UAUCU - Student Research Exchange Collected Papers 2018
238
-
Upload
khangminh22 -
Category
Documents
-
view
2 -
download
0
Transcript of UAUCU - Student Research Exchange Collected Papers 2018


This is the digital version of the UAUCU 2018 Student Research Exchange Papers.
Due to editorial motives, blank pages for final print have not been removed
from this document.


UAUCUStudent Research Exchange
Collected Papers 2018

UAUCUStudent Research Exchange
Collected Papers 2018
Daniel van HeusdenXavier BoekhoudtJay-Mar Gamarra
Luc LipsAnnemieke DrostEmmeline Long
Fabian Timpen and Emma BeroskeStephanie Arango
Nora RödersThais FrankenDirijini Piter


This volume presents academic papers and personal reflections written by the participants of the UAUCU student research exchange project 2018. These texts reflect the diversity of academic disciplines and approaches, as well as the diversity in cultural background, of this year’s participants. The program, which offers students from the University of Aruba (UA) and University College Utrecht (UCU) the opportunity to conduct research in a multidisciplinary international student team, has already proven a successful formula: work presented in the 2015, 2016 and 2017 volumes led to international publications, and thesis awards for several program alumni. We anticipate similar achievements for contributors to the 2018 edition.
During the introductory week in January 2018, the student group defined their guiding principles and goals for the project (see these below). These principles and goals illustrate the collective dedication of the participants to contributing to the project in ways that would be meaningful for others and for themselves personally.
The academic works included here treat topics like identity, culture, creativity, entrepreneurship, economics, human resources, policy, and environmental conservation. The nature of the research is equally far-ranging, including pilot projects, theoretical explorations verified with respondent data, in depth environmental studies, and sociocultural studies that explore fundamental issues confronting society. The diverse papers are linked by a common interest in sustainable societies, reflecting a strong sense of community awareness, and providing research findings that have meaning for Aruban society. The papers further demonstrate how the student researchers’ collaboration in a multidisciplinary team has influenced their approach
to their work. The papers here are products of peer-to-peer learning: the student authors provided each other with feedback on content, method, style, language and structure. In general, the papers appear as submitted by the authors -- including perhaps the odd raw opinion or hasty generalization. Some of the student-researchers are still working on the interpretation and presentation of their findings, and will later finalize project papers, or bachelor or master theses, based on results of fieldwork presented.
The participants have all also contributed personal pieces reflecting on their experiences. The cultural and ethnic diversity within the group contributed to an extraordinarily rich social environment, and their reflective texts show the strength of the collaboration and mutual support within this diverse group. The texts reveal much about the power of this project: it is about the realization that we can achieve more in the world when we take multiple perspectives in approaching problems, and when we work together to build on each other’s complementary strengths.
This fourth year of the project has involved many people crucial to its success, and as in previous years, it is impossible to name them all. A special thank you goes to Jenny Lozano-Cosme and Carlos Rodriguez-Iglesias, both of the University of Aruba, who took their time to proofread all the papers. But to all others who have taken part as (guest) lecturer, supervisor, manager, initiator, facilitator, student, interviewee, respondent, guide, coach or mentor: thank you very much for your contribution to powering this year’s project.
Eric Mijts & Jocelyn Ballantyne Project coordinators UAUCU
Introduction to the fourth edition of the UAUCU Student Research Exchange Collected Papers
It’s all about the journey, not the destination
Guiding principles 2018
collaborate
help each other in research
motivate each other
be kind to all involved
contextualize in society - valorization
be considerate of the society you work with
always work with consent
be considerate of diversity
give back to the researched community
heed research integrity and ethics
be accountable
Goals 2018
follow the guiding principles
complete our research
learn from each other
personal development
cultural exchange, engagement and exposure
learn from other disciplines
coach each other with constructive critical feedback
get out of our comfort zones
learn to do research in a relevant way
share with society how valuable research can be
break down barriers between academics and society
contribute to sustainable development


Daniel van Heusden - UCU 21Aruba’s Sustainable Entrepreneurial Ecosystem: Drivers and Barriers for Sustainable Entrepreneurship
Xavier Boekhoudt - UA 51Policy for energy system innovation: Multi-actor policy-making of the Aruba energy transition
Jay-Mar Gamarra - UA 61Perceived economic impact of tourism
Luc Lips - UCU 81Determinants of eco-innovation: The Aruban Case
Annemieke Drost - UCU 105Coral Health and Citizen Science
Emmeline Long - UCU 123The impacts of oil contamination on the mangrove ecosystems of Aruba

Fabian Timpen - UCU and Emma Beroske - UCU 139The impact of illegal dumpsites on the environment
Stephanie Arango - UA 169Improving the Recruitment Procedure at the Renaissance Resort & Casino
Nora Röders - UCU 185Becoming Aruban?
Thais Franken - UA 211Putting Culture and Creativity in the Heart of the Aruban Sustainable Development
Dirijini Piter - UA 229A look into the strategies utilized by SMEs on Main Street duringthe Oranjestad redevelopment program

Previous UAUCU Student Research ExchangeCollected Papers 2017:
Culture, language, media and psychology
Louisa Maxwell - UCU Calypso and cultural commodification in Aruba
Yun Lee - UCU A correlation between cultural identity and juvenile delinquency in Aruba
Tanya Kirchner - UA Understanding the roots of parasuicide among the adolescence in Aruba: associated risks and protective factors
Melany Llocclla - UA Volunteerism: an approach to encouraging more volunteering in Aruba
Zita Ngizwenayo - UU Adolescent perceptions on language and professional communication
Rachel Tromp - UA Social media use on Aruba in the business perspective

Previous UAUCU Student Research ExchangeCollected Papers 2017:
Policy, law, environmental sciences and sustainability
Rotem Zilber - UCU Assessment of endemic fauna in key biodiversity areas
Larisa Leeuwe - UA Environmental law: national and international perspectives
Ben Bultrini - UCU Community participation in solid waste management in Aruba
William Cruice - UCU Entrepreneurial governance and sustainable development on Aruba: a cultural political economy approach
Rodolfo Rodriguez - UA The synergy between academia and industry: success factors towards a healthy partnership
Nayla Yarzagaray - UA The importance of tax compliance among SME’s in Aruba for business continuity
Previous UAUCU Student Research ExchangeCollected Papers 2016:
Language and Culture
Anne Maamke Boonstra - UCU The Performance of Gender & Sexuality During Carnival on Aruba
Maja Vasić - UU The preferred language of instruction in the higher education in Aruba:attitudinal, situational and motivational aspects
Fardau Bamberger - UU The role of English in Aruba’s linguistic landscape
Health and Care Development
Felishah Ponson - UA The emotional impact on people with disabilities striving to be independent in Aruba
Dahariana Evertsz - UA A situational Analysis of the relevant welfare services and social security programs for the older population of Aruba: implications for policy
Nurianne Dhalía Arias - UA Diabetes Management in a Changing Society
International Relations and Diplomacy
Ghislaine Nicolaas - UA Economic Diplomacy in Sub-National Island Jurisdiction

Previous UAUCU Student Research ExchangeCollected Papers 2016:
Labor and Productivity
Giancarla Lobbrecht - UA Absenteeism in the Public Sector
Gianira Maduro - UA Satisfaction of the ‘Bezoldigingsregeling Ambtenaren’
Organizational Transitions and Sustainability
Mirjam Snitjer - UU “The Sexiness of Sustainability”Perspectives Towards Sustainability of Aruban Citizens
Anniek van Wezel - UU The utility and waste management sector in the 2020 vision of Aruba
Lizanne Takke - UU Aruba’s sustainable transition: leadership used in an organizational transition towards sustainability from a management perspective
Jochem Pennekamp - UA Does the Model Fit the Format?A Re-contextualization of the Triple Helix Model(s) in a Small Island Setting

Previous UAUCU Undergraduate Student Research ExchangeCollected Papers 2015:
Florianne Sollie - UCU Language and Education in a Multilingual Society: Text comprehension and language attitudes among Aruban high school students.
Sil Boedi Scholte - UCU Who Plays What Role to Take the Stage? The Governance of Staging Authenticity and Commodification of Cultural Heritage in Aruba.
Kimberly van Loon - UA Perceptions of internal communication, as told by employees within the health care sector.
Geneida Geerman - UA Internal communication of sustainable development within hotel sector.
Sharon Meijer - UA Sustainable practices of Aruban SMEs and their influence on the economy.
Previous UAUCU Undergraduate Student Research ExchangeCollected Papers 2015:
Petra Zaal - UCU Reduction of energy consumption at Aruban hotels.
Francis Malca - UA Legal perspectives on Solid waste management in Aruba.
Rikkert Loosveld - UCU Does the Parkietenbos landfill have boundaries? A waste and ph-gradient assessment of Parkietenbos.
Tobia de Scisciolo - UCU The Assessment of Aruba’s Shoreline Pollution: A Comparison between the South and the North coast.
Giovanni Jacobs - UA Mapping Aruba’s policy on beach care.

UAUCU Student Research Exchange Collected Papers 2018
21
“Did you bring the speaker?”, I ask Emma before leaving for our daily destination.During these last months this has become my go-to phrase, as I have found my true calling: being the DJ during our trips to dumpsites, beaches, interviews and of course our home base, the University of Aruba. Gradually, these Reggaeton, Dancehall and Dutch Hip Hop songs have become the anthems of our adventures. Personally, these little things have defined my time on Aruba. Going on our ‘once every two days’-snorkel trips to Boca Catalina, Arashi and Mangel Halto, playing Marco Polo in the Montaña Park pool with my little friend Joshué, eating barbecue at the Babyback Grill, or if lazy, walk to Fermin’s instead. Also, our nights out, the unforgettable boat trip and of course our movie nights, where at least one of us would always fall asleep (most likely Emmeline).
But also my experience with the always friendly Arubans. One time I asked a gentleman whether he knew the way to one of my interview locations. Without a doubt he halted his work, signaled me to come to his car and brought me there himself. Another time a total stranger brought us home at 4 AM after a night out. These events characterized the Arubans for me: always kind and willing to help. During my research this open and friendly mentality also prevailed. The fact that everyone was willing to share their experiences and stories in such a passionate manner has enabled me to do this research in the best way possible. It showed that despite the difficulties surrounding sustainability on Aruba, there is a set of admirable individuals that drive this development and thereby provide a fruitful soil for future greatness. Therefore, I would like to sincerely thank those that have participated in my research. Furthermore, I would like to thank all individuals that made the UAUCU program possible. In particular, Jocelyn and Eric, whose personal commitment and care provided us with all the preparation and guidance needed to make this program a success. Also, I would like to thank the Montaña squad for making this time as delightful as it was. Specifically, Nora, Fabian and Luc for sacrificing their time to drive me to my interviews, Emma and Emmeline for their help, and Annemieke for her non-binary influence. Lastly, I would like to specifically acknowledge those that personally motivate me to do what I do. John, Daniela, Robbert, Ranka and, of course, Blanca, thank you for your everlasting support and love. Without you this would not have been possible.
Daniel van Heusden, University College Utrecht

UAUCU Student Research Exchange Collected Papers 2018
22
IntroductionGlobally, the Caribbean island of Aruba is known for its sun and sea. After being confronted with the 2008 financial crisis, however, the Aruban government has started to present itself as the island of sustainability in both domestic and international fora. For example, the then newly elected Eman cabinet focused on diversifying the Aruban economy through positioning itself as the Green Gateway, a regional hub specialized in knowledge-driven and sustainable industries.
This would be accomplished by “[... assuming] ecological responsibility through resource efficiency, renewable energy and green technologies”, which requires “innovation and resilience by means of entrepreneurship, new industry opportunities, improved business productivity and new investment opportunities” (Government of Aruba, 2011, p.1). Therefore, sustainable entrepreneurship and businesses are viewed as the engine behind sustainable development.
According to the previous government, Aruba “offers excellent opportunities for investors and entrepreneurs to channel business into the Caribbean, the Americas or Europe”, for numerous reasons, among them Aruba being a “knowledge hub for renewable energy, sustainable tourism, intelligent distribution and many creative industries” (Government of Aruba, 2017, p. 21). However, to what extent does Aruba actually provide fertile ground for starting or operating an established sustainable enterprises?
In this research, the drivers and barriers for sustainable entrepreneurship on Aruba will be analyzed. In order to effectively execute this analysis, entrepreneurial ecosystem (EE) theory will be utilized, which focuses on how context-specific attributes, such as policies, universities and infrastructures either enable or inhibit an entrepreneur’s ability to start or operate their business.
Specifically, a synergy between two entrepreneurial ecosystem theory models, derived from Spigel (2015) and Cohen (2006), will assist in the evaluation of the current state of Aruba’s sustainable entrepreneurial ecosystem (SEE). Using this model, the attributes will be divided between three classifications, which are cultural, social and material, after which these will be assessed consecutively. A community-based research approach is employed, which signifies that important stakeholders of the entrepreneurial ecosystem were actively involved in the research process. These stakeholders could not only voice their opinion on the relevant subjects during the interviews, but also afterwards on the theoretical and methodological framework.
Lastly, the outcome of this research will not only be relevant for sustainable enterprises on Aruba, but for the Aruban population as a whole. This is the case because sustainable entrepreneurship is able to provide solutions to unsustainable practices, thereby assisting in the attainment of the Sustainable Development Goals. In particular Goal
Aruba’s Sustainable Entrepreneurial Ecosystem: Drivers and Barriers for Sustainable
Entrepreneurship Daniel van Heusden

UAUCU Student Research Exchange Collected Papers 2018
23
7: Affordable and Clean Energy, and Goal 12: Responsible Consumption and Production can be effectively achieved with the help of sustainable entrepreneurship, which provides innovative and sustainable forms of both consumption and production.
1.2 Research QuestionIn order to effectively achieve the research aim, the following research question has been formulated:
To what extent does Aruba provide a business climate beneficial for starting and operating a sustainable enterprise?
In turn, this research question has been divided into three sub-questions:
1. How do the cultural attributes of Aruba’s SEE influence the ability of sustainable entrepreneurs to start and operate their business?
2. How do the social attributes of Aruba’s SEE influence the ability of sustainable entrepreneurs to start and operate their business?
3. How do the material attributes of Aruba’s SEE influence the ability of sustainable entrepreneurs to start and operate their business?
2. Literature Review2.1 Aruba’s Economic and Environmental VulnerabilityAchieving and maintaining a sustainable entrepreneurial ecosystem is important for all regions, since Entrepreneurship is able to reduce environmental degradation and enhance economic and social sustainability (Dean and McMullen, 2007). However, this is even more so in the case of Aruba, because it is a small island state (SIS), which are, due to their size, location, insularity and remoteness, economically, but especially environmentally vulnerable.
Aruba’s economic vulnerability does not signify it is poor. On the contrary, Aruba has one of the highest Gross Domestic
Products (GDP) per capita of the Caribbean (CIA, 2011). It does mean, however, that Aruba, due to its island-specific characteristics, is highly sensitive to global economic crises and disbalances. The United Nations Conference on Trade and Development (UNCTAD), authorized Briguglio (1995) to create an index designed to explain and measure the economic vulnerabilities of SIS. Briguglio divides these into five distinct categories. Firstly, he summarizes economic vulnerabilities resulting from their small size and subsequent exposure to foreign conditions, such as limited natural resources, small domestic markets, and a limited ability to influence domestic prices. Secondly, he states that there are also economic vulnerabilities related to a SIS’ remoteness and insularity, such as high transportation costs and uncertainties of supply.
Historically, Aruba has proven to be particularly vulnerable to global economic pressures and therefore economically unsustainable. Since the 1930s, Aruba’s economic sector had been predominantly built on oil refinement. Illustratively, in the late 1970s Aruba’s oil sector contributed 35% to its gross domestic product (GDP) (Vanegas & Croes, 2000). In the beginning of the 1980s, Venezuela nationalized its oil sector, which signified that Aruba lost an important client, while simultaneously gaining a catastrophic competitor. This resulted in the closure of the Lago Oil Refinery by Exxon in 1985, which had far-reaching consequences for the island. Unemployment rose by approximately 40%, while its GDP decreased by nearly 20% (Ridderstaat, 2007; Vanegas & Croes, 2000).
In order to turn the tide, the Aruban government decided to promote tourism as its number one export product. They adopted incentives for investments in the tourism sector, developed the required infrastructure, and supported the construction of holiday resorts. Between 1975 and 2000, the number of accommodations on Aruba increased by a factor of approximately 6. Instead of focussing on the oil sector, the Aruban economy rapidly became dependent on its tourism sector (Vanegas & Croes, 2000).

UAUCU Student Research Exchange Collected Papers 2018
24
In 2010, 70% of the entire Aruban economy consisted of tourism related activities. Furthermore, besides being predominantly dependent on one sector, the majority of its consumers also originate from the same country: the United States. The Aruban economy, being incredibly dependent on one industry, that in turn is predominantly based on one market is therefore especially vulnerable to external shocks related to the United States.
Therefore, when the United States experiences a 1% temporary decline of economic growth, Aruba experiences a 2% temporary decline in the same year, as well as the following (International Monetary Fund, 2015). Inevitably, in 2008, following the global crisis that originated in the American housing market, Aruba’s economy was also heavily disrupted. Aruba’s real GDP declined by 7,7% in 2009 and 3,6 in 2010 (International Monetary Fund, 2010 & 2013).
Furthermore, Briguglio included environmental factors. Numerous authors have argued that SIS are incredibly vulnerable to environmental hazards and in particular climate change (Bernstein et. al; Pelling and Uitto, 2001; Wong, 2011). One of the most substantial consequences of climate change is the global rise of sea levels. The International Panel on Climate Change (IPCC) (2017) has projected that during the 21st century sea levels will rise by a minimum of 0.18 meters, while in reality this number is likely to be higher. Even if the rise of sea levels proves to be moderate, significant parts of SIS, such as ports, capital cities, hospitals, and other forms of infrastructure could be flooded (Kelman and West, 2009).
Moreover, climate change will lead to higher sea surface temperatures and larger amount of atmospheric carbon dioxide, triggering coral bleaching, which in turn results in the elimination of coral reefs. Naturally, coral reefs form barriers against waves and storms. The destruction of these natural barriers might lead to increased damage from extreme weather events, such as cyclones, and accelerated coastal erosion.
Lastly, an increase of sea surface temperatures does not lead to an increase in the amount of cyclones, yet can lead to greater intensity after their formation. Also, it is likely that an increase in sea surface temperature will change the track of future cyclones towards SIS closer to the equator, including Aruba. Thus far, Aruba has had limited experience with such severe weather conditions, which means that a sudden confrontation can be catastrophical (Kelman and West, 2009).
2.2 Aruba Moving Towards Sustainability Sustainability entered the official Aruban discourse in 2008, when the Nos Aruba 2025 Project was initiated. This initiative was primarily focused on how stakeholders, such as politicians, civil society, government officials and private actors, envisioned Aruba’s sustainable future. As part of this vision, twelve sustainable development priorities were identified, which were in line with Aruba’s four sustainability themes: economic, environmental, social and political. Examples of these sustainable development priorities include Sustainable Socio-economic Development by Means of Diversification, Sustainable Tourism Development, Promoting Sustainable Food Supplies, Energy Management for a Sustainable Development, and a Clean and Risk Free Environment (Nos Aruba, 2010).
The first three priorities were addressed in the Green Gateway Project, which predominantly focuses on making the Aruban economy more resilient to external economic shocks. This would be accomplished through diversifying towards more sustainable industries, such as green technology, creative industries, sustainable tourism, and maritime technology and logistics (Government of Aruba, 2017). Another important component of the Green Gateway Project is the desire to position Aruba as a knowledge-driven sustainability hub between North America, South America and Europe (Government of Aruba, 2010).
The last two priorities outlined in the Nos Aruba 2025 Projects were further solidified through the Eman
UAUCU Student Research Exchange Collected Papers 2018
25
administration’s 2020 Vision, a dedication towards 100% fossil fuel independence by the year 2020. Sir Richard Branson’s Carbon War Room, a foundation that focuses on providing market-based solutions to climate change, was a strategic partner in this effort (Aruba Huis, 2012).
2.3 EntrepreneurshipFocussing on sustainable entrepreneurship, it is essential to first address the basic concept of entrepreneurship. This is important, because although the terms entrepreneur and entrepreneurship are frequently utilized, they encompass a wide range of distinct meanings. This can be accounted to the fact that entrepreneurial research is highly fragmented (Blundel and Smith, 2001). To avoid uncertainty, it is essential to provide a clear definition of these concepts. An often utilized definition frames the entrepreneur as an individual who started a new business where there was none before (Gartner, 1985), which would exclude those that inherited or bought into a venture. Others, such as Schumpeter (1934), claim that the term entrepreneur can solely be given to those that create innovation, while Kirzner (1974) states that entrepreneurship is the discovery and exploitation of opportunities.
One of the most recent and inclusive definitions has been provided by Maijd and Koe (2012), who claim that entrepreneurship is “A process of identifying, evaluating and pursuing opportunities through creativity, innovativeness and transformations to produce new products, processes and values that are beneficial” (p.295). While similar, these distinct definitions include and exclude different types of individuals, which signifies that further specification is required.
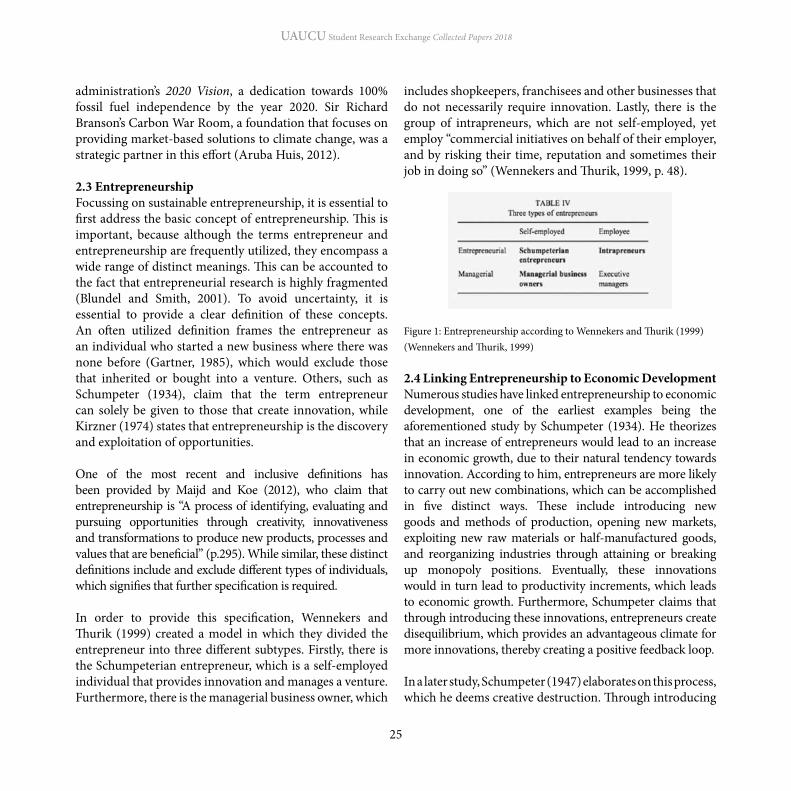
In order to provide this specification, Wennekers and Thurik (1999) created a model in which they divided the entrepreneur into three different subtypes. Firstly, there is the Schumpeterian entrepreneur, which is a self-employed individual that provides innovation and manages a venture. Furthermore, there is the managerial business owner, which
includes shopkeepers, franchisees and other businesses that do not necessarily require innovation. Lastly, there is the group of intrapreneurs, which are not self-employed, yet employ “commercial initiatives on behalf of their employer, and by risking their time, reputation and sometimes their job in doing so” (Wennekers and Thurik, 1999, p. 48).
Figure 1: Entrepreneurship according to Wennekers and Thurik (1999)(Wennekers and Thurik, 1999)
2.4 Linking Entrepreneurship to Economic DevelopmentNumerous studies have linked entrepreneurship to economic development, one of the earliest examples being the aforementioned study by Schumpeter (1934). He theorizes that an increase of entrepreneurs would lead to an increase in economic growth, due to their natural tendency towards innovation. According to him, entrepreneurs are more likely to carry out new combinations, which can be accomplished in five distinct ways. These include introducing new goods and methods of production, opening new markets, exploiting new raw materials or half-manufactured goods, and reorganizing industries through attaining or breaking up monopoly positions. Eventually, these innovations would in turn lead to productivity increments, which leads to economic growth. Furthermore, Schumpeter claims that through introducing these innovations, entrepreneurs create disequilibrium, which provides an advantageous climate for more innovations, thereby creating a positive feedback loop.
In a later study, Schumpeter (1947) elaborates on this process, which he deems creative destruction. Through introducing

UAUCU Student Research Exchange Collected Papers 2018
26
new ideas, products and services, entrepreneurs effectively renew economic activities of not only firms or industries, but of whole regions. Entrepreneurial activity namely results in a ‘mosaic’ of new ventures, which continuously compete with each other. This competition leads to the ‘natural selection’ of the most efficient and effective ventures, resulting in higher productivity, displacement of obsolete firms, and the expansion of new industries and niches. The combination of these consequences allow resources to be allocated into more successful ventures, which could signify an increase of a region’s competitive advantage and localised economic growth.
Recent studies have attempted to discover whether this relationship between entrepreneurship and economic growth exists. An empirical study by Audretsch and Thurik (1999) illustrates that the increase of entrepreneurial activity has led to a decline of unemployment in 23 OECD countries. Additionally, Acs (2006) also shows that entrepreneurship, with the right entrepreneurial environment, can result in higher amounts of income per capita. Furthermore, Ángel Galindo and Méndez‐Picazo (2013) conducted an empirical study in Denmark, Finland, France, Germany, Italy, Japan, Netherlands, Spain, Sweden and the United States, which shows there is a positive relationship between entrepreneurship and economic growth.
2.5 Linking Sustainable Entrepreneurship to Sustainable DevelopmentHowever, entrepreneurship’s tendency to increase economic growth does not imply that it naturally stimulates environmental and societal growth. On the contrary, in pursuit of economic growth, entrepreneurship is likely to result in environmental damage and subsequent negative societal impact (Cropper and Oates, 1992; Dean and McMullen, 2007).
Sustainable development refers to economic development that attempts to avoid the above mentioned trade off. An
initial definition for sustainable development was provided in the Brundtland United Nations Report (1987), which states that sustainable development is “the development that meets the needs of the present without compromising the ability of future generations to meet their own needs” (p. 16). However, this definition proved to be insufficiently concrete; it is difficult to effectively estimate the needs of the coming generations. Furthermore, it specifically focuses on the one-dimensional “protecting the long-term value of the environment” (Emas, 2015, p.1), while sustainable development is a multidimensional concept.
In order to provide context for the multidimensional nature of sustainable development, Elkington (2004) created the Triple Bottom Line (TBL) concept, which states that sustainability can exist in three different forms, which are economic, social, and environmental. These three dimensions, which are informally called profit, people, and planet, need to be balanced accordingly, so that a sustainable economic growth can be acquired, without endangering the environment or any social groups.
2.6 Sustainable EntrepreneurshipTBL is also utilized to define the concept of sustainable entrepreneurship, since according to Greco and De Jong (2017) “balancing economic health (profit), social equity (people) and environmental resilience (planet) through entrepreneurial behavior is what identifies a sustainable entrepreneur” (p.2). Since this definition effectively captures the multidimensional nature of sustainable entrepreneurship, it will be utilized for this research.
As mentioned before, sustainability in the Aruban context is predominantly focused on the economic and environmental aspects. Inspired by Cohen and Winn (2005), this research will therefore focus on these two dimensions of sustainable entrepreneurship. This does not signify that the social dimension is of no importance. On the contrary, environmentally and economically
UAUCU Student Research Exchange Collected Papers 2018
27
sustainable initiatives also have positive social effects, such as the reduction of pollution that can enhance the quality of life, and the social wealth that can be derived from successful entrepreneurship. Therefore, all three aspects of sustainability will be addressed.
2.7 Entrepreneurial Ecosystem ApproachAs previously mentioned, entrepreneurship is able to reduce environmental degradation and enhance economic and social sustainability (Dean & McMullen, 2007). However, this does not signify that it is able to do this independently; entrepreneurship does not exist in a vacuum. An approach that focuses on how context-specific circumstances affect entrepreneurship is the entrepreneurial ecosystem approach.
Firstly, the term entrepreneurial ecosystem (EE) will be explained in order to increase the understanding of what such an approach entails. According to Stam and Spigel (2016), an EE is “a set of interdependent actors and factors coordinated in such a way that they enable productive entrepreneurship within a particular territory” (p. 1). The first component, entrepreneurial, is straightforward, since it refers to the aforementioned concept of entrepreneurship; those that are self-employed and may provide innovation. The second component, ecosystem, is less clear, yet refers to the parallel drawn between biological and entrepreneurial ecosystems. Similarly to how the success of a biological ecosystem depends on how well its organisms interact with each other and their physical environment, an EE’s success is also dependent on a set of local interdependent factors. Therefore, this approach provides an inherently geographic perspective to entrepreneurship, since it focuses on how these location-specific factors, such as cultures, institutions and networks, either allow or restrict a region’s entrepreneurial activity and subsequent economic growth, the output of such a system.
The entrepreneurial ecosystem approach can be traced back to a study by Dubini (1989), in which she claimed that effective ecosystems, in her terminology ‘environments’, are
characterized by an effective business infrastructure, diverse economy, encouraging entrepreneurial culture, presence of role models and family businesses, availability of investment capital, and government policies that support the process of starting new ventures. Later on, Spilling (1996) was the first to coin the term ecosystem, and emphasized that, besides the characteristics given by Dubin (1989)i, proximity of universities, and the availability of technically skilled workers are also important components of entrepreneurial ecosystems that enable entrepreneurial activities. More recently, the World Economic Forum (2013) has conducted research concerning entrepreneurial ecosystems and concluded that their success depends on eight fundamental pillars, namely, accessible markets, human capital, funding and finance, support systems such as mentors and incubators, an efficient regulatory framework, education and training, major universities as catalysts, and cultural support.
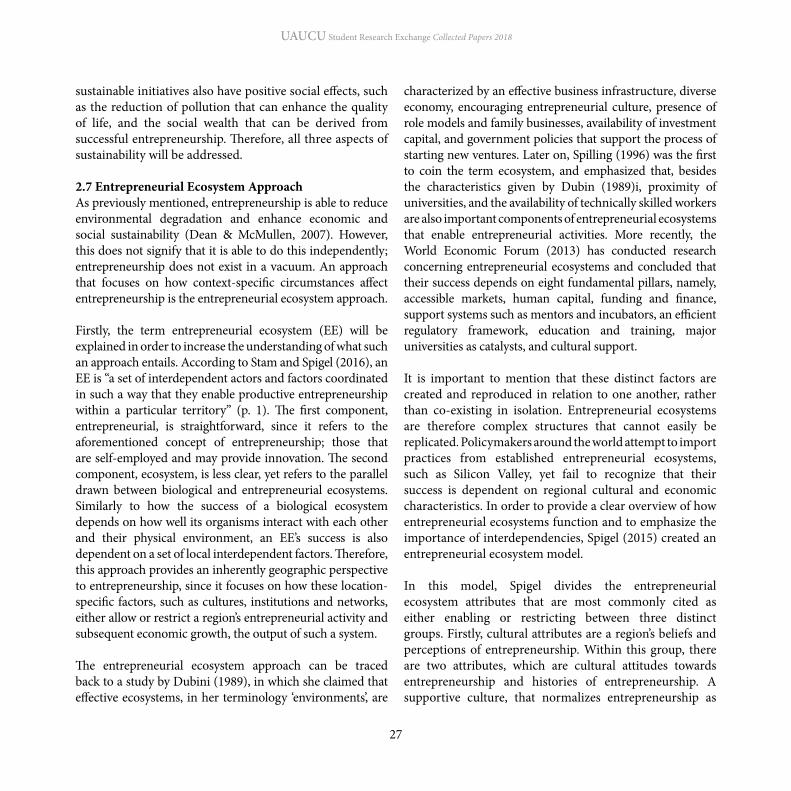
It is important to mention that these distinct factors are created and reproduced in relation to one another, rather than co-existing in isolation. Entrepreneurial ecosystems are therefore complex structures that cannot easily be replicated. Policymakers around the world attempt to import practices from established entrepreneurial ecosystems, such as Silicon Valley, yet fail to recognize that their success is dependent on regional cultural and economic characteristics. In order to provide a clear overview of how entrepreneurial ecosystems function and to emphasize the importance of interdependencies, Spigel (2015) created an entrepreneurial ecosystem model.
In this model, Spigel divides the entrepreneurial ecosystem attributes that are most commonly cited as either enabling or restricting between three distinct groups. Firstly, cultural attributes are a region’s beliefs and perceptions of entrepreneurship. Within this group, there are two attributes, which are cultural attitudes towards entrepreneurship and histories of entrepreneurship. A supportive culture, that normalizes entrepreneurship as

UAUCU Student Research Exchange Collected Papers 2018
28
a possible career path, greatly increases firm creation and the undertaking of high-risk entrepreneurial activities. Histories of entrepreneurship, which refers to the stories of successful local entrepreneurs, can encourage young aspiring entrepreneurs to undertake similar endeavors.
Secondly, there are social attributes, which refers to the resources acquired through a region’s social networks. In total, there are four social attributes. Networks assist aspiring entrepreneurs in acquiring capital, technical knowledge, and linkages to customers and suppliers. Investment capital provided by local investors that are genuinely concerned for the regional entrepreneurial community is also essential for enabling entrepreneurial growth. Furthermore, mentors greatly improve firm formation and survival, and assist aspiring entrepreneurs in developing business skills and social capital. Lastly, there is worker talent, which refers to employees with high amounts of human capital, which is not solely limited to technical knowledge, but also managerial and entrepreneurial skills.
The third group of attributes are material, which points towards the tangible assets of an entrepreneurial ecosystem, of which there are four. Universities are of incredible importance, since they develop technological knowledge, provide skilled workers, and are able to encourage entrepreneurial mindsets through their curriculum. The availability of support systems, such as incubators, accelerators, accountants and lawyers are also crucial, since they provide services necessary for entrepreneurs to execute entrepreneurial aspirations that frequently cannot be achieved in-house. Furthermore, the absence or presence of government regulations and policies, which consists of tax benefits, reduction of legal barriers, and the assignment of public funds to entrepreneurial initiatives, can play an important part in an entrepreneurial ecosystem. Finally, a strong local market is associated with an effective entrepreneurial ecosystem, since the specialized needs of local customers can provide unique opportunities for entrepreneurs to exploit, and a platform to acquire initial sales (Spigel, 2015).
According to Spigel (2015), these distinct groups of attributes do not exist in isolation, but constantly support and reinforce each other. For example, the author claims that through creating a normalizing and legitimizing entrepreneurial culture, a fertile soil is created in which social attributes can rise, which in turn both provide a solid base for the material attributes that could not have existed without the support of underlying cultural and social attributes. However, this does not signify that their relationship is one-sided, since the model shows that the ‘upper’ groups also reinforce underlying groups of attributes, which in turn strengthen the former again, creating a positive feedback loop. Spigel (2015) provides an example of how this reinforcement process would work:
For example, entrepreneurial support organizations can play an important role in fostering local networks and raising the profile of successful local startups. This encourages new actors to engage in networking activities by exposing them to success stories, increasing the amount of financial, technical, and advisory resources within local social networks. Strong sets of social attributes such as networks, mentors, and investment capital within a region then help to reinforce and reproduce the ecosystem’s pre-existing culture by normalizing these practices and creating new stories of successful entrepreneurship that enter in the region’s history (p.55).
Figure 2: Spigel’s Entrepreneurial Ecosystem Model(Spigel, 2015)
UAUCU Student Research Exchange Collected Papers 2018
29
Most entrepreneurial ecosystems do not possess these attributes at equal levels, but have a unique and varied selection. In dense ecosystems, ecosystems with high rates of attributes and strong interrelations, all the attributes constantly support and reinforce each other, while in ‘sparse’ ecosystems, there is often one dominant attribute that produces the rest of the attributes. According to Spigel (2015), studying the input of systems is as important as studying the outcome, since this will provide valuable information on how to enhance said entrepreneurial ecosystem.
2.8 Sustainable Entrepreneurial Ecosystem ApproachTraditionally, studies and models concerning entrepreneurial ecosystems focus on technological innovative entrepreneurship (Nambisan and Baron, 2013; Rohrbeck et. al, 2009, Spigel and Stam, 2016). Cohen (2006), however, examined whether the entrepreneurial ecosystem literature can also be applied to sustainable entrepreneurship. The author uses attributes frequently utilized in existing entrepreneurial ecosystem models and theorizes that, in order to thrive sustainable enterprises require distinct circumstances.
For example, in entrepreneurial ecosystem theory, universities can provide value through research and providing skilled workers to enterprises. According to Cohen’s (2006) sustainable entrepreneurial ecosystem model, universities can have far greater contributions, since they can not only “create and disseminate knowledge regarding sustainability”, but also “developing and commercializing technologies” and “raising awareness in the community at large, particularly through leading by example” (p.4)
Another example is investment capital, which in entrepreneurial ecosystem theory consists of, among others, venture capital and angel investors. These are essential to starting businesses and maintaining a healthy ecosystem. In a well-functioning sustainable entrepreneurial ecosystem,
however, availability of capital for enterprises is not sufficient. Special ‘green investors’ are required, who “understand their business and share their ideals” (p.4). ‘Regular’ investors frequently do not value the sustainable aspect of businesses and prefer to invest in more conservative industries.
As mentioned before, governmental organizations can play an important role in entrepreneurial ecosystems through inhibiting or stimulating policies. In sustainable entrepreneurial ecosystems, however, this role is even greater, since policies that “encourage or mandate more sustainable behaviour on the part of consumers and firms” are of great importance.
Furthermore, traditional entrepreneurial ecosystem theory states that the availability of high-skilled workers is essential. In SEE theory, however, it is also essential that there are sufficient employees with sustainability backgrounds and values. Additionally, there should also be enough support services, such as incubators and tax advisors, that understand and value the sustainable aspect, so that they can effectively guide and advise sustainable businesses. Large established companies and technology parks can also play supportive roles in this regard.
Moreover, Cohen (2006) also emphasizes the importance of informal networks through which sustainable entrepreneurs are able to acquire social support, mentorship, and advice. According to the author, these networks are especially important for sustainable entrepreneurs, since these are confronted with extra costs and difficulties in comparison with regular start-ups. Sustainable entrepreneurs can utilize their network in order to gain information and resources, and in turn mitigate these relatively larger difficulties.
Another fundamental aspect of entrepreneurial ecosystem theory is culture. However, a region’s culture is of even

UAUCU Student Research Exchange Collected Papers 2018
30
greater importance in the sustainable entrepreneurial ecosystem, since “accumulated local knowledge and culture have a profound impact on the pursuit of a sustainability agenda in a community”. Additionally, as stated by Cohen (2006) “the quality and quantity of outdoor recreational activities and natural landscapes can also play a role in developing a community conducive to the development of an SEE” (p.11). Specifically, accessibility to outdoor activities, such as diving, national parks, hiking, and biking, can attract entrepreneurs that care about the environment.
Lastly, SEE theory also emphasizes the importance of a region’s physical infrastructure. For example, the cost of living, the presence of transportation, and transportation costs all influence the likelihood of sustainable enterprises flourishing in a region.
As mentioned for each relevant factor individually, Cohen (2006) emphasizes the importance of each relevant actor to “have an understanding of sustainability issues and the unique challenges they face” (p.60). According to him, this is essential for creating a climate in which sustainable entrepreneurship is able to flourish.
2.9 Synergy between Spigel’s Entrepreneurial Ecosystem and Cohen’s Sustainable Entrepreneurial Ecosystem ModelsDespite the fact that Spigel (2015) and Cohen’s (2006) models both provide relevant contributions to sustainable entrepreneurial ecosystem theory, they are not able to independently provide an effective framework for the analysis of Aruba’s SEE.
Firstly, Spigel’s entrepreneurial ecosystem model provides an elaborate list of different attributes and how these can be grouped into cultural, social and material attributes that reinforce and support each other. However, these are predominantly focussed on technological innovative
enterprises rather than sustainable ones. Therefore, this model is independently unsuitable for researching the distinct attributes of the Aruban SEE.
Cohen’s (2006) model, on the other hand, focuses on sustainable enterprises, and therefore specifically states how attributes of a SEE can inhibit or stimulate sustainable entrepreneurship. Nevertheless, since this model is based on an exploratory study designed to discover whether EE theory is also applicable to sustainable entrepreneurship, multiple attributes and their interconnection are mentioned, yet remain unspecified.
For example, the importance of mentorship, networks and advice are mentioned as parts of the informal network, yet lack individual clarification. Furthermore, the author hints towards the interconnection of attributes, yet does not concretize these in his model. Therefore, Cohen’s model is inappropriate for providing a clear overview of inhibiting and stimulating attributes.
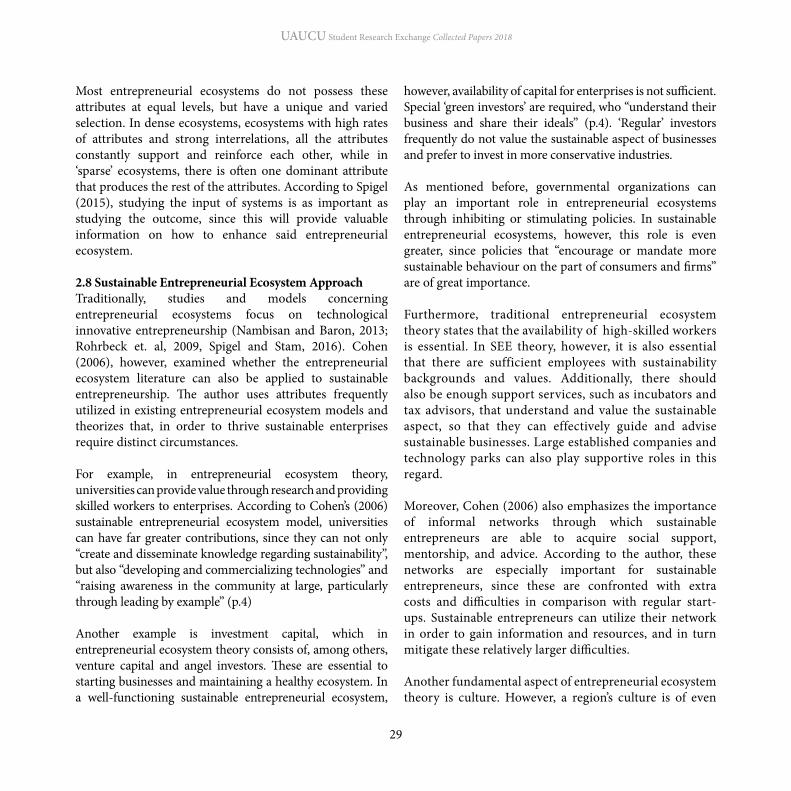
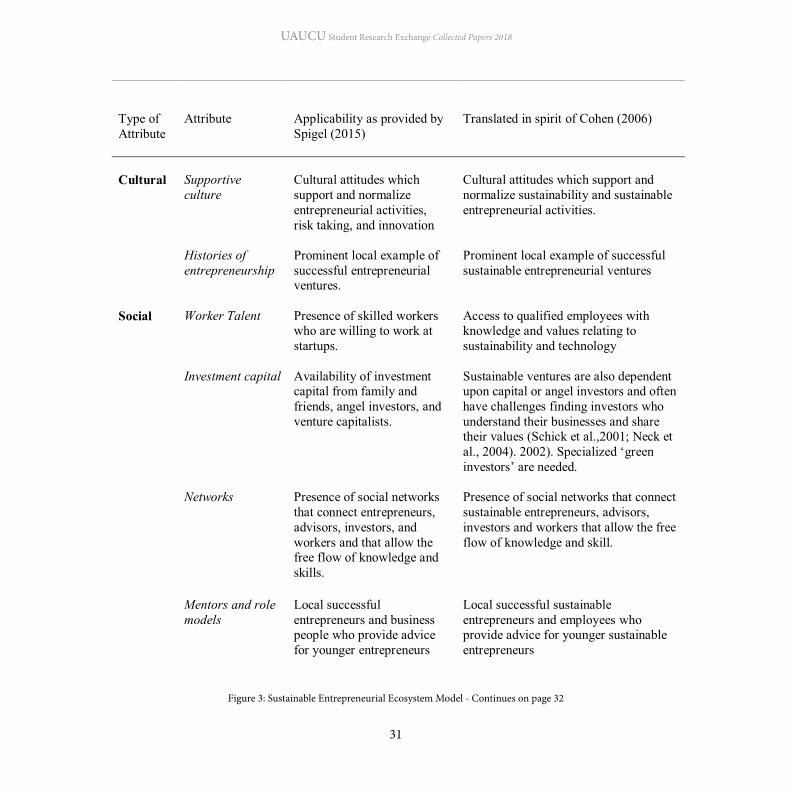
In synthesis, however, Spigel and Cohen’s models are able to effectively explain Aruba’s SEE, since each’s deficiency is offset by the strengths of the other. Therefore, this research will utilize a combination of the two. Specifically, it will utilize Spigel’s EE model as a stable foundation, while using Cohen’s theory as a method of ‘translating’ this model to be usable for sustainable entrepreneurship, rather than technological innovative entrepreneurship. This will be done through retaining the cultural, social, and material attributes present in Spigel’s model, while utilizing the meaning given to them by Cohen to make these more applicable to investigate Aruba’s SEE.
UAUCU Student Research Exchange Collected Papers 2018
31
Figure 3: Sustainable Entrepreneurial Ecosystem Model - Continues on page 32

UAUCU Student Research Exchange Collected Papers 2018
32
Figure 3: Sustainable Entrepreneurial Ecosystem Model

UAUCU Student Research Exchange Collected Papers 2018
33
3. Methodology After providing the relevant concepts and theoretical framework, it is important to outline the qualitative methods that have been employed in order to determine how the distinct attributes of Aruba’s sustainable entrepreneurial ecosystem influence their ability to start and operate their business. Semi-structured interviews have been employed with relevant stakeholders. In line with Spigel’s (2015) research, qualitative methods have been employed rather than quantitative methods, since these “methods allow for a nuanced understanding of how entrepreneurs interact with their local entrepreneurial ecosystem and are particularly useful in situations where there are yet few standardized metrics to analyze the structure or success of entrepreneurial ecosystems” (p. 57). The stakeholders have been selected through maximum variation sampling, a purposive sampling technique focussed on involving varied actors with distinct roles as present in the utilized theoretical framework on the Aruban SEE. These actors included (semi)-governmental organizations, support systems, investment firms, research universities and most importantly, a diverse set of sustainable entrepreneurs. Selecting this wide range of actors will likely yield “important shared patterns that cut across cases and derive their significance from having emerged out of heterogeneity” (Patton, 1990, p. 172), thereby illuminating the barriers and drivers of the Aruban sustainable entrepreneurial ecosystem from multiple angles.
Most actors were easily identified as such, excluding the sustainable entrepreneurs. These were identified through the use of two essential criteria. Firstly, in order to determine whether the interviewed classified as ‘entrepreneur’, the interviewee was asked their role at the enterprise, which had to match one of the three forms of entrepreneurship provided by Wennekers and Thurik (1999). Specifically, the interviewee had to be a
business owner, or an intrapreneur, an employee that makes commercial decisions on behalf of their supervisor. Furthermore, in order to determine whether the business would be considered sustainable, the interviewee was asked their personal drivers for starting and operating their business. If this corresponded with Greco and De Jong’s (2017) definition, the interviewee would be considered a sustainable entrepreneur. Specifically, if one of the main drivers was to provide an economic, environmental or social sustainable need.
In total, sixteen semi-structured interviews were conducted, of which fifteen was in person and one through video call. Of these interviews, fifteen were conducted in English, with the occasional use of Dutch, and one entirely in Dutch. The duration of these interviews ranged from 16 to 100 minutes. After conducting these interviews, they were transcribed, and later coded and analyzed utilizing Nvivo, software designed to organize and analyze qualitative data. The employed framework has been deduced from the aforementioned framework, consisting of a synergy between Spigel’s (2015) EE model and Cohen’s (2006) SEE model, utilizing the former’s structure and attributes, and the latter’s focus on sustainable entrepreneurship in order to make these attributes applicable to Aruba’s SEE.
Using Nvivo, multiple relevant concepts present in the literature were analyzed. These include: 1) The culture surrounding sustainability and (sustainable) entrepreneurship as experienced by both sustainable entrepreneurs themselves and other relevant actors; 2) The influence of Aruba’s social attributes as experienced by sustainable entrepreneurs; and 3) The influence of material attributes as experienced by sustainable entrepreneurs. In order to substantiate this analysis, the literature review, policy documents, general information about relevant actors and initiatives, and other secondary sources will be utilized as way of cross-reference.

UAUCU Student Research Exchange Collected Papers 2018
34
Figure 4: Interviewee List

UAUCU Student Research Exchange Collected Papers 2018
35
4. Analysis4.1 Cultural Attributes4.1.1 Supportive CultureThe culture surrounding sustainability and entrepreneurship is incredibly important for a region’s SEE. Specifically, how the general population and the relevant actors understand and value not only sustainable entrepreneurship, but also sustainability at large, can enable or inhibit potential sustainable entrepreneurs from starting and operating their business.
Firstly, an important component of a culture that is supportive of sustainable entrepreneurship is that the relevant actors understand and value sustainability. All of the interviewed actors understood the term sustainability in either the environmental, financial or social context. Many of those interviewed emphasized the multidimensional nature of sustainability, while others stressed either the environmental or financial aspects. Themes that came back multiple times were the United Nation’s Sustainable Development Goals and the focus on long-term focused growth. Furthermore, most of the interviewed actors understood the importance of sustainable development and sustainability in the Aruban context. One of the interviewees expressed it as:
First of all, small island states do not always have all the resources that you need in order to address sustainability issues. Second, due to the scale it is much more difficult for the small island states to develop their own solutions. Third, due to Aruba being a post-colonial island state… you will see that the practice in society is to adopt European solutions. (R-U-2)
Even more important, however, is the perception of the general population concerning sustainability, since this can have a large influence on the decision to start All the interviewed, both sustainable entrepreneurs and other actors, were asked what, in their opinion, the general culture surrounding sustainability entailed. The majority
felt that the general population was far from knowledgeable or involved in sustainable practices.
Nevertheless, numerous interviewees sensed a gradual shift occurring, especially related to the younger generation, which in their opinion are more sustainable than previous generations (S-E-3, S-E-4). One of the interviewees experienced that although the older generation understands the importance, they simultaneously look at the new generation as those who should take sustainability:
“People are more ambitious for their kids than for themselves. People see the potential in it, but they are like: can’t teach an old dog new tricks.” (S-E-3)
Moreover, some felt that traditionally there was a lack of entrepreneurial culture on the island and that the public sector functioned as a “safety net”, yet that the “millennials” were changing this culture (R-U-1; S-S-2).
The way we look at the new generation, they are developing their own career, it is not the traditional way anymore because literally from start on they are entrepreneurs themselves and they look at ways of making this sustainable, which is a completely different approach from a, let’s call it the, the more older generation by being more traditional. (S-S-2)
Despite the fact that most interviewees experienced the Aruban population as unknowledgeable, most of the entrepreneurs received positive responses after starting their sustainable business. For example, one of the interviewees stated that:
A lot of people loved it from the beginning. I have many followers, many people that are interested in the concept, it was great.” (S-E-1)
Another interviewee reiterates this notion and claims that the generally positive response from the local population
UAUCU Student Research Exchange Collected Papers 2018
36
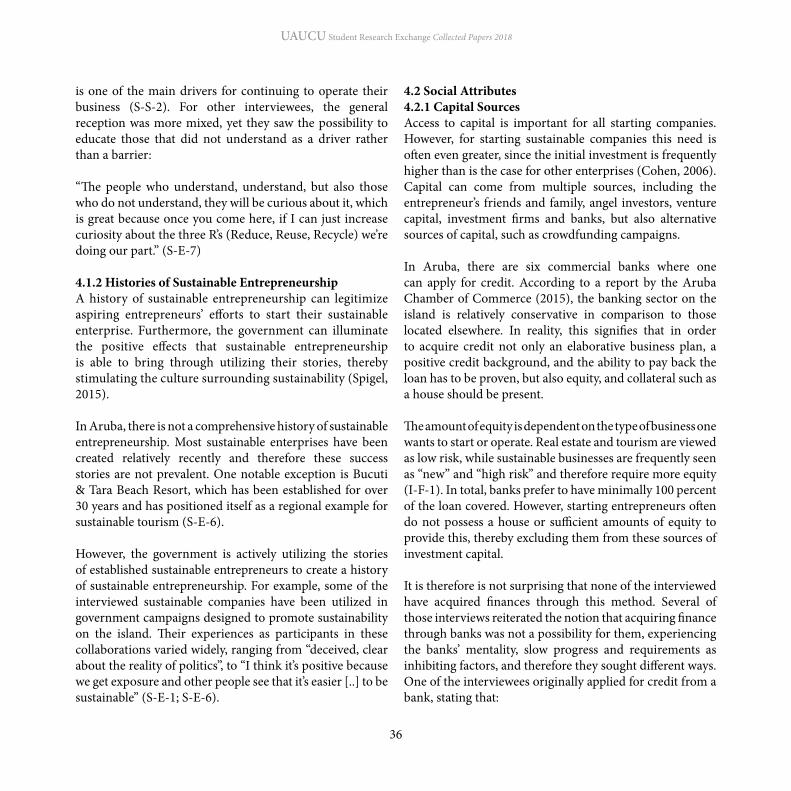
is one of the main drivers for continuing to operate their business (S-S-2). For other interviewees, the general reception was more mixed, yet they saw the possibility to educate those that did not understand as a driver rather than a barrier: “The people who understand, understand, but also those who do not understand, they will be curious about it, which is great because once you come here, if I can just increase curiosity about the three R’s (Reduce, Reuse, Recycle) we’re doing our part.” (S-E-7)
4.1.2 Histories of Sustainable EntrepreneurshipA history of sustainable entrepreneurship can legitimize aspiring entrepreneurs’ efforts to start their sustainable enterprise. Furthermore, the government can illuminate the positive effects that sustainable entrepreneurship is able to bring through utilizing their stories, thereby stimulating the culture surrounding sustainability (Spigel, 2015).
In Aruba, there is not a comprehensive history of sustainable entrepreneurship. Most sustainable enterprises have been created relatively recently and therefore these success stories are not prevalent. One notable exception is Bucuti & Tara Beach Resort, which has been established for over 30 years and has positioned itself as a regional example for sustainable tourism (S-E-6).
However, the government is actively utilizing the stories of established sustainable entrepreneurs to create a history of sustainable entrepreneurship. For example, some of the interviewed sustainable companies have been utilized in government campaigns designed to promote sustainability on the island. Their experiences as participants in these collaborations varied widely, ranging from “deceived, clear about the reality of politics”, to “I think it’s positive because we get exposure and other people see that it’s easier [..] to be sustainable” (S-E-1; S-E-6).
4.2 Social Attributes4.2.1 Capital SourcesAccess to capital is important for all starting companies. However, for starting sustainable companies this need is often even greater, since the initial investment is frequently higher than is the case for other enterprises (Cohen, 2006). Capital can come from multiple sources, including the entrepreneur’s friends and family, angel investors, venture capital, investment firms and banks, but also alternative sources of capital, such as crowdfunding campaigns.
In Aruba, there are six commercial banks where one can apply for credit. According to a report by the Aruba Chamber of Commerce (2015), the banking sector on the island is relatively conservative in comparison to those located elsewhere. In reality, this signifies that in order to acquire credit not only an elaborative business plan, a positive credit background, and the ability to pay back the loan has to be proven, but also equity, and collateral such as a house should be present.
The amount of equity is dependent on the type of business one wants to start or operate. Real estate and tourism are viewed as low risk, while sustainable businesses are frequently seen as “new” and “high risk” and therefore require more equity (I-F-1). In total, banks prefer to have minimally 100 percent of the loan covered. However, starting entrepreneurs often do not possess a house or sufficient amounts of equity to provide this, thereby excluding them from these sources of investment capital.
It is therefore is not surprising that none of the interviewed have acquired finances through this method. Several of those interviews reiterated the notion that acquiring finance through banks was not a possibility for them, experiencing the banks’ mentality, slow progress and requirements as inhibiting factors, and therefore they sought different ways. One of the interviewees originally applied for credit from a bank, stating that:
UAUCU Student Research Exchange Collected Papers 2018
37
“We did [...] some checking, but the bank [...] they are more interested in loans for houses and cars and it was like not easy. [..] For them this is a big risk operation. I do not know why.” (S-E-2)
Therefore, since it took a “long time” and the process was “difficult”, the sustainable entrepreneurs decided to opt for crowdfunding instead. Another interviewee also acquired their capital through crowdfunding, while several others have either acquired their starting capital by themselves or through friends and family (S-E-1;S-E-5:S-E-6).
Another interviewee refrained from applying for credit from the bank because “they will not understand”, yet has instead acquired funding through Qredits, which is a micro finance business from the Netherlands (S-E-7). In 2017, Qredits opened a branch in Aruba and provides loans up to ƒ94.000 to small and medium sized enterprises. In comparison to the regular process of acquiring capital, Qredits focuses more on the business plan and the unique selling position of the company than on the provided equity and collateral, thereby enabling starting entrepreneurs the opportunity to start their business (S-E-7; I-F-1).
Furthermore, Qredits is perceived to understand and value the sustainable aspect of businesses, and provides those that acquire a loan with coaching in different fields, such as marketing, finance, administration and sales. Additionally, Qredits assists with the writing of business and financial plans, and also attempts to connect their clients with commercial banks if they require more than the original ƒ94.000. Therefore, Qredits seems to provide an alternative to entrepreneurs that otherwise would not be able to acquire finance, among them many current and potential sustainable entrepreneurs.
4.2.2 Worker TalentIn order for sustainable businesses to effectively conduct their business, the presence of employees with the right
technological and sustainable background is required. In Aruba, there is a lack of educated local Arubans, specifically with a background in sustainability. Specifically, only 13 percent of the population is educated on a Bachelor level or higher and subsequently 60 percent of the private sector experiences a skill gap (Central Bank of Aruba, 2018). This can be accounted to the high amount of brain drain, the outflux of educated people towards other regions. For prospective students, the curriculum at the University of Aruba is experienced as limited in comparison to those in other countries, such as the Netherlands or the United States. Therefore, 300 Aruban students annually leave to study abroad, while only 20 percent of these return within 3 to 5 years. This can be accounted to the fact that only 25 percent of Aruban young professionals think that there are local growth or business opportunities for them on the island (Central Bank of Aruba, 2018).
Most of the interviewed entrepreneurs claimed that they were eventually capable of finding people with the right knowledge concerning sustainability and technology. However, this knowledge would have to come from foreign professionals, rather than from local Arubans, since “Aruba doesn’t really have a that type of knowledge” (S-E-1). The general consensus therefore is that “you have to find somebody in Holland [...] if you do want to pursue that type of personnel.” (S-E-4).
However, it is unsustainable for a region to be dependent on outside knowledge. Fortunately, the University of Aruba is perceived to understand the necessity to educate the local population in this regard.
They bring their experience. They will take data from their environments. They will compare that without having broad contextual knowledge, will give an advice for solutions that are based on their backgrounds within continental Europe or continental United States, whatsoever. And then it’ll go,

UAUCU Student Research Exchange Collected Papers 2018
38
go away again, leaving the islands without that expertise. It is our strong conviction that if we want to have sustainable practices in this society, we need expertise to be here and build up from here. (R-U-2)
The University of Aruba might therefore be able to effectively solve this dependency on foreign worker talent through expanding its curriculum with technological and sustainable-focused programs, providing the local population a plausible alternative to studying elsewhere. This would decrease the brain-drain and therefore increase the sustainability of the Aruban economy.
4.2.3 Networks Networks are especially important for sustainable entrepreneurs, since these can provide effective ways of acquiring knowledge and resources early in the startup phase. There are multiple organizations in Aruba that attempt to enhance the network for sustainable entrepreneurs.
Firstly, there is the ATECH Foundation, a for-purpose organization that has organized an annual conference since 2015 in order to unite startup-founders, investors, entrepreneurs and other stakeholders in the industry, and thereby attempts to stimulate network building and educate the local Aruban population. At the event there are a wide range of speakers, ranging from tech entrepreneurs to sustainable development experts. Furthermore, startups can participate in a pitching contest, in which the winner will receive $20000 (ATECH, 2017).
Moreover, there are other entities that organize networking events. One example is creative platform Beam, which organizes multiple events, such as Beam social, where creatives and entrepreneurs connect. Furthermore, Beam provides starting companies a platform where starting entrepreneurs can expand their networks. The Aruban Chamber of Commerce also organizes networking events,
which are attended by numerous entrepreneurs, but also workshops, lectures and seminars, whereafter networking activities can be conducted (S-S-2; S-S-1).
However, there are few activities specifically focused on networking for sustainable entrepreneurs. In the tourism sector, the Aruba Hotel and Tourism Association (AHATA) has created the AHATA environmental committee, whose members come together once a month to discuss sustainability related issues. Furthermore, they organize events, such as beach cleanups through which they stimulate a sustainability-focused network of hotels, the public sector, and the community at large (S-E-6).
Furthermore, there is the Americas Sustainable Development Foundation (ASDF), which “is an independent not-for-profit advisory foundation that connects people with innovative ideas to take concerted actions to address sustainable development challenges across the Americas” and organizes networking events, such as the Circular Economy Club Event.
Most of the interviewed sustainable entrepreneurs did not experience that there were numerous events in which they could participate; however, two did participate in informal and formal networking events organized by AHATA and the ASDF, which they experienced positively (S-E-4;S-E-6).
In order to acquire resources from the network, however, sustainable entrepreneurs must be willing to provide resources, such as knowledge, to other entrepreneurs, but also to seek these resources if needed. Most of the interviewed sustainable entrepreneurs would be willing to assist other entrepreneurs if they would seek advice. This culture of sharing for the greater good was illustrated by one of the interviewed who stated that:
We really want others to do the same thing, we’re not trying to keep this a big secret, but we’re trying to show people

UAUCU Student Research Exchange Collected Papers 2018
39
that, you know, it’s something that is, it’s not hard to do, but you can also do it. So if they have questions, we’re more than happy to answer.(S-E-6)
Two others, however, were willing to share basic information, yet felt that this should be limited, since “[they] did all the work and then you just give it to somebody”, while another felt that their “data is proprietary” (S-E-2; S-E-4). Moreover, all of the interviewed sustainable entrepreneurs would ask others for resources, and have successfully done so, since multiple of them have acquired not only advice and assistance, but also affordable space and financing through their networks (S-E-2;S-E-3;S-E-7).
4.2.4 Mentor and Role ModelsThe presence of sustainable role models and mentors can greatly increase the likelihood of entrepreneurs starting and successfully operating sustainable enterprises. On the island of Aruba, there is not a comprehensive history of sustainable entrepreneurship; almost all of the interviewed sustainable enterprises were less than 6 years old, and therefore it is unsurprising that almost none were inspired by established sustainable entrepreneurs before them. However, one of the interviewees who started their business this year had been inspired to do so by another Aruban sustainable entrepreneur:
I came in contact with a very good friend of mine, [individual], she has [business name] and [...] started recycling, and then you do more research and you encounter stuff [...] and if we all do a little bit, [...] we will do better off. (S-E-7)
Therefore, we can already see that relatively recently established sustainable businesses inspire other individuals to become sustainable entrepreneurs themselves. Concerning mentorship, there is a similar tendency. Solely one of the interviewed sustainable entrepreneurs claims to have a mentor (S-E-7).
4.3 Material Attributes4.3.1 Policies Governments can play a crucial role in the creation of a climate advantageous to sustainable enterprises, for example, through providing tax incentives and forms of financial support, such as grants and subsidies, and the removal of bureaucratic ‘red tape’, but also through creating innovative legislation and raising public awareness for sustainability through events, regulations, and projects (Spigel 2015; Cohen, 2006).
As mentioned before, after Mike Eman’s Arubaanse Volkspartij (AVP) managed to form a majority coalition in the 2009 elections, sustainable development penetrated almost all aspects of the government’s external communications. One of the earliest expressions occurred when the government initiated the Green Aruba Conference in 2010, a yearly conference that provides “a platform [..] set for information exchange at an expert level” specifically focused on green energy (Government of Aruba, 2014, p.6). This conference has boasted prestigious speakers, such as American politician and environmentalist Al Gore and current Dutch King Willem-Alexander. In 2014, the Green Aruba Conference merged with Europe meets the Americas Conference, further solidifying its desire to position itself as a sustainability hub between the three continents.
Most important, however, was the announcement of Aruba’s 2020 vision, a collaboration between the Aruban government and Sir Richard Branson’s Carbon War Room. Announced at the Rio+20 convention in 2012, the Aruban government would focus on achieving 100% fossil fuel independence by 2020 through the use energy generated through solar, wind, and waves.
Another effort by the Aruban government involved partnerships with external actors in order to promote their sustainability agenda. One of such partnerships is with

UAUCU Student Research Exchange Collected Papers 2018
40
TNO, a Dutch “renowned not-for-profit organization for applied scientific research”, which established a Caribbean branch on Aruba in 2011. Their most prominent project is Smart Community Aruba, a collaborative effort of the Aruban government, TNO and “a 20 unit residential neighborhood aimed at sustainable living” that functions as “a professionally managed research, test and demonstration environment” for sustainable technologies.
Additionally, the United Nations Development Program (UNDP) announced the establishment in Aruba of a Centre of Excellence for the Sustainable Development of Small Island Developing States in 2015, “to provide a platform for strengthening innovation and resilience among SIDS” (UNDP, 2015).
Besides partnering up with external actors, the government of Aruba has also assisted in the creation of (semi-)governmental organizations itself. For example, Bureau Innovatie (BI), founded in 2014, was part of the Ministry of General Affairs, Sustainable Development, Innovation and Science, “to strategically develop, support and advise on the areas of social-, technological- and economic innovation for the benefit of Aruba’s vision to create a sustainable society” (Bureau Innovatie, 2017).
BI initiated and supported multiple projects and initiatives. One of such projects is Startup Aruba, which was “a public-private platform to cocreate and facilitate the development of a startup ecosystem in Aruba.” (Government of Aruba, 2017, p. 31). Another project BI supported was TEDx Aruba, which “strives for sustainable innovation, new business creation and bringing ideas to life” (TED, 2015). TEDx Aruba attempts to accomplish this through their annual coordination of an independently organized event where predominantly international inspirational speakers, among them (sustainable) entrepreneurs, can inspire Aruban individuals.
Furthermore, BI organized Coffee Bytes, Hackathons and other workshops where knowledge concerning entrepreneurship, innovation and sustainability were created and dispersed. Additionally, BI also founded the Green’S’Cool Foundation, which “aims to educate the next generation on the importance of living green and instill environmentally friendly behaviors among Aruban citizens” through “innovative, viable and fun methods” (Green’S’Cool Foundation, 2018).
Lastly, the Mobile Tech Lab program was initiated, a program focussed on exposing and teaching primary school pupils to work with new technologies. BI was discontinued after Eman’s AVP was voted out of office in the 2017 elections. However, some of the projects have been continued by the current government.
Another governmental organization designed to “boost economic activity, sustainable development, and encourage local entrepreneurship” is the Aruba Investment Agency (ARINA), which was founded in 2012. As an investment agency, ARINA provides local and foreign investors intelligence, advice, assistance, connections, and most importantly, a fast track for licenses and permits, signifying that these can be acquired relatively faster. (Government of Aruba, 2017).
Moreover, Iniciativa pa Desaroyo di Empresa Arubano (IDEA) was created in order to contribute to the formation of sustainable development in the business sector. IDEA provides small business owners with practical assistance and education, such as workshops concerning business plans, social media management, and small business tax (Aruba Economic Affairs, 2018).
Additionally, the Aruban government has banned single-use bags in order to “prevent litter on the streets and in the sea” and to “to contribute to preserving the environment.” (Government of Aruba, 2016). Furthermore, import tariffs

UAUCU Student Research Exchange Collected Papers 2018
41
on ‘green’ products, such as solar panels and windmills, but also machines utilized for sustainable businesses, have been reduced to 2%, and businesses that employ sustainable activities may employ a profit tax rate of 10% and an exemption of dividend withholding tax.
Despite the fact that sustainability has been evident in Aruban policies, the majority of the interviewed sustainable entrepreneurs stated that in their opinion these measures have had little impact and go as far as saying that “for the past eight years that AVP sat in the government, it was all talk and no actions, which are political, nothing. Nothing was done.” (S-E-1). Others have expressed that the efforts of the Aruban government are solely “marketing” or a ‘marketing scheme” “to make it seem like a lot of things are going on” (S-E-3;S-E-4;S-E-6).
The frustration often lies with the high amount of bureaucratic red tape associated with applying for licenses and permits, but also with applying for tax reduction. For example, some of the interviewed have received import tariff reductions when they purchased their required equipment (S-E-1;S-E-2;S-E-4;). However, the majority of the interviewed sustainable entrepreneurs have not received any tax incentives from the government at all (S-E-3;S-E-5;S-E-6;S-E-7). For some sustainable businesses this is due to the government’s focus on green technology rather than sustainable activities in general; those that conduct the latter are frequently not eligible for the tariff reduction, since they simply do not have to import ‘green’ equipment.Furthermore, there are also those that do apply for the reduction of the import tariffs, but find the process of receiving this reduction cumbersome, resulting in the eventual retraction of their application. For example, according to one of the interviewees, the process of receiving the import tariff reduction was unpractical:
It was just like a lot of bureaucracy that doesn’t happen. It wasn’t accessible. It wasn’t useful [...] it is three months and
you still can’t get your machines. It is a lot of time. [...] we ended up paying more than 2000 [Aruban] guilders to just bring in things [...] it would mean a whole other machine or something that like by law we should be able to have tax free, just because there is too much red tape. (S-E-3)
This bureaucratic red tape also seems to be apparent in the process of acquiring permits, licenses and other requirements for starting up a business. While some businesses experienced this process as “easy” or “average”, multiple others experienced the process as long, confusing and inhibiting. For one of the interviewees, the process of acquiring the required permits is “really difficult” and hinders their business:
“If [they] are not ready we are not allowed to open [...] we are working with an external company [...] to see if they can get a temporary permit.” (S-E-7)
For others, the process of acquiring all the required permits, licenses and forms has taken years, yet is still unfinished. In theory, larger local and international investors could make use of ARINA’s fast track, reducing the time it takes acquire the required permits and licenses. In reality, however, the departments responsible for providing these service are not capable of doing so (G-O-3).
Another phenomenon that came up during the interviews, yet is absent in SEE theory, is the impact that government discontinuation has on policies and campaigns concerning sustainability. For example, one of the interviewed entrepreneurs actively refrains from participating in government campaigns and collaborations due to the politicization of government projects, stating that:
“We’d rather just work directly with companies and people that are not trying to push something through the government because it’s not very sustainable, it takes four years and there’s another government. So if you have

UAUCU Student Research Exchange Collected Papers 2018
42
something that is built within the community, it has more resilience than something that gets implemented through the government”. (S-E-3)
This notion was also reiterated by another interviewee, who commented on how the “discontinuation” of government policies hinder business processes, claiming that “good things get lost or because the other minister signed it and the other one will not” (S-E-4).
An example of this is the closure of Bureau Innovatie after the election of the MEP in 2017, since it was deemed too close to the previous AVP government. However, both former and current government representatives state that this discontinuity does not affect projects and that they are in contact with each other in order to accommodate this transition (G-O-1;G-O-2).
Also, the current government has appointed a Chief Innovation Officer, who is appointed to guide the smart diversification of the economy and digitalization of government protocols, with a special focus on innovation, creativity and sustainability. A government strategic plan concerning these developments will be released in June 2018, and will include multiple measures that will stimulate sustainable entrepreneurship. Examples include utilizing blockchain technology to reduce red tape, a strategic venture fund to provide finance to innovative or sustainable enterprises, and setting up a youth agenda in order to instill entrepreneurial spirit in the younger generations (G-O-2). Lastly, some of the interviewed actors claimed that, in their opinion, Aruba’s rigid labour laws and high tax rates also inhibit the ability of entrepreneurs to start and operate their business. Nevertheless, none of the sustainable entrepreneurs mentioned this as a barrier (S-S-2; R-U-1).
4.3.2 Research UniversitiesResearch universities can play crucial roles in SEEs through providing the interdisciplinary knowledge required for
understanding and executing sustainable development. Furthermore, it can promote sustainable development through enriching its curriculum with courses and faculties focused on sustainability, thereby educating potential sustainable leaders, entrepreneurs, employees and consumers. Additionally, research universities can develop technological solutions capable of enhancing sustainability.
Aruba has multiple institutes of higher learning, such as the Instituto Pedagogico Arubano (public institution for higher professional education), All Saints University of Medicine and Xavier University School of Medicine (private institutions for medical science), Compulearn (IT training), Doc (private institution for financial administration, management etc.) and the Caribbean Academy of Business (private institution for business studies) (NUFFIC, 2013).
The only research university, however, is the University of Aruba, which was established in 1988. Currently, the university consists of four faculties, which are the Faculty of Law, Faculty of Economics and Finance, Faculty of Hospitality and Tourism Management Studies, and the Faculty of Arts and Science. Together, these faculties provide a wide range of bachelor and master programs, including, but not limited to International Tourism Management, Social Work & Development and Organisation, Governance & Management (R-U-2).
Multiple courses contain sustainability aspects. For example, students in the final year of the Business Economics and Commerce programs have to approach business questions from a “sustainable development perspective”, which has resulted in “them being involved in community projects” concerning sustainability (R-U-2). Furthermore, a sustainability program has been set up in the Faculty of Hospitality and Tourism Management Studies, and sustainable development plays a fundamental role in the relatively recently founded faculty of Arts and Science.
UAUCU Student Research Exchange Collected Papers 2018
43
However, the current curriculum does not offer courses that provide sufficient technological and sustainability-related knowledge that is required to educate the local population. In order provide in this need, the University of Aruba is opening a fifth faculty in 2019, the Faculty for Sustainable Island Solutions Through Science, Technology, Engineering and Mathematics. This new faculty will offer a Bachelor’s degree in bioenvironmental studies, data and informatics and technology and engineering, and a Master’s degree in Sustainable Solutions. Moreover, the new faculty will start off with a PhD program, that in collaboration with students of the new Bachelor and Master programs, will focus on making the practices and other programs of the University of Aruba more sustainable (R-U-1;R-U-2).
Additionally, the University of Aruba has set up the Academic Foundation Year (AFY), a program at the HBO propaedeutic level that “has been created with the purpose of serving as a bridge between high school and university” (University of Aruba, 2017). The program is comprised of four pillars: the Coaching and Counseling program, Academic core program, Language skills program, and the Academic orientation program. As part of the curriculum, a large number of students participate in the Earth and Environment track, which has shown to increase their engagement in sustainability initiatives (R-U-2).
Furthermore, AFY provides its students the opportunity to intern with researchers from the UAUCU program, an annual Undergraduate Research Exchange between the University of Aruba and University College Utrecht. In this program, undergraduate students conduct research primarily focused on sustainable subjects, such as sustainable tourism, waste management, energy policies and coral reef research. This program produces a large amount of knowledge concerning sustainability in Aruba. Interning with these researchers inspires these AFY students to be further involved in sustainability initiatives, or at least assists in them becoming educated consumers (R-U-2).
In relation to sustainable entrepreneurs, the University of Aruba is actively connected to them. Several of the interviewed sustainable entrepreneurs have either publicly spoken at the university or invited students to visit their enterprise to give guided tours in “order give back to them and give them information to guide them to the direction that I think they should be guided” (S-E-4). Others that have not done this yet would be interested in doing so, because they “think it is cool to pay it forward” (S-E-7).
Currently, the University of Aruba does not develop any sustainable techniques or technology, which explains why none of the interviewed sustainable entrepreneurs utilized any techniques developed by the University of Aruba. However, none of the interviewed was opposed to this idea. One interviewee in particular was passionate about this possibility, stating it would be beneficial for the island, since universities can develop techniques at a lower costs than private engineers would (S-E-4).
4.3.3 InfrastructureThe physical infrastructure of a region can play an important role. For example, transportation costs, the connectivity and state of the roads, the availability of affordable housing, electricity, and water can influence sustainable entrepreneurs’ ability to start and operate their businesses.
In recent years, the Aruban government has invested large amounts of money to enhance Aruba’s infrastructure. Examples of this include the urban renewal of Oranjestad and San Nicolas, the construction of the Green Corridor, which is the expansion of the road between the Reina Beatrix Airport and San Nicolas, the construction of the Watty Vos Boulevard Route, the repurposing of the Port of Oranjestad and Baracadera and the expansion of the Reina Beatrix Airport (Government of Aruba, 2017).
A limitation of Aruba’s infrastructure is the fact that it is an island, meaning that all import and export goods need

UAUCU Student Research Exchange Collected Papers 2018
44
to be transported utilizing airplanes or container ships, making this process relatively expensive. Many interviewed sustainable entrepreneurs saw this as a barrier or nuisance to their operations for several reasons (S-E-2;S-E-4;S-E-5). Firstly, “being on an island makes it difficult because you got to transport everything via container when everything is in containers it is already expensive” (S-E-4). Because of these expensive costs, certain sustainable entrepreneurial activities cannot be executed, as the same interviewee claims:
“Glass is something that, you know, in other countries you can do [...] we have to ship glass, it’s going to cost a fortune, so that makes it prohibitive.” (S-E-4)
However, not only the costs form a barrier, also the process is viewed as troublesome. For example, two interviewees claimed that the process of exporting goods is “horrible” due to the fact that the customs procedure takes 4 or 5 days, thereby slowing down the process. Another sustainable entrepreneur described the process of importing goods as “like a drama”, since packages get lost and the process of claiming takes weeks (S-E-2;S-E-4;S-E-5).
Most entrepreneurs did not have any trouble concerning electricity and water when their property was already connected. However, two entrepreneurs found the process of getting connected to these infrastructures a difficult and long process. One interviewee explains:
“That is typical Aruba [...] it took months, months, months, before we got our own power. But now it’s OK. It was a really big barrier. If we, if we would have wanted to start up faster it would not be possible because of this.” (S-E-2).
Another form of infrastructure that is not present in the model, yet mentioned by several sustainable entrepreneurs is the lacking financial infrastructure. Some of the interviewees namely claimed that it took months to open
an account at a bank, which is necessary for receiving and sending money, and therefore essential for starting a business (S-E-2;S-E-3;G-O-3)
Regarding water, most entrepreneurs did not experience any problems. To one of the entrepreneurs, however, the current water price is preventing him for operating his sustainable agricultural business, since the water is too expensive for their business to be profitable (S-E-1).
Lastly, two interviewees also noted the relatively high costs of renting or buying properties as possible barriers. However, this did not pose any barriers, since those entrepreneurs that were facing problems capable of finding affordable solutions through their networks (S-E-4).
4.3.4 Support ServicesSupport services, which include not only accountants, tax lawyers, human resource advisers, but also incubators, accelerators and co-working spaces can provide essential services to starting sustainable enterprises. In order to most effectively support sustainable enterprises, it is essential that these support services understand and value the sustainability aspect of their business (Spigel, 2015; Cohen, 2006).
The majority of the interviewees made use of accountant services, while a few also made use of other services, such as tax lawyers. Most of these found that their accountant understood and valued the sustainability aspect of their business, in some cases they were active supporters or even investors of the enterprise (S-E-2; S-E-3; S-E-5; S-E-6; S-E-7).
Co-working spaces can also provide starting sustainable enterprises with services that are especially important in an early stage. On Aruba, there are two co-working spaces, which are Co-lab and the Vault. As part of these co-working spaces, tenants can rent either an office or a desk space, reducing the costs that are normally associated with renting office space. Furthermore, not only basic utilities such as

UAUCU Student Research Exchange Collected Papers 2018
45
electricity, water, WiFi connection, and a conference room are included, but also training, workshops, and networking events. None of the interviewed sustainable entrepreneurs were part of such co-working spaces; however, the interviewed co-working space would be open to sustainable enterprises that would like to join (S-S-1).
For most of the interviewed sustainable entrepreneurs, incubators were not relevant, since their business model required specific characteristics for their location. For example, a hotel or a waste recycling plant can not practically be part of an incubator. However, of those that were practically able to join an incubator were positive about this possibility (S-E-3; S-E-7).
At this moment, there are no business incubators present on the island of Aruba. However, there are multiple initiatives that are currently working on creating this support service. The most tangible project is part of the COSME project, an EU funded program that has the responsibility to allocate $15 million dollars to “contribute to the sustainable and climate-resilient economic diversification and prosperity of Caribbean states” (COSME, 2018). As part of this program, incubators are being set up across the Overseas Caribbean Territories in order to stimulate the sustainability and competitiveness of SMEs. In Aruba, two incubators will be set up: one in Oranjestad and one in San Nicolas. They are planned to be up and running in Q1 2019 (S-S-2).
Currently, the incubator program is promoted by the Aruba Chamber of Commerce (KvK), in collaboration with other public and private actors, such as the University of Aruba and the government. As part of this, the KvK has conducted an incubator survey, to which 18% of the respondents claimed that they would definitely make use of the incubator (Aruba Chamber of Commerce, 2018).
Additionally, the survey also asked the respondents what services an incubator should provide, of which the most
popular answers were accounting and legal assistance, business guidance, networking and assistance in acquiring capital. Taking this feedback into account, these services will be part of the incubator, with the KvK providing the relevant guidance, consisting of courses, lectures and trainings.
Besides this initiative, the creative platform Beam, which now organizes creative and entrepreneurial events, is also planning to provide a co-working space in the near future, as well as one of the interviewed sustainable entrepreneurs, who desires to provide their space available to other creative and sustainable entrepreneurs (S-E-7;S-S-3).
3.3.5 Open MarketsThe availability of strong local markets is another important factor for the success of a SEE, because the presence of local clients with specialized issues makes a good climate for introducing new solutions. Furthermore, local sustainable entrepreneurs are capable of identifying the issues present in the area, and can test solutions on a small scale, using it as a stepping stone for entering other markets (Spigel, 2015). Aruba is able to provide such a climate, because of its SIS-status, which signifies that the island experiences a whole range of unique issues, that therefore also require a large number of solutions. The majority of these solutions are still insufficiently discovered, which signifies that there are numerous opportunities in the form of entrepreneurial spinoffs.
The majority of the interviewed sustainable entrepreneurs directly address SIS-related issues. For example, three of them provide assistance to solutions for the waste management process, recycling waste into products that can be reused on the island, such as oil, gas and appliances. Furthermore, others have found innovative solutions for Aruban agriculture, which is traditionally difficult because of the arid and hot environment (S-E-1; S-E-2). This makes Aruba more sustainable through decreasing the

UAUCU Student Research Exchange Collected Papers 2018
46
dependence on uncertain streams of produce, such as the currently politically unstable Venezuela.
For two of the interviewed sustainable enterprises, Aruba indeed forms a springboard to other regions. One interviewed sustainable entrepreneur illustrates this thought clearly:
I think [...] what we put here on the island, [...] that’s going really well, so when this is finished you can see it also as a concept to put it somewhere else, then you can also take it and put it on Curacao. (S-E-2)
5. Conclusion and Discussion5.1 ConclusionThis study has aimed to illustrate the current state of the Aruban sustainable entrepreneurial ecosystem. Specifically, how the different attributes either inhibit or enable the startup of sustainable enterprises. Utilizing a synergy between Spigel (2015) and Cohen’s (2006) entrepreneurial ecosystem models, the cultural, social and material attributes of Aruba’s sustainable entrepreneurial ecosystem were analyzed.
One can conclude that the island of Aruba possesses attributes that clearly form barriers and drivers for starting and operating a business. Firstly, Aruba’s SIS status comes with numerous economic and environmental vulnerabilities, such as dependence on imports, limited amount of natural resources, and difficulties concerning waste management. Despite the fact that these vulnerabilities might be detrimental for Aruba as a whole, they are beneficial for the Aruban SEE. This is the case, because these vulnerabilities provide opportunities for sustainable entrepreneurs, which has been evident in this research sample.
Furthermore, despite the fact that the Aruban population is not well-versed in issues surrounding sustainability, they
are generally positively towards sustainable enterprises. The new generation of Arubans, in particular, is becoming more sustainable and entrepreneurial, which suggests a clear prospect for the future.
Nevertheless, there are numerous barriers that inhibit sustainable entrepreneurs’ ability to start and operate their businesses. Firstly, the government has executed various matters in order to increase awareness concerning sustainability, yet hard measures are lacking, resulting in the general perception that these measures are solely a “marketing scheme”. Interestingly, the discontinuity of government also came forward as a barrier. Thereafter, there is a large amount of red tape present, meaning that the process of starting up a business is unclear and long; it can take from months to even years. Such processes include acquiring the required permits and licenses, getting connected to the grid, and opening a bank account.
Another barrier is the difficulty of acquiring funding for sustainable startups, since Aruban banks are conservative and require large collaterals and equity stakes, in particular for ‘high-risk’ sustainable businesses. However, new alternatives have been opened, such as Qredits, which values sustainability and will therefore enable aspiring and operating sustainable entrepreneurs to acquire funding.
Moreover, as a result of brain drain to Europe and the United States, there is a lack of local expertise concerning technology and sustainability. Fortunately, however, the University of Aruba acknowledged this problem and is currently actively expanding its curriculum to include these subjects.
5.2 DiscussionOne could say that Aruba does not provide a climate that effectively enables sustainable entrepreneurs to start and operate their businesses. Nonetheless, there are attributes and developments present that seem promising. If recent

UAUCU Student Research Exchange Collected Papers 2018
47
government discontinuity, high tax rates and rigid labour laws, which if known beforehand, could have been included during the interviews with sustainable entrepreneurs. For future research, these qualities can be included.
Nevertheless, this research has provided a contribution to (sustainable) entrepreneurial ecosystem theory through focussing on a novel context, the SIS. It shows that the models are applicable to a wide range of circumstances, yet that the model should be utilized flexibly according to the local context In the case of Aruba, there is a unique set of circumstances that clearly influence the ability of sustainable entrepreneurs to start and operate their business. Specifically interesting are the opportunities that the economic and environmental vulnerabilities related to the SIS status provide. Further research can focus on how relevant actors can most efficiently enable sustainable entrepreneurs to exploit these opportunities.
Bibliography
• Acs, Z. (2006). How is entrepreneurship good for economic growth?. Innovations: technology, governance, globalization, 1(1), 97-107.
• Aruba Chamber of Commerce (2015). Aruba Business Environment: Economic Reality and Potential.
• Aruba Chamber of Commerce (2018). Incubator Survey.
• Arubaeconomicaffairs.aw. (2018). Aruba Economic Affairs - Iniciativa pa Desaroyo di Empresa Arubano (IDEA). [online] Available at: http://www.arubaeconomicaffairs.aw/index.php?option=com_content&task=view&id=84&Itemid=194
• Aruba Huis. (2012). Aruba en Carbon War Room kondigen samenwerking aan. Retrieved from Aruba Huis Persberichten: https://www.arubahuis.nl/prvoorlichting/persberichten/360-aruba-en- carbon-war-room-kondigen-samenwerking-aan
• ATECH (2018). ATECH* Conference 2017, Caribbean
developments, such as the availability of starter capital, education, incubators and other support programs are continued to be pursued, the first generations of Aruban sustainable entrepreneurs will be able to effectively exploit the opportunities that are present on the island. This will inspire a whole new generation of sustainable entrepreneurs, thereby constantly reinforcing attributes that will make Aruba the sustainable hub it desires to be. Furthermore, these findings are subject to certain limitations. Firstly, due to utilizing a purposive maximum variation sampling technique, the interviewed actors were selected for their relevance, which was determined by the researcher. Therefore, there was a certain degree of selection bias involved in selecting interviewees, which may have influenced the results. Furthermore, interviewees were asked questions concerning their view and practices on sustainability, relationships with and opinions about other actors, and their experienced barriers and drivers. Since these concern personal opinions about the self and other, there is a social desirability bias present, signifying that some actors will respond in a way that is viewed positively by others through emphasizing ‘good’ behaviour and downplaying ‘bad’ behaviour. This could possibly have had an effect on the answers reported by the interviewees, thereby influencing the results.
Moreover, only sparse research concerning sustainable entrepreneurial ecosystem theories has been executed. For example, the only model that specifically focussed on the barriers and drivers of sustainable entrepreneurship was created by Cohen (2006), which was exploratory in nature and therefore limited. This research is the first that combines Spigel (2015) and Cohen’s (2006) models in order to assess the attributes of a sustainable entrepreneurial ecosystem. In general, this synergy proved to useful, since it efficiently exposed the underlying drivers and barriers for Aruban sustainable entrepreneurs. However, interviewees named constraints that were not present in these models, such as

UAUCU Student Research Exchange Collected Papers 2018
48
public policies, Journal of Business Venturing, 4, issue 1, 11-26,
• Elkington, J. (2004) Enter the triple bottom line, in Henriques, A. and Richardson, J. (Eds.): The
• Triple Bottom Line, Does it All Add Up?, pp.1–16, Earthscan Publications, London.
• Emas, R. (2015) The Concept of Sustainable Development: Definition and Defining Principles
• Galindo, M. Á., & Méndez-Picazo, M. T. (2013). Innovation, entrepreneurship and economic growth. Management Decision, 51(3), 501-514
• Gartner, W. (1985). A Conceptual Framework for Describing the Phenomenon of New Venture Creation. The Academy of Management Review, 10(4), 696-706.
• Government of Aruba (2011). Green Gateway: Economic Vision and Policy 2011-2013. Oranjestad, Aruba
• Government of Aruba. (2017). Opportunities Ahead: Government Initiatives, Investment Opportunities, and Economic Prospects. Oranjestad.
• Greco, A., and de Jong, G. (2017). Sustainable entrepreneurship: definitions, themes and research gaps. (17ed.) (Working paper series ).
• Greenscool.org. (2018). GreenSCool. [online] Available at: http://greenscool.org/pages/ [Accessed 12 Apr. 2018].
• International Monetary Fund. (2010). Kingdom of the Netherlands-Aruba: 2015 Article IV Consultation Discussions- Sta Report, and Press Release. Washington, D.C. : IMF Publication Services
• International Monetary Fund. (2013). Kingdom of the Netherlands-Aruba: 2015 Article IV Consultation Discussions- Sta Report, and Press Release. Washington, D.C. : IMF Publication Services
• International Monetary Fund. (2015). Kingdom of the Netherlands-Aruba: 2015 Article IV Consultation Discussions- Sta Report, and Press Release. Washington, D.C. : IMF Publication Services
• Kelman, I., & West, J. J. (2009). Climate change
hottest tech conference. [online] ATECH* Conference. Available at: https://www.atechconference.com/
• Audretsch, D. B. and A. R. Thurik, (1999). Capitalism and Democracy in the 21st Century: From the Managed to the Entrepreneurial Economy’, Journal of Evolutionary Economics.
• Bernstein, L., Bosch, P., Canziani, O., Chen, Z., Christ, R., Davidson, O., ... & Kundzewicz, Z. (2007). IPCC, 2007: climate change 2007: synthesis report. Contribution of working groups I. II and III to the Fourth Assessment Report of the Intergovernmental Panel on Climate Change. Intergovernmental Panel on Climate Change, Geneva.
• Central Bank of Aruba (2018). Isla Innovativo. • Cia.gov. (2018). The World Factbook — Central
Intelligence Agency. [online] Available at: https://www.cia.gov/library/publications/the-world-factbook/rankorder/2004rank.html [Accessed 12 Apr. 2018].
• COSME Program. (n.d.). Retrieved April 12, 2018, from http://www.cosmeprogramme.org/about-cosme.html
• Blundel and Smith (2001). Business networks SMEs and inter-firm collaboration: a review of the research literature with implications for policy. The Small Business Service, Sheffield.
• Briguglio, L. (1995). Small Island Developing States and their Economic Vulnerabilities. World Development, 23(9), 1615-1632.
• Cohen, B. (2006). Sustainable valley entrepreneurial ecosystems. Business Strategy and the Environment, 15(1), 1-14.
• Cohen, B. and M. I. Winn, (2007). Market Imperfections, Opportunity and Sustainable Entrepreneurship, Journal of Business Venturing 22(1), 29–49
• Cropper, M.L and Oates, W.E, (1992). Environmental Economics: A Survey. Journal of Economic Literature, American Economic Association, vol. 30(2), 675-740
• Dubini, P. (1989), The influence of motivations and environment on business start-ups: Some hints for

UAUCU Student Research Exchange Collected Papers 2018
49
• Spilling, O. R. (1996). The entrepreneurial system: On entrepreneurship in the context of a
• mega-event. Journal of Business Research, 36, p. 91-103
• Stam, F. C., & Spigel, B. (2016). Entrepreneurial ecosystems. USE Discussion paper series, 16(13).
• University of Aruba (2016). The Academic Foundation Year. [online] Available at: http://www.ua.aw/academic-foundation-year/ [Accessed 13 Apr. 2018].
• Vanegas, M., & Croes, R. (2000). Evaluation of Demand: US Tourists to Aruba. Annals of Tourism Research, 27(4), 946-963.
• Wennekers, S., and Thurik, R. (1999). Linking entrepreneurship and economic growth. Small
• Business Economics 13:27-55.• Wong, P. P. (2011). Small island developing states.
Wiley Interdisciplinary Reviews: Climate Change, 2(1), 1-6.
• World Commission on Environment and Development (1987). Our Common Future. Oxford: Oxford University Press. p. 27
• World Economic Forum (2013). Entrepreneurial Ecosystems Around the Globe and Early-Stage Company Growth Dynamics
and small island developing states: a critical review. Ecological and Environmental Anthropology, 5(1), 1-16.
• Kirzner, I. M. (1974). Competition and entrepreneurship. Chicago: University of Chicago Press.
• Majid, I.A., and Koe, W.L. (2012). Sustainable Entrepreneurship (SE): A Revised Model Based on Triple Bottom Line (TBL). International Journal of Academic Research in Business and Social Sciences, 2(6), 293-310.
• Nambisan, S., & Baron, R. A. (2013). Entrepreneurship in innovation ecosystems: entrepreneurs’ self‐regulatory processes and their implications for new venture success. Entrepreneurship Theory and Practice, 37(5), 1071-1097.
• NUFFIC (2016). Evaluation of foreign degrees and qualifications in the Netherlands
• Patton, M. Q. (1990). Qualitative evaluation and research methods. SAGE Publications, inc.
• Pelling, M., & Uitto, J. I. (2001). Small island developing states: natural disaster vulnerability and global change. Global Environmental Change Part B: Environmental Hazards, 3(2), 49-62.
• Rohrbeck, R., Hölzle, K., & Gemünden, H. G. (2009). Opening up for competitive advantage–How Deutsche Telekom creates an open innovation ecosystem. R&d Management, 39(4), 420-430.
• Ridderstaat, J. (2007). the Lago Story, the Compelling Story of an Oil Company on the Island of Aruba.
• Schumpeter, J. A. (1934). The theory of economic development – An inquiry into profits, capital, credit, interest, and the business cycle. Cambridge, MA: Harvard University Press
• Schumpeter, J. (1947). Capitalism, socialism, and democracy. New York: Harper & Brothers.
• Spigel, B. (2017). The relational organization of entrepreneurial ecosystems. Entrepreneurship Theory and Practice, 41(1), 49-72.


UAUCU Student Research Exchange Collected Papers 2018
51
The UAUCU project has been a unique opportunity for me as an Aruban student studying in the Netherlands, coming back to my home island and experiencing the environment of eagerness to learn and to add to the body of knowledge that constitutes sustainable development for small island states. Personally, I have grown up in an atmosphere of curiosity and critical thinking that always fueled me to try and find new and exciting things to learn about my island. Aruba has a lot to offer for a small rock in the ocean and being able to come back and see how I can apply my knowledge and share with the local community in my learning process, has opened my eyes to the curiosity of other islanders like myself who are hungry for information and who are eager to be able to contribute and participate in the process of sustainable development, even if they might not know exactly what that means. I think it is funny to realize how often I find myself trying to apply theories to broader or more personal phenomena than what they
are actually intended for and then playing with them to see how they could describe these too. I say this because when I think of development now, I think in terms of transition, I think in terms of a messy process that we as (junior) researcher try to place into understandable chunks of theory and models to make sense of what is happening. But that is the fun part, something is happening and being in an environment where there always seems to be hope for a positive outcome even in gray to pitch black situations it feels like when things are “happening” there’s always a positive outlook to take. In this program I got the chance to see a group of multi-disciplinary students bond while gathering data on a beach and to see both local and international students feel saddened by the negative impacts of human “development” while also be proud that they can contribute to solutions.
Xavier Boekhoudt, University of Aruba
UAUCU Student Research Exchange Collected Papers 2018
52
Policy for energy system innovation: Multi-actor policy-making of the
Aruba energy transitionXavier Boekhoudt
Introduction
The previous and current governments of Aruba have expressed their intention for, and set in motion, a campaign to actively pursue innovation and sustainable development. One of the major topics on this national agenda is the pursuit to shift to fully renewable/sustainable energy sources through the introduction of renewable energy production technologies. This transition can be considered a challenge that requires both freedom for experimentation from the technology side and innovation from the governance side.
The aim of this research is, therefore, to focus on the governance of this transition. To evaluate the policy of the Aruban government, the research will compare the Aruban energy transition policies to the policy framework of the Transition Management model of D. Loorbach (2010). The research will map actors, policy instruments and competencies that form the basis for the temporal transition and, then, to evaluate the effectiveness of this policy system/structure. In order to reach this, the following research questions will be answered: • How does the Aruba energy policy case compare to the
model of transition management described? • Does the case show similarities or discrepancies
compared to the original “Nationaal Milieu Plan 4” (NMP4) case, and what does this mean for the concepts
of the transition management theory? • Are there challenges that are specific to the Aruba case
that might be comparable in other island cases but do not fit the profile of transition management in other settings?
The analysis of the Aruba case with the framework of the transition management model will lead to a recommendation for future studies, concerning the possible need of a new or adapted model or alternative approaches to explain and guide the process of policy making for complex transitions in similar cases.
The importance and social relevance of this research is that of providing information to a wider public than only the main stakeholders in this transition. By doing so, the research contributes to make the innovation process more transparent and serves as informative feedback for policymakers, aiming to close the loop of policy by taking a multi-actor (community) approach.
Additionally, a sustainable energy transition also contributes to the Sustainable Development Goals (SDG’s) formulated by the United Nations (UN). The SDGs most relevant to this particular research are those of Affordable and Clean energy (SDG 7), Industry, Innovation and Infrastructure (SDG 9) and Responsible Consumption and Production (SDG 12). Reliable

UAUCU Student Research Exchange Collected Papers 2018
53
energy forms the backbone of the modern society. Innovation towards sustainable and reliable energy would provide direct benefits for all sectors of the local economy but also to reducing global effects of the previously required amounts of fossil fuel and produced greenhouse gases. Furthermore, the production of knowledge on an island setting will add to the south-to-south innovation-aid and knowledge sharing that is pursued by the UN (UNDP, 2017). Next to the active pursuit of these goals, this transition and, therefore, this research is relevant for the position of Aruba as a frontrunner in sustainability on the global platform and, especially, as a positive example of sustainability in practice for Small Island States (SIS), as they are seen as potential experimental settings for practical implementation of sustainability.
This research will, thus, complement the active practices of the Aruban energy transition by shedding light on the process of the transition, with emphasis on the policy framework in which it takes place.
HypothesisA major reasoning for this case study is to see how both the community of Aruba and the body of literature on transition management can benefit from a literature-case comparison. The hypothesis is that the policy process of the energy transition of Aruba does not fit in the pre-required socio-technical mold of the transition management model nor does the process fully resemble the policy process described by Loorbach and Kemp (2010). The research aim is, therefore, to gain understanding of how the energy transition of Aruba can be seen as an example of macro-level innovation in SIS and to map the drivers of innovation in the case it does not fit the theory of transition management.
Literature Review
Transition management theory Transition management is a broad, open and flexible theoretical model for the planning of innovation
management policy for (socio-)technical transition. Transition management is centered around the concept of socio-technical regimes, i.e. the systems of institutions, techniques and artifacts but also the rules, practices and networks that constitute the current norms of technological and social functions with regard to that specific system (Smith et al., 2005). According to the transition management model, a regime is relatively stable over time and requires external pressure to change. The model, subsequently, describes a multi-level system in which there is “landscape” of external factors that are slowly changing macro level development and put pressure on the regime to change. Additionally, on the micro level, there are niche developments either within or external to the regime that seek to develop alternative solutions to the changing needs of the regime as it experiences landscape pressures (Smith et al., 2005; Geels, 2002). The process of socio-technical transitions through the process of innovation can be facilitated by a four step policy cycle, which leads to a more efficient transition process (Loorback, 2010). The first step, problem structuring, is when frontrunner participants are brought together from relevant institutions, to form a transition arena. These participants should, however, not function as representatives of their respective institutions, but are, instead, required to participate on a personal basis. “The main effort in the group of frontrunners is made towards reaching a joint perception of the problem and the generation of sustainability visions” (Pisano, 2014).Secondly, formulating a transition agenda should extend the sustainability vision from phase 1 to “objectives, action points, projects and instruments to realize these objectives” (Pisano, 2014). The actors should seek to form coalitions based on common traits in the initial vision formulation of phase 1. Then, the third phase is to conduct short-term experiments and actions that have been derived from these visions and their related action points and projects. If an experiment is successful, it can, then, either be scaled up or broadened
UAUCU Student Research Exchange Collected Papers 2018
54
into another context to gather more knowledge in a process of continuous learning (Pisano, 2014). Lastly, in the fourth phase, the emphasis is put on “transition monitoring and evaluation” (Loorbach, 2010). This includes the evaluation of the transition process, experimentation development but also the monitoring of the management of the transition. Actors, action plans, projects, instruments and experiments are all evaluated as products of the approach (Pisano, 2014).
Fourth Dutch National Environmental Plan Transition management was, initially, used as a pioneer approach in the cases of the Dutch NMP4, which stands for the Fourth Dutch National Environmental Plan introduced in 2001. The NMP4 focused on several areas of environmental policy challenges and used ideas of transition management to structure the process of policy making into longer cycles of learning, investment and development. This, thus, made it, generally, an attractive approach, not only for the initial cases of the NMP4 but more broadly for innovation and technology management. (Loorbach & Kemp, 2008)
Methodology
In this research, a mix of qualitative methods was applied in the form of literature studies and semi-structured interviews. The choice for this approach was based on the need for in-depth knowledge of the process and the involvement of actors in the specific case of the policy for the energy transition of Aruba. An initial inventory of key actors was made to determine the starting point of the interviews. A snowball method was used to reach more actors, allowing for a total of 5 actors, representing institutions involved in the energy sector and secondary institutions, which play a role in providing knowledge input to the transition process. These were, Utilities Aruba N.V., N.V. Elmar, TNO Caribbean, The Centre of Excellence for Sustainable
Development is SIS and The University of Aruba. The method of contact was through emails and follow up via phone calls. The interviews were conducted in a semi-structured fashion due to the exploratory nature of this research. The questions centered on the following topics: • What has been the key process of energy innovation
that the actor has been involved in with regard to energy innovation?
• What role does the actor play in the policy making process of energy innovation?
• What role does the actor play in the knowledge development and sharing with regard to energy innovation?
• What is the (perceived) structure of the policy cycle from the experience of the actor?
• What is the position of the actor in terms of emphasizing social or technical agendas for policy of energy innovation?
• Are there any identifiable challenges in the energy transition that are related to policy and are dealt with from a policy-making perspective?
Finally, follow-up questions would be formulated, based on the responses or questions of the interviewee with regard to the topic of policy making or the general energy transition of Aruba.
The method of analysis was to, firstly, identify the structure of hierarchy within the actors (interviewed and not interviewed). Secondly, key policy steps were mapped and the involvement of actors at different stages was determined. Also, the relative positions of actors was determined with regard to the setting of the policy agenda, taking into account prioritization per actor. Lastly, the main challenges of the energy transition were looked at and formulated as an example of the Aruba case, in comparison with other island cases to determine their relevance for SIS in general.

UAUCU Student Research Exchange Collected Papers 2018
55
ResultsEnergy utility (ownership) structureThe structure of the energy utility gives an indication of how the actors within the main institutions relate in terms of power and how this hierarchy could influence policy making.
Most Small Island States (SIS) have a singular, central energy utility company that has a historical/traditional role of providing energy to the entire state, serving both private citizens and commercial clients. In Aruba, the Water en Energiebedrijf Aruba (WEB) has been producing the energy for the island since 1932 (Utilities Aruba, n.d.). The company is formally a government owned Naamloze Vennootschap (N.V.), which is the term in Dutch for joint-stock company, and produces both electricity and fresh (drinking) water. It also functions as the supplier of water to all clients on the island. The electricity is supplied/sold by Elmar N.V., a separate company that owns and maintains the electricity infrastructure and supplies the electricity to all clients on the island. Both of these utility companies are owned by a holding company, Utilities Aruba N.V., which functions as a mediator between the government of Aruba and the utility companies. See figure 1 for an overview of the ownership structure.
Figure 1. Ownership structure of utility companies of Aruba. (Utilities Aruba, n.d.)
In the first place, the government of Aruba has to represent the interests of its citizens and provide leadership and governance. However, to some extent, this formal corporate structure means the government is also responsible for the financial stability of the utility companies and the technical requirements of innovation in the energy sector. This is why Utilities Aruba N.V. functions as the middle man between the Government and the utility companies. Its primary function recently has been to create a common ground of knowledge and understanding of the current and envisioned transition for the utilities companies and their sectors. Again, here Utilities Aruba N.V. prioritizes the stability of its companies.
It is important to mention the difference in expertise between these groups of companies within the structure of the energy sector of Aruba. The WEB Aruba N.V. has primarily mechanical engineers due to the current and historical usage of mechanically driven energy production systems. The N.V. Elmar employs primarily electrical engineers because the company occupies itself with energy distribution services. The Utilities Aruba N.V. and the Government of Aruba employ a range of (technical) policy advisors.
SIS Comparison The construct of government owned utilities is not uncommon in the case of SIS. This is linked to high costs of facilities and infrastructure and the small size of the national economy. Furthermore the importance of these basic utilities makes that providing reliable services is highly prioritized on the social/political agenda, pressuring governments to ensure a stable electricity and water provision for its citizens and industries.
Policy stages in the energy transition of Aruba
The governance system of Aruba works primarily with a vertically structured central governance system of hierarchy. Power and advocacy is concentrated in the ministries of government and the parliament. Due to the small size of

UAUCU Student Research Exchange Collected Papers 2018
56
the island population, it could be expected that there is a fair amount of direct governance from within the ministries and little delegation to the departments or through co-decision-making. In the case of the energy transition of Aruba, the policy steps start with agenda setting. This happened in an abrupt way as the Prime Minister, Mike Eman, initiated the policy making cycle by setting an ambitious vision for 2020: 100% renewable energy goal. Following this, the actors within the central energy utility structure worked both on formulating a common language, and on gathering knowledge on the technical capacity to achieve high levels of energy penetration. This phase concluded with an energy roadmap. Thirdly, execution of planning has been done in the form of rolling out experiments and investments and knowledge partners were brought in to gain momentum towards upscaling and realizing some of the planned projects. Lastly, evaluation has been taken into account as a continuous process, putting emphasis on the successfulness of the output of the individual stages.
The stages of policy focusing only on the energy transition follow a process of constantly fluctuating levels of involvement. Whereas the initial agenda setting was done primarily by the government of Aruba, the creation of a common language was done with a high level of inclusiveness while, at the same time, the creation of an energy road map was the product of a singular actor (TNO Caribbean), albeit, making use of input from other actors in the form of interviews. The policy cycle and, thus, the transition seems to tend towards a path of least resistance since competing viewpoints between the utility companies and the government are not effectively discussed and resolved in order to reach each other.
Island (specific) challenges Economies of scale The economies of scale is a popular approach for renewable energy(RE) projects around the globe. This is not an
exception in the case of SIS. It does, however, bring uniquely inflated risks and challenges.
After 2009, the government of Aruba placed innovation and sustainability as a political priority. It exercised its influence as owner and majority shareholder in the utility companies by extending their sustainability agenda to the utility companies through Utilities Aruba N.V. (Utilities Aruba, n.d.). The result of this has been a long process of policy-making.
As Aruba historically follows the trend of a centralized energy production system and the financial stability of the utilities is held as a priority, the prospect of an “economies of scale” approach is favoured over more decentralized local owned approaches. Next to the initial cost-benefit superiority of an “economies of scale” approach, it also warrants better oversight in the technical aspect of managing complex energy mixes associated with RE inputs to the electricity grid.
The small size of the Aruban energy demand (also the case for most SISs), averaged at 100 MW with peaks of 130MW, causes that the introduction of large RE projects produces shocks to the RE penetration graph, which makes comparisons with other countries difficult, in the case that a single wind park (consisting of 10 windmills) can cover and averaged 16% of the energy demand (Utilities Aruba, 2018). Furthermore, Utilities Aruba emphasizes that there is a need for common understanding about the costs, risks and challenges attached to different types of energy sources: “1 KWh of wind or solar energy (intermittent) is not equivalent to 1 kWh of fossil fuel generated energy” (UNDP, 2017). What is meant by this is that the costs related to RE sources are higher than only the production installation and maintenance. RE has the technical limitation of producing intermittent energy to a varying degree of performance, e.g. solar power can only be produced during the day, and when it does produce, the output can fluctuate rapidly
UAUCU Student Research Exchange Collected Papers 2018
57
due to cloud cover (in the case of Aruba, rapidly moving clouds). This, then, has to be backed up by an equal amount of stored energy, be it in the form of fossil fuels, flywheels, batteries or any other storage methods. What complicates this even further is the energy density of stored energy and the amount of time it can cover the dips in RE output.
The choice between a largely centrally operated RE project versus allowing/promoting more decentralized production of energy, then, also has to do with the complexity of covering for the mixture of energy inputs on the grid. According to TNO and Utilities Aruba, it is more manageable to ensure grid stability with less “working components” i.e. input sources to the grid (TNO, 2018; Utilities Aruba, 2018). The utilities have, however, introduced policies that, to some extent, promote private investment in small scale RE installation for business lots and domestic lots. These policies include a reduced import tariff on solar panels and other RE technology. Furthermore, a feed-in tariff was introduced by N.V. Elmar, allowing solar energy producers to sell their excess energy to the grid, which can result in a net 0 billing when it covers the energy bought from the grid and the initial grid-connection fee. Most investments are made in solar installation, for which there are various niche companies selling and installing solar panels.
Broadening to SIS The economies of scale approach is not uncommon to RE projects, not only for SIS but also for large economies. The key difference is that experimentation and ownership in SIS is, in most cases, left in the hands of the government. The investment costs for infrastructure are high regardless of the type of energy production, although each country has a unique techno-economic forecast. For SIS renewable energy, sources can vary greatly in type and, thus, also in load or penetration of total production. SIS with hydro-electric energy sources or resources such as geothermal energy might see larger investment needs, but due to the technological benefits would not require the same
investments in non-renewable back-ups or expensive experimental technologies.
Social pressures in the transition process When considering the transition process, there are relevant actors and relevant stakeholders. As citizens, the population of Aruba is considered an actor but not a direct stakeholder in decision-making about the transition of the energy sector. However, the social dimension of citizens in large scale transitions cannot be overlooked or left out. Regardless of the approach chosen, both a centralized and decentralized approach would require to some extent the support of the local population, primarily, since they indirectly form the foothold for decision-makers in democratic stakes.
Wind energy With regards to the Aruba case, the central approach, linked to the concept of economies of scale, is to produce as much RE as possible using the least amount of producers. Linking this to the RE potentials of Aruba, the options for large scale projects primarily fall in the production of wind energy and solar energy. Of the two energy sources, wind energy has a larger potential in energy output (3MW per individual turbine), compared to solar energy (3.4MW for the entire Reina Beatrix Airport solar park produced by 14,400 panels). The potential for wind energy on Aruba lies with the year-round stable trade-winds. Although, technically, wind farms produce relatively dense energy, compared to other RE sources, this same advantage brings with it the need for an equally large back-up generation or storage system for when the energy production drops due to wind fluctuations. Wind energy is. therefore, considered an intermittent energy source, which could cause major challenges to energy stability.
Urirama In 2008, the construction of the first 30 MW wind farm, located at Vader Piet on the North-East side of the island, was initiated and, in late 2009, it became operational. The

UAUCU Student Research Exchange Collected Papers 2018
58
wind farm has since its inception produced an average energy penetration level of 12%. However, at production peaks and demand troughs, the penetration level can reach upwards of 20%. With this successful project, the perspective for the construction and integration of a second park seemed positive. The choice for the new location lied purely in the techno-economic modelling of potential sites for the installation of another 30 MW wind farm. The choice to expand the Vader Piet wind park was quickly tossed from the table due to the forecast of it further increasing the vulnerability of the grid to wind energy produced by a single wind park, i.e. more windmills on the same location will cause steeper drops of wind energy supply, due to the close proximity of the wind mills. The North-West area of the island was, therefore, considered the best techno-economic zone for a second park. Modelling the specific Urirama location was found to be most suitable due to its relative distance from residential buildings, with the closest residential area at a distance of 850 m. (KEMA, 2012)
Technically and politically, the environment was stable and supportive. However, the project still received social counter pressure. In late 2012, a few months after announcing the Urirama wind farm project, a group of concerned citizens, nearby residents to the envisioned Urirama wind farm, started a long process of pressuring the government and parliament with their concerns on adverse health-effects of windmills (Waubra Foundation Inc., 2012). The social pressure has held on ever since, with little legal success, however, pressuring to the point that it has dissuaded the government and its investors from pursuing the project. Social pressures are, therefore, in this case, both pushing through and inhibiting the process of transition. The lack of communication and the small group of involved actors seem to have been playing an important role in creating such challenges.
Discussion and conclusionFirstly, the research findings show that Aruba has a small and rigid structure of institutions that have control over the
energy sector due to their monopolies of the sector. This structure works for the case of islands because the small government size allows to maintain oversight over the quality of service provided and to hold itself and a small amount of actors accountable for the quality.
The challenge and simultaneous opportunities of the small scales of islands and the utility monopolies lead to a lack of market opportunities for experimentation and niche building. Consequently, the transition management model and the key concepts of landscapes, regimes and niches are not completely applicable. On islands, the macro level or landscapes and meso level or regimes are relatively equal in size, while niches are not internally developed innovations but imported from the international market. This does not discard the fact that niches do still evolve in an island-specific way, while each island has a different set of RE opportunities as well as an island specific socio-technical setting.
Secondly, the cycle of policy follows a rough traditional cycle policy model. However, the scale of the island implies that the group of actors is smaller and the policy cycle goes both faster and slower at different phases with different levels of inclusiveness. The differences in expertise, that according to the transition management theory should add to the transition process in the Aruba case, cause the process to stagnate due to hesitation reportedly linked to job security or lack of a common understanding or language.
The differences between the concepts, prerequisites and actions of the transition management theory and the Aruba case, and, arguably, also in other SIS, are, primarily, in the context in which the policy takes place. Here, specifically, the size and status of island communities versus large open economies make for a difficult comparison and application of the theory to the Aruba case. However, the policy process does have bare similarities with some of the processes described in the theory. In fact, both
UAUCU Student Research Exchange Collected Papers 2018
59
the Aruba energy transition case and the general model for transition management make use of a four step policy cycle. Again, here the emphasis lies on the difference in level of participation of the actors throughout all the phases of the process, which would be the case if following the theory of transition management, but it is not the case for the energy transition of Aruba. As this research also shows, in various ways, the Aruba case has similarities with other SIS, in that there are specific challenges that islands face that put pressure on their systems requiring innovation. The transition management model to this end does not provide a full fit to the case, which would suggest an opportunity for the consideration of presenting new models of transition policy management adjusting for size but also social context of small communities.
Limitations This research builds on the qualitative inputs of the interviews held. The use of a snowball method to reach actors and interviewees has a possibility to produce a bias due to oversampling of a peer network. This was avoided by making use of an inventory of the key actors at the start of the research. Nevertheless, a bias might be caused by the snowball method. Furthermore, the sole energy producing utility company of the island was not available for this research.
Future research The results of this research provide opportunities for continued research on the mapping of challenges and opportunities of SIS in policy making and with regard to knowledge sharing of policy making processes for small communities. Given the discrepancies between the theory and the Aruba case, continued research can focus on the flexibility of contextualizing transition management concepts and criteria as well as looking at lessons that can be learned to produce alternative models for transition management for small isolated community settings as would be the case of small islands states.
References
• Smith et al. (2005). The governance of Sustainable Socio-technical Transitions. Research Policy, Vol. 34, pp. 1491–1510
• KEMA. (2012). Social and Environmental Impact Assessment For: Urirama Wind Farm, Aruba. Retrieved from https://issuu.com/arubaprotest/docs/seia_urirama_full_report
• Loorbach, D. (2010). Transition Management for Sustainable Development: A Prescriptive, Complexity-Based Governance Framework. Governance: An International Journal of Policy, Administration, and Institutions, Vol. 23(1), pp.161–183
• Loorbach, D., Kemp, R. (2008). Transition management for the Dutch energy transition : multilevel governance aspects. Managing the transition to renewable energy : theory and practice from local, regional and macro perspectives. - Cheltenham [u.a.] : Elgar, ISBN 978-1-84720-229-1. - 2008, p. 245-266
• Umberto Pisano. (2014). Transition management as a governance tool for sustainable development. ESDN Case study No 17. Retrieved from
• http://www.sd-network.eu/pdf/case%20studies/ESDN%20Case%20Study_No%2017_final.pdf
• UNDP. (2017). Energizing All Stakeholders: An Inclusive Approach For Sustainable Energy In Aruba. Retrieved from http://www.sustainablesids.org/wp-content/uploads/2017/04/COE-Sustainable-Energy-case-RAS-Approach.pdf
• Utilities Aruba N.V. (n.d.). Company Profile Water- en Energiebedrijf Aruba N.V. Retrieved from http://www.utilitiesarubanv.com/main/wp-content/uploads/ppt/WEB%20-%20company_profile.pdf
• The Waubra Foundation Inc. (2012, September 21). An open letter to all parties responsible for the planning and decision with respect to the URIRAMA Wind Development ARUBA Island [Archived Online]. Retrieved from https://issuu.com/arubaprotest/docs/uriramawinddevelopmentaruba

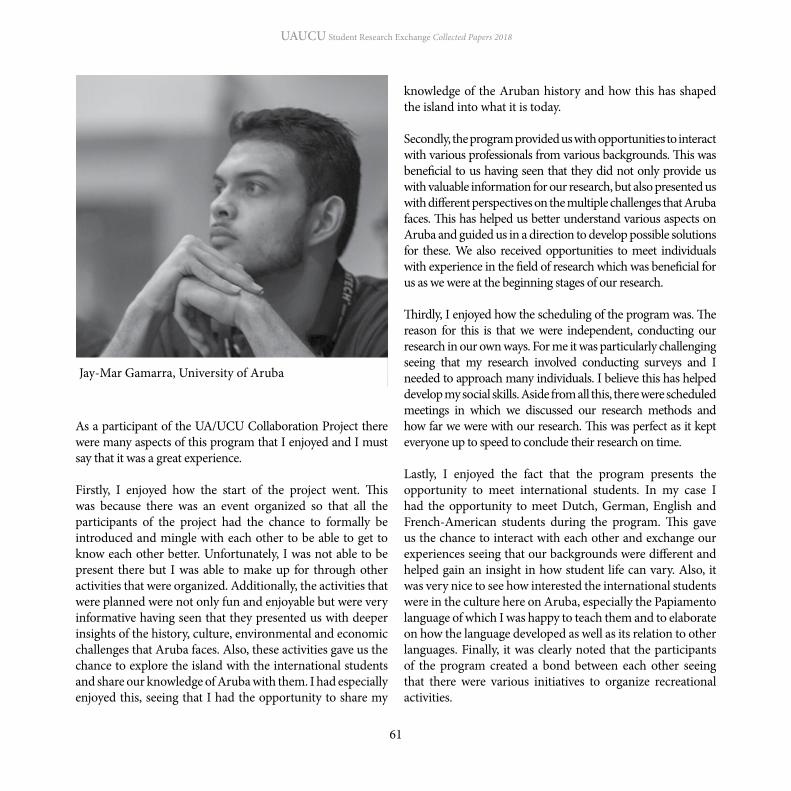
UAUCU Student Research Exchange Collected Papers 2018
61
As a participant of the UA/UCU Collaboration Project there were many aspects of this program that I enjoyed and I must say that it was a great experience.
Firstly, I enjoyed how the start of the project went. This was because there was an event organized so that all the participants of the project had the chance to formally be introduced and mingle with each other to be able to get to know each other better. Unfortunately, I was not able to be present there but I was able to make up for through other activities that were organized. Additionally, the activities that were planned were not only fun and enjoyable but were very informative having seen that they presented us with deeper insights of the history, culture, environmental and economic challenges that Aruba faces. Also, these activities gave us the chance to explore the island with the international students and share our knowledge of Aruba with them. I had especially enjoyed this, seeing that I had the opportunity to share my
knowledge of the Aruban history and how this has shaped the island into what it is today.
Secondly, the program provided us with opportunities to interact with various professionals from various backgrounds. This was beneficial to us having seen that they did not only provide us with valuable information for our research, but also presented us with different perspectives on the multiple challenges that Aruba faces. This has helped us better understand various aspects on Aruba and guided us in a direction to develop possible solutions for these. We also received opportunities to meet individuals with experience in the field of research which was beneficial for us as we were at the beginning stages of our research.
Thirdly, I enjoyed how the scheduling of the program was. The reason for this is that we were independent, conducting our research in our own ways. For me it was particularly challenging seeing that my research involved conducting surveys and I needed to approach many individuals. I believe this has helped develop my social skills. Aside from all this, there were scheduled meetings in which we discussed our research methods and how far we were with our research. This was perfect as it kept everyone up to speed to conclude their research on time.
Lastly, I enjoyed the fact that the program presents the opportunity to meet international students. In my case I had the opportunity to meet Dutch, German, English and French-American students during the program. This gave us the chance to interact with each other and exchange our experiences seeing that our backgrounds were different and helped gain an insight in how student life can vary. Also, it was very nice to see how interested the international students were in the culture here on Aruba, especially the Papiamento language of which I was happy to teach them and to elaborate on how the language developed as well as its relation to other languages. Finally, it was clearly noted that the participants of the program created a bond between each other seeing that there were various initiatives to organize recreational activities.
Jay-Mar Gamarra, University of Aruba

UAUCU Student Research Exchange Collected Papers 2018
62
INTRODUCTION
In recent years it, has been noted that Aruba has become increasingly dependent on the tourism industry, which has been key in maintaining a favorable level of economic activity on the island. Seeing that this tourism has become such an important source of income for Aruba, it would be natural to protect and maintain it. The estimated total contribution of the tourism industry to the Aruban GDP (Gross Domestic Product) was 84.1% in 2013 and steadily increased to 86.5% in 2017 according to the World Travel and Tourism Council. This being the case, it would be beneficial to study both external and internal threats to this industry.
The main focus of this research report will be on internal threats to the Aruban tourism industry, referring to the potential threats to the industry posed by perceptions and attitudes of the Aruban community itself. More specifically, this study will focus on the degree to which the Aruban community approves of tourism on the island based on current conditions, in order to identify areas for improvement in regards to it.
Considering that Aruba is well known for its high rate of repeat visitors, the relationship between the locals and the tourists is key. In other words, the level of interaction between locals and tourists should be preserved and
Perceived economic impact of tourismJay-Mar Gamarra
increased (Dipietro & Peterson, 2017). By doing so, not only will Aruba be able to maintain current its current levels of visitors, but also increase the number of tourists. Maintaining current visitors and attracting new ones is highly important in light of the current situation, given Aruba’s dependency on the tourism industry as well as the estimated contribution of this to the Aruban economy.
Given that the perception of locals towards tourism may impact the interaction/relationship between locals and tourists, which in turn may impact the main source of income for Aruba, it would be valuable to determine the perceptions of locals towards tourism. These findings could in turn help contribute to recognizing the need for a more sustainable development approach for tourism. Studies suggest that the success and sustainability of tourism development largely depends on the acceptance of tourists and tourism-related programs, offerings, and activities by local communities (Musa, Hall, and Higham 2004).
This type of research would not only assess local perceptions towards tourism, but may also consequently serve as an indicator of the level of interaction/relationship that exists between tourists and locals (Zhang, Inbakaran & Jackson, 2006). The results would be beneficial especially for ATA (Aruba Tourism Authority), the Aruban government and AHATA (Aruba Hotel and Tourism Association). The success

UAUCU Student Research Exchange Collected Papers 2018
63
and sustainability of any development requires the active support of the local population. Understanding the reasons behind such support is crucial for policy makers to determine what form of development is acceptable and why. As suggested by Lepp (2007), one indicator of tourism appropriateness is the attitudes of the host population toward tourism.
Recognizing the importance of the perception of the Aruban community towards tourism, the main research question is: What are the perceptions of the Aruban community towards the economic impact of tourism? In this specific case the focus will be on the perception of the economic impact of tourism. The study aims to determine if the Aruban community perceives the economic impact to be positive, negative or neutral.
LITERATURE REVIEW
TOURISM ON ARUBA
The roots of the tourism industry in Aruba can be traced back to the late 1940s with the creation of the Aruba Tourism Commission (ATC). The goal of the ATC was to explore the possibility of developing tourism on Aruba to enhance the economy. In the early 1950s, the government established the government-controlled Aruba Tourism Bureau (today known as the Aruba Tourism Authority). The first 100-room hotel was built in 1959 and thereafter the number of rooms grew steadily. In 1985, the oil refinery on Aruba closed; and at that time, it was the main driver for the economy of Aruba. It was then that the Aruban government realized the relevance of tourism and further developed this industry to be able to absorb the negative effects on the economy of the closing of the oil refinery.
When in operation, the oil refinery was responsible for about 25% of the gross domestic product (GDP) for Aruba, directly and indirectly employed 30% - 40% of the population (Ridderstaat, 2007) and was responsible for 40%
of Aruba’s tax income. Given the impact that the refinery’s closing had on the Aruban community, the government had to act quickly. The most viable way to increase income was to expand the tourism industry (Ridderstaat, 2007). It was at that point that Aruba began to experience a high increase in the number of hotels, restaurants and other commercial buildings. The number of hotel rooms increased dramatically throughout the years, from 2,078 in 1986 to 7,092 in 2011. The number of stay-over visitors grew from 181,211 in 1986 to 871,316 in 2011. The cruise tourism grew from 73,338 in 1986 to 599,893 in 2011. Tourism receipts increased from Afl. 283.0 million in 1986 to Afl. 2,413.5 million in 2011.
The main market segment for Aruba is U.S. Americans. The total market share has stabilized at nearly 60% in recent years. However, this market share has decreased from its highest point of nearly 73.6% of total arrivals in 1986 to around 63.5% in 2000. One reason for this decrease has been the promotional efforts aimed at diversifying the market. For the past 25 years, the U.S. market has demonstrated to be incredibly stable, with steady growth and a strong response from the northeastern corridor. The expansion of tourism in Aruba is believed to reflect a more sustainable pace of the level of economic growth in the USA, world-wide recognition of Aruba’s safety, social and political stability, beautiful beaches and consistently pleasant climate.
THEORETICAL FRAMEWORK AND PAST STUDIES
Social Behavior Exchange Theory
This paper will be based on past research done by John Williams and Rob Lawson (2001) to help determine the perceptions of the Aruban community towards tourism. This will be done in combination with George C. Homans’ Social Behavior Exchange Theory. This theory suggests that people will enter into an exchange if they feel they can make some gain out of it. The perception of the impact of tourism will be the determining factor. The way people are impacted by tourism

UAUCU Student Research Exchange Collected Papers 2018
64
is affected by the exchange they believe they are making (ex. sacrificing nature areas to create space for development, cost: nature reward: personal gain for business opportunity).
It was hypothesized that positive attitudes toward tourism would be predicted by employment in industry, country of residence, and positive perceptions of tourism impacts. It was further hypothesized that more frequent and satisfying intercultural contact, lower perceptions of threat, more positive stereotypes and less intergroup anxiety would predict positive attitudes.
Host – guest relationship
Pizam et al. (2000), in a study regarding tourism in Israel, found that the social relationship between hosts (locals/communities in a destination) and tourists could affect tourists’ feelings, satisfaction and attitudes towards the destination. The study revealed that the higher the level of the social relationship between hosts and tourists, the more favorable were the tourists’ feelings towards their hosts, and the more positive was the change in attitudes towards hosts and the destination. It also reported that the higher the level of social relationship between hosts and tourists, the higher was the satisfaction of these tourists with their stay and experience. From the findings, it was revealed that a destination with residents who demonstrate apathy towards tourists will most likely not encourage repeat visitation.
Putting it together
When considering social exchange theory and the social relationship between tourists and host communities, a link between them can be observed. The hosts’ perception towards tourism impacts their level of approval for this activity, and their level of approval impacts their relationship with tourists. Additionally, the level of relationship impacts the perception of tourists towards destinations, which in turn impacts their willingness to return.
This can also be seen in the research done by Bimonte & Punzo (2016). In their study they suggest that interactions and experiences influences attitudes and opinions. This causes structural changes in individual preferences that affect residents’ perceptions of tourism and tourists’ willingness to pay.
METHODOLOGY
This research will focus on the perceived economic impact of tourism on Aruba. The research consisted of a survey consisting of twenty-six (26) questions. The questions were a combination of specific open and closed questions to narrow down areas of inquiry and simultaneously provide the survey participants the opportunity to elaborate on their perspectives.
The survey questions were modeled on a previous survey conducted by Jon Williams and Rob Lawson (2001), who aimed to determine opinions of residents in selected towns in New Zealand in regards to the economic, social and environmental impact of tourism. Seeing that the present paper focuses on the economic impact, only those questions related to this area were used. (A copy of the survey can be found in the appendix)
INDEPENDENT VARIABLES
The first four (4) questions of the survey are mainly for demographic purposes. Participants were asked to identify their gender, age group, district of residency and lastly the degree to which their employment is related to the tourism industry.
It is important to note that the way in which the age groups were separated is based on life stages which are believed to impact the consumption patterns of consumers and will ultimately influence how certain economic impacts are perceived. The age groups were separated as follows:• 18 – 30: This group consists mostly of students
and recent graduates from higher education, or are currently entering the workforce, who usually have fewer than 2 or no children, and are either single or are
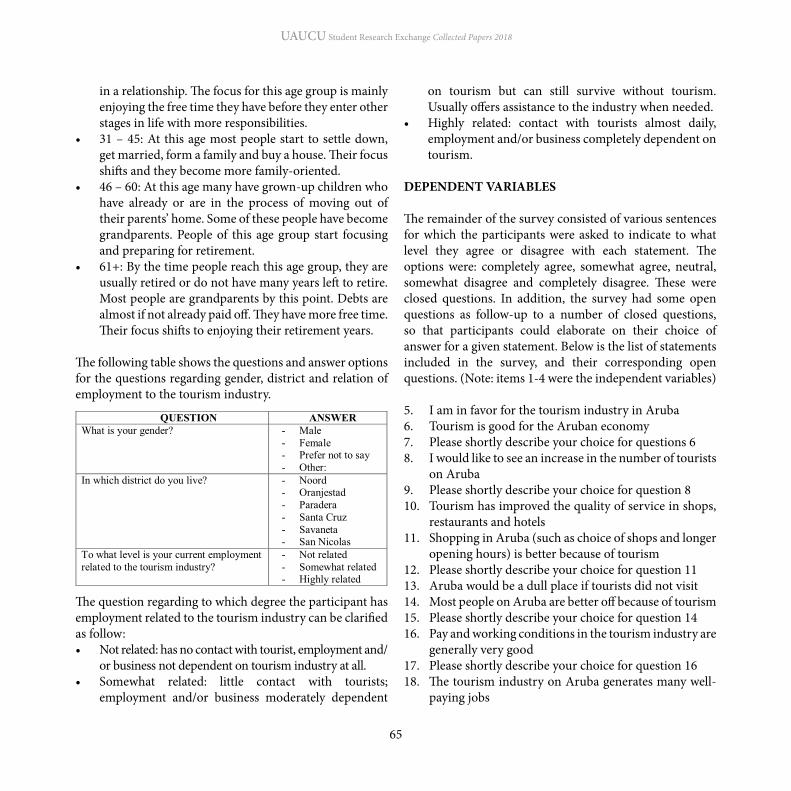
UAUCU Student Research Exchange Collected Papers 2018
65
in a relationship. The focus for this age group is mainly enjoying the free time they have before they enter other stages in life with more responsibilities.
• 31 – 45: At this age most people start to settle down, get married, form a family and buy a house. Their focus shifts and they become more family-oriented.
• 46 – 60: At this age many have grown-up children who have already or are in the process of moving out of their parents’ home. Some of these people have become grandparents. People of this age group start focusing and preparing for retirement.
• 61+: By the time people reach this age group, they are usually retired or do not have many years left to retire. Most people are grandparents by this point. Debts are almost if not already paid off. They have more free time. Their focus shifts to enjoying their retirement years.
The following table shows the questions and answer options for the questions regarding gender, district and relation of employment to the tourism industry.
The question regarding to which degree the participant has employment related to the tourism industry can be clarified as follow:• Not related: has no contact with tourist, employment and/
or business not dependent on tourism industry at all.• Somewhat related: little contact with tourists;
employment and/or business moderately dependent
on tourism but can still survive without tourism. Usually offers assistance to the industry when needed.
• Highly related: contact with tourists almost daily, employment and/or business completely dependent on tourism.
DEPENDENT VARIABLES
The remainder of the survey consisted of various sentences for which the participants were asked to indicate to what level they agree or disagree with each statement. The options were: completely agree, somewhat agree, neutral, somewhat disagree and completely disagree. These were closed questions. In addition, the survey had some open questions as follow-up to a number of closed questions, so that participants could elaborate on their choice of answer for a given statement. Below is the list of statements included in the survey, and their corresponding open questions. (Note: items 1-4 were the independent variables)
5. I am in favor for the tourism industry in Aruba6. Tourism is good for the Aruban economy7. Please shortly describe your choice for questions 68. I would like to see an increase in the number of tourists on Aruba9. Please shortly describe your choice for question 810. Tourism has improved the quality of service in shops, restaurants and hotels11. Shopping in Aruba (such as choice of shops and longer opening hours) is better because of tourism12. Please shortly describe your choice for question 1113. Aruba would be a dull place if tourists did not visit14. Most people on Aruba are better off because of tourism15. Please shortly describe your choice for question 1416. Pay and working conditions in the tourism industry are generally very good17. Please shortly describe your choice for question 1618. The tourism industry on Aruba generates many well- paying jobs

UAUCU Student Research Exchange Collected Papers 2018
66
19. Please shortly describe your choice for question 1820. The benefits from tourism are distributed fairly throughout our community21. Please shortly describe your choice for question 2022. I have more money to spend as a result of tourism on Aruba
23. Tourism makes prices rise, so locals can no longer afford to enjoy amenities in certain areas of Aruba24. Please shortly describe your choice for question 2325. Tourism has increased the cost of living in Aruba26. Please shortly describe your choice for question 25
DEMOGRAPHICS
The total number of respondents was 162. In regard to demographics, the survey yielded the following the results:

UAUCU Student Research Exchange Collected Papers 2018
67
Next, the variables relation to the tourism industry and district were examined, yielding the following discoveries:• Not related: Noord had 18% of these respondents,
Oranjestad had 33%, Paradera and Santa Cruz had 15% each, Savaneta had 6% and San Nicolas had 13%.
• Somewhat related: From these respondents Noord had 23%, Oranjestad had 27%, Paradera had 20%, Santa Cruz had only 4%, Savaneta 15% and San Nicolas had 19%.
• Highly related: For this Noord had 23%, Oranjestad had 25%, Paradera 11%, Santa Cruz and Savaneta had 13% each and San Nicolas had 15%.
From this data, it seems that the residence of most participants whose employment is related to the tourism industry are precisely the ones where the concentration of tourism activities is the highest, which are Noord and Oranjestad. It is notable that the more inland the participants, the lower the relation of employment to the tourism industry. Additionally, going from west (which includes the outermost districts, Noord and Oranjestad) towards east, more inland and then to the eastern outermost districts (Savaneta and San Nicolas), it can be seen that the relation of employment to the tourism industry declines and then rises again (see table 1).

UAUCU Student Research Exchange Collected Papers 2018
68
An analysis of the gender and age group variables in regard to relation of employment to the tourism industry, led to the following discoveries:
GENDER AND RELATION TO INDUSTRY:When comparing gender and relation to the tourism industry it was revealed that for the category of ‘not related’, 41% of the male participants identified their employment as not related to the tourism industry as was the case for 59% for female participants. For the category of ‘somewhat related’, 54% of male participants identified their employment to be ‘somewhat related’ to the tourism industry as was the case for 46% for female participants. Lastly, for the category of ‘highly related’, 49% of male participants identified their employment to be ‘highly related’ to the tourism industry; the same was true for 51% of female participants.
From these results, it seems that there is no specific gender that has a significant dominance in the tourism industry, as the percentages of both genders are close to each other.
AGE GROUPS AND RELATION TO INDUSTRY:When considering the participants’ age groups and their relation to the tourism industry, the following was revealed:
From these results, it seems that, in regards to their relation to the tourism industry, the 46 – 60 age group is dominant (with the exception of the ‘somewhat related’ category, where it is tied with the 31 – 45 age group). This may due to the fact that currently in Aruba, this is currently the largest age (CBS, Census 2010). This may also explain why this age group is more dominant in the other categories as well. However, it must be noted that according to the last census in 2010, the next biggest age group on Aruba were those the
age of 19, who are currently part of the 18 – 30 age group, considering the time that passed since that census. As mentioned before, this group consists of mostly students, recent graduates and/or newcomers to the workforce, which may explain why this age group does not yet display dominance in the industry.
PERCEPTIONS
The survey questions that were used to help identify the perceptions of the Aruban community toward the economic impact of tourism can be split up into 5 categories, including (1) Perception of the industry; (2) Perception of the impact on quality of service and products in relation to value of their money; (3) Perception of employment in the industry; (4) Perception of the industry’s impact on a personal level; and (5) Perception of impact on prices and costs.
Perception of the industry: How the industry is perceived, what the perception is regarding its impacts on the Aruban economy, and the perception regarding the growth of the industry. This consists of the replies to the statements of ‘I am in favor for the tourism industry in Aruba’, ‘Tourism is good for the Aruban economy’ and ‘I would like to see an increase in the number of tourists on Aruba’.
Perception of impact on quality of service and products in relation to value for their money: The impact of the industry on the quality of service, restaurants, shops etc. and how the shopping experience has been impacted. This is to identify if the community feels better off in regard to their purchasing power. This consists of the replies to the statements of ‘Tourism has improved the quality of service in shops, restaurants and hotels’ and ‘Shopping in Aruba (such as choice of shops and longer hours etc.) is better because of tourism’.
Perception of employment in the industry: How are the pay and work conditions in the industry perceived and

UAUCU Student Research Exchange Collected Papers 2018
69
what are the perceptions of the type of jobs that the industry produces. This consists of the replies to the statements of ‘Pay and working conditions in the tourism industry are generally very good’ and ‘The tourism industry on Aruba generates many well-paying jobs’.
Perception of the industry impact on a personal level: Does everyone feel better off? Does one believe that Aruba would be different without the industry? Does a person feel financially better, and do the benefits of tourism reach everyone? This consists of the replies to the statements; ‘Most people on Aruba are better off because of tourism’, ‘Aruba would be a dull place if tourists did not visit’, ‘I have more money to spend because of tourism on Aruba’ and ‘The benefits of tourism are fairly distributed throughout the community’.
Perception of impact on prices and costs: is it perceived that tourism cause prices to increase and what are the perceptions on the impact for cost of living. This consists of the replies to the statements: ‘Tourism makes prices rise, so locals can no longer afford to enjoy amenities in certain areas of Aruba’ and ‘Tourism has increased the cost of living in Aruba’.
I AM IN FAVOR FOR THE TOURISM INDUSTRY IN ARUBA:• Completely agree: 22 respondents which represents
14% of the participants ‘completely agree’ with the statement
• Somewhat agree: 117 respondents which represents 72% of the participants ‘somewhat agree’ with the statement
• Neutral: 13 respondents which represents 8% of the participants were ‘neutral’ with the statement
• Somewhat disagree: 10 respondents which represents 6% of the participants ‘somewhat disagree’ with the statement
• Completely disagree: none of the respondents ‘completely disagree’ with the statement
TOURISM IS GOOD FOR THE ARUBAN ECONOMY:• Completely agree: 24 respondents which represents
15% of the participants ‘completely agree’ with the statement
• Somewhat agree: 116 respondents which represents 72% of the participants ‘somewhat agree’ with the statement
• Neutral: 13 respondents which represents 8% of the participants were ‘neutral’ with the statement
• Somewhat disagree: 9 respondents which represents 6% of the participants ‘somewhat disagree’ with the statement
• Completely disagree: none of the respondents ‘completely disagree’ with the statement
I WOULD LIKE TO SEE AN INCREASE IN THE NUMBER OF TOURISTS ON ARUBA:• Completely agree: 21 respondents which represents
13% of the participants ‘completely agree’ with the statement
• Somewhat agree: 115 respondents which represents 71% of the participants ‘somewhat agree’ with the statement
• Neutral: 21 respondents which represents 13% of the participants were ‘neutral’ with the statement
• Somewhat disagree: 5 respondents which represents 3% of the participants ‘somewhat disagree’ with the statement
• Completely disagree: none of the respondents ‘completely disagree’ with the statement
From the results it can be clearly seen that the majority of the respondents are in favor of tourism and believe that it is good for the Aruban economy. These respondents are the so called “Lovers” and approve of tourism according Jon Williams and Rob Lawson (2001). After reviewing the open-ended responses for why they ‘completely agree’ and ‘somewhat agree’ it was noted that these respondents strongly believe that the tourism industry is

UAUCU Student Research Exchange Collected Papers 2018
70
the main source of income for Aruba, generates a large amount of revenue, is the industry with the largest share of employment, ensures income for many households on Aruba and stimulates business opportunities on Aruba. Additionally, it was noted that politics also influences their perception having seen that a number of respondents mentioned the current governmental financial crisis and that the industry can contribute to improving this situation because of the revenue that the industry generates.
There were also respondents that were neutral. These respondents were mainly of opinion that the industry does in fact generate a large amount of revenue for Aruba and is the main source of income for many households. However, they do believe that because of the large amount of revenue that the industry produces, Aruba has become too focused on this and has become increasingly dependent on one specific industry, which they feel is not a responsible way of ensuring income. Additionally, they also agree that the industry creates opportunities to employ many people; however, they also believe that the industry does not produce many high-paying jobs, which may cause for not having a higher momentum in the economy and that this can be improved.
As for the respondents that disagree, or “cynics” as referred to by Williams and Lawson, they are the ones who do not approve much of tourism. These were the people who believe that the industry mainly creates low-paying jobs which does not benefit the community much. Also, they believe that due to the growth level of this industry throughout the years, it led to a high influx of immigrants with low skills and level of education which also results in creation of low-paying jobs. Although they do believe that the industry generates revenue as a main source of income for Aruba, they perceive it to be only beneficial to ‘the ones at the top’ in the industry, meaning that only investors,
business owners, and employees with high position in the industry benefit the most from the revenues. In other words, they do not believe the economic benefits reach everyone in the industry.
Notably there were no respondents that ‘completely disagree’ with the industry, its impact on the economy and an increase in the number of tourists. After having analyzed and compared the answers it became clear that the community is very much aware that Aruba is highly dependent on this industry and may be an indicative as to why none of the respondents would ‘completely disagree’ with the industry and its impacts on tourism.
Additionally, it was noted that there was a close relation between the responses of “being in favor for the tourism industry” and the industry “being good for the economy”. However, when comparing the responses regarding an increase in tourism, it can be seen that the relation changes slightly. The shift is mainly seen between the majority of the participants ‘completely agree’, changing to the participants being ‘neutral’ and ‘somewhat disagree’. This may also serve as an indication that for those who disagree with certain aspects of the tourism industry, they are still aware for the need of this industry in Aruba and are willing to see an increase in the number of tourists.
Aside from this, there were respondents who referenced the financial position of the government and who believe that this may help the government due to the potential revenues from this industry. This may explain why none of the respondents ‘completely disagreed’. This may also be an indication that politics/financial position of a country may have an impact on how a community perceives an industry in relation to the income that it generates.
Perception of impact on quality of service and products (percentages are rounded up)

UAUCU Student Research Exchange Collected Papers 2018
71
TOURISM HAS IMPROVED THE QUALITY OF SERVICE IN SHOPS, RESTAURANTS AND HOTELS:• Completely agree: 12 respondents which represents 7%
of the participants ‘completely agree’ with the statement• Somewhat agree: 106 respondents which represents
65% of the participants ‘somewhat agree’ with • Neutral: 39 respondents which represents 24% of the
participants were ‘neutral’ with the statement• Somewhat disagree: 5 respondents which represents
3% of the participants ‘somewhat disagree’ with the statement
• Completely disagree: none of the respondents ‘completely disagree’ with the statement
1. SHOPPING IN ARUBA (SUCH AS CHOICE OF SHOPS AND LONGER OPENING HOURS) IS BETTER BECAUSE OF TOURISM:• Completely agree: 7 respondents which represents 4%
of the participants ‘completely agree’ with the statement• Somewhat agree: 68 respondents which represents 42%
of the participants ‘somewhat agree’ with the statement• Neutral: 66 respondents which represents 41% of the
participants were ‘neutral’ with the statement• Somewhat disagree: 21 respondents which represents
13% of the participants ‘somewhat disagree’ with the statement
• Completely disagree: none of the respondents ‘completely disagree’ with the statement
In regards to the perceptions of the impact of tourism on the quality of products and services, it can be seen that the respondents mostly perceive this positively and largely agree that tourism has improved the quality of services in shops, restaurants and hotels. In literature such as “Tourism management” by Ryan C. & Page S. (2000) and “Tourism shopping” by Albayrak T., Caber M., & Çömen, N. (2016) it has been revealed that shopping in tourism has been cause for revitalizing traditional urban shopping centers and that destinations aim to maximize income by offering high
(shopping) value to tourists. This may explain why locals perceive an improved quality of service because of tourism.
When analyzing the open-ended questions from those who perceive that shopping is better because of tourism it was revealed that there exists a divide between those who ‘completely agree’/’somewhat agree’ and those who are ‘neutral’ and ‘somewhat disagree’. For respondents who agree that shopping is better, they mainly believe that because of the tourism industry there are many more opportunities for entrepreneurs to open up shops, and that tourism has enabled a greater variety of choice, thus increasing the number of high quality stores and encouraging many worldwide brands to penetrate the Aruban market.
On the other hand, those who were ‘neutral’ do believe that there are in fact more new stores and this creates opportunities for entrepreneurs; however, they also believe that because of the high level of quality that is being offered to tourists, this has caused for shopping to become more expensive in Aruba.
Lastly, for those who disagree with the statement that shopping on Aruba is better because of tourism, there is a perception that there are in fact many more stores/choices, which usually offer the same type of products, which from their perspective does not result in more options or choices. Also, they consider that most of these stores are focusing on tourists rather than locals, which causes the goods being offered not to match the tastes of locals which also restricts options for locals. Additionally, they believe that Aruba has become ‘Americanized’ and that there are little to none authentic, locally-produced goods that are also not only directed to tourists. Once again it should be noted that the option of ‘completely disagree’ did not receive any responses. This may be due to the fact that locals do agree that shopping is better because of tourism in a way; however, their perceptions of the different factors at play definitely varies.

UAUCU Student Research Exchange Collected Papers 2018
72
Those who agreed that the tourism industry offers very good pay and working conditions and generates many well-paying jobs indicated that they believe this to be true due to personal experiences of having opportunities to transition to jobs with better pay and conditions. These experiences vary from transitioning within the industry itself and from outside to inside the industry. Additionally, a number of these respondents were immigrants who believe that the working conditions and pay in the tourism industry on Aruba are better compared to other countries in the region. Several respondents also indicated that with the Aruban tourism industry increasing its level of quality, the industry may generate higher levels of wages and work conditions to attract the best employees possible.
The respondents who were neutral regarding this issue of employment in the tourism industry mainly believed that the jobs generated and the pay and working conditions in this industry were decent and can be improved. Also, various respondent believed that the level of pay and work conditions in this industry is thanks to Aruba’s labor laws. This may also indicate why the other respondents believe pay and work conditions are at acceptable levels, due to the labor laws.
As for the disagreeing respondents, they mostly believe that because most immigrants from the region perceive the jobs being generated and work conditions are better compared to their native countries, this causes for a high influx of immigrants that want to work in this industry. This causes for the demand for jobs to be higher than the supply and results in lower wages according to Katz L. F. & Murphy, K. M. (1992) for both locals and immigrants. Additionally, these respondents believe that the industry does not do much on its own to mitigate this situation to be able to keep importing “cheap labor” which results in locals not receiving many opportunities to receive employment.
Perception of employment in the industry (percentages are rounded up)
PAY AND WORKING CONDITIONS IN THE TOURISM INDUSTRY ARE GENERALLY VERY GOOD:• Completely agree: 2 respondents which represents
1% of the participants ‘completely agree’ with the statement
• Somewhat agree: 53 respondents which represents 33% of the participants ‘somewhat agree’ with the statement
• Neutral: 80 respondents which represents 49% of the participants were ‘neutral’ with the statement
• Somewhat disagree: 27 respondents which represents 17% of the participants ‘somewhat disagree’ with the statement
• Completely disagree: none of the respondents ‘completely disagree’ with the statement
THE TOURISM INDUSTRY ON ARUBA GENERATES MANY WELL-PAYING JOBS:• Completely agree: 2 respondents which represents 1%
of the participants ‘completely agree’ with the statement• Somewhat agree: 33 respondents which represents 20%
of the participants ‘somewhat agree’ with the statement• Neutral: 73 respondents which represents 45% of the
participants were ‘neutral’ with the statement• Somewhat disagree: 54 respondents which represents
33% of the participants ‘somewhat disagree’ with the statement
• Completely disagree: none of the respondents ‘completely disagree’ with the statement
Here, a shift in perceptions can be observed, when compared to the previous examination of perceptions of approval for the tourism industry. We can see that the perceptions between those who have high approval for the tourism industry and those with lower approval for the industry begin to overlap each other in regards to the perceptions of employment in this industry.

UAUCU Student Research Exchange Collected Papers 2018
73
• Neutral: 16 respondents which represents 10% of the participants were ‘neutral’ with the statement
• Somewhat disagree: 7 respondents which represents 4% of the participants ‘somewhat disagree’ with the statement
• Completely disagree: 61 respondents which represents 38% of the participants ‘completely disagree’ with the statement
THE BENEFITS FROM TOURISM ARE DISTRIBUTED FAIRLY THROUGHOUT OUR COMMUNITY:• Completely agree: none of the respondents ‘completely
agree’ with the statement• Somewhat agree: 42 respondents which represents 26%
of the participants ‘somewhat agree’ with the statement• Neutral: 48 respondents which represents 30% of the
participants were ‘neutral’ with the statement• Somewhat disagree: 66 respondents which represents
41% of the participants ‘somewhat disagree’ with the statement
• Completely disagree: none of the respondents 6 respondents which represents 4% of the participants ‘completely disagree’ with the statement
Regarding the perception of the impact of the tourism industry on a personal level, we can see that perceptions shift more to the disapproving side. This can be seen by the fact that the majority of the respondents are ‘neutral’, ‘somewhat disagree’ or ‘completely disagree’ in regards to being better off because of tourism, having more money to spend because of tourism and having the benefits of tourism fairly distributed throughout the community. These respondents strongly believe that one is better off, benefited by the industry and have more money to spend only if one is related to the industry. In contrast, those who agreed manifested that tourism impacts the whole island one way or another, and results in a distribution of benefits, being better off and having more money to spend.
Perception of the industry impact on a personal level (percentages are rounded up)
MOST PEOPLE ON ARUBA ARE BETTER OFF BECAUSE OF TOURISM:• Completely agree: 9 respondents which represents 6%
of the participants ‘completely agree’ with the statement• Somewhat agree: 28 respondents which represents 17%
of the participants ‘somewhat agree’ with the statement• Neutral: 68 respondents which represents 42% of the
participants were ‘neutral’ with the statement• Somewhat disagree: 50 respondents which represents
31% of the participants ‘somewhat disagree’ with the statement
• Completely disagree: 7 respondents which represents 4% of the participants ‘completely disagree’ with the statement
ARUBA WOULD BE A DULL PLACE IF TOURISTS DID NOT VISIT:• Completely agree: 67 respondents which represents
41% of the participants ‘completely agree’ with the statement
• Somewhat agree: 76 respondents which represents 47% of the participants ‘somewhat agree’ with the statement
• Neutral: 19 respondents which represents 12% of the participants were ‘neutral’ with the statement
• Somewhat disagree: none of the participants ‘somewhat disagree’ with the statement
• Completely disagree: none of the respondents ‘completely disagree’ with the statement
I HAVE MORE MONEY TO SPEND BECAUSE OF TOURISM ON ARUBA:• Completely agree: 29 respondents which represents
18% of the participants ‘completely agree’ with the statement
• Somewhat agree: 49 respondents which represents 30% of the participants ‘somewhat agree’ with the statement

UAUCU Student Research Exchange Collected Papers 2018
74
agree; with the statement• Somewhat agree: 32 respondents which represents 20%
of the participants ‘somewhat agree’ with the statement• Neutral: 46 respondents which represents 28% of the
participants were ‘neutral’ with the statement• Somewhat disagree: 64 respondents which represents
40% of the participants ‘somewhat disagree’ with the statement
• Completely disagree: 20 respondents which represents 12% of the participants ‘completely disagree’ with the statement
When analyzing the results on perception of impact on prices and costs there was a clear difference. Regarding the rise in prices in certain areas, the majority of respondents agreed that there are indeed areas in Aruba where prices are noticeably higher than other areas. Notably, these areas are the two districts with the highest concentration of tourism activities. Also notable was, that majority of the respondents believed that the higher prices were caused by increased quality of service and products being offered which relates to them agreeing that tourism raises quality. Additionally, as mentioned before, tourism leads to urban shopping centers to be revitalized (Ryan C. & Page S. 2000) as destinations strive to offer high value to tourists in order to maximize income (Albayrak T., Caber M., & Çömen, N. 2016).
Another factor that may contribute to higher prices is supply and demand. Research conducted by the Aruba Tourism Authority revealed that on average, in a given year, for every 1 local, there are approximately 9.5 tourists. That being said, the demand in areas with high concentration of tourists will be much higher than non-tourist areas, and may impact the prices in those areas only. Additionally, the various restaurants in those areas offer unique services and specialties, which allows them to set their own prices and differentiate themselves, causing monopolistic competition. This may also be a reason for the higher prices (Principles of Economics, 2014). For those respondents who did not
Additionally, the respondents were ‘neutral’, ‘somewhat agreed’ and ‘completely agreed’ with the statement of ‘Aruba would be a dull place if tourists did not visit’. None of the respondents disagreed with this statement, thus lending some support to respondents who said that tourism impacts the entire island one way or another. However, despite the fact that the respondents do believe this to be true, most do not feel better off, benefited or have more money because of tourism which indicates that personally they do not experience any impact.
Important to note is, that the percentage for those respondents who did not agree to be better off, having more money to spend and experience fairly distributed benefits of tourism, closely resembles the percentage of respondents who identified their employment to be unrelated to the tourism industry.
Perception of impact on prices and costs (percentages are rounded up)
TOURISM MAKES PRICES RISE, SO LOCALS CAN NO LONGER AFFORD TO ENJOY AMENITIES IN CERTAIN AREAS OF ARUBA:• Completely agree: 40 respondents which represents
25% of the participants ‘completely agree’ with the statement
• Somewhat agree: 109 respondents which represents 67% of the participants ‘somewhat agree’ with the statement
• Neutral: 10 respondents which represents 6% of the participants were ‘neutral’ with the statement
• Somewhat disagree: 3 respondents which represents 2% of the participants ‘somewhat disagree’ with the statement
• Completely disagree: none of the respondents ‘completely disagree’ with the statement
TOURISM HAS INCREASED THE COST OF LIVING IN ARUBA:• Completely agree: none of the respondents ‘completely
UAUCU Student Research Exchange Collected Papers 2018
75
that the Aruban community is currently tolerant of the current situation, but that improvements can be made so that the economic impact can be much more positive than at current levels.
Additionally, it was noted that the main problems that locals experience because of tourism from their perspectives were the following: higher prices, not many shopping options, too ‘Americanized’, no Aruban authenticity, wages not high enough, immigrants dominating the industry, an economy that is highly vulnerable to changes in the tourism industry, and most do not feel any personal economic benefit from tourism.
To help mitigate these problems, it would be advised that the government and other stakeholders take note of the following: high prices are believed to be caused by high import duties and high quality of the products and services being offered. A suggestion might be to create policies to stimulate and increase locally produced items by the means recycling. Not only can this reduce the need to import and reduce the costs of import duties, but also by making use of recycling, this may also contribute to solving the current challenges the island faces with its dumpsite. Additionally, it may result in higher authenticity.
Another recommendation would be to stimulate and increase locally-grown produce and cattle breeding. Having seen that Aruba offers a large variety of restaurants that operate in a monopolistic competition market, it would be beneficial to locally produce the raw materials that these restaurants need to operate. This may result in fewer imports and therefore lower costs to produce and operate, while giving the restaurants the chance to offer tourists fresh and high-quality ‘products’ (food/cuisine/cooking). At the same time, more locals can benefit by expanding the agriculture industry to keep up with this demand. This may also lower prices and raise the contribution of local expenditure in restaurants.
agree, they believed that the high prices are not caused by tourism but by inflation and high import duties.
The majority of respondents disagreed that tourism has increased the cost of living. The ones that were neutral stated that cost of housing, utilities, etc., did not rise because of tourism; however, as mentioned before, shopping and dining expenses have. For this reason, they are neutral, as they feel tourism has increased part of their costs, but not the majority.
It is important to note that for those who agreed, their motivation was that house/properties, supermarkets and rental apartments closer to the tourist areas were more expensive and therefor raised the cost of living. It was also notable that the percentage of respondents who agreed had a close correlation with the respondents who identified themselves as residents in the district of Noord.
CONCLUSION
After having analyzed the findings from this research, the following conclusions have been made: the Aruban community largely approves of the tourism industry on Aruba, the Aruban community perceives the economy to be highly dependent on tourism, locals perceive that tourism raises the quality of services and products, locals do not perceive that their power of consumption has improved because of tourism, locals perceive that the employment, pay and conditions in the tourism industry can be improved, locals do not perceive their personal well-being has improved due to tourism and locals perceive that tourism has increased prices
To conclude, the Aruban community perceives the tourism industry to be beneficial; however, their perceptions of the economic impact of tourism regarding various factors are, at a neutral level. This indicates

UAUCU Student Research Exchange Collected Papers 2018
76
and welfare in an open dynamic economy’, Japanese Economic Review, Vol 57, No 4, pp 501–515
• Copeland, B. R. (1991). Tourism, welfare, and de-industrialization in a small open economy. Vancouver, Canada
• Dipietro, R. B., & Peterson, R. (2017). Exploring Cruise Experiences, Satisfaction, and Loyalty: The Case of Aruba as a Small-Island Tourism Economy. International Journal of Hospitality & Tourism Administration,18(1), 41-60. doi:10.1080/15256480.2016.1263170
• Hazari, B.R., and Ng, A. (1993) ‘An analysis of tourists’ consumption of non-traded goods and services on the welfare of the domestic consumers’, International Review of Economics and Finance, Vol 2, pp 53–58
• Katz, L. F., & Murphy, K. M. (1992). Changes in Relative Wages, 1963-1987: Supply and Demand Factors. The Quarterly Journal of Economics,107(1), 35-78. doi:10.2307/2118323
• Melledu, M. (2014) ‘Tourism, residents’ welfare and economic choice: a literature review’, Journal of Economic Surveys, Vol 28, No 2, pp 376–399
• MUTH, J. F. (1959). Rational expectations and the theory of price movements. Ft. Belvoir: Defense Technical Information Center.
• Nowak, J.J., and Sahli, M. (2007), ‘Coastal tourism and ‘Dutch disease’ in a small island economy’, Tourism Economies, Vol 13, No 1, pp 49–65
• Pizam, A. (1978) Tourism impacts: the social costs to the destination community as perceived by its residents, Journal of Travel Research, 16, pp. 8–12.
• Pizam, A. (1982). Tourism Manpower: The State of the Art. Journal of Travel Research,21(2), 5-9. doi:10.1177/004728758202100204
• Pizam, A., Uriely, N. & Reichel, A. (2000) The intensity of tourist–host social relationship and its effects on satisfaction and change of attitudes: the case of working tourists in Israel, Tourism Management, 21(4), pp. 395–406.
Entrepreneurship among locals should be stimulated and increased. This may encourage more locally-owned businesses, which would be less ‘Americanized’ and more authentic, as well as expanding shopping options. More locals could benefit from tourism by entering the retail industry.
An additional suggestion might be to improve and increase employment regulations. This may lead more locals to be able to have better opportunities to acquire jobs, and may bring balance between supply and demand in the labor market. It may also cause wages to increase to acceptable levels for both employers and employees.
Attempts should be made to diversify the economy, creating and/or developing new and/or existing industries such as finance and/or technology. This would generate high-paying jobs, boost the economy and promote less dependency on and vulnerability to one sole industry.
It is advised that further studies be conducted on local perceptions of the social and environmental impact of tourism, so that we can better determine the general public’s level of approval and willingness to support tourism-related economic activity.
REFERENCES
• Albayrak, T., Caber, M., & Çömen, N. (2016). Tourist shopping: The relationships among shopping attributes, shopping value, and behavioral intention. Tourism Management Perspectives,18, 98-106. doi:10.1016/j.tmp.2016.01.007
• Bimonte, S., & Punzo, L. F. (2016). Tourist development and host–guest interaction: An economic exchange theory. Annals of Tourism Research,58, 128-139. doi:10.1016/j.annals.2016.03.004
• Chao, C.-C., Hazari, B.R., Laffargue, J.-P. , Sgro, P.M., and Yu, E.S.H. (2006), ‘Tourism, Dutch disease
UAUCU Student Research Exchange Collected Papers 2018
77
College of Utrecht. The survey aims to identify what are the perceptions of the Aruban community towards tourism. Ideally by having conducted this survey, this will help gain a better insight in what are the opinions of the Aruban community towards certain aspects of tourism, which in this case will be focusing on the economic aspect of tourism on Aruba.
The goal is to be able to compile data which can be used to translate the local perception towards tourism into areas of focus for when improving/creating economic policies that involve tourism. This will help create a balance which will not only be beneficial for the tourism industry but for the government of Aruba and the Aruban community too.
1. What is your gender?a) Maleb) Femalec) Prefer not to sayd) Other:
2. What is your age group?a) 18 – 30b) 31 – 45c) 46 – 60d) 61 +
3. In which district do you live?a) Noordb) Oranjestadc) Paraderad) Santa Cruze) Savanetaf) San Nicolas
4. To what level is your current employment related to the tourism industry?a) Not relatedb) Somewhat relatedc) Highly related
• Pourrier, Y. (n.d.). Retrieved April 14, 2018, from http://cbs.aw/wp/index.php/2014/12/05/census-2010-population-projections-2010-2030-the-2014-revision/
• Principles of Economics, N. Gregory Mankiw, 7th edition, 2014, South-Western College Pub
• Ridderstaat, J. (2007). The Lago Story, The Compelling Story of an Oil Company on the Island of Aruba. Editorial Charuba.
• Ridderstaat, J., Croes, R., & Nijkamp, P. (2013). Tourism and Long-run Economic Growth in Aruba. International Journal of Tourism Research,16(5), 472-487. doi:10.1002/jtr.1941
• Ryan, C., & Page, S. (2000). Tourism management: Towards the new millennium. Amsterdam: Pergamon.
• Sr, M. V., & Croes, R. R. (2003). Growth, development and tourism in a small economy: Evidence from Aruba. International Journal of Tourism Research,5(5), 315-330. doi:10.1002/jtr.441
• Tkalec, M., & Vizek, M. (2016). The Price Tag of Tourism: Does Tourism Activity Increase the Prices of Goods and Services? Tourism Economics,22(1), 93-109. doi:10.5367/te.2014.0415
• Williams, J., & Lawson, R. (2001). Community issues and resident opinions of tourism. Annals of Tourism Research,28(2), 269-290. doi:10.1016/s0160-7383(00)00030-x
• Zhang, J., Inbakaran, R. J., & Jackson, M. S. (2006). Understanding Community Attitudes Towards Tourism and Host—Guest Interaction in the Urban—Rural Border Region. Tourism Geographies,8(2), 182-204. doi:10.1080/14616680600585455
APPENDIX
Tourism surveyHow do you perceive tourism on Aruba?
This survey is being conducted as part of a collaborative research program between the University of Aruba and the University/

UAUCU Student Research Exchange Collected Papers 2018
78
d) Somewhat disagreee) Completely disagree
11. Shopping in Aruba (such as choice of shops and longer opening hours) is better because of tourisma) Completely agreeb) Somewhat agreec) Neutrald) Somewhat disagreee) Completely disagree
12. Please shortly describe your choice for question 11
13. Aruba would be a dull place if tourists did not visita) Completely agreeb) Somewhat agreec) Neutrald) Somewhat disagreee) Completely disagree
14. Most people on Aruba are better off because of tourisma) Completely agreeb) Somewhat agreec) Neutrald) Somewhat disagreee) Completely disagree
15. Please shortly describe your choice for question 14
16. Pay and working conditions in the tourism industry are generally very gooda) Completely agreeb) Somewhat agreec) Neutrald) Somewhat disagreee) Completely disagree
17. Please shortly describe your choice for question 16
For the remainder of this survey you will be presented with multiple statements of which you are requested to indicate to what level you agree or disagree with these statements. Additionally, several of these statements will be accompanied by a follow up question in which you are requested to elaborate in short why your choice of level of agreement or disagreement.
5. I am in favor for the tourism industry in Arubaa) Completely agreeb) Somewhat agreec) Neutrald) Somewhat disagreee) Completely disagree
6. Tourism is good for the Aruban economya) Completely agreeb) Somewhat agreec) Neutrald) Somewhat disagreee) Completely disagree
7. Please shortly describe your choice for questions 6
8. I would like to see an increase in the number of tourists on Arubaa) Completely agreeb) Somewhat agreec) Neutrald) Somewhat disagreee) Completely disagree
9. Please shortly describe your choice for question 8
10. Tourism has improved the quality of service in shops, restaurants and hotelsa) Completely agreeb) Somewhat agreec) Neutral

UAUCU Student Research Exchange Collected Papers 2018
79
a) Completely agreeb) Somewhat agreec) Neutrald) Somewhat disagreee) Completely disagree
26. Please shortly describe your choice for question 25
18. The tourism industry on Aruba generates many well-paying jobsa) Completely agreeb) Somewhat agreec) Neutrald) Somewhat disagreee) Completely disagree
19. Please shortly describe your choice for question 18
20. The benefits from tourism are distributed fairly throughout our communitya) Completely agreeb) Somewhat agreec) Neutrald) Somewhat disagreee) Completely disagree
21. Please shortly describe your choice for question 20
22. I have more money to spend as a result of tourism on Arubaa) Completely agreeb) Somewhat agreec) Neutrald) Somewhat disagreee) Completely disagree
23. Tourism makes prices rise, so locals can no longer afford to enjoy amenities in certain areas of Arubaa) Completely agreeb) Somewhat agreec) Neutrald) Somewhat disagreee) Completely disagree
24. Please shortly describe your choice for question 23
25. Tourism has increased the cost of living in Aruba


UAUCU Student Research Exchange Collected Papers 2018
81
Large contrasts on ‘One Happy Island’
It is 2pm on a Wednesday. Daniel and I are sitting in a parking lot near the cruise terminal at a somewhat random smoothie and sandwich shop. We are surrounded by parked cars with “One Happy Island” written on the number plates. It is a well-deserved break from a day of writing at the University of Aruba. Last year’s student recommended us going there, and we are pleasantly surprised with the sandwiches we receive. “Masha danki, hopi bon”, we mutter in our broken Papiamento. And then it happens. Just as we receive our smoothies, we see it being poured in a non-biodegradable Styrofoam cup. “No, don’t it”, we attempt to say, but it is too late. Shamefully we finish our delicious drinks, thinking to ourselves “What would Eric think?”.
Having spent 11 weeks on Aruba, we have been able to experience the most beautiful, but also the darker parts of
the island. Fittingly, the introduction week consisted of a number of ‘depression tours’ showing us the places that still had some room for improvement. But even in that week, Eric was unable to hide the beauty that Aruba possesses. When sailing past Parkietenbos (which I found out is not a pretty forest with birds), and seeing how mangroves were affected by all the Aruban waste, we still catch a glimpse of the breath-taking Spanish Lagoon, whilst some people were able to spot a turtle.
This large contrast symbolizes the island for me. As part of the UAUCU research collaboration, I have tried to make one of the darker parts a bit less grim, whilst enjoying the beauty to its fullest. I fully realise how unique this opportunity has been, to do field research as a bachelor student in the Caribbean. Our thesis will not only be read by our supervisors, and if we are lucky, one of us might actually make a difference. Besides that, all of us have learnt a lot by participating in this programme. I think that everyone has gone through the classic stages of doing research, which include frustration, excitement, desperation and satisfaction.
I would like to end the introduction by thanking everyone involved in the project. First of all, I want to express my gratitude to the cornerstones of the collaboration, Jocelyn and Eric, without whom I would sit in my room in Utrecht, writing some boring literature review for a thesis. I would also like to thank Loek Groot, my supervisor, who has been able to guide me through the entire process, making sure that I would set realistic goals for myself. Moreover I would like to thank all the participants of my research, the (assistant-)managers, chief engineers, certification managers, public relations, human resources, sustainability managers, quality managers, energy consultant, maintenance manager, and employees of the tourism companies. Without the help of these people I would not have been able to conduct any research. Lastly, I would like to thank everyone else involved in the project: Kitty, Anthony, Clifford, Jairo, Carlos, and all the other people who helped to make this project reality.
Luc Lips, University College Utrecht

UAUCU Student Research Exchange Collected Papers 2018
82
Abstract
This paper presents an analysis of the determinants of eco-innovation in the Aruban tourism sector. The research goal is to find the drivers and barriers for firms to engage in environmental innovations in the unique context of a small island states. Eighteen participants from firms in the tourism sector were interviewed on the topic, which enabled the research to come to two types of conclusions. Conceptually, the market pull-, and regulation push- and pull- factors are of limited influence in the Aruban context, whereas the supply side factors such as ownership structure, nationality of the owners and education of the management have been identified as important determinants. The conceptual conclusion has led to a policy proposal, in which the government has to detach itself from the Water and Energy plant (WEB), the solar panel policy should be less strict and cash needs to flow directly from unsustainable to sustainable efforts in several ways. These policies should be formulated in a 2030 plan, in accordance with all relevant (political) parties in order to guarantee long term continuation.
Keywords: Aruba, small island state, determinants of eco-innovation, environmental innovation, sustainability, waste management, tourism industry.
Introduction
“The effects of climate change are visible everywhere, but nowhere more so than in small island states.” (Ban Ki Moon, 2014)
As Ban Ki Moon stated in 2014, small island states are at the frontline of our environmental problems. Rising sea levels will affect these countries, with limited resources, first. Therefore one would expect that governments of small island states prioritise preventing the potential destructive consequences from climate change. However, due to their small size small island states, such as Aruba, face many more complex environmental problems. Waste management, water life preservation and reducing the carbon footprint are issues that are significantly more complicated in these small states compared to their mainland counterparts. Therefore, the government has to work together with the private sector in order to counter these problems effectively. A large problem in countering these environmental issues in small island states is the choice between competition and economies of scale. In general economic theory, it is assumed that perfect competition is the most efficient market structure, but this is not necessarily the case for small island states, where natural monopolies occur a lot more frequently than in other states. Due to the limited
Determinants of eco-innovation:
The Aruban Case
Luc Lips

UAUCU Student Research Exchange Collected Papers 2018
83
influence of the government over these monopolizing corporations, the public officials have to focus their policies on markets with some form of competition.
Therefore, this research is aimed at the largest Aruban sector with competition; the tourism industry. The research looked into the drivers and barriers of firms in the aforementioned sector to engage in environmental innovation activities, which includes reducing waste and the carbon footprint. The study utilized the simple framework derived from the literature by Horbach, Rammer and Rensing (2012) on the determinants of eco-innovation. The previously defined factors of influence are: firm strategy, market pull-, technology push, and regulation push- and pull factors. The research aims at mapping out the effect of each of the determinants, followed by conclusions as to what effect each of these factors has.
This research can be linked to many of the sustainable development goals (SDG), as its purpose can be described to be twofold, similar to the SDGs, sustainability and development are key factors in environmental innovation. Specifically, the goals 11 (sustainable cities and communities), 12 (responsible production and consumption) and 13 (climate action) are a direct part of this research, and indirectly various others could be influenced by the results.
Firstly, the theory regarding environmental innovation will be discussed, after which the Aruban context will be elaborated on. In order to be able to come to a conclusion, 18 semi-structured interviews were held with participants from firms in the Aruban tourism sector. The data acquired will be thematically analysed, which will enable the paper to come to two types of conclusions. Initially, the conceptual relevance of the model will be discussed in the small island state context. Subsequently, a set of policies will be proposed that might ameliorate the framework for sustainability in the Aruban context.
Theoretical framework
Finding an adequate definition of eco-innovation is not an easy task, as various researchers do not agree on a common definition. In order to come to a better understanding of the topic, it is first necessary to review the meaning of the concept ‘innovation’. Innovation is “the implementation of a new or significantly improved product (good or service), or process, a new marketing method, or a new organisational method in business practices, workplace organisation or external relations” (OECD, 2005). The OECD distinguishes three types; namely process, product and organisational innovations. Process innovations happen when a certain amount of goods or services (output) can be produced with less input. Product innovations are an amelioration of existing products or the development of new goods. For example, a product innovation in a firm that produces machinery can lead to a process innovation in another firm that uses that machinery. Organisational innovation are new forms of management that allow a firm to produce their output more efficiently or with a higher quality (OECD, 2005).
According to various researchers, the OECD categories are insufficient in explaining and differentiating environmental innovation, which henceforth has led to a gap in the literature (Rennings, 2000; Horbach, Rammer & Rennings, 2012). They therefore propose a new innovation category called ‘eco-innovation’. This paper will use the definition proposed by Horbach, Rammer and Rennings, who define eco-innovation as follows:
“Eco-innovation is the production, application or exploitation of a good, service, production process, organizational structure, or management or business method that is novel to the firm or user and which results, throughout its life cycle, in a reduction of environmental risk, pollution and the negative impacts of resources use (including energy use) compared to relevant alternatives”. (Horbach, Rammer & Rennings, 2012)
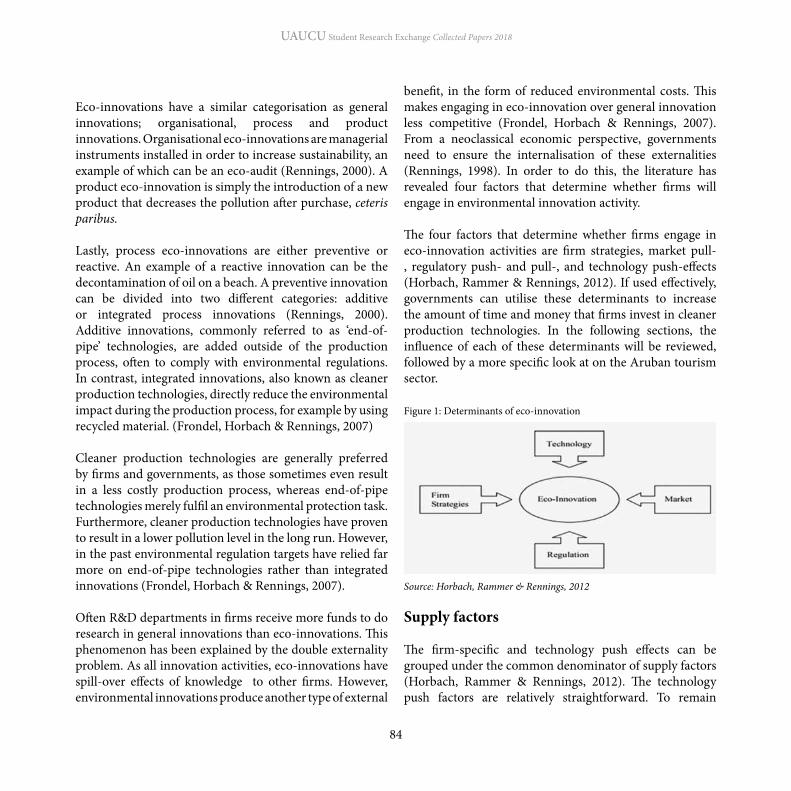
UAUCU Student Research Exchange Collected Papers 2018
84
Eco-innovations have a similar categorisation as general innovations; organisational, process and product innovations. Organisational eco-innovations are managerial instruments installed in order to increase sustainability, an example of which can be an eco-audit (Rennings, 2000). A product eco-innovation is simply the introduction of a new product that decreases the pollution after purchase, ceteris paribus.
Lastly, process eco-innovations are either preventive or reactive. An example of a reactive innovation can be the decontamination of oil on a beach. A preventive innovation can be divided into two different categories: additive or integrated process innovations (Rennings, 2000). Additive innovations, commonly referred to as ‘end-of-pipe’ technologies, are added outside of the production process, often to comply with environmental regulations. In contrast, integrated innovations, also known as cleaner production technologies, directly reduce the environmental impact during the production process, for example by using recycled material. (Frondel, Horbach & Rennings, 2007)
Cleaner production technologies are generally preferred by firms and governments, as those sometimes even result in a less costly production process, whereas end-of-pipe technologies merely fulfil an environmental protection task. Furthermore, cleaner production technologies have proven to result in a lower pollution level in the long run. However, in the past environmental regulation targets have relied far more on end-of-pipe technologies rather than integrated innovations (Frondel, Horbach & Rennings, 2007).
Often R&D departments in firms receive more funds to do research in general innovations than eco-innovations. This phenomenon has been explained by the double externality problem. As all innovation activities, eco-innovations have spill-over effects of knowledge to other firms. However, environmental innovations produce another type of external
benefit, in the form of reduced environmental costs. This makes engaging in eco-innovation over general innovation less competitive (Frondel, Horbach & Rennings, 2007). From a neoclassical economic perspective, governments need to ensure the internalisation of these externalities (Rennings, 1998). In order to do this, the literature has revealed four factors that determine whether firms will engage in environmental innovation activity.
The four factors that determine whether firms engage in eco-innovation activities are firm strategies, market pull-, regulatory push- and pull-, and technology push-effects (Horbach, Rammer & Rennings, 2012). If used effectively, governments can utilise these determinants to increase the amount of time and money that firms invest in cleaner production technologies. In the following sections, the influence of each of these determinants will be reviewed, followed by a more specific look at on the Aruban tourism sector.
Figure 1: Determinants of eco-innovation
Source: Horbach, Rammer & Rennings, 2012
Supply factors
The firm-specific and technology push effects can be grouped under the common denominator of supply factors (Horbach, Rammer & Rennings, 2012). The technology push factors are relatively straightforward. To remain

UAUCU Student Research Exchange Collected Papers 2018
85
competitive, firms have to engage in innovation activities. However, innovation activities only make sense if a firm can harvest the profits of its innovation: therefore, it is important that by regulation the spill-over effects are (temporary) minimalised (Horbach, 2008).
The first of the firm specific factors is that of the educated personnel and/or management. Porter and Van der Linde stated in the famous ‘Porter-hypothesis’ that firms do not detect the potential of eco-innovations because they are “still inexperienced in dealing creatively with environmental issues”, and that an increase in profit can be made by eco-innovation if education expenditure is increased (Porter & Van der Linde, 1995). However, many economists dispute this hypothesis, as they argue that although small eco-innovations can lead to a marginal increase in the profits, bigger environmental innovations are complex to such a degree, that it will decrease profits, at least in the short term. This educational factor has been more elaborately researched by Reid and Miedzinski, who found that firms that are most successful in eco-innovations educated their personnel significantly more than firms that remained unsuccessful. Moreover, even at the highest management level there seemed to be an information gap between the firms that engaged in environmental innovation activities and those who did not. The main reason for firms not to invest in eco-innovation was the costliness, whereas one of the chief reasons for the successful firms was to save costs (Reid & Miedzinski, 2008).
Another supply factor is the size of a company. Several studies have found that due to the high complexity of environmental innovations, larger firms are more likely to implement eco-innovations. This goes against general innovation theory, in which it is argued that small- and medium sized enterprises (SMEs) have the need to be more innovative in order to be able to compete with larger firms. (Del Rio, 2017; Kammerer, 2009)
Following from this, the strength of networks between firms in a certain industry has shown to be of importance. This has been named as one of the most significant factors in the success of environmental innovation by several researchers. Due to the aforementioned complexity of eco-innovations, a lot of basic research needs to be done before coming to a practical competitive invention. When an industry has relatively strong networks, the basic information can be shared amongst members, which would decrease the cost of eco-innovating. However, the decrease of competitiveness is of course a disincentive for sharing (Del Rio, 2017; Triguero, Moreno-Mondéjar, & Davia, 2013; Hojnik & Ruzzier, 2016).
Lastly, there are regional factors that play a role in the supply factors. For example, cultural capital explains the cultural background and basic value system that is shared by the individuals in a community, which manifests in their attitudes and habits (OECD, 2005). The previously discussed willingness to collaborate on innovations is another example of a culturally determined factor (Reid & Miedzinski, 2008).
Regulation
Regulation has been considered as probably the most important determinant of eco-innovation, with the government as the main actor. The research on the topic of the effects of various policies on the firm’s behaviour is relatively recent, but the overall hypothesis thus far is that there is a differentiated effect. The literature distinguishes two different types of regulations; hard and soft. The following section will discuss both types as well as the theoretical effects on eco-innovation.
Hard regulationThe first type of a hard regulation is called a command and control (CaC) measure. This means that a government sets a legal limit that each firm is allowed to pollute. This

UAUCU Student Research Exchange Collected Papers 2018
86
gives companies an incentive to engage in end-of-pipe innovations. This is mainly caused by the fact that firms are not rewarded for exceeding the amount of CO2 reduction set by the CaC measures (Vollebergh, 2007). However, countries have largely relied on these policies, due to lack of research regarding the effect of such policies (Hojnik & Ruzzier, 2016).
The second regulation governments can resort to is that of a carbon tax. By increasing the price of polluting, the government has made the price of alternative products less expensive. Furthermore, this measure does reward firms when decreasing their pollution to levels lower than the expected threshold. Firms that are more innovative by nature, will environmentally innovate more than others, until a new efficient equilibrium is reached. However, companies are more likely to evade a carbon tax, as it is difficult to measure the exact amount a firm has polluted. A framework that fully and correctly measures carbon pollution has proven to be too expensive thus far (Vollebergh, 2007). Research has not yet been able to identify the effect of a carbon tax on eco-innovation specifically.
Furthermore, governments can choose to implement subsidies for environmental technologies, which initially will decrease the cost of engaging in process innovations. However, due to the ‘aversion to regret’, firms will be less likely to innovate after the subsidy has ended, because the price of an innovation has relatively increased. It is unclear what the effect of a subsidy in the long run is (Vollebergh, 2007; Kahneman & Tversky, 1979).
The last type of regulation governments can decide to adopt is called a cap-and-trade system. In theory this works similar to a carbon tax; firms have to pay a price for the amount of carbon they pollute. However, the price is determined by a supply and demand mechanism, which results in a fluctuating price, depending on the amount that is polluted
country-wide. In theory, this can make eco-innovation very profitable, as firms are able to sell permits by producing more efficiently. Yet in practice, there is no proof that eco-innovation has been stimulated by the implementation of this type of policy (Pontogolio, 2010).
Soft regulationAs has become apparent from the above section, there is not a single policy that has proven to be most successful in incentivising firms to engage in eco-innovation for cleaner production technologies. A large part of the success of policies is influenced by soft regulations, which together with the hard regulations can prove to have a large effect on environmental innovation in a country (Horbach, Rammer & Rennings, 2012; Frondel et al., 2007).
The main factor that has proven to be effective by the government is general policy stringency. Frondel et al. (2007) have found that general government stringency is the most important factor in incentivising firms to engage in eco-innovation in OECD countries. However, policy stringency motivates firms more to engage in end-of-pipe innovations, rather than integrated cleaner production technologies. This is due to the complexity of the latter type of innovation, which shows results in a later stage after initial investment.
The type of soft regulation that has proven to incentivise firms to do research in cleaner production technologies has to do with future regulations. In the past, end-of-pipe innovations were more frequently implemented by firms, but the more it becomes clear that certain policies are meant to stay, more firms switch to complex research into cleaner production technologies. Therefore, if a government has a strong stance on eco-innovation and is willing to commit long term to certain policies, this implicitly increases the cost for future pollution, which makes an investment in integrated cleaner technologies more sensible (Horbach, Rammer & Rennings, 2012).

UAUCU Student Research Exchange Collected Papers 2018
87
Furthermore, as mentioned before, Reid and Miedzinski (2008) have found that the most significant reason for firms to invest in cleaner production technologies is for cost saving. However, firms that do not invest in eco-innovation are demotivated by the high perceived investment of environmental innovations. Therefore, the government can motivate firms to increase their investment in the implementation of cleaner production technology by framing their policies in such a way, that it is seen as an opportunity to save costs (Thaler & Sunstein, 2008).
Lastly, governments can decrease the knowledge spill-over effects that arise with eco-innovation by issuing patents for new innovations/inventions. This increases profits associated with research, by giving firms a temporary monopoly over a certain innovation. However, this does result in a slower diffusion of an environmental innovation, which would slow a country’s energy transition. Furthermore, the importance of patents by themselves is rather low for environmental innovations, as the main profits are public by nature (Frondel et al, 2007).
Market
The last determinant of environmental innovation concerns the consumer benefit that arises when a product is advertised as being sustainable. For certain products, consumers are willing to pay a premium price when it is promoted as environmentally responsible. The market pull factors are most influential to luxury sectors, such as tourism (Kammerer, 2009).
However, so far it has proven to be the least important factor of all (Horbach, Rammer & Rennings, 2012). Nevertheless, Reid and Miedzinski (2008) have found that a strong motivation for firms to engage in eco-innovation activities is the potential increase in market share, which shows that firms expect this to be a more important determinant in the future.
Aruban context
Kammerer (2009) shows that in each industry has the relative importance of each of the determinants is different, and as shown in the supply factor section, there are many factors that determine this. This next section will therefore discuss some background information on the Aruban tourism sector.
Waste Management
In the literature for European and American environmental innovations, the focus lies on limiting the release of greenhouse gases, such as carbon dioxide and methane, in the atmosphere. However, in the small island context there is the dimension of waste management in the environmental practises as well. In these states, due to land scarcity and the high costs of sustainable waste management technologies, there is a large environmental pressure on the islands to process the waste.
Generally, there is a strong correlation between the human development index (HDI) and waste generation. However, although the islands in the Caribbean have a lower HDI, they generate a similar amount of waste as high income countries. This can largely be ascribed to two factors. First of all, most of the island economies rely on millions of tourists each year, who are not taken into account when calculating the amount of waste generated per capita. Each extra tourist generates on average 1.31kg of garbage per day (Mateu-Sbert et al., 2013). Secondly, because the small island states rely mostly on import of all products, waste is increased as well (Mohee et al., 2015).
Mohee et al. (2015) distinguish five different waste management technologies: landfilling, recycling, composting, anaerobic digestion and fermentation processes and thermochemical processes. The last two technologies concern the production of biogas from household and organic waste. On Aruba, most

UAUCU Student Research Exchange Collected Papers 2018
88
of the waste ends up in one of the landfills or illegal dumping sites, which is at the bottom of the waste management hierarchy. Recycling and composting only happens on a recreational basis. Furthermore, the local private company EcoTech has patented a technology that can produce biogas from household materials.
Because almost all garbage on the island currently ends up in landfills or illegal dump sites, and tourists generate a lot of waste and consume large quantities of electricity, the tourism sector plays a key role in countering the environmental challenges.
Natural monopolies
A large problem in waste management on small island states is the choice between competition and economies of scale. In general economic theory, it is assumed that perfect competition is the most efficient market structure, but this is not necessarily the case for small island states, where natural monopolies occur a lot more frequent than in other states. This can best be explained by a real life example from St. Eustatius (Statia). In that country, there is one man with an excavator, who makes money by renting it out for construction work. Due to the size of the island, the market is only large enough for one excavator, but this results in a situation in which this individual can rent out his equipment for an inflated price. If one would want create a situation with perfect competition, excavators should be banned from the island, so people with shovels would find an efficient market solution. However, it is unclear/doubtful whether that would be more efficient than the existing monopoly.
Another example in the energy transition sector is the WEB (water and energy plant), the government owned company responsible for producing all clean water and energy for the entire island. The corporation does not accept the gas produced by EcoTech, which therefore has to export its
gas to other countries. This is one of the main reasons this study focuses on the tourism sector, which can be strongly influenced by governmental regulations, as there is a lot of competition.
Composition of the economy and relevant policies
Aruba’s economy is largely dependent on the tourism sector, which comprises three quarters of the country’s GDP. Within the tourism industry, most income is earned from tourists coming from Northern America; 74.3% in 2011. (CBS, 2011) Furthermore, the sector largely consists of SMEs; more than 98% of the companies within the tourism industry qualify as a small- or medium sized enterprise (CBS, 2013).
An issue of high priority for the Aruban government is the high public debt. In 2018, the Caft (Aruban financial control) issued a statement expressing concern on the financial position of the country. In 2017 the public debt was 85% of GDP, and it is expected to increase to 87% in 2018 (Rasmijn, 2018; IMF, 2017). Therefore, the Caft has demanded budget cuts for the coming years, in order for the debt to be decreased to a maintainable level. This has left the government with little room for investments in for example sustainability.
Nevertheless, in the current Aruban tax system, there are incentives to invest in sustainability and education. An example can be found on the website of Arina (Aruban Investment Agency); For a hotel to qualify for certain tax reliefs, it should invest a specified amount per year in the Aruban community, of which one third should be allocated to green energy projects, another third to education and the last third to the purchase of local products. The investment can be deducted from the company’s profit. Furthermore, the company has to “be in the possession or at least prove that it has started the process of acquiring an earth check certificate or a similar certificate (a certificate of the lowest category)”,

UAUCU Student Research Exchange Collected Papers 2018
89
Another policy that is of importance to the tourism sector is that of the Spatial Management Beaches Directive (RRIS), a new beach policy adopted in 2015. The policies were made according to the following general philosophy:The beaches of Aruba are in the public domain, must be accessible on an equal basis for everyone, resident or visitor to our country, and remain so (BRO, 2014).More specifically, two policies have been of great importance to the Aruban tourism industry. First of all, the government declared that all beaches on the west coast of the island (the coast with the highest number of beaches) remained public, which means that hotels, resorts and restaurants were not allowed to take ownership of beach strips. Secondly, in order to increase gains from tourism directly to the population, and stimulate small scale entrepreneurship, the government has introduced 40 water sport areas, often between two hotels, where residents and/or small chains are free to open small businesses that sell “beach related water sports”. These services are aimed at both cruise ship- and hotel tourists.
Methods
As discussed in the introduction, this article will explore the drivers and barriers of environmental innovation for the tourism sector in Aruba, which is a very relevant question specifically in the small island state context. This is mainly due to the fact that the informal structure of the state has evolved to be different from the general Western assumptions, as will become clear in the following sections. Besides that, the unique mixture of cultures on each of the Caribbean islands mixed with the small scale of the states, whilst being heavily influenced and dependent on the Americas and Europe, makes it an area where many different factors influence the decision making processes of actors in the public and private sector. Thus far, little research has been done to make these factors explicit, which is why this research will be useful information for both Aruban parties and international partners (such as the Netherlands) when evaluating the Aruban policies.
which proves that the company’s management has followed a course in for-profit sustainability (Arina, 2016).
Furthermore, instead of the customary 40% import tariff, Aruba has a 2% tariff for certain sustainable products, such as LED lights and products with an energy star label. Besides the tax system, the current policy scheme mainly relies on outside innovations or intrinsic motivation from the tourism sector (Green Deck Aruba, 2015).
Moreover, the government has adopted some laws to decrease environmental impact. Most of them are relatively basic and include rules such as the prohibition of throwing waste in the ocean. However, in 2017 the government adopted a generally unpopular law that all plastic bags were banned from the island, as they formed too much of a strain on sea and land the life, as it is not biodegradable (Aruba Overheid, 2016).
A disincentive on sustainability has been laid upon the tourism sector by the energy net operator, Elmar. Together with WEB, Elmar is part of the government-owned Utilities NV Aruba, which has a monopoly on all energy production and transmission on the island. Before March 2016 it was not allowed for households and private companies to have solar panels, until Elmar introduced the “Elmar Solar Policy”, which introduced solar panel limits for private and corporate properties. A private property can have solar panels with a capacity up to 10kWp, whereas for corporate properties the limit is 100kWp. The reason behind this policy is that the energy industry on the island argues that it will not be able to guarantee the stability of the net with the variable demand that comes with increased use of private solar panels. This basically means that too large of an increase in energy privately produced by solar panels will decrease the revenue for Elmar and WEB to such a large extent, that they will not be able to supply a sufficient amount of electricity at its peak level (during nights/a cloudy day) (Elmar, 2016).

UAUCU Student Research Exchange Collected Papers 2018
90
found that these types of hotels distinctively differ from each other in the way environmental innovation is decided. Generally timeshare hotel can fall either under low- or high rise, but in this paper it will be treated as a separate category due to its unique characteristics.
The supply side factors (firm specific and technological push), will be discussed separately per subdivision of the tourism sector, as various industries influence the adoption of environmental innovation activities in a different way. This will lead to lead to two types of conclusions. Firstly, the article will be able to deduce to what extent the existing model fits the Aruban context and whether small alterations need to be made. Secondly, the analysis section gives rise to several policy suggestions for the Aruban government, as to how to influence the tourism industry as efficiently as possible.
Analysis
The following section will assess the specific influence of each of the determinants of eco-innovation on the Aruban tourism industry, as designed by Horbach, Rammer and Rensing (2012). At first, the categories will be introduced, after which the supply side-, market pull- and regulation push and pull effects will be elaborated on.
Supply side factors
The following section will elaborate on the subdivision’s characteristics of each of the aforementioned categories, after which the relative and specific importance of the supply side factors will be discussed.
High rise hotelsThe name ‘high rise hotel’ originates from the literal height of the building. The hotels are generally more than four stories high. The hotels can be all-inclusive, but this is not the case for all. All high rise hotels are part of a chain and/or its eco-
The data collection has followed a qualitative method, namely semi-structured interviews. Eighteen people from tourism companies on Aruba were interviewed. The interviewed enterprises include hotels, restaurants, water sport companies and transfer and tour corporations. The participants hold a wide range of positions in these firms, as many businesses have a different hierarchical structure in the decision making of eco-innovation. Positions of the interviewees include (assistant-)managers, chief engineers, certification managers, public relations, human resources, sustainability managers, quality managers, energy consultant, maintenance manager and in the case of very small companies senior employees. The selection did not take into account whether or not the company has engaged in environmental innovation activities. In category at least two companies were interviewed. The sampling method followed a random approach, although due to the small scale of the island in some categories (almost) all relevant companies were interviewed.
The semi-structured interviews were prepared in order for all the factors that influence the implementation of eco-innovation to be touched upon, whilst leaving space for suggestions and new interpretations from the interviewee. However, sometimes the interviews deviated from the predetermined structure to be able to either ask the participant to further elaborate on certain topics, or to omit certain questions, when those had already been answered.In order to come to adequate conclusions, the results have been thematically analysed by putting the answers in the context of the model designed by Horbach, Rammer and Rensing (2012). The way in which the Aruban context fits the model will be discussed in the following section by evaluating each determinant individually, and when appropriate the categories of the tourism sector will be analysed separately. The categories made are high rise hotels, low rise hotels, timeshare hotels, restaurants, water sport companies and transfer and tours corporations. The distinction between hotel types was made, because during the research it was

UAUCU Student Research Exchange Collected Papers 2018
91
innovation activities, all high rise hotels believe that sustainability will be cost saving in the end. However, the high initial investment and the complexity of the innovations that have to be done, generally do not fit the orders received from the international chain. Thus, looking at the environmental innovations done in the high rise hotel sector, one can see that the cleaner production technologies implemented require a relatively small investment, and the return of investment period is short. When looking at the end-of-pipe innovations, all are reliant on outside parties having come to the hotels to request their help. This shows that the hotels did not have to do research themselves, but were just able to follow the environmental innovation suggested by the outside party. Besides that, these eco-innovations also require a low continuous investment. Therefore, it can be concluded that an important determinant on whether an environmental innovation is implemented is the return of investment period. This also confirms the results of Reid and Miedzinski (2008); many hotels do not want to make a high initial investment, even though they believe it is cost saving in the long term.
Another important supply side factor is the education of personnel. Some of the high rise hotels confirmed to have given their personnel training in sustainability, but amongst all there is the perception that although the staff should receive information to implement environmental innovation, the highly complex nature of these innovations make it ideal for a top down approach. However, the hotels that have given their personnel training acknowledge the spill over effect of education by saying that some of their staff has successfully halved their energy bill by implementing material learned from the training in sustainability.
Networks have been identified as another determinant of large influence on eco-innovation. The high rise hotels are ambiguous in their assessment of the strength of informal networks on the island, as half of the participants argued that although their actions are defined by their
innovation policies are decided by a larger international management concern. This means that the owners do not live on the island, and are primarily American or Spanish. These hotels are also located next to each other, and they can be characterised as large businesses.
The environmental innovation efforts of these companies are generally limited. However, they do include donating used cooking oil, recycling trash with EcoTech, using LED lights, recycling beer bottles, using recycled paper, installing aerators in faucets and showerheads, using solar boilers, giving leftover food to the pig farm, adopting an energy management system (EMS), and eliminating foam cups. These environmental innovations are mentioned by at least two of the high rise hotels, so the above list does not include all innovations, and not all firms have implemented all of these. The innovations can mainly be categorised as end-of-pipe, but also include a few cleaner production technologies.
The ownership structure of the high rise hotels make it a difficult place for eco-innovation to thrive due to various reasons. First of all, because the hotels are part of a larger chain, eco-innovation policies are set on an international scale. This top down structure limits the firm’s potential to creatively come up with solutions unique to the Aruban context. The eco-innovation goals for the coming years are sent to the management and chief engineers each year, which limits the creative potential of the firms to come up with a solution that fits the Aruban context. This structure results in the international organisation exempting the Aruban hotel from certain measures, such as properly recycling waste, because it is not possible on the island to do so. In the end, this means that the Aruban hotels are generally less sustainable than their mainland counterparts, due to a culture of exempting, and disincentivising overachievement.
Furthermore, following Reid and Miedzinski’s (2008) found gap in (dis)incentives for engaging in environmental

UAUCU Student Research Exchange Collected Papers 2018
92
and drip irrigation from collected rain. As one can see, these eco-innovations are a mix of both reactive and preventive measures, and as a part of the preventive innovation there is also a mix between the more complex cleaner production technologies and end-of-pipe innovation.
The fact that the owners of the low rise hotels commonly have roots on the island results in a different sense of responsibility. The owners profit directly from their own eco-innovations, as their own living situation ameliorates from innovations in for example waste management. Besides that, the size of the company (not small, but still independent) leaves room for investment in education and cleaner production technology, whilst not being hindered by the size of the company.
Similar to the high rises, the low rise hotels expect sustainability to be profitable once implemented, but also acknowledge the high investment that needs to be done due to the complex nature of the innovations. Moreover, the biggest barrier for two of the interviewed low rise hotels to implement new innovations is the difficulty and risk associated with integrating outside innovations to the Aruban context. As the economy is focused on tourism, and there is a limited amount of technological knowledge and innovation on the island, all new environmental innovations need to be imported, mostly from the United States. Obviously, the circumstances for solar panels and irrigation systems are different on Aruba than the country they were designed in.
However, when looking at the eco-innovations done by the low rise hotels, we see that contrastingly to their larger counterparts, these businesses have decided to implement cleaner production technologies. This can best be explained by three factors, one of which has to do with the market pull determinant, which will be discussed later. Besides that, due to the ownership structure, the perceived gains are not only financial, but also an ameliorated living situation.
international chains, local contact is limited. The other half does make use of the networks on the island, by observing an innovative technique when it has been successfully implemented by another hotel. This relates to the fact that the high rise hotels do not see themselves as the initiators of environmental innovation, they expect the change to come from outside, i.e. the government, third parties or similar hotels. This can best be shown by an example: one of the reasons that most of the high rise hotels are not looking into solar panels is that it is seen as a risky investment, as the technology has not yet been tested for a significant amount of time on Aruba due to the block by Elmar. Factors such as a lot of salty wind and bright sunlight on the island cause insecurity about the length of return of investment. The high rise hotels generally do not see themselves as pioneers and are waiting until it is shown to be profitable in another company.
Low rise hotelsIn contrast to high rise hotels, low rise hotels are never more than four stories high. Generally, these hotels are not part of a chain, and are owned by a single family or person. The owners are either Dutch/Aruban or American, and most of them have in common that they (used to) live on the island. Besides that, the larger part of these hotels have a specific person in charge of sustainability (which is often combined with another task). The companies are placed in the near vicinity of each other, and can best be characterised as a medium size business.
These types of hotels are usually more engaged with environmental innovation. Eco-innovations include the same ones as the high rise hotels, and are moreover comprised of solar panels, paper straws instead of plastic straws, a sustainable purchasing policy, more efficient air conditioning, toxic free paint, elimination of single use plastic cups, sensor lights, sensor taps in the toilet, efficient toilets, an electric car, participation in the monthly beach clean-up, vegetation design that does not need a lot of water,

UAUCU Student Research Exchange Collected Papers 2018
93
has resulted in a prolonged return of investment period, as the relative gain of producing for example clean energy by solar panels has decreased vis à vis electricity of the WEB.
Timeshare hotelsTimeshare hotels can be either low- or high rise, and are mainly characterised by the ownership structure. Individuals can buy a week or two of holiday in the same hotel each year, and are thereby fractional owner of the entire hotel. The owners are represented by a board that decides the future strategy and investments of the company. The number of owners with a vote can reach up to more than 7000 people, who are generally largely American. The timeshares are spread out over the west coast of the small island state.
These hotels generally have a limited interest in eco-innovations, and have a combination of low- and high rise environmental innovations, such as more efficient air conditioning, a sustainable purchasing policy, LED lights, leftover food and cooking oil donation and waste separation with EcoTech. Although these companies have both end-of-pipe innovations and integrated cleaner production technologies, the latter can be categorised as less complex than the low rise hotel innovations.
The unique ownership structure of timeshare hotels results in an interesting effect, namely that policies set by the owners directly affect the same people when they are consuming the service supplied by the hotel. The people responsible for sustainability in these companies therefore also acknowledge that there is little room for investment, as a low price paid for their room is a priority of the owners. Each year the plans for the coming year have to be presented and approved by the board, and investments of a low amount and short return of investment periods are generally approved. The board of the timeshare owners also does not allow for risky investments, and the businesses therefore wait for other pioneers to initiate new eco-innovations.
This results in the spill over effect, that is associated with eco-innovations, being partially internalised. Moreover, the fact that low rise hotels function as pioneers when implementing new technologies to the island, increases the motivation to take risk with environmental innovations, as successful innovations might be implemented all across the island, which increases societal gains. Interestingly, the low rise hotel chain with foreign owners on the island does not identify with the idealistic reasoning, and argues to solely engaging in environmental innovation activities for cost saving. This strengthens the statement that origin of the owners is of influence for eco-innovation.
The last reason immediately links to the factor of networks, which are regarded as being strong in Aruba. The low rise hotels are not afraid to function as pioneers, due to the aforementioned reasons, and are open to share their eco-innovations with the competition, which makes patent law regarding environmental innovations redundant. The openness of these businesses largely links back again to the owners, who profit personally when other (larger) hotels implement similar practises.
In most of the interviewed low rise hotels, the education of the personnel forms an important part of the sustainability policies. Comparably to the high rise hotels, there is a large positive externality to training one’s staff in environmental innovation. One of the hotels even allows the personnel to take their waste to the hotel and recycle it there, in order to increase awareness. However, still the perception is that eco-innovation is most efficiently done from a top down perspective due to its complexity, the educated staff had only come up with a couple of minor suggestions.
Lastly, another barrier again relates to the return of investment period of the eco-innovation. In the last couple of years, oil prices have plummeted, which directly affects the price of electricity of the WEB, as most is produced with either heavy fuel- or light fuel oil. The lower price of energy
UAUCU Student Research Exchange Collected Papers 2018
94
deciding to include environmental innovation in their business planning. American (fast-food) restaurants that have come to the island acknowledge that their entire sustainable policies are decided upon by the franchise. The only time a differentiated guideline was initiated occurred after the plastic bag ban in 2017, when corporations were not allowed to hand out single-use plastic bags anymore. On the other hand, restaurant chains that originate from Aruban owners are more willing to invest in environmental innovation, which relates back to the partial internalisation of societal gains discussed in the low rise hotel section.
Contrastingly to the hotels, all restaurants perceive eco-innovation to be more expensive and require a larger investment, hence there is no financial incentive to engage in those type of activities. As one of the participants said: “Often when you talk about sustainability, it is more expensive or more work.” This perception can best be explained by looking at the types of innovations done by the restaurants, which mainly include end-of-pipe innovations. The reason for the restaurants to still initiate environmental innovation is the large direct effect of their policies; for example a plastic straw blowing in the sea can partially distort ecosystems. Interestingly, in their case, the spill over effect of their innovations was large enough to commit to higher costs.
None of the interviewed restaurants trains their personnel in sustainability, as it is not seen as a priority within the business. Besides that, networks are not seen as strong on the island, and not used as a means to come up with ideas for environmental innovation. The limited interest and low priority of environmental innovation seems to be largely due to a lack of knowledge of more complex cleaner production technologies, which can be cost saving. One of the restaurants acknowledged that every year a list is given with potential innovations, and the main motivator when deciding on which ones will be implemented is the return of investment period and potential gains.
Again, environmental innovations implemented are expected to be cost saving, but as mentioned above, a high investment disincentivises firms to engage in environmental innovation activities. The timeshare hotels also mentioned the increased safety of eco-innovations to be the reason for implementing them, as their sustainable purchasing policy keeps them from buying for example toxic cleaning products.
The interviewed timeshare hotels do not invest a large amount in trainings that increase awareness on climate change, as it is believed by all that a top down approach is more efficient and successful in the case of eco-innovations. Besides that, the perception generally is that networks on the island can result in fruitful collaborations, as one of the participants said: “everyone just wants the best for their children.”
RestaurantsThe restaurants have a wider variety of characteristics and are therefore less homogeneous in their adoption of environmental innovation. The ownership structure can range from an American franchise to a single Aruban owner or family. A restaurant can be categorised as a small or medium business, whilst a larger chains of restaurants can either be medium or large.
The restaurants are generally at most limited in their adoption of eco-innovation, as some are using paper straws, purchasing biodegradable doggy boxes and bags, recycling glass bottles where possible, donating organic waste and separating trash for Ecotech. However, there are also restaurants that have only changed from plastic to paper bags, as was mandated by the recent law. These measures can chiefly be categorised as preventive end-of-pipe innovations.
Similarly to the hotels, it can be observed that the origin of the owner, and whether or not the person and/or organisation are residents on the island is of crucial importance when

UAUCU Student Research Exchange Collected Papers 2018
95
innovations is low, and when being asked to suggest new environmental activities that could realistically be implemented, none was able to come up with an answer.
Transfer and tour corporationsTransfer and tour corporations are companies that can provide airport transfers, do bus tours around the island and the national park (Arikok), and offer various other activity services. There are various small companies that are active in this sector, and one large corporation. The companies are generally Aruban owned, with the owners currently living on the island and operating the business.
These businesses have started to adopt eco-innovation policies, but their efforts thus far have been limited. The environmental innovations done include clean ups in Arikok, limitations on water bottle usage, digitalisation of their systems, reef cleaning and organisation of a lion fish hunting tournament. The innovations can be characterised as both preventive and reactive measures, with more end-of-pipe and reactive procedures having been implemented. The transfer and tour sector is at the start of its energy transition, but feels limited by the outside framework. For example, although the small size businesses would like to buy electric cars and buses, they argue that there only is one electric luxury car model available, and no affordable electric buses. Additionally, in order for the electric cars to be profitable, solar panels need to be placed first, due to the high price of the energy supplied by Elmar, which makes the initial investment too large for the smaller companies.
In the interviewed companies, the personnel had received a basic training in sustainability, and although it did not result in more environmental innovation. These businesses also mentioned the large spill over associated with education. Networks were perceived as potentially strong on the island, but the companies did not make use of them, as they did not see any use in exploiting the networks.
Water sport companiesAs stated in the Aruban context section, water sport companies have been protected by law in order to stimulate local small scale entrepreneurship. The businesses are generally owned by an Aruban or South American owner, living on the island. Almost all of these companies can be characterised as small businesses, and they are located in the 40 appointed water sports areas as regulated by the government.
The engagement in environmental innovations is very limited, but the eco-innovations that have been adopted include reef and beach clean-ups, hunts for lion fish, recycling glass beer bottles where possible, and using a solar panel. Although all types of eco-innovation are represented, there seems to be a larger emphasis on reactive measures in these companies.
Due to the small scale of the water sports companies and the low complexity of the businesses, there is generally not anyone educated in the corporation to deal with sustainability. The innovations done yield a direct result, as they are reactive, or are merely practical in nature; a solar panel is necessary to generate energy as the beach is not connected to the grid.
Moreover, since the new beach policy was adopted, there has been an increase of water sport companies in the designated zones. This has resulted in smaller profit margins, and henceforth little room for investment in sustainability. Besides that, the owners make their living directly from the profits made by the business, and are therefore less incentivised to invest part of their personal income in order to become more sustainable.
Due to the low complexity and small size of their business, the personnel is not educated in sustainability, and there is no usage of networks amongst each other to inform on eco-innovation. Therefore, the knowledge of potential

UAUCU Student Research Exchange Collected Papers 2018
96
is the effect of these certifications on eco-innovation. There seems to be a differentiated effect as they attain more prestigious rankings within these certifications. At first, when the companies lack knowledge and are overwhelmed by the complexity of environmental innovations, the certification organisation can help give insight and suggestions about what is possible for the type of firm to achieve. However, once companies reach a higher ranking, they can be disincentivised due to a sense of achievement that comes with the rank; the certification becomes a goal in itself. Because this hypothesis is not quantitatively proven, more research should be done on this aspect, as well as the differentiated effect of each of the certificates.
Regulation push- and pull factorsWhen asked whether the government or the private sector is responsible for initiating the energy transition, the general perception was that the government should initiate and force the private sector to be sustainable. As one of the participants stated: “If we are a little bit fair, it should be the government.” The companies that claimed that the private sector should be responsible, argued that the government should still supply the framework (waste recycling) for a sustainable society. Therefore, it can be concluded that regulation is also an important determinant in the Aruban tourism sector.
Hard regulationInterestingly, out of the 18 participants, 6 were convinced that the government had no CaC, tax, or subsidy policies in place to fasten or block the energy transition and help foster environmental innovation. The rest of the companies knew about the differentiated import tax and/or the solar panel restrictions. Out of all companies, only two (of which one did not qualify) knew about the tax reliefs related to certificates. All of the companies said that the governmental regulations did not incentivise them to engage in environmental activities.
Due to the large difference in size of these companies, an interesting observation can be made of the effect of size on eco-innovation. Although larger companies have more room for investment, and can implement a single eco-innovation in several sections of the company, thereby decreasing the return of investment period, small companies are more agile in their decision making processes, and can adjust their strategy more abruptly. Therefore, the effect of size on environmental innovation remains ambiguous.
Other supply side factorsThe following supply side factor has not been mentioned in previous literature, as they might be unique to the small island state- and/or tourism industry context.
CertificatesThis additional factor can already be noticed when looking at the policies set by the government, one of which says that hotels may be eligible for tax reliefs if they “are in the possession or at least prove that it has started the process of acquiring an earth check certificate or a similar certificate (a certificate of the lowest category)”. Certificates are something that tourism companies (hotels and transfer and tour companies), can apply for. Corporations pay a fee, and in return each (couple of) years someone from the certification organisation comes and decides if and which category of certification the business qualifies for. Besides that, the companies get access to software and-, training programmes and get assigned a specific person that helps the organisation with the transition to become more sustainable. Lastly, once having acquired a certification, the hotels will be listed on the certification website ranked by category. It is allowed for hotels to have more than one certification at the same time.
The most common certificates in Aruba are Earth Check, Travel Life, and Green Globe. Tourism companies disagree about which of the certificates is the strictest and most difficult to acquire. Most interesting for this research

UAUCU Student Research Exchange Collected Papers 2018
97
of electricity throughout the day, and some even have generators in order for the energy demand not too fluctuate too much throughout the day.
Soft regulationThe last barrier of the hard regulations has resulted in a large distrust in the government by companies in the tourism sector. The basis of the perceived reason for the solar panel policy lies with the large public debt of Aruba. As the Aruban government is under supervision by the Caft, expenditure needs to decrease, and income should either stay stable, or increase. The revenue from the natural monopoly of electricity on the island is an important part of the government’s revenue. Therefore, the tourism companies argue that the government has little to gain from decreasing the energy demand due to more efficient processes and solar panels, as a decrease might lead to an even larger public debt.
Moreover, conflicting policies by the government have been mentioned to be a large disincentive for firms to engage in environmental innovations. Besides the aforementioned alleged conflict of interest, the government has announced that oil refinery will reopen (although people are not sure whether this will actually happen), recycling opportunities continue to be lacking, and most of the wetlands on the west coast have been replaced by hotels in the past two decades.Additionally, tourism corporations have argued that although the government has installed some decorative policies, it is afraid to take unpopular measures. This might be explained by the small island state context, which results in a different relation of the government towards the population. Governmental officials generally have much more informal contact with their voters, as they might encounter a large part of them in day to day life.
Lastly, as has been stated in the theoretical framework, the perception of future regulations is an important determinant of eco-innovation. In the Aruban context,
When asked what policies could incentivise tourism companies in general to become more sustainable, most participants argued that either taxes or subsidies would help most. Some of the low rise hotels were even willing to pay extra by means of a tax, if it meant that the entire industry would become more sustainable. Two of the high rise hotels also argued that a tax would be most effective, as it would allow them to come up with a policy that did not follow the international standards set by the franchise. The most mentioned example of a tax that incentivised sustainable behaviour was that of the tipping fee for waste: when companies recycle their waste with EcoTech, they pay a fixed and variable fee per tonne. Participants stated that the implementation of this tipping fee dramatically decreased their waste, as reducing waste suddenly had a monetary value.
However, two other policies were mentioned that have disincentivised firms to eco-innovate. First of all, the hotels argued that the beach policy reduced the value of their product in two ways. As each day, Aruba’s harbour hosts one or two cruise ships, cruise ship visitors enter the island and go to the beaches. Due to all beaches being public, on some beaches all seats are taken, so the hotel tourists are not able to secure one. Besides that, due to water sport companies being allowed on almost all beaches, gasoline and diesel is dropped into the sea. This deteriorates the quality of the sand, and thereby decreases the value of the beach for the hotels. These two measures have made the hotels argue that the lower value of beaches leaves less space for investment in their budget for investment in eco-innovations.
The second disincentive for tourism companies is the solar panel policy instated by Elmar (a semi-public company). For many, the limit is set too low, which makes the initial costs too high, and therefore the return of investment period is too long. When being presented with the stability of the net argument, companies with energy management systems argued that they can guarantee a stable demand

UAUCU Student Research Exchange Collected Papers 2018
98
is only one luxury electric car model available. And as the consumers often want a specific brand car, which does not offer an electric model, the companies are forced to supply the gasoline brands requested.
On the other hand, there is another customer group that expects sustainability from the tourism sector. These consumers have been described as largely European, with many of them staying in low rise hotels. Their willingness to put more effort in being sustainable is expected to stem from the large percentage of return visitors, as some low rise hotels see more than 50% of their visitors come back each year. For these customers the perception of future holidays incentivises them to invest some time and/or money in being more environmentally cautious. This immediately relates to one of the reasons why low rise hotels are less afraid to be the pioneers in sustainability; their consumers expect sustainability, and appreciate any progression of environmental innovation when they return each year. The companies that target this customer group therefore believe that they are partially dependent on the state of the island. As one of the low rise hotel participants said: “We are not in the tourism industry, we are in the nature industry.” However, companies do agree that solely being sustainable does not incentivise customers to pay a premium price. If sustainability is part of the brand, such as wellness, visitors might be willing to pay extra.
An exception to the previously sketched profiles is that of the timeshare hotels, that are both controlled by their customers and at the same time the owners of the timeshare rooms. Needless to say, the market pull factor is of the utmost importance in this sector, as the tourists directly approve or deny plans for eco-innovation for the coming years. In Aruba, this group can be characterised as largely retired individuals, that do not want to worry about sustainability when being on the island. Besides that, the board of the timeshare holders decides on the budget per year, and there seems to be a larger interest in decreasing
the tourism sector accuses the government of being too focused on being re-elected each four years, and therefore there is a large variation in policies in the longer run. As sustainability does not yield significant tangible results in the short term, corporations hope, but do not believe, that the government will impose significant environmental policies in the years to come.
Market pull factorThe last of the determinants of eco-innovation is the market pull factor. Although having been defined as the least important factor, in the tourism sector the demand side can play an important role in deciding the course of a company. As “the customer is king” was probably the most heard quote in all of the interviews, it can be said that consumers can both drive and block eco-innovations. In the Aruban tourism sector, the general perception is that “Aruba is not and will never be a real eco-destination, such as Belize and Costa Rica.”
The consumers can be split up in three groups, one of which drives environmental innovation, whereas the others disincentivises firms to do so. First of all, the most important target group on the island is the ‘all-inclusive tourist’, generally American or Spanish, who are more interested in luxury than sustainability. For example, generally all hotels have limits on their air-conditioning, but some tourists ask to remove those limits, even when explained they are implemented for environmental reasons. Instead of incentivising the tourism industry to become more sustainable, it works the other way around: the eco-friendly tourism companies attempt to nudge the behaviour of these tourists in such a way, that they become more sustainable without noticing. Although generally tolerating environmental friendly behaviour, these tourists would rather not have it affect their behaviour. Companies can be blocked in their environmental efforts in several ways. For example, as mentioned before, a big limit for transfer and tour companies is the perception that there

UAUCU Student Research Exchange Collected Papers 2018
99
on the way the strategy of a company is decided upon.
However, the education of the personnel, which had been mentioned as an important factor of eco-innovation, is perceived as hardly of influence. This contrasting finding compared to previous literature might be caused by the nature of the industry; many jobs within the tourism industry have a limited impact on the environmental footprint of the company, as a small percentage of the corporation is responsible for the larger part of the decisions on water, waste and energy.
Moreover, the market factor plays a limited role on environmental innovation. When there is influence by the maret, it generally functions as barrier. Due to the large size and many different potential customer segments, firms can simply target a different group when deciding to become less or more sustainable. An interesting aspect to the tourism sector is that firms are dependent on education policies of other countries in the development of this process. The general perception is that the consumers will demand more sustainability in the long term, but this is not a reason (yet) for firms to increasingly engage in environmental innovation.
Although the Aruban tourism industry still sees the government as the most important factor in determining their choice for eco-innovation, the perceived absence of strong measures has not stopped the corporations from implementing sustainable practises completely. This might lead one to conclude sustainability is profitable, or that CSR plays a big role in the small island state context. I would rather cynically conclude that this could be deduced by a simple cost-benefit analysis.
Again, much can be concluded when looking at the ownership of a company. If a business is part of a franchise, the course of the chain is decided by a cost-benefit analysis made for the entire chain, regardless of firm specific aspects,
the price for the rooms, which limits the investment budget per year. This is a large barrier for timeshare hotels to engage in environmental innovation activities.
Discussion
This paper has attempted to identify the drivers and barriers of environmental innovation in a small island state context. This has led to several thoughts that will be formulated in the following paragraphs. Firstly, the conceptual contribution of this research will be discussed, with suggestions for potential research. Thereafter, several measures will be proposed for the Aruban government to stimulate environmental innovation further in the country.
Determinants on eco-innovation in small island state contextFirst of all, as one might conclude from the analysis section, although the model designed by Horbach, Rammer and Rennings (2012) might seem simple at first glance, in practice it leads to a complicated framework of factors that influence a decision for a company whether to engage in eco-innovation. Most interestingly in the Aruban context is that one is able to observe the working of these factors when governmental policies are limited. This allows the paper to make hypotheses on concepts such as corporate social responsibility (CSR), or whether simple economic equilibria still rule the decision making processes of firms in the private sector.
The model utilised in this research mentioned four determinants of eco-innovation; firm strategy, market, regulation and technology. In this research no reason has been found to add another factor to the list, but extra subthemes within the determinants have been suggested to increase the exhaustiveness of the model. Factors such as certificates for sustainability, nationality of the owners and the ownership structure have shown to have a large effect

UAUCU Student Research Exchange Collected Papers 2018
100
perceived to have blocked environmental innovation more than incentivised it. In order for a government to efficiently stimulate eco-innovation, barriers should be removed, and drivers should be stimulated. In the following section a set of policies will be proposed that attempts to do so.
First and foremost, although ambitious, the government should make a plan to detach itself from the energy sector, and privatise it. Although the energy sector is a natural monopoly on the island, and there is a danger of losing control over it, a private company (helped by taxes) will have more incentives to come up with cleaner and more efficient sources of energy on the island. Moreover, it would allow the government to make more independent choices on sustainability on the island, as there would be no more conflict of interest. Besides that, this would increase the faith of the companies in the government, which has been identified as an important determinant of eco-innovation.
Related to this, the government should allow companies to have solar panels with a capacity larger than 100kW. However, due to the stability of the energy net, this should only be done in close cooperation, and if corporations can show that they are able to utilise a stable amount of energy. Moreover, businesses should have emergency plans ready for days when there is less sun (E.G. generators), in order to retain a stable energy demand.
On the other hand, the government should take more ownership of the waste management of the island state. This could be done in various ways: Firstly, the government could turn to CaC measures, by setting rules for waste management. A downside to this is the affordability of the processing waste by adapting this type of regulation. Another option may be stimulating EcoTech through either subsidies or tax reliefs. Moreover, the government could provide the facilities to manage waste more sustainably, which is costly as well. There are many more options for waste management on the island to be more sustainable,
probably due to an increase in control. The unique small island state context therefore results in unfitting policies, and a decrease of sustainability in the hotels based on Aruba.
If the company is part of a smaller chain, and owned by a smaller group of individuals (for example a family), nationality plays an important role. This is due to the fact that for a non-Aruban owner, the cost-benefit analysis simply consists of the return of investment period. For an owner that resides on Aruba, there are a lot more factors that are included in the decision making process. Besides the profitability of an investment, the future state of the island has a direct impact on the owner and his/her family. Moreover, due to the small island state context, the population is able to hold an owner directly responsible for the policies implemented in his/her company. However, not all companies with Aruban owners are sustainable, which can largely be explained by the factor of education. If the management of a company is not fully educated in sustainability (its implications for the island, the potential eco-innovations done by the firms, consequences of measures taken by the company), it will not be able to make a full cost-benefit decision on whether to engage in environmental activities. Nevertheless, although regarded as less important, idealism also plays a role in the relative value put on sustainable efforts in the cost-benefit analysis. Therefore, I would conclude that eco-innovation on Aruba is largely determined by the ownership structure, nationality of the management, education of the management and a touch of idealism. Note that not all factors have been discussed in this section, this is a mere overview of the most important ones to the Aruban context.
Policy proposalIn the analysis section, it can be seen that Aruban companies in the tourism sector see governmental regulation as the chief determinant of eco-innovation. However, although the government has implemented certain policies, it has been
UAUCU Student Research Exchange Collected Papers 2018
101
further on the island. Lastly, as was found in the analysis, most corporations do not know all policies implemented by the government. Transparency needs to be increased in order for the measures taken to be effective. A way to do this, is to publish a yearly sustainability report, to be sent to all tourism companies, which would include an overview of all policies regarding sustainability and an update of all subsidized innovations done by a pioneer, with the invitation to come look at the results. The expenditure of these policies should be low; therefore debt does not have to be increased when implementing the measures.
These policies should be established in a long term plan, independent from the political business cycle. This is due to the important role that policy expectations play in the model and the perception of companies that policies might change with each government. To bypass these problems, a 2030 (as stated in the Paris agreements) plan should be made in cooperation with all political parties and the private sector to guarantee the continuation of the plan.
Suggestions for further research
As this research is merely exploring the thematic factors of influence for the tourism sector to engage in environmental activities, more specific research needs to be done to be able suggest a more specific policy proposal. First of all, the effect of proposed taxes and subsidies should be quantitatively researched, in order for the government to implement specific policies. Additionally, the financial consequences of a detachment of the WEB need to be analysed, with potential solutions to fill the gap in the budget. Besides that, more research is needed in a sustainable solution for waste management on small island states, as this persists to be a complex issue for many countries.
Lastly, more research should be done on the influence of eco-certificates on the behaviours of companies. In order to differentiate between all the possible certificates, a ranking
some more costly and/or efficient than others. It is of vital importance that this should be a high priority of the government, in order to lessen the amount of conflicting policies and to increase the possibilities for tourism companies to implement environmental innovation.
As finances continue to play the most important role in the decision making processes of firms, policies have to be put in place in order to incentivise environmental innovation. However, one also has to take into account the large public debt. Therefore, the following policies will all fall under the principle of direct cash flows; money should be transferred directly from unsustainable to environmentally conscious businesses.
Therefore, the first cash flow policy proposed would be a (higher) tax on water, waste and energy consumption from the WEB. Currently, the price of the tax on water and energy is integrated in the price of the product, due to the ownership of the energy sector. However, without the WEB in the government’s hands, income needs to be generated from energy and water. This would directly make the relative return of investment period of eco-innovations shorter than other innovations, which would incentivise firms to become more sustainable.
The other side of the financial policies would consist of three parts. First of all, because a subsidy for all environmental innovations would be too expensive, a cheaper alternative is proposed, eco-innovation on Aruba is extremely hindered by the perceived risk of implementing outside innovation to the island’s context. Pioneers that take risk in environmentally innovating a new technology and/or product should be compensated in the form of a subsidy for their risk. This will give an accelerated effect in combination with the second part of the policies. As found in the interviews, networks on the island are strong, due to the strong sense of community. Therefore, money should be invested to strengthen and utilise these networks even

UAUCU Student Research Exchange Collected Papers 2018
102
on whether CSR played a crucial role in the implementation of eco-innovation in small island states. This paper largely rejected this hypothesis, by arguing that ownership structure, nationality of the owners and education of the management are more important determinants of the cost-benefit analysis of firms when deciding on corporate strategy.
These conceptual deductions led to a more practical conclusion, which has been formulated in a policy proposal. The policies include a detachment of the government from the WEB, a less strict solar panel policy, more control over waste management, a higher tax on waste, water and energy, funding for pioneer behaviour, stimulation and use of the strong (informal) networks on the island, and a yearly report on sustainability in the tourism sector. These policies should be formulated in a 2030 plan, in accordance with all relevant (political) parties in order to guarantee long term continuation.
Bibliography
• Arina. (2016). Taxes and Incentives. Retrieved January 15, 2018, from http://arina-aruba.com/doing-business-in-aruba/taxes-and-incentives/
• Aruba Overheid. (2016, November 23). Information campaign to abolish plastic bags launched. Retrieved March 14, 2018, from http://www.overheid.aw/news/news_3809/item/information-campaign-to-abolish-plastic-bags-launched_29092.html
• Ban Ki Moon. (2014). Ban: ‘Island issues affect us all’ - UN Climate Summit 2014. Retrieved March 19, 2018, from http://www.un.org/climatechange/summit/2014/09/ban-island-issues-affect-us/
• BRO. (2014, July). Policy Directive: Spatial Management Beaches. Retrieved March 14, 2018.
• CBS. (2013, January 17). Companies by economic sector and size. Retrieved January 13, 2018, from http://cbs.aw/wp/index.php/2013/01/17/fc2-4-3-companies-
could be made on the effect on environmental activities of each of these, so the government and tourists are able to make more informed decisions.
Conclusion
As small island states are at the frontline of our world’s environmental problems, global measures need to be taken in order to limit the potential repercussions from climate change. Ironically, these island states, such as Aruba, have to deal with more complex environmental issues on a much smaller scale. The problems include sea life preservation, waste management and limiting the carbon footprint. For these countries to overcome the complexity of these issues, a collaboration between the public and private sector is necessary.
Therefore, this research has aimed at identifying the determinants of environmental innovation of the largest private sector on Aruba: the tourism industry. The study has utilized the simple framework derived from the literature by Horbach, Rammer and Rensing (2012) on the determinants of eco-innovation, which are the market pull-, technological push-, regulation push- and pull-, and firm specific factors.
By having interviewed 18 participants from firms in the tourism sectors, 6 categories of companies could be made that have different factors influencing their decision making processes. The categories are transfer and tour corporations, water sports companies, restaurants, high rise-, low rise-, and timeshare hotels. From the analysis, a conceptual and practical conclusion could be drawn.
Due to a perceived absence of governmental regulation, it was interesting to observe that firms still engaged in environmental innovation. Even in the tourism industry, the influence of the market pull factor is limited, yet generally still experienced as negative. This resulted in a discussion

UAUCU Student Research Exchange Collected Papers 2018
103
2017-article-iv-mission• Kahneman, D., & Tversky, A. (1979, March). Prospect
Theory: An Analysis of Decision under Risk. Retrieved May 2, 2017, from http://www.jstor.org/stable/pdf/1914185.pdf
• Kammerer, D. (2009). The effects of customer benefit and regulation on environmental product innovation.: Empirical evidence from appliance manufacturers in Germany.
• Mateu-Sbert, J., Ricci-Cabello, I., Villalonga-Olives, E., & Cabeza-Irigoyen, E. (2013). The impact of tourism on municipal solid waste generation: The case of Menorca Island (Spain). Waste management, 33(12), 2589-2593.
• Mohee, R., Mauthoor, S., Bundhoo, Z. M., Somaroo, G., Soobhany, N., & Gunasee, S. (2015). Current status of solid waste management in small island developing states: a review. Waste management, 43, 539-549.
• OECD (2005). Oslo Manual. Guidelines for collecting and interpreting innovation data.
• Pontogolio, S. (2010). An early assessment of the influence on eco-innovation of the EU Emissions Trading Scheme. Environmental Efficiency, Innovation and Economic Performances. Routledge, London, New York, 81-91.
• Porter, M. E., & Van der Linde, C. (1995). Toward a new conception of the environment-competitiveness relationship. The journal of economic perspectives, 9(4), 97-118.
• Rasmijn, A. (2018). Caft ‘zeer bezorgd’ over Arubaanse financiën. Retrieved March 14, 2018, from https://caribischnetwerk.ntr.nl/2018/02/03/caft-zeer-bezorgd-over-arubaanse-financien/
• Reid, A., & Miedzinski, M. (2008). Eco-innovation. Final report for Sectoral Innovation Watch. Europe Innova. Technopolis group.
• Rennings, K. (1998). Towards a theory and policy of eco-innovation-Neoclassical and (Co-) Evolutionary Perspectives (No. 98-24). ZEW Discussion Papers.
by-economic-sector-and-size/• CBS. (2011). Economic Profile Aruba. Retrieved
January 13, 2018, from http://cbs.aw/wp/index.php/category/business-economy/economic-profile/
• Del Rio, P., Romero-Jordán, D., & Peñasco, C. (2017). Analysing firm-specific and type-specific determinants of eco-innovation. Technological and Economic Development of Economy, 23(2), 270-295.
• Elmar. (2016, March). ELMAR Solar Policy. Retrieved March 14, 2018, from https://www.elmar.aw/sites/default/files/pdf-files/N.V.%20ELMAR%20Solar%20Policy%20English%20Mar%202016%20ver%203.3_0.pdf
• Frondel, M., Horbach, J., & Rennings, K. (2007). End‐of‐pipe or cleaner production? An empirical comparison of environmental innovation decisions across OECD countries. Business strategy and the environment, 16(8), 571-584.
• Government of Aruba (2015, June). Green Deck Aruba. Retrieved January 15, 2018, from http://www.utilitiesarubanv.com/main/wp-content/uploads/pdf/green-deck-aruba.pdf
• Hojnik, J., & Ruzzier, M. (2016). What drives eco-innovation? A review of an emerging literature. Environmental Innovation and Societal Transitions, 19, 31-41.
• Horbach, J. (2008). Determinants of environmental innovation—New evidence from German panel data sources. Research policy, 37(1), 163-173.
• Horbach, J., Rammer, C., & Rennings, K. (2012). Determinants of eco-innovations by type of environmental impact—The role of regulatory push/pull, technology push and market pull. Ecological economics, 78, 112-122.
• IMF. (n.d.). Kingdom of the Netherlands-Aruba: Concluding Statement of the 2017 Article IV Mission. Retrieved March 14, 2018, from http://www.imf.org/en/News/Articles/2017/03/31/ms033117-kingdom-of-the-netherlands-aruba-concluding-statement-of-the-
UAUCU Student Research Exchange Collected Papers 2018
104
• Rennings, K. (2000). Redefining innovation—eco-innovation research and the contribution from ecological economics. Ecological economics, 32(2), 319-332.
• Thaler, R. H., & Sunstein, C. R. (2008). Nudge: Improving Decisions About Health, Wealth, and Happiness.
• Triguero, A., Moreno-Mondéjar, L., & Davia, M. A. (2013). Drivers of different types of eco-innovation in European SMEs. Ecological economics, 92, 25-33.
• Vollebergh, H. R. (2007). Differential impact of environmental policy instruments on technological change: a review of the empirical literature. 7355206

UAUCU Student Research Exchange Collected Papers 2018
105
I might have spent my fall semester in the same time zone as Aruba (Kingston, Canada) already, but that did in no way prepare me for the transition to this One Happy Island. Our first moments were already foreshadowing of the entire trip: rules are irrelevant, Aruba is beautiful, and Eric will never stop talking (and we would not want him to either). This personal statement comes in three parts: a lesson learnt, a wish for Aruba, and endless gratitude.
The biggest lesson I have learnt on Aruba is to stop thinking and talking, and start doing. Preparing is always important, but there is only so much you can do from your comfortably air-conditioned apartment when you have a research project on corals to perform. There is nothing like a good snorkel to reorganise your thoughts and get motivated again, even if it involves you being slightly MIA for 1.5h and some Aruban police agents.
Secondly, if I could, I would tell every Aruban resident about my lesson learnt, because the lack of marine life protection could be fixed if people would stop talking and get to doing. There has been talk on improving marine conservation and establishing a marine protected area for years, but little actual progress seems to be made. I am excited to see what the future will bring for the areas that are currently proposed to become marine nature reserves. I hope TNO coral surveying will finally bring the data to Aruba to make informed decisions on marine conservation, and especially coral reef care. Furthermore, I wish the best of luck to the coral reef nursery on Palm Island, the Marine Park Foundation, the Aruba Reef Care Foundation, Nichole Danser and her students, and every other person invested in improving Aruba’s marine conservation. Thank you for taking time to meet with me and inspire me!
Thirdly, I would not have finished this research project without the help of countless people. First, my research apprentice Lian den Berg, without whom I would not have survived the long days out in the water. Secondly, this research would not have been possible without the help and the materials sent all the way from Queensland, Australia by CoralWatch’s Monique Grol. Then, my supervisor Maarten Eppinga for helping me shape my research into something feasible and fun. Additionally, I appreciate the time Mike Gil took to answer my random questions on marine life. And thank you to Miriam van de Plassche for generously allowing me to visit Palm Island with my research crew. Furthermore, I would like to thank Carlos Rodriguez for managing the apprentice programme and for his endless enthusiasm. I am also grateful for all the passion, love and kindness put into this project by Eric Mijts, Jocelyn Ballantyne and Kitty Groothuijse. And of course, I appreciate every minute we got to spend together as UA-UCU students. Finally, my time on Aruba would not have been the same without kittycat Mickey, may you catch your beloved iguana one day!
Annemieke Drost, University College Utrecht
UAUCU Student Research Exchange Collected Papers 2018
106
1. IntroductionCoral reefs in Aruba provide a range of ecosystem services like fish nurseries, natural land-sea barrier, heritage site and attractor of tourism (Moberg & Folke, 1999; Waite et al., 2014). Aruba’s economy is dependent on the ocean and associated tourism: in 2016 89,3% of the total employment was dependent on tourism (Zanten, van, Lacle, van Duren, Soberon, & van Beukering, 2018). However, as a Small Island State (SIS), Aruba’s marine environment is threatened by climate change. Coral reef health and coverage in the Caribbean has declined by more than 80% since the 1970s due to human disturbances, ocean acidification and rising ocean temperatures (Gardner, Côté, Gill, Grant, & Watkinson, 2003). The severity and frequency of coral bleaching events (the release of their photosynthetic symbionts) have increased (Eakin et al., 2010), resulting in great mortality, and ocean acidification hinders new reef building (Hoegh-Guldberg et al., 2007). Bleaching is a strong coral health indicator because it leads to a lack of energy acquisition and can severely reduce the functional capacity of affected corals (Coral Health Atlas, 2018).
In line with the UN Sustainable Development goals 13 and 14, it is important to take climate action and to conserve life below water. However, there are no marine conservation areas on Aruba and its coral reefs are vulnerable and
practically unmonitored. Considering this lack of data, engaging the local population in a citizen science project would be of value to the monitoring of Aruban reefs. The CoralWatch Health Chart project is a citizen science effort on coral bleaching that has been developed at the University of Queensland, Australia. It is an inexpensive, simple, non-invasive way to monitor coral bleaching and to assess coral health. Implementing this project on Aruba would be beneficial because citizen science results in data collection that would not be performed otherwise. Secondly, citizen science projects engage the public in scientific endeavours in a way traditional research projects cannot, and thus this form of community based research realises more public awareness and call for action for more marine life protection and conservation.
However, the reliability of citizen science data must be verified. Therefore, this research evaluates coral bleaching with the CoralWatch Health chart to determine its value for citizen science monitoring of Aruba’s coral reefs by comparing reefs of varying health statuses. The following questions will be answered: (1) how big is the inter-observer variability in the citizen science based CoralWatch method in Aruba while snorkelling when comparing close-shore, shallow sites of varying coral health and (2) what does this indicate for this method’s potential to be used to reliably monitor coral reef bleaching and health? First, literature is
Coral Health and Citizen ScienceExamining the potential of the CoralWatch Health Chart as a monitoring tool for cor-
al bleaching and health status in shallow, close-shore Aruban reefs
Annemieke Drost

UAUCU Student Research Exchange Collected Papers 2018
107
reviewed on coral health and coral stressors, citizen science projects, and CoralWatch. Then, to establish the reliability and monitoring potential of the Health Chart, fieldwork is performed by letting citizen scientists score the same 20 corals on each close-shore snorkelling site. The Health Chart is expected to be reliable and to have monitoring potential for Aruban close-shore reefs.
2. Literature review
First, this literature review examines basic coral biology. Secondly, coral bleaching and other coral stressors are discussed. After which, literature on the coral health status in the Caribbean and Aruba specifically are evaluated. Then, citizen science projects and CoralWatch specifically are discussed.
2.1 Coral reefs: the basicsCorals are colonial organisms: they are made up of hundreds to hundreds of thousands of organisms called polyps, as seen in figure 1. These polyps range in size from one to three millimetres in diameter (NOAA, 2018a). Corals feed themselves at night by capturing their food with stinging cells, called nematocysts, that come out of these polyps called nematocysts (NOAA, 2018b). Reef building polyps secrete calcium carbonate, which forms a protective cup called a calyx around the polyps (NOAA, 2018a). This reef building is very important, as it creates the structures that are known as corals.
Figure 1 – Coral polyp anatomy (NOAA, 2018a)
The majority of reef building corals have a symbiotic relationship with photosynthetic algae called zooxanthellae that live in their tissue. Together they facilitate a tight recycling of nutrients in nutrient-poor tropical waters. The coral gives the zooxanthellae compounds needed for photosynthesis, and the zooxanthellae provide the coral with photosynthesis products, oxygen and waste removal. As much as 90% of the organic material photosynthetically produced by the zooxanthellae is transferred to the host coral tissue. This is the reason corals thrive in nutrient poor tropical waters (NOAA, 2018c).

UAUCU Student Research Exchange Collected Papers 2018
108
In addition to providing an environment for the zooxanthellae, corals also perform ecosystem services that benefit humans. Corals provide three-dimensional structure and substrate that houses and feeds fish and other marine animals, which are important to the livelihoods of fishers (Moberg & Folke, 1999). Coral reef ecosystems also perform cultural services, like tourism and a sense of belonging for the local community (Waite et al., 2014). They contain great amounts of biodiversity, rivalling with terrestrial rainforests on diversity scales. This biodiversity is important for resilience of ecosystems, for example a diverse reef is better equipped to deal with major catastrophic events like hurricanes. Moreover, the reef has a role as a nursery and general habitat to countless fish species, many of them edible. Additionally, reefs protect and create land, like the limestone rocks on Aruba. They can also dissipate wave energy from storms and tsunamis, which reduces impact on the land (Carilli, 2013). A decrease in reef resilience, for example by coral bleaching, endangers these ecosystem services.
2.2 Coral bleaching and other stressorsCorals and their ecosystem services are threatened by a wide range of stressors, the biggest global one being warming oceans. Due to global climate change, sea temperatures have risen by approximately 1C over the past 100 years, and are expected to increase another 1-2 °C this century. This seemingly small increase, for example due to extremely warm seasons (El Niño), causes great stress for the reef building corals, that are already living close to their thermal maxima. An exceedance of their thermal maxima results in coral bleaching; the zooxanthellae become increasingly vulnerable to damage by light and are released by the coral host. If the temperatures do not go back within desired temperature range, corals do not reacquire symbionts and die in great numbers. Coral bleaching events have been observed since 1980 and they are expected to increase over the next few decades as carbon dioxide levels continue to increase, to an annual occurrence in most tropical oceans
by the end of the next 30-50 years. For the Caribbean, yearly bleaching is already expected by 2020. Corals may adapt to these rising temperatures. However, the current rate of warming is exceptionally fast compared to evolutionary time scales. An adaption like this would take at least hundreds of years (Hoegh-Guldberg, 2017).
Coral bleaching is most detrimental when coral health is suboptimal. Globally, coral health is affected by ocean acidification. Reefbuilding corals need carbonate ions for their skeleton. As atmospheric carbon dioxide levels increase, more carbon dioxide is taken up by the ocean. The CO2 reacts with water to produce carbonic acid. Carbonic acid dissociates to form bicarbonate ions and protons, which in turn react with carbonate ions to produce more bicarbonate ions, reducing the availability of carbonate to biological systems. This decrease in carbonate-ion availability reduces the rate of calcification of marine organisms such as reef-building corals, and ultimately favours erosion (Hoegh-Guldberg et al., 2007).
Corals are also affected by local, anthropogenic stressors like nutrient pollution, increased sedimentation and disturbances by (over)fishing, tourism and industries (Gil & Osenberg, 2010). The main sources of water pollution on Aruba are the Parkietenbos dumpsite, the water and electricity plant (WEB) and the industries and tourist activities along the coastline (Zetten, Meulen, & Brink, 2001).
Even seemingly trivial things, like sunscreen usage, have been shown to negatively impact coral health (McCoshum, Schlarb, & Baum, 2016). Additionally, the reefs are still impacted by the oil refinery (operational from 1925 to 1985 and 1990 to 2012) on the south-eastern coast (C. M. Eakin, Feingold, & Glynn, 1994). The reefs near the refinery are likely still more severely damaged compared to surrounding areas (C. M. Eakin et al., 1994). There are efforts to reopen the refinery again.

UAUCU Student Research Exchange Collected Papers 2018
109
2.3 Coral health in the CaribbeanOver the past 40 years, most complex reefs have disappeared in the Caribbean on shallow (<6 m), mid-water (6-20 m) and deep (>20 m) depths. The loss of architectural complexity coincides with the key events in the Caribbean’s ecological history: “the loss of structurally complex Acropora corals, the mass mortality of the grazing urchin Diadema antillarum and the 1998 El Nino Southern Oscillation-induced worldwide coral bleaching event.” (Alvarez-Filip, Dulvy, Gill, Cote, & Watkinson, 2009). Across the Caribbean basin, hard coral cover, like Acropora, has reduced by 80%, from about 50% to 10%. These corals form the basis for the rest of the reef, and their decline has a big impact on the reef ’s health (Gardner et al., 2003). Additionally, the mass mortality of the grazing urchin in 1983 has led to more macroalgal blooms (Mumby, Hastings, & Edwards, 2007). A combination of loss of structural complexity and increase in algal cover has negative effects on reef health.
Unfortunately, Aruban corals have not been well studied. Curacao and Bonaire’s corals, the two (Dutch) islands closest to Aruba, have been studied in relation to coral bleaching. Bonaire has always had the highest coral cover, architectural complexity, and net carbonate accretion, though the reefs have suffered over the past 40 years. Bonaire also has the highest architectural complexity. The 2010 bleaching event hit Bonaire hard, resulting in a 10% coral mortality. However, the corals recovered quickly to pre-bleaching levels in 2017 due to their proactive management. A high abundance of herbivores prevents a shift towards an algal-dominated reef (DCNA, 2017a). In contrast, the bleaching event had a smaller impact on Curacao. Twelve percent of the bottom covered by reef building coral “bleached” and of those 10% subsequently died (DCNA, 2017b). The reefs on Bonaire and Curacao are likely in a much better state than the Aruban reefs, so the magnitude of the impact of the bleaching event on the Aruban reefs is hard to estimate. If the Aruban reefs are in a worse state than the Curacao
and Bonaire reefs, it is likely that they were hit harder by the bleaching event.
Recently the XL Catlin Global Reef Monitoring project has mapped some of Aruba’s reefs with coral reef imagery (González-Rivero et al., 2016; XL Catlin SeaviewSurvey, 2015). They found struggling coral colonies and associated reef communities, with only 5-8% coral cover (XL Catlin Seaview Survey, 2013a, 2013b). However, there was still a lot of marine life, including soft corals, sponges and smaller reef fish. The abundance of juvenile fish in particular stressed the ecological importance of these reefs (XL Catlin SeaviewSurvey, 2015). This paints a hopeful picture.
2.4 Citizen science researchThis lack of data could be remedied by introducing a citizen science reef health project. Citizen scientists are non-scientists who volunteer their time to help collect or analyse data in a scientific project led by a researcher (Gura, 2013). Citizen science projects are useful for two reasons. Firstly, citizen science results in data collection that would not be performed otherwise, for example due to a lack of time and resources. Citizens can easily perform longitudinal research in their own surroundings (McKinley et al., 2017). This benefit is confirmed by the previously mentioned lack of available data on coral reef health on Aruba. Additionally, they can monitor rare events (Starkey et al., 2017), like sudden bleaching events. Secondly, citizen science projects engage the public in scientific endeavours in a way traditional research projects cannot (McKinley et al., 2017). For example, the Lost Ladybug project asks kids to log ladybug observations, while its bigger purpose is not to monitor ladybugs but rather to “help children become confident and competent participants in science, identifying personally with science, so that we develop a generation of adults who are engaged in scientific discussions, policy, and thinking.” (Lost Ladybug Project, 2018). likewise, having Aruban residents engage with the reef will not just provide more data, but also engage them with their surrounding

UAUCU Student Research Exchange Collected Papers 2018
110
ecosystem. However, the key question is whether data collected by citizens can be reliable enough to analyse trends and answer relevant questions. The reliability of citizen data collection should be tested before programmes are set up (McKinley et al., 2017). Another obstacle to the scientific use of citizen science data is the perceptions of trained scientists. Some have concerns about data quality, like unsuitable study designs, insufficient training of the citizen scientists, and a lack of standardization and verification methods (Burgess et al., 2017). Addressing these issues is vital for citizen science efforts to be properly incorporated in scientific discourse. An example of successful validation is a study on the population variability of butterflies in the UK. Since 1976, the UK Butterfly Monitoring Scheme (UKBMS) has been collecting data on butterfly abundancy. Analysis of these data concluded that variability in species can be deduced from these opportunistic citizen science records (Mason et al., 2018). This shows the potential monitoring value of citizen science records.
2.5 CoralWatchThe appropriate citizen science project for combatting the lack of coral health data on Aruba would be CoralWatch. CoralWatch launched in 2002 after two massive bleaching events following each other shortly in 1998 and 2002. The project’s goal is to stimulate education about coral bleaching together with increasing global monitoring. They use the monitoring network to educate the general public about coral reef ecology, the effects of climate change and environmental stewardship (Marshall, Kleine, & Dean, 2012). They developed their Coral Health Chart in 2006 (Siebeck, Marshall, Klüter, & Hoegh-Guldberg, 2006).
Figure 2 - CoralWatch Health chart (CoralWatch, n.d.-b)
This CoralWatch Health Chart has made coral monitoring as easy as comparing paint chips. The standardised colour reference card requires the observer to match the colour of the coral with one of the hues on the chart (Siebeck, Logan, & Marshall, 2008). Spectrophotometric and photographic colour quantification was used to produce the colour series, which indicates the symbiont density and thus bleaching in the monitored coral. It doesn’t require extensive training and can be used for rapid assessment of corals (Siebeck et al., 2008). The method has been used while reef-walking, snorkelling and scuba diving (Siebeck et al., 2008). Changes in coral colour can be detected by citizen scientists if the change is at least 2 units (Siebeck et al., 2008). In April 2018, CoralWatch had 4902 members who had performed 9969 surveys distributed over 1705 reefs, coming to a total of 207141 datapoints (CoralWatch, 2018b). Between January and April 2018, about 5000 corals have been surveyed

UAUCU Student Research Exchange Collected Papers 2018
111
(CoralWatch, 2018b). Annual Reefblitzes, inspired by Bioblitzes, have also used the CoralWatch Health Chart on the Great Barrier Reef. In October 2016, over 1,100 people collected over 18,000 data points for a range of marine related citizen science programs. In this effort, 1,396 coral colonies had data contributions recorded for CoralWatch, which was a 44% increase on the monthly CoralWatch average (Great Barrier Reef Foundation, 2016).
On the chart, bleaching of coral is reflected in a change of 2 units or more. A reef can be classified as “healthy” (5-6), “partially bleached” (3-4), or “bleached” (1-2) (Siebeck et al., 2006). When testing the health chart, the standard deviation was ± 0.5 when only a single species was used in a laboratory environment, and higher (± 0.59) when there were field conditions with a cloudy sky and rising tide (Siebeck et al., 2006). The initial try-out on an intertidal reef flat of the Great Barrier Reef with non-specialist observers found an inter-observer error of ± 1 colour score (Siebeck et al., 2006). Interobserver variability is the amount of variability, or error, between two or more observers examining the same thing. In this study, that is the variation in scores given by multiple observers to the same coral organism. Low interobserver variability indicates reliable monitoring.
3. Materials and methodsTo assess the reliability and monitoring potential of the Coral Watch Health Chart, the inter-observer variability is established by comparing research sites of varying coral health, based on a baseline measurement. A baseline will be established for all sites by the same researcher to rule out the possibility that the sites are not truly different if no difference is found by the citizen data collectors.
3.1 Research question and sub questions(1) How big is the inter-observer variability in the citizen science based CoralWatch method in Aruba while snorkelling when comparing close-shore, shallow sites of
varying coral health? and (2) what does this indicate for this method’s potential to be used to reliably monitor the coral reef bleaching and health?• To what extent does the observed mean coral colour of
the citizen scientist agree with the baseline? • To what extent can the coral colour be reliably observed
by multiple observers?• To what extent can lightest coral colour be reliably
observed by multiple observers? • To what extent can darkest coral colour be reliably
observed by multiple observers?• To what extent can the coral colour range be reliably
observed by multiple observers?• To what extent can the coral shape be reliably observed
by multiple observers?• How big should colour changes be to reliably be
observed by multiple observers?
3.2 HypothesisThe inter-observer variability in the citizen science based CoralWatch method in Aruba is expected to be acceptable, and to show potential for its use as a method to reliably monitor coral reef bleaching and health, since bleaching status changes are in steps of 2 units. The observed mean coral colour of the citizen scientist will agree with the general coral colour of the reef (determined by assessing 60 surrounding corals as a baseline), and the lightest colour, darkest colour, colour range and coral shape can be observed reliably by multiple observers. A colour score of at least 2 units is required to detect changes in coral bleaching status.
3.3 Fieldwork
Materials: • CoralWatch DIY set• Underwater scoreboard and pencil• Coral Watch chart• Thermometer

UAUCU Student Research Exchange Collected Papers 2018
112
• Data summary chart• Snorkelling gear• Marking tape (pink) and permanent marker• Coral rubble as marking stones• Plastic bottles• Rope
Preparation and BaselineThe corals were marked with pink marking tape. After picking a random starting point, the closest coral was marked every 3 fin kicks, to ensure a random selection of assessed corals. This transect was about parallel to the island, only spanning a certain depth, not a depth gradient. Every coral was tagged with numbered marking tape. Flagging tape was tied to large/heave/stable pieces of coral rubble to mark the corals. The start of the transect was marked with a plastic bottle floating on the water.
A baseline was established for all sites by the same researcher to rule out the possibility that the sites are not truly different if no difference is found by the citizen data collectors. The researcher marked 60 corals closest to the transect line, 3 corals per marked coral.
Figure 3 - Visualisation of transect (grey) and baseline corals (black)
The sitesIn this research, the chart was used while snorkelling in close-shore, shallow sites because citizen scientist have to be able to reach the sites easily. There are deeper reefs on Aruba, but SCUBA diving or free diving at deeper off-shore sites would make the research less accessible. The reefs visited by the researcher were Arashi beach, Boca Catalina, Malmok, Palm Island, Mangel Halto, Bou Baranca, Savaneta and Baby Beach. All sites were suitable for bleaching assessment. The reefs at Mangel Halto and Boca Catalina were most suitable for assessing the interobserver variability. Palm Island is a potential third research site. These sites had sufficient coral cover in shallow, non-turbulent water that were easily reachable from the shore. All sites are described in more detail in the result section. Transect A and B are on the inner reef at Mangel Halto. Transect C is near the coast at Boca Catalina. A potential transect D is at Palm Island.
Coral scoring methodology at the siteThe following methodology was adapted from the recommended methodology by CoralWatch. The citizen scientist approached a coral with the CoralWatch Health Chart, see figure 3, and an underwater scoreboard and pencil.
Figure 4 - CoralWatch Health chart (CoralWatch, n.d.-b)

UAUCU Student Research Exchange Collected Papers 2018
113
The citizen scientist followed the instructions given by CoralWatch for every marked coral. This method was first practised above water:
1. Look down at the coral and select the lightest area, avoiding the tips of branching corals. Those are usually very light and are the growing tips/edges (they haven’t gained symbiotic algae/zooxanthellae yet)
2. Hold the colour chart next to the selected area.3. Rotate the chart until you find the closest colour match.4. Record the matching colour code along with coral type
on the data sheet.5. Repeat steps 2 to 5 for the darkest area of the coral.6. Continue survey with other corals.7. When you finish, transcribe your collected data to the
website data sheet.
The Coral Health Chart uses four coral types to classify corals: branching, boulder, plate and soft.
Figure 5 - Four coral shapes (CoralWatch, 2018a)
At the end of the survey, the citizen scientist gave their underwater marking board to the head researcher to be photographed, and later copied into SPSS.
3.4 Statistical analysisMultiple approaches are used to assess whether the citizen scientists’ assessment is reliable enough to monitor the reef bleaching status. The mean values of all the transect baselines and citizen scientist observers are compared. This determines if the mean values of the baseline assessments and observers fall within the confidence intervals, and thus are the same or different. An intraclass correlation coefficient (ICC) is run over all transects to look at absolute agreement of average measures because the observers are a subset of the sample (all people) and the corals are chosen at random. The CoralWatch website considers transect averages, so average measures are more appropriate. A retrospective power analysis tells how big the minimum effect size should be to be able to tell the sites of different health status apart based on the variability in the data. This will be accompanied by a sensitivity analysis.
4. Results
4.1 Location descriptionsThis section describes some of the of shallow corals reefs on the west coast, ordered from north to south. The scouted locations are Arashi Beach, Boca Catalina, Malmok Beach, Palm Island, Mangel Halto, Bou Baranca, Savaneta and Baby Beach. Topics discussed per reef are activity and development, coral cover and structure, vegetation, animals (fish and sea urchins) and other miscellaneous characteristics. Lastly, the suitability of the site is concluded.
4.1.1 Arashi BeachArashi Beach is a sandy beach with rocks north of it, without any mangrove forests. It is a popular beach with locals and some tourists. There is little water sport and boat traffic. The corals on the inner reef flat are very sparse and unhealthy. There is a decent amount of fish and few sea urchins, still more than you would expect with these little islands of mostly dead coral structures. There is a lot of algae growth. Sedimentation rates are high. The current

UAUCU Student Research Exchange Collected Papers 2018
114
and wave turbulence are not very strong. Further out, the coral cover is higher and the corals are healthier. However, this far out the waters are too deep for this research and not easily reachable from the coast.
4.1.2 Boca Catalina: Baseline CBoca Catalina has sandy and rocky beaches. There are no mangroves at Boca Catalina, nor did I find any sea grass fields. It is frequented by tourists and some locals, and it is a very popular location for boats. Due to these boats it was not safe to check out the outer reef. On the inner reef there is some small patches of reef, parallel to the coast line. They are little mountains ridges of life on the sandy seafloor. The corals are mostly boulders. They are bleached, though they seem somewhat healthier than the shallow Mangel Halto corals. It is likely that outer reef is in a bad shape due to the boat activity, which often means repeated anchor dropping and dragging. There was a fair bit of sedimentation, but the scattered corals didn’t look covered with it. The algae cover quite high, but only covering dead coral stone. There were a few sea urchins too, which weren’t very big, in addition to some schools of smaller fish. The waves and current were strong, even the fish were being thrown around by the wave turbulence. However, the shallowness of the water and reachability from the coast make this an accessible research site.
4.1.3 Malmok beachMalkmok Beach does not have sand, but rather has rocky coral cliffs. There are some tourists on the sandy parts of the beach, but most of the activity is on boats on the water. The reef has obviously suffered under this boat activity. There are signs of anchor dragging and the coral cover is very low near the coast. The water seems deep and calm enough, but the only corals to be seen were growing on the cliffs. There were almost no fish and no sea grass close to the coast. I was unable to find the reef further out. There were some turtles grazing on sparse sea grass further out at about 10 meters depth. The low coral cover and placement of corals (only on
shore line rocks) make this site too unpractical for research purposes.
4.1.4 Palm IslandPalm island is heavily developed and has artificially-kept beaches. Palm Island is always very busy with tourists. There is a big contrast between the designated snorkelling area and the rest of the corals. Inside of the snorkelling area there are few living corals, but a lot of fish. There are some boulder corals, but tourists trample most of them. In contrast, outside of the snorkelling area there is a bigger variety in coral structure but fewer fish. The outer reef is impressive and has big fields of Acropora, big boulders (>1m) and branching corals. There are soft corals too. Palm Island also maintains a coral nursery deeper down at the outer reef. The current and turbulence are both calm close to the coast and further out. The accessibility of these corals and low turbulence, in combination with many potential citizen scientists, make Palm Island a potential research site.
4.1.5 Mangel Halto: baseline A and BMangel Halto still has some mangroves in relatively good health, and there are sea grass fields. It is a very popular recreational beach, for locals as well as tourists. It is a busy snorkelling and diving location. The coral cover near the coast is lacking. The water stays shallow for a long time, so many people walk onto the reef flat. The coral structure gets more elaborate near the outer reef. Near the coast there’s mostly small, very yellow boulder corals. In deeper water further out there’s bigger boulders, some soft corals and a lot of Elkhorn corals. Especially near the coast, a lot of the coral is overgrown with algae. There is also a lot of sedimentation near the coast. Further out, the sedimentation varies by location and over time. Sometimes the visibility is more than 8 meters, sometimes it’s only about 3 meters. The fish populations also vary a lot closer to the coast and further out. Close to the coast there are a few small fish, further out there’s some parrot fish and schools of bigger black and blue

UAUCU Student Research Exchange Collected Papers 2018
115
fish (possibly Tangs). There is a lot of sea urchins on the shallower corals near the outer reef. The current is stronger further out, but the wave turbulence is not extreme. The lack of water turbulence and easily accessible corals make this a suitable research site.
4.1.6 Bou BarancaThis is a relatively sheltered beach behind a row of houses, south of the Mangel Halto mangroves. There is little activity in the water because this beach is not easily reachable. However, there is a lot of development in the water. A pier and a stone structure to maintain the artificial beach have been (illegally) constructed, which has probably impacted the corals a lot with sedimentation and pollution. The coral cover inside of the stone structure is meagre. There are only some bleached boulders. However, outside of the stone structure there is a surprising amount of relatively healthy corals. This is the only shallow spot where there were not just boulders, but also branched and soft corals. These corals were also much bigger than normally seen so closely to the coast. There were some more healthily coloured patches, and some extremely shallow bleached patches of corals. The algae cover inside of the stone structure was high, but outside of the structure the algae cover was lower. There were very few fish and sea urchins. The current and turbulence were rather high outside of the stone structure. The strong current makes this an unsuitable research site as citizen scientists would be a threat to the corals.
4.1.7 SavanetaSavaneta beach is next to the Isla di Oro mangroves and has some mangroves of its own. It’s a calmer beach with less recreation. There was a lot of healthy sea grass here. It was impossible to get through to the reef without damaging the sea grass fields. At sheltered spots near the coastline the sedimentation rate was very high, but except for that the system seemed pretty healthy. The current further out seemed strong. The inaccessibility of the reef makes this an unsuitable research location.
4.1.8 Baby beachThe Baby Beach bay is close to the oil refinery and next to the oil refinery recreational centre, which is currently owned by JADS diving centre. Baby Beach is a popular bay to swim in, especially for locals. There are very few corals in the bay due to heavy recreational activities. There are a lot of fish that are fed. The current outside of the bay was too strong to snorkel. The lack of an easily reachable reef with enough coral cover makes this an unsuitable research location.
4.2 Statistical analysis
4.2.1 Baselines
Figure 6 - Basic information on baseline A, B and C
Baseline A and B have similar means (2,5 and 2,7) whereas baseline C has a higher mean colour score for combined light and dark colour scores for the 60 baseline corals. Baseline A and B also share the same minimum and maximum (1, 5) while baseline C also had corals with a darkest colour score of 6
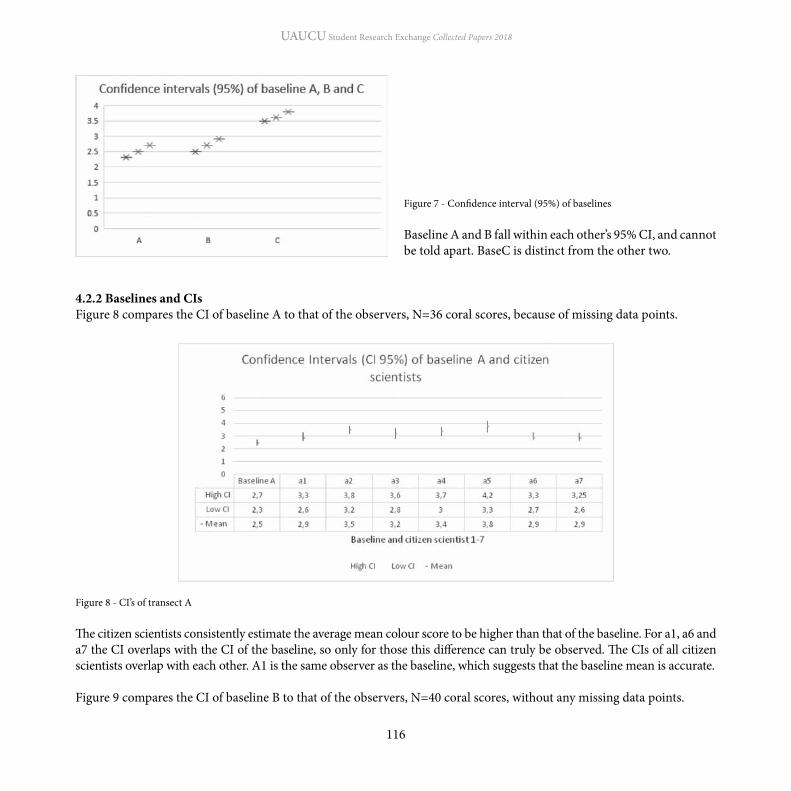
UAUCU Student Research Exchange Collected Papers 2018
116
Figure 7 - Confidence interval (95%) of baselines
Baseline A and B fall within each other’s 95% CI, and cannot be told apart. BaseC is distinct from the other two.
4.2.2 Baselines and CIsFigure 8 compares the CI of baseline A to that of the observers, N=36 coral scores, because of missing data points.
Figure 8 - CI’s of transect A
The citizen scientists consistently estimate the average mean colour score to be higher than that of the baseline. For a1, a6 and a7 the CI overlaps with the CI of the baseline, so only for those this difference can truly be observed. The CIs of all citizen scientists overlap with each other. A1 is the same observer as the baseline, which suggests that the baseline mean is accurate.
Figure 9 compares the CI of baseline B to that of the observers, N=40 coral scores, without any missing data points.

UAUCU Student Research Exchange Collected Papers 2018
117
Figure 9 - CI’s of transect B
The citizen scientists consistently estimate the average mean colour score to be higher than that of the baseline. B1 is the same observer as the baseline, which suggests that the baseline mean might not be a true reflection of the overall coral bleaching status.
Figure 10 compares the CI of baseline C to that of the observers, N=24 coral scores, because of missing data points.
Figure 10 - CI’s of transect C
The confidence intervals of the baseline and citizen scientists overlap for all 6 scorers. They are not different from each other.
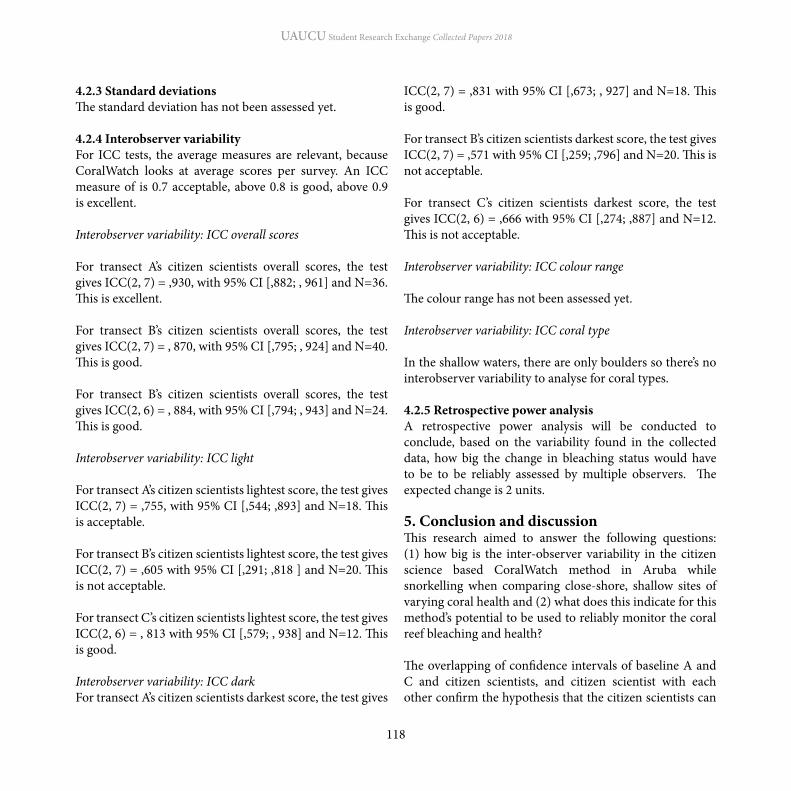
UAUCU Student Research Exchange Collected Papers 2018
118
4.2.3 Standard deviationsThe standard deviation has not been assessed yet. 4.2.4 Interobserver variabilityFor ICC tests, the average measures are relevant, because CoralWatch looks at average scores per survey. An ICC measure of is 0.7 acceptable, above 0.8 is good, above 0.9 is excellent.
Interobserver variability: ICC overall scores
For transect A’s citizen scientists overall scores, the test gives ICC(2, 7) = ,930, with 95% CI [,882; , 961] and N=36. This is excellent.
For transect B’s citizen scientists overall scores, the test gives ICC(2, 7) = , 870, with 95% CI [,795; , 924] and N=40. This is good.
For transect B’s citizen scientists overall scores, the test gives ICC(2, 6) = , 884, with 95% CI [,794; , 943] and N=24. This is good.
Interobserver variability: ICC light
For transect A’s citizen scientists lightest score, the test gives ICC(2, 7) = ,755, with 95% CI [,544; ,893] and N=18. This is acceptable.
For transect B’s citizen scientists lightest score, the test gives ICC(2, 7) = ,605 with 95% CI [,291; ,818 ] and N=20. This is not acceptable.
For transect C’s citizen scientists lightest score, the test gives ICC(2, 6) = , 813 with 95% CI [,579; , 938] and N=12. This is good.
Interobserver variability: ICC darkFor transect A’s citizen scientists darkest score, the test gives
ICC(2, 7) = ,831 with 95% CI [,673; , 927] and N=18. This is good.
For transect B’s citizen scientists darkest score, the test gives ICC(2, 7) = ,571 with 95% CI [,259; ,796] and N=20. This is not acceptable.
For transect C’s citizen scientists darkest score, the test gives ICC(2, 6) = ,666 with 95% CI [,274; ,887] and N=12. This is not acceptable.
Interobserver variability: ICC colour range
The colour range has not been assessed yet.
Interobserver variability: ICC coral type
In the shallow waters, there are only boulders so there’s no interobserver variability to analyse for coral types.
4.2.5 Retrospective power analysisA retrospective power analysis will be conducted to conclude, based on the variability found in the collected data, how big the change in bleaching status would have to be to be reliably assessed by multiple observers. The expected change is 2 units.
5. Conclusion and discussionThis research aimed to answer the following questions: (1) how big is the inter-observer variability in the citizen science based CoralWatch method in Aruba while snorkelling when comparing close-shore, shallow sites of varying coral health and (2) what does this indicate for this method’s potential to be used to reliably monitor the coral reef bleaching and health?
The overlapping of confidence intervals of baseline A and C and citizen scientists, and citizen scientist with each other confirm the hypothesis that the citizen scientists can

UAUCU Student Research Exchange Collected Papers 2018
119
(usually) make an accurate estimation of the reef bleaching status by assessing a subset of the corals.
Additionally, the excellent ICC score for transect A and the good scores for transect B and C indicate a reliable assessment. However, the variability is high in the assessment of light and dark colour separately, especially in subset B. Observers are generally better at consistently marking the lightest colour than the darkest colour. The difference between unsplit and split scores might be explained by the difference in dataset size, resulting in bigger impacts of outliers on the total score. This partly confirms the hypothesis that citizen scientists can estimate the general, darkest and lightest coral colour. The inter-observer variability in the citizen science based CoralWatch method in Aruba while snorkelling close to the coast is good. The mean colour can usually be assessed by multiple observers. The lightest colour can reliably be observed by multiple observers. The darkest colour is less reliably observed by multiple observers. The standard deviation and reliability of colour range observation will be studied at a later point in time. The reliability of coral shape cannot be commented on because all corals assessed were boulders.
These preliminary results indicate a potential for this method’s to be used to reliably monitor the coral reef bleaching. However, because of the high variability, especially in the darkest colour assessment, a high number of data points over time or consistent rating by only one person over time is required to get a good estimate and reliably assess the progression of bleaching events. The full potential of assessing a bleaching event, which goes in stages of bleached (1-2), partially bleached (3-4), and healthy (5-6), will be concluded when a retrospective power analysis shows how big the change in bleaching status would have to be, in order to be reliably assessed by multiple observers.The ability of community members to reliably monitor the coral reef bleaching and health with the Coral Health
Chart will help Aruba, a small island state, deal with the consequences of climate change on their surrounding environment. It will also help in working towards the UN Sustainable Development goals 13 and 14, as extra data on coral health will enable Aruba to conserve life below water and to act against the effects of climate change on coral health.
5.1 Limitations and challengesA known limitation of the CoralWatch Health Chart is its bias towards only assessing more visible corals (CoralWatch, n.d.-a). This might have influenced which 20 corals were picked for assessment and the 60 baseline corals. Furthermore, CoralWatch recommends at least 100 data points for a baseline, not 60.
It took a long time for enough CoralWatch Health Charts to arrive to Aruba, so the measurements at transect A and B were partially done with printed sheets in zip lock bags. This may have introduced more variability into the dataset because these materials were less easy to handle and were printed with different toner. Additionally, in shallow waters near the coast there is a lot of wave turbulence, which makes assessing corals harder. It also was not always clear which coral a marking stone was supposed to mark, as some stones had multiple nearby corals. This could have introduced more variability. Furthermore, because data gathering took all day the light circumstances varied within transects between the observers. Especially near the end of the day, when it gets darker, it is harder to see contrast. In addition, due to time constraints, not every citizen scientist got a lengthy explanation of the methodology. More extensive explanations could increase understanding and decrease variability. The missing data decreases the robustness of the dataset. Readability and completeness should be checked when citizen scientists hand in their data to the head researcher. Human error in reading the charts might have influenced the results, as well as the copying of results into different datasheets for SPSS analysis.

UAUCU Student Research Exchange Collected Papers 2018
120
Additionally, with more data on coral reef health, for example from CoralWatch monitoring, the establishment of marine protected areas is recommended. As discussed in the site descriptions, the coral reef systems in shallow waters close to the shore are unhealthy. More protection is necessary for marine life to preserve their ecosystem services for current and future generations.
6. Bibliography • Alvarez-Filip, L., Dulvy, N. K., Gill, J. A., Cote, I. M., &
Watkinson, A. R. (2009). Flattening of Caribbean coral reefs: region-wide declines in architectural complexity. Proceedings of the Royal Society B-Biological Sciences, 276(1669), 3019–3025. doi:10.1098/rspb.2009.0339
• Burgess, H. K., DeBey, L. B., Froehlich, H. E., Schmidt, N., Theobald, E. J., Ettinger, A. K., … Parrish, J. K. (2017). The science of citizen science: Exploring barriers to use as a primary research tool. Biological Conservation, 208, 113–120. doi:10.1016/j.biocon.2016.05.014
• Carilli, J. (2013, June 17). Why Are Coral Reefs Important? Retrieved February 20, 2018, from https://www.nature.com/scitable/blog/saltwater-science/why_are_coral_reefs_important
• Coral Health Atlas. (2018). Coral Health. Retrieved February 13, 2018, from http://coralhealth.uhh.hawaii.edu/coral-health
• CoralWatch. (2018a). Coral Health Chart. Retrieved April 11, 2018, from https://www.coralwatch.org/web/guest/coral-health-chart
• CoralWatch. (2018b). Home - CoralWatch. Retrieved January 30, 2018, from https://www.coralwatch.org/web/guest
• CoralWatch. (n.d.-a). FAQ’s - CoralWatch. Retrieved April 12, 2018, from https://www.coralwatch.org/web/guest/faq-s
• CoralWatch. (n.d.-b). Twitter profile picture. Retrieved from https://twitter.com/coral_watch
• DCNA. (2017a). Status of Bonaire’s reef (BioNews No. 3). DCNA Nature. Retrieved from http://www.
In order to effectively asses this method’s potential to be used for reliably monitoring coral reef bleaching in Aruba, the engagement of more citizen scientists from Aruba would have been ideal. Only 9 citizen scientists participated in the project, many of whom were university students, which is not an accurate representation of the average Aruban resident. Additionally, only two shallow, close-shore sites were evaluated with these three transects, which might not give a reliable image of the applicability across the entire island’s reefs.
The study looked at how well the multiple observers could estimate the colour bleaching status, but the health chart’s purpose is also to monitor bleaching events. This was not done in this study since no major bleaching event took place at the time of data gathering. Moreover, Aruban coral health is not only influenced by the bleaching status. Other health problems, like physical destruction of reef structures, sedimentation, algae growth and diseases are bigger problems in Aruba. These issues are not monitored with this methodology. Thus, while bleaching status might be observed reliably, this might not be a robust indicator of ecosystem health by itself.
5.2 Further research and recommendations Longitudinal research into coral health and coral bleaching on Aruba would be necessary to assess whether this method can truly assess these events. Furthermore, to accurately assess coral reef health on Aruba different factors should be studied as well, such as, coral cover, fish populations, algae growth and sedimentation rates. In combination with a bleaching assessment, these assessments could give a better estimation of the development of coral health in Aruba’s shallow, near shore waters. Furthermore, Aruba also has deeper waters with coral reefs that should to be studied. Multi-approach marine health assessments would be advisable there as well to reliably monitor coral health.
UAUCU Student Research Exchange Collected Papers 2018
121
1737–1742. doi:10.1126/science.1152509• Hoegh-Guldberg, Ove. (2017). Climate change, coral
bleaching and the future of the world’s coral reefs.” Marine and freshwater research (2017). Retrieved from http://citeseerx.ist.psu.edu/viewdoc/download?doi=10.1.1.589.3272&rep=rep1&type=pdf
• Lost Ladybug Project. (2018). Lost Ladybug Project. Retrieved March 20, 2018, from http://www.lostladybug.org/about.php
• Marshall, N. J., Kleine, D. A., & Dean, A. J. (2012). CoralWatch: education, monitoring, and sustainability through citizen science. Frontiers in Ecology and the Environment, 10(6), 332–334. doi:10.1890/110266
• Mason Suzanna C., Hill Jane K., Thomas Chris D., Powney Gary D., Fox Richard, Brereton Tom, … Stewart Alan. (2018). Population variability in species can be deduced from opportunistic citizen science records: a case study using British butterflies. Insect Conservation and Diversity, 11(2), 131–142. doi:10.1111/icad.12242
• McCoshum, S. M., Schlarb, A. M., & Baum, K. A. (2016). Direct and indirect effects of sunscreen exposure for reef biota. Hydrobiologia, 776(1), 139–146. doi:10.1007/s10750-016-2746-2
• McKinley, D. C., Miller-Rushing, A. J., Ballard, H. L., Bonney, R., Brown, H., Cook-Patton, S. C., … Soukup, M. A. (2017). Citizen science can improve conservation science, natural resource management, and environmental protection. Biological Conservation, 208, 15–28. doi:10.1016/j.biocon.2016.05.015
• Moberg, F., & Folke, C. (1999). Ecological goods and services of coral reef ecosystems. Ecological Economics, 29(2), 215–233. doi:10.1016/S0921-8009(99)00009-9
• Mumby, P. J., Hastings, A., & Edwards, H. J. (2007). Thresholds and the resilience of Caribbean coral reefs. Nature, 450(7166), 98–101. doi:10.1038/nature06252
• NOAA. (2018a). Corals: NOAA’s National Ocean Service Education. Retrieved February 20, 2018, from https://oceanservice.noaa.gov/education/tutorial_
dcnanature.org/wp-content/uploads/2017/10/Bionews_2017_3_Status-of-Bonaire-coral-reef.pdf
• DCNA. (2017b). Status of Curacao’s reef (4). DCNA Nature.
• Eakin, C. M., Feingold, J. S., & Glynn, P. W. (1994). Oil refinery impacts on coral reef communities in Aruba, NA. Retrieved from https://miami.pure.elsevier.com/en/publications/oil-refinery-impacts-on-coral-reef-communities-in-aruba-na
• Eakin, C. Mark, Morgan, J. A., Heron, S. F., Smith, T. B., Liu, G., Alvarez-Filip, L., … Yusuf, Y. (2010). Caribbean Corals in Crisis: Record Thermal Stress, Bleaching, and Mortality in 2005. PLOS ONE, 5(11), e13969. doi:10.1371/journal.pone.0013969
• Gardner, T. A., Côté, I. M., Gill, J. A., Grant, A., & Watkinson, A. R. (2003). Long-Term Region-Wide Declines in Caribbean Corals. Science, 301(5635), 958–960. doi:10.1126/science.1086050
• Gil, M., & Osenberg, C. (2010). The effects of multiple anthropogenic stressors on coral reef communities | Gump Station. Retrieved February 20, 2018, from http://www.moorea.berkeley.edu/research/projects/effects-multiple-anthropogenic-stressors-coral-reef-communities
• González-Rivero, M., Beijbom, O., Rodriguez-Ramirez, A., Holtrop, T., González-Marrero, Y., Ganase, A., … Hoegh-Guldberg, O. (2016). Scaling up Ecological Measurements of Coral Reefs Using Semi-Automated Field Image Collection and Analysis. Remote Sensing, 8(12), 30. doi:10.3390/rs8010030
• Great Barrier Reef Foundation. (2016). ReefBlitz. Retrieved March 25, 2018, from https://www.barrierreef.org/get-involved/events/reef-blitz
• Gura, T. (2013). Citizen science: Amateur experts. Nature, 496(7444), 259–261. doi:10.1038/nj7444-259a
• Hoegh-Guldberg, O., Mumby, P. J., Hooten, A. J., Steneck, R. S., Greenfield, P., Gomez, E., … Hatziolos, M. E. (2007). Coral Reefs Under Rapid Climate Change and Ocean Acidification. Science, 318(5857),

corals/media/supp_coral01a.html• NOAA. (2018b). What Are Corals? - Corals: NOAA’s
National Ocean Service Education. Retrieved February 20, 2018, from https://oceanservice.noaa.gov/education/tutorial_corals/coral01_intro.html
• NOAA. (2018c). Zooxanthellae...What’s That - Corals: NOAA’s National Ocean Service Education. Retrieved February 20, 2018, from https://oceanservice.noaa.gov/education/tutorial_corals/coral02_zooxanthellae.html
• Siebeck, U. E., Logan, D., & Marshall, N. J. (2008). CoralWatch: A flexible coral bleaching monitoring tool for you and your group (Vol. 1, pp. 549–553). Presented at the 11ICRS: 11th International Coral Reef Symposium 2008, National Coral Reef Institute. Retrieved from https://espace.library.uq.edu.au/view/UQ:221955
• Siebeck, U. E., Marshall, N. J., Klüter, A., & Hoegh-Guldberg, O. (2006). Monitoring coral bleaching using a colour reference card. Coral Reefs, 25(3), 453–460. doi:10.1007/s00338-006-0123-8
• Starkey, E., Parkin, G., Birkinshaw, S., Large, A., Quinn, P., & Gibson, C. (2017). Demonstrating the value of community-based (‘citizen science’) observations for catchment modelling and characterisation. Journal of Hydrology, 548, 801–817. doi:10.1016/j.jhydrol.2017.03.019
• Waite, R., Burke, L., Gray, E., van Beukering, P., Brander, L., Mackenzie, E., … Tompkins, E. L. (2014). Coastal capital: ecosystem valuation for decision making in the Caribbean. World Resources Institute. Retrieved from https://eprints.soton.ac.uk/362289/
• XL Catlin Seaview Survey. (2013a, April). Maps - Global Reef Record. Retrieved February 11, 2018, from http://globalreefrecord.org/maps/image_analysis/17006
• XL Catlin Seaview Survey. (2013b, April). Maps - Global Reef Record. Retrieved February 11, 2018, from http://globalreefrecord.org/maps/image_analysis/17050
• XL Catlin SeaviewSurvey. (2015). Catlin Seaview
Survey. Retrieved February 11, 2018, from http://catlinseaviewsurvey.com/surveys/caribbean/aruba
• Zanten, van, B., Lacle, F., van Duren, S., Soberon, V., & van Beukering, P. (2018). The Value Natural Capital for the Tourism Industry of Aruba. Aruba.
• Zetten, R. van, Meulen, F., & Brink, T. (2001, October). Aanbevelingen voor integraal kustbeheer op Aruba. Coastal Zone Management Centre. Retrieved from http://edepot.wur.nl/174321
UAUCU Student Research Exchange Collected Papers 2018
123
The ‘Whip’ 2.0’s windows are winded down, we’re cruising (or more like bustling along) towards Boca Catalina. The speaker’s are blaring, it’s Daniel’s Dutch rap playlist, the sounds that we initially regarded with great hesitation are now transformed into requested car karaoke favourites. Outside, the silhouettes of passing Palm trees are slowly become more distinct as we chase the sun’s descent. Clutching tight to the warm metal pot on my lap, tightly packed together, there’s an air of eagerness and anticipation to reach the beach for the sunset and to unwind.
We untangle ourselves out of the car and wander to our perfect spot. There’s a warm evening breeze and we serve food amongst ourselves over the exchanges of words, thoughts and laughter. The laughter is contagious and creates a chain reaction amplified throughout the group. A usual game of “Times Up” is followed, bringing out the
fun but competitive nature of our characters. I couldn’t ask for a better group of people to spend these moments with.
As the sun dips to the surface of the ocean, it’s huey yellow glow scatters, refracts and reflects across the waves, prompting a moment of reflection of our own. As day transforms into night, we meander into the water for a refreshing swim, cutting through the silver traced sea surface. An evening swim is certainly one of my favourite ways to relax. For me, the escapism of exploring natural environments is ever so rewarding. Which is why the choice for my research study was ideal for me.
Conducting fieldwork in the mangrove forests was an engaging and physically exerting experience. Swinging, jumping, crawling, lifting, gripping tight across the densely packed branches and roots of the mangroves made me have a deeper appreciation and understanding of their complex but fascinating physiology. I also became somewhat too familiar to their fauna, confronting in close quarters to ants, spiders, rats, hermit crabs, curious geckos and if I was really unfortunate Palm Island’s beautiful boisterous peacock.
Fortunately, I had the pleasure of others helping me with my mangrove fieldwork. First a special thank you to my two Academic Foundation Year (AFY) apprentices Danick Netto and Tyronn Kelly, for their incredible motivation and hard working attitude throughout, whether that be through conducting fieldwork or testing samples or finding unusual species on the field. A great thank you to my fellow researchers, friends and family who embraced the physical challenges of mangrove fieldwork (Nora, Emma, Annemieke, Fabian, Daniel, Luc, Heather, Morgan, Xavier, Dirijini and Luis). I would also like to thank all of the students of the UA-UCU program for our time spent together, whether that be soft ball, our DIY Prom event, amazing boat trip or university study sessions.
Emmeline Long, University College Utrecht

UAUCU Student Research Exchange Collected Papers 2018
124
I’m incredibly grateful for the experiences and development I’ve had (personally and academically) from this program, thus, a huge thank you to those who made this program possible. Firstly Eric Mijts who has led and guided us to reach our optimal research goals, offering with his help for every stage. Also to Jocelyn Ballantyne, who helped me set goals and find the measures to achieve them. Additionally to Kitty Groothuijse for all her advice and support towards my research. Moreover, to Carlos Rodriguez, for the organising and leading of the partnership between the AFY and UA-UCU Program, and the occasional practice of Chinese words. I would also like to give significant acknowledgements to Maarten Eppinga my thesis supervisor, for all his guidance in planning, preparing for all the stages of my research as well as his fast responses of constructive feedback on my progress.
I would like to thank Leopoldo Henriquez, who took the time to discuss the history of oil spills on the island, methodology on oil analysis, as well as providing essential reading materials to support my research. Additionally, a thank you to Miriam van de Plassche for enabling me to conduct my fieldwork on Palm Island. Furthermore, I would also like to thank Gisbert Boekhoudt for organizing a permit to ship my samples to the Netherlands.
Finally I would like to give an enormous thank you to my family and friends. My parents and younger brother have shown consistent morale support, as well as valuable suggested input and relieved any moments of my own self doubt, through their encouragement prior and throughout this program (both from the UK and from my mum’s visit over).
UAUCU Student Research Exchange Collected Papers 2018
125
IntroductionCurrently, mangrove forests are found on less than one per cent of the Earth’s surface (Bond, 2017). Their role as an ecosystem holds significant value both economically and environmentally. They provide a number of ecological services, including biochemical, conservation and coastal protection roles of purpose. Their value is recognisable biochemically, as mangrove forests have the “capacity to recycle nutrients” (Getter, Scott & Michel, 1981, p. 536). They are also well equipped to store high amounts of organic matter and possess the capability “to sequester heavy metals and other toxic materials” (Getter, Scott & Michel, 1981, p. 536). Mangrove forests are also distinguished by their effectivity as a carbon sink, established as the most carbon-rich forest type of the tropics (Kawalekar, 2015). Henceforth, from a global scale, the conservation of this forest type provides as a mitigation method of climate change (Hutchison et al., 2014), through the storage capacity of carbon stocks. In addition to this, mangrove forests are essential for maintaining marine biodiversity through their role as nurseries of fishing species (Manson, Loneragan, Skilleter & Phinn, 2005). The mangroves demonstrate this role, by acting as a refuge for fish populations against predators, as well as a providing a ”source of nutrients” for these species to prosper (Manson, Loneragan, Skilleter & Phinn, 2005, p. 497).
Mangroves as a species are situated along the tropical and subtropical coastlines of the world, found in approximately 120 countries (Duke et al., 2007). This collection of countries includes the group of small island states (SIS), which share several characteristics such as being physically small in nature, surrounded by “large expanses of ocean”, having “limited natural resources” and “limited funds, human resources and skills” (Nurse et al., 2001, p. 845). Mangrove ecosystems play a necessary role for SIS, for example, mangrove forests contribute to sustaining the practice of fishery trade, “where 80 percent of marine catches are directly or indirectly dependent on mangroves” (Bond, 2017, p. 612). Thus, they are essential in providing a more cost-efficient solution to conserving the economies of the fishing industry.
Another crucial ecological service this species provides is that it serves as a natural coastline protection by “reducing wave energy”, “increasing sedimentation” of soils and “reducing erosion” (Spalding et al., 2014, p. 51). From this, they serve effectively as barriers “against coastal erosion by stabilizing sediments” (Valiela, Bowen & York, 2001, p. 811). This is evident as in a previous research study of Southern Thailand, it was found that rates of erosion were reduced among coastal areas with the presence of mangroves in comparison to areas without (Thampanya, Vermaat, Sinsakul & Panapitukkul,
The impacts of oil contamination on the mangrove ecosystems of Aruba
Emmeline Long

UAUCU Student Research Exchange Collected Papers 2018
126
2006). Costly alternatives of coastal protection (instead of preserving the mangroves ecosystems) could involve implementing hard engineering strategies such as the construction of expensive man-made sea walls.
Furthermore, the mangrove forests are beneficial in their contribution towards maintaining the shorelines of SIS, which are valued by the local population. As from a societal perspective, mangrove forests as a natural ecosystem are also effective as a recreational area for human well-being and exploration, “by providing opportunities for reflection, spiritual enrichment, cognitive development, recreation and aesthetic experience” (Vo et al., 2012, p. 434). This demonstrates that the depletion of the area of the mangrove forests along the coastline can incur damage in differing forms.
Unfortunately, there is a threat of external anthropogenic factors, which can pose a great risk to the loss of a beneficiary natural resources (of SIS) such as the mangrove forests. One of these anthropogenic influences is the impact of oil spills, which can be sourced from domestic oil rigs or internationally such as neighbouring state owned rigs and illegal oil dumping from cruise ships (International Maritime Organization, 1973).
For the case of Aruba, the oil industry has a prevalent history. The origins of the importance of the oil industry to the country of Aruba dates back to 1925, when the island’s oil refinery, Lago, was first established (Razak, 1995). Later, during the Second World War, it transformed into one of the largest oil refineries in the world (Bond, 2017). However, in the 1980s, Lago closed the refinery, and the oil company holders switched in recent decades to the Coastal Oil Company and then to Valero Oil Corporation, when the refinery was sold in 2004 (Meckler & Barnes, 2012). Moreover, there was further expansion of the oil industry when Aruba’s water and electric utility, WEB opened in 1932 (Beamguard,
2009). Today, the WEB plant not only generates oil-fired electricity but also provides accessible desalinated potable water for the island (Meckler & Barnes, 2012). Both the WEB plant and the oil refinery have used in the past or continue to use Bunker C fuel oil as well as process Arabian and Venezuelan crude oils (L. Henriquez, personal communication, March 15, 2018). It is, therefore, evident, then, to explain Aruba’s dependency on imported oil for its energy sector, where “more than 80% of the island’s electricity is generated using heavy oil fuel” (Energy Transition Initiative Islands, 2015). This increased dependency on the oil industry has prompted the economy of Aruba to thrive and prosper, and now, given the anthropogenic global influences, it has also enabled demands for growing energy consumption to be met. However, Aruba’s economy remains vulnerable to fluctuations of global oil prices as well as the economic and environmental costs of oil spill events.
An example of such oil spill events that have occurred on Aruba, is that of the WEB desalination plant oil spill in February 2015 impacting the south coast of the island (NoticiaCla, 2015). This oil spill was caused by the leak of one of the tanker heaters (NoticiaCla, 2015). The full extent of what damage this specific oil spill is difficult to determine, but the occurrences of such oil spill events arising on the coasts of Aruba (both sourced domestically and internationally) is a very current relevant issue.
For the coastline ecosystems, the environmental ramifications of an oil spill event, in some cases, can be denoted as catastrophic, depending on the type of oil released and the volume of oil spilled. However, due to the nature of mangrove forest coastal shorelines and their low wave energy, oil from spills can be retained on the shores for up to 20 years depending on the conditions (Hoffman et al., 2002). As a result, mangrove forests as a shoreline ecosystem is classified to be a particularly sensitive type associating to its high vulnerability ranking,

UAUCU Student Research Exchange Collected Papers 2018
127
against the threat of oil spills (Gundlach & Hayes, 1978). Nonetheless, to what extent are the mangrove forests under threat, specifically for the case of Aruba, from the impacts of an oil spill(s)?
This research study contains three main components towards testing the impact of oil contamination on the mangrove forests. This includes, the testing for the classification of crude oil, as well as the comparing of pH, electric conductivity and Molybdenum concentrations and, finally, the comparing of the amount of carbon storage between mangrove ecosystem sites. Thus, this research paper aims to address and consider the following research question and sub-questions, through methodology and analysis using the appropriate quantitative methodology to testify hypotheses and assumptions.
Research Question: Is there a significant impact of oil contamination on the mangrove ecosystems in Aruba and if so what is it? Research Sub-Question 1: Are there significant comparative differences in chemical attributes (such as the pH, electric conductivity (eC) and concentrations of Molybdenum of the soil) between the “polluted” De Palm Island mangrove ecosystem site and the “healthy” mangrove ecosystem site, Mangel Halto, of the south coastline? Research Sub-Question 2: To what extent has oil contamination (to be determined as either lethal or sub-lethal) damaged the existing mangroves? Is there a significant greater amount of carbon stored in the “healthy” mangrove ecosystem site, Mangel Halto than the “polluted” De Palm Island mangrove ecosystem site?
Research Sub-Question 3: Is crude oil prevalent on Aruba, and if so, what type of crude oil is present in the potentially oil contaminated mangroves of Aruba?
Ideally, the findings of this research study may assist in engaging the community and related stakeholders to distinguish the relevance and importance of the immediate threat of oil contamination. This research, optimally, can bring awareness to the scale and meaning behind the loss of mangrove forest ecosystems of Aruba, what this could imply consequentially economically, socially or environmentally. If there are evident significant contrasts of tested parameters between an oil contaminated and non-oil contaminated site, a further pressure will be pushed towards responsible stakeholders of Aruba to improve and adapt crude oil storage and handling regulations, and to further reduce the risk and chances of more oil spill events. Thus, the conduction of this research has the goal to direct attention to approaches the sustainable development, with regards to the oil industry, to improve measures of conservation of the mangrove forests against oil spill events.
Methodology and Analysis In order to identify the impact (and its extent) of oil contamination, this research is broken down into the three relevant components (of chemical attributes; pH, electric conductivity and Molybdenum concentrations, carbon storage and determination of the crude oil type). The research design included the testing of samples and conducting of fieldwork between two different mangrove ecosystem sites of Aruba. One of the sites was Mangel Halto located on the southwestern coastline in the village of Pos Chiquito of Aruba. The fieldwork plots were randomly generated with coordinates ranging from 12° 27’ 47.14” N to 12° 27’ 53.15” N in latitude and from 69° 58’ 05.35” W to 69° 58’ 11.04” W in longitude. The Mangel Halto site was chosen to be tested for “healthy” conditions of a mangrove ecosystem (as one of the few remaining mangrove forest sites on the island), and thus, it can be used for the role as a control site

UAUCU Student Research Exchange Collected Papers 2018
128
for fieldwork/sampling. The other site chosen was the tourist attraction of De Palm Island located opposite the WEB plant, approximately 700 metres offshore (separate from the mainland) from the coast of the Balashi region. This site was chosen due to the photographic evidence of oil deposits/remains laid out alongside the mangrove forest along the coastline. The site De Palm Island was preliminary investigated in the initial stages of the program to identify and explore whether oil deposits were still present, thus, clarifying the potential of conducting this research study.
The observations from the preliminary visit of De Palm Island confirmed it to be an appropriate testing site, as oil deposits currently remain at this site. Therefore, the three components of this research are to be examined to identify the implications of an oil spill.
Community Based Research As part of the data collection for the fieldwork, a community based research approach was incorporated through varying ways. For example, this research program has helped contribute towards the spread of awareness of the value of mangroves of Aruba. This was exemplified when an outreach community fieldwork day event was organized through social media to involve volunteers of the community. The participation of community members has enabled them to learn research skills of conducting fieldwork as well as the opportunity to discover and understand the particular threats mangroves are facing.
Another community research based approach was adopted through the exchange of information on the knowledge known of the local Aruban mangrove forests with stakeholders. This included a discussion with the Clear Kayak Aruba Company on the current health of the mangrove forest of Isla Di Oro. The other exchange of information was conversed with the movement group
“Aruban Warriors” of the historical decline of the density of the mangrove forests in the local area of Pos Chiquito of the south coastline in Aruba. The partnership of the UA-UCU program’s researchers with the Academic Foundation Year (AFY) apprentice scheme proved incredibly resourceful and beneficial. With the assistance of two apprentices (Danick Netto & Tyronn Kelly), who participated in the mangrove forest fieldwork, data collection & handling of the first two components (See 1.1 & 1.2), the productivity of sampling and time efficiency considerably increased over the weeks for the studying of both sites. This opportunity enabled the transfer of research skills and knowledge of what was known of the mangrove ecosystems observed in the sites. The fieldwork with the AFY students also prompted them to take their own independent initiative to further explore and question what was observed from within the plots. An example of this was demonstrated when one of the AFY students identified the Cytospora rhizophorae fungus attached to a Rhizophora Mangle tree.
As a result, the foundations of awareness of certain threats to mangrove forests were brought to some members of the community, and further outreached to others via the publication of the issue in one of Aruba’s newspapers “Bon Dia”. The community based research approaches also provided the opportunity for the two AFY student apprentices to gain skills of advising and informing others, based on their experience and knowledge. As a result, these approaches have helped to highlight and initiate the real importance of conserving mangrove forest in the context of a community perspective, for instance, the security they provide for sustaining local Aruban fisheries. Additionally the discussion with the Aruban Warriors featured the importance of the role of the mangrove forests for the community itself, as the conservation of the mangrove forests play a strong role

UAUCU Student Research Exchange Collected Papers 2018
129
of being a recreational space for locals and their families of the island.
Consequently, my research aims to identify the impacts of oil contamination on the health of mangrove ecosystems. With the collaboration of student apprentices from the Academic Foundation Year, this research is expected to indicate a significant difference (with the use of specific elemental, pH, electric conductivity, carbon storage proxies) between the mangrove ecosystem of Mangel Halto, tested to be of a “healthy” state, against the oil contaminated mangrove ecosystem, situated on De Palm Island.
1.1 Chemical Attributes (pH, electric conductivity & Molybdenum concentrations)
In order to uncover the implications of oil contamination from oil spills, one component of this research is to analyse the chemical attributes between the ‘control’ site (Mangel Halto) and the oil contaminated site (De Palm Island). This component, particularly, analyses the values of pH, electric conductivity and the concentration of Molybdenum of soil samples between the two sites.
The measure of pH determines the acidity or alkalinity of a solution, by recording the concentration of hydrogen ions (Noyo, 2012). As a measure, it can be used as an indicator of critical conditions for soil required for yielding vegetation. The critical values for pH that classify soil to be in conditions that may yield poor vegetation are measurements of pH below 5.5 or above 8.5 (Albers, 1995). For the physical and chemical attributes of soil in mangrove forest ecosystems, the pH is expected to range from, approximately, 6.2 to 7.0 in reference to findings from former study of the mangrove ecosystems of Northern Australia (Boto & Wellington, 1984).
Therefore, it is expected that the pH will be significantly different between the two sites, where it is predicted the pH of soils of Mangel Halto mangrove forest ecosystem will measure within this range as “healthy”. Whereas the mangrove forest ecosystem of De Palm Island will be expected to have significantly different measurements of pH as a significant impact of oil contact causes the alteration of pH Hoffman et al., 2002). In a study conducted in 2013, it was found that crude oil contamination significantly increased the pH of marsh wetland soils (of similar nature to mangrove forest ecosystems), of the Momoge National Nature Reserve in Jilin Province, China (Wang et al, 2013). It was discovered that crude oil contamination significantly increased the pH of marsh soils ranging up to 8.0 for pH (Wang et al, 2013). However, other studies have shown that crude oil impacted soils show signs of acidification with a significant decrease in pH (Osuji & Ezebuiro, 2006). Taking into account findings of previous studies, it is to be hypothesized that there will be a significant difference of pH (either as greater or lower) for the soil conditions of the mangroves of De Palm Island in comparison to Mangel Halto. As it is expected that the crude oil contamination of De Palm Island will have significantly alkalised or acidified the soils of the mangrove ecosystem located there, as a result of the historic event(s) of oil spill(s). Another chemical attribute included in the data analysis was electric conductivity, which is a measure of “ionic concentration in the soils” (Osuji & Nwoye, 2007, p. 323), which demonstrates the capacity of the soil to pass an electric current. Mangrove forests, as a coastal species, are located in saline environments resulting in a low water potential and, thus, an expected high electric conductivity (Dorai, Papadopoulos & Gosselin, 2001). This is because levels of salinity and electric conductivity have a strong positive correlation (Miller, Bradford & Peters, 1988). However, a sudden increase

UAUCU Student Research Exchange Collected Papers 2018
130
or decrease of electric conductivity can indicate signs of pollution (LCRA, 2014). The critical values of electric conductivity for soil conditions that may yield poor vegetation can be classified as 4-6 mmhos/cm or greater (Albers, 1995), which is equivalent to 4 000-6 000 µS/cm. Depending on the composition of contaminating organic compounds (such as hydrocarbons of crude oils), the breakdown of ions can vary, influencing the levels of electric conductivity (Albers, 1995). Thus, it is expected that soils of De Palm Island contaminated with crude oil have adverse levels of electric conductivity. It can be hypothesized that the mangrove forest ecosystem soils of Mangel Halto will have a significantly different score of electric conductivity in comparison to the soils of De Palm Island mangrove ecosystem.
A final chemical attribute to be tested for was the concentration of Molybdenum (Mo) of the soils of the mangrove forest ecosystems. Molybdenum as an element plays the indispensable role of nitrate reduction in plant tissues and is further required to be present processes such as protein synthesis in plants (Tomati & Galli, 1995). The average concentrations of Molybdenum for soils ranges between 1–2 mg Mo/kg (Barceloux & Barceloux, 1999), whereas soils experiencing deficiency or excessiveness of the element can be classified with concentrations of <0.2 mg Mo/kg and >0.7 mg Mo/kg, respectively. Soils of greater acidity have shown a deficiency in Molybdenum (Barceloux & Barceloux, 1999). Thus, combined with the predicted alteration chemical and physical properties of the soil (mentioned earlier) as a result of oil spill contamination, it is hypothesized that there will be a significant difference in Molybdenum concentrations between Mangel Halto and De Palm Island mangrove forest ecosystem soils.
1.1.1 Data CollectionOf the nine 7x7 metre plots marked out for fieldwork, each at both De Palm Island and Mangel Halto several
soil samples were collected with the use of plastic zip lock bags. For every plot, sampling was conducted at three different random points within the plot. At each point, the soil corer was used to extract and obtain the top 10 cm in depth of soil to be then bagged and labelled “Soil Top”. Then, the soil corer was used to extract a further deeper 10cm and bagged under the label of “Soil Mid”. If the soil was of sufficient depth, a final deeper 10cm sample of the soil was dug and collected with the label of “Soil Bottom”. The collected soil samples in the zip-lock bags were then stored outside for a time period of between a few days to a few weeks depending on the date of collection of plot of origin and which site was sampled that day.
After the completion of fieldwork and all the plot soil samples were collected from the sites, Mangel Halto and De Palm Island, the pH and electric conductivity (eC) was measured of each level of depth of each point and plot of the sites. Plot seven of De Palm Island was excluded from this particular analysis for the testing of soil samples due to the whole plot area being covered with oil deposits. This meant it was not possible to extract any soil samples of that plot that would not contain large volumes of oil, which could potentially influence the outcome of the results.
1.1.2 Data AnalysisThe pH and electric conductivity of the soil samples was measured using the Eijkelkamp Waterproof Portable Meter. To prepare the samples, 10 ml of soil were removed from a zip lock bag and compressed into test tubes, then 10 ml of PB Demineralised Water were added and mixed in the test tube. The meter’s probes for electric conductivity (in units of µS) and pH (dimensionless) were inserted and the reading for the variables was recorded simultaneously after, approximately, a minute, once the readings would stabilize. In total, 70 samples were measured for pH (and 72 for electric conductivity)

UAUCU Student Research Exchange Collected Papers 2018
131
from Mangel Halto and 38 samples were measured from Palm Island for pH and electric conductivity.
With regards to the testing of concentrations of Molybdenum, the instrument DR900 Multiparameter portable colorimeter was used. In preparation for the procedure of measuring samples, 25 ml of a soil sample (only from zip lock bags labelled “Soil Top”) combined with 25 ml of PB Demineralised Water was added and mixed into the test tube subject of testing. The test tubes were then stored overnight for a minimum of 10 hours to allow sedimentation and to allow a more transparent solution to emerge in the top layer of the sample. After the 10 hours and a clearer solution has emerged, 10 ml of the sample’s solution were pipetted into a testing pot. The testing pot was positioned in the colorimeter and calibrated to zero, for the device to recognize a difference of the solution after the interaction from the added powder pillows. Thus, once the sample was calibrated to zero, and the powder pillows of Molybdenum 1, 2 and 3 were added, respectively, to the solution and swirled between intervals. The instrument, then, was used to time 5 minutes to enable the chemical interaction to take place. After the five minutes, the testing pot was inserted into the colorimeter and the recording of the concentration of Molybdenum (in units of mg/L Mo6+ ) of the testing solution was read on the instrument. In total, 24 soil samples were measured for Molybdenum concentrations from Palm Island and 27 samples were recorded from Mangel Halto.
The collection of data obtained from the analysis, then, underwent the statistical test (using the statistical computer program of SPSS) of an independent-samples t-test to identify whether there is a significant difference of the means recorded between the two sites (classified as the grouping) in order to testify the hypothesis for the chemical attributes (pH, electric conductivity and Molybdenum concentrations).
1.2 Level of impact and carbon storage Due the credibility that the mangrove species holds as an efficient storage of carbon (Kawalekar, 2015), it is important to include this measure as a component for oil contamination impact.
It has been shown that deposits of heavy fuel oils and crude oils on the coastal shorelines of the mangrove forest ecosystem can cause deteriorating implications for the health of the mangrove forests. Due the high viscosity and thick tar characteristics, the oil deposits can prohibit processes of exchange between the mangrove and its abiotic environment, thus, interfering its’s “normal physiological function” (Hoff & Michel, 2002, p. 24). This can, in some cases, lead to the suffocation of the plant.
An indication of a sub-lethal/lethal oil spill impact can also be recognized by the mortality of adult living mangrove trees as well as seedlings, which are particularly susceptible to oil exposure (Hoff & Michel, 2002). The mortality of mangrove forests and of its sub-divisions within the ecosystems (such as seedlings) will consequently mean a reduced overall biomass of the forest as the capacity for the mangrove forests to sequester carbon will be hindered, thus, resulting in a lower carbon storage. It is, therefore, relevant to monitor whether there is a significant difference in carbon storage between the mangrove forest ecosystem of De Palm Island and the ecosystem of Mangel Halto to determine whether the oil contamination has caused changes to a considerable extent.
The methodology for data collection and data analysis of this component were adopted from the Kauffmann & Donato (2012) report, which offered “approaches to accurately measure, monitor and report species composition and structure, aboveground biomass, and carbon stocks of mangrove ecosystems” (Kauffmann &
UAUCU Student Research Exchange Collected Papers 2018
132
Donato, 2012, p. 3). These approaches of the report hold in adherence to the “international standards outlined in the guidelines of the Intergovernmental Panel on Climate Change (IPCC)” (Kauffmann & Donato, 2012, p. 3), enabling further contributions to research on the assessment of carbon stocks of mangrove forest ecosystems globally. It is hypothesized that there will be a significantly lower carbon storage of De Palm Island mangrove forest ecosystem in contrast to the mangrove forest ecosystem of Mangel Halto due to oil contamination.
1.2.1 Data CollectionThis component of the research aims to quantify the size of the carbon pools stored within the mangrove forest ecosystems of Mangel Halto in comparison to De Palm Island. For methodology, the same marked 7x7 metre plots (as 1.1Chemical Attributes (pH, electric conductivity & Molybdenum concentrations)) were randomized using a number generator to determine the final coordinates limited within the range of forest covered area in Mangel Halto. Whereas, for the De Palm Island site, the 7x7 metre plots were chosen according to areas most impacted.
The size of the rectangular plots of seven metres by seven metre was chosen based of the modifying the shape and size the models present in the Kauffmann & Donato (2012) report, with the aim to achieve an optimal “sampling intensity to accurately describe the ecosystem properties” (Kauffmann & Donato, 2012, p. 7), whilst keeping the plot size effective for time efficiency for a total of 18 plots to be sampled.
For the total carbon storage to be accurately estimated (in units of Mg, mega grams), by calculation, a number of different assessments were required to be executed during the fieldwork days for data collection. An initial
assessment of the fieldwork includes an assessment of downed wood (Kauffmann & Donato, 2012), tallying the number of pieces of downed wood of various diameter groups; fine (<0.6cm), small (0.6cm - 2.5 cm), medium (2.5cm - 7.5cm) and the circumference measurements of large pieces (>7.5cm in diameter). Another assessment that was conducted was the litter assessment, which included the collecting and weighing of ecological litter consisting of “dead leaves, flowers, fruits, seeds and bark fragments” (Kauffmann & Donato, 2012, p. 16) found within a transect sized 0.5 x 0.5 metres at three random points in a plot. Other assessments required using the same sized transect to count the number of alive and dead seedlings as well as counting the number of pneumatophores present within the transect and the measurement of ten pneumatophores heights. The soil assessment required the extracting depths of 30 cm of soil in intervals of 10cm at three different random points within the plot as well as bagging and weighing each 10cm depth of soil and recording the depth of the soil itself at these points.
The final assessment involved the measuring of the circumference at breast height of the main stems of trees within the plot, as well as checking the status of the tree (alive or dead decay status) and determining the species of the tree (either Avicennia germinas, Rhizophora Mangle, Laguncularia racemosa or Conocarpus erectus for the case of Aruba) subject to measurements. From these measurements, the diameter of the trees of the plot could be calculated.
1.2.2 Data Analysis Using the values of these different parameters, it is possible to estimate the mass of carbon between different sub-divisions of a plot as well as calculate the total of carbon stored per plot. An example of a subdivision is the mass of carbon stored in the mangrove forest living trees of the plot. Due to the variation in species of mangroves,

UAUCU Student Research Exchange Collected Papers 2018
133
there are differentiating equations to calculate the biomass (units in kilograms). The following equations (calculating for Avicennia germinans, Rhizophora Mangle and Laguncularia racemosa respectively) have been used to calculate the total biomass of living trees (kg) per plot, which will benefit to the calculating of biomass and carbon stored of plots between the sites of Mangel Halto and De Palm Island. These equations were derived from the Kauffmann & Donato (2012) report.
BAG = 0.403(D1.934) (1) BRM = 0.722(D1.731) (2) BLR = 0.362(D1.930) (3)
Once the data is collected for the values of carbon storage of the different plots of data, it will, then, be required to undergo the independent-samples t-test statistical test. For the this test, the sites (Mangel Halto and De Palm Island) will be classified as the grouping variable and the outcome will determine whether there is a significant difference in means for carbon storage between the sites. This will further indicate whether the hypothesis for a significantly greater values of carbon storage for Mangel Halto mangrove forest ecosystem (compared to De Palm Island) was correctly predicted.
1.3 Identifying crude oil & type of crude oil From the photographs of the oil deposits and observations taken whilst preliminary visiting De Palm Island, it was of interest to determine whether the oil deposits were samples of crude oil and, if so, then, can the type of crude oil be determined.
1.3.1 Data CollectionAt the site of De Palm Island, the 7x7 metre plots were chosen along the coastline of the areas most impacted by the oil spill (plots that feature large masses of oil deposits from observation), distinguished by remains of oil deposits in a number of the plots. In total, a number of
nine (7x7 metre) plots were marked out of the De Palm Island site. Of the plots marked out plots 3, 7, 8 and 9 contained oil deposits coating the coastline. For each of these plots, three oil samples were extracted using a soil corer and collected in plastic zip lock bags. For each oil sample, the top 10cm of the oil/soil were collected into a zip lock bag, followed by an extraction of a deeper 10cm of oil/soil and, then, if possible, a final deeper 10cm oil/soil sample. This allowed a greater in depth analysis of the soil/oil profile in association to depth of the oil/soil within the plots.
1.3.2 Data AnalysisThe determination of the type of oil is favourable to this research, as the type of oil has implications on the level of ranking for the impact caused on the mangrove ecosystems (Hoff & Michel, 2002). The samples collected can be tested for crude oil and for a specific type of crude oil through the method of elemental spectrometry analysis. Spectroscopy would enable the discovery of “detecting and quantifying the presence of elements in a material” by distinguishing between contrasting spectral lines of various elements (Barraclough et al., 2014, p. 24). In order to do this particle elemental analysis, the specific instrument of spectroscopy will be used to test these samples is the X-ray Fluorescence analyser (XRF).
The elemental indicator that will be used from the XRF spectroscopy analysis to classify crude oil and a type of the collected from the oil samples of De Palm Island is the Vanadium to Nickel ratio. Previous research shows that there is a presence of Vanadium and Nickel in crude oil, of which Vanadium is bonded more strongly to crude oil in comparison to Nickel, thus, when decomposition occurs, Vanadium is released (Andrade et al., 2004). The ratio between the two elements represents the ease of biodegradability of the oil (Andrade et al., 2004). It is expected that the ratio of Vanadium to Nickel will range from 1 to 10 of the oil samples, but these values

UAUCU Student Research Exchange Collected Papers 2018
134
of the ratio are dependent on the origin of the crude oil (Andrade et al., 2004). Therefore, to verify specifically the type of crude oil of the samples collected, the V/Ni ratios obtained from the samples will be tested against proxies of V/Ni of different crude oil types from Koops (1985) handbook.
It is expected that the oil deposit samples will be of a crude oil type originating from Venezuela, or elsewhere South America or Arabia, as these are types of crude oils, presently, processed on Aruba (L. Henriquez, personal communication, March 15, 2018). It has also been suggested that, likely, examples of such types of crude oils that may be identified include Lagomedio, Lagunillas Heavy and La Rosa medium (L. Henriquez, personal communication, March 15, 2018).
In order to conduct this component of the research, the collected oil samples will be required to be shipped to the Netherlands to be tested with the XRF analyser in the Botanical Gardens Laboratory at the Uithof, Utrecht.
Preliminary Results
In regards to the data collected for the first component of the research, an independent-samples t-test was conducted to compare the values of pH for the soils of the Mangel Halto mangrove forest ecosystem site against the soils of the De Palm Island mangrove forest ecosystem. It was discovered that there was a significant difference in the pH values for Mangel Halto (M= 6.69, SD = 0.48) and De Palm Island (M= 7.26, SD = 0.54) conditions; t(106) = -5.72, p < 0.001.
Moreover, with a particular focus of the topsoil (soil ranging from the surface till the depth of 10 cm) between the sites, an independent-samples t-test was also conducted for the conditions of Mangel Halto site against the conditions of De Palm Island site. Additionally, a
significant difference was found between the pH values for Mangel Halto site (M = 6.60, SD =0.49) and De Palm Island site (M= 7.37, SD = 0.52) conditions; t(47) = -5.34, p < 0.001.
The same independent-samples t-test was conducted to compare electrical conductivity for the Mangel Halto site and for De Palm Island site. Furthermore, a significant difference was found between the scores (in units of µS) for Mangel Halto (M= 11.36, SD = 9.45) and De Palm Island (M= 2.87, SD = 2.26) conditions; t(85.29) = 7.24, p = 0.000. This was also the case for the topsoil, scores of electric conductivity with Mangel Halto site (M = 4.86, SD = 2.81) and De Palm Island (M= 2.72, SD = 2.45) site; t(47) = 2.85, p = 0.007. Therefore, the hypothesis stated prior to the data analysis for the significant difference of the chemical attributes, pH and electric conductivity, can be assumed to be correct.
In contrast, the SPSS analysis of comparing Molybdenum concentrations with an independent-samples t-test between the two sites had unexpected results. It was found that there was not a significant difference in the scores for Mangel Halto (M= 0.70, SD = 2.05) in comparison to De Palm Island (M= 0.63, SD = 1.73) conditions; t(49) = 0.13, p = 0.896. Therefore, the hypothesis stated prior, of an expected significant difference in concentrations of Molybdenum, cannot be confirmed, or is not supported by this study.
For the second component of the research (1.2 Level of impact and carbon storage), the data collected requires a further analysis to calculate an accurate estimation of carbon storage between both sites, before conducting an independent-samples t-test between the scores derived from the equations found in the Kauffmann & Donato (2012) report. This is similarly the case for the third component (1.3 Identifying crude oil & type of crude oil), where the analysis has to await testing that needs

UAUCU Student Research Exchange Collected Papers 2018
135
to be conducted under laboratory conditions with the aforementioned appropriate equipment.
Discussion & Preliminary Conclusions
In consideration to the results obtained so far, there is substantial evidence that the oil contamination (from the oil deposits on Palm Island) has caused a significant effect in the chemical soil properties regarding the pH and electric conductivity of the mangrove ecosystem. The obtained significant results, prompts the relevance for the further analysis of the other two components to further determine the extent of the impact that oil contamination has on mangrove ecosystems. Additionally, this could further support and exemplify the implications of oil contamination as a threat to the conservation of mangrove ecosystems. On the contrary, the insignificant results obtained for Molybdenum concentrations between the two sites could imply that both mangrove ecosystem sites experience similar levels of effectivity for processes such as nitrate reduction (Tomati & Galli, 1995). However, the outcome of this sub-component could also be influenced by the limitations, which arose during the process of conducting this research. These will be discussed in the following section.
Limitations
For the first component of this research study, a few constraints need to be noted to improve the data collection or data analysis of similar methodology in the future. Firstly, in regards to time, the measuring of pH and electric conductivity was subject to fluctuations, thus, the measurements for these parameters for some of the soil sample solutions were not always recorded directly at the same time. Furthermore, although the soil samples to be tested for the Molybdenum concentrations
were left to settle in PB Demineralised Water for the same number of hours, it was observed that some samples would preferably need more time for a clearer solution to form. This may have affected the capability for the colorimeter to sufficiently measure the correct readings for Molybdenum concentrations. Additionally, for this component of the research, the reliability for measurements of pH and electric conductivity of De Palm Island at different depths may be lower in comparison to the number of measurements of different depths taken at Mangel Halto. This was limited due to the fact that De Palm Island had sandy soils that were much shallower compared to Mangel Halto. For the second component, a number of limitations must be considered from the conducting of the protocol for measurements from the Kauffmann & Donato (2012) report. With respects to the Tree Assessment, the difference of heights of participants and volunteers involved in the fieldwork meant that the reference point of breast height to measure the circumference of trees may have variance. Moreover, as part of the Soil Assessment, the soil depths were sometimes not possible to determine, as the soil depths exceeded the length of metal rod used to measure the depths of the soil. Additionally, the corer used for the Soil Assessment was not washed between the extractions of soils at different points within plots and between different plots. This may have influenced the readings for pH, electric conductivity and concentrations of Molybdenum of samples. Another limitation regarded the soil samples of the Soil Assessment, which were not sufficiently dried out after extraction but remained sealed in zip lock bags until they were mixed with PB Demineralised Water, stored and tested for pH, electric conductivity and Molybdenum concentrations. This may have influenced the readings. For further research opportunities, there could be a further investigation into the reasons for the pH to

UAUCU Student Research Exchange Collected Papers 2018
136
significantly alter by becoming greater in value (rather than becoming smaller) for the oil contaminated site of De Palm Island in comparison to the Mangel Halto mangrove forest ecosystem. Additionally, there could be further investigation on the factors causing a change of electric conductivity to significantly decrease (instead of significantly increase) for De Palm Island mangrove forest ecosystem in contrast to the Mangel Halto site.
From these preliminary findings, the importance of instigating further for this study is highlighted through the potential outcomes of further significant effects from the other two components to this research. Although the measured pH and electric conductivity levels remained within the range of soil conditions that are deemed healthy for yielding vegetation, the significant difference of these parameters initiates the support towards implementing precautionary measures to prevent a widening of the difference of the parameters for vulnerable mangrove ecosystems. It also prompts for there to be further conservation and recovery efforts towards the mangrove forest ecosystem present on De Palm Island and elsewhere on Aruba against the threat of oil spills.
Optimally, it is predicted that the other two components of this research will further exemplify and support that oil contamination has a significant impact on the survival of mangrove forest ecosystems. Therefore, this research endeavours to further contribute to continuing Aruban conservation efforts, through its ties towards the progress of the 15th Sustainable Development Goal, Life on Land. This goal aims to “protect, restore and promote sustainable use of terrestrial ecosystems, sustainably manage forests, combat desertification, and halt and reverse land degradation and halt biodiversity loss” (The United Nations Development Programme, 2017, p. 18). Due to trends of the continuing reliance on oil as a principal energy resource, it is likely that the world
will see a future expansion of the oil industries of Aruba and throughout the rest of the Caribbean. Where forth, oil spills of sub-lethal or lethal impact will continually pose as hazard for the survival of already fragmenting global mangrove forest ecosystems (Kawalekar, 2015). Although, with the collaboration of predicted outcomes for the other two components of this study, it is anticipated that the threat of oil contamination on mangrove ecosystems will be much more identified as a vital issue that needs to be addressed. This will encourage the evaluation of the issue and further implementation of environmental regulations and policy directives aimed at safe storage and handling of crude oils such as Bunker C fuel. Additionally, it would be optimal if the concluding findings of this research could signify a need for further collaboration between different stakeholders of Aruba. This would enhance the shared capability to work towards finding a proactive approach for mitigation measures, in order to contribute to a more sustainable future and to prevent any further damage to the mangroves that remain on the island of Aruba. Wherefore, “the adage ‘prevention is better than cure’ applies ‘par excellence’ to mangrove swamps” (Baker, 1982, p. 10).
References
• Albers, P. H. (1995). Petroleum and individual polycyclic aromatic hydrocarbons. Handbook of ecotoxicology, 2.
• Andrade, M. L., Covelo, E. F., Vega, F. A., & Marcet, P. (2004). Effect of the Prestige oil spill on salt marsh soils on the coast of Galicia (northwestern Spain). Journal of Environmental Quality, 33(6), 2103-2110.
• Baker, J. M. (1982). Mangrove swamps and the oil industry. Oil and Petrochemical Pollution, 1(1), 5-22.
• Barceloux, D. G., & Barceloux, D. (1999). Molybdenum. Journal of Toxicology: Clinical Toxicology, 37(2), 231-237.

UAUCU Student Research Exchange Collected Papers 2018
137
• Beamguard, M. (2009). Transitioning from Thermal Desalination to Reverse Osmosis–The Benefits and Process Hurdles. Seven Seas Water Corp. (June 2012), slides, 17, 21.
• Bond, D. (2017). Oil in the Caribbean: Refineries, Mangroves, and the Negative Ecologies of Crude Oil. Comparative Studies in Society and History, 59(3), 600-628.
• Boto, K. G., & Wellington, J. T. (1984). Soil characteristics and nutrient status in a northern Australian mangrove forest. Estuaries, 7(1), 61-69.
• Dorai, M., Papadopoulos, A., & Gosselin, A. (2001). Influence of electric conductivity management on greenhouse tomato yield and fruit quality. Agronomie, 21(4), 367-383.
• Duke, N. C., Meynecke, J. O., Dittmann, S., Ellison, A. M., Anger, K., Berger, U., Cannicci, S., Diele, K., Ewel, K. C., Field, C. D., Koedam, N., Lee, S. Y., Marchand, C., Nordhaus, I., & Dahdouh-Guebas, F. (2007). A world without mangroves?. Science, 317(5834), 41-42.
• Edema, N. (2012). Effects of crude oil contaminated water on the environment. In Crude Oil Emulsions-Composition Stability and Characterization. InTech.
• Energy Transition Initiative Islands. Data, E. S. Energy Snapshot Aruba. (2015)
• Getter, C. D., Scott, G. I., & Michel, J. (1981, March). The effects of oil spills on mangrove forests: a comparison of five oil spill sites in the Gulf of Mexico and the Caribbean Sea. In International Oil Spill Conference (Vol. 1981, No. 1, pp. 535-540). American Petroleum Institute.
• Gundlach, E. R., & Hayes, M. O. (1978). Vulnerability of coastal environments to oil spill impacts. Marine technology society Journal, 12(4), 18-27.
• Henning, P., Walsh, D., Yurko, R., Barraclough, T., Shi, A., & Yuegang, Z. (2014). Oil analysis handbook for predictive equipment maintenance. Spectro Scientific.
• Hoff, R. Z., & Michel, J. J. M. (2002). Oil spills in mangroves: planning & response considerations.
• Hoffman, D. J., Rattner, B. A., Burton Jr, G. A., & Cairns Jr, J. (Eds.). (2002). Handbook of ecotoxicology. CRC press.
• Hutchison, J., Manica, A., Swetnam, R., Balmford, A., & Spalding, M. (2014). Predicting global patterns in mangrove forest biomass. Conservation Letters, 7(3), 233-240.
• International Maritime Organization. The International Convention for the Prevention of Pollution of Ships, 1973 (MARPOL 73/78). Retrieved from URL: http://www.vliz.be/docs/Zeecijfers/MARPOL.pdf
• Kauffman, J. B., & Donato, D. C. (2012). Protocols for the measurement, monitoring and reporting of structure, biomass, and carbon stocks in mangrove forests. Bogor, Indonesia: CIFOR.
• Kawalekar, J. S., (2015). Impact of Anthropogenic Pollution on Mangrove Biodiversity: A Review. International Journal of Multidisciplinary and Current Research (IJMCR), Vol. 3, 1152-1154. Retrieved from http://ijmcr.com/wp-content/uploads/2015/11/Paper91152-1154.pdf
• Koops, W. (1985). Handboek oliebestrijding op zee, kust en binnenwateren. Rijkswaterstaat, Directie Noordzee.
• LCRA (2014). Water Quality Indicators. In Colorado River Watch Network. Retrieved from http://www.lcra.org/water/quality/colorado-river-watch-network/Pages/water-quality-indicators.aspx
• Manson, F. J., Loneragan, N. R., Skilleter, G. A., & Phinn, S. R. (2005). An evaluation of the evidence for linkages between mangroves and fisheries: a synthesis of the literature and identification of research directions. Oceanography and marine biology, 43, 483.
• Meckler, M., & Barnes, B. (2012). Alternative fuel and energy production in Aruba: a case study.

Journal of Business Case Studies (Online), 8(4), 361.• Miller, R. L., Bradford, W. L., & Peters, N. E. (1988).
Specific conductance: theoretical considerations and application to analytical quality control. US Government Printing Office.
• NoticiaCla. (2015, February 9). WEB: No por determina grandura di e oil spill, aunke e daño haci no ta grandi. NoticiaCla. Retrieved from https://www.noticiacla.com/news/2262
• Nurse, L. A., Sem, G., Hay, J. E., Suarez, A. G., Wong, P. P., Briguglio, L., & Ragoonaden, S. (2001). Small island states. Climate change, 843-875.
• Osuji, L. C., & Ezebuiro, P. E. (2006). Hydrocarbon contamination of a typical mangrove floor in Niger Delta, Nigeria. International Journal of Environmental Science & Technology, 3(3), 313-320.
• Osuji, L. C., & Nwoye, I. (2007). An appraisal of the impact of petroleum hydrocarbons on soil fertility: the Owaza experience. African journal of agricultural research, 2(7), 318-324.
• Razak, V. (1995). Culture under construction: The future of native Arubian identity. Futures, 27(4), 447-459.
• Spalding, M. D., Ruffo, S., Lacambra, C., Meliane, I., Hale, L. Z., Shepard, C. C., & Beck, M. W. (2014). The role of ecosystems in coastal protection: Adapting to climate change and coastal hazards. Ocean & Coastal Management, 90, 50-57.
• Thampanya, U., Vermaat, J. E., Sinsakul, S., & Panapitukkul, N. (2006). Coastal erosion and mangrove progradation of Southern Thailand. Estuarine, coastal and shelf science, 68(1-2), 75-85.
• The United Nations Development Programme (UNDP), “Sustainable Development Goals”. (2017): 1-21. Retrieved from URL: http://www.undp.org/content/dam/undp/library/corporate/brochure/SDGs_Booklet_Web_En.pdf
• Tomati, U., & Galli, E. (1995). Earthworms, soil fertility and plant productivity. Acta Zoologica
Fennica, 196, 11-14.• Valiela, I., Bowen, J. L., & York, J. K. (2001).
Mangrove Forests: One of the World’s Threatened Major Tropical Environments: At least 35% of the area of mangrove forests has been lost in the past two decades, losses that exceed those for tropical rain forests and coral reefs, two other well-known threatened environments. Bioscience, 51(10), 807-815.
• Vo, Q. T., Künzer, C., Vo, Q. M., Moder, F., & Oppelt, N. (2012). Review of valuation methods for mangrove ecosystem services. Ecological indicators, 23, 431-446.
• Wang, Y., Feng, J., Lin, Q., Lyu, X., Wang, X., & Wang, G. (2013). Effects of crude oil contamination on soil physical and chemical properties in Momoge wetland of China. Chinese geographical science, 23(6), 708-715.
UAUCU Student Research Exchange Collected Papers 2018
139
My initial idea of Aruba was far from its reality. I first came to the island with the unrealistic thought of categorizing every single item of trash in each dumpsite to establish their full inventory. Little did I know that this would be far from possible. I would have never imagined the dumpsites to be this impressive, each amassing incredible amounts of waste. I got accustomed to their imposing composition over time as the sample collection progressed. Their sight has made me perceived waste management in a different light. I have become ever so conscious when purchasing overly packaged products and when disposing of them well knowing where they might end up. Despite of all this trash talk, I am forever grateful to have been given the opportunity to conduct this research. I hope it can contribute to the progress of the island in attaining a more sustainable society.
My experience here has been better than I could have ever wished for. Enjoying the beautiful sunset while eating
dinner at Boca Catalina. Swimming amongst schools of fish and seeing squids and a flying gurnard. Cruising in our beloved whip 2.0 listening to the Actually Squad 2018 playlist. Being able to do what you want while trying to look alive. The good life. But most of all, I was amazed by the friendliness of the people and their way of making me feel so welcome. Being part of this group has also been great. Learning not only from my own research but getting to follow the progress of the others. My time in Aruba would have not been the same without hearing about the shocking challenges of immigrants during naturalization, discovering corals’ nocturnal feeding methods, discussing actors added to the entrepreneurial ecosystem, findings out about the newest mangrove discovery or the latest sustainable practices in low rise hotels. The multidisciplinary aspect of the program is definitely part of its uniqueness.
Finally, this study would have not been the same without Fabian Timpen, my research partner. Thank you for spending so much time at the dumpsites and countless hours in our home lab analyzing samples. This research would have not been possible without your collaboration. The same goes to Julianna Lopez and Tiany Maduro, thank you for willingly volunteering to help us out in the field and being so eager to learn more about our project. Not to forget the people from Directie Natuur en Milieu for providing us with the necessary information especially Richard Gibbs and Ralph Thijsen for taking the time to accompany us to inaccessible dumpsites. Of course, thank you to Jocelyn Ballantyne and Eric Mijts for putting together this program and Kitty Groothuijse and Carlos Rodriguez for supporting us through the process. In addition, thank you to Maarten Eppinga for your expertize and being able to guide us in moments of doubt. Lastly, thank you to my family, friends and Maurits for encouraging me every step of the way.
Aruba mi dushi tera, until next time!
Emma Beroske, University College Utrecht

UAUCU Student Research Exchange Collected Papers 2018
140
It is early in the afternoon, we are cramped together in the car with five of us as the rain continues pouring after more than an hour. In the end we muster up the courage and jump out; four of us walk blindly into the direction of a heap of trash the size of a large trailer in the distance. We step over an iron chain, thinking it is just another part of the dump. Not a moment later a large wooden box suddenly starts moving. The head of a dog comes out, attached to it a collar with the iron chain we just stepped over. In this instant we stare the dog right in its eyes, and we try to realize at what point we messed up. The dog shortly experiences similar confusion, but this quickly turns into aggression as it starts barking and runs towards us. In the few seconds that this takes place I only remember thinking; “If the dog has a chain, it is because it needs to be contained. And since we stepped over the chain we are now in the range of the dog. Run.” We all sprint into different directions to get out as quickly as possible. Most of us were lucky and ran
back to the car, but Emma went the other way and ended up surrounded by three different dogs. At least she got one step closer to the dumpsite in question... An hour later we are all back in the car on our way home. We are completely soaked, still a little scared, and stinking of dumpsite mud. Nevertheless, we are also victorious as we take back some of the first soil samples with us.
This is not the only memory I take home of Aruba. Aruba is also a beautiful place of nature, kind people and tranquility. However, this story does represent my experience of doing practical research in the field. It never goes the way you planned, honestly, it is often a struggle. But in the end this makes your efforts more worthwhile. You appreciate the results you find so much more and you learn so much more, not just about your research topic but also about the island. It is because of all this effort you put in, that taking a swim at Arashi Beach feels more refreshing and relaxing than ever before.
Acknowledgements:
Firstly and most importantly I would like to thank Emma Beroske, my faithful research partner, for putting up with all my quirks, stubbornness and driving skills through the entire project. Thank you for your support, insights and surprisingly different perspectives on the same topic. It would not have been the same doing this research without you. Furthermore, I would like to thank the other students that stayed with me at Montaña parks. Nora, for making sure we did something fun and/or new (almost) ever day. Daniel, for his undying love of trash music. Emmeline for her continuous presence, which made my stay in Aruba (and also Cuba) so much more enjoyable. Luc, for being my second pair of eyes on the road, and preventing (at least) one accident. Annemieke, for taking care of me when I fell ill, and for kicking me out of bed in the morning after I got better. Thank you all for making sure Aruba was not just about work, but also about having a great time.
Fabian Timpen, University College Utrecht

UAUCU Student Research Exchange Collected Papers 2018
141
Other people that helped make this research possible and/or supported me on the way include; My supervisor, Maarten Eppinga, who was always willing to answer our questions and guide us into the right direction. Directie Natuur en Milleu, including Gisbert Boekhoudt, Richard Gibbs and Ralph Thijsen, for sharing their expertise about the island and accompanying us to the numerous dumpsites we could otherwise not have accessed. My special thanks to our enthusiastic AFY students, Tiany Maduro and Julianna Lopez for showing up to help us whenever we asked them to, even though we failed to give them more than a day’s notice in advance. Moreover, I would like to thank Kitty Groothuijse for showing Emma and me our first dumpsites, and for her enthusiasm about the island. Carlos Rodriguez for his support of the project and his help and guidance in our collaboration with the AFY students. Lastly but certainly not least I would like to thank Eric Mijts and Jocelyn Ballantyne for setting up this amazing project, which gave all of us the opportunity to do this form of research. Their continuous feedback and support made sure that I stayed on the right track.

UAUCU Student Research Exchange Collected Papers 2018
142
1.1 Introduction
In today’s world of consumerist societies and growing populations, more waste is generated than ever before as people are continuously enticed to purchase goods while disposing of their old ones. Up to about 150 years ago, waste was seen as the responsibility of its producer. Nowadays, it is generally accepted that the government is responsible for dealing with the increasing amounts of waste. This process led to the creation of the waste treatment industry (Hamer, 2013). Due to the low costs of landfilling, dumpsites have emerged as a common way of waste treatment and are impacting their surrounding communities all across the globe (Biswas, Kumara, Babu, Bhattacharyya & Chakrabarti, 2010). On Aruba, the majority of all waste is dumped in the government-owned landfill called the Parkietenbos. The company responsible for this is called Servicio di Limpieza di Aruba (Serlimar). By law, all other forms of unauthorized dumping are illegal (Caceres, 2015). However, in practise, the Parkietenbos is not the only place on the island where waste is dumped. Aruba faces a structural waste management issue based on the large presence of uncontrolled illegal dumpsites. The governmental agency responsible for monitoring these sites, Directie Natuur en Milieu (DNM), has identified at least 19 other dumpsites of which several are still active today (DNM, personal communication, February, 2018).
Additionally, they state that illegal landfill dumping has been a problem since the 1990’s when numerous construction projects created empty sand and granite quarries all over the island. These sites are ideal for this form of waste disposal (DNM, personal communication, February, 2018). The dumpsites have varying ages, waste composition and activity status. However, most dumpsites emerged in the year 2000. (DNM, personal communication, February, 2018). The number and size of dumpsites grew significantly after 2005 after a tipping fee for the main dumpsite, Parkietenbos, was introduced. At this time, companies were charged up to 60$ per ton when getting rid of their waste, which incentivized them to seek cheaper alternatives (DNM, personal communication, February, 2018).
1.2 Relevance of research on dumpsites
Waste dumping in landfills often leads to social problems associated with bad odors and smoke originating from burning of garbage, which makes the surrounding area uninhabitable (Local resident, personal communication, April, 2018). Besides such social impacts, dumpsites can have a negative influence on the local environment and public health through the destruction of local flora and fauna and the spread of leachate (Ell-Fadel, Findikakis & Leckie, 1997; Hamer, 2013). Leachate is a sludge with high concentration of several toxic compounds that forms when precipitation
The impact of illegal dumpsites on the environment:A study on soil parameters, waste composition and mosquito
breeding site presence in Aruban landfills.
Emma Beroske and Fabian Timpen

UAUCU Student Research Exchange Collected Papers 2018
143
combines with partly decomposed waste. Close monitoring of these effects is necessary in order to understand their impact. Documentation and publication on the influence of these dumps on the local environment can help actors, such as waste disposal companies and government institutions to mitigate or prevent the occurrence of negative effects. This is important, not just for Aruba, but for all countries that use landfill dumps as a waste management strategy. Additionally, exploring this topic on Aruba allows to gain scientific insight about the issue within a Caribbean context, which could be further applicable to other Small Island States (SIS). Other nearby islands with similar climate conditions, such as Curacao and Bonaire, can benefit from this type of research as their dumpsites would have similar characteristics and impact. Furthermore, until now, only the effects of the legal Parkietenbos dumpsite in the surrounding mangrove system have been measured (Loosveld, 2015). Thus, more information on the semi-arid ecosystems on the island and the possible effects on local flora and fauna in the non-mangrove context is needed. Moreover, the image Aruba gives to the rest of the world is of great importance for the tourism sector, which is vital for the Aruban economy. Healthy ecosystems, their proper protection and, therefore, sustainable waste management are key in maintaining this positive image and a flourishing tourism industry (Polaszek, Laclé, van Beukering & Wolfs, 2018).
Lastly, the effects of illegal dumpsites relate to multiple of the United Nations’ Sustainable Development Goals put forward in 2015. Firstly, number 11 ‘Sustainable Cities and Communities’ is closely connected as investigating dumpsites’ environmental impact allows to shed light on the issue and can contribute towards the improvement of waste management. Secondly, goals 14 ‘Life Below Water’ and 15 ‘Life on Land’ are also linked as the leachate generated from waste can contaminate and damage surrounding ecosystems on land and in the ocean. Lastly, goal 3 ‘Good Health and Well-Being’ is applicable too since the topic of
environmental health is related to mosquitoes breeding at the landfills which can spread several diseases such as yellow fever and dengue.
1.3 Research approach
This study is a Community Based Research and is executed with the help of two apprentices taking part in the Academic Foundation Year program at the University of Aruba. With their support, samples were collected and analysed more efficiently. Their participation enables the exchange of local and scientific knowledge while raising greater awareness about the issue. Additionally, close collaboration with Directie Natuur en Milieu has been helpful to gather pre-existing information and get access to otherwise inaccessible dumpsites. This collaboration allows for the localization of the dumpsites, along with details on their previous monitoring. Additionally, a better insight into what the organisation needed and how this research could be helpful to them was acquired. Their major concerns are the pollution arising from the dumpsites contaminating nearby gardens and groundwater, along with fire hazards and explosions (DNM, personal communication, February, 2018). Finally, this research is beneficial for the concerned stakeholders, namely nearby neighbors, the municipality and its community as well as the flora and fauna on the island. Overall, clarification on the effects of illegal dumping is provided by putting forward a comprehensive report of their environmental impact, which will be freely accessible to the broader community.
1.3 Research question
Based on the relevance of this topic, especially on Aruba, the main goal of this research is to investigate the following main question:
How do illegal dumpsites on Aruba influence the surrounding environment?
UAUCU Student Research Exchange Collected Papers 2018
144
To explore this, multiple factors are considered. Firstly, it aims to compare soil parameters within the dumpsites to the ones away from them, and to determine the distance up to which the leachate can reach. More specifically, soil parameters such as pH, Electrical Conductivity, chromium and copper concentrations are measured in the soil of 10 illegal Aruban dumpsites as indicators of soil quality. Electrical Conductivity (EC) and pH levels are indicators of soil conditions since they reflect acidity and the presence of inorganic material, such as heavy metals (Ali, Pervaiz, Afzal, Hamid & Yasmin, 2014; Kanmani & Gandhimathi, 2013). Secondly, this research investigates the dumpsites’ waste composition along with their potential for mosquito hazard. In particular, the waste type and the amount of containers considered to be possible breeding sites for mosquitos are established. Examining a variety of dumpsites on the island, hence, allows for a comparison of these sites.
2. Literature Review
The literature review covers different aspects of landfill dumpsites, including their characteristics such as waste composition and activity status. Additionally, their environmental effects are discussed, including heavy metal leaching and changes in soil parameters like pH, organic matter and physical soil properties. Lastly, the breeding habits of mosquitoes and how they relate to dumpsites is explored.
2.1 Characteristics of landfill dumps The main environmental impact of waste dumping in landfills, apart from the presence of solid waste and odor, is the creation of leachate by rainwater. This is caused by a combination of chemical, physical and microbial processes that enable the pollutants from the solid waste to dissolve or be carried away by the excess rainwater (Kjeldsen et al., 2010). This generated leachate affects the soil quality and is responsible for the contamination of surface water
ecosystems and groundwater supplies in numerous regions of the world (Biswas et al., 2010). The leachate features general similarities worldwide because the streams of municipal waste have comparable compositions all over the world. However, varying climatic conditions lead to differentiation in the amount, intensity and duration of leaching per individual landfill (Kjeldsen et al., 2010). Over time, landfills undergo different stages. When waste is added continuously, different parts of the dumpsite may be in different decomposition phases. These phases strongly influence the composition and intensity of the leachate that spills from the landfill (Lisk, 1991; Kjeldsen et al., 2010). In general, it is believed that the reactions in a landfill stabilize over time. The decomposition process starts at an anaerobic phase, it passes through a more acidic phase and ends at a relatively stable methanogenic phase as can be seen in figure 1 (Kjeldsen et al., 2010). These names refer to the large presence of anaerobic bacteria, the increased acidity and the production of methane, which are the main characteristics of each of the respective decomposition phases. The mentioned phases refer mostly to the state of the organic waste present. More stable waste forms, such as construction debris and plastics, are less reactive and take longer to decompose than their organic counterparts. The decomposition phase the dumpsite is in should not be confused with the activity status of such sites. Studies showed that dumpsites that had not seen activity for several years still produce toxic leachate (De, Maiti, Hazra, Debsarkar & Dutta, 2016; Eggen, Moeder & Arukwe, 2010). Even the leachate pollution index (LPI), which looks at 18 different parameters within the leachate, was similar for the active and inactive part of the dumpsite, even after 28 years of inactivity (De et al., 2016). There are four main groups of components that are present in landfill leachate: dissolved organic matter, inorganic macro components, heavy metals and xenobiotic organic compounds. Dissolved organic matter is quantified as

UAUCU Student Research Exchange Collected Papers 2018
145
the total organic carbon. Inorganic macro components include minerals such as ammonium (NH4+), potassium (K+), manganese (Mn2+) and calcium (Ca2+). Heavy metals include the following elements; cadmium (Cd2+), chromium (Cr3+ and Cr6+), copper (Cu2+), lead (Pb2+), nickel (Ni2+) and zinc (Zn2+). The last group, xenobiotic organic compounds, includes mostly toxic chemicals, such as aromatic hydrocarbons, pesticides and plasticizers. These compounds are usually present in low concentration of less than 1 mg/L. Many other components can be present in leachate depending on the dumpsite next to these four most common main constituents (Kjeldsen et al., 2010).
Figure 1.The change in intensity and composition of leachate compounds in landfills over time. In addition to the aforementioned anaerobic, acidic, unstable and stable methanogenic phases later stadia have been included in the diagram. These newer phases are future speculation, since real time data is not available as phase 3 and 4 can both take up to several decades and not many landfills exceed this age. Time progresses from left to right in the figure. Levels of leaching of different compounds are given by the fluctuating Lines in the lower diagram, whilst volume changes are given in the upper part (Kjeldsen et al., 2010).
2.2 Environmental effects of landfill dumpsites The main environmental effects of landfill dumpsites is caused by leachate reaching the groundwater or surface water (Kjeldsen et al. 2010). Additionally, the surrounding environment and soil is directly affected by aforementioned leachate components. Little is known about the extent of horizontal spread of leachate in top soil, but leachate has been estimated to reach up to 50 to 80 meters into the surrounding area (Bielińska & Mocek-Plóciniak, 2009). In areas with sandy soils and good water permeability, the leachate can move deeper into the soil almost instantaneously, and toxic effects are likely to reach deep but not far into the soil (Bielińska & Mocek-Plóciniak, 2009). However, in areas with a high soil water repellency, which is mostly caused by hydrophobic components released by plants and microorganisms (Siteur et al., 2014), rainwater does not infiltrate the soil directly. In this scenario, excess rainwater could freely flow into the surroundings and carry leachate further than normally expected (M. Eppinga, personal communication, January, 2018).
The toxicity of leachate has been studied, especially for aquatic life such as fish, water plants, crustaceans and algae. The most acute effects of landfills are often ascribed to ammonia, which is toxic in higher concentrations (Mwiganga & Kansiime, 2005). Ammonia is considered the leachate component with the strongest long lasting effects, because the compound cannot be broken down naturally in the landfill. Therefore, ammonia levels are only reduced by leaching, which causes ammonia concentrations in the leachate to stay stable and high over the course of decades (Kjeldsen et al., 2010).
2.3 Waste composition Waste composition may also influence the environmental impact of the dumpsites. Composition of waste differs depending on the location, season, socio-economic

UAUCU Student Research Exchange Collected Papers 2018
146
conditions, waste collection or disposal methods along with numerous other factors (Kanmani & Gandhimathi, 2013). This different waste composition, in turn, affects the leachate which corresponds to the rainwater percolating through the waste further interacting with organic substances and other bacteriology activity (Kanmani & Gandhimathi, 2013). Landfills can present a combination of waste, for instance, Municipal Solid Waste (MSW), which includes glass, metals, organic waste, paper, plastic as well as textile. (Manfredi, Tonini & Christensen, 2010). A study on heavy metal contamination of dumpsites in India by Kanmani & Gandhimathi (2013) compared and characterised fresh MSW directly from the garbage trucks and old MSW from the ground to determine the basic solid waste composition. The waste was then divided into several categories, specifically debris, glass, metals, paper, plastics, textile and vegetable waste (Kanmani & Gandhimathi, 2013). The latter was the most present in the fresh litter while the older waste showed large variations with a majority of dead leaves, woodchips and plastics (Kanmani & Gandhimathi, 2013). Another study, conducted by Oketola and Akpotu (2015), investigated dumpsites in Lagos and Nigeria and collected waste samples in 7 sites, which were then characterized. A majority of domestic waste was found in most of the sites investigated. Vegetative matter was predominant in three sites while the other four mainly contained putrescible. In addition, all sites presented nearly equal amounts of scrap metals. This is an indicative factor for the level of development, industrialization and population for both countries, as metals are more often categorized as industrial waste (Oketola & Akpotu, 2015).
Moreover, the majority of E-waste, defined as discarded appliances, which use electricity, is landfilled (Robinson, 2009). These appliances, thus, include telephones, computers as well as domestic appliances, which are most often associated with potential environmental contaminants. Indeed, E-waste is predominantly made of a mixture of metals, copper, aluminum and iron in
particular, along with various plastics and ceramics coverages (Robinson, 2009). Electronic devices and appliances can also be associated with other elements, for instance, Polybrominated diphenyl ethers (PBDEs) used as flame retardants, which are incorporated into plastics. This element can easily leach from the surface of the electronic wastes into the environment also leading to its bioaccumulation in organisms (Robinson, 2009). When E-waste, such as batteries, electronic objects or electro-plating waste is disposed with MSW, the heavy metal concentration in dumpsite increases. During the degradation process under acidic conditions, slow leaching of these metals takes place resulting in a high concentration in the leachates (Kanmani & Gandhimathi, 2013). As landfills can contain a combination of waste, including MSW along with abandoned vehicles and electrical devices, higher concentrations of chromium and copper may be detected. Since these metals are conductors of electricity, their presence would result in increased conductivity levels.
2.4 Activity status
The activity status of a dumpsite influences its environmental impact. Even though it can be assumed that active dumpsites are by nature more damaging to the environment, inactive open dumping sites also affect their surroundings. Depending on how long the site has been inactive, the soil quality may have recovered to more pristine levels as the leachate is diluted by rainwater over time. However, studies have established that the pH of leachate increases as a landfill ages (Biswas et al., 2010). As inactive dumpsites tend to be older than active ones, it may appear that alkaline pH values would be encountered (De et al., 2016). In addition, the assumed longer time frame allows for more decomposition and decay of inorganic material, possibly resulting in increased soil conductivity. The same applies for the concentration of heavy metals such as chromium and copper.

UAUCU Student Research Exchange Collected Papers 2018
147
2.5 Heavy metal leaching
Metals are some of the most hazardous environmental pollutants as physical processes do not lead to their decay. Instead, they tend to remain in the environment for extensive periods while influencing biogeochemical cycles and bio-accumulating in living organisms making their way into the food chain causing long-lasting damages (Kasassi et al., 2008). Despite their natural occurrence in the earth’s crust, heavy metals can also be leached from waste and contaminate the soil profile further influencing the quality of the atmosphere and water bodies (Tchounwou, Yedjou, Patlolla & Sutton, 2012; Jaishankar, Tseten, Anbalagan, Mathew & Beeregowda, 2008). The primary sources of these heavy metals in dumpsites are industrial waste, building materials, mine waste and hazardous substances from household like batteries, dyes, inks or paints (Kanmani & Gandhimathi, 2013; Jaishankar et al., 2014) Copper in particular is extensively used for electroplating, pigments and wood preservation along with cooking utensils, electrical wiring, dye manufacturing, lithography, petroleum refining as well as piping (Akobundu & Nwankwoala, 2013). Because the amount of heavy metals in leachate from dumpsites can be low (Kjeldsen et al., 2010), a small absolute increase still leads to a large proportional increase (Tchounwou et al., 2012; Kasassi et al., 2008). For example, soil samples in Nigeria showed an increase of heavy metals presence of over 200% between dumpsite and non-dumpsite soil (Anikwe & Nwobodo, 2001). Research in Uganda showed results which where even higher with an increase of zinc, lead and copper levels of 600-1300% (Mwiganga & Kansiime, 2005).
Plants take up more heavy metals when they grow close to dumpsites, with increased uptake reaching up to 700-2000% (Anikwe & Nwobodo, 2001). Plants do generally need low levels of metals, but once those levels are exceeded they start to inhibit enzymes and feature
damaged cell structures due to oxidative stress (Chibuike & Obiora, 2001; Iwegbue, Emuh, Isirimah & Egun, 2007). Studies suggest that heavy metals are absorbed through the roots of plants and cause growth delays and decreased robustness (Ali et al., 2014). More specifically, chromium, which can enter the food chain when present in excess amounts, can impact biological factors of plants like barley, cauliflower, citrullus, maize, along with wheat, and lead to decreased root growth, leaf chlorosis, as well as hindered germination (Jaishankar et al., 2014). Plants may also be indirectly affected in their growth due to a decrease of beneficial microorganisms in the soil due to heavy metal toxicity (Chibuike & Obiora 2014; Frey, Stemmer, Widmer, Luster, & Sperisen, 2006; Giller, Witter & Mcgrath, 1998). Such a decrease in microbial activity in the soil was shown in Poland where the microorganism count was significantly lower under dumpsites than in the surrounding area (Breza-Boruta, Lemanowicz, & Bartkowiak, 2016).
Animals can also indirectly take up these heavy metals, either through consumption of the plants or through direct intake of soil and coating leaves (Anikwe & Nwobodo 2001). Such effects were illustrated in a study that looked at recovered insect pupae and goat, sheep and human remains in a heavily polluted area. The research showed that all specimens had high copper and lead decompositions in their bones and teeth which resulted up to 50 times higher concentrations compared to database averages (F.B. Pyatt, A.J. Pyatt, Walker, Sheen, & Grattan, 2005). Such heavy metals are known to be stored in the body for longer times and have long term health effects as they bind to the DNA and nuclear proteins of biological macromolecules leading to their oxidative degradation (Jaishankar et al., 2014), resulting in DNA damage and carcinogenic effects (Knasmüller et al., 1998). This means that even small amounts of heavy metals can still accumulate over time and result in eventual health issues for animals and humans.
UAUCU Student Research Exchange Collected Papers 2018
148
2.6 pH change and increase in organic matter Other effects on the environment are seen through the change in pH levels close to the dumpsites and increased levels of organic matter in the surrounding soil (Anikwe & Nwobodo, 2002; Hamer 2003; Kjeldsen et al., 2010; Mwiganga & Kansiime, 2005). Normally, the increase in organic matter is not directly detrimental, but rather beneficial for plant growth, as organic matter contains numerous nutrients necessary for plant development. However, the change in these soil parameters can often negatively affect the plant and soil communities that were already present. This can lead to a change in species composition due to a lower performance or death of local species (Foy, 1984; Greenberg, Crownover & Gordon, 1997; Mwiganga & Kansiime, 2005). In harsh ecosystems, where the plants are highly adapted to local nutrient scarce climate conditions, a small change can be enough to shift the ecosystem. Additionally, leaching of organic components, especially phosphorus, into water bodies surrounding the dumpsite can lead to excess algae growth. This can subsequently lead to oxygen depletion, which results in the death of fish and other aquatic animals. This process is also known as eutrophication (Mwiganga & Kansiime, 2005). Leachate can either increase or decrease pH values depending on the type of waste dumped and the stage of decomposition of the dumpsite. In the early stages of the landfill, the leachate is often acidic as it passes through the acidic decomposition phase (Kjeldsen et al., 2010) and releases up to a tenfold increase in organic substances than inactive sites (Eggen et al., 2010). Afterwards, the methane producing bacteria use up the free volatile acids, which results in a more alkaline leachate (De et al., 2016). These increased pH levels increase metal toxicity. (Mwiganga & Kansiime, 2005; Chibuike & Obiora, 2014). This can create an unfavorable situation in areas where the leachate is both alkaline and rich in heavy metals.
2.7 Physical soil properties The leaching and presence of the landfill also change the physical properties of the soil, on top of changing chemical properties. Such properties include particle size, particle density and hydraulic conductivity (Anikwe & Nwobodo, 2001). Measurements show that particle size and hydraulic conductivity increased, which can lead to better root penetration, increased soil aeration and better water runoff. These properties are seen as positive plant growth indicators (Anikwe & Nwobodo, 2001). However, these properties also stimulate the spreading of leachate and increase the speed of leaching to surrounding soils and deeper soil levels. These differences are also seen in natural soils. Soils with large portions of sand (70% sand) are highly permeable and promote leachate spreading, whereas soils that are rich in clay and silt (31%) have a low permeability, which results in fast above ground spread of runoff. Both this vertical and horizontal spreading are unfavorable conditions for a landfill dump (Anikwe & Nwobodo, 2001). 2.8 Mosquitoes; Aedes aegypti Mosquitoes go through four distinct phases in their life: egg, larvae, pupae and adult. Of these phases, three are spent in or on water (American Mosquito Control Association, 2018). Therefore, water holding containers are important for mosquitoes, in order to breed and spread. Thus, dumpsites, which are known for presence of solid waste, in combination with rain, can be suitable breeding sites for mosquitos.
The Aedes aegypti, also known as the yellow fever mosquito, is spread throughout most tropical and subtropical regions around the world as it thrives in warm climates and can endure up to 9 dry months a year (Chan K.L. Ho & Chan Y. C.,1971).This mosquito is also known as a vector that spreads dengue, chikungunya, yellow fever and the Zika virus, of which dengue is the fastest re-emerging arbovirus in the
UAUCU Student Research Exchange Collected Papers 2018
149
environmental effects caused by the airborne chemicals. This shows that community based approaches, focused on reducing the number of suitable breeding sites, are more suitable for mosquito and dengue control (Perich et al., 2000).
3. Hypothesis
It can be expected that the investigated active dumpsites are more environmentally impactful than inactive ones, which would be reflected in greater differences in soil parameters and a higher number of suitable containers for mosquitos. However, inactive dumpsites still have potent leachate that would result in a measurable difference between dumpsite and control samples. Furthermore, it is assumed that the dumpsites will contain a variety of waste. In addition, dumpsites presenting a majority of E-waste would have increased presence of heavy metals along with higher conductivity levels.
4. Materials and Methods
4.1 Study area
Aruba is an island of the Kingdom of the Netherlands situated at the most southeastern point of the Caribbean archipelago just 27 kilometers off the coast of Venezuela (Wolfs, Laclé, Bubalo, van Beukering & Pols, 2017). With a surface area of 180 km², the island is 32 km long and 10 km wide (Polaszek et al., 2018). Overall, the territory presents low elevations with the highest point; Mount Jamanota, reaching 189 meters above sea levels (Polaszek et al., 2018). The general climate is dry and windy, which is further classified as tropical steppe, semi-arid hot climate. Temperatures average around 27.9° C while rainfall has been recorded to be 471.1 mm per year (Wolfs et al., 2017).
Over the years, with the development of the island, a number of stone and sand quarries have been dug for the
world (Arunachalam et al. 2010). A. aegypti was eliminated in several countries in the Americas and Caribbean during the 1950’s and 60’s, but in the last 35 years all have been reinfested and were prone to dengue outbreaks (Perich et al. 2000). Additionally, the WHO states that there is only a vaccine for 1 of the 4 subtypes of dengue. This vaccine offers no protection against the other types of dengue. This poses serious problems, as re-infection with a different subtype often leads to more severe and intense symptoms (Dengue vaccine research, 2018). The A. aegypti is known to be highly anthropophilic (prefers to feed on humans), and is prone to areas with a high population density. It often breeds indoors and mostly prefers man-made water holding containers to lay their eggs (Simard et al., 2005). Since the mosquito prefers freshwater containers, anything that can contain rainwater is a potential breeding site. Several studies investigated the spread of A. aegypti pupae (its inactive immature form between larva and adult) in urban areas. In some cases, it was found that 95% of all breeding sites were man-made containers such as earthenware jars, bottles and tin cans (Chan et al.,1971) Other studies have found that containers with a wider opening were more productive compared to small mouthed containers, like bottles (Focks et al., 1981). These types of studies establish the most viable and productive containers, which can be used to formulate the most suitable and effective approach to fight the spread of the mosquito, and, consequently, the diseases it brings, especially since pesticides are often not effective in reaching the most common resting places of mosquitoes, and, thus, cannot eliminate the threat (Perich, Davila, Turner, Garcia, & Nelson, 2000). In addition, it has been found that the A. aegypti has a fly range of at least 840 meters, as opposed to the 50-100 meters that was assumed for a long time (Reiter et al., 1995). Therefore, using pesticides to fight dengue outbreaks would need to cover a large area, which makes it less cost effective and could lead to other detrimental

UAUCU Student Research Exchange Collected Papers 2018
150
In this case, the landfills tend to be loaded with a variety of materials after which they are completely covered with sand which is then leveled out (DNM, personal communication, February, 2018). A selection of 10 of these illegal dumpsites was investigated, 5 of them being active and the other 5 inactive, all scattered across the island (Figure 2). A short description of the different dumpsites is given below, including their surface area, location and surroundings.
construction of various buildings. Despite the existence of the Parkietenbos, these sites have been repurposed and filled up with a diversity of litter often commercial or yard waste leading to the emergence of illegal dumpsites. Although most of these sites are actively being used to dump waste from nearby inhabitants or local companies, some of them have now become inactive. In such sites, the waste has accumulated over the years, often attaining maximum capacity as waste reaches up to ground level.
Figure 2. Map of Aruba with the investigated dumpsites

UAUCU Student Research Exchange Collected Papers 2018
151
and being filled up, as sand and gravel is still being mined on one side and the quarry slowly fills up with waste on the other. Samples were taken in or directly below the area where the most recent thrash is being dumped. Control samples were taken at around 170 meters from this area in the adjacent grassland. Transect measurements were taken, starting at around 100 meters from the waste filled sampling area extending into the nearby grassland while crossing a large barrier made of building debris that marked the end of the dumpsite. Coordinates: 12°32’49.38”N - 70° 0’23.43”WPerimeter: 645 metersSurface area: 22384 square metersWaste composition: yard waste, construction waste, sand, dry algae/seaweed, plastic
BabijnThis dumpsite is located somewhere in the middle of the island. Even though its relative distance to the Northern shore is similar to Moko, its position towards the middle of the island makes that it is situated at the height of Divi resort, rather than the bird sanctuary. A large part of the quarry is still quite deep and has groundwater standing in it. This area was not taken into account when calculating the area of the dump. Only one house is in the close proximity of the dump, while the rest of the area is surrounded by xeric shrubland. Samples were taken in the area of the dumpsite that contained visible heaps of trash. Controls were taken on an inactive part of the dumpsite that was several meters higher than the rest of the area and very close to the xeric shrubland. In the end, it was found that this area used to be an active part of the dumpsite before 2012. Coordinates: 12°32’22.35”N - 69°59’22.52”WPerimeter: 720 metersSurface area: 24917 square metersWaste composition: abandoned cars, building material, sand, metal scrap, plastic debris, yard waste and trees
4.2 Active dumpsites
MataderaThis dumpsite is located on the North-West side of the island at the height of the Bubali bird sanctuary. It is relatively far away from densely populated areas compared to some of the other dumpsites as it is mostly surrounded by a few houses and larger areas of xeric shrubland. The official dumpsite consists of two adjacent sites called Matadera Ruiz and Matadera Dijkhof. Matadera Ruiz has been used for several years and is slowly reaching its full capacity. Matadera Dijkhoff is situated on the West site of the aforementioned dumpsite and has only recently been used to dispose of solid waste. On the East side of Matadera Ruiz, there is another quarry although this one seems to have been relatively undisturbed as little to no waste has been dumped here. For this research, samples were collected on Matadera Ruiz, as it has been active for a longer period of time and was more easily accessible compared to Matadera Dijkhoff. Control samples were taken at around 100 meter distance from the dumpsite at the edge of a dirt road that led to a house. Coordinates: 12°33’6.82”N - 70° 1’25.87”WPerimeter: 398 metersSurface area: 8324 square metersWaste composition: wood, yard waste, metal scrap, construction material, e-waste (fridge), vehicles, plastic MokoThis dumpsite is located on the North-West side of the island and, similar to Matadera is around the height of the Bubali bird sanctuary. However, this dumpsite is relatively closer to the North coast. Similarly to Matadera, it is surrounded by only a few houses and some larger areas of xeric shrubland. On the West side of the dumpsite, there is another empty quarry which compared to the dumpsite, looks pristine as no waste has been dumped there. Uniquely this quarry is in the process of simultaneously expanding

UAUCU Student Research Exchange Collected Papers 2018
152
Mon PosMon pos is located all the way up to the nature area that edges the north coast. It is found more to the East of the island as it is directly North of the Parkietenbos dump. Because it is so far North, little houses are present in the area, except for one that is separated from the dumpsite by a thin line of xeric shrubs and cacti. Most of the dumpsite was covered by sand, and little above ground presence of waste was found. Samples were taken in a transect that was set out from South to North following the water flow direction and started at a little corner of the dumpsite that was not covered by sand. In this area, trash was still clearly visible and at ground level.
Coordinates: 12°31’29.57”N - 69°58’11.56”W Perimeter: 324 metersSurface area: 6684 square metersWaste composition: mostly empty but also yard waste, wood, construction waste
TamarijnThis dumpsite is located just South of Babijn. Since it is closer to Oranjestad, more houses are present in its direct vicinity. Two sides of the dumpsite are looking out over an urban area while the two other face a sizable patch of shrubland. The dumpsite has been recently covered with sand, and no aboveground waste is present at this day. The only thing visible above ground were several metal pipes that stood vertically out of the sand. The pipes emitted a gaseous smell. The dumpsite is situated lower compared to the surroundings, and one side of the dumpsite is marked by a narrow ditch. Samples were taken spread across the covered dumpsite and controls were taken only a few meters away from the dumpsite at the edge of xeric shrubland. However, the controls were taken at a higher elevation than the dumpsite so leachate was not likely to flow in this direction.
Coordinates: 12°32’6.42”N - 69°59’31.00”WPerimeter: 420 metersSurface area: 11523 square metersWaste composition: empty
MeiveldThis dumpsite is located in the middle of the island. However, it is not close to the Northern coast like the other dumps, but rather close to Oranjestad. Compared to the other dumpsites it is surrounded by more houses and less shrublands, although one side is still looking out over a sizable area of shrubs and grasses. Compared to this field, the dumpsite is elevated several meters and looks like a cliff made out of garbage. The samples were taken in two groups, one on top of the cliff, right between the dumped waste and one at the bottom of the cliff, close to the waste. The group on top of the dumpsite was labelled (1) and the other as (2). Lastly, the controls were taken 100 meters away in an adjacent field that was at the same height as the dumpsite. Coordinates: 12°31’15.70”N - 70° 0’30.08”WPerimeter: 337 metersSurface area: 7312 square metersWaste composition: majority of yard waste, wood and construction material and some plastics. Parish HillThis dumpsite was located all the way on the Eastern side of the island on the outskirts of San Nicolas. It is situated close to the Arikok national park on the Northern coast. Only a very few houses were found in the area. Samples were taken in the middle of freshly dumped trash and controls were taken around 160 meters away on the edge of a sand road, close to the xeric shrublands that made up most of the surroundings. Coordinates: 12°27’13.45”N - 69°53’51.86”WPerimeter: 409 metersSurface area: 10447 square metersWaste composition: cars, mattress, yard waste, tires, building waste, plastic and glass bottles, fridges, couches, car parts (door, bumper, seat), cables
4. 3 Inactive dumpsites
UAUCU Student Research Exchange Collected Papers 2018
153
Coordinates: 12°33’50.70”N - 70° 0’54.10”WPerimeter: 427 metersSurface area: 8708 square metersWaste composition: e-waste, car, construction / industrial waste, plastic, household waste, mattress fridge, oven
ShabaThe dumpsite is situated close to Matadera on the North-West side of the island at the height of the Bubali bird sanctuary. The inactive dumpsite is enclosed by walls and is, thus, not accessible to the public. Just outside of the wall, the site was surrounded by houses on all sides. A large pit was found in the middle of the dumpsite. It was largely covered with trash. but a small part had groundwater standing in it. Measurements were taken along a transect that started at the edge of the pit and waste, and led over a grass field. The transect followed the slope of the area and ended close to the wall that surrounded the area.
Coordinates: 12°33’4.95”N - 70° 1’44.17”WPerimeter: 300 metersSurface area: 5619 square metersWaste composition: yard waste, wood, construction waste
4.4 Sample collection
Previous studies have most frequently investigated dumpsites all around the world by comparing the soil parameters within the dumpsite to a control site away from the waste. For example, a research conducted in Pakistan explored the soil characteristics of a dumpsite in Islamabad, which was divided into sectors. Samples were collected in the sector used for waste dumping and compared to samples taken in three other sectors within the city used as control sites (Ali et al., 2014). Nevertheless, the leachate composition can differ from one area of a dumpsite to another indicating that the environmental impact may also vary (Biswas et al., 2010). Therefore, a transect can be used to explore the leachate gradient and determine the extent of
Lagabena Lagabena is situated closest to the Arikok national park from all the dumpsites studied. It is situated North of San Nicolas and the Spanish lagoon. The dumpsite consists of several quarries, of which some are completely filled and others, partly. The one furthest away from the road was still completely empty and was filled with grazing goats instead. At the entrance of the dumpsite, a Shoco couple was nesting in a heap of construction waste. It is also interesting to note that the dumpsite is recorded to be one of the oldest on the island as it originally emerged in the 1980s. Samples were taken spread out over the completely filled quarry. Control samples were collected closer to the road in a patch of grass and shrubland at around 85 meters away from the dump.
Coordinates: 12°30’31.85”N - 69°57’22.26”W Perimeter: 986 metersSurface area: 34963 square metersWaste composition: yard waste, wood (pallets, trees), construction waste, metal scrap, tires, plastic debris
Alto VistaThis dumpsite is situated all the way North of the island, even further North than the Bubali bird sanctuary. The dumpsite is in a relatively urban area, even though the South side is neighbouring a large patch of xeric shrubland. The urban setting is surprising as it is situated close to the North coast, where, in general, little houses are present. The dumpsite itself was largely covered with sand and overgrown with grass. However, the area which was furthest away from the road was uncovered. Nevertheless, this area was partly overgrown by vegetation. Samples were taken in a transect from the uncovered part towards the road, over the covered part of the dump. There was a slight slope against the transect direction. Samples were also taken spread over the uncovered part of the dumpsite in order to compare this area to other dumpsites.

UAUCU Student Research Exchange Collected Papers 2018
154
the leachate flow. Samples were collected at every 0.5 meters within the first 5 meters of the dumpsite. The first sample was taken at the edge of the waste at d=0. From 5 to 16 meters, samples were taken every meter and from 16 to 71 meters, samples were taken every 5 meters. This resulted in a 71 meter transect with a total of 33 samples divided over three groups each containing 11 samples and having a set interval between them. Samples were collected in Ziplock bags, labelled and marked on a digital map.
MataderaNumber of samples: 20 within - 20 controls Explanation for taken approach: Non accessible surroundings and unclear dumpsite boundaries to identify a starting point prevented a transect measurement.
MokoNumber of samples: 20 within - 12 controls - 33 transectExplanation for taken approach: Possibility of transect into an adjacent field. Part of the transect samples were used to serve a double role as control samples.
Meiveld Number of samples: 40 within - 20 controls Explanation for taken approach: A clear slope against the dumpsite, which prevented runoff flow of leachate into the surroundings, made a transect measurement obsolete.
Babijn Number of samples: 20 within - 20 controls Explanation for taken approach: Non accessible surroundings and unclear dumpsite boundaries to identify a starting point prevented a transect measurement.
Parish Hill Number of samples: 20 within - 20 controls Explanation for taken approach: Non accessible surroundings prevented a transect measurement.
the contamination. For instance, a study by Akinbile (2012) found that the mean pH of a dumpsite was between 6.9 and 7.5 but the values decreased as the distance from the site increased (Akinbile, 2012). In addition, the heavy metal presence was found to be more pronounced between 0 and 10 meters away from the dumpsite, which implied toxic pollution (Akinbile, 2012). Thus, using a transect method allows to determine how far away from the dumpsite the leachate reaches.
Based on these methods used by previous studies and depending on the characteristics of the dumpsite and its surroundings, different methodological approaches were used for the collection of samples. In specific cases, a combination of the different approaches was used. The different methods are described below, and, afterwards, the reasoning behind the chosen approach for each dumpsite is shortly explained
• Method 1: A total of 20 samples of topsoil (1-7 cm depth) were collected with shovels as close to the waste piles as possible and stored in Ziplock bags until testing. Another 20 samples were taken further away from the waste in an area, which was deemed to be uncontaminated. These samples were taken from the outskirts of the dumpsite or outside of the dumpsite and are, hence, used as a control in order to compare the different soil parameters to an area unaffected by the dump. Samples were numbered physically and their location was marked on a digital map.
• Method 2: To measure out the strength and reach of pollutants leaching from a dumpsite, samples were taken along a transect that started at the edge of the dumpsite. Samples of topsoil (1-7 cm depth) were collected at short intervals on this transect. The intervals between the different measurements got progressively bigger as they move away from the dumpsite. When possible, a downward slope of the terrain was used to lay out the transect in order to accommodate to

UAUCU Student Research Exchange Collected Papers 2018
155
waste type was counted and divided into the Municipal Solid Waste, E-waste and Vehicles categories. Objects belonging to a certain waste type, but which could not be entirely distinguished, were scored under the ‘unidentifiable’ or ‘other’ subsections. Mon Pos and Tamarijn were excluded from this method as both inactive dumpsites presented mostly empty terrains since their waste was buried underground.
Estimating mosquito breeding sites:
For this objective several dumpsites were selected in order to look at breeding sites for mosquitoes, especially, Aedes aegypti. Because of the dry season, no productive containers could be established on the dumpsites. Therefore, containers were classified rather on availability than productiveness in order to sketch a picture of the role dumpsites could play in helping mosquitos breed and spread on the island. For smaller dumpsites with a limited amount of containers, all of them were counted and measured in order to calculate their volume. For larger sites, several areas of 3 by 3 meters were plotted in which all of the containers were counted and measured. The total amount and volume of containers was then estimated by multiplying the average of the plots against the area of the dumpsite that was characterised by the presence of aboveground solid waste.
4. 5 Sample analysis
Samples collected from the 10 dumpsites were all tested for pH and EC levels with a waterproof handheld multimeter. The samples were prepared for analysis by mixing soil from the samples with demineralised water in test tubes in a 1:1 volume ratio. The mixture was shaken until homogenized and poured into a container where both probes from the combined multimeter were able to reach the solution simultaneously. This was done in order to correct pH values for temperature, which was measured by the EC probe. pH and EC levels were hence determined for all samples
Mon Pos Number of samples: 33 transectExplanation for taken approach: Large area of the dumpsite was covered with sand. The small pile of waste left in open air that was still present was used as the starting point for the transect.
Tamarijn Number of samples: 20 within - 20 controls Explanation for taken approach: Non accessible surroundings prevented a transect measurement.
Lagebena Number of samples: 20 within - 20 controls Explanation for taken approach: Non accessible surroundings prevented a transect measurement.
Alto VistaNumber of samples: 20 within - 33 transect Explanation for taken approach: Possibility of transect into an adjacent field. Even though there seemed to be a small slope against the transect direction, it seemed interesting to establish if this affected leachate flow. Within dumpsite measurements were taken to compare dumps between each other.
Shaba Number of samples: 29 transectExplanation for taken approach: Possibility of a (partial) transect into the surroundings. Main mass of waste was inaccessible for in dumpsite measurements.
Estimating waste composition:
A representative section of all dumpsites was chosen to obtain an approximate number of the waste composition except for Mon Pos and Tamarijn. An area of 3 by 3 meters was plotted where the types of waste encountered were scored using a data sheet. The absolute number of each

UAUCU Student Research Exchange Collected Papers 2018
156
5. Results
5.1 Soil parameters
The average pH and EC values that were found within each of the dumpsites and their corresponding control area are displayed in Table 1. A common pattern of lower pH values within the dumpsite compared to away from it is frequently noticed, namely, for Babijn, Matadera, Meiveld, Moko, Parish Hill and Lagabena. However, the opposite is found for Tamarijn. The other two dumpsites, Shaba and Mon Pos are not included as no within dumpsite measurements were taken here.
For electrical conductivity, a pattern of high average conductivity values near the dumpsite compared to lower ones away from it can be observed. Electrical conductivity results are not included for Matadera and Meiveld as the values showed to have too much discrepancy due to the usage of different brands of distilled water during testing. Table 2 shows the mean heavy metal concentrations in the four dumpsites. A higher concentration of heavy metals is found within almost all dumping sites compared to their control area. The highest mean values are seen in Matadera where they reach 0.152 mg/L of chromium and 2.001 mg/L of copper.
once a stable value was reached on the device. The probes were rinsed with demineralised water in between each measurements.
In addition, samples taken from 4 dumpsites, namely, Babijn, Matadera, Meiveld and Lagabena were further analyzed for the presence of the heavy metals chromium (Cr6+) and copper (Cu2+) with an DR900 handheld colorimeter. Every other sample (1,3,5,.. etc.) was tested, which resulted in 10 tested samples for both the control and within dumpsite samples. The samples were mixed with distilled water in a test tubes in a 1:1.4 volume ratio. This was done instead of a 1:1 ratio in order to ensure that 20 milliliters of clear solution would be available for testing. After swirling the mixture and letting it sit for at least 16 hours, the clear layer that formed at the top of the test tube was extracted. Two samples of 10 milliliters were pipetted into the appropriate test tubes provided by the colorimeter. Untreated samples were shaken for a few seconds and used as the baseline measurement for the machine. Afterwards, the contents of the according powder pillow sachets were poured into the test vials. These contain chemicals that turn purple when they come in contact with the metals in question. The tubes were shaken for 20-30 seconds and a timer was set for 2 and 5 minutes for the copper and chromium measurements respectively. The change in concentration was measured and noted down after the timer ended. 4.6 Statistical analysis
Both Excel and SPSS softwares were used to categorize and analyze the data. Independent T-tests were run in order to compare the means of the soil parameters of each dumpsite compared to their respective control area. For transect measurements, the correlation between the distance from the dumpsite and its soil parameters were determined by computing a Pearson’s and Spearman’s rho correlation coefficient for the different transect measurements.
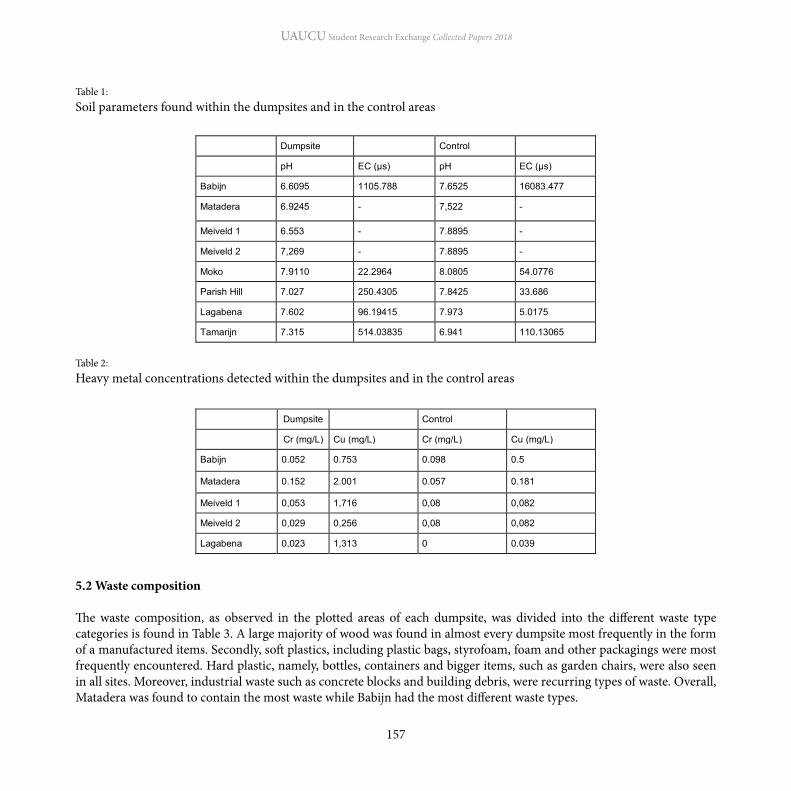
UAUCU Student Research Exchange Collected Papers 2018
157
Table 1: Soil parameters found within the dumpsites and in the control areas
Table 2: Heavy metal concentrations detected within the dumpsites and in the control areas
5.2 Waste composition
The waste composition, as observed in the plotted areas of each dumpsite, was divided into the different waste type categories is found in Table 3. A large majority of wood was found in almost every dumpsite most frequently in the form of a manufactured items. Secondly, soft plastics, including plastic bags, styrofoam, foam and other packagings were most frequently encountered. Hard plastic, namely, bottles, containers and bigger items, such as garden chairs, were also seen in all sites. Moreover, industrial waste such as concrete blocks and building debris, were recurring types of waste. Overall, Matadera was found to contain the most waste while Babijn had the most different waste types.
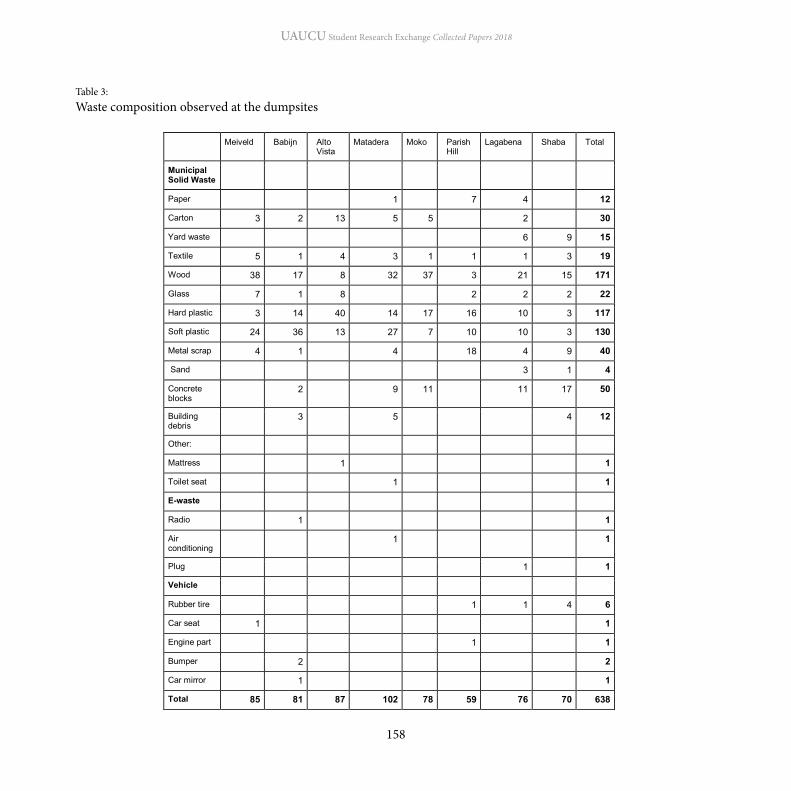
UAUCU Student Research Exchange Collected Papers 2018
158
Table 3: Waste composition observed at the dumpsites
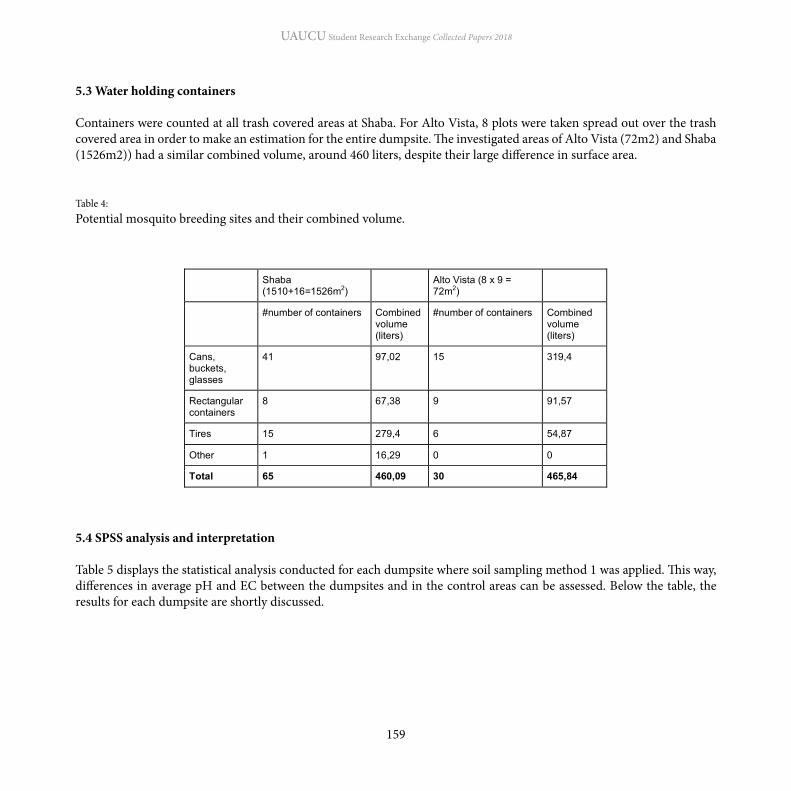
UAUCU Student Research Exchange Collected Papers 2018
159
Table 4: Potential mosquito breeding sites and their combined volume.
5.3 Water holding containers
Containers were counted at all trash covered areas at Shaba. For Alto Vista, 8 plots were taken spread out over the trash covered area in order to make an estimation for the entire dumpsite. The investigated areas of Alto Vista (72m2) and Shaba (1526m2)) had a similar combined volume, around 460 liters, despite their large difference in surface area.
5.4 SPSS analysis and interpretation
Table 5 displays the statistical analysis conducted for each dumpsite where soil sampling method 1 was applied. This way, differences in average pH and EC between the dumpsites and in the control areas can be assessed. Below the table, the results for each dumpsite are shortly discussed.

UAUCU Student Research Exchange Collected Papers 2018
160
Table 5: Statistical findings of soil parameters within waste dumping sites and their control areas
* Significant difference at 0.05 level (2-tailed). ** Significant difference at 0.01 level (2-tailed).

UAUCU Student Research Exchange Collected Papers 2018
161
BabijnFor Babijn, the mean pH and EC nearby the waste are 6.61 and 1105.788 µs, respectively, while in the control samples, average values are 7.6525 for pH and 16083.477 µs. The difference in pH between the two sites is seen to be significantly different (p = 0.00).
LagabenaDespite the small difference in average pH within the dumpsite in comparison to the control area with values being 7.6 and 7.98, respectively, it was found to be significant (p = 0.03). Similarly, the conductivity levels are significantly different (p = 0.01) with increased mean EC within the dumpsite compared to away from it as the levels are seen to be 96.194 µs and 5.0175 µs respectively.
MokoNo significant difference in mean was found for the soil parameters within Moko with pH and EC levels averaging to 7.9110 and 22.2964 µs, respectively, within the dumpsite and 8.0805 and 54.0776 µs in the control area. In this dumpsite, the conductivity was actually found to be higher away from the waste than within.
Parish HillIn Parish Hill, comparable pH levels were found near the waste and away from it with values attaining 7.027 and 7.8425, respectively. This difference in means is found to be significant (p = 0.00). On the contrary, the EC levels are not significant, but are also found to be higher within the sites than away from it as the conductivity is 250.4305 µs and 33.686 µs, respectively. The fact that the difference is not significant may be explained by an outlier, which is reflected in the high variation in conductivity levels detected in the within dump soil samples.
TamarijnSignificant results can be observed for Tamarijn at 0.05 level as the pH and EC values are 7.315 and 514.04 µs, respectively, within the site and 6.941 and 110.13065 µs in the control, with significance values of (p = 0.014) and (p = 0.015).The pH in the inactive site appears to be more neutral than the slightly acidic values found in the control area.
MataderaSignificant differences in average pH (p = 0.00) are also obtained in Matadera with values seen to be 6.9245 within the dumpsites compared to 7.522 at the control site.
MeiveldSignificant pH differences (p = 0.00) are seen in Meiveld when comparing the area at the top of the cliff near the waste to the control site as well as the bottom of the cliff. Indeed, the values were found to be 6.87 at the top and 7.19 at the bottom compared to 7.89 in the control area. The difference in pH between the top and the control is seen to be the greatest out of all dumpsites.

UAUCU Student Research Exchange Collected Papers 2018
162
For the transect method, correlation coefficients, specifically Spearman’s and Pearson’s coefficients were obtained for the relationship between distance from the dumpsite and the soil parameters as shown in table 6 and 7 below. Below the tables, the results for each dumpsite are shortly discussed.
Table 6: Correlational findings between the distance and the soil parameters of the dumpsites
Table 7: Correlational findings between the distance and the soil parameters of the dumpsites
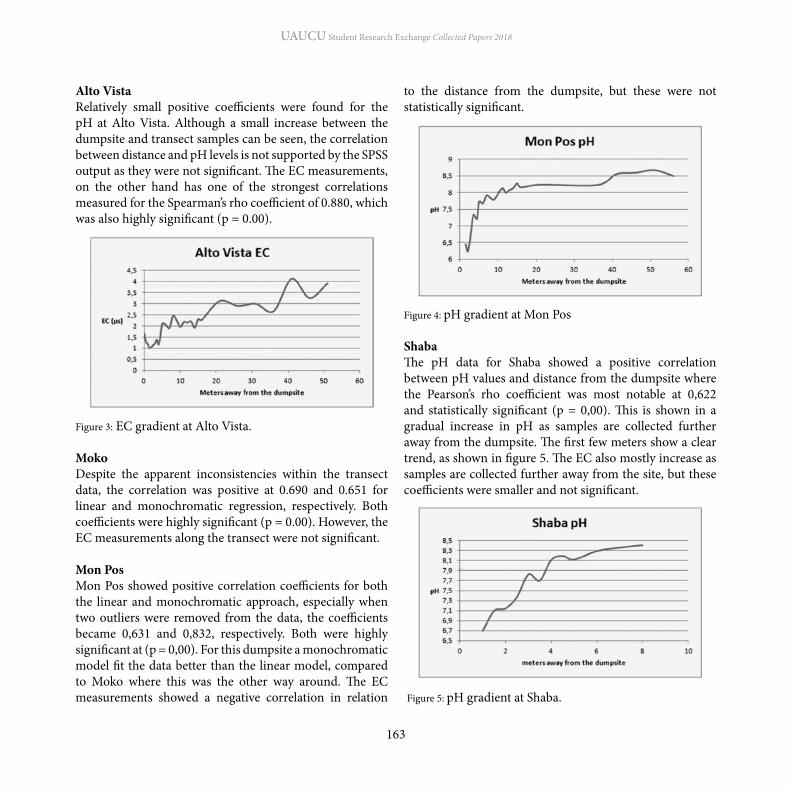
UAUCU Student Research Exchange Collected Papers 2018
163
to the distance from the dumpsite, but these were not statistically significant.
Figure 4: pH gradient at Mon Pos
ShabaThe pH data for Shaba showed a positive correlation between pH values and distance from the dumpsite where the Pearson’s rho coefficient was most notable at 0,622 and statistically significant (p = 0,00). This is shown in a gradual increase in pH as samples are collected further away from the dumpsite. The first few meters show a clear trend, as shown in figure 5. The EC also mostly increase as samples are collected further away from the site, but these coefficients were smaller and not significant.
Figure 5: pH gradient at Shaba.
Alto VistaRelatively small positive coefficients were found for the pH at Alto Vista. Although a small increase between the dumpsite and transect samples can be seen, the correlation between distance and pH levels is not supported by the SPSS output as they were not significant. The EC measurements, on the other hand has one of the strongest correlations measured for the Spearman’s rho coefficient of 0.880, which was also highly significant (p = 0.00).
Figure 3: EC gradient at Alto Vista. MokoDespite the apparent inconsistencies within the transect data, the correlation was positive at 0.690 and 0.651 for linear and monochromatic regression, respectively. Both coefficients were highly significant (p = 0.00). However, the EC measurements along the transect were not significant.
Mon PosMon Pos showed positive correlation coefficients for both the linear and monochromatic approach, especially when two outliers were removed from the data, the coefficients became 0,631 and 0,832, respectively. Both were highly significant at (p = 0,00). For this dumpsite a monochromatic model fit the data better than the linear model, compared to Moko where this was the other way around. The EC measurements showed a negative correlation in relation

UAUCU Student Research Exchange Collected Papers 2018
164
the only exception to this, where chromium levels were higher in control than dumpsite soil. Matadera had the highest chromium and copper concentrations compared to all tested sites. Additionally, this site also possessed the greatest number of waste items per plot. This is in agreement with the results of a study that has previously found that the quantity of waste dumped greatly influences the pH, conductivity and heavy metals available (Ali et al., 2014). The soil parameters suggest that Meiveld and Matadera are the most environmentally impactful out of the 10 assessed dumpsites. As both sites are still highly operational, this finding would be in line with the idea that active dumpsites are (at least slightly) more damaging to the environment than inactive ones as decomposition processes tend to stabilize over time.
When looking into the transect approach, a leachate gradient was observed with lower pH close to the waste and higher values in the samples collected progressively away from the site. These increasing values with increasing distance from the site are not in accordance with results found in a previous study by Akinbile (2012) and the results found for the dumpsite-control comparisons. It was found that leachate spread was measurable up to 20 meters from the dumpsite, especially when the transect was set out to follow the water flow direction. An opposite trend is seen in the conductivity measurement of Moko and Mon Pos where values get increasingly lower away from the dump. Despite the general trends that were found for EC measurements, there were also many differences between the sites. At Alto Vista for example, the EC measurements seemed to get lower close to the dumpsite compared to most other sites where an opposite trend was found. Evidently, dumpsites and their effects are heavily dependent on the waste dumped and the characteristics of their location.
Most of the dumpsites were similar in waste composition with regards to industrial wastes. The large amounts of building debris, concrete blocks and metal scraps
6. Discussion and conclusion
Comparison of different sites and explanations
Investigating soil parameters of various illegal dumpsites in Aruba has allowed for the comparison of different dumpsites and their respective control areas, in order to establish which dumpsite had the largest environmental impact. Overall, all dumpsites had lower pH values than their surroundings, with the exception of Tamarijn that showed an opposite trend. The mean pH of the dumpsites were between 6.55 and 7.91, which is in line with results found in a study by Oketola and Akpotu (2015) and indicates that most sites are in the anaerobic decomposition stage. This was also in accordance with the theory that dumpsites undergo an acidic decomposition phase at the start of their lifespan. These pH values are in agreement with the relatively young age of the Aruban dumpsites, especially because the difference in pH between dumpsites and control samples was relatively smaller in the older Lagabena site compared to the younger active sites. Furthermore, Meiveld was seen to have the largest pH difference when comparing the values close to the waste to the ones in the control. For Tamarijn, the unexpected reverse difference in pH may be due to the sand that has been used to cover the waste, which has neutral properties. Apparently, the sand hinders the detection of the leachate from the underground waste as no increased acidity was found in the newly added topsoil. It can still be assumed that the leachate is present, but that it only seeps downward and may be contaminating groundwater systems. However, it is still unexpected that the xeric shrubland surroundings were relatively acidic compared to other control sites on the island.
Concerning heavy metal testing, all dumpsite soil contained copper concentrations, several magnitudes higher than their control counterparts. This was, to a lesser extent, also, the case for chromium. Babijn was

UAUCU Student Research Exchange Collected Papers 2018
165
the time of this research. To obtain more significant results, it would, hence, be recommended to choose control areas further away from the waste, in areas that are certainly not contaminated.
Suggestions for future research
The results found in this study focus mainly on horizontal spread and intensity of leachate. For future studies, it would be advisable to also look into vertical spread of leachate on Aruba. Even though groundwater is not used as a source for drinking water, the area over which leachate could spread once it reaches the groundwater greatly increases compared to the area covered by the above ground runoff. Additionally, several other soil parameters could be investigated, such as chemical and biological oxygen demand. Furthermore, it would be interesting to look into the release of volatile components, such as harmful gases from dumpsites, as this has not been done before. Lastly, the social aspects of dumpsites could be further explored. Several elements, such as the reasoning behind the use of illegal dumpsites or the negative effects perceived by local residents in the area surrounding dumpsites, could be investigated. Policy and suggestions
This study shows a significantly impactful effect on the soil arising from the disposal of waste. In order to improve on the illegal dumping situation, suggestions can be put forward. Firstly, a fine system should be established and enforced when people are caught throwing out their waste in illegal dumpsites. For this to work, additional monitoring of the dumpsites is recommended. Not just by the DNM, but also by the local police forces. Such policy may discourage individuals from dumping and put an end to the practice. Secondly, more resources and incentives should be given to promote recycling, which may allow to decrease the amount of waste disposed. In the end, it is impossible to monitor the entire island for illegal dumping. It is simply
encountered reflect the high industrialization levels of the island. This substantial presence of inorganic material in all dumpsites, whether in the form of industrial waste or plastics, can be related to the observed increased conductivity levels (Kanmani & Gandhimathi, 2013). The two dumpsites at which the water holding containers were counted are Alto Vista and Shaba. Even though more containers were found at Shaba, their combined volume was similar to the total of the containers measured at Alto Vista. This shows that there is difference in size and density of water holding containers for Alto Vista and Shaba. When taking into account that the measured area of Alto Vista was about 21 times smaller, but the total area covered in trash is slightly larger, it can be concluded that Alto Vista is a more suitable habitat for mosquitos. Both dumpsites contained numerous tires, which made up a large part of the total volume. It is surprising that the trash composition data showed that not all dumpsites contained tires. This suggest that on top of the size difference there is also a difference in container composition present at different dumpsites, which can directly influences their suitability as a mosquito breeding site.
Research limitations
Despite the fact that several significant results were found, a number of limitations were encountered when conducting samples analysis. Firstly, large discrepancies in conductivity values were found for Babijn, Matadera and Lagebena due to the fact that different brands of distilled water were used for testing the samples. In order to obtain more reliable data, these samples will be retested with the same water type after publication of this book. Furthermore, it appeared that the electrical conductivity values were found to be higher in the control samples than within the Babijn and Moko. This may be due to the fact that the selected areas thought to be uncontaminated may have previously been part of the dumpsite, but were unrecognisable as such at

UAUCU Student Research Exchange Collected Papers 2018
166
• Biswas, A. K., Kumara, S., Babu, S. S., Bhattacharyya, J. K. & Chakrabarti, T. (2010). Studies on environmental quality in and around municipal solid waste dumpsite. Resources, Conservation and Recycling, 55(2),129-134
• Bielińska, E. J., & Mocek-Płóciniak, A. G. N. I. E. S. Z. K. A. (2009). Impact of uncontrolled waste dumping on soil chemical and biochemical properties. Archives of Environmental Protection, 35(3), 101-107.
• Breza-Boruta, B., Lemanowicz, J., & Bartkowiak, A. (2016). Variation in biological and physicochemical parameters of the soil affected by uncontrolled landfill sites. Environmental Earth Sciences, 75(3), 201.
• Caceres, F. (2015, April). Legal perspectives on solid waste management in Aruba. In Mijts, E., Ballentyne, J. (Eds.), UAUCU Undergraduates Student Research Exchange Collected Paper 2015, (pp. 69-74). Oranjestad, University of Aruba.
• Chan, K. L., Ho, B. C., & Chan, Y. C. (1971). Aedes aegypti (L.) and Aedes albopictus (Skuse) in Singapore city: 2. Larval habitats. Bulletin of the World Health Organization, 44(5), 629.
• Chibuike, G. U., & Obiora, S. C. (2014). Heavy metal polluted soils: effect on plants and bioremediation methods. Applied and Environmental Soil Science, 2014.’
• De, S., Maiti, S. K., Hazra, T., Debsarkar, A., & Dutta, A. (2016). Leachate characterization and identification of dominant pollutants using leachate pollution index for an uncontrolled landfill site. Global journal of environmental science and management, 2(2), 177.
• Dengue vaccine research. (n.d.). Retrieved April 04, 2018, from http://www.who.int/immunization/research/development/dengue_vaccines/en/
• Eggen, T., Moeder, M., & Arukwe, A. (2010). Municipal landfill leachates: a significant source for new and emerging pollutants. Science of the Total Environment, 408(21), 5147-5157.
• El-Fadel, M., Findikakis, A. N., Leckie, J. O. (1997). Environmental Impacts of Solid Waste Landfilling.
an additional incentive not to dump waste illegally. An important aspect to consider would be for inhabitants’ mindsets on waste management practices to change. More awareness and education on waste, recycling and negative effects of waste on the environment are crucial in order to reach this goal. The Earth and Environment module taught in the Academic Foundation Year and the future green faculty (STEM) at the University of Aruba are steps in the right direction.
Bibliography
• American Mosquito Control Association, Life Cycle. (n.d.). Retrieved April 12, 2018, from http://www.mosquito.org/page/lifecycle
• Akinbile, C. O. (2012). Environmental Impact of Landfill on Groundwater Quality and Agricultural Soils in Nigeria. Soil & Water Res., 7(1): 18–26
• Akobundu, A. N., & Nwankwoala, H. O. (2013). Evaluation of Heavy Metal in Soils from Enyimba Dumpsite in Aba, Southeastern Nigeria Using Contamination Factor and Geo-Accumulation Index. Energy and Environment Research, 3(1), 125-134
• Ali, S. M., Pervaiz, A., Afzal, B., Hamid, N., & Yasmin, A. (2014). Open dumping of municipal solid waste and its hazardous impacts on soil and vegetation diversity at waste dumping sites of Islamabad city. Journal of King Saud University - Science, 26(1), 59-65.
• Anikwe, M. A. N., & Nwobodo, K. C. A. (2002). Long term effect of municipal waste disposal on soil properties and productivity of sites used for urban agriculture in Abakaliki, Nigeria. Bioresource Technology, 83(3), 241-250.
• Arunachalam, N., Tana, S., Espino, F., Kittayapong, P., Abeyewickrem, W., Wai, K. T., ... & Petzold, M. (2010). Eco-bio-social determinants of dengue vector breeding: a multicountry study in urban and periurban Asia. Bulletin of the world Health Organization, 88(3), 173-184.

UAUCU Student Research Exchange Collected Papers 2018
167
Zabaniotoua, A., Tsiouvarasc, K., Nastisc, A., Tzafeiropoulouc., K. (2008). Soil contamination by heavy metals: Measurements from a closed unlined landfill. Bioresource Technology, 99 (18), 8578-8584
• Kjeldsen, P., Barlaz, M. A., Rooker, A. P., Baun, A., Ledin, A., & Christensen, T. H. (2002). Present and long-term composition of MSW landfill leachate: a review. Critical reviews in environmental science and technology, 32(4), 297-336.
• Knasmüller, S., Gottmann, E., Steinkellner, H., Fomin, A., Pickl, C., Paschke, A., ... & Kundi, M. (1998). Detection of genotoxic effects of heavy metal contaminated soils with plant bioassays. Mutation Research/Genetic Toxicology and Environmental Mutagenesis, 420(1), 37-48.
• Lisk, D. J. (1991). Environmental effects of landfills. Science of the total environment, 100, 415-468.
• Loosveld, R. (2015). Where does the Parkietenbos Landfill end? A waste and pH-gradient assessment. In Mijts, E., Ballentyne, J.(Eds.), UAUCU Undergraduate Students Research Exchange Collected Papers 2015, (pp. 76-84). Oranjestad, University of Aruba.
• Manfredi, S., Tonini, D. & Christensen, T. H. (2010). Contribution of individual waste fractions to the environmental impacts from landfilling of municipal solid waste. Waste Management. 30(3). 433-440
• Mwiganga, M., & Kansiime, F. (2005). The impact of Mpererwe landfill in Kampala–Uganda, on the surrounding environment. Physics and Chemistry of the Earth, Parts A/B/C, 30(11), 744-750.
• Oketola, A. A., & Akpotu, S. O. (2015). Assessment of solid waste and dumpsite leachate and topsoil. Chemistry and Ecology, 31(2), 134-146
• Perich, M. J., Davila, G., Turner, A., Garcia, A., & Nelson, M. (2000). Behavior of resting Aedes aegypti (Culicidae: Diptera) and its relation to ultra-low volume adulticide efficacy in Panama City, Panama. Journal of Medical Entomology, 37(4), 541-546
• Polaszek, T., Laclé, F., van Beukering, P., & Wolfs, E.
Journal of Environmental Management, 50 (1), 1-25 • Focks, D. A., Sackett, S. R., Bailey, D. L., & Dame,
D. A. (1981). Observations on container-breeding mosquitoes in New Orleans, Louisiana, with an estimate of the population density of Aedes aegypti (L.). The American journal of tropical medicine and hygiene, 30(6), 1329-1335.
• Foy, C. D. (1984). Physiological effects of hydrogen, aluminum, and manganese toxicities in acid soil. Soil acidity and liming, (soilacidityandl), 57-97.
• Frey, B., Stemmer, M., Widmer, F., Luster, J., & Sperisen, C. (2006). Microbial activity and community structure of a soil after heavy metal contamination in a model forest ecosystem. Soil Biology and Biochemistry, 38(7), 1745-1756.
• Giller, K. E., Witter, E., & Mcgrath, S. P. (1998). Toxicity of heavy metals to microorganisms and microbial processes in agricultural soils: a review. Soil Biology and Biochemistry, 30(10), 1389-1414.
• Greenberg, C. H., Crownover, S. H., & Gordon, D. R. (1997). Roadside soils: a corridor for invasion of xeric shrub by nonindigenous plants.
• Hamer, G. (2003). Solid waste treatment and disposal: effects on public health and environmental safety. Biotechnology Advances, 22(1), 71-79.
• Iwegbue, C. M. A., Emuh, F. N., Isirimah, N. O., & Egun, A. C. (2007). Fractionation, characterization and speciation of heavy metals in composts and compost-amended soils. African Journal of Biotechnology, 6(2), 067-078.
• Jaishankar, M., Tseten, T., Anbalagan, N., Mathew, B. B., & Beeregowda, K. N. (2014). Toxicity, mechanism and health effects of some heavy metals. Interdisciplinary Toxicology, 7(2), 60–72.
• Kanmani, S., Gandhimathi, R. (2013). Assessment of heavy metal contamination in soil due to leachate migration from an open dumping site. Applied Water Science, 3(1), 193–20
• Kasassia, A., Rakimbeib, P., Karagiannidisb, A.,

UAUCU Student Research Exchange Collected Papers 2018
168
(2018). The Economics of Ecosystems and Biodiversity, Aruba, 1-129
• Pyatt, F. B., Pyatt, A. J., Walker, C., Sheen, T., & Grattan, J. P. (2005). The heavy metal content of skeletons from an ancient metalliferous polluted area in southern Jordan with particular reference to bioaccumulation and human health. Ecotoxicology and Environmental Safety, 60(3), 295-300.
• Reiter, P., Amador, M. A., Anderson, R. A., & Clark, G. G. (1995). Dispersal of Aedes aegypti in an urban area after blood feeding as demonstrated by rubidium-marked eggs. The American journal of tropical medicine and hygiene, 52(2), 177-179.
• Robinson, B. H. (2009). E-waste: An assessment of global production and environmental impacts. Science of The Total Environment, 408(2), 183-191
• Simard, F., Nchoutpouen, E., Toto, J. C., & Fontenille, D. (2005). Geographic distribution and breeding site preference of Aedes albopictus and Aedes aegypti (Diptera: Culicidae) in Cameroon, Central Africa. Journal of medical entomology, 42(5), 726-731.
• Siteur, K., Eppinga, M. B., Karssenberg, D., Baudena, M., Bierkens, M. F., & Rietkerk, M. (2014). How will increases in rainfall intensity affect semiarid ecosystems?. Water Resources Research, 50(7), 5980-6001.
• Tchounwou, P. B., Yedjou, C. G., Patlolla, A. K., & Sutton, D. J. (2012). Heavy metals toxicity and the environment. Experientia Supplementum, 101, 133-164
• Wolfs, E., Laclé. F., Bubalo, M., van Beukering, P., & Pols, R. (2017). Cultural Ecosystem Service (CES) for Local Community in Aruba, 1 - 99

UAUCU Student Research Exchange Collected Papers 2018
169
The first time I signed up for the UAUCU program, I was hesitant to do so. The reason for this is because of me being shy to participate in something new. However, I decided to challenge myself and take on the opportunity to collaborate with other students from abroad. I was nervous about getting into and starting the program seeing that I knew what was going to be done through the few months it lasts and the end results that are expected from you.
Upon meeting my colleagues and the students from the University of Utrecht, I became more comfortable and motivated to participate in the program. I was able to receive the support and motivation from my peers that made the journey to complete the research more possible to execute. However, over the period of the program, not everything went as smooth as I expected it would be. I found myself being stuck and faced with obstacles that demotivated me and made me feel as if I would not be able to continue with
the program. Due to the help and support that I received from my teachers and peers, I was able to pick myself back up and find a separate way to finish my research.
I believe that this program was able to teach me the importance and knowledge of the Sustainable Development Goals (SDG’s). This is because through my years in university I did not really find an interest in doing research in relation to SDG’s; however, this program focuses a lot on SDG’s and I found myself learning about the importance and development of the SDG’s and how it relates to my research topic. In other words, this program and collaboration has helped me immensely to prepare for my thesis in many ways and with the help from my teachers and peers, I was able to learn more from them.
All in all, I am grateful for the opportunity that I have received to further grow and develop as a future professional, and for the advice, help and support that I received from everyone that was involved in the program.
Stephanie Arango, University of Aruba

UAUCU Student Research Exchange Collected Papers 2018
170
Introduction
First and foremost, it is important to state that this research concept still needs to be executed in the year 2018. All the information that is provided in this research will serve as the foundation when executing the research along with the steps that will be taken together with the results that may be expected once the research is completed.
According to Zinyemba (2014), “Misrepresentation can occur during a selection process when an eloquent communicator can get the job only to be realized later that he is incapable or does not have the right qualifications or experience” (p. 30). When it comes to hiring new employees into the organization, managers have a specific recruitment procedure that they follow to make sure that the employee that they are interviewing is qualified for the job position and the company. However, the steps and procedures that are followed to determine the qualification of the employee to the job position do not always end up resulting in a positive outcome for the company. When employees are placed in the wrong position or company, the employees can end up causing conflict within the culture of the workplace due to their unhappiness in the company. Apart from causing conflict within the culture of the workplace, other consequences that come from putting employees in the wrong position or company are high absenteeism and
low productivity. Managers can go through the steps and recruitment procedure as they are supposed to and still end up hiring the wrong employee for the wrong job position and company.
The company that will be used for this research topic is the franchise Renaissance Resort & Casino. The reason for selecting this organization is because the researcher has a personal history with the company. The researcher has previously worked with the company such as for a summer job, a part-time and internship. As a result, the researcher was also able to easily have contact with managers of the company, and to receive their enthusiasm about the topic and cooperation.
The topic of this thesis is about the managers of the Renaissance Aruba hiring the right kind of people for the right job position to avoid the employees being unhappy in the wrong job position which can bring conflict in the workplace culture, lead to high absenteeism and low productivity which can result in high turnover. The reason for selecting this topic is because the researcher has experienced situations in which people are placed in a job position that does not suit their personality or the characteristics they possess. Therefore, the researcher has been curious as to what happens at the recruitment procedure that would have this type of result and would want to look for how to improve the recruitment
Improving the Recruitment Procedure at the Renaissance Aruba Resort & Casino
Designing New Methods for More Effective Procedures
Stephanie Arango

UAUCU Student Research Exchange Collected Papers 2018
171
procedure and make it more effective to avoid placing the wrong person in the wrong position.
The relevance of this research within the area of sustainable development comes from connecting the Sustainable Development Goals (SDG) with the topic. Since the topic of the research is about designing new methods to improve the recruitment procedure at the Renaissance Aruba Resort & Casino, the following SDG’s will be used for this research: - Goal 8 → Decent Work and Economic Growth - Goal 10 → Reduced Inequalities
Goal 8 is about promoting inclusive and sustainable economic growth, employment and decent work for all. According to the United Nations website about the SDG, many people in the world are still having trouble escaping poverty which means that there needs to be a change in the economic and social policies that are present to eliminate poverty. Therefore, sustainable economic growth will require societies to create the conditions that allow people to have quality jobs, job opportunities, and decent working conditions that stimulate the economy without harming the environment. Society’s way of deciding how to select their future employers are changing. “Society’s expectations of business are changing, and an increasing number of applicants pre-assess the social and environmental performance of companies before choosing an employer” (World Business Council for Sustainable Development, p. 5). Therefore, companies must start coming up with new methods for their recruitment policies to attract future employees. Many people want to be able to be a part of a company that incorporates sustainable development into their procedures and culture.
Goal 10 is about reducing inequality within and among countries. There have been many attempts to reduce poverty in the least developed countries; however, inequality continues, and an enormous difference remains in certain areas. According to the United Nations website:There is a growing consensus that economic growth is not
sufficient to reduce poverty if it does not involve the three dimensions of sustainable development – economic, social and environmental. To reduce inequality, policies should be universal in principle paying attention to the needs of disadvantaged and marginalized populations. (Sustainable Development Goals, n.d.).
When it comes to recruitment processes, many people believe that there is a negative influence of power, relationships and money involved. The reason for this is because, according to a policy brief, “most pupils from poor households, especially those from mountainous ethnic minority areas were found to be inferior in terms of education quality when they reached higher levels of education” (Increasing Inequality: What Do People Think?, 2013, p. 5). Because many of these pupils are unable to attend higher educational universities, it is difficult for them to be recruited for future jobs, which shows that there is an inequality in job opportunities for them. Therefore, the policy suggests that “policies need to develop and execute a transparent recruitment process in order to create an equality of opportunity in transferring education investment into job opportunities” (Increasing Inequality: What Do People Think?, 2013, p. 9). In other words, recruitment policies need to be adjusted to introduce new methods in equality of job opportunities because this would be a start in reducing the inequality.
The relevance of this research to the Aruban community is the following. Aruba is considered a small island state, which means that they are very much dependent on tourism (Social Security Panel: Advances in Coverage, Quality and Financing Countries of the Region: The Aruban Experience, 2007). This means that “the dependence of SIDS on tourism means, amongst other things, that a large proportion of employment occurs in the tourist industry or in tourism related activities” (Briguglio & Briguglio, n.d., p. 1). Employment in the tourism sector is important to small states, such as Aruba, which means that these employments must be effective. The reason for this is because companies must be able to

UAUCU Student Research Exchange Collected Papers 2018
172
recruit people who would be able to aid in giving tourists an exceptional experience for them to be able to return in the future. In other words, tourists come to the island of Aruba to enjoy and have a wonderful experience. These experiences are judged, for the most part, based on the employees whom they meet during the journey. If employees are friendly, welcoming and dedicated to giving the tourists a wonderful experience, then this can help in making the tourist return to the island in the future with even more people (friends and family), whereas if the tourist goes through a bad experience, then they would not likely return. All in all, if the company hires the most effective employees for the job, then this can aid in generating more income for the economy of the island. The main research question for this research will be the following: “How can improvements be made at the Renaissance Aruba towards a more effective recruitment policy to position future employees better?”
In order to help answer the main research question, the following five (5) sub-questions have been developed:1. What aspects do the managers of the Renaissance Aruba
take into account when recruiting new personnel?2. How do the managers know if an employee fits well into
the job position that they are given?3. What are causes for putting an employee in the wrong
job position during recruitment?4. Which factors contribute to an effective recruitment?5. Which factors obstruct an effective recruitment?
The method that will be used for this thesis is qualitative research in the form of conducting interviews. The reason for choosing to do a qualitative research with interviews is because with this type of approach, the interviewees have the freedom to speak and explain as much as they want, which helps the researcher receive detailed explorative insights about the process of the recruitment at the franchise Renaissance Resort & Casino and the experiences from the executive and staff members by conducting interviews.
Context
The Renaissance Aruba Resort & Casino is a hotel, which consists of approximately 800 employees. The Renaissance Aruba Resort & Casino is a franchise and is part of the Marriott brand and the hotel started as part of MetaCorp. The role of MetaCorp is to establish policies and procedures, similar to those of the Marriott, as well as supervise, direct and control its subsidiaries while managing the finances to insure its long-term viability and growth.
In 2017, the Renaissance Aruba was bought by Wind Creek Hospitality, which is a hospitality and gaming operations company from Alabama. Even though the Renaissance Aruba has new owners, it will still stay as part of the Marriott brand.
The Renaissance Aruba Resort and Casino, which is located in the heart of downtown Oranjestad, boasts two distinct resorts: one for families, and one exclusively for adults. Both offer excellent dining, shopping and endless entertainment. The Renaissance Marina Hotel is an adults-only area with a sophisticated ambiance suited to singles and couples. For a family vacation, the Renaissance Ocean Suites has ample rooms and activities for everyone in the family. Every guest is welcome to board a complimentary water taxi and set out for Aruba’s only private beaches, located on Renaissance Island and is just an 8-minute water taxi ride away.
Mission and Vision
The Renaissance Aruba Resort & Casino is a work place where all employees are respected members of a team providing the best quality of service to the guests. Due to this, the resort strives to be the preferred destination in Aruba and in the Caribbean. The casinos strive to attain and create the ultimate gaming experience by providing the best service, and the best quality of games in an impressive and unique atmosphere. They accomplish this every day by making sure that their entire team maintains a positive attitude and works towards

UAUCU Student Research Exchange Collected Papers 2018
173
excellence. Team pride is their motivation to support each other and to provide a clean, friendly and safe environment for the guests and for each other. The staff acts with respect to all guests and their professional skills prevail and current working conditions is one of the motivating engines of the hotel (The Renaissance Aruba Resort & Casino, 2017).
The vision of the hotel is that all employees should contribute to the development and progress of the company (The Renaissance Aruba Resort & Casino, 2017).
HistoryWhile looking up information about the Renaissance Aruba, the researcher realized that there was no timeline present about the history of the Renaissance hotel (franchise). Therefore, the researcher approached and contacted some executive members of the Renaissance Aruba to receive the contact information of past executive members of the Renaissance Aruba. After contacting and speaking to the past executive members of the Renaissance Aruba, the researcher was able to develop the following timeline.
Meta Corp started in 1920 with the establishment of a movie theatre, projecting silent movies in an open lot adjacent to the current immigration office in Oranjestad. With time, more theatres were built, and the company evolved to the point where it owned and operated nine theatres utilizing advanced technology. Tropical Bottling Company, which became a new business venture for MetaCorp, was incorporated in 1948 to bottle and distributes Coca Cola products and in time expanded into a brewery and distributor for international liquor brands. In 1949, Associated Transport Company, another new business venture, was established to haul materials and supplies for Exxon’s Lago Oil Refinery; this company expanded to Curacao, Bonaire and Venezuela and diversified into many areas including stevedoring, coal mining and marketing, ready mix concrete, block making, civil works etc. In 1990, MetaCorp expanded its real estate activities to include
a three-hundred room resort hotel in Aruba with the luxurious Crystal Casino and an attractive shopping center. Expanded in 1993, this complex, known as Renaissance resort comprises 560 hotel rooms, two casinos, 160 shops and restaurant, a convention center, a marina and a private reef island. In 2011, a Renaissance resort was established in Curacao. Transport and movie subsidiaries were also established in Curacao. From May to October 2017, Wind Creek Hospitality (WCH) bought the Renaissance Aruba & Curacao. This means that Meta Corp would no longer be the owners of the Renaissance and WCH would be the new owners; however, the resort would still be part of the Marriott brand. Moreover, since WCH became the new owners of the resort, that meant the HR policies would be adjusted to match those of Wind Creek. In other words, the policies of the Renaissance Aruba & Curacao would be adjusted to match those of both Renaissance and Wind Creek.

UAUCU Student Research Exchange Collected Papers 2018
174
1 Literature Review and Theoretical FrameworkIn this chapter, relevant literature about the research topic will be provided along with a theoretical framework. Moreover, this chapter will, firstly, look at the important aspects that are considered at a recruitment procedure such as the skills, characteristics and qualifications, and the organizational culture. Secondly, potential causes for putting someone in the wrong position in a company will be discussed, followed by the obstructing and contributing factors to an effective recruitment procedure. Finally, a theoretical framework model will be presented.
1.1 Aspects that are Considered at a Recruitment ProcedureAccording to Perry (2002), “some of the most important decisions a manager will make involve employee hiring. It is individuals that drive an organization, create the culture, and determine whether the organization succeeds or fails. The task of hiring staff, therefore, is one that should be taken very seriously. Wrong choices can be costly to an organization in more than just financial terms” (p. 154). Due to this, it is important to determine the aspects that are considered at a recruitment procedure.
1.1.1. Skills, Characteristics and QualificationsWhen speaking of recruitment procedure, it is understood as “a proactive process of ensuring that the organization has the requisite skills and experience which cannot be easily built from within but sourced from outside the organization” (Zinyemba, 2014, p. 29). In other words, attracting people who are interested in the job and organization, and are able to do this job in the organization. After attracting potential candidates, the organization will have a “pool” of candidates to choose from that they feel will be qualified for the job. While analyzing the potential candidates, managers look at different aspects of the candidates to determine their qualification. In this research, the term qualifications, or more specifically a qualified person, will be defined as a person who possesses or fits the requirements of the job position. According to Newton, Hurstfield, Miller, Page and Akroyd
(2005), employers would look at the skills, characteristics and qualifications of the candidates. Employers would seek candidates who are motivated, honest, reliable and possess certain skills that would be helpful or important for the job that they are hiring for. Furthermore, according to Bogatova (2017), “in order to hire the most suitable and talented employees, it is important not only to identify the best skills and specifications needed, but also to choose the most suitable sources where the candidates can be reached. Therefore, it is crucial to know the sources of recruitment and understand which of them could bring talented people to the company” (p. 6). Moreover, according to Dictionary.com (2018) the term of Skills is defined as, “the ability, coming from one’s knowledge, practice, aptitude, etc., to do something well”.
1.1.2. Organizational CultureThe final step in the recruitment procedure is the selection of the best and right candidate for the job position. The right employee is usually selected because they possess the qualities that the company and the job require them to have. Moreover, by choosing the right candidate(s) for the job means that the employer believes that they fit well into the culture and job of the organization. The fit at the organization is actually a key factor when it comes hiring new employees because the culture of an organization plays a crucial role in the company functioning effectively (Rollinson, 2008). To understand the reason for this, it is important to define the term organizational culture. According to the book Organizational Behaviour and Analysis: An Integrated Approach, written in 2008 by Rollinson, organizational culture is:A pattern of basic assumptions – invented, discovered or developed by a given group as it learns to cope with its problems of external adaptation and internal integration – that has worked well enough to be considered valuable and, therefore, to be taught to new members as the correct way to perceive, think and feel in relation to those problems. (p. 591). In other words, the organizational culture is the way employees and managers act during certain situations.

UAUCU Student Research Exchange Collected Papers 2018
175
Also, according to Bolman and Deal (2013), “Culture forms the superglue that bonds an organization, unites people, and helps and enterprise accomplish desired ends” (p. 248). When speaking of organizational culture, it is understood as the organization’s visions, beliefs, values, norms, symbols, language, rituals, etc. Therefore, the culture of an organization is a key factor in creating a strong organization that functions more effectively due to the unity amongst the employees in the company. If there is conflict within the culture of the workplace, then this can lead to the organization performing poorly. Furthermore, “Poor ‘chemistry’ between a new addition to your team and your existing team (including yourself) sabotages the success of new hires more often than anything else – including incompetence” (Recruiting the Right People, n.a, n.d.). In other words, by selecting the final candidate for the job, the employer feels that the new employee is the best and most effective candidate for the company. According to Sun (2015), “’the best’ is not to say that achievement is the highest, but to require that personal knowledge level, attitude, motivation and emotion could be matched with the job and organization’s culture” (p. 44).
Furthermore, according to the book The Tracks We leave: Ethics in Healthcare Management, written in 2002 by Perry: In addition to knowledge, skills, talents, and experience, smart managers will seek out prospective recruits who reflect integrity and strong character. It is much easier to “teach” knowledge and skills than it is to “teach” integrity and character. Managers often look for new employees whom they feel will be a “good fit” in the organization, who will “play well with others”. Equally important is the employee who is interesting and pleasant with a positive attitude about work and about life in general. Positive employees of strong character contribute greatly to productivity, morale, and to an ethical work environment. (p. 155).
1.2 Causes for Putting an Employee in the Wrong PositionAccording to the article “Exploring the Causes of Recruiting Failure”, written in 2015 by Sun, there are four key causes of
recruiting failure which are (1) lack of Human Resource Plan (HRP) and recruitment plan, (2) lack of choice of recruiting channels, (3) lack of a reasonable personnel test, and (4) lack of a recruiting feedback system. Firstly, HRP is an overall personnel plan which can ensure that all the decisions made are consistent with the strategic goals of the organization. Therefore, without an HRP, the organization will not have a structure for their recruitment planning and procedure.
Secondly, through the process of recruitment advertising, companies will need to expand their ways of attracting new candidates through social media, for example. According to the article “Employee Recruitment: Current Knowledge and Important Areas for Future Research”, written in 2008 by Breaugh:… numerous types of advertisements exist, and they can have different effects. For example, an individual who is not actively looking for a job may not see a newspaper ad, but may be “reached” by a radio or television ad. In terms of the amount of information conveyed in a job advertisement, research has shown that ads with more information resulted in a job opening being viewed as more attractive and as more credible than ads that contained less information. Research also has shown that advertisement that contain more specific information about a position increased applicant interest in the position and may result in better person-organization fit. (p. 113).In other words, the recruitment channels used and the way that the information about the position is brought forward can cause unfit people to come and apply for the job. Therefore, the information that is brought forward must clearly explain the knowledge, skills, qualifications and characteristics that the company is looking for, which will in turn lead to attracting the right kind of people.
Thirdly, to hire the most effective employees for your organization, it is crucial to conduct a personnel test. According to Baez (2013):Many employers utilize personality tests in the employment selection process to identify people who have more than just

UAUCU Student Research Exchange Collected Papers 2018
176
the knowledge and skills necessary to be successful in their jobs. If anecdotes are to be believed, the work place is full of people whose personalities are a mismatch for the positions they hold. Psychology has the ability to measure personality and emotional intelligence (“EQ”), which can provide employers with data to use in the selection process. “Personality refers to an individual’s unique constellation of consistent behavioral traits” and “emotional intelligence consists of the ability to perceive and express emotion, assimilate emotion in thought, understand and reason with emotion, and regulate emotion”. By using a scientific approach in hiring, employers can increase their number of successful employees. (Par. 1). Therefore, by conducting a certain psychology/personality tests, it can be determined if the employee that is being hired truly fits into the job position and organization. Other than the required knowledge and skills, managers or employers can be able to determine if the employee possesses the right personality for the job and the company.
Additionally, information on resumes may sometimes be exaggerated or false. Once the applicants’ resumes have been reviewed, the next step is to select the best candidates for the job. Finally, after finding and hiring the candidates, it is important to conduct feedback on the recruitment to check the data of the procedure and knowing what could be better for next time.
Apart from the four above-mentioned causes, there are also two other causes that play a role in putting an employee in the wrong position, which are the labor market and inexperienced managers. When it comes to the labor market, according to Singh (2013):Employment conditions in the community where the organization is located will influence the recruiting efforts of the organization. If there is surplus of manpower at the time of recruitment, even informal attempts at the time of recruiting like notice boards display of the requisition or announcement in the meeting etc. will attract more than enough applicants. (par. 7).
In other words, depending on the demand and supply of employment at the organization, it can affect the recruitment process by making it easier or more difficult to hire employees. For example, if there is a demand for workers with knowledge of Information Technology (IT) in a nearby organization and the supply for the specific IT knowledge is high, then the organization would have an easier and effective recruitment process due to the large pool of applicants.
Furthermore, another possible cause for putting employees in the wrong position may also lie on the managers who hire the employees, more specifically, the inexperienced managers. For this research, an inexperienced manager will be defined as a manager who does not yet possess all the knowledge or skills to perform and execute important managerial tasks. Inexperienced managers sometimes look to hire staff who may be easy to control. They may be afraid to hire someone “smarter” than they are for fear of losing full authority. While experienced managers know that to achieve organizational goals, it is important to recruit and hire bright people for key positions who will bring needed skills and talents to the tasks at hand. (Perry, 2002, p. 155).
1.3 Contribution and Obstruction Factors to an Effective RecruitmentThere are several factors that play a role in an effective recruitment. These factors can obstruct and/or contribute to the recruitment procedures. Contributing factors are factors that play a role in helping to make the recruitment procedure more effective, and obstructing factors are those that hinder or prevent an effective recruitment procedure. According to the article “An Analytical Study on Determining Effective Factors for Recruiting Right Person”, written in 2012 by Rahman and Islam, there are several factors mentioned that affect the recruitment and selection process which are both controllable (internal) and uncontrollable (external) factors. This means that these factors are those that the organizations can or cannot control. In this thesis, the controllable (internal) factors will be known as the contributing factors,

UAUCU Student Research Exchange Collected Papers 2018
177
When speaking of the labor market, it is about the availability of employment and work. It depends on the demand and supply of the labor market if the applicant pool will be effective in the sense that there will be a selection of effective people to choose from during a recruitment procedure or selection process.
Second of all, factors of social, cultural and political environment also play a role because sometimes when there are changes in these environments, it can have a direct influence on the recruitment policy of the organization. For example, when it comes to the social and cultural environment, it is important to mention that these environments are about the beliefs and behaviors of people and the society in which they live in. Society is constantly changing which results in people changing their beliefs and behaviors as well. As mentioned earlier, since more people have started to become interested in sustainable development, it makes that they would like to be employed by an organization that has sustainable development in its workforce culture and procedures. Such as society, the political environment also changes whenever the government changes which means that when the government changes, the laws change. These laws are those that are incorporated into the recruitment procedures that companies follow such as health regulations.
Finally, another obstructing factor for effective recruitment is the competition between companies within the same industry. “When competitors are few and roughly equal in size, they watch each other carefully to make sure that any move by another firm is matched by an equal countermove” (Hunger & Wheelen, 2011, p. 39). Therefore, all companies, whether in the hospitality industry or not, will be competing to attract the attention of qualified candidates and in order to beat their competitors, they will need to have a better offer to avoid losing their best candidates.
1.4 Theoretical FrameworkFor this thesis, the above-mentioned literature review went over all the aspects, causes and factors for effective or ineffective
and the uncontrollable (external) factors will be known as the obstructing factors.
There are four internal factors affecting the recruitment and selection functions of a company, according to Rahman and Islam. First of all, the organizational recruiting policy needs to be clear and efficient. “Organizations with recruiting policies tend to spend relatively large sums on training and development programs so as to prepare employees for higher-level jobs” (Rahman & Islam, 2012, p. 52).
Second, the authors further mention that it is crucial for requirements to be known when hiring new employees because the company needs to know the set of knowledge or skills that the employees need in the company, and the characteristics the employees need to have such as personal attributes, good health, pleasant manners, no significant disabilities in voice, hearing and eyesight.
The third one is motivation. Motivation is something that the organization needs to have when it comes to recruitment because recruiting employees with no interest or motivation will only lead to the organization hiring the wrong people for the company.
According to the same authors, three external factors that affect the recruitment and selection functions of a company. First of all, the labor market plays a major factor in the creating of the recruitment procedures for the following reason:Labor market affects the size and quality of the applicant pool which in turn affects the choice of selection methods. Labor market constitutes the force of demand and supply of labor of particular importance. For instance, if demand for a particular skill is high relative to its supply, the recruitment process evolves more efforts. Contrary to it, if supply is more than demand, the recruitment process will be easier. Both scenarios influence the recruitment process and activities. (Rahman & Islam, 2012, p. 53).
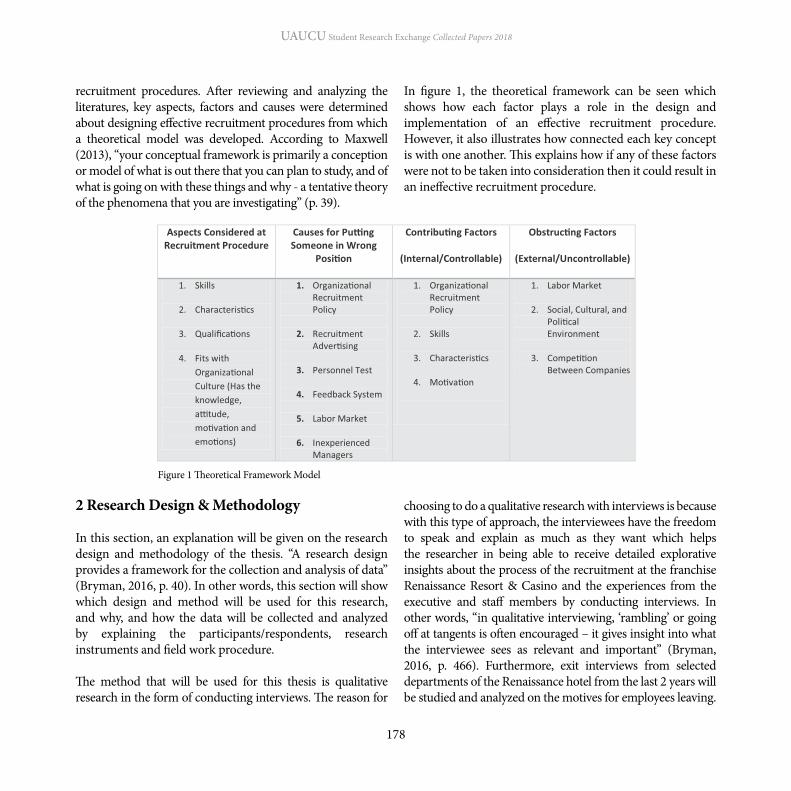
UAUCU Student Research Exchange Collected Papers 2018
178
recruitment procedures. After reviewing and analyzing the literatures, key aspects, factors and causes were determined about designing effective recruitment procedures from which a theoretical model was developed. According to Maxwell (2013), “your conceptual framework is primarily a conception or model of what is out there that you can plan to study, and of what is going on with these things and why - a tentative theory of the phenomena that you are investigating” (p. 39).
In figure 1, the theoretical framework can be seen which shows how each factor plays a role in the design and implementation of an effective recruitment procedure. However, it also illustrates how connected each key concept is with one another. This explains how if any of these factors were not to be taken into consideration then it could result in an ineffective recruitment procedure.
2 Research Design & Methodology
In this section, an explanation will be given on the research design and methodology of the thesis. “A research design provides a framework for the collection and analysis of data” (Bryman, 2016, p. 40). In other words, this section will show which design and method will be used for this research, and why, and how the data will be collected and analyzed by explaining the participants/respondents, research instruments and field work procedure.
The method that will be used for this thesis is qualitative research in the form of conducting interviews. The reason for
choosing to do a qualitative research with interviews is because with this type of approach, the interviewees have the freedom to speak and explain as much as they want which helps the researcher in being able to receive detailed explorative insights about the process of the recruitment at the franchise Renaissance Resort & Casino and the experiences from the executive and staff members by conducting interviews. In other words, “in qualitative interviewing, ‘rambling’ or going off at tangents is often encouraged – it gives insight into what the interviewee sees as relevant and important” (Bryman, 2016, p. 466). Furthermore, exit interviews from selected departments of the Renaissance hotel from the last 2 years will be studied and analyzed on the motives for employees leaving.
Figure 1 Theoretical Framework Model

UAUCU Student Research Exchange Collected Papers 2018
179
2.1 RespondentsTo collect data through the interviews, the researcher will need to select respondents. This thesis will be directed on the recruitment procedure of the Renaissance Aruba and the reason for choosing this organization is due to the researcher having a personal history with the company such as a summer job, a part-time and an internship. As a result, the researcher was able to easily have contact with the managers of the company, and the HR department was enthusiastic about the topic. The respondents will be managers/employees of the selected organization and since the Renaissance hotel consists of approximately 800 employees, as mentioned earlier, the pool of respondents will be narrowed down to four departments; Human Resources (HR), Front Office (FO) and Food & Beverage (F&B) and the Casino department. The reason for narrowing down to these four departments is because the HR, FO and F&B departments are the ones that have the highest employee turnover. This means in these three departments, there are more employees who enter and leave the department and/or organization. The Casino department serves as the best practice department which is, in other words, a department with the least employee turnover. This means that this department has been selected to receive a better understanding and view of how they do their recruitment procedure and then do a comparison with the above-mentioned departments that have more changes in employees.
Furthermore, the respondents of this research will be selected through theoretical sampling. “Theoretical sampling is the process of data collection for generating theory whereby the analyst jointly collects, codes and analyzes his data and decides what data to collect next and where to find them” (Bryman, 2016, p. 411). Since the managers of the hotel are the ones in charge of interviewing and recruiting new employees, the managers of the four chosen departments will be interviewed to receive their perspective of how the procedure goes and what they look
at when hiring new employees. After interviewing the managers of the departments, the researcher will ask the managers for permission to interview some employees of their department. However, in this case, the researcher will ask the managers to select employees. The most important criteria for the managers to consider when selecting the team-members, will be that the employees must be those who have been working with the company the longest (most years in service) for them to be interviewed for the research. The reason for this is because these employees might be able to share their knowledge and experience about why certain employees end up leaving or not fitting well into the organization. The employees have a more day-to-day personal contact unlike the managers; therefore, they are able to explain where the issues lie with hiring and keeping adequate employees.
In figure 2 below, an overview can be seen of the number of employees and managers that will be interviewed of each chosen department for the research.
Figure 2 Overview of Participants
As mentioned, respondents that were selected for this thesis are both managers and employees of the Renaissance Aruba Resort & Casino. The reason for choosing this is because managers and employees have different experiences and views when it comes to employee turnover; therefore, the researcher will be able to receive perspectives and opinions of both parties. According to the book Strategic Human Resource Management: A Balanced Approach, written in 2010 by Boselie, “high turnover rates are not good for an organization, for example because of the loss of valuable (human) resources, but extremely low turnover rates might also be bad for the organization, indicating little or no flexibility and mobility of employees” (p. 59). Therefore, it would be important to distinguish the difference of opinion between managers and employees when it comes to turnover.
2.2 InstrumentsSemi-structured interviews will be conducted to collect data at the Renaissance hotel. According to Bryman (2016), with semi-structured interviews, it is meant that the researcher will have a list of questions or specific topics to be covered during the interview; however, the interviewee has the freedom and flexibility to reply as they would like to and questions that were not made prior to the interview may be asked during the interview based on the replies of the interviewee. The topic list or interview will be available in two different languages, which are English and Papiamento. The reason for this is because some employees might understand better or be more comfortable with Papiamento, and others with English.
The researcher will contact the selected respondents to set up interview dates and will ask for permission of the respondents to use a voice recorder to record the interview sessions. This will be done through the use of a consent form where the researcher would emphasize the confidentiality and anonymity of the respondents to assure that the sensitive information provided during the interviews will be kept private. The reason for this is because according to Bryman
(2016), the issue with privacy is that the participants want for certain information to be kept confidential and anonymous; therefore, it is important for the participants to provide their consent. Furthermore, when it comes to interview transcripts, summaries and field notes, these will sometimes contain names of the respondents or individuals mentioned by the respondent as well as information that points at one specific individual. In order to respect the anonymity of the selected respondents, it is therefore necessary to erase or sometimes change information (Fink, 2000).
2.3 Role of ResearcherDuring the process of collecting data through interviews, it will be the role of the researcher to make sure that the respondents understand the goal of the research, their decision to participate, and that they feel safe and comfortable in sharing their knowledge and information about their company. The researcher must make sure that the interview feels more like a conversation rather than an interrogation. The researcher must explain to the respondents that any sensitive information that is shared will be kept confidential and private. To do this, the researcher will, as mentioned, provide the respondents with a confidentiality form.
When doing and conducting field research, it is crucial for the researcher to carry out the research in an ethical manner. Ethics is about the way the researcher treats the participants and behaves while conducting the research. According to Bryman (2016), behaving ethically means that no harm should come to the research participants, their privacy should not be invaded, they should not be lied to or cheated, and the participants should agree to participate and know what the research is about (p. 125). Therefore, the researcher will make sure to behave and treat the research participants in an ethical manner during the research process.
2.4 Fieldwork ProcedureIn this section, steps will be mentioned of how the field work procedure will be done. In other words, this will show the

UAUCU Student Research Exchange Collected Papers 2018
181
data to refer to the extraction of key themes in one’s data” (p. 697). In other words, the researcher will analyze the data by summarizing the conducted interviews and selecting key words (themes) that have been repeated and used the most to have a better overview of the results. “Repetition is probably one of the most common criteria for establishing that a pattern within the data warrants being considered a theme” (Bryman, 2016, p. 586). Therefore, once all of the data from the interviews has been collected and summarized, the researcher will determine the themes in the answers of the respondents to create an overview of the results.
3 Results and Recommendations
Once the research is completed, it would be expected that the Renaissance Aruba Resort & Casino would have their own recruitment policy that they follow when hiring new people for the company. However, once the current recruitment policy is analyzed and possible problems are determined, then this can be a start in determining where the main problems or gaps of the policy lie.
Recruitment procedures are carried out differently based on the job that the employer is recruiting people for. According to Chanda, Bansal and Chanda (2010), organizations need to choose selection methods that are suitable for the job. Given the type of job, the methods should be consistent. Some of these methods may include application forms, interviews, references, assessment centres and formal tests (as cited in Argue, 2015, p. 21). Therefore, the current recruitment procedure of the hotel would need to be analyzed to determine if there is only one recruitment policy for all the jobs in the resort.
To design a new method to improve the recruitment procedure at the Renaissance Aruba Resort & Casino, the following steps ideally should be taken. According to Dessler (2013), the traditional way to envision recruitment and selection is as follows:
readers the steps that the researcher took when conducting this research from start to finish.
After completing some desktop research in which the researcher looks for relevant articles online to assist in writing the thesis and creating a topic list, the researcher will proceed to contact the managers from the three departments with the highest turnover rates. These departments were the Front Office (FO), Food & Beverage (F&B) and Human Resources (HR). After deciding on a date and time for the interviews which will be conducted at the Renaissance Aruba, the researcher will carry out the interview with the manager of the department. After conducting the interview with the manager, the researcher will proceed to ask the manager to select the employee(s) that can be interviewed for the research based on who has been working with the company the longest (years of service). The reason for letting the managers choose the employees is because the managers will be able to know which of their employees have had the most years of service with the company. After finishing conducting the interviews with all of the managers and employees of the three mentioned departments, the researcher will continue with the best practice department which is the Casino department which has less changes of employees within. The reason for choosing to interview a best practice department is to receive a better understanding and view of how the department does their recruitment procedure and then do a comparison with the above-mentioned departments that have a higher turnover rate. Finally, after concluding all of the interviews, the researcher will continue by summarizing all of the interviews and then analyze them through thematic analysis to receive a better overview of the results.
2.5 AnalysisFor this thesis, once all of the data is collected, the researcher will begin to analyze the collected data through thematic analysis. According to Bryman (2016), thematic analysis is “a term used in connection with the analysis of qualitative
UAUCU Student Research Exchange Collected Papers 2018
182
Following the creation of the applicant pool, the applicants will complete an application form for the employers. According to Dessler (2013): A filled-in application provides four types of information. First, you can make judgments on substantive matters, such as whether the applicant has the education and experience to do the job. Second, you can draw conclusions about the applicant s previous progress and growth, especially important for management candidates. Third, you can draw tentative conclusions about the applicant s stability based on previous work record. Fourth, you may be able to use the data in the application to predict which candidates will succeed on the job and which will not. (p. 164).After receiving the applications from the applicants, the employer will begin to screen out most applicants through tests, background checks, references and other exams to select the most viable candidates. The tests that are conducted will vary depending on the job that the candidate is being interviewed for. For example, a candidate that is being interviewed for a position as a supervisor would be asked or tested on their leadership skills whereas a front desk agent applicant would be asked and tested on their communication skills. After reviewing and testing these applicants, the pool would be smaller to commence the interview phase.The interview phase would be carried out by supervisors and other executive members who would interview the final pool of candidates to make the final selection of who would be hired into the company. However, an important factor to keep in mind when making the final decision would be the recruitment of a more diverse workforce. The reason for this is because a diverse workforce means having different people, such as single parents, older workers and minorities, who can bring different skills and knowledge to your organization.
Conclusion
To conclude, in the year 2018, a research will be conducted about the recruitment procedure at the Renaissance Aruba Resort & Casino. The main objective of the research is to
1. Decide what positions to fill, through workforce/personnel planning and forecasting.
2. Build a pool of candidates for these jobs, by recruiting internal or external candidates.
3. Have candidates complete application for these jobs and perhaps undergo initial screening interviews.
4. Use selection tools like tests, background investigations, and physical exams to identify viable candidates.
5. Decide who to make an offer to, by having the supervisor and perhaps others interview the candidates.
The steps mentioned above would be ideal to follow during the recruitment and selection procedures; however, for this research, the steps will be more detailed to make sure that they are clear when putting them into practice. First and foremost, it is crucial to determine what exactly the company or team needs. In other words, what positions need to be filled and how will they be filled? How many employees will the company need? It is important to analyze the employment and turnover history to make sure that enough employees are hired to make sure that the company continues to function after some employees leave. An approach to identify how many candidates a company would be able to attract would be to observe the current labor market. For example, Dessler (2013) mentions how “unemployment rates around 9% in the United States in 2011 signaled to HR managers that finding good candidates would be easier” (p. 144). Therefore, the same would count for Aruba, in the sense that the resort would need to analyze the labor market to determine and be prepared if finding good candidates would be easy or difficult before the recruiting procedure starts.Second, the next step would be to advertise the job openings to the community. There are different ways to advertise the job openings to create an applicant pool. However, it is crucial to be informative in the advertisements to the people to clearly explain what is expected from the people and the job. Apart from advertising to the community, the first choice would usually be to identify which current employees in the company might be qualified for the job. Through these actions, a pool of candidates will be created to recruit from.

UAUCU Student Research Exchange Collected Papers 2018
183
Finland University of Applied Sciences.• Boselie, P. (2010). Strategic Human Resource
Management: A Balanced Approach. United Kingdom: McGraw-Hill Education.
• Breaugh, J. A. (2008). Employee Recruitment: Current Knowledge and Important Areas for Future Research. Human Resource Management Review, 103 - 118 .
• Briguglio, L., & Briguglio, M. (n.d.). Sustainable Tourism in Small States: The Case of Malta. Malta.
• Bryman, A. (2016). Social Research Methods. New York: Oxford University Press.
• Casino, T. R. (2017). Employee Handbook. Aruba.• Dessler, G. (2013). Human Resource Management (13th
ed.). Florida: Pearson.• Development, W. B. (n.d.). Driving Success: Human
Resources and Sustainable Development. United Kingdom.
• Fink, A. S. (2000). The Role of the Researcher in the Qualitative Research Process. A Potential Barrier to Archiving Qualitative Data. Forum: Qualitative Social Research.
• Hunger, J. D., & Wheelen, T. L. (2011). Essentials of Startegic Management. New Jersey: Pearson Education.
• (2013). Increasing Inequality: What Do People Think? Oxfam.
• Maxwell, J. A. (2013). Qualitative Research Design: An Interactive Approach . California: Sage Publications Inc.
• n.a. (2018). Skill. Retrieved from Dictionary.com: http://www.dictionary.com/browse/skill
• n.a. (n.d.). Recruiting the Right People. Retrieved from http://www.workinculture.ca/getmedia/a c 4 9 c 8 c 6 - a c e c - 4 e b c - 9 1 e f - b c 0 4 1 6 3 a 4 a 3 8 /toolsRecruitingtherightpeople.pdf.aspx
• Nations, U. (n.d.). Sustainable Development Goals. Retrieved from http://www.un.org/sustainabledevelopment/sustainable-development-goals/
• Newton, B., Hurstfield, J., Miller, L., Page, R., & Akroyd, K. (2005). What employers look for when recruiting
analyze the current recruitment procedure and to design new methods to create a more effective recruitment. The goal of this is to avoid placing the wrong people in the wrong position which can lead to poor performance of the company. The main research question for this research will be the following: “How can improvements be made at the Renaissance Aruba towards a more effective recruitment policy to position future employees better?” In order to help answer the main research question, the following five (5) sub-questions have been developed:1. What aspects do the managers of the Renaissance Aruba
take into account when recruiting new personnel?2. How do the managers know if an employee fits well into
the job position that they are given?3. What are causes for putting an employee in the wrong
job position during recruitment?4. Which factors contribute to an effective recruitment?5. Which factors obstruct an effective recruitment?With the aid of the research results and the recommendations that arise from these findings, the company could make use of the new methods to improve their recruitment procedure, which will benefit the company in the long-run.
References
• Bolman, L. G., & Deal, T. E. (2013). Reframing Organizations: Artistry, Choice, & Leadership (5 th ed.). San Francisco: Jossey-Bass.(n.d.).
• Argue, M. (2015). The Importance of the Strategic Recruitment and Selection Process on Meeting an Organizations Objectives’. Dublin: Master of Business Administration General Management.
• Baez, H. B. (2013, January 26). Personality Tests in Employment Selection: Use With Caution. Retrieved from Cornell HR Review: http://www.cornellhrreview.org/personality-tests-in-employment-selection-use-with-caution/
• Bogatova, M. (2017). Improving Recruitment, Selection and Retention of Employees. Finland: South-Eastern

UAUCU Student Research Exchange Collected Papers 2018
184
the unemployed and inactive: skills, characteristics and qualifications. Department for Work and Pensions.
• Perry, F. (2002). The Tracks We Leave: Ethics in Healthcare Management. Health Administration Press.
• Rahman, S., & Islam, S. (2012). An Analytical Study on Determining Effective Factors for Recruiting Right Person . Bangladesh: ABC Journal of Advanced Research.
• Rollinson, D. (2008). Organizational Behaviour and Analysis: An Integrated Approach. England: Pearson Education Limited.
• Singh, N. (2013, November 22). Factors Affecting Recruitment. Retrieved from HR.com : https://www.hr.com/en/app/blog/2013/11/factors-affecting-recruitment_hobbaoej.html
• Social Security Panel: Advances in Coverage, Quality and Financing Countries of the Region: The Aruban Experience. (2007). Second Intergobernmental Regional Conference On Ageing. Brazil.
• Sun, L. (2015). Exploring the Causes of Recruiting Failure. China: Scientific Research Publishing .
• Zinyemba, A. Z. (2014). The Challenges of Recruitment and Selection of Employees in Zimbabwean Companies. Zimbabwe: International Journal of Science and Research.
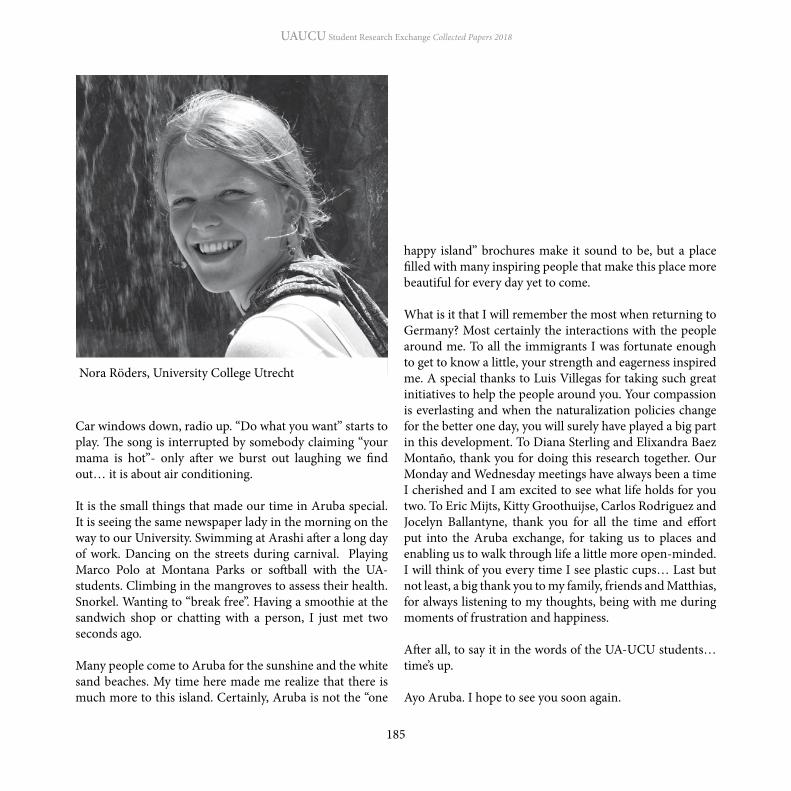
UAUCU Student Research Exchange Collected Papers 2018
185
Car windows down, radio up. “Do what you want” starts to play. The song is interrupted by somebody claiming “your mama is hot”- only after we burst out laughing we find out… it is about air conditioning.
It is the small things that made our time in Aruba special. It is seeing the same newspaper lady in the morning on the way to our University. Swimming at Arashi after a long day of work. Dancing on the streets during carnival. Playing Marco Polo at Montana Parks or softball with the UA-students. Climbing in the mangroves to assess their health. Snorkel. Wanting to “break free”. Having a smoothie at the sandwich shop or chatting with a person, I just met two seconds ago.
Many people come to Aruba for the sunshine and the white sand beaches. My time here made me realize that there is much more to this island. Certainly, Aruba is not the “one
happy island” brochures make it sound to be, but a place filled with many inspiring people that make this place more beautiful for every day yet to come.
What is it that I will remember the most when returning to Germany? Most certainly the interactions with the people around me. To all the immigrants I was fortunate enough to get to know a little, your strength and eagerness inspired me. A special thanks to Luis Villegas for taking such great initiatives to help the people around you. Your compassion is everlasting and when the naturalization policies change for the better one day, you will surely have played a big part in this development. To Diana Sterling and Elixandra Baez Montaño, thank you for doing this research together. Our Monday and Wednesday meetings have always been a time I cherished and I am excited to see what life holds for you two. To Eric Mijts, Kitty Groothuijse, Carlos Rodriguez and Jocelyn Ballantyne, thank you for all the time and effort put into the Aruba exchange, for taking us to places and enabling us to walk through life a little more open-minded. I will think of you every time I see plastic cups… Last but not least, a big thank you to my family, friends and Matthias, for always listening to my thoughts, being with me during moments of frustration and happiness.
After all, to say it in the words of the UA-UCU students… time’s up.
Ayo Aruba. I hope to see you soon again.
Nora Röders, University College Utrecht

UAUCU Student Research Exchange Collected Papers 2018
186
Introduction
Aruba, a Small Island State located just off the Venezuelan coast, has been subject to constant migration patterns. In 2010, the foreign-born population on Aruba represented 34% of the total of 101,669 inhabitants (CBS, 2010, p. 20). Of these immigrants, about 75% intend to stay in Aruba (CBS, 2018). This number is indicative of the need for effective integration policies. Citizenship is one of the main indicators for immigrants’ inclusion (Apektar, 2016). In 2003, one in four immigrants in Aruba had applied for citizenship. At the time of the survey, only about 12% of all immigrants had obtained the status (CBS, 2003). More recent data are not available to our knowledge. Yet, 15 years later, access to citizenship among immigrants is still an important societal issue, especially since the criteria for successful naturalization have become increasingly more demanding (Nestmann, 2011; van Oers, 2008; Villegas, 2017).
The low numbers of successful applicants relate to the complex naturalization procedure. Although Aruba gained independence in 1986, the naturalization policies - the legal act by which immigrants acquire citizenship upon request (Netherlands Nationality Act, 2015) - are dealt with under the Kingdom Act on the Netherlands nationality (ibid). The Dutch understanding of naturalization follows traditional
notions of citizenship, considering naturalization as the final step of a successful integration, the final step of becoming Dutch (Böcker & Thränhardt, 2006).
To our knowledge, only a few empirical studies focused on the motivations of immigrants to apply for naturalization (Apektar, 2016; Reichel, 2011). In many occasions, policy makers perceive individual actions as the consequence of rational reasoning, without understanding whether the individual intends to perform the actions by will or as a reactive response. For sociological work, it is important to reflect from the position of the person dealing with the problem, to find out their intentions (Wunderlich, 2005). The aim of the present study is to gain further insights into the motivation for naturalization by investigating the individual motivations of immigrants in Aruba to apply for naturalized citizenship. The three major research questions are: (1) what are the legal requirements to be eligible to apply for Dutch citizenship in Aruba?; (2) why do immigrants in Aruba apply for Dutch citizenship?; (3) what individual determinants affect naturalization decision?
Firstly, the legal procedures in Aruba will be discussed, followed by a description of relevant theories and previous empirical studies on immigrants’ motivations to apply for citizenship. Subsequently, the method and results of the present community-based study done in Aruba will be
Becoming Aruban?The motivation of immigrants in Aruba to apply for Dutch citizenship
Nora Röders
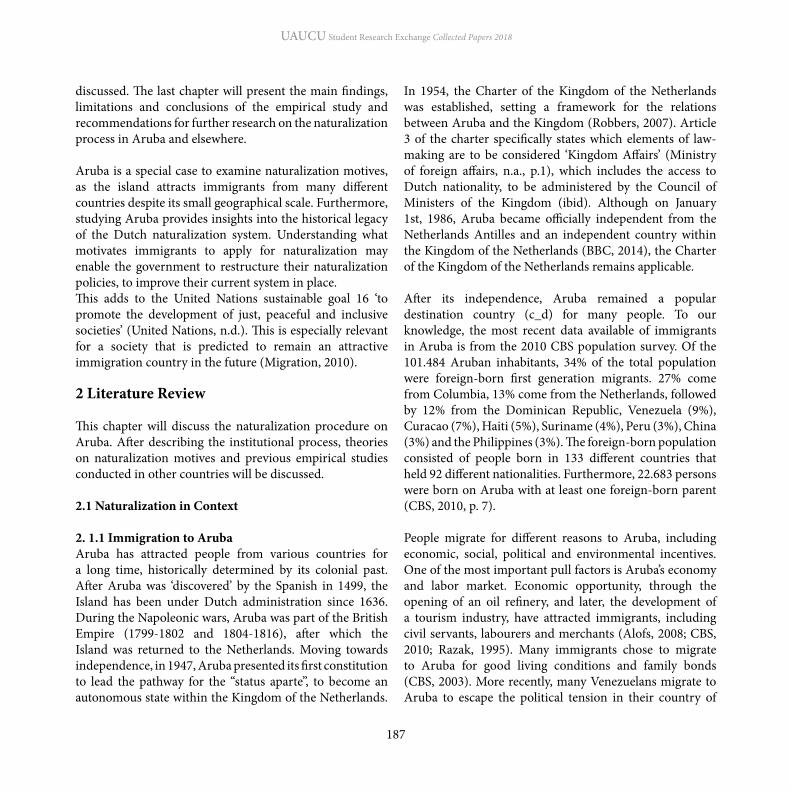
UAUCU Student Research Exchange Collected Papers 2018
187
discussed. The last chapter will present the main findings, limitations and conclusions of the empirical study and recommendations for further research on the naturalization process in Aruba and elsewhere.
Aruba is a special case to examine naturalization motives, as the island attracts immigrants from many different countries despite its small geographical scale. Furthermore, studying Aruba provides insights into the historical legacy of the Dutch naturalization system. Understanding what motivates immigrants to apply for naturalization may enable the government to restructure their naturalization policies, to improve their current system in place. This adds to the United Nations sustainable goal 16 ‘to promote the development of just, peaceful and inclusive societies’ (United Nations, n.d.). This is especially relevant for a society that is predicted to remain an attractive immigration country in the future (Migration, 2010).
2 Literature Review
This chapter will discuss the naturalization procedure on Aruba. After describing the institutional process, theories on naturalization motives and previous empirical studies conducted in other countries will be discussed.
2.1 Naturalization in Context
2. 1.1 Immigration to ArubaAruba has attracted people from various countries for a long time, historically determined by its colonial past. After Aruba was ‘discovered’ by the Spanish in 1499, the Island has been under Dutch administration since 1636. During the Napoleonic wars, Aruba was part of the British Empire (1799-1802 and 1804-1816), after which the Island was returned to the Netherlands. Moving towards independence, in 1947, Aruba presented its first constitution to lead the pathway for the “status aparte”, to become an autonomous state within the Kingdom of the Netherlands.
In 1954, the Charter of the Kingdom of the Netherlands was established, setting a framework for the relations between Aruba and the Kingdom (Robbers, 2007). Article 3 of the charter specifically states which elements of law-making are to be considered ‘Kingdom Affairs’ (Ministry of foreign affairs, n.a., p.1), which includes the access to Dutch nationality, to be administered by the Council of Ministers of the Kingdom (ibid). Although on January 1st, 1986, Aruba became officially independent from the Netherlands Antilles and an independent country within the Kingdom of the Netherlands (BBC, 2014), the Charter of the Kingdom of the Netherlands remains applicable.
After its independence, Aruba remained a popular destination country (c_d) for many people. To our knowledge, the most recent data available of immigrants in Aruba is from the 2010 CBS population survey. Of the 101.484 Aruban inhabitants, 34% of the total population were foreign-born first generation migrants. 27% come from Columbia, 13% come from the Netherlands, followed by 12% from the Dominican Republic, Venezuela (9%), Curacao (7%), Haiti (5%), Suriname (4%), Peru (3%), China (3%) and the Philippines (3%). The foreign-born population consisted of people born in 133 different countries that held 92 different nationalities. Furthermore, 22.683 persons were born on Aruba with at least one foreign-born parent (CBS, 2010, p. 7).
People migrate for different reasons to Aruba, including economic, social, political and environmental incentives. One of the most important pull factors is Aruba’s economy and labor market. Economic opportunity, through the opening of an oil refinery, and later, the development of a tourism industry, have attracted immigrants, including civil servants, labourers and merchants (Alofs, 2008; CBS, 2010; Razak, 1995). Many immigrants chose to migrate to Aruba for good living conditions and family bonds (CBS, 2003). More recently, many Venezuelans migrate to Aruba to escape the political tension in their country of

UAUCU Student Research Exchange Collected Papers 2018
188
origin (Casey, 2016). Migration is likely to play a major role in Aruba’s future too. Population projections indicate that in 2030, about 46% of the island will be foreign- born because of low fertility levels and rapid aging of the Aruban population (Migration, 2010).
2.1.2 Legal Status of Immigrants on ArubaUndocumented immigration is a major concern for the Aruban Government. Many immigrants enter the island either illegally or overstay their tourist or visitor’s visa. In 2016, the CBS indicated that an immigrant needed an average of 6-7 months to obtain a residence permit and between 5-6 months to obtain a work permit (CBS, 2018). Asking about the immigrants’ motives why they came to Aruba, most respondents (75% of N =1096) answered that they intended to settle indefinitely (CBS, 2018). In 2010, 52% of the foreign-born population reported having obtained the Dutch nationality. Meanwhile, some refrained from applying for naturalization because they could not fulfil the requirements (M. Plaza, personal communication, March 9, 2018).
2.1.3 Access to Citizenship in the Kingdom of the NetherlandsAlthough independent in many legal matters, Aruba has a legal system based on the Dutch model of civil law, and immigration is dealt with under the Netherlands Nationality Act (2015), administered by the Netherlands. Despite there being four countries in the Kingdom of the Netherlands (Aruba, Curacao, Sint Maarten, the Netherlands), there is only one category of citizen, the Nederlandse Burgers (Dutch citizens), as determined by the Charter of the Kingdom of the Netherlands (Netherlands Nationality Act, 2015).
Becoming an Aruban citizen, therefore, means to become a Dutch and European citizen too (Nestmann, 2011). Nevertheless, the rights among ‘Dutch citizens’ differ from one another. As an independent country, the government of
Aruba has the right to control the inflow of Dutch nationals and some rights are strictly reserved for the Dutch-Aruban citizens, including legal access to Aruban territory without a permit, the right to open a business on Aruba, access to loans and voting rights amongst others (DIMAS, 2018; Overheid Aruba, 2014). People are considered Dutch-Aruban citizens if they are: (1) born on Aruba to Dutch parents; (2) immigrants but naturalized on Aruba; (3) are Dutch citizens that lived on Aruba before January 1st, 1986; (4) children of the previously mentioned groups (Overheid Aruba, 2014). Although this essay only refers to “Dutch citizenship”, it is important to keep this distinction in mind. People acquire the Dutch citizenship in three ways: by descent (jus sanguinis), by option and by naturalization. The principle of jus sanguinis is opposed to the jus soli citizenship model (country of birth determines the legal status) in that citizenship is inherited through parents. People without Dutch parents, wanting to become Dutch citizens at a later stage of their life can either apply for option or naturalization (Immigratie- en Naturalisatiedienst, 2017).
2.1.3.1 Requirements for applying for the option and naturalization procedureDutch citizenship through option. To acquire Dutch citizenship through the option procedure is the cheapest and quickest alternative available. The application process only involves the applicant and the Cabinet of Governors- the official secretariat of the Governor who represents the Dutch king and the Kingdom government on Aruba (Gouverneur, n.d.). The option procedure is reserved for restrictive categories of foreign nationals. Although this list is not exhaustive, applicants may belong to one of the following categories: • Age of 18 years and older; born on Aruba as a child of
immigrants and lived on Aruba without gaps and in possession of valid residency permits
• live on Aruba for three consecutive years with valid residency permits whilst being stateless

UAUCU Student Research Exchange Collected Papers 2018
189
• be 18 years or older and have lived on Aruba since the age of 4 with valid residency permits
• married to a Dutch citizen (minimum of 3 years) and have lived on Aruba consecutively for a minimum of 15 years
• be 65 years and older and lived for at least 15 years on Aruba without a gap
Furthermore, applicants cannot be subject to a criminal proceeding, prison sentence, community service order or be fined a large amount of money in the previous 4 years, nor be in a bigamy relationship. A major advantage for the option procedure is that foreign nationals do not need to renounce their previous citizenship, except from one category: when the applicant has reached full age (18 years old) and has “lived in the Netherlands with a valid residence permit from the age of 4” (Immigratie- en Naturalisatiedienst, 2017).
2.1.3.2 The Institutional Pathway to Dutch citizenshipIt is the applicants’ responsibility to submit the application documents and to make the payment at the Cabinet of Governors. Upon completion, the Cabinet checks for the completeness and accuracy of the submitted documents. For both, the naturalization process and the option procedure, the Cabinet collects information about the applicant from a variety of institutions on Aruba, including Censo, the Departamento di Integracion, Maneho y Admision di Stranhero (DIMAS) and the Openbaar Ministerie Aruba (OM). Censo provides the Cabinet with information about personal data from the population register. The OM gives insights into potential criminal activity in the past. Finally, DIMAS gives information about the legal status of the applicant. Once all data is collected, the Cabinet checks if all requirements to become a Dutch citizen are met.
For the option procedure, the Cabinet of Governors decides whether the application is successful. For the naturalization procedure, the Cabinet formulates a recommendation about the naturalization decision that is sent to the Immigration
and Naturalisation Service (IND) in the Netherlands (Immigratie- en Naturalisatiedienst, 2017). According to the Cabinet, the IND follows most of its recommendations (Cabinet, personal communication, February 28, 2018). Exceptions concern forged documents, that can only be detected in the Netherlands, given the restricted resources available in Aruba (ibid).
In case of a successful application for both, the option and the naturalization procedure, applicants are invited to attend the naturalization ceremony to declare solidarity with the Kingdom of the Netherlands. Finally, if applicable, applicants must renounce their previous nationality.
2.2 Motives to apply for citizenshipThe previous paragraph served as a short introduction into the procedure to become a Dutch citizen. This, however, does not explain the immigrants’ motivation to apply for citizenship. To our knowledge, there has not been any data collected on the motivation to apply for Dutch citizenship in Aruba. This research will give first insights into this topic. In this section, the most prevailing theories on naturalization incentives will be presented, including social identity theory, rational choice theory, social capital theory and political incentives.
2.2.1 Social Identity TheorySocial identity theory (Tajfel & Turner, 1986) argues that people strive for a positive social identity to attain a high self-esteem and for their psychological well-being. This positive social identity is created through intergroup comparisons in which group members favour their in-group above other groups. People from low status groups, such as immigrants may change their group membership by joining a higher-status group (Leszczensky, 2013). This change will most likely only be conducted if the group boundaries are (perceived as) permeable. Increasing interethnic friendship may lead to this perception and thus help immigrants to identify more with the host society

UAUCU Student Research Exchange Collected Papers 2018
190
(Leszczensky, 2013). Besides, the age of the immigrant plays an important role, given that children and young adults are more sensitive to opinions and values they are exposed to during their adolescence (Lubbers et al., 2009). Immigrants that were born on Aruba (2nd generation immigrants) or migrated during their childhood or adolescence (1.5 generation immigrants) would be more likely to naturalize for social identity motives than individuals that migrated during their adulthood (1st generation immigrants) as they may be inclined to identify more with the c_d and want to become an official part of the community. Citizenship might then be seen as a sign of symbolic group membership (Witte, 2014). The sense of belonging may further show in motivation to settle in the country of destination (Reichel, 2011).
2.2.2 Rational Choice TheoryRational choice theory (RCT) suggests that people’s behaviour is influenced by individual goals, self-interest and “utility maximization” (Petracca, 1991, p. 289). Individuals are considered rational agents that conduct cost-benefit analyses and take decision for their personal benefit (ibid). Rational choice motives may include economic, pragmatic and safety considerations.
Economic Reasoning. Immigrants may apply for citizenship to improve their income, enhance job and employment opportunities. Immigrants, especially from poorer countries, might be likely to apply for naturalization for economic reasons, to increase their economic opportunities and gain access to labor markets (Bloemraad & Sheares, 2017). Moreover, some jobs are only open to legal citizens, including positions in the public sector such as competitive civil service positions or jobs requiring security clearances (Sumption & Flamm, 2012). Besides, employers may prefer to hire naturalized citizens to reduce the likelihood of employing illegal immigrants or to be able to send the employee abroad without having to encounter visa problems (Bratsberg et al., 2002). Overall, citizenship
gives access to “broader life opportunities” (Yang, 1994, p. 453). Although citizens and permanent residents may enjoy similar rights, differences still apply, for example, in the access to higher education and governmental loans (i.e. Aruba lening; DUO). Immigrants may naturalize to get access to public benefits, including state welfare or public assistance programs (Nam & Kim, 2012).
Pragmatic Reasoning. A passport can have several pragmatic reasons. Foremost, it might function as an access to visa-free travel opportunities (Bloemraad & Sheares, 2017; Harpaz, 2015). It allows immigrants to move with more freedom between residencies, without waiting times at airports or doing paperwork for visas or other bureaucratic barriers, such as applying for residency permits. Other pragmatic advantages of the passport could be to avoid the military service or other services in the country of origin and/or being able to stay longer in the country of origin without fearing to not be able to come back to the country of residence (Reichel, 2011).
Safety Concerns. Citizenship secures permanent access to state territory and protects against deportation. Other legal forms of residency are subject to policy change and never secure full protection (Bloemraad & Sheares, 2017). In addition to the right of residence, citizenship secures economic security, security whilst traveling and access to the social welfare (Reichel, 2011).
2.2.3 Social Capital TheoryTo analyse how social capital- the relationship between individuals in a particular society (Diehl & Blohm, 2003) - impacts naturalization decisions, we must study immigrant’s networks. As mentioned in the section about social identity theory, a stronger network of naturalized friends or relatives may lead to increasing identification with the c_d. Yet, applying for citizenship may not be an individual decision but a shared experience with people living in the same community with the same ethnic background

UAUCU Student Research Exchange Collected Papers 2018
191
and race that come from the same c_o (Echautegui & Giannarelli, 2015). Finally, applying for citizenship may impact future social capital by indicating the wish to settle and start a family in another country or to make the family more internationally mobile (Aptekar, 2016). Parents may decide to naturalization to the benefit of the future of their children (Street, 2014).
2.2.4 Political MotivationsAccess to political rights, including the right to vote and run for public office, is an important privilege of naturalized citizens (Meer & Sever, 2004; Yang, 1994). To apply for naturalization to engage in politics may be impacted by social identity, rational choice and social capital reasons.
From a perspective of social identity theory, the longer time an individual spends in a country, the more they develop a moral claim to engage in politics (Gropas, 2012). From a perspective of rational choice theory, people that spend more time in a country are increasingly affected by political decisions than those staying for a short-term (Gropas, 2012). Immigrants, especially those with a better economic position may be more inclined to naturalize to secure their status position and to influence political decisions that may have an effect on their economic situation (Yang, 1994). Furthermore, the country of origin may impact the importance attributed to voting. Ethnic social networks may “encourage political participation by turning the powerlessness of one vote into the power of many” (Bueker, 2005, p.111) in order to push a certain agenda. Voting may not only fulfil the desire to have a say in national elections but to impact policies that affect their country of origin too (Aptekar, 2016). Immigrants that grew up in democratic societies, especially, may feel a deeper sense of civic responsibility to vote (Bueker, 2005; Finifter and Finifter, 1989).
2.3 Previous findings on motives to apply for citizenshipThe research about reasons for applying for citizenship (i.e., Apektar, 2016; Bloemraad & Sheares, 2017; Wunderlich,
2005), are mostly limited to North America and Europe (Dronkers & Vink, 2012).
2.3.1 Emotional AttachmentSeveral empirical studies in various countries have shown the importance of identity and belonging for decisions on naturalization. Concerning the feeling of belonging, Marger (2006) found that immigrants in Toronto naturalized for a sense of civic obligation and to become a fuller part of the Canadian society. Apektar (2016) further concluded that immigrants in Canada naturalize because it makes them “feel more Canadian”. This indicates that immigrants already considered themselves as Canadian prior to naturalization. The symbolic value attached to the Canadian passport, however, was affected by the age of the individual at the moment of migration. Immigrants that migrated at a young age did not think the passport would make them feel more Canadian, while those that immigrated at a later stage in life put a greater emphasis on its symbolic value. Interestingly, in the USA, the passport rather represents a gateway to become American (Apektar, 2016). Gilbertson (2004) concluded, from his study on naturalization motives of Dominican immigrants in the USA, that naturalization is often considered the first step of becoming more American and represents an opportunity to engage with the country and its culture.
2.3.2 Rational choice theoryRational choice theory has proven to be important in explaining naturalization decisions. The benefits of naturalization can be categorised into economic, political and pragmatic motives. Individuals conduct cost-benefit calculations to decide whether to naturalize. In his study on Latinos in the USA, Gonzalez-Barrera et al. (2013) found that the most common reason for naturalization was to gain civic and legal rights in addition to citizen benefits. Many scholars referred to the importance of naturalizing for traveling purposes and access to employment opportunities (i.e., Gilbertson, 2004; Reichel, 2011).

UAUCU Student Research Exchange Collected Papers 2018
192
Besides, in some countries, such as the USA, immigrants naturalize for defensive reasons, to protect themselves from policy changes and criminalization (Gilbertson, 2004; Aptekar, 2016). Both, Apektar (2016) and Gilbertson (2004) concluded that immigrants in America greatly emphasize the importance of protection from the passport in an “anti-immigrant climate” (Gilbertson, 2004, p. 45). Applicants were afraid of policy changes and hoped to reduce (perceived) discrimination (ibid.). In more ‘welcoming’ societies, such as Canada, applicants did not worry about potential future changes in immigration policies (Apektar, 2016).
2.3.3 Social Capital TheoryFamily and friend networks have often been reported as a reason for naturalization (e.g. Aptekar, 2016; Reichel, 2011). Several scholars concluded that for immigrants in America, naturalization decisions are not taken by the individual but are a shared experience with people from the same country, race and ethnic background, who settled in the same community (Jones-Correa, 2001; Yang, 1994). Moreover, future concerns seem to play a role in naturalization decisions. On his study on intergenerational motives for naturalization in Germany, Street (2014) concluded that many parents applied for naturalization to extend their citizenship status to their children.
2.3.4 Voting incentivesMany scholars report that immigrants consider voting rights an important reason to apply for naturalization. On her study on applicants for naturalization in the USA and Canada, Apektar (2016) concluded that 46% (n = 33) immigrants in the USA and 19 (28%) immigrants in Canada would mention voting as a major reason for naturalization without being prompted. After prompting the respondents, the percentage increased to more than 85% in both countries. Reichel (2011), concluded, similarly, that being able to vote was considered a major naturalization motive for immigrants in Austria. In her study on Greek immigrants in New York, Karpathakis (1999) emphasized
that immigrants did not only want to influence local politics but be able to engage in transnational politics more effectively by strengthening diffused lobby groups. 2.4 Research Questions and Hypotheses
2.4.1 Research QuestionsThe results of previous studies indicate patterns in naturalization motives. What immigrants consider important, however, alters with the cross-national understanding of laws and regulations impacting nations and individuals (Bloemraad & Sheares, 2017).
To gain insights into the reasons to apply for Dutch citizenship on Aruba, this research asks:
For what reasons do immigrants in Aruba apply for the Dutch citizenship?
For the quantitative part of this study, an additional research question is asked:
What are the individual determinants that affect naturalization decisions?
2.4.2 HypothesesFrom the literature review, the following hypotheses were derived: • H1: Social identity motives to apply for the Dutch
citizenship are stronger for 2nd generation and 1.5 generation immigrants than for 1st generation immigrants
• H2: Social identity motives to apply for Dutch citizenship are stronger for immigrants that have accumulated country-specific human capital compared to those without.
• H3: Rational choice motives to apply for naturalization are more important for immigrants from low-income economies than among those from high-income economies

UAUCU Student Research Exchange Collected Papers 2018
193
• H4: Voting incentives are more important for people from democratic countries than for people from undemocratic regions
• H5: To apply for naturalization to be able to vote is more important for immigrants with a high income compared to people with a low income.
Methodology
3.1 Study design To answer the research question, this research uses a concurrent triangulation design (Tashakkori and Teddlie, 2003) “to obtain different but complementary data on the same topic” (Morse, 1991; cited by Baran & Jones, 2016, p. 81). Using only quantitative or qualitative analysis may not capture the complexity of the research domain (ibid). The mixed method design allows to reflect on the naturalization incentives from different perspectives. Qualitative and quantitative findings are integrated and compared in the analysis.
3.2 Community based approachThis study uses a community-based approach. Collaborating with the community might help to overcome distrust against the researcher and reduce biases about sensitive topics (Minkler, 2005). Including the population into the knowledge gathering and survey development will make this study more relevant and enhance its validity by developing accurate frameworks that respond to the community (Elden & Levin, 1991).
The Aruban community was involved in three ways: as co-researchers, as experts, whose knowledge was used to design the questionnaire, and as participants in the study. Two co-researchers from the Academic Foundation Year Program of the University of Aruba helped in the process of data gathering and interviewing. Both students have an immigrant background themselves and have undergone the process of applying for Dutch citizenship. Similar experiences help to develop trust with the interviewees that (want to) undergo the
same procedure now (Apektar, 2016). The research assistants enabled the sample to be more varied, by translating the surveys and conducting interviews in different languages, including Papiamento, Spanish and Haitian Créole. An interview with the Cabinet of Governors gave insights into the naturalization process from the institutional perspective. The information was especially useful considering the limited data available to the public. Finally, the public was involved as respondents in the study.
3.3 Qualitative data
3.3.1 Semi-structured interviewsGiven the lack of literature available on naturalization incentives of immigrants on Aruba, this research will provide first insights into the field. Semi-structured interviews help to gain an in-depth understanding of immigrants’ motivation to naturalize and leave room for unpredicted results.
Sample Group. The sample group consists of immigrants that consider applying for citizenship, are in the process of applying or have already been naturalized. Only focusing on successful applicants may reduce the validity of the data, as becoming a citizen requires skills and resources (Gershon, 2016).
In total, 13 immigrants were interviewed. Of the 13 interviews, 12 were conducted in English. In one case, the interview took place in a mixture of Haitian Créole and Papiamento. The first potential candidates were contacted through social media and through the University of Aruba network. To find more participants, the snowball-effect was used, asking each participant for more people that could be interested in participating. This method helps to build trust within the community, as potential participants were approached by people they are familiar with. As a limitation, the sample is non-random and not an accurate representation of the immigrant population on Aruba. Figure 1 shows the demographic characteristics of the participants:

UAUCU Student Research Exchange Collected Papers 2018
194
Figure 1. Descriptive statistics of qualitative interview participants.
Procedure. Each interview started with a short introduction of the research. The participants were asked if it was possible to record the interview and informed that the audio file would be kept by the University of Aruba. Additionally, participants were informed that they have the right to refuse any question or to stop the interview or recording at any time. To reduce social desirability, the respondents were assured that the data will be kept anonymously. Once the participant agreed to the procedure, the interview started.
The interview was divided into five major parts. First, participants were asked about the time before moving to Aruba. This section included questions about their school education, work experience and personal relationship with the country of origin. Second, the immigrants’ migration to Aruba was discussed, asking for the motives for migration. Third, the interviewee was asked about his/her experiences on Aruba, including the school and work experiences and the relationship to Aruba and the Dutch Kingdom. The fourth part concerned the naturalization incentives and personal experiences with the institution involved in the application process. The essential question in this part was “For what reasons do/did you want to naturalize?”. This open-ended question avoids biases by allowing the participants to elaborate on their thoughts freely.
3.4 Quantitative research
3.4.1 SurveyMost studies on naturalization incentives use qualitative data only. Quantitative analysis, however, can provide a powerful insight into the topic, by analysing characteristics of a population (Reichel, 2011). This methodological approach makes the results viable, given the wide variety of people that may participate (de Vaus, 2002).

UAUCU Student Research Exchange Collected Papers 2018
195
3.4.1.1 Procedure and Sample GroupAs in the qualitative part of the present study, immigrants that want to apply for Dutch citizenship in the future, have already applied or obtained it, were invited to fill out the survey. The survey was spread online via the University of Aruba network and through social media. It was available in 3 different languages (English, Papiamento and Spanish). Participants were informed that the study concerns their incentives to apply for naturalization and that it will take about 5 minutes for completion of the survey. Respondents were being ensured that the results are confidential and anonymous. For potential questions, participants were provided with an email address.
In total, N=60 people completed the survey of which 48% (n = 29) people were already naturalized, 20% (n = 12) were in the naturalization process and 30% (n = 18) want to naturalize in the future. The participants were between 19 and 54 years of age (M=24.27, SD=9.97). 28% (n = 17) of the respondents were male and 72% (n = 43) female. Most participants have finished high school (68%), some have limited college experience (17%) and 8.3% have obtained their bachelor’s degree.
Most participants were born in Latin America (46.67%), 25% (n = 15) come from the Caribbean, 17% (n = 10) were born in Europe and 11.67% (n = 7) were born in Asia. Overall, participants reported 21 different countries of birth. With 81% of all valid responses (n = 56), most participants were single and 18% were married. Overall, 12 participants had children, where the maximum amount of children was 3. Of those participants that migrated to Aruba (n = 43), the average migration age (years) was M= 9.91 (SD= 9.98).
Figure 2. Descriptive statistics of survey participants
3.4.1.2 Survey DesignThe survey was developed in two ways. First, outcomes from similar studies (see Chapter 2) were used to develop general statements about naturalization motives. Second, interviews were conducted to make the survey side-specific. Two officials from the Cabinet of Governors were interviewed to gain insight into naturalization decisions from an institutional perspective (Cabinet, personal communication, February 28, 2018). Second, an interview with Luis Villegas, a local journalist with expertise on naturalization decisions, helped to give insights into the immigrants’ perspective on naturalization decisions (personal communication, February 10, 2018). The local immigration institution DIMAS was contacted, without success.
The final product is a 5-point Likert scale questionnaire. 15 Likert items were employed to measure different, underlying

UAUCU Student Research Exchange Collected Papers 2018
196
constructs, namely: the role of rational choice theory, social identity theory, social capital theory and political incentives in naturalization decision. Each variable was phrased as a question beginning with “How important was it for you to apply for citizenship…..” followed by a statement (i.e. because you feel Aruban; because you decided to settle on Aruba). The participants could rank the importance with 5 options (1= Not important; 2= Of little importance; 3= Moderately important; 4= Important; 5= very important).
To determine whether the Likert-items measured the intended underlying construct, a principle component analysis (PCA) was performed in addition to a Cronbach alpha, to check for the reliability of the data.
Social Identity Theory. The first determinant for naturalization incentives is the identification with the country of origin and the sense of belonging. There are 4 statements that cover the importance of social identity in the naturalization decision. The first question asked “how important was it for you to apply for citizenship because you feel Aruban?” This question asked if the passport is considered an important factor for one’s identity, attached to feelings of patriotism and social environment. The second question was more concerned with the future relationship and commitment to Aruba: “How important was it for you to apply for citizenship because you decided to settle on Aruba?”. The third and fourth question focused on the role and perception of the individual within the Aruban society. These questions were: “How important was it for you to apply for citizenship to be perceived as a full member of the Aruban community?” and “How important was it for you to apply for citizenship to be treated equally as the Aruban citizens?”. These last questions aimed to identify if respondents understand the change of citizenship as a change of status and social identity.
The category “social identity” had a medium level of internal consistency, as determined by the Cronbach alpha of .73.
Given the low corrected item-total correlation of the variable settle (r=.34) and the Cronbach’s alpha, if the item is deleted (α= .77), the variable settle will be excluded from further analysis. This decision is supported by the results of the PCA, which have shown strong correlations of the variable ‘settle’ with multiple variables. This can be explained by the fact that the intention to settle may also be affected by one’s social capital or rational choice decisions. After excluding the variable “settle”, the final Cronbach’s alpha is .77.
Rational Choice Theory. Rational choice motives are divided into economic and pragmatic motives and safety concerns. The economic motivation was measured with four questions. The first question asked for the importance to apply for citizenship to get access to government funding (i.e. student loans, social benefits, pensions): “How important was it for you to apply for citizenship to have access to loans?” The second question asked: “How important was it for you to apply for citizenship to get access to higher education on Aruba or abroad?”. This question was included after the interviews with Villegas and the Cabinet, who emphasized that immigrants naturalize for educational purposes (Cabinet, personal communication, February 28, 2018; L. Villegas, personal communication, February 10, 2018). Questions 3 and 4 were targeted directly at job opportunities on Aruba and Europe: “How important was it for you to apply for citizenship to get access to jobs on Aruba?” and “How important was it for you to apply for citizenship to get access to job opportunities in Europe?”. Both questions discuss the importance of enhancing job opportunities, both on Aruba and abroad. To measure the importance of pragmatic reasons, 2 questions were examined. The first question asked “how important was it for you to apply for citizenship because traveling is easier with the Aruban citizenship/ Dutch passport?”, and second, “how important was it for you to apply for citizenship to avoid having to reapply for permits to live on Aruba?”. Finally, safety concerns and their impact on naturalization decisions will be questioned. The desire for safety is related

UAUCU Student Research Exchange Collected Papers 2018
197
to both immigration policies and travel restrictions. First, the participant was asked: “How important was it for you to apply for citizenship to not be affected by changes in immigration policies?”, and second, “how important was it for you to apply for citizenship to be able to come and leave Aruba without restrictions?”.
The PCA indicated that rational choice theory can be divided into two separate categories: (1) ‘future opportunities’ (job opportunities on Aruba/ in Europe; traveling; access to higher education; government funding) and (2) ‘naturalization status’ (importance of coming and leaving Aruba; having to reapply and not being affected by policy changes). The category ‘future opportunities’ has an average of 4.20 (SD=.67) and explains 32% of the variance in naturalization decisions. The category ‘naturalization status’ explains a further 11% of the total variance. The Cronbach’s alpha for ‘future opportunities’ and ‘naturalization status’, however, is too low to include both factors in the further analysis. Therefore, it was decided to group economic, pragmatic and safety concerns into one category, namely: rational choice motives. The Cronbach alpha of the newly constructed dependent variable is .78, which indicates a fairly good reliability.
Social Capital Theory. The role social capital plays in individual naturalization decisions will be measured with 2 questions. Firstly, “how important was it for you to apply for citizenship so that your children can have the European citizenship?”. This question aims to measures the importance of intergenerational naturalization decision that has proven to play a significant role in different studies (Street, 2014). Second, the influence of the immigrants’ surroundings is taken into consideration by asking “how important was it for you to apply for citizenship because relatives applied for naturalization too?”. This question measures the perceived importance of social networks on naturalization decisions. The two questions only have a weak correlation and the Cronbach’s alpha is low, namely, .60. Therefore, it is decided
to measure “social capital” using two independent variables instead of grouping them together. This decision is further supported by the outcome of the PCA analysis that indicated correlations between the importance for applying for citizenship for the future of one’s children and rational choice theory.
Political Motivation. Previous research found that being able to vote is an important motivation for naturalization. The participants were asked, “How important was it for you to apply for citizenship to be able to vote in elections?”.
The PCA indicated correlations with various factors. This result was expected, as immigrants may consider voting important for rational choice motives, social identity reasons or to please their social network (see chapter 2). Therefore, ‘political motivation’ will be considered as a category of its own.
Independent variables. The independent variables include the economic position (education; income; occupation), migration background (time living on Aruba; migrant generation) the social network (having children, marital status) and finally the country of origin (GNI per capita; region) of the immigrant. Given the low number of responses, the variables had to be reconstructed into larger categories with “sufficient cases” as presented below.
From a perspective of socialisation theory, the more time an individual spends in a country, the more they identify with its culture and people (Esser, 2009). The independent variables are the immigrants’ status (1st generation/1.5 generation/ 2nd generation), based upon the country of birth, the country of the parents’ birth and the year of migration to Aruba and the time spend in Aruba.
Social networks have shown to impact naturalization decisions. The present research considers the marital status of respondents, including two different statuses, namely
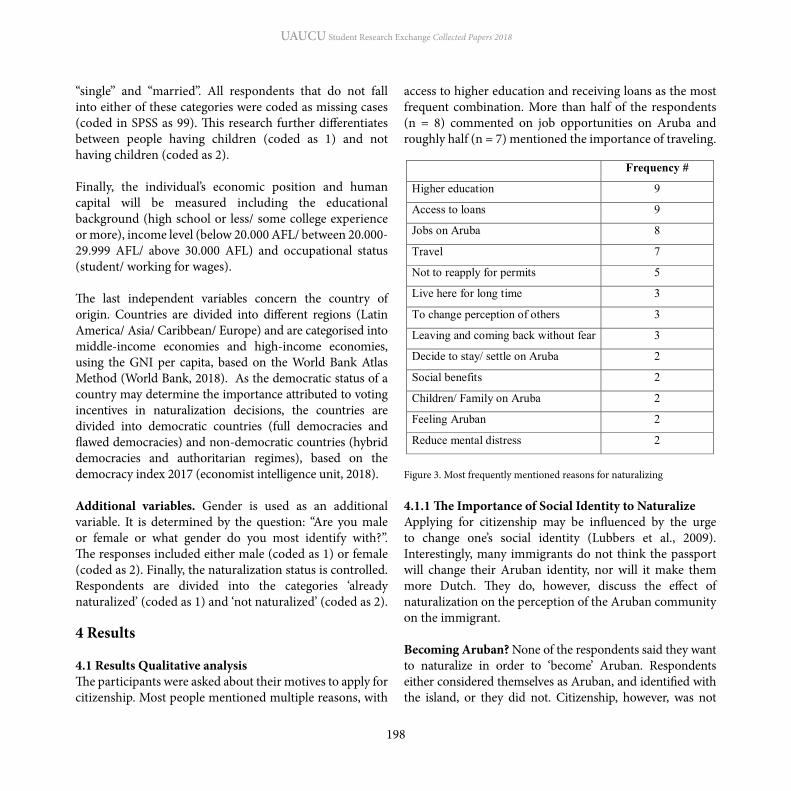
UAUCU Student Research Exchange Collected Papers 2018
198
“single” and “married”. All respondents that do not fall into either of these categories were coded as missing cases (coded in SPSS as 99). This research further differentiates between people having children (coded as 1) and not having children (coded as 2).
Finally, the individual’s economic position and human capital will be measured including the educational background (high school or less/ some college experience or more), income level (below 20.000 AFL/ between 20.000-29.999 AFL/ above 30.000 AFL) and occupational status (student/ working for wages).
The last independent variables concern the country of origin. Countries are divided into different regions (Latin America/ Asia/ Caribbean/ Europe) and are categorised into middle-income economies and high-income economies, using the GNI per capita, based on the World Bank Atlas Method (World Bank, 2018). As the democratic status of a country may determine the importance attributed to voting incentives in naturalization decisions, the countries are divided into democratic countries (full democracies and flawed democracies) and non-democratic countries (hybrid democracies and authoritarian regimes), based on the democracy index 2017 (economist intelligence unit, 2018).
Additional variables. Gender is used as an additional variable. It is determined by the question: “Are you male or female or what gender do you most identify with?”. The responses included either male (coded as 1) or female (coded as 2). Finally, the naturalization status is controlled. Respondents are divided into the categories ‘already naturalized’ (coded as 1) and ‘not naturalized’ (coded as 2).
4 Results
4.1 Results Qualitative analysisThe participants were asked about their motives to apply for citizenship. Most people mentioned multiple reasons, with
access to higher education and receiving loans as the most frequent combination. More than half of the respondents (n = 8) commented on job opportunities on Aruba and roughly half (n = 7) mentioned the importance of traveling.
Figure 3. Most frequently mentioned reasons for naturalizing
4.1.1 The Importance of Social Identity to Naturalize Applying for citizenship may be influenced by the urge to change one’s social identity (Lubbers et al., 2009). Interestingly, many immigrants do not think the passport will change their Aruban identity, nor will it make them more Dutch. They do, however, discuss the effect of naturalization on the perception of the Aruban community on the immigrant.
Becoming Aruban? None of the respondents said they want to naturalize in order to ‘become’ Aruban. Respondents either considered themselves as Aruban, and identified with the island, or they did not. Citizenship, however, was not

UAUCU Student Research Exchange Collected Papers 2018
199
considered a sign of membership. Yet, applying for it was sometimes mentioned as a response to ‘feeling’ Aruban. This sensation was especially strong amongst the 1.5 generation immigrants, who migrated before the age of 13. What makes Aruba home, and them Aruban, is the knowledge of Aruban culture, the nature, the memories they made and the social network of friends and family they established:(…) there is a lot of history here, that you have with your family, so this is home. You went to the beach together, you went to the carnival, you celebrate Christmas, so everything is really a bit, based on the family history and the moments that you spent here, with your friends and your school. So yeah, this is home. (female, 27, British-Guyana)
People who immigrated at a later age (13 years and older), seemed to identify less with Aruba and its culture. Often, their relationship with the country of origin was stronger; positively influenced by vivid memories, the familiarity with the surroundings, and the feeling of acceptance and belonging in their country of origin. Most immigrants that migrated at an older age reported difficulties with learning Papiamento and experienced discrimination on Aruba. Again, citizenship was not considered important in changing their identity or helping them to become more Aruban. A middle-aged, already naturalized respondent from Belgium summarized this feeling as followed:I have to say after 18 years, it’s not like I’m completely integrated. So you’re still, you, you never will be an Aruban.I: Why so?P: Because you don’t have family here. So there’s still some gaps in the language of course, because if you’re married to an Aruban guy who speak Papiamento at home, it’s much more easily, but just like picking up from the streets and so even after years it’s sometimes like, what are they saying? Yeah. So that’s, that’s the, the Gap (female, 54, Belgium)
Interestingly, the feeling of belonging was only mentioned in relation to Aruba. The Kingdom of the Netherlands did not play a role in any of the respondents’ decisions to
naturalize. Some respondents, however, elaborated on their perception of the Netherlands. One participant (female, Columbia) mentioned an emotional attachment to the Netherlands: I am more bond to Holland right now in this moment. Also that I share so much in Holland and I learned more and I was living with Holland people in and I’m working with Holland people so it’s like it’s more bond. You see. How much of influence is about living in Aruba? I have so much part of, of, of Holland culture have so much part of Aruban culture (female, 24, Columbia)
This participant has visited the Netherlands before and wishes to continue her higher education there. Other participants mentioned the Aruban connection with the Netherlands as positive because it gives access to opportunities, including the possibility of studying abroad and access to financial aid. Furthermore, they consider the Netherlands helpful in supporting Aruba in times of crisis. Besides that, respondents did not mention an emotional connection to the country itself. I don’t feel like it belongs. They say like for the Dutch, it belongs in the Dutch Kingdom, the Netherlands Antilles but it doesn’t feel like it. It really feels like Aruba is just Aruba, apart from the Dutch Antilles. (female, 30, Suriname)The Dutch passport means a lot. It helps a lot. You can travel anywhere you want. Well I mean if you have money. Even if you don’t have money, it gives you a lot of incentives and its really, it’s an advantage for students, like me, who wants to achieve something, want to pursue another career because you don’t have those possibilities, the system is very limited, it’s very, it, like, students like me, people like me, who want to do something always want to go elsewhere to have a greater mind-set and that where I feel, yeah because honestly, when Aruba gives you a permit you basically stuck in one place. Because if they give you a school permit, you can’t work. Let’s say, you can only work part-time, you cannot work fulltime. But when you have the Dutch passport, you can navigate, you can move around, you can do more. (female, 21, Haiti)

UAUCU Student Research Exchange Collected Papers 2018
200
In conclusion, when applying for Dutch citizenship on Aruba, immigrants are not motivated to become Aruban. Instead, they either consider themselves as Aruban or they do not. It seems that age at migration affects the feeling of being Aruban. Furthermore, immigrants that experienced difficulties with learning the language and experienced discrimination are less likely to consider themselves as Aruban. The perception of ‘the others’. Interestingly, although applicants’ do not consider citizenship important in changing their own feelings of membership, there is a general perception that having a Dutch passport changes the perception of Arubans on immigrants. For instance: “if you have a Dutch passport, they (the Arubans) do regard you differently than someone who has a, another, like even a permit of 10 years.” (female, 21, Haiti)P: Just because you have a Dutch passport doesn’t really mean you have experience and expertise but it actually gives you an image. It gives you a, yeah, an exclusive, it gives you an exclusive look.I: What is that look, you think?P: Mostly because it’s hard to get a Dutch passport here, basically. And when you get, when you get a Dutch passport, people regard you highly (female, 21, Haiti)
Respondents, especially those from Latin-American countries, described an ‘anti-immigrant climate’ on Aruba. They experienced discrimination at school, during job applications and at the local immigration office DIMAS, amongst other places.
By naturalizing, immigrants hope to reduce the stigma attached to their immigration background. Two middle-aged women from Suriname elaborated further, that although they hope the passport will reduce discrimination, they do not believe that the stigma will fully dissolve. Although the passport may increase the likelihood of getting jobs, it will not end discrimination as Arubans look at one’s family name.
They referred to this phenomenon as the “Aruban privilege”, reserved to people with a long heritage on the island (female, 30, Suriname; female, 37, Suriname).
4.1.2 The Importance of Rational Choice Motives to Naturalize
The motivation to apply for citizenship for rational reasons was mentioned most frequently. Motives include economic and safety concerns.
Building up a future: Economic motives. The most frequently mentioned reasons to apply for Dutch citizenship were to get access to higher education in combination with access to study loans (Aruba lening, DUO). For this, Dutch citizenship is beneficial in two ways. First, study choices for higher education in Aruba are limited. Secondly, having the Dutch citizenship does not only reduce the university fees, but gives access to governmental loans, which are necessary for many people to pay for the education. The access to student loans is restricted to people under 30 years of age. Therefore, some respondents emphasized the urgency to naturalize now: If I get it when I am old, yeah, it doesn’t matter anymore. Because when you are thirty I guess you can’t apply for the lening (loans). If you don’t apply for the lening (loans) you don’t get the DUO in the Netherlands (female, 24, Venezuela).
Overall, access to loans and government funds was mentioned by 9 respondents. Applicants emphasizing the importance of naturalization to get access to higher education mostly wanted to leave Aruba to study in the Netherlands. Respondents that considered access to social welfare, pension plans and construction loans important, mostly intended to settle in Aruba. Their motivation to naturalize concerned future intentions on the island.
Job opportunities on Aruba are another important factor for naturalization. Immigrants hope to increase their

UAUCU Student Research Exchange Collected Papers 2018
201
employment chances, as many employers are said to be specifically looking for Dutch citizens. Furthermore, not having to reapply for a work permit is considered important, as it saves time and money.
Defensive Naturalization. Naturalization is not only considered economically advantageous, but serves to protect one’s rights in Aruba and abroad. Applicants specifically mentioned naturalization decisions in relation to travel opportunities and permit applications. 54% of the respondents spoke of traveling when applying for Dutch citizenship. Some mentioned traveling, in general, including the opportunity to explore other countries, while others specifically referred to make traveling to their country of origin easier; “I can go travel and come back here instead of worrying whether are they really gonna accept my papers or not, if I come back.” (female, 37, Suriname)
A middle-age Suriname women reported difficulties to access Aruban territory after a trip to her country of origin, despite having a permanent residency on Aruba. A young, Venezuelan women reported the fear of leaving Aruba and not being able to come back to the Island to finish her studies. A young Columbian man reported that he did not travel for 8 years before applying for naturalization because of the fear to create gaps in his legal residency that will delay his naturalization process.
Not having to reapply for permits was mentioned explicitly by 5 respondents. Moreover, being a citizen as opposed to a ‘legal’ resident is considered a matter of safety. All of the respondents (100%) reported problems with applying for permits at the local immigration institution, DIMAS. This has several implications on the life of the immigrant. First, working and living without a legal permit, has been reported to cause anxiety and mental distress: “You get (…) this anxiety problem of rejection, of everything, (…) you explode your small world, your small dreams explode.”
(female, Columbia, 24, female)(I applied for naturalization) mainly because, because the paperwork here was such a hassle and not feeling comfortable that I was working and being here without papers. Sometimes the gaps in between and the feeling like, OK, you can, of course they wouldn’t, but it was possible, theoretically, that they can find you and expel you (female, 54, Belgium)Second, applicants had difficulties finding jobs without Dutch citizenship and felt pressured to engage in illegal employment.Are they pushing me to being a drug dealer? Because that’s the only job that you can get to have a fairly decent job. Of, of, of what do I need to do? (…) kill myself in front of, of making like a big something of you want to die. Actually I, I, I will tell you honestly, you just don’t want to live anymore because you don’t know what to do. (female, 21, Haiti)Third, having a gap in permits delayed the intent of many immigrants to apply for naturalization, as they could no longer fulfil the 5-year living requirement.
Why do the problems with the permits arise? Respondents mentioned the lack of education of the employees at DIMAS. Often, the requested information about the application procedure for permits was incomplete or wrong. Furthermore, there is only limited information available for the applicants to inform themselves. Respondents mentioned the lack of organization at DIMAS: they reported lost documents and online networks are not updated frequently enough. Furthermore, people described discrimination targeted towards them. Some respondents even portrayed the interaction with DIMAS as a form of competition: They say OK; we will call you. And they didn’t call you for eight months. And you say, I really need my papers and they say Oh, but no, we forgot to mention you need another…. So that was really annoying and that’s what they do with all the other people. They are very difficult just to not have to give them papers. They hope you give up. (female, 54, Belgium)So the guy told my mom, look really easy lady. You suck my
UAUCU Student Research Exchange Collected Papers 2018
202
dick and your daughter will get everything. (....) My mom was married still, you know, and my mom crying, you know, she’d say no. And then the guy say, don’t worry, I will make sure your daughter, gets, you and your daughter don’t get anything in Aruba. I will make sure of that.” (female, 24, Columbia)It is important not to generalize these accusations, and immigrants explicitly mentioned differences between individual employees at the institution. Overall, however, people experienced an ‘anti-immigrant’ attitude at DIMAS that makes them feel unsafe about their position in Aruba. Naturalization may therefore be considered a defensive act to protect their rights.
4.1.3 The Importance of Social Capital to NaturalizeThe social network of immigrants in Aruba affected naturalization decisions in two ways. First, respondents with children mentioned the importance of naturalizing to enable their child a better future: “My son was born and the situation changes in Venezuela. And then I said: I don’t have a future in Venezuela. There is no future for my son there either” (female, 28, Venezuela) Second, social capital seemed to play a major role in increasing or decreasing one’s chances of success. Knowing people that have undergone the same process before is mentioned as an advantage to gain information about the process. Meanwhile, parents have been reported to be a barrier in the naturalization process, too, especially when the immigrant is underage and cannot sign for themselves. A female respondent from Haiti reported: I find it stressful because, basically if your parents weren’t intelligent enough to not proceed your, ehm, status. Legal status. Then you basically, hands tight. And you have to have connections here, in order to be able to apply for a permit or in order to have, obtain a permit (female, 21, Haiti)On the other hand, personal contacts with the government or immigration organisations are reported as helpful in the naturalization process. It was with the Cabinet with the Governor and we knew
people there. It’s not like they helped me, but they knew. They were like, OK, you’re Dutch. We know you speak Dutch. Uh, there’s no reason to be difficult about this is just what we have to know the procedures.I: OK. Did you contact them sometimes directly as well to ask about specific things?P: No, no. But if we go to the, to the office, we, we saw each other. We know each other. Yeah.” (Female, 54, Belgium)And then also the hotels trying to tell you to lie to your workers, that (they) are going to be OK, (…) we’re going to fix your papers. But it’s not true. And also people with money and influence, hotels and those things doing favours for the government. And they get their paperwork done. You know, you, I saw that thing happening (…) you will get your favours and then the, the general manager gets the paper done” (female, 24, Columbia)
This shows the heavy influence networks may have on the naturalization process. On the other hand, these networks can have opposite effects for the individual: “(…) you have the problem that here in Aruba, everybody knows each other, so you have already someone that don’t like you anymore and he has a big power” (female, 24 Columbia).
Against the expectations, none of the respondents said that friends or relatives emotionally impacted their naturalization decisions. Social capital is rather seen important to simplify the process.
4.2 Survey ResultsOverall, most Likert items were considered ‘important’ in affecting naturalization decisions. Some variables were considered moderately important and one variable, namely, ‘the effect naturalized relatives have on naturalization decisions’, was considered of little importance for naturalization decisions.
Important. With an average of 4.40, respondents considered not having to reapply for permits as most important
UAUCU Student Research Exchange Collected Papers 2018
203
(SD=0.90). This is followed by having access to higher education (M=4.38, SD=1.15), travel opportunities (M= 4.34, SD=0.87), access to government funding (M=4.22, SD=1.08), to be able to come to and leave Aruba (M=4.19, SD=1.14) and not be affected by policy changes (M= 4.16, SD=1.11). Applying for naturalization because one decided to settle in Aruba was considered important (M= 3.93, SD=1.35) as was having access to job opportunities in Aruba (M=3.95, SD= 1.21). Access to job opportunities in Europe was considered less important compared to those in Aruba but still represented an important factor in naturalization decisions (M=3.61, SD=1.25). Finally, naturalizing in order to be treated equally as the Arubans citizens (M=3.60, SD= 1.39) and for the future of one’s child were generally considered important (M=3.58, SD=1.40).
Moderately important. Respondents considered it moderately important to naturalize to become a full member of the Aruban community (M=3.28; SD=1.45) and because they feel Aruban (M=3.29; SD=1.45). The average importance to naturalize to be able to vote in elections was 3.19 (SD=1.35).
Of little importance. To naturalize “because other relatives did so” was considered of little importance (M=2.44; SD= 1.24). Other reasons for naturalization. The survey allowed participants to fill in additional reasons for naturalization, which 3 people did. These reasons included: • “to open job opportunities and do not depend on your
employer”• “to receive the same rights as any other Aruban”• “because I was born on Aruba”
The Effects of Individual Determinants on Differences in Naturalization Choices. The statistical analysis showed that rational choice motives are most important to explain the motivation of immigrants in Aruba to apply for Dutch
citizenship (M=4.20, SD=0.67). They are followed by the incentive to apply for the future of one’s child (M=3.58, SD= 1.40), social identity reasons (M= 3.41, SD= 1.17), the possibility to vote (M=3.19, SD= 1.37) and, finally, because other relatives applied for naturalization too (M= 2.44, SD=1.24). In contradiction to the hypotheses, the bi-variate analysis has shown that age is the only independent variable that affects naturalization decisions. A multiple regression was run to predict rational choice motivation max from age. The multiple regression model shows that age significantly predicted rational choice motives, F(1,53) = 5.906, p =.19, adj. R2 = .083. Age explained 10% of the variability in rational choice motives to apply for citizenship.
5 Summary and Discussion
5.1 Mixed Method DiscussionIn what follows, findings from the qualitative and quantitative analysis will be compared and discussed.
Rational Choice. Rational choice motives to apply for citizenship were considered most important in both, the qualitative and the quantitative analysis. As anticipated from the results of previous studies on naturalization, future opportunities, including access to higher education, travel opportunities’ and access to government funding were mentioned as naturalization motives in qualitative interviews and were ranked as ‘important’ on the Likert Items.
The only reason that was considered important (M=3.61, SD=1.246) in the questionnaire but has not been mentioned frequently during the interviews, was ‘job opportunities in Europe’. This alteration may be explained by the methodological difference between surveys and interviews. While the semi-structured interviews asked for the main reasons for naturalization, respondents may be inclined to list factors that have affected or affect their lives at this moment, such as access to higher education.

UAUCU Student Research Exchange Collected Papers 2018
204
Entering the labor market may play a role in the future but may not be considered urgent, yet. In the survey, however, different naturalization motives were included and served as a prompt. This may have increased the attention paid to future opportunities, such as work opportunities in Europe. Immigrants that naturalize to attend higher education abroad, especially, may consider future employment opportunities important. The data from the innovation report 2017 supports this anticipation: of the 300 students that leave Aruba annually to study abroad, only 20% return within 3 to 5 years to Aruba and less than 25% of young professionals on Aruba believe in business opportunities on Aruba (Central Bank of Aruba, 2017). This explanation may further explain the small, yet statistically significant effect age has on rational choice motives.
Besides opportunities, many immigrants want to naturalize for pragmatic matters and the longing for security. The Likert items ‘not having to reapply for permits’ (M=4.40, SD=0.90), ‘to be able to come to and leave Aruba’ (M=4.19, SD=1.14) and ‘not being affected by policy changes’ (M= 4.16, SD=1.11) were all considered important. The qualitative analysis indicated that immigrants hope to reduce the hassle required in the permit application process and to avoid travel problems, but more importantly, they considered citizenship important to feel “safe” on Aruba. Naturalization was considered a defensive action to protect their rights in an ‘anti-immigrant’ environment, where the application procedures for residency and working permits are marked with unforeseeable obstacles.
Social Identity Motives. Although generally being considered less important than rational choice motives, social identity does play a role in naturalization decisions. From the interviews, it can be concluded that citizenship is generally not considered a sign of membership; people either identify as Aruban or they do not. People that already feel Aruban see the passport as a sign of membership confirmation. This conclusion
may be supported by importance attributed to Likert item measuring the importance of ‘feeling Aruban’ for naturalization decisions. The descriptive statistics show that on average, the item was considered moderately important (M=3.29; SD=1.45). The range, however, indicates that some people considered the ‘feeling as Aruban’ as very importance for naturalization decisions, while others did not attribute any importance to it. Furthermore, respondents considered applying for citizenship to ‘become a full member of the Aruban community’ as moderately important (M=3.28; SD=1.45). This seems to be in contradiction with the aforementioned conclusion that the passport is not considered a sign of membership. However, the question does not measure whether ‘full membership’ refers to the perception of the immigrant him or herself within a social group or if it measures the perception of the Aruban community on the immigrant. It is the latter one that has shown to be important in the qualitative analysis. This finding is supported in the qualitative results in the ranking of the Likert item ‘how important is it for you to apply for naturalization to be treated equally as Arubans’ as important.
Interestingly, when looking at the qualitative interviews, it seemed that immigrants that migrated at a young age felt more Aruban. The bi-variate analysis, however, did not show a significant effect of the migrant generation on social identity reasons. These findings may not be in contradiction. For the statistical analysis, migrant generations were divided into 3 different groups (1st generation migrants, 1.5 generation migrants and 2nd generation migrants). This subdivision may not be enough. It was, especially, the immigrants that came to Aruba at the age of 13 or younger that considered themselves ‘Aruban’. For future analysis, one should increase the number of immigrant categories, to include 1.25 and 1.75 generations, as suggested by Rumbaut (2004).

UAUCU Student Research Exchange Collected Papers 2018
205
Social Capital Reasons. From the Likert scale analysis, children seem to be the only form of social capital impacting naturalization decisions. While during interviews, to naturalize for the future of one’s child was only mentioned by immigrants with children, there was no significant difference in responses to the Likert item between immigrants with offspring and those without. This may (again) show that respondents take future possibilities into consideration when applying for naturalization after being prompted.
Interestingly, the motivation to apply for citizenship ‘because relatives applied too’, was considered to be of little importance. The qualitative interviews, however, revealed that social capital may act as an incubator to speed up the naturalization process; Parents, friends and relatives that have gone through the naturalization process are often considered helpful in sharing information. Furthermore, having contact with important individuals, including politicians and employees of the naturalization institutions, makes the application process more accessible. In conclusion, social capital may not affect naturalization decisions, but may help immigrants in applying for citizenship.
Voting incentives. Finally, none of the interviewees mentioned voting as a major factor to apply for Dutch citizenship. Yet, the statistical analysis showed that, on average, immigrants consider voting rights moderately important when applying for citizenship (M= 3.19, SD= 1.37). These findings may not be in contrast. The fact that respondents did not mention voting in the interviews may show that they do not consider it as one of the most important naturalization reasons. Nevertheless, it may still play a role in their decision-making process. In her research about immigrants in the USA and Canada, Apektar (2016) noted that only a few immigrants mentioned the importance attributed to voting without being prompted. After prompting, 85% mentioned its value in naturalization decisions in both countries.
5.2 Summary of ResultsThis research aimed to provide more insights into naturalization processes in Aruba, divided into three research questions: (1) what are the legal requirements to be able to apply for naturalization? (2) For what reasons do immigrants in Aruba apply for the Dutch citizenship? And (3) what are the individual determinants that affect naturalization decisions?
Legal Requirements to Apply for Dutch Citizenship. The access to citizenship in Aruba is regulated by the Netherlands Nationality Act (2015), administered by the Netherlands. Immigrants can either apply for the option procedure or for naturalization. While decisions for the option procedure are taken by the Cabinet of Governors, naturalization decisions are taken by the IND in the Netherlands. According to the Dutch understanding of citizenship, naturalization should be more than a paper formality and should imply the immigrants’ incentive to be “choosing for Dutch society” (Tweede Kamer, 2005). However, what does naturalization really mean for immigrants in Aruba?
Motives to Naturalize. The research about naturalization decisions was divided into two concurrent, separate analyses that include semi-structured interviews and quantitative research in form of a Likert scale questionnaire. While the qualitative research was of exploratory nature to leave room for unexpected results, the Likert items were based on findings of previous studies on naturalization motives and expert interviews.
The results of the qualitative and quantitative studies show similar patterns of immigrants’ naturalization decisions. Rational choice motives were considered most important, followed by future opportunities for one’s children, social identity motives, voting incentives and the importance to apply for citizenship because relatives applied too. However, what do these categories mean to the immigrants?

UAUCU Student Research Exchange Collected Papers 2018
206
Comparable to findings on naturalization decisions in other countries, rational choice motives include access to job opportunities and travel possibilities. Interestingly, access to higher education was considered especially important. This may be impacted by the relatively young sample group and the limited access to higher education available in Aruba. Besides, voting has been considered moderately important when applying for naturalization.
The results of naturalization incentives differ to findings of similar studies in other countries because of the importance of safety concerns in naturalization decisions. Naturalization is considered a defensive move to protect one’s rights on Aruba and to reduce the stigma attached to one’s immigration background. (Perceived) discrimination and racist attitudes impact naturalization decisions for rational choice and social identity motives.
Safety concerns play a major role when explaining rational choice motives for naturalization. Citizenship is perceived as the only legal status that secures access to the Aruban territory and allows people to travel without having to fear not being able to re-enter Aruba. Immigrants hope that naturalization will reduce mental distress that develops from their insecure legal status on Aruba. Access to permits, especially, plays an important role. Regardless of the immigrants’ country of origin, income or migration background, permits are handed out infrequently by the local immigration institution DIMAS. Even immigrants that are in possession of the firma liber (permanent residency) are scared of policy changes.
The analysis of the role of social identity in naturalization decisions furthermore showed that immigrants do not feel they ‘become’ more Aruban by changing their legal status. Actually, most immigrants do not expect to change their own feeling of membership but rather their social standing in the eyes of the Aruban community. Naturalization is expected to reduce discrimination and to increase one’s social status.
Effects of Individual Determinants on Naturalization Decisions. In the literature, it has been suggested that naturalization decisions are impacted by the human capital (occupation, income, education), individual attributes (age, gender), social network (marital status, having children), migration background (migration generation/ time since arrival in Aruba) and the country of origin (GNI per capita/ region of origin) of the immigrant.
From the analysis, it can be concluded that there were almost no differences in the importance attributed to naturalization decisions. Only age explained 10% of the variability in rational choice motives to apply for naturalization. The outcomes to this question, however, are limited because of the small number of cases for each independent variable and the non-random sample group. On the other hand, the lack of significant differences between immigrant groups may indicate that, roughly speaking, many naturalization experiences are often shared and similar for all immigrants on Aruba.
Impact of Results for the Aruban Community. From the analysis and discussion, it can be concluded that immigrants do not understand naturalization as “choosing for Dutch society” (Tweede Kamer, 2005). Instead, citizenship is considered an access to future opportunities and a defensive move. One major reason for the discrepancy between the Dutch understanding of naturalization and the one of the immigrants is the (perceived) discrimination that shows in daily interactions with the Aruban community and local institutions, such as DIMAS. The feeling of not being welcomed starts with small signs. One example is the abbreviation “DIMAS” which translates into “too many”. Although this may only be a coincidence, informal conversations have indicated that many immigrants perceive the name as being representative of the anti-immigrant attitudes in the political sphere.

UAUCU Student Research Exchange Collected Papers 2018
207
Aruba has committed to the United Nations sustainable development goals. Goal 16 promotes the development of just, peaceful and inclusive societies. It is predicted that in 2030 immigrants will represent about half of the Aruban population (Migration, 2010). If defensive naturalization motives remain equally important as they are today, fear and anxiety may become integral in the reproduction of the Aruban society. Now more than ever, it is urgent to discuss the effect of naturalization and inclusive citizenship on the sustainable development of Aruba.
5.3 Strength, Limitations and suggestions for further research
5.3.1 Strengths and limitationsThis research had several strengths and limitations. The greatest strength is the insight it provides into naturalization decisions of immigrants in Aruba, which has been, to our knowledge, mainly ignored by previous research. Although there is some literature from other countries, this research has shown that naturalization motives differ in Aruba. The second strength of the research is, that the study combines qualitative and quantitative research methods to gain a fuller understanding of the research problem. The third strength is the community based approach used to conduct this research. Involving the Cabinet of Governors, as well as co-researchers and publishing about the writing process in newspapers increased the awareness of the project and established trust in the community, which is likely to result in more reliable results.
Several limitations of this research may have influenced the results. First, the sample group for both, the qualitative interviews and the quantitative survey responses were collected using the snowball method and are therefore not likely to represent the population. Although the focus of this research is not on the univariate statistics of the study but to understand naturalization decisions from the perspective of the immigrant, a more representative sample
might provide useful insights. Second, due to the limited time frame, the survey sample of N=60 was relatively small, yet highly diverse, which made the independent variable groups rather small (i.e. income groups, the region of origin). As a consequence, the quantitative analysis was restricted to conducting bivariate analyses only. The results have to be read with great care as they are not as robust as those of multivariate analyses (Witte, 2014). Furthermore, social desirability may be a limitation, especially, during the interviews. Finally, immigrants with different naturalization statuses filled out the questionnaire. Some respondents have not naturalized (yet), some have naturalized a while ago, while others have been naturalized for years. Although the statistical analysis did not find an association between naturalization status and immigrants’ motives, each group may have been exposed to different naturalization laws. Additionally, immigrants who naturalized some time ago may have been impacted by their experience as a naturalized citizen. Their answers may no longer represent their initial motives for naturalization. Ideally, respondents would fill out the questionnaire at one specific moment of time during the naturalization procedure (i.e. after the naturalization ceremony).
5.3.2 Suggestions for Further ResearchThis study has shown the need for further research about naturalization decisions of immigrants in Aruba. To gain more valuable insights into naturalization decisions, a sample that is representative of the immigrant population in Aruba is required. This may increase the reliability of the data, allow for more elaborate statistical analyses and may include more independent variables.
Some variables that should be considered for future research include (perceived) discrimination and a more in-depth analysis of the social network of immigrants. In the interviews, many immigrants mentioned the impact of discrimination on their naturalization decisions. It would be interesting to see what form of discrimination affects

UAUCU Student Research Exchange Collected Papers 2018
208
naturalization decisions the most. Moreover, although respondents did not consider it important to apply for naturalization because relatives did so, their social network may still impact their decisions unconsciously. Questionnaires should, therefore, pay attention to the immigrants’ number of naturalized friends and relatives, including their migration backgrounds. This research gave insights into naturalization motives of immigrants that wish to obtain the Dutch citizenship. The scope did not allow to look at the barriers to naturalization and ignores immigrants who fulfil all citizenship requirements and do not chose to naturalize. Their motives should become subject to future research.
References
• Alofs, L. (2008). The Aruba heritage report. Aruba’s intangible cultural heritage, an inventory.
• Aptekar, S. (2016). Making sense of naturalization: What citizenship means to naturalizing immigrants in Canada and the USA. Journal of International Migration and Integration, 17(4), 1143-1161.
• Baran, M. L., & Jones, J. E. (2016). Mixed Methods Research for Improved Scientific Study (pp. 1-335). Hershey, PA: IGI Global. doi:10.4018/978-1-5225-0007-0
• BBC. (2017, May 23). Aruba profile. Retrieved April 05, 2018.
• Bloemraad, I., & Sheares, A. (2017). Understanding Membership in a World of Global Migration:(How) Does Citizenship Matter?. International Migration Review, 51(4), 823-867.
• Böcker, A., & Thränhardt, D. (2006). Multiple citizenship and naturalization: An evaluation of German and Dutch policies. Journal of International Migration and Integration/Revue de l’integration et de la migration internationale, 7(1), 71-94.
• Bratsberg, B., Ragan, Jr, J. F., & Nasir, Z. M. (2002).
The effect of naturalization on wage growth: A panel study of young male immigrants. Journal of Labor Economics, 20(3), 568-597.
• Brettell, C. B. (2006). Political belonging and cultural belonging: Immigration status, citizenship, and identity among four immigrant populations in a Southwestern city. American Behavioral Scientist, 50(1), 70-99.
• Bueker, C. (2005). Political Incorporation among Immigrants from Ten Areas of Origin: The Persistence of Source Country Effects. The International Migration Review, 39(1), 103-140.
• Casey, N. (2016). Hungry Venezuelans Flee in Boats to Escape Economic Collapse. Retrieved March 19, 2018.
• CBS. (2003). Aruba: Migration and Integration. Retrieved April 04, 2017.
• CBS. (2010). Social Atlas of Aruba. Retrieved April 04, 2018.
• CBS. (2018). The Future Intentions of Recent Migrants by Region of Origin. Retrieved April 04, 2018.
• Central Bank of Aruba. (2017). Isla Innovatio. Retrieved April 6, 2018.
• Cohen, J. (1988). Statistical power analysis for the behavioural sciences (2nd ed.). Hillsdale, NJ: Lawrence Earlbaum Associates.
• Diehl, C., & Blohm, M. (2003). Rights or identity? Naturalization processes among “labor migrants” in Germany. International Migration Review, 37(1), 133-162.
• DIMAS. (2018). Citizens of the Dutch Kingdom. Retrieved April 05, 2018.
• Dronkers, J., & Vink, M. P. (2012). Explaining access to citizenship in Europe: How citizenship policies affect naturalization rates. European Union Politics, 13(3), 390-412.
• Elden, M., & Levin, M. (1991). Cogenerative learning: bringing participation into action reserach. IN: Whyte, WF Participatory Action Research, 127-142.
• Enchautegui, M., & Giannarelli, L. (2015). The Economic Impact of Naturalization on Immigrants

UAUCU Student Research Exchange Collected Papers 2018
209
and Cities. Retrieved April 3, 2018.• Esser, H. (2009). Pluralisierung oder Assimilation?
Effekte der multiplen Inklusion auf die Integration von Migranten/Pluralization or Assimilation? Effects of Multiple Inclusion on the Integration of Immigrants. Zeitschrift für Soziologie, 358-378.
• Fick, P. (2016). Does Naturalization Facilitate Integration?. Zeitschrift für Soziologie, 45(2), 107-121.
• Finifter, A. W., & Finifter, B. M. (1989). Party identification and political adaptation of American migrants in Australia. The Journal of Politics, 51(3), 599-630.
• Fix, M., & Laglagaron, L. (2002). Social Rights and Citizenship: An International Comparison.
• Freeman, G. P., Plascencia, L. F., Baker, S. G., & Orozco, M. (2002). Explaining the surge in citizenship applications in the 1990s: Lawful permanent residents in Texas. Social Science Quarterly, 83(4), 1013-1025.
• Gershon, S. A. (2016). The Road to Citizenship: What Naturalization Means for Immigrants in the United States. By Sofya Aptekar. New Brunswick, NJ: Rutgers University Press, 2015. 190 pages.
• Gilbertson, G. A. (2004). Regulating transnational citizens in the post-1996 welfare reform era: Dominican immigrants in New York City. Latino Studies, 2(1), 90-110.
• Gonzalez-Barrera, A., Lopez, M. H., Passel, J. S., & Taylor, P. (2013). The path not taken. Pew Research Center.
• Gouverneur van Aruba. (n.d.). The Cabinet. Retrieved April 05, 2018, from http://www.kabga.aw/.
• Gouverneur van Aruba. (n.d.). Welcome. Retrieved April 05, 2018, from http://www.kabga.aw/
• Gropas, R., & Triandafyllidou, A. (2012). Migrants and political life in Greece: Between political patronage and the search for inclusion. South European Society and Politics, 17(1), 45-63.
• Harpaz, Y. (2015). Ancestry into Opportunity: How Global Inequality Drives Demand for Long-distance
European Union Citizenship. Journal of Ethnic and Migration Studies, 41(13), 2081-2104.
• Van Hook, J., Brown, S., & Bean, F. (2006). For Love or Money? Welfare Reform and Immigrant Naturalization. Social Forces, 85(2), 643-666.
• Immigratie- en Naturalisatiedienst. (2017). Hoe kunt u Nederlander werden? (How can you become a Dutch citizen?). Retrieved June 12, 2017.
• Jones-Correa, M. (2001). Institutional and contextual factors in immigrant naturalization and voting. Citizenship Studies, 5(1), 41-56.
• Karpathakis, A. (1999). Home society politics and immigrant political incorporation: the case of Greek immigrants in New York City. International Migration Review, 55-78.
• Kymlicka, W., & Norman, W. (1994). Return of the Citizen: A Survey of Recent Work on Citizenship Theory. Ethics, 104(2), 352-381.
• Leszczensky, L. (2013). Do national identification and interethnic friendships affect one another? A longitudinal test with adolescents of Turkish origin in Germany. Social science research, 42(3), 775-788.
• Marger, M. N. (2006). Transnationalism or assimilation? Patterns of sociopolitical adaptation among Canadian business immigrants. Ethnic and Racial Studies, 29(5), 882-900.
• Meer, S., & Sever, C. (2004). Gender and citizenship. Overview Report, Institute of Development Studies.
• Migration. (2010). Retrieved March 19, 2018, from http://arubademographics.com/chapters/migration/.
• Ministry of Foreign Affairs. (n.d.). Kingdom of the Netherlands: One Kingdom- four Countries. Retrieved March 19, 2018.
• Minkler, M. (2005). Community-based research partnerships: challenges and opportunities. Journal of Urban Health, 82, ii3-ii12.
• Nam, Y., & Kim, W. (2012). Welfare Reform and Elderly Immigrants’ Naturalization: Access to Public Benefits as an Incentive for Naturalization in the United States.
International Migration Review, 46(3), 656-679. • Naturalisatiedienst (IND). (2017, November 20).
Frequently asked questions. Retrieved April 03, 2018. • Naturalisatiedienst (IND). (2018, March 30). Costs.
Retrieved April 03, 2018.• Nestmann, M. (2011). Dutch Passport Becoming Even
Harder to Get. Retrieved June 12, 2017, from https://www.nestmann.com/dutch-passport-becoming-even-harder-to-get
• Netherlands Nationality Act (2015). Retrieved June 12, 2017.
• Van Oers, R. (2008). From liberal to restrictive citizenship policies: the case of the Netherlands. International Journal on Multicultural Societies, 10(1), 40-59.
• Overheid Aruba. (2014, August 08). Verblijfsvergunningen en waarborgsommen. Retrieved April 05, 2018
• Petracca, M. (1991). The Rational Choice Approach to Politics: A Challenge to Democratic Theory. The Review of Politics, 53(2), 289-319.
• Razak, V. (1995). Culture under construction: The future of native Arubian identity. Futures, 27(4), 447-459.
• Reichel, D. (2011). Staatsbürgerschaft und Integration: Die Bedeutung der Einbürgerung für MigrantInnen. Springer-Verlag.
• Robbers, G. (2007). Encyclopedia of World Constitutions. 1. New York City: Facts on File, Inc. p. 649. ISBN 0-8160-6078-9.
• Rumbaut, R. G. (2004). Ages, life stages, and generational cohorts: Decomposing the immigrant first and second generations in the United States. International migration review, 38(3), 1160-1205.
• Street, A. (2014). My child will be a citizen: Intergenerational motives for naturalization. World Politics, 66(2), 264-292.
• Sumption, M., & Flamm, S. (2012). The economic value of citizenship for immigrants in the United
States. Migration Policy Institute. September.• Tajfel, H., & Turner, J. C. (1986). The social identity
theory of intergroup behavior. In S. Worchel & WG Austin (Eds.), Psychology of intergroup relations: 7-24. Chicago: Nelson-Hall.
• Teddlie, C., & Tashakkori, A. (2003). Major issues and controveries inthe use of mixed methods in the social and behvioral sciences. Handbook of mixed methods in social & behavioral research, 3-50.
• The Economist Intelligence Unit. (2018). Democracy Index 2017: Free speech under attack. Retrieved April 4, 2018.
• Tweede Kamer. (2005). Kamerstukken Tweede Kamer, 2004-2005, 28 689, nr. 33.
• United Nations. (n.d.). Sustainable development goals. Retrieved April 11, 2018, from https://www.un.org/sustainabledevelopment/sustainable-development-goals
• De Vaus, D. A. (2002). Surveys in social research. Psychology Press.
• Villegas, L. (2017, May 22). ‘Futuro ta solamente bon; no pa mi so, pero pa tur hende cu mester’. Retrieved April 05, 2018.
• DeVoretz, D. J., & Pivnenko, S. (2004). The economics of Canadian citizenship.
• Witte, N. (2014). Legal and symbolic membership–Symbolic boundaries and naturalization intentions of Turkish residents in Germany. RSCAS, 100, 1- 39.
• World Bank. (2018). World Bank Country and Lending Groups. Retrieved April 03, 2018.
• Wunderlich, T. (2005). Die neuen Deutschen: subjektive Dimensionen des Einbürgerungsprozesses (Vol. 9). Lucius & Lucius DE.
• Yang, P. (1994). Explaining Immigrant Naturalization. The International Migration Review, 28(3), 449-477. doi:10.2307/2546816
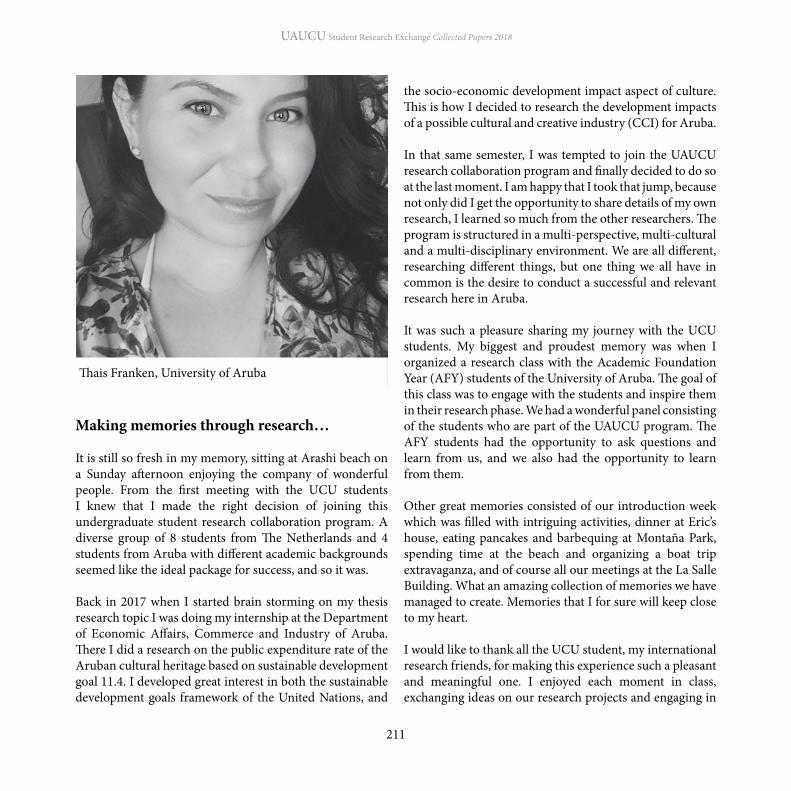
UAUCU Student Research Exchange Collected Papers 2018
211
Making memories through research…
It is still so fresh in my memory, sitting at Arashi beach on a Sunday afternoon enjoying the company of wonderful people. From the first meeting with the UCU students I knew that I made the right decision of joining this undergraduate student research collaboration program. A diverse group of 8 students from The Netherlands and 4 students from Aruba with different academic backgrounds seemed like the ideal package for success, and so it was.
Back in 2017 when I started brain storming on my thesis research topic I was doing my internship at the Department of Economic Affairs, Commerce and Industry of Aruba. There I did a research on the public expenditure rate of the Aruban cultural heritage based on sustainable development goal 11.4. I developed great interest in both the sustainable development goals framework of the United Nations, and
the socio-economic development impact aspect of culture. This is how I decided to research the development impacts of a possible cultural and creative industry (CCI) for Aruba.
In that same semester, I was tempted to join the UAUCU research collaboration program and finally decided to do so at the last moment. I am happy that I took that jump, because not only did I get the opportunity to share details of my own research, I learned so much from the other researchers. The program is structured in a multi-perspective, multi-cultural and a multi-disciplinary environment. We are all different, researching different things, but one thing we all have in common is the desire to conduct a successful and relevant research here in Aruba.
It was such a pleasure sharing my journey with the UCU students. My biggest and proudest memory was when I organized a research class with the Academic Foundation Year (AFY) students of the University of Aruba. The goal of this class was to engage with the students and inspire them in their research phase. We had a wonderful panel consisting of the students who are part of the UAUCU program. The AFY students had the opportunity to ask questions and learn from us, and we also had the opportunity to learn from them.
Other great memories consisted of our introduction week which was filled with intriguing activities, dinner at Eric’s house, eating pancakes and barbequing at Montaña Park, spending time at the beach and organizing a boat trip extravaganza, and of course all our meetings at the La Salle Building. What an amazing collection of memories we have managed to create. Memories that I for sure will keep close to my heart.
I would like to thank all the UCU student, my international research friends, for making this experience such a pleasant and meaningful one. I enjoyed each moment in class, exchanging ideas on our research projects and engaging in
Thais Franken, University of Aruba

UAUCU Student Research Exchange Collected Papers 2018
212
feedback sessions. Not to forget all the inspiring activities we shared together as a group. I will treasure all the wonderful times we had fun together and laughed under the sun. All the best and much success with your final thesis and future endeavors. You are all awesome!
A big thank you also goes to Eric Mijts, Jocelyn Ballantyne and Kitty Groothuijse for believing in me and supporting the entire group from the beginning till the end. Thank you for granting me the opportunity to contribute to such an amazing research collaboration program. It is incredible how much I have grown from this experience and that is all thanks to you two whom work hard to make this possible for us.
To you reader, thank you for your interest in our program and reading this. I hope to inspire you with my research project and my experience. Sharing this with you is part of my contribution to general knowledge on the development impacts of a possible creative industry here in Aruba, and to open new opportunities for research on the CCIs and SDGs here in Aruba.

UAUCU Student Research Exchange Collected Papers 2018
213
1. Introduction
In the last couple of years there has been a growing interest in Aruba for creative industries to solve issues related to the realization of economic, cultural and social value in an innovative manner. Issues related to factors such as employment, heritage sustainability and social cohesion. The vision of the previous government is to build the third economic pillar for Aruba, a knowledge based economy, through one of the top four sectors, namely, creative industries. This may possibly be the next opportunity for Aruba to increase economic diversification, stability, cultural preservation and social development. According to UNESCO (2017), Cultural and Creative Industries (CCI) are defined as “sectors of organized activity whose principal purpose is the production or reproduction, distribution, and/or commercialization of goods, services and activities of a cultural, artistic or heritage- related nature” (n.p). This approach emphasizes more than just the industrially made products of human creativity; it makes relevant the entire productive chain, as well as the specific functions of each sector involved in bringing these creations to the public. Thus, the definition also encompasses related activities, such as creative content, publicity and graphic design, which are decisive factors in this process.
This paper aims to share the design even though the execution phase is not complete yet. The present study
consists of different chapters and is structured as follows: Chapter one will introduce the research scope, information of the research context, personal research motive, research relevance, research objectives and research questions. Chapter two will provide more in depth information on the literature review of the cultural and creative industries related to sustainable development and small island states. Subsequently, the third chapter will provide the theoretical framework, while chapter four will focus on the methodology employed in this research by explaining the research design, data collection and analysis process, and the ethical considerations. Lastly, in chapter five the expected results are provided as a conclusion.
The vision of encouraging a creative industry on Aruba cannot be carried out without a development impact of some sort. UNESCO has prescribed a relationship between the economic, cultural, social and environmental factors regarding the execution of creativity. For this reason, the question as to the potential impact of a creative industry on the Aruban economy and community emerged. Aruba’s sustainable development strategy is transitioning in all fields in even stages. The Aruban creative industry will not resemble other countries around the world. As a small island state, Aruba faces particular hurdles, such as the lack of resources for economic, social and cultural development, which implies the need for a sustainable and strategic vision for economic diversification.
Putting Culture and Creativity in the Heart of the Aruban Sustainable Development
A Constructed Analysis of the Possible Economic, Cultural and Social Impact of a Creative Industry
Thaïs G. Franken

UAUCU Student Research Exchange Collected Papers 2018
214
1.1 Research ContextOver the years, the Aruban government has taken initiatives to further develop its economic, cultural and social agenda. In the report “Opportunities Ahead” (2017), the previous Minister of Economic Affairs and Communication states that “Aruba has taken a long-term view to what a sustainable future entails, and has heeded the call of innovation and diversification to strengthen the competitiveness and resilience of our economy” (p. 7). Therefore, Aruba is envisioning new industry opportunities and investments to further participate in the sustainable development for the continuous well-being of its community. Currently, the Aruban economy is 70% dependent on the tourism sector according to this report making the island economically vulnerable. Because of this, four top sectors were identified in the report as an integrated and long term strategic vision for Aruba. These top sectors include Green Technology, Maritime & Logistics, Creative Industries & Knowledge Export. The realization and development of the third economic pillar, a knowledge-based economy, could be established by making Aruba a gateway between Latin America, the United States of America and the European Union for commerce, export, trade and international investments. However, to accomplish this to its full potential, concise research could benefit the development process of these four sectors, by adding to the completed stages.
Out of the top four sectors, this research will be solely focusing on the third top sector, which is the creative industry. The aforementioned report states that the Aruban creative industry sector is grounded in rich traditions that foster space for innovative businesses to solve issues within the community and to encourage further economic, cultural and social development. This sector has a critical role in the fulfillment of developing a knowledge-based economy on Aruba. With the evolvement of the creative industry, Aruba could expand its business partners and relationships in order to strengthen its vision for a knowledge-based economy on Aruba. This is important due to Aruba’s geographical
position and accessibility. As a small island state, Aruba, together with other islands has the unique opportunity of using its incapacities or lack of resources as motive to be economically resilient and to encourage more innovative strategies for further development of sustainable islands.
The idea of a creative industry sector is not only developing on Aruba, but globally. Many developed and developing countries have succeeded in diversifying their economies and creating more stability and sustainability. In 2004 UNESCO introduced the Creative Cities Network, which seeks to support and unleash the creative, cultural, social and economic potential of local communities around the world. All of this with the end goal of promoting cultural diversity. However, due to extensive gaps between cultural industries in the developed countries and developing countries, the challenge for Aruba lies in strengthening its local capacity, improving access to global markets through new partnerships, obtaining support from experts, and combatting piracy and defending intellectual property rights.
Since 2016, the Aruban government has been working on the Sustainable Developing Goals (SDGs) by reinforcing the presence of the 17 goals and 169 indicators formulated by the United Nations (UN) within the country’s vision. This implies different policy enhancements on all sectors, especially a young sector such as the creative industry. However, the local cultural resources and the possible impact of this new economic pillar on Aruba is not evident and should be investigated, before any CCI policy can be determined and encouraged. The United Nations through the work of different departments such as the United Nations Educational Scientific and Cultural Organization (UNESCO), the Economic Commission for Latin America and the Caribbean (ECLAC), the United Nations Development Program (UNDP) and the Culture for Development Indicators (CDIS) have created numerous benchmarks, indicators and frameworks to measure cultural and creative development on various scales. This

UAUCU Student Research Exchange Collected Papers 2018
215
research will specifically focus on the impact of creative industries in Aruba’s economic, cultural and social sectors. The government has expressed multiple times that the well-being of the Aruban community is central in the vision of making Aruba prosperous in all areas of development. In the same way, UNESCO (2014) states that “the success of development strategies in improving human well-being depends on recognizing the cultural context within which development occurs” (p. 9). In other words, since culture is intrinsic to society and exceeds all aspects of a person’s life, it establishes the environment in which development happens. Furthermore, culture creates the conditions which facilitate economic and social progress, and therefore, becomes an enabler of development. The impact of culture in development, whether it be economic, social, technological or environmental, has direct influence in a community’s economic growth and social improvement. For Aruba, this is also the case, seeing that culture has fostered all types of development in the past and in the present. Moreover, UNESCO explains that the cultural and creative industries accumulate economic benefits while, at the same time providing a pathway for cultural fulfillment, both at the national and local level. In this and many other ways, culture can be interpreted not just as an enabler but also as a driver of development processes.
1.2 Personal Research MotiveDuring the months anticipating the start of my thesis journey, I began to search internally for topics that interest me, topics that I am passionate about and topics that are currently relevant in the Aruban development. In 2017 I did my internship at the Department of Economic Affairs, Commerce and Industry. During my internship, I had a research assignment on SDG 11.4, which entails the protection and safeguard of the cultural and natural heritage of a country. I conducted a research on the total expenditure rate of the government in the cultural sector. During this internship, I became more aware of the possibilities for Aruba to develop a cultural and creative industry as an
economic initiative. Seemingly, I decided to combine my passion, my interest, my experience and general research necessity. Personally, I am convinced that with innovative strategies, Aruba can continue developing sustainably.
1.3 Research RelevanceAruba has been working on sustainable development of its economy and community for some years now. Many advancements have been made in projects related to green energy, infrastructure and ecological initiatives. However, culture and creative industries (CCI) is still an underdeveloped sector in Aruba. From the point of view of research, there is a great need for academic support in this field with data and knowledge. Culture and creativity have great influence in sustainable urban development with significant impact on the enhancement of a country’s quality of life, diversification of its economy and contribution to aspects like social inclusion and cultural diversity.
Aruba, as small as it is, counts more than 92 different nationalities in a united community according to a report of the Central Bureau of Statistics of Aruba (2017). “As mentioned before in 2010, the foreign-born population consisted of persons born in 133 different countries. Besides the country of birth, the nationality also determines the diversity of Aruba’s population. In 2010, there were persons with 92 different nationalities living on Aruba” (p. 7). For many years Aruba, has embraced migration of people of with other customs and traditions, while taking pride in its own cultural journey. Culture is more than just tradition, it touches the identity of a country, a community and an individual. Its interpretation varies according to the context and reality of the ones living it. Furthermore, Aruba has adopted an interdependent behavior from being economically bound to not only other countries in the region, but to specific economic pillars. Aruba’s economy depends enormously on imports, as nearly all products consumed on the island are sourced abroad. The report “Aruba Business Environment. Economic Reality and

UAUCU Student Research Exchange Collected Papers 2018
216
Potential” from the Kamer van Koophandel en Nijverheid Aruba (2015), states that “Aruba’s economy depends enormously on imports, as nearly all products consumed on the island are sourced abroad. Considering the economy’s already high dependence on tourism, these developments only serve to further increase Aruba’s vulnerability to external shocks. Tourism as such is developing positively and is currently estimated to contribute 88% to our GDP” (p. 3-4). This has created a habit of embracing the unknown and rejecting what is truly Aruban. However, this is slowly changing, seeing that creativity and cultural talent is becoming more prominent and accepted in the Aruban society. The opportunity for a creative industry on Aruba is new and should not be neglected, but instead be encouraged and pursued.
The Aruban government has included the creative industry as a possible sector within the vision of diversifying the Aruban economy through developing a knowledge-based economy. This alone creates an opportunity for research as well as academic analysis of current policies that are in place and polices that should be introduced for further sustainable development of Aruba. This research is important, because it will contribute with in depth insight and academic data of the possible economic, cultural and social impact of a creative industry on Aruba.
1.4 Research ObjectivesAs mentioned above, the creative industry is a relatively new concept within the Aruban society. This means that this sector is still in its early developing stages and provides an excellent opportunity for analysis, formation, implementation and evaluation. The objectives of the present research aim at identifying the economic, cultural and social impact of a creative industry on Aruba. Such research objectives in this case are to; 1. Investigate the potential impact of CCI as a new
economic pillar for Aruba. 2. Explore new innovative economic possibilities for
Aruba within the creative industry. 3. Make a connection between the CCI of Aruba and
sustainable development on economic, cultural and social sectors.
4. Contribute to the sustainable development of Aruba with the use of the Sustainable Development Goals Framework of the UN and academic research.
1.5 Research QuestionsIn order to meet the aforementioned objectives, a main research question has been formulated. This research hopes to have an answer to this question in order to bring light to all the doubts surrounding the vision of stimulating a creative industry on Aruba. The main research question of this research is: How can Culture & Creative Industries (CCI) play a role as a potentially new economic pillar for the sustainable development of the local economy and community of Aruba? With the purpose of answering the main question as precisely as possible, four sub questions have been formulated. These sub questions, which aim to investigate possible cultural resources, as well as the economic impact, cultural impact and social impact on Aruba are:1. What are the cultural and creative elements that construct the Aruban CCI? 2. What is the possible impact of CCI on development on Aruba? a. How can CCI impact the economic development of Aruba? b. How can CCI impact the cultural development of Aruba? c. How can CCI impact the social development of Aruba?3. How does the actual governance system foster cultural and creative industries (CCI) to support creativity and innovation in the Aruban community?4. What (additional) resources on Aruba can be identified as ‘starting points’ for a relevant and realistic CCI development implementation on Aruba?

UAUCU Student Research Exchange Collected Papers 2018
217
Ultimately, the goal of this research is to define concepts, identify factors and measure impact with existing indicators and frameworks. By using these, Aruba can benefit from what other countries and creative cities have done. The advantage of using these international frameworks for culture is the shared data and knowledge, which ties directly with Aruba’s vision of becoming a knowledge-based economy.
2. Cultural and Creative Industries in Motion
In the urban societies of the world, a new movement of creativity and innovation is emerging (United Nations, 2008). While, affecting economic, cultural and societal aspects of sustainable development, these new concepts are creating space for dialogue between communities, the government and the cultural and creative sectors. This new movement is recognizing the importance of culture, technology, knowledge and innovation as drivers to encourage economic growth, advocating cultural identity and heritage preservation. In this research, the concept of creativity on its own relates to the formulation of new ideas and to the application of these ideas to produce original works of art and cultural products, functional creations, scientific inventions and technological innovations (United Nations, 2008). With this being said, it can be deducted that creativity has an economic, cultural and social inclination.
Creativity is flexible, both tangible and intangible, and can be found in all scenarios. Creativity does not limit itself to geographical esthetics, religion, gender, sex, or language. It can be encountered amongst the wealthiest and poorest in the world. The only facet that separates creativity from the norm is originality, the cultural imagination that lives within all societies of the world. Seeing that all societies have their own set of creativity, it indicates that per country, culture is also unique. Each society lives out a cultural reality whereas people decide
for themselves what their culture and their heritage looks like.
The use of the term Cultural and Creative Industry (CCI) varies per country and context. Culture and Identity is perceived from many angles, thus, the CCI has the same effect. Several different models exist around the world. As for Aruba, the government has defined the Aruban Cultural and Creative Industry influenced by the initiatives of creating a CCI for the island. In other words, this definition can still evolve and be expanded. Figure 1 illustrates a broad context is illustrated, showcasing the CCI definition from the perspectives of different countries, including Aruba. In this scenario, the central definition of UNESCO is used as the bases of the CCI definition benchmark. The Creative Economy Report of UNESCO (2008) makes it clear that ultimately, “there is no ‘right’ or ‘wrong’ model of the creative industries, simply different ways of interpreting the structural characteristics of creative production. The attractiveness of the various models may therefore be different, depending on the analytical purpose” (p. 12).
Even though, the CCIs differ per region, per continent and per country, the increase of creative development has been experiencing many advancements. According to United Nations (2013), “greater proportions of the world’s intellectual and creative resources are now being invested in the culture-based industries. Human creativity and innovation, at both the individual and group level, are the key drivers of these industries, and have become the true wealth of nations in the 21st century” (p. 15). Along the same lines, many governments like Aruba, local communities and industries are increasingly seeking to work in partnership to use creativity more effectively as part of their growth agendas. All of this in an effort to better recognize and develop these industries and the skills of their practitioners, to invest in them more often and to make an impact on all angles of sustainable development.

UAUCU Student Research Exchange Collected Papers 2018
218
Figure 1 Different Cultural & Creative Industry Definitions

UAUCU Student Research Exchange Collected Papers 2018
219
2.1 Culture and Sustainable DevelopmentCulture in its many dimensions is creating new dialogue within communities, on its presence, importance, necessity and development. Upon analysis of the streets of the cultural city of Aruba, San Nicolas, the very public expression of its community states “we culture”. People feel very connected to their culture, because it is part of their past, present and future. It is evident that culture is significant to human development. Culture is the tool for the dynamic construction of individual and collective identities all over the world. The active participation of people in local cultural activities (such as poetry, dance, sculpture, theatre, music, etc.) improves their quality of life and well-being and enhances opportunities and options of any community (Duxbury, Hosaghahar, & Pascual, 2016).
The relationship between culture and sustainable development is relatively new. Considering all international advancements achieved in the cultural sectors, the 2030 Agenda for sustainable development acknowledged the integral role of culture across many of the SDGs and the importance of having culture within the structure of the SDGs. Seemingly, culture is now directly addressed in Goal 11, which aims to “make cities and human settlements inclusive, safe, resilient and sustainable” (UNESCO, 2016). There is a critical view, a three-dimensional model by Duxbury et al. regarding the relationship between culture and sustainable development. This model explains the three possible roles of culture in sustainable development, indicating, that there is not one way to include culture in all aspects of development and policy making.
In the first role proposed in the model, culture is added as a separated pillar, equal to other pillars in the community, economy and social development. In this situation, culture plays a major role in a society and is considered an asset. In the second role, culture is mediating between the pillars. The difference between these two roles is their cultural approach and context. When culture is in sustainable development,
it is limited and cannot be used in other fields and sectors of development. However, when culture is for sustainable development, it has the flexibility to influence and intervene in all areas of development. The last role proposed in the model, culture as sustainable development, culture has the role of being the foundation of development. The constant influence of culture is without doubt consistent and fosters a broad outlook.
2.2 The CCIs within Small Island Developing StatesAruba, like many other countries in the Caribbean region, falls under a group of small island developing states (SIDS). According to the Office of the High Representative for the Least Developed Countries, Landlocked Developing Countries and Small Island Developing States; “small Island Developing States are a distinct group of developing countries facing specific social, economic and environmental vulnerabilities. SIDS were recognized as a special case both for their environment and development at the United Nations Conference on Environment and Development (UNCED) (United Nations, 2011). In the case of Aruba, the island is not an independent member state, but an associate member under the Dutch Kingdom. Many of these islands have many things in common, such as multilingual societies, economic migration, multicultural communities and colonial histories. All these influence the cultural development and cultural identities of these islands. Thus, when talking about culture and its role in communities and governments, it is critical to understand the gaps that exist between developed and developing countries.
In the article “Culture in Small Island States” Ikhef (2014) argues that SIDS “have a broad geographical range that generates extremely diverse cultural conditions between regions and their peoples, indigenous or descendants from various ethnic groups. The popular view of small islands as remote and culturally isolated has always carried a certain paradox. Their history reflects the economic, social and

UAUCU Student Research Exchange Collected Papers 2018
220
cultural rich exchanges and what they have given to the rest of the world” (p. 18). Many developments, some faster than others, are currently taking place and these have effects on the human, cultural and environmental angles of a community. With the sustainable development movement, many SIDS are working hard towards sustainable energy and infrastructures, forgetting all these implications that are at stake. Additionally, for SIDS it would be almost impossible to overcome their weaknesses, without incorporating culture in their sustainable development plans. Ikhlef argues that “SIDS cultural assets must be protected, valued and powered so that they can strengthen and find ways to flourish in a globalized and changing world” (p. 18). In the end, culture plays a critical and unique role in the life of the SIDS communities, and can add value to, and encourage advancements of their sustainable development agendas.
2.3 Development Impact of CCIsIn all regards, the CCI is no different to other sectors in the economy. Development occurs in all stages and by all industries. In the CCI, the development impact is categorized in economic, cultural, social and environmental impact. In short, according to van der Borg and Russo (2015), “culture can be considered a driver for a new stage of development of cities based on quality of life, conviviality, creativity as elements of distinction of cities, at the same time guaranteeing balance to such development. Hence the importance for cities to invest in culture: heritage management and preservation, art production, events and infrastructure, jobs and creative education” (p. 22). In this research context, the primordial essence will be on economic, cultural and social developmental impacts.
2.3.1 The Economic Impact of CCIsIn many respects, the relationship between culture and the economy is an ongoing dialogue in the academic world. The CCI sector is the result of incorporation of these two different worlds interconnected with each other. The United Nations declared that this way of seeing is
important because it also encompasses the broader ways of life- understanding of culture by revealing how identities and life-worlds are intertwined with the production, distribution and consumption of goods and services. Next to this, it recognizes that what is referred to as the “economy” is bound up with processes of social and cultural relations.
In this sense, it reminds us that the economy itself is a part of culture. (United Nations, 2013) Culture has been a productive sector playing an increasingly critical role in national economies all over the world. Cultural activities and industries are becoming drivers for growth, enabling the diversification of national economies, generating income and creating employment in developed, developing and emerging countries (UNESCO, 2014).
Cultural industries also perfectly fit the requirements of the knowledge-based economy. Van der Borg and Russo (2005) explain that on one hand, they are highly transversal to many other urban functions. Their “value chain” is rich; through it, the creative knowledge typical of art and culture, its attitude to reflection, openness and innovation, trickle down to other information-intensive economic sectors. On the other hand, the cultural industries have important social connotations. Cultural jobs are irregular and flexible, so that cultural employment is an “anti-cyclical” factor in periods of industrial decline and transition, and a vehicle for social mobility in periods of revitalization and expansion. (p. 21)
The Latin American CCI economy generates US$124b in revenues (6% of CCI global market) and 1.9 million jobs (7% of total CCI jobs) (Ernst & Young, 2015). Furthermore, Duxbury, Hosaghahar and Pascual (2016) reiterate that creative activities contribute significantly to youth employment and careers in CCI are relatively open to people of all ages and backgrounds. In Europe, CCI sectors typically employed more people aged 15–29 years than any other sector. Creative industries also tend to favor the participation of women compared with more traditional

UAUCU Student Research Exchange Collected Papers 2018
221
industries. (p. 18) Alongside this, these three authors claim that in many countries, creative industries tend to favor the participation of women compared with more traditional industries. In many developing countries and transition economies, just like Aruba, women creators are more likely to be found in the folk-art sector. Lastly, the concentric circle model of the United Nations illustrates how the creative and cultural industries fit into the overall economy. According to UNESCO (2013) “this includes diverse elements, including aesthetic, social, spiritual, historical, symbolic, and authenticity values. The model makes a distinction between cultural and the creative industries, placing both within the economy as a whole”.
2.3.1.1 EmploymentThe focus of the economic impact is directly affected by the employment opportunities of a community. An outcome of primary importance is the boost to the local economy generated by the cultural industries, reflected in such indicators as the value of regional output, employment, business investment, skills development in the workforce and growth in diverse sectors. Additionally, outcomes relating to the distribution of the benefits of economic growth, such as progress towards poverty alleviation, might be of concern. Van der Borg and Russo state that culture may contribute to a more balanced and sustainable urban development. Culture is part and parcel of urban revitalization projects in degraded urban areas throughout the developed world. It provides a formidable opportunity for personal development and social interaction among weaker groups, and gives to “excluded” individuals a chance to their own start businesses or to catch up socially. (n.p)
Another factor of employment is also the encouragement of entrepreneurship amongst women and young people. The labor opportunities within the community expand and create greater demand for the government to introduce incentives to make these processes more flexible and profitable. Lastly, according to the European Commission (2009)
culture-based creativity is an essential feature of a post-industrial economy. A firm needs more than an efficient manufacturing process, cost-control and a good technological base to remain competitive. It also requires a strong brand, motivated staff and a management that respects creativity and understands its process. It also needs the development of products and services that meet citizens’ expectations or that create these expectations. Culture-based creativity can be very helpful in this respect. (p. 5)
2.3.2 The Cultural Impact of CCIsCulture on its own forms a great part of and has a lot of impact on the development of CCIs. “CCI make cities more livable, providing the hubs and many of the activities around which citizens develop friendships, build a local identity and fulfillment” (Duxbury, Hosaghahar, & Pascual, 2016, n.p). Societies and communities rely on culture, identity and a sense of belonging to relate to what is important in life to many: family, work, hobbies, language, art, music and more. As these authors explain “the world has a shared history and a rich, diverse cultural heritage. This heritage is cherished globally as an asset that belongs to us all, yet gives our societies their identity and binds them together, nurturing a rich cultural and creative present and future. That is why stakeholders of the creative and cultural world must do everything in their power to preserve this heritage and the diversity of actual cultural content, amid a political and economic climate that is subject to major upheavals” (n.p).
2.3.2.1 Heritage SustainabilityCultural heritage is the focal point of irreplaceable cultural, social, environmental and economic added value. Cultural heritage comprises the vestiges of society. Heritage sites are relics of ancient civilizations, over the years considered as cultural patrimony of humankind and the heritage of nations. In addition to their cultural and historic value, such unique endowments contribute to reinforcing our identities and broadening our education. Heritage sites are the main

UAUCU Student Research Exchange Collected Papers 2018
222
attractions in cultural tourism all over the world (United Nations, 2008). According to Josefsson and Aronsson (2016), from a phenomenological perspective, every human being as an individual subject has the power to select those phenomena which transit values in her own lifeworld, but at the same time she is hampered by the interrelated society. In this she must relate to other human beings and to an everyday reality of social, cultural and historical contexts, including conventions and entrenched patterns of behavior or so called typifications. If we apply this idea of cultural heritage we have, on one hand the subjective aspect and many subjective opinions that create either heritage with intersubjective meanings or dissonant heritage, and on the other, the objective aspect. (p. 2093)
For some countries, these sites are major sources of revenue, albeit usually not reported as cultural services of the creative economy. Heritage is also embedded in the traditional cultural expressions of human creativity, manifested in cultural celebrations, festivals and folklore. In different parts of the world, native peoples and communities are keeping alive, and sometimes reviving and rescuing, old traditions by reproducing ancient crafts, using their original designs (United Nations, 2008).
2.3.3 The Social Impact of CCIsWhile the role of culture in promoting community cohesion and well-being has been amply recognized, the converse is equally important: how the community context enables or constrains the creative economy. Trade rules and regulations may inadvertently disadvantage cultural enterprise, as may the social sphere. Hence, attention needs to be paid to policies that concern welfare, work conditions and pensions as well as to the commitment and leader- ship of civil society organizations that work across the for- and not-for-profit, the formal and informal, or the public and private sectors (United Nations, 2013). The relation between a community and its culture extends to concerns of safety and social harmony. In an age in which
societies tend to become multi-cultural, identities and ways of life confront one another. In the multi-cultural city, culture can be a lever that stimulates pride, personal development, and self-fulfillment for minorities, and at the same time it can be a common language, a bridge between different groups (Borg van der & Russo, 2005). Furthermore, the European Commission (2009) state that social cohesion can be defined as a set of shared norms and values for society which also encompasses the diversity of people’s different backgrounds and helps to ensure that those from different backgrounds have similar life opportunities. It is the ability of cultural activities to help express specific cultures, while also developing strong and positive relationships between people from different backgrounds in the workplace, in schools, and within neighborhoods” (p. 7).
2.3.3.1 Social CohesionCulture enables citizen participation, community empowerment, and social cohesion as it promotes grassroots processes that build recognition and connections within communities. Cultural programs can accelerate the rootedness of newcomers including new immigrants. Local cultural activities and expressions can provide knowledge, heighten awareness, and foster processes that also relate inhabitants to the past, the present, and the future of a city (Duxbury, Hosaghahar, & Pascual, 2016). According to United Nations (2013),While the role of culture in promoting community cohesion and well-being has been amply recognized, the converse is equally important: how the community context enables or constrains the creative economy. Trade rules and regulations may inadvertently disadvantage cultural enterprise. The social sphere may as well. Hence, attention needs to be paid to policies that concern welfare, work conditions and pensions as well as to the commitment and leadership of civil society organizations that work across the for and not for-profit, the formal and informal, or the public sector (p. 118)

UAUCU Student Research Exchange Collected Papers 2018
223
Social cohesion is simply one aspect of the entire social agenda of a country. In the same way, UNESCO (2013) states that “cultural values, aptitudes and norms which encourage tolerance of diversity, openness and respect for all contribute to avoid tension and to promote social harmony and cohesion, especially in polytechnic and multicultural countries” (p.88). For Aruba, this is critical due to its multi-dimensional complexity of nationalities and migration. This will not decrease, rather an increase will develop over the years. At this point, the focus should be on creating respect for diversity and desire for cohesion of all without discrimination of sex, race, religious convictions, sexual preferences of ethnic backgrounds.
3. Theoretical Framework
Internationally, culture and creative industries as a concept are still in development. There are different frameworks and theories available to measure and evaluate the different impacts of CCIs at both local and global levels. This research will look at the most prominent and relevant for the Aruban context. In this chapter, CCIs will be explained through the perspectives of the Sustainable Development Goals (SDGs) framework, the Culture for Development Indicators (CDIS) framework, and together they will formulate the theoretical framework for the present research.
The SDG framework is the new global initiative where all UN member states agree to work on 17 global goals and 169 indicators to ensure sustainable development for all. This framework is set to be executed from 2015 to 2030 and is meant to be used as a guideline for countries when making policies and legislative agreements. These goals have both a political and an instrumental value, while becoming benchmarks for accountability among nations. Furthermore, they enable cross-country dialogue and encourage policy coherence on crucial matters that need attention of all nations. However, not all countries interpret these goals in the same way and for Aruba this is also the
case. The paper “Towards integration at last? The sustainable development goals as a network of targets”, (Le Blanc, 2015) brings clarity to the issue by stating that “different countries have different priorities, and they are likely to put different emphasis on the various goals and targets depending on their national circumstances” (p. 15).
Aruba has been working on these SDG frameworks since 2016. Mr. Mike Eman, then Prime Minister of Aruba, states in the “Aruba Island of Sustainable Solutions” report (2015), “Aruba places an emphasis on creating a balance between quality of life and sustained economic growth” (p. 2). Seemingly, these 17 goals cover various problem areas, ranging from education, gender equality, poverty, climate change and justice within communities. In the case of cultural and creative industries it has a direct link to the following SDG goals:1. SDG 8 “Promote sustained, inclusive and sustainable
economic growth, full and productive employment and decent work for all”
2. SDG 11 “Make cities and human settlements inclusive, safe, resilient and sustainable”.
These two goals represent the CCI concept in two sections. The SDG 8 targets the creative and innovative aspect of the CCIs, and SDG 11 targets the cultural aspect of the CCIs. Together they represent the CCI in the SDG framework. Within the economic growth SDG goal, the focus will be on target 8.3, which is to promote development-oriented policies that support productive activities, decent job creation, entrepreneurship, creativity and innovation, and encourage the formalization and growth of micro-, small- and medium sized enterprises, including access to financial services. The indicators for this will be the three economic, cultural and social dimensions, which will narrow the search for the possible impact of CCIs. Next to this, within the inclusive cities SDG goal, the focus will be on target 11.4, which is to strengthen the efforts of protecting and safeguarding the world’s cultural and natural heritage. In this case, the indicators will also be on the economic, cultural and social dimensions.

UAUCU Student Research Exchange Collected Papers 2018
224
For the creative resources, as Figure 2 shows, the first indicator will be the cultural resources of the Aruban cultural and creative industries. The cultural resources indicator is also further categorized in five sections; creative workforce, creative businesses, cultural institutions, heritage sites and intangible cultural heritage. Next to this, there is the employment indicator that supports the economic impact analysis. Employment is chosen based on its direct impact on the Aruban economy. The third indicator is heritage sustainability and will support the cultural impact analysis. Lastly, there is the social cohesion indicator, which will support the social impact analysis. Together, they form the theoretical framework for the present research.
Based on the sub-questions, the following theoretical framework has been made to illustrate the research matrix. The foundation of this framework is the vision of creating a new economic pillar for Aruba, which is called a knowledge-based economy. This vision holds four top sectors encouraging economic diversification. The present research will go deeper into one of the four sectors, which is the creative industries. The goal is to investigate the current cultural resources available on the island, and the possible economic, cultural and social impact on development. Currently these categories are too broad and need to be narrowed down to specific indicators.
Figure 2 Research Theoretical Framework

UAUCU Student Research Exchange Collected Papers 2018
225
4. Methodology
The methodology of this research is essentially concerned with the overall strategy of data collection to ensure the reliability, replicability and validity of the study. This research paper will be conducted conforming the qualitative research structure with supportive statistical indicators. In the first place, this section will discuss the research design chosen as a guideline and firm bases, seeing that in the introduction, it was mentioned that there is a clear difference between research method and research design. Then, the data collection and data analysis strategy will be introduced. These two sections present interrelated concepts that are critical for understanding throughout the research. Additionally, ethical considerations are stated as relevant to the research process. Contributors and participants of this research play a great role in this study, thus the inclusion of ethical considerations is essential.
4.1 Research DesignAs previously mentioned, the qualitative research style is the focal point and bases of the research design. The general aim of a qualitative research is to explore a phenomenon. In the present research, the phenomenon to be studied will be the possible economic, cultural and social impact of a creative industry alongside the vision of diversifying the Aruban economic pillar. The analytical objectives of a study like this are to describe a relationship, individual experiences and to, finally, explain a group norm. Most qualitative research designs are repetitive, which means that flexibility in design is not un common. However, a clear understanding of a research design is, in this case, relevant.
According to Bryman (2012) a research design “provides a framework for the collection and analysis of data. A choice of research design reflects decisions about the priority being given to a range of dimensions of the research process” (p. 46). Having said this, the chosen research design is a phenomenological approach, which is primarily concerned
with the study of perspective. Consequently, Lester (1999) explains that the purpose of the phenomenological approach is to illuminate the specific, to identify phenomena through how they are perceived by the actors in a situation. In the human sphere this normally translates into gathering ‘deep’ information and perceptions through inductive, qualitative methods such as interviews, discussions and participant observation, and representing it from the perspective of the research participants” (p. 1).
The phenomenological approach overlaps many other qualitative studies, but purely seeks to describe a situation or impact on a society. Overall, Lester continuous to explain that “phenomenological methods are particularly effective at bringing to the fore the experiences and perceptions of individuals from their own perspectives, and therefore at challenging structural or normative assumptions. Adding an interpretive dimension to phenomenological research, enabling it to be used as the basis for practical theory, allows it to inform, support or challenge policy and action” (p.1).
Alongside the phenomenological approach as the corner stone of the present research, the case study research design will be the main research design. The case study design entails a detailed and intensive analysis of a single case. In this research that will be one single sector, which is the Aruban cultural and creative sector. These two approaches could work well together in this research, seeing their objectives and strategies. In the end, Lester (1999) confirms that “phenomenological and associated approaches can be applied to single cases or to serendipitous or deliberately selected samples” (p. 1), indicating that these two approaches could complement each other for in depth research results.
4.2 Data CollectionIn the beginning of the research process, desktop research was conducted to gather relevant data in the field. This conduced to proper understanding of the research variables. A desktop research is conducted to create a

UAUCU Student Research Exchange Collected Papers 2018
226
solid framework and add to the academic aspects of the research. Many research reports, papers, articles, books are collected to form a concise perspective on creative industries. Next to this, secondary data will be gathered through qualitative interviews. Qualitative interviews are structured to maximize the reliability and validity of the research variables. The interest is mostly on gathering data from interviewee’s perspective and experience. This requires somewhat of flexibility and adaptability from the researcher. The interview method to be employed be semi-structured with the use of a Strengths, Weaknesses, Opportunities and Treats (SWOT) matrix method. The research instrument will consist of an interview booklet. Within this booklet the participant is informed of the research objectives and it contains all the SWOT matrix overviews of the development variables mentioned in the theoretical framework. There will be a specific topic list in this booklet as a driver for conversation, allowing the flexibility and space for the interviewee to develop their personal input.
4.2.2 ParticipantsThe scope of participant for this research is very diverse and will include the following stakeholders: government departments, non-profit organizations, creative workers, and creative and cultural scholars. Based on the theoretical framework of this research, the data gathering will be separated in two categories. The first section will focus on the creative resources. To gather data for this category, the researcher will approach different private organizations and government departments that could provide statistical information. This category is not aimed at personal data, but it is designed to generate statistical information as a foundation for the data gathered in the second category and to sustain the discussion of the research. Also, a number of 13 participant organizations will be approached for the interview sessions. Lastly, a number of 6 participant organizations will be approached for the gathering of statistical data.
4.3 Data AnalysisWith the completed interviews of the participants, the crucial stage emerges. The data analysis will determine the outcome of the research. This research will be analyzed through thematic analysis based on the variables presented in the theoretical framework and the SWOT quadrant. Additionally, Bryman (2017) also states that coding in qualitative data analysis tends to be in a constant state of potential revision and fluidity. The data are treated as potential indicators of concepts. Open coding is the process of breaking down, examining, comparing, conceptualizing and categorizing data’ this process of coding yields concepts, which are later to be grouped and turned into categories (p. 568).
As part of the coding process, this research will make use of a confrontation matrix to organize the inputs received from the SWOT analysis and the topic list used during the interviews. From this confrontation matrix, the results are formed and presented. Moreover, to process and foster the data analysis of the qualitative section, the thematic analysis will be done manually instead of using coding program. From the outcome of the interviews, conclusions and recommendations will be made to finally answer the main research question and sub research questions.
4.4 Ethical ConsiderationsAll research processes should pay attention to ethical guidelines and this is no exception. All participants will be approached with a formal letter asking for their participation in the research, along with a research information flyer. The research objectives will be explained to them and they will be formally asked whether they agree to set up an interview appointment. On the interview date, the participant will be asked to sign a consent sheet. This sheet will explain the reasoning behind the research and will give the participant the option to give the researcher consent to use the interview as data. All interviews will be recorded and this is will also be mentioned in the consent form. All consent forms should be signed by the interviewer

UAUCU Student Research Exchange Collected Papers 2018
227
and the interviewee accordingly. Thus, it is important to assure confidentiality and be sensitive with the information the interviewee shares. All these procedures are in place to ensure that everything is done without prejudice and bias. 5. Expected Results
The CCI is a relative new concept for Aruba and the entire Caribbean region. It is solely an opportunity for Aruba to diversify its economy and encourage creativity in its communities and give people back what is theirs: their identity and culture. Based on the research questions it is expected that the CCI will have great impact on the cultural, economic and social areas. The development of a CCI on Aruba will require a revision of economic policies, labor laws and regulations and possible intellectual property right laws. Furthermore, the CCI could help Aruba balance the disadvantages of having a multicultural community and help sustain the positive advancements thereof. Also, when it comes to the social development, the CCI could help develop understanding, awareness, cultural identity, unity and less intolerance. A community is intolerant when it is not familiar with the unknown. Socially, Aruba could benefit from exercising a more open-minded approach to different levels of culture and appreciation thereof. Overall, this should not seem as a hurdle, but Aruba can make use of international and regional policies to help build a framework for CCI. The government will have an important role in this entire process together with the creative sector, to ensure that this development is done sustainably and effectively, not leaving anyone behind.
References
• Aruba Tourism Authority. (2017). Cu Mira pa Futuro. Oranjestad.
• Banks, M. (2000). Craft Labour and Creative Industries. The Open University, Department of Sociology.\
• Bryman, A. (2012). Social Research Method. Oxford University Press, 4th Edition.
• Dutch Ministry of Economic Affairs. (2009). Our Creative Potential Paper on Culture and Economy.
• Duxbury, N., Hosaghahar, J., & Pascual, J. (2016). Why must culture be at the heart of sustainable urban development? United Cities and Local Governments.
• Central Bureau of Statistics of Aruba (2017) Quarterly Statistical Bulletin.
• Ernst & Young. (2015). Cultural Times: the first global map of cultural and creative industries.
• European Commission. (2015). Composite indicator on cultural and creative cities: monitoring cultural & creative sectors in European cities.
• European Commission. (2017). The Cultural and Creative Cities Monitor.
• European Union. (2012). European Agenda for Culture Work Plan.
• Ikhlef, K. (2014). Culture in Small Island Developing States. Small Islands and Indigenous Knowledge Section.
• Kamer van Koophandel en Nijverheid (2015) Aruba Business Environment. Economic Reality and
• Potential. Oranjestad.• Le Blanc, D. (2015). Towards integration at last? The
sustainable development goals as a network of targets. Department of Economic & Social Affairs.
• Ministry of Economic Affairs, Social Affairs and Culture. (2011). The Green Gateway: A knowledge-driven, Entrepreneurial Economy .
• Minister of Economic Affairs and Communication (2017) Opportunities Ahead. Oranjestad.
•• Paolo Russo, A., & van der Borg , J. (2005). The Impacts
of Culture on the Economic Development of • Price Waterhouse Coopers. (2005). Cities of the future
global competition, local leadership. Price Waterhouse Coopers.
• Smith, K. (2002). What is ‘Knowledge Economy’? Knowledge Intensity and Distributed Knowledge Bases. Institute for New Techonologies.

UAUCU Student Research Exchange Collected Papers 2018
228
• Smith, R. (2015). The Caribbean and the post-2015 development agenda. Social Development Unit of the Economic Commission for Latin America and the Caribbean.
• The Ministry of Economic Affairs. (2009). Creative Value. The Ministry of Economic Affairs, The Ministry of Education, Culture and Science.
• UNESCO. (2012). Measuring the Economic Contribution of Cultural Industries. A Review and Assessment of Current Methodological Approaches. UNESCO Institute of Statistics .
• United Nations. (2008). Creative Economy Report. UNCTD, UNDP.
• United Nations. (2013). Creative Economy Report. United Nations Development Programm.
• United Nations Industrial Development Organization. (2013). Creative Industries for Youth Unleashing Potential and Growth. Vienna.
• World Economic Forum. (2016). Factors for Enabling the Creative Economy. World Economic Forum, Geneva.

UAUCU Student Research Exchange Collected Papers 2018
229
My Experience in the UAUCU program
I joined the program as a way to step out of my comfort zone. I remember the day when the UAUCU collaboration program was introduced to our class. At that moment I was not interested in participating, but later on I was convinced by one of my classmates to join the program together with her. Initially I was a bit hesitant, as social interaction seems to be a crucial part of the program and I am quite shy. But I decided to give it a try, because I wanted to add a little zest to my life and there is no room for adventures or excitement in my comfort zone. When I joined the program I did not have any idea of what I wanted to do, but week by week into the program the topic became more clear. I chose the research topic of strategies implemented by SME’s during and after the redevelopment of Main Street, as I remember it was a very controversial topic and I wanted to shed some light on this matter from the perspective of the shopkeepers.
One of the aspects of the program that I enjoyed most was the introduction week, it was very nice to meet the students from UCU. They are very amiable, very social and highly interested to know more about Aruba. During the introduction week I also learned about my own island and social problems that I was not even aware of, this has changed my perception about how important it is to take care of our environment. The experience that impacted me the most was the field trip regarding the ecosystems and the human footprint, in which we went on a boat trip along the landfill of Parkietenbos. It was tragic to see the impact this landfill causes to our environment and more lamentable to learn that there still are no adequate ecological regulations regarding waste management in Aruba.
I have to admit that there were times in which I wanted to quiet as I felt that I was not putting my best work out there and I felt that the data I gathered was not as insightful as I intended it to be. But at the end of it all I still managed to finish the report and I can certainly say that I feel satisfied with the end results.
Dirijini Piter, University of Aruba

UAUCU Student Research Exchange Collected Papers 2018
230
Introduction
For several decades, the Main Street in Oranjestad was a focal point for shopkeepers and retailers in Aruba. In the past two decades, several shopping malls were opened in the hotel area, which impacted the local businesses in the Main Street of Oranjestad by drawing away shoppers, both locals and tourists, to the new shopping malls. As a consequence, many shopkeepers moved to the shopping malls, and some less successful shopkeepers went bankrupt and had to close their shops. Main Street became a desolated area, but some shopkeepers managed to survive the crisis.
To curb this trend, the initiative was taken by the Government of Aruba to redevelop Main Street and make it prosperous again. Tourists and locals would be drawn to the street by the redesign of walkways and shaded areas, the introduction of the tram, the placement of fountains and other beautification aspects of the street, and finally the introduction of services like free Wi-Fi. This redevelopment unfortunately took much longer than expected. The project was intended to conclude in 18 months, but it took 5 years to be completed. This delay created even more trouble for the shopkeepers. Despite the government’s efforts, the renovation had little impact in attracting customers to the local businesses. According to shopkeepers in Downtown, the implementation of the new parking action plan had an unfavorable impact on the
number of consumers visiting Main Street (KvK, 2016). Another possible factor affecting foot traffic to businesses is the increase in e-commerce.
The goal of this research project is to gain insight into the way in which business owners have experienced the challenges that they faced over the last five years and to gain insight into the strategies the shopkeepers used and that played a role in why some businesses have been more successful than others in adapting to the challenges. This can help gain insight in critical successful characteristics of SME in Aruba. Research ProblemThis study will address the following central research question:
What strategies did Small and Medium sized Enterprises (SMEs) in the Main Street of Aruba use to overcome the challenges during and after the redevelopment of the Main Street? To answer this problem statement, several sub-questions were formulated to provide an answer to the main research question. The sub-questions are the following: 1. What was the redevelopment of the Main Street?2. What challenges did the SMEs located in downtown
A look into the strategies utilized by SMEs on Main Street during the Oranjestad
redevelopment programDirijini Piter

UAUCU Student Research Exchange Collected Papers 2018
231
experience during and after the renovation?3. What strategies did SMEs located in downtown use to
overcome these challenges?
Theoretical framework
Strategic ModelA strategic model allows an organization to make plans and decisions in conformance to its mission and values. Companies use strategic models to enhance their operations and meet their goals. There are five strategic models that can be identified in an organization: growth, innovation, core competencies, value discipline model and competition (Vries, 2014).
Growth StrategyThe Ansoff Matrix is a well-known strategic planning tool used by firms to identify and analyze possible growth opportunities based on current as well as new markets and products. This product-market matrix designed by Igor Ansoff suggests that a firm should focus on one of four growth strategies: Market penetration (business focuses on selling existing goods to existing markets), Market development (business seeks to sell current products to new markets), Product development (business aims to introduce new products into existing markets) and Diversification (business markets new products to new markets) (Ansoff, 1957).
InnovationThe Blue Ocean Strategy is a new strategy created in 2005 by W. Chan Kim and Renée Mauborgne. In their book, the authors argue that almost every player in the market is becoming identical, as they all offer high quality products at low prices causing the so-called “red ocean” effect. The blue ocean strategy is about growing demand and breaking away from the competition. The strategy has four important dimensions, which include: Increasing (adding resources that increase product quality), Eliminating (cutting unnecessary resources), Reduction (cutting unnecessary work processes
to reduce overall cost) and Creativity (creating new jobs and a better work environment for employees) (Kim, 2005).
Core competencesHamel & Prahalad created this strategy in 1990. According to them, a core competency means “something” unique or excelling at a particular trait. According to Hamel & Prahalad, there are three aspects that a core competency must fulfill in order to be successful: first it has to be valuable and create an advantage for its customers, second it has to be difficult to imitate, and last it must be rare and have potential to profit from it (Muilwijk, n.d.).
Values Discipline model The value discipline model from Treacy & Wiersema is a strategy used by businesses as an attempt to create added value and distinguish themselves by having distinctive traits relative to their competitors. The strategy focuses on three terms: operational excellence (the focus lies on excelling in operational efficiency), product leadership (the product quality is the main focus) and customer intimacy (relationship with customers occupies a central point) (Treacy, 1995). Competitive strategyA competitive strategy is a long-term action plan created to help companies gain a competitive advantage over its competitors, either by means of lower prices or by providing greater benefits and services to its customers. In 1985 Michael E. Porter introduced two types of competitive advantages: Cost leadership and Differentiation.
A firm pursuing a cost leadership strategy attempts to establish a competitive advantage by increasing profits through cost reduction or by increasing market share through lower prices. A business that chooses differentiation as their strategy focuses on making their products more unique and attractive to clients. This can be achieved by delivering high-quality products or services, using effective sales and marketing techniques, providing a more personalized
UAUCU Student Research Exchange Collected Papers 2018
232
customer experience, and by making services and products more convenient (Porter, 1985).
According to Porter (1985), in order for a business to be successful it must achieve one of the generic competitive strategies. Porter argues that companies or business units that do not qualify into one of the generic competitive strategies are more likely to underperform (Porter, 1985).
Methodology
Desk research was conducted to collect information about the redevelopment using articles in local newspapers of Aruba, a YouTube video explaining the process of the redevelopment of Main Street, and an article written in the magazine Transcend. In addition to this, information was gathered online about the streetcars brought to Aruba, a publication by Free Zone of Aruba named “Opportunities Ahead 2017” which contained information about the developments made until 2017, and a publication named “Urban Design Visions for Aruba: Oranjestad”, which outlined the planning for the urban renewal of Oranjestad. The theoretical framework was obtained through a literature review of Porter’s 1985 publication on competitive strategy.
Determining the challenges faced and strategies used by Main Street SMEsTo gain insight into the challenges that businesses located on Main Street faced during and after the renovations, interviews were conducted with ten shopkeepers located on Main Street. Storeowners were interviewed whenever possible; in other instances, it was the manager or supervisor who was interviewed. There were three criteria that a business had to meet to qualify for this research. Firstly, the businesses must be small or medium sized enterprises. SMEs are defined by the number of employees, size of capital and sales, which are determined relative to the size of other organizational structures in the economy. To identify SMEs in Main Street the number of employees was used as criteria.
Using as context the criteria of small island developing states, an enterprise is considered small or medium sized when the number of employees is below fifty (Taylor, n.d.). Secondly, the businesses must have been operational during the redevelopment process. And lastly, the businesses must have been successful in surviving the ordeal. A semi structured approach was used to conduct the interviews in order to allow the shopkeepers some freedom to voice their opinions while still covering the points this paper is trying to address. The respondents were informed verbally that all information would be kept anonymous. The interviews had a length of ten to fifteen minutes each.
Seven questions were asked. The first one was what challenges the businesses faced during the redevelopment. Next, they were asked how these challenges impacted their businesses. The third question was about the strategies that were employed to meet these challenges. Further, they were asked about whether they noticed a change in the flow and demographic of pedestrians. The next question referred to how dependent they were on a particular customer base. Afterwards, they were questioned about what impact the new parking plan had on their business, and lastly their opinions on how Main Street can be revitalized.
For this research, a thematic analysis was conducted with the interviews. This method involves identifying patterns in the data that are important or interesting, and using these to address the research or say something about the issue.
The redevelopment of the Main Street
The blueprint for the reimagining of the downtown area is detailed in the Urban Design Vision Plan. An ambitious plan was developed with a budget that was estimated to be around 28 million dollars. The plan was a collaboration between an urban design studio at the University of Pennsylvania School of Design, the Government of Aruba, and the American Planning Association. According to the publication, five

UAUCU Student Research Exchange Collected Papers 2018
233
major issues and constraints regarding downtown were identified, these included: a poor pedestrian environment; vehicular congestion; an unclear parking strategy; difficulty in wayfinding; and neglected or underutilized amenities (Department of City Regional Planning, 2010).
To tackle these issues, the publication proposed the idea to implement a well-coordinated parking system that would help bring customers close to their downtown destinations; streetscape amenities to provide comfortable, safe and enjoyable pedestrian experiences and encourage walking over other means of transport; a balanced multi-modal transportation system that could help reduce auto-congestion and provide access choice; integrated wayfinding systems that would help tourists navigate the city; and last, a well-connected street network to improve direct access throughout the city (Department of City Regional Planning, 2010).
The Urban Renewal of Oranjestad was carried out in four phases: the first phase was the renovation of Plaza Daniel Leo, followed by the construction of the trolley system on Main Street. Next followed the improvements of the streetscape design and the renovation of commercial structures and finally the renovation of Plaza Nikki Habibe. The relocation of the container terminal located just outside of Downtown was also included in the project. (Government of Aruba, 2017).
The streetcar line was built starting from the cruise ship terminal down to Main Street. The project was carried out by TIG/m, who constructed two streetcars, a single and a double decker. The single-deck car line was inaugurated on December 15, 2012. However, the trolley line did not become fully operational until February 19, 2013. Landscaping, traffic signaling and the final touches on the pedestrian mall took several months (Morrison, 2013).
The execution of the project faced many challenges. The installment of the streetscape was carried out in 2013 and included feeder streets made out of pavers and natural stones
that have wider sidewalks to accommodate pedestrians, big plants, lighting, modern street furniture and sun shades. One of the companies involved with streetscaping was Manbraca Construcciones. According to an article by Solo di Pueblo (2013), the construction company had trouble meeting the deadline to finalize Main Street by July 4, 2013. The delay was due to the necessary replacement of the old water and power supply lines under the boulevard (Klein, 2011). Another factor that compounded the delay was related to the natural stones used for the floors of the streetscape. These had to be imported, but unfortunately the supplier could not deliver on time. The decision to change the sequence of construction ended up causing more problems for the project. Furthermore, the company had to rely on foreign contractors to work with these stones (Phot, 2013).
In a press release by Andin Bikker, he addresses the issue that the delay of the redevelopment put a big financial strain on the shops located in Main Street. He further explained that the delay caused a drastic decrease in sales and that businesses had the right based on jurisprudence and existing law to be compensated for the damages caused by this matter. However, no further information was found regarding shopkeepers receiving any compensation. (Awe24, 2016).
Results
Challenges facedDuring the redevelopment process the businesses on Main Street experienced a lot of disturbance. They felt they were being unfairly penalized as the government did not provide them with adequate compensation. As a result of the constructions that were being done on Main Street, many customers decided to go shopping at other shopping centers located in Noord, Tanki Flip, Tanki Leendert, Paradera and Santa Cruz.
During the interviews, shopkeepers expressed their frustration with regards to the effect that the implementation

UAUCU Student Research Exchange Collected Papers 2018
234
of the tram had on their businesses. While some admit that the tram does look attractive and does bring tourists to Main Street, these tourists are not incentivized to get off the tram and peruse the stores. The shopkeepers also mentioned that after the tram became operational, they had fewer visits from tourists. Before, the stores would get the occasional foreign passerby entering their stores; now with the tram there are a lot fewer tourists walking down Main Street and therefore fewer visits from tourists. Some of the opinions expressed by the interviewees regarding the tram were that it is impractical, non-traditional and a waste of public funds.
The implementation of the parking system according to the interviewees had the biggest impact. In September 2015 the Government of Aruba introduced paid parking in Main Street. Before this occurrence, parking used to be free. The parking system was implemented as a way to deter drivers from leaving their vehicles for extended periods of time near the downtown area, and to restrict parking on the sidewalks. Drivers who breached the law were fined, had their vehicle clamped or gotten their cars towed. The new regulations included: parking only allowed in parking zones, designated spaces for permit holders, and paid parking between 7AM to 3PM during weekdays. At the end of 2017, the Government of Aruba decided to eliminate the wheel clamp as a sanction (Limon, 2017). According to the shopkeepers interviewed, the implementation of the parking regulation has resulted in a significant drop in sales.
The merchants shared their thoughts on why the parking system was ineffective in bringing visitors to Main Street. One belief was that people had to rush to make their purchases while they were constantly paying attention to their remaining parking time, which made it difficult for the sales agents to sell their products. Another was that customers only came to Main Street looking for specific items and therefore no longer lingered and shopped around. Sales agents who received commissions were
especially frustrated because their salary depends on the commission on sales and they are thus not making as much as they used to. The shopkeepers also mentioned that the parking system was not adequately explained to the community. There was a lot of confusion about the distinction between the yellow and white parking zones. This led to people getting fined and having their vehicles clamped. A shopkeeper further elaborated that after people got clamped, they had a negative view of Main Street. An interesting point that came up was that merchants felt that Main Street was no longer being promoted to tourists anymore and were instead being referred to stores located in the High Rise Hotel District.
Not all merchants were against the implementation of the new parking system, as other cities have implemented it successfully. They did feel that the parking fee was too high. After 3 o’clock, when parking becomes free, the majority did not notice a big impact on the amount of sales. Meanwhile the people that have noticed an impact lament that it is only for 3 hours out of a whole workday.
The interviewees said that after the redevelopment their businesses suffered, reporting a decrease in revenues by as much as 85%. Tourists just drive by in the tram and do not get off to walk, while locals cannot drive through the street in the evening anymore, so they don’t window shop. As a consequence of the policy to restrict vehicles from entering Main Street, there is no longer any traffic on Main Street, not during the day nor after closing hours. The continuous flow of cars in Main Street in the past was experienced as a form of social surveillance that led to a sense of safety. The perceived lack of surveillance led to stores being vandalized.
Recently, stores that used to get a large share of their revenue from Venezuelan tourists are now having trouble keeping their sales up due to the ongoing Venezuelan economic crisis. Others blamed the decrease of purchasing power in Aruba as the main cause of their drop in sales.

UAUCU Student Research Exchange Collected Papers 2018
235
Strategies usedThe strategies used by the surviving enterprises can be mainly split into two categories. One revolving around increasing engagement with their clients, and the other around cutting costs. Both these strategies fall under the competitive strategy.
The majority of businesses had a loyal customer base built up over the years. In order to ensure that this base would continue to shop at their stores despite the inconveniences that came with the construction work, stores began pursuing strategies that involved more engagement with their clients.
For starters, many shopkeepers either kept or started keeping an expansive client list of their loyal and recurring customers. Many of them use social media, especially Facebook. Stores have also modernized their marketing strategy by incorporating social media into their advertising campaigns and also to increase their interaction with customers. This strategy was pursued in addition to their existing marketing techniques, such as sending invitation letters, calling their clients or sending notices via email about upcoming sales or the arrival of new stock.
Another strategy was to provide extra care to the user experience whenever a client entered their stores. These not only include giving clients their full attention, being friendly, making sure that the client’s need were met, but also being more flexible in payment options, especially to recurring clients.
Other stores tried to diversify and innovate by organizing activities and inviting clients to partake in product tryouts. They also diversified their store by offering new lines of products. Others tried to survive by reducing their costs. Some stores did this by laying off some of their staff to counteract the decrease in daily customers. Others reduced their costs by changing to a more cost
effective supplier. Still others were more thoughtful about their inventory and payment methods, allowing existing clients to make payments in installments and changing their shipping methods from airfreight to ocean freight. They also had to be more careful in managing their inventory so that they did not end with a backlog or dead stock.
Conclusion/Recommendations
In conclusion, the redevelopment op Main Street by streetscaping and the introduction of a tram and parking system led to frustration among the merchants, with all of them struggling to remain in business. They experienced both a drop in revenue and a decline in customers. In order to survive this downturn, some of the merchants focused on cutting costs and managing inventory; others went for a differentiation strategy, where the focus was on setting themselves apart from the rest by treating their clients with more care and selling higher quality products.
From the interviews conducted it is apparent that shopkeepers think that people have become more conscious of the time they spend in Main Street and therefore don’t spend as much time idly perusing anymore. Therefore, it has become important that shopkeepers ensure that the user experience is the best it can be in a short amount of time in order to keep them coming back to their stores. It has also become increasingly important to understand the wants and needs of the clients in order to better manage stock and be more effective in sales campaigns. Since the use of showcases has become less effective in Main Street, it has become necessary to use social media as showcasing platform.
Some recommendations and suggestions were given by the shopkeepers about how they believe Main Street can be revitalized again:

UAUCU Student Research Exchange Collected Papers 2018
236
• Klein, R. (2011, December). Downtown Oranjestad. Transcend, 1, 21-22.
• Limon, A. (2017, November 02). Everything You Need To Know About Paid Parking in Aruba. Retrieved April 11, 2018, from http://www.vacationsbyaruba.com/parking-in-downtown-aruba/
• Morrison, A. (2013, June 22). The streetcars of Oranjestad. Retrieved April 02, 2018, from http://www.tramz.com/aw/aw.html
• Muilwijk, E. (n.d.). Core Competencies by Hamel and Prahalad. Retrieved April 11, 2018, from http://www.intemarketing.org/marketing-information/marketing-basics/core-competencies-hamel-and-prahalad
• Phot, C. (Producer). (2013). Bo Aruba, Nos Aruba - Programma 115 [Video file]. Aruba: Government of Aruba. Retrieved April 02, 2018, from https://www.youtube.com/watch?v=6a1UFcfshZw&t=84s&index=1&list=LLEy_iGaqOJE0fVlkRi_OQHg
• Porter, M. E. (1985). Competitive advantage: Creating and sustaining superior performance. London: The Free Press.
• Solo di Pueblo. (2013, July 5). Mapotex NV lo laga beslag Manbraca Construcciones. Solo Di Pueblo, p. 3.
• Taylor, D. (n.d.). S mall and M edium Sized E nterprises (SME s ) in Aruba: A path to sustainable development (Rep.).
• Treacy, Micheal & Wiersema, Fred (1995).The Discipline of Market Leaders. Scriptum Management.
• Vries, W. D., Lancée, E. F., Helsdingen, P. J., & Borchert, T. (2014). Dienstenmarketingmanagement: Offline & online. Groningen: Noordhoff Uitgevers, p 160
1. Increase security. To decrease vandalism and delinquency, create a safe environment for visitors and protect the public property of Main Street.
2. Organize more events along Main Street in order to attract and incentivize customers to come to Main Street.
3. Provide incentives to attract more diverse types of stores.4. Discourage the establishment of too many similar types
of stores and/or low quality stores.5. Install and maintain public restrooms to provide a basic
amenity for visitors.6. Rezone the yellow parking spaces to white parking
spaces in order to have fewer unused parking spaces. 7. Open up Main Street for vehicles after closing hours
so stores can use their shop windows to promote their products and increase surveillance.
8. Allow more refreshments kiosks to seduce tourists to get off the tram and stop by for refreshments.
Sources
• Ansoff, H. I. (1957). Strategies for Diversification. Harvard Business Review. (Vol. 35 Issue 5, Sep/Oct)
• Awe24. (2016, August 11). Riba derecho di compensacion Andin Bikker ta sugeri comerciantenan den Caya pa manda carta pa Gobierno. Retrieved April 11, 2018, from http://www.awe24.com/r25499
• Chamber of Commerce & Industry (KvK).(2016) Situacion di Caya Grandi a empeora. Retrieved from https://www.arubachamber.com/downloads/chamber-news/press-releases/934-19-2016-situacion-di-caya-grandi-a-empeora
• Department of City Regional Planning. (2010). Urban Design Vision Plans for Aruba: Oranjestad (Rep.). University of Pennsylvania.
• Government of Aruba. (2017). Opportunities Ahead 2017 (p. 16, Rep.).
• Kim,W. C. ,and Mauborgne, R. (2005). Blue Ocean Strategy. Boston: Harvard Business School Publishing Corporation