Transportation Facilities Management Under Emergencies
76
TRANSPORTATION FACILITIES MANAGEMENT UNDER EMERGENCIES By Virginia P. Sisiopiku, PhD Xuping Li, MSCE Abdul Muqueet Abro, MSCE and Robert W. Peters, PhD, P.E. Department of Civil, Construction, and Environmental Engineering The University of Alabama at Birmingham 311 Hoehn Building 1075 13th Street South Birmingham, AL 35294-4440 Prepared by UTCA University Transportation Center for Alabama The University of Alabama, The University of Alabama in Birmingham, and The University of Alabama at Huntsville UTCA Report 06202 March 2007
-
Upload
ua-birmingham -
Category
Documents
-
view
0 -
download
0
Transcript of Transportation Facilities Management Under Emergencies

TRANSPORTATION FACILITIES MANAGEMENT UNDER EMERGENCIES
By
Virginia P. Sisiopiku, PhD Xuping Li, MSCE
Abdul Muqueet Abro, MSCE and
Robert W. Peters, PhD, P.E.
Department of Civil, Construction, and Environmental Engineering The University of Alabama at Birmingham
311 Hoehn Building 1075 13th Street South
Birmingham, AL 35294-4440
Prepared by
UTCA
University Transportation Center for Alabama The University of Alabama, The University of Alabama in Birmingham,
and The University of Alabama at Huntsville
UTCA Report 06202 March 2007

ii
Technical Report Documentation Page
1. Report No FHWA/CA/OR-
2. Government Accession No. 3. Recipient Catalog No.
5. Report Date March 2007
4. Title and Subtitle Transportation Facilities Management Under Emergencies 6. Performing Organization Code
7. Authors Virginia P. Sisiopiku, Xuping Li, Abdul Muqueet Abro, and Robert W. Peters
8. Performing Organization Report No. UTCA Report 06202 10. Work Unit No.
9. Performing Organization Name and Address Department of Civil, Construction & Environmental Engineering The University of Alabama at Birmingham 1075 13th Street South Birmingham, AL 35294-4440
11. Contract or Grant No. DTSR0023424
13. Type of Report and Period Covered Final Report 1/1/06-12/31/06
12. Sponsoring Agency Name and Address University Transportation Center for Alabama The University of Alabama P.O. Box 870205 Tuscaloosa, AL 35487-0205
14. Sponsoring Agency Code
15. Supplementary Notes 16. Abstract In order to address limitations of static traffic assignment, recent research focused on the development of Dy-namic Traffic Assignment (DTA) models that are capable of estimating time-varying network conditions by cap-turing traffic flow and route choice behavior. Such models compute the spatio-temporal path for every vehicle so that no user can switch path and improve his travel. Moreover, they account for real-time routing behavior in response to congestion due to recurrent and non-recurrent events. In this context, DTA models provide transpor-tation planners and engineers with modern tools to improve the accuracy of traditional transportation planning approaches and enable modeling of Intelligent Transportation Systems technologies that are used to improve transportation system management. This project developed a Dynamic Simulation/Assignment Model for Birmingham, Alabama area to study emer-gencies in the Birmingham area for preplanning purposes and to evaluate alternative relief strategies. The Visual Interactive System for Transport Algorithms (VISTA) platform was utilized for this purpose. Case studies were constructed to demonstrate the potential use of the software for traffic management and transportation planning under emergencies. More specifically, one incident management case study with six scenarios and one emergency analysis case study with two scenarios were tested on a sub-network of the Birmingham regional network. The study confirmed that a DTA approach could provide transportation agencies with a powerful tool with which to improve their existing management plans through the evaluation of route diversion strategies, information dis-semination through variable message signs placement, signal preemption in support of evacuation, and a variety of emergency response actions.
17. Key Words Dynamic Traffic Assignment, Traffic Simulation, Inci-dent and Emergency Management, Visual Interactive System for Transport Algorithms (VISTA)
18. Distribution Statement
19. Security Classif. (of this report)
Unclassified
20. Security Classif. (of this page)
Unclassified
21. No of Pages 68 pages
22. Price
Form DOT F 1700.7 (8-72)

iii
Contents
Contents ....................................................................................................................................... iii List of Tables ................................................................................................................................. vi List of Figures ............................................................................................................................... vii Executive Summary ..................................................................................................................... viii 1.0 INTRODUCTION .....................................................................................................................1
1.1 Motivation and Problem Statement ....................................................................................... 1 1.2 Objective................................................................................................................................ 3 1.3 Work Contribution................................................................................................................. 3 1.4 Organization of the Report .................................................................................................... 4
2.0 DYNAMIC TRAFFIC ASSIGNMENT (DTA) OVERVIEW..................................................5
2.1 DTA Concept......................................................................................................................... 5 2.1.1 STA Methods ..................................................................................................................5 2.1.2 DTA Methods .................................................................................................................6
2.2 Available DTA Options ......................................................................................................... 6 2.2.1 Analytical Models...........................................................................................................6 2.2.2 Simulation-based DTA Models ......................................................................................7
2.3 DTA Application Areas ......................................................................................................... 8 3.0 SIMULATION-BASED DTA MODELS................................................................................10
3.1 DynaMIT ............................................................................................................................. 10 3.1.1 Approach.......................................................................................................................10 3.1.2 Capabilities ...................................................................................................................10 3.1.3 Limitations ....................................................................................................................11 3.1.4 Applications ..................................................................................................................12
3.2 DYNASMART-X................................................................................................................ 12 3.2.1 Approach.......................................................................................................................12 3.2.2 Capabilities ...................................................................................................................13 3.2.3 Limitations ....................................................................................................................13 3.2.4 Applications ..................................................................................................................14
3.3 VISTA.................................................................................................................................. 15 3.3.1 Approach.......................................................................................................................15 3.3.2 Capabilities ...................................................................................................................15 3.3.3 Limitations ....................................................................................................................17 3.3.4 Applications ..................................................................................................................17
3.4 Model Comparison .............................................................................................................. 18 4.0 METHODOLOGY ..................................................................................................................20
4.1 Approach.............................................................................................................................. 20

iv
Contents (continued)
4.2 Selection of Test Bed and Incident and Emergency Sites ................................................... 20 4.3 Simulation Model Selection................................................................................................. 24
4.3.1 Model Selection Process ...............................................................................................24 4.3.2 Considerations of Model Level of Detail......................................................................24 4.3.3 Model Validation ..........................................................................................................25
4.4 Data Needs and Data Sources.............................................................................................. 27 4.4.1 Input Data Needs in VISTA..........................................................................................27
4.4.1.1 Network data......................................................................................................... 27 4.4.1.2 Demand data. ........................................................................................................ 27 4.4.1.3 Control data........................................................................................................... 28
4.4.2 Data Sources .................................................................................................................28 4.5 Study Boundaries and the Test Bed..................................................................................... 29 4.6 Other Considerations ........................................................................................................... 30
4.6.1 VMS Designs ................................................................................................................30 4.6.2 Model Outputs for Incident Scenarios ..........................................................................32 4.6.3 Preemption Design........................................................................................................32 4.6.4 Model Output for Emergency Scenarios.......................................................................33
4.7 Description of Incident-Related Scenarios .......................................................................... 34 4.7.1 Scenario 1: Base Case...................................................................................................35 4.7.2 Scenario 2: Incident Conditions-Full Lane Blockage-No Information Provision ........35 4.7.3 Scenario 3: Incident Conditions-Full Lane Blockage-Information Provision to all
Users ............................................................................................................................36 4.7.4 Scenario 4. Incident Conditions-Two Lane Blockage-No Information Provision .......36 4.7.5 Scenario 5: Incident Conditions-Full Lane Blockage-Information Provision- VMS
Design 1 before Junction of I-65 and University Boulevard -User Response 50%.....36 4.7.6 Scenario 6: Incident Conditions-Full Lane Blockage-Information Provision-VMS
Design 2 before Junction of I-65 and US-11 -User Response 50%.............................37 4.8 Description of Emergency Scenarios................................................................................... 38
5.0 RESULTS AND ANALYSIS OF INCIDENT MANAGEMENT ............................................. SCENARIOS .................................................................................................................................41
5.1 Scenario 1: Base Case.......................................................................................................... 41 5.2 Scenario 2: Incident Conditions-Full Lane Blockage-No Information Provision ............... 42 5.3 Scenario 3: Incident Conditions-Full Lane Blockage-Information Provision to all Users.. 44 5.4 Scenario 4: Incident Conditions-Two Lane Blockage-No Information Provision .............. 46 5.5 Scenario 5: Incident Conditions-Full Lane Blockage-Information Provision-VMS Design 1
before Junction of I-65 and University Boulevard-User Response 50%............................. 47 5.6 Scenario 6: Incident Conditions-Full Lane Blockage- Information Provision-VMS Design 2
before Junction of I-65 and US-11 -User Response 50%.................................................... 49
6.0 RESULTS AND ANALYSIS OF EMERGENCY MANAGEMENT SCENARIOS.............56 6.1 Scenario A: Base Case......................................................................................................... 56 6.2 Scenario B: Signal Preemption ............................................................................................ 57

v
Contents (continued) 7.0 CONCLUSIONS......................................................................................................................63
7.1 Project Contributions ........................................................................................................... 63 7.2 Conclusions From the Case Study ....................................................................................... 64 7.3 Future Research ................................................................................................................... 64
8.0 REFERENCES ........................................................................................................................66 9.0 Appendix A - List of Abbreviations…………………………………………………………68

vi
List of Tables
Number Page
3-1 Comparison of DTA simulation models......................................................................19 4-1 Summary of scenarios .................................................................................................35 5-1 Base case system wide results-scenario 1....................................................................41 5-2 Results for the directly impacted route-scenario 1 ......................................................41 5-3 Results for the potential alternative route-scenario 1 ..................................................42 5-4 Incident closure overview-scenario 2 ..........................................................................42 5-5 System wide results-scenario 2....................................................................................43 5-6 Results for the directly impacted route-scenario 2 ......................................................43 5-7 Results for the potential alternative route-scenario 2 ..................................................44 5-8 Incident closure overview-scenario 3 ..........................................................................44 5-9 System wide results-scenario 3....................................................................................45 5-10 Results for the directly impacted route-scenario 3 ......................................................45 5-11 Results for the potential alternative route-scenario 3 ..................................................46 5-12 Incident closure overview-scenario 4 ..........................................................................46 5-13 System wide results-scenario 4....................................................................................46 5-14 Results for the directly impacted route-scenario 4 ......................................................47 5-15 Results for the potential alternative route-scenario 4 ..................................................47 5-16 Incident closure overview-scenario 5 ..........................................................................48 5-17 System wide results-50% compliance-scenario 5 .......................................................48 5-18 Results for the directly impacted route-50% compliance-scenario 5 ..........................48 5-19 Results for the potential alternative route-50% compliance- scenario 5 ....................................................................................................................49 5-20 Results for the potential alternative route-no information provision-scenario 2..........49 5-21 Incident closure overview-scenario 6 ..........................................................................49 5-22 System wide results-50% compliance-scenario 6 .......................................................50 5-23 Results for the directly impacted route-50% compliance-scenario 6 ..........................50 5-24 Results for the potential alternative route-50% compliance- scenario 6 ....................................................................................................................50 5-25 Results for the potential alternative route-no information provision-scenario 1 …...51 6-1 Base case system wide results-scenario 1.....................................................................56 6-2 Base case bus travel time..............................................................................................57 6-3 Base case emergency bus travel time ...........................................................................57 6-4 Signal preemption system wide results-scenario 2.......................................................58 6-5 Preemption case bus travel time ...................................................................................58 6-6 Preemption case emergency bus travel time.................................................................59 6-7 Bus travel time base case system wide.........................................................................59 6-8 Bus travel time preemption case system wide..............................................................60 6-9 Bus travel time categories in base case ........................................................................60 6-10 Bus travel time categories in preemption case .............................................................60 6-10 Bus delay base case system wide .................................................................................62 6-11 Bus delay preemption case system wide ......................................................................62

vii
List of Figures
Number Page 4-1 Map of the study network.............................................................................................21 4-2 The incident location in this study................................................................................22 4-3 The location of Riverchase Galleria Shopping Mall ....................................................23 4-4 The location of Roebuck Shopping Center...................................................................24 4-5 Observed counts Vs simulation counts.........................................................................26 4-6 The Birmingham regional network as coded in VISTA...............................................29 4-7 The sub-network of the Birmingham regional network ...............................................30 4-8 The VMS location for design 1 ....................................................................................31 4-9 The VMS location for design 2 ....................................................................................32 4-10 Non-priority recovery (Ziliaskopoulos and Chang, 2004) ..........................................34 4-11 Scenario 5-Directly impacted and alternative route using University Blvd................37 4-12 Scenario 6-Directly impacted and alternative route using US Highway 11................38 4-13 Emergency route US-31 ..............................................................................................39 4.14 Emergency route US-11...............................................................................................40 5-1 Total delay for the six scenarios ...................................................................................53 5-2 Total travel time for the six scenarios ..........................................................................53 5-3 Total delay with varying user response to information provision................................53 5-4 Total travel time with varying user response to information provision .......................54 5-5 Total delay for VMS 1 vs. VMS 2 with 50% response ................................................54 5-6 Total travel time for VMS 1 vs. VMS 2 with 50% response........................................55 6-1 Number of buses per travel time category in base case................................................61 6-2 Number of buses per travel time category in preemption case.....................................61

viii
Executive Summary
In order to address limitations of static traffic assignment, recent research focused on the devel-opment of Dynamic Traffic Assignment (DTA) models that are capable of estimating time-varying network conditions by capturing traffic flow and route choice behavior. Such models compute the spatio-temporal path for every vehicle so that no user can switch path and improve his travel. Moreover, they account for real-time routing behavior in response to congestion due to recurrent and non-recurrent events. In this context, DTA models provide transportation plan-ners and engineers with modern tools to improve the accuracy of traditional transportation plan-ning approaches and enable modeling of Intelligent Transportation Systems technologies that are used to improve transportation system management. This project developed a Dynamic Simulation/Assignment Model for Birmingham, Alabama area to study emergencies in the Birmingham area for preplanning purposes and to evaluate al-ternative relief strategies. The Visual Interactive System for Transport Algorithms (VISTA) plat-form was utilized for this purpose. Case studies were constructed to demonstrate the potential use of the software for traffic management and transportation planning under emergencies. More specifically, one incident management case study with six scenarios and one emergency analysis case study with two scenarios were tested on a sub-network of the Birmingham regional net-work. The results from the analysis showed that incidents that occur in strategic locations and are not cleared quickly can affect traffic operations in the entire network and should not be ignored, at least in medium-sized networks such as the Birmingham regional network under study. The re-sults also demonstrate that the network under consideration is sensitive to the duration of inci-dent presence, and thus quick incident response could greatly benefit post-incident operations.
The findings further confirm the hypothesis that, in large networks there is typically temporal residual capacity and thus drivers’ awareness and proper reaction under incident conditions can substantially alleviate the impact of spatial capacity reduction in the vicinity of the incident. The results also justify the common practice of maintaining at least partial capacity of major transpor-tation facilities (instead of shutting down the facility completely) so that an emergency can be handled relatively efficiently. Moreover, the results demonstrate the potential benefit of signal preemption along evacuation corridors.
Overall, the study confirmed that a DTA approach could provide transportation agencies with a powerful tool with which to improve their existing management plans through the evaluation of route diversion strategies, information dissemination through variable message signs placement, signal preemption in support of evacuation, and a variety of emergency response actions.

1
1.0 INTRODUCTION
1.1 Motivation and Problem Statement
The extensive network of transportation infrastructure provides mobility in the U.S. and is the backbone of the U.S. economy. According to the 2003-2008 strategic plan of the U.S. Depart-ment of Transportation (DOT), the U.S. transportation system annually provides over 4.9 trillion passenger miles of travel and 3.8 trillion ton miles of domestic freight generated by 281 million people, 7.1 million business establishments, and 88 thousand government units. The economic implications are also significant. Transportation in the U.S. comprises 11 percent of the gross domestic product, or approximately $1.1 trillion annually, and supports one in eight jobs. In 1999, American households spent an average of $7,000 on transportation, or nearly 20 percent of their income; an expenditure second only to the amount they spent on housing (DOT, 2003). Historical data trends and projections agree that in the years ahead, America will require an even safer, more equitable and efficient transportation system to serve citizens, businesses, and gov-ernment units. On the other hand, a disproportional increase in travel demand, compared to sup-ply, results in considerable congestion that significantly hampers the ability of existing transpor-tation systems to provide mobility, especially in urban settings. According to a study conducted at the Texas Transportation Institute (TTI) with 2003 data (Schrank and Lomax, 2005), conges-tion results in 3.7 billion hours of travel delay and 2.3 billion gallons of wasted fuel annually in the U.S. Along with traffic congestion, there is significant additional cost due to wasted fuel, en-vironmental impacts, and human injuries and fatality. TTI estimates that in 2003 alone, the total annual cost of traffic congestion to the U.S. economy in lost productivity and wasted motor fuel was more than $63 billion. Among other factors, incidents contribute substantially to urban congestion. An incident is any non-recurring event that impedes the flow of traffic. Incidents vary in severity and duration from a minor property damage crash on the shoulder to a serious injury crash blocking all lanes. Inci-dent examples include traffic crashes, stalled vehicles abandoned in a traffic lane, debris spilled in the lane etc. Traffic studies confirm that incidents can cause substantial traffic congestion in directly impacted areas. Moreover, real world studies indicate that disruptions on heavily trav-eled routes will have a magnified effect due to human behaviors. For instance, secondary crashes may occur if the incident is not safely and quickly managed. According to research results pre-sented by the incident management team of the Minnesota Department of Transportation (Mn/DOT), traffic incidents can create up to 50 percent of the congestion on the state’s metro-politan freeways depending upon the severity, time of day, and location of the incidents (Mn/DOT, 2006). Incident management has been widely recognized as one of the most important operational treatments for increasing the efficiency of an existing transportation system. An incident man-

2
agement program is a planned and coordinated process to detect, respond to, and remove traffic incidents, as well as restore traffic capacity as safely and quickly as possible. The benefits of in-cident management programs can be significant. TTI researchers discuss in the 2005 Urban Mo-bility Report (Schrank and Lomax, 2005) the effect of incident management programs designed to enhance the efficiency of the existing transportation infrastructure. According to this report, implementation of incident management programs provides faster and smoother traffic flow and improves safety through the reduction of response time and of the occurrence of “secondary” crash collisions. Furthermore, freeway incident management programs were estimated to pro-vide 177 million hours of delay reduction and $2.93 billion in congestion savings for the 85 ur-ban areas studied with 2003 data; it was assumed in the study that the programs covered 40 to 67 percent of the freeway miles in the study urban areas. If these incident management programs were deployed on all major freeways and streets in these study areas, an estimated 250 million hours of delay and more than $5.2 billion could be saved. These are significant benefits that clearly demonstrate that incident management strategies have a great potential to provide relief from traffic congestion and improve traffic conditions without the need for expensive, time-consuming, and often hard to implement roadway or public transportation system expansions (Schrank and Lomax, 2005). Similarly to incident management, efficient and well coordinated emergency management is critical in minimizing traffic disruptions in an event of a natural or man-made disaster. The con-cept of emergency management has emerged as a partial response to a long recognized need for improved emergency responses for hazard management (Drabek, 1985). Management of emer-gencies constitutes a unique managerial problem as it involves a wide range of responding or-ganizations with conflicting priorities and needs. Effective emergency management relies on thorough integration of emergency plans at all levels of government and non-government involvement. The process of emergency management typically involves four phases: mitigation, preparedness, response, and recovery. The vital role of transportation in all four phases of emer-gency management is well recognized. Communication among agencies, responders, and the public, as well as the technology to facili-tate it, is a critical part of successful incident and emergency management programs. The advent of Intelligent Transportation Systems (ITS) has provided a breakthrough for effective incident management programs and significantly enhanced the ability to manage traffic and provide trav-eler information in the area affected by an incident and available options (FHWA, 2006). In fact, one of the main functions of ITS is to provide travelers with real time information on traffic con-ditions and route guidance around congestion. This can assist travelers with optimizing their routes on the basis of current traffic conditions in case of incidents and emergencies. Traditional Static Traffic Assignment (STA) models assume that link flows and link trip times remain constant over the planning horizon of interest, and thus fail to capture the true traffic dy-namics and properly model user choices under congested conditions. Therefore, they are inap-propriate for real time traffic control applications on congested networks. In order to address the problems that are beyond the scope of STA methods, the Dynamic Traffic Assignment (DTA) concept was initiated more than two decades ago. Since then, there have been considerable re-search efforts invested in this area. As a result, DTA has evolved substantially in the past few

3
years, and some new sophisticated DTA simulation tools have emerged for modeling large-scale regional areas. DTA models depart from the standard static assignment assumptions to deal with time-varying flows, and thus overcome STA limitations that traditionally test the short-term con-trol actions necessary to manage non-recurring events such as crashes or infrastructure failures on the basis of average daily traffic. DTA is particularly appropriate for modeling incidents be-cause the timing of incident occurrence, management, recovery, and the use of alternate routes are critical to roadway performance and driver behavior (Wirtz et al., 2005).
1.2 Objective
The objective of this study was to demonstrate the applicability of DTA modeling on incident and emergency management so as to analyze the possible disruption to the existing urban trans-portation network due to incidents and emergencies and to assess the effectiveness of response actions. More specifically, the impacts of incidents of varying degrees of severity were evaluated at a study area. Information provision via ITS technologies was considered, along with carefully designed candidate response plans. A sensitivity analysis of the potential impacts of the response plans under incident conditions was performed, as part of the study. Moreover, emergency sce-narios were developed and tested to analyze emergency responses to a fire breakout. Among other strategies considered, signal preemption was implemented along the emergency response routes in an attempt to reduce the response time of emergency vehicles and quickly evacuate the people from the hazardous locations. A regional transportation network model was developed and tested for the Birmingham, Ala-bama metropolitan area to study incident and emergency management using a DTA simulation tool. More specifically, the Visual Interactive System for Transport Algorithms (VISTA) plat-form was utilized to analyze the impacts of incidents of various durations and assess the effec-tiveness candidate incident management plans on traffic operation in the Birmingham regional area. Furthermore, relevant ITS technologies such as Variable Message Signs (VMS) were im-plemented on the network to assess the impact of information provision. As mentioned earlier, in emergency management, response plans were designed with and without preemption to analyze the impact of preemption on traffic operations in the event of emergencies. This study also showcased the capabilities of DTA modeling and the benefits associated with DTA adoption by transportation agencies. As a result, DTA options were introduced in an effort to educate transportation planners, engineers, and practitioners on the great promise that DTA applications hold for improving existing transportation planning approaches.
1.3 Work Contribution
While DTA presents a true evolution in the transportation field, many transportation agencies are still unfamiliar with the potential benefits of DTA adoption. To narrow this gap, this report

4
documents DTA methodologies and options for future reference. First, it offers an in-depth in-vestigation of simulation models with the capability to perform dynamic traffic simulation and assignment. More specifically, the features, strengths, and limitations of three representative DTA simulation models [namely, DynaMIT (the Dynamic Network Assignment for the Man-agement of Information to Travelers Model), DYNASMART (the Dynamic Network Assign-ment-Simulation Model for Advanced Road Telematics), and VISTA] are described. A compari-son of these models is also presented. DynaMIT is a state-of-the-art real time computer system for traffic estimation and prediction that supports generation of traveler information and route guidance. DYNASMART is a discrete time mesoscopic simulation model for the applications of Advanced Traveler Information Systems (ATIS) and Advanced Traffic Management Systems (ATMS). It is designed to model traffic pat-tern and evaluate overall network performance under real-time information systems. VISTA is an innovative network-enabled framework that integrates spatio-temporal data and models for a wide range of transportation applications, including planning, engineering and operational ones. More details about these models can be found in Section 3.0. Moreover, the VISTA software package was adapted to model incident and emergency condi-tions and response actions in the Birmingham regional network. Relevant ITS technologies for information dissemination were also evaluated in VISTA. Thus, a powerful DTA tool was de-veloped and provided to local transportation planners and engineers to improve the accuracy of traditional transportation planning approaches and enable modeling of recently emerged tech-nologies such as ITS. Another contribution of this work was identification of specific application areas where DTA can play a very important role in improving planning, engineering, and opera-tional procedures currently adopted by transportation and planning agencies; more details in this respect can be found in Section 2.3.
1.4 Organization of the Report
This report is divided into seven sections. Following the Introduction in Section 1.0, Section 2.0 reviews DTA concepts, available DTA options, and DTA application areas. In Section 3.0, the features and functionality of three representative simulation-based DTA models are presented. Furthermore, a brief comparison of the three models is provided. Section 4.0 presents the meth-odology of this study, in which details about the study approach, model selection criteria, the study test bed, and experimental scenarios are illustrated. Sections 5.0 and 6.0 provide a sum-mary and interpretation of the simulation results for incident and emergency scenarios, and Sec-tion 7.0 presents the conclusions and recommendations for further research.

5
2.0 DYNAMIC TRAFFIC ASSIGNMENT OVERVIEW
2.1 DTA Concept
The purpose of traffic assignment is to determine the volume of traffic that uses specific highway routes as a result of travelers’ route choice decisions. Traditionally, traffic assignment is the fourth step of the planning process that assigns trips from zone i to zone j by mode m to a spe-cific path subject to selected optimization criteria. The fundamental methodology for traffic as-signment is based on some principle of network equilibrium [e.g., user equilibrium (UE), system optimal (SO), or stochastic equilibrium].
2.1.1 STA Methods STA methods have been traditionally used by planners to determine paths followed by transpor-tation system users and thus estimate current and future use of traffic networks. STA models as-sume that link flows and link trip times remain constant over the planning horizon of interest, including the peak period. Then a matrix of steady-state origin-destination (O-D) trip rates is as-signed to the network links, resulting in a link flow pattern that is intended to replicate the peak period flow (Peeta, 1994). Conventional STA methods are based on all-or-nothing, incremental, volume-averaging, or capacity-restrained approaches. While STA models are adequate for long-term planning analyses, studies have shown that these formulations fail to properly account for the essential features of traffic congestion (Peeta, 1994). One of the major limitations of an STA approach is its inherent static analysis perspective, which is unable to capture the true dynamics of real-time routing behavior. The assumption that exter-nal inputs do not vary is typically not applicable in reality, especially during rush hours, when traffic is highly dynamic or under incident conditions. The main reasons that STA models are inappropriate for real-time traffic control applications in congested networks can be summarized as follows (Peeta, 1994). • STA models cannot adequately model congestion. Congestion in STA models is represented
using link performance functions, also known as volume-delay curves, which give the average trip time as a function of the prevailing average link flow. This approach violates the reality of traffic behavior, especially at high flow levels, as they cannot indicate the locations and ex-tents of queues or the delays associated with them. However, because queuing can be of major importance in peak period traffic operations or under incident conditions, the assignment can be grossly inaccurate in predicting peak period operating speeds.
• STA models do not depict users' responses to supplied real-time information and/or route guidance instructions, which is the foundation of applications of Advanced Traveler Informa-tion Systems (ATIS) and Advanced Traffic Management Systems (ATMS).

6
2.1.2 DTA Methods The need to address the limitations of STA methods and the interest in modeling large-scale traf-fic networks, while taking into consideration real-time conditions, have generated considerable research in the area of DTA. Agencies and practitioners are also increasingly realizing the poten-tial of DTA to address longstanding problems caused by the unrealistic assumptions of existing static planning methods, as well as the potential of DTA to evaluate ITS technologies. Further-more, the potential of DTA to be the main operational engine for deployment has attracted much attention from the industry (Peeta and Ziliaskopoulos, 2001). DTA models depart from the standard static assignment assumptions to deal with time-varying flows. It has been recognized that DTA problems are much more complex than STA problems as they involve a wide variety of issues, each corresponding to different sets of decision variables and underlying behavioral assumptions and possessing varying data requirements and capabili-ties for representing the traffic system or control actions. Thus, it is essential to be aware of the common features as well as the strengths and limitations of DTA models. One of the main common features of DTA models is that they deal with the dynamic nature of the network under time-varying demands. Another important feature is that DTA models take into account complex interactions between supply and demand in a transportation network. Such models compute the spatio-temporal path for every vehicle while accounting for real-time driver behavior. This is a great advantage over traditionally used models (such as CORSIM, which is a network-based, microscopic simulation model) that do not track the movement of individual ve-hicles but instead split traffic at intersections. Moreover, it allows for modeling of a variety of ITS options, a feature of great importance given the proliferation of such systems in the last two decades.
2.2 Available DTA Options
Existing DTA models are generally classified into two broad categories: analytical models and simulation-based approaches. The next paragraphs discuss the main feature of each class of models.
2.2.1 Analytical Models Since the pioneering work of Merchant and Nemhauser, (1978 a, b), a wide variety of analytical models have been proposed. The analytical models can be further categorized as mathematical programming, optimal control, or variational inequality models. Most analytical DTA models are extensions of their equivalent static formulations and tend to focus on the UE and SO objectives, or on some variants of them. These models typically attempt

7
to formulate the problems and seek mathematical techniques to solve them. Details on analytical model formulation are provided in the literature. More specifically, Peeta, (1994) provided a re-view of the literature on mathematical programming and optimal control-based DTA formula-tions, with particular focus on provision of real-time information. Ran and Boyce (1994) dis-cussed various optimal control models. Research efforts that focus on variational inequality-
based formulations are discussed in Ran and Boyce, (1996) and Chen, (1999). Although analytical formulations are vital to gaining insight into DTA problems and future ap-plications, a number of limitations raise questions regarding their applicability for real world ap-plications. First, existing analytical models inevitably involve many simplifications. As a result, such models cannot adequately capture the true dynamics of traffic conditions, such as conges-tion buildup and dissipation. Moreover, in realistic applications the network size is typically very large; thus, analytical models are computationally cumbersome and not practical for real world employment. When real world large-scale networks are being considered, simulation-based DTA models offer practical advantages for implementation over analytical approaches (Sisiopiku and Li, 2006). Such advantages are discussed in detail in the following paragraphs.
2.2.2 Simulation-based DTA Models
Simulation-based DTA models use a traffic simulator to replicate the complex traffic flow dy-namics. This circumvents the traffic realism issues of analytical formulations. In addition to us-ing a simulator to determine the traffic flow propagation, most existing simulation-based DTA models also use it as part of the search process to determine the optimal solution. In other words, the simulator is used in an iterative way, with each iteration being used to project the future traf-fic conditions as part of the direction-finding mechanism for the search process.
The availability of large and powerful computers has caused the simulation techniques of DTA to gain sophistication and significance. One such promising improvement to traditional planning tools is the use of DTA and simulation to model network performance. According to Sundaram, (2002), the key advantages of simulation-based DTA models for planning applications are as fol-lows: • Simulation-based DTA systems capture the time-dependent interactions between the demand
and supply of a network. • Simulation-based DTA systems are able to predict the locations and impacts of traffic conges-
tion by modeling the dynamic nature of a network and capturing critical aspects such as con-gestion buildup, queues, spill-backs, and congestion dissipation.
• Simulation-based DTA systems are able to capture the effects of segment level operational changes such as ramp meters and traffic lights by incorporating the operation control logic (through its impact on link capacities) into the representation of the supply simulator.
• Simulation-based DTA systems can also effectively model various ITS strategies, in particu-lar ATMS and ATIS applications, and the impact of information dissemination. This is possi-ble because such systems incorporate rich traveler behavior models and simulation to model traffic dynamics at the required level of detail. Moreover, simulation-based DTA systems can represent travelers’ choices in great detail.

8
In this project, a simulation-based DTA model was utilized to achieve the research goals since this type of model is currently the most appropriate tool for modeling a real world large-scale network.
2.3 DTA Application Areas In real world applications, DTA uses historical and real-time data to determine and predict traffic conditions. Researchers and practitioners agree that DTA holds a great potential for improving current modeling capabilities and can be especially useful for modeling real time deployment options and short-term planning applications. To date, a number of studies have successfully utilized the DTA capabilities for various opera-tional, planning, and ITS applications. For instance, Mahmassani et al., (2004) designed experi-ments to apply DYNASMART to the Irvine (Orange County, California) network and test its estimation and prediction capabilities. Traffic management center (TMC) surveillance data were used to address the calibration and evaluation objectives. In another case study, Chauhan, (2003) applied DynaMIT’s DTA capabilities to the Lower Westchester County (New York) ITS subsys-tem. In this study, a calibrated system was used to perform illustrative analyses of incident re-sponse strategies. DynaMIT was first calibrated to estimate traffic conditions in the Lower West-chester County network with precision sufficient for ITS purposes. The diversion response strat-egy in the case of an incident on the county network was then evaluated. Agrawal et al., (2002) utilized VISTA for evaluating the regional effect of signal preemption strategies for bus transit operations. The model addressed both the propagation and interaction of traffic with the bus operations, as well as the routing behavior of drivers, in response to the in-troduced preemption control. An example traffic network that included Cermak Road in Chicago (Illinois) was coded in VISTA to demonstrate the applicability of the modeling approach. In summary, DTA models can assist in improving the transportation planning process as they can • Replace STA methods with dynamic ones for traditional transportation planning analyses, • Assess impacts of ITS and non-ITS technologies on the transportation network in the planning
phase, • Support decision making for work zone management, incident management, special event
management, and so on, and • Assess impacts of different traffic operation and control strategies with fixed OD demand for
the analysis period. DTA models can also evaluate various types of ITS technologies and infrastructure improve-ments. For example, such models can • Evaluate the impact of traveler information messages and the locations of VMS, • Assess the effectiveness of incident and emergency management plans, • Evaluate and optimize a variety of traffic control measures (location, type of control, and sig-
nal timing),

9
• Estimate environmental impacts of incident management strategies, • Evaluate various types of infrastructure changes, and • Perform accurate and robust traffic impact analyses.
Because of the significant advancements in computer technologies, several simulation-based DTA models have been developed in recent years and are currently available for use. Three rep-resentative simulation-based DTA models are reviewed in Section 3.0 with respect to model ap-proaches, features, and capabilities. A comparison of these three models is also provided for fu-ture reference.
10
3.0 SIMULATION-BASED DTA MODELS
This section documents the features, strengths, and limitations of three representative simulation-based DTA models (namely, DynaMIT, DYNASMART-X, and VISTA). A comparison of these three models is also offered for future reference.
3.1 DynaMIT
3.1.1 Approach DynaMIT is a state-of-the-art real time computer system for traffic estimation and prediction that supports the generation of traveler information and route guidance. It was initially proposed by Ben-Akiva at the Massachusetts Institute of Technology (MIT) and sponsored by the Federal Highway Administration (FHWA), with Oak Ridge National Laboratories (ORNL) serving as the program manager. The main functionality of DynaMIT is to combine historical databases with real-time inputs from the surveillance system to perform estimations of current network conditions and rolling horizon predictions of network conditions. DynaMIT consists of a demand simulator and a supply simulator that interact to generate UE route guidance under the rolling horizon framework. The demand simulator estimates and pre-dicts OD demand using the Kalman filtering methodology. In doing so, it considers both histori-cal information and the driver’s response to the information. The supply simulator is used to de-termine the flow pattern on the basis of the demand. It is a mesoscopic traffic simulator in which vehicles are moved in packets and links are divided into segments that include a moving part and a queuing part to model traffic flow (Ben-Akiva et al., 1997).
3.1.2 Capabilities To sustain users' acceptance and achieve reliable predictions and credible guidance, DynaMIT incorporates unbiasedness and consistency into its guidance generation methodology. Unbiased-ness guarantees that the information provided to travelers is based on the best available knowl-edge of current and anticipated network conditions. Consistency ensures that DynaMIT's predic-tions of expected network conditions match what drivers would experience on the network. Moreover, DynaMIT has the ability to oscillate between the level of detail and computational performance without compromising the integrity of its output. The main features of DynaMIT can be summarized as follows (Sundaram, 2002). • It allows for estimation and prediction of OD flows. • It makes optimal use of historical, surveillance, and OD data to generate reliable OD esti-
mates in real time. The system records the results from previous OD estimations to update OD databases.

11
• It provides iterations between predicted network state and the network state, resulting from driver responses to available information as a means of generating a consistent information strategy.
• It generates information or guidance that is consistent and unbiased to maintain drivers' confi-dence in the system and avoid incident congestion.
• It allows demand simulation using a micro-simulator that generates individual travelers and simulates their pre-trip and en-route decisions (i.e., choice of departure time and route) in re-sponse to information provided by the ATIS system.
• It simulates driver behavior in detail. • It offers the capability to distinguish between informed and uninformed drivers. • It provides supply simulation using a mesoscopic traffic simulator that explicitly captures traf-
fic dynamics related to the development and dissipation of queues, spill-backs, and conges-tion.
• It has the capability to handle real time scenarios such as incidents, special events, weather conditions, highway construction activities, and fluctuations in demand.
• It can integrate with the MITSIMLab microscopic traffic simulator for online evaluation and calibration.
• It offers the possibility for deployment over a computer network by using flexible and inter-nally distributed architecture.
3.1.3 Limitations After several years of intense research and development, DynaMIT has gained sophistication and maturity for real world deployment. As a result, DynaMIT has been successfully implemented in a number of projects. However, there are still several directions in which future research can be focused to improve the model’s performance. These include the following areas. • The calibration of a DynaMIT DTA system is cumbersome since demand calibration and sup-
ply calibration are conducted separately. Thus, the quality of field data has a large influence on the quality of estimates of demand and supply parameters. Future work could provide inte-grated calibration of both the demand simulator and the supply simulator modules in the DTA system.
• The DynaMIT interface is not very user friendly; it utilizes a text editor to modify input data, and the quality of graphics is relatively low.
• DynaMIT is capable of analyzing short- term infrastructure and operational changes. How-ever, it is not adequate for-long term planning applications at the current development stage.
• The demand simulation in DynaMIT uses a micro-simulator. Thus, its computation perform-ance remains to be tested, and the network size with which DynaMIT can deal is limited. For the time being, DynaMIT is applicable only up to medium-sized networks allowing impact studies of limited area coverage.
• Although DynaMIT has already been used to model traveler behavior in response to available information, there is still significant room for improvements to the existing DynaMIT system in this direction. Incorporation of traveler behavior models that closely mimic travelers’ re-

12
sponses to information will enhance both the importance of DynaMIT as a planning tool and its level of acceptance.
3.1.4 Applications After several years of intense research and development, DynaMIT has gained sophistication and maturity for real world employment. As a result, DynaMIT has been successfully implemented in a number of projects. For example, DynaMIT was applied to the Lower Westchester County (New York) ITS subsystem to perform illustrative analyses of incident response strategies (Chauhan, 2003). In another study, DynaMIT was used to model a large-scale network in Irvine (California) for the evaluation of ITS at the planning level, and was used for several short-term planning projects (Sundaram, 2002). This study focused on the evaluation of alternative designs of VMS and illus-trated the functionality and potential of the DynaMIT system. More specifically, various scenar-ios involving VMS implementation were evaluated on the basis of a hypothetical incident on the Irvine network. DynaMIT was used to evaluate both predictive and instantaneous information through the VMS. In the instantaneous case, the analysis was performed for a frequency of in-formation update of 5 min and 10 min. The planning tool was found to be particularly useful in analyzing various scenarios and capturing relevant critical details.
3.2 DYNASMART-X
3.2.1 Approach DYNASMART is a discrete-time mesoscopic simulation model for ATMS and ATIS applica-tions. It is designed to model traffic patterns and evaluate overall network performance under real-time information systems. DYNASMART was developed by Mahmassani et al., (1998) at the University of Texas at Austin in 1998, after several years of research and development on behalf of FHWA. Two versions of DYNASMART are currently available (namely, DYNASMART-X for real-time analysis and DYNASMART-P for planning applications). DYNASMART-X is a state-of-the-art real-time DTA system for effective support of ATMS and ATIS. DYNASMART-X interacts continuously with multiple sources of real-time information such as loop detectors, roadside sensors, and vehicle probes, which it integrates with its own model based on representation of the network traffic state. The system combines advanced net-work algorithms and models of trip-maker behavior in response to traveler information in an as-signment simulation-based framework to provide: • Reliable estimates of network traffic conditions, • Predictions of network flow patterns over the near and medium terms in response to various
contemplated traffic control measures and information dissemination strategies, and

13
• Routing information to guide trip makers (Mahmassani et al., 2004).
3.2.2 Capabilities Consistency checking and updating are important functions incorporated into DYNASMART-X to ensure the consistency of the simulation-assignment model results with actual observations and to update the estimated state of the system accordingly. Another externally supported func-tion is intended to perform the estimation and prediction of the OD trip preference; in turn, these two parameters form the load onto the traffic network and as such are an essential input to the simulation-assignment core. The functionality of DYNASMART-X is achieved through judicious selection of modeling fea-tures that achieve a balance among representational detail, computational efficiency, and input data requirements. The main features of the DYNASMART-X model are as follows (Mahmas-sani et al., 2004): • The model provides a simulation-based DTA system that allows micro-simulation of individ-
ual user decisions in response to information and that also permits mesoscopic traffic flow simulation.
• It recognizes multiple user classes in terms of operational performance (e.g., trucks, buses, and passenger vehicles), information availability and type, and user behavior rules and re-sponse to information.
• It represents traffic processes at signalized intersections and does so under a variety of opera-tional controls, including real-time adaptive signal policies and coordination schemes.
• It achieves consistency among predicted network states, supplied information, and users’ de-cisions.
• It incorporates state prediction capabilities in a rolling horizon implementation with simulta-neous multiple horizons.
• It is capable of optimal path assignment and integrated system management. • It fully integrates ATMS and ATIS under different operational scenarios and deployment lev-
els. • It is compatible with alternative ITS architectures (centralized vs. distributed). • It supports deployment of multiple types of DTA capabilities (descriptive vs. normative) to
meet functional needs of different areas. • It provides guidance information and control actions that are robust under various operational
conditions (incidents, control strategies, etc.). • It adopts distributed software implementation for flexible and scalable execution in a distrib-
uted environment.
3.2.3 Limitations In future research and extension, additional refinement is desirable and will contribute to improv-ing the capability of DYNASMART-X. These refinements are expected to address the following issues:

14
• It is recognized that an online approach to calibration and to estimation and prediction is likely to considerably improve the operational performance of DYNASMART-X models. However, although DYNASMART-X provides online calibration and consistency correction functions, those functions have not been used to their full potential. Therefore, there is still room for future improvement in this area.
• The DTA system in DYNASMART-X consists of a collection of integrated algorithmic pro-cedures, each of which performs a specific function that complements those performed by the other procedures. The integration of these modules and procedures in a coherent and stable software system capable of being deployed is still an important issue requiring further refine-ment.
• The quality of graphics of DYNASMART-X is still relatively low. • DYNASMART-X is capable of short-term infrastructure and operational changes. However,
its long-term planning application performance remains to be tested. • The collected sensor data reveal that the model does not always provide a very good fit to the
observations. The traffic flow model in DYNASMART is currently based on the modified Greenshields model, which is static in nature. Thus, although the model provides a “best” es-timation of link performance under static assumptions, its effectiveness in matching sensor data degrades somewhat.
• Immediate additional development on an improved route choice model and on assignment logic through adaptive consistency updating is needed to overcome the limitation of the inher-ent route choice model.
• The computation performance of DYNASMART-X remains to be tested, especially when im-plemented on large-scale regional networks.
• DYNASMART-X cannot model detailed traffic maneuvers such as car-following, lane-changing, and weaving operations. Analyzing complex emergency transportation manage-ment strategies is also beyond its present capability.
• DYNASMART-X includes only limited transit and intermodal modeling capabilities.
3.2.4 Applications Since its inception, DYNASMART has been used in successful applications across the country. For example, a study (Huynh et al., 2002) was conducted by adopting a transfer function model (TFM) derived from actual detector data in San Antonio, Texas. The TFM was developed and used in the traffic simulation module of the DYNASMART-X DTA system to update network link speeds. The motivation was to improve the speed estimation method to enable better system consistency with reality in real-time operation. In a recent study, Mahmassani et al., (2004) designed experiments to apply DYNASMART-X to the Irvine (Orange County, California) network and test its estimation and prediction capabilities. The results showed that the online estimation of density, speed, and volume outperformed the corresponding offline estimation because of quasi-continuous real-time information acquisition and updating. In the evaluation of prediction capability, the relative accuracy of the prediction from four consecutive (and partially overlapping) prediction horizons was ascertained. The re-sults confirmed that the short-term predictions were more reliable than the longer-term predic-

15
tions due to the higher reliability of input information (e.g., predicted OD demand). In this study the significance of the rolling horizon approach in online prediction and the capabilities of the current version of DYNASMART-X, were verified.
3.3 VISTA
3.3.1 Approach VISTA is an innovative network-enabled framework that integrates spatio-temporal data and models for a wide range of transportation applications, including planning, engineering, and op-erational ones. VISTA utilizes a mesoscopic simulator called RouteSim and a DTA routine to emulate the be-havior of individual drivers and how they distribute themselves into the transportation network. RouteSim is based on an extension of Daganzo's cell transmission model introduced by Zilias-kopoulos and Lee, (1996). RouteSim is one of the fundamental modules and is used for simula-tion, DTA, optimization, and evaluation. The main enhancements of the extension model over the basic cell transmission model include: • The concept of adjustable-size cells to improve the flexibility, accuracy, and computational
requirements of the model, and • The introduction of a modeling approach to represent signalized intersections. In this model, the road is divided into small cells, and the cells are adjustable in length; bigger cells are used for a mid-section of a long highway segment, and smaller cells are used for inter-sections and interchanges. Vehicles are considered to be moving from one cell to another. Basi-cally, traffic is moved by the simulator in platoons and not in terms of single vehicles. The simu-lator keeps track of the flow in each cell for every time step, and calculates the number of vehi-cles that are transmitted between adjacent cells. Initially, The RouteSim simulator is run with vehicles assigned to the free flow shortest paths. The link travel times resulting from that assignment pattern are then used to calculate a new set of shortest paths, and the simulation is repeated with vehicles assigned to a combination of the paths in the previously calculated path set. At first, the link flows generated by the free flow shortest paths vehicle assignment can be different from the link flows generated by the simula-tion using the new set of calculated paths. However, after certain iterations, the link flows will converge. Thus, iterations continue between the mesoscopic simulation and vehicle assignment until the link flows converge. This procedure accounts for vehicle path choice with changes in traffic conditions (Chang and Ziliaskopoulos, 2003).
3.3.2 Capabilities
The enhanced cell transmission model adopted in VISTA yields a model that can simulate inte-grated freeway and surface street networks with varying degrees of detail. RouteSim assigns

16
every generated vehicle to a path in a fashion similar to that used in the DYNASMART model. An advantage of RouteSim is that the simulation step and the representational detail are adjust-able on the basis of the geometry of the network. Lengthy freeway segments that do not need to be modeled in detail are simulated as aggregate long cells, and their state is updated infrequently. For instance, a two-mile freeway segment without on- and off-ramps could be modeled as a sin-gle cell and be updated every two minutes. Alternatively, near intersections or other points of interest where the evolution of queues, spatio-temporal traffic dynamics, and signalization phases need to be captured in detail, the simulation step can be as small as two seconds, allowing detailed representation of traffic conditions.
The main features of VISTA are summarized as follows. • VISTA can be accessed via a cross-platform Java client or a Web page. The client software
allows the user to perform all basic transportation geographic information system (GIS) type operations such as zooming, displaying multiple layers, and adding intersections, street seg-ments, and ITS devices, as well as running modules, accessing the data warehouse, and re-porting.
• It runs over the network on a cluster of Unix/Linux machines and uses the Internet as an in-formation dissemination medium and a means to access and run algorithms. As a result, VISTA can run very large-scale networks in a reasonable time without large computing de-mands at the user’s end.
• The data warehouse can be simultaneously accessed by many users; each user logs on to the system with his own authorization level and, depending on that level, can see and modify data, run algorithms, create scenarios, run tests, and produce reports.
• It provides iterations between the predicted network state and the network state resulting from drivers’ response to available information as means of generating a convergent information strategy.
• It offers the capability to distinguish between informed and uninformed drivers and recog-nizes multiple user classes in terms of operational performance (e.g., trucks, buses, and pas-senger vehicles), information availability and type, and user behavior rules and responses to information.
• It has the ability to simulate real-time scenarios such as incidents, special events, weather conditions, highway construction activities, and fluctuations in demand and generates guid-ance information and control actions that are robust under these operational conditions.
• It represents traffic processes at signalized junctions and can generate signal timings and phasing plans based on traffic flow information.
• It is capable of optimal path assignment and integrated system management. • It supports deployment of multiple types of DTA capabilities (descriptive vs. normative) to
meet functional needs of different areas, and • It adopts distributed software deployment over a computer network by using flexible and in-
ternally distributed architecture.

17
3.3.3 Limitations VISTA has been successfully implemented and updated in recent years. Nevertheless, it still has limitations that need further improvement. Several limitations of VISTA are summarized as fol-lows. • Due to its inherent model nature, VISTA cannot precisely detect vehicle stops. • VISTA can be less detailed than other models since the vehicle position in VISTA is tracked
only at a cell level and since vehicle speeds are estimated on the basis of transmission time across cell boundaries. The analyst needs to use his/her judgment to determine the specific cell length and time step required to achieve the desired degree of detail.
• VISTA cannot model detailed traffic maneuvers such as car-following, lane-changing, and weaving operations.
• The computational performance of VISTA for very large networks remains to be tested.
3.3.4 Applications VISTA has been continuously updated and is commercially available. It has been successfully implemented across the nation in many case studies. For instance, VISTA has been used to evaluate the impacts and effectiveness of a number of transit signal priority strategies on the Chicago regional network sponsored by the Regional Transportation Authority of Chicago (Zili-askopoulos and Chang, 2004). A recent study was conducted by Wirtz et al., (2005), who used VISTA to test a DTA model as a tool for pre-planning strategies for managing major freeway incidents. Incidents of varying scale and duration were modeled in the northern Chicago highway network, and the impacts of inci-dents and response actions were measured using measures of effectiveness (MOE) defined by the researchers (e.g., lane-mile-hours of highway links at level of service “F”). According to Wirtz et al., (2005), the best response action to a given incident scenario is not necessarily intuitive, and implementing the wrong response can worsen congestion on both the directly impacted freeway and its surrounding highway network. The simulation results showed that a full closure of the freeway causes congestion to spread to parallel alternate routes around the simulated incident. An event at this scale constitutes a major disruption that may warrant handing off traffic control authority from first responders to a corridor or regional TMC. Major arterials accessible from the incident-impacted freeway sometimes need increased capacity to provide access to less con-gested parallel alternate routes during incidents. The simulation model showed that congestion increases with delayed response, underscoring the benefits of pre-planning in speeding the implementation of effective incident response actions. Regression analysis using data generated by the simulation demonstrates that both incident scale and duration are statistically significant predictors of lane-mile-hours of congestion in the zone near the incident and on the expressway.

18
3.4 Model Comparison Before a model is selected from the existing suite of simulation-based DTA models, it is of im-portance to clarify the key desirable features and available resources. In doing so, the user should be aware of the features, strengths, and limitations of available models and exercise judgment in selecting the best model for implementation. To facilitate this process, this study compared the three aforementioned models with respect to available features, application potential, input re-quirements, and model strengths and limitations. The results from the comparison are summa-rized in Table 3-1 for future reference. In summary, the three software packages are among the most well known simulation-based DTA models. Although they vary significantly in many aspects, as shown in Table 3-1, they do share several features of a simulation-based DTA model: • All of the three models utilize a traffic simulator to emulate the traffic conditions. In general,
simulation-based DTA models iterate between a traffic simulation module, a time-dependent shortest path module, and a network loading module. The process terminates when some user-specified convergence criteria are met.
• They all produce the spatio-temporal trajectory of each individual vehicle from its origin to its destination. Each vehicle trajectory includes the departure time from the origin, the arrival time at the destination, the vehicle’s chosen path, and the location of the vehicle at any time of interest along this path.
• All three models account for the modeling of driver behavior to a certain extent. • All three models can incorporate real-time traffic information and can account for ITS provi-
sions. Model election greatly depends on project needs and requirements, resource availability, user preferences, and model features and reliability.

19
Table 3-1: Comparison of DTA simulation models
DynaMIT DYNASMART-X VISTA
Approach
• Heuristic • UE • Mesoscopic, moving queuing seg-
ments • Kalman filtering methodology
• Heuristic • UE and SO • OD assignment • Mesoscopic, moving queuing
segments • Greenshield-type speed-
density relationships
• Exact and heuristic • UE and SO • OD assignment • Mesoscopic • Cell transmission model
Impacts That Can Be Evaluated
• Short-term infrastructure and opera-tional changes
• Limited area coverage
• Short-term, long-term infra-structure and operational changes
• No limit on area coverage
• Short-term, long-term infrastruc-ture and operational changes
• No limit on area coverage
Input Data Required
• Geometry, control, and demand data inputs
• Demand tables need to be arrival and/or departure time based
• Text editor to modify input data
• OD trip table, link traffic flows, traffic control, and detailed ge-ometry
• OD trip table, link traffic flows, traffic control, and detailed ge-ometry
• Networks created through VISTA client or PSQL
• Network of nodes and links • Can define controls, streets,
zones, and VMSs, etc.
Direct Output
• Individual vehicle trajectories • Link occupied by each vehicle at each time step
• Cell occupied by each vehicle at each time step
• Vehicle path and travel time
Ease of Use
• Not so easy to implement and use, still at the research level
• Not so easy to implement and use, still at the research level
• Moderate training required • Software ready • Web based
Typical Time Step
• 60 sec • ≥ 6 sec • 2-6 sec
Quality of Graphics
• Low • Low • Medium
Network Size
• Medium • Medium to large • Large to very large; networks with 40,000 nodes have been demonstrated
• Cannot detect vehicle stops
Calibration Required
• Demand and supply simulators calibration
• Interfaces with the real world • Demand and supply calibration
• Traffic flows and travel time distributions
• Traffic flows and travel time dis-tributions
Strengths • Interfaces with the real world • Demand and supply calibration • Bus movement included • Requires less calibration
• Bus movement included • Requires less calibration
• Bus movement included • Requires less calibration
Weak-nesses
• Computation performance remains to be tested
• Interface is not very user friendly • Bus/transit/background not mod-
eled • Travel time is the only link imped-
ance modeled
• Computation performance remains to be tested
• Not modular • Mode and departure time as-
sumed given
• Cannot precisely detect vehicle stops
• Less emphasis on driver behavior

20
4.0 METHODOLOGY
4.1 Approach
The overall approach in this study was to utilize the DTA capabilities to support decision making for incident and emergency management. Static assignment methods are based on average daily traffic and fail to capture the dynamic process of an incident and emergency response. DTA models, on the other hand, are particularly appropriate for studying short-term planning applica-tions such as evaluating various incident management and emergency management programs. In this study, a simulation-based DTA model was employed to assess the impacts of designed inci-dent and emergency scenarios and to evaluate the effectiveness of candidate incident and emer-gency management plans, as well as the impacts of different traffic operation and control strate-gies, for the analysis period. Furthermore, the impacts of proving information via variable mes-sage signs and signal preemption on transportation network operations were evaluated. The ac-complishment of the research goals consisted of the following tasks.
1. Selection of the study test bed and identification of appropriate incident and emergency sites.
2. Selection of an appropriate simulation-based DTA model. 3. Identification of data needs and data sources. 4. Definition of study boundaries and development of the study test bed. 5. Development of candidate incident and emergency scenarios and corresponding response
plans, and 6. Performance of simulation runs and analysis of the results.
4.2 Selection of Test Bed and Incident and Emergency Sites
The test bed selected for the case study was the Birmingham, Alabama regional traffic network that is comprised of most major freeway and arterial facilities serving the Birmingham metro-politan region. A map of the network modeled is depicted in Figure 4-1.

21
Figure 4-1: Map of the study network
A major north-south facility in the Birmingham region is the I-65 freeway, an interstate highway of great importance to the mobility of Alabamians but also a north-south route of national sig-nificance for the movement of people and goods. Extending as far north as Lake Michigan, I-65 connects Birmingham with Nashville (Tennessee) and Indianapolis (Indiana) to the north and with Montgomery and Mobile (Alabama) to the south. On the other hand, I-459 and I-20/59 fa-cilities connect Birmingham to Tuscaloosa (Alabama) to the west and Anniston (Alabama) and Atlanta (Georgia) to the east. The I-459 and I-20/59 routes form a loop around the city of Bir-mingham and intersect with other important transportation facilities, including I-65, US11, US31, US280, US75, US79, and US78 that are also coded in the simulation test bed, along with selected arterials of major importance.
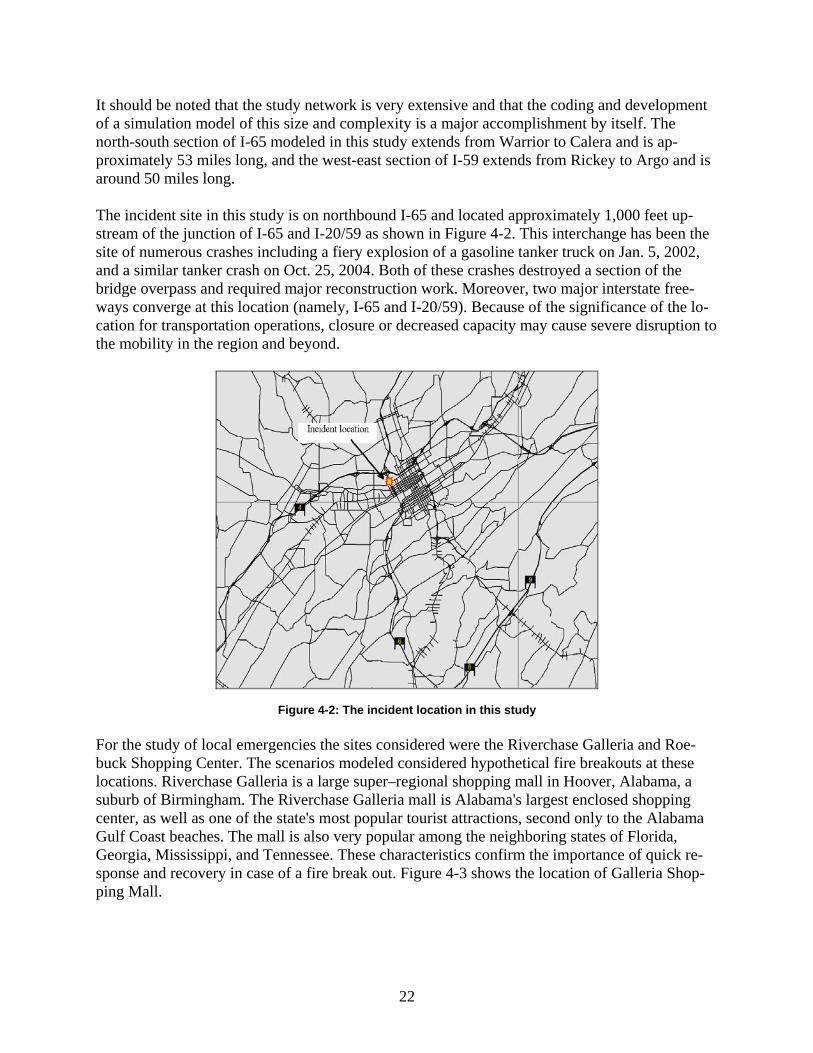
22
It should be noted that the study network is very extensive and that the coding and development of a simulation model of this size and complexity is a major accomplishment by itself. The north-south section of I-65 modeled in this study extends from Warrior to Calera and is ap-proximately 53 miles long, and the west-east section of I-59 extends from Rickey to Argo and is around 50 miles long. The incident site in this study is on northbound I-65 and located approximately 1,000 feet up-stream of the junction of I-65 and I-20/59 as shown in Figure 4-2. This interchange has been the site of numerous crashes including a fiery explosion of a gasoline tanker truck on Jan. 5, 2002, and a similar tanker crash on Oct. 25, 2004. Both of these crashes destroyed a section of the bridge overpass and required major reconstruction work. Moreover, two major interstate free-ways converge at this location (namely, I-65 and I-20/59). Because of the significance of the lo-cation for transportation operations, closure or decreased capacity may cause severe disruption to the mobility in the region and beyond.
Figure 4-2: The incident location in this study For the study of local emergencies the sites considered were the Riverchase Galleria and Roe-buck Shopping Center. The scenarios modeled considered hypothetical fire breakouts at these locations. Riverchase Galleria is a large super–regional shopping mall in Hoover, Alabama, a suburb of Birmingham. The Riverchase Galleria mall is Alabama's largest enclosed shopping center, as well as one of the state's most popular tourist attractions, second only to the Alabama Gulf Coast beaches. The mall is also very popular among the neighboring states of Florida, Georgia, Mississippi, and Tennessee. These characteristics confirm the importance of quick re-sponse and recovery in case of a fire break out. Figure 4-3 shows the location of Galleria Shop-ping Mall.

23
Figure 4-3: The location of Riverchase Galleria Shopping Mall The second site considered was in the vicinity of the Roebuck Center in Birmingham, Alabama. The Roebuck Center is located at US-11, just southwest of the interchange of I-59 with Parkway East and Gadsden Highways. This area features a concentration of retailers and service providers seeking proximity to the surrounding residential neighborhoods and ease of access from the road network that converges at the interstate interchange. The average daily traffic at this location is 48,000 vehicles. Figure 4-4 shows the location of the Roebuck Shopping Center.

24
Figure 4-4: The location of Roebuck Shopping Center
4.3 Simulation Model Selection
4.3.1 Model Selection Process The investigation and comparison of DTA models in Section 3.0 provided guidance toward the selection of a DTA model from the existing suite of simulation-based DTA models. Considera-tion of the desirable features for the study tasks, review of the candidate model capabilities and limitations, and model availability issues led to the selection of VISTA as the simulation tool for this study. The approach and main features of VISTA were summarized in Section 3.3. In the following section, some of the properties that make this model a particularly attractive one for implementa-tion in the context of this study are discussed in detail. Moreover, VISTA input and output han-dling, as well as validation issues, are addressed.
4.3.2 Considerations of Model Level of Detail
Simulation models are generally categorized as macroscopic, mesoscopic, and microscopic on the basis of the analysis detail they provide. Macroscopic models treat traffic as a high level of aggregation as flows. The flows are often defined in differential equations, which are similar to those utilized to describe flows of fluids or gases. Microscopic models, on the other hand, de-scribe traffic at a detailed level on a vehicle-by-vehicle basis. Mesoscopic models are intermedi-ate between macroscopic and microscopic models. Such models typically describe traffic entities

25
at high levels of detail but characterize their behaviors and interactions at a lower levels of detail. Each model type has its strengths and weaknesses; thus, selection of the most suitable model usually depends on the type of application (Burghout, 2005). In the case of this study, the main required model capabilities included the ability to simulate the study network, the ability to realistically model incident and emergency conditions, the ability to model response of individual drivers and emergency vehicles to incident conditions, and the abil-ity to model variable message signs and signal preemption strategies. Furthermore, the model needed to simulate networks large enough to contain the direct effects of incidents/emergencies and the pre-planned management strategies and also the indirectly impacted areas. Although macroscopic models have the ability to model large networks efficiently, they typically lack the level of detail needed to model individual driver behavior when an incident occurs. In contrast, microscopic models can model incidents in great detail, but they require careful coding of all network details. Thus, microscopic models are subject to a high level of sensitivity to cod-ing errors and have limitations related to the computational ability and network size. Mesoscopic models fill in the gap by modeling the route choice of individual drivers and other important driver behaviors but limiting the level of detail when modeling driver interactions with the infra-structure and other drivers. The model selected for this study was VISTA, a mesoscopic simulation-based DTA model. VISTA’s mesoscopic nature, along with other features, makes it an appropriate simulation tool for studying incident and emergency management strategies and operations, as well as for achieving the overall goals and objectives of this study.
4.3.3 Model Validation To date, several agencies have successfully used VISTA for a variety of planning and opera-tional applications. Application examples include: • VMS and ramp metering evaluation at New Jersey I-80 Priority Corridor (New Jersey De-
partment of Transportation) • Evaluation of the impacts and effectiveness of various transit signal priority strategies on the
Chicago region trip planning as part of the Chicago Transit Signal Priority project (Regional Transportation Authority)
• Prediction of transportation impacts of flooding nationwide in the Transportation Impact of Flooding study (U.S. Army Corps of Engineers)
• Evaluation of trucking policies and interaction of trucks and cars for the Chicago intermodal freight project supported by the National Science Foundation, the Chicago Area Transporta-tion Study (CATS) and the Illinois Department of Transportation
• Evaluation of multi-agency cooperation in emergency evacuation scenarios on Lake-Cook Road, Chicago for the Evacuation Strategies on Lake-Cook Road project (CATS and Lake-Cook County, Illinois)
• Traffic management strategies for the 2004 Athens Olympics as part of the Simulation/DTA study of the City of Athens, Greece network

26
• Large-scale assignment simulations for evaluation of VMS and other technologies as part of the Simulation/DTA study of Columbus, Ohio (Ohio Department of Transportation), and
• Integration of VISTA with the Environmental Protection Agency (EPA) Mobile 6.2 Model as part of the Air Quality and Waste Transfer Stations in the South Bronx Area project (funded by the EPA/New York Metropolitan Transportation Council).
The previous application experience and validation efforts demonstrated and enhanced the reli-ability of VISTA. For further model verification, traffic counts and travel time data can be used to validate the model for local conditions. In this study, hourly volumes for interstates and other major facilities were obtained from the Alabama Department of Transportation (ALDOT) and the City of Bir-mingham over six-hour periods (i.e., 3:00 pm to 9:00 pm) and were compared with the simula-tion results generated by the base case. For comparison purposes, the observed and simulated results were plotted and an ideal reference line was drawn diagonally, as shown in Figure 4.5. The graph showed that further calibration of OD demand was desirable to provide a closer match with traffic counts.
Figure 4-5: Observed counts Vs simulation counts For further model verification, limited field travel time data were also collected by driving through selected routes. The observed travel time data were then compared with the simulation results generated by VISTA in the base case to ensure compatibility. The relative percentage dif-ference [i.e., (Estimated - Observed) * 100/Observed)] for both the volume and travel time was found to fall within ± 20 percent, which was acceptable for this slope.

27
4.4 Data Needs and Data Sources
4.4.1 Input Data Needs in VISTA Model inputs are data to create the simulation model for experimentation and typically include geometric, control, and demand data. For large transportation networks, such as the Birmingham regional network, data collection, manipulation, and coding were very time consuming and tedi-ous tasks. 4.4.1.1 Network data. Although VISTA can be accessed through either the Web interface or the client interface, net-works cannot be created in VISTA through the Web interface. They must be created through ei-ther the client interface or Postgre Structured Query Language (PSQL). PSQL is a terminal-based front end to PostgreSQL, which is an open source software object relational database man-agement system. VISTA network data are in a node-link format and thus the user can define a network with nodes and links (Ziliaskopoulos and Barrett, 2005). As an alternative, the user can also directly import existing network data from other software such as TRANPLAN and CORSIM by use of conversion tools provided. This approach simplifies the network develop-ment process and increases efficiency. In this study, the basic network was imported directly from the regional TRANPLAN network provided by the Regional Planning Commission of Greater Birmingham (RPCGB). Refinement of the network was conducted manually after the importation. The network covers the whole of Jefferson County area and a small part of three adjacent counties (namely, Shelby, St. Clair, and Blount). The network is very extensive and includes 5,005 nodes and 11,014 links. The huge coverage is beneficial since it allows more trips to be captured from their origins to their destina-tions in totality. Otherwise, the assignment becomes constrained since it may miss some impor-tant routes that could have been chosen by the drivers. 4.4.1.2 Demand data. The demand data in VISTA are in the format of OD trip matrices. The model used in VISTA is dynamic in nature, but dynamic demand information is not always available in practice. For this reason, VISTA allows users to input either dynamic demand or static demand. Dynamic OD trip matrices are departure time based, and the number of seconds after the beginning of the simula-tion at which the vehicle enters the network is given. In contrast, static demand is a flat value for the total number of vehicles going from one zone/node to another for a given period. For exam-ple, the user may enter the number of vehicles moving in a 24-hour period. In this study, OD trip tables were first extracted from TRANPLAN files and inputted into VISTA. The data from TRANPLAN included the origin, destination, vehicle type, and number of vehicles moving in a 24-hour period. A total of 1,933,781 passenger vehicles and 109 transit vehicles were loaded into the network, which generated 1,933,890 trips. At first, the demand data

28
were static, with flat numbers for a 24-hour period. A module called "Demand Profiler" was then used to create demand data that better represented actual demand fluctuations within the 24-hour period. This module profiled the demand on the basis of a curve for the simulation period. The curve was defined by using traffic counts by the hour of day obtained from demand profiles pro-vided by ALDOT. For practical reasons, a sub network and its demand were extracted from the basic 24-hour network to analyze the six evening hours (i.e., 3:00 pm to 9:00 pm). This approach reduced significantly the computational requirements while still meeting the needs for this pro-ject. 4.4.1.3 Control data. In VISTA control data include traffic signals, signs (i.e., stop and yield), and ramp meters. Signal preemption options are also available. Control data can be inputted from the client interface. Ide-ally, detailed signal definition data such as signal locations and signal timing plans should be available for all intersections in the created model. In reality, these data may be very difficult to obtain, especially for large-scale networks. Under such circumstances, VISTA can assign opti-mal signal timing plans based on the flows generated by the simulation for those intersections where signal data are not available. In this study, detailed current signal data for major facilities and the intersections near the inci-dent location were obtained from ALDOT and the City of Birmingham and were coded into the network in great detail. However, there were still many intersections for which detailed signal data was not available. To fill in this gap, the intersection signal optimization module provided in VISTA was utilized to generate signal timing plans while using algorithms to calculate cycle and green phase times. The signal timings were set to allow traffic volumes on all approaches to pass through the intersections. As a result, in many instances original timing plans were replaced by optimized timings to improve the distribution of traffic in the network.
4.4.2 Data Sources One of the main features of VISTA is the ability to integrate spatio-temporal data and models for a wide range of transportation applications: planning, engineering, and operational. Thus, the coding process can be less time consuming because the user can make the best use of existing databases. VISTA provides several conversion tools to import data directly from other simula-tion software packages (such as TRANPLAN and CORSIM). In this project, the integration of data from TRANPLAN and CORSIM into VISTA was successfully achieved. This is very prom-ising since TRANPLAN and CORSIM have been widely used in the industry. Numerous pro-jects have been done with these software packages. With the conversion tools provided, the data from these tools can be coded into VISTA with less effort. As the study network was very extensive, organizations in various jurisdictions were contacted to solicit data inputs to address the needs of the data collection process. The main data sources for this study included RPCGB, ALDOT, the City of Birmingham, and several consulting compa-nies that were involved in recent data collection efforts in support of other local projects.
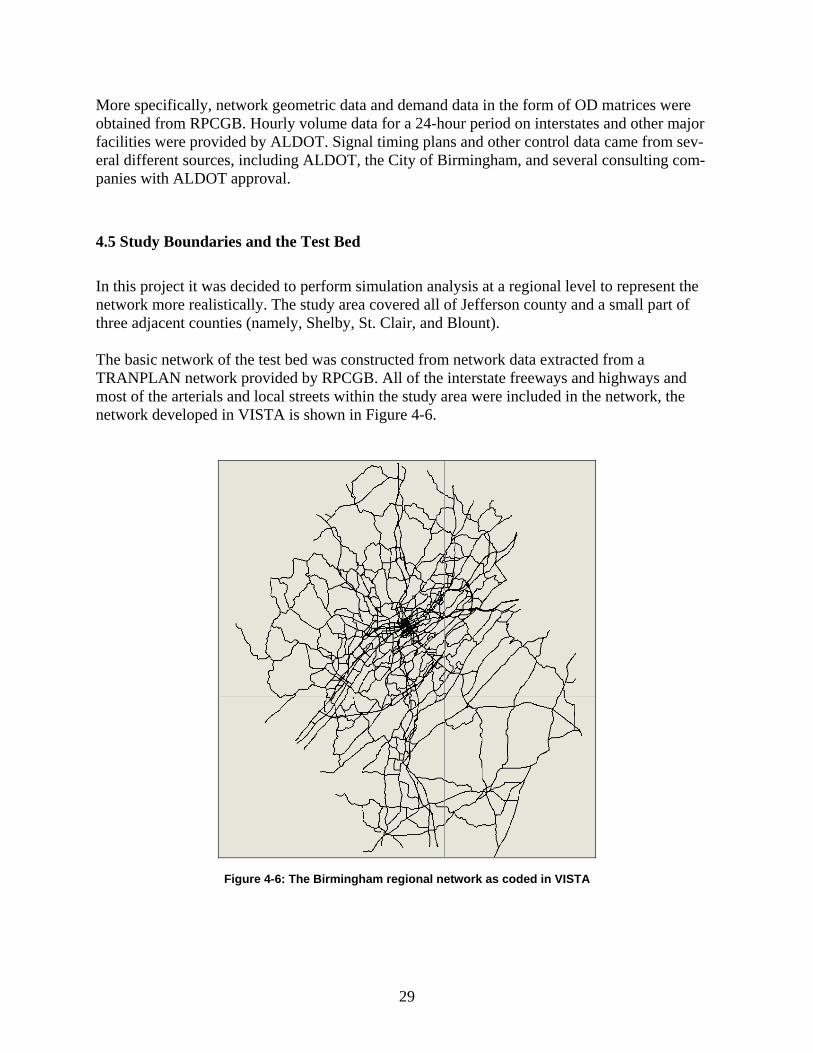
29
More specifically, network geometric data and demand data in the form of OD matrices were obtained from RPCGB. Hourly volume data for a 24-hour period on interstates and other major facilities were provided by ALDOT. Signal timing plans and other control data came from sev-eral different sources, including ALDOT, the City of Birmingham, and several consulting com-panies with ALDOT approval.
4.5 Study Boundaries and the Test Bed In this project it was decided to perform simulation analysis at a regional level to represent the network more realistically. The study area covered all of Jefferson county and a small part of three adjacent counties (namely, Shelby, St. Clair, and Blount). The basic network of the test bed was constructed from network data extracted from a TRANPLAN network provided by RPCGB. All of the interstate freeways and highways and most of the arterials and local streets within the study area were included in the network, the network developed in VISTA is shown in Figure 4-6.
Figure 4-6: The Birmingham regional network as coded in VISTA

30
To save computational time, a sub-network of the Birmingham regional network was partitioned from the base network. The simulation was conducted on this sub-network to demonstrate the DTA capabilities to evaluate the impact of various incidents and emergencies and management strategies. Figure 4-7 presents the sub-network used in the analysis.
Figure 4-7: The Sub-network of the Birmingham regional network
4.6 Other Considerations
4.6.1 VMS Designs One of the objectives of this study was to analyze the potential impact of providing information through ITS technologies on traffic operations under incident conditions. In this study, the im-plementation of a VMS was the means for information dissemination. In practice, VMSs are typically located at key points on highways and connecting routes to inform travelers about traf-fic conditions and provide recommendations on appropriate actions. Traffic information coordi-nators use data obtained from computers to assess the volume and speed of traffic on different sections of highways and immediately identify trouble spots and transmit appropriate messages to motorists via VMS. The minimum amount of information provided by VMS includes a state-ment of the problem. An action statement may be also provided to further assist drivers in opti-mizing their travel. There are four general categories of incident conditions for which VMSs can convey information to motorists:

31
• Non-recurring events (accidents), • Construction, • Environmental conditions, and • Special events. Information conveyed through a VMS message can either be prescriptive with recommended routes, or descriptive with travel time/delay information on certain links or paths. During the simulation, whenever a vehicle passed over a link that has a VMS message, a driver responded to the VMS massage with certain probabilities. In this study, VMSs were utilized to convey non-recurring event information to drivers. Simula-tions were performed to evaluate the impact of employing VMS to a selected location. Figures 4-8 and 4-9 show the locations of two VMSs considered in the study. One was on northbound I-65, approximately 1,000 feet upstream of University Boulevard, and the other was on northbound I-65 around 500 feet upstream of US Highway 11.
The information conveyed by VMSs in this study was prescriptive with recommended routes. VISTA allows the user to specify a compliance rate, which reflects the probability that drivers will follow the VMS recommendation. VISTA then generates a specific VMS report for analyz-ing each VMS design.
Figure 4-8: The VMS location for design 1

32
Figure 4-9: The VMS location for design 2
4.6.2 Model Outputs for Incident Scenarios The outputs generated by VISTA can be link specific, aggregated for multiple links (such as a group of links connecting a specific OD pair), and network wide. Examples of available outputs or performance measures generated by the software include the cell occupied by each vehicle at each time step, vehicle path for each individual vehicle, and various MOEs such as travel times, delays, and emissions. The main MOEs considered in this study included travel time, delay, and vehicle miles traveled (VMT). The outputs are mainly generated as pre-formatted reports that are currently available in three formats (i.e., PDF file, Excel file, or Web format). The pre-formatted report results must be viewed in the Web interface. Another format of outputs generated by VISTA that can be viewed through the client interface is link specific plots. For instance, VISTA provides a link travel time plot of the average vehicle travel time versus the simulation time for a link of interest.
4.6.3 Preemption Design Signal preemption is used to shorten the travel times of emergency and transit vehicles by adjust-ing signal timing plans to benefit the selected movements or by having signal phases switch

33
when a preempted vehicle approaches. Thus, signal preemption can be use to decrease delays for emergency and transit vehicles at traffic signals. The signal preemption strategy is varied by time of day, corridor configuration, and need for im-plementation. During peak hours, when levels of congestion are high, the signal preemption may be less helpful at improving emergency response and can result in increased delays to general traffic. There is currently no accepted standard for signal preemption corridor selection, and re-search continues in the determination of which traffic conditions are most conducive to success-ful signal preemption implementation. Typically, signal preemption is implemented on busy arte-rials with the understanding that an excessively high level of congestion and intersection queuing will overwhelm any possible travel time benefits of signal preemption (Ziliaskopoulos and Chang, 2004). The signal preemption non-recovery strategy (used in this study) provides phase extension or truncation upon detection of emergency or transit vehicles. Specifically, non-recovery strategy recovers from phase extension by reducing the time allotted to each of the remaining phases in the cycle such that regular timing and coordination with surrounding signals is regained by the end of the cycle. Following a phase truncation, the truncation time is added to the priority phase, such that the priority phase is held until its regular phase change time. Coordination with sur-rounding signals is regained by the end of the priority phase. A weakness of this strategy is that non-priority phases experience a reduced amount of green time. Under an extension, the green phase is held until the emergency vehicle traverses the intersec-tion. The regular signal timing plan is then recovered by shortening each of the non-priority phases proportionally throughout the following cycle. As such, non-priority phases experience a reduced amount of green time; however, the regular timing plan is recovered within one cycle following the extension, as shown in Figure 4-10. Alternatively, the non-priority phase is truncated, and the priority phase is invoked and held until its regularly scheduled phase change. As a result, the non-priority phase experiences a reduced amount of green time. The original timing plan and coordination with other signals is recovered immediately after the priority phase is served as can be seen in Figure 4.10.
4.6.4 Model Output for Emergency Scenarios
The main MOE considered in the analysis of emergency operations include emergency or transit vehicle travel time, average travel time, average speed, delay, and VMT.
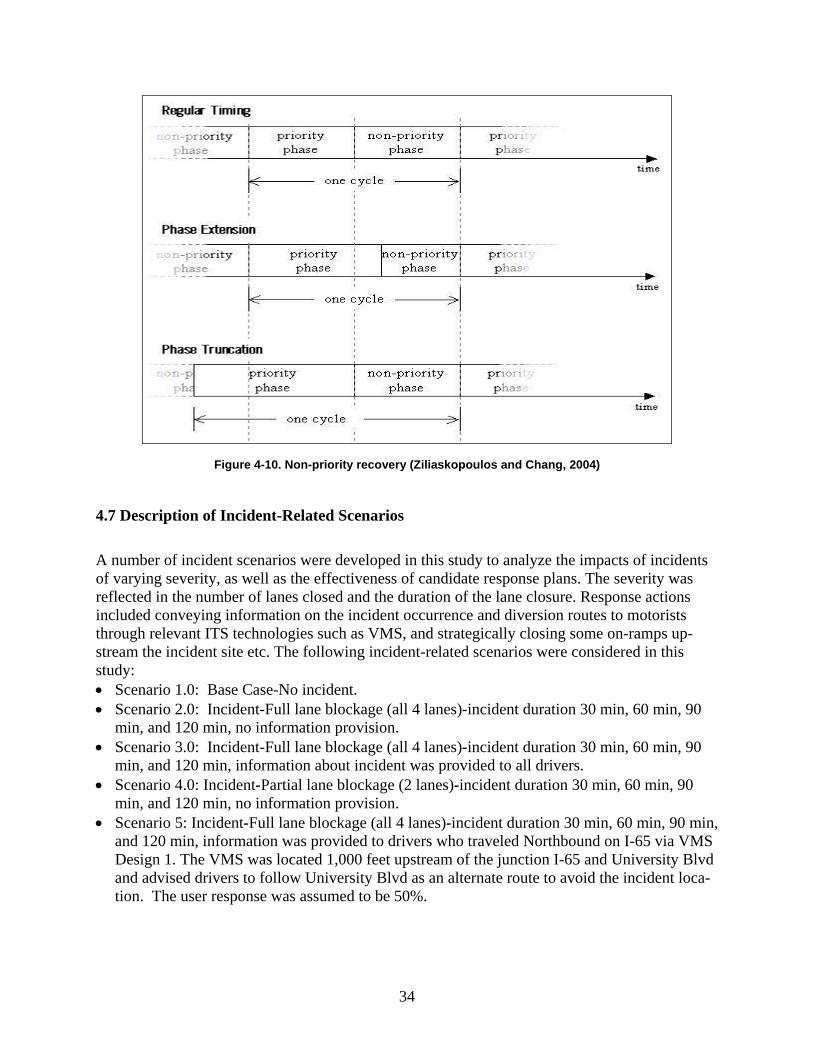
34
Figure 4-10. Non-priority recovery (Ziliaskopoulos and Chang, 2004)
4.7 Description of Incident-Related Scenarios
A number of incident scenarios were developed in this study to analyze the impacts of incidents of varying severity, as well as the effectiveness of candidate response plans. The severity was reflected in the number of lanes closed and the duration of the lane closure. Response actions included conveying information on the incident occurrence and diversion routes to motorists through relevant ITS technologies such as VMS, and strategically closing some on-ramps up-stream the incident site etc. The following incident-related scenarios were considered in this study: • Scenario 1.0: Base Case-No incident. • Scenario 2.0: Incident-Full lane blockage (all 4 lanes)-incident duration 30 min, 60 min, 90
min, and 120 min, no information provision. • Scenario 3.0: Incident-Full lane blockage (all 4 lanes)-incident duration 30 min, 60 min, 90
min, and 120 min, information about incident was provided to all drivers. • Scenario 4.0: Incident-Partial lane blockage (2 lanes)-incident duration 30 min, 60 min, 90
min, and 120 min, no information provision. • Scenario 5: Incident-Full lane blockage (all 4 lanes)-incident duration 30 min, 60 min, 90 min,
and 120 min, information was provided to drivers who traveled Northbound on I-65 via VMS Design 1. The VMS was located 1,000 feet upstream of the junction I-65 and University Blvd and advised drivers to follow University Blvd as an alternate route to avoid the incident loca-tion. The user response was assumed to be 50%.

35
• Scenario 6: Incident-Full lane blockage (all 4 lanes)-incident duration 30 min, 60 min, 90 min, and 120 min, information was provided to drivers who traveled Northbound on I-65 via VMS Design 2. Drivers were directed to follow US-11 to avoid the incident location and reroute themselves through the designed alternate route. The user response was assumed to be 50%.
A summary of the study scenarios is provided in Table 4-1, and some additional details for each scenario may be found in the following paragraph.
Table 4-1: Summary of scenarios
Scenario
Lanes Blocked
Incident Duration
(min)
Information Provision
% of Driver
Response/Rerouting 1 0 0 No No 2 4 30, 60, 90, 120 No No 3 4 30, 60, 90, 120 All All 4 2 30, 60, 90, 120 No No 5 4 30, 60, 90, 120 VMS Design 1 On I-65 NB, Follow Univ Blvd-50% 6 4 30, 60, 90, 120 VMS Design 2 On I-65 NB, Follow US11-50%
4.7.1 Scenario 1: Base Case Scenario 1 described network operations under normal (no-incident) conditions and provided the baseline for comparisons. In this study, a peak demand period lasting from 3:00 pm to 9:00 pm was chosen as the analysis period. In order to establish the base case for this period, a set of equi-librium travel times and the planning OD matrix for the period were obtained through the proc-ess mentioned in sub-section 4.4.1.2.
4.7.2 Scenario 2: Incident Conditions-Full Lane Blockage-No Information Provision This scenario was designed to conduct a sensitivity analysis by varying the incident duration in 30-min increments under a full four-lane blockage condition and observing the relative changes in model response. The objective of the sensitivity analysis in this study was to illustrate the im-pact of the incident on travel times and delays under different incident durations. The scenario assumed the occurrence of a traffic incident on northbound I-65 about 1,000 feet upstream of the junction of I-65 and I-20/59. The model was run with a full four-lane blockage on link 5994 starting at 4:00 pm and lasting for 30 min, 60 min, 90 min, and 120 min. One on-ramp upstream of the incident on I-65 was also closed. No information about the incident was provided to drivers; thus, users were expected to follow their habitual paths. Testing and analyz-ing the model outputs from this scenario was beneficial since these procedures were very useful for studying and designing response plans in a timely and cost effective manner.

36
4.7.3 Scenario 3: Incident Conditions-Full Lane Blockage-Information Provision to all Users
This scenario was designed to conduct a sensitivity analysis by varying the incident duration in 30-min increments under a full four-lane blockage condition and observing the relative changes in model response. Similarly to Scenario 2, (section 4.7.2) Scenario 3 assumed the occurrence of a traffic incident on northbound I-65 about 1,000 feet upstream of the junction of I-65 and I-20/59. While all other assumptions remained the same, in Scenario 3 all users were informed about the incident location, thus they could optimize their travel time in response to the informa-tion available, should they choose so. It is noted that in practice only a percentage of travelers would have good knowledge about the incident and which route to choose such that they would benefit from it.
4.7.4 Scenario 4. Incident Conditions-Two Lane Blockage-No Information Provision This scenario was similar to Scenario 2, except that a less severe incident was considered, result-ing in blockage of two traffic lanes instead of four. Moreover, no on-ramp closures due to the incident were considered this time. All other incident conditions remained the same. The objec-tive of this scenario was to study the impact of the accident on traffic conditions and operations under partial lane closure on the basis of selected MOEs (i.e. travel time and delay).
4.7.5 Scenario 5: Incident Conditions-Full Lane Blockage-Information Provision- VMS De-sign 1 before Junction of I-65 and University Boulevard -User Response 50% The hypothetical incident conditions in this case were identical to those of Scenario 2 with full, four-lane blockage of varying durations starting at 4:00 pm. On the other hand, in this scenario information provision was available to drivers, and a response action was taken. More specifi-cally, in response to the incident, the travel times of designed diversion route was provided to drivers through VMS Design 1 strategically located upstream of decision points. The diversion route for the response plan is illustrated in Figure 4-11. As can be seen, major alternative route include University Boulevard, US-31/280 and I-20/59. Moreover, the impact of driver compliance to rerouting information based on the selected ap-proach was analyzed in this study by assuming user response of 50 percent. This scenario was designed to study the impacts of information provision and user compliance with diversion recommendations on traffic operations under incident conditions. Moreover, this scenario tested the effectiveness of incident management response plans in improving the traffic conditions during severe mobility disruption on a major facility.

37
Figure 4-11: Scenario 5-Directly impacted and alternative route using University Blvd
4.7.6 Scenario 6: Incident Conditions-Full Lane Blockage-Information Provision-VMS De-sign 2 before Junction of I-65 and US-11 -User Response 50% The hypothetical incident conditions in this case were identical to those of Scenario 2 with full, four-lane blockage of varying durations starting at 4:00 pm. On the other hand, in this scenario information about alternate routes became available to drivers and, as a result, a response action was taken by 50 percent of the users. More specifically, in response to the incident, the travel times of designed diversion route was provided to drivers through VMS Design 2 strategically located upstream of decision points. The diversion route for the response plan is illustrated in Figure 4-12 and includes diversion through US-11, US 31/280 and I-20/59. VMS Design 2 was correspondingly employed before the junction of I-65 and US-11. This scenario was designed to study the impacts of information provision and user compliance with diversion recommendations on traffic operations under incident conditions. Moreover, this scenario tested the effectiveness of incident management response plans in improving the traffic conditions during severe mobility disruption on a major facility and provided an opportunity for comparisons with VMS Design 1 (Scenario 5).

38
Figure 4-12: Scenario 6-Directly impacted and alternative route using US Highway 11
4.8 Description of Emergency Scenarios Emergency scenarios were developed in this study to represent an emergency conditions related to a fire breakout at the Riverchase Galleria Mall and Roebuck Shopping Center assumed to oc-cur at 6:00 PM. Scenario A Under Scenario A, an emergency in the Riverchase Galleria was considered, along with a quick emergency response plan that involved the use of the transit vehicles to evacuate the people from the site. This response plan could be especially helpful for the evacuation of people who become stranded at the site and need to be evacuated. Transit vehicles involved in the evacuation were assumed to follow routes US-31, I-65 and I-459 as shown in Figure 4-13. To respond quickly to the evacuation needs, the regular bus service was temporary halted at the central station and buses were directed toward the affected site for the quick evacuation of those in need. It was as-sumed that the first transit bus involved in the evacuation departed from central station at 6:30 PM traveling south toward the Riverchase Galleria Mall. A total of 12 buses were used in the evacuation with a running frequency of 10 minutes. During the analysis, particular attention was given to the travel time of the emergency/transit vehicles during the evacuation. Then, an emergency at the Roebuck Shopping Center was simulated and a response plan was prepared for transporting the non-seriously injured victims from the site to the University of Ala-

39
Figure 4-13: Emergency route US-31 bama at Birmingham (UAB) Hospital for observation and assistance using transit and emergency vehicles. The transit evacuation vehicles in this study followed route US-11 and Messer Airport Highway as shown in Figure 4-14. The evacuation of fire victims from Roebuck Shopping Cen-ter also started 6.30 PM and involved 8 buses with the running frequencies of 15 minutes. Scenario B Scenario B simulated similar emergency conditions and emergency response actions as detailed in Scenario A above. The only difference was that transit signal preemption was implemented at selected signal locations along the transit evacuation route to further reduce the delay of transit and emergency vehicles. The impacts of the signal preemption along the route corridor and at system wide level were analyzed. Summery of Scenarios In summary, the following emergency-related scenarios were considered in this study: • Scenario A: Emergency at Riverchase Galleria/Roebuck Shopping Center. Base Case-No
Signal Preemption on the emergency routes US-31 and US-11. • Scenario B: Emergency at Riverchase Galleria/Roebuck Shopping Center-Signal Preemption
used on the emergency routes US-31 and US-11. Details on the results from the analysis are presented in the next section of this report.

40
Figure 4.14: Emergency route US-11

41
5.0 RESULTS AND ANALYSIS OF INCIDENT MANAGEMENT SCENARIOS
5.1 Scenario 1: Base Case This subsection summarizes the results for the base case, i.e., incident free conditions, as the baseline for comparisons. The travel times, delays, and other MOEs generated by the simulation and DTA runs are presented with respect to the whole network, as well as to selected critical routes (e.g., the directly impacted upstream route and potential alternative routes that may be used for diversion). Table 5-1 provides network wide results for the base case scenario under the evening period conditions. The table shows the total number of vehicles loaded in the network and the experi-enced travel times, delays, and VMT. STD represents Standard Deviation.
Table 5-1: Base case system wide results-scenario 1 Loaded Vehicles
Total Travel Time (hr)
Average Travel Time (min)
STD (min)
VMT (miles)
Delay (hr)
Average Delay (min/veh)
Delay STD (min)
512,025 129,783 15.21 16.23 4,373,062 35,500 4.16 13.17
Table 5-2 presents the results on the directly impacted route under incident-free conditions. The directly impacted route selected in this study is a 2.64-mile-long segment of I-65 immediately upstream of the hypothetical incident site. Figures 4.11 and 4.12 present maps for the directly impacted route. In VISTA, the directly impacted route is comprised of links 2419, 4561, 10307, 12299, 5629, 5797 and 5994. As shown in Table 5-2, under no incident conditions, there is very little delay on this freeway segment, and vehicles can travel with the free flow speed.
Table 5-2: Results for the directly impacted route-scenario 1
Path Path Length (mile) Free Flow Travel Time (min)
Simulation Travel Time (min) Total Delay (min) Average Delay
(min/mile)
Links 2419, 4561, 10307, 12299,
5629, 5797, 5994 2.64 2.7 2.72 0.02 0.01
Unlike many previous studies that only evaluated the impact of incidents on the directly im-pacted route, this study also examined the incident impact on routes in the vicinity of the incident site. The corresponding results for one such route are summarized in Table 5-3. This route is a 1.84-mile-long segment of US 31/280 that extends from University Boulevard to the interchange of I-20/59 and US 31/280. Figure 4-11 provides a map for the route, and the links included in this route are shown in Table 5-3. This segment is considered as a potential alternative route un-der the incident assumption in this study. As illustrated in Table 5-3, under incident free condi-tions, there is no delay along this route, and vehicles can travel with free flow speed on this seg-ment.

42
Table 5-3: Results for the Potential Alternative Route-Scenario 1
Path Path Length (mile)
Free Flow Travel Time (min)
Simulation Travel Time (min) Total Delay (min) Average Delay
(min/mile)
Links 5358, 5360, 5568, 5573, 5719, 18844, 18845,
4302, 11725 1.84 2.3 2.32 0.02 0.01
5.2 Scenario 2: Incident Conditions-Full Lane Blockage-No Information Provision The results generated for this scenario show the impacts of incidents of varying durations on traf-fic operations both network wide and along selected routes. The incident occurred on link 5994, which is a 1,848-feet-long four-lane interstate segment with a free flow speed of 65 mph. The incident results in full closure of the freeway for the simulated incident durations. Along with the freeway segment closure, the one lane on-ramp upstream of the incident on I-65 was also closed on link 5996. No information was made available to drivers. Table 5-4 provides an overview of the incident closure, including details on capacity reduction, incident start time, and durations.
Table 5-4: Incident Closure Overview-Scenario 2
Link ID Length (ft) Speed (mph) Capacity (vphpl) Start Time Duration (min) Lanes Closed
Available Capacity
5994 1, 848 65 2,300 0400:00 pm 30, 60, 90, 120 4 0
5996 528 40 1,700 0400:00 pm 30, 60, 90, 120 1 0
The RouteSim mesoscopic traffic simulator was executed on the basis of the paths found by the DTA model of the base case. Table 5-5 presents network wide results for each incident duration. As expected, average travel times and incident-related delays increased with the increase in inci-dent duration. Overall, it was observed that the network wide travel times and delays were sensi-tive to the incident duration. It should be noted that when the incident duration was less than 30 min, the network performs remarkably close to the base case condition. In other words, the im-pact of a minor incident was localized and had a minimal effect on overall network performance. However, for more persistent incidents (i.e., those lasting for more than half an hour), there was a substantial increase in both network travel times and delays observed. Compared with the base case results (Table 5-1), the travel time and delays observed during the 60, 90 and 120 min incident durations under Scenario 2 increased considerably. A decrease in VMT (miles) was observed for the 120 min incident duration case due to non-exited vehicles, i.e., vehicles that entered but not exited the network. In such cases the simulator should be al-lowed to run for a few more hours to capture the impact of the incident for the entirety of the trips from their origin to their destination. Ideally, DTA should be executed for a full 24-hour time period to capture all daily trips in their entirety. This finding is interesting since most previ-ous studies simply assumed that the impact of an incident in terms of system wide performance measures could be ignored.
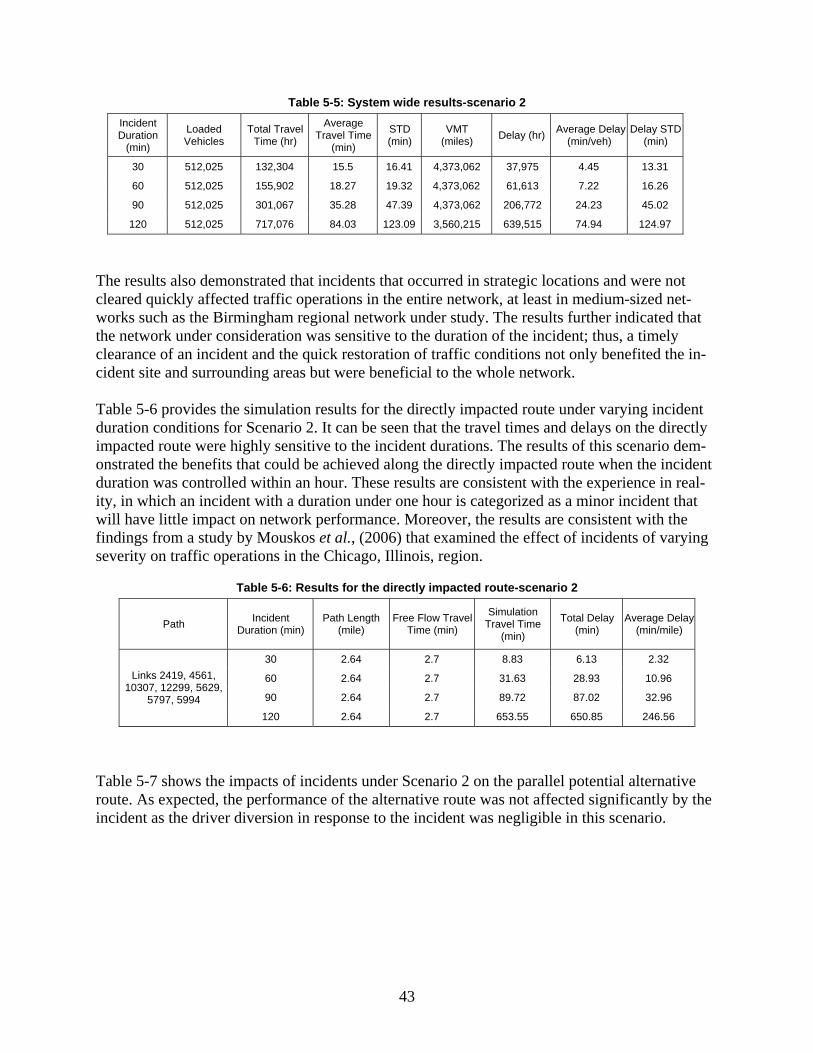
43
Table 5-5: System wide results-scenario 2 Incident Duration
(min)
Loaded Vehicles
Total Travel Time (hr)
Average Travel Time
(min)
STD (min)
VMT (miles) Delay (hr) Average Delay
(min/veh) Delay STD
(min)
30 512,025 132,304 15.5 16.41 4,373,062 37,975 4.45 13.31
60 512,025 155,902 18.27 19.32 4,373,062 61,613 7.22 16.26
90 512,025 301,067 35.28 47.39 4,373,062 206,772 24.23 45.02
120 512,025 717,076 84.03 123.09 3,560,215 639,515 74.94 124.97
The results also demonstrated that incidents that occurred in strategic locations and were not cleared quickly affected traffic operations in the entire network, at least in medium-sized net-works such as the Birmingham regional network under study. The results further indicated that the network under consideration was sensitive to the duration of the incident; thus, a timely clearance of an incident and the quick restoration of traffic conditions not only benefited the in-cident site and surrounding areas but were beneficial to the whole network. Table 5-6 provides the simulation results for the directly impacted route under varying incident duration conditions for Scenario 2. It can be seen that the travel times and delays on the directly impacted route were highly sensitive to the incident durations. The results of this scenario dem-onstrated the benefits that could be achieved along the directly impacted route when the incident duration was controlled within an hour. These results are consistent with the experience in real-ity, in which an incident with a duration under one hour is categorized as a minor incident that will have little impact on network performance. Moreover, the results are consistent with the findings from a study by Mouskos et al., (2006) that examined the effect of incidents of varying severity on traffic operations in the Chicago, Illinois, region.
Table 5-6: Results for the directly impacted route-scenario 2
Path Incident Duration (min)
Path Length (mile)
Free Flow Travel Time (min)
Simulation Travel Time
(min)
Total Delay (min)
Average Delay (min/mile)
30 2.64 2.7 8.83 6.13 2.32
60 2.64 2.7 31.63 28.93 10.96
90 2.64 2.7 89.72 87.02 32.96
Links 2419, 4561, 10307, 12299, 5629,
5797, 5994 120 2.64 2.7 653.55 650.85 246.56
Table 5-7 shows the impacts of incidents under Scenario 2 on the parallel potential alternative route. As expected, the performance of the alternative route was not affected significantly by the incident as the driver diversion in response to the incident was negligible in this scenario.

44
Table 5-7: Results for the potential alternative route-scenario 2
Path Incident Dura-tion (min)
Path Length (mile)
Free Flow Travel Time
(min)
Simulation Travel Time
(min) Total Delay (min)
Average Delay
(min/mile)
30 1.84 2.3 2.32 0.02 0.01
60 1.84 2.3 2.32 0.02 0.01
90 1.84 2.3 2.32 0.02 0.01
Links 5358, 5360, 5568, 5573, 5719, 18844, 18845, 4302, 11725
120 1.84 2.3 2.30 0.00 0.00
5.3 Scenario 3: Incident Conditions-Full Lane Blockage-Information Provision to all Users This scenario presents the impacts of incidents of varying durations on traffic operations both network wide and along selected routes. Similarly to Scenario 2, the incident occurred on link 5994, and resulted in a full closure of the facility and closure of a one on-ramp upstream of the incident on I-65 (link 5996). Information availability about the incident is assumed for all driv-ers. Table 5-8 provides an overview of the incident closure with details on capacity reduction, incident start time, and durations.
Table 5-8: Incident closure overview-scenario 3
Link ID Length (ft) Speed (mph) Capacity (vphpl) Start Time Duration (min) Lanes Closed
Available Capacity
5994 1, 848 65 2,300 0400:00 pm 30, 60, 90, 120 4 0
5996 528 40 1,700 0400:00 pm 30, 60, 90, 120 1 0
The DTA-route choice was executed, thus all users could optimize their travel time by switching paths, whereas in Scenario 2 travelers could not change paths to optimize their travel time as they were not aware of the incident presence. Table 5-9 presents network wide results for each incident condition considered under Scenario 3. As expected, average travel times and incident-related delays increased with the increase in incident duration; however, the increase was consid-erably smaller in comparison to Scenario 2. In other words, the impact of an incident was local-ized and had a minimal effect on overall network performance if all users had information about the incident location and optimized their paths accordingly. It should be noted that Scenario 3 appeared to perform remarkably close to the no-incident case (i.e. base case). This finding demonstrates that on this particular network, there were enough al-ternatives for people to use in case of a major incident, so that the impact of the incident on the network was almost immaterial if users took advantage of information provision services. The challenge is, however, to have the means to provide this information to all drivers, which is one of the aims of ITS. This might suggest a great potential for the deployment of various ITS infor-mation systems within this area.

45
Compared with the results of Scenario 2, the delays observed during the 30, 60, 90 and 120 min incident duration cases decreased significantly and the issue of non-exited vehicles in particular to 120 min incident duration case was eliminated. The results demonstrated that when incidents occurred in strategic locations and incident-related information was reported quickly to all users in the system a positive improvement on traffic operations in the entire network could material-ize, at least in medium-sized networks such as the Birmingham regional network under study. Thus, timely information of an incident and location are very beneficial to system-wide network operations.
Table 5-9: System wide results-scenario 3
Incident Duration
(min)
Loaded Vehicles
Total Travel Time
(hr)
Average Travel Time (min) STD (min) VMT
(miles) Delay (hr) Average Delay (min/veh)
Delay STD (min)
30 512,025 130,294 15.27 16.18 4,364,381 36,098 4.23 13.11
60 512,025 130,867 15.34 16.32 4,362,741 36,695 4.30 13.23
90 512,025 131,533 15.41 16.6 4,375,465 36,780 4.31 13.47
120 512,025 133,089 15.60 16.90 4,390,907 37,719 4.42 13.73
Table 5-10 summarizes the results for the directly impacted route under varying incident dura-tion conditions for Scenario 3. It can be seen that the travel times and delays on the directly im-pacted route were sensitive to the incident durations. The results of this scenario further demon-strate the benefits achieved along the directly impacted route when the incident information was provided to all users in comparison to scenario 2 (i.e., see Table 5-6), especially for the 120 min incident duration.
Table 5-10: Results for the directly impacted route-scenario 3
Path Incident Duration (min)
Path Length (mile)
Free Flow Travel Time (min)
Simulation Travel Time (min)
Total Delay (min)
Average Delay (min/mile)
30 2.64 2.7 5.48 2.78 1.05
60 2.64 2.7 15.06 12.36 4.68
90 2.64 2.7 28.12 25.42 9.63
Links 2419, 4561, 10307, 12299, 5629,
5797, 5994 120 2.64 2.7 38.24 35.54 13.46
Table 5-11 shows the impacts of incidents under Scenario 3 on the parallel potential alternative route. As expected, the travel time increased on the alternative route in comparison with Scenario 2 (i.e., Table 5-7) as drivers responded to the information available in this scenario. Thus more drivers selected that segment of alternate route for their travel.
Table 5-11: Results for the potential alternative route-scenario 3
Path Incident Dura-tion (min)
Path Length (mile)
Free Flow Travel Time
(min)
Simulation Travel Time (min)
Total Delay (min)
Average Delay
(min/mile)
30 1.84 2.3 2.34 0.04 0.02
60 1.84 2.3 2.79 0.49 0.27
Links 5358, 5360, 5568, 5573, 5719, 18844, 18845, 4302, 11725
90 1.84 2.3 2.65 0.35 0.19

46
120 1.84 2.3 2.69 0.39 0.21
5.4 Scenario 4: Incident Conditions-Two Lane Blockage-No Information Provision
This section presents the impacts of incidents of low severity that allowed two of the four traffic lanes to remain open during the incident presence (50 percent capacity available). Moreover, no on-ramp ramp closures were considered under Scenario 4 conditions. Table 5-12 gives an over-view of the incident conditions under Scenario 4 along with details on capacity reduction, inci-dent start time, and incident durations.
Table 5-12: Incident closure overview-scenario 4
Link ID Length (ft) Speed (mph) Capacity (vphpl) Start Time Duration (min) Lanes
Closed Available Capacity
5994 1, 848 65 2, 300 04:00:00 am 30, 60, 90, 120 2 50%
Table 5-13 shows network wide results for each incident condition considered under Scenario 4. The results were fairly consistent and close to the base case findings. One possible explanation is that the demand on the incident link did not considerably exceed available capacity; thus, the available capacity accommodated the demand on this link without any major problems. As a re-sult, the incident presence had only a slight impact on the overall network performance. Another possible explanation was that the network size was large so that the impacts of these less severe incidents were not obvious in terms of network wide performance measures.
Table 5-13: System wide results-scenario 4
Incident Duration
(min) Loaded Vehicle
Total Travel Time (hr)
Average Travel Time
(min) STD (min) VMT (mile) Delay
(hr) Average
Delay (min/veh)
Delay STD (min)
30 512,025 129,842 15.22 16.23 4,373,062 35,500 4.16 13.17 60 512,025 130,051 15.24 16.24 4,373,062 35,756 4.19 13.17
90 512,025 130,398 15.28 16.26 4,373,062 36,098 4.23 13.17 120 512,025 130,855 15.33 16.29 4,373,062 36,524 4.28 13.19
The results provided in Table 5-14 indicate that the incidents under Scenario 4 had much less impact on the directly impacted route than those in Scenarios 2 and 3. However, the degradation of the segment performance was still substantial, compared with the base case condition.
Table 5-14: Results for the directly impacted route-scenario 4
Path Incident Duration
(min) Path Length
(mile) Free Flow
Travel Time (min)
Simulation Travel Time
(min)
Total Delay (min)
Average Delay
(min/mile) 30 2.64 2.7 2.82 0.12 0.04 60 2.64 2.7 3.22 0.52 0.20
Links 2419, 4561, 10307, 12299, 5629,
5797, 5994 90 2.64 2.7 3.93 1.23 0.47

47
120 2.64 2.7 4.92 2.22 0.84 The results of the potential alternative route shown in Table 5-15 remained close to those of the base case (i.e., Scenario 1) for two reasons. First, there was no information available to users to allow them to alter their travel paths and second, that there was enough available capacity at the incident site so that users did not need to seek alternate routes.
Table 5-15: Results for the potential alternative route-scenario 4
Path Incident Dura-tion (min)
Path Length (mile)
Free Flow Travel Time
(min)
Simulation Travel Time
(min)
Total De-lay (min)
Average Delay
(min/mile)
30 1.84 2.3 2.32 0.02 0.01
60 1.84 2.3 2.32 0.02 0.01
90 1.84 2.3 2.32 0.02 0.01 Links 5358, 5360, 5568, 5573,
5719, 18844, 18845, 4302, 11725
120 1.84 2.3 2.32 0.02 0.01
The similarity of the findings in this scenario to those of the base case was not surprising since the flows on the freeway links were below the capacity of these links. Thus, the remaining capac-ity of the incident link could accommodate the demand in a reasonable manner. The results fur-ther justified the common practice of maintaining at least partial capacity of major transportation facilities when possible (instead of shutting down the facility completely) so that an emergency could be handled relatively efficiently. 5.5 Scenario 5: Incident Conditions-Full Lane Blockage-Information Provision- VMS Design 1 before Junction of I-65 and University Boulevard-User Response 50%
This scenario assumed a full lane blockage for incidents of varying durations with incident in-formation disseminated to the traveling public through a VMS. The motivation behind this sce-nario was to demonstrate the impact of information provision to travelers, as well as the effec-tiveness of incident management actions. Unlike previous studies that assumed a fixed compli-ance rate, this study recognized that, in reality, not all motorists follow the recommended infor-mation. Thus, the simulation tests performed in this scenario assumed a 50 percent motorist compliance rate. An overview of the incident and ramp closure information under Scenario 5 is given in Table 5-16 whereas the simulation system wide results are summarized in Table 5-17. Tables
Table 5-16: Incident closure overview-scenario 5
Link ID Length (ft) Speed (mph) Capacity (vphpl) Start Time Duration (min) Lanes Closed
Available Capacity
5994 1, 848 65 2,300 04:00:00 am 30, 60, 90, 120 4 0
5996 528 40 1,700 04:00:00 am 30, 60, 90, 120 1 0

48
Table 5-17: System wide results-50% compliance-scenario 5
Incident Duration
(min)
Loaded Vehicle
Total Travel
Time (hr)
Average Travel
Time (min)
STD (min)
VMT (miles)
Delay (hr)
Average Delay
min/veh
Delay STD (min)
30 512,025 132,303 15.50 16.40 4,373,062 37,975 4.45 13.31 60 512,025 155,672 18.24 19.31 4,373,062 61,357 7.19 16.24 90 512,025 301,269 35.30 47.36 4,373,062 206,942 24.25 44.97
120 512,025 450,723 52.82 74.68 4,361,568 356,623 41.79 72.72
As shown in Table 5-17, under incident conditions similar to Scenario 2, the network wide travel times and delays were reduced for incidents lasting 60 and 120 min as a result of diversion in-formation availability. Moreover, the VMT (miles) decreased for 120 min incident duration case as did also the number of non-exited vehicles (1,634 in Scenario 5). Table 5-18 demonstrates the impact of the strategy described in Scenario 5 on traffic operations along the directly impacted route. As can be seen from Table 5-18, the performance of the di-rectly impacted route degraded somewhat compared with the base case condition. However, re-duced delays were achieved for 30 and 120 min long incidents in comparison with the delays found for Scenario 2 when no information was provided to motorists about the incident.
Table 5-18: Results for the directly impacted route-50% compliance-scenario 5
Path Incident Duration (min)
Path Length (mile)
Free Flow Travel Time (min)
Simulation Travel Time (min)
Total Delay (min)
Average Delay (min/mile)
30 2.64 2.7 8.8 6.1 2.31 60 2.64 2.7 31.65 28.95 10.97 90 2.64 2.7 90.18 87.48 33.14
Links 2419, 4561, 10307, 12299, 5629,
5797, 5994 120 2.64 2.7 110.95 108.25 41.01
Tables 5-19 and 5-20 summarize performance measures for the potential alternate route consid-ered in the study with 50 percent (Scenario 5) and zero percent (Scenario 2) compliance rates respectively. This alternative route is a 4.59-mile-long segment of University Blvd, US 31/280 and I20/59. The analysis showed that travel time increased for 30, 90 and 120 min incident dura-tion cases in Scenario 5 in comparison with Scenario 2, which suggested that vehicles diverted to the designed alternate route as a result of incident information received via VMS Design 1.
Table 5-19: Results for the potential alternative route-50% compliance-scenario 5
Path Incident Duration
(min)
Path Length (mile)
Free Flow Travel Time
(min)
Simulation Travel Time
(min)
Total De-lay (min)
Average Delay
(min/mile)
30 4.59 8.4 8.52 0.12 0.03
60 4.59 8.4 8.48 0.08 0.02
Links 4562, 10318, 11797, 4558, 4554, 5307, 5309, 5312, 5314, 5318, 5322, 5326, 5334,
12665, 5336, 5343, 11631, 5346, 5349, 5354,11639, 5356, 12152, 12153, 5358, 5360, 90 4.59 8.4 8.92 0.52 0.11

49
5568, 5573, 5719, 18844, 18845, 4302, 11725, 5380, 6166, 6189, 12029
120
4.59 8.4 11.08 2.68
0.58
Table 5-20: Results for the potential alternative route-no information provision-scenario 2
Path Incident Duration
(min)
Path Length (mile)
Free Flow Travel Time
(min)
Simulation Travel Time
(min)
Total De-lay (min)
Average Delay
(min/mile)
30 4.59 8.4 8.51 0.11 0.02
60 4.59 8.4 8.49 0.09 0.02
90 4.59 8.4 8.9 0.50 0.10
Links 4562, 10318, 11797, 4558, 4554, 5307, 5309, 5312, 5314, 5318, 5322, 5326,
5334, 12665, 5336, 5343, 11631, 5346, 5349, 5354, 11639, 5356, 12152, 12153,
5358, 5360, 5568, 5573, 5719, 18844, 18845, 4302, 11725, 5380, 6166, 6189,
12029 120 4.59 8.4 11.07 2.67
0.58
5.6 Scenario 6: Incident Conditions-Full Lane Blockage- Information Provision-VMS De-sign 2 before Junction of I-65 and US-11 -User Response 50% This scenario assumed a full lane blockage for incidents of varying durations, information avail-ability about the incident presence via VMS, and diversion options. All assumptions in Scenario 6 were similar to those in Scenario 5, except that information was given at a different VMS loca-tion (upstream of the junction of I-65 and US-11) and a different alternate route was considered. An overview of the incident and ramp closure information for Scenario 6 is provided in Table 5-21.
Table 5-21: Incident closure overview-scenario 6
Link ID Length (ft) Speed (mph) Capacity (vphpl) Start Time Duration (min) Lanes Closed
Available Capacity
5994 1, 848 65 2,300 04:00:00 am 30, 60, 90, 120 4 0
5996 528 40 1,700 04:00:00 am 30, 60, 90, 120 1 0
Simulation tests were conducted for this scenario and the results for a representative case with full lane blockage and 50 percent user response to the VMS Design 2 are summarized in Tables 5-22, 5-23, and 5-24.
Table 5-22: System wide results-50% compliance-scenario 6
Incident Duration
(min)
Loaded Vehicle
Total Travel Time (hr)
Average Travel Time (min)
STD (min)
VMT (miles)
Delay (hr)
Average Delay(min/veh)
Delay STD (min)
30 512,025 132,294 15.5 16.40 4,373,062 37,975 4.45 13.31

50
60 512,025 155,677 18.24 19.31 4,373,062 61,357 7.19 16.25
90 512,025 312,306 36.60 49.70 4,373,056 218,036 25.55 47.38
120 512,025 714,525 83.73 122.93 3,566,881 636,870 74.63 124.81

51
Table 5-23: Results for the directly impacted route-50% compliance-scenario 6
Path Incident Duration (min)
Path Length (mile)
Free Flow Travel Time (min)
Simulation Travel Time (min)
Total Delay (min)
Average Delay (min/mile)
30 2.64 2.7 8.78 6.08 2.30 60 2.64 2.7 31.65 28.95 10.97 90 2.64 2.7 92.82 90.12 34.14
Links 2419, 4561, 10307, 12299, 5629,
5797, 5994 120 2.64 2.7 650.07 647.37 245.24
Table 5-24: Results for the potential alternative route-50% compliance-scenario 6
Path Incident Duration
(min)
Path Length (mile)
Free Flow Travel
Time (min)
Simulation Travel Time
(min)
Total De-lay (min)
Average Delay
(min/mile)
30 3.87 7.6 7.62 0.02 0.00 60 3.87 7.6 7.62 0.02 0.00 90 3.87 7.6 8.93 1.33 0.34
Links 5796, 5877, 11867, 5874, 5798, 11674, 5793, 5787, 5782, 5780, 17389, 17477, 5772, 12530, 5765, 12537, 5757, 5753, 5748, 5743,
5735, 5726, 5718, 5840, 17938, 18846, 18847, 18845, 4302, 11725, 5380, 6166, 6189, 12029 120 3.87 7.6 90.82 83.22
21.53
As shown in Table 5-22, the network wide travel times and delays in Scenario 6 increased sig-nificantly for incidents of 90 and 120 min incident duration in comparison to their counterparts in Scenario 5. Thus it was clear from the results in Tables 5-17 and 5-22 that VMS-Design 1 out performed VMS Design 2, especially for 90 and 120 min incident durations at a system wide level. As can be seen from Table 5-23, the performance of the directly impacted route under Scenario 6 degraded somewhat compared with the Scenario 5, for 90 and 120 min incident durations. For short incidents (30 min incident duration) the performance of the directly impacted was some-what better than to its counterpart in Scenario 5. Table 5-24 provides results of the incident impact under Scenario 6 on the alternate route shown in Figure 4-12. This route is a 3.87-mile-long segment of US-11, US 31/280 and I 20/59. Table 5-25 provides the results for the information-free condition on the same potential alternative route. The comparison of the results in Tables 5-24 and 5-25 showed that travel time and delay remained unaffected by short incidents (30 and 60 min incident duration). This suggested that the alternative route had enough reserve capacity available to handle the additional demand from vehicles rerouting due the simulated incident. However, for longer incidents (90 and 120 min incident duration), the performance of the alternate route degraded when compared to the base case (Scenario 1).

52
Table 5-25: Results for the potential alternative route-no information provision-scenario 1
Path Incident Du-ration (min)
Path Length (mile)
Free Flow Travel
Time (min)
Simulation Travel Time
(min)
Total Delay (min)
Average Delay
(min/mile)
Links 5796, 5877, 11867, 5874, 5798, 11674, 5793, 5787, 5782, 5780, 17389,
17477, 5772, 12530, 5765, 12537, 5757, 5753, 5748, 5743, 5735, 5726, 5718, 5840, 17938, 18846, 18847, 18845,
4302, 11725, 5380, 6166, 6189, 12029
0 3.87 7.6 7.62 0.02 0.0
To facilitate comparison of the findings further, the total delay and travel time network wide re-sults for the six illustrated scenarios were plotted in Figures 5-1 and 5-2, respectively. The results of study cases from Scenario 2, 3, 5 and 6 were summarized in Figures 5-3, 5-4, 5-5, and 5-6, respectively. As illustrated in Figures 5-3 and 5-4, the overall network performance was im-proved by the information provision and corresponding user response, especially for incidents of longer duration (i.e., 120 min). As discussed earlier, when all users re-optimized their travel paths in response to the incident, the network wide MOE’s were practically unaffected by the incident since the regional network had enough reserve capacity to absorb the diverted traffic with ease. Another interesting observation was that the network performance results for user compliance of zero percent, and 50 percent (VMS Design 1, and VMS Design 2) for 30, 60 and 90 min incident durations were remarkably close to each other in terms of network wide total delay and total travel time.
Total Delay for All Six Scenarios
0
100,000
200,000
300,000
400,000
500,000
600,000
700,000
0 20 40 60 80 100 120 140
Incident Duration (min)
Tota
l Del
ay (h
r)
Base CaseScenario 2 Scenario 3Scenario 4Scenario 5Scenario 6

53
Figure 5-1: Total delay for the six scenarios
Total Travel Time for All Six Scenarios
0
100,000
200,000
300,000
400,000
500,000
600,000
700,000
800,000
0 30 60 90 120 150
Incident Duration (min)
Tota
l Tra
vel T
ime
(hr) Base Case
Scenario 2 Scenario 3Scenario 4Scenario 5Scenario 6
Figure 5-2: Total travel time for the six scenarios
Total Delay with Varying Response
0
100,000
200,000
300,000
400,000
500,000
600,000
700,000
0 30 60 90 120 150
Incident Duration (min)
Tota
l Del
ay (h
r)
0 Response
100% Response
50% Reponse VMSDesign 150% Reponse VMSDesign 2
Figure 5-3: Total delay with varying user response to information provision

54
Total Travel Time with Varying Response
0
100,000
200,000
300,000
400,000
500,000
600,000
700,000
800,000
0 30 60 90 120 150
Incident Duration (min)
Tota
l Tra
vel T
ime
(hr) 0 Response
100% Response
50% Reponse VMSDesign 150% Reponse VMSDesign 2
Figure 5-4: Total travel time with varying user response to information provision
Total Delay VMS 1 vs. VMS 2
0
100,000
200,000
300,000
400,000
500,000
600,000
700,000
0 30 60 90 120 150
Incident Duration (min)
Tota
l Del
ay (h
r)
VMS Design 1VMS Design 2
Figure 5-5: Total delay for VMS 1 vs. VMS 2 with 50% response
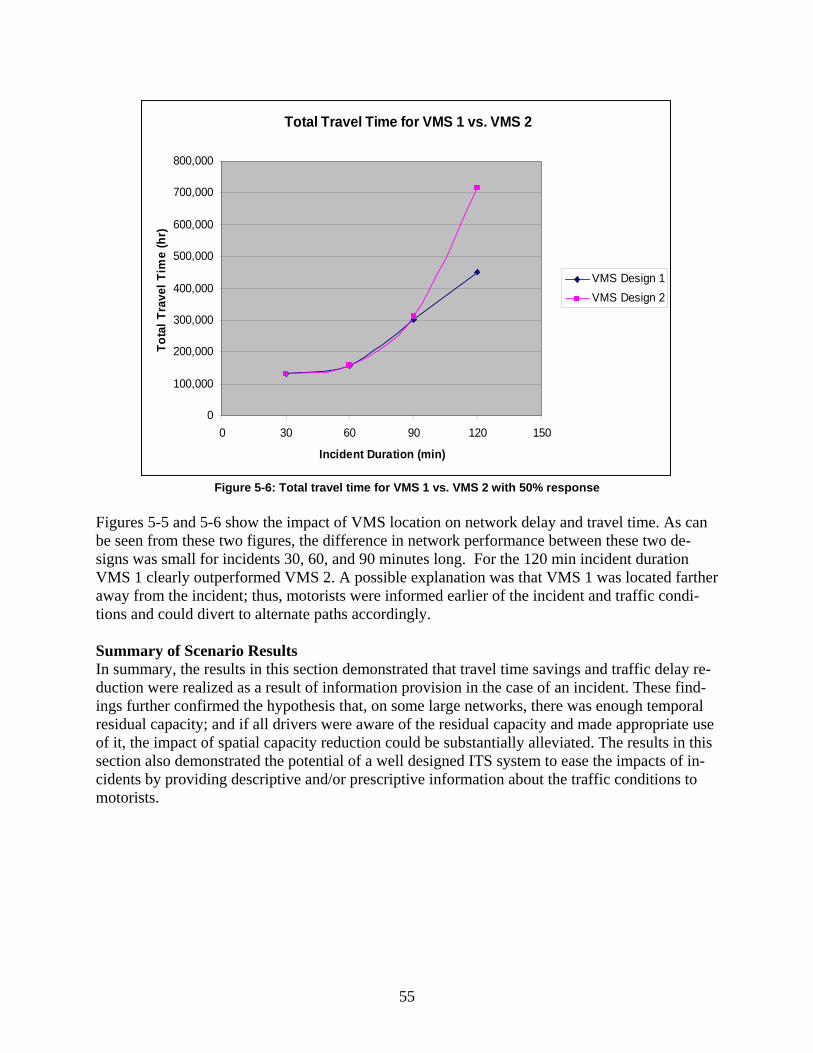
55
Total Travel Time for VMS 1 vs. VMS 2
0
100,000
200,000
300,000
400,000
500,000
600,000
700,000
800,000
0 30 60 90 120 150
Incident Duration (min)
Tota
l Tra
vel T
ime
(hr)
VMS Design 1VMS Design 2
Figure 5-6: Total travel time for VMS 1 vs. VMS 2 with 50% response
Figures 5-5 and 5-6 show the impact of VMS location on network delay and travel time. As can be seen from these two figures, the difference in network performance between these two de-signs was small for incidents 30, 60, and 90 minutes long. For the 120 min incident duration VMS 1 clearly outperformed VMS 2. A possible explanation was that VMS 1 was located farther away from the incident; thus, motorists were informed earlier of the incident and traffic condi-tions and could divert to alternate paths accordingly. Summary of Scenario Results In summary, the results in this section demonstrated that travel time savings and traffic delay re-duction were realized as a result of information provision in the case of an incident. These find-ings further confirmed the hypothesis that, on some large networks, there was enough temporal residual capacity; and if all drivers were aware of the residual capacity and made appropriate use of it, the impact of spatial capacity reduction could be substantially alleviated. The results in this section also demonstrated the potential of a well designed ITS system to ease the impacts of in-cidents by providing descriptive and/or prescriptive information about the traffic conditions to motorists.

56
6.0 RESULTS AND ANALYSIS OF EMERGENCY MANAGEMENT SCENARIOS
6.1 Scenario A: Base Case
This section summarizes the results for the base case, which assumed emergency conditions at the Riverchase Galleria Mall as detailed in Section 4.0. The travel times, delays, and other results generated by the simulation runs are presented with respect to the whole network, as well as to selected routes (e.g., the US-11 and US-31). Table 6-1 provides network wide results for the base case scenario under the evening period conditions. The results showed that the total number of vehicles loaded in the network and the experienced travel times, delays, and VMT. STD represents Standard Deviation.
Table 6-1: Base case system wide results-scenario 1
Loaded Vehicles Total Travel Time (hr)
Average Travel Time (min)
STD (min) VMT (miles) Delay
(hr) Average Delay
(min/veh) Delay STD
(min)
512,010 129,494 15.17 16.23 4,351,085 35,841 4.2 13.17
As described in Section 4.8, as part of the emergency response plan, the first emergency transit bus run used for evacuation had a departure time of 6:30 PM with a starting point as Central Sta-tion. More specifically, as Figure 4-13 shows, the bus moved away from the Central Station (i.e. moving outbound in the south direction) with an ending point at the Galleria Mall. The total ap-proximated travel distance was 13.69 miles. Each bus started its run with an interval of 10 min-utes from Central Station. Transit related MOEs for Scenario A were obtained by running the bus travel time and bus path time space reports. The bus travel time report listed the departure time and total travel time of each run for a selected route where as the bus path time space report showed the average travel time of buses/emergency vehicles for a selected set of links representing a corridor. The bus emergency response travel times are reported in Table 6-2. The results showed that the average response travel time for all twelve bus runs was 30.78 min-utes. The review of the critical route delay report provided by VISTA showed that the automo-bile average travel time along the corridor was 24.35 minutes, compared to the free flow travel time along the corridor of 21.2 minutes. The bus average speed for all of the twelve bus runs along the corridor was 26.68 mph (33.78 mph for the automobile). The buses were operating in mixed traffic and their speed was influ-enced by delays due to traffic signals, and interferences from other traffic operating on the corri-dor. The average delay per mile to auto vehicles along the corridor was 0.23 minutes/mile.
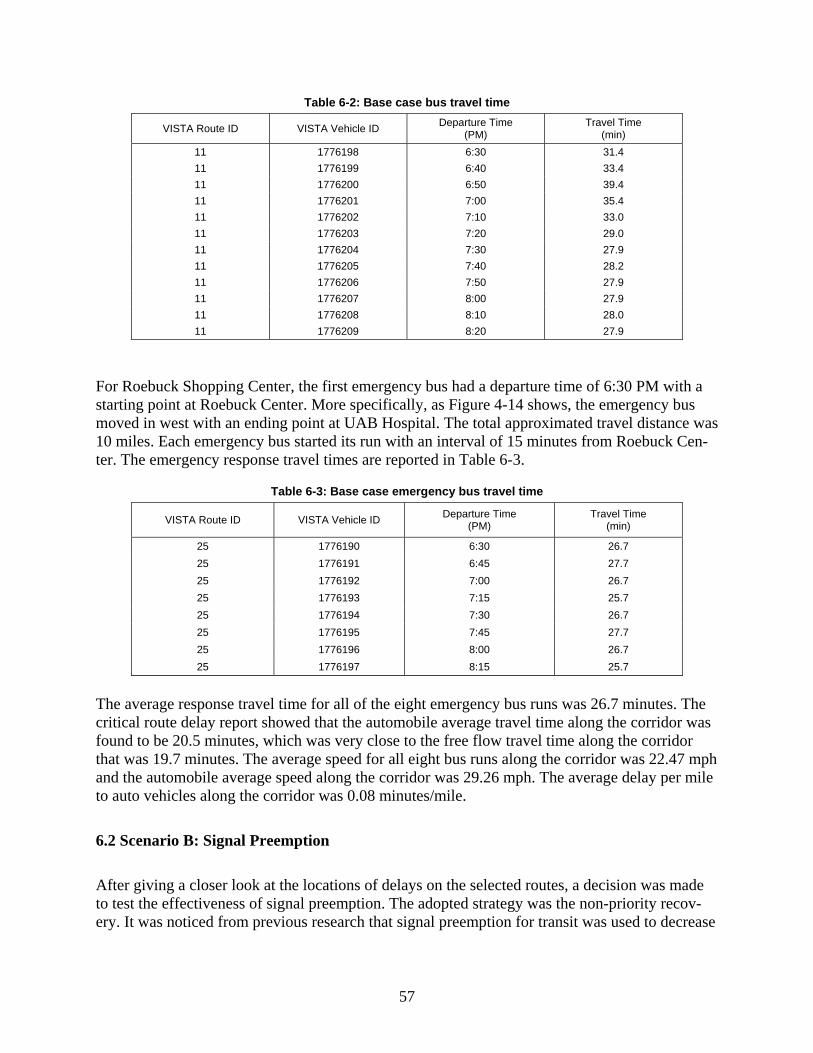
57
Table 6-2: Base case bus travel time
VISTA Route ID VISTA Vehicle ID Departure Time (PM)
Travel Time (min)
11 1776198 6:30 31.4 11 1776199 6:40 33.4 11 1776200 6:50 39.4 11 1776201 7:00 35.4 11 1776202 7:10 33.0 11 1776203 7:20 29.0 11 1776204 7:30 27.9 11 1776205 7:40 28.2 11 1776206 7:50 27.9 11 1776207 8:00 27.9 11 1776208 8:10 28.0 11 1776209 8:20 27.9
For Roebuck Shopping Center, the first emergency bus had a departure time of 6:30 PM with a starting point at Roebuck Center. More specifically, as Figure 4-14 shows, the emergency bus moved in west with an ending point at UAB Hospital. The total approximated travel distance was 10 miles. Each emergency bus started its run with an interval of 15 minutes from Roebuck Cen-ter. The emergency response travel times are reported in Table 6-3.
Table 6-3: Base case emergency bus travel time
VISTA Route ID VISTA Vehicle ID Departure Time (PM)
Travel Time (min)
25 1776190 6:30 26.7 25 1776191 6:45 27.7 25 1776192 7:00 26.7 25 1776193 7:15 25.7 25 1776194 7:30 26.7 25 1776195 7:45 27.7 25 1776196 8:00 26.7 25 1776197 8:15 25.7
The average response travel time for all of the eight emergency bus runs was 26.7 minutes. The critical route delay report showed that the automobile average travel time along the corridor was found to be 20.5 minutes, which was very close to the free flow travel time along the corridor that was 19.7 minutes. The average speed for all eight bus runs along the corridor was 22.47 mph and the automobile average speed along the corridor was 29.26 mph. The average delay per mile to auto vehicles along the corridor was 0.08 minutes/mile.
6.2 Scenario B: Signal Preemption After giving a closer look at the locations of delays on the selected routes, a decision was made to test the effectiveness of signal preemption. The adopted strategy was the non-priority recov-ery. It was noticed from previous research that signal preemption for transit was used to decrease

58
the travel time by adjusting the signal timing plans to benefit transit movements. The literature also reports that at locations of severe congestion and queuing, the overall results of signal pre-emption are not conducive (Ziliaskopoulos and Chang, 2004). Here, the selected study routes were performing close to free flow conditions and there was no noticeable congestion or queu-ing. Nevertheless, by considering these factors, bus path time space was run and bus travel time results were collected along links. Then signals were selected along those routes for signal pre-emption implementation. A total of 13 signals were preempted along the transit route serving the Riverchase Galleria Mall and 15 along the route serving the Roebuck Center. Table 6-4 provides network wide results for the preemption scenario under the evening period conditions. The table showed the total number of vehicles loaded in the network and the experi-enced travel times, delays, and VMT. STD represents Standard Deviation.
Table 6-4: Signal preemption system wide results-scenario 2 Loaded Vehicles
Total Travel Time(hr)
Average Travel Time (min)
STD (min)
VMT (miles)
Delay (hr)
Average Delay (min/veh)
Delay STD (min)
512,010 129,490 15.17 16.23 4,351,085 35,755 4.19 13.17
It can be seen from the comparison of the results reported in Tables 6-1 and 6-4 that preemption had a positive affect at a system wide level and overall delays were reduced. However, on the selected routes this effect was small. For the Riverchase Galleria Mall route, the bus emergency response travel times after preemp-tion are reported in Table 6-5.
Table 6-5: Preemption case bus travel time
VISTA Route ID VISTA Vehicle ID Departure Time (PM)
Travel Time (min)
11 1776198 6:30 29.5 11 1776199 6:40 33.5 11 1776200 6:50 37.1 11 1776201 7:00 35.3 11 1776202 7:10 31.3 11 1776203 7:20 27.6 11 1776204 7:30 27.0 11 1776205 7:40 24.9 11 1776206 7:50 26.7 11 1776207 8:00 27.1 11 1776208 8:10 25.0 11 1776209 8:20 25.0
Under this scenario, the average response travel time for all twelve bus runs was 29.17 minutes. From the critical route delay report, the automobile average travel time along the corridor was 24.37 minutes. The free flow travel time along the corridor was 21.2 minutes. It is clear from the implementation of signal preemption that the difference between average bus travel time and av-

59
erage automobile travel time along the potential emergency corridor was reduced from 6.43 min-utes (i.e., base case) to 4.80 minutes (i.e., preemption case), thus the signal preemption had a positive impact on the performance of buses along this study corridor. As far as speeds were concerned, under the preemption scenario, the bus average speed for all twelve bus runs along the corridor was 28.16 mph, compared to 33.70 mph for the automobile. Overall, the speed of buses along the potential emergency corridor was increased in comparison with the base case which further confirms the potential benefit of transit signal preemption. The results from the analysis of transit preemption along the emergency route serving the Roe-buck Shopping Center were consistent with those obtained for Scenario B for the Riverchase Galleria Mall emergency route. More specifically, the emergency response travel time for each transit run under signal preemption, as reported in Table 6-6, resulted in an average response travel time of 25.83 minutes. Under similar conditions, the automobile average travel time along the corridor was 20.5 minutes and the free flow travel time was 19.7 minutes. The difference of average bus travel time and average automobile travel time along the potential emergency corri-dor under preemption was 5.33 minutes, or 0.87 minutes lower than the base case.
Table 6-6: Preemption case emergency bus travel time
VISTA Route ID
VISTA Vehicle ID Departure Time (PM)
Travel Time (min)
25 1776190 6:30 25.5 25 1776191 6:45 26.3 25 1776192 7:00 25.3 25 1776193 7:15 26.3 25 1776194 7:30 25.3 25 1776195 7:45 26.3 25 1776196 8:00 25.3 25 1776197 8:15 26.3
The average speed for all of the eight bus runs along the corridor was 23.22 mph. It should be also noted that the speed of buses along the potential emergency corridor increased in compari-son with the base case and delays were reduced. These findings demonstrated the desirable im-pact on transit signal preemption on transit operations. Tables 6-7 and 6-8 provide the bus average travel times under base conditions (Scenario A) and signal preemption conditions (Scenario B). It can be seen that the total average travel time was reduced from 29.15 minutes (i.e., base case) to 27.83 minutes (i.e., preemption case).

60
Table 6-7: Buses travel time base case system wide
Assignment
Start End No. Veh. AVG Travel Time (min)
STD (min)
14 6:30:00 6:45:00 3 30.50 3.44 15 6:45:00 7:00:00 2 33.55 8.27 16 7:00:00 7:15:00 3 31.70 4.49 17 7:15:00 7:30:00 2 27.35 2.33 18 7:30:00 7:45:00 3 27.60 0.79 19 7:45:00 8:00:00 2 27.80 0.14 20 8:00:00 8:15:00 3 27.53 0.72 21 8:15:00 8:30:00 2 26.80 1.56
Total 6:30:00 8:30:00 20 29.15 3.57
Table 6-8: Bus travel time preemption case system wide
Assignment
Start End No. Veh. AVG Travel Time (min) STD (min)
14 6:30:00 6:45:00 3 29.50 4.00 15 6:45:00 7:00:00 2 31.70 7.64 16 7:00:00 7:15:00 3 30.63 5.03 17 7:15:00 7:30:00 2 26.95 0.92 18 7:30:00 7:45:00 3 25.73 1.12 19 7:45:00 8:00:00 2 26.50 0.28 20 8:00:00 8:15:00 3 25.80 1.14 21 8:15:00 8:30:00 2 25.65 0.92
Total 6:30:00 8:30:00 20 27.83 3.63
Tables 6-9 and 6-10 provide the bus travel time ranges for the base case and the preemption case and their distribution is shown in Figures 6-1 and 6-2, respectively. Tables 6-11 and 6-12 provide information on the delay distribution of emergency buses without and with signal preemption. It should be noted that total average delay was reduced from 8.55 minutes (i.e., base case) to 7.23 minutes (i.e., preemption case). The results in Tables 6-9 through 6-12 show further benefits from the transit signal implementation.
Table 6-9: Bus travel time categories in base case
Time (Min) 35 ~ 40 30 ~ 35 25 ~ 30
No. Vehicles 2 3 15
Table 6-10: Bus travel time categories in preemption case Time (Min) 35 ~ 40 30 ~ 35 25 ~ 30 20 ~ 25
No. Vehicles 2 2 15 1

61
Figure 6-1: Number of buses per travel time category in base case
Figure 6-2: Number of buses per travel time category in preemption case

62
Table 6-11: Bus delay base case system wide
Assignment Start End Vehicle Count
AVG Delay (min/veh)
Delay STD (min)
14 6:30:00 6:45:00 3 9.80 2.62 15 6:45:00 7:00:00 2 13.10 7.21 16 7:00:00 7:15:00 3 11.00 3.67 17 7:15:00 7:30:00 2 6.90 1.27 18 7:30:00 7:45:00 3 6.90 0.17 19 7:45:00 8:00:00 2 7.35 0.92 20 8:00:00 8:15:00 3 6.83 0.15 21 8:15:00 8:30:00 2 6.35 0.49
Total 6:30:00 8:30:00 20 8.55 3.20
Table 6-12: Bus delay preemption case system wide
Assignment Start End Vehicle Count
AVG Delay (min/veh)
Delay STD (min)
14 6:30:00 6:45:00 3 8.80 3.28 15 6:45:00 7:00:00 2 11.25 6.58 16 7:00:00 7:15:00 3 9.93 4.25 17 7:15:00 7:30:00 2 6.50 0.14 18 7:30:00 7:45:00 3 5.03 1.16 19 7:45:00 8:00:00 2 6.05 0.78 20 8:00:00 8:15:00 3 5.10 1.14 21 8:15:00 8:30:00 2 5.20 1.98
Total 6:30:00 8:30:00 20 7.23 3.34
63
7.0 CONCLUSIONS This study utilized DTA modeling to analyze the impact of incidents and emergencies on urban transportation network operations and to assess ways to address it. DTA has evolved rapidly over the past two decades to support increasing needs ranging from real-time traffic operations to long-term planning. As a matter of fact, DTA models are a natural evolution in the transportation field and are expected to become mainstream when issues related to the realism of their assumptions and mathematical tractability are addressed in greater detail. Several simulation-based DTA mod-els are currently available for real world deployment and have already gained sophistication and significant acceptability. The VISTA model used in this study is a great example of a versatile DTA tool that can support decision making under emergencies for pre planning and real time planning purposes. The following paragraphs summarize the contributions of this project, the main conclusions stemming from the case study, and recommendations for future research.
7.1 Project Contributions
In this project, three representative simulation-based DTA models (namely, DynaMIT, DYNASMART-X, and VISTA) were presented and compared in an effort to assist transportation professionals and transportation agencies with gaining more familiarity with DTA. The study offered an in-depth investigation of these models and thoroughly described their features, strengths, and limitations. To demonstrate the potential of DTA modeling for incident and emergency management, the VISTA software package was adopted in this study to model incident and emergency conditions and response actions in the Birmingham regional network. The VISTA model was used to assess the impacts of carefully designed incident and emergency scenarios and the effectiveness of can-didate incident and emergency management plans. Relevant ITS technologies such as informa-tion dissemination through VMS and Signal Preemption were also evaluated in VISTA. It should be noted that the development of the DTA model is a major accomplishment by itself. It can be used beyond the scope of this study by local transportation planners and engineers to improve the accuracy of traditional transportation planning approaches and enable modeling of recently emerged technologies such as ITS. Another contribution of this work is the identifica-tion of specific application areas in which DTA can play a major role in improving planning, en-gineering, and operational procedures currently adopted by transportation and planning agencies.

64
7.2 Conclusions from the Case Study
In this study, simulation tests were conducted on a sub-network of the Birmingham regional network to showcase the ability of DTA to:
a. evaluate the impacts of various incidents and emergencies, and b. model incident and emergency management strategies and relevant ITS technologies.
The main findings are as follows:
DTA is a powerful tool that transportation agencies could use to improve their existing emergency management plans through the evaluation of route diversion strategies, infor-mation dissemination via VMS, signal preemption, and other incident and emergency re-sponse actions.
The Birmingham transportation network is sensitive to the duration of incident presence.
Timely clearance of incidents and quick restoration of traffic conditions not only benefits the incident site and surrounding areas but also benefits the entire network operation.
In large networks where residual capacity is available, drivers’ awareness of and proper
reaction to traffic congestion build-up can substantially alleviate the impact of spatial ca-pacity reduction. The analysis demonstrated that when users optimize their paths in re-sponse to the incident, the network performed close to the no-incident case (i.e., base case).
Furthermore the study demonstrated the feasibility of using transit buses as emergency
vehicles and the utility of the simulation modeling for predicting transit emergency re-sponse travel time. Such information is otherwise unavailable. Implementation of strate-gies that support evacuation using transit buses such as Transit Signal Preemption was further confirmed.
Overall it was concluded that DTA could provide a powerful tool for transportation agencies to use to improve their current incident and emergency management plans through the evaluation of route diversion strategies, various response actions, potential emergency routes and relevant ITS technologies.
7.3 Future Research
The work in this study has brought to light a number of initiatives for future research. • The initial attempt to incorporate data from TRANPLAN and CORSIM into VISTA was
successful; however, because of the differences in alignment, the CORSIM data could not be easily transported and integrated during the simulation process. Further work is needed to address this issue.
• The availability and use of location specific historical incident data would be desirable for study purposes. However, the solicitation of such data for this study was not successful be-

65
cause some government agencies were reluctant to release incident information due to possi-ble legal disputes resulting from this action. In the future, a process should be implemented to lift such restrictions and allow use of such data for scientific research purposes.
• While some insight was gained on the implementation of incident and emergency manage-ment strategies in this study, additional future research could focus on designing better diver-sion and response action plans, VMS designs to adopt in the evaluation of the impacts of dif-ferent VMS designs, and evaluation of different signal preemption strategies.

66
8.0 REFERENCES
Agrawal, B. B., Waller, S. T., and Ziliaskopoulos, A. K., (2002). “A modeling approach for tran-sit signal preemption.” Transportation Research Record 1791, Transportation Research Board, Washington, D.C., 13-20.
Ben-Akiva, M. E., Bierlaire, M., Bottom, J., Koutsopoulos, H. N., and Mishalani, R., (1997). “Development of a route guidance generation system for real-time application.” Proc., IFAC Conf., Chania, Greece.
Burghout, W. (2005). “Mesoscopic simulation models for short-term prediction.” Centre for Traffic Research, Royal Institute of Technology, Stockholm, Sweden. Available online at: http://www.infra.kth.se/ctr/publikationer/ctr2005_03.pdf. Accessed May 27, 2006.
Chang, E., and Ziliaskopoulos, A. (2003). “Data challenges in development of a regional as-signment: simulation model to evaluate transit signal priority in Chicago.” Transportation Re-search Record 1841, Transportation Research Board, Washington, D.C., 12-22.
Chauhan, A. S. (2003). “Development and evaluation of diversion strategies under incident re-sponse using dynamic traffic assignment system.” M.S. Thesis, Massachusetts Institute of Technology, Cambridge, MA. Available online at: http://web.mit.edu/ its/publications.html. Accessed May 7, 2006.
Chen, H. K. (1999). Dynamic travel choice models. Springer-Verlag, Berlin, Germany. DOT (2003). “STRATEGIC PLAN 2003-2008.” Available online at: http://www.dot
.gov/stratplan2008/strategic_plan.htm. Accessed Apr. 30, 2006. Drabek, T.E. (1985). “Managing the emergency response.” Public Administration Review, Vol. 45, Special Issue: Emergency Management: A Challenge for Public Administration, pp. 85-92. FHWA (2006). “Integrated communications/Intelligent Transportation Systems.” Available
online at: http://ops.fhwa.dot.gov/incidentmgmt/integrated_comm/its_ims.htm. Accessed Apr. 30, 2006.
Huynh, N., Mahmassani, H. S., and Tavana, H. (2002). “Adaptive speed estimation using trans-fer function models for real-time dynamic traffic assignment operation.” Transportation Re-search Record 1783, Transportation Research Board, Washington, D.C., 55-65.
Mahmassani, H. S., Qin, X., and Zhou, X., (2004). “DYNASMART-X evaluation for real-time TMC application: Irvine test bed.” TREPS Phase 1.5B Final Rep. Maryland Transportation Initiative, University of Maryland, College Park, MD.
Mahmassani, H. S., Hawas, Y., Abdelghany, K., Abdelfatah, A., Chiu, Y-C, and Kang, Y. (1998). “DYNASMART-X; Volume II: Analytical and algorithmic aspects.” Technical Rep. ST067-85, Vol. II. Center for Transportation Research, University of Texas at Austin, Austin, TX.
Merchant, D. K., and Nemhauser, G.L. (1978a). “A model and an algorithm for the dynamic traf-fic assignment problems.” Transportation Science. 12 (3), 183-199.
Merchant, D. K., and Nemhauser, G.L. (1978b). “Optimality conditions for a dynamic traffic as-signment model.” Transportation Science. 12 (3), 200-207.
Mn/DOT (2006). Mn/DOT Web site. Available online at: http://www.dot.state.mn.us/ tmc/incmgmt.html, Accessed Jul. 10, 2006.

67
Mouskos, K. C., Ziliaskopoulos, A. K., Chien, S., Kamga, C., and Barrett, C. (2006). “Imple-menting dynamic traffic assignment to support incident management.” Proc., 6th Asia-Pacific Transportation Development Conf. and the 19th ICTPA Annual Meeting. Hong Kong and Macau, China.
Peeta, S. (1994). “System optimal dynamic traffic assignment in congested networks with ad-vanced information systems.” Ph.D. Dissertation, University of Texas at Austin, Austin, TX.
Peeta, S., and Ziliaskopoulos, A. K. (2001). “Foundations of dynamic traffic assignment: the past, the present and the future.” Networks and Spatial Economics. 1 (3-4), 233-65.
Ran, B., and Boyce, D. (1994). “Dynamic urban transportation network models.” Lecture notes in Economics and Mathematical Systems 417. Springer-Verlag, Berlin, Germany.
Ran, B., and Boyce, D. (1996). Modeling dynamic transportation networks. Springer-Verlag, Berlin, Germany.
Schrank, D., and Lomax, T. (2005). “The 2005 urban mobility report.” Texas Transportation In-stitute, Texas A&M University System, College Station, TX. Available online at: http://mobility.tamu.edu, Accessed Apr. 30, 2006.
Sisiopiku, V. P., and Li X. (2006). “Overview of dynamic traffic assignment options.” Proc., 2006 Spring Simulation Multiconference (CD-ROM), Society for Modeling and Simulation International, Hunts-ville, AL.
Sundaram, S. (2002). “Development of a dynamic traffic assignment system for short-term plan-ning applications.” M.S. Thesis, Massachusetts Institute of Technology, Cambridge, MA.
Wirtz, J. J., Schofer, J. L., David F., and Schulz D. F. (2005). “Using simulation to test traffic incident management strategies: Illustrating the benefits of pre-planning.” Proc., 75th Trans-portation Research Board Annual Meeting, Washington, D.C.
Ziliaskopoulos, A. K., and Lee, S. (1996). ‘‘A cell transmission based assignment-simulation model for integrated freeway/surface street systems.’’ Proc., 75th Transportation Research Board Annual Meeting, Washington, D.C.
Ziliaskopoulos, A., and Barrett C. (2005). “Visual Interactive System for Transportation Algo-rithms.” Available online at: http://cluster.vistatransport.com, Accessed Feb. 16, 2006.
Ziliaskopoulos, A., and Chang E. (2004). “Regional traffic simulation/assignment model for evaluation of transit signal priority.” Department of Civil Engineering at Northwestern University, Evanston, IL.

68
Appendix A
List of Abbreviations
ALDOT Alabama Department of Transportation ATIS Advanced Traveler Information Systems ATMS Advanced Traffic Management Systems CATS Chicago Area Transportation Study CORSIM CORridor SIMulation Traffic Software DOT Department of Transportation DTA Dynamic Traffic Assignment DynaMIT Dynamic Network Assignment for the Management of Information to
Travelers Model DYNASMART Dynamic Network Assignment-Simulation Model for Advanced
Road Telematics EPA Environmental Protection Agency FHWA Federal Highway Administration ITS Intelligent Transportation Systems MOE Measures of Effectiveness MPO Metropolitan Planning Organization ORNL Oak Ridge National Laboratories OD Origin-destination PSQL Postgre Structured Query Language RPCGB Regional Planning Commission of Greater Birmingham SO System Optimal STD Standard Deviation STA Static Traffic Assignment TFM Transfer Function Model TMC Traffic management center TRANPLAN TRANSporation PLANing Software TTI Texas Transportation Institute UE User Equilibrium VISTA Visual Interactive System for Transport Algorithms VMS Variable Message Sign VMT Vehicle Miles Traveled