Traffic Information Provision Suitable for TV Broadcasting Based on Macroscopic Fundamental Diagram...
6
Abstract—This paper describes the feasibility study on the traffic information provision which is suitable for TV broadcasting by using floating car data (FCD). Recent telematics services provide traffic information via on-board car navigation units or portable navigation devices which facilitate interactive use but for limited number of users. On the other hand, the information provision via TV broadcasting has large number of viewer and may seems have significant influence on their travel behaviors especially in the case of singular traffic conditions. However the way of expression of traffic information via broadcasting has limitation in the interaction and the sparse resolution on TV monitors. In this paper, we will propose the mesh-wised traffic indices in terms of the fluidity and the singularity in traffic conditions based on the macroscopic fundamental diagram (MFD) of traffic flows. After the discussion on the theoretical framework, the preliminary studies using taxi probe data in Tokyo will be presented. I. INTRODUCTION HIS paper describes the feasibility study on the traffic information provision which is suitable for TV broadcasting by using floating car data (FCD). Recent telematics service provides traffic information via an on-board car navigation unit or a portable navigation device which facilitates interactive use. In Japan, car manufacturers provide their own telematics services based on FCD combining with VICS, the sensor based traffic information system in Japan. The information provision via a navigation unit produces much 'personalized' knowledge which reflects the user's preference, alternative routes to the destination, vehicle queues near the current position, etc. However, it is only provided to the limited number of drivers who correctly tell their destinations to the navigation units. Although there is no statistics, it is believed that the number of such drivers is small so that the influence of the telematics would be limited. Another limitation of the present telematics is just providing the information to the on-trip drivers who have already chosen vehicles in place of the public transportation. This means the present telematics does not reduce the traffic demand. It is said the possible mitigation of traffic congestion will not be high without any traffic demand management. On the other hand, the information provision via TV broadcasting has large number of viewer and may seems have significant influence on their travel behaviors. If traffic information will be provided as well as the weather forecast in the morning news, many people will watch it in habit and will consider the suitable transportation mode before they leave home. However the way of expression of traffic information via broadcasting has limitations. Because of a lack of the interaction, the displayed content of the traffic information will be shared in public to exclude the dependence on the location, the travel purpose or the destination of each viewer. Furthermore, since one broadcasting center covers wide area as large as whole region or metropolis, the link-based display like car navigation units becomes messy if we are going to stuff all of the link iformation on TV monitors with sparse resolution. The present traffic information provision on TV uses of the deformed map image only covering highways and major arterial roads, as shown in Fig. 1, but it may lose plenty of the valuable information of the congestion on surface streets. Even if we assume high density monitors which can show the clear picture of whole road network, the rich information may not always help the quick comprehension of traffic conditions within the limited display duration. In this paper, let us propose the mesh-wised traffic information which will be provided onto TV monitors for the quick comprehension of the rough skech of regional traffic conditions. in terms of the fluidity and the singularity in traffic conditions for more suitable expression of urban traffic conditions on TV monitors. In order to collect wider and more precise traffic information as much as we can, the use of Traffic Information Provision Suitable for TV Broadcasting Based on Macroscopic Fundamental Diagram from Floating Car Data Ryota Horiguchi, Morihisa Iijima and Hisatomo Hanabusa T Fig. 1. An example of the deformed map for the traffic information on TV monitor (left), and the actual road network of the same region.
-
Upload
independent -
Category
Documents
-
view
0 -
download
0
Transcript of Traffic Information Provision Suitable for TV Broadcasting Based on Macroscopic Fundamental Diagram...

Abstract—This paper describes the feasibility study on the traffic information provision which is suitable for TV broadcasting by using floating car data (FCD). Recent telematics services provide traffic information via on-board car navigation units or portable navigation devices which facilitate interactive use but for limited number of users. On the other hand, the information provision via TV broadcasting has large number of viewer and may seems have significant influence on their travel behaviors especially in the case of singular traffic conditions. However the way of expression of traffic information via broadcasting has limitation in the interaction and the sparse resolution on TV monitors. In this paper, we will propose the mesh-wised traffic indices in terms of the fluidity and the singularity in traffic conditions based on the macroscopic fundamental diagram (MFD) of traffic flows. After the discussion on the theoretical framework, the preliminary studies using taxi probe data in Tokyo will be presented.
I. INTRODUCTION
HIS paper describes the feasibility study on the traffic information provision which is suitable for TV
broadcasting by using floating car data (FCD). Recent telematics service provides traffic information via
an on-board car navigation unit or a portable navigation device which facilitates interactive use. In Japan, car manufacturers provide their own telematics services based on FCD combining with VICS, the sensor based traffic information system in Japan.
The information provision via a navigation unit produces much 'personalized' knowledge which reflects the user's preference, alternative routes to the destination, vehicle queues near the current position, etc. However, it is only provided to the limited number of drivers who correctly tell their destinations to the navigation units. Although there is no statistics, it is believed that the number of such drivers is small so that the influence of the telematics would be limited.
Another limitation of the present telematics is just providing the information to the on-trip drivers who have already chosen vehicles in place of the public transportation. This means the present telematics does not reduce the traffic
demand. It is said the possible mitigation of traffic congestion will not be high without any traffic demand management.
On the other hand, the information provision via TV broadcasting has large number of viewer and may seems have significant influence on their travel behaviors. If traffic information will be provided as well as the weather forecast in the morning news, many people will watch it in habit and will consider the suitable transportation mode before they leave home.
However the way of expression of traffic information via broadcasting has limitations. Because of a lack of the interaction, the displayed content of the traffic information will be shared in public to exclude the dependence on the location, the travel purpose or the destination of each viewer.
Furthermore, since one broadcasting center covers wide area as large as whole region or metropolis, the link-based display like car navigation units becomes messy if we are going to stuff all of the link iformation on TV monitors with sparse resolution. The present traffic information provision on TV uses of the deformed map image only covering highways and major arterial roads, as shown in Fig. 1, but it may lose plenty of the valuable information of the congestion on surface streets. Even if we assume high density monitors which can show the clear picture of whole road network, the rich information may not always help the quick comprehension of traffic conditions within the limited display duration.
In this paper, let us propose the mesh-wised traffic information which will be provided onto TV monitors for the quick comprehension of the rough skech of regional traffic conditions. in terms of the fluidity and the singularity in traffic conditions for more suitable expression of urban traffic conditions on TV monitors. In order to collect wider and more precise traffic information as much as we can, the use of
Traffic Information Provision Suitable for TV Broadcasting Based on Macroscopic Fundamental Diagram from Floating Car Data
Ryota Horiguchi, Morihisa Iijima and Hisatomo Hanabusa
T
Fig. 1. An example of the deformed map for the traffic information on TV monitor (left), and the actual road network of the same region.

floating car data will be discussed for how to derive those indices. After the discussion on the theoretical framework, the preliminary studies using taxi probe data in Tokyo will be presented.
II. MESH-WISED TRAFFIC INFORMATION
A. Traffic Conditions Based on MFD estimated with FCD
The fundamental diagram (FD) of traffic flows is the well-known relationship among the flow (q), the density (k) and the space-mean speed (v) of the traffic on a simple section. It is frequently seen that q is approximated with the concave function of k.
The idea of FD for the flow on a simple section can be extended to network flows. Daganzo formulated the idea as macroscopic fundamental diagram (MFD) for homogenously congested areas relating 'production' (Q: the product of average flow and network length) and 'accumulation' (K: the product of density and network length) [1]. Theoretically, the MFD of a certain area will be found independently from the travel demand. It is basically to be estimated with the travel speeds of all vehicles running in the area, but it is difficult to know them in practice. Even though we do not know the movement of entire vehicles, however, Geroliminis and Daganzo [2] suggested MFD can be estimated from FCD with the field experiment data in Yokohama.
To confirm how MFD will be estimated, we have examined with the FCD of taxis running on the surface streets in Tokyo city center. The size of the area depends on the volume of FCD and the homogeneity of the traffic condition. If we use smaller mesh, the homogeneity will be higher but the volume of FCD will be lower. This is undesirable for steady service. Similar discussion can be found on the aggregation period. In the following study, let us use square mesh of 1km in length and breadth and 1 hour aggregation interval.
Fig. 2 shows the aggregated Q-K values for the weekdays and the holidays in one mesh. The vertical axis (Q) represents the total trip distance of whole floating cars, while the
horizontal axis (K) means the total travel time. The number of the taxis operating as floating cars in Tokyo
city center was approximately 3000. In this case, we have only used in-service taxi trips for a month. We have overlaid the approximated quadratic curves, both of which show the concave form. If those in-service taxi trips always represent some constant portion of whole trips, the approximated curve of each day will be consistent with other days. However the weekdays and the holidays apparently reveal different curves. We may agree the proportion of the in-service taxis within the whole traffic on weekdays will differ from the holidays. This implies we have to prepare different MFDs for each day according to the volume of the running floating cars.
It seems curious there are no plots in the congested area, the right half side of the concave. This comes from two possible reasons; 1) the in-service taxis have the tendency to avoid congestion and can run faster than the other cars, or 2) there are always non-congested sections in the area even in the peak period and the aggregation including such section will counterbalance the contribution of the congestion. Although we cannot conclude the sufficient reason, it will be approved that the MFD in the figure has the nature with which the ‘fluidity’ of the aggregated traffic condition declines in proportion how it is far from the origin, since the tangent of each point on MFD means the average travel speed in the area.
B. Concept of the Mesh-wised Traffic Information
The concept of the mesh-wised traffic information provision is quite different from the conventional telematics services. The conventional link-based traffic information will be mainly used to estimate the travel time or to find better alternative route to the destination with the aim to increase the users' benefit.
On the other hand, the mesh-wised information does not represent the traffic condition of any certain road but quantifies the average fluidity and the singularity of the traffic conditions for all roads in the mesh by using MFD. It is aiming to suppress the traffic demand by letting the people recognize the whole picture of the real traffic condition and consider ceasing driving when the traffic condition is heavy.
As for the mesh-wised traffic information, let us propose two indices, the fluidity index and the singularity index.
1) Fluidity index The fluidity index quantifies how close the aggregated
traffic condition is to the origin of MFD. In place of using the average travel speed in a mesh, the reason why we introduce such quantification is the low sensitivity of the travel speed on MFD. As we discussed in the previous section, the aggregated Q-K values mostly appear in the left half of the quadratic curve. The range of the travel speed may not widely vary.
On the contraly, the Q-K values widely distributed along the quadratic curve. The traffic condition far from the MFD origin, i.e. with low fluidity index, may indicate some degree of the congestion in the area. Fig. 3 shows an example of the
Aggregated Q-K relationship in MFD(Tokyo Mesh#533936_00, 5:00~20:00)
0.0
1.0
2.0
3.0
4.0
5.0
6.0
7.0
8.0
0.00 0.05 0.10 0.15 0.20
Area average density [veh]
Agg
rega
ted
flow
[ve
h*km
/hr
Weekdays Holidays y=-72.4x^2+41.9x y=-70.6x^2+48.1x
Approximated curve for holidays
Approximated curve for weekdays
Fig. 2. The aggregated flow-density plot for the weekdays and the

fluidity index of each mesh in Tokyo city center. The red color means low fluidity with heavy congestion and the blue color does high fluidity. People will see the distribution of the congestion over the city and may roughly understand the traffic condition around their habitat or business places.
2) Singularity index In order to understand the traffic condition correctly, it is
important to know not only how congested but also how different from the ordinary. For this purpose, let us introduce another index to highlight the singularity of the traffic condition of the mesh. The singularity index is an extension of the quantity of information for traffic congestion proposed by Horiguchi [3] which calculates the entropy of the aggregated traffic condition of certain time period according to the probability density function of traffic conditions.
Even though a mesh has low fluidity index at certain time, it may have low singularity index when the extent of the congestion is ordinary level for that time. If the mesh has high fluidity index to the contrary, it may have high singularity when the traffic is unusually light because of the extraordinary demand reduction in some disasters or incidents.
Fig. 4 shows an example of the mesh-wised singularity index at the same time of Fig. 3. In this picture, the red color means high singularity and the blue means low. By comparing those two pictures, people will see how the congestion in the south area of Tokyo is extraordinary.
C. Operation on the Aggregated Q-K plot on MFD
In order to quantify the aggregated Q-K condition on MFD in terms of the fluidity and the singularity, let us propose the following operation.
1) Approximation with quadratic curve For the first step, let us approximate the aggregated Q-K
values with concave function in order to represent the 'average' relationship. In this case, we borrow the quadratic curve from the Greenshield's formula [4], i.e.
)0,0(2 babKaKQ (1)
Where, Q : aggregated flow
K : aggregated density a, b: parameters The parameters a and b are determined to minimize the
square error between the approximated curve and the values. It is said the Greenshield’s formula does not describe
traffic accurately especially for heavy congestion. However, the distribution of the aggregated traffic conditions will not spread over the heavy congested area, as shown in Fig. 2, the use of the quadratic formula may be less problematic and let us allow to take the advantage of the easiness for the operation described later.
2) Transformation of Q-K plot The singularity index intends to express how rare a traffic
condition is with the entropy in the information mathematics. For the calculation of the entropy, we need to know the probability density function of traffic conditions.
However, it is difficult to identify the function for the aggregated Q-K values which distributes around the concave curve. Therefore, let us allow to transform Q-K plot onto well posed two-dimensional normal distribution which is suitable for the entropy calculation.
In this study, we introduce ‘t’-axis in accordance with the quadratic curve and ‘d’-axis meaning the distance from the quadratic curve. For the preparation, the quadratic function (1) is transformed to the parametric expression (2).
tta
bQ
ta
bK
22
(2)
Here, t is the parameter changing along the quadratic curve with the range [0, 1]. The point where 't = 0' is the origin and the point where 't=1' is the right intercept on k-axis.
Let us next introduce the scaling factor s to modify the quadratic curve as follows.
ttsa
bQ
sta
bK
22
(3)
Fig. 3. Mesh-wised 'fluidity' index in Tokyo city center.
Fig. 4. Mesh-wised 'singularity' index at the same time of Fig. 3.

For given point (Ki, Qi), we may calculate si to let the scaled curve pass the point and ti corresponding to the point on the scaled curve as follows.
ii
ii
bKaK
Qs
2 (4)
i
iii bQ
abKKat
232
(5)
Then find the point (K*i, Q
*i) of which t-parameter is equals
to ti on the original quadratic curve with the equation (2). We may now calculate the distance di between (ki, qi) and
(k*i, q
*i) with the following equation.
)1(1
)1(1
44
22
2
2
i
ii
iiiiiii
s
s
ttQb
atK
b
ad
(6)
Fig. 5 illustrates the operation described with the equations (1)-(6). Fig. 6 shows the transformed plot from Q-K onto t-d plane according to each time of day. By introducing those transformations, we may approximate the t-d plot of each time with two-dimensional normal distribution.
3) Calculation of fluidity index The parameter t represents the extent how far from the
origin of MFD along the approximated curve. Within the range [0, 1], 't=0' means 'no traffic', 't=1' means 'fully jammed' condition, and 't=0.5' means 'critical' condition. It is obvious as the t-value gets higher, the fluidity of the traffic will be smaller. Therefore, let us introduce the fluidity index f as follow;
tf 1 (7)
4) Calculation of singularity index In order to quantify the singularity of the traffic condition,
let us regard that the t-d plot of each time of day follows the two-dimensional normal distribution p(t,d) represented by the equation (8).
)1(2
))((2
exp
)1(2
1,
2
22
2
d
d
dt
dt
t
t
dt
ddtt
dtp
(8)
Where, t, d : the mean values of t and d, t, d : the unbiased standard deviations of t and d, : the correlation coefficients between t and d.
For given (ti,di), the generation probability P(ti,di) is calculated as the integral of p(t,d) around (ti,di). Here, let us allow the approximation as the equation (9) by taking the tiny widths t and d to avoid the complication in the integral of the normal distribution. )10,10(,, dtdtdtpdtP iiii (9)
The singularity index Ii for (ti,di) is now given by the entropy of P(ti,di) as follows.
iii dtPI ,log (10)
From the definition of entropy, Ii will be larger when the generation probability p(ti,di) is getting small.
III. CASE STUDIES IN TOKYO CITY CENTER
For the demonstration purpose, the fluidity and the singularity indices were calculated for some interested days.
In the following examples, we have used the FCD of approximately 3000 in-service taxis operating in the Tokyo city center. The FCD from the empty trips and the traverse on expressways were filtered.
The period of the data collection is from September to November in 2009. Same as the example in the chapter II, the size of the mesh is 1 km in length and breadth and the aggregation period is 1 hour. The meanings of the color are also the same as well. For convenience, only major arterial roads are figured on the pictures of mesh-wised indices to know the location of the map.
Fig. 7 is an example for the 'ordinary' weekday (Wed. Oct. 7, 2010). We may see, from the fluidity pictures in the upper row, the congestion arises at around the fringe of the city center (8~9 am) at first, then penetrates into the center later
Fig. 5. Transformation of aggregated Q-K values to t-d values.
Transformation of MFD onto t-d space(weekdays, mesh#533936_00)
-0.6
-0.4
-0.2
0.0
0.2
0.4
0 0.05 0.1 0.15 0.2 0.25 0.3
t: fluidity
d: d
iffe
renc
e fr
on a
ppro
x. c
urv
5~7am 7~11am 11am~3pm 3~7pm 7~9pm
Q
Kt=0 t=1
t=0.5
-b/a-b/2a
Q=aK2+bK
(Ki, Qi)(si, ti)
Q=si(aK2+bK)
di (K*i, Q
*i)(1, ti)
Fig. 6. The transformed t-d plot from Q-K values for the weekdays.
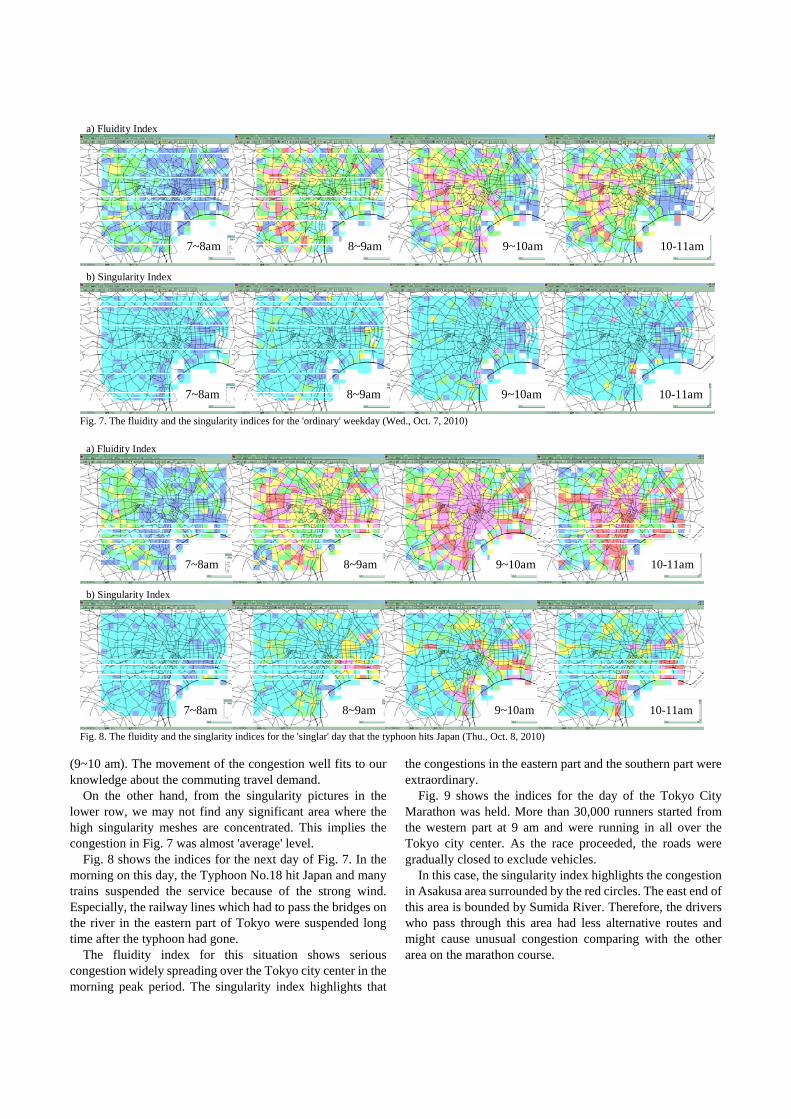
(9~10 am). The movement of the congestion well fits to our knowledge about the commuting travel demand.
On the other hand, from the singularity pictures in the lower row, we may not find any significant area where the high singularity meshes are concentrated. This implies the congestion in Fig. 7 was almost 'average' level.
Fig. 8 shows the indices for the next day of Fig. 7. In the morning on this day, the Typhoon No.18 hit Japan and many trains suspended the service because of the strong wind. Especially, the railway lines which had to pass the bridges on the river in the eastern part of Tokyo were suspended long time after the typhoon had gone.
The fluidity index for this situation shows serious congestion widely spreading over the Tokyo city center in the morning peak period. The singularity index highlights that
the congestions in the eastern part and the southern part were extraordinary.
Fig. 9 shows the indices for the day of the Tokyo City Marathon was held. More than 30,000 runners started from the western part at 9 am and were running in all over the Tokyo city center. As the race proceeded, the roads were gradually closed to exclude vehicles.
In this case, the singularity index highlights the congestion in Asakusa area surrounded by the red circles. The east end of this area is bounded by Sumida River. Therefore, the drivers who pass through this area had less alternative routes and might cause unusual congestion comparing with the other area on the marathon course.
7~8am 8~9am 9~10am 10-11am
a) Fluidity Index
b) Singularity Index
7~8am 8~9am 9~10am 10-11am
Fig. 7. The fluidity and the singularity indices for the 'ordinary' weekday (Wed., Oct. 7, 2010)
7~8am 8~9am 9~10am 10-11am
a) Fluidity Index
b) Singularity Index
7~8am 8~9am 9~10am 10-11am
Fig. 8. The fluidity and the singlarity indices for the 'singlar' day that the typhoon hits Japan (Thu., Oct. 8, 2010)

IV. CONCLUSIONS
In this paper, we have proposed the mesh-wised measurement index in terms of the fluidity and the singularity of the area traffic conditions based on the macroscopic fundamental diagram. The fluidity index quantifies how smooth the traffic in the area flows and the singularity index shows how extraordinary the traffic condition from the average.
For the purpose of demonstration, we have studied the fluidity and the singularity indices for a couple of interest days by using the FCD with more than 3000 in-service taxis operating in the Tokyo city center. The case study demonstrates that the mesh-wised fluidity index can express the rough distribution of congestions over the city and the singularity index can highlight the unusually congested area because of whether anomalies, big events, etc.
We believe that the mesh-wised traffic information will be more preferable for the broadcasting on TV than the conventional link-wised traffic information in terms of the area-wide comprehension of congestion. It will affect the travel behaviors of huge number of people to avoid the car use in the extraordinary traffic condition.
There are, however, some remaining issues. The most essential one is the validity of the mesh-wised traffic information. It is possible that taxi trips may not be representative for entire trips. For this issue, the mesh-wised indices with taxi are to be compared with the ones with passenger car in order to be checked the correspondency between them.
Another one would be the discussion on the suitable resolution in terms of mesh size and aggregation time period. The resolution should be fine as much as possible to know the dynamic changes in queue building up or resolving. However,
too fine resolution troubles the steadiness of information provision. We have used 1 km square mesh and 1 hour aggregation period in this study, but it is not a general solution.
Our future works will concern with the following tasks; 1) The aggregation of traffic conditions to distinguish the
direction of traffic. 2) Data fusion with the other spatial data source such as
whether, accident reports, etc. to interpret the traffic conditions.
3) Statistical analysis to find the similarity on the changing pattern of the index for the preparation of 'traffic forecast' service.
ACKNOWLEDGMENT
We would like to thank Mr. Kobayashi in Japan Broadcasting Company (NHK) for his valuable suggestions. Also thank Fujitsu Ltd. to provide us their taxi prove data for the research use.
REFERENCES [1] C. F. Daganzo, “Urban gridlock: macroscopic modeling and mitigation
approaches,” Transportation Research B 41, 49-62; “corrigendum” Transportation Research B 41, 379, 2007.
[2] N. Geroliminis and C. F. Daganzo, “Existence of urban-scale macroscopic fundamental diagrams: some experimental findings,” Working paper, Volvo Center of Excellence on Future Urban Transport, Univ. of California, Berkeley, 2007.
[3] R. Horiguchi and K. Wada, "Effective probe data transmittal with detection of congestion pattern," Proceedings of 11th World Congress on Intelligent Transport Systems, Nagoya, October, 2004.
[4] B. D. Greenshields, "A study of traffic capacity," Highway Research Board Proceedings 14, 1935, pp. 448-477.
11~10am 12~1pm 1~2pm 2~3pm
a) Fluidity Index
b) Singularity Index
11~10am 12~1pm 1~2pm 2~3pm
Start
Goal
Fig. 9. The fluidity and the sigularity indices for the 'singlar' day that the Tokyo City Marathon was held. (Sun., Mar. 22, 2009)