
Towing Operation Methods of Offshore Integrated ... - MDPI
15
Journal of Marine Science and Engineering Article Towing Operation Methods of Offshore Integrated Meteorological Mast for Offshore Wind Farms Hongyan Ding 1,2,3 , Ruiqi Hu 3 , Conghuan Le 1,3, * and Puyang Zhang 1,3 1 State Key Laboratory of Hydraulic Engineering Simulation and Safety, Tianjin University, Tianjin 300072, China; [email protected] (H.D.); [email protected] (P.Z.) 2 Key Laboratory of Coast Civil Structure Safety, Ministry of Education, Tianjin University, Tianjin 300072, China 3 School of Civil Engineering, Tianjin University, Tianjin 300072, China; [email protected] * Correspondence: [email protected] Received: 22 January 2019; Accepted: 3 April 2019; Published: 11 April 2019 Abstract: An offshore integrated meteorological mast (OIMM) is introduced which has great application potential for the development of offshore wind turbine power. This innovative OIMM features in two aspects: the integrated construction and the integrated transportation. Its integrated techniques enable this OIMM to be prefabricated onshore and transported by a relatively small tugboat to the installation site. It is efficient in construction, rapid in transportation and saving in cost. The towing process is an important section for the integrated transportation, which makes the towing operation necessary to investigate. With the numerical simulation software MOSES, the hydrodynamic behavior of the towing operation is investigated. Two special wet towing methods (surface towing and submerged towing) are adopted and analyzed in terms of the towing resistance, towing speed, fairlead position and the motion response. The results show that for both towing methods, to obtain a higher speed by increasing the towing force is uneconomic since the towing resistance increases a much higher percentage than the towing speed dose. Surface towing has a smaller resistance but larger motion response compared to submerged towing. The submerged towing shows a clear descending heave motion. The heave and pitch motions are smaller with the lower fairlead position and fluctuate less with deeper submerged depth. Keywords: offshore integrated meteorological mast (OIMM); towing method; towing resistance; fairlead position; motion response 1. Introduction The development of offshore wind turbine power characteristics is based on the anemometer technology including both meteorological mast structures and measurement devices [1]. While the primary problem for an offshore meteorological mast is associated with the structure design. Offshore meteorological masts are usually required to be installed on a fixed or a floating foundation. It can be expensive to install such a foundation or platform and maintain the instrument in an offshore location [1]. Tianjin University and Dao Da Heavy Industry Company (DDHI) developed an offshore meteorological mast with an innovative foundation as an integrated structure (OIMM) that reduces costs by shortening the installation process and narrowing down the required amount of marine operation equipment [2,3]. This offshore integrated meteorological mast (OIMM) is shown in Figure 1 with the transporting operation. The OIMM excels in two aspects: the integrated construction and the integrated installation. It can be manufactured onshore, hoisted into the sea and wet towed to an installation site. Since the structure has a big triangular floating tank, thus it can be self-floating and wet towed. J. Mar. Sci. Eng. 2019, 7, 100; doi:10.3390/jmse7040100 www.mdpi.com/journal/jmse
-
Upload
khangminh22 -
Category
Documents
-
view
0 -
download
0
Transcript of Towing Operation Methods of Offshore Integrated ... - MDPI

Journal of
Marine Science and Engineering
Article
Towing Operation Methods of Offshore IntegratedMeteorological Mast for Offshore Wind Farms
Hongyan Ding 1,2,3, Ruiqi Hu 3, Conghuan Le 1,3,* and Puyang Zhang 1,3
1 State Key Laboratory of Hydraulic Engineering Simulation and Safety, Tianjin University,Tianjin 300072, China; [email protected] (H.D.); [email protected] (P.Z.)
2 Key Laboratory of Coast Civil Structure Safety, Ministry of Education, Tianjin University,Tianjin 300072, China
3 School of Civil Engineering, Tianjin University, Tianjin 300072, China; [email protected]* Correspondence: [email protected]
Received: 22 January 2019; Accepted: 3 April 2019; Published: 11 April 2019�����������������
Abstract: An offshore integrated meteorological mast (OIMM) is introduced which has greatapplication potential for the development of offshore wind turbine power. This innovative OIMMfeatures in two aspects: the integrated construction and the integrated transportation. Its integratedtechniques enable this OIMM to be prefabricated onshore and transported by a relatively smalltugboat to the installation site. It is efficient in construction, rapid in transportation and saving incost. The towing process is an important section for the integrated transportation, which makesthe towing operation necessary to investigate. With the numerical simulation software MOSES,the hydrodynamic behavior of the towing operation is investigated. Two special wet towing methods(surface towing and submerged towing) are adopted and analyzed in terms of the towing resistance,towing speed, fairlead position and the motion response. The results show that for both towingmethods, to obtain a higher speed by increasing the towing force is uneconomic since the towingresistance increases a much higher percentage than the towing speed dose. Surface towing hasa smaller resistance but larger motion response compared to submerged towing. The submergedtowing shows a clear descending heave motion. The heave and pitch motions are smaller with thelower fairlead position and fluctuate less with deeper submerged depth.
Keywords: offshore integrated meteorological mast (OIMM); towing method; towing resistance;fairlead position; motion response
1. Introduction
The development of offshore wind turbine power characteristics is based on the anemometertechnology including both meteorological mast structures and measurement devices [1]. While theprimary problem for an offshore meteorological mast is associated with the structure design. Offshoremeteorological masts are usually required to be installed on a fixed or a floating foundation. It canbe expensive to install such a foundation or platform and maintain the instrument in an offshorelocation [1]. Tianjin University and Dao Da Heavy Industry Company (DDHI) developed an offshoremeteorological mast with an innovative foundation as an integrated structure (OIMM) that reduces costsby shortening the installation process and narrowing down the required amount of marine operationequipment [2,3]. This offshore integrated meteorological mast (OIMM) is shown in Figure 1 with thetransporting operation. The OIMM excels in two aspects: the integrated construction and the integratedinstallation. It can be manufactured onshore, hoisted into the sea and wet towed to an installationsite. Since the structure has a big triangular floating tank, thus it can be self-floating and wet towed.
J. Mar. Sci. Eng. 2019, 7, 100; doi:10.3390/jmse7040100 www.mdpi.com/journal/jmse

J. Mar. Sci. Eng. 2019, 7, 100 2 of 15
As can be seen in Figure 1, the OIMM has three major components: the upper meteorological mast,the floating tank, and the anti-slide skirt plates (bottom).J. Mar. Sci. Eng. 2019, 7, x FOR PEER REVIEW 2 of 16
Figure 1. Offshore integrated meteorological mast and towing operation.
The design concept of this OIMM is based on many former research [4–6] about the one-step-installation technology applied in the lager-scale composite bucket foundation (CBF). However, the construction and installation process for the OIMM are more simplified and different, because it has a relatively small dimensional size of infrastructure and a much higher superstructure. Generally, the entire OIMM weights about 300 t, and it has a height varying from 90–140 m, which can be adjusted based on specific requirements. The huge floating tank usually has multiple subdivisions inside to function as individual ballast compartments and to facilitate the stability adjustment during the wet-towing. It can also function as a gravity type foundation during the service life. The upper structure is a meteorological mast that carries many wind measurement devices. The bottom anti-slide skirt plates penetrate the sea bed working as suction caissons, and providing horizontal righting moment by the lateral resistance.
Many publications are focused on the offshore structure installation technology to understand the behavior of the structure and estimate the feasibility of this installation process. The basic dynamics of a subsea template, assembled system, were studied by calculating the dynamic forces and displacements by using time integration in SIMO (simulation of marine operations, SESAM package) [7,8]. They estimated the tension of a lift wire by SIMO and a simplified method simulating this dynamic system which agreed well with the experimental investigation. The feasibility of dry transport a TLP (tension leg platform) by a heavy lift transport vessel was studied, and the motion behavior of TLP structure and its transport vessel were evaluated [9]. Eriksson and Kullander [10] conducted a wet towing of a substructure with special equipment and vessels in Sweden. Some researchers focus on the towing stability feature and important influence factors in terms of the different sea conditions for a floating platform and offshore wind turbines [11–14]. A dynamic analysis of the wet tow for a floating wind turbine based on a multi-body model in SESAM has been performed by Ding et al., and the towline force and the stability features are studied [15]. While a comparison of the cost estimation between the dry towing and the wet towing for a semisubmersible platform, conducted by Kim et al. [16], suggests that the wet towing is more cost-saving for this structure. More installation solutions, especially for deepwater structures, backed by engineering tools and numerical simulation methods are discussed by Wang et al. [17] with main characteristics and critical challenges.
Little research has been done on the offshore meteorological mast, especially for the transport operation. Based on the above research, this paper adopts two special wet towing methods to the innovative OIMM and compares the corresponding dynamic performance by using the numerical simulation software MOSES (offshore platform design and installation software). The purpose is to obtain the feasibility of the two towing methods with respect to its reliability and operability. Figure
Figure 1. Offshore integrated meteorological mast and towing operation.
The design concept of this OIMM is based on many former research [4–6] about the one-step-installation technology applied in the lager-scale composite bucket foundation (CBF). However,the construction and installation process for the OIMM are more simplified and different, because ithas a relatively small dimensional size of infrastructure and a much higher superstructure. Generally,the entire OIMM weights about 300 t, and it has a height varying from 90–140 m, which can beadjusted based on specific requirements. The huge floating tank usually has multiple subdivisionsinside to function as individual ballast compartments and to facilitate the stability adjustment duringthe wet-towing. It can also function as a gravity type foundation during the service life. The upperstructure is a meteorological mast that carries many wind measurement devices. The bottom anti-slideskirt plates penetrate the sea bed working as suction caissons, and providing horizontal rightingmoment by the lateral resistance.
Many publications are focused on the offshore structure installation technology to understand thebehavior of the structure and estimate the feasibility of this installation process. The basic dynamics ofa subsea template, assembled system, were studied by calculating the dynamic forces and displacements byusing time integration in SIMO (simulation of marine operations, SESAM package) [7,8]. They estimatedthe tension of a lift wire by SIMO and a simplified method simulating this dynamic system which agreedwell with the experimental investigation. The feasibility of dry transport a TLP (tension leg platform)by a heavy lift transport vessel was studied, and the motion behavior of TLP structure and its transportvessel were evaluated [9]. Eriksson and Kullander [10] conducted a wet towing of a substructure withspecial equipment and vessels in Sweden. Some researchers focus on the towing stability feature andimportant influence factors in terms of the different sea conditions for a floating platform and offshore windturbines [11–14]. A dynamic analysis of the wet tow for a floating wind turbine based on a multi-bodymodel in SESAM has been performed by Ding et al., and the towline force and the stability features arestudied [15]. While a comparison of the cost estimation between the dry towing and the wet towing fora semisubmersible platform, conducted by Kim et al. [16], suggests that the wet towing is more cost-savingfor this structure. More installation solutions, especially for deepwater structures, backed by engineeringtools and numerical simulation methods are discussed by Wang et al. [17] with main characteristics andcritical challenges.
Little research has been done on the offshore meteorological mast, especially for the transportoperation. Based on the above research, this paper adopts two special wet towing methods to theinnovative OIMM and compares the corresponding dynamic performance by using the numerical

J. Mar. Sci. Eng. 2019, 7, 100 3 of 15
simulation software MOSES (offshore platform design and installation software). The purpose isto obtain the feasibility of the two towing methods with respect to its reliability and operability.Figure 2 demonstrates the detailed information of the applied towing methods: the surface towingand the submerged towing (or subsurface towing). As for the submerged towing method, the mooringpoint can either be attached to the floating tank (fairlead 1) or to the mast (fairlead 2). While for thesurface towing method, the mooring point is attached to the floating tank (fairlead 1). The OIMM isdesigned to be suitable for a water depth around 50 m. Therefore, when performing a submergedtowing simulation, the submerged depth of the OIMM is defined varying within 0–40 m. For thesurface towing method, it is simple with only one submerged depth (draft). The towing resistancebased on these two methods is obtained and compared between the MOSES simulation and the manualcomputation method. The towing speed and hydrodynamic motion responses relating to the mooringpositions are also considered and compared. The results can provide recommendations and referencesfor the estimation of the feasibility of the two methods and on the optimization of the towing operationfor OIMM.
The paper is organized as follows. Section 2 introduces the relevant methods for the computationof the towing resistance and the hydrodynamic theory. A comparison of towing resistance between thenumerical method and manual method is shown in Section 3, as well as the detailed explanations aboutthe towing speed and the mooring positions. Section 4 illustrates the results based on the discussionin Section 3, and conclusions are drawn in Section 5.
J. Mar. Sci. Eng. 2019, 7, x FOR PEER REVIEW 3 of 16
2 demonstrates the detailed information of the applied towing methods: the surface towing and the submerged towing (or subsurface towing). As for the submerged towing method, the mooring point can either be attached to the floating tank (fairlead 1) or to the mast (fairlead 2). While for the surface towing method, the mooring point is attached to the floating tank (fairlead 1). The OIMM is designed to be suitable for a water depth around 50 m. Therefore, when performing a submerged towing simulation, the submerged depth of the OIMM is defined varying within 0–40 m. For the surface towing method, it is simple with only one submerged depth (draft). The towing resistance based on these two methods is obtained and compared between the MOSES simulation and the manual computation method. The towing speed and hydrodynamic motion responses relating to the mooring positions are also considered and compared. The results can provide recommendations and references for the estimation of the feasibility of the two methods and on the optimization of the towing operation for OIMM.
The paper is organized as follows. Section 2 introduces the relevant methods for the computation of the towing resistance and the hydrodynamic theory. A comparison of towing resistance between the numerical method and manual method is shown in Section 3, as well as the detailed explanations about the towing speed and the mooring positions. Section 4 illustrates the results based on the discussion in Section 3, and conclusions are drawn in Section 5.
Towing direction
Water surface
Subsurface towing
Mooring line
Tug boatMooring line
Fairlead 1
Fairlead 2
Water surface
Surface towing
Tug boatMooring lineFairlead 1
Figure 2. Surface towing and submerged towing methods.
2. Theory Background
The towing resistance is a basic parameter, on which the towing system depends. The estimation methods have been investigated by many researchers [18,19] in terms of the speed reduction and numerical calculation. The total resistance for different sea states can be described by four different types of resistance: surface friction, energy loss due to wave generating, energy loss due to current, wind resistance. For low speed towing, the surface friction counts for a majority. According to DNV-RP-H103 [20], the tug will have the maximum towing force at zero velocity and in the absence of wind, waves and current, and the available towing force decreases with forward velocity. In this paper, the towing resistance is obtained from two methods: the numerical computation by MOSES, and the manual computation by the Guidelines for Towage at Sea (CCS code) [21].
2.1. Towing Resistance By MOSES
In MOSES, the towing resistance is primarily influenced by the wind force and the viscous drag force. The viscous drag force is illustrated as a portion of the system which is the velocity squared
Figure 2. Surface towing and submerged towing methods.
2. Theory Background
The towing resistance is a basic parameter, on which the towing system depends. The estimationmethods have been investigated by many researchers [18,19] in terms of the speed reduction andnumerical calculation. The total resistance for different sea states can be described by four differenttypes of resistance: surface friction, energy loss due to wave generating, energy loss due to current,wind resistance. For low speed towing, the surface friction counts for a majority. According toDNV-RP-H103 [20], the tug will have the maximum towing force at zero velocity and in the absence ofwind, waves and current, and the available towing force decreases with forward velocity. In this paper,the towing resistance is obtained from two methods: the numerical computation by MOSES, and themanual computation by the Guidelines for Towage at Sea (CCS code) [21].

J. Mar. Sci. Eng. 2019, 7, 100 4 of 15
2.1. Towing Resistance By MOSES
In MOSES, the towing resistance is primarily influenced by the wind force and the viscous dragforce. The viscous drag force is illustrated as a portion of the system which is the velocity squaredterm in Morison’s equation, the viscous roll damping, or the viscous drag on a piece. This can beeither an excitation due to wave or current, or a damping in still water [22]. Generally, MOSESemploys three hydrodynamic theories: Morison’s equation, strip theory, and 3D-diffraction theory.The Morison’s Equation is used for beam element and the viscous drag will be computed. For panelmodel, the 3D-diffraction theory is applied.
The drag force on a cylinder in an unsteady viscous flow is determined by Morison’s Equation,which consists of a combination of an inertia term and a drag term:
dF = ρπD2
4CM
..V +
ρ
2CDD|V|V (1)
where dF is the force per unit length of a cylinder [N/m], D is the diameter of cylinder [m], ρ is thedensity of fluid [kg/m3], CM is the mass coefficient, CD is the drag coefficient,
..V is the acceleration [m/s2].
Drag force on submerged element consists mainly of friction resistance and pressure resistance.Friction resistance can be expressed as:
F =12
CFρV2S (2)
where F is the friction resistance on object [N] and V is the towing velocity [m/s]. CF is the dimensionlessfriction coefficient depended on the Reynolds number. S is the wet surface area of the object [m2].
The pressure distribution on panel element can be found by velocity potential function andBernoulli’s equation with boundary conditions [23].
V = ∇Φ ≡ i∂Φ∂x
+ j∂Φ∂y
+ k∂Φ∂z
(3)
p + ρgz + ρ∂Φ∂t
+ρ
2V·V = C (4)
where p is the pressure in Bernoulli’s equation, C is an arbitrary function of time.
2.2. Towing Resistance By Code
As for the manual computation, the Guidelines for Towage at Sea (CCS code) provides an estimationof ocean towage resistance considering the towing speed, by the following empirical equation:
RT = 1.15[R f + RB + (R f t + RBt)] kN (5)
R f = 1.67A1V1.83× 10−3 kN (6)
RB = 0.147δA2V1.74+0.15V kN (7)
where: Rf and RB are the friction and the residual resistance of towed vessel, in kN; Rft and RBt arethe friction and the residual resistance of towing vessel, in kN; A1 is the wetted surface area underwaterline of vessel or surface structure, in m2; V is the towage velocity, in m/s; δ is the block coefficient;A2 is the submerged transverse section area amidships, in m2. Rf is the residual resistance of towingvessel, in kN.
For drilling units or other surface structures with huge wind area, the towage resistance is also tobe calculated as follows, taken whichever is greater:∑
R = 0.7(R f + RB) + Ra kN (8)
J. Mar. Sci. Eng. 2019, 7, 100 5 of 15
Ra = 0.5ρV2∑
CxAi × 10−3 kN (9)
where: Rf and RB are the same as (1) above, and the Ra is the air resistance; ρ is the air density, to betaken as 1.22 kg/ m3; V is the wind velocity, to be taken as 20.6 m/s; Ai is the wind area, to be taken asupwind, in m2; Cx is the configuration coefficient of wind area.
Equations (5)–(9) are applied to compute the total towing resistance of the floating tank andthe upper meteorological mast. The resistance of the towing vessel (tugboat) is not included in thetotal resistance so that it can be compared with numerical results for which the towing resistance isgiven separately.
The sea states in MOSES are defined according to the items in CCS guidelines. The wind velocityis 20.6 m/s, and the current velocity is 0.5 m/s. The towing speed is 3 m/s with a significant wave heightof 2 m.
The results of towing resistance based on this code will be analyzed in Section 3.
2.3. The Hydrodynamic Theory
The motion of the OIMM is featured by the free surface boundary condition, which is nonlinearand makes the description of the body motion complex. Based on the potential theory, the dynamicresponses of marine structures are widely studied. The problem of hydrodynamics can be formulatedin terms of potential theory based on the following assumptions:
The sea water is assumed incompressible and inviscid. The fluid motion is irrotational. Viscouseffects are neglected and the fluid is assumed to be incompressible. The depth h is finite and constantand the free surface is infinite in all directions. Assumed the motion of the body and the fluid to besmall for a linearization of the boundary condition and free surface condition.
A velocity potential φ can be used to describe the fluid velocity vector V (x, y, z) = (u, v, w) at timet at the point X = (x, y, z) in a cartesian coordinate system fixed in space [23].
It is convenient to decompose the total velocity potential in the alternative forms [24]:
φ = φ0e−iwt + φ7e−iwt +6∑
i=1
φi.ηi (10)
where φ0e−iwt is the velocity potential of the incident wave system; φ7e−iwt is the scattered field dueto the presence of the body; the diffraction problem can be solved by considering the φ0 and the φ7
together; φi, i = 1–6, is the contribution to the velocity potential from the ith mode of motion. Thereforethe φi (i = 1–6) is called the radiation potential.
The towing dynamic problem in this paper is analyzed separately by whether or not consideringthe forward speed. To achieve that, we change the forward speed by applying different towing force.In two ways, the system has no forward speed. One is to tow the structure with a limited force andkeep the OIMM to its initial position without moving forward. Another way is that the towing tugboatis fixed in the global system and the OIMM connected with the tugboat by a mooring line, and thenthe OIMM can oscillate under the environment loadings.
3. Comparisons and Analyses
3.1. Towing Resistance in Different Towing Methods
In Section 2, the numerical method and the manual computation method have been introducedto obtain the towing resistance. The results are shown in this section and analyzed in Section 4.The towing resistance is compared based on the surface towing and the submerged towing. As forthe submerged towing, the towing resistance of the OIMM is different if the initial submerged depthchanges. Therefore, four submerged depths are considered and compared by the manual methodand the numerical methods. For the surface towing, only one submerged depth (draft) is consideredbecause the vertical height of the floating tank is small (shown in Figure 1). The OIMM can be

J. Mar. Sci. Eng. 2019, 7, 100 6 of 15
self-floating with a draft of 0.85 m which has been verified to be able to maintain adequate floatingstability. Thus, this draft is used for the surface towing.
The towing resistance for submerged towing computed by the manual method and the numericalmethod has been tabled in four groups corresponding to four submerged conditions (10 m, 20 m,30 m, 40 m). For both numerical and manual methods, the resistance caused by the mooring line isnot considered. The wind force listed in Table 1 is based on the CCS code and the wind force on thefloating tank is not considered. The detailed computation of the towing resistance is listed in Table 2.
Table 1. Wind force of OIMM (meteorological mast).
Elevation/m 90–80 80–70 70–60 60–50 50–40 40–30 30–20 20–10 0–10
Area/m2 5.19 8.55 10.71 10.82 13.66 14.39 17.12 20.56 33.09Wind force/kN 1.923 3.165 3.799 4.843 3.649 4.245 4.875 5.855 8.565
Note: The elevation is positive in vertical upward direction.
Table 2. Towing resistance by CCS code.
ItemsWave & Current/t
Wind Force/t Total/tFloating Tank Tower
Surface towing 11.66 0.00 4.09 15.75Submerged 10 m 20.28 5.58 3.89 29.75Submerged 20 m 20.28 9.04 3.58 32.90Submerged 30 m 20.28 11.92 3.20 35.40Submerged 40 m 20.28 14.22 2.72 37.22
Note: The submerged depth and blockage impacts are not considered here.
In MOSES, a time domain simulation was conducted and the required towing force was adjustedaccording to the final velocity of the OIMM. The towing resistance is compared under the same towingspeed. The wind force and the towing resistant by MOSES are shown in Table 3.
Table 3. Towing resistance by MOSES.
Items Wind Force/t Towing Resistance/t
Surface towing 5.34 17.94Submerged 10 m 3.01 32.56Submerged 20 m 2.32 39.35Submerged 30 m 1.73 48.42Submerged 40 m 1.51 51.21
The wind forces from Tables 2 and 3 are generally agreed. More detailed discussion is presentedin Section 4.1.
3.2. Towing with Forward Speed
In this section, the relation among the towing resistance, towing methods, and the resulted speedare analyzed. The analyses results will provide the towing operation with suggestions on feasibleenvironment conditions and the choice of possible towing equipment.
In Section 2.2, it has been illustrated that the total potential can be investigated in terms of theradiation potential and the diffraction potential separately. The radiation problem does not consideran incident wave. Therefore, the towing operation can be investigated by whether including the waveand current loads. This can be achieved directly by the numerical method.
In addition, the towing operation performed in the calm sea condition with a forward speed willbe compared in terms of the surface towing and the submerged towing. For both towing operations,optional towing velocity is around 3–5 knots [7]. Therefore, four different velocities (0 m/s, 1 m/s, 2 m/s,
J. Mar. Sci. Eng. 2019, 7, 100 7 of 15
3 m/s) are chosen to compare the towing resistance and towing stability in complex loading states.As has been mentioned, the zero forward speed can be achieved by exerting a limited towing force.
Moreover, another towing operation is performed as a comparison with zero forward speedachieved by fixing the tugboat in the global system. The simulation is performed in both surfacetowing and submerged towing. The wave, current and wind loads are taken in to account. The towingforce is not needed when the tugboat is fixed. The results of the comparison are shown in Section 4.2.
3.3. Mooring Positions
This section focuses on the feasibility and superiority of the mooring positions (fairlead positions)based on two towing methods. Generally, the surface towing method is applied to the self-floatingobjects and the large structures will adopt the submerged towing [25]. Considering the high-risefeature of the OIMM, both towing methods can be applied. For the surface towing, only one fairleadposition, fairlead 1 is taken. As for the submerged towing, both fairlead 1 and fairlead 2 can beapplied. The dynamic performance of this towing system relates to the mooring positions, because theorientation and the position of the applied towing force are associated with the fairlead positions.
To eliminate the additional effect by the towline and tugboat, the towing system is simplified bysubstitute the towline with a constant horizontal force, which will provide the driving force to OIMM.In this simplified system, the only interaction is the environment loading with OIMM.
In addition, for each mooring position, the dynamic features of the submerged towing are furthercompared in terms of the submerged depth. This comparative analysis will be a more valuablereference when the OIMM is higher and the sea is deeper. With different submerged depths, not onlythe towing resistance but also the motion responses will change. The impact caused by fairleadpositions on the dynamic motion responses of the OIMM are compared in heave and pitch motions.The results are discussed in Section 4.3 which may be benefit the optimization of the towing operationand maneuverability of the towed structures.
4. Results and Discussions
4.1. Towing Resistance
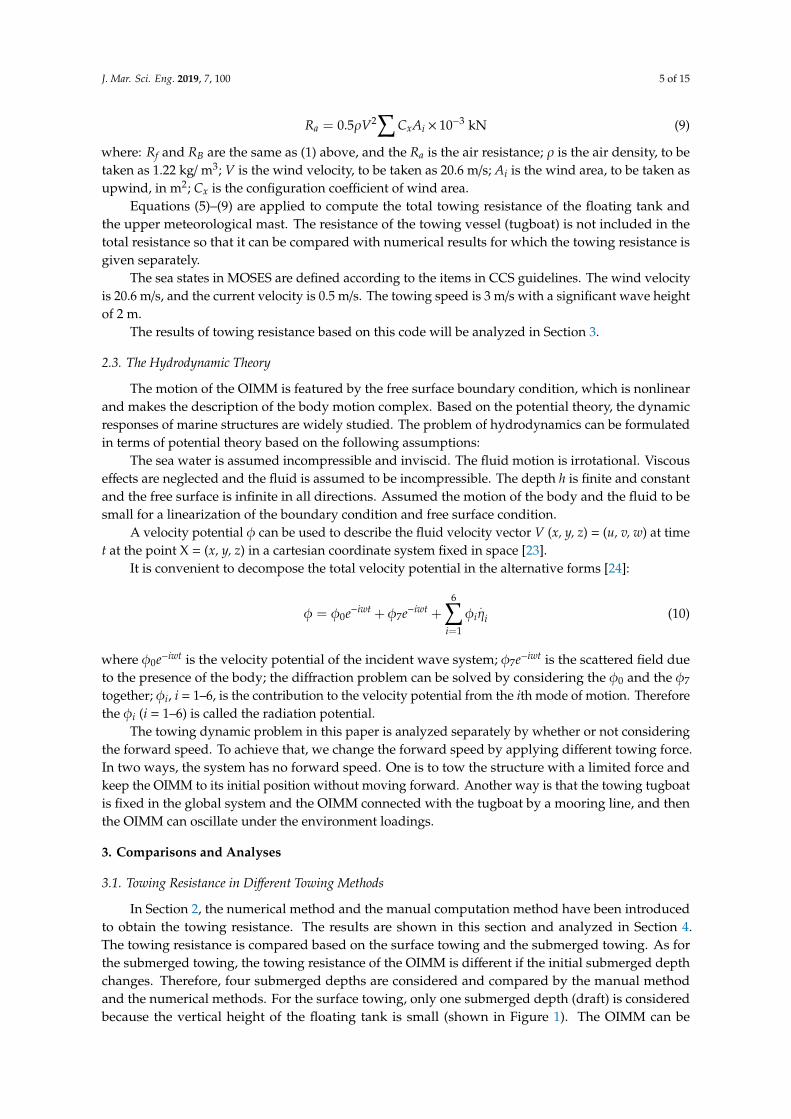
In this section, the towing resistance obtained by two methods (MOSES and CCS code) isdiscussed. Two towing methods are distinguished by the submerged depth. Specifically, the surfacetow corresponds to the shallowest submerged depth and the submerged tow includes four differentdepths (10 m, 20 m, 30 m, 40 m). The comparison is shown in Figure 3.
J. Mar. Sci. Eng. 2019, 7, x FOR PEER REVIEW 7 of 16
optional towing velocity is around 3–5 knots [7]. Therefore, four different velocities (0 m/s, 1 m/s, 2 m/s, 3 m/s) are chosen to compare the towing resistance and towing stability in complex loading states. As has been mentioned, the zero forward speed can be achieved by exerting a limited towing force.
Moreover, another towing operation is performed as a comparison with zero forward speed achieved by fixing the tugboat in the global system. The simulation is performed in both surface towing and submerged towing. The wave, current and wind loads are taken in to account. The towing force is not needed when the tugboat is fixed. The results of the comparison are shown in Section 4.2.
3.3. Mooring Positions
This section focuses on the feasibility and superiority of the mooring positions (fairlead positions) based on two towing methods. Generally, the surface towing method is applied to the self-floating objects and the large structures will adopt the submerged towing [25]. Considering the high-rise feature of the OIMM, both towing methods can be applied. For the surface towing, only one fairlead position, fairlead 1 is taken. As for the submerged towing, both fairlead 1 and fairlead 2 can be applied. The dynamic performance of this towing system relates to the mooring positions, because the orientation and the position of the applied towing force are associated with the fairlead positions.
To eliminate the additional effect by the towline and tugboat, the towing system is simplified by substitute the towline with a constant horizontal force, which will provide the driving force to OIMM. In this simplified system, the only interaction is the environment loading with OIMM.
In addition, for each mooring position, the dynamic features of the submerged towing are further compared in terms of the submerged depth. This comparative analysis will be a more valuable reference when the OIMM is higher and the sea is deeper. With different submerged depths, not only the towing resistance but also the motion responses will change. The impact caused by fairlead positions on the dynamic motion responses of the OIMM are compared in heave and pitch motions. The results are discussed in Section 4.3 which may be benefit the optimization of the towing operation and maneuverability of the towed structures.
4. Results and Discussions
4.1. Towing Resistance
In this section, the towing resistance obtained by two methods (MOSES and CCS code) is discussed. Two towing methods are distinguished by the submerged depth. Specifically, the surface tow corresponds to the shallowest submerged depth and the submerged tow includes four different depths (10 m, 20 m, 30 m, 40 m). The comparison is shown in Figure 3.
10
20
30
40
50
60
SD40 mSD30 mSD20 mSD10 m
Tow
ing
resi
stan
ce (
t)
CCS MOSES
Surface tow
SD: Submerged Depth Figure 3. Towing resistances by two method (MOSES and CCS code) under surface tow and submerged tow.
J. Mar. Sci. Eng. 2019, 7, 100 8 of 15
Figure 3 depicts the variations of the towing resistance between numerical method and manualcomputation (CCS). Basically, the surface towing method has the lowest towing resistance suggestingthat the surface friction force caused by current and wave accounts for a large part of the towingresistance. In Section 3.1, from Tables 2 and 3, the wind forces by MOSES and CCS code are basicallyagreed. Thus, the total resistance is dominated by wave and current loadings. However, the growthof towing resistance by numerical method is much higher than that by CCS code, especially for thesubmerged towing.
The difference is quite small for the surface tow and shallow submerged tow. The maximumdifferent is around 37% corresponding to the submerged depth of 40 m. This increased differencebetween MOSES and CCS methods can be accounted for by the submerged area of the slender structure(meteorological mast) which increase as the depth goes deeper. That is, the Morison’s Equation wasused in MOSES to compute the wave and current interaction on beam element (meteorological mast),while for CCS code, the entire submerged part adopted the same estimation method. The figure impliesthat the CCS code comparatively underestimates the towing resistance, especially for submergedconditions with slender part.
Other reasons accounting for the overestimation may because that the sea environment performedin MOSES is irregular wave condition and the current induced force is more sensitive to the panelmodel for diffraction. Moreover, the resistance growth by CCS code mainly results from the increaseof the wet surface of the meteorological mast which is quite limited and the friction and the residualresistance of the floating tank does not change under the water. While by the numerical method, aslender structure will make a difference because of the Morison’s Equation.
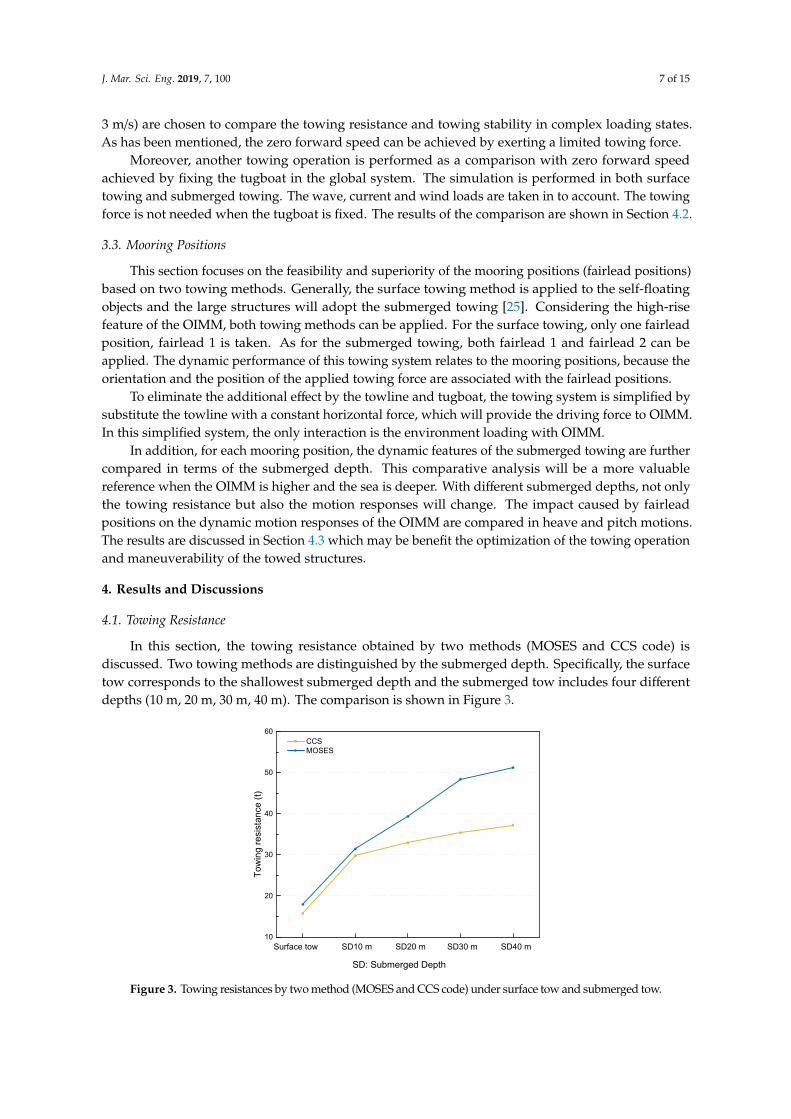
For this high-rise structure, the wind force can be significant compared with the wave and currentloads, which should be considered. To analyze the individual effects of environment loadings, thesurface towing was performed. It means the water plane and wet surface were the same, and then thetowing resistance caused by the wave and current is the same. Besides the wind load is at the maximumsince the entire mast is above the surface. The towing force is balanced with the resistance and resultsin a stable forward speed. In Figure 4, wind, wave and current effects are separately investigated interms of the induced forward speed and they are compared with the total effect. The total effect meansall environment loads are considered. The towing force applied to the system varies from 5–25 t.
J. Mar. Sci. Eng. 2019, 7, x FOR PEER REVIEW 8 of 16
Figure 3. Towing resistances by two method (MOSES and CCS code) under surface tow and submerged tow.
Figure 3 depicts the variations of the towing resistance between numerical method and manual computation (CCS). Basically, the surface towing method has the lowest towing resistance suggesting that the surface friction force caused by current and wave accounts for a large part of the towing resistance. In Section 3.1, from Tables 2 and 3, the wind forces by MOSES and CCS code are basically agreed. Thus, the total resistance is dominated by wave and current loadings. However, the growth of towing resistance by numerical method is much higher than that by CCS code, especially for the submerged towing.
The difference is quite small for the surface tow and shallow submerged tow. The maximum different is around 37% corresponding to the submerged depth of 40 m. This increased difference between MOSES and CCS methods can be accounted for by the submerged area of the slender structure (meteorological mast) which increase as the depth goes deeper. That is, the Morison’s Equation was used in MOSES to compute the wave and current interaction on beam element (meteorological mast), while for CCS code, the entire submerged part adopted the same estimation method. The figure implies that the CCS code comparatively underestimates the towing resistance, especially for submerged conditions with slender part.
Other reasons accounting for the overestimation may because that the sea environment performed in MOSES is irregular wave condition and the current induced force is more sensitive to the panel model for diffraction. Moreover, the resistance growth by CCS code mainly results from the increase of the wet surface of the meteorological mast which is quite limited and the friction and the residual resistance of the floating tank does not change under the water. While by the numerical method, a slender structure will make a difference because of the Morison’s Equation.
For this high-rise structure, the wind force can be significant compared with the wave and current loads, which should be considered. To analyze the individual effects of environment loadings, the surface towing was performed. It means the water plane and wet surface were the same, and then the towing resistance caused by the wave and current is the same. Besides the wind load is at the maximum since the entire mast is above the surface. The towing force is balanced with the resistance and results in a stable forward speed. In Figure 4, wind, wave and current effects are separately investigated in terms of the induced forward speed and they are compared with the total effect. The total effect means all environment loads are considered. The towing force applied to the system varies from 5–25 t.
5 10 15 20 250
4
8
12
16
Spe
ed (
m/s
)
Towing force (t)
current wind wave total
Figure 4. Comparison between the towing speed under different sea loads varying with the towing force by MOSES.
As shown in Figure 4, generally the current induced speed line is closest to the total effect line. Wave occupies much less impact when the forward speed is higher. The wind load has a dominant
Figure 4. Comparison between the towing speed under different sea loads varying with the towingforce by MOSES.
As shown in Figure 4, generally the current induced speed line is closest to the total effect line.Wave occupies much less impact when the forward speed is higher. The wind load has a dominanteffect only when the towing force at the lowest level and it declines significantly afterward. In general,

J. Mar. Sci. Eng. 2019, 7, 100 9 of 15
Figure 4 suggests that for OIMM the wave and current loads are dominant for normal towing speeds(above 1 m/s), which supports the increased difference shown in Figure 3. Since the submergedpart of the mast is not considered in manual results and the current and wave loads on this partare considerable.
4.2. Forward Speed
In this section, the towing resistance under different forward speeds are compared. The towingresistance is defined as the viscous drag force in MOSES. The resistance variations are compared ina time domain for both surface towing and subsurface towing. The comparison is considered from twoperspectives: zero-speed and none-zero speed. This has been illustrated in Section 3.2. Two loadingenvironments are defined for the none-zero speed towing. One does not consider the wave and currentloadings (the still water condition). The other is normal including all environment loadings. Noticethat the towing force applied to the still water condition was the same as that applied to the speedcondition of 3 m/s.
Figure 5 shows the time domain results of the viscous drag force for the surface towing. Viscousdrag curves fluctuate significantly as towing speed increases because of the free surface effects on thefloating tank. The dynamic motion under higher speed conditions is larger because the wet surfacearea varies significantly and accounts for this fluctuation. The fixed condition shows a similar variationas the 0 m/s speed condition. The viscous drag forces for the fixed and the 0 m/s speed conditionsare the lowest, which is reasonable because the resistance is in proportion to the second order of thevelocity term. That is, the lower speed corresponds to lower sea loads. The still water condition hasa close and smaller viscous resistance as the 3 m/s speed condition since the same towing force wasapplied for them and the latter has wave and current induced resistance. Without the wave and current,the viscous drag curve is smooth. In addition, the viscous resistance increases by around 20% for everyspeed increase of 1 m/s.
J. Mar. Sci. Eng. 2019, 7, x FOR PEER REVIEW 9 of 16
effect only when the towing force at the lowest level and it declines significantly afterward. In general, Figure 4 suggests that for OIMM the wave and current loads are dominant for normal towing speeds (above 1 m/s), which supports the increased difference shown in Figure 3. Since the submerged part of the mast is not considered in manual results and the current and wave loads on this part are considerable.
4.2. Forward Speed
In this section, the towing resistance under different forward speeds are compared. The towing resistance is defined as the viscous drag force in MOSES. The resistance variations are compared in a time domain for both surface towing and subsurface towing. The comparison is considered from two perspectives: zero-speed and none-zero speed. This has been illustrated in Section 3.2. Two loading environments are defined for the none-zero speed towing. One does not consider the wave and current loadings (the still water condition). The other is normal including all environment loadings. Notice that the towing force applied to the still water condition was the same as that applied to the speed condition of 3 m/s.
Figure 5 shows the time domain results of the viscous drag force for the surface towing. Viscous drag curves fluctuate significantly as towing speed increases because of the free surface effects on the floating tank. The dynamic motion under higher speed conditions is larger because the wet surface area varies significantly and accounts for this fluctuation. The fixed condition shows a similar variation as the 0 m/s speed condition. The viscous drag forces for the fixed and the 0 m/s speed conditions are the lowest, which is reasonable because the resistance is in proportion to the second order of the velocity term. That is, the lower speed corresponds to lower sea loads. The still water condition has a close and smaller viscous resistance as the 3 m/s speed condition since the same towing force was applied for them and the latter has wave and current induced resistance. Without the wave and current, the viscous drag curve is smooth. In addition, the viscous resistance increases by around 20% for every speed increase of 1 m/s.
0 50 100 150 200 250 3000
10
20
30
40
50
60
Vis
cous
Dra
g (t)
Time (s)
speed=0 m/s speed=1 m/s speed=2 m/s speed=3 m/s still water fixed
Figure 5. Comparison between the time history curves of the viscous drag force under different towing speeds for surface towing.
Figure 6 illustrates the time domain results of the viscous drag force of the submerged towing. The submerged depth is 40 m. The resistance curve fluctuates much less than that of the surface towing, which is because the water plane is much smaller. The resistance force increases significantly as each additional growth of the towing speed. More specifically, the resistance force nearly doubled for each additional towing speed. The fixed condition presents a similar variation as that of the 0 m/s
Figure 5. Comparison between the time history curves of the viscous drag force under different towingspeeds for surface towing.
Figure 6 illustrates the time domain results of the viscous drag force of the submerged towing.The submerged depth is 40 m. The resistance curve fluctuates much less than that of the surfacetowing, which is because the water plane is much smaller. The resistance force increases significantlyas each additional growth of the towing speed. More specifically, the resistance force nearly doubledfor each additional towing speed. The fixed condition presents a similar variation as that of the
J. Mar. Sci. Eng. 2019, 7, 100 10 of 15
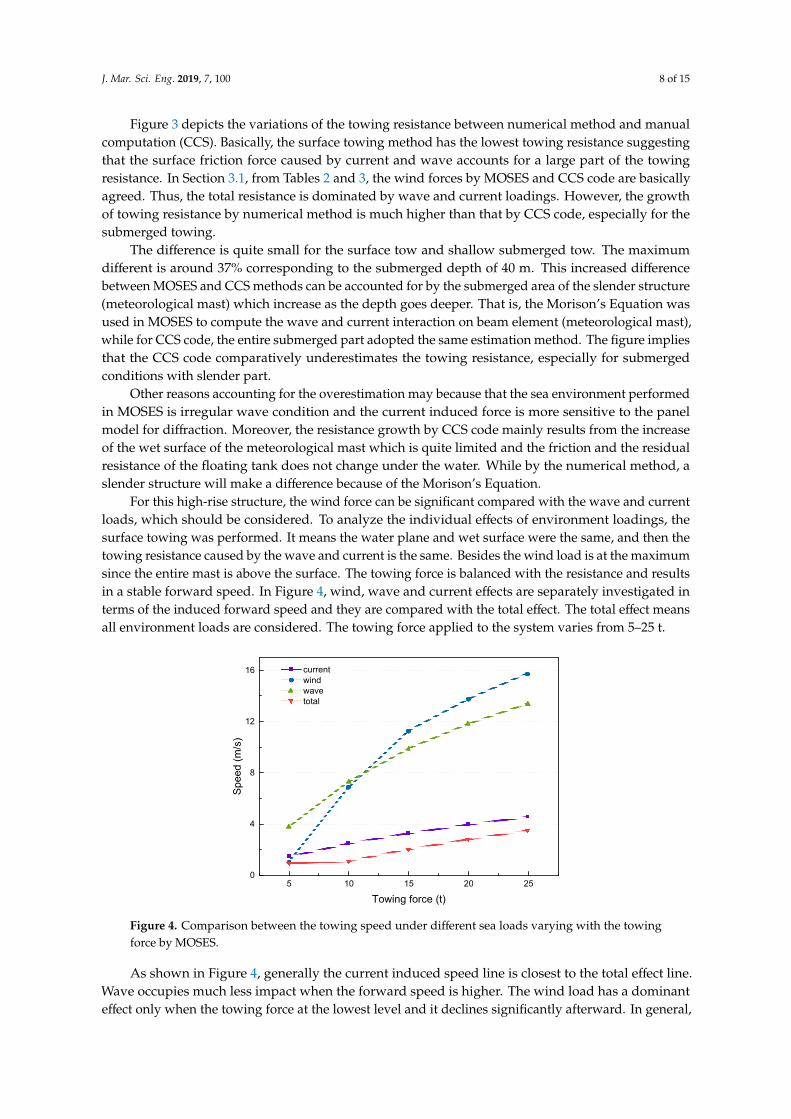
0 m/s speed condition. As for the still water condition, basically it has a close and smaller viscousresistance similar to that of the 3 m/s speed condition since the same towing force was applied for them.Likewise, the time history curve is smooth for the still water condition. Generally, the towing processfor submerged towing is more stable, which can be beneficial from a practical perspective.
J. Mar. Sci. Eng. 2019, 7, x FOR PEER REVIEW 10 of 16
speed condition. As for the still water condition, basically it has a close and smaller viscous resistance similar to that of the 3 m/s speed condition since the same towing force was applied for them. Likewise, the time history curve is smooth for the still water condition. Generally, the towing process for submerged towing is more stable, which can be beneficial from a practical perspective.
0 50 100 150 200 250 3000
10
20
30
40
50
60
70
Vis
cous
Dra
g (t
)
Time (s)
speed=0 m/s speed=1 m/s speed=2 m/s speed=3 m/s still water fixed
Figure 6. Comparison between the time history curves of the viscous drag force under different towing speeds for submerged towing (submerged depth: 40 m).
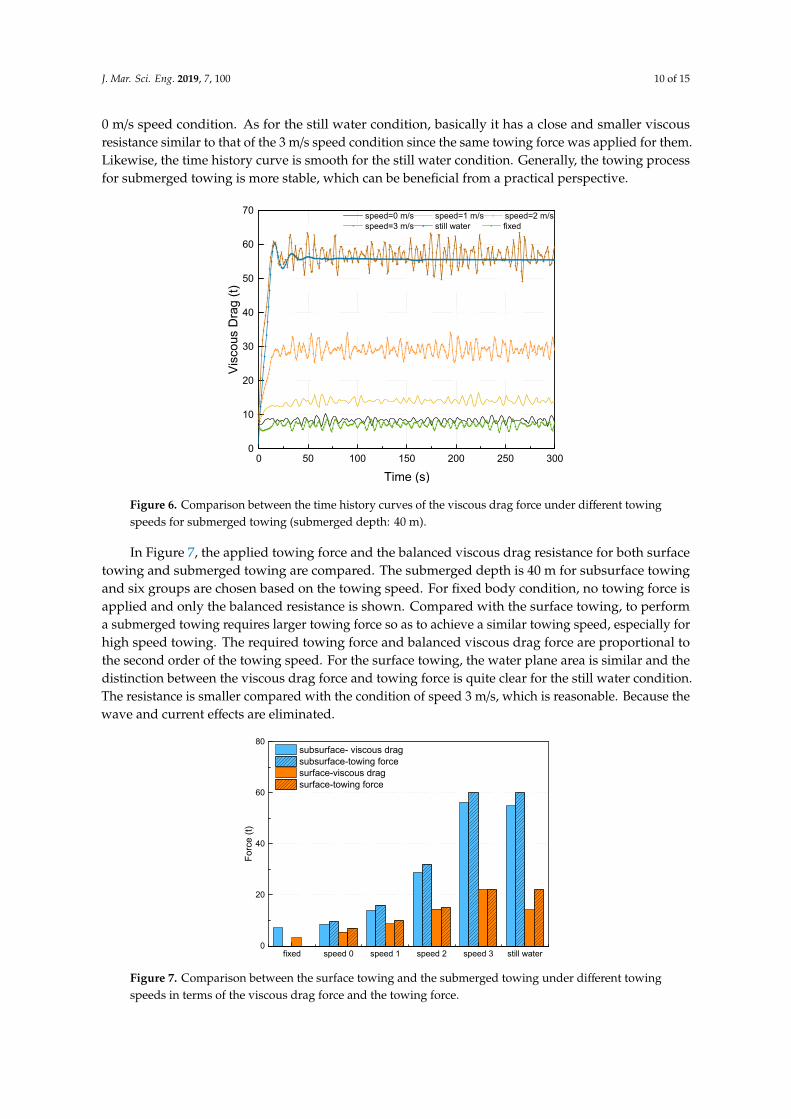
In Figure 7, the applied towing force and the balanced viscous drag resistance for both surface towing and submerged towing are compared. The submerged depth is 40 m for subsurface towing and six groups are chosen based on the towing speed. For fixed body condition, no towing force is applied and only the balanced resistance is shown. Compared with the surface towing, to perform a submerged towing requires larger towing force so as to achieve a similar towing speed, especially for high speed towing. The required towing force and balanced viscous drag force are proportional to the second order of the towing speed. For the surface towing, the water plane area is similar and the distinction between the viscous drag force and towing force is quite clear for the still water condition. The resistance is smaller compared with the condition of speed 3 m/s, which is reasonable. Because the wave and current effects are eliminated.
fixed speed 0 speed 1 speed 2 speed 3 still water0
20
40
60
80
For
ce (
t)
subsurface- viscous drag subsurface-towing force surface-viscous drag surface-towing force
Figure 6. Comparison between the time history curves of the viscous drag force under different towingspeeds for submerged towing (submerged depth: 40 m).
In Figure 7, the applied towing force and the balanced viscous drag resistance for both surfacetowing and submerged towing are compared. The submerged depth is 40 m for subsurface towingand six groups are chosen based on the towing speed. For fixed body condition, no towing force isapplied and only the balanced resistance is shown. Compared with the surface towing, to performa submerged towing requires larger towing force so as to achieve a similar towing speed, especially forhigh speed towing. The required towing force and balanced viscous drag force are proportional tothe second order of the towing speed. For the surface towing, the water plane area is similar and thedistinction between the viscous drag force and towing force is quite clear for the still water condition.The resistance is smaller compared with the condition of speed 3 m/s, which is reasonable. Because thewave and current effects are eliminated.
J. Mar. Sci. Eng. 2019, 7, x FOR PEER REVIEW 10 of 16
speed condition. As for the still water condition, basically it has a close and smaller viscous resistance similar to that of the 3 m/s speed condition since the same towing force was applied for them. Likewise, the time history curve is smooth for the still water condition. Generally, the towing process for submerged towing is more stable, which can be beneficial from a practical perspective.
0 50 100 150 200 250 3000
10
20
30
40
50
60
70V
isco
us D
rag
(t)
Time (s)
speed=0 m/s speed=1 m/s speed=2 m/s speed=3 m/s still water fixed
Figure 6. Comparison between the time history curves of the viscous drag force under different towing speeds for submerged towing (submerged depth: 40 m).
In Figure 7, the applied towing force and the balanced viscous drag resistance for both surface towing and submerged towing are compared. The submerged depth is 40 m for subsurface towing and six groups are chosen based on the towing speed. For fixed body condition, no towing force is applied and only the balanced resistance is shown. Compared with the surface towing, to perform a submerged towing requires larger towing force so as to achieve a similar towing speed, especially for high speed towing. The required towing force and balanced viscous drag force are proportional to the second order of the towing speed. For the surface towing, the water plane area is similar and the distinction between the viscous drag force and towing force is quite clear for the still water condition. The resistance is smaller compared with the condition of speed 3 m/s, which is reasonable. Because the wave and current effects are eliminated.
fixed speed 0 speed 1 speed 2 speed 3 still water0
20
40
60
80
For
ce (
t)
subsurface- viscous drag subsurface-towing force surface-viscous drag surface-towing force
Figure 7. Comparison between the surface towing and the submerged towing under different towingspeeds in terms of the viscous drag force and the towing force.

J. Mar. Sci. Eng. 2019, 7, 100 11 of 15
Generally, based on the above figures, it suggests that to obtain a higher speed by increasing thetowing force is low efficient in terms of the transportation cost since the towing resistance will increaseby a larger margin.
4.3. Mooring Position
In this section, the impacts of the mooring positions are investigated from the viscous resistanceand the motion response perspectives. The submerged towing was performed with an initial depth of40 m. As has been shown in Figure 2, there are two mooring positions named as fairlead 1 attached tothe floating tank; and fairlead 2 attached to the tower near to the surface, respectively. The two fairleadpositions excel at different aspects. For instance, the fairlead 2 is near to the free surface and can beconveniently connected with a towline. While the fairlead 1 attached the floating tank in a heightnear to the center of gravity has a smaller force arm, which is benefit for a relatively small motionresponse amplitude. Thus, it is necessary to analyze the dynamic behavior under these two conditions.Figure 8 depicts the motion responses and the sea environment with two fairlead positions.
J. Mar. Sci. Eng. 2019, 7, x FOR PEER REVIEW 11 of 16
Figure 7. Comparison between the surface towing and the submerged towing under different towing speeds in terms of the viscous drag force and the towing force.
Generally, based on the above figures, it suggests that to obtain a higher speed by increasing the towing force is low efficient in terms of the transportation cost since the towing resistance will increase by a larger margin.
4.3. Mooring Position
In this section, the impacts of the mooring positions are investigated from the viscous resistance and the motion response perspectives. The submerged towing was performed with an initial depth of 40 m. As has been shown in Figure 2, there are two mooring positions named as fairlead 1 attached to the floating tank; and fairlead 2 attached to the tower near to the surface, respectively. The two fairlead positions excel at different aspects. For instance, the fairlead 2 is near to the free surface and can be conveniently connected with a towline. While the fairlead 1 attached the floating tank in a height near to the center of gravity has a smaller force arm, which is benefit for a relatively small motion response amplitude. Thus, it is necessary to analyze the dynamic behavior under these two conditions. Figure 8 depicts the motion responses and the sea environment with two fairlead positions.
Wave
Current
Fairlead 2
Fairlead 1
depth
z
Pitch
Heave
Figure 8. Schematic view of the pitch and heave motion directions, the loading environments and the fairlead positions.
In Figure 9, it is shown that the surface towing method has a much lower resistance but significant fluctuation since it has a larger water plane area. While for the submerged towing method, the fairlead 1 has a smaller resistance level compared with the fairlead 2. The difference of viscous drag between fairlead 1 and 2 is related to various reasons, for example, the initial submerged depth and the towing speed. Therefore, to verify this regulation, more simulations with different submerged depths are compared with the same forward speed, as shown in Figures 10 and 11.
Figure 8. Schematic view of the pitch and heave motion directions, the loading environments and thefairlead positions.
In Figure 9, it is shown that the surface towing method has a much lower resistance but significantfluctuation since it has a larger water plane area. While for the submerged towing method, the fairlead1 has a smaller resistance level compared with the fairlead 2. The difference of viscous drag betweenfairlead 1 and 2 is related to various reasons, for example, the initial submerged depth and the towingspeed. Therefore, to verify this regulation, more simulations with different submerged depths arecompared with the same forward speed, as shown in Figures 10 and 11.J. Mar. Sci. Eng. 2019, 7, x FOR PEER REVIEW 12 of 16
0 50 100 150 200 250 3000
20
40
60
Vis
cous
Dra
g (t
)
Time (s)
surface towing-fairlead 1 subsurface towing-fairlead 1 subsurface towing-fairlead 2
Figure 9. Comparison between the time history curves of the viscous drag force for surface towing and subsurface towing in terms of the fairlead position (towing speed: 3 m/s).
0 50 100 150 200 250 3000
20
40
60
100 150 200 250 300
30
45
60
Vis
cous
Dra
g (t
)
Time (s)
submerged 10-Fairlead 1 submerged 10-Fairlead 2 submerged 20-Fairlead 1 submerged 20-Fairlead 2 submerged 30-Fairlead 1 submerged 30-Fairlead 2 submerged 40-Fairlead 1 submerged 40-Fairlead 2
FFT(Fast Fourier Transform)
Figure 10. Comparison between the time history curves of the viscous drag force under different submerged depths in terms of the fairlead position (towing speed: 3 m/s).
0
20
40
60
SD=30m SD=40mSD=20m
Vis
cous
Dra
g -
ST
D (
t)
Fairlead 1 Fairlead 2
SD=10m Figure 11. Statistical comparison of viscous drag force.
Figure 9. Comparison between the time history curves of the viscous drag force for surface towing andsubsurface towing in terms of the fairlead position (towing speed: 3 m/s).
J. Mar. Sci. Eng. 2019, 7, 100 12 of 15
J. Mar. Sci. Eng. 2019, 7, x FOR PEER REVIEW 12 of 16
0 50 100 150 200 250 3000
20
40
60
Vis
cous
Dra
g (t
)
Time (s)
surface towing-fairlead 1 subsurface towing-fairlead 1 subsurface towing-fairlead 2
Figure 9. Comparison between the time history curves of the viscous drag force for surface towing and subsurface towing in terms of the fairlead position (towing speed: 3 m/s).
0 50 100 150 200 250 3000
20
40
60
100 150 200 250 300
30
45
60
Vis
cous
Dra
g (t
)
Time (s)
submerged 10-Fairlead 1 submerged 10-Fairlead 2 submerged 20-Fairlead 1 submerged 20-Fairlead 2 submerged 30-Fairlead 1 submerged 30-Fairlead 2 submerged 40-Fairlead 1 submerged 40-Fairlead 2
FFT(Fast Fourier Transform)
Figure 10. Comparison between the time history curves of the viscous drag force under different submerged depths in terms of the fairlead position (towing speed: 3 m/s).
0
20
40
60
SD=30m SD=40mSD=20m
Vis
cous
Dra
g -
ST
D (
t)
Fairlead 1 Fairlead 2
SD=10m Figure 11. Statistical comparison of viscous drag force.
Figure 10. Comparison between the time history curves of the viscous drag force under differentsubmerged depths in terms of the fairlead position (towing speed: 3 m/s).
J. Mar. Sci. Eng. 2019, 7, x FOR PEER REVIEW 12 of 16
0 50 100 150 200 250 3000
20
40
60
Vis
cous
Dra
g (t
)
Time (s)
surface towing-fairlead 1 subsurface towing-fairlead 1 subsurface towing-fairlead 2
Figure 9. Comparison between the time history curves of the viscous drag force for surface towing and subsurface towing in terms of the fairlead position (towing speed: 3 m/s).
0 50 100 150 200 250 3000
20
40
60
100 150 200 250 300
30
45
60
Vis
cous
Dra
g (t
)
Time (s)
submerged 10-Fairlead 1 submerged 10-Fairlead 2 submerged 20-Fairlead 1 submerged 20-Fairlead 2 submerged 30-Fairlead 1 submerged 30-Fairlead 2 submerged 40-Fairlead 1 submerged 40-Fairlead 2
FFT(Fast Fourier Transform)
Figure 10. Comparison between the time history curves of the viscous drag force under different submerged depths in terms of the fairlead position (towing speed: 3 m/s).
0
20
40
60
SD=30m SD=40mSD=20m
Vis
cous
Dra
g -
ST
D (
t)
Fairlead 1 Fairlead 2
SD=10m Figure 11. Statistical comparison of viscous drag force. Figure 11. Statistical comparison of viscous drag force.
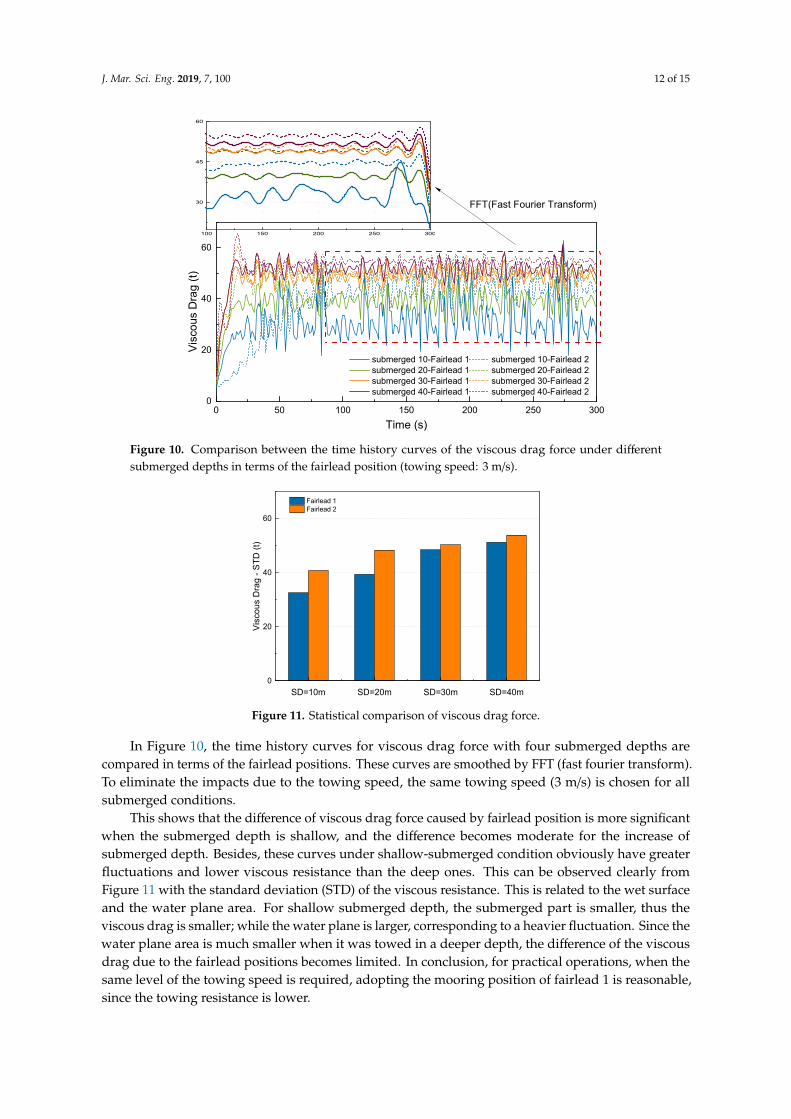
In Figure 10, the time history curves for viscous drag force with four submerged depths arecompared in terms of the fairlead positions. These curves are smoothed by FFT (fast fourier transform).To eliminate the impacts due to the towing speed, the same towing speed (3 m/s) is chosen for allsubmerged conditions.
This shows that the difference of viscous drag force caused by fairlead position is more significantwhen the submerged depth is shallow, and the difference becomes moderate for the increase ofsubmerged depth. Besides, these curves under shallow-submerged condition obviously have greaterfluctuations and lower viscous resistance than the deep ones. This can be observed clearly fromFigure 11 with the standard deviation (STD) of the viscous resistance. This is related to the wet surfaceand the water plane area. For shallow submerged depth, the submerged part is smaller, thus theviscous drag is smaller; while the water plane is larger, corresponding to a heavier fluctuation. Since thewater plane area is much smaller when it was towed in a deeper depth, the difference of the viscousdrag due to the fairlead positions becomes limited. In conclusion, for practical operations, when thesame level of the towing speed is required, adopting the mooring position of fairlead 1 is reasonable,since the towing resistance is lower.

J. Mar. Sci. Eng. 2019, 7, 100 13 of 15
The pitch and heave motion responses for the submerged towing are compared in Figures 12 and 13.The wind force is not considered here to simplify the loading environment and the same towing speed ismaintained. The motion responses are clearly influenced by two fairlead positions.
J. Mar. Sci. Eng. 2019, 7, x FOR PEER REVIEW 13 of 16
In Figure 10, the time history curves for viscous drag force with four submerged depths are compared in terms of the fairlead positions. These curves are smoothed by FFT (fast fourier transform). To eliminate the impacts due to the towing speed, the same towing speed (3 m/s) is chosen for all submerged conditions.
This shows that the difference of viscous drag force caused by fairlead position is more significant when the submerged depth is shallow, and the difference becomes moderate for the increase of submerged depth. Besides, these curves under shallow-submerged condition obviously have greater fluctuations and lower viscous resistance than the deep ones. This can be observed clearly from Figure 11 with the standard deviation (STD) of the viscous resistance. This is related to the wet surface and the water plane area. For shallow submerged depth, the submerged part is smaller, thus the viscous drag is smaller; while the water plane is larger, corresponding to a heavier fluctuation. Since the water plane area is much smaller when it was towed in a deeper depth, the difference of the viscous drag due to the fairlead positions becomes limited. In conclusion, for practical operations, when the same level of the towing speed is required, adopting the mooring position of fairlead 1 is reasonable, since the towing resistance is lower.
The pitch and heave motion responses for the submerged towing are compared in Figures 12 and 13. The wind force is not considered here to simplify the loading environment and the same towing speed is maintained. The motion responses are clearly influenced by two fairlead positions.
0 50 100 150 200 250 300-4
-3
-2
-1
0
1
Pitc
h (d
eg)
Time (s)
Fairlead 1-10m Fairlead 1-20m Fairlead 1-30m Fairlead 1-40m Fairlead 2-10m Fairlead 2-20m Fairlead 2-30m Fairlead 2-40m
Figure 12. Pitch motion versus fairlead positions under different submerged depths.
0 50 100 150 200 250 300-12
-9
-6
-3
0
3
Fairlead 1-10m Fairlead 1-20m Fairlead 1-30m Fairlead 1-40m Fairlead 2-10m Fairlead 2-20m Fairlead 2-30m Fairlead 2-40m
Hea
ve (
m)
Time (s)
Figure 13. Heave motion versus fairlead positions under different submerged depths.
In Figure 12, pitch motions are depicted. As can be seen, the pitch angles are positive for fairlead 1 suggesting a backward rotation of the OIMM. For deeper submerged depth, pitch angles are larger, but its fluctuations are smaller. As for fairlead 2, it shows a quite opposite feature. The negative pitch
Figure 12. Pitch motion versus fairlead positions under different submerged depths.
J. Mar. Sci. Eng. 2019, 7, x FOR PEER REVIEW 13 of 16
In Figure 10, the time history curves for viscous drag force with four submerged depths are compared in terms of the fairlead positions. These curves are smoothed by FFT (fast fourier transform). To eliminate the impacts due to the towing speed, the same towing speed (3 m/s) is chosen for all submerged conditions.
This shows that the difference of viscous drag force caused by fairlead position is more significant when the submerged depth is shallow, and the difference becomes moderate for the increase of submerged depth. Besides, these curves under shallow-submerged condition obviously have greater fluctuations and lower viscous resistance than the deep ones. This can be observed clearly from Figure 11 with the standard deviation (STD) of the viscous resistance. This is related to the wet surface and the water plane area. For shallow submerged depth, the submerged part is smaller, thus the viscous drag is smaller; while the water plane is larger, corresponding to a heavier fluctuation. Since the water plane area is much smaller when it was towed in a deeper depth, the difference of the viscous drag due to the fairlead positions becomes limited. In conclusion, for practical operations, when the same level of the towing speed is required, adopting the mooring position of fairlead 1 is reasonable, since the towing resistance is lower.
The pitch and heave motion responses for the submerged towing are compared in Figures 12 and 13. The wind force is not considered here to simplify the loading environment and the same towing speed is maintained. The motion responses are clearly influenced by two fairlead positions.
0 50 100 150 200 250 300-4
-3
-2
-1
0
1
Pitc
h (d
eg)
Time (s)
Fairlead 1-10m Fairlead 1-20m Fairlead 1-30m Fairlead 1-40m Fairlead 2-10m Fairlead 2-20m Fairlead 2-30m Fairlead 2-40m
Figure 12. Pitch motion versus fairlead positions under different submerged depths.
0 50 100 150 200 250 300-12
-9
-6
-3
0
3
Fairlead 1-10m Fairlead 1-20m Fairlead 1-30m Fairlead 1-40m Fairlead 2-10m Fairlead 2-20m Fairlead 2-30m Fairlead 2-40m
Hea
ve (
m)
Time (s)
Figure 13. Heave motion versus fairlead positions under different submerged depths.
In Figure 12, pitch motions are depicted. As can be seen, the pitch angles are positive for fairlead 1 suggesting a backward rotation of the OIMM. For deeper submerged depth, pitch angles are larger, but its fluctuations are smaller. As for fairlead 2, it shows a quite opposite feature. The negative pitch
Figure 13. Heave motion versus fairlead positions under different submerged depths.
In Figure 12, pitch motions are depicted. As can be seen, the pitch angles are positive for fairlead 1suggesting a backward rotation of the OIMM. For deeper submerged depth, pitch angles are larger, but itsfluctuations are smaller. As for fairlead 2, it shows a quite opposite feature. The negative pitch anglemeans the OIMM leans forward. The oscillations are more stable, and the amplitude is smaller at a deepersubmergence depth. In general, the pitch motion for the fairlead 2 is larger than that of the fairlead 1.
As for Figure 13, the heave motion of the submerged towing with fairlead position 1 shows a slightdescending motion except for the deepest one which ascends slowly by around 1 m. The submergeddepth of 30 m presents the most significant heave motion and ends up with a relative stable verticalposition. As for fairlead 2, the heave motions are negative for all depths and the amplitude is larger.The deepest submerged condition shows the lowest heave motion. Likewise, the submerged depth of30 m with fairlead 2 shows the most significant heave motion. In general, with a mooring position ofthe fairlead 2, the heave motion is larger than that of the fairlead 1.
The pitch and heave motion responses prove that fairlead 1 is superior to fairlead 2 because ofthe smaller amplitude. As shown in Figure 13, the descending heave motion can be explained thatthe OIMM leans forward and the wave and current force may result in a relative downward forceon the OIMM. Especially when the mooring position is near to the surface and the towing force mayaggravate the lean angle. Besides, the current velocity is different on the top and the bottom surfaces ofthe floating tank accounting for the pressure difference, which may further result in this descendingmotion. The ascending motion for fairlead 1 can be explained for the same reason. The submergeddepth is near to the sea bed where the current velocity decreases rapidly. Thus, the current velocity

J. Mar. Sci. Eng. 2019, 7, 100 14 of 15
decreases near to the bottom of the floating tank and the induced pressure on bottom surface of islarger than that of the upper surface of the floating tank. Therefore, the OIMM could be lifted slightly.
5. Conclusions
This study deals with the dynamic characteristics of an innovative integrated offshore structureOIMM in terms of the towing resistance and motion responses. Two special towing methods areadopted for this high-rise structure and the hydrodynamic software MOSES is applied to simulatethe towing process in time domain. This paper estimates the feasibility of the towing operations andprovides suggestions for potential problems when conducting an offshore wet towing for the OIMM.
First, the towing resistance is obtained by MOSES and CCS code. The numerical result is verified withmanual computation. The manual result of towing resistance is agreed with the result by MOSES for surfacetowing and shallow submerged towing. For deep submerged towing, the difference between two methodsis caused by the applied theory in MOSES and CCS. The potential theory and Morison equation are appliedin numerical method, while empirical equations are used by CCS code. The current impact is the mostimportant component since the induced speed is closest to the overall induced speed.
Secondly, the surface and submerged towing methods are compared in terms of different forwardspeeds and the results suggest that to obtain a higher speed by increasing the towing force isunreasonable with respect to the transportation cost, since the towing resistance increases much higher.Larger towing force is required for submerged towing to achieve the same speed level as surfacetowing, particularly when the towing speed becomes higher.
Thirdly, based on the fairlead positions, time domain simulations are conducted to estimate thesurface and the submerged towing methods with respect to the resistance and dynamic responses.It suggests that higher mooring position is likely to result in larger viscous resistance. Deepersubmerged depth is preferred when the lower motion amplitude is required. Fairlead 1 excels in twoaspects: lower resistance and lower motion responses. The submerged towing should be performedwith sufficient distance away from the seabed because the OIMM is likely to descend by a large distance.
Finally, it can be concluded that the numerical method by MOSES can be applied for the preliminaryestimation of the towing operations for OIMM considering complex sea environment. More accurateand detailed estimation will require to consider the properties of the mooring line and the impacts ofthe tugboat in the system. These conclusions can provide recommendations and references for theestimation of the feasibility of the towing methods and on the optimization of the towing operation forOIMM and resembling structures.
Author Contributions: Conceptualization, H.D., P.Z. and C.L.; Methodology, R.H. and C.L.; Software, C.L. andR.H.; validation, H.D., P.Z. and C.L.; Formal Analysis, R.H. and C.L.; Writing-Original Draft Preparation, R.H. andC.L.; Writing-Review & Editing, C.L., R.H. and P.Z.; supervision, H.D. and P.Z; project administration, H.D. andP.Z; funding acquisition, H.D., P.Z. and C.L.
Funding: This research was funded by the National Natural Science Foundation of China (Grant Nos. 51679163 &51779171), Innovation Method Fund of China (Grant No. 2016IM030100), Tianjin Municipal Natural Science Foundation(Grant No. 18JCYBJC22800) and State Key Laboratory of Coastal and Offshore Engineering (Grant No. LP1709).
Conflicts of Interest: The authors declare no conflict of interest.
References
1. Assessment Wind Measurement Program North Sea. Available online: https://offshorewind.rvo.nl/file/view/
31040402/assessment-wind-measurement-program-north-sea-dnv-gl (accessed on 6 March 2015).2. Ding, H.; Han, Y.; Zhang, P. Numerical simulation on floating behavior of buoyancy tank foundation of
anemometer tower. Trans. Tianjin Univ. 2014, 20, 243–249. [CrossRef]3. Zhang, P.; Hu, R.; Ding, H.; Le, C. Preliminary design and hydrodynamic analysis on the offshore integrated
anemometer mast during wet-towing. Structures, Safety, and Reliability. In Proceedings of the ASME 201837th International Conference on Ocean, Offshore and Arctic Engineering, American Society of MechanicalEngineers, Madrid, Spain, 17–22 June 2018.

J. Mar. Sci. Eng. 2019, 7, 100 15 of 15
4. Ding, H.; Lian, J.; Li, A.; Zhang, P. One-step-installation of offshore wind turbine on large-scale bucket-top-bearing bucket foundation. Trans. Tianjin Univ. 2013, 19, 188–194. [CrossRef]
5. Zhang, P.; Han, Y.; Ding, H.; Zhang, S. Field experiments on wet tows of an integrated transportation andinstallation vessel with two bucket foundations for offshore wind turbines. Ocean Eng. 2015, 108, 769–777.[CrossRef]
6. Zhang, P.; Ding, H.; Le, C.; Zhang, S.; Huang, X. Preliminary analysis on integrated transportation techniquefor offshore wind turbines. In Proceedings of the ASME 2013 32nd International Conference on Ocean,Offshore and Arctic Engineering, American Society of Mechanical Engineers, Nantes, France, 9–14 June 2013.
7. Jacobsen, T. Subsurface Towing of a Subsea Module. Master’s Thesis, Norwegian University of Science andTechnology, Trondheim, Norway, 2010.
8. Jacobsen, T.; Leira, B.J. Numerical and experimental studies of submerged towing of a subsea template.Ocean Eng. 2012, 42, 147–154. [CrossRef]
9. Zhang, D.; Sun, W.; Fan, Z. Application of a newly built semi-submersible vessel for transportation ofa tension leg platform. J. Mar. Sci. Appl. 2012, 11, 341–350. [CrossRef]
10. Eriksson, H.; Kullander, T. Survey of Swedish Suppliers to a Floating Wind Turbine Unit Equipped with Pumpsfor Oxygenation of the Deepwater; BOX-WIN Technical Report no. 7, C101; University of Gothenburg:Goteborg, Sweden, 2013; ISSN 1400-383X.
11. Jurewicz, J.M. Design and Construction of an Offshore Floating Nuclear Power Plant. Master’s Thesis,Massachusetts Institute of Technology, Cambridge, MA, USA, 2015.
12. Kang, W.H.; Zhang, C.; Yu, J.X. Stochastic extreme motion analysis of jack-up responses during wet towing.Ocean Eng. 2016, 111, 56–66. [CrossRef]
13. Li, C.; Liu, Y. Fully-nonlinear simulation of the hydrodynamics of a floating body in surface waves bya high-order boundary element method. In Proceedings of the ASME 2015 34th International Conference onOcean, Offshore and Arctic Engineering, American Society of Mechanical Engineers, St. John’s, NL, Canada,31 May–5 June 2015.
14. Zhao, Z.; Tang, Y.; Wu, Z.; Li, Y.; Wang, Z. Towing Analysis of Multi-Cylinder Platform for Offshore MarginalOil Field Development. In Proceedings of the ASME 2016 35th International Conference on Ocean, Offshoreand Arctic Engineering, American Society of Mechanical Engineers, Busan, Korea, 30 June 2016.
15. Ding, H.; Han, Y.; Le, C.; Zhang, P. Dynamic analysis of a floating wind turbine in wet tows based onmulti-body dynamics. J. Renew. Sustain. Energy 2017, 9, 033301. [CrossRef]
16. Kim, B.; Kim, T.W. Scheduling and cost estimation simulation for transport and installation of floating hybridgenerator platform. Renew. Energy 2017, 111, 131–146. [CrossRef]
17. Wang, Y.; Duan, M.; Liu, H.; Tian, R.; Peng, C. Advances in deepwater structure installation technologies.Underw. Technol. 2017, 34, 83–91. [CrossRef]
18. Zelazny, K. A method of calculation of ship resistance on calm water useful at preliminary stages of shipdesign. Zesz. Nauk./Akad. Morska Szczec. 2014, 38, 125–130.
19. Putra, I.N.; Susanto, A.D.; Suharyo, O.S. Comparative analysis results of towing tank and numericalcalculations with harvald guldammer method. Int. J. Appl. Eng. Res. 2017, 12, 10637–10645.
20. Veritas, D.N. Modelling and Analysis of Marine Operations. In Offshore Standard; DET NORSKE VERITAS(DNV): Akershus, Norway, 2014.
21. Guidelines for Towage at Sea; China Classification Society: Beijing, China, 2012.22. MOSES. Reference Manual for Moses; Ultramarine Inc.: Houston, TX, USA, 2009.23. Faltinsen, O.M. Sea Loads on Ships and Offshore Structures; Cambridge University Press: New York, NY, USA, 1993.24. Newman, J.N. Wave effects on multiple bodies. Hydrodyn. Ship Ocean Eng. 2001, 3, 3–26.25. Berg, P.W.S. A Discussion of Technical Challenges and Operational Limits for Towing Operations. Master’s Thesis,
Norwegian University of Science and Technology, Trondheim, Norway, 2017.
© 2019 by the authors. Licensee MDPI, Basel, Switzerland. This article is an open accessarticle distributed under the terms and conditions of the Creative Commons Attribution(CC BY) license (http://creativecommons.org/licenses/by/4.0/).