The use of the self-paced exercise test in assessing ...
172
Kent Academic Repository Full text document (pdf) Copyright & reuse Content in the Kent Academic Repository is made available for research purposes. Unless otherwise stated all content is protected by copyright and in the absence of an open licence (eg Creative Commons), permissions for further reuse of content should be sought from the publisher, author or other copyright holder. Versions of research The version in the Kent Academic Repository may differ from the final published version. Users are advised to check http://kar.kent.ac.uk for the status of the paper. Users should always cite the published version of record. Enquiries For any further enquiries regarding the licence status of this document, please contact: [email protected] If you believe this document infringes copyright then please contact the KAR admin team with the take-down information provided at http://kar.kent.ac.uk/contact.html Citation for published version Hogg, James (2018) The use of the self-paced exercise test in assessing cardiorespiratory fitness in runners. Doctor of Philosophy (PhD) thesis, University of Kent,. DOI Link to record in KAR https://kar.kent.ac.uk/68563/ Document Version UNSPECIFIED
-
Upload
khangminh22 -
Category
Documents
-
view
2 -
download
0
Transcript of The use of the self-paced exercise test in assessing ...
Kent Academic RepositoryFull text document (pdf)
Copyright & reuse
Content in the Kent Academic Repository is made available for research purposes. Unless otherwise stated all
content is protected by copyright and in the absence of an open licence (eg Creative Commons), permissions
for further reuse of content should be sought from the publisher, author or other copyright holder.
Versions of research
The version in the Kent Academic Repository may differ from the final published version.
Users are advised to check http://kar.kent.ac.uk for the status of the paper. Users should always cite the
published version of record.
Enquiries
For any further enquiries regarding the licence status of this document, please contact:
If you believe this document infringes copyright then please contact the KAR admin team with the take-down
information provided at http://kar.kent.ac.uk/contact.html
Citation for published version
Hogg, James (2018) The use of the self-paced exercise test in assessing cardiorespiratory fitnessin runners. Doctor of Philosophy (PhD) thesis, University of Kent,.
DOI
Link to record in KAR
https://kar.kent.ac.uk/68563/
Document Version
UNSPECIFIED
The use of the self-paced exercise test
in assessing cardiorespiratory fitness in
runners
The thesis is presented for the Degree of Doctor of Philosophy at
the University of Kent
May 2018
James S. Hogg
School of Sport and Exercise Science
ii
Acknowledgements
Dr Lex Mauger, for his unwavering support and guidance throughout this PhD, and for
showing remarkable patience when being asked many a stupid question by me.
Dr James Hopker, world class devil’s advocate. Enough said.
Dr Sarah Coakley, for her invaluable assistance and advice throughout Chapter 6.
Dr Lauren Jenkins, who graciously volunteered her expertise by independently confirming
the ventilatory thresholds for Chapter 7.
Adam Hart, Francesca Waters, Marcus Cram, Stewart Clayton, and Sam Smith for their
enthusiastic assistance with data collection.
All fifty-six participants who volunteered their time. This would be a pretty damn short
thesis without them.
Peter Jackson, the Lord of the Rings trilogy got me through inputting data.
Sophie, who was my biggest distraction throughout all of this, but also the person who
knew how to motivate me like no other. This certainly would have been a lot harder
without her.
iii
Abstract
The aim of this thesis was to investigate the utility of the self-paced exercise test (SPXT) in
assessing the cardiorespiratory fitness of runners. Traditionally, cardiorespiratory fitness is
assessed via an open-ended graded exercise test (GXT) which utilises fixed increments of
work-rate and involves the participant continuing until volitional exhaustion. The SPXT is
a closed-looped 10 minute (min) test which is made up of 5 x 2 min stages in which
intensity is clamped by ratings of perceived exertion (RPE). The test starts at RPE 11, and
this increases in an incremental fashion to encompass RPE 13, 15, 17, and finally 20. The
test is more time-efficient than traditional protocols due to not requiring a known starting
speed. Additionally, the SPXT may be more valid for runners compared to the GXT in
which test duration is unknown.
In study one, gradient and speed-based SPXT protocols were compared to a laboratory
based GXT to investigate the validity of the SPXT in producing maximal oxygen uptake
(V砦 O2max). The gradient-based SPXT [which has not previously been investigated] produced
higher V砦 O2max than the GXT (71 ± 4.3 vs. 68.6 ± 6.0 mL·kg-1·min-1, P = .03, ES = .39) but
the speed-based SPXT produced similar V砦 O2max to the GXT (67.6 ± 3.6 vs. 68.6 ± 6.0
mL·kg-1·min-1, P = .32, ES = .21). Results also demonstrated that the oxygen (O2) cost of
ventilation may differ between the SPXT and GXT (26.4 ± 2.8 vs. 28.2 ± 2.8 mL.min-1,
respectively) (P = .02).
In study two, the oxygen cost of breathing during the SPXT was investigated. When
assessed via separate ventilation trials, there were no differences in the oxygen cost of
breathing between the SPXT and GXT (26.1 ± 5.3 vs. 26.9 ± 4.2 mL.min-1, respectively)
(t7 = -1.00, P = .34,), and V砦 O2max was again similar between the SPXT and GXT (Z = -.43,
iv
P = .67,). The mean velocity at RPE20 (vRPE20) measured via the SPXT was also similar
to the maximal velocity (Vmax) derived from the GXT (t8 = .74, P = .48).
In study three, the ability of the SPXT to provide novel parameters that could be used to
prescribe six-weeks of running training for recreationally active runners was investigated.
Results demonstrated that vRPE20 was effective in improving V砦 O2max (6 ± 6 %), critical
speed (3 ± 3 %) and lactate threshold (7 ± 8%) and these improvements were similar to a
separate group who trained using GXT-derived parameters including Vmax (4 ± 8, 7 ± 7, 5 ±
4 %, for V砦 O2max, critical speed, and lactate threshold, respectively). Prescribing training via
the SPXT may be beneficial as it does not require additional testing that is usually
associated with the GXT.
In study four, the ability of the SPXT to accurately determine ventilatory thresholds (VT)
was investigated. The first and second VT (VT1 and VT2, respectively) were not
significantly different when measured as V砦 O2 between the SPXT (4.03 ± 0.5 and 4.37 ±
0.6 L.min-1, for VT1 and VT2, respectively) and GXT (4.18 ± 0.5 and 4.54 ± 0.7 L.min-1,
respectively) in highly trained runners. In recreationally trained runners VT1 was
significantly different when measured via the SPXT and GXT (2.78 ± 0.5 vs. 2.99 ± 0.5
L.min-1, respectively) (t23 = -4.51, P < .01, ES = .42) whilst VT2 was also significantly
different (3.10 ± 0.6 vs. 3.22 ± 0.6 L.min-1) (t21 = -2.35, P = .03, ES = .20). However, when
calculated using different variables such as velocity, RPE, and HR, VT1 and VT2 were
similar between protocols. This demonstrated that the SPXT can provide valid VT for
runners.
The conclusion from this thesis is that the SPXT is a valid protocol for measuring V砦 O2max

v
and can also be used to prescribe a programme of endurance training, and provide an
accurate marker of VT.
vi
Table of Contents
Acknowledgements ii
Abstract iii -v
List of figures viii
List of tables
Abbreviations
ix-x
xi-xiii
Chapter 1 - Introduction
1.1. Introduction 2-7
Chapter 2 – Literature review
2.1. V砦 O2max and the factors that limit it 9-11
2.2. Considerations for testing V砦 O2max 11-20
2.3. Additional parameters that can be obtained via the GXT 20-24
2.4. Rating of perceived exertion in exercise testing 24-26
2.5. Self-paced exercise tests 26-38
2.6. Prescribing training via the GXT 39-45
2.7. Summary 45-46
2.8. Thesis aims and hypotheses 47-49
Chapter 3 – General methods
3.1. Experimental procedures 51-55
Chapter 4 – Validity of the SPXT to assess V砦 O2max in highly trained runners
4.1. Abstract 57
4.2. Introduction 58
4.3. Method 58-60
4.4. Results 61-65
4.5. Discussion 65-69
4.6. Conclusion 70
Chapter 5 – The oxygen cost of breathing in the SPXT
5.1. Abstract 72
vii
5.2. Introduction 73-75
5.3. Method 75-78
5.4. Results 78-80
5.5. Discussion 81-84
5.6. Conclusion 84-85
Chapter 6 – Prescribing 6 weeks of running training using parameters from the SPXT
6.1. Abstract 87
6.2. Introduction 88-89
6.3. Method 89-94
6.4. Results 94-100
6.5. Discussion 100-103
6.6. Conclusion 103-104
Chapter 7 – Comparison of the ventilatory thresholds obtained from the SPXT and GXT
7.1. Abstract 106
7.2. Introduction 107-108
7.3. Method 108-110
7.4. Results 110-114
7.5. Discussion 115-118
7.6. Conclusion 119
Chapter 8 – General discussion
8.1. General discussion 121-126
8.2. General limitations 127-129
8.3. Future directions 129-130
8.4. Conclusion 130-131
References 133-158
viii
List of figures
Chapter 4 - Validity of the SPXT to assess V砦 O2max in highly trained runners
Figure 4.1 Differences in V砦 O2max between the GXT, SPXTsp and SPXTinc for all participants
66
Figure 4.2 V砦 O2 and speed or power response for all three protocols for a representative subject
67
Figure 4.3 Level of Agreement between V砦 O2max from each protocol for all three protocols
68
Chapter 5 - The oxygen cost of breathing in the SPXT
Figure 5.1 V砦 O2vent in the ventilation trials in both G-VENT and S-VENT for all participants
83
Chapter 6 - Prescribing a 6 week training programme using novel
parameters from the SPXT
Figure 6.1 Differences in V砦 O2max between the STND and S-P training groups before and after training
100
Table 6.2 Differences in the velocities Vmax and vRPE20 for all participants for before and after training
101
Chapter 7 - Validity of the SPXT in calculating the ventilatory thresholds
Table 7.1 VT1 and VT2 calculated via the V-Slope and V砦 E-V砦 CO2 methods in
both the GXT and SPXT for a representative subject in the
recreationally trained subset.
113
Table 7.2 VT1 and VT2 calculated via the V-Slope and V砦 E-V砦 CO2 methods in
both the GXT and SPXT for a representative subject in the highly
trained subset.
115
ix
List of tables
Chapter 2 – Literature review
Table 2.1 Summary of studies that have investigated the use of the SPXT 29-32
Table 2.2 Summary of studies that have used interval training 44-46
Chapter 4 - Validity of the SPXT to assess V砦 O2max in highly trained runners
Table 4.1 Key variables recorded from the SPXT and GXT 69
Chapter 5 - The oxygen cost of breathing in the SPXT
Table 5.1 Key variables recorded from the SPXT and GXT 82
Table 5.2 Values for actual and target V砦 E in the breathing trials in both
ventilation protocols
83
Chapter 6 - Prescribing a 6 week training programme using novel parameters from
the SPXT
Table 6.1 Physiological and intensity variables recorded during both GXT and SPXT protocols across both before and after training for all participants
97
Table 6.2 Training prescription for a representative subject in both training
groups
98
Table 6.3 Physiological and threshold variables recorded before and after
training for both training groups.
100
Table 6.4 Completion times for individual distance trials from the critical
speed test for both groups before and after training
Chapter 7 - Validity of the SPXT in calculating the ventilatory thresholds
Table 7.1 Variables corresponding to VT1 and VT2 recorded during both
GXT and SPXT protocols for recreationally trained participants.
113
Table 7.2 Variables corresponding to VT1 and VT2 recorded during both 115

x
GXT and SPXT protocols for highly trained participants.
xi
Abbreviations
ANOVA Analysis of variance
a-vO2diff Ateriovenous oxygen difference
bpm Beats per minute
CI Confidence Interval
CS Critical Speed
CP Critical Power
ES Effect Size
GPS Global Positioning Satellite
G-VENT GXT-based ventilation protocol
GXT Graded exercise test
h hours
HIIT High intensity interval training
HR Heart rate
HRmax Maximal heart rate
ICC Intraclass correlation coefficient
L.min-1 Litres per minute
LoA Limits of Agreement
LT Lactate threshold
LT1 First lactate threshold
LT2 Second lactate threshold
m Metres
min Minutes
mL·kg-1·min-1 Millilitres, per kilogram of body weight, per minute
mL.min-1 Millilitres per minute
mmol.L-1 Millimoles per litre
m.s-1 Metres per second
n Number
xii
2p Partial eta-squared
O2 Oxygen
PETO2 Partial end-tidal volume of oxygen
PETCO2 Partial end-tidal volume of carbon dioxide
POpeak Peak power output
P Significance level
PO Power output
PRET Perceptually regulated exercise test
Q砦 Cardiac output
Q砦 max Maximal cardiac output
RAMP Incremental ramp test
RER Respiratory exchange ratio
RERmax Maximal respiratory exchange ratio
RPE Rating of perceived exertion
s Seconds
SMD Standardised mean difference
SPXT Self-paced exercise test
SD Standard deviation
SV Stroke volume
S-VENT SPXT-based ventilation protocol
SVmax Maximal stroke volume
Tmax Time in which Vmax/vV砦 O2max can be maintained
TTE Time to exhaustion
V砦 CO2 Carbon dioxide production
V砦 E Minute ventilation
V砦 Emax Maximal minute ventilation
Vmax Maximal velocity
V砦 O2 Volume of oxygen
V砦 O2max Maximal oxygen uptake
V砦 O2peak Peak oxygen uptake
xiii
V砦 O2vent Oxygen cost of breathing
Vpeak Peak Velocity
vRPE20 Velocity at RPE20
VT Ventilatory thresholds
VT1 Ventilatory threshold 1
VT2 Ventilatory threshold 2
vVO2max Velocity at V砦 O2max
V砦 O2VT1 V砦 O2 at VT1
V砦 O2VT2 V砦 O2 at VT2
W Watts
wk Weeks
W.min-1 Watts increase per minute
〉 Difference

1
Chapter 1: Introduction
2
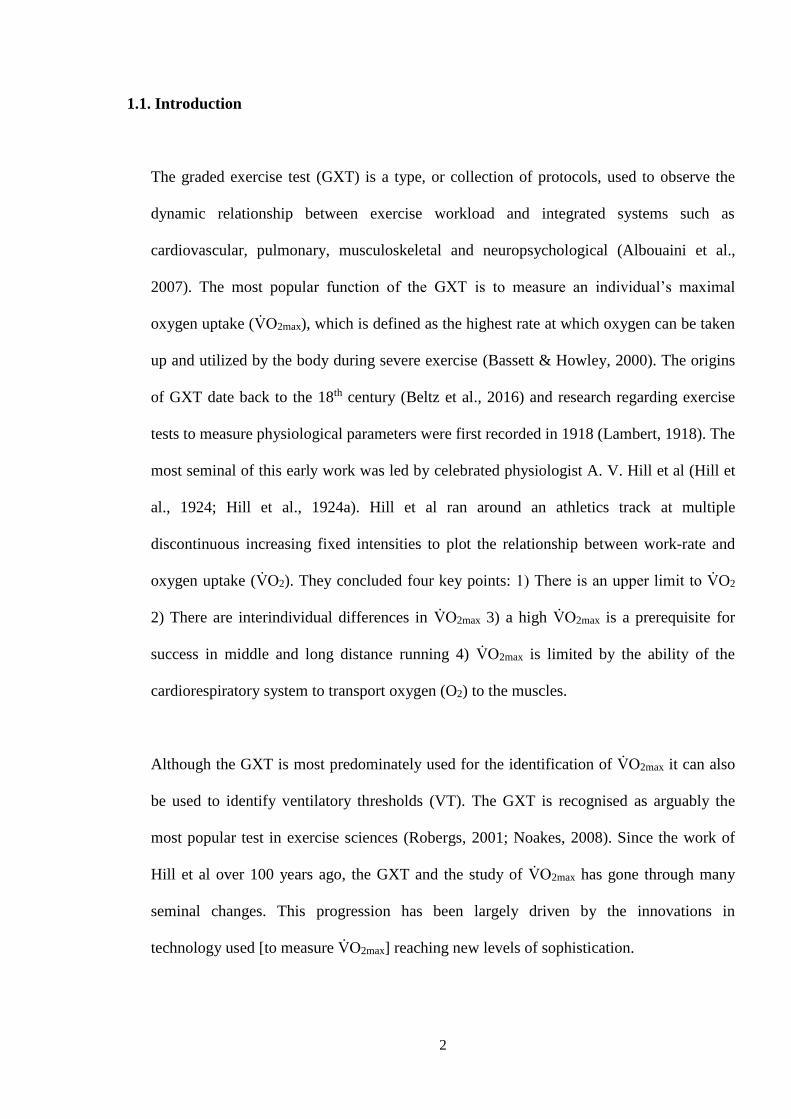
1.1. Introduction
The graded exercise test (GXT) is a type, or collection of protocols, used to observe the
dynamic relationship between exercise workload and integrated systems such as
cardiovascular, pulmonary, musculoskeletal and neuropsychological (Albouaini et al.,
2007). The most popular function of the GXT is to measure an individual’s maximal
oxygen uptake (V砦 O2max), which is defined as the highest rate at which oxygen can be taken
up and utilized by the body during severe exercise (Bassett & Howley, 2000). The origins
of GXT date back to the 18th century (Beltz et al., 2016) and research regarding exercise
tests to measure physiological parameters were first recorded in 1918 (Lambert, 1918). The
most seminal of this early work was led by celebrated physiologist A. V. Hill et al (Hill et
al., 1924; Hill et al., 1924a). Hill et al ran around an athletics track at multiple
discontinuous increasing fixed intensities to plot the relationship between work-rate and
oxygen uptake (V砦 O2). They concluded four key points: 1) There is an upper limit to V砦 O2
2) There are interindividual differences in V砦 O2max 3) a high V砦 O2max is a prerequisite for
success in middle and long distance running 4) V砦 O2max is limited by the ability of the
cardiorespiratory system to transport oxygen (O2) to the muscles.
Although the GXT is most predominately used for the identification of V砦 O2max it can also
be used to identify ventilatory thresholds (VT). The GXT is recognised as arguably the
most popular test in exercise sciences (Robergs, 2001; Noakes, 2008). Since the work of
Hill et al over 100 years ago, the GXT and the study of V砦 O2max has gone through many
seminal changes. This progression has been largely driven by the innovations in
technology used [to measure V砦 O2max] reaching new levels of sophistication.
3
Whilst the early tests for measuring V砦 O2 were discontinuous in nature, the 1960’s saw the
rise of the continuous incremental protocol. This was largely related to the introduction of
online gas analysers. These continuous incremental protocols were predominately designed
for the primary purpose of measuring V砦 O2max. These protocols became the crux for the
GXT as we know it today. An important feature of the GXT, which separates this
collection of protocols from the discontinuous protocols first tested by Hill and colleagues,
is the V砦 O2-workrate slope (V砦 O2-WR). This refers to the relationship between the increase
in intensity and the increase in V砦 O2 during the exercise test. GXT protocols take the form
of either a STEP or a RAMP. In a STEP, work-rate is increased periodically by a
predetermined amount until exhaustion. In a RAMP, work-rate may increase by the same
amount as the STEP, but is distributed over the entirety of each stage, creating a more
linear progressive increase in intensity throughout the protocol.
Continuous STEP protocols were first prevalent in the 1960s and consisted of a number of
well-known protocols: Balke; Bruce; Eleestad; and modified Astrand. All of these
protocols are open-ended and combine different stage lengths and intensity alteration
(velocity or gradient) with the participant continuing until they are unable to physically
continue, or likewise they terminated the test due to fatigue, thereon defined as volitional
exhaustion. These protocols were first compared comprehensively in the 1970’s (Pollock et
al., 1976) with it reported that the protocol itself is not necessarily a main contributing
factor in V砦 O2max differences, if similar intensities and models are utilised. However, when
protocol length, modality, and intensity increments (among other factors) are not similar,
this can significantly alter V砦 O2max. RAMP protocols may improve an individual’s ability to
reach V砦 O2max (Whipp et al., 1981; Davis et al., 1982; Beltz et al., 2016) but the small
increases in work-rate may make it more difficult to verify a V砦 O2 plateau (Midgley et al.,
4
2007a). Due to logistical limitations, such as some treadmills not being equipped with a
ramp function, RAMP protocols are used less for treadmill protocols compared to cycling
ergometers.
The GXT has been a key test in both clinical (McKelvie & Jones, 1989; Milani, 2004;
Albouaini et al., 2007) and applied settings (Beltz et al., 2016) but how it relates to ‘real-
life’ exercise has been questioned. South African physiologist and experienced ultra-
endurance runner Tim Noakes (2008) has expressed three concerns regarding the current
design of the GXT: 1) The test duration is unknown 2) The intensity increases
incrementally from low to maximal 3) The participant has no control over regulation of the
exercise intensity besides terminating the test. Noakes highlighted that all three of these
concepts are foreign to real sporting performance as no sport exists within the confines of
these rules.
In comparison to the GXT, in which intensity progressively increases until volitional
exhaustion with no fixed end time, an exercise protocol that allows for a degree of self-
pacing whilst remaining progressive and incremental may be favourable as it has the
potential to address the concerns identified by Noakes (2008). Self-paced exercise has been
shown to be less physiologically demanding than enforced paced exercise (Lander et al.,
2009), most likely because fixed increments of intensity are an unnatural way of exercising
for most athletes, as highlighted by Noakes (2008).
Mauger and Sculthorpe (2012) designed a novel maximal cycling exercise protocol named
the ‘self-paced V砦 O2max test’ which will thereon be referred to as the ‘self-paced exercise
test’ (SPXT). This protocol has a closed-loop design which is made up of 5 x 2 min stages.
5
Work-rate is self-regulated based on prescribed ratings of perceived exertion (RPE) (Borg,
1982; Borg, 1990). Participants must regulate their work-rate based on an RPE of 11, then
13, 15, 17 and then finally a maximal effort of 20 in the final 2 min. In doing so, the SPXT
addresses the issues laid out by (Noakes, 2008). As intensity is clamped by RPE,
participants can regulate their own work-rate, but an incremental test design remains due to
the increasing RPE as the test progresses. The ability to self-regulate pace may make it
more relevant for athletes. Additionally, the closed loop design means participants always
exercise for 10 min, and due to the ‘need to think’ (Straub et al., 2014) during the protocol,
increases the role of the brain. This protocol design could also be considered more efficient
and practical due to it, unlike the GXT, not requiring the tester to estimate a starting
velocity or power (PO). This also means the test can be easily adapted to a wide range of
exercise modalities (Mauger et al., 2013). The definitive 10 min duration also means that
the test is guaranteed to match the well-cited recommendation that V砦 O2max tests last for
~10 min (Yoon et al., 2007).
Whilst the test design of the SPXT makes it a popular alternative to the GXT, much
interest has come from the findings of Mauger and Sculthorpe (2012) and their follow up
study which introduced the treadmill-based SPXT (Mauger et al., 2013a). In both of these
cycling and treadmill protocols, using untrained participants, they found that V砦 O2max was
significantly higher in the SPXT protocols compared to the GXT counterparts. As
mentioned earlier, whilst protocol differences can alter V砦 O2max, much of the debate
surrounded whether the self-paced nature of the SPXT was responsible for the differences
in V砦 O2max, with opinion very much divided (Mauger & Sculthorpe, 2012; Chidnok et al.,
2013; Mauger, 2013; Mauger et al., 2013; Mauger et al., 2013a; Astorino, 2014; Eston et
al., 2014; Poole, 2014). Since the height of this discussion, there has been a surge in
6
research regarding the SPXT in cycling and running across both applied and clinical
settings (Straub et al., 2014; Astorino et al., 2015; Faulkner et al., 2015; Scheadler &
Devor, 2015; Hanson et al., 2016; Jenkins et al., 2017; Jenkins et al., 2017a; Beltz et al.,
2018). Variations of the SPXT have also been used that tend to utilise different RPE
increments or stage lengths (Chidnok et al., 2013; Evans et al., 2014; Truong et al., 2017)
compared to the protocol first used by Mauger and Sculthorpe (2012). To avoid confusion,
study protocols that have utilised the test structure as described by Mauger and Sculthorpe
(2012) (5 x 2 min stages with RPE increments of 11, 13, 15, 17, and 20) will thereon be
termed ‘SPXT’ whereas studies that utilised a modified design will be described as having
used a ‘modified-SPXT’.
Reasons for potential differences in V砦 O2max in the SPXT have been hotly debated.
Mechanistic investigations have predominately focused on the hemodynamic responses
during both the GXT and SPXT, specifically looking at the role of O2 delivery and
extraction, and the role of cardiac output (Q砦 ). Beyond V砦 O2max, there have also been
inconsistent findings regarding other physiological variables such as minute ventilation
(V砦 E), respiratory exchange ratio (RER) and heart rate (HR). One of the main criticisms of
both GXT and SPXT testing is the lack of standardisation (Hutchinson et al., 2017), as this
has been highlighted as an on-going issue (Beltz et al., 2016) with various researchers
using slightly different methods which may confound progression towards an accepted
consensus.
The attraction of the GXT is largely two-fold: 1) It is the most well-recognised method of
directly measuring V砦 O2max, which is itself the most widely tested parameter in sport and
exercise science; and 2) it is a versatile test that can offer a wide range of data and

7
information to testers, clinicians, athletes, and coaches. Currently, the GXT can provide
data on VT, exercise efficiency, V砦 O2 kinetics, and as previously discussed, V砦 O2max (Poole
& Jones, 2017). The GXT can also be used to identify both the velocity at V砦 O2max
(vV砦 O2max) and the maximal velocity (Vmax) which can be used by coaches and practitioners
to prescribe interval training to athletes, recreationally active individuals, and clinical
populations (Smith et al., 2003; Laursen & Jenkins, 2002; Esfarjani & Laursen, 2007;
Manoel et al., 2017; Bacon et al., 2013). By prescribing training via these methods,
significant improvements in V砦 O2max, lactate thresholds (LT), VT, and the time in which
vV砦 O2max or Vmax can be maintained (Tmax), have been achieved (Smith et al., 2003; Denadai
et al., 2006; Esfarjani & Laursen, 2007; Laursen & Jenkins, 2002; Manoel et al., 2017;
Silva et al., 2017). Alternatively, the SPXT, whilst more ecologically valid and sport
specific (Noakes, 2008; Poole & Jones, 2017) than the GXT, does not currently offer
useful data beyond V砦 O2max. If it could, this would make the SPXT potentially attractive to
athletes and coaches.
Whilst the body of research on the SPXT is growing, gaps in the literature remain. The
SPXT as a valid protocol of V砦 O2max is increasingly investigated; however, little has been
done regarding highly trained athletes in relation to the SPXT. Of perhaps greater
fundamental importance is what the SPXT can offer athletes and coaches, as the protocol
was originally conceived to be more applicable to these populations. Accordingly, the aim
of this thesis was to identify the utility and advantages of the SPXT in assessing
cardiorespiratory fitness in runners.

8
Chapter 2: Literature Review
9
2.1. V砦 O2max and the factors that limit it
V砦 O2 is the total amount of oxygen consumed per minute whereas V砦 O2max is defined as the
highest rate at which oxygen can be taken up and utilised by the body during severe
exercise (Bassett & Howley, 2000). V砦 O2 can be expressed as an absolute value, as L.min-1,
or, more commonly in endurance performance, normalised to body weight and expressed
as mL.kg-1.min-1.
V砦 O2 is measured via the Fick equation where V砦 O2 = oxygen consumption; SV = stroke
volume; HR = heart rate; CaO2 = arterial oxygen content; CvO2 = mixed venous oxygen
content:
V砦 O2 = (SV x HR) x (CaO2 – CvO2)
During maximal exercise the Fick equation can be displayed as such:
V砦 O2max = (SVmax x HRmax) x (CaO2max – CvO2max)
An individual’s aerobic capacity is defined by the ability of the body to transport and use
oxygen. An individual’s aerobic capacity was first investigated by celebrated physiologist
A.V. Hill et al (Hill et al. 1924; Hill et al. 1924a). They tested it by running around a track
and measuring V砦 O2. They speculated V砦 O2 reached a point where no bodily effort could
drive it higher, concluding there was an upper limit to oxygen consumption. Impressively,
despite a lack of suitable equipment to make such measurements, Hill postulated that
V砦 O2max was limited by the cardiovascular system’s ability to supply O2. Despite the great
advancement in technology and techniques since the work of Hill et al, their findings still
ring true today (Bassett & Howley, 2000). During incremental exercise, V砦 E and Q砦 will
increase ensuring there is greater O2 delivery, so that blood is redistributed to muscles that
10
have a greater necessity for O2. As such V砦 O2max and Q砦 are higher in running exercise in
comparison to cycling where O2 is primarily required by the muscles of the legs. This is
due to running being ‘whole body’ exercise as a result of the dual role of both the arms and
legs during exercise. As Q砦 and O2 delivery to the muscles increases, oxygen is extracted
from the arterial blood which then widens the arteriovenous oxygen difference (a-vO2diff)
further. Due to the complex nature of oxygen delivery and utilisation, any step in the
pathway of O2 from the atmosphere to the mitochondria could represent a potential
impediment to V砦 O2 (Bassett & Howley, 2000). It is also worth stressing that limiting
factors can vary based on the population and exercise type (Robergs, 2001; Levine, 2008)
and so the following sections of this thesis will focus on healthy individuals during whole-
body exercise. As such, whilst this discussion alone could warrant an entire thesis, the
most widely accepted and best-evidenced limitations concern the cardiorespiratory
system’s ability to maximally deliver oxygen to the working muscles (Bassett & Howley,
2000; Bergh et al., 2000; Mortensen et al., 2005; Brink-Elfegoun et al., 2007; Hawkins et
al., 2007; Ferretti, 2014; Montero et al., 2015; Lundby et al., 2017).
As expressed by the Fick equation, V砦 O2max is governed by Q砦 max, which is the product of
maximal heart rate (HRmax) and SVmax, and the a-vO2diff. However, Q砦 is widely considered
the primary limiting factor for V砦 O2 in whole body exercise (Bergh et al., 2000; Bassett &
Howley, 2000; Saltin, 2005; Astorino et al., 2015; Astorino et al., 2017; Lundby et al.,
2017). During maximal incremental exercise in which hemodynamic responses were
monitored using direct invasive techniques (Mortensen et al., 2005), Q砦 increased linearly
to 80 % of peak PO (POpeak) and then plateaued due to a fall in SV, whereas HR continued
to increase. Limb blood flow also increased until 80 % and then plateaued. Conversely,
systemic a-vO2diff and O2 extraction increased until exhaustion, suggesting O2 delivery, not
11
extraction, was the limiting factor (Mortensen et al., 2005). When participants had
completed a GXT to assess V砦 O2max, followed by blood donation, and then another GXT
(48-72 hours (h) separating each visit) V砦 O2max significantly declined in the post-blood
donation visit, suggesting that blood flow and O2 delivery were the primary limiting factors
(Gordon et al., 2014). Q砦 max and SVmax have been shown to increase with endurance training
(~9 and 8 %, respectively), with a concurrent improvement in V砦 O2max (10 %) whilst a-
vO2diff did not improve (Astorino et al., 2017). Similar findings were reported by Ekblom
(1968), further supporting this notion. In a meta-anaylsis investigating the effect of
endurance training (ranging from 5 – 13 weeks (wk)) on 130 untrained and moderately
trained participants, V砦 O2max had a standardised mean difference (SMD) after training of
0.75. Q砦 max also improved (SMD = 0.64) whereas a-vO2diff did not (SMD = 0.21) (Montero
et al., 2015), further suggesting O2 delivery has greater implications than O2 extraction. As
will be discussed later (see section 2.5.4), several studies have investigated hemodynamic
responses during SPXT testing, however, these are typically performed with non-invasive
methods, due to the difficulty of including invasive catheter techniques. As such, these
methods should be considered estimative, as opposed to direct measurements.
2.2. Considerations for testing V砦 O2max
2.2.1. Step and RAMP protocols
The early tests for measuring V砦 O2 were discontinuous and intermittent in nature (Taylor et
al., 1955). Continuous protocols became more prevalent in the 1960s, largely as a result of
the increasingly widespread use of online gas analysers - these protocols became the crux
for the GXT as we know them today. An important feature of the GXT, which separates

12
this collection of protocols from the discontinuous protocols that preceded them, is the
V砦 O2-WR slope. This refers to the relationship between the increase in intensity and the
increase in V砦 O2 during the exercise test.
The treadmill protocols that first used continuous incremental designs are: Balke; Bruce;
Eleestad; and modified Astrand. All the tests are open-ended and combine different stage
lengths and intensity alteration (velocity or gradient) with the participant continuing until
they are unable to physically continue, or likewise they terminate the test due to fatigue
[thereon defined as volitional exhaustion]. These protocols are considered a ‘STEP’
variation, as the work-rate increases periodically every stage, creating an incremental step
effect. In a comparative study, Pollock et al (1976) investigated the aforementioned four
protocols’ ability to produce valid V砦 O2max using fifty-one healthy males (ranging from 35-
55 years old). In all four protocols: Balke, Bruce, Ellestad and Astrand; V砦 O2max was not
significantly different (39.4, 40.0, 40.7, and 41.8 mL.kg-1.min-1, respectively). Importantly,
they highlight that the protocol itself, when similar intensities and models are used, is not
necessarily the main contributing factor in V砦 O2max differences.
RAMP protocols have been suggested as an attractive alternative to step-protocols due to
these protocols increasing work-rate in a more continuous fashion compared to STEP
protocols. It has been proposed that the linear model of the RAMP may improve an
individual’s ability to reach a greater peak V砦 O2 (V砦 O2peak) (Whipp et al., 1981; Davis et al.,
1982; Beltz et al., 2016). Buchfuhrer et al (1983) compared RAMP cycling protocols of
different work rates (15 W.min-1, 30 W.min-1, and 60 W.min-1) with five male volunteers
and reported that 30 W.min-1 produced significantly the highest V砦 O2 values (P < 0.05)
compared to the 15 W.min-1 and 60 W.min-1 (3.77 ± 0.43 vs. 3.62 ± 0.40 vs. 3.35 vs. 0.38
13
L.min-1, respectively). Although widely regarded as a seminal study, the small sample size
(and thus low statistical power) renders the findings questionable on a larger scale (Yoon et
al., 2007). In another comparative study, Zhang et al (1991) had eight sedentary males
complete three cycling step protocols (stage durations of 1, 2, and 3 min) and a cycling
RAMP. Intensities for each protocol were individualised to bring about exhaustion in
approximately 12 min. V砦 O2max for the step protocols of 1, 2 and 3 min (3.35 ± 0.98 vs. 3.23
± .99 vs. 3.22 ± 1.07 L.min-1, respectively) did not significantly differ from that of the
RAMP (3.25 ± 1.04 L.min-1). This suggests that as long as stage duration and intensity are
appropriately selected, V砦 O2max is likely to be similar between a STEP and RAMP protocol.
Whilst both RAMP and step protocols continue to be used, preferences for protocol and
stage duration vary widely with multiple methods reported to be valid. RAMP protocols
may be preferable in situations where the highest possible V砦 O2peak is the primary goal,
however due to the small increases in work-rate utilised in the RAMP, identifying the V砦 O2
plateau is not feasible when analysing the differences in V砦 O2 between stages, which is a
clear disadvantage of the protocol. Alternatively, treadmill protocols are generally more
suited to the STEP design as many treadmills do not have ramp function capabilities. As
such, for the rest of the thesis step-dependent protocols will be referred to as GXT and
ramp-orientated protocols referred to as RAMP.
2.2.2. Test duration
It is a common conception that exercise tests which aim to elicit V砦 O2max should have a time
to exhaustion (TTE) of 8 - 12 min (Midgley et al., 2008). This notion largely comes from
the findings of Buchfuhrer et al (1983). In that study, participants completed three RAMP
cycling protocols and five treadmill protocols. These all had completion times of 5 - 26
min. In the shortest treadmill and cycling protocols (7 and 6 min, respectively) V砦 O2max was

14
significantly lower than those recorded in trials lasting between 8 – 17 min, and this was
attributed to the test duration. While novel at the time of publication, the study is not
without its limitations. First of all, as stated earlier, the small sample size (n = 5) means the
results have a low statistical power. Secondly, only the shortest tests (6 and 7 min) showed
a significant reduction in V砦 O2max, with protocols longer than 17 min not being significantly
different compared with those in the ‘optimal’ window of 8-17 min. More recent research
has recommended a test duration of 8-10 min (Yoon et al., 2007). In that study, sixteen
male and female University and club-level cyclists and triathletes completed four cycling
RAMP protocols with estimated durations of 5, 8, 12, and 16 min. They found that for
men, V砦 O2max was significantly higher in 8 min compared with all other durations (P = .02
for the 5 min; P < 0.01 for 12 and 16 min protocols). Of the eight male participants, seven
achieved their highest V砦 O2max during the 8 min and one achieved it during the 12 min
duration. There were no differences between protocols for women. This is further
supported by Astorino et al (2004) who reported that participants achieved significantly
lower V砦 O2max in a protocol lasting ~14 min compared with protocols of ~7 and 10 min
durations (3.45 ± 0.79 vs. 3.56 ± 0.83 vs. 3.58 ± 0.83 L.min-1, respectively). Shorter
protocols of ~5 min might underestimate V砦 O2max due to the steeper V砦 O2-WR slope creating
a greater reliance on anaerobic energy systems (Beltz et al., 2016), which may be
especially problematic in participants with lower fitness levels. Alternatively, as
highlighted by Midgley et al (2008), longer protocols that underestimate V砦 O2max usually
include excessive gradients (≥ 15 %) and so it may be the poorly tolerated incline and
related fatigue that results in the underestimated V砦 O2max as opposed to the actual protocol
duration. Furthermore, Buchfuhrer et al (1983) stated that longer protocols have not been
shown to offer any additional data of informative value compared with tests of durations of
8 – 12 min. Whilst Midgley et al (2008) made a recommendation to journal editors and
15
reviewers that they not judge manuscripts based on whether V砦 O2max protocols lasted
between ~8-12 min, protocol duration is still being highlighted as a limitation ten years on.
Based on the available evidence, as protocols as short as ~7 min have been shown to be
valid, and longer protocols offer no additional valuable information, aiming for ~10 min
protocols, as long as this is consistent throughout all protocols used, is most sensible,
unless further research suggesting otherwise is presented.
2.2.3. Importance of the V砦 O2max plateau
The primary criterion for achieving a ‘true’ V砦 O2max is a small or no increase in V砦 O2 despite
an increase in work-rate. Taylor et al (1955) first reported the use of a plateau and defined
it as an increase in V砦 O2 of less than 150 mL.min-1 in response to an increase in treadmill
gradient of 2.5 % at 7 mp.h-1. This criteria was determined by halving the mean increase in
V砦 O2 per stage increment for all participants. A wide range of values have since been used
to determine whether the plateau criteria have been satisfied, with a large majority of
researchers failing to even report their plateau criteria (Robergs et al., 2010). Typically,
various arbitrary (Midgley et al., 2007a) values ranging from the following have been
used: <50, 100, 150, 200, 280 mL.min-1 (Taylor et al., 1955; Astorino et al., 2000; Kang et
al., 2001; Astorino et al., 2005; Midgley et al., 2007a). Depending on the criteria used
during a GXT, incidences of the plateau identification can vary widely between 8-100 %
for adults (Astorino et al., 2000; Gordon et al., 2012; Beltrami et al., 2013). Midgley and
Carroll (2009) highlighted that an arbitrary plateau threshold of 280 mL.min-1 would have
been greater than the V砦 O2-WR slope for 10 subjects [in their own study], meaning that
plateau criteria would be satisfied for those participants regardless of whether a plateau had
been legitimately achieved. In contrast, they highlight that a plateau threshold of 100
mL.min-1, in the case of six out of twenty [of their participants], would have accounted for

16
nearly 33 % of the V砦 O2-WR slope, rendering a plateau difficult to achieve. Consequently,
such criteria should not be universally applied unless it is specific to the data set and
expected rate of V砦 O2 increase per unit of time in relation to the specific protocol design
(Beltz et al., 2016). Furthermore, numerous factors that may affect the ability of the
individual to obtain a plateau in V砦 O2 have been identified: age; testing modality; data
analysis methodology; non-contingent feedback; familiarisation; and female contraception
(Robergs, 2001; Astorino, 2009; Gordon et al., 2012; Gordon et al., 2017; Gordon et al.,
2017a; Beltz et al., 2016). However, the incidence of a plateau being verified may
primarily be a methodological rather than a physiological issue (Astorino et al., 2005).
Interval sampling of V砦 O2 data may be the main methodological limiter in achieving a V砦 O2
plateau. In a substantial investigation with a cohort of 106 [recreationally active to
competitive runners and triathletes] participants, plateau incidence was highest when using
15 seconds (s) sampling (91 % of participants), followed by 30 s (89 %), breath-by-breath
(81 %) and finally 60 s intervals (59 %) (Astorino 2009). Smaller sampling intervals may
increase the probability of a plateau being achieved due to allowing for better examination
of small change (Astorino, 2009) increases in V砦 O2 standard deviation (Myers et al., 1990)
however an increase in data noise (Howley et al., 1995) may mean that a plateau has been
detected due to calculation artefacts as opposed to physiological events (Beltrami et al.,
2013). Whilst 15 s sampling may slightly increase the chance of a plateau being detected
compared to 30 s interval sampling, 30 s sampling is still the most widely used (Robergs et
al., 2010) and most commonly used for additional measurements such as the identification
of the VT (Kuipers et al., 2003; Bergstrom et al., 2013; Gordon et al., 2017; Truong et al.,
2017; Wang et al., 2017). For these reasons, either 15 or 30 s interval sampling should be
used but 30 s may be preferable if the data is going to be used for VT measurement also.
17
Failure to register a plateau does not mean a true V砦 O2max has not been achieved or that it
does not exist (Wagner, 2000; Day et al., 2003). Some participants may not be capable of
achieving a plateau in V砦 O2 despite a maximal effort being given, regardless of whether
they are motivated or not (Midgley & Carroll, 2009) - perhaps due to the stress caused by
the workload (such as too steep a work-rate increment being used, as discussed in section
2.2.2). Interestingly, Rossiter et al (2006) highlighted that based on the work of Taylor et al
(1955), there was no implicit requirement of a plateau during a single bout of exercise, but
that V砦 O2 from a subsequent bout not be significantly higher. Whilst the detection of a
plateau in the primary exercise bout is always preferable, and practitioners should attempt
to select the best methodology to increase the probably of a valid plateau being detected
[as discussed in 2.2.1], this is not always possible. As such, this would support the use of a
secondary test or additional criteria to verify that a maximal effort, and thus a ‘true’
V砦 O2max has likely been achieved in the absence of a V砦 O2 plateau being observed.
2.2.4. Secondary criteria
In instances where a plateau has not been achieved, a set of secondary criteria may be
included to support whether a maximal effort has been given and a ‘true’ V砦 O2max attained.
The use of such secondary criteria is currently recommended by ACSM (Riebe et al.
2018). A combination of maximal values for RER, HR, post-test lactate concentration, and
RPE are used as evidence of a maximal effort having been given. Values used for
secondary criteria can vary greatly, however the following have been widely adopted: RER
(≥ 1.1); HR (within 10 bpm of age-predicted HRmax); RPE (≥ 17) (Edvardsen et al., 2014;
Beltz et al., 2016; Riebe et al., 2018). Although secondary criteria are regularly used to
support the attainment of V砦 O2max, the validity of such criteria is widely debated. This is
predominately due to large between-subject variation for the criteria being used (Midgley
18
et al., 2007a; Edvardsen et al., 2014; Beltz et al., 2016; Poole & Jones, 2017) which may
then provide false confidence in attaining V砦 O2max or even incorrectly excluding
participants who may otherwise have achieved a valid V砦 O2max or given a maximal effort
(Poole et al., 2008). Despite the criticism of secondary criteria, they continue to be
regularly reported, perhaps due to a lack of consensus on the alternatives. However, the
increasing popularity of verification testing may result in a decrease in their use.
2.2.5. Verification stage to confirm V砦 O2max
Due to the varying recommendations for V砦 O2max attainment criteria, it has become
increasingly recommended to utilise a verification stage (Day et al., 2003; Midgley et al.,
2006; Rossiter et al., 2006; Hawkins et al., 2007; Poole et al., 2008; Midgley & Carroll,
2009; Weatherwax et al., 2016; Astorino & DeRevere, 2017; Schaun, 2017). This usually
takes the form of a ‘square-wave’ bout of exercise that follows the initial incremental test.
The aim of a verification stage is to not simply achieve a similar V砦 O2 to that attained in the
preceding incremental test, but to create a platform which enables a higher V砦 O2 to be
reached if possible (Schaun, 2017). Intensities in the range of 5-10 % higher, or one stage
higher than that achieved in the incremental are most common (Midgley et al., 2006; Poole
et al., 2008; Mann et al., 2013; Sedgeman et al., 2013; Astorino et al., 2015; Astorino et al.,
2017; Beltz et al., 2016; Murias et al., 2018). The required rest between the GXT and
verification stage is considered less critical (Poole & Jones, 2017) and 10-20 min have
been used effectively (Midgley et al., 2006; Mauger et al., 2013a; Lim et al., 2016;
Weatherwax et al., 2016; Astorino & DeRevere, 2017). Nolan et al (2014) suggested that
an intensity of 105 % of the maximal GXT workload and 20 min rest period may be the
most optimal. They observed that a verification trial at 105 % confirmed a true V砦 O2max for
all participants regardless of the recovery period allocated between the GXT and
19
verification trial, whilst a verification intensity of 115 % only confirmed V砦 O2 in seven or
eight participants [out of twelve] depending on recovery period used. It is possible that in
the 115 % trials, the intensity limited the participants’ ability to produce a maximal
performance for a period long enough for V砦 O2 kinetics to respond accordingly (Poole &
Jones, 2017). Having the participants complete the incremental test and verification on the
same day also has practical implications and may be more pragmatic for athletes and
coaches compared to multiple lab visits.
Along with considering the intensity and recovery period of the verification stage, criteria
for deciding whether the verification stage confirms that a ‘true’ V砦 O2max has been achieved
is required. The most common method is that the verification stage V砦 O2 must be no higher
than 2-3 % than the incremental test, considering the measurement error of the equipment
(Dalleck et al., 2012; Weatherwax et al., 2016; Astorino & DeRevere, 2017; Beltz et al.,
2018). Fixed criteria such as < 50 mL-1.min-1 have also been used (Scheadler & Devor,
2015) however it is considered important that verification criteria are more individualised
(Schaun, 2017). It has been suggested that the verification stage may not be a valid method
of confirming V砦 O2max from an incremental test (Mauger et al., 2013). This is largely based
on the findings of (Hawkins et al., 2007) who reported that the verification stage confirmed
V砦 O2max in all 156 tests conducted. However, Hawkins et al (2007) did not state what their
criteria for V砦 O2max confirmation in the verification stage was. As with the GXT and plateau
attainment, the criteria and methodology chosen is important. When using the criteria of ≤3
% (V砦 O2max from the GXT being less than the verification) V砦 O2max confirmation has varied
from 87 – 100 % (Dalleck et al., 2012; Weatherwax et al., 2016; Beltz et al., 2018) whilst
out of 109 participants, Astorino and DeRevere (2017) reported that 11 % did not have
V砦 O2max verified by the verification stage. Recently, Murias et al (2018) suggested that the
20
verification stage may not be necessary. They based this on their findings that there were
no differences between a GXT and a verification, and that this meant that the verification
stage does not prove an underestimation of V砦 O2max derived from the GXT. However,
finding no differences between the protocols does not make the verification stage
redundant, as they themselves concede that such findings could either suggest that the
verification stage ‘confirms’ that a true V砦 O2max was achieved, or alternatively that the
verification simply confirms the adequacy of the GXT. Either way, it is arguable that this
still provides useful information, and the fact that past research has found that the
verification can be significantly higher in some participants (Astorino & DeRevere, 2017)
provides evidence that the verification stage is still beneficial. The current consensus is that
the verification stage is still a useful component to verify V砦 O2max (Poole & Jones, 2017;
Schaun, 2017) however the intensity [and thus the likely duration] and the criteria must be
carefully selected, with the recovery [between the incremental and verification] less
essential.
2.3. Additional parameters that can be obtained via the GXT
2.3.1. Velocity at V砦 O2max and maximal velocity
It is reasoned that to improve V砦 O2max it is important to train at velocities that would elicit it
(Laursen & Jenkins, 2002). vV砦 O2max is traditionally measured as the lowest speed which
elicits V砦 O2max during an incremental test (Billat & Koralsztein, 1996; Billat et al., 2000;
Laursen & Jenkins, 2002; Hanon et al., 2008; Esfarjani & Laursen, 2007; Manoel et al.,
2017) and has been reported to have good repeatability across two repeated tests (intraclass
correlation coefficient (ICC) = .93) (Merry et al., 2016). vV砦 O2max has commonly been used
21
to prescribe interval training (Esfarjani & Laursen, 2007; Manoel et al., 2017; Denadai et
al., 2006; Silva et al., 2017) (see section 2.6).
The terms vV砦 O2max and Vmax are often used interchangeably; however the difference
between the two is small but significant. Vmax is the maximal velocity [or peak, termed
Vpeak] achieved in a treadmill test (Jones & Carter, 2000), and so is not directly associated
with V砦 O2max. Vmax is often calculated as the highest speed which is maintained for 30 – 60
s at the end of the test (Noakes et al., 1990; Slattery et al., 2006; Stratton et al., 2009;
McLaughlin et al., 2010; Smith et al., 2003). Numerous studies have found Vmax to be
highly correlated with running performance in distances ranging from 3-16 km (r = 0.83-
0.97) (Noakes et al., 1990; Slattery et al., 2006; Stratton et al., 2009; McLaughlin et al.,
2010; Machado et al., 2013). Both vV砦 O2max and Vmax have been shown to produce similar
outcomes when used as part of high intensity interval training (HIIT) (Manoel et al., 2017)
(see section 2.6) however, Vmax may be more practical to coaches and athletes compared to
vV砦 O2max due to the relative ease in which it is obtained, as Vmax does not require a
measurement of V砦 O2max to calculate it.
2.3.2. Ventilatory thresholds
There are typically two ventilatory breakpoints that are passed during incremental exercise.
During exercise the first threshold is typically identified via a first breakpoint in gas
exchange or ventilation. The second threshold is typically identified as the point when a
second breakpoint in gas exchange or ventilation occurs. There has been a series of
contrasting and often conflicting terminology and definitions for exercise thresholds,
which has caused considerable confusion in the field (Bosquet et al., 2002; Binder et al.,
2008; Faude et al., 2009; Beneke et al., 2011; Hopker et al., 2011; Hall et al., 2016). To
22
avoid further confusion the VT will be referred to as the first ventilatory threshold (VT1)
and the second ventilatory threshold (VT2), and these will be defined as the first and
second break points in gas exchange or ventilation, respectively.
VT1 is characterised as the work-rate or V砦 O2 just below the point in which anaerobic
metabolism becomes a significant contributor to the increasing work rate and associated
changes in gas exchange occur (Hopker et al., 2011) and typically occurs at 60-75 %
V砦 O2max (Zhang et al., 1991; McClave et al., 2011; Bergstrom et al., 2013; Seiler & Sjursen,
2002; Nicolò et al., 2014; Rabadán et al., 2011; Esteve-Lanao et al., 2007; Cannon et al.,
2009; Peinado et al., 2016). VT2 is characterised by a considerable increase in blood
lactate accumulation and ventilation (Hopker et al., 2011; Morán-navarro et al., 2016) and
is typically observed at 81-88 % V砦 O2max (Gordon et al., 2017; Seiler & Sjursen, 2002;
Nicolò et al., 2014; Mermier, 2013; Rabadán et al., 2011; Esteve-Lanao et al., 2007; Black
et al., 2014). VT1 is most commonly calculated using either the V-Slope or ventilatory
equivalents (VEQ) methods. In V-Slope, VT1 represents the first break-point in the V砦 O2
vs. V砦 CO2 relationship (Beaver et al., 1986). In VEQ, VT1 occurs when there is a rise in
V砦 E/ V砦 O2 without a concurrent rise in V砦 E/ V砦 CO2 (Beaver et al., 1986). A third method can
be used which uses the first increase in PETO2 with no concurrent fall in PETCO2 (Beaver et
al., 1986). As VT can be difficult to determine (Gaskill et al., 2001), authors sometimes
utilise multiple methods to confirm where the threshold occurs. They use a primary
method, typically either V-Slope or VEQ and then confirm the result using the remaining
method and PETO2 vs. PETCO2 (Bergstrom et al., 2013; Gaskill et al., 2001; Nicolò et al.,
2014; Jenkins et al., 2017a). VT2 can be identified using the following: the break-point in
V砦 E vs. V砦 CO2 relationship; first non-linear increase in V砦 E/ V砦 CO2 with a continued rise in
V砦 E/ V砦 O2; and a fall in PETCO2 (Beaver et al., 1986; Nicolò et al., 2014; Mermier, 2013;
23
Spurway et al., 2012; Rabadán et al., 2011; Esteve-Lanao et al., 2007; Bertuzzi et al., 2014;
Black et al., 2014).
VT is typically identified visually by experienced researchers/laboratory technicians.
Whilst this does allow for human error and subjectivity (Rabadán et al., 2011), this can be
countered by having VT confirmed by a minimum of two researchers or technicians, to
ensure agreement is found and to limit individual bias (Gaskill et al., 2001; Esteve-Lanao
et al., 2007; Rabadán et al., 2011; Mermier, 2013; Black et al., 2014; Maturana et al., 2017;
Peinado et al., 2016; Jenkins et al., 2017a; McNulty & Robergs, 2017; Truong et al., 2017).
Automated calculations of VT built into online gas analysers can be used (Plato et al.,
2008; Kang et al., 2001; Kuipers et al., 2003) however even these will sometimes require
human correction as the software may not be able to account for individual differences or
discrepancies in the test.
VT can be beneficial in prescribing exercise intensities and training zones for athletes
(Esteve-Lanao et al., 2007; Seiler, 2010; Mora et al., 2016). The advantage of VT
assessment over LT assessment is that VT can be detected via a GXT or RAMP (Kang et
al., 2001; Plato et al., 2008; Mcnulty & Robergs, 2017; Jenkins et al., 2017a) without the
need for additional lactate analysis equipment (Black et al., 2014). This is because VT is
detected via ventilatory and gas exchange data that is synonymously collected when testing
for V砦 O2max via online gas analysis. This potentially makes its desirable over LT, although
how related LT and VT are, is debated (Hopker et al., 2011). As previously mentioned, VT
is typically measured via a GXT or RAMP due to the linear increase in PO or velocity.
However, a few studies have recently investigated the determination of VT within the
SPXT. Truong et al (2017) reported a VT1 of 75 and 76 % in the GXT and SPXT
24
[respectively] amongst highly trained middle-distance runners. However, they utilised a
modified SPXT that used 1 min stages (discussed more in section 2.5). Due to the very
small increments in RPE, participants likely found it difficult to differentiate between RPE
levels for each stage and so the RPE associated with VT1 may not be accurate. They also
failed to identify VT2 in 8 out of 11 GXT tests which may suggest the 1 min stages made it
difficult to get a valid ventilatory response. Similar findings were reported by Beltz et al
(2018) with VT1 reported as 78 and 79 % in the SPXT and GXT [respectively] however
unfortunately they did not measure VT2. Also, considering the relatively low fitness levels
of the participants (V砦 O2max = ~47 mL.kg-1.min-1) ~78 % could be considered quite high
compared to previous research. Whilst these are interesting findings, VT has yet to be
investigated in a study that utilised both a well-trained population and an unmodified
SPXT (2 min stages).
2.4. Rating of perceived exertion in exercise testing
Perceived exertion [or perception of effort] is the feeling of how heavy, strenuous and
laborious exercise is, and plays a crucial role in endurance performance (Pageaux, 2016).
This is predominately due to its strong relationship with exercise intensity (e.g. work,
speed, power) (Eston, 2012; Eston & Thompson, 1997) and physiological factors such as
HR, ventilation, blood lactate, and V砦 O2max (Hetzler et al., 1991; Eston & Williams, 1998;
Pfeiffer et al., 2002; Eston et al., 2005; Green et al., 2006; Davies et al., 2007; Faulkner &
Eston, 2007; Lambrick et al., 2009; Eston, 2012; Scherr et al., 2013; Dantas et al., 2015;
Madrid et al., 2016; Nicolò et al., 2016). RPE is typically utilised in the form of a verbally
anchored scale of which the most popular (Eston, 2012) is the Borg RPE 6-20 (Borg, 1982;
25
Borg, 1990). It is constructed as a 15-point scale from 6-20 where 6 represents ‘no exertion
at all’ and 20 represents ‘maximal exertion’. RPE 7 and 8 are considered extremely light,
RPE 9 ‘very light’, RPE 11 ‘light’, RPE 12 ‘somewhat hard’, RPE 15 ‘hard’, RPE 17 ‘very
hard’ before the final aforementioned maximal effort of RPE 20. Participants are able to
select numbers in between, and even decimal places if deemed necessary (Pageaux, 2016).
RPE is most commonly used as a dependent variable during a GXT where participants give
a subjective estimation of their effort (estimation trial) (Eston & Thompson, 1997).
Participants can then regulate subsequent exercise with RPE anchored to an intensity such
as V砦 O2max, HR, or blood lactate (Ceci & Hassmen, 1991; Faulkner et al., 2007; Kang et al.,
2009). The latter is known as ‘estimation-production’. Production procedures have been
well utilised in the form of a perceptually regulated exercise test (PRET) (Eston et al.,
2005; Eston et al., 2006; Faulkner et al., 2007; Eston et al., 2008; Eston et al., 2012; Smith
et al., 2015). The exact methodologies of each PRET differ, however they generally consist
of 4-5 stages (each being 2-4 min in length) in which work-rate is regulated by RPE values
ranging between 9, 11, 13, 15, and 17. Eston et al (2005) reported that the predicted
V砦 O2max from the PRET was not significantly different to that of a GXT (48.6 vs. 48.8 ± 7.1
mL.kg1.min-1, respectively) with similar findings since reported (Eston et al., 2006;
Faulkner et al., 2007; Eston et al., 2008; Eston et al., 2012; Smith et al., 2015). These
studies however, did not use plateau criteria to verify V砦 O2max in the GXT, to ensure a true
V砦 O2max was attained, which is important when the PRET is being validated against the
GXT.
Whilst these findings are of interest, the PRET protocol is somewhat cumbersome, as at
each RPE stage, the participant is required to regulate their RPE at the given intensity for
26
2-3 min, after which the intensity is clamped for a further 2-4 min. This raises two key
issues: 1) if the PRET contains 5 stages, the participant could be exercising for up to 35
min, compared to ~15 min in a GXT containing 3 min stages (Eston et al., 2005); 2) by
only allowing participants to regulate their intensity for the initial part of each stage, the
test ceases to be continuously RPE-regulated, and simply becomes intensity-fixed. A
potential argument for the use of a PRET is it may be safer to predict V砦 O2max via a
submaximal protocol in clinical populations [although this has been disputed] (Noonan &
Dean, 2000; Balady et al., 2010; Smith et al., 2015; Jenkins et al., 2017; Jenkins et al.,
2017b; Selig et al., 2017). Regardless of this, as healthy participants have been used (Eston
et al., 2005; Eston et al., 2006; Faulkner et al., 2007; Eston et al., 2012) it highlights
whether it is worth using predictive V砦 O2max protocols at all, when it is just as practical [and
actively quicker] to directly measure V砦 O2max via a GXT. The PRET does highlight,
however, that RPE can be used effectively in production trials which may have an
implication for RPE based training.
2.5. Self-paced exercise tests
2.5.1. RPE clamped self-paced exercise tests
The GXT has been notably criticised by Noakes (2008) for components which he describes
as “being foreign” to all forms of freely chosen exercise. As no sports are performed in this
fashion, it can be argued that the GXT does not represent the challenges of real sport and
exercise. The SPXT was originally designed by Mauger and Sculthorpe (2012) as a novel
method to assess V砦 O2max in cycling. Participants completed both a GXT and an SPXT
protocol using a Computrainer cycle ergometer (RacerMate, Seattle, USA). The SPXT was
27
made up of 5 x 2 min stages, meaning it had a closed loop design and end-time of 10 min.
Intensity was clamped via RPE values of 11, 13, 15, 17 and crucially a maximal effort at
RPE 20, meaning that the first 2 min stage was completed at RPE 11, and then the next 2
min at RPE 13, and so on. Throughout the protocol PO could be freely regulated to match
the required RPE of the given stage. In the GXT, the test commenced at a PO of 60 W and
increased by 30 W every 2 min until either the participant reached volitional exhaustion or
the cadence dropped to below 60 revolutions per minute, terminating the test. The SPXT
produced significantly higher V砦 O2max values than those attained in the GXT (see table 2.1),
which consequently represented an 8 % difference. This was despite a plateau being found
in the majority of the tests, although no actual number is given by Mauger and Sculthorpe
(2012) on what a ‘majority’ represents.
28
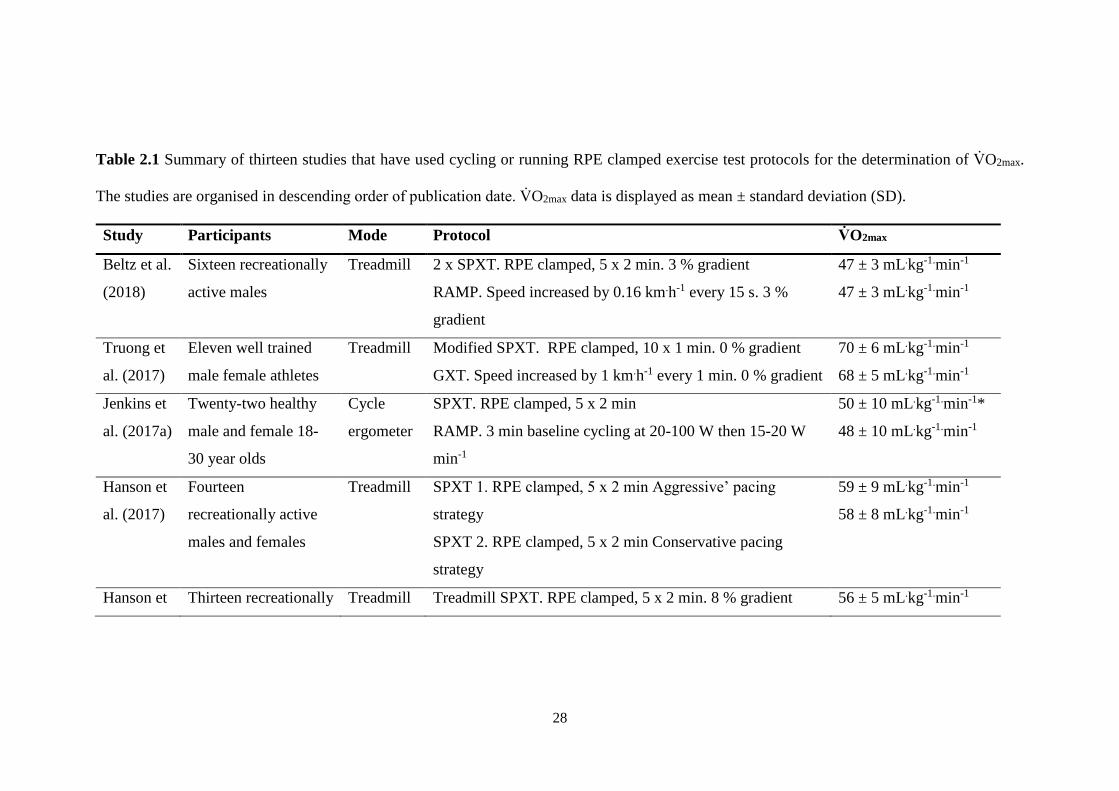
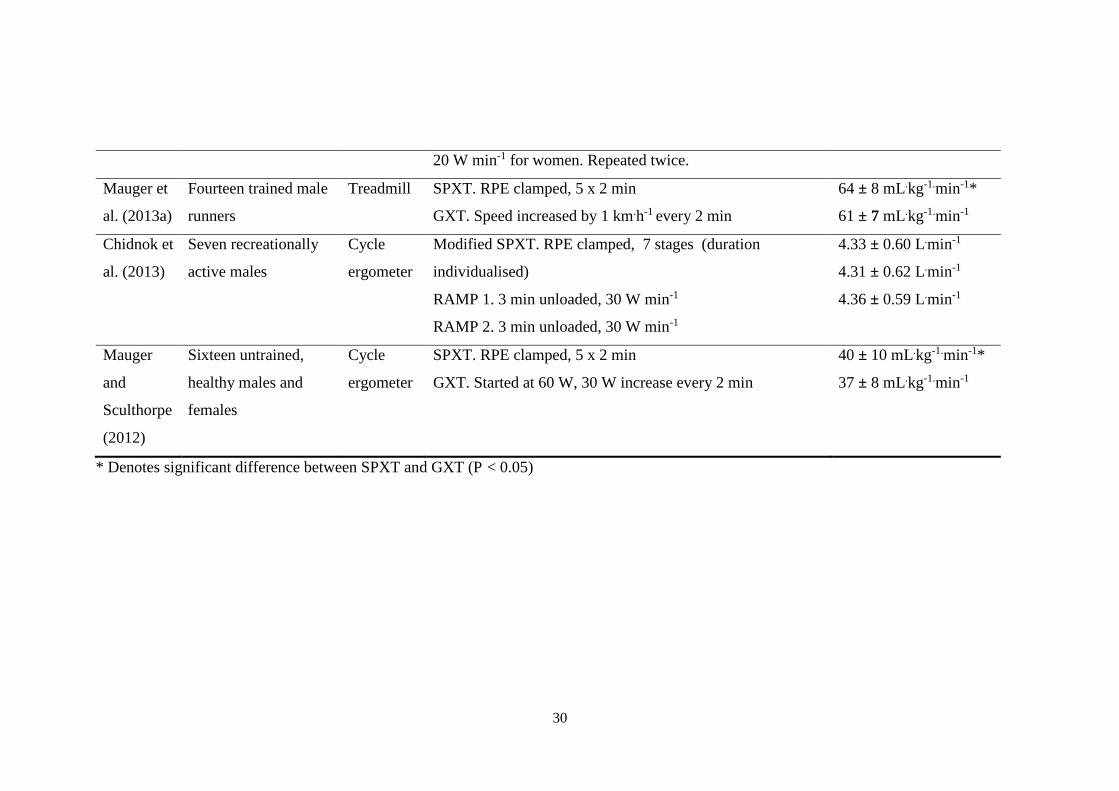
Table 2.1 Summary of thirteen studies that have used cycling or running RPE clamped exercise test protocols for the determination of V砦 O2max.
The studies are organised in descending order of publication date. V砦 O2max data is displayed as mean ± standard deviation (SD).
Study Participants Mode Protocol V砦 O2max
Beltz et al.
(2018)
Sixteen recreationally
active males
Treadmill 2 x SPXT. RPE clamped, 5 x 2 min. 3 % gradient
RAMP. Speed increased by 0.16 km.h-1 every 15 s. 3 %
gradient
47 ± 3 mL.kg-1.min-1
47 ± 3 mL.kg-1.min-1
Truong et
al. (2017)
Eleven well trained
male female athletes
Treadmill Modified SPXT. RPE clamped, 10 x 1 min. 0 % gradient
GXT. Speed increased by 1 km.h-1 every 1 min. 0 % gradient
70 ± 6 mL.kg-1.min-1
68 ± 5 mL.kg-1.min-1
Jenkins et
al. (2017a)
Twenty-two healthy
male and female 18-
30 year olds
Cycle
ergometer
SPXT. RPE clamped, 5 x 2 min
RAMP. 3 min baseline cycling at 20-100 W then 15-20 W
min-1
50 ± 10 mL.kg-1.min-1*
48 ± 10 mL.kg-1.min-1
Hanson et
al. (2017)
Fourteen
recreationally active
males and females
Treadmill SPXT 1. RPE clamped, 5 x 2 min Aggressive’ pacing
strategy
SPXT 2. RPE clamped, 5 x 2 min Conservative pacing
strategy
59 ± 9 mL.kg-1.min-1
58 ± 8 mL.kg-1.min-1
Hanson et Thirteen recreationally Treadmill Treadmill SPXT. RPE clamped, 5 x 2 min. 8 % gradient 56 ± 5 mL.kg-1.min-1
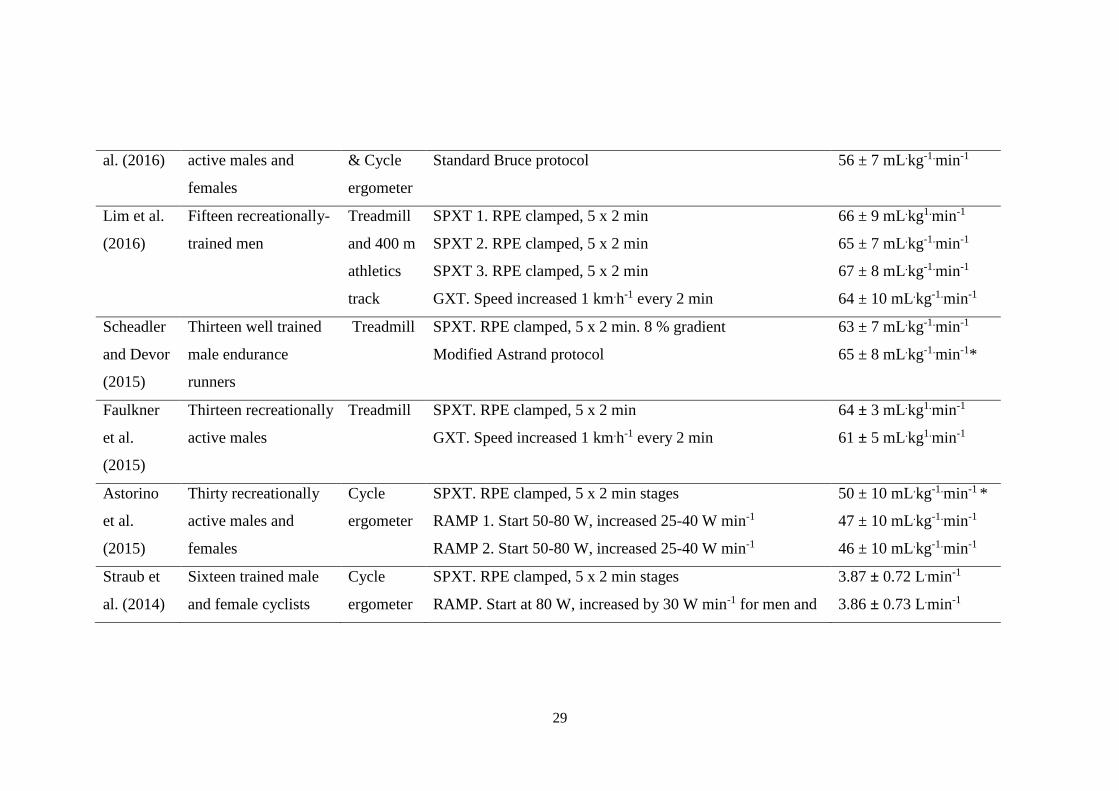
29
al. (2016) active males and
females
& Cycle
ergometer
Standard Bruce protocol 56 ± 7 mL.kg-1.min-1
Lim et al.
(2016)
Fifteen recreationally-
trained men
Treadmill
and 400 m
athletics
track
SPXT 1. RPE clamped, 5 x 2 min
SPXT 2. RPE clamped, 5 x 2 min
SPXT 3. RPE clamped, 5 x 2 min
GXT. Speed increased 1 km.h-1 every 2 min
66 ± 9 mL.kg1.min-1
65 ± 7 mL.kg-1.min-1
67 ± 8 mL.kg-1.min-1
64 ± 10 mL.kg-1.min-1
Scheadler
and Devor
(2015)
Thirteen well trained
male endurance
runners
Treadmill SPXT. RPE clamped, 5 x 2 min. 8 % gradient
Modified Astrand protocol
63 ± 7 mL.kg-1.min-1
65 ± 8 mL.kg-1.min-1*
Faulkner
et al.
(2015)
Thirteen recreationally
active males
Treadmill SPXT. RPE clamped, 5 x 2 min
GXT. Speed increased 1 km.h-1 every 2 min
64 ± 3 mL.kg1.min-1
61 ± 5 mL.kg1.min-1
Astorino
et al.
(2015)
Thirty recreationally
active males and
females
Cycle
ergometer
SPXT. RPE clamped, 5 x 2 min stages
RAMP 1. Start 50-80 W, increased 25-40 W min-1
RAMP 2. Start 50-80 W, increased 25-40 W min-1
50 ± 10 mL.kg-1.min-1 *
47 ± 10 mL.kg-1.min-1
46 ± 10 mL.kg-1.min-1
Straub et
al. (2014)
Sixteen trained male
and female cyclists
Cycle
ergometer
SPXT. RPE clamped, 5 x 2 min stages
RAMP. Start at 80 W, increased by 30 W min-1 for men and
3.87 ± 0.72 L.min-1
3.86 ± 0.73 L.min-1
30
20 W min-1 for women. Repeated twice.
Mauger et
al. (2013a)
Fourteen trained male
runners
Treadmill SPXT. RPE clamped, 5 x 2 min
GXT. Speed increased by 1 km.h-1 every 2 min
64 ± 8 mL.kg-1.min-1*
61 ± 7 mL.kg-1.min-1
Chidnok et
al. (2013)
Seven recreationally
active males
Cycle
ergometer
Modified SPXT. RPE clamped, 7 stages (duration
individualised)
RAMP 1. 3 min unloaded, 30 W min-1
RAMP 2. 3 min unloaded, 30 W min-1
4.33 ± 0.60 L.min-1
4.31 ± 0.62 L.min-1
4.36 ± 0.59 L.min-1
Mauger
and
Sculthorpe
(2012)
Sixteen untrained,
healthy males and
females
Cycle
ergometer
SPXT. RPE clamped, 5 x 2 min
GXT. Started at 60 W, 30 W increase every 2 min
40 ± 10 mL.kg-1.min-1*
37 ± 8 mL.kg-1.min-1
* Denotes significant difference between SPXT and GXT (P < 0.05)
31
The findings of Mauger and Sculthorpe (2012) were criticised by Chidnok et al (2013) who
argued that the high V砦 O2max in the SPXT could be explained by the longer GXT test
duration (10 ± 0 vs. 13 ± 3 min, respectively). In response to the findings of Mauger and
Sculthorpe (2012), Chidnok et al (2013) investigated whether the SPXT resulted in
differences in V砦 O2max compared to a GXT. In their methodology, the SPXT protocol
differed significantly from the original protocol and consisted of 7 stages in which stage
duration equated to the duration of the initial RAMP test divided by 7. For the 7 stages
RPE was clamped at 8, 10, 12, 14, 16, 18, and 20. They found that V砦 O2max did not
significantly differ between the two RAMP protocols and the SPXT. Although the authors
should be commended on their method of matching the test durations between the two
protocols it is interesting that they decided to alter the SPXT duration to match that of the
GXT. They argue that the longer duration of the GXT may have ‘stifled’ participants’
ability to achieve a true V砦 O2max in that protocol, resulting in the SPXT producing a
significantly higher V砦 O2max. Whilst this argument is potentially valid, their decision to then
alter and lengthen the SPXT undermines this argument. This is further supported by the
authors citing Eston (2012) who clearly state that to truly evaluate whether the V砦 O2max
values observed by Mauger and Sculthorpe (2012) were legitimate, a direct comparison
where test duration is matched would be required. The most logical solution would be to
alter the GXT, as their main argument is that the longer duration of the GXT may lead to
an invalid V砦 O2max and it is the specific protocol of the SPXT that they were testing the
validity of. Ultimately, it is difficult to directly compare their findings to the SPXT as
described by Mauger and Sculthorpe (2012) as these protocols differ significantly.
The SPXT has since been applied to treadmill running (Mauger et al., 2013a; Faulkner et
al., 2015; Scheadler & Devor, 2015; Hanson et al., 2016; Truong et al., 2017; Beltz et al.,

32
2018). Mauger et al (2013) reported significantly higher V砦 O2max values in the SPXT
compared to the GXT. Their methodology consisted of a motorised treadmill for the GXT
and a non-motorised treadmill for the SPXT, with thirteen of the fourteen participants
achieving a higher V砦 O2max in the SPXT and all but two participants achieving a plateau in
the GXT. Running speed was noted to be significantly higher during all stages of the GXT
compared to the SPXT, including significantly higher peak speeds (16.3 ± 2.1 vs. 9.6 ± 1.2
km.h-1, in the GXT and SPXT respectively). This is due to the use of two different types of
treadmill - which has been criticised (Eston et al., 2014; Poole, 2014). The much lower
speeds achieved in the SPXT were most likely as a result of higher belt friction
experienced on the non-motorised treadmill (Hopker et al., 2009). Finally, the specific
model of non-motorised treadmill (Force 3.0, Woodway USA Inc., Wisconsin, USA) used
in the study is traditionally intended for sprinting, making it inappropriate for longer
durations and resulting in slower speeds and different biomechanics. For these reasons
comparison of the two different modalities is inappropriate. This is to date the only
treadmill-based study to find V砦 O2max to be higher in the SPXT, with studies utilising a
motorised treadmill finding no differences between protocols (Faulkner et al., 2015;
Hanson et al., 2016; Beltz et al., 2018). However, conducting a self-paced protocol on a
motorised treadmills can also be challenging due to the requirement of the participant to
manually alter their own work-rate, typically achieved using the buttons on the treadmill
(Faulkner et al., 2015; Beltz et al., 2018). To date, the general consensus is that the SPXT
provides equal or higher V砦 O2max in comparison to the GXT, with the exception of one
study in which V砦 O2max was reported to be lower in the SPXT (discussed in 2.5.4).
Lim et al (2016) has investigated the use of the SPXT in the field. The primary aim of this
study was to assess the concurrent validity and repeatability of a field-SPXT compared to a
33
GXT [as described by Faulkner et al (2015)]. In their study, the field-based SPXT utilised
the same protocol as described by Mauger and Sculthorpe (2012) however rather than
laboratory based, the trials were completed on an outdoor synthetic 400 m athletics track
with physiological data collected via a portable K4-b-TX Cosmed gas analyser (Cosmed
K4-b-TX, Rome, Italy). Global positioning system (GPS) was used to track changes in
speed. V砦 O2max in the GXT was 63.5 ± 10.1 mL.kg-1.min-1 and for the three SPXT trials was
65.5 ± 8.7, 65.4 ± 7.0, and 66.7 ± 7.7 mL.kg-1.min-1 with no consequent familiarisation
effect observed between the three field-SPXT trials (ICC = 0.80; SEM = 3.16 mL.kg-1.min-
1) and a mean difference of 1.8 mL.kg-1.min-1 between the three field-SPXT trials. Whilst
the reported ICC was not as high as previously reported for the 20 m multi-stage shuttle
run test (ICC = 0.95) (Lamb & Rogers, 2007; Aandstad et al., 2011), the findings for the
20 m multi-stage shuttle run test referred to predicted V砦 O2max, and not measured, as per the
findings of Lim et al (2016). Also, the small mean difference (1.8 mL.kg-1.min-1) for
measured V砦 O2max reported by Lim et al (2016) suggests the field-based SPXT is a reliable
method for direct V砦 O2max measurement, which may make it more appropriate and attractive
to athletes and coaches than the laboratory based GXT, which does not currently provide a
similar field-based protocol.
2.5.2. Pacing strategies in the SPXT
Whilst previously it has been stated that the RPE 20 stage is an ‘all-out’ effort (Jenkins et
al., 2017a), precise instruction is rarely given to participants [or simply not reported]. Of
the twelve SPXT studies [see table 2.1], five simply stated that participants were asked to
match each RPE, with no further detail given, whilst another did not report any instruction.
Of the studies that did give more detailed descriptions, these tended to differ. For instance,
Mauger et al (2013a) clearly instructed the participants to vary their speed to match the

34
RPE for each given moment, as opposed to pacing themselves according to the projected
end point of the test, and thus the final stage was instructed to be performed as a maximal
effort with no regard to pacing for the 2 min duration. Faulkner et al (2015), and Straub et
al (2014), instructed participants to modify their intensity on a ‘moment-to-moment basis’
but give no specific mention to the final stage, whilst Astorino et al (2015) simply stated
that the final stage ‘must elicit volitional exhaustion’. Alternatively, Chidnok et al (2013)
stated that participants were instructed to ‘pace them-selves within each stage in
accordance to the prescribed RPE’ and that they should ‘reach volitional exhaustion at the
end of the test’. It is arguable that participants could interpret this instruction to suggest
that effort should be reserved until the end of the final stage as to ensure they are exhausted
then, but not necessarily before (which an all-out effort may instead achieve). This is
potentially reflected in the mean POpeak participants’ achieved in the RAMP and SPXT
(385 ± 47 vs. 364 ± 46 W, respectively) by Chidnok et al (2013). It is conceivable that this
lower PO – potentially brought on by confusion regarding the requirements of the protocol
– may have had an impact on the ability of the participants to produce true a V砦 O2max.
Hanson et al (2017) sought to provide some clarity regarding the differing pacing strategies
during the final stage (RPE20) of the SPXT. They compared two SPXT protocols which
were identical other than the final stage of each SPXT having a different prescribed pacing
strategy. The order of these two trials were randomised and participants were verbally
instructed to utilise either a ‘conservative’ or ‘aggressive’ pacing strategy. For the
conservative strategy participants were asked at the onset of the final stage (from 8 min) to
progressively increase their speed until approximately 09:30, in which they would switch
to an all-out effort. Unfortunately, the authors do not elaborate on how the participants
would know approximately 30 s remained. In the all-out trial participants were asked to
35
run aggressively from the offset of the final stage with the expectation that their speed
would inevitably slow. V砦 O2max was not significantly different between aggressive and
conservative strategies. Average velocity for the final 2 min did not significantly differ
between aggressive and conservative strategies (12.3 ± 2.4 vs. 12.1 ± 1.9 km.h-1,
respectively). This importantly suggests that a specific pacing strategy during the final
stage of the SPXT may not be essential to ensure a similar outcome between participants
for V砦 O2max. This is also important if athletes and coaches want to use the velocity at RPE20
in training prescription, as they can be confident that how the final stage is paced will not
ultimately affect the mean velocity.
2.5.3. Reliability of the SPXT
Along with the validity of the SPXT, the reliability of the protocol has also been
investigated (Lim et al., 2016; Jenkins et al., 2017) in both cycling and outdoor running.
Investigating the test-retest reliability of twenty-five healthy participants across three
cycling-SPXT protocols, Jenkins et al (2017) reported that the coefficient of variation for
V砦 O2peak was 4.7 %, which is similar to previous research for GXT protocols (Froelicher et
al., 1974; Mauger et al., 2013a; Lim et al., 2016). Recently Lim et al (2016) concluded that
a field-based SPXT was a reliable measure of V砦 O2, with three repeated SPXT trials
resulting in strong ICCs (<0.80). This is important as it not only shows that the SPXT is
comparable to the GXT for V砦 O2max measurement, but that it is repeatable and also not
subject to issues with familiarisation.
2.5.4. Mechanistic differences during the SPXT
Mauger and Sculthorpe (2012) speculated that the higher V砦 O2 values attained in the SPXT
could be due to a lower recruitment of type II muscle fibres until the latter stages of the
36
test, which they argue is supported by the drastic 70 W increase in PO witnessed during the
initial parts of the final stage of the SPXT followed by a significant drop. Conversely,
Scheadler and Devor (2015) argued that, in their study, the lower V砦 O2max reported during
the SPXT may have been as a result of an increased recruitment of muscle fibres in the
final stage due to too great an increase in intensity between stages 4 and 5. In their study,
the final stage of the SPXT produced supramaximal running at ~106 % vV砦 O2max. Their
argument that this caused a greater anaerobic contribution and thus a lower V砦 O2max seems
unlikely as verification stages typically involve intensities in this range (as discussed in
section 2.2.5). As an example, a participant may run the final stage at 16 km.h-1, meaning
their verification stage would be set at 17 km.h-1. This would represent approximately 106
% vV砦 O2max, and as the verification stage is used as a tool to try and drive up V砦 O2max to
ensure that the V砦 O2peak obtained in the main test is in fact a max, 106 % is not likely to be
considered ‘too anaerobic’. Additionally, they set the treadmill gradient of the SPXT at 8
%, to avoid participants ‘maxing’ out the speed of the treadmill. In their GXT, gradient
increased by 2 % every 2 min, suggesting the earlier stages of the SPXT may have been
performed at a higher work rate than the GXT, which could then have potentially altered
the V砦 O2 response in the latter stages. The utilisation of a greater gradient coupled with the
low speeds associated with the early stages of the SPXT, may have resulted in a loss of
efficiency and premature muscle fatigue (Kang et al., 2001).
A number of studies have reported lower HRmax values in the SPXT compared to the GXT
(Mauger & Sculthorpe, 2012; Mauger et al., 2013a; Faulkner et al., 2015; Scheadler &
Devor, 2015). Mauger et al (2013a) speculated that the lower HRmax recorded in the SPXT,
coupled with no change in V砦 E, may suggest that the higher V砦 O2max in the SPXT was more
likely due to O2 extraction than delivery, meaning some sort of muscular recruitment or
37
peripheral blood flow adaptation must have occurred, although this was not tested.
Interestingly, multiple studies have found the SPXT to produce lower HRmax compared to
the GXT, in the range of 2-4 bpm, but not to significance (Evans et al., 2014; Hanson et al.,
2016; Truong et al., 2017; Beltz et al., 2018). To date, three studies have investigated the
role of Q砦 and SV during the SPXT (Astorino et al., 2015; Jenkins et al., 2017a; Beltz et al.,
2018). Q砦 was estimated using a non-invasive thoracic impedance device (PhysioFlow,
Manatec Biomedical, France). In two of these studies (Astorino et al., 2015; Jenkins et al.,
2017a) Q砦 was significantly higher in the SPXT compared to the GXT, although no
differences were observed by Beltz et al (2018). Jenkins et al (2017a) only reported
differences in V砦 O2max in the group containing 18-30 year old participants and not in a
group of 50-75 year old participants. Astorino et al (2015) suggested the higher V砦 O2max
seen in their study may have been due to a greater O2 delivery, as both HRmax and Q砦 were
higher in the SPXT but SV showed no difference between protocols. They concluded that
the self-paced nature of the test may have played an important role in this as the average
work-rate in the first three stages of the SPXT (RPE 11, 13 and 15) was lower compared to
the equivalent stages of the GXT (176 ± 46 W vs. 190 ± 48 W, respectively). They
highlighted that the higher V砦 O2max and Q砦 seen in the younger population but not in the
older population makes it easy [and perhaps attractive] to assume that the greater Q砦 may be
the main factor in the higher V砦 O2max. They acknowledge, however, that the V砦 O2max and
peak Q砦 may not have occurred at the same time, which also applies to their finding of a
higher SV during the SPXT, which is certainly a limitation. In addition to Q砦 and SV,
Jenkins et al (2017a) also measured the electromyography and muscle deoxyhaemoglobin
of the vastus lateralis. They reported that oxygen extraction was not the likely cause of the
higher V砦 O2max in their study due to the lack of differences in deoxyHB and muscle
recruitment of the vastus lateralis between protocols. Whilst research [although it is
38
minimal] has shown thoracic impedance to be valid in estimating Q砦 (Charloux et al., 2000;
Tordi & Mourot, 2004; Welsman et al., 2005) it should be noted that there is a lack of
standardisation in the testing (Suehiro et al., 2016). There is also a lack of research using
such methods with healthy adults, as opposed to paediatric or clinical populations. With
this in mind, it is necessary for invasive methods to determine Q砦 to be adopted as to
understand the role Q砦 may play in the purported V砦 O2max differences between the SPXT and
GXT.
Significantly higher maximal V砦 E (V砦 Emax) have been recorded in the SPXT compared to the
GXT (Astorino et al., 2015; Faulkner et al., 2015; Jenkins et al., 2017a). Norton et al
(1995) previously demonstrated that supramaximal intensities (115 % V砦 O2max) could
increase ventilation beyond that achieved during V砦 O2max. The authors suggested the
exercise stimulus could be an important factor in increasing V砦 E, with Faulkner et al (2015)
postulating that the higher peak speeds reported in their own study could have driven up
V砦 E as a result of elevated metabolic acidosis. Several authors have noted that an increased
V砦 E may then require additional O2 being needed for the respiratory musculature (Anholm
et al., 1987; Aaron et al., 1992; Wilhite et al., 2013). Faulkner et al (2015) calculated the
O2 cost of ventilation between the two protocols and found no differences. Whilst both
Astorino et al (2015) and Jenkins et al (2017a) found differences in both V砦 O2max and V砦 E,
they did not measure the O2 cost of ventilation and so, due to the conflicting findings of
these studies, the role of ventilation warrants further investigation.
39
2.6. Prescribing training via the GXT
2.6.1. Background
To improve V砦 O2max, training at or near V砦 O2max is most likely required in a highly trained
population, whilst moderately or recreationally individuals may even benefit from training
at 65-80 % V砦 O2max (Smith et al., 1999; Smith et al., 2003; Denadai et al., 2006; Midgley et
al., 2006a; Esfarjani & Laursen, 2007; Gormley et al., 2008; Manoel et al., 2017). Highly
trained and recreationally trained runners will likely include both continuous runs and HIIT
in their regime. Whilst continuous training, characterised by longer slower runs, has been
shown to be effective (Overend et al., 1992; Burgomaster et al., 2008; McNicol et al.,
2009), it is likely to be less beneficial for more highly trained athletes (Laursen & Jenkins,
2002) because the intensity required to elicit an improvement in V砦 O2max is largely
dependent on the initial V砦 O2max of the individual, and so runners with high initial V砦 O2max
will need to train at higher intensities (Swain & Franklin, 2002). For these individuals,
training at or near V砦 O2max may be required to place maximal stress on the physiological
processes and structures that limit V砦 O2max (Midgley et al., 2006a). When directly
comparing continuous training protocols to prescribed HIIT, a vast majority of recent
research have reported significantly greater improvements obtained via HIIT for
physiological variables and performance (Esfarjani & Laursen, 2007; Helgerud et al.,
2007; O’Brien et al., 2008; Ní Chéilleachair et al., 2017). Due to the popularity and
effectiveness of using vV砦 O2max and Vmax in prescribing training intensities (see table 2.2),
and the fact that these parameters can be easily obtained during the GXT, they are ideal for
HIIT which is effective in improving cardiorespiratory fitness and performance in both
highly and recreationally trained athletes. HIIT is typically characterised by repeated bouts
of short to moderate duration exercise (≤ 5 min) at an intensity greater than VT2 and
40
usually close to 100 % V砦 O2max, with a recovery period that is usually either passive or at a
low intensity (Laursen & Jenkins, 2002; García-Pinillos et al., 2017). HIIT sessions are
made up of the following components: the ‘work’ component (high intensity part), and the
‘recovery’ component (low intensity part). For each of these components, the intensity and
duration must be considered (Seiler & Sjursen, 2002).

41
Table 2.2 Summary of studies that have used running-based training protocols and HIIT as a key component. The studies are organised in
descending order of publication date.
Study Subjects Study
Duration
(wk)
Starting
V砦 O2max
(mL .kg1.min-1)
Interval
sessions/wk
Reps/
session
Intensity Work
duration
Rest
duration
Mean %
improvement
V砦 O2max
Silva et al.
(2017)
Eight male
recreational runners
4 55 ± 8 2 5 vV砦 O2max 50 % Tmax 1:1 5
Støren et
al. (2017)
Twenty-six
recreationally active
participants
8 51 ± 8 3 4 90-95 %
HRmax
4 min 3 min 11*
Manoel et
al. (2017)
Eight moderately
trained runners
4 50 ± 4 2 or 3 # Vmax 60 % Tmax 1:1 0
Manoel et
al. (2017)
Six moderately
trained runners
4 49 ± 7
2 or 3 # vV砦 O2max 60 % Tmax 1:1 0
Esfarjani
and
Laursen
(2007)
Six moderately
trained runners
10 51 ± 2 2 8 vV砦 O2max 60 % Tmax
1:1 9 *
Esfarjani Six moderately 10 52 ± 3 2 12 130 % 30 s 4.5 min 6 *
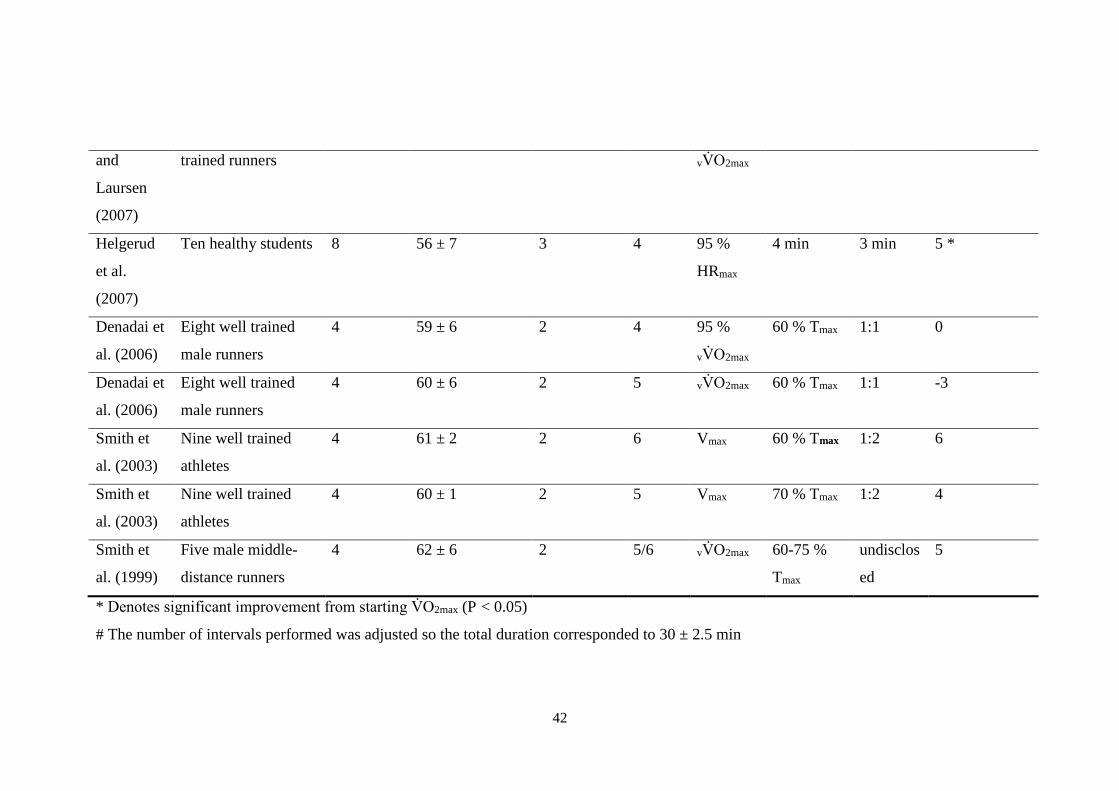
42
and
Laursen
(2007)
trained runners vV砦 O2max
Helgerud
et al.
(2007)
Ten healthy students 8 56 ± 7 3 4 95 %
HRmax
4 min 3 min 5 *
Denadai et
al. (2006)
Eight well trained
male runners
4 59 ± 6 2 4 95 %
vV砦 O2max
60 % Tmax
1:1 0
Denadai et
al. (2006)
Eight well trained
male runners
4 60 ± 6 2 5 vV砦 O2max 60 % Tmax 1:1 -3
Smith et
al. (2003)
Nine well trained
athletes
4 61 ± 2
2 6 Vmax 60 % Tmax 1:2 6
Smith et
al. (2003)
Nine well trained
athletes
4 60 ± 1
2 5 Vmax 70 % Tmax
1:2 4
Smith et
al. (1999)
Five male middle-
distance runners
4 62 ± 6 2 5/6 vV砦 O2max 60-75 %
Tmax
undisclos
ed
5
* Denotes significant improvement from starting V砦 O2max (P < 0.05)
# The number of intervals performed was adjusted so the total duration corresponded to 30 ± 2.5 min
43
2.6.2. Exercise intensity
Billat et al (1999) reported that 100 % vV砦 O2max was the most effective intensity to
maximise time spent at V砦 O2max compared to time-to-exhaustion runs at 90, 120 and 140 %
(190, 16, 73, and 18 s, respectively). The time [that V砦 O2max could be maintained] was very
low during the 90 % due to five out of six participants not reaching V砦 O2max during the run,
suggesting 90 % would not be an ideal intensity. For this reason, prescribing training at
vV砦 O2max, or similar intensities is preferred. Regarding frequency of training, 2-3 HIIT
sessions a week at or above vV砦 O2max would benefit recreational runners’ athletic
performance (García-Pinillos et al., 2017), although 1-2 interval sessions per week with at
least 48 h recovery may be preferable to avoid sustaining injury from overuse (Midgley et
al., 2006a).
2.6.3. Durations of work and rest intervals
Whilst the intensity of training is paramount, so is the duration, as durations that are too
long may result in the individual not being able to complete the prescribed training, and
durations which are too short may not allow time to elicit an appropriate physiological
response, resulting in no physiological adaptation occurring. As such, it is important to
consider that attaining and maintaining V砦 O2max are not mutually exclusive. Based on V砦 O2
kinetics, V砦 O2max may be attained within 80 – 140 s but a steady state (≥ 95 V砦 O2max) may
not be achieved until up to approximately 4 min of exercise (Buchheit & Laursen, 2013).
This distinction may be more critical for highly trained and elite athletes who may be
reaching their trainable limit for V砦 O2max, and as such, must train at intensities that attain
and maintain V砦 O2max to elicit further improvement (Midgley et al., 2007). The current
consensus for the intensity of the work-interval, based on a meta-analysis of 37 unique
research studies and 334 participants, is 3-5 min [per work interval] (Bacon et al., 2013). In
44
line with the expected time it would take to attain V砦 O2max, 1 min intervals have been found
to be insufficient, eliciting a 85 % V砦 O2peak compared to 92-93 % in intervals lasting 2 – 6
min when exercising at the same intensity (Seiler & Sjursen, 2002; O’Brien et al., 2008).
A more widely utilised method in prescribing interval duration is Tmax, which offers an
individualised approach, in comparison to fixed duration trials. Typically, intervals are set
at 60 % Tmax which would result in interval durations of 2-5 min (Smith et al., 2003;
Denadai et al., 2006; Esfarjani & Laursen, 2007). Smith et al (2003) found that when
prescribing training via 60 and 70 % Tmax [at Vmax] (two different groups), V砦 O2max
improved by 6 and 3 % [respectively] and Vmax improved by 5 and 2 %, however, for both
groups these were insignificant improvements compared to pre-training. From a
performance perspective, the group training at 60 % Tmax significantly improved their 3000
m run performance by 3 %, which equated to 18 ± 4 s, whilst the 70 % Tmax group
improved by 6 ± 4 s, which was not significant. Whilst both groups trained at the same
intensity, it’s possible that the longer durations of the 70 % group meant that there was a
greater anaerobic contribution towards the end of each rep. This is supported by the greater
improvement in VT in the 60 % group (7 vs. 2 %, respectively) and the higher post-interval
lactates of the 70 % group. Crucially, in the 60 % group, 96 % of the prescribed training
was successfully completed whereas this was 86 % in the 70 % group, suggesting that 70
% Tmax may be too long for interval training. Esfarjani and Laursen (2007) found that
V砦 O2max improved by 9 % when training at 60% Tmax however this was a 10 week
programme, compared to the 4 weeks of Smith et al (2003). Other studies (Denadai et al.,
2006; Manoel et al., 2017) have not found significant differences in V砦 O2max but this may be
due to the relative short training duration of those studies (4 wk) which may not allow
enough time for adaptations in trained athletes.
45
Most training studies that have utilised 60 % Tmax typically used either 1:1 or 1:2
work:recovery ratio (Smith et al., 2003; Denadai et al., 2006; Esfarjani & Laursen, 2007;
Manoel et al., 2017; Silva et al., 2017). Seiler and Hetlelid (2005) found that when trained
runners could self-select the work rate for their interval work and recovery segments, 2
min recovery periods produced the highest work rate in relation to V砦 O2max. This was in
comparison to recovery durations of 1, 4, and 6 min. However, in less trained individuals,
1:1 ratio, or 2 min [which would likely be similar, or even less compared to their Tmax work
duration] may be too short to allow adequate recovery, suggesting longer recoveries such
as those utilised by Smith et al (2003) may be ideal to increase the probability of
participants successfully completing interval sessions at the required intensity.
2.7. Summary
The GXT is considered a gold standard protocol for V砦 O2max, which is arguably the most
widely tested parameter in the sport sciences. Despite its widespread use, the GXT is still
criticised for not representing the real life challenges athletes encounter during sport and
exercise (Noakes, 2008). The SPXT was introduced not to be better than the GXT, but to
offer an alternative that perhaps answered some of the criticisms that the GXT could not
address. The greater control over work-rate that the SPXT gives the participant, along with
greater knowledge of the protocol duration, and the ability to provide an ‘end-spurt’ which
is natural to endurance athletes (Tucker et al., 2006), arguably makes the SPXT more
attractive to athletes and coaches. The SPXT has, to date, been investigated in both healthy
and clinical populations in running and cycling. These have yielded mixed findings
regarding the assessment of V砦 O2max via the SPXT, with the majority of studies finding the
46
SPXT to be comparable to the GXT (Straub et al., 2014; Faulkner et al., 2015; Hanson et
al., 2016; Beltz et al., 2018), whilst some have reported higher (Mauger & Sculthorpe,
2012; Mauger et al., 2013a; Astorino et al., 2015; Jenkins et al., 2017a; Jenkins et al.,
2017) and even lower (Scheadler & Devor, 2015) V砦 O2max in the SPXT. There has also
been various modified versions of the SPXT (Chidnok et al., 2013; Evans et al., 2014;
Truong et al., 2017) which have to date all produced similar V砦 O2max to the GXT. For these
reasons, a noted criticism of the SPXT has been the various methodologies and protocols
used (Hutchinson et al., 2017), rendering comparisons between studies problematic.
Regardless of this, the general consensus is that the SPXT produces similar or higher
V砦 O2max compared to the GXT. However, there are gaps in the research, because whilst the
ability of the SPXT to assess V砦 O2max is fairly well investigated, limited research has been
conducted on highly trained runners, which is of importance as all studies to date that have
reported higher V砦 O2max in the SPXT have generally been carried out using lesser trained or
clinical populations. In line with this, beyond V砦 O2max, data regarding the actual usability of
the SPXT for athletes and coaches is largely non-existent, whereas the GXT is well-
established in this area and offers VT measurement and the attainment of useful
performance parameters such as vV砦 O2max and Vmax which can be utilised for training
prescription. Whilst the potential of the SPXT is well recognised, with it considered a
‘paradigm shift’ in exercise testing (Beltz et al., 2018) that has greater ecological validity
than the GXT (Poole & Jones, 2017), large gaps in the research still exist, especially in
regards to its application in trained runners.
47
2.8. Thesis aims and hypotheses
The overall aim of this thesis was to assess the suitability of the SPXT to calculate key
aerobic parameters such as V砦 O2max, to successfully prescribe training, and to be utilized as
a field protocol, allowing for greater accessibility to athletes and coaches compared to
previously established GXT protocols. Therefore, the following Chapters present a series
of studies which contribute to the overall aim of the thesis. The aims and hypotheses of
each experimental Chapter are as follows:
1. The majority of research surrounding the SPXT has focused on a cycling modality and
used untrained participants, and so the first experimental Chapter aimed to assess the
efficacy of the SPXT in assessing V砦 O2max in highly trained runners during motorised
treadmill exercise.
Aim: To assess the validity of two different SPXT protocols in assessing V砦 O2max
compared to a GXT in treadmill running (see Chapter 4)
H10: The speed-based SPXT will not be significantly different to the GXT in
measuring V砦 O2max.
H11: The speed-based SPXT will be significantly different to the GXT in
measuring V砦 O2max.
H20: The gradient-based SPXT will not be significantly different to the GXT in
measuring V砦 O2max.
H21: The gradient-based SPXT will be significantly different to the GXT in
measuring V砦 O2max.
2. Prior research predominately focused on the validity of the SPXT as a V砦 O2max protocol

48
in different populations and modalities, however recent research has reported significant
differences in V砦 Emax in the SPXT which may explain potential V砦 O2max differences between
protocols due to differences in the oxygen cost of breathing.
Aim: To assess the oxygen cost of breathing in the SPXT and GXT (see Chapter 5).
H30: The oxygen cost of breathing will not be significantly different between
protocols.
H31: The oxygen cost of breathing will be significantly different between protocols.
3. The utility of the SPXT is currently limited to assessment of V砦 O2max, yet there is
significant potential to apply the protocol to a variety of other uses. The application of the
SPXT in training prescription for athletes and coaches is yet to be investigated and this
would provide a valuable additional use of the SPXT.
Aim: To determine if the SPXT can successfully prescribe training and result in
similar improvements in cardiorespiratory fitness compared to training prescribed
via the GXT in recreationally trained runners (see Chapter 6).
H40: The SPXT will not produce similar training improvements compared to
training prescribed via the GXT
H41: The SPXT will produce similar training improvements compared to training
prescribed via the GXT
4. Research on the SPXT has not focused on the ability of the SPXT to validate other
parameters of cardiorespiratory fitness such as VT1 and VT2.
Aim: To determine if the SPXT can be used to accurately identify VT (see Chapter
7).
H50: The SPXT will not be able to accurately identify VT.

49
H51: The SPXT will be able to accurately identify VT.

50
Chapter 3. General Methods
51
3.1. Experimental Procedures
3.1.1. Equipment and calibration methods
All participants had their body mass and stature measured (Seca Beam scale and
stadiometer, Birmingham, UK). Throughout the duration of the maximal exercise tests
expired gases were measured with the use of an online breath-by-breath analysis system
(Cortex Metalyzer 3BR2, Cortex, NL). Before every test the gas analyser was calibrated in
accordance with the manufacturers guidelines, using a calibration gas and 3-litre syringe. A
two-point gas calibration was completed using a measurement of ambient air and a
measurement of standard compressed gas of 17 % O2 and 5 % CO2. The 3-litre syringe
(Hans Rudolph Inc. Kansas, USA) was used to calibrate the flow sensor and turbine. Heart
rate was measured using a Polar heart rate chest strap T31 (Polar Electro Inc, New York,
USA). When capillary lactate sampling was required (Chapter 6), the blood lactate
analyser (Biosen C-line, EKF diagnostic, Barleben, Germany) was calibrated using the
manufacturers recommended 12 mmol.L-1 standard (EKF diagnostic, Barleben, Germany).
This calibration process was then repeated automatically every 60 minutes.
3.1.2. Exercise tests (all studies)
Before each test, participants were instructed to maintain similar eating habits, abstain
from alcohol (24 h) and caffeine (8 h), and to avoid exhaustive or vigorous exercise (48 h).
These measures were verbally verified by the experimenter prior to testing.
52
3.1.3. Self-paced exercise test (Chapters 4, 5, & 6)
The test designed was replicated from Mauger and Sculthorpe (2012). The test was
completed on a motorised H/P/Cosmos Saturn treadmill (H/P/Cosmos, Nussdorf-
Traunstein, Germany). The test consisted of 5 x 2 min stages, resulting in a 10 min closed
loop design. For each stage, the participants were asked to continuously vary their speed
based on Borg’s RPE 6-20 scale (Borg, 1982; Borg, 1990). Familiarisation of the RPE
scale and how to vary their speed according to a fixed RPE was provided via verbal
explanation prior to the warm-up with specific emphasis given to considering their RPE for
each given moment, as opposed to viewing each stage as a 2 min effort at a particular RPE.
This was to encourage free-flowing pace and avoid participants simply staying at the same
speed for 2 minute blocks. Stage 1 (0-2 min) of the SPXT was fixed at an RPE of 11, stage
2 (2-4 min) fixed to an RPE of 13, stage 3 (4-6 min) fixed at an RPE of 15, stage 4 (6-8
min) fixed to an RPE of 17 and stage 5 (8-10 min) fixed to an RPE of 20. The RPE scale
remained visible throughout the test and participants were consistently reminded to vary
their intensity to suit the particular RPE for each given stage. Consequently, on the final
stage (8-10 min), where RPE 20 ‘maximal effort’ was required, participants were
instructed to perform a maximal effort with no regard to pacing themselves for 2 min or
saving energy for a final effort at the end of the stage. Verbal encouragement was given
throughout the test. Treadmill gradient was set to 3 % in Chapters 4 and 5, and 1 % in
Chapters 6.
To allow for continuous pacing throughout the protocol, and so participants did not have to
manually adjust their speed, three ‘zones’ were marked out on the treadmill. The treadmill
belt measured 2.5 m in length. The front section (0.9 m) of the treadmill represented an
53
increase in intensity, the middle section (0.7 m) represented no change in intensity and the
back section (0.9 m) of the treadmill represented a reduction in intensity. By running in
either the front or back zones, the experimenter adjusted the treadmill speed/gradient to
ensure that the participant returned to the middle ‘zone’. Changes in speed were recorded
using a CMOS video camera (Samsung, Seoul, South Korea). Each recording was then
replayed and changes were subsequently averaged over 30 s. Participants were informed
about the self-pacing zones before the warm-up and then practiced utilising the zones after
completing their individualised warm-up. The test did not start until the participants stated
that they understood the zonal system.
3.1.4. GXT (Chapters 4, 5, & 6)
The test was completed on a motorised H/P/Cosmos Saturn treadmill (H/P/Cosmos,
nussdorf-Traunstein, Germany). The GXT was the same as described by Mauger et al
(2013a). The GXT commenced at a submaximal speed, gauged by the experimenter and
subject, to help bring about volitional exhaustion within 8-12 min. Speed was increased by
1 km.h-1 every 2 min and the test was terminated when participants reached volitional
exhaustion. Treadmill gradient was set to either 1 % (Chapter 6) or 3 % (Chapters 4 and 5).
All previously described cardiorespiratory measures were recorded during this stage and
participants continued until volitional exhaustion. 6-20 RPE was recorded 20 s before the
end of each stage. Verbal encouragement was given throughout. Vmax was defined as the
highest speed that could been maintained for ≥ 30 s (Smith et al., 2003).
54
3.1.5. Verification Stage (Chapters 4, 5, & 6)
After completion of the GXT, participants received 20 min recovery (Nolan et al., 2014).
In Chapter 4, this was 10 min recovery (Mauger et al., 2013a). This recovery consisted of
walking around the laboratory and stretching. Participants would warm-up for 2 min at the
same speed they initially completed for the warm-up before the GXT and the speed was
gradually increased over 30 s up to a speed equivalent to one stage higher than the final
stage achieved in the GXT. All previously described cardiorespiratory measures were
recorded during this stage and participants continued until volitional exhaustion. Verbal
encouragement was given throughout. In Chapters 4 and 5, when participants failed to
meet the plateau criteria for V砦 O2max, the verification stage was used to verify whether a
true V砦 O2max was achieved and a maximal effort given, using two criteria: 1) V砦 O2max
verification; 2) HRmax verification. V砦 O2max verification was achieved when the V砦 O2max
from the verification stage was ≤ 2 % higher than the GXT. HRmax verification was
achieved with a difference of ≤ 4 bpm between that achieved in the GXT and verification
stage. In the absence of a V砦 O2 plateau during the GXT, if the V砦 O2max verification was
satisfied then this was accepted as evidence that a true V砦 O2max had been achieved. When
the HRmax verification was satisfied, this was accepted as evidence that the participant
provided a maximal effort and that V砦 O2max was probably elicited (Midgley et al., 2009).
3.1.6. Physiological measures
For each participant V砦 O2max (mL.kg-1.min-1) was determined by the highest 30 s average
during the entirety of the test. V砦 O2max was then verified by a plateau. A plateau in V砦 O2
during the GXT was accepted if the change in V砦 O2 during the highest 30 s average from
each of the final two stages of the test were less than half of the normal stage-to-stage
55
difference in V砦 O2 during the initial linear parts of the test for each subject. As an ancillary
method to verify attainment of V砦 O2max, secondary criteria were accepted when two of the
following were attained: HR within 10 bpm of age-predicted maximum; RER ≥ 1.15 and
RPE ≥ 17. V砦 Emax and maximal RER (RERmax) were all calculated as the highest 30 s
average during the entirety of the test.
56
Chapter 4. Validity of the SPXT to assess V砦 O2max in
highly trained runners
Aspects of the following chapter have been included within the following manuscript:
Hogg, J. S., Hopker, J. G., Mauger, A. R. (2015). The Self-paced VO2max test to assess
maximal oxygen uptake in highly trained runners. International Journal of Sport
Performance and Physiology, 10(2): 172-177.
Available at: https://kar.kent.ac.uk/61030/
57
4.1. Abstract
The SPXT may be a more suitable alternative to traditional maximal tests for highly
trained athletes due to the ability to self-regulate pace. This study aimed to examine
whether the SPXT can be administered on a motorised treadmill. Fourteen highly trained
male distance runners performed a standard GXT, a gradient-based SPXT (SPXTinc) and a
speed-based SPXT (SPXTsp). Results demonstrated there was no significant difference (P
= 0.32, ES = 0.21) in the V砦 O2max achieved in the SPXTsp (67.6 ± 3.6 mL·kg-1·min-1,
95%CI = 65.6 – 69.7 mL·kg-1·min-1) compared to that achieved in the GXT (68.6 ± 6.0
mL·kg-1·min-1, CI = 65.1 – 72.1 mL·kg-1·min-1). Participants achieved a significantly
higher V砦 O2max in the SPXTinc (71 ± 4.3 mL·kg-1·min-1, 95%CI = 68.1 – 73.0 mL·kg-1·min-
1) compared to both the GXT (P = .03, ES = .39) and SPXTsp (P < .01, ES = .76). The
current study demonstrated that the speed based SPXT protocol produces similar V砦 O2max
values to those obtained in the GXT and may represent a more appropriate and athlete-
friendly test which is more orientated towards the variable speed found in competitive
sport.
58
4.2. Introduction
To date, the SPXT has been shown to be comparable to the GXT in producing V砦 O2max
(Straub et al., 2014; Faulkner et al., 2015; Scheadler & Devor, 2015; Hanson et al., 2016;
Lim et al., 2016; Beltz et al., 2018) although several studies have also reported higher
V砦 O2max values within the SPXT (Mauger & Sculthorpe, 2012; Mauger et al., 2013a;
Astorino et al., 2015; Jenkins et al., 2017; Jenkins et al., 2017a). The majority of these
studies have been completed using cycling ergometers. Of the treadmill based studies,
most used either a non-motorised or semi-automated treadmill, and participants who were
defined as either recreationally active or untrained. Therefore, the purpose of the current
study was to investigate whether the SPXT could be successfully administered on a
motorised treadmill in highly trained runners.
4.3. Method
4.3.1. Participants
Fourteen well-trained, male, middle-long distance runners (mean + SD: age = 28 ± 5 years,
mass = 71 ± 7 kg, height = 175 ± 5cm), familiarised with treadmill running and V砦 O2max
testing, volunteered to participate in this study. The study was conducted with the approval
of the Ethics Committee of the School of Sport & Exercise Sciences at the University of
Kent. All participants who volunteered read and provided written informed consent before
participation.
59
4.3.2. Exercise Tests
All participants performed a standard GXT, self-paced gradient-based exercise test
(SPXTinc) and self-paced speed-based exercise test (SPXTsp) in a randomised order, 2-7
days apart and at the same time of day (±2 h). At the onset of each testing session
participants performed a self-paced warm-up on a motorised treadmill (Saturn,
H/P/Cosmos, Nussdorf-Traunstein, Germany), which remained the same for all subsequent
tests. Following the completion of the warm-up, participants’ performed a GXT, SPXTinc
or SPXTsp in which oxygen consumption (Cortex Metalyzer 3BR2; Cortex, Lepzig,
Germany) and heart rate (Polar heart rate chest strap T31, Polar Electro Inc, New York,
USA) were recorded for the duration of the test.
4.3.3. GXT
The GXT was completed as outlined in the general methods chapter (see Chapter 3).
4.3.4. SPXTinc Protocol
The SPXTinc utilised the same basic format of the SPXT as outlined in the general
methods (see Chapter 3). However, instead of just speed, gradient could also be
manipulated. The SPXTinc protocol commenced at a gradient of 3 % with speed varying
for the first stage and incline remaining at 3 %. At the end of the first stage, gradient then
became the variable instead of speed (which was fixed) for the middle 3 stages (3-8 min).
At the end of the penultimate stage, incline would then be fixed at what it was at the end of
the stage, with speed once again changing until the end of the stage and the test. The
experimenter would adjust the speed and incline accordingly based on the participants’
60
positioning on the treadmill throughout the test with speed/incline able to increase or
decrease depending on the individual’s positioning.
4.3.5. SPXTsp Protocol
The SPXTsp was completed as outlined in the general methods chapter (see Chapter 3).
4.3.6. V砦 O2max determination
V砦 O2 plateau and secondary criteria were calculated as outlined in the general methodology
(see Chapter 3).
4.3.7. Statistical Analysis
All data are presented as means ± SD. Data were checked for normality of distribution
using the Shapiro-Wilk statistic. Log transformation was used where the assumption of
normality was violated. A one-way ANOVA with repeated measures was used to examine
maximal value differences between protocols, with pairwise comparisons used to identify
where statistical differences lay. Partial eta2 (さp2) and cohen’s d were used to report effect
sizes and statistical significance was accepted when P < 0.05. A Bland and Altman 95%
LoA analysis (Bland & Altman, 1986) quantified the agreement (bias ± random error [1.96
x SD]) between the measured V砦 O2max from each test. In accordance with recommendations
for conducting LoA analysis, the data were checked for heteroscedastic error by
conducting correlation analysis on the measurement error and the mean of the GXT and
SPXT V砦 O2max scores. Oxygen cost of breathing for each protocol was calculated using ∆
V砦 O2/∆V砦 E, as performed by Vella et al (2006). All statistical tests were completed using
SPSS version 19.0 (Chicago, IL, USA).
61
4.4. Results
The mean stage-to-stage difference in V砦 O2 for all participants was calculated as 215 ± 51
mL.min-1, so that a mean plateau phenomenon was defined as a change in V砦 O2 ≤ 108 ± 25
mL.min-1 (or an average of 1.5 mL.kg−1.min−1, considering the average body mass of the
participants) between the two final stages of the protocol. A V砦 O2 plateau was observed in
57 % of participants in the GXT. Of the participants who did not achieve a plateau, all
achieved the V砦 O2 verification criteria. In total, 86 % of participants achieved the V砦 O2max
verification criteria and 93 % achieved the HRmax verification criteria.
There was a significant difference in V砦 O2max between the three protocols (Figure 4.1) (F2,26
= 5.66, P = .01, さp2 = .30), a pairwise comparison revealed no significant difference in the
V砦 O2max achieved between the SPXTsp (67.6 ± 3.6 mL·kg-1·min-1, 95%CI = 65.6 – 69.7
mL·kg-1·min-1) and the GXT (68.6 ± 6.0 mL.kg-1.min-1, 95%CI = 65.1 – 72.1 mL·kg-1·min-
1). However, participants achieved a significantly higher V砦 O2max in the SPXTinc (71 ± 4.3
mL·kg-1·min-1, 95%CI = 68.1 – 73.0 mL·kg-1·min-1) compared to the GXT (P = .03, ES =
.47) and SPXTsp (P < .01, ES = .76).
Figure 4.2 shows a representative subject’s V砦 O2max and speed/power for all three protocols.
No significant differences (t13 = 1.22, P = .25) were observed between V砦 O2max achieved in
the GXT and the subsequent verification bout (68.6 ± 6.0 mL·kg-1·min-1 vs. 67.9 ± 6.8
mL·kg-1·min-1 respectively). LoA (Figure 4.3) values between the GXT and the SPXTsp,
the GXT and the SPXTinc and the two SPXT protocols were 8 ± 4 mL·kg-1·min-1; 6 ± 3
mL·kg-1·min-1; and 5 ± 3 mL·kg-1·min-1, respectively. Nine participants achieved their
highest V砦 O2max in the SPXTinc, with three achieving it in the GXT and two in the SPXTsp.
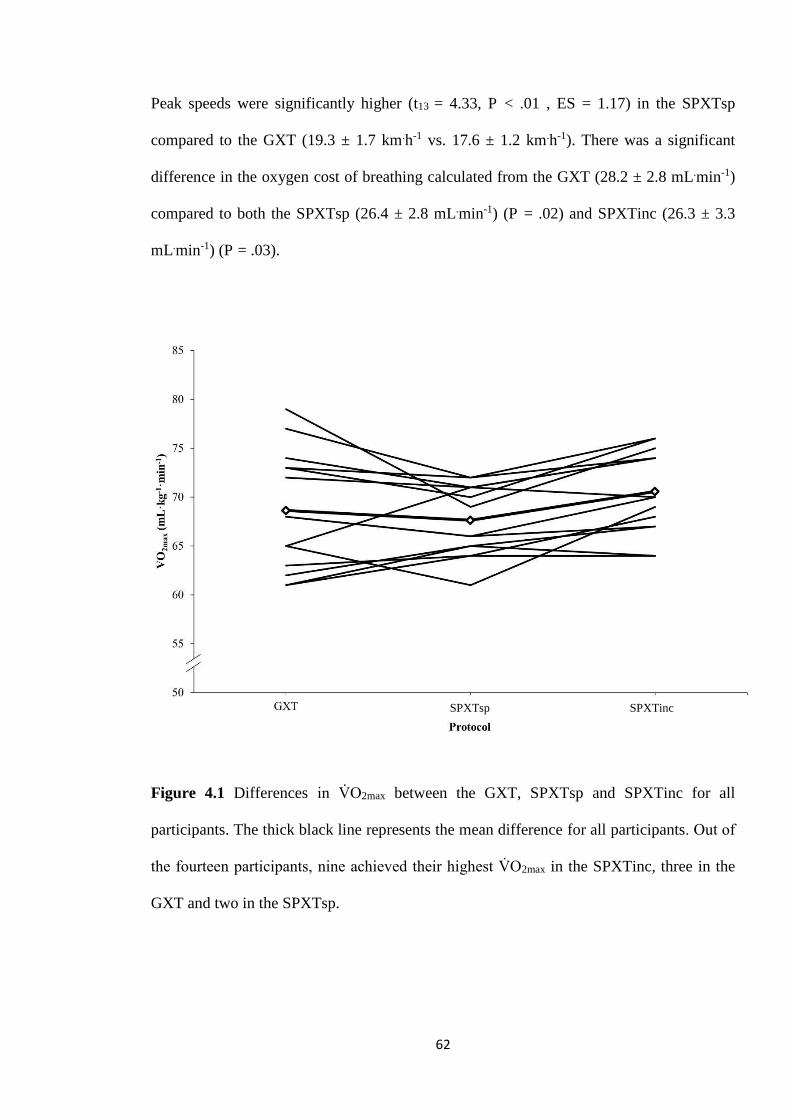
62
Peak speeds were significantly higher (t13 = 4.33, P < .01 , ES = 1.17) in the SPXTsp
compared to the GXT (19.3 ± 1.7 km.h-1 vs. 17.6 ± 1.2 km.h-1). There was a significant
difference in the oxygen cost of breathing calculated from the GXT (28.2 ± 2.8 mL.min-1)
compared to both the SPXTsp (26.4 ± 2.8 mL.min-1) (P = .02) and SPXTinc (26.3 ± 3.3
mL.min-1) (P = .03).
Figure 4.1 Differences in V砦 O2max between the GXT, SPXTsp and SPXTinc for all
participants. The thick black line represents the mean difference for all participants. Out of
the fourteen participants, nine achieved their highest V砦 O2max in the SPXTinc, three in the
GXT and two in the SPXTsp.
SPXTsp
SPXTsp SPXTinc
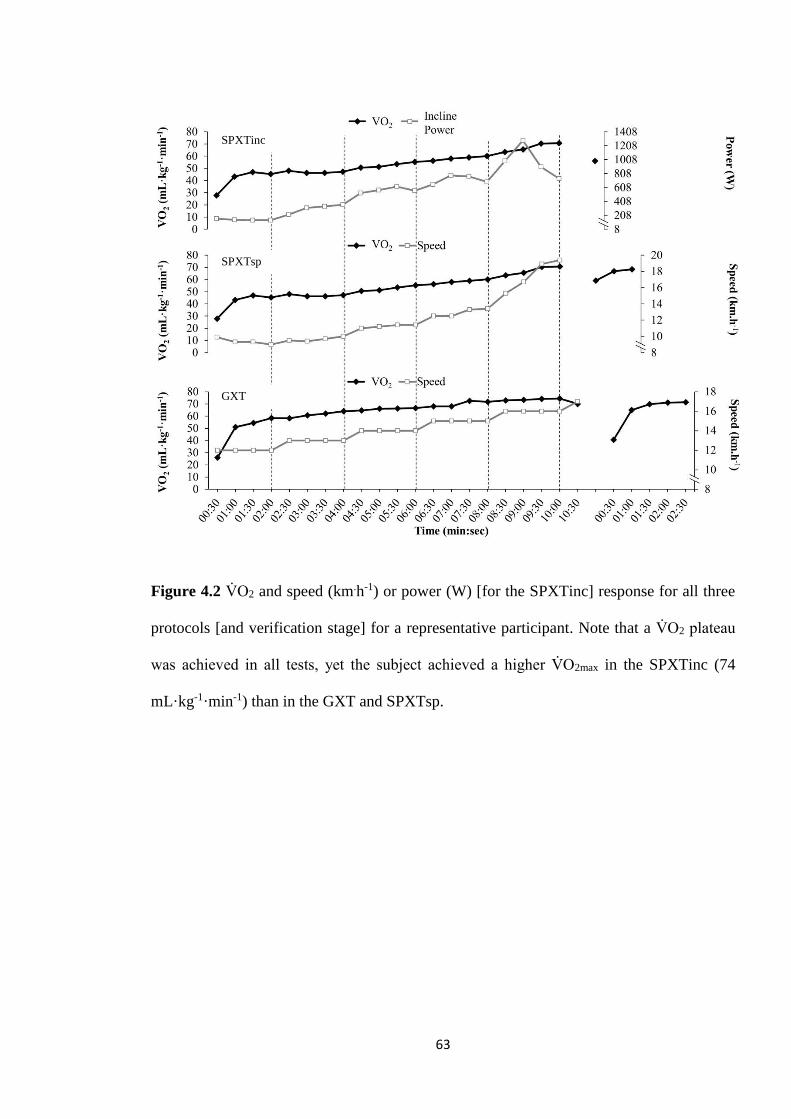
63
Figure 4.2 V砦 O2 and speed (km.h-1) or power (W) [for the SPXTinc] response for all three
protocols [and verification stage] for a representative participant. Note that a V砦 O2 plateau
was achieved in all tests, yet the subject achieved a higher V砦 O2max in the SPXTinc (74
mL·kg-1·min-1) than in the GXT and SPXTsp.
SPXTinc
GXT
SPXTsp
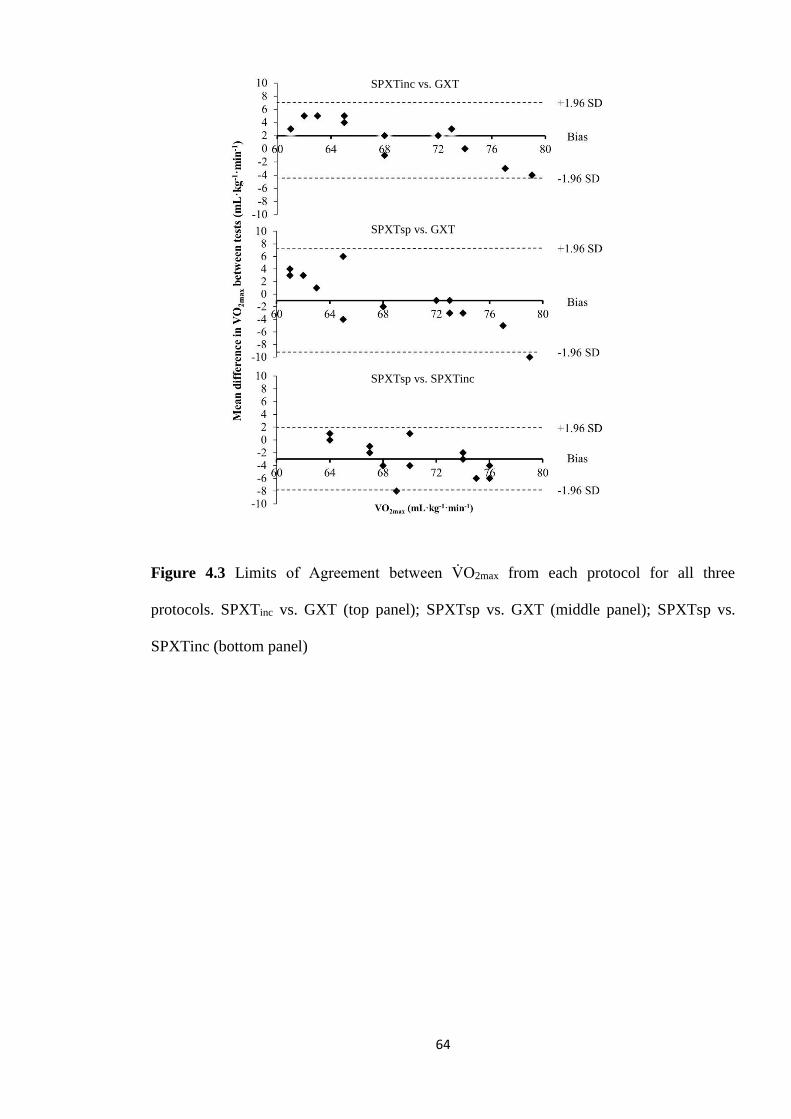
64
Figure 4.3 Limits of Agreement between V砦 O2max from each protocol for all three
protocols. SPXTinc vs. GXT (top panel); SPXTsp vs. GXT (middle panel); SPXTsp vs.
SPXTinc (bottom panel)
SPXTinc vs. GXT
SPXTsp vs. GXT
SPXTsp vs. SPXTinc
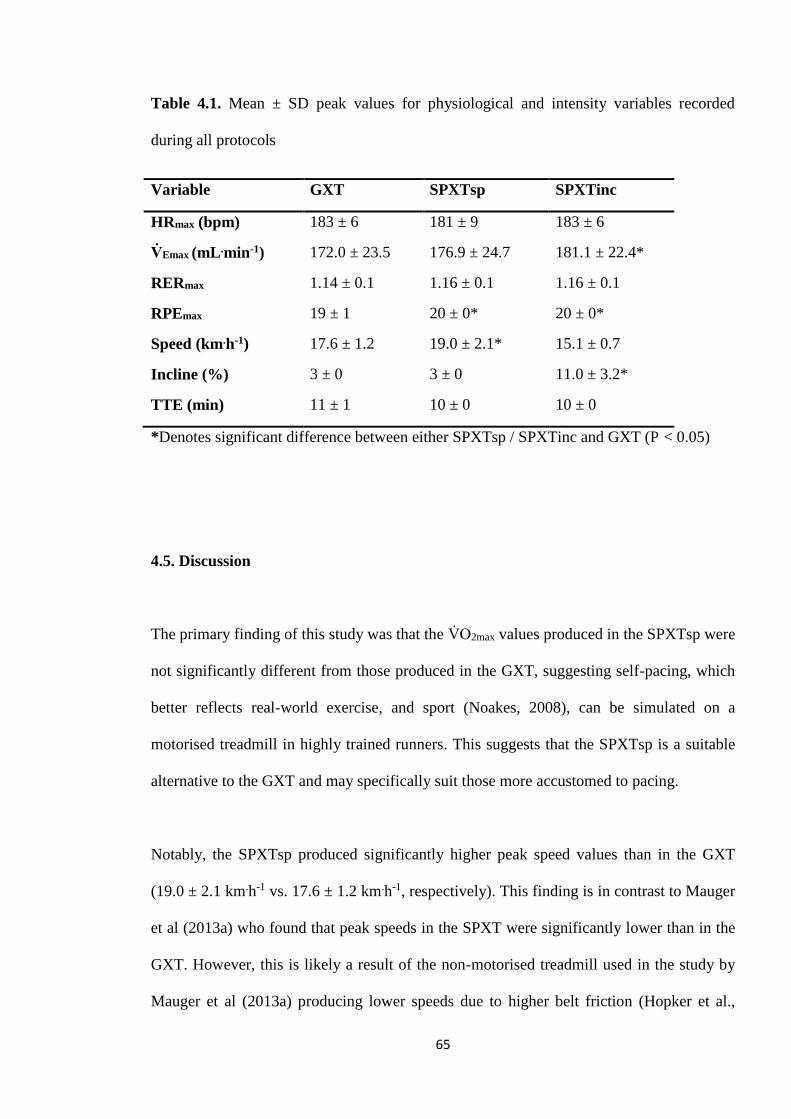
65
Table 4.1. Mean ± SD peak values for physiological and intensity variables recorded
during all protocols
Variable GXT SPXTsp SPXTinc
HRmax (bpm) 183 ± 6 181 ± 9 183 ± 6
V砦 Emax (mL .min-1) 172.0 ± 23.5 176.9 ± 24.7 181.1 ± 22.4*
RERmax 1.14 ± 0.1 1.16 ± 0.1 1.16 ± 0.1
RPEmax 19 ± 1 20 ± 0* 20 ± 0*
Speed (km.h-1) 17.6 ± 1.2 19.0 ± 2.1* 15.1 ± 0.7
Incline (%) 3 ± 0 3 ± 0 11.0 ± 3.2*
TTE (min) 11 ± 1 10 ± 0 10 10 ± 0
*Denotes significant difference between either SPXTsp / SPXTinc and GXT (P < 0.05)
4.5. Discussion
The primary finding of this study was that the V砦 O2max values produced in the SPXTsp were
not significantly different from those produced in the GXT, suggesting self-pacing, which
better reflects real-world exercise, and sport (Noakes, 2008), can be simulated on a
motorised treadmill in highly trained runners. This suggests that the SPXTsp is a suitable
alternative to the GXT and may specifically suit those more accustomed to pacing.
Notably, the SPXTsp produced significantly higher peak speed values than in the GXT
(19.0 ± 2.1 km.h-1 vs. 17.6 ± 1.2 km.h-1, respectively). This finding is in contrast to Mauger
et al (2013a) who found that peak speeds in the SPXT were significantly lower than in the
GXT. However, this is likely a result of the non-motorised treadmill used in the study by
Mauger et al (2013a) producing lower speeds due to higher belt friction (Hopker et al.,

66
2009). In the current study, the peak speeds observed in the SPXTsp may better reflect the
finishing speeds these runners achieve in athletic performance where pacing is key (Bailey
et al., 2011) and therefore makes this protocol more relevant for the competitive athlete.
Future research should investigate the velocities achieved during the SPXT and how these
may compare to well recognised parameters such as vV砦 O2max or Vmax during the GXT.
In the study by Mauger and Sculthorpe (2012), the higher V砦 O2max values achieved in the
SPXT were attributed to a significant increase in PO in the final stage, followed by a
significant drop by the end of the final stage. This observation was similar in the current
findings (see Figure 4.2) where participants tended to achieve a ‘spike’ in intensity [in the
SPXTinc] followed by a large drop during the second half of the final stage. However,
during the SPXTsp, participants tended to maintain high speeds until the end of the test,
perhaps suggesting they didn’t fully exert themselves at the start of the final stage. It is
possible that due to their trained status, it may be difficult to achieve the high speeds
required to reach maximal exertion on a motorized treadmill. In the SPXTinc, the majority
of the participants achieved their highest gradient early in the second-to-last stage (RPE
17) followed by a decline going into the final stage. This is supported by the finding from
the LoA data that, in participants with consistently higher V砦 O2max values [compared to
other participants], their highest recorded V砦 O2max tended to be achieved during the GXT.
Conversely, this was reversed for the participants with lower V砦 O2max values, who tended to
achieve their highest V砦 O2max in the SPXT protocols. It could be inferred that this may be
due to the more seasoned athletes not reaching intensities high enough during the SPXT
protocols to obtain a true V砦 O2max. Alternatively, those with lower V砦 O2max may be less
accustomed to GXT testing compared to the participants of a higher competitive standard,
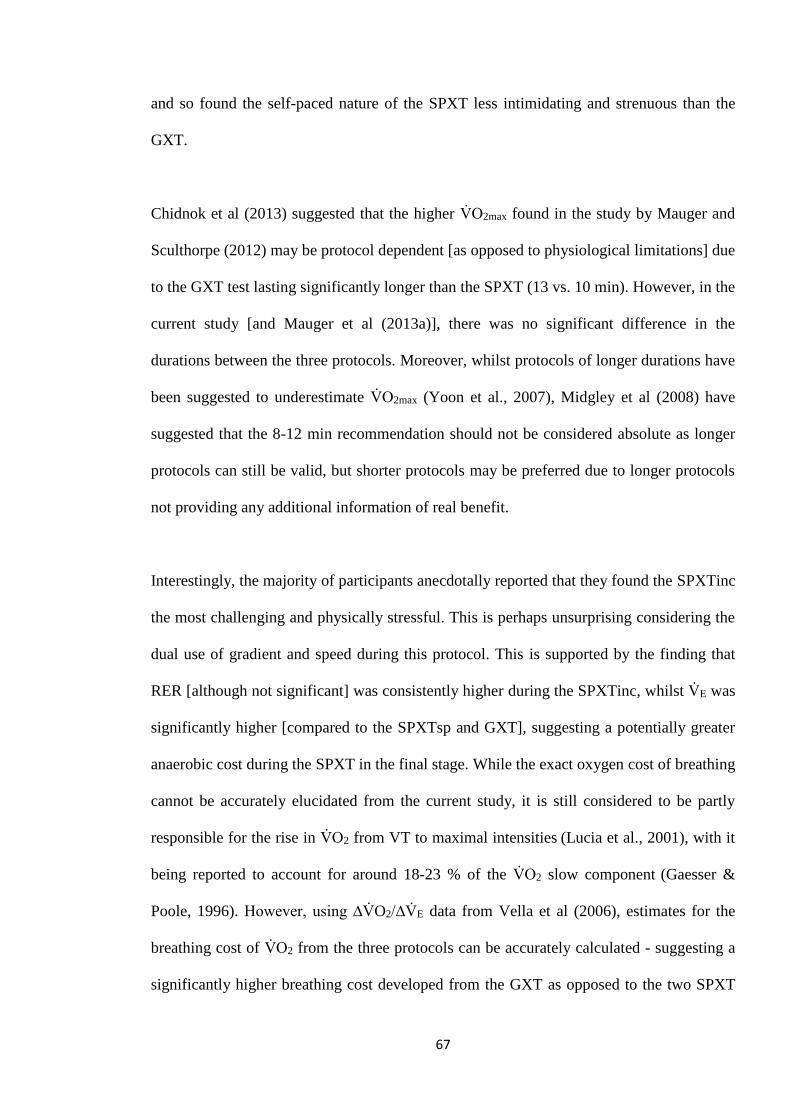
67
and so found the self-paced nature of the SPXT less intimidating and strenuous than the
GXT.
Chidnok et al (2013) suggested that the higher V砦 O2max found in the study by Mauger and
Sculthorpe (2012) may be protocol dependent [as opposed to physiological limitations] due
to the GXT test lasting significantly longer than the SPXT (13 vs. 10 min). However, in the
current study [and Mauger et al (2013a)], there was no significant difference in the
durations between the three protocols. Moreover, whilst protocols of longer durations have
been suggested to underestimate V砦 O2max (Yoon et al., 2007), Midgley et al (2008) have
suggested that the 8-12 min recommendation should not be considered absolute as longer
protocols can still be valid, but shorter protocols may be preferred due to longer protocols
not providing any additional information of real benefit.
Interestingly, the majority of participants anecdotally reported that they found the SPXTinc
the most challenging and physically stressful. This is perhaps unsurprising considering the
dual use of gradient and speed during this protocol. This is supported by the finding that
RER [although not significant] was consistently higher during the SPXTinc, whilst V砦 E was
significantly higher [compared to the SPXTsp and GXT], suggesting a potentially greater
anaerobic cost during the SPXT in the final stage. While the exact oxygen cost of breathing
cannot be accurately elucidated from the current study, it is still considered to be partly
responsible for the rise in V砦 O2 from VT to maximal intensities (Lucia et al., 2001), with it
being reported to account for around 18-23 % of the V砦 O2 slow component (Gaesser &
Poole, 1996). However, using ∆V砦 O2/∆V砦 E data from Vella et al (2006), estimates for the
breathing cost of V砦 O2 from the three protocols can be accurately calculated - suggesting a
significantly higher breathing cost developed from the GXT as opposed to the two SPXT
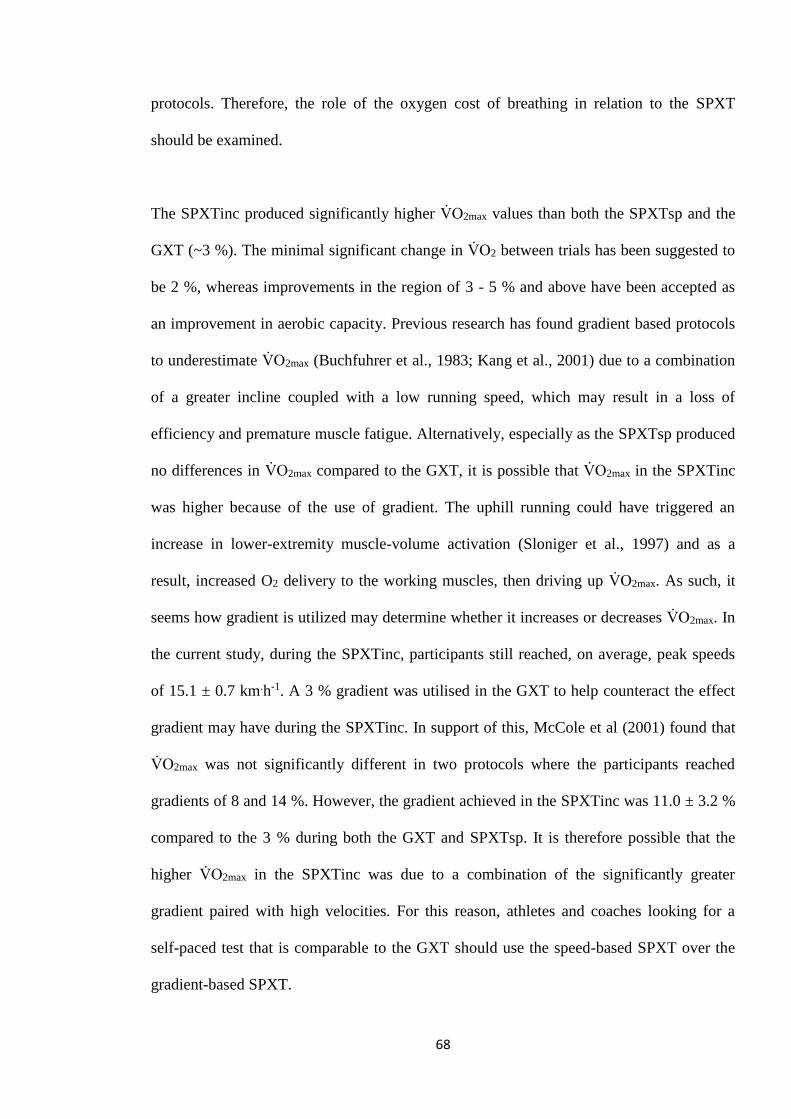
68
protocols. Therefore, the role of the oxygen cost of breathing in relation to the SPXT
should be examined.
The SPXTinc produced significantly higher V砦 O2max values than both the SPXTsp and the
GXT (~3 %). The minimal significant change in V砦 O2 between trials has been suggested to
be 2 %, whereas improvements in the region of 3 - 5 % and above have been accepted as
an improvement in aerobic capacity. Previous research has found gradient based protocols
to underestimate V砦 O2max (Buchfuhrer et al., 1983; Kang et al., 2001) due to a combination
of a greater incline coupled with a low running speed, which may result in a loss of
efficiency and premature muscle fatigue. Alternatively, especially as the SPXTsp produced
no differences in V砦 O2max compared to the GXT, it is possible that V砦 O2max in the SPXTinc
was higher because of the use of gradient. The uphill running could have triggered an
increase in lower-extremity muscle-volume activation (Sloniger et al., 1997) and as a
result, increased O2 delivery to the working muscles, then driving up V砦 O2max. As such, it
seems how gradient is utilized may determine whether it increases or decreases V砦 O2max. In
the current study, during the SPXTinc, participants still reached, on average, peak speeds
of 15.1 ± 0.7 km.h-1. A 3 % gradient was utilised in the GXT to help counteract the effect
gradient may have during the SPXTinc. In support of this, McCole et al (2001) found that
V砦 O2max was not significantly different in two protocols where the participants reached
gradients of 8 and 14 %. However, the gradient achieved in the SPXTinc was 11.0 ± 3.2 %
compared to the 3 % during both the GXT and SPXTsp. It is therefore possible that the
higher V砦 O2max in the SPXTinc was due to a combination of the significantly greater
gradient paired with high velocities. For this reason, athletes and coaches looking for a
self-paced test that is comparable to the GXT should use the speed-based SPXT over the
gradient-based SPXT.
69
The ability to self-pace on a motorised treadmill was a key challenge of this Chapter. As
previously discussed (see section 2.5), previous literature relied on participants using
buttons on the treadmill to adjust their speed throughout the SPXT (Faulkner et al., 2015;
Beltz et al., 2018) whilst other investigators have utilised sonar range finders to transform
motorised treadmills into semi-automated treadmills (Scheadler et al., 2015; Truong et al.,
2017). Due to sonar range finders not being commercially available, this was not
achievable in the current chapter. Also, due to sonar range-finders still being considered
novel and not wide-spread, how reactive they are to changes of pacing is questionable.
Notably, further information was not given by authors who have utilised sonar range
finders for self-pacing. A zonal system was selected over button pushing as the zonal
system would likely require less interruption to the participants running pattern than
manually pressing buttons on a panel. It is also speculated that a zonal system, which
simply requires the participants to move between zones to signal to the tester that they
want to change speed, may be more natural and fluid then buttons. It is accepted that this
still does not constitute genuine self-pacing, which was always going to be difficult to
achieve on motorized treadmill, however the comparable V砦 O2max between protocols (GXT
and speed-based SPXT) and the fact that participants were still able to achieve higher
speeds in the speed-based SPXT suggests the zonal system did not present a barrier to the
participants’ ability to self-pace.
70
4.6. Conclusion
This study demonstrates that a motorised self-paced speed-based running exercise test is a
viable alternative to a GXT whilst also producing similar V砦 O2max values. The peak speeds
achieved in the speed-based SPXT may better represent the finishing spurt achieved during
a competitive race. The current findings show that self-paced exercise, to an extent, can be
achieved on a motorised treadmill and may even be more effective than on a non-
motorised treadmill where running mechanics are too dissimilar to normal running (Hopker
et al., 2009). Future research should aim to investigate what measurements and parameters
beyond V砦 O2max can be extracted from the SPXT and how these can be utilized by athletes
and coaches both in the lab and in the field.
71
Chapter 5: The oxygen cost of breathing in the
SPXT
72
5.1. Abstract
The SPXT may have a lower oxygen cost of breathing (V砦 O2vent) compared to the GXT
which may explain differences between protocols found in some previous research. This
Chapter aimed to examine whether there are differences in the oxygen cost of breathing
between the SPXT and GXT. Ten trained male runners performed a GXT, a speed-based
SPXT, and two ventilation protocols based on either the GXT (G-VENT) or SPXT (S-
VENT). Results demonstrated that there were no significant differences in the oxygen cost
of breathing (t7 = -1.00; P = .34,) between the GXT and SPXT (26.9 ± 4.2 mL.min-1 vs.
26.1 ± 5.3 mL.min-1, respectively) and that V砦 O2max (Z = -.43, P = .67,) and V砦 Emax (P = .15)
were not significantly different between the protocols. The mean velocity at RPE20 was
also comparable to Vmax calculated via the GXT (t8 = .74, P = .48). The current study
demonstrates that any differences in V砦 O2max are unlikely to be related to ventilation and
that the finding of similar velocities between protocols suggests the SPXT may offer the
potential for training prescription.
73
5.2. Introduction
In Chapter 4, two different SPXT protocols conducted on highly trained runners and
completed on a motorised treadmill were validated against the GXT. The main finding was
that the [speed-based] SPXT was a valid protocol for V砦 O2max measurement. Whilst most
physiological variables were similar between protocols, V砦 Emax was significantly different
from the GXT, which may indicate a different oxygen cost of breathing (V砦 O2vent) between
the two protocols. The purpose of this chapter was therefore to investigate this potential
mechanistic difference.
Despite its relative infancy, the SPXT has been well researched in running (see Chapter 4;
Mauger et al., 2013a; Faulkner et al., 2015; Scheadler & Devor, 2015; Hanson et al., 2016;
Beltz et al., 2018) and cycling (Mauger & Sculthorpe, 2012; Chidnok et al., 2013; Straub et
al., 2014; Astorino et al., 2015; Hanson et al., 2016; Jenkins et al., 2017a). However, much
of the focus of this research has revolved around the validity of the protocol for V砦 O2max
measurement. Nearly all of the aforementioned studies [except the work of Scheadler et al
(2015)] have reported that the SPXT produces [at least] equal values to those achieved in
the GXT. Additionally, some studies have even found the SPXT to produce significantly
greater V砦 O2max compared to the GXT (Mauger & Sculthorpe, 2012; Mauger et al., 2013a;
Astorino et al., 2015; Jenkins et al., 2017; Jenkins et al., 2017a).
Currently, research on the physiological mechanisms underpinning these potential
differences in V砦 O2max have focused on the hemodynamic responses during the GXT and
SPXT (Astorino et al., 2015; Jenkins et al., 2017a; Beltz et al., 2018). Mauger and
74
Sculthorpe (2012) speculated that the higher V砦 O2max observed during their SPXT may have
been due to the self-paced nature of the test being less reliant on type II muscle fibres, thus
restricting the more anaerobic component of the test until the latter stages and
consequently increasing the recruitment of more oxygen-dependent type I fibres for the
majority of the protocol. In their follow up study, Mauger et al (2013a) speculated that
limb blood flow and O2 extraction may have been improved – using the finding that HRmax
was significantly lower in the SPXT as evidence, coupled with no differences in V砦 E.
Alternatively, a number of studies have reported significantly higher V砦 E during the SPXT
(see Chapter 4; Astorino et al., 2015; Faulkner et al., 2015; Jenkins et al., 2017a; Jenkins et
al., 2017). Faulkner et al (2015) speculated that the greater velocities achieved in the SPXT
may drive up V砦 E, which is in line with previous research regarding supramaximal
intensities (Norton et al., 1995).
Several studies have reported that the oxygen cost of breathing was equal to ~10 % of
V砦 O2max (Aaron et al., 1992; Vella et al., 2006; Turner et al., 2012) and this increased
exponentially with increasing V砦 E. It has been suggested that the respiratory muscles
demand a significant amount of Q砦 during exercise which may in turn limit blood flow to
the working muscles (Harms et al., 1997; Harms et al., 1998). Multiple studies, both when
higher V砦 O2max values have been achieved during the SPXT and when they have not, have
shown a greater V砦 Emax during the SPXT. Chapter 4 found that V砦 Emax was significantly
higher in one of the SPXT protocols compared to the GXT, and that, based on calculations
by Vella et al (2006), there was a greater oxygen cost of breathing during the GXT. This
suggests that the oxygen cost of breathing may be more efficient in the SPXT and that this
could promote greater blood flow to limbs and thus improve O2 delivery and extraction. As
75
such, this chapter aimed to investigate whether there was a difference in the oxygen cost of
breathing between a treadmill SPXT and GXT.
5.3. Method
5.3.1. Participants
Ten trained male runners (mean ± SD: Age = 28 ± 5 years, mass = 72 ± 6 kg, height = 177
± 7 cm) volunteered to participate in this study. The study was conducted with the approval
of the Ethics Committee of the School of Sport & Exercise Sciences at the University of
Kent. All participants who volunteered read and provided written informed consent before
participation.
5.3.2. Exercise Tests
All participants visited the laboratory on five occasions. On separate occasions,
participants completed a GXT and a speed-based SPXT; a ventilation protocol with
ventilation trials calculated via the GXT (G-VENT); a ventilation protocol with ventilation
trials calculated via the SPXT (S-VENT); and an initial eucapnic voluntary hyperpnoea
(EVH) assessment. All participants completed the EVH assessment first, followed by the
V砦 O2max protocols, and then the ventilation protocols in a randomised order. The EVH
assessment required the participant to hyperventilate dry air containing 5% CO2 as a
method of diagnosing bronchoconstriction (Anderson et al., 2001). All participants
completed a spirometry test before and after the EVH test. Participants who achieved a
76
post-EVH reduction in forced expiratory volume [in one second] compared to the pre-EVH
spirometry test were excluded from further participation. Both the V砦 O2max and ventilation
protocols were completed in a randomised order between the respective two trials. The
ventilation protocols (G-VENT and S-VENT) were included to assess whether differences
in ventilation between the SPXT and GXT existed.
5.3.3. V砦 O2max protocols
The GXT and SPXT were as described in the general methodology (see Chapter 3). V砦 O2
(Metalyzer 3BR2, Cortex, Lepzig, Germany) and heart rate (T31, Polar Electro Inc, New
York, USA) were recorded for the duration of the testing protocol. During the GXT, Vmax
was calculated as the highest velocity maintained for ≥ 30 s. In the SPXT, the mean
velocity of the final stage (vRPE20) was recorded.
5.3.4. Ventilation Protocols
Participants completed two ventilation protocols. Each ventilation protocol included
ventilation trials that were either calculated via the GXT (G-VENT) or SPXT test (S-
VENT). The protocols were randomized and the first ventilation trial took place at least 48
h after the second maximal exercise protocol. Each visit contained seven ventilation trials
separated by 5 min of seated rest. Each trial lasted 3 min. The trials were completed at the
following percentages of the participant’s V砦 Emax taken from the relevant V砦 O2max protocol
(GXT or SPXT) test: Rest, 100, 30, 75, 45, 60, 100 %. This order was chosen to avoid
having back-to-back high intensity efforts which may cause respiratory muscle fatigue. An
effort of 100 % was included twice to increase the participant’s likelihood of achieving the
required V砦 E. The 100 % trial that they performed best (actual V砦 E closest to target V砦 E) was
77
then selected for analysis. During each effort participants were asked to match the
calculated V砦 E and real time feedback was given to the participant by the cortex metalyzer
which showed their real-time breath-by-breath V砦 E. Participants breathed into a 2-way
breathing apparatus (Hans Rudolph Inc, Kansas, USA) that was connected to the Cortex
metalyzer. The breathing apparatus was then connected to a gas canister with a gas
concentration of 5%CO2/21%O2 (Anderson et al., 2001). CO2 was included to avoid
hypocapnoea (Aaron et al., 1992). To calculate V砦 O2vent, resting V砦 O2 was subtracted from
those obtained from the mimicking trials (Turner et al., 2012). The O2 cost per litre of V砦 E
(〉V砦 O2/〉V砦 E) was calculated by dividing the change in V砦 O2 by the change in V砦 E [from the
resting value].
5.3.5. Statistical Analysis
All data are presented as means ± SD. Data were checked for normality of distribution
using the Shapiro-Wilk statistic. Log transformation was used where the assumption of
normality was violated. Differences in maximal variables between the GXT and SPXT
were analysed using a paired samples t-test, or, where log transformation did not resolve
the distribution of the data, a Wilcoxon signed rank test was used. In the G-VENT and S-
VENT, to identify the differences in target and actual V砦 E (type) at different ventilation
rates (trial), 2x5 ANOVA was used. Violation of the assumptions were assessed using the
Mauchly’s test of sphericity, if P was > 0.05 then sphericity was assumed but if P < 0.05
then Greenhouse-Geisser corrections were used. A paired samples t-test was used to assess
individual differences in target and actual V砦 E for the individual ventilation trials. To
identify differences in V砦 O2vent in the G-VENT and S-VENT (protocol) across the five
different ventilation rates (trial), a 2x5 ANOVA was used. Partial eta-squared (2p ) was
78
used to report effect sizes, and statistical significance was accepted when P < 0.05. All
statistical tests were completed using SPSS version 25 (Chicago, IL, USA).
5.4. Results
The average stage-to-stage difference in V砦 O2 for all participants was calculated as 263 ±
67 mL.min-1, so that a mean plateau phenomenon was defined as a change in V砦 O2 ≤ 132 ±
33 mL.min-1 (or an average of 1.8 mL.kg−1.min−1, considering the average body mass of the
participants) between the two highest 30 s averages during the final two stages of the test.
A V砦 O2 plateau was observed in 70 % of participants in the GXT. All participants satisfied
the V砦 O2max verification criteria.
Differences in test protocols for key variables for all participants are presented in Table
5.1. There were no significant differences in V砦 O2max between the GXT and SPXT protocols
(Z = -.43, P = .67). V砦 Emax was not significantly different between protocols (t9 = -1.59; P =
.15). RERmax was significantly greater in the SPXT (t9 = -3.81, P < .01). Protocol duration
was not significantly different between protocols (t9 = 1.63, P = .14). RPEmax was
significantly greater in the SPXT (t9 = -4.12, P < .01). HRmax was not significantly
different between protocols (P = .83, t9 = .22). Vmax and vRPE20 were not significantly
different (t8 = .74, P = .48).
The O2 cost per litre of ventilation at V砦 Emax during the breathing trials were not
significantly different between the G-VENT and S-VENT protocols (2.79 ± 1.81 vs. 2.67 ±
1.73 mL/L, respectively) (t7 = -.19, P = .86). There were no significant differences in the
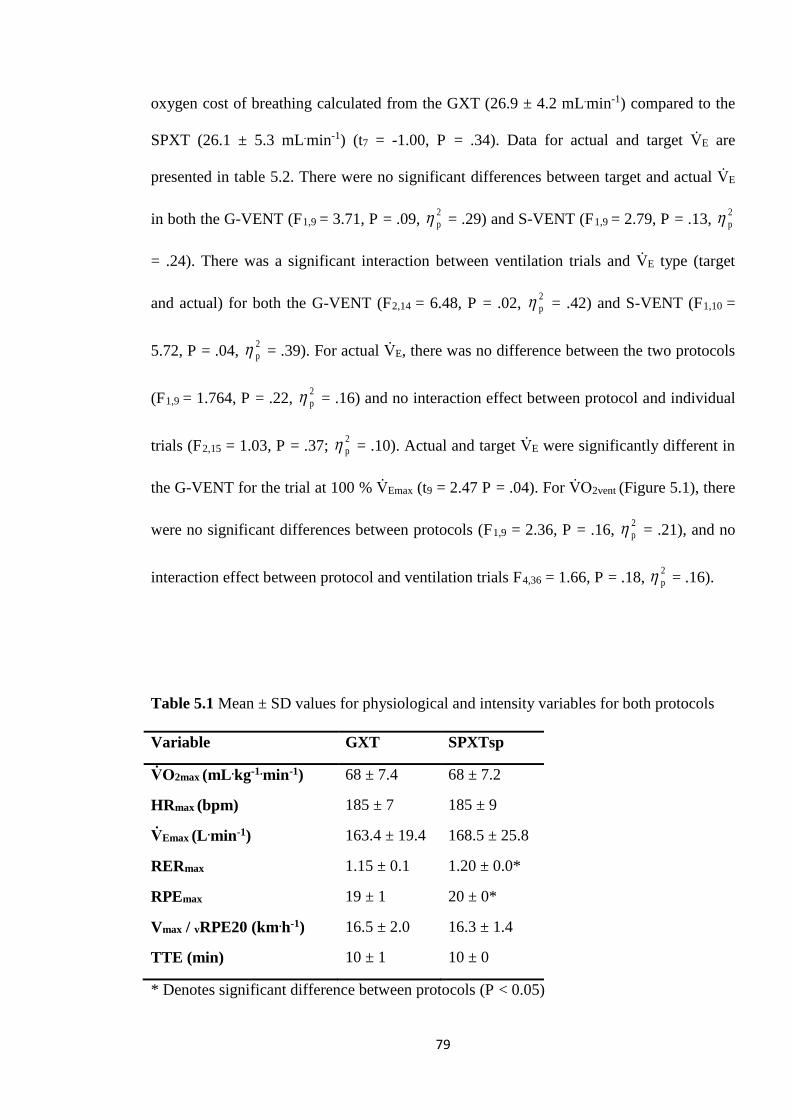
79
oxygen cost of breathing calculated from the GXT (26.9 ± 4.2 mL.min-1) compared to the
SPXT (26.1 ± 5.3 mL.min-1) (t7 = -1.00, P = .34). Data for actual and target V砦 E are
presented in table 5.2. There were no significant differences between target and actual V砦 E
in both the G-VENT (F1,9 = 3.71, P = .09, 2p = .29) and S-VENT (F1,9 = 2.79, P = .13, 2
p
= .24). There was a significant interaction between ventilation trials and V砦 E type (target
and actual) for both the G-VENT (F2,14 = 6.48, P = .02, 2p = .42) and S-VENT (F1,10 =
5.72, P = .04, 2p = .39). For actual V砦 E, there was no difference between the two protocols
(F1,9 = 1.764, P = .22, 2p = .16) and no interaction effect between protocol and individual
trials (F2,15 = 1.03, P = .37; 2p = .10). Actual and target V砦 E were significantly different in
the G-VENT for the trial at 100 % V砦 Emax (t9 = 2.47 P = .04). For V砦 O2vent (Figure 5.1), there
were no significant differences between protocols (F1,9 = 2.36, P = .16, 2p = .21), and no
interaction effect between protocol and ventilation trials F4,36 = 1.66, P = .18, 2p = .16).
Table 5.1 Mean ± SD values for physiological and intensity variables for both protocols
Variable GXT SPXTsp
V砦 O2max (mL .kg-1.min-1) 68 ± 7.4 68 ± 7.2
HRmax (bpm) 185 ± 7 185 ± 9
V砦 Emax (L .min-1) 163.4 ± 19.4 168.5 ± 25.8
RERmax 1.15 ± 0.1 1.20 ± 0.0*
RPEmax 19 ± 1 20 ± 0*
Vmax / vRPE20 (km.h-1) 16.5 ± 2.0 16.3 ± 1.4
TTE (min) 10 ± 1 10 ± 0
* Denotes significant difference between protocols (P < 0.05)
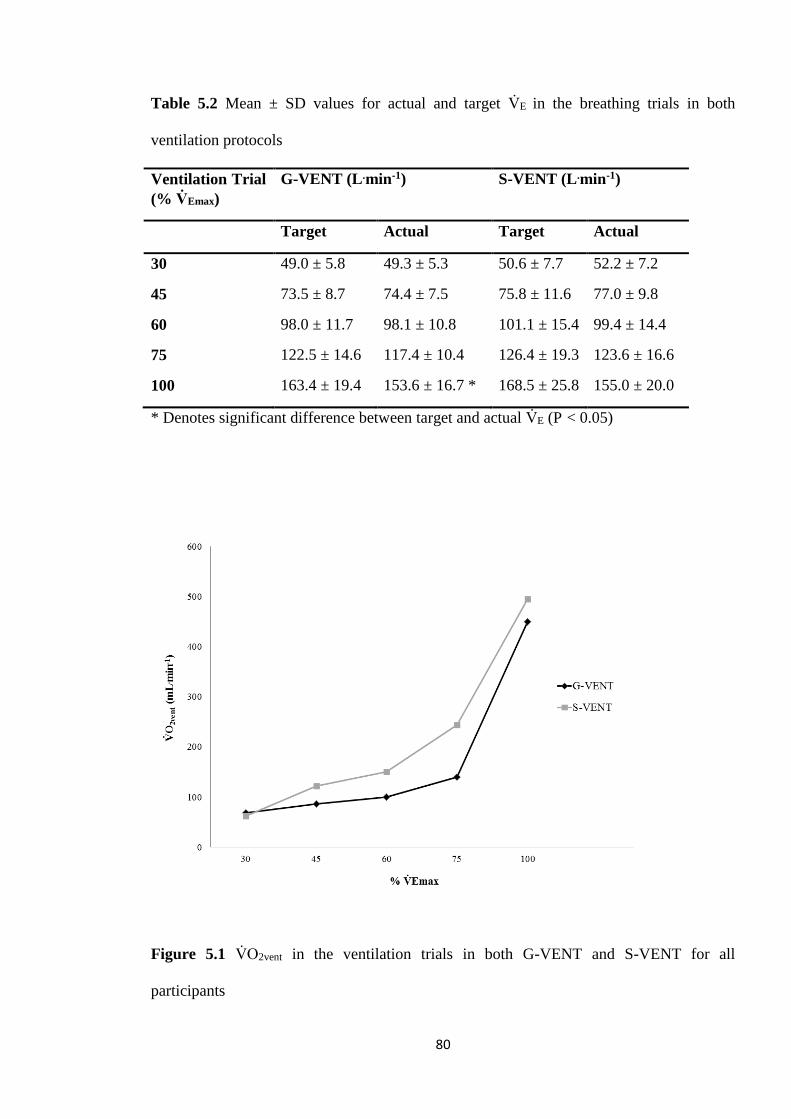
80
Table 5.2 Mean ± SD values for actual and target V砦 E in the breathing trials in both
ventilation protocols
Ventilation Trial (% V砦 Emax)
G-VENT (L .min-1) S-VENT (L .min-1)
Target Actual Target Actual
30 49.0 ± 5.8 49.3 ± 5.3 50.6 ± 7.7 52.2 ± 7.2
45 73.5 ± 8.7 74.4 ± 7.5 75.8 ± 11.6 77.0 ± 9.8
60 98.0 ± 11.7 98.1 ± 10.8 101.1 ± 15.4 99.4 ± 14.4
75 122.5 ± 14.6 117.4 ± 10.4 126.4 ± 19.3 123.6 ± 16.6
100 163.4 ± 19.4 153.6 ± 16.7 * 168.5 ± 25.8 155.0 ± 20.0
* Denotes significant difference between target and actual V砦 E (P < 0.05)
Figure 5.1 V砦 O2vent in the ventilation trials in both G-VENT and S-VENT for all
participants

81
5.5. Discussion
Contrary to the first experimental chapter (see Chapter 4), V砦 Emax and the oxygen cost of
breathing were not significantly different between the SPXT and GXT. As a result, there
was no interaction between the various trials for V砦 E and V砦 O2vent and the G-VENT and S-
VENT. A key decision of this chapter was to include the GXT and speed-based SPXT, but
not the gradient-based SPXT. It is important to highlight than in Chapter 4, only the
gradient-based SPXT provided significantly higher V砦 E compared to the GXT. However,
the speed-based SPXT was selected for this Chapter due to it having greater ‘real-world
relevance’ than the gradient-based SPXT, due to it being speed-based and thus easier to
administer than also utilizing gradient. Whilst V砦 E was not significantly different in the
speed-based SPXT in Chapter 4, estimated oxygen cost of breathing was still significantly
different to the GXT which meant its selection was justified, however it cannot be known
if the gradient based SPXT would have produced a significantly different outcome in this
Chapter as it was not used and so this is a limitation of the current design.
A key challenge of this study was to simulate various breathing rates from an exercise test,
in a passive rested state. Participants were asked to match the given V砦 E for each trial. As
could be expected, this proved more problematic for the ventilation trials with a high V砦 E
target compared to the trials with a lower V砦 E target. Matched breathing frequency was also
originally included however this proved too problematic for the participants and so only V砦 E
was matched for each trial. This is a limitation as breathing patterns may differ between
protocols beyond just V砦 E, however as participants struggled to match breathing frequency
coupled with high target V砦 E, these were not ultimately included. In the G-VENT trials,
participants struggled to meet the V砦 E requirement during the 100 % trial. As these trials are
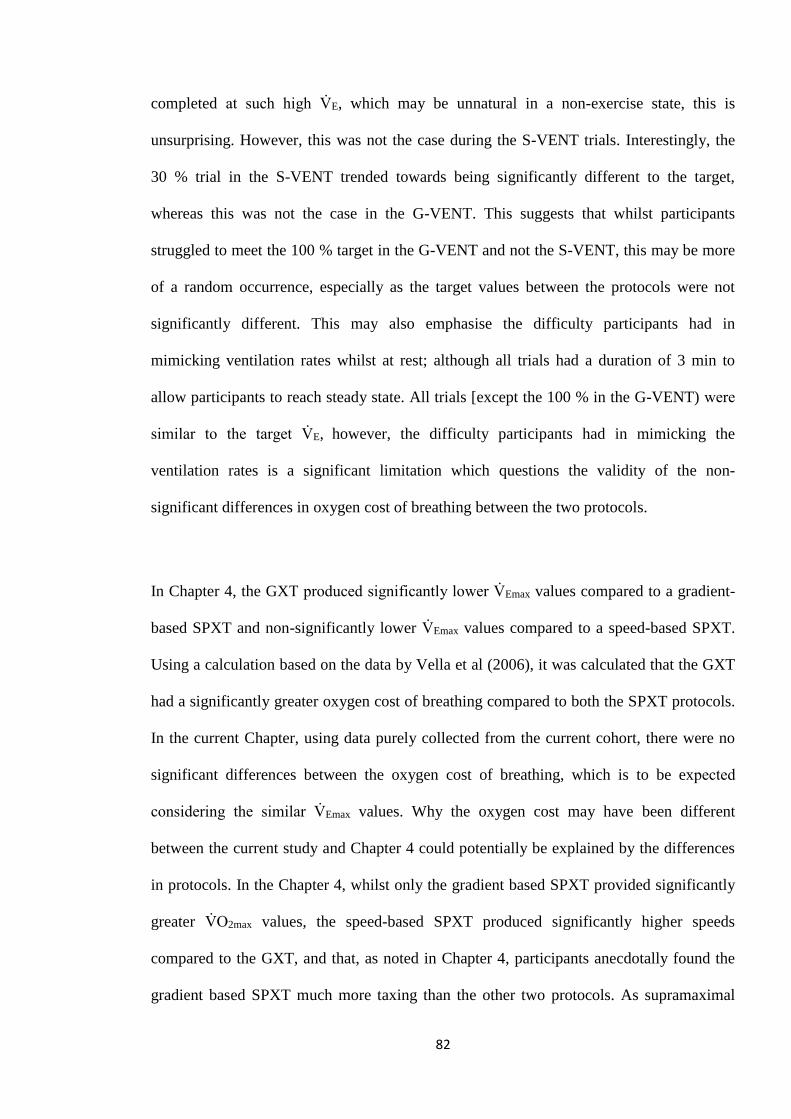
82
completed at such high V砦 E, which may be unnatural in a non-exercise state, this is
unsurprising. However, this was not the case during the S-VENT trials. Interestingly, the
30 % trial in the S-VENT trended towards being significantly different to the target,
whereas this was not the case in the G-VENT. This suggests that whilst participants
struggled to meet the 100 % target in the G-VENT and not the S-VENT, this may be more
of a random occurrence, especially as the target values between the protocols were not
significantly different. This may also emphasise the difficulty participants had in
mimicking ventilation rates whilst at rest; although all trials had a duration of 3 min to
allow participants to reach steady state. All trials [except the 100 % in the G-VENT) were
similar to the target V砦 E, however, the difficulty participants had in mimicking the
ventilation rates is a significant limitation which questions the validity of the non-
significant differences in oxygen cost of breathing between the two protocols.
In Chapter 4, the GXT produced significantly lower V砦 Emax values compared to a gradient-
based SPXT and non-significantly lower V砦 Emax values compared to a speed-based SPXT.
Using a calculation based on the data by Vella et al (2006), it was calculated that the GXT
had a significantly greater oxygen cost of breathing compared to both the SPXT protocols.
In the current Chapter, using data purely collected from the current cohort, there were no
significant differences between the oxygen cost of breathing, which is to be expected
considering the similar V砦 Emax values. Why the oxygen cost may have been different
between the current study and Chapter 4 could potentially be explained by the differences
in protocols. In the Chapter 4, whilst only the gradient based SPXT provided significantly
greater V砦 O2max values, the speed-based SPXT produced significantly higher speeds
compared to the GXT, and that, as noted in Chapter 4, participants anecdotally found the
gradient based SPXT much more taxing than the other two protocols. As supramaximal
83
intensities have been found to drive up V砦 E (Norton et al., 1995) it is entirely possible these
differences in V砦 E may have been as a result of the greater intensities often achieved during
the SPXT. This would also be in agreement with previous findings in which V砦 E was higher
in the SPXT in which greater peak intensities were also achieved (Faulkner et al., 2015;
Jenkins et al., 2017a), although prior studies have found no differences in V砦 Emax despite
higher intensities achieved during the SPXT (Scheadler & Devor, 2015). Another finding
of the current study is that the V砦 O2vent reported during the 100 % V砦 E trial equates to ~9 %
of V砦 O2max, which is in agreement with previous research (Vella et al., 2006; Turner et al.,
2012).
The finding that V砦 O2max was not significantly different between the GXT and SPXT (68 ±
7.4 vs. 68 ± 7.1 mL.kg-1.min-1, respectively) contributes to the growing number of research
studies to find the SPXT to be a valid protocol for V砦 O2max. RERmax was significantly
higher in the SPXT which has been reported previously (see Chapter 4; Mauger &
Sculthorpe, 2012; Jenkins et al., 2017a). In the study by Jenkins et al (2017a) both RERmax
and POpeak in cycling were significantly higher in the SPXT across different populations.
This was also the case in the findings of Mauger and Sculthorpe (2012). Although not
significantly different, in Chapter 4, RERmax was consistently higher in both SPXT
protocols. Although mean velocities were not different, it’s possible the final stage ‘spurt’
associated with the SPXT may have added a greater anaerobic contribution to the SPXT,
thus driving up RERmax. This would also be supported by the finding that RPEmax was
significantly higher in the SPXT, suggesting participants found the SPXT more
challenging. However, it is worth noting that whilst 70 % of participants satisfied plateau
criteria in the GXT, all participants had V砦 O2max confirmed via the verification stage,
suggesting a maximal performance was still given in the GXT.
84
In Chapter 4, peak speeds were compared between SPXT protocols and GXT, finding that
the SPXT produced significantly higher peak speeds compared to the GXT. A secondary
finding of the current study is that the vRPE20 is similar to the Vmax calculated from the
GXT. Vmax has successfully been used as a training parameter (Smith et al., 2003; Manoel
et al., 2017) and so if the SPXT could produce a comparable parameter, this would open up
possibilities to prescribe training via the SPXT. This would then give the SPXT added
utility. As such, it was found that the Vmax calculated via the GXT and the vRPE20
calculated via the SPXT were not significantly different. It is therefore recommended that
future research investigate the use of vRPE20 for training prescription in relation to the
SPXT.
5.6. Conclusion
Whilst this study adds to the growing number of studies investigating V砦 O2max testing using
the SPXT, any mechanistic differences in V砦 O2max found in the SPXT [although not in the
current Chapter] are not likely due to ventilation, as no differences in this measure were
found in the current study. However difficulties in mimicking ventilation rates mean this
still requires further investigation. In line with the findings from Chapter 4, V砦 O2max was not
significantly different between protocols, and as such, future research should develop
beyond V砦 O2max validity during the SPXT. The utility of the SPXT in prescribing training
should be investigated, and as an extension of this, the ability of the SPXT to provide

85
training parameters such as a velocity similar to Vmax, and ventilatory thresholds would be
beneficial.
86
Chapter 6: Prescribing 6 weeks of running training
using parameters from the SPXT
Aspects of the following chapter have been included within the following manuscript,
Hogg, J. S., Hopker, J. G., Coakley, S. L., Mauger, A. R. (2018). Prescribing 6-wk of
running training using parameters from a self-paced maximal oxygen uptake protocol.
European Journal of Applied Physiology, 5, 911-918.
Available at: https://kar.kent.ac.uk/65903/
87
6.1. Abstract
The SPXT may offer effective training prescription metrics for athletes. This study aimed
to examine whether SPXT-derived data could be used for training prescription. Twenty-
four recreationally active male and female runners were randomly assigned between two
training groups: (1) Standardised (STND) and (2) Self-Paced (S-P). STND had training
prescribed via GXT data, whereas S-P had training prescribed via SPXT data. V砦 O2max,
vV砦 O2max, Tmax, vRPE20, CS, and LT were determined before and after the 6 wk training.
Results demonstrate that STND and S-P training significantly improved V砦 O2max by 4 ± 8 %
and 6 ± 6 %, CS by 7 ± 7 % and 3 ± 3 %; LT by 5 ± 4 % and 7 ± 8 %, respectively (all P <
0.05), with no differences observed between groups. The current study demonstrates that
novel metrics obtained from the SPXT can offer similar quality of training prescription and
improvement in V砦 O2max, CS and LT compared to training derived from a traditional GXT.
88
6.2. Introduction
In Chapter 5 the mechanistic differences regarding ventilation were investigated. V砦 O2max
and key physiological variables were not different between protocols. As a secondary
measure, the average velocity during the final stage of the SPXT was reported to not be
significantly different to the Vmax measured during the GXT. As the validity of the SPXT is
now well founded, it is now important to assess the practical applications of the SPXT.
Therefore, Chapter 6 will investigate the utility of the SPXT in training prescription.
The utility of the SPXT beyond simple V砦 O2max measurement has yet to be investigated in
depth. Greater emphasis should be placed on the practical advantages the SPXT has over
the GXT. The problems associated with the GXT are well documented (Noakes, 2008),
whilst it has been put forward that the SPXT may represent a paradigm shift in V砦 O2max
testing (Beltz et al., 2016). This is due to self-paced protocols offering greater ecological
validity due to the self-paced and closed-loop nature, whilst also circumventing the issue of
estimating the ramp-rate and starting work-rate for the researcher or practitioner (Poole &
Jones, 2017).
The GXT offers additional metrics in addition to the measurement of V砦 O2max, such as
vV砦 O2max, Tmax, and Vmax. However, the identification of Tmax requires an additional test
which adds to the impracticality of the GXT for prescribing training. Nevertheless, V砦 O2max,
vV砦 O2max, Tmax, and Vmax have been shown to be useful and viable parameters in running
training and performance (Billat & Koralsztein, 1996; Smith et al., 2003; Esfarjani &
Laursen, 2007; Manoel et al., 2017) and can be used to prescribe training and assess
89
training adaptations. If similar metrics for training prescription could be acquired from the
SPXT, in a singular test, it would demonstrate utility over and above traditional GXT
assessment of V砦 O2max, especially as the SPXT is an effective test for highly trained runners
(see Chapter 4; Scheadler & Devor, 2015), and has good test-retest reliability (Lim et al.,
2016; Jenkins et al., 2017a). As such, this study aimed to investigate whether training
prescribed via novel metrics derived from the SPXT could result in comparable
improvements in key aerobic parameters as training formulated from traditional GXT
variables.
6.3. Method
6.3.1. Participants
Twenty-four recreationally active male (n = 16) and female runners (n = 8) (Mean ± SD:
Age = 30 ± 9 years, body mass = 70 ± 13 kg, height = 172 ± 9 cm) volunteered to
participate in this study. Sample size was estimated from power calculations (G-Power
software, Franz Faul, Universitat Kiel, Germany) with mean and SD data from a similar
training study (Esfarjani & Laursen, 2007). The study was conducted with the approval of
the Ethics Committee of the School of Sport & Exercise Sciences at the University of
Kent. All participants who volunteered read and provided written informed consent before
participation.
90
6.3.2. Exercise Tests
Participants were randomly allocated into two groups: ‘Standardised’ (STND) and ‘Self-
paced’ (S-P). All participants completed a GXT, an SPXT, and a sub-maximal lactate
threshold (LT) test on a motorised treadmill (Saturn, H/P/Cosmos, Nussdorf-Traunstein,
Germany), and a critical speed (CS) test as part of baseline testing on three separate
occasions over a two week period. The V砦 O2max protocols were completed in a randomised
order, 2-7 days apart and at the same time of day (± 2 h). V砦 O2 (Metalyzer 3BR2, Cortex,
Lepzig, Germany) and heart rate (T31, Polar Electro Inc, New York, USA) were recorded
for the duration of the testing protocol. Before each test, participants performed a warm-up
of their choice on the motorised treadmill, which was kept the same for all subsequent
tests. The CS test was completed on an all-weather synthetic 400 m running track using the
method outlined by Galbraith (2011). Briefly, this involved three runs at distances of 3600
m, 2400 m, and 1200 m, each separated by 30 min recovery. For the LT protocol,
participants completed 4 min stages on the treadmill with a capillary blood sample (Biosen
C-Line, EKF Diagnostics, Barleben, Germany) taken at the end of each stage, with the
velocity increasing by 1 km.h-1 at the beginning of each stage. Starting speed was estimated
based on each participant’s individual fitness level. The test was terminated once the first
and second lactate thresholds (LT1 and LT2, respectively) had been obtained, defined as
blood lactate readings of 2 and 4 mmol.L-1, respectively. Following baseline testing all
participants then undertook a 6 wk field-based training program, consisting of two high
intensity interval training sessions, one recovery run, and a tempo run per week. Training
sessions were either based on data from the SPXT or GXT [depending on group
allocation]. Participants completed either a GXT, or SPXT mid-training [depending on
group allocation] in the third week of the training programme. This test replaced one of the
high intensity sessions for that week, with its sole purpose to recalibrate interval session
91
intensity in both groups. All baseline tests were then repeated in the immediate two-weeks
that followed the 6 wk training intervention.
6.3.3. GXT
The GXT was conducted in accordance with the procedures previously outlined in the
general methodology (see Chapter 3). Vmax was determined as the highest velocity that
could be maintained for at least 30 s.
6.3.4. Determination of Tmax
For the GXT, Tmax was measured in a separate bout of exercise (Smith et al., 2003). After a
20 min recovery (Nolan et al., 2014) following the GXT, participants warmed up on the
treadmill at 60 % Vmax for 5 min. Participants were then allowed to stretch before
remounting the treadmill with the speed being ramped up over 30 s until Vmax was reached.
Participants were then asked to continue until volitional exhaustion. Heart rate and expired
gas were recorded throughout this test.
6.3.5. Self-paced exercise test
The SPXT was conducted in accordance with the procedures previously outlined in the
general methodology (see Chapter 3).
92
6.3.6. Determination of V砦 O2max
V砦 O2 plateau and secondary criteria were calculated as outlined in the general methodology
(see Chapter 3).
6.3.7. Training programme
All participants completed two high-intensity interval sessions per week, along with a
recovery run and a tempo run. This equated to four exercise sessions per week.
Participants were free to schedule the sessions throughout each week but were encouraged
to not complete interval sessions and tempo run on consecutive days. All sessions were
completed using an assigned GPS watch (310XT, Garmin International Inc, KS, USA), and
training was logged in a training diary
6.3.7.1. STND Group
For each interval session, participants completed 6 intervals at Vmax with duration
determined as 60 % of Tmax (Smith et al., 2003). A 2:1 ratio was used to determine the
recovery stage duration in-between each interval. Recovery run intensity was calculated as
60 % of their HRmax obtained from the GXT. Participants were required to run for 30 min.
This session was included to help ensure participants would not be encouraged to
supplement their program with additional training.
Tempo run intensity was determined from the submaximal LT test and participants were
required to run at a velocity calculated as 50 % between LT1 and LT2 for 30 min.
93
6.3.7.2. S-P Group
For each interval session, participants completed 7 x 2 min intervals at vRPE20. A 2:1 ratio
was used to determine the recovery stage duration in-between each interval. The recovery
run was the same as in the STND group, but intensity was calculated as 60 % of their
HRmax obtained from the SPXT.
Tempo run intensity was determined by calculating the VT via the V-Slope method from
the V砦 O2 and V砦 CO2 data collected during the SPXT (Beaver et al., 1986). The participants
were then asked to run at an RPE that corresponded with the stage of the SPXT in which
the VT was achieved. The participants were asked to freely adjust their pacing to match the
required RPE.
6.3.8. Statistical Analysis
Data were checked for normality of distribution using the Shapiro-Wilk statistic. To assess
maximal value differences between protocols, a paired samples t-test, or a Wilcoxon
signed rank test for not normally distributed data, was performed. Based on the achieved
effect size, a post hoc power analysis demonstrated that the statistical power of the pre-post
V砦 O2max comparison was 0.93. To identify training responses for both training groups
(group) and GXT and SPXT protocols (protocol) for before and after training (time-point)
a mixed model ANOVA was used. Where no interaction effect was identified between a
variable and protocol (GXT and SPXT), the protocol was omitted from further analysis of
training responses for that variable. Participants’ CS were calculated from the field test
using a linear distance-time model. 2p was used to report effect sizes, and statistical

94
significance was accepted when P < 0.05. All statistical tests were completed using SPSS
version 24 (Chicago, IL, USA).
6.4. Results
6.4.1. SPXT vs. GXT Protocol Data
6.4.1.1. Incidence of V賀 O2 plateau in GXT and secondary criteria achievement in SPXT
In pre-testing, the average stage-to-stage increase in V砦 O2 for all participants was calculated
as 268 ± 112 mL.min-1, so that a mean plateau phenomenon for pre-testing was defined as
a change in V砦 O2 ≤ 134 ± 56 mL.min-1 (or relative V砦 O2 1.9 mL.kg−1.min−1), between the
highest 30 s average obtained from each of the final two stages of the test for each
participant. In the GXT, 50 % of participants achieved a plateau whilst the remaining
participants all satisfied secondary criteria. In the SPXT, ninety-six percent of participants
satisfied secondary criteria.
In post-testing, the average stage-to-stage increase in V砦 O2 for all participants was
calculated as 234 ± 66 mL.min-1, so that a mean plateau phenomenon for post-testing was
defined as a change in V砦 O2 ≤ 117 ± 33 mL.min-1 (or relative V砦 O2 1.7 mL.kg−1.min−1),
between the highest 30 s average obtained from each of the final two stages of the test for
each participant. In the GXT, 63 % of participants achieved a plateau whilst the remaining
participants all satisfied secondary criteria. In the SPXT, all participants satisfied
secondary criteria.
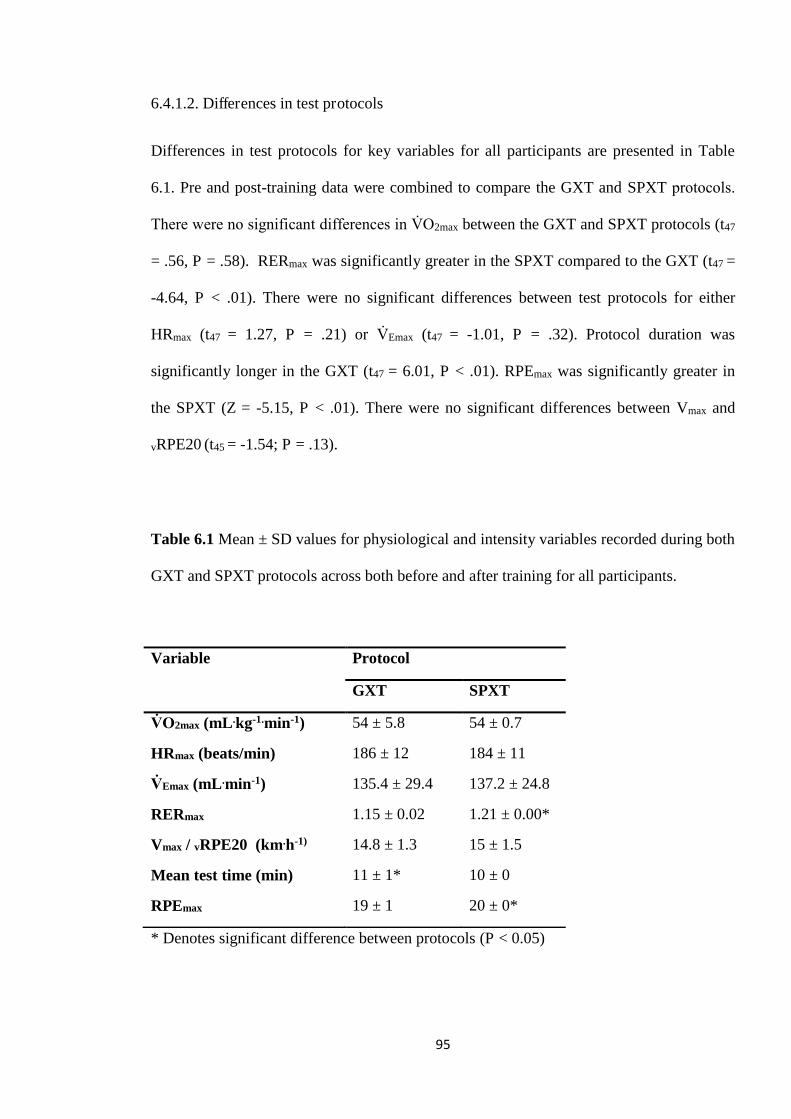
95
6.4.1.2. Differences in test protocols
Differences in test protocols for key variables for all participants are presented in Table
6.1. Pre and post-training data were combined to compare the GXT and SPXT protocols.
There were no significant differences in V砦 O2max between the GXT and SPXT protocols (t47
= .56, P = .58). RERmax was significantly greater in the SPXT compared to the GXT (t47 =
-4.64, P < .01). There were no significant differences between test protocols for either
HRmax (t47 = 1.27, P = .21) or V砦 Emax (t47 = -1.01, P = .32). Protocol duration was
significantly longer in the GXT (t47 = 6.01, P < .01). RPEmax was significantly greater in
the SPXT (Z = -5.15, P < .01). There were no significant differences between Vmax and
vRPE20 (t45 = -1.54; P = .13).
Table 6.1 Mean ± SD values for physiological and intensity variables recorded during both
GXT and SPXT protocols across both before and after training for all participants.
* Denotes significant difference between protocols (P < 0.05)
Variable Protocol
GXT SPXT
V砦 O2max (mL .kg-1.min-1) 54 ± 5.8 54 ± 0.7
HRmax (beats/min) 186 ± 12 184 ± 11
V砦 Emax (mL .min-1) 135.4 ± 29.4 137.2 ± 24.8
RERmax 1.15 ± 0.02 1.21 ± 0.00*
Vmax / vRPE20 (km.h-1) 14.8 ± 1.3 15 ± 1.5
Mean test time (min) 11 ± 1* 10 ± 0
RPEmax 19 ± 1 20 ± 0*
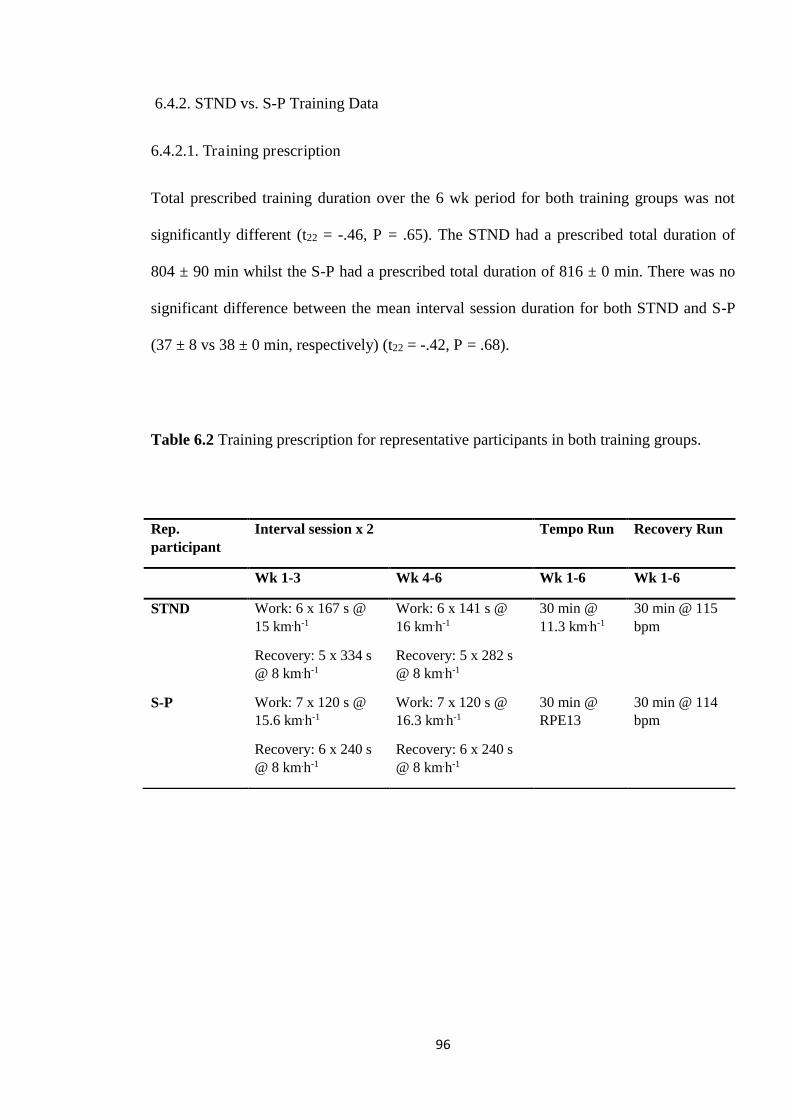
96
6.4.2. STND vs. S-P Training Data
6.4.2.1. Training prescription
Total prescribed training duration over the 6 wk period for both training groups was not
significantly different (t22 = -.46, P = .65). The STND had a prescribed total duration of
804 ± 90 min whilst the S-P had a prescribed total duration of 816 ± 0 min. There was no
significant difference between the mean interval session duration for both STND and S-P
(37 ± 8 vs 38 ± 0 min, respectively) (t22 = -.42, P = .68).
Table 6.2 Training prescription for representative participants in both training groups.
Rep. participant
Interval session x 2 Tempo Run Recovery Run
Wk 1-3 Wk 4-6 Wk 1-6 Wk 1-6
STND Work: 6 x 167 s @ 15 km.h-1
Recovery: 5 x 334 s @ 8 km.h-1
Work: 6 x 141 s @ 16 km.h-1
Recovery: 5 x 282 s @ 8 km.h-1
30 min @ 11.3 km.h-1
30 min @ 115 bpm
S-P Work: 7 x 120 s @ 15.6 km.h-1
Recovery: 6 x 240 s @ 8 km.h-1
Work: 7 x 120 s @ 16.3 km.h-1
Recovery: 6 x 240 s @ 8 km.h-1
30 min @ RPE13
30 min @ 114 bpm
97
6.4.2.2. Responses to Training
Group data (pre- vs. post-training) are shown in Table 6.3. As outlined in the methods,
participants were grouped into either S-P or STND, and conducted both an SPXT and GXT
before and after the training intervention. There was no interaction effect for protocol
duration between groups identified (F1,22 = .56, P = .46, 2p = .03). As shown in Figure 6.1
and Table 6.3, there was a significant difference for V砦 O2max for pre and post training (F1,22
= 7.461, P = .01, 2p = .25) but there was no interaction effect identified (F1,22 < .01, P =
.954, 2p < .01). Whilst there was a significant difference for V砦 Emax for pre and post
training (F1,22 = 12.59, P < .01, 2p = .36), there was no interaction effect identified (F1,22 <
.01, P = .98, 2p < .01). There was no interaction effect for HRmax (F1,22 = 1.06, P = .31, 2
p
= .05). There was a significant difference for vRPE20 and Vmax for pre and post training
(F1,20 = 5.80, P = .03, 2p = .23). As shown in Figure 6.2, for both groups, there were no
differences in Vmax and vRPE20 before training (14.3 ± 1.3 vs. 14.3 ± 1.7 km.h-1,
respectively), but vRPE20 was greater than Vmax after training (15.7 ± 1.3 vs. 15.2 ± 1.3
km.h-1, respectively). CS significantly improved in both groups before and after training
(F1,21 = 26.12, P < .01, 2p = .56) however there was no interaction effect identified (F1,21 =
3.01, P = .10, 2p = .13). Similarly, LT1 and LT2 significantly improved in both groups
(F1,21 = 14.64, P < .01, 2p = .41) however there was no interaction effect identified (F1,21 =
1.23, P = .28, 2p = .06).
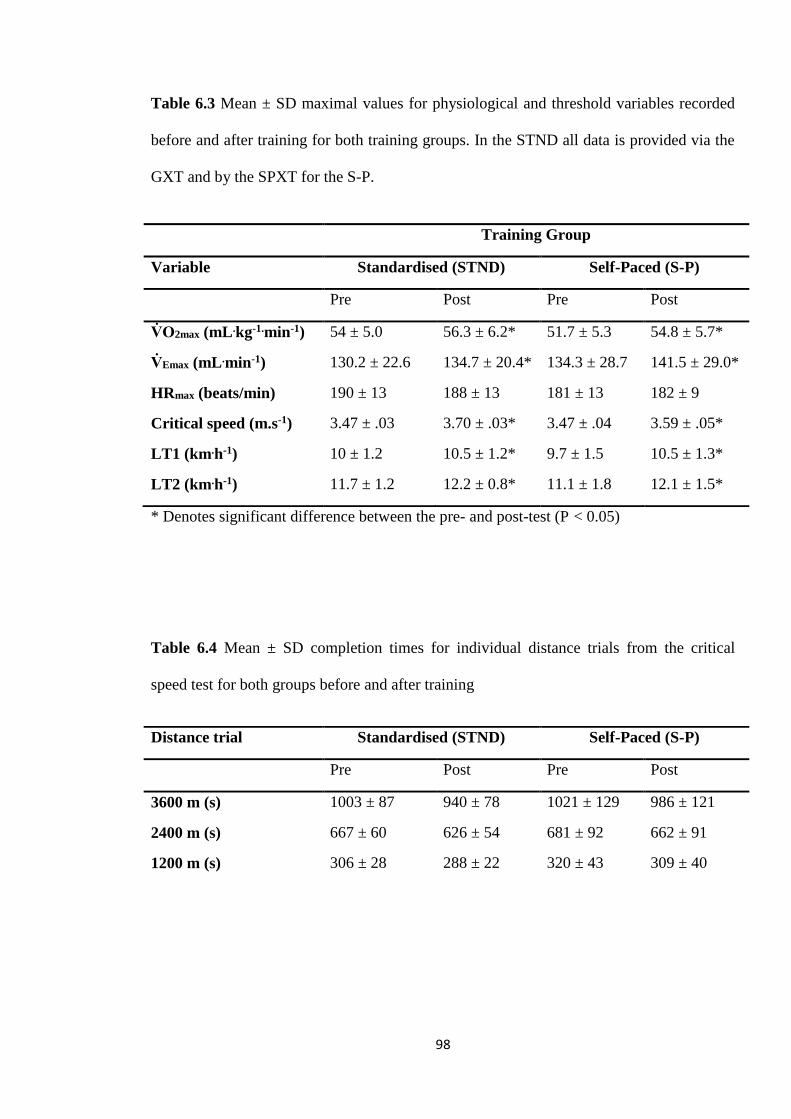
98
Table 6.3 Mean ± SD maximal values for physiological and threshold variables recorded
before and after training for both training groups. In the STND all data is provided via the
GXT and by the SPXT for the S-P.
* Denotes significant difference between the pre- and post-test (P < 0.05)
Table 6.4 Mean ± SD completion times for individual distance trials from the critical
speed test for both groups before and after training
Training Group
Variable Standardised (STND) Self-Paced (S-P)
Pre Post Pre Post
V砦 O2max (mL .kg-1.min-1) 54 ± 5.0 56.3 ± 6.2* 51.7 ± 5.3 54.8 ± 5.7*
V砦 Emax (mL .min-1) 130.2 ± 22.6 134.7 ± 20.4* 134.3 ± 28.7 141.5 ± 29.0*
HRmax (beats/min) 190 ± 13 188 ± 13 181 ± 13 182 ± 9
Critical speed (m.s-1) 3.47 ± .03 3.70 ± .03* 3.47 ± .04 3.59 ± .05*
LT1 (km .h-1) 10 ± 1.2 10.5 ± 1.2* 9.7 ± 1.5 10.5 ± 1.3*
LT2 (km .h-1) 11.7 ± 1.2 12.2 ± 0.8* 11.1 ± 1.8 12.1 ± 1.5*
Distance trial Standardised (STND) Self-Paced (S-P)
Pre Post Pre Post
3600 m (s) 1003 ± 87 940 ± 78 1021 ± 129 986 ± 121
2400 m (s) 667 ± 60 626 ± 54 681 ± 92 662 ± 91
1200 m (s) 306 ± 28 288 ± 22 320 ± 43 309 ± 40
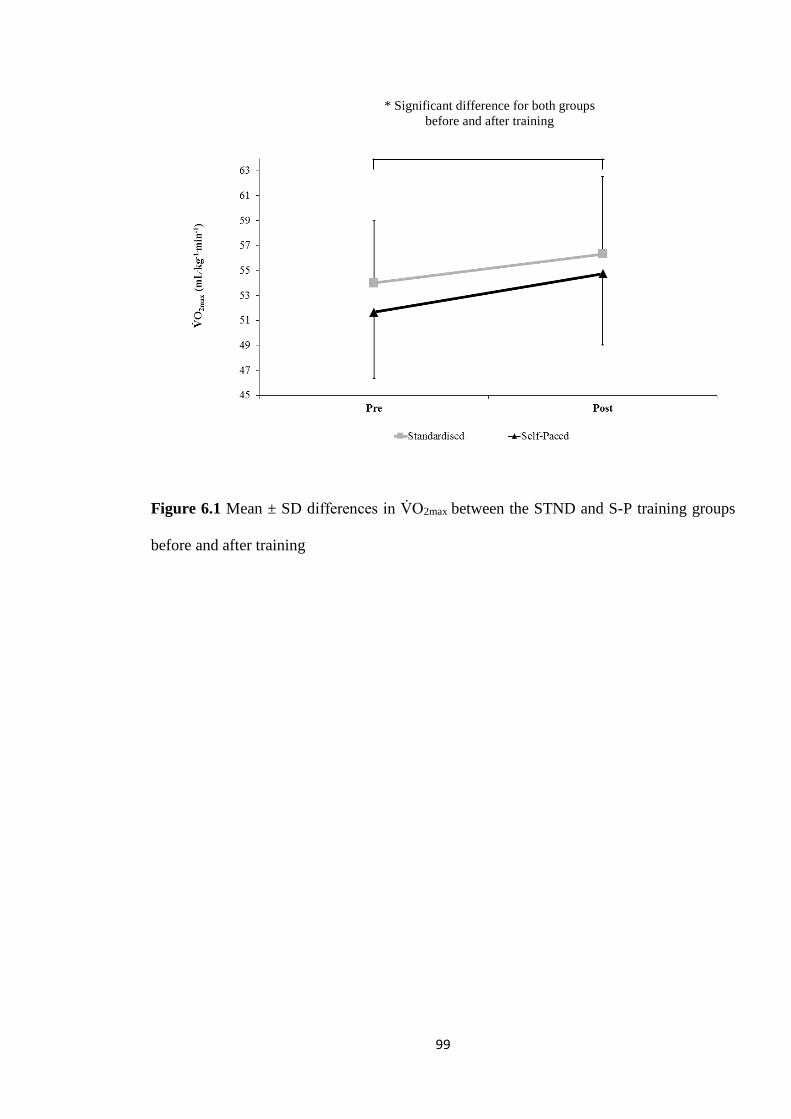
99
Figure 6.1 Mean ± SD differences in V砦 O2max between the STND and S-P training groups
before and after training
* Significant difference for both groups before and after training
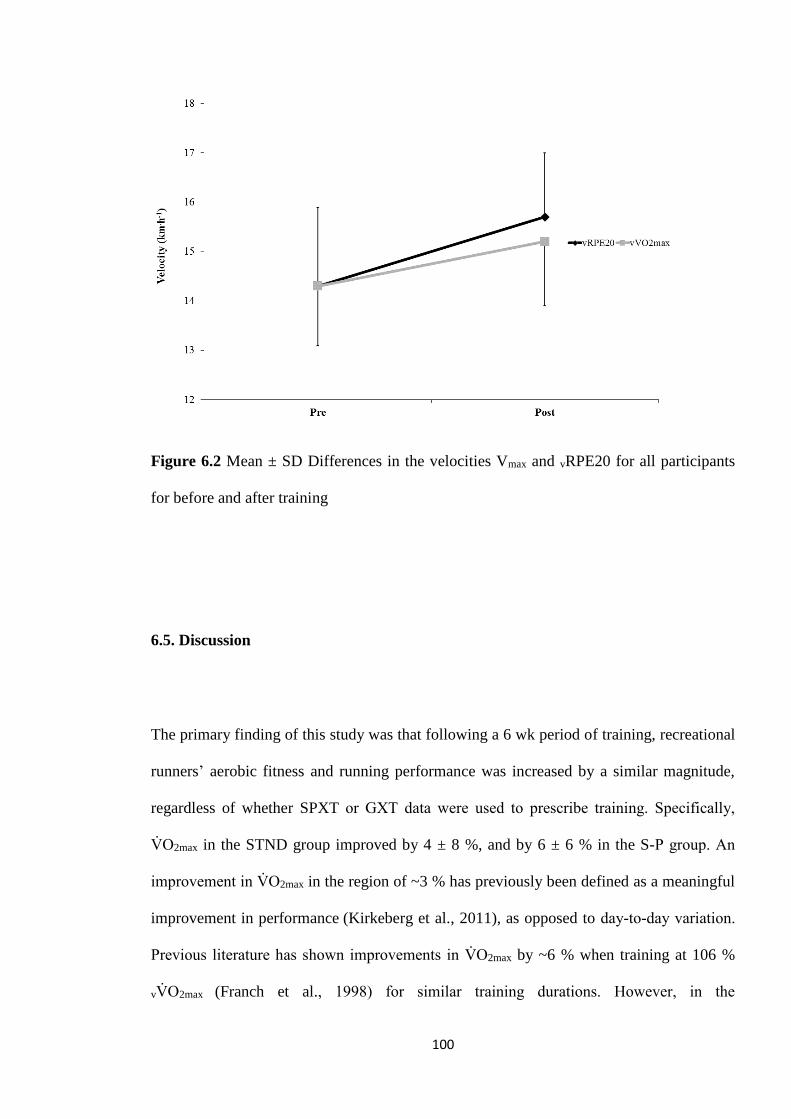
100
Figure 6.2 Mean ± SD Differences in the velocities Vmax and vRPE20 for all participants
for before and after training
6.5. Discussion
The primary finding of this study was that following a 6 wk period of training, recreational
runners’ aerobic fitness and running performance was increased by a similar magnitude,
regardless of whether SPXT or GXT data were used to prescribe training. Specifically,
V砦 O2max in the STND group improved by 4 ± 8 %, and by 6 ± 6 % in the S-P group. An
improvement in V砦 O2max in the region of ~3 % has previously been defined as a meaningful
improvement in performance (Kirkeberg et al., 2011), as opposed to day-to-day variation.
Previous literature has shown improvements in V砦 O2max by ~6 % when training at 106 %
vV砦 O2max (Franch et al., 1998) for similar training durations. However, in the
101
aforementioned study the starting V砦 O2max for the participants were significantly lower than
those reported in the current study, which may suggest a greater level of trainability for
V砦 O2max (Swain & Franklin, 2002) compared with the participants in the current study.
Athletes of slightly higher training status’ than those in the current study achieved little to
no improvements in V砦 O2max over 4-6 wk of similar intensity training (Smith et al., 2003;
Denadai et al., 2006; Manoel et al., 2017), but did show significant improvements in LT
and 3-10 km running performance. Similar running programmes utilising interval training
have also produced improvements in CS (Clark et al., 2013). This is supported by the
findings of the current study that in both STND and S-P, CS improved by 7 ± 7 % and 3 ±
3 %, respectively (see Tables 6.3 and 6.4). For LT1 and LT2, STND improved by 5 ± 4 %
and 3 % and S-P improved by 7 ± 8 % and 8 %.
An important finding of this study is that the novel training parameter extracted from the
SPXT, vRPE20, is effective at prescribing running intensity for interval training. The Vmax
for the STND before and after training was 14.3 ± 0.9 vs. 15.2 ± 1.0 km.h-1 compared to
14.2 ± 1.9 vs. 15.7 ± 1.9 km.h-1 for vRPE20 in the S-P, respectively. Vmax has recently been
shown to be as beneficial as vV砦 O2max for exercise prescription (Manoel et al., 2017), and
like vRPE20 is simple to calculate. Moreover, vRPE20 has been shown to be repeatable
regardless of the pacing strategy adopted during this final stage (Hanson et al., 2017). This
should be reason to encourage further investigation to assess the potential of vRPE20 in
training prescription and its suitability as a performance parameter.
As the aim of the study was to investigate whether SPXT-derived training parameters
could offer similar improvements in aerobic fitness compared to GXT prescribed training,
102
it was important that training prescription was similar between groups in both intensity and
duration. To calculate interval duration for the STND, 60 % Tmax was used. Setting interval
duration at 60 % of an individual’s Tmax has been shown to produce significant
improvements in aerobic parameters and 3-10 km running performance (Smith et al., 2003;
Esfarjani & Laursen, 2007; Manoel et al., 2017). In the study by Smith et al (2003), 60 %
Tmax resulted in an average interval duration of 6 x 133 ± 4 s. This equated to ~13 min of
high intensity effort per interval session. In the current study, 7 intervals at 120 s [which
also matched the stage duration of the SPXT] resulted in ~14 min of high intensity effort,
ensuring it was comparable to the STND group. Durations of 2 min have been shown to
elicit responses closer to V砦 O2max compared to shorter intervals (O’Brien et al., 2008).
Longer interval work periods may have resulted in a greater V砦 O2max improvement
(Esfarjani & Laursen, 2007; O’Brien et al., 2008; Seiler & Sjursen, 2002) but also
significantly increased the interval duration. As a consequence, the mean prescribed
training duration for each interval session over the 6 wk training period was similar
between groups (37 ± 8 vs. 38 ± 0 min for STND and S-P, respectively). Total training
time over the 6 wk period was also similar (804 ± 90 vs. 816 ± 0 min, for STND and S-P
respectively).
The similar V砦 O2max found between both protocols in this study is in line with previous
research (see Chapter 4; Chidnok et al., 2013; Straub et al., 2014; Faulkner et al., 2015;
Scheadler & Devor, 2015; Hanson et al., 2016; Lim et al., 2016). Even though test duration
was significantly longer in the GXT, the test was still similar to the recommended duration
of ~10 min (Yoon et al., 2007), and the V砦 O2max achieved was not significantly different
between protocols. Interestingly, RERmax was significantly higher in the SPXT, which has
been observed in some (see Chapter 4; Mauger & Sculthorpe, 2012; Jenkins et al., 2017a),
103
but not all previous SPXT literature (Straub et al., 2014; Astorino et al., 2015; Faulkner et
al., 2015; Lim et al., 2016). Consequently, no consensus on whether the SPXT produces a
higher RERmax can be currently drawn. However, it can be speculated that this potential
difference in RERmax may be due to the higher peak velocities experienced in the SPXT
compared to the GXT, indicative of a greater anaerobic contribution towards the end of the
test. This is supported by the recent work of Hanson et al (2017) who found, when
comparing two SPXT trials with different RPE20 pacing strategies, that RERmax was
significantly greater in the SPXT that adopted the more aggressive pacing strategy.
A perceived limitation of this Chapter could be the lack of a control group, however as the
main aim of the Chapter was to compare between the two methods of training this was not
deemed essential. Comparing between the different methods; training via the SPXT-
derived parameters, and the established method of prescribing training via GXT-derived
parameters, was the central aim over investigating absolute improvements in
cardiorespiratory fitness in individuals. This model has previously been utilized in the
literature (Manoel et al., 2017).
6.6. Conclusion
The ability to prescribe training for recreationally active males and females via SPXT-
derived parameters offers coaches and athletes valuable alternatives to traditional methods.
Prescribing training via the SPXT is as effective but more time-efficient. Specifically, the
104
same level of improvement in key aerobic fitness parameters can be obtained when
training is set via novel training parameters collected from a single 10 min SPXT test
compared to that achieved using a GXT and a mandatory additional test to acquire Tmax
data. This alone may make the SPXT more attractive to athletes and coaches, however,
recent research regarding a field based SPXT (Lim et al., 2016) may emphasise this further.
Whilst a field-based SPXT has been shown to produce a valid directly measured V砦 O2max,
future research should investigate whether V砦 O2max can be accurately estimated from the
field based SPXT. If so, athletes and coaches would then be able to utilise a single 10 min
test on an athletics track, without expensive equipment, that would offer accurate V砦 O2max
estimation and data for effective training prescription. Therefore, the current findings
demonstrate that training parameters derived from the SPXT protocol can be used to
prescribe effective running training that is similarly effective to training prescribed from
GXT-derived parameters. Consequently, in the group that was prescribed training using
SPXT-derived parameters, V砦 O2max, LTs and CS showed similar improvements compared
to runners who were prescribed training via the velocity at V砦 O2max and LT zones, with
training durations and intensities suitably similar between groups throughout training.
105
Chapter 7: Comparison of the ventilatory
thresholds obtained from the self-paced and
graded exercise protocols
106
7.1. Abstract
The SPXT may offer the calculation of VT1 and VT2. This study aimed to examine
whether VT1 and VT2 could be calculated via the SPXT. Data from twenty-one
recreationally trained (RT) runners and twelve highly trained runners (HT) from the
previous Chapters (4, 5, and 6) were analysed. VT1 was calculated using the V-Slope
method and VT2 via plotting of V砦 E/V砦 CO2. Results demonstrated that in HT, VT1 and VT2
[as % V砦 O2max] were similar between the SPXT (83 ± 6 and 91 ± 5 %, respectively) and
GXT (85 ± 3 and 93 ± 3 %, respectively). In RT, VT2 was similar between SPXT and
GXT (86 ± 5 vs. 88 ± 3 %, respectively) but VT1 was significantly lower in the SPXT
compared to the GXT (73 ± 6 vs. 78 ± 3 %, respectively). The current study demonstrates
that in highly trained runners, the SPXT offers similar ventilatory parameters compared to
the GXT whereas in recreationally trained runners, there is some disparity in VT1, but VT2
is similar, suggesting that in general the SPXT calculates approximately the same
ventilatory thresholds as via the GXT.
107
7.2. Introduction
In Chapter 6, the utility of the SPXT, and parameters derived from it in training
prescription were explored. In recreationally trained runners the SPXT was able to offer
similar training and performance benefits when compared to training set via the GXT.
Whilst the primary training was intervals set using either vRPE20, or Vmax [in the SPXT
and GXT, respectively], VT1 was also calculated in the SPXT to prescribe intensity for a
tempo run and this was comparable to a tempo run set via LT for the GXT-set group.
However, the wider validity of setting VT (both VT1 and VT2) via the SPXT was not
explored and comprehensively compared to VT via the GXT and so Chapter 7 will focus
on this concept.
The attainment of VT can be beneficial in prescribing exercise intensities and training
zones for athletes (Esteve-Lanao et al., 2007; Seiler, 2010; Mora et al., 2016). Whilst no
‘gold standard’ for VT measurement exists, it is generally obtained during a GXT with
either a RAMP or STEP design, and thus means the GXT is able to offer valuable
information beyond V砦 O2max measurement (Black et al., 2014). This key factor means VT
may be more beneficial than lactate thresholds, as the measurement of LT typically
requires a protocol of much longer stages than those typically used in a GXT (Plato et al.,
2008) and so additional testing is usually required.
Until recently, the SPXT has been used to predominantly assess V砦 O2max, with it previously
suggested that the disadvantage of the SPXT is that it cannot offer information on VT due
to the irregular incremental work-rate design and that the measurement of VT requires
108
consistent increases in work-rate (Straub et al., 2014). This has been shown to not
necessarily be the case as multiple studies have recently calculated VT via the SPXT and
found it comparable to the GXT (Jenkins et al., 2017; Truong et al., 2017; Beltz et al.,
2018). All of these studies have calculated VT1, with Truong et al (2017) unable to
calculate VT2. This is perhaps due to the modified-SPXT that they used (which included 1
min stages instead of 2 min) resulting in an inconsistency in work-rate increase and thus
made VT2 difficult to calculate. Of the two studies that have investigated VT in running-
based SPXT, one has used a semi-automated treadmill and a modified SPXT whilst the
other has used untrained participants. This Chapter will therefore investigate the use of the
SPXT in identifying VT1 and VT2 in both recreationally and highly trained runners when
using a motorised treadmill.
7.3. Method
7.3.1. Participants
This study utilised datasets from previous experimental Chapters (see Chapters 4, 5, and
6). Criteria for the inclusion of data was defined as participants who had completed both a
GXT and a SPXT (hereon defined as a data set) within 7 days of one another under the
same laboratory conditions. An SPXT could only be paired with the corresponding GXT
which took place within the previously stated 7 day period, and vice-versa. Participant data
were divided into two sub-sets: highly trained (HT) (data collected from Chapters 4 and 5)
and recreationally trained (RT) (data collected from Chapter 6). In the RT subset, multiple
data sets for a single participant could be included if they met the previously described
109
criteria. The HT subset included data for twelve highly trained male runners (mean ± SD:
age = 27 ± 4 years, mass = 177 ± 7 cm, weight = 70 ± 7 kg). The RT subset included data
for twenty-one recreationally trained male and female runners (mean + SD: age = 27 ± 7
years, mass = 172 ± 9 cm, weight = 68 ± 11 kg).
7.3.2. Protocols
The GXT and SPXT were as described in the general methodology (see Chapter 3). In the
HT subset, the GXT and SPXT were completed using a 3 % gradient whilst the RT subset
protocols utilised a 1 % gradient. V砦 O2max, V砦 O2 at VT1 (V砦 O2VT1), V砦 O2 at VT2 (V砦 O2VT2), and
HR were calculated as 30 s averages.
7.3.3. Determination of VT1 and VT2
VT1 was primarily defined using the V-Slope method (Beaver et al., 1986), described as
the V砦 O2 that corresponds with the first break-point (V砦 O2VT1) in the V砦 O2 vs. V砦 CO2
relationship. This was then confirmed by at least one of the following criteria: an increase
in V砦 E/ V砦 O2 without a concurrent rise in V砦 E/V砦 CO2; first increase in PETO2 with no
concurrent fall in PETCO2. VT2 was defined as the V砦 O2 that corresponds with the break
point (V砦 O2VT2) in the V砦 E vs. V砦 CO2 relationship (Beaver et al., 1986). This was then
confirmed by at least one of the following secondary criteria: First non-linear increase in
V砦 E/ V砦 CO2 with a continued rise in V砦 E/ V砦 O2; A fall in PETCO2. Secondary criteria had to be
within 3 % of V-Slope to be considered valid. For every data set, a trained researcher
visually analysed the individual graphs to determine VT1 and VT2. A second trained
researcher then confirmed VT1 and VT2 (Gaskill et al., 2001; Esteve-Lanao et al., 2007;
Black et al., 2014). Where there was no agreement within 3 %, that data set was excluded
110
(Gaskill et al., 2001). Participants who did not meet all of the above criteria were excluded
from that particular analysis. For these reasons, data for a particular participant could be
present for VT1, but not VT2, and vice versa.
7.3.4. Statistical analysis
Due to differences in protocol gradient and fitness levels the HT and RT subsets were
analysed separately and not compared. VT1 and VT2 variables were not compared as
different participants were present in each. Data were checked for normality of distribution
using the Shapiro-Wilk statistic. Log transformation was used where the assumption of
normality was violated. To assess differences between protocols for each variable, a paired
samples t-test, or a Wilcoxon signed rank test for not normally distributed data, was
performed. Intra- and inter-rater reliability were assessed using ICC. Cohen’s d were used
to report effect sizes, and statistical significance was accepted when P < 0.05. All
statistical tests were completed using SPSS version 25 (Chicago, IL, USA).
7.4. Results
7.4.1. Determination reliability of VT1 and VT2
Inter-rater reliability for the SPXT for VT1 and VT2 was 1.00 and 0.98. For the GXT for
VT1 and VT2 it was 1.00 and 0.97. Intra-rater reliability for the SPXT for VT1 and VT2
was 0.97 and 1.00. For the GXT for VT1 and VT2 it was 0.99 and 1.00.
.
111
7.4.2. Recreationally trained (RT) subset
7.4.2.1. VT1
Seventeen participants and twenty-four data sets were included for VT1 analysis. There
were no significant differences in V砦 O2max between the GXT and SPXT protocols (t23 = -
.65, P = .52, ES = .04). There were significant differences in the V砦 O2VT1 (t23 = -4.51, P <
.01, ES = .42) and RPE associated with this threshold between protocols (Z = 2.15, P = .03,
ES = .91). There were no significant differences in HRmax between protocols (t19 = -1.85, P
= .08, ES = .40). HR at VT1 was not significantly different between protocols (t20 = -1.58,
P = .16, ES = .30). There were no significant differences in the velocities associated with
VT1 between protocols (Z = -1.91, P = .06, ES = .52) and vRPE20 and Vmax were not
significantly different (t18 = 2.10, P = .05, ES = .30) although % Vmax was significantly
higher than % vRPE20 (t18 = 2.10, P = .02, ES = .99)
7.4.2.2. VT2
Sixteen participants and twenty-two data sets were included for VT2 analysis. There were
no significant differences in V砦 O2max (t21 = -.96, P = .35, ES = .06) and HRmax between the
GXT and SPXT protocols (t18 = -1.74, P = .10, ES = .30). There was a significant
difference in the V砦 O2VT2 between protocols (t21 = -2.35, P = .03, ES = .20), although no
differences when calculated as % V砦 O2max (t21 = -1.95, P = .06, ES = .60). HR at VT2 was
significantly different between protocols (t16 = -2.85, P = .01, ES = .50). There were no
significant differences in the velocities (t21 = -.20, P = .85, ES = .06) and RPE associated
with VT2 between protocols (Z = -.15, P = .89, ES = .06). vRPE20 and Vmax were not
significantly different (t20 = 2.00, P = .06, ES = .23).
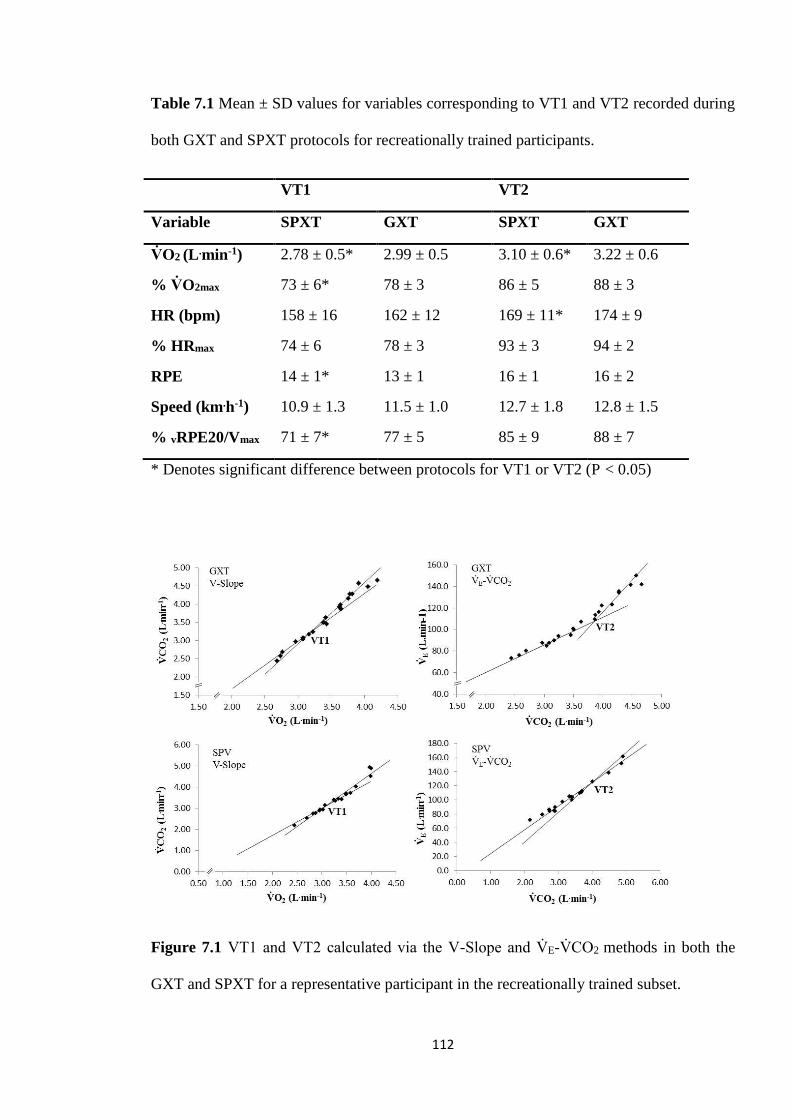
112
Table 7.1 Mean ± SD values for variables corresponding to VT1 and VT2 recorded during
both GXT and SPXT protocols for recreationally trained participants.
VT1 VT2
Variable SPXT GXT SPXT GXT
V砦 O2 (L .min-1) 2.78 ± 0.5* 2.99 ± 0.5 3.10 ± 0.6* 3.22 ± 0.6
% V砦 O2max 73 ± 6* 78 ± 3 86 ± 5 88 ± 3
HR (bpm) 158 ± 16 162 ± 12 169 ± 11* 174 ± 9
% HRmax 74 ± 6 78 ± 3 93 ± 3 94 ± 2
RPE 14 ± 1* 13 ± 1 16 ± 1 16 ± 2
Speed (km.h-1) 10.9 ± 1.3 11.5 ± 1.0 12.7 ± 1.8 12.8 ± 1.5
% vRPE20/Vmax 71 ± 7* 77 ± 5 85 ± 9 88 ± 7
* Denotes significant difference between protocols for VT1 or VT2 (P < 0.05)
Figure 7.1 VT1 and VT2 calculated via the V-Slope and V砦 E-V砦 CO2 methods in both the
GXT and SPXT for a representative participant in the recreationally trained subset.
113
7.4.3. Highly trained (HT) subset
7.4.3.1. VT1
Nine participants were included for VT1 analysis. There were no significant differences in
V砦 O2max (t8 = -.74, P = .48, ES = .16) and HRmax between the GXT and SPXT protocols (t8 =
-1.15, P = .29, ES = .21). There were no significant differences in the V砦 O2VT1 (t8 = -1.98, P
= .10, ES = .34). There were no significant differences in the velocities (t5 = -.73, P = .50,
ES = .34), RPE (Z = -1.93, P = .09, ES = .91), and HR associated with VT1 (t6 = -1.26, P =
.26, ES = .43). vRPE20 and Vmax were not significantly different (Z = -.14, P = 1.00, ES =
.07).
7.4.3.2. VT2
Eleven participants were included for VT2 analysis. There were no significant differences
in V砦 O2max (t10 = -.43, P = .68, ES = .05) and HRmax between the GXT and SPXT protocols
(t9 = -.08, P = .94, ES = .10). There were no significant differences in the V砦 O2VT2 (t10 = -
1.75, P = .11, ES = .15). There were no significant differences in the velocities (t5 = .35, P
= .74, ES = .20), RPE (Z = -.67, P = .57, ES = .4) and HR associated with VT2 between
protocols (t7 = -1.99, P = .09, ES = .69). vRPE20 and Vmax were not significantly different
(Z = -.67, P = .63, ES = .23).
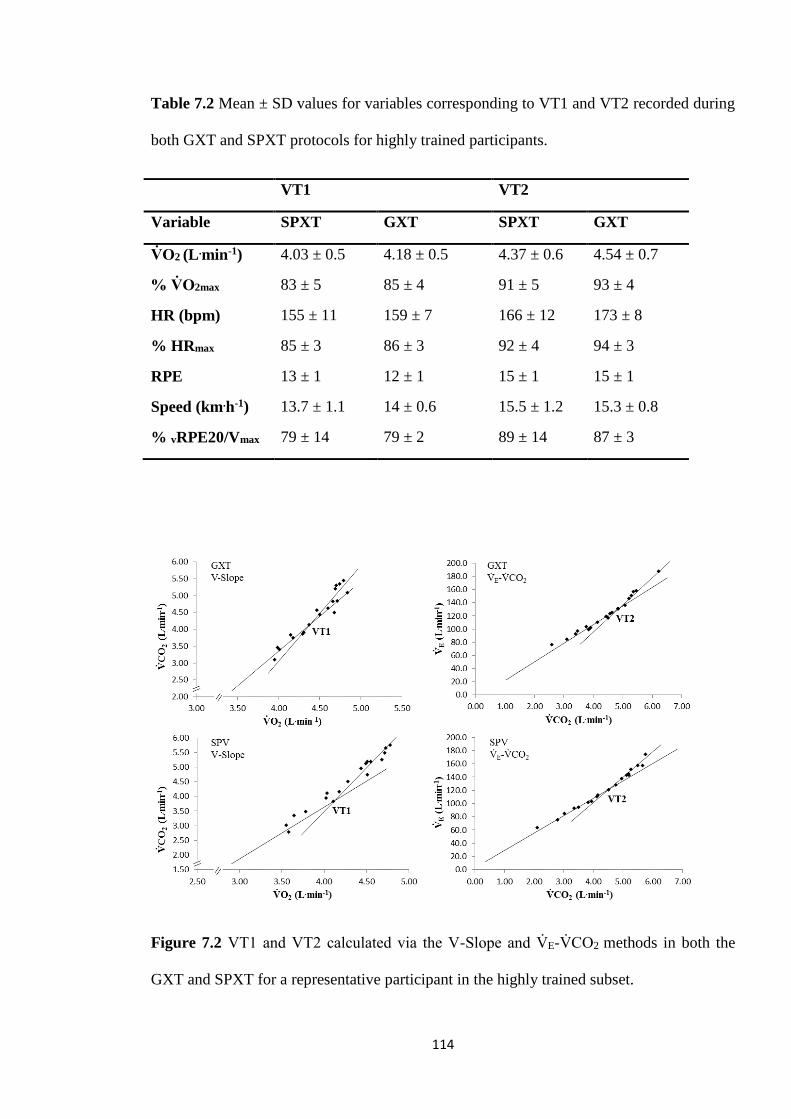
114
Table 7.2 Mean ± SD values for variables corresponding to VT1 and VT2 recorded during
both GXT and SPXT protocols for highly trained participants.
VT1 VT2
Variable SPXT GXT SPXT GXT
V砦 O2 (L .min-1) 4.03 ± 0.5 4.18 ± 0.5 4.37 ± 0.6 4.54 ± 0.7
% V砦 O2max 83 ± 5 85 ± 4 91 ± 5 93 ± 4
HR (bpm) 155 ± 11 159 ± 7 166 ± 12 173 ± 8
% HRmax 85 ± 3 86 ± 3 92 ± 4 94 ± 3
RPE 13 ± 1 12 ± 1 15 ± 1 15 ± 1
Speed (km.h-1) 13.7 ± 1.1 14 ± 0.6 15.5 ± 1.2 15.3 ± 0.8
% vRPE20/Vmax 79 ± 14 79 ± 2 89 ± 14 87 ± 3
Figure 7.2 VT1 and VT2 calculated via the V-Slope and V砦 E-V砦 CO2 methods in both the
GXT and SPXT for a representative participant in the highly trained subset.

115
7.5. Discussion
This is the first known study to investigate the use of the SPXT in identifying VT in both
highly and recreationally trained runners. The main findings of this Chapter are that in
highly trained runners, VT1 and VT2 calculated via the SPXT are similar to ventilatory
thresholds calculated via the GXT. In recreationally trained runners, VT1 was lower in the
SPXT compared to the GXT when calculated as either V砦 O2 or RPE but was similar
between protocols when calculated as a velocity or HR. In recreationally trained runners
VT2 was lower in the SPXT when calculated as V砦 O2 and HR, but similar as a velocity and
RPE. These findings suggest the ventilatory thresholds calculated via the SPXT are
comparable to the GXT.
In highly trained runners VT2 has been reported at ~88-90 % V砦 O2max (Esteve-Lanao et al.
2007; Rabadán et al., 2011) which is similar to the current findings (91 vs. 93 % in the
SPXT and GXT, respectively). However, the finding that VT1 was between 83-85 %
V砦 O2max is similar but higher than previous research where VT was observed at 77 % in
highly trained runners (Rabadán et al., 2011), although it should be noted that athletes
recruited by Rabadán et al (2011) were of a slightly lower fitness level [in relation to
V砦 O2max] compared to the current study. The observance of a higher VT1 may be linked to
the specific training of the participants in the current study, however this was not
investigated. Additionally, the use of 3 % gradient in the protocol for highly trained
runners may have had an effect on VT as it has been shown that VT may be protocol
dependent (Kang et al., 2001) although this warrants further investigation. In recreationally
trained runners VT2 has been reported at 84 % V砦 O2max (Bergstrom et al., 2013) which is in
116
line with the current findings (86 vs. 88 % in the SPXT and GXT, respectively). VT1 in the
recreationally trained runners was the only occasion where both the V砦 O2VT1 and VT1 as a
% V砦 O2max differed significantly between protocols. However, VT1 for both the SPXT and
GXT were still similar to past research (McClave et al., 2011).
It has previously been suggested that a disadvantage of the SPXT is its inability to provide
useful information on VT due to the requirement of a constant increase in work rate for its
correct determination (Straub et al., 2014). However, there is no consensus [or gold
standard] that protocols for VT determination must adhere to strict guidelines apart from
the fact that most previous research has utilised STEP or RAMP protocols. Whilst Straub
et al (2014) did not test their assumption, recently, multiple studies have demonstrated that
the SPXT, in both cycling and running, can calculate VT (Jenkins et al., 2017a; Truong et
al., 2017; Beltz et al., 2018). Whilst the two studies that have calculated VT via a running-
based SPXT have used either a semi-automated treadmill, or untrained participants, the
current study is the first to calculate VT via a SPXT in recreationally and highly trained
runners using a motorised treadmill. Whilst the major concern of Straub et al was that the
SPXT utilises variable speed [or work rate], it has previously been demonstrated in
Chapter 4 (see Figure 4.2) that, although work-rate in the SPXT is not strictly linear, it still
tends to form a step-like pattern as seen in a corresponding STEP-based GXT.
Interestingly, in recreationally trained runners, for VT1, despite most key variables being
significantly higher in the GXT, RPE was instead significantly lower [compared to the
SPXT]. Speculatively, it is possible that the higher reported RPE in the SPXT, despite the
seemingly reduced physiological stress, may have been due to these recreationally trained
117
participants not being as accustomed with effort production trials and thus potentially over-
estimated RPE in the initial stages. It should be noted that similar findings were reported in
the HT group, although not of significance. These findings support the anecdotal findings
of Straub et al (2014) who suggested that participants potentially perceived the SPXT as
more physically demanding than the GXT, which may be linked to a ‘need to think’ in the
SPXT compared to the GXT. In recent research by Hanson and Buckworth (2015),
participants completed two running trials where one had a known end point and the other
trial’s end point was unknown to the participant. They reported that whilst the
physiological variables between trials were the same, the known end point trial was
completed significantly quicker than the unknown trial. The authors contributed this to
teleoanticipation and suggested that during the unknown end-time trial, participants
conserved their metabolic energy because they did not want to fatigue before the end of the
trial. It is possible that this was similar for the recreational participants in the current study.
Unlike Hanson and Buckworth (2015), end time in the SPXT [in this study] was known.
However, because of the nature of the SPXT, it is possible that participants may have
inadvertently constructed an exercise template with the known end point (10 min) in mind,
and so ran more conservatively in the earlier stages to conserve energy for the final stage
(which they were aware required an effort of RPE20) whilst still reporting a higher RPE.
A consistent finding of the current study was the differences in RPE associated with VT1
and VT2 between protocols in both the HT and RT groups. In RT, RPE at VT1 was lower
in the GXT compared to the SPXT (13 vs. 14, respectively) and was the same (RPE 16) in
both the GXT and SPXT for VT2. Similarly, in HT, RPE was again lower in the GXT
compared to the SPXT (12 vs. 13) and the same for VT2 (RPE 15), however only RPE at
VT1 in the RT was significantly different. The finding that the highly trained runners
118
found both VT1 and VT2 less perceptually challenging despite both VT occurring at
higher intensities compared to the RT can be reasonably explained by their greater
experience and training status. The finding that for both groups VT1 occurred at RPE 12-
14 is in line with prior research (Hill et al., 1987).
A limitation of the current Chapter is the relatively small sample size of highly trained
participants. Whilst VT data for a total of eleven highly trained runners were collected -
which is comparable to past research (Black et al., 2014; Gordon et al., 2017; Truong et al.,
2017) - issues with data collection meant the sample size of variables such as velocity at
VT were relatively small. However, this relatively small sample size is predominately as a
result of the strict criteria adhered to in regards to VT identification. Data from a total of
forty-eight unique participants, and seventy-five data sets were initially analysed, with data
from thirty-three participants meeting the criteria for VT1 and/or VT2. In line with prior
literature (Gaskill et al., 2001; Cannon et al., 2009), data was rejected if it was deemed to
have not met the criteria by either investigator. Interestingly however, in recent studies
regarding the identification of VT in the SPXT (Jenkins et al., 2017a; Truong et al., 2017;
Beltz et al., 2018), such criteria was not used, or specified, which raises questions
regarding the validity of past findings and the robustness of methods used to identify VT.
Whilst the sample size of highly trained participants was relatively small, due to the strict
criteria used it can be reasoned that the findings regarding VT were representative and
accurately judged.
119
7.6. Conclusion
Whilst the SPXT has previously been shown to be a valid protocol for V砦 O2max
measurement and provides useful information for training prescription, this required
further investigation so it could be determined to what extent the SPXT could offer
valuable information that could already be provided via the GXT. This study demonstrated
that the SPXT results in measurements of VT1 and VT2 in highly trained runners that are
highly comparable to those derived from the GXT. These findings are also similar in
recreationally trained runners, however there seems to be greater disparity in the
calculation of VT1 in the SPXT for this population which may be due to inexperience of
pacing on behalf of these runners, compared to their highly trained counterparts. These
findings are important as they show the greater utility of the SPXT which is important for
athletes and coaches who may want a more time economical alternative to the GXT whilst
still obtaining the same outcome regarding data.

120
Chapter 8: General Discussion
121
8.1. General discussion
This thesis aimed to investigate the suitability of the SPXT as an alternative to the GXT in
assessing cardiorespiratory fitness and prescribing endurance training and monitoring
fitness parameters. Despite the long history of GXT, the issue of the practicality and real
world application of these protocols was only seriously raised a decade ago by Noakes
(2008) who highlighted the ‘foreign’ nature of the GXT in regards to how athletes actually
exercise and compete. The SPXT, with its closed loop design and lack of a requirement of
a set starting intensity, and the ability to self-regulate pace and intensity, may offer athletes
and coaches an attractive alternative to traditional methods that simultaneously offers
similar physiological data and parameters that can be used for training prescription.
The core underlying theme of SPXT-related research has been its validity in assessing
V砦 O2max and how this has compared to ‘gold standard’ methods: the GXT. Whilst many
research groups have investigated this, a criticism has been the perceived lack of
consistency and uniformity between studies (Beltz et al., 2016; Hutchinson et al., 2017).
This is predominately due to the methodologies used (Chidnok et al., 2013; Straub et al.,
2014; Scheadler & Devor, 2015; Hanson et al., 2016; Truong et al., 2017) varying
significantly from the original cycling and running protocols proposed (Mauger &
Sculthorpe, 2012; Mauger et al., 2013a). Whereas the ‘original’ SPXT consisted of 5 x 2
min stage with RPE increments of 11, 13, 15, 17, and 20, various studies have altered this
to include 1 min stages, customised stage durations and even the number of stages
completed. This thesis aimed to standardise this and produce a collection of studies that
consistently investigated the SPXT as it was originally defined. The major finding of this is

122
that in all the experimental Chapters there were no differences in V砦 O2max between the
standard speed-based SPXT and the corresponding GXT. In Chapter 4, a gradient-based
SPXT produced significantly higher V砦 O2max than both the GXT and the speed-based SPXT
however it is likely those differences were due to a greater recruitment of muscle mass
driving up V砦 O2 (Sloniger et al., 1997), as a result of the combination of gradient and high
speeds.
Excluding the Chapters in this thesis, thirteen original investigations on the SPXT have
been published, with five of those finding higher V砦 O2max in the SPXT (Mauger &
Sculthorpe 2012; Mauger et al., 2013a; Astorino et al., 2015; Jenkins et al., 2017; Jenkins
et al., 2017a), and another study finding the SPXT to be lower than the GXT (Scheadler &
Devor, 2015). The other seven have found no significant differences between the two
protocols. It is worth clarifying that of those five, four were in cycling, and three of those
four were in untrained or clinical populations. The remaining study was completed in
untrained men (Mauger et al. 2013a), but included major methodological limitations that
have been previously discussed both in this thesis and elsewhere (Chidnok et al., 2013;
Eston et al., 2014; Poole, 2014). All of the Chapters in this thesis were completed using
running based SPXT protocols, and either recreationally trained, or highly trained men and
women. Whilst it is possible that physiological differences in lesser trained individuals, or
how individuals of different training status’ approach the SPXT, may contribute to the
differences in V砦 O2max reported in those studies, the same cannot be said for participants of
a higher training status as that has not been seen in this thesis or in other similar
publications.

123
The finding of this thesis that no significant differences in V砦 O2max exist between the two
protocols may be inferred as a lacklustre finding, but the opposite is actually true, and it is
important to consider all research published on the SPXT to fully appreciate this. As
previously discussed, only five studies have found the V砦 O2 in the SPXT to produce higher
V砦 O2max, and all of these studies either specifically used lesser trained individuals, or had
substantial methodological considerations. The same can be said for the one study that
found the SPXT to produce significantly lower V砦 O2max (Scheadler & Devor, 2015). Whilst
an incredibly novel study at the time, and an important one in the development of SPXT
research, methodological issues regarding the differences in gradient between the GXT and
SPXT (discussed further in section 2.5.4) potentially explain why V砦 O2max was lower in the
SPXT. As discussed in the literature review (section 2.2), methodological decisions and
considerations can impact the likelihood of an individual achieving a true V砦 O2max, whether
that is regarding the test duration (protocols that fall outside the recommended 8-12 min
window), the use of speed or gradient, or the increments of work-rate chosen (Whipp et al.,
1981; Davis et al., 1982; Astorino et al., 2004; Yoon et al., 2007; Midgley et al., 2008).
This could arguably be applied to the comparison of the SPXT and GXT - whilst the SPXT
rarely produces different V砦 O2max to the GXT, when the protocols are appropriately
matched, a practitioner could be confident that the SPXT will almost always produce the
same or higher V砦 O2max.
To attempt to provide some clarity as to why the SPXT has sometimes produced higher
V砦 O2max than the GXT, most studies have also looked at the differences in other key
physiological variables [such as V砦 Emax, HRmax, and RERmax] . Throughout this thesis,
differences in these key physiological variables have been investigated. There have been
no significant differences between the two protocols for HRmax or V砦 Emax in any of the
124
experimental Chapters, with only the gradient-based SPXT reporting a significantly higher
V砦 Emax than both the GXT and SPXT in Chapter 4. Whilst these differences have been more
commonly reported in cycling related SPXT studies (Astorino et al., 2015; Jenkins,
Mauger & Hopker., 2017a) most literature related to similarly trained runners have found
no differences (Hanson et al., 2016; Truong et al., 2017; Beltz et al., 2018). V砦 Emax has
previously been reported to be significantly higher during the SPXT (Faulkner et al., 2015;
Jenkins et al., 2017). Indeed, the differences in V砦 Emax in the gradient-based SPXT, the
higher [but not significantly so] V砦 Emax during the speed based SPXT, and the finding of a
significantly greater oxygen cost of breathing in the GXT in Chapter 4 led to the
investigation of this mechanism in Chapter 5. However, no differences in V砦 Emax were then
subsequently found in Chapter 5. Whilst several studies have investigated the mechanistic
underpinnings of V砦 O2max in the SPXT, and differences in estimated Q砦 have been found,
even the authors of these findings concede that due to the estimative techniques used, the
accuracy of the results are questionable. Importantly, the one study that has investigated
the mechanistic underpinnings of the SPXT in treadmill running subsequently found no
differences in V砦 O2max or any other key physiological variables (Beltz et al., 2018).
Interestingly, in Chapters 5 and 6, RERmax was significantly higher during the SPXT
compared to the GXT, which has been previously reported (Scheadler & Devor, 2015;
Jenkins et al., 2017a). It is possible that this higher RER could be as a result of the higher
peak work-rates achieved during the SPXT, thus resulting in a greater anaerobic
contribution, thus driving up RER (Scheadler & Devor, 2015; Jenkins et al., 2017a).
Across the four experimental Chapters in this thesis, no consistent findings of significantly
different physiological variables were reported and so it can be reasonably suggested that,
when completed in line with standard recommendation (fixing intensity to the required
125
RPE and producing a maximal effort at RPE20), there are not any consistently significant
differences between the protocols for key variables such as V砦 Emax, HRmax, and RERmax.
As discussed in the literature review (see section 2.2), there has been much debate
regarding the ideal test duration when the primary goal is V砦 O2max achievement. As
previously highlighted, differences in test duration are not necessarily an automatic sign of
an invalid test, and in most cases this is not the case. The issue with slightly longer
durations is more down to the lack of additional useful information they offer, as opposed
to discrepancies in V砦 O2max, which is only usually an issue when the duration is
significantly longer than the upper suggested duration of the test (i.e. 12 min) (Buchfuhrer
et al., 1983; Yoon et al., 2007). In this thesis, test duration was significantly longer in
Chapter 6, but not in 4 and 5. It is important to note that [as previously stated] no
differences in V砦 O2max between protocols in any of these Chapters exist. Issues about test
duration have previously been highlighted regarding the findings of Mauger and
Sculthorpe (2012). However in that study the protocol duration of the GXT was 13 ± 3 min
[compared to 10 min in the SPXT] which is greater than the 11 ± 1 min reported in this
thesis (Chapters 4 and 6). However, even then, the differences in V砦 O2max they reported are
more likely related to the significant increase in PO achieved [in the SPXT]. One of the
main complainants of this difference in protocol duration (Eston et al., 2014) then authored
an SPXT study which also included significantly different test durations, but they
conceded that this difference was not likely significant. What these differences in protocol
duration do highlight though, is the difficulty in estimating the starting speed of the GXT,
especially if the participant or athlete is not well-known to the tester. This has previously
been highlighted as a key fault of the GXT and an advantage of the SPXT (Poole & Jones,
2017). Not only can incorrectly choosing the wrong starting speed potentially compromise
126
the data collected from the test, but it can also be inconvenient for laboratories that run on
tight testing schedules.
A point that has been consistently stressed throughout this thesis is the necessity to move
the conversation away from V砦 O2max assessment and more towards the practical
implications and advantages of the SPXT compared to the GXT. A recurring theme of this
thesis has been the running velocities obtained in the GXT and SPXT – Vmax and vRPE20,
respectively. Whilst peak velocities were compared in Chapter 4, Chapter 5 introduced
vRPE20 and this was reported to be similar to the Vmax, which is a well-researched and
accepted parameter in both research and training prescription, obtained from the GXT.
This was then similarly reported in Chapter 6. A key finding of this thesis was that vRPE20
could be successfully used to prescribe interval training for recreational athletes in a
similar way to Vmax in the GXT. In the prescription of training using Vmax and vV砦 O2max, a
common method is to utilise Tmax, which requires an additional test and therefore may be
more inconvenient for the athlete. However, Chapter 6 showed that the same training
benefits could be reached by prescribing training via vRPE20 with set interval durations of
2 min. This means that not only is the SPXT 10 min long with no need to estimate starting
speed, but no additional test is required afterwards to assign interval training duration. This
makes the use of the SPXT valid for not only V砦 O2max assessment, but also makes training
prescription potentially a much more streamlined time efficient process. This may be
useful for athletes and coaches who want to assess fitness and prescribe training with
minimal disruption to training.
127
8.2. General limitations
Prior to this thesis, only one study had investigated the use of the SPXT in treadmill
running and in that study a non-motorised treadmill was used (Mauger et al., 2013a). This
was criticised as it resulted in different treadmills being used for the SPXT and GXT
(Eston et al., 2014; Poole, 2014). As such, it was important for this thesis to establish a
method of self-pacing that could be carried out on a motorised treadmill. Whilst several
studies have utilised sonar rang finders to transform motorised treadmills into ‘sem-
automatic’ treadmills that may better allow for self-pacing (Scheadler et al., 2015; Truong
et al., 2017), these are neither readily available or the technology currently sophisticated
enough. Previous literature has relied on participants using buttons on the treadmill to
adjust their speed throughout the SPXT (Faulkner et al., 2015; Beltz et al., 2018) however
it was speculated this may rely too heavily on the participant making manual decisions
which also required additional physical movements. This in turn may disrupt the
participant’s running pattern and rhythm. As such, a zonal system was selected which
simply requires the participants to move between marked zones to signal to the tester that
they want to change speed, which may be more natural and fluid then buttons. A
cornerstone of the SPXT is that it is a self-pacing-centric and participant-driven protocol
and it is this factor that makes it attractive over the GXT. The method used in this thesis
then, to artificially create self-pacing may then be seen as a limitation and it is recognized
that self-pacing can never be genuinely reproduced on a motorized treadmill. However, it
is contended that the findings throughout the experimental Chapters of this thesis put
forward a strong argument that self-pacing can be adequately achieved on a motorised
treadmill. This is best reflected by the end-spurt, which is considered a key component of
real-life exercise and competition, regularly being achieved during the SPXT.
128
Chapter 5 focused on the mechanistic underpinnings of the SPXT, specifically the oxygen
cost of breathing during both the GXT and SPXT. This was based on the findings of
Chapter 4, where V砦 E was significantly different between the gradient-based SPXT and the
GXT. A limitation of this thesis was the decision to compare the oxygen cost of breathing
of the speed-based SPXT with the GXT, and not the gradient-based SPXT. The speed-
based SPXT was selected for Chapter 5 due to it having greater ‘real-world relevance’ than
the gradient-based SPXT, due to it being speed-based and thus easier to administer than
also utilising gradient. Whilst V砦 E was not significantly different in the speed-based SPXT
in Chapter 4, estimated oxygen cost of breathing was still significantly different to the
GXT which meant its selection was justified, however it cannot be known if the gradient
based SPXT would have produced a significantly different outcome in Chapter 5 as it was
not used and so this is a limitation of the current design. During the ventilation trials,
participants were only asked to match a specific V砦 E. Originally participants were also
required to match specific breathing frequencies but this was deemed too difficult for
participants to achieve, especially at higher V砦 E rates. Whilst participants did not have
difficulties matching the required V砦 E at lower rates, the difficulties participants experienced
at higher rates mean it is difficult to categorically say there were no differences in the
oxygen cost of breathing.
Chapter 6 represented an important shift in the direction of SPXT-based research as this
was the first investigation to focus more on the wider utility of the SPXT beyond V砦 O2max
measurement. Whilst the Chapter is certainly novel, a perceived limitation of this Chapter
could be the lack of a control group, however as the main aim of the Chapter was to
compare between the two methods of training this was not deemed essential. Comparing
between the different methods; training via the SPXT-derived parameters, and the
129
established method of prescribing training via GXT-derived parameters, was the central
aim over investigating absolute improvements in cardiorespiratory fitness in individuals.
This model has previously been utilized in the literature (Manoel et al., 2017).
Furthermore, a control group, in addition to the two existing groups, would represent a
significant challenge regarding participant recruitment, particularly due to the necessity for
participants to commit to six weeks of training and a further 4 weeks of laboratory testing.
8.3. Future directions
Whilst the findings of this thesis add to the growing body of literature regarding the SPXT
and its application, there are clearly areas that warrant further research and consideration.
Currently, only one study has investigated the use of a field-based SPXT (Lim et al.,
2016). The advantage of a field-based SPXT is that it may be more sport-specific for
athletes compared to laboratory based protocols. A field-based SPXT would also allow for
genuine self-pacing that, as discussed, is difficult to achieve in a laboratory on a treadmill.
Lim et al (2016) reported that V砦 O2max directly measured in the field-based SPXT was
comparable to a laboratory based SPXT. However, this still requires expensive portable
gas analysers. As such, the progression of this would then be to investigate whether the
field SPXT and its variables offer strong predictive qualities for V砦 O2max, in a similar
capacity to established protocols such as the University of Montreal track test and 20 m
multi-stage shuttle run test. This would then allow coaches and athletes to conduct a
running specific field protocol that potentially accurately predicts V砦 O2max and gives
valuable data that can then be used to prescribe effective training for improvements in
130
V砦 O2max, critical speed, and LT/VT thresholds [the training effects which have already been
demonstrated (see Chapter 6)].
Throughout this thesis it was important to not only demonstrate that a ‘true’ V砦 O2max had
been attained during the GXT, but that stringent criteria were in place to ensure this was
the case and that it had been thoroughly considered. As previously discussed, much has
been made of V砦 O2max criteria, ranging from a visible V砦 O2 plateau, to verification stages and
secondary criteria. However, similar widely recognised criteria are not considered for
V砦 O2max assessment in the SPXT, especially the detection of a plateau, which is largely
down to the variation of work-rate making this unachievable. If the SPXT is to be used
more widely by both athletes and coaches, and researchers, then the use of criteria to
confirm V砦 O2max in the SPXT is paramount and should be further investigated.
8.4. Conclusion
The overall aim of this thesis was to investigate the utility of the SPXT as an alternative to
the GXT in highly trained and recreationally trained runners. Each of the experimental
Chapters aimed to support this overall aim. The main findings of this thesis are that the
SPXT is a valid protocol for assessing parameters of cardiorespiratory fitness, such as
V砦 O2max and VT, in both highly and recreationally trained runners. Whilst it is not suggested
that the SPXT is a superior protocol to the GXT, it can be concluded that it is an attractive
alternative to the GXT, depending on the specific needs of the athletes and coaches.
131
Ultimately, the SPXT offers a more efficient design in regards to test duration whilst still
offering largely the same information as the GXT, but also with the added benefit of a
near-identical field variation of the protocol that may be more beneficial for athletes
looking to replicate their actual sporting and exercise performance. Research related to the
SPXT is still young and so further investigation is recommended to uncover the full
potential of the protocol and its application for athletes, coaches, and practitioners.

132
References
133
Aandstad, A., Holme, I., Bernsten, S., & Anderssen, S. A. (2011). Validity and reliability
of the 20 meter shuttle run test in military personnel. Military Medicine, 176, 513–
518.
Aaron, E.A., Seow, K.C., Johnson, B.D., & Dempsey, J.A. (1992). Oxygen cost of exercise
hyperpnea: implications for performance. (1992). Journal of Applied Physiology, 72,
1818–1825.
Albouaini, K., Egred, M., Alahmar, A., & Wright, D.J. (2007). Cardiopulmonary exercise
testing and its application. Postgraduate Medical Journal, 83, 675–682.
Anderson, S.D., Argyros, G.J., Magnussen, H., Holzer, K. (2001). Provocation by eucapnic
voluntary hyperpnoea to identify exercise induced bronchoconstriction. British
Journal of Sports Medicine, 35, 344-347.
Anholm, J.D., Johnson, R.L., & Ramanathan, M. (1987). Changes in cardiac output during
sustained maximal ventilation in humans. Journal of Applied Physiology, 63, 181–7.
Astorino, T.A., Robergs, R.A., Ghiasvand, F., Marks, D., & Burnes, S. (2000). Incidence
of the oxygen plateau at VO2max during exercise testing to volitional fatigue. Journal
of Exercise Physiology Online, 3, 1–12.
Astorino, T.A. (2014). Discussion: The efficacy of the self-paced VO2max test tomeasure
maximal oxygen uptake in treadmill running. Applied Physiology, Nutrition, and
Metabolism, 38, 592–593.
Astorino, T.A., Edmunds, R.M., Clark, A., King, L., Gallant, R.A., Namm, S., et al.
(2017). High-intensity interval training increases cardiac output and VO2max. Medicine
and Science in Sports and Exercise, 49, 265-273.
134
Astorino, T.A., McMillian, D.W., Edmunds, R.M., & Sanchez, E. (2015). Increased
cardiac output elicits higher V砦 O2max in response to self-paced exercise. Applied
Physiology, Nutrition, and Metabolism, 40, 223–229.
Astorino, T.A., Rietschel, J.C., Tam, P.A., Taylor, K., Johnson, S.M., Freedman, T.P., et
al. (2004). Reinvestigation of optimal duration of VO2max test. Journal of Exercise
Physiology Online, 7, 1–10.
Astorino, T.A. & DeRevere, J. (2017). Efficacy of constant load verification testing to
confirm VO2max attainment. Clinical Physiology and Funcyional Imaging (DOI:
10.1111/cpf.12474).
Astorino, T.A. (2009). Alterations in VO2max and the VO2 plateau with manipulation of
sampling interval. Clinical physiology and functional imaging, 29, 60–7.
Astorino, T.A., Willey, J., Kinnahan, J., Larsson, S.M., Welch, H. & Dalleck, L.C. (2005).
Elucidating determinants of the plateau in oxygen consumption at VO2max. British
Journal of sports medicine, 39, 655–60.
Bacon, A.P., Carter, R.E., Ogle, E.A. & Joyner, M.J. (2013). VO2max trainability and high
intensity interval training in humans: a meta-analysis. PLOS one, 8, e73182.
Bailey, S.J., Vanhatalo, A., Dimenna, F.J., Wilkerson, D.P. & Jones, A.M. (2011). Fast-
start strategy improves VO2 kinetics and high-intensity exercise performance.
Medicine and Science in Sports and Exercise, 43, 457–467.
Balady, G.J., Arena, R., Sietsema, K., Myers, J., Coke, L., Fletcher, G.F., et al. (2010).
Clinician’s guide to cardiopulmonary exercise testing in adults: A scientific statement
from the American heart association. Circulation, 122, 191–225.
135
Bassett, D.R. & Howley, E.T. (2000). Limiting factors for maximum oxygen uptake and
determinants of endurance performance. Medicine and science in sports and exercise,
32, 70–84.
Beaver, W.L., Wasserman, K. & Whipp, B.J. (1986). A new method for detecting
anaerobic threshold by gas exchange. Journal of Applied Physiology, 60, 2020–27.
Beltrami, F.G., Wong, D.P. & Noakes, T.D. (2013). High prevalence of false-positive
plateau phenomena during VO2max testing in adolescents. Journal of Science and
Medicine in Sport, 17, 1–18.
Beltz, N.M., Amorim, F.T., Gibson A.L., Janot, J.M., Kravitx, L., Mermier, C.M., et al.
(2018). Hemodynamic and metabolic responses to self-paced and ramp graded
exercise testing protocols. Applied Physiology, Nutrition, and Metabolism (DOI:
10.1139/apnm-2017-0608).
Beltz, N.M., Gibson, A.L., Janot, J.M., Kravitz, L., Mermier, C.M. & Dalleck, L.C. (2016).
Graded exercise testing protocols for the determination of VO2max: Historical
perspectives, progress, and future considerations. Journal of Sports Medicine (DOI:
10.1155/2016/3968393).
Beneke, R., Leithäuser, R.M. & Ochentel, O. (2011). Blood lactate diagnostics in exercise
testing and training. International Journal of Sports Physiology and Performance, 6,
8–24.
Bergh, U., Ekblom, B. & Astrand, P-O. (2000). Maximal oxygen uptake “classical” versus
“Contemporary” viewpoints. Medicine & Science in Sports & Exercise, 32, 85–88.
Bergstrom, H.C., Housh T.J., Zuniga, J.M., Traylor, D.A., Camic, C.L., Lewis, R.W. Jr., et
al. (2013). The relationships among critical power determined from a 3-min all-out
136
test, respiratory compensation point, gas exchange threshold, and ventilatory
threshold. Research Quarterly for Exercise and Sport, 84, 232–238.
Bertuzzi, R., Lima-Silva, A.E., Pires, F.O., Damasceno, M.V., Bueno, S., Pasqua, L.A., et
al. (2014). Pacing strategy determinants during a 10-km running time trial. Journal of
Strength and Conditioning Research, 28, 1688–1696.
Billat, V.L., Slawinski, J., Bocquet, V., Demarle, A., Lafitte, L., Chassaing, P., et al.
(2000). Intermittent runs at the velocity associated with maximal oxygen uptake
enables subjects to remain at maximal oxygen uptake for a longer time than intense
but submaximal runs. European Journal of Applied Physiology, 81, 188–196.
Billat, V.L., Blondel, N. & Berthoin, S. (1999). Determination of the velocity associated
with the longest time to exhaustion at maximal oxygen uptake. European Journal of
Applied Physiology and Occupational Physiology, 80, 159–161.
Billat, V.L. & Koralsztein, J-P. (1996). Significance of the velocity at VO2max and time to
exhaustion at this velocity. Sports Medicine, 22, 90–108.
Binder, R.K., Wonisch, M., Corra, U., Cohen-Solal, A., Vanhees, L., Saner, H., et al.
(2008). Methodological approach to the first and second lactate threshold in
incremental cardiopulmonary exercise testing. European Journal of Cardiovascular
Prevention & Rehabilitation, 15, 726–734.
Black, M.I., Durant, J., Jones, A.M., Vanhatalo, A. (2014). Critical power derived from a
3-min all-out test predicts 16.1-km road time-trial performance. European Journal of
Sport Science, 14, 217–23.
Bland, J.M. & Altman, D.G. (1986). Statistical methods for assessing agreement between
two methods of clinical measurement. Lancet, I, 307-310.
137
Borg, G. (1990). Psychophysical scaling with applications in physical work and the
perception of exertion. Scandinavian Journal of Work, Environment and Health, 16,
55–58.
Borg, G. (1982). Psychophysical bases of perceived exertion. Medicine & Science in
Sports & Exercise, 14, 377–381.
Bosquet, L., Léger, L. & Legros, P. (2002). Methods to determine aerobic endurance.
Sports Medicine, 32, 675–700.
Brink-Elfegoun, T., Kaijser, L., Gustafsson, T. & Ekblom, B. (2007). Maximal oxygen
uptake is not limited by a central nervous system governor. Journal of Applied
Physiology, 102, 781–6.
Buchfuhrer, M.J., Hansen, J.E., Robinson, T.E., Sue, D.Y., Wasserman, K., Whipp, B.J.
(1983). Optimizing the exercise protocol for cardiopulmonary assessment. Journal of
Applied Physiology, Respiration, and Environmental Exercise Physiology, 55, 1558–
1564.
Buchheit, M. & Laursen, P.B. (2013). High-intensity interval training, solutions to the
programming puzzle: Part II: Anaerobic energy, neuromuscular load and practical
applications. Sports Medicine, 43, 927–954.
Burgomaster, K.A., Howarth, K. R., Phillips, S.M., Rakobowchuk, M., MacDonald, M.J.,
McGee, S.L., et al. (2008). Similar metabolic adaptations during exercise after low
volume sprint interval and traditional endurance training in humans. Journal of
Physiology, 586, 151–60.
Cannon, D.T., Kolkhorst, F.W. & Buono, M.J. (2009). On the determination of ventilatory
threshold and respiratory compensation point via respiratory frequency. International
138
Journal of Sports Medicine, 30, 157–162.
Ceci, R. & Hassmen, P. (1991). Self-monitored exercise at three different RPE intensities
in treadmill vs field running. Medicine and Science in Sports and Exercise, 23, 732–
738.
Charloux, A., Lonsdorfer-Wolf, E., Richard, R., Lampert, E., Oswald-Mammosser, M.,
Mettauer, B., et al. (2000). A new impedance cardiograph device for the non-invasive
evaluation of cardiac output at rest and during exercise鳥: comparison with the "direct
Fick" method. European Jounal of Applied Physiology, 82, 313–320.
Chidnok, W., DiMenna, F.J., Bailey, S.J., Burnley, M., Wilkerson, D.P., Vanhatalo, A., et
al. (2013). VO2max is not altered by self-pacing during incremental exercise. European
Journal of Applied Physiology, 113, 529–39.
Clark, I.E., West, B.M., Reynolds, S.K., Murray, S.R., Pettitt, R.W. (2013). Applying the
critical velocity model for an off-season interval training program. Journal of Strength
and Conditioning Research, 27, 3335–3341.
Dalleck, L.C., Astorino, T.A., Erikson, R.M., McCarthy, C.M., Beadell, A.A., Botten, B.H.
(2012). Suitability of verification testing to confirm attainment of VO2max in middle-
aged and older adults. Research in Sports Medicine, 20, 118–128.
Dantas, J.L., Doria, C., Rossi, H., Rosa, G., Pietrangelo, T., Fano-Illic, G., et al. (2015).
Determination of blood lactate training zone boundaries with rating of perceived
exertion in runners. Journal of Strength and Conditioning Research, 29, 315–320.
Davies, R.C., Rowlands, A. V. & Eston, R.G. (2007). The prediction of maximal oxygen
uptake from submaximal ratings of perceived exertion elicited during the multistage
fitness test. British Journal of Sports Medicine, 42, 1006–1010.
139
Davis, J.A., Whipp, B.J., Lamarra, N., Huntsman, D.J., Frank, M.H. & Wasserman, K.
(1982). Effect of ramp slope on determination of aerobic parameters from the ramp
exercise test.pdf. Medicine & Science in Sports & Exercise, 14, 339–343.
Day, J.R., Rossiter, H.B., Coats, E.M., Skasick, A. & Whipp, B.J. (2003). The maximally
attainable V砦 O2 during exercise in humans: the peak vs. maximum issue. Journal of
Applied Physiology, 95, 1901–1907.
Denadai, B.S., Ortiz, M.J., Greco, C.G. & de Mello, M.T. (2006). Interval training at 95%
and 100% of the velocity at VO2max: effects on aerobic physiological indexes and
running performance. Journal of Applied Physiology, Nutrition, and Metabolism, 31,
737–743.
Edvardsen, E., Hem, E. & Anderssen, S.A. (2014). End criteria for reaching maximal
oxygen uptake must be strict and adjusted to sex and age: A cross-sectional study.
PLOS ONE, 9, 18–20.
Ekblom, B., Astrand, P-O, Saltin, B., Stenberg, J. & Wallstrom, B. (1968). Effect of
training on cardiovascular response to exercise in women. Journal of Applied
Physiology, 39, 891–895.
Esfarjani, F. & Laursen, P.B. (2007). Manipulating high-intensity interval training: Effects
on over VO2max, the lactate threshold and 3000m running performance in moderately
trained males. Journal of Science and Medicine in Sport, 10, 27–35.
Esteve-Lanao, J., Foster, C., Seiler, S. & Lucia, A. (2007). Impact of training intensity
distribution on performance in endurance athletes. Journal of Strength and
Conditioning Research, 21, 943–9.
Eston, R., Evans, H., Faulkner, J., Lambrick, D., Al-Rahamneh, H. & Parfitt, G. (2012). A
140
perceptually regulated, graded exercise test predicts peak oxygen uptake during
treadmill exercise in active and sedentary participants. European Journal of Applied
Physiology, 112, 3459–3468.
Eston, R.G., Lambrick, D., Sheppard, K. & Parfitt, G. (2008). Prediction of maximal
oxygen uptake in sedentary males from a perceptually regulated, sub-maximal graded
exercise test. Journal of Sports Sciences, 26, 131–9.
Eston, R.G. (2012). Use of ratings of perceived exertion in sports. International Journal of
Sports Physiology and Performance, 7, 175–82.
Eston, R.G., Crockett, A. & Jones, A.M. (2014). Discussion of “The efficacy of the self-
paced VO2max text to measure maximal oxygen uptake in treadmill running.” Applied
Physiology, Nutrition, andMetabolism, 39, 1–3.
Eston, R.G., Lamb, K.L., Parfitt, G. & King, N. (2005). The validity of predicting maximal
oxygen uptake from a perceptually-regulated graded exercise test. European Journal
of Applied Physiology, 94, 221–7.
Eston, R.G., Faulkner, J. A., Mason, E. A. & Parfitt, G. (2006). The validity of predicting
maximal oxygen uptake from perceptually regulated graded exercise tests of different
durations. European Journal of Applied Physiology, 97, 535–41.
Eston, R.G. & Thompson, M. (1997). Use of ratings of perceived exertion for predicting
maximal work rate and prescribing exercise intensity in patients taking atenolol.
British Journal of Sports Medicine, 31, 114–9.
Evans, H., Parfitt, G. & Eston, R. (2014). Use of a perceptually-regulated test to measure
maximal oxygen uptake is valid and feels better. European Journal of Sport Science,
14, 452-8.
141
Faude, O., Kindermann, W. & Meyer, T. (2009). Lactate threshold concepts: How valid
are they? Sports Medicine, 39, 469–490.
Faulkner, J., Mauger, A.R., Wooley, Brandon. & Lambrick, D. (2015). The efficacy of a
self-paced VO2max test during motorized treadmill exercise. International Journal of
Sport Physiology and Performance, 10, 99–105.
Faulkner, J. & Eston, R. (2007). Overall and peripheral ratings of perceived exertion
during a graded exercise test to volitional exhaustion in individuals of high and low
fitness. European Journal of Applied Physiology, 101, 613–20.
Faulkner, J., Parfitt, G. & Eston, R. (2007). Prediction of maximal oxygen uptake from the
ratings of perceived exertion and heart rate during a perceptually-regulated sub-
maximal exercise test in active and sedentary participants. European Journal of
Applied Physiology, 101, 397–407.
Ferretti, G. (2014). Maximal oxygen consumption in healthy humans: theories and facts.
European Journal of Applied Physiology, 114, 2007–2036.
Franch, J., Madsen, K., Djurhuus, M.S. & Pedersen, P.K. (1998). Improved running
economy following intensified training correlates with reduced ventilatory demands.
Journal of Medicine and Science in Sports and Exercise, 30, 1250-1256.
Froelicher, V.F., Brammell, H., Davis, G., Noguera, I., Stewart, A. & Lancaster, M.C.
(1974). A Comparison of the Reproducibility and Physiologic Response to Three
Maximal Treadmill Exercise Protocols. CHEST, 65, 512-17.
Gaesser, G.A. & Poole, D.C. (1996). The slow component of oxygen uptake kinetics in
humans. Exercise and Sport Sciences Reviews, 24, 35–71.
142
García-Pinillos, F., Soto-Hermoso, V.M. & Latorre-Román, P.A. (2017). How does high-
intensity intermittent training affect recreational endurance runners? Acute and
chronic adaptations: A systematic review. Journal of Sport and Health Science, 6, 54-
67.
Gaskill, S.E., Ruby, B.C., Walker, A.J., Sanchez, O.A., Serfass, R.C. & Leon, A.S. (2001).
Validity and reliability of combining three methods to determine ventilatory
threshold. Medicine and Science in Sports and Sxercise, 33, 1841–48.
Gordon, D., Wood, M., Porter, A., Vetrivel, V., Gernigon, M., Caddy, O., et al. (2014).
Influence of blood donation on the incidence of plateau at VO2max. European Journal
of Applied Physiology, 114, 21–27.
Gordon, D., Mehter, M., Gernigon, M., Caddy, O., Keiller, D. & Barnes, R. (2012). The
effects of exercise modality on the incidence of plateau at VO2max. Clinical
Physiology and Functional Imaging, 32, 394–399.
Gordon, D., Gernigon, M., Baker, J., Merzbachh, V. & Scruton, A. (2017). The effects of
non-contingent feedback on the incidence of plateau at VO2max. Journal of Sports
Science and Medicine, 16, 105–111.
Gordon, D., Scruton, A., Barnes, R., Baker, J., Prado, L. & Merzbach, V. (2017a). The
effects of menstrual cycle phase on the incidence of plateau at V砦 O2max and associated
cardiorespiratory dynamics. Clinical Physiology and Functional Imaging (DOI:
10.1111/cpf.12469).
Gormley, S.E., Swain, D.P., High, R., Spina, R.J., Dowling, E.A., Kotipalli, U.S., et al.
(2008). Effect of intensity of aerobic training on VO2max. Medicine and Science in
Sports and Exercise, 40, 1336–1343.
143
Green, J.M., Mclester, J.R., Crews, T.R., Wickwire, P.J., Pritchett, R.C. & Lomax, R.G.
(2006). RPE association with lactate and heart rate during high-intensity interval
cycling. Medicine and Science in Sports and Exercise, 38, 167–172.
Hall, M.M., Rajasekaran, S., Thomsen, T.W. & Peterson, A.R. (2016). Lactate: friend or
foe. Physical Medicine and Rehabilitation, 8, S8–S15.
Hanon, C., Leveque, J-M., Thomas, C. & Vivier, L. (2008). Pacing strategy and VO2
kinetics during a 1500-m race. International Journal of Sports Medicine, 29, 206–11.
Hanson, N.J., Scheadler, C.M., Taylor, L.L., Neuenfeldt, N.C., Michael, T.J. & Miller,
M.G. (2016). Modality determines VO2max achieved in self-paced exercise tests:
validation with the bruce protocol. European Journal of Applied Physiology, 116,
1313–1319.
Hanson, N.J., Reid, C.R., Conrwell, K.M., Taylor, L.L. & Scheadler, C.M. (2017). Pacing
strategy during the final stage of a self-paced VO2max (SPXT) test does not affect
maximal oxygen uptake. European Journal of Applied Physiology, 116, 1807-1815.
Hanson, N.J. & Buckworth, J. (2015). The effect of endpoint knowledge on perceived
exertion, affect, and attentional focus during self-paced running. Journal of Strength
and Conditioning Research, 29, 934–941.
Harms, C.A., Wetter, T.J., McClaran, S.R., Pegelow, D.F., Nickele, G.A., Nelson, W.B.,
et al. (1998). Effects of respiratory muscle work on cardiac output and its distribution
during maximal exercise. Journal of Applied Physiology, 85, 609–618.
Harms, C.A., Babcock, M.A., McClaran, S.R., Pegelow, D.F., Nickele, G.A., Nelson,
W.B., et al. (1997). Respiratory muscle work compromises leg blood flow during
maximal exercise. Journal of Applied Physiology, 82, 1573–1583.

144
Hawkins, M.N., Raven, P.R., Snell, P.G., Stray-Gundersen, J. & Levine, B.D. (2007).
Maximal oxygen uptake as a parametric measure of cardiorespiratory capacity.
Medicine and Science in Sports and Exercise, 39, 103–107.
Helgerud, J., Hoydal, K., Wang, E., Karlsen, T., Berg, P., Bjerkaas, M., et al., (2007).
Aerobic high-intensity intervals improve V砦 O2max more than moderate training.
Medicine and Science in Sports and Exercise, 39, 665–671.
Hill, A.V, Long, C.N.H. & Lupton, H. (1924). Muscular exercise, lactic acid, and the
supply and utilisation of oxygen - parts I-III. Proceedings of the Royal Society of
London, 96, 438-475.
Hill, A.V, Long, C.N.H. & Lupton, H. (1924a) Muscular exercise, lactic acid and the
supply and utilisation of oxygen - parts VII - VIII. Proceedings of the Royal Society of
London, 97, 155–176.
Hill, D.W., Cureton, K.J., Grisham, C. & Collins, M.A. (1987). Effect of training on the
rating of perceived exertion at the ventilatory threshold. European Journal of Applied
Physiology and Occupational Physiology, 56, 206–211.
Hopker, J.G., Coleman, D.A., Wiles, J.D. & Galbraith, A. (2009). Familiarisation and
reliability of sprint test indices during laboratory and field assessment. Journal of
Sport Sciences & Medicine, 8, 528–532.
Hopker, J.G., Jobson, S.A. & Pandit, J.J. (2011). Controversies in the physiological basis
of the “anaerobic threshold” and their implications for clinical cardiopulmonary
exercise testing. Anaesthesia, 66, 111–123.
Howley, E.T., Bassett, D.R. & Welch, H. (1995). Criteria for VO2max: review and
commentary. Medicine and Science in Sports and Exercise, 27, 1292-301.
145
Hutchinson, M.J., Paulson, T.A.W., Eston, R. & Goosey-Tolfrey, V.L. (2017). Assessment
of peak oxygen uptake during handcycling: test-retest reliability and comparison of a
ramp-incremented and perceptually-regulated exercise test. PLOS ONE, 12, 1–14.
Jenkins, L.A., Mauger, A.R., Fisher, J. & Hopker, J.G. (2017). Reliability and validity of a
self-paced cardiopulmonary exercise test in post-MI patients. International Journal of
Sports Medicine, 38, 1–7.
Jenkins, L.A., Mauger, A.R. & Hopker, J.G. (2017a). Age differences in physiological
responses to self-paced and incremental V砦 O2max testing. European Journal of Applied
Physiology, 117, 159-170.
Jenkins, L.A., Mauger, A.R. & Hopker, J.G. (2017b). Evaluation of risk in research must
be judged on evidence, not personal opinion. International Journal of Sports
Medicine, 38, 646–647.
Jones, A.M. & Carter, H. (2000). The effect of endurance training on parameters of aerobic
fitness. Sports Medicine, 29, 373–86.
Kang, J., Chaloupka, E.C., Mastrangelo, A.M., Biren, G.B. & Roberston, R.J. (2001).
Physiological comparisons among three maximal treadmill exercise protocols in
trained and untrained individuals. European Journal of Applied Physiology, 84, 291–
295.
Kang, J., Chaloupka, E.C., Biren, G.B., Mastrangelo, M.A. & Hoffman, J.R. (2009).
Regulating intensity using perceived exertion: effect of exercise duration. European
Journal of Applied Physiology, 105, 445–451.
Kirkeberg, J.M., Dalleck, L.C., Kamphoff, C.S. & Pettitt, R.W. (2011). Validity of 3
protocols for verifying VO2max. International Journal of Sports Medicine, 32, 266–
146
270.
Kuipers, H., Rietjens, G., Verstappen, F., Schoenmakers, H. & Hofman, G. (2003). Effects
of stage duration in incremental running tests on physiological variables.
International Journal of Sports Medicine, 24, 486–491.
Lamb, K.L. & Rogers, L. (2007). A re-appraisal of the reliability of the 20 m multi-stage
shuttle run test. European Journal of Applied Physiology, 100, 287–292.
Lambrick, D.M., Faulkner, J.A., Rowlands, A.V. & Eston, R.G. (2009). Prediction of
maximal oxygen uptake from submaximal ratings of perceived exertion and heart rate
during a continuous exercise test: the efficacy of RPE 13. European Journal of
Applied Physiology, 107, 1–9.
Lander, P.J., Butterly, R.J. & Edwards, A.M. (2009). Self-paced exercise is less physically
challenging than enforced constant pace exercise of the same intensity: influence of
complex central metabolic control. British Journal of Sports Medicine, 43, 789–95.
Laursen, P.B. & Jenkins, D.G. (2002). The scientific basis for high-intensity interval
training: optimising training programmes and maximising performance in highly
trained endurance athletes. Sports Medicine, 32, 53–73.
Levine, B.D. (2008). VO2max: what do we know, and what do we still need to know?
Journal of Physiology, 5861, 25–34.
Lim, W., Lambrick, d., Mauger, A.R., Woolley, B. & Faulkner, J. (2016). The effect of
trial familiarisation on the validity and reproducibility of a field-based self-paced
VO2max test. Biology of Sport, 33, 269–75.
Lucia, A., Rivero, J-L. L., Perez, M., Serrano, A.L., Calbet, J.A.L., Santalla, A., et al.
147
(2001). VO2 kinetics at high power outputs during a ramp exercise protocol. Medicine
& Science in Sports & Exercise, 34, 326-31.
Lundby, C., Montero, D. & Joyner, M. (2017). Biology of VO2max: looking under the
physiology lamp. Acta Physiologica, 220, 218–228.
Machado, F.A., Kravchychyn, A.C.P., Peserico, C.S., Silva, da D.F. & Mezzaroba, P.V.
(2013). Incremental test design, peak “aerobic” running speed and endurance
performance in runners. Journal of Science and Medicine in Sport, 16, 577–582.
Madrid, B., Pires, F.O., Prestes, J., Vieira, D.C.L., Clark, T., Tiozzo, E., et al. (2016).
Estimation of the maximal lactate steady state intensity by the rating of perceived
exertion. Perceptual and Motor Skills, 122, 136–149.
Mann, T., Lamberts, R.P. & Lambert, M.I. (2013). Methods of prescribing relative exercise
intensity: Physiological and practical considerations. Sports Medicine, 43, 613–625.
Manoel, F. de A., Silva da, D.F., Lima de, J.R.P. & Machado, F.A. (2017). Peak velocity
and its time limit are as good as the velocity associated with VO2max for training
prescription in runners. Sports Medicine International Open, 1, 8–15.
Maturana, F.M., Keir, D.A., Mclay, K.M. & Murias, J.M. (2017). Critical power testing or
self-selected cycling: which one is the best predictor of maximal metabolic steady-
state? Journal of Science and Medicine in Sport, 20, 795–799.
Mauger, A.R., (2013). VO2max is altered by self-pacing during incremental exercise.
European Journal of Applied Physiology, 113, 541–2.
Mauger, A.R., Metcalfe, A.J., Taylor, L. & Castle, P.C. (2013). Reply to “Discussion: the
efficacy of the self-paced V砦 O2max test to measure maximal oxygen uptake in treadmill
148
running.” Applied physiology, nutrition, and metabolism, 38, 1211–6.
Mauger, A.R., Metcalfe, A.J., Taylor, L. & Castle, P.C. (2013a). The efficacy of the self-
paced V砦 O2max test to measure maximal oxygen uptake in treadmill running. Applied
Physiology, Nutrition, and Metabolism, 38, 1211–1216.
Mauger, A.R. & Sculthorpe, N. (2012). A new VOmax protocol allowing self-pacing in
maximal incremental exercise. British Journal of Sports Medicine, 46, 59–63.
McClave, S.A., LeBlanc, M. & Hawkins, S.A. (2011). Sustainability of critical power
determined by a 3-minute all-out test in elite cyclists. Journal of Strength and
Conditioning Research, 25, 3093–3098.
McCole, S.D., Davis, A.M. & Fueger, P.T. (2001). Is there a disassociation of maximal
oxygen consumption and maximal cardiac output? Medicine and Science in Sports
and Exercise, 33, 1265–9.
McKelvie, R.S. & Jones, N.L. (1989). Cardiopulmonary exercise testing. Clinics in Shest
Medicine, 10, 277–291.
McLaughlin, J.E., Howley, E.T., Bassett, D.R.Jr., Thompson, D.L. & Fitzhugh, E.C.
(2010). Test of the classic model for predicting endurance running performance.
Medicine and Science in Sports and Exercise, 42, 991–7.
McNicol, A.J., O'Brien, B.J., Paton, C.D. & Knez, W.L. (2009). The effects of increased
absolute training intensity on adaptations to endurance exercise training. Journal of
Science and Medicine in Sport, 12, 485–489.
McNulty, C.R. & Robergs, R.A. (2017). New methods for processing and quantifying VO2
kinetics to steady state: VO2 onset kinetics. Frontiers in Physiology, 8, 1–8.
149
Mermier, C.M. (2013). The effects of a harness safety system during maximal treadmill
run testing in collegiate middle and long distance runners. Journal of Strength and
Conditioning Research, 27, 2934-2938.
Merry, K.L., Glaister, M., Howatson, G. & Someren, K.V. (2016). The exercise intensity at
maximal oxygen uptake (iVO2max ): Methodological issues and repeatability.
European Journal of Sport Science, 8, 1–7.
Midgley, A.W., Bentley, D.J., Luttikholt, H., McNaughton, L.R. & Millet, G.P. (2008).
Challenging a dogma of does an incremental exercise test for valid VO2max
determination really need to last between 8 and 12 minutes? Sports Medicine, 38,
441–447.
Midgley, A.W. & Carroll, S. (2009). Emergence of the verification phase procedure for
confirming true VO2max. Scandinavian Journal of Medicine and Science in Sports, 44,
1–31.
Midgley, A.W., Carroll, S., Marchant, D., McNaughton, L.R. & Siegler, J. (2009)
Evaluation of true maximal oxygen uptake based on a novel set of standardized
criteria. Applied Physiology, Nutrition, Metabolism, 34, 115–23.
Midgley, A.W., Mcnaughton, L.R. & Carroll, S. (2006). Verification phase as a useful tool
in the determination of the maximal oxygen uptake of distance runners. Applied
Physiology, Nutrition, and Metabolism, 31, 541–548.
Midgley, A.W., McNaughton, L.R. & Jones, A.M. (2007). Training to enhance the
physiological determinants of long-distance running performance: can valid
recommendations be given to runners and coaches based on current scientific
knowledge? Sports Medicine, 37, 857–80.
150
Midgley, A.W., McNaughton, L.R., Polman, R. & Marchant, D. (2007a). Criteria for
determination of maximal oxygen uptake: A brief critique and recommendations for
future research. Sports Medicine, 37, 1019–1028.
Midgley, A.W., Mcnaughton, L.R. & Wilkinson, M. (2006a). Is there an optimal training
intensity for enhancing the maximal oxygen uptake of distance runners? physiological
rationale and practical recommendations. Sports Medicine, 36, 117–132.
Milani, R. V. (2004). Cardiopulmonary exercise testing: how do we differentiate the cause
of dyspnea? Circulation, 110, 27–31.
Montero, D., Diaz-Cañestro, C. & Lundby, C. (2015). Endurance eraining and VO2max: role
of maximal cardiac output and oxygen extraction. Medicine and Science in Sports and
Exercise, 47, 2024-2033.
Mora, R., Ortega, J.F. & Pallare, G. (2016). Validity and Reliability of Ventilatory and
Blood Lactate Thresholds in Well-Trained Cyclists. PLOS One, 11, 1–16.
Morán-navarro, R., Mora-Rodriguez, R., Rodfriguez-Rielves, V., Fuente-Perez, P.De la. &
Pallares, J.G. (2016). Heart rate reserve at ventilatory thresholds, maximal lactate
steady state and maximal aerobic power in well-trained cyclists: training application.
European Journal of Human Movement, 36, 150–162.
Mortensen, S.P., Dawson, E.A., Yoshiga, C.C., Dalsgaard, M.K., Damsgaard, R., Secher,
N.H., et al. (2005). Limitations to systemic and locomotor limb muscle oxygen
delivery and uptake during maximal exercise in humans. The Journal of Physiology,
5661, 273–85.
Murias, J.M., Pogliaghi, S. & Paterson, D.H. (2018). Measurement of a true VO2maxduring
a ramp incremental test is not confirmed by a verification phase. Frontiers in
151
Physiology (DOI: 10.3389/fphys.2018.00143).
Myers, J., Walsh, D., Sullivan, M. & Froelicher, V. (1990). Effect of sampling on
variability and plateau in oxygen uptake. Journal of Applied Physiology, 68, 404–10.
Ní Chéilleachair, N.J., Harrison, A.J. & Warrington, G.D. (2017). HIIT enhances
endurance performance and aerobic characteristics more than high-volume training in
trained rowers. Journal of Sports Sciences, 35, 1052-1058.
Nicolò, A., Bazzucchi, I., Haxhi, J., Felici, F. & Sacchetti, M. (2014). Comparing
continuous and intermittent exercise: an “isoeffort” and “isotime” approach. PLOS
ONE (DOI: 10.1371/journal.pone.0094990)
Nicolò, A., Marcora, S.M. & Sacchetti, M. (2016). Respiratory frequency is strongly
associated with perceived exertion during time trials of different duration. Journal of
Sports Sciences, 34, 1199–1206.
Noakes, T.D. (2008). Testing for maximum oxygen consumption has produced a brainless
model of human exercise performance. British Journal of Sports Medicine, 42, 551–5.
Noakes, T.D., Myburgh, K.H. & Schall, R. (1990). Peak treadmill running velocity during
the VO2max test predicts running performance. Journal of Sports Sciences, 8, 35–45.
Nolan, P.B., Beaven, M.L. & Dalleck, L. (2014). Comparison of intensities and rest
periods for VO2max verification testing procedures. International Journal of Sports
Medicine, 35, 1024–1029.
Noonan, V. & Dean, E. (2000). Submaximal exercise testing: clinical application and
interpretation. Physical Therapy, 80, 782–807.
Norton, K.I., Squires, B., Norton, L.H., Craig, N.P., McGrath, P. & Olds, T.S. (1995).
152
Exercise stimulus increases ventilation from maximal to supramaximal intensity.
European Journal of Applied Physiology and Occupational Physiology, 70, 115–125.
O’Brien, B.J., Wibskov, J., Knez, W.L., Paton, C.D. & Harvey, J.T. (2008). The effects of
interval-exercise duration and intensity on oxygen consumption during treadmill
running. Journal of Science and Medicine in Sport, 11, 287–290.
Overend, T.J., Paterson, D.H. & Cunningham, D.A. (1992). The effect of interval and
continuous training on the aerobic parameters. Canadian Journal of Sport Sciences,
17, 129–134.
Pageaux, B. (2016). Perception of effort in exercise science: definition, measurement and
perspectives. European Journal of Sport Science, 16, 885–894.
Peinado, A.B., Pessoa, F.D.M., Diaz, V., Benito, P.J., Alvarez-Sanchez, M., Zapico, A.G.,
et al. (2016). The midpoint between ventilatory thresholds approaches maximal
lactate steady state intensity in amateur cyclists. Biology of Sport, 33, 373–380.
Riebe, L.S., Ehrman, J.K., Liguori, G. & Magal, M. (2018). ACSM’s Guidelines for
exercise Testing and Prescription 10th Edn., Wolters Kluwer, Philadelphia.
Pfeiffer, K., Pivarnik, J.M., Womack, C.J., Reeves, M.J. & Malina, R.M. (2002).
Reliability and validity of the borg and OMNI rating of perceived exertion scales in
adolescent girls. Medicine and Science in Sports and Exercise, 34, 2057–2061.
Plato, P.A., McNulty, M., Crunk, S.M. & Tug Ergun, A. (2008). Predicting lactate
threshold using ventilatory threshold. International Journal of Sports Medicine, 29,
732–737.
Pollock, M.L., Bohannon, R.L., Cooper, K.H., Ayres, J.J., Ward, A., White, S.R., et al.
153
(1976). A comparative analysis of four protocols for maximal treadmill stress testing.
American Heart Journal, 92, 39–46.
Poole, D. (2014). Discussion: “The efficacy of the self-paced VO2max test to measure
maximal oxygen uptake in treadmill running.” Journal of Applied Physiology,
Nutrition, and Metabolism, 39, 586–588.
Poole, D.C. & Jones, A.M. (2017). Measurement of the maximum oxygen uptake V砦 o2max:
V砦 o2peak is no longer acceptable. Journal of Applied Physiology, 122, 997–1002.
Poole, D.C., Wilkerson, D.P. & Jones, A.M. (2008). Validity of criteria for establishing
maximal O2 uptake during ramp exercise tests. European Journal of Applied
Physiology, 102, 403–10.
Rabadán, M., Diaz, V., Calderon, F.J., Benito, P.J., Peinado, A.B. & Maffulli, N. (2011).
Physiological determinants of speciality of elite middle- and long-distance runners.
Journal of Sports Sciences, 29, 975–82.
Ramsbottom, R., Brewer, J. & Williams, C. (1988). A progressive shuttle run test to
estimate maximal oxygen uptake. British Journal of Sports Medicine, 22, 141–144.
Robergs, R.A., Dwyer, D. & Astorino, T. (2010). Recommendations for improved data
processing from expired gas analysis indirect calorimetry recommendations for
improved data processing from expired gas analysis indirect calorimetry. Sports
Medicine, 40,95–111.
Robergs, R.A. (2001). An exercise physiologist’s “contemporary” interpretations of the
“Ugle and creaking edifices” of the VO2max concept. Journal of Exercise Physiology
Online, 4, 1–44.
154
Rossiter, H.B., Kowalchuk, J.M. & Whipp, B.J. (2006). A test to establish maximum O2
uptake despite no plateau in the O2 uptake response to ramp incremental exercise.
Journal of Applied Physiology, 100, 764–770.
Saltin, B. (2005). Point: In health and in normoxic enviroment, VO2max is limited primarily
by cardiac output and locomotor muscl blood flow. Journal of Applied Physiology,
100, 744-748.
Schaun, G.V. (2017). The maximal oxygen uptake verification phase: a light at the end of
the tunnel? Sports Medicine Open (DOI: 10.1186/s40798-017-0112-1).
Scheadler, C.M. & Devor, S.T. (2015). VO2max measured with a self-selected work Rate
protocol on an automated treadmill. Medicine and Science in Sports and Exercise, 47,
2158–2165.
Scherr, J., Wolfarth, B., Christle, J.W., Pressler, A., Wagenpheil, S. & Halle, M.(2013).
Associations between Borg’s rating of perceived exertion and physiological measures
of exercise intensity. European Journal of Applied Physiology, 113, 147–155.
Sedgeman, D., Dalleck, L., Clark, I.E., Jamnick, N. & Pettitt, R.W. (2013). Analysis of
square-wave bouts to verify VO2max. International Journal of Sports Medicine, 34,
1058–1062.
Seiler, K.S. & Sjursen, J.E. (2002). Effect of work bout duration on physiological and
perceptual responses during self-paced interval training. Medicine & Science in Sports
& Exercise, 14, 318-325.
Seiler, S. (2010). What is best practice for training intensity and duration distribution in
endurance athletes? International Journal of Sports Physiology and Performance, 5,
276–291.
155
Seiler, S. & Hetlelid, K.J. (2005). The impact of rest duration on work intensity and RPE
during interval training. Medicine and Science in Sports and Exercise, 37, 1601–1607.
Selig, S.E., Borg, G.A.V., Runciman, W., Gerche, A. La., Davison, K., Coquart, J., et al.
(2017). Safety Concerns regarding article: reliability and validity of a self-paced
cardiopulmonary exercise test in post-MI patients. L.A. Jenkins, A. Mauger, J. Fisher,
J. Hopker. Int J Sports Med 2017; 38: 300-306. International Journal of Sports
Medicine, 38, 644–645.
Silva, R., Damasceno, M. & Cruz, R. (2017). Effects of a 4-week high-intensity interval
training on pacing during 5-km running trial. Brazilian Journal of Medicinal and
Biological Research, 50, 1–7.
Slattery, K.M., Wallace, L.K., Murphy, A.J. & Coutts, A.J. (2006). Physiological
determinants of three-kilometer running performance in experienced triathletes.
Journal of Stength and Conditioning Research, 20, 47–52.
Sloniger, M.A., Cureton, K.J., Prior, B.M. & Evans, E.M. (1997). Lower extremity muscle
activation during horizontal and uphill running. Journal of Applied Physiology, 83,
2073–9.
Smith, A.E., Eston, R.G., Norton, B. & Parfitt, G. (2015). A perceptually-regulated
exercise test predicts peak oxygen uptake in older active adults. Journal of Aging and
Physical Activity, 23, 205–211.
Smith, T.P., Coombes, J.S. & Geraghty, D.P. (2003). Optimising high-intensity treadmill
training using the running speed at maximal O(2) uptake and the time for which this
can be maintained. European Journal of Applied Physiology, 89, 337–43.
Smith, T.P., McNAaughton, L.R. & Marshall, K.J. (1999). Effects of 4-wk training using
156
Vmax/Tmax on VO2max and performance in athletes. Medicine & Science in Sports &
Exercise, 31, 892–896.
Spurway, N.C., Ekblom, B., Noakes, T.D. & Wagner, P.D. (2012). What limits VO2max? a
symposium held at the bases conference, 6 September 2010. Journal of Sports
Sciences, 30, 517–31.
StØren, Ø., Helgerud, J., Saebo, M., Stoa, E.M., Bratland-Sanda., Unhjem, R.J., et al.
(2017). The effect of age on the VO2max response to high-intensity interval training.
Medicine and Science in Sports and Exercise, 49, 78–85.
Stratton, E., O'Brien, B.J., Harvey, J., Blitvich, J., McNicol, J., Janissen, D., et al. (2009).
Treadmill velocity best predicts 5000-m run performance. International Journal of
Sports Medicine, 30, 40–45.
Straub, A.M., Midgley, A.W., Zavorsky, G.S. & Hillman, A.R. (2014). Ramp-incremented
and RPE-clamped test protocols elicit similar VO2max values in trained cyclists.
European Journal of Applied Physiology, 114, 1581–1590.
Suehiro, K., Joosten, A. & Murphy, L.S. (2016). Accuracy and precision of minimally-
invasive cardiac output monitoring in children鳥: a systematic review and meta-
analysis. Journal of Clinical Monitoring and Computing, 30, 603–620.
Swain, D.P. & Franklin, B.A. (2002). VO2 reserve and the minimal intensity for improving
Cardiorespiratory Fitness. Medicine and Science in Sports and Exercise, 34, 152–157.
Taylor, H., Buskirk, E. & Henschel, A. (1955). Maximal oxygen uptake as an objective
measure of cardio-respiratory peformance. Journal of Applied Physiology, 8.73–80.
Tordi, N., Mourot, L., Matusheski, B. & Hughson, R.L. (2004). Measurements of cardiac

157
output during constant exercises: comparison of two non-invasive techniques.
International Journal of Sports Medicine, 25, 145-149.
Truong, P., Millet, G.P. & Gojanovic, B. (2017). Perceptually regulated exercise test
allows determination of VO2max and ventilatory threshold but not respiratory
compensation point in trained runners. International Journal of Sports Medicine, 38,
1–10.
Tucker, R., Bester, A., Lambert, E.V., Noakes, T.D., Vaughan, C.L. & Gibson, A St Clair.
(2006). Non-random fluctuations in power output during self-paced exercise. British
Journal of Sports Medicine, 40, 912–917.
Turner, L.A., Tecklenburg-Lund, A.L., Chapman, R.F., Stager, J.M., Wilhite, D.P. &
Mickleborough, T.D. (2012). Inspiratory muscle training lowers the oxygen cost of
voluntary hyperpnea. Journal of Applied Physiology, 112, 127–134.
Vella, C.A., Marks, D. & Robergs, R.A. (2006). Oxygen cost of ventilation during
incremental exercise to VO2max. Respirology, 11, 175–81.
Wagner, P.D. (2000). New ideas on limitations to VO2max. Exercise and Sport Sciences
Reviews, 28, 10-4.
Wang, R., Fukuda, D.H., Stout, J.R., Robinson IV, E.H., Miramonti, A.A., Fragala, M.S.,
et al. (2017). Tracking changes in the upper boundary of the heavy-intensity exercise
domain: end-test power versus respiratory compensation point. Kinesiology, 49, 15–
21.
Weatherwax, R.M., Richardson, T.B., Beltz, N.M., Nolan, PB. & Dalleck, L. (2016).
Verification testing to confirm VO2max in altitude-residing, endurance-trained runners.
International Journal of Sports Medicine, 37, 525–530.
158
Welsman, J., Bywater, K., Farr, C., Welford, D. & Armstrong, N. (2005). Reliability of
peak V砦 O2 and maximal cardiac output assessed using thoracic bioimpedance in
children, European Journal of Applied Physiology, 94, 228-234.
Whipp, B.J., Davis, J. A., Torres, F. & Wasserman, K. (1981). A test to determine
parameters of aerobic function during exercise. Journal of Applied Physiology:
Respiratory, Environmental and Exercise Physiology, 50, 217–21.
Wilhite, D.P., Mickleborough, T.D., Laymon, A.S. & Chapman, R.F. (2013). Increases in
V砦 O2max with “live high-train low” altitude training: role of ventilatory acclimatization.
European Journal of Applied Physiology, 113, 419–426.
Yoon, B.-K., Kravitz, L. & Robergs, R. (2007). VO2max, protocol duration, and the VO2
plateau. Medicine and Science in Sports and Exercise, 39, 1186–92.
Zhang, Y.Y., Johnson II, M.C., Chow, N. & Wasserman, K. (1991). Effect of exercise
testing protocol on parameters of aerobic function. Medicine and Science in Sports
and Exercise, 23, 625–630.