The Total Economic Impact™ Of Microsoft 365 E3
27
A Forrester Total Economic Impact™ Study Commissioned By Microsoft June 2019 The Total Economic Impact ™ Of Microsoft 365 E3 Cost Savings And Business Benefits Enabled By Microsoft 365 E3
-
Upload
khangminh22 -
Category
Documents
-
view
1 -
download
0
Transcript of The Total Economic Impact™ Of Microsoft 365 E3

A Forrester Total Economic Impact™ Study Commissioned By Microsoft June 2019
The Total Economic Impact™ Of Microsoft 365 E3 Cost Savings And Business Benefits Enabled By Microsoft 365 E3

Table Of Contents Executive Summary 1
Key Findings 1 TEI Framework And Methodology 4
The Microsoft 365 E3 Customer Journey 5 Interviewed Organizations 5 Key Challenges 5 Key Results 6 Composite Organization 6
Analysis Of Benefits 8 Improved Collaboration And Communication 8 Reduced User Downtime 10 Improved Security And Compliance 11 Reduction In Help Desk Calls 12 Device Provisioning Time Savings 13 Application Provisioning Savings 14 Technology Infrastructure Cost Avoided 15 Flexibility 16
Analysis Of Costs 18 License Costs 18 Planning, Implementation, And Deployment Costs 18 Training Costs 19
Financial Summary 21 Microsoft 365 E3: Overview 22 Appendix A: Total Economic Impact 24 Appendix B: Endnotes 25
Project Director: Sarah Musto
ABOUT FORRESTER CONSULTING
Forrester Consulting provides independent and objective research-based consulting to help leaders succeed in their organizations. Ranging in scope from a short strategy session to custom projects, Forrester’s Consulting services connect you directly with research analysts who apply expert insight to your specific business challenges. For more information, visit forrester.com/consulting.
© 2019, Forrester Research, Inc. All rights reserved. Unauthorized reproduction is strictly prohibited. Information is based on best available resources. Opinions reflect judgment at the time and are subject to change. Forrester®, Technographics®, Forrester Wave, RoleView, TechRadar, and Total Economic Impact are trademarks of Forrester Research, Inc. All other trademarks are the property of their respective companies. For additional information, go to forrester.com.

1 | The Total Economic Impact™ Of Microsoft 365 E3
Executive Summary Today’s technology end users are increasingly seeking more flexibility to work from anywhere and from any device without sacrificing productivity or security. It’s imperative that organizations prioritize this digital transformation and the accompanying modernization of IT to optimize business outcomes and improve employee satisfaction. IT must focus on providing users with the right tools to work collaboratively and in real time on innovative ideas. This includes supporting an increasingly mobile workforce that uses multiple different devices to be productive. The organization must also balance the needs of IT by leveraging analytics and automation to streamline processes and tools to secure all end user devices, customer information, and corporate IP. Organizations need technology solutions that can take what is in place today, easily update and combine it with innovative cloud solutions, and take a more modern approach to management, identity, and security that meets these new demands.
Microsoft 365 E3, consisting of Windows 10, Office 365 ProPlus, Microsoft Teams, and Enterprise Mobility + Security (EMS), is a complete solution that enables organizations to securely provide the latest collaboration and productivity tools that empower users alongside the modern management features that IT needs to support business goals. The always-up-to-date delivery model ensures users and IT staff have the newest features to increase their efficiency. Device management features provide workers the flexibility to securely access information and applications from any device. The solution also enables IT to leverage analytics and security features to proactively identify and resolve device health and security events, as well as ensure updates don’t negatively impact users through several app compatibility tools. The automation enabled by the cloud delivery model also simplifies IT operations and reduces costs.
Microsoft commissioned Forrester Consulting to conduct a Total Economic Impact™ (TEI) study and examine the potential return on investment (ROI) enterprises may realize by deploying Microsoft 365 E3. The purpose of this study is to provide readers with a framework to evaluate the potential financial impact of a Microsoft 365 investment on their organizations. To better understand the benefits, costs, and risks associated with this investment, Forrester interviewed and surveyed several customers with experience using Microsoft 365.
Key Findings Quantified benefits. The following risk-adjusted present value (PV) quantified benefits are representative of those experienced by the companies interviewed and surveyed:
› Microsoft 365 users save up to 3 hours per week, on average, by Year 3 due to collaboration and communication efficiency. With Microsoft 365, knowledge workers can use the most up-to-date collaboration and communication features on any device, including coauthoring documents, leveraging AI-powered tools, using Microsoft Teams to collaborate remotely, and sharing files easily with OneDrive. Highly mobile users can securely access their applications on their mobile devices, creating up to 2.5 hours per week of additional productivity outside of the office by Year 3.
Key Benefits
End user productivity savings by Year 3, across 5,000 users: 285,000 hours
Reduced risk of a major security breach: 40%
Total cost of ownership (TCO) reduction from reduced help desk calls, provisioning savings, and reduced license, infrastructure, and management costs: $13.1 million
2 | The Total Economic Impact™ Of Microsoft 365 E3
› Improved security, stability, and analytics functionality reduce user downtime events by 25% by Year 3. Improved visibility into the health of the environment, increased threat protection, and access to applications from any device reduce the number of user device downtime events, saving users 2.5 hours per event.
› Microsoft 365’s holistic security features reduce the risk of a breach by 40%. Microsoft’s native security solutions integrate easily and simplify deployment and management, ensuring that data and users are protected from wherever they choose to work. Information protection, security management features, identity and access management, and the simplicity and frequency of updates reduce the number and severity of end user security events and the time it takes to remediate them.
› Self-service functionality and insights that enable proactive IT reduce help desk calls by 25% by Year 3. Self-service functionality like password resets and application provisioning reduce help desk calls, and improved device management enables proactive remediation so that issues don’t impact a large number of users. The ability to quickly access data from any device enables users to be productive while their work devices are being fixed.
› Automated device provisioning saves organizations 4 hours per device. Using Windows Autopilot and EMS to streamline and automate device provisioning helps organizations save 4 hours per device compared to previous imaging processes. Some interviewees noted that Microsoft 365 also enables them to lengthen their hardware refresh windows from three years to four years.
› IT can more efficiently test and deploy applications with Microsoft 365, saving a total of 7,450 hours by Year 3. Desktop Analytics, MSIX, and Desktop App Assure all reduce testing time by identifying and remediating application compatibility issues and repackaging applications to be more supported on Windows. End users can self-provision applications using integrations with several app exchanges, saving expensive calls to the help desk.
› Organizations avoid an average of $11 million in previous solution and management costs by migrating to Microsoft 365. Moving to the cloud reduces license and infrastructure costs. Organizations can leverage built-in capabilities to replace third-party antivirus, mobile device management, collaboration, and communication solutions. Overall simplification and automation reduce the IT administration effort, which previously required four full-time equivalents (FTEs).
Costs. The interviewed and surveyed organizations experienced the following risk-adjusted PV costs:
› Organizations purchase Microsoft 365 E3 subscription licenses. Organizations pay $35 per user per month for the Microsoft 365 E3 license. Subscription license costs begin when licenses are deployed to users during the phased rollout.
› Organizations use both internal staff and professional services for implementation and deployment, and internal staff for ongoing administration. Interviewed and surveyed organizations vary considerably in their implementation and deployment effort. On average, the initial planning, testing, and deployment phase takes 10 months before full deployment to users. Organizations require an average of three FTEs for ongoing administration and management.
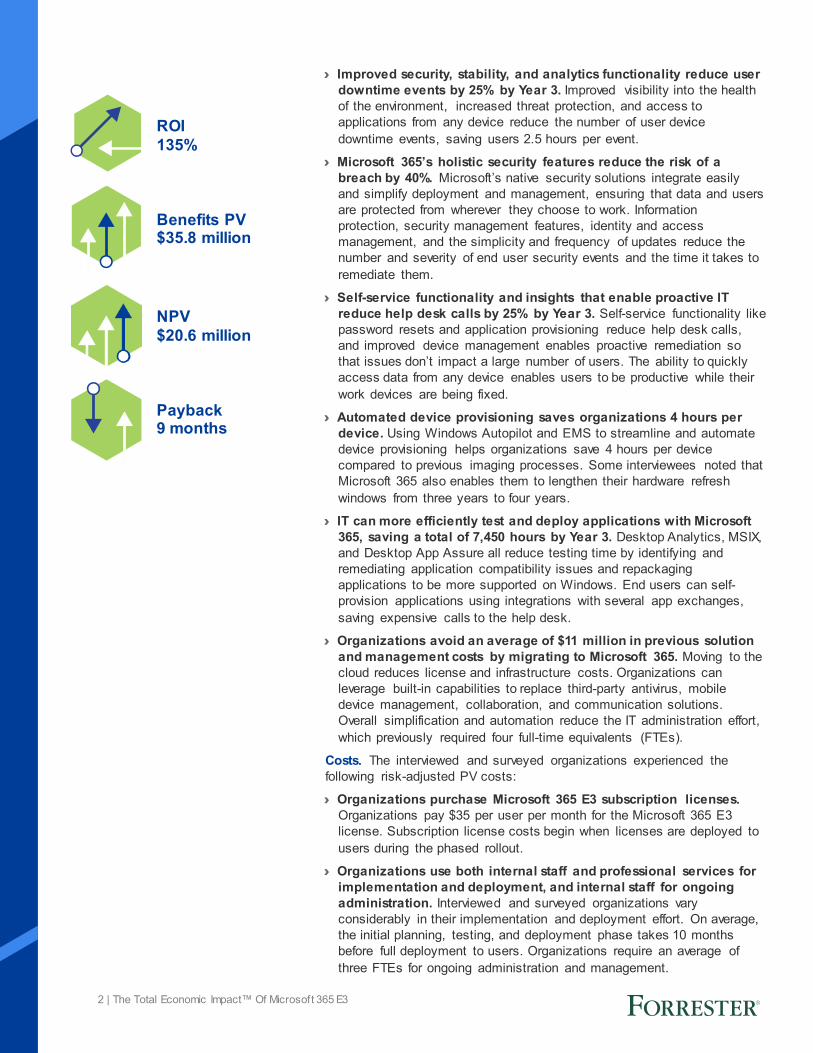
ROI 135%
Benefits PV $35.8 million
NPV $20.6 million
Payback 9 months

3 | The Total Economic Impact™ Of Microsoft 365 E3
› End users and IT staff participate in training. IT FTEs spend five days on upfront training and two days per year on ongoing training to understand new features. End users spend 3 hours on upfront training and 2 hours per year on ongoing training to leverage new features to continuously boost their productivity.
Forrester’s interviews with three and survey of six existing customers found that a representative organization experiences benefits of $35.8 million over three years versus costs of $15.2 million, adding up to a net present value (NPV) of $20.6 million and an ROI of 135%.
Total benefits
PV, $35.8M
Total costs PV, $15.2M
Initial Year 1 Year 2 Year 3
Financial Summary
Payback period:
9 months
Improved end user
productivity, $22.4M
Improved security, $383.6K
Reduced TCO, $13.1M
$35.8 millionthree-year
total benefits PV

4 | The Total Economic Impact™ Of Microsoft 365 E3
TEI Framework And Methodology From the information provided in the interviews, Forrester has constructed a Total Economic Impact™ (TEI) framework for those organizations considering implementing Microsoft 365 E3.
The objective of the framework is to identify the cost, benefit, flexibility, and risk factors that affect the investment decision. Forrester took a multistep approach to evaluate the impact that Microsoft 365 E3 can have on an organization:
DUE DILIGENCE Interviewed Microsoft stakeholders and Forrester analysts to gather data relative to Microsoft 365 E3.
CUSTOMER INTERVIEWS AND SURVEY Interviewed three organizations and surveyed six organizations using Microsoft 365 E3 to obtain data with respect to costs, benefits, and risks.
COMPOSITE ORGANIZATION Designed a composite organization based on characteristics of the interviewed and surveyed organizations.
FINANCIAL MODEL FRAMEWORK Constructed a financial model representative of the interviews and survey using the TEI methodology and risk-adjusted the financial model based on issues and concerns of the interviewed organizations.
CASE STUDY Employed four fundamental elements of TEI in modeling Microsoft 365 E3’s impact: benefits, costs, flexibility, and risks. Given the increasing sophistication that enterprises have regarding ROI analyses related to IT investments, Forrester’s TEI methodology serves to provide a complete picture of the total economic impact of purchase decisions. Please see Appendix A for additional information on the TEI methodology.
The TEI methodology helps companies demonstrate, justify, and realize the tangible value of IT initiatives to both senior management and other key business stakeholders.
DISCLOSURES
Readers should be aware of the following:
This study is commissioned by Microsoft and delivered by Forrester Consulting. It is not meant to be used as a competitive analysis.
Forrester makes no assumptions as to the potential ROI that other organizations will receive. Forrester strongly advises that readers use their own estimates within the framework provided in the report to determine the appropriateness of an investment in Microsoft 365 E3.
Microsoft reviewed and provided feedback to Forrester, but Forrester maintains editorial control over the study and its findings and does not accept changes to the study that contradict Forrester’s findings or obscure the meaning of the study.
Microsoft provided the customer names for the interviews but did not participate in the interviews. A confidential survey link was sent to current Microsoft customers.

5 | The Total Economic Impact™ Of Microsoft 365 E3
The Microsoft 365 E3 Customer Journey BEFORE AND AFTER THE MICROSOFT 365 E3 INVESTMENT
Interviewed Organizations For this study, Forrester conducted three interviews with Microsoft 365 E3 customers and surveyed six additional customers. Interviewed and surveyed customers include the following:
Key Challenges The interviewees and survey respondents shared that common challenges prior to the Microsoft 365 E3 investment included:
› Changing user expectations for their work devices and tools. Employee expectations for their work devices and applications had shifted, increasingly demanding anytime, anywhere, any-device access to their productivity and collaboration tools. Organizations wanted to improve user experience related to device management and downtime, improve user ability to collaborate and communicate with the newest features, and improve user access to information and applications from any device.
› An increasingly complex and out-of-date on-premises environment that required significant cost and time to maintain. On-premises Microsoft and third-party tools increased time spent on ongoing management and capex costs. Rising complexity increased the possibility of user downtime. Several organizations were concerned about end of life for some of their prior products or had a planned upgrade to newer Microsoft products. Organizations wanted a modern IT platform that simplified deployment, provisioning, and management across all devices, shifted spending from capex to opex, reduced IT costs by consolidating on one platform, and reduced IT costs by migrating to the cloud.
› Responding to more frequent and sophisticated security risks. Interviewed and surveyed organizations wanted unified, intelligent security solutions to defend against, identify, and quickly remediate security breaches. Major security breaches provided significant disruption to employees and could be very costly for businesses, both in remediation and in lost business or customer trust. Third-party tools created additional complexity in management and increased costs.
SOURCE INDUSTRY REGION INTERVIEWEE
Interview Mining Headquartered in Australia Cloud solutions specialist
Interview Financial services Headquartered in the United States
Endpoint operating system and collaboration manager; End user experience delivery
Interview Professional services Headquartered in the United Kingdom
Senior director for messaging, collaboration, and mobility
Survey High-tech, retail, transportation, financial services, and healthcare
Respondents based in the United States
One senior finance leader, three director-level in IT, and two manager-level in IT
“For me, the updates were one of the pain points I had before because there were so many dependencies. So applications started failing and the machines — the complaints got out of whack and we had a lot of problems.” Cloud solutions specialist, mining company
“Previously, we had Office 2010, and pockets of 2013 and 2016. And it was highly unmanaged. So, with this standardized approach, cloud subscription, the major and minor updates will be standard across the environment.” Senior director for messaging, collaboration, and mobility, professional services company

6 | The Total Economic Impact™ Of Microsoft 365 E3
Key Results The interviews and survey revealed that key results from the Microsoft 365 E3 investment include: › Improved access to and use of the most current collaboration and
communication features, resulting in incremental productivity. Microsoft 365 provides end users with productivity tools, like coauthoring with Office 365 ProPlus, online meetings with Microsoft Teams, and file storage and sharing with OneDrive, that are always up to date with the newest features. End users have the flexibility to securely access their applications and work on mobile devices. IT can provide self-service access for password resets, application provisioning, and recovery from ransomware and malware to improve the user experience and reduce lost productivity from help desk interactions.
› A modernized IT environment and IT processes, reducing IT effort and costs. Organizations can shift from capex to opex by migrating their Microsoft environments to the cloud. Organizations save on license costs, infrastructure purchases, and deployment complexity by standardizing on the Microsoft platform and replacing third-party tools. Microsoft 365 is easy to manage and deploy through cloud-based tools and processes. Microsoft Intune (part of EMS) enables cloud-based unified endpoint management (UEM) across mobile devices running iOS, Android, and Windows Mobile, as well as Windows 10 systems. IT can increase automation to reduce costs, including providing self-service access to users to reduce IT time spent on device and application provisioning. Features like Desktop Analytics and more stable MSIX packages allow organizations to be more proactive in diagnosing and fixing issues, reducing overall remediation efforts.
› Improved security features, providing peace of mind despite increased mobile device use and remote access to data. Broad security and compliance tools safeguard customer data, company data, and intellectual property with intelligent security embedded into Microsoft 365. The always-up-to-date functionality of Microsoft 365 ensures that devices have the latest security tools and features installed, including Windows Defender Antivirus, conditional access, multifactor authentication, BitLocker, security baselines within Intune, and Office 365 ProPlus security features like message encryption and ATP Safelinks in documents. The results are reduced risk exposure, reduced security incidents, and reduced remediation efforts.
Composite Organization Based on the interviews and survey, Forrester constructed a TEI framework, a composite company, and an associated ROI analysis that illustrates the areas financially affected. The composite organization is representative of the three companies that Forrester interviewed and the six companies surveyed and is used to present the aggregate financial analysis in the next section. The composite organization that Forrester synthesized has the following characteristics:
“Microsoft Teams is really starting to be accepted as a new way to collaborate.” Endpoint operating system and collaboration manager, financial services company
“I see a lot of collaboration happening with Microsoft Teams, and people started using OneDrive because of the flexibility; it’s platform-independent. The Office 365 ProPlus licensing is different; it’s not device based anymore. Now it’s user based. So, people can log on to multiple devices, even at home, and start using the product, which made it seamless from a user perspective.” Cloud solutions specialist, mining company
7 | The Total Economic Impact™ Of Microsoft 365 E3
Description of composite. The composite is a global organization serving employees and customers in multiple regions. The organization has 5,000 employees who are knowledge workers using Microsoft 365. Of those 5,000 employees, 900 are considered highly mobile users who frequently travel and use their mobile devices and laptops outside of the office to work.
Deployment characteristics. The organization rolls out Microsoft 365 E3 licenses to its 5,000 users in phases. The organization begins with a planning, testing, and pilot period before deploying Microsoft 365 to users more broadly. The organization migrates to EMS, Windows 10, and Office 365 ProPlus, including Microsoft Teams.
Key assumptions 5,000 knowledge workers 900 highly mobile users

8 | The Total Economic Impact™ Of Microsoft 365 E3
The table above shows the total of all benefits across the areas listed below, as well as present values (PVs) discounted at 10%. Over three years, the composite organization expects risk-adjusted total benefits to be a PV of nearly $36 million.
Analysis Of Benefits QUANTIFIED BENEFIT DATA AS APPLIED TO THE COMPOSITE
Improved Collaboration And Communication One of the most important results from the Microsoft 365 investment is improved end user productivity. Interviewed organizations and survey respondents experience significant time savings from improved collaboration, communication, and mobile access. With Office 365 ProPlus and OneDrive, end users can easily share and coauthor documents in their browsers; mobile users can access, create, and edit documents from across multiple devices; users can leverage AI features to create content; and desktop and mobile users can collaborate in real time. Microsoft 365 provides secure access to information and systems for mobile users, increasing their productivity outside of the office. End users also use Microsoft Teams to easily connect with colleagues and share information, and online meetings are easy to schedule, reduce travel, and are more effective with tools like screen sharing. Interviewed organizations deliver updates every six months, so end users get access to new features faster than the three- to four-year upgrade cycle of the previous environments. Interviewed organizations mentioned the following areas of benefit:
› “We have enabled OneDrive and Microsoft Teams. I think they are the two most valuable products that came out and that people are using at the moment. I think the biggest benefit is that we use several hubs, and if I’m here and someone’s in an eastern state, we can have a Microsoft Teams session going on, and then they can share their whiteboards while you’re having the audio feature. Someone might be on the train with a mobile device. If someone shares a file, you don’t have to rely on on-premises shared files; you can go into OneDrive and just grab that file — doesn’t matter what platform you
Microsoft 365 E3 users save 3 hours per week with improved collaboration and communication tools.
Total Benefits Ref. Benefit Initial Year 1 Year 2 Year 3 Total Present
Value
Atr Improved collaboration and communication $0 $5,580,484 $9,826,291 $11,971,694 $27,378,469 $22,188,580
Btr Reduced user downtime $0 $38,500 $77,001 $96,251 $211,752 $170,952
Ctr Improved security and compliance $0 $105,057 $157,586 $210,115 $472,759 $383,606
Dtr Reduction in help desk calls $0 $36,000 $72,000 $90,000 $198,000 $159,850
Etr Device provisioning time savings $0 $391,875 $391,875 $391,875 $1,175,625 $974,535
Ftr Application provisioning savings $0 $271,047 $370,648 $486,611 $1,128,306 $918,325
Gtr Technology infrastructure cost avoided $1,665,000 $3,682,800 $3,817,800 $3,817,800 $12,983,400 $11,036,576
Total benefits (risk-adjusted) $1,665,000 $10,105,764 $14,713,201 $17,064,346 $43,548,311 $35,832,424

9 | The Total Economic Impact™ Of Microsoft 365 E3
Impact risk is the risk that the business or technology needs of the organization may not be met by the investment, resulting in lower overall total benefits. The greater the uncertainty, the wider the potential range of outcomes for benefit estimates.
are on, where you are, and what device you use.”
› “In [our industry], a lot of people are on the move maybe in airports or driving to a site or not in the office. Nowadays, people have iOS, Android, Windows. These tools enable you to work on any of those platforms without any issues. I think that’s the biggest benefit.”
› “Previously, we shared a file and then people would have to come to the office to go to the shared drive and look at that file. Or they need to have a computer, not their mobile device, because the app wasn’t available on their mobile device.”
Forrester assumed for the composite analysis:
› The composite has 5,000 knowledge workers. These users save up to 3 hours per week due to improved collaboration and communication with Microsoft 365 E3. The organization realizes less of this benefit in Year 1 as the phased rollout is completed and users go up the learning curve. The organization captures 25% of this productivity for additional productive work.
› The composite has 900 highly mobile users, including sales and marketing roles that require more frequent travel. Mobile users save up to 2.5 hours per week due to secure access to applications from any device, anywhere. Due to the phased deployment, the organization realizes less of this benefit in Year 1. The organization captures 75% of this productivity.
› The average knowledge worker fully burdened compensation (including all benefits and taxes) is $45.63 per hour, or $94,940 annually.
› With Microsoft Teams, the organization can avoid up to 400 trips per year by using remote Teams meetings instead of in-person meetings. The average cost per trip is $1,000.
While interviewees indicated that these collaboration tools not only increased efficiency but also increased the effectiveness of their work, Forrester was not able to quantify the impact of improved outcomes from collaborative work. The following risks can affect this benefit estimate:
› The opportunity for productivity improvements in daily processes will depend on the prior environment. Organizations can choose the frequency with which they deliver new features to users, and adoption of new features by users will vary based on the amount of training and awareness provided.
› The adoption of online meetings and the opportunity to replace in-person meetings with online meetings will vary based on the organization’s culture and by department.
› Mobile productivity will vary based on prior limitations on mobile access and on the importance of mobile access for end users.
To account for these risks, Forrester adjusted this benefit downward by 10%, yielding a three-year risk-adjusted total PV of over $22 million.
“I think the biggest benefit is that we use several hubs, and if I’m here and someone’s in an eastern state, we can have a Microsoft Teams session going on, and then they can share their whiteboards while you’re having the audio feature. Someone might be on the train with a mobile device. If someone shares a file, you don’t have to rely on on-premises shared files; you can go into OneDrive and just grab that file — doesn’t matter what platform you are on, where you are, and what device you use.” Cloud solutions specialist, mining company

10 | The Total Economic Impact™ Of Microsoft 365 E3
Reduced User Downtime The analytics and security components of Microsoft 365 enable organizations to reduce the impact of device health or security incidents on end users. Desktop Analytics allows organizations to quickly review the health of the environment and resolve application or driver compatibility issues before they affect users more broadly. MSIX and Desktop App Assure also mitigate application compatibility issues. The security features built into Microsoft 365, and the more frequent delivery of security updates, enable more secure access to information, systems, and people, reducing the number of security events. Interviewed organizations said the following:
› “We’ve had a reduction in help desk calls because of the robustness of Windows 10. We are seeing less and less issues deploying applications, and the main thing is the patching PCs in the corporate environment. So, there’s no down time.”
› “From a gut feel perspective, it does feel like we do get less tickets.” Forrester assumed for the composite analysis:
› On average, each user has three events per year that result in device downtime. With Microsoft 365, there is a 25% reduction in the number of downtime events, resulting in 3,750 events avoided. On average, each event results in 2.5 hours of downtime. The organization captures 25% of this productivity.
Microsoft 365 E3 users experience a 25% reduction in downtime events.
Improved Collaboration And Communication: Calculation Table REF. METRIC CALCULATION YEAR 1 YEAR 2 YEAR 3
A1 Number of Microsoft 365 users Interviews/survey 5,000 5,000 5,000
A2 Weekly time savings (hours) Interviews/survey 1.5 2.5 3.0
A3 Productivity capture — Microsoft 365 users Assumption 25% 25% 25%
A4 User fully loaded hourly compensation Assumption $45.63 $45.63 $45.63
A5 Total Microsoft 365 user productivity benefit A1*A2*52 weeks*A3*A4 $4,448,925 $7,414,875 $8,897,850
A6 Number of highly mobile users Interviews/survey 900 900 900
A7 Weekly time savings (hours) Interviews/survey 1.0 2.0 2.5
A8 Productivity capture — mobile users Assumption 75% 75% 75%
A9 Total mobile user productivity benefit A6*A7*52 weeks*A8*A4 $1,601,613 $3,203,226 $4,004,033
A10 Total number of avoided trips Interviews/survey 150 300 400
A11 Average cost per trip Assumption $1,000 $1,000 $1,000
A12 Total trip costs avoided A10*A11 $150,000 $300,000 $400,000
At Improved collaboration and communication A5+A9+A12 $6,200,538 $10,918,101 $13,301,883
Risk adjustment ↓10%
Atr Improved collaboration and communication (risk-adjusted) $5,580,484 $9,826,291 $11,971,694

11 | The Total Economic Impact™ Of Microsoft 365 E3
› The average knowledge worker fully burdened compensation (including all benefits and taxes) is $45.63 per hour, or $94,940 annually.
End users can also recoup productivity during remaining downtime events by accessing their applications on a separate device. Forrester was not able to quantify the impact of this benefit for this study.
The following risks can affect this benefit estimate:
› The amount and length of downtime events in the previous environment is highly variable based on prior tools and security practices. The ability to reduce the number of downtime events will depend on the use of analytics and security features in Microsoft 365.
To account for these risks, Forrester adjusted this benefit downward by 10%, yielding a three-year risk-adjusted total PV of $170,952.
Improved Security And Compliance The suite of security tools across the Microsoft 365 solutions reduces the risk of a major security breach, the number of end user security incidents, and the time it takes to remediate those events. Microsoft 365 provides better visibility with Desktop Analytics, identity and access management with Azure Active Directory (AAD), mobile device and application management with Microsoft Intune, and information protection with BitLocker and Office 365 ProPlus message encryption and sensitivity labels. Microsoft 365 also ensures that people can access information easily and securely from any device with OneDrive. Organizations can use single sign-on for both cloud and on-premises applications, provision or deprovision users rapidly, and, with regular security patches, stay up to date with the latest security features. For the composite analysis:
› Forrester used data from the 2018 Ponemon “Cost of Data Breach Study” to arrive at an average total cost of a breach without security automation tools of $4,430,000 and an average probability of a breach of 13.95% per year.1 By deploying Microsoft 365 security features, Forrester assumes the composite reduces its risk of a breach by 40%. The organization realizes more of this benefit each year as the rollout expands to more devices and more security solutions are deployed.
Reduced User Downtime: Calculation Table REF. METRIC CALCULATION YEAR 1 YEAR 2 YEAR 3
B1 Device downtime events per year, before 3 events per user per year 15,000 15,000 15,000
B2 Reduction in device downtime events Interviews/survey 10% 20% 25%
B3 Hours of downtime per incident Interviews/survey 2.5 2.5 2.5
B4 User fully loaded hourly compensation Assumption $45.63 $45.63 $45.63
B5 Productivity capture Assumption 25% 25% 25%
Bt Reduced user downtime B1*B2*B3*B4*B5 $42,778 $85,556 $106,945
Risk adjustment ↓10%
Btr Reduced user downtime (risk-adjusted) $38,500 $77,001 $96,251
Organizations using Microsoft 365 reduce the risk of a security breach by 40%.

12 | The Total Economic Impact™ Of Microsoft 365 E3
The following risks can affect this benefit estimate:
› The Ponemon Institute data represents global average figures. An organization’s actual risk level may differ from these figures based on size, industry, region, and other factors.
› The ability to reduce the number of incidents depends on the security features implemented, training for IT on how to use them, user behavior, and time spent educating and training users on security best practices.
To account for these risks, Forrester adjusted this benefit downward by 15%, yielding a three-year risk-adjusted total PV of $383,606.
Reduction In Help Desk Calls Microsoft 365 includes some self-service functionality, like the ability for users to reset passwords or provision new applications, which reduces the number of help desk calls for simple tasks. The Desktop Analytics functionality provides improved visibility into the environment and device health so that IT can proactively address issues before they impact more users. Forrester assumed for the composite analysis:
› In the prior environment, the composite organization had on average four help desk calls per user per year. With the Microsoft 365 implementation, help desk calls reduce by 25%.
› The cost per call is $20.
The following risks can affect this benefit estimate:
› Benefits will vary based on the implementation and training of users on self-service features and the use of Desktop Analytics to proactively address device health issues before they affect a larger number of users.
› Some organizations may see an initial spike in help desk calls until end users become more familiar with the new solution set.
To account for these risks, Forrester adjusted this benefit downward by 10%, yielding a three-year risk-adjusted total PV of $159,850.
Improved Security And Compliance: Calculation Table REF. METRIC CALCULATION YEAR 1 YEAR 2 YEAR 3
C1 Average total cost of a breach without security automation Ponemon $4,430,000 $4,430,000 $4,430,000
C2 Average probability of a breach Ponemon 13.95% 13.95% 13.95%
C3 Reduction in risk Interviews/survey 20% 30% 40%
Ct Improved security and compliance C1*C2*C3 $123,597 $185,396 $247,194
Risk adjustment ↓15%
Ctr Improved security and compliance (risk-adjusted) $105,057 $157,586 $210,115
25% reduction in help desk calls with self-service and device health features

13 | The Total Economic Impact™ Of Microsoft 365 E3
Device Provisioning Time Savings In the prior environment, IT would image devices manually, resulting in significant time spent on creating and maintaining images and provisioning devices to users. With the Microsoft 365 investment, IT can now securely provision devices over the cloud using Windows AutoPilot and EMS (Intune and Azure Active Directory) to automate device deployment. Files On-Demand makes all of a user’s files available in seconds after logging in to a new device. Automated provisioning programs for other devices are also supported by EMS. By defining a set of compliance policies and configuration profiles, IT no longer needs to handle every device individually.
Forrester assumed for the composite analysis:
› The composite provisions 1.2 devices per user over a four-year refresh cycle. This translates to approximately 1,500 devices provisioned each year. The composite saves 4 hours per device due to automated provisioning.
› The average IT fully burdened compensation (including all benefits and taxes) is $68.75 per hour, or $143,000 annually. Forrester does not include a productivity capture for this time savings because it is time saved on a discrete task and not overall time savings.
The following risks can affect this benefit estimate:
› This benefit will vary based on the number of devices being provisioned, the ability to automate device provisioning processes, and any previous outsourcing or other solutions in place for provisioning.
To account for these risks, Forrester adjusted this benefit downward by 5%, yielding a three-year risk-adjusted total PV of $974,535.
Reduction In Help Desk Calls: Calculation Table REF. METRIC CALCULATION YEAR 1 YEAR 2 YEAR 3
D1 Number of help desk calls related to Microsoft products, prior state
4 calls per user per year 20,000 20,000 20,000
D2 Reduction in calls Interview/survey 10% 20% 25%
D3 Cost per call Assumption $20 $20 $20
Dt Reduction in help desk calls D1*D2*D3 $40,000 $80,000 $100,000
Risk adjustment ↓10%
Dtr Reduction in help desk calls (risk-adjusted) $36,000 $72,000 $90,000
4 hours saved per device with automated device provisioning

14 | The Total Economic Impact™ Of Microsoft 365 E3
Application Provisioning Savings Microsoft 365 provides self-service and automation tools for application provisioning, reducing the time that IT spends on this task and reducing the time it takes for end users to access applications they need to be productive. Windows 10 integrates with tools and services such as the Microsoft Store and the Microsoft Store for Business. End users can access and install many applications without calling their help desk, and IT can ensure that users install the right version of the right application. Additionally, Microsoft 365 reduces the application testing time required for major operating system (OS) releases with Desktop Analytics, MSIX, and Desktop App Assure. OS releases are no longer the major, every two- or three-year undertakings that come with new and updated features in virtually every area. Instead, operating system updates come incrementally, most commonly twice-a-year feature updates and monthly quality updates. Applications that don’t interact with a new or updated feature likely don’t need testing.
One interviewees said, “Now we have the Microsoft Store for business enabled so the users can actually go to the Store where we have the applications published and then download, which saves a lot of time.”
Forrester assumed for the composite analysis:
› In the prior environment, IT spent 1,000 hours per year on application provisioning. This initially decreases by 15%, improving to a 30% reduction as more applications are moved to the app store.
› In the prior environment, IT spent 8,000 hours per year on application compatibility testing. By selectively testing applications, this decreases by 50% in Year 1, improving to a 70% reduction by Year 3.
› The average IT fully burdened compensation (including all benefits and taxes) is $68.75 per hour, or $143,000 annually. Forrester does not include a productivity capture for this time savings because it is time saved on a discrete task and not overall time savings.
The following risks can affect this benefit estimate:
› This benefit will depend on the previous application provisioning processes, number of application requests from end users, the total number of applications in the portfolio, and the amount of application testing required in the prior environment.
Device Provisioning Time Savings: Calculation Table REF. METRIC CALCULATION YEAR 1 YEAR 2 YEAR 3
E1 Number of devices provisioned 5,000 users*1.2 devices/4 years (four-year refresh) 1,500 1,500 1,500
E2 Device provisioning time saved (hours per device) Interviews/survey 4 4 4
E3 IT fully loaded hourly compensation Assumption $68.75 $68.75 $68.75
Et Device provisioning time savings E1*E2*E3 $412,500 $412,500 $412,500
Risk adjustment ↓5%
Etr Device provisioning time savings (risk-adjusted) $391,875 $391,875 $391,875
30% reduction in application provisioning time with self-service access
70% reduction in application testing time with targeted testing

15 | The Total Economic Impact™ Of Microsoft 365 E3
› Some organizations had difficulty adjusting to the new frequency of updates and the resulting need to test applications more frequently. Organizations also found that their third-party vendors struggled to keep up with the new frequency of updates, creating more compatibility issues for those applications.
To account for these risks, Forrester adjusted this benefit downward by 5%, yielding a three-year risk-adjusted total PV of $918,325.
Technology Infrastructure Cost Avoided Organizations can replace third-party security, mobile device management, communication, and collaboration tools with functionality in Microsoft 365. Windows Defender Antivirus replaces the third-party antivirus, EMS replaces multiple endpoint management tools, and functionality like Microsoft Teams replaces previous collaboration tools. Organizations also receive total cost of ownership savings by moving their on-premises Microsoft environments to Microsoft 365. Organizations switch to subscription license fees, reducing capex license costs. Organizations can also avoid purchases of on-premises infrastructure. By simplifying and modernizing their environments, organizations also reduce the amount of IT support needed for administration and management. Interviewees said:
› “Microsoft has done a good job to streamline the patching process.”
› “The feature updates are certainly less disruptive. We’re not having to create giant project efforts and carry all of that overhead to deploy the next version of Windows. It takes less people to execute the change from an engineering standpoint.”
› “I think that, overall, it provides for a better platform for us to troubleshoot any issues that come across. It’s much more consistent than the Windows 7 environment was, and it definitely seems to harbor less bugs and problems.”
› “Before, we were chasing our tails. I anticipate management of the environment savings.”
› “We’re able to repurpose that effort to drive more value, like we’re able to change more stuff, we’re able to have more core configuration.”
Forrester assumed for the composite analysis:
Application Provisioning Savings: Calculation Table REF. METRIC CALCULATION YEAR 1 YEAR 2 YEAR 3
F1 Time spent on application provisioning before (hours) Interviews/survey 1,000 1,100 1,210
F2 Reduction in time spent on application provisioning Interviews/survey 15% 25% 30%
F3 Time spent on application compatibility testing (hours) Interviews/survey 8,000 9,000 10,125
F4 Reduction in time spent on application compatibility testing Interviews/survey 50% 60% 70%
F5 IT fully loaded hourly compensation Assumption $68.75 $68.75 $68.75
Ft Application provisioning savings (F1*F2+F3*F4)*F5 $285,313 $390,156 $512,222
Risk adjustment ↓5%
Ftr Application provisioning savings (risk-adjusted) $271,047 $370,648 $486,611
“The feature updates are certainly less disruptive. We’re not having to create giant project efforts and carry all of that overhead to deploy the next version of Windows. It takes less people to execute the change from an engineering standpoint.” End user experience delivery, financial services company

16 | The Total Economic Impact™ Of Microsoft 365 E3
› The composite replaces four third-party tools with functionality in Microsoft 365. On average, each third-party tool cost the organization $30 per user per year in license and infrastructure costs. The organization gets 75% of this benefit in Year 1 as it completes its phased rollout.
› By switching to Microsoft 365 E3 subscription license costs, the organization can reduce its Microsoft license costs by 30%.
› The organization avoids $350,000 in on-premises infrastructure purchases and resulting maintenance costs by migrating to the cloud.
› By simplifying the overall environment, moving to the cloud, and increasing automation, the organization reduces its IT administration effort. In the previous environment, four FTEs maintained the platform. In the new environment (in the cost section below), three FTEs are needed, resulting in a savings of one FTE. The average IT fully burdened compensation (including all benefits and taxes) is $143,000 annually.
The following risks can affect this benefit estimate:
› This benefit will vary based on the previous third-party solutions that can be replaced and negotiated pricing for those solutions.
› License and infrastructure costs will vary from organization to organization.
To account for these risks, Forrester adjusted this benefit downward by 10%, yielding a three-year risk-adjusted total PV of just over $11 million.
Flexibility The value of flexibility is clearly unique to each customer, and the measure of its value varies from organization to organization. There are multiple scenarios in which a customer might choose to implement
Technology Infrastructure Cost Avoided: Calculation Table REF. METRIC CALCULATION INITIAL YEAR 1 YEAR 2 YEAR 3
G1 Cost savings from replacing prior third-party tools
4 tools replaced, average $30/user/year/tool $450,000 $600,000 $600,000
G2 Avoided Microsoft license costs 30% reduction $1,500,000 $3,000,000 $3,000,000 $3,000,000
G3 Eliminated on-premises costs Assumption $350,000 $70,000 $70,000 $70,000
G4 Prior ongoing IT administration (FTEs) Interviews/survey 4 4 4
G5 IT fully loaded annual compensation Interviews/survey $143,000 $143,000 $143,000
Gt Technology infrastructure cost avoided G1+G2+G3+G4*G5 $1,850,000 $4,092,000 $4,242,000 $4,242,000
Risk adjustment ↓10%
Gtr Technology infrastructure cost avoided (risk-adjusted) $1,665,000 $3,682,800 $3,817,800 $3,817,800
$11 million in TCO avoided by migrating to Microsoft 365

17 | The Total Economic Impact™ Of Microsoft 365 E3
Flexibility, as defined by TEI, represents an investment in additional capacity or capability that could be turned into business benefit for a future additional investment. This provides an organization with the "right" or the ability to engage in future initiatives but not the obligation to do so.
Microsoft 365 E3 and later realize additional uses and business opportunities, including:
› Increasing the adoption of productivity-generating features. With updates being delivered more frequently, organizations have additional opportunities to increase awareness and provide training for new features that can help end users and IT staff increase their productivity-related time savings, including AI features.
› Additional functionality may also help to streamline costs in other areas. Delivery optimization enables organization to utilize peer-to-peer distribution capabilities to update devices internally, potentially creating network bandwidth savings.
Flexibility would also be quantified when evaluated as part of a specific project (described in more detail in Appendix A).

18 | The Total Economic Impact™ Of Microsoft 365 E3
The table above shows the total of all costs across the areas listed below, as well as present values (PVs) discounted at 10%. Over three years, the composite organization expects risk-adjusted total costs to be a PV of more than $15 million.
Implementation risk is the risk that a proposed investment may deviate from the original or expected requirements, resulting in higher costs than anticipated. The greater the uncertainty, the wider the potential range of outcomes for cost estimates.
Analysis Of Costs QUANTIFIED COST DATA AS APPLIED TO THE COMPOSITE
License Costs Forrester assumes for the composite analysis:
› The composite organization purchases 5,000 Microsoft 365 E3 licenses. Licenses cost $35 per user per month. The organization incurs six months of license costs in the initial period due to upfront testing and deployment. The rollout ends during Year 1, which represents the first full year of license costs for all users.
The following risks can affect this cost estimate:
› License costs are variable based on volume discounts, other products licensed from the same vendor, or other discounts.
To account for these risks, Forrester adjusted this cost upward by 5%, yielding a three-year risk-adjusted total PV of approximately $6.6 million.
Planning, Implementation, And Deployment Costs Planning, implementation, and deployment costs vary significantly based on the length of deployment, professional services used, which solutions are deployed, and the number of devices. Most organizations use professional services initially to speed up deployment time and help with configuration and integrations. Forrester assumes for the composite analysis
Total Costs Ref. Cost Initial Year 1 Year 2 Year 3 Total Present
Value Htr License costs $1,102,500 $2,205,000 $2,205,000 $2,205,000 $7,717,500 $6,586,009
Itr Planning, implementation, and deployment costs $3,205,146 $2,352,900 $545,100 $545,100 $6,648,246 $6,204,183
Jtr Training costs $880,770 $796,620 $536,580 $536,580 $2,750,550 $2,451,565
Total costs (risk-adjusted) $5,188,416 $5,354,520 $3,286,680 $3,286,680 $17,116,296 $15,241,757
License Costs: Calculation Table REF. METRIC CALCULATION INITIAL YEAR 1 YEAR 2 YEAR 3
H1 Number of Microsoft 365 users Interviews/survey 5,000 5,000 5,000 5,000
H2 Microsoft 365 E3 license cost
$35 per user per month, 6 months initial $210 $420 $420 $420
Ht License costs H1*H2 $1,050,000 $2,100,000 $2,100,000 $2,100,000
Risk adjustment ↑5%
Htr License costs (risk-adjusted) $1,102,500 $2,205,000 $2,205,000 $2,205,000

19 | The Total Economic Impact™ Of Microsoft 365 E3
› The composite has a 10-month initial deployment period. During this time, the organization stands up the solutions and completes early testing and deployments.
› The composite uses $1.8 million in professional services during the initial period and $1 million in professional services to complete the rollout during Year 1.
› Eight internal FTEs are involved with implementation and deployment in the initial 10 months. Four FTEs complete the rollout during Year 1. The composite requires three FTEs for ongoing management to support and configure Microsoft solutions, manage user accounts, and roll out new solution components.
› The average IT fully burdened compensation (including all benefits and taxes) is $143,000 annually.
› The migration requires $45,000 in annual additional technology spend, 75% of which is incurred in the initial period.
The following risks can affect this cost estimate:
› Costs will vary based on the size and scope of the deployment, the number of FTEs required, and the amount of professional services support needed. The adoption of videoconferencing will affect the increase in bandwidth costs.
To account for these risks, Forrester adjusted this cost upward by 15%, yielding a three-year risk-adjusted total PV of approximately $6.2 million.
Training Costs Both IT staff and end users require training on new features and functionality.
Forrester assumes for the financial analysis:
Planning, Implementation, And Deployment Costs: Calculation Table REF. METRIC CALCULATION INITIAL YEAR 1 YEAR 2 YEAR 3
I1 Number of months Interviews/survey 10 12 12 12
I2 Internal FTEs for planning and implementation Interviews/survey 8 4
I3 Professional services costs Assumption $1,800,000 $1,000,000
I4 Additional technology costs Interviews/survey $33,750 $45,000 $45,000 $45,000
I5 Internal FTEs for ongoing management and administration Interviews/survey 3 3 3
I6 IT fully loaded annual compensation Assumption $143,000 $143,000 $143,000 $143,000
It Planning, implementation, and deployment costs ((I1/12)*(I2+I5)*I6)+I3+I4 $2,787,083 $2,046,000 $474,000 $474,000
Risk adjustment ↑15%
Itr Planning, implementation, and deployment costs (risk-adjusted) $3,205,146 $2,352,900 $545,100 $545,100
10 months Initial implementation and deployment time

20 | The Total Economic Impact™ Of Microsoft 365 E3
› The composite spends $75,000 to make initial training materials and spends $15,000 per year to update training materials with new features.
› Fifteen IT staff participate in training, including five days initially, three days in Year 1, and two days each year after deployment ends to train on new functionality. The average IT fully burdened compensation (including all benefits and taxes) is $550 per day, or $143,000 annually.
› All 5,000 end users participate in both formal and on-the-job training, including 3 hours initially, 3 hours in Year 1, and 2 hours per year after deployment ends to train on new features. The average knowledge worker fully burdened cost (including all benefits and taxes) is $45.63 per hour, or $94,940 annually.
The following risks can affect this cost estimate:
› Training efforts will vary based on the frequency of updates and the effort to spread awareness of new features. Ongoing training to accompany new feature updates is a critical component of ongoing productivity benefits.
To account for these risks, Forrester adjusted this cost upward by 10%, yielding a three-year risk-adjusted total PV of just under $2.5 million.
Training Costs: Calculation Table REF. METRIC CALCULATION INITIAL YEAR 1 YEAR 2 YEAR 3
J1 Development of training materials Interviews/survey $75,000 $15,000 $15,000 $15,000
J2 Number of IT staff participating in training Interviews/survey 15 15 15 15
J3 Days of IT training Interviews/survey 5 3 2 2
J4 IT fully loaded daily compensation Assumption $550 $550 $550 $550
J5 Number of end users Interviews/survey 5,000 5,000 5,000 5,000
J6 Hours of end user training Interviews/survey 3 3 2 2
J7 User fully loaded hourly compensation Assumption $45.63 $45.63 $45.63 $45.63
Jt Training costs J1+J2*J3*J4+J5*J6*J7 $800,700 $724,200 $487,800 $487,800
Risk adjustment ↑10%
Jtr Training costs (risk-adjusted) $880,770 $796,620 $536,580 $536,580
Five days Initial IT training 3 hours Initial end user training

21 | The Total Economic Impact™ Of Microsoft 365 E3
The financial results calculated in the Benefits and Costs sections can be used to determine the ROI, NPV, and payback period for the composite organization’s investment. Forrester assumes a yearly discount rate of 10% for this analysis.
Financial Summary CONSOLIDATED THREE-YEAR RISK-ADJUSTED METRICS
Cash Flow Chart (Risk-Adjusted)
-$10.0 M
-$5.0 M
$5.0 M
$10.0 M
$15.0 M
$20.0 M
$25.0 M
$30.0 M
Initial Year 1 Year 2 Year 3
Cashflows
Total costs
Total benefits
Cumulative net benefits
These risk-adjusted ROI, NPV, and payback period values are determined by applying risk-adjustment factors to the unadjusted results in each Benefit and Cost section.
Cash Flow Analysis (risk-adjusted estimates)
Initial Year 1 Year 2 Year 3 Total Present Value
Total costs ($5,188,416) ($5,354,520) ($3,286,680) ($3,286,680) ($17,116,296) ($15,241,757)
Total benefits $1,665,000 $10,105,764 $14,713,201 $17,064,346 $43,548,311 $35,832,424
Net benefits ($3,523,416) $4,751,244 $11,426,521 $13,777,666 $26,432,015 $20,590,667
ROI 135%
Payback period 9 months

22 | The Total Economic Impact™ Of Microsoft 365 E3
Microsoft 365 E3: Overview The following information is provided by Microsoft. Forrester has not validated any claims and does not endorse Microsoft or its offerings.
• Unlocks creativity o Create compelling content: Use AI-powered tools to create high-quality content that stands out —
from impressive slides to animated 3D models and immersive mixed-reality experiences. o Turn data into insight: Turn an ever-growing mass of data into actionable insights to transform your
organization. o Find what you need: Find people, data, and the information you need without leaving the flow of your
work. o Focus on what matters: Remove distractions and overcome information overload by focusing on
what is most important. o Work naturally across devices: Go from thought to content effortlessly on any device through more
natural ways of working with voice, touch, and pen.
• Built for teamwork o Bring together teams and resources all in one place: Get the hub for your teamwork with Microsoft
Teams, where you can chat, hold meetings, and share files and apps. Connect people to content with file storage and sharing.
o Stay connected and organized on the go: Connect and collaborate wherever you go. Outlook for iOS and Android brings together email, calendar, contacts, and documents — securely — allowing you to share files, coordinate schedules, and book meetings.
o Connect the workplace with a mobile, intelligent intranet: Share resources, news, and apps across the organization with dynamic sites and portals. Transform internal communications with SharePoint — whether in the office or on the go.
o Engage and empower employees across your organization: Drive open conversation and improve employee engagement with Yammer. Build communities, conduct live and on-demand events, encourage sharing of knowledge and best practices, and crowdsource ideas
o Work together in real time with Office apps: Share your files securely with OneDrive for Business and cocreate in real time. See who’s working on a file with you and easily track changes with version history, using apps like Word and PowerPoint.
• Integrated for simplicity o Windows 10, Office 365 ProPlus, and Microsoft Teams: Empower employees with the most
productive tools and secure computing environment while lowering costs and simplifying IT. o Flexible device management: Provision, deploy, and manage all your devices — from mobile
devices running iOS, Android, or Windows Mobile, to PCs running Windows, Mac, or Linux. Increase your security posture by connecting you on-premises infrastructure to the cloud, all on your own terms.
o Integrated administration: Administer apps, services, data, devices, and users — all from one unified, web-based administration center. Quickly accomplish common tasks and retain the ability to dive deep from a central console.
o Built-in compliance: Easily assess your compliance risk, govern and protect your data, and efficiently respond to regulatory requirements.

23 | The Total Economic Impact™ Of Microsoft 365 E3
• Intelligent security o Secure access to your enterprise: Traditional security perimeters no longer apply. Identity is the new
control plane. Protecting an enterprise requires defense in depth, which starts with a passwordless user authentication experience and automatic, policy-based rules for accessing sensitive information, regardless of location or device type.
o Defend your digital landscape: Protect your assets and empower your defenders with Microsoft Threat Protection Services.
o Safeguard your sensitive data: In this era of big data and strengthened privacy laws, an organization’s most valuable asset is data, yet most don’t understand what data is sensitive and how to control access. Protecting data and privacy requires automatic detection of sensitive information and protection that stays with a file, even when it travels outside of your network.
o Understand and improve your security posture: Increasingly sophisticated threats mean organizations must constantly reassess their security posture, but accurately and objectively measuring it is a challenge for most companies. Your security providers should help quantify your security posture and provide recommendations to improve it, including the user impact and level of effort required.
o Security beyond Microsoft products: Modern enterprises are adopting a variety of solutions to achieve digital transformation goals. Most organizations run workloads on different operating systems, use multiple cloud platforms, and rely on a variety of vendors. It’s critical that security solutions work together — regardless of the vendor — to protect devices, products, and services.
Microsoft 365 empowers every employee from your first-line workforce all the way to your boardroom. Microsoft’s subscriptions offer complete, intelligent, and more secure solutions that will bring more value to your business and help transform your organization to drive innovation.

24 | The Total Economic Impact™ Of Microsoft 365 E3
Appendix A: Total Economic Impact Total Economic Impact is a methodology developed by Forrester Research that enhances a company’s technology decision-making processes and assists vendors in communicating the value proposition of their products and services to clients. The TEI methodology helps companies demonstrate, justify, and realize the tangible value of IT initiatives to both senior management and other key business stakeholders.
Total Economic Impact Approach
Benefits represent the value delivered to the business by the product. The TEI methodology places equal weight on the measure of benefits and the measure of costs, allowing for a full examination of the effect of the technology on the entire organization.
Costs consider all expenses necessary to deliver the proposed value, or benefits, of the product. The cost category within TEI captures incremental costs over the existing environment for ongoing costs associated with the solution.
Flexibility represents the strategic value that can be obtained for some future additional investment building on top of the initial investment already made. Having the ability to capture that benefit has a PV that can be estimated.
Risks measure the uncertainty of benefit and cost estimates given: 1) the likelihood that estimates will meet original projections and 2) the likelihood that estimates will be tracked over time. TEI risk factors are based on “triangular distribution.”
The initial investment column contains costs incurred at “time 0” or at the beginning of Year 1 that are not discounted. All other cash flows are discounted using the discount rate at the end of the year. PV calculations are calculated for each total cost and benefit estimate. NPV calculations in the summary tables are the sum of the initial investment and the discounted cash flows in each year. Sums and present value calculations of the Total Benefits, Total Costs, and Cash Flow tables may not exactly add up, as some rounding may occur.
Present value (PV) The present or current
value of (discounted) cost and benefit estimates given at an interest rate (the discount rate). The PV of costs and benefits feed into the total NPV of cash flows.
Net present value (NPV)
The present or current value of (discounted) future net cash flows given an interest rate (the discount rate). A positive project NPV normally indicates that the investment should be made, unless other projects have higher NPVs.
Return on investment (ROI)
A project’s expected return in percentage terms. ROI is calculated by dividing net benefits (benefits less costs) by costs.
Discount rate
The interest rate used in cash flow analysis to take into account the time value of money. Organizations typically use discount rates between 8% and 16%.
Payback period
The breakeven point for an investment. This is the point in time at which net benefits (benefits minus costs) equal initial investment or cost.

25 | The Total Economic Impact™ Of Microsoft 365 E3
Appendix B: Endnotes
1 Source: “2018 Cost of a Data Breach Study: Global Overview,” Ponemon Institute, LLC, July 2018. (https://www.ibm.com/security/data-breach).