the structure, conduct, and performance of agricultural market ...
411
THE STRUCTURE, CONDUCT, AND PERFORMANCE OF AGRICULTURAL MARKET INFORMATION SYSTEMS IN SUB-SAHARAN AFRICA By Andrew Muganga Kizito A DISSERTATION Submitted to Michigan State University in partial fulfillment of the requirements for the degree of DOCTOR OF PHILOSOPHY Agricultural, Food, and Resource Economics 2011
-
Upload
khangminh22 -
Category
Documents
-
view
0 -
download
0
Transcript of the structure, conduct, and performance of agricultural market ...
THE STRUCTURE, CONDUCT, AND PERFORMANCE OF AGRICULTURAL MARKET INFORMATION SYSTEMS IN SUB-SAHARAN AFRICA
By
Andrew Muganga Kizito
A DISSERTATION
Submitted to Michigan State University
in partial fulfillment of the requirements for the degree of
DOCTOR OF PHILOSOPHY
Agricultural, Food, and Resource Economics
2011

ABSTRACT
THE STRUCTURE, CONDUCT, AND PERFORMANCE OF AGRICULTURAL MARKET INFORMATION SYSTEMS IN SUB-SAHARAN AFRICA
By
Andrew Muganga Kizito
This dissertation addresses three sets of questions: (1) what evidence is there that
supports the premises that second-generation agricultural Market Information System
(MIS) models are likely to meet user needs and become financially sustainable relative to
first-generation models? (2) How have different MIS models tried to address the generic
design issues of any MIS and what are the relative advantages of different models of MIS
in addressing those challenges? (3) What factors affect the reception of improved
agricultural market information among smallholder farmers in Mozambique; and how
does reception of improved agricultural market information affect their marketing
behavior?
The key findings are that: (1) there is great heterogeneity among MIS in terms of
their structure and conduct design issues. (2) Whether or not an MIS is government-based
explains very little in terms of its performance. What matters is the: (a) mandate, (b)
financial and managerial autonomy, (c) information and communication technology
(ICT) used in transmission and diffusion, (d) funding strategy, (e) quality control
methods, and (f) feedback methods of the MIS. (3) All MIS types still heavily depend on
donor funding for sustainability. (4) Private MIS do not engage in policy analysis
compared to government supported MIS, but could provide data to units that do. (6)
There is a rapidly evolving market environment in terms of (a) market actors, and (b) ICT
availability and usage. (5) It is difficult to analyze the key design issues of MIS
independent of overall environment in which they operate.
From the econometric analysis of a two-year panel household data set for four
provinces in Mozambique, the study finds that the generic factors that influence the
reception of improved agricultural market information include involvement in growing of
marketable staples, access to alternative information and communication technologies,
and access to markets and extension services. The specific factors include: growing
maize, large and small groundnuts; owning a radio; presence of a cell phone network in
the village; proximity to a road with public transport; membership to farmer association;
access to extension services; level of education; the agro ecological zone of households;
and distance to village administrative post. Holding other factors constant, reception of
market information increases farmers’ probability of market participation by 34 percent.
The average price difference per kilogram of maize sold between households with
and without information (also referred to as an information premium or information rent)
is 12%. This premium translates into an average income gain of 0.34 meticais per
kilogram of maize sold, or an income gain of $3.13 (about 1% of average gross and net
total household income in 2005 meticais) for an average household that sells about 214
kilograms of maize in the main growing season per year. The average marginal
population gain in income by an estimated a quarter million households that received
information and sold maize is estimated to be $766,748 in the main marketing season per
year. These gains are 6 times more than the operational costs in MIS of $130,000 in
2002. The cost-benefit analysis shows that less-commercialized farmers are less likely to
afford the use of information from MIS than are more-commercialized farmers.

Copyright by ANDREW MUGANGA KIZITO 2011

v
DEDICATION
To Juliet, Lydia, Jesse, Jenell, and Lyndsey
vi
ACKNOWLEDGMENT
Special thanks in the preparation of this dissertation go to my major professor and
academic advisor Dr. John Staatz. I also wish to thank all members on my dissertation
committee, consisting of Dr. Eric Crawford, Dr. Cynthia Donovan, and Dr. Brent Ross in
the Department of Agricultural, Food, and Resource Economics at Michigan State
University (MSU); and to Dr. Jack Meyer in the Economics Department at MSU. This
research is linked to activities of the Food Security Group (FSG), which aim at assisting
African countries to improve market performance and food security. More specifically,
the dissertation is linked to the MSU-FSG-Hewlett project on Strengthening African
Regional Trade through Improved Market Information: Alternative Models to Provide
Agricultural Market Information; and to the MSU-COMESA-BMGF Project on Guiding
Investments in Sustainable Agricultural Markets in Africa (GISAMA). Thus, I wish to
extend my thanks to the Department of Agricultural, Food, and Resource Economics at
Michigan State University; The William and Flora Hewlett Foundation; and The Bill and
Melinda Gates Foundation for funding this research. I also wish to thank Makerere
University for giving me a study leave to pursue graduate studies at MSU.
Thanks also go to the collaborators in the Agricultural Research for Developing
Countries (CIRAD) and the National Institute for Agricultural Research (INRA) in
France. Thanks also go to the information providers in the Agricultural Market
Information System (SIMA) in Mozambique, the Ethiopia Commodity Exchange, the
Agricultural Market Information Center in Zambia, the Zambia National Farmers Union
(ZNFU) 4455 SMS MIS, and all MIS that provided the information during the E-survey.

vii
I also wish to extend thanks to friends: Kato Edward, Kiggundu Richard, Richard
Sengoba, and Richard Semakula of Uganda; Helder Zavale of Mozambique; Athur
Mabiso of Zimbabwe; Joshua Ariga, Thomas Awour, Phoebe Omolo, Lillian Kirimi, and
Julius Kirimi of Kenya; Doe Adovor and Clarice Mensah of Ghana; Kingdom Kwapata
of Malawi; and Jordan Chamberlin of USA for the academic, social, and moral support
during my studies. I also wish to extend my thanks to fellow graduate students at MSU.
Lastly, I wish to thank my family members: Juliet Mugambwa, Lydia
Namuganga, Jesse Kitumba, Jenell Muganga, and Lyndsey Muganga for the support they
gave me during my studies at Michigan State. My wife Juliet gave me a lot of support
during the entire graduate studies program and MSU. Lydia always asked: Daddy, have
you finished writing your book? Jesse would ask: Daddy, when are you ever going to
finish writing your book? Every morning I left the house, Jenell would ask: Daddy, are
you going to the library? And Lyndsey would say: Baba Tata (bye bye daddy). To
Lydia and Jesse: Yes! I finished writing “the book”. It’s now your turn to write books.

viii
TABLE OF CONTENTS
LIST OF TABLES ........................................................................................................... xiii
LIST OF FIGURES ......................................................................................................... xvi
1. INTRODUCTION ....................................................................................................... 1 1.1 Introduction ......................................................................................................... 1 1.2 Problem Statement and Research Objectives ..................................................... 2 1.3 Market Information Systems and Improved Agricultural Market Information .. 5 1.4 Conceptual Framework and Theoretical Tools ................................................. 11 1.5 Analytical Framework: Structure, Conduct, and Performance of MIS ............ 12
1.5.1 The Environment in which the MIS Operates .............................................. 12 1.5.2 Structural Design Issues ................................................................................ 14 1.5.3 Conduct Design Issues .................................................................................. 14 1.5.4 MIS Performance Features............................................................................ 15 1.5.5 Weakness of the SCP Framework ................................................................. 18
1.6 Sources of Data ................................................................................................. 18 1.7 Contributions of the Dissertation ...................................................................... 19 1.8 Structure of the Dissertation ............................................................................. 20
2 ECONOMICS OF INFORMATION: IMPLICATIONS FOR MIS DESIGN AND IMPACT .................................................................................................................... 22
2.1 The Role of Market Information Systems in Agricultural Marketing .............. 22 2.1.1 Market Efficiency through Reduction of Information Asymmetries ............ 22 2.1.2 “Leveling the Playing Field” and Income Redistribution ............................. 23 2.1.3 Reduction in Risk and Efficient Allocation of Productive Resources .......... 23 2.1.4 Design of Better Policy and Monitoring by Governments and Donors ........ 24
2.2 Characteristics of Information That Affect Its Demand and Supply ................ 25 2.2.1 Indivisibility .................................................................................................. 25 2.2.2 Nonappropriability (High Exclusion Costs) ................................................. 26 2.2.3 Non-rivalry (Marginal Cost of Another User/Use = Zero) ........................... 27 2.2.4 Quality Uncertainty ....................................................................................... 29 2.2.5 Perishability .................................................................................................. 29
2.3 Environment in which the MIS Operates .......................................................... 30 2.3.1 Government Policies ..................................................................................... 30 2.3.2 Key Macro-Economic Indicators and Social-Economic Characteristics ...... 31 2.3.3 Market Structure, Vertical Coordination, and Price Discovery Methods Used
....................................................................................................................... 33 2.3.4 Agro-Climatic Conditions in a Country ........................................................ 35 2.3.5 Level of usage of ICT in a country ............................................................... 35 2.3.6 Geographic Setting ........................................................................................ 36 2.3.7 Cultural Factors in a Country ........................................................................ 37 2.3.8 Lack of Effective Demand for Improved Information by Some Users ......... 38 2.3.9 Seasonality of Crop Production .................................................................... 38 2.3.10 Security in a Country .................................................................................... 39

ix
2.4 Implications for Information Funding and Impact of MIS ............................... 39 2.4.1 Administrative: Government Funding Using Tax Money ............................ 42 2.4.2 Combination of Administrative Funding, Donor Funding, and Private
Effective Demand ......................................................................................... 43 2.4.3 Tie-in-sale of Market Information and Members Fees ................................. 46 2.4.4 Private Effective Demand: Subscriptions Fees and Information Sales........ 46 2.4.5 Complementarity and Endogeneity of Market Information .......................... 47
3 CROSS-COUNTRY SYNTHESIS OF THE GENERIC DESIGN ISSUES OF EMERGING AND TRADITIONAL MIS MODELS ............................................... 48
3.1 Characteristics and Premises for the Support of Emerging MIS ...................... 48 3.2 Key Research Questions ................................................................................... 51 3.3 Organization of the Chapter .............................................................................. 51 3.4 Conceptual, Theoretical, and Analytical Framework ....................................... 52 3.5 Methods Used in the Study ............................................................................... 53
3.5.1 Sources of Information and Data .................................................................. 53 3.5.2 Global Review of Literature ......................................................................... 56 3.5.3 Case Studies .................................................................................................. 57 3.5.4 Email Survey Design .................................................................................... 60 3.5.5 Meetings and Workshop ............................................................................... 62
3.6 Generic Structural Design Issues Facing Any MIS .......................................... 64 3.6.1 MIS Perceived Mandate ................................................................................ 64 3.6.2 Institutional Home, Organizational Features, and Coordination Forms ....... 71
3.6.2.1 Provision of Complementary Services ................................................... 72 3.6.2.2 Geographic Coverage and Range of Commodities Covered ................. 77 3.6.2.3 Assuring Coordination among MIS Activities and Production Stages .. 84
3.6.2.3.1 Vertical Integration of MIS Activities ............................................ 85 3.6.2.3.2 Centralization vs. Decentralization of MIS Activities .................... 87 3.6.2.3.3 Specialization in the Production of MIS Products .......................... 90
3.6.2.4 Designing Incentives for Staff to be Responsive to Client Needs ......... 93 3.6.2.5 Profit Orientation of the MIS ................................................................. 97
3.6.3 The Nature of Commodities Covered ........................................................... 98 3.7 Generic Conduct Design Issues for Any MIS ................................................. 100
3.7.1 Information Provided and Frequency of Provision ..................................... 100 3.7.2 ICT used in Transmission and Diffusion of Market Information ............... 106 3.7.3 Funding Strategies of MIS .......................................................................... 117 3.7.4 Data Collection Methods Used By MIS ..................................................... 124 3.7.5 Quality Control Methods Used By MIS ..................................................... 131 3.7.6 Feedback Mechanisms Used By MIS ......................................................... 136
3.8 Summary of Key Observations and Conclusions from the Synthesis ............ 139 3.8.1 Summary of Key Observations ................................................................... 139 3.8.2 Conclusions from the Synthesis .................................................................. 144
3.9 Implications for Stakeholders in Terms of Promoting and Supporting Different Types of MIS .................................................................................................. 145

x
4 EFFECTS OF RECEIVING IMPROVED AGRICULTURAL MARKET INFORMATION ON THE MARKETING BEHAVIOR OF FARMERS IN MOZAMBIQUE ...................................................................................................... 150
4.1 Introduction and Research Questions ............................................................. 150 4.2 Hypotheses ...................................................................................................... 153 4.3 Data, Sampling Design, and Study Coverage ................................................. 154 4.4 Market Information Systems in Mozambique between 2002 and 2005 ......... 155 4.5 Indicators Used to Measure the Impact of Market Information ..................... 157
4.5.1 Market Participation and Crop Revenue or Income.................................... 157 4.5.2 Changes in Price Dispersion or Variation ................................................... 159 4.5.3 Marketing Margins and Profits ................................................................... 161 4.5.4 Consumer Surplus, Producer Surplus, and Dead Weight Loss ................... 162 4.5.5 Elimination of Waste .................................................................................. 163 4.5.6 Household-level Prices Received by Sellers ............................................... 163 4.5.7 Aggregated Prices Paid By Traders in Markets .......................................... 164 4.5.8 Sales Volumes ............................................................................................. 164 4.5.9 Integration of Markets ................................................................................. 165 4.5.10 Number of New Markets and Entrants into Value Chains ......................... 165 4.5.11 Effects on Production Decisions or Output Response ................................ 165 4.5.12 Decision-Theoretic Approaches .................................................................. 166 4.5.13 Revealed and Stated Preferences ................................................................ 166 4.5.14 Difference in the Approach Used In This Dissertation with Those in Existing
Literature ..................................................................................................... 167 4.6 Sources and Channels of Obtaining Information in Mozambique .................. 172 4.7 Theoretical and Empirical Models of Reception of Market Information and
Prices Obtained ............................................................................................... 177 4.7.1 Model of Receiving Information and Its Impact on Market Participation .. 178 4.7.2 Model of Receiving Information and Its Impact on Prices Received ......... 180 4.7.3 Econometric and Statistical Concerns ........................................................ 181
4.7.3.1 Endogeneity .......................................................................................... 182 4.7.3.1.1 Measurement Error in Prices Obtained—a Dependent Variable .. 182 4.7.3.1.2 Simultaneity .................................................................................. 187 4.7.3.1.3 Omitted Variables Bias ................................................................. 188
4.7.3.2 Identification ........................................................................................ 188 4.7.3.3 Attrition Bias ........................................................................................ 188 4.7.3.4 Multi-colinearity and Heteroscedasticity ............................................. 189 4.7.3.5 Transformation of Continuous Variables ............................................. 189 4.7.3.6 Rural Price Inflators ............................................................................. 190 4.7.3.7 Heterogeneous Effects .......................................................................... 190
4.8 Descriptive and Econometric Analysis of Factors that Affect Reception of Market Information ......................................................................................... 191
4.8.1 Staple Crops Grown .................................................................................... 198 4.8.2 Ownership of a Radio ................................................................................. 198 4.8.3 Presence of a Cell Phone Network .............................................................. 198 4.8.4 Availability of Electricity............................................................................ 200

xi
4.8.5 Ownership of Means of Transport and Access to Roads and Public Amenities .................................................................................................... 200
4.8.6 Belonging to Farmer Associations .............................................................. 202 4.8.7 Access to Extension Services ...................................................................... 204 4.8.8 Gender of Household Head ......................................................................... 204 4.8.9 Family Size and Age of Household Head ................................................... 205 4.8.10 Education and Literacy Level of Household Head ..................................... 206 4.8.11 Size of Land Holdings and Farm Assets ..................................................... 207 4.8.12 Geographical and Administrative Setting ................................................... 208 4.8.13 Agro-Ecological Zones ............................................................................... 209
4.9 Descriptive and Econometric Analysis of Reception of Information on Market Participation .................................................................................................... 212
4.10 Descriptive and Econometric Analysis of Reception of Information on Prices of Maize Received ............................................................................................... 215
4.10.1 Econometric Models Evaluation ................................................................. 215 4.10.2 Descriptive and Econometric Results of Information on Prices Obtained . 220
4.11 Cost-Benefit Analysis of Information Search ................................................. 225 4.11.1 Model Parameters ....................................................................................... 226 4.11.2 Estimated Benefits Analysis ....................................................................... 231 4.11.3 Costs, Cost-Benefit Ratios, and Sensitivity Analysis on Search Modes .... 232 4.11.4 Sensitivity Analysis on Quantity Sold ........................................................ 239 4.11.5 MIS Operational Costs in Mozambique...................................................... 241
4.12 Main Findings and Their Implications for MIS Design .................................. 242 4.13 Limitations of the Study and Areas of Further Research ................................ 248
5 SUMMARY, CONCLUSIONS, AND AREAS FOR FURTHER RESEARCH .... 250 5.1 The Links between Chapters ........................................................................... 250 5.2 Consistencies and Inconsistencies between Conceptual Issues and Analysis
Results ............................................................................................................. 252 5.3 The Key Messages and Future Research Questions ....................................... 254 5.4 Some Policy and Operational Implications of The Findings .......................... 255
APPENDICES ................................................................................................................ 259
APPENDIX A THE INFORMATION NEEDS OF STAKEHOLDERS AND EXPERIENCES OF CURRENT AND EMERGING MIS MODELS .................... 260
A. 1 Introduction ..................................................................................................... 260 A. 2 Information Received and Information Needed by Stakeholders ................... 261
A.2.1 Information Received and Needed By Users in Mali, Guinea, Senegal, and Niger ........................................................................................................... 261
A.2.2 Information Received and Needed By Users in Mozambique .................... 267 A.2.3 Information Received and Needed By Users in Ethiopia ........................... 276 A.2.4 Information Received and Needed By Users in Zambia............................. 285 A.2.5 Summary and Implications ......................................................................... 291
A. 3 Public MIS ...................................................................................................... 294 A.3.1 The Mozambique Information System for Agricultural Markets (SIMA) . 294 A.3.2 The Zambia Agricultural Market Information Center (AMIC) .................. 305

xii
A.3.3 The Ethiopia Commodity Exchange (ECX) Market Information Section .. 312 A.3.4 The Fruit and Vegetable Market News - USA ............................................ 322 A.3.5 National Agricultural Statistical Service (NASS) - USA ........................... 323 A.3.6 The Indonesian Horticultural Market Information Service ......................... 327 A.3.7 The Integrated Agricultural Marketing Information System/ Agricultural
Marketing News Service (AGMARIS-AMNEWSS) - Philippines ............ 329 A. 4 Farmer Organization-Based MIS .................................................................... 331
A.4.1 Observatoire du Marché Agricole (OMA) – Mali ...................................... 331 A.4.2 The Zambia National Farmers Union SMS Market Information Services . 337
A. 5 Private MIS ..................................................................................................... 344 A.5.1 Reuters Market Light ('RML') .................................................................... 344 A.5.2 Esoko – Ghana ............................................................................................ 346 A.5.3 KACE Market and Information Linkage System – Kenya ......................... 350
A. 6 Conclusions From Global Review and Cases Studies .................................... 352 A. 7 Checklist Used in The Case Studies for Information Providers and User In
Mozambique, Ethiopia, and Zambia ............................................................... 355 A. 8 Categories, Organizations, and Location of Providers and Users Interviewed
During Case Studies in Mozambique, Ethiopia, and Zambia ......................... 357 A. 9 Expanded Tables of MIS Characteristics ........................................................ 360
APPENDIX B Questionnaire for the Survey of Characteristics of Market Information Systems in Africa ..................................................................................................... 374
REFERENCES ............................................................................................................... 386
xiii
LIST OF TABLES
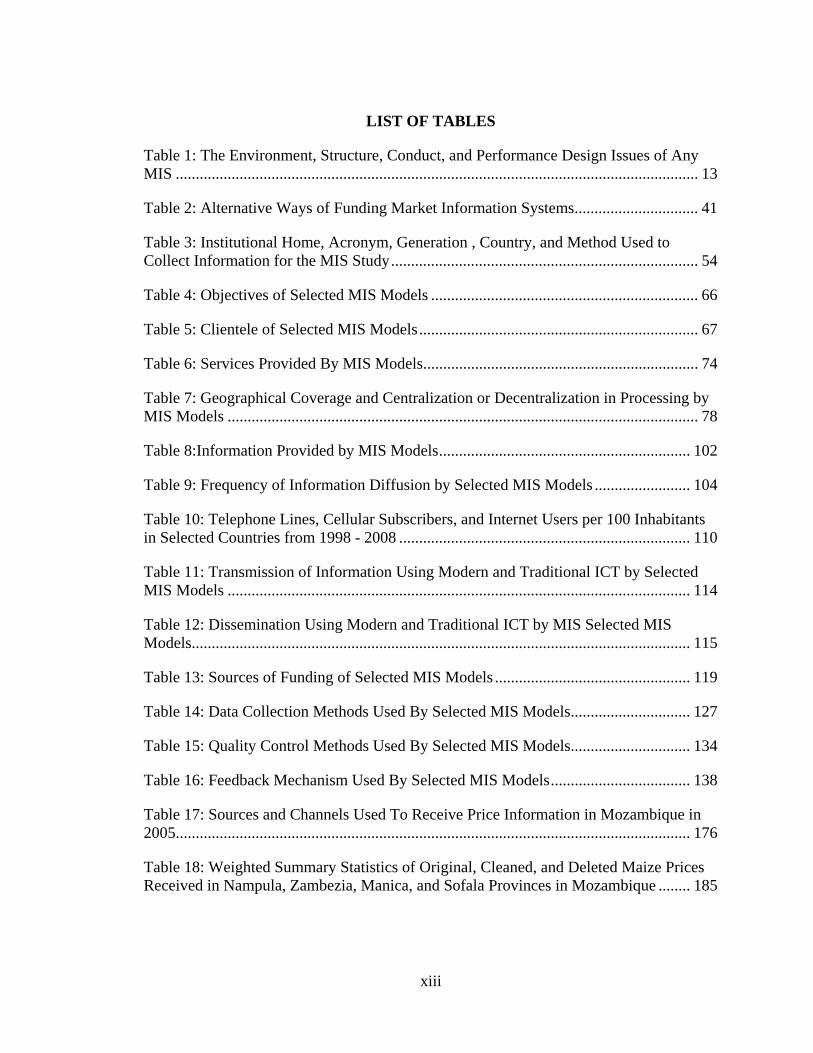
Table 1: The Environment, Structure, Conduct, and Performance Design Issues of Any MIS ................................................................................................................................... 13
Table 2: Alternative Ways of Funding Market Information Systems ............................... 41
Table 3: Institutional Home, Acronym, Generation , Country, and Method Used to Collect Information for the MIS Study ............................................................................. 54
Table 4: Objectives of Selected MIS Models ................................................................... 66
Table 5: Clientele of Selected MIS Models ...................................................................... 67
Table 6: Services Provided By MIS Models ..................................................................... 74
Table 7: Geographical Coverage and Centralization or Decentralization in Processing by MIS Models ...................................................................................................................... 78
Table 8:Information Provided by MIS Models ............................................................... 102
Table 9: Frequency of Information Diffusion by Selected MIS Models ........................ 104
Table 10: Telephone Lines, Cellular Subscribers, and Internet Users per 100 Inhabitants in Selected Countries from 1998 - 2008 ......................................................................... 110
Table 11: Transmission of Information Using Modern and Traditional ICT by Selected MIS Models .................................................................................................................... 114
Table 12: Dissemination Using Modern and Traditional ICT by MIS Selected MIS Models............................................................................................................................. 115
Table 13: Sources of Funding of Selected MIS Models ................................................. 119
Table 14: Data Collection Methods Used By Selected MIS Models .............................. 127
Table 15: Quality Control Methods Used By Selected MIS Models.............................. 134
Table 16: Feedback Mechanism Used By Selected MIS Models ................................... 138
Table 17: Sources and Channels Used To Receive Price Information in Mozambique in 2005................................................................................................................................. 176
Table 18: Weighted Summary Statistics of Original, Cleaned, and Deleted Maize Prices Received in Nampula, Zambezia, Manica, and Sofala Provinces in Mozambique ........ 185

xiv
Table 19: Test of Difference in Mean Prices between Households Disaggregated by Information, Years, and Units of Measurements in Nampula, Zambezia, Manica, and Sofala Provinces in Mozambique ................................................................................... 185
Table 20:Summary Statistics of Market Participation and Access to Market Information in Nampula, Zambezia, Manica, and Sofala in Mozambique in 2002 and 2005 ............ 193
Table 21: Estimated Parameters and Robust Standard Errors in Parentheses from the Recursive Bivariate Probit Model of Reception of Market Information and Market Participation .................................................................................................................... 195
Table 22: Agro-Ecological Zones in Nampula, Zambezia, Sofala, and Manica Provinces in Mozambique ............................................................................................................... 211
Table 23:Regressions of Reception of Market Information on Prices of Maize Received......................................................................................................................................... 218
Table 24: Parameters for Estimating the Benefits and Costs of Information Search in Mozambique ................................................................................................................... 227
Table 25: Expected Benefits from Improved Market Information in Mozambique ....... 228
Table 26: Estimated Costs, Cost-Benefit Ratio, and Sensitivity Analysis of Search of Improved Market Information in Mozambique .............................................................. 229
Table 27: Estimated Costs, Cost-Benefit Ratio, and Sensitivity Analysis on Quantity Sold and Search of Improved Market Information in Mozambique ....................................... 230
Table 28: Annual Operating Costs of SIMA in 2002 ..................................................... 242
Table 29: Non-available but necessary information to facilitate purchases and sales among selected value chain operators in Mali and Guinea in 2008 ............................... 263
Table 30: Availability of information for making buying and selling decisions among traders in Niger, 2008 ..................................................................................................... 264
Table 31: Information needed for effective planning of purchases and sales by traders in Senegal in 2008 ............................................................................................................... 265
Table 32: Information Received and Modes Used To Receive Market Information by Users in Mozambique ..................................................................................................... 271
Table 33: Information Needed and Frequency Needed By Users in Mozambique in 2009......................................................................................................................................... 273
Table 34: Information Received and Modes Used To Receive Market Information by Users in Ethiopia ............................................................................................................. 280

xv
Table 35: Information Needed, Frequency Needed, and Preferred Modes of Diffusion by Users in Ethiopia in 2009 ................................................................................................ 282
Table 36: Information Received and Modes Used To Receive Market Information by Users Zambia .................................................................................................................. 288
Table 37: Information Needed, Frequency Needed, and Preferred Modes of Diffusion by Users in Zambia in 2009 ................................................................................................. 290
Table 38: Contracted Private Radios Diffusing Market Information in Mali ................. 334
Table 39: ZNFU SMS Requests by Commodities from October 2006 to November 2007......................................................................................................................................... 339
Table 40: Categories, Organizations, and Location of Providers and Users Interviewed During Case Studies in Mozambique, Ethiopia, and Zambia ......................................... 357
Table 41: Objectives of Selected MIS Models ............................................................... 360
Table 42: Clientele of Selected MIS Models .................................................................. 361
Table 43: Services Provided By Selected MIS Models .................................................. 362
Table 44: Centralization or Decentralization in Processing, Geographical Coverage, Range of Commodities, and Markets Covered By Selected MIS Models ...................... 363
Table 45:Information Provided by Selected MIS Models .............................................. 364
Table 46: Frequency of Information Diffusion by Selected MIS Models ...................... 367
Table 47: Transmission of Information Using Modern and Traditional ICT by Selected MIS Models .................................................................................................................... 368
Table 48: Dissemination Using Modern and Traditional ICT by MIS Selected MIS Models............................................................................................................................. 369
Table 49: Sources of Funding of Selected MIS Models ................................................. 370
Table 50: Data Collection Methods Used By Selected MIS Models .............................. 371
Table 51: Quality Control Methods Used By Selected MIS Models.............................. 372
Table 52: Feedback Mechanism Used By Selected MIS Models ................................... 373

xvi
LIST OF FIGURES
Figure 1: The ICT4D Pyramid Showing the Role of ICT within Organization Compared to Within Society ............................................................................................................ 108
Figure 2: Ethiopia Total Coffee Exports from 2000-2009 in '000 60 kg bags ............... 277
Figure 3: Organizational Chart of SIMA and SIMAP in Mozambique .......................... 304
Figure 4: Organizational Chart Showing the Position of AMIC and AMIS in Zambia . 310
Figure 5: Organizational Chart of the Ethiopia Commodity Exchange Showing the Position of the Market Information Activities ................................................................ 320
Figure 6: Monthly SMS Requests For the Top Four Most Requested Commodities in ZNFU SMS MIS ............................................................................................................. 340

1
1. INTRODUCTION
1.1 Introduction
The importance and use of improved agricultural market information in developing
economies increases with the transformation of agriculture from diversified-subsistence
to more specialized-commercial production. As farmers move away from subsistence
agriculture to commercial agriculture, they interact more with traders and other actors in
input and output markets, and information becomes the lubricant that facilitates such
exchanges.
In high-income countries, the spread of the internet has transformed the way some
goods and services (e.g., information, new knowledge, and software) are produced.
There is increasing peer production and sharing of information by individuals, for
example through Wikipedia, and the development and use of open-source software. The
increase in the use of the internet has enabled the social production of some goods and
services that were previously produced through the market using capital-based firms
(Benkler, 2008). In low-income and middle-income countries, however, the peer-
production and sharing of information and new knowledge is still limited within smaller
social networks due to the limited or costly use of some Information and Communication
Technologies (ICT), especially the internet and cell phones, implying the need for formal
information production systems to provide information to poor households.
Increased commercialization; the evolution of market structure (e.g., the increase
in the number of commodity buyers and sellers); the changes in vertical coordination
arrangements from state-organized cooperatives and marketing boards to spot markets,
private trade, and group marketing (Rashid, et al., 2008); the changes in pricing methods

2
(e.g., use of open auctions in commodity exchanges); the spread of ICT such as cell
phones, internet, and private FM radios; and enabling government policies (e.g.,
privatization and liberalization) increase stakeholders’ demand for market information on
one side, and broaden peoples’ choices of sources of information on the other side,
including market information systems (MIS). As a result of the above factors, several
types of market information systems have emerged, with some substituting, competing or
complementing each others’ roles.
1.2 Problem Statement and Research Objectives
Historically, many agricultural Market Information Systems have faced two main
problems: (1) they often failed to meet the informational needs of the stakeholders, and
(2) they frequently were not financially sustainable once donor support was withdrawn
(Aldridge, 1999, Holtzman, et al., 1993, Shepherd, 1997). In their initial stages in early
1990s, MIS were often not designed to involve the users in the design and to understand
the information needs of different users; instead, they were usually designed to collect
mostly price information on a wide range of commodities, often without much attention
to quality differences, making the information collected of limited value. In addition,
they covered vast geographic areas; had poor data collection, transmission and
dissemination methods; and were not well managed (Holtzman, et al., 1993). Other MIS
faced problems of duplication of activities and political interference in some cases
(Shepherd, 1997). Indeed, lack of financial sustainability can also be viewed as failing to
meet the needs of the users such as donors, governments, private companies, and
researchers who could potentially pay for the information products —i.e., some users
3
such as donors and governments do not pay for MIS products because they do not meet
their needs and expectations.
The emergence of many MIS models has created debate among stakeholders such
as governments, donors, charity organizations, and researchers in terms of what MIS are,
who their stakeholders are, what activities they conduct, and the kind of information they
produce. There is also debate about who should provide the different information
products to users: should it be the state-, private-, farmer organization-, or trader and
NGO-based MIS? There is debate about who should provide the purchasing power to
convert the information needs of poor stakeholders such as smallholder farmers and
small-scale traders into effective demand for information, e.g., by paying for the
information directly, or indirectly through state and donor budgets.
For example, currently, there is a premise that the increase in cell phone and
internet use may help MIS to become financially sustainable, especially due to more
private-sector involvement in their provision and financing. These arguments may not
take sufficient account of other factors such as the environment in which the MIS operate
(e.g., supportive government policies, macro- and social- economic indicators, market
structure, coordination arrangements, pricing methods, agro-climatic conditions, effective
demand among users, seasonality of crop production, and security) that could also be
preconditions to the financial sustainability of MIS. Moreover, it has been historically
argued that low effective demand and supply of some types of market information is
partly due to market failures caused by “public good” characteristics of information
demand and supply such as nonappropriability and non-rivalry and other characteristics
such as indivisibility, quality uncertainty, and perishability. These characteristics of
4
information have meant that the private sector is likely to under-invest in the provision of
certain types of information—thus the need for some public financing to complement the
investment in MIS activities through the private sector, the public sector, farmer
organizations, or through trader and NGO-based MIS.
Presently, there is limited detailed and systematic analysis of the strengths,
weaknesses, and complementarities of public-, private-, farmer organization-, and trader
and NGO-based MIS models in Sub-Saharan Africa (SSA) in terms of supplying
agricultural market information. To guide future investments in provision of improved
agricultural market information that meet stakeholder needs, such analysis is needed.
Researchers have not developed a systematic framework to guide the analysis and design
of alternative MIS models, with the exception of the one developed by Aldridge (1992),
which analyzes the alternative institutional arrangements for the production of market
information products in state-based MIS using the transactions cost framework (Aldridge,
1992). With this background, this dissertation addresses the following key questions.
1. What evidence is there that supports the premises that the new MIS models, which
are mostly based in non-government organizations and mostly rely on cell phones and
the internet to collect and diffuse information, are likely to meet user needs and
become financially sustainable in comparison to the first-generation MIS models that
are typically housed in state departments or state-supported?
2. How have different MIS models tried to address the generic design issues of any MIS
and what are the relative advantages of different models of MIS in addressing those
issues?
5
3. What factors affect the reception of improved agricultural market information among
smallholder farmers in the context of Mozambique; and how does reception of
improved agricultural market information affect their marketing behavior?
The specific hypotheses related to objective 3 in this dissertation are stated in chapter 4
after the appropriate conceptual materials are presented in chapter 2 and 3 that help frame
the hypotheses. Answering these questions requires developing a typology of the
structural, conduct, and performance issues of different MIS models, and then conducting
a comparative analysis of the models. Building on Aldridge’s framework and on
guidelines developed by researchers at Michigan State University over the past 20 years
(Dembélé, et al., 2000, Weber, 2005), this study uses concepts from industrial
organization and information theory to develop an analytical framework to guide the
answering of the key research questions above.
The rest of this chapter is organized as follows. Section 1.3 defines an MIS and
improved agricultural market information, divides MIS into different categories, and
gives examples for each category. Section 1.4 presents the conceptual framework and
theoretical tools. Section 1.5 presents the analytical framework based on the Structure,
Conduct, and Performance paradigm. Section 1.6 discusses the sources of data. Section
1.7 describes the contributions of the dissertation, and section 1.8 outlines the structure of
the remaining parts of the dissertation.
1.3 Market Information Systems and Improved Agricultural Market Information
In this study, a Market Information System (MIS) is considered to be an organization or a
group of organizations that: (1) collects and transmits data to a processing center, (2)
processes and analyses the data to transform it into market information, and (3)

6
disseminates market information products to different stakeholders via one or more
dissemination channels for private and/or public decision making. Market information
includes: (1) market news (e.g., information on prices, quantities, market conditions,
regulations, and business contacts for both factor inputs and outputs), (2) market
analytical reports (e.g., reports that analyze factors that cause changes in market
conditions and their effects on stakeholders, including policy analysis), and (3) business
reports (e.g., providing information that can help stakeholders identify reliable trade
partners, including their creditworthiness).
Not all MIS produce all these products. The MIS may also gather and transmit
complementary information produced by others, such as weather forecasts. The MIS
may be based in the public-sector, private-sector, a farmer organization, a trader
organization, or an NGO. The information is generated from processes that take place
before, during, or after the exchange of rights over agricultural commodities and services
between two or more parties in the different levels of the food system.
The activities of the MIS can also be viewed as the different production stages of
market information, which consist of identification of the information needs of users, data
collection, data analysis, policy or business analysis, dissemination, and coordination
among system components (Aldridge, 1992). Although Aldridge does not mention
business analysis, it could be a part of a more agribusiness-focused MIS. Thus, at each
stage, for each type of information, the MIS faces the “make or buy” decision of whether
to produce the information itself or get it from someone else. The “produce the
information itself” can include the type of “social production” of information using wiki
approaches where users can contribute information through internet and cell phone

7
updates. The “get it from someone else” can include information obtained at a cost or for
free from other sources. .The different production stages of information system can be in
different organizations for each type of information; thus there is a need to examine how
they are coordinated to produce information that meets user needs. Also, the question of
which information the MIS produces itself and which it redistributes from others
becomes a key strategic issue for the organization.
Data and Improved Agricultural Market Information
In the context of an MIS, data refers to the unprocessed figures that are collected from
market transactions (e.g., retail or wholesale prices of commodities) or from events that
can affect market transactions (e.g., complementary information on production
techniques, weather, the policy setting). They might be numeric (e.g., today’s wholesale
price of a kilogram of maize is $.50 cents in market A and $.80 cents in Market B) or
non-numeric (e.g., the bridge connecting village A and town B has collapsed due to
heavy rain, or the government has banned the export of maize this month). Data is
transformed into improved agricultural market information when it is processed,
analyzed, interpreted, and disseminated to users for making production, marketing,
consumption, and policy decisions.
Processing involves capturing the numeric data and/or non-numeric data (e.g.,
market commentary) reported by enumerators from questionnaires or forms into an
organized format such as a price database or a simple Word document. Analysis involves
tabulating, graphing, and computing estimates desired by different users for making
different private and public decisions. Examples of estimates include descriptive
statistics such as means, medians, and modes. Other types of analysis include computing

8
ranges, ratios (especially in food security and early warning analysis), percentage
changes, and time series graphs. Interpretation involves explaining the analyzed
information in relation to the decisions public and private users need to make. The
interpreted information becomes improved agricultural market information when
disseminated using one or more dissemination channels to users for making private and
public decisions. From here onwards in this dissertation, market information, or
information refers to improved agricultural market information.
MIS Stakeholders
MIS stakeholders include MIS personnel who provide the information on the supply side,
and information users on the demand side. Information users are defined by their need to
use the information generated by the MIS in decision-making. They include farmers,
farmer organization officials, traders, local and central government policy analysts and
policy makers, researchers, users in education institutions, extension officials, private
companies, donors, and consumers who directly or indirectly express needs or effective
demand for MIS information products.
The above definition of market information systems is much broader, in a sense
that it includes data and information collected from all market coordination arrangements
such as spot markets and contract transactions, than that used by the FAO, which defines
a market information service as “A service, usually operated by the public sector, which
involves the collection on a regular basis of information on prices and, in some cases,
quantities of widely traded agricultural products from rural assembly markets, wholesale
and retail markets, as appropriate, and dissemination of this information on a timely and
regular basis through various media to farmers, traders, government officials,

9
policymakers and others, including consumer” (Shepherd, 1997, Shepherd and Schalke,
1995).
The FAO definition of MIS was written before the cell phone revolution, which
has led to the increase in cell phone-based MIS that are usually operated in the private
sector like Esoko-Ghana and from farmer-based organizations like the ZNFU 4455 SMS
MIS. The categories and some examples of what are considered in this study as MIS
include:
• Public MIS: These include MIS housed in government or state departments,
ministries or autonomous bodies. Examples include the Agricultural Market
Information Center in Zambia and the Agricultural Market Information System
(SIMA1) in Mozambique. In this dissertation, MIS initiatives under autonomous
public-private partnerships, such as the MIS section under the Ethiopia Commodity
Exchange are also grouped in public MIS. Other examples of public MIS include the
Fruit and Vegetable Market News and the National Agricultural Statistics Service in
the USA.
• Farmer organized-based MIS: These include MIS under farmer organizations such
as the Malian Observatoire du Marché Agricole (OMA), which is housed in a farmer
organization (l’Assemblée Permanent des Chambres d’Agriculture du Mali) but with
strong government support, and the Zambia National Farmers' Union (ZNFU 4455)
SMS2 MIS.
1 The Portuguese names of the SIMA and SIMAP are respectively Sistema de Informação de Mercados Agrícolas De Moçambique (SIMA) and Sistema Provincial de Informacao Sobre Mercados Agro-Pecuario (SIMAP) de Nampula. 2 Short Message Service

10
• Private MIS: These consist of two groups:
o Private MIS that provide information, but are not involved in trade of
agricultural commodities. Examples include the Reuter’s Project Market Light
in India and Esoko in Ghana.
o Private MIS attached to emerging commodity exchanges such as the KACE
(Kenya Agricultural Commodity Exchange) Market and Information Linkage
System located in a private-sector based commodity exchange.
• Trader and NGO-based MIS: This category consists of MIS based in trader
organizations or associations such as the Regional Agricultural Trade Intelligence
Network (RATIN), which is housed in a trader organization (Eastern Africa Grain
Council (EAGC)); and the Rice Observatory (OdR), which is like a consortium of the
rice value chain actors in Madagascar.
Organizations that amalgamate market news from secondary or administrative sources
alone, e.g., Fewsnet and INFOCOM and INFOSHARE under the United Nations
Conference on Trade and Development, are not considered in this document as an MIS.
Nonetheless, some of the MIS described above also distribute complementary
information (e.g., weather forecasts and foreign exchange rates) produced by others along
with the information they compile themselves. Also, not all improved market
information comes through MIS. For example, improved cell-phone access can improve
actor’s access to market information without a formal MIS—a point that is discussed in
section 4.5.2.

11
1.4 Conceptual Framework and Theoretical Tools
The MIS enter formal and informal contracts with different stakeholders in a broad sense,
to provide information. MIS activities are viewed as production stages of information
that under different situations has “public good” characteristics of nonappropriability
(high exclusion cost) and non-rivalry and other characteristics such as indivisibility,
quality uncertainty, and perishability, as defined below in section 2.2. Several factors
then interact to affect the way the MIS meets the needs and demand of the various
stakeholders. Moreover, some stakeholders have conflicting interests and incentives that
are not aligned with having the MIS meet user needs and to be sustainable. Thus,
concepts from welfare economics; information theory; industrial organization such as
Structure, Conduct and Performance (SCP), sub-sector analysis; institutional economics;
and organization theory are used to analyze how the increase in modern ICT (especially
the cell phones and the internet); the market structure, coordination arrangements, pricing
methods; and government policies have allowed MIS to overcome some of the
characteristics of information such as indivisibility, nonappropriability, non-rivalry,
quality uncertainty, and perishability that have limited private provision of such
information at socially desirable levels. These concepts are also used to analyze the
different options of providing and funding of MIS activities, the different ways of
coordinating the MIS production stages and how to align incentives of MIS workers to
induce them provide information that meets user needs. Also, themes from the literature
12
on Information and Communication Technologies for Development (ICT4D) are used to
examine the role of ICT in the conduct design issues and performance of MIS.
1.5 Analytical Framework: Structure, Conduct, and Performance of MIS
This section presents the analytical framework used in the analysis in this dissertation
based on Structure Conduct and Performance (SCP) paradigm. Table 1 outlines the
environment in which the MIS operate, their distinguishing structure and conduct design
issues, and their performance issues. These features can vary from country to country; a
detailed analysis and examples of the environment in which the MIS operate are given in
chapter 2 and that of the structure and conduct design issues are given in chapter 3.
1.5.1 The Environment in which the MIS Operates
The environment in which MIS operates includes: (1) government policies, (2) some key
macro-economic indicators and social-economic characteristics (e.g., inflation levels,
interest rates, GDP from agriculture, employment, transport and feeder roads, market
infrastructure, storage and credit facilities, literacy and education levels, and user voice);
(3) the market structure, vertical coordination arrangements, and price discovery methods
in the market; (4) agro-climatic conditions, pests and diseases; (5) the level of ICT usage
in a country; (6) the geographical setting; (7) cultural factors; (8) lack of effective
demand for improved information by some users; (9) seasonality of crop production; and
(10) the level of security in a country. A detailed analysis of the environment in which
the MIS operates is discussed in section 2.3.

13
Table 1: The Environment, Structure, Conduct, and Performance Design Issues of Any MIS The Environment in which the MIS operates: (1) Government policies, (2) key macro-economic indicators and social-economic characteristics (e.g., inflation levels, interest rates, GDP from agriculture, employment, transport and feeder roads, market infrastructure, storage and credit facilities, literacy and education levels, and user voice); (3) market structure, vertical coordination, and price discovery methods; (4) agro-climatic conditions, pests, and diseases; (5) the level of ICT usage in a country, (6) geographical setting; (7) cultural factors; (8) lack of effective demand for improved information by some users; (9) seasonality of crop production; and (10) security. Structural design issues Conduct (behavior) design issues Performance (outcomes) 1. MIS’s perceived mandate (Aims, objectives, and clientele)
• Policy formulation and monitoring • Food security planning and monitoring • Attainment of efficient markets • Attainment of “fairer1” agricultural markets • Clientele (e.g., farmers, traders, consumers,
government, donors) 2. Institutional home, organization, and coordination
• Public-, private-, farmer organization, or trader and NGO-based MIS
• Provides complementary services that generate or increase value of information
• Geographic coverage and range of commodities • Assuring coordination among stages
o Integration of MIS Activities o Centralized or decentralized MIS activities o Specialization in MIS Products
• Design of incentives for MIS staff • Profit orientation of the MIS
3. Nature of commodities covered (e.g., staple, cash, or perishable commodities)
1. Information provided • Market news • Market analysis • Business reports
2. ICT used in transmission and diffusion • Traditional ICT (e.g., radio,
television, and fax) • Modern ICT (e.g., email,
internet, SMS) 3. Funding strategies 4. Data collection methods used
• Structured questionnaire and enumerators
• Wiki approach (users SMS or update web)
5. Quality control methods used 6. Feedback mechanism used
1. Reliability 2. Credibility 3. Accessibility to different
clientele 4. Timeliness 5. Sustainability of MIS
• Financial support • User support • Cost minimization
Some Impact Indicators 1. Production, marketing, and
consumption behavior 2. Revenues (income)
obtained 3. Reduction in transaction
costs 4. Welfare changes among
actors 5. Integration of markets 6. Policy decisions and
outcomes
1. “Fairer” relates to the political judgment about the distributional outcomes of a policy or intervention. The outcomes may be income, prices or quantity obtained, or participation in a program and may lead some sections of the population to be worse-off while others are made better-off, depending on the weights used in computing what is “fair”.

14
1.5.2 Structural Design Issues
In SCP analysis, structure refers to the relatively stable features that influence the rivalry
among the buyers and sellers operating in a market (Caves, 1992). Some examples of the
elements of structure include the number of buyers and sellers in the market, barriers to
entry and exit, and the vertical coordination mechanisms. This concept is modified to be
applicable to an information sub-sector. The key structural design issues include: (1)
MIS’s perceived mandate (aims, objectives, and clientele served), (2) institutional home
and related organizational and coordination features, and (3) the nature of the
commodities covered by the MIS (e.g., staple, cash, or perishable commodities). It is
noted that in typical SCP, structure relates to the features in the market or industry in
which firms operate. This means that some of the elements included in the environment
in section 1.5.1 fall under structure when SCP is used to analyze firms in the market or
industry. In this dissertation, structure relates to the stable features or characteristics of
the MIS themselves and not the features in the market in which the MIS operates. These
structural features are affected by the environmental features identified in section 1.5.1
that influence the key MIS structural design issues, and consequently performance of the
MIS. The rational is that the MIS structure is an adaptation to the environment in which
it operates. A detailed discussion and synthesis of these structural design issues from MIS
experiences around the world is given in section 3.5.2.
1.5.3 Conduct Design Issues
In the SCP analysis, conduct refers to the patterns of behavior that market participants
adopt to affect or adjust to the markets in which they sell or buy goods and services
(Caves, 1992). Examples of conduct include price-setting behavior and buying and

15
selling practices. In the context of an MIS, the key conduct design issues are: (1) the
information products provided and frequency at which they are provided, (2) the ICT
used in transmission and diffusion, (3) funding strategies, (4) the data collection methods,
(5) quality control methods used, and (6) the feedback mechanism used by the MIS.
Some of the conduct and structural design issues have no clear boundaries. For
example, the level of ICT in the country may be an environmental or structural issue, but
its use is a conduct feature. Likewise, the boundary between conduct and performance
features discussed below is not always clear. For example, the funding strategies of an
MIS are a conduct feature, but its sustainability, which largely depends on the funding
strategies, is considered as a performance feature. A detailed discussion of these features
with empirical examples is given in section 3.7.
1.5.4 MIS Performance Features
Performance refers to the extent to which markets result in outcomes that are deemed
good or preferred by society (Caves, 1992). Examples of performance include price
levels and price stability in the short and long term, profit levels, costs, efficiency, and
quantities and quality of goods sold or provided. The performance features of the MIS
relate to the extent to which the MIS provides information that meets different user
needs—i.e., how the MIS ensures that it produces useful products. Performance
dimensions include reliability (including accuracy), credibility, accessibility (including
digestibility), timeliness, and sustainability of the MIS. Aldridge (1992) defines the first
four as follows:

16
1. Reliability refers to data quality and accuracy, measured by the amount of errors in
the data as well as their overall utility or relevance to the uses for which the data are
intended.
2. Credibility refers to the unbiased objectivity of the statistical or analytical products as
perceived by users of the information. Credibility depends on the skills of the MIS
employees who collect and analyze the information; and the presence of structures
that protect the MIS from pressures to compromise the objectivity of the data (e.g.,
pressures from political leaders or businesses to report favorable or unfavorable
information depending on the problems they intend to solve).
3. Accessibility refers to equal access for all targeted users. This includes the capacity
of users to digest the information provided, which may require use of simple and
understandable techniques including user education (e.g., on how to interpret
forecasts). Accessibility requires identifying appropriate ICT that can be used for
direct and indirect reception of information so as to assure its static and dynamic
benefits to stakeholders.
4. Timeliness refers to the continuous and consistent diffusion of information.
Timeliness also refers to delivering the information when the stakeholders need it for
making critical production, marketing, consumption, and policy decisions. The use of
ICT and automation may increase timeliness.
The sustainability of the MIS refers to: (a) the ways it generates funding internally
(e.g., through user fees); (b) the way it mobilizes support from users, especially farmers,
traders and policy makers, to voice their support for the service so as to compel
governments through political pressure to provide information through tax revenues; and

17
(c) cost control—i.e., running the organization so as to minimize the costs of information
collection and diffusion. Such efficiency reduces the amount of funding needed for the
organization and also likely increases the willingness of users or the state and external
agencies to provide the funding. Also, the MIS may gain political support from
smallholder farmers and NGOs working in rural areas that may compel external donors to
financially support the MIS.
Some of these performance features cannot be measured or defined in absolute
terms. They can only be defined relative to the needs and decisions made by a particular
user, implying that different users have their own evaluations of the performance
characteristics. In Zambia, for example, in a case study carried out by the author, some
government policy analysts found the timeliness and quality of price data from AMIC to
be good for early warning analysis, while the traders felt that the information was not
timely and accurate to be used for trading decisions. The traders, however, found the
information bulletin useful in gauging government “thinking” —i.e., what the
government was planning to do in the food sector (e.g., planning to import food, ban food
exports, or distribute fertilizer).
Table 1 also shows some of the impact indicators that result from a well-
functioning MIS, together with several other factors in the environment. They include
production, marketing, and consumption decisions of users; revenues (income) obtained;
reduction in transaction costs; welfare changes among actors; integration of markets; and
policy decisions made by government and their outcomes.

18
1.5.5 Weakness of the SCP Framework
The main weaknesses of the SCP framework as applied to MIS are:
(1) The performance features: (a) cannot be measured or defined in absolute terms,
and (b) depend on the needs of different users. It is therefore difficult to
statistically test hypothesis on MIS performance without their absolute
measurements, nor with survey data on the perceptions of MIS users on MIS
performance indicators. One way of measuring these performance measures is to
conduct a survey among different MIS stakeholders and ask them to rank the
performance measures of the MIS.
(2) It has limited capacity to develop testable hypothesis, partly due to (a) small
sample sizes – i.e., few MIS; and (b) several unique SCP design issues within and
between MIS. These two observations mean that it is difficult to obtain statistical
values (observations) for most variables across all MIS that are sufficient for the
application of traditional statistical methods such as computing means and
standard deviations with sufficient degrees of freedom to enable the computation
of hypotheses test statistics.
1.6 Sources of Data
The analysis in this dissertation is drawn from triangulated information obtained using
three methods: (1) A global literature review of MIS in USA, Asia, and Africa; (2) Case
studies of MIS stakeholders in Mozambique, Ethiopia, and Zambia; and (3) from an
email survey (E-survey) of MIS practitioners in African countries carried out in
collaboration with the Agricultural Research for Developing Countries (CIRAD), and the
National Institute for Agricultural Research (INRA) in France. This information is

19
triangulated with data from other secondary sources such as the World Bank’s World
Development Indicators. Information was also obtained from discussions with MIS
practitioners such as researchers, providers, users, and funders during meetings and a
workshop on market information system in Sub-Saharan Africa conducted by
CIRAD/INRA and MSU in France in March 2010; and from past experience of the
author working on MIS in the East African Region. The analysis to address objective 3 is
done using statistical and econometric methods on randomly collected household data of
the Mozambique National Household Survey (Trabalho de Inquerito Agricola (TIA)).
The detailed methods used in the study are included in section 3.5 and in APPENDIX A.
1.7 Contributions of the Dissertation
This study makes the following analytic and policy contributions to MIS literature:
• Broadening and updating the definition of an MIS to take account of the changes that
have occurred in the past 10 years such as the cell phone revolution and liberalization
and privatization by governments, which have led to the emergence of many cell
phone-based MIS operated in the private sector, farmer organizations, trader
organizations, and NGOs.
• Development of a comprehensive framework built on information theory and
accounting for the environment in which the MIS operate, to conduct a cross-country
synthesis of how different MIS models have tried to address the structural and
conduct MIS design issues; and the implications for MIS design and performance in
Sub-Saharan Africa.

20
• In some ways, the dissertation is exploratory, identifying hypotheses that could be
examined empirically if one did a broader study. It is also useful in raising questions
about some a-priori assumptions about the importance of different forms of MIS.
• The study also uses econometric models to understand factors that affect reception of
improved agricultural market information, and its effects on the marketing behavior
of smallholder farmers in Mozambique. Such analyses have not been carried out in
Mozambique in the past.
• The study also contributes to literature on the costs and benefits of using radio, cell
phones, and meetings as methods of search among users in Mozambique.
• The policy contributions of this study are a list of suggestions and guidelines for
coordination and funding of public-, private-, farmer organization-, and trader and
NGO-based MIS activities in a way likely to improve on their capacity to collect,
analyze, and diffuse information that meets the needs of diverse users, subject to the
limited human, time and financial resources at their disposal. These results are useful
for informing policy makers, donors, and MIS practitioners on how to invest in MIS
in a way that increases the benefit to users.
1.8 Structure of the Dissertation
The rest of the dissertation is in five chapters and an appendix, organized as follows:
Chapter 2 covers concepts on the economics of information and their implications for
MIS design and impact. Chapter 3 presents a cross-country synthesis that examines the
premises that gave rise to the second-generation MIS models and how they deal with the
generic design issues of any MIS relative to the first-generation MIS models. Chapter 4
analyzes the impact of MIS on marketing behavior of smallholder farmers in

21
Mozambique. Chapter 5 presents the summary, conclusions, and areas of further
research. Appendix A covers a global review of MIS in Africa, Asia and USA and case
studies of MIS in Mozambique, Ethiopia, and Zambia that form the basis of the synthesis
presented in chapter 3. Two very different styles of analysis are used in the dissertation.
Chapter 3 uses a qualitative (descriptive, case-study, and exploratory) approach of
analysis, while chapter 4 uses a deductive, quantitative (statistical and econometric)
approach of analysis.

22
2 ECONOMICS OF INFORMATION: IMPLICATIONS FOR MIS DESIGN
AND IMPACT
This chapter presents the key conceptual issues related to the provision of market
information and their implications for the design of MIS and their impact. These include
the role of MIS in agricultural marketing; the characteristics of information such as
indivisibility, nonappropriability, non-rivalry, quality uncertainty, perishability; and the
environment in which an MIS operates that affects the demand and supply of market
information. The main analytical question addressed in this chapter is: given some of the
characteristics of information and the environment in which the MIS operates, what are
some of the ways of funding MIS activities?
2.1 The Role of Market Information Systems in Agricultural Marketing
In the early 1990s in sub-Saharan Africa (SSA), MIS were designed to improve market
efficiency (more competitive markets) and help attain “fairer” markets (Dembélé and
Staatz, 2000, Holtzman, et al., 1993, Keita, 2006, Shepherd, 1997, Tollens, 1994,
Tollens, 2006). This section presents a summary of some of the ways in which MIS lead
to efficient and fairer markets. In this study, the benefits of the MIS are analyzed in the
context of the decisions and actions made by private and public users.
2.1.1 Market Efficiency through Reduction of Information Asymmetries
MIS help to attain efficient or competitive markets through reduction of information
asymmetries among food system participants, which leads to reduction in transaction
costs (i.e., reducing costs of negotiating, signing, and enforcement of contracts), and
23
integration of markets through spatial and temporal arbitrage. Reducing information
asymmetries is equivalent to increasing market transparency, but it is important to note
that MIS may reduce information asymmetries without solving the problem of imperfect
or incomplete information; trading partners can have symmetric but imperfect or
incomplete information. The role of MIS in improving market efficiency is also
presented in terms of helping to establish the law of one price, where there is reduction in
price dispersion.
2.1.2 “Leveling the Playing Field” and Income Redistribution
Market information helps to “level the playing field” by increasing the bargaining power
of market players who cannot afford to collect information on their own, resulting in
“fairer” markets and income redistribution among actors. “Fairer” relates to the political
judgment about the distributional outcomes of a policy or intervention. The outcomes
may be income, prices or quantity obtained, or participation in a program and may lead
some sections of the population to be worse-off while others are made better-off,
depending on the weights used in computing what is “fair”. “Leveling the playing field”
will also normally have an efficiency impact through reducing the dead-weight loss
associated with a less-than-competitive pricing structure, although the scale of the income
redistribution typically exceeds the pure efficiency gain (Azzam and Schroeter, 1995).
2.1.3 Reduction in Risk and Efficient Allocation of Productive Resources
Improved market information helps in the reduction and managing price risks (e.g.,
stability of marketing margins) and allows market actors to make better production,
marketing, and consumption decisions that result in efficient allocation of productive
resources. For example, market information helps smallholder farmers and traders to

24
identify new market opportunities (in space, time, and scope) and reliable trade partners,
thereby improving spatial and temporal arbitrage and possibly capturing of economies of
scale due to reduction in transaction costs. In developed countries, MIS products are
commonly used in insurance contracts (e.g., yield, price, and revenue insurance) and in
derivative contracts (e.g., forward, options, and future contracts) to manage production
and marketing risks.
2.1.4 Design of Better Policy and Monitoring by Governments and Donors
MIS provide information used by governments, donors, food assistance agencies, and
researchers for (1) better policy formulation, (2) monitoring and evaluation of
development projects and programs on technology transfer, (3) food security and early
warning analysis, and (4) monetization of agricultural crops and products, including food
aid. Some of the decisions made by governments include deciding when and how to
distribute food assistance in a way that does not distort markets. Information from MIS is
also used to analyze and guide local food purchases and to promote market participation
among smallholder farmers by food assistance organizations such as the Purchase for
Progress (P4P) program under the World Food Program (WFP).
Improved agricultural market information can increase or decrease the welfare
and risks for different market actors under different scenarios. For example, when some
farmers improve their bargaining power and obtain higher prices as a result of access to
better information, some traders pay higher farmgate prices or assembly market prices for
agricultural produce. When traders cannot transmit the higher prices to consumers, their
profits reduce. Thus, under different scenarios, the welfare of some market-actors
increases or decreases when information asymmetry among market actors reduces.

25
Also, it is not necessary for all market participants to have complete and
symmetric information in order to attain efficient market outcomes. In some situations, it
is sufficient to have complete and symmetric information among a few market players in
strategic levels of the value chains in order to attain efficient market outcomes. For
instance, it is not necessary to have all volumes traded between sellers and buyers to be
“informed”. What is important is to have higher percentages of “informed” volume
traded and the “uninformed” volume traded (market transactions) will be forced by
market competition to move toward the informed competitive equilibrium. For example,
more efficient market outcomes may be achieved when information is provided to a few
more-commercialized famers (with a higher percentage of volumes traded) than to many
less-commercialized ones (with a lower percentage of volumes traded.)
2.2 Characteristics of Information That Affect Its Demand and Supply
What are the characteristics of information that affect the demand and supply of
improved agricultural market information? This section presents the characteristics of
information that are likely to limit its provision by the private sector at socially desirable
levels.
2.2.1 Indivisibility
Indivisibility means that the cost of collecting and diffusing information in an area is the
same regardless of the number of users. The argument has been that indivisibility can
lead to economies of scale in information collection and dissemination of certain types of
information, and can consequently affect supply for information because one firm can
become a monopoly in information collection (Stigler, 1961). With an information
monopolist, the advantage can be that when the low-cost information collector is

26
efficient, information users may pay lower prices. The disadvantage is that when the
monopolist uses market power, information users may pay higher prices, and poor
farmers may not afford it. The fear of an information monopolist applying market power
is one of the reasons advanced in favor of public investment in MIS. The information
monopolist could be a private firm or public sector department or unit, depending on who
controls or owns the information generated from the market transactions and the
coordination mechanisms used in the market. For example, implicitly, the Ethiopian
Coffee Exchange (ECX) controls all the coffee trading on the commodity exchange from
which information is the byproduct; thus it approximates a monopolistic supplier of
information in the coffee sector in Ethiopia. In the case of ECX, however, some types of
information generated (e.g., prices, grades and standards) are disseminated for free to
some users, such as traders and farmers, through radio, websites, and electronic
billboards.
2.2.2 Nonappropriability (High Exclusion Costs)
Nonappropriability means that when information is disseminated through some channels,
such as radio, broadcast TV, or loaded on the internet without a password, then excluding
non-paying users is impossible, and the information provider cannot recover production
costs. Market information becomes a High Exclusion Cost (HEC) good.
Nonappropriability of information may also be viewed as lack of enforcement of property
rights over information once it is disseminated or sold to the first user. Because of the
high exclusion cost, suppliers of the information cannot, through sale of the information,
recover the full costs of producing it, thereby reducing the private-sector incentives to
produce it; thus the need for the public sector to finance provision of some types of

27
information, especially those needed by the poor users, if the marginal social benefits
exceed opportunity cost of collecting the information. It is noted that the argument is for
some public financing of market information provision, which is not necessarily the same
thing as the state directly providing the information. The state could subsidize its
production by the private sector or civil society, for example.
The increase in availability of cell phones and the internet allows some types of
information to be sold to subscribing users, for example through e-mail, SMS, or a
webpage with a password, thus making information a Low Exclusion Cost (LEC) good.
In terms of performance, this reduces the free-ridership problem, and increases cost
recovery by the information provider for some types of information by MIS. It is still
possible, however, for one user to buy the information and share it with others (spillover
effects). Another problem with making information a low exclusion cost good is that
poor farmers, who cannot afford to subscribe to information, are excluded from direct
access (although they may benefit indirectly from a more competitive market resulting
from their neighbors or traders being better informed). This exclusion may conflict with
the objectives of the some MIS, especially when government, using tax payers’ money, is
one of the investors.
2.2.3 Non-rivalry (Marginal Cost of Another User/Use = Zero)
When some types of market information are disseminated using some channels (e.g.,
through broadcast radio and television, the internet without passwords, or billboards),
they can be viewed as non-rival goods because they can be listened to or viewed by many
information users at no extra cost. Goods and services that have zero marginal cost
(MC=0) characteristics can be provided depending on the structure (institutional
28
arrangement) of deciding the rules of how to cost-share (i.e., who pays the fixed vs.
variable costs), and who chooses the quality (Schmid, 2004). This then affects the
distribution of benefits between users (e.g., who gets the information first, and who gets it
last, and in which formats and channels is the information provided to different users).
This concept may be used to determine who (which users) cover fixed vs. variable
(marginal) costs, as well as the relative share of each type of cost in the total cost. For
example, one party, e.g., the government, or donors can pay the fixed costs of installing
the bill boards and other users (e.g., poor farmers) pay the variable costs (e.g., of
traveling to the billboards to watch information). This compares to price discrimination
or preferential pricing where different types of people pay different rates for the same
good. In terms of quantity and quality, the users who pay the least may be given the least
quantity and/or quality while those who pay more are given the higher quantity and/or
quality. For example, the MIS may disseminate only market news to poor farmers who
pay little or nothing at off-peak times, or for very short periods of time; and disseminate
both market news and analytical market reports to paying customers such as traders using
their preferred channels in a timelier manner. This concept may also be applied by MIS
to negotiate for air time with radios and TVs where the MIS, because of limited funds,
may seek to be allocated dissemination time in the off-peak hours at no or lower costs,
with richer private firms advertising in peak hours at a higher cost. This concept may
also be used to determine: (1) which crops the MIS focuses on (e.g., disseminating
market analysis on the main traded crop only and market news on other crops); (2)
whether the MIS only operates over a few months during the peak marketing season or
29
throughout the year; and (3) which geographical area the MIS concentrates in to diffuse
market information (e.g., main production vs. consumption areas).
2.2.4 Quality Uncertainty
Quality uncertainty means that market information users may not be able to judge the
usefulness and quality of the information provided by the MIS before they use it, leading
to adverse selection and moral hazard. When quality of a good cannot be easily
established or verified by users, such a good is called a High Information Cost (HIC)
good. In general, when buyers are uncertain about the quality of the commodity being
sold, they offer an average price, which further leads to quality deterioration, and
reduction in the size of the market (Akerlof, 1970). Other examples of how asymmetric
information affects market outcomes is in credit markets where lenders can fail to
distinguish between low and high risk borrowers, leading to credit rationing (Stiglitz and
Weiss, 1981); and when insurance companies fail to distinguish between high and low
risk customers leading to no, or “strange” competitive equilibriums (Rothschild, 1974).
Quality uncertainty makes risk-averse users under-invest in information
acquisition. For private-sector providers, incentives to produce information are reduced,
as potential clients will want to see the information before deciding whether to pay for it.
But once the information is revealed, the private client has an incentive to say that the
information is not useful to her, thereby avoiding the need to pay for it.
2.2.5 Perishability
Perishability means that some types of information lose value more rapidly than others.
For example, in fruit and vegetable markets, prices can change several times during the
day. In addition, the degree of perishability for the same information depends on the

30
client. For vegetable farmers and traders, for example, timely price information may be
much more crucial and perishable than for policy analysts, who might only need average
historical (times series data) at less frequent intervals. Thus, perishability raises the
question of which clients’ needs receive priority in the activities and investments of the
MIS.
2.3 Environment in which the MIS Operates
This section explains the environmental features identified in section 1.5.1 that influence
the key design issues, and consequently performance of the MIS directly or by affecting
the demand and supply of information in a country. The environmental features include:
(1) government policies; (2) some key macro-economic indicators and social-economic
characteristics; (3) the market structure, vertical coordination arrangements, and price
discovery methods used in the market; (4) agro-climatic conditions, pests and diseases;
(5) the level of ICT usage in a country; (6) the geographical setting; (7) cultural factors;
(8) lack of effective demand for improved information by some users; (9) seasonality of
crop production; and (10) the level of security in a country.
2.3.1 Government Policies
Government policies include how the state promotes the role of the private sector relative
to the state in the marketing of food (e.g., crop and input subsidies to producers, food
subsidies to consumers, and import and export restrictions). Government policies
influence many MIS design issues such as the mandate of the MIS and the institutional
features within the MIS such as its institutional home, whether it provides
complementary services, whether it is centralized or not, its level of autonomy, its
geographic coverage, and range of commodities covered.

31
For example, when the state offers crop and input subsidies to farmers, or food
subsidies to consumers, the MIS mandate is likely to focus on collecting information for
monitoring how markets are functioning on behalf of government. Governments need to
detect and avoid urban consumer unrest (e.g., food riots in Mozambique in 2010 and the
walk-to-work protests in Uganda in 2011) when food prices significantly increase, or to
avoid rural area unrest when producer prices decline considerably by coming up with
timely interventions using information signals gathered by the MIS. Also, when
governments allow national and regional agricultural commodity trade by the private
sector as opposed to state marketing boards, the mix of information needed by the public
and private sector actors changes as their roles in the marketing system vary. Private
users such as traders and farmers may need both national and regional market
information compared to when trade is restricted, which influences the geographical
coverage and range of commodities covered by an MIS. This implies that the MIS need
to evolve as markets evolve, and provide more regional information as a result of
government policies. Moreover, the flexibility or ability of the MIS evolve as markets
evolve becomes a key design feature of the MIS; historically, one of the arguments for
private-sector provision of services (in general—e.g., some types of extension services—
not necessarily information) is that private firms may be more agile in responding to
change than public structures.
2.3.2 Key Macro-Economic Indicators and Social-Economic Characteristics
Some of the key macro-economic and social indicators that affect the structure, conduct,
and performance of an MIS include: inflation levels, the importance of agriculture in the
country in terms of contribution to GDP, employment and proportion of consumer

32
expenditures going to basic food staples, physical market infrastructure, availability of
storage and credit facilities, the level of transportation and conditions of feeder roads, and
availability of sufficient electricity. Others include household income levels, literacy and
education levels, and the thinness of markets.
For example, employment and proportion of consumer expenditures going to
basic food staples are key factors in driving the political-economy of food price
regulation. Food price regulation needs market information to be well implemented,
which can compel governments, donors, and food assistance agencies to monitor food
market prices. This affects the MIS mandate in terms of its objectives (e.g., monitoring
food prices for food security monitoring and policy formulation) and in terms of its
targeted clienteles (e.g., government and food assistance agencies).
The need and demand for information is higher among users in countries where
there is future price uncertainty and where prices change rapidly due to variance in
inflation over time. In terms of conduct, price uncertainty and inflation imply that the
MIS need to provide more frequent information compared to those where the price levels
are relatively predictable and constant.
The literacy levels in some countries in sub-Saharan Africa are still low.
According to the World Bank’s World Development Indicators, the literacy rate among
adults aged 15 years and above was 36 percent in Ethiopia in 2004, 66 percent in Ghana
in 2008, 87 percent in Kenya in 2008, 26 percent in Mali in 2006, 54 percent in
Mozambique in 2008, and 71 percent in Zambia in 2008; compared to 63 percent in India
and Indonesia in 2006, and 94 percent in Philippines in 2008. The education and literacy
levels of the population greatly affect how the MIS collects information and how it
33
diffuses information. For example, illiterate users cannot participate in data collection
methods that involve writing. In terms of diffusion, illiterate users, who are mostly
located in rural areas, may fail to digest information received through billboards,
newspapers, email and even SMS that require reading.
In terms of MIS performance, low-income levels imply that some households may
not afford to buy ICT such as radios and cell phones that enable them to receive
information, thus affecting accessibility of information. The presence of thin markets
characterized with low volume of marketable surplus can lead to the MIS providing
prices that are unrepresentative of overall supply-demand conditions, which affects the
reliability and credibility of the information from the MIS. Also, the extent to which
farmers and users can voice their interests individually or through their leaders in support
of MIS activities can affect sustainability of the MIS.
2.3.3 Market Structure, Vertical Coordination, and Price Discovery Methods Used
Market structure: The sources and need for market information is higher when the
agricultural commodity market structure consists of many buyers and sellers compared to
when it is concentrated. For example, when farmers sell their commodities to a few
cooperatives and state-sponsored marketing boards, farmers’ sources and need for market
information is limited compared to when they sell to many traders in the absence state-
sponsored marketing boards and cooperatives. However, it can be argued that when there
are so many buyers and sellers that the market is perfectly competitive, then the market
becomes the MIS. There will be no need for an independent MIS for farmers and
consumers, as competition will ensure that farmers get a price that represents the
marginal willingness of the consumers to pay for the product, less marketing costs. The

34
presence of few buyers and sellers of agricultural inputs and outputs may indirectly affect
the mandate of the MIS, such as considering farmers and government as its main
clienteles. Indeed, the main reason why many African governments invested in the
provision of MIS was to attain “fairer” markets among market participants after
liberalization (Tollens, 2006).
Market coordination: Market coordination arrangements influence the demand of
information by some stakeholders and consequently the conduct of a responsive MIS.
For example, when farmers sell in the spot or assembly market, they need market
information on prices and quantities traded in nearby markets. However, when they sign
a long-term contract in which price and quantity is specified for that period of time, the
intensity of their information needs changes. For example, trading partners in tighter
vertical coordination methods may need information on traceability, quality, post-harvest
handling, commissions, and contract terms offered to other farmers. Some of this
information might be provided by farmers’ and traders’ trading partners rather than a
separate MIS because in tighter coordination such as in marketing contracts, some
information becomes private. This also implies that the MIS need to evolve as markets
evolve and provide information products and frequencies dictated by changes in market
coordination arrangements.
Price discovery methods: The supply of information varies with the price
discovery methods used in markets. For example, open auctions, where there are many
buyers and sellers, generate open information as a byproduct, increasing the reliability of
the data and accessibility to the data. Obtaining information as a byproduct (e.g., on a
commodity exchange) also reduces data collection costs such as allowances for data

35
collectors, vehicles, and fuel for data collection, which contributes to sustainability of the
MIS. In contrast, private treaties, which involve direct negotiations between buyers and
sellers, and which remain the most prevalent means of price discovery for staple foods in
Sub-Saharan Africa, do not generate open information as a byproduct, implying that such
information is not easily accessible unless there is a structure in place to collect it.
2.3.4 Agro-Climatic Conditions in a Country
Agro-climatic conditions such as rainfall, temperature, and soil types; and pathological
conditions such as pests and diseases may affect agricultural production and consequently
the demand for information, or may alter the information needs of users from market
news to agronomic information. For example, when there is crop failure, there is less
demand by farmers for information on marketing opportunities since farmers have little
output to sell. The demand for information for making consumption decisions may
increase, however, since many households (including farmers who are now net buyers of
food) may resort to the market as the source of food. Traders may also need increased
information at this time on alternative sources of supply.
2.3.5 Level of usage of ICT in a country
Most information is transmitted through some form of ICT such as radio, cell phones,
newspapers, email or websites. The level of ICT usage in a country, such as the
proportion of the population with cell phone subscriptions, access to the internet, and
investment in private FM radios, affects some structural, conduct, and performance
design issues of the MIS. For example, in terms of structure, ICT availability and usage
in a country influences the geographic coverage of the MIS in terms of data collection
and dissemination. An MIS cannot use SMS or telephone interviews to collect data

36
where there are no telephone services. Also, the decision for an MIS to become a profit-
making enterprise by charging user fees depend on the availability and usage of ICT such
as emails and cell phones among users.
In terms of conduct, ICT availability influences: (1) the types of information an
MIS can provide, such as market news through text messages or historical information
through email; (2) the dissemination channels such as the use of radio or cell phones; (3)
the funding strategies such as charging user fees through password protected websites,
emails and SMS; (4) the data collection methods such as use of telephone interviews or
wiki approaches where users can contribute information through internet and cell phone
updates; and (5) feedback methods such as the use of internet based customer satisfaction
surveys.
The structural and conduct features affected by ICT usage in the country in turn
affect performance in terms of: (1) reliability of information depending on the ICT used
to transmit it; (2) accessibility of information depending on the ICT used to diffuse it; (3)
timeliness of the information depending on the ICT used to transmit and diffuse it; and
(4) sustainability of the MIS due to economies of scale gained in collection and diffusion
of information and the cost-recovery by the MIS during diffusion. The details of the
effects of ICT as a conduct feature in MIS performance are given in section 3.7.2 below.
2.3.6 Geographic Setting
Another factor in the environment in which the MIS operates includes the geographical
setting of the countries. For example, land-locked countries have a greater range of
prices between import- and export-parity prices, so farmers and consumers typically face
greater price variation than in coastal countries (in the absence of trade restrictions),

37
thereby increasing demand for market information ceteris paribus. This may influence
the mandate of the MIS in terms of objectives of the MIS and the clientele it serves.
Also, countries that have greater rainfall variability, ceteris paribus, are likely to
have more volatile markets, and hence more demand for market information. In West
Africa, this effect is compounded by the landlocked effect, which leads to a larger range
between import- and export-parity prices in the landlocked countries. These Sahelian
countries historically invested earlier in MIS than did coastal West African states, which
had more stable food markets. Countries such as Niger and Mali invested in MIS in the
1980s, much earlier than several other non-Sahelian countries such as Uganda,
Mozambique, and Zambia that invested in MIS activities in the 1990s as part of the
liberalization and privatization process. The geographical setting may need the MIS to
collect information at several levels of the marketing chains, ending up with a wider
range of information collected (e.g., FOB-, CIF-, farmgate-, retail-, and wholesale prices,
and marketing costs).
2.3.7 Cultural Factors in a Country
Examples of cultural factors include the level of trust among stakeholders such as
between farmers, traders, government and the MIS, and between funders and MIS
implementers that can influence (1) the credibility of the data, and (2) the sustainability
of the MIS. Other examples include the number of languages used in the country in
relation to the literacy levels. In a few countries such as Kenya and Tanzania, there is
one national language (Swahili), which is understood by almost the whole population. In
several other countries such as Ethiopia, Mali, Uganda, Mozambique, and Zambia,
information has to be disseminated in several local languages. This affects the
38
performance of the MIS by increasing the diffusion budgets and time for contracting and
monitoring radio and newspaper diffusion.
2.3.8 Lack of Effective Demand for Improved Information by Some Users
Some information users have no effective demand for information because they have (1)
low incomes, or (2) a small level of market involvement. Many smallholder farmers and
traders in Sub-Saharan Africa are poor and lack resources to access some sources of
market information such as cell phones, the internet, radios, newspapers, and TV. This
limits their capacity to effectively demand for information. For example, in Mozambique
and Ethiopia, where the researcher conducted field visits, farmers complain about the
costs of buying batteries for their radios, and traders complain about the high cost of cell
phone air time. These two examples illustrate the impact of how changing technologies
(e.g., greater availability of crank radios, which lowers the cost of purchasing them and
consequently that of accessing the information) or policies (e.g., allowing greater
competition in the wireless telephone business, which lowers the cost of airtime for voice
and SMS) could change the quantity of market information demanded due to lower
search costs. Also, some smallholder farmers have limited or no marketable surplus,
implying that they have a small level of market involvement, at least as sellers, which
may limit demand for market information. However, even farmers who sell very little
may want market information as consumers, as they are frequently net buyers of staples.
2.3.9 Seasonality of Crop Production
Demand for some types of information is seasonal. For example, in Zambia, there is
higher demand for maize price information using SMS requests from the ZNFU 4455

39
SMS MIS during the peak marketing periods in the months of June to August, compared
to other months of the year (see section A.5.1 on the ZNFU 4455 SMS MIS).
2.3.10 Security in a Country
The level of security in the country affects the geographical coverage and range of
commodities covered by the MIS. For example, trade, and consequently market
information activities, were missing or did not operate efficiently in Northern Uganda
during the 1990s and early 2000 due to political instability caused by the Lord’s
Resistance Army (LRA) war.
2.4 Implications for Information Funding and Impact of MIS
Given some of the characteristics of information and the environment in which the MIS
operates, what are some of the ways of funding MIS activities? Table 2 gives four
alternatives for the funding MIS activities. In the first column of Table 2, baseline
conditions refer to the inherent characteristic of some information products among users.
For example, price information broadcast on radio and TV is a High Exclusion Costs
Good (HEC) among users. In the second column, structure refers to the “institutional
alternatives that people can choose to order the interdependencies created by the situation
of various technologies”(Schmid, 2004). Structures may be administrative such as
hierarchies or public structures; bargaining such as markets or private firms; or
customary. The alternative institutional structures of funding market information in a
HEC situation include: (1) Administrative funding where taxpayers’ money is used to
fund the provision of information. In low-income countries, funds from government
budgets can also be from donor funds. (2) A combination of administrative and private
effective demand of information by users such as when users invite MIS to bid to supply
40
market information (see example in Box 1 below). (3) Use of tie-in sales of market
information with other low-exclusion-cost goods and services. (4) Letting private
effective demand alone to fund the provision of information. The last column shows the
performance under each of the alternative structure and is discussed in the next
subsections.
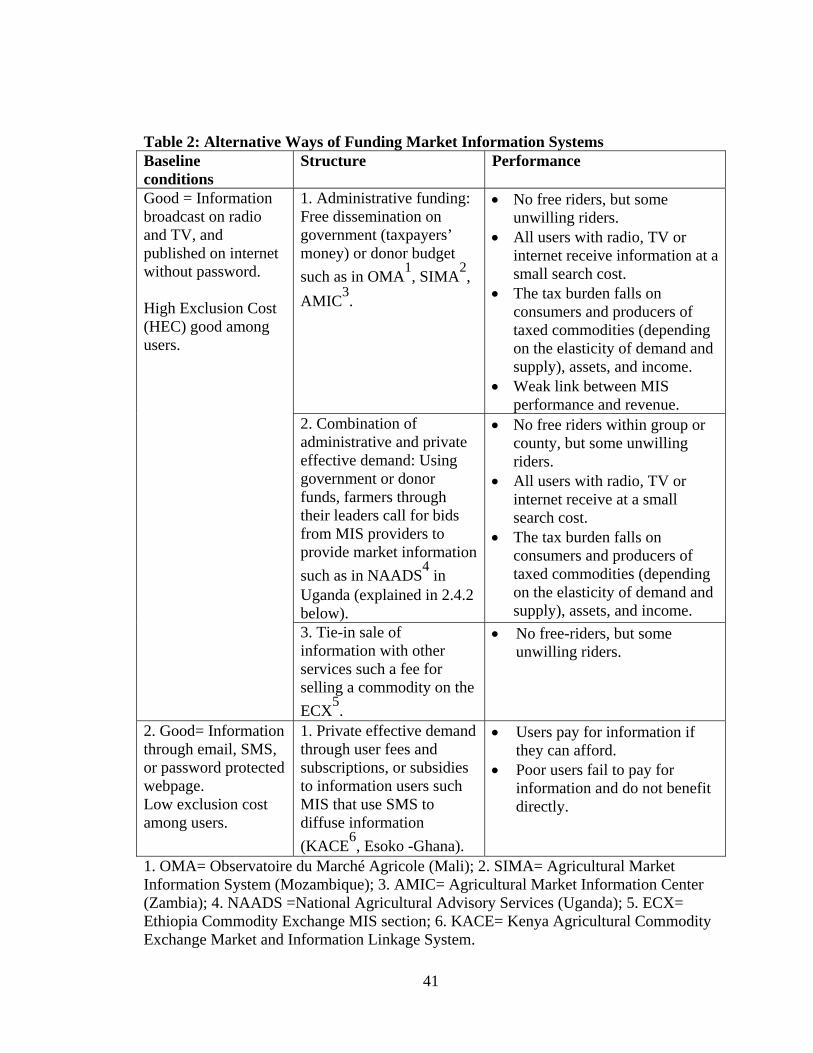
41
Table 2: Alternative Ways of Funding Market Information Systems Baseline conditions
Structure Performance
Good = Information broadcast on radio and TV, and published on internet without password. High Exclusion Cost (HEC) good among users.
1. Administrative funding: Free dissemination on government (taxpayers’ money) or donor budget such as in OMA1, SIMA2, AMIC3.
• No free riders, but some unwilling riders.
• All users with radio, TV or internet receive information at a small search cost.
• The tax burden falls on consumers and producers of taxed commodities (depending on the elasticity of demand and supply), assets, and income.
• Weak link between MIS performance and revenue.
2. Combination of administrative and private effective demand: Using government or donor funds, farmers through their leaders call for bids from MIS providers to provide market information such as in NAADS4 in Uganda (explained in 2.4.2 below).
• No free riders within group or county, but some unwilling riders.
• All users with radio, TV or internet receive at a small search cost.
• The tax burden falls on consumers and producers of taxed commodities (depending on the elasticity of demand and supply), assets, and income.
3. Tie-in sale of information with other services such a fee for selling a commodity on the ECX5.
• No free-riders, but some unwilling riders.
2. Good= Information through email, SMS, or password protected webpage. Low exclusion cost among users.
1. Private effective demand through user fees and subscriptions, or subsidies to information users such MIS that use SMS to diffuse information (KACE6, Esoko -Ghana).
• Users pay for information if they can afford.
• Poor users fail to pay for information and do not benefit directly.
1. OMA= Observatoire du Marché Agricole (Mali); 2. SIMA= Agricultural Market Information System (Mozambique); 3. AMIC= Agricultural Market Information Center (Zambia); 4. NAADS =National Agricultural Advisory Services (Uganda); 5. ECX= Ethiopia Commodity Exchange MIS section; 6. KACE= Kenya Agricultural Commodity Exchange Market and Information Linkage System.

42
2.4.1 Administrative: Government Funding Using Tax Money
The advantage of an administrative structure, where taxpayers’ money or donor money is
used to fund MIS activities and information is broadcast on radio and TV or published on
internet without password, is that there are no free-riders. All users with radio, TV or
internet can obtain information at a small search cost (e.g., of buying radios, batteries and
their opportunity cost of listening time). The provider can be a public-, private-, farmer
organization-, trader organization-, or and NGO-based MIS. The disadvantages are that
there are some unwilling riders who are forced to contribute funds to public information
provision when they do not want it. Assuming that the taxes used to finance the MIS are
imposed on goods and services rather than assets or incomes, the tax burden (incidence of
the taxation) falls on consumers and producers of taxed commodities or services
depending on the elasticity of demand and supply. For example, the tax incidence will
largely fall on consumers with inelastic demand for the taxed commodities or suppliers
facing elastic demand for the taxed commodities (e.g., in the case of a marketing
assessment of goods whose prices are covered by the MIS broadcasts). Also, lack of
sustainability emerges when governments or donors withdraw funding. Another
disadvantage is that users who are unable to pay taxes (e.g., poor users) may face
punishments of failure to pay their taxes when they exist. Another performance aspect of
funding MIS using tax money is that the direct link between how well the MIS does its
job and its revenue may be weaker than in a user-fee based system, thereby reducing the
incentives for good performance. Note that the provider can be a government or non-
government MIS.
43
2.4.2 Combination of Administrative Funding, Donor Funding, and Private
Effective Demand
Another institutional structure, when information is a high exclusion cost good, is a
combination of administrative funding, donor funding, and relying on private effective
demand for funding. In this structure, using government tax funds or donor funds and
some matching funds from local governments (also taxes), farmer organizations or local
government units (e.g., at county or sub-county level) can be given funds to pay for
market information from MIS. The contract of information provision can also be at a
national level such as in Mali’s OMA. The provider can be a public-, private-, farmer
organization-, trader organization-, or and NGO-based MIS. Farmers and traders through
their leaders may call for bids from MIS providers to provide market information, e.g.,
through radio, SMS, or meetings. This funding model is possible when the MIS provides
multiple products, some of which can be sold to generate revenue (to cover both variable
and some of the fixed costs), and others are provided for free to users. The OMA in Mali
follows this model, charging for custom analyses carried out for private businesses or
consultants, but providing market reports on the radio for free.
In the National Agricultural Advisory Service (NAADS) programs in Uganda,
one of the services farmers could procure was market information. Farmers through their
groups identified the advisory services and technologies they needed, which they
forwarded to an elected Sub-county Farmer Forum (SFF). The SSF amalgamated all
service requirements from eligible farmers groups, ranked, scored and selected the top
prioritized services needed by farmer groups. A procurement committee awarded the
service contracts. The signing of contracts involved four parties: the sub county chief,
44
the farmer forum chairperson, the service provider and the sub-county NAADS
coordinator who acted as a witness. Once contracts had been signed, service contractors
provided the services to farmers groups and reported accomplished tasks to the sub-
county chief. The tasks of assessing quality and monitoring the service provider’s
performance was done by the SFF, which reported the performance results to farmers, the
sub county chief and district farmer fora (NAADS, 2004). A small percentage of the
money came from taxing farmers. This percentage was matched by government and
donor money, but with farmers given a chance to voice their needs through their leaders.
In more recent years, however, this process has been marred by some problems. After
some time, in some districts and sub-counties, farmers complained that the process was
hijacked by prominent farmers and politicians, and service delivery was interrupted by
government in a bid to control alleged corruption in the procurement process.
The performance under this structure (i.e., a combination of administrative
funding, donor funding and private effective demand) is similar to the first one in some
aspects. Farmers and traders with radios, TVs or cell phones receive information at a
small search cost. The incentive to free-ride emerges when funding is provided at
neighboring-small-administrative units that are empowered to choose the services they
can procure. The free-rider problem may also be considered as a spillover effects among
users. Some administrative units may not like to contribute but will listen to information
for free, and service provision may collapse because it is difficult for the information
provider to recover production costs. As a result, the market fails to provide the optimal
levels of information that society demands. In Mali, contracting for the provision of
information is at the national level, but with a mix of funding sources from public and

45
private sector. The contracting the provision of information at the national level
overcomes some of the free-rider/ spillover problems between local units of government
described above.
Another problem is that prominent farmers and politicians may determine what
information is provided instead of ordinary farmers, especially when there are no
channels through which farmers express their voices, such as regular meetings and
election of farmer leaders.
46
2.4.3 Tie-in-sale of Market Information and Members Fees
Another administrative option is a tie-in sale of market information with other low-
exclusion-cost goods. Examples given by Olson are the lobbying organizations such as
the American Farm Bureau that sell insurance at lower costs to farmers only after they
pay membership fees. Part of the fees help to provide high-exclusion-cost good of
lobbying for legislation that benefits all farmers, some of whom may not be members
(Olson, 1965). Tie-in-sales of information can be introduced in commodity subsectors
with tighter vertical coordination mechanisms or where trading can be easily regulated at
strategic levels in the production stages of the subsector. The performance outcome
under a tie-in sale is that there are no free-riders, but some unwilling riders.
2.4.4 Private Effective Demand: Subscriptions Fees and Information Sales
As already noted, the use of email, SMS, or a webpage with a password can turn some
types of information into low-exclusion-cost goods. In this approach, MIS disseminate
information through excludable channels so as to recover some costs through
subscriptions and user fees when individual users request for information. Also, the
provider can be a public-, private-, farmer organization-, trader organization-, or and
NGO-based MIS. The performance outcomes under a private effective demand structure
are that (1) users pay for information if they can afford and get it, and (2) poor users fail
to pay for information and do not benefit directly. Poor users, however, can benefit
indirectly when for example a few traders obtain information and indulge in spatial and
temporal arbitrage that results in more competitive markets.

47
2.4.5 Complementarity and Endogeneity of Market Information
The provision and use of improved market information is complementary to other
government policies and programs, such as infrastructure development and provision of
security that also contribute to increased or decreased welfare among different market
actors. Thus, there is endogeneity between provision of improved market information
and other government policies that improve market performance. For example, if
information from public MIS improves government policies that in turn improve market
performance, then some other stakeholders such as farmers and traders may also benefit
from the MIS. These complementarities also introduce attribution problems in measuring
the impact of MIS. For example, in Mali, some of the benefits from market reforms,
which utilized information from the market information system, included integration of
markets, stabilization of prices, development of grain markets (entry of new traders,
expansion of investments in transport and storage facilities), increase in volumes traded,
avoidance of poor policies, and facilitation of regional integration (Dembélé and Staatz.,
1999, Diarra, et al., 2004, Keita, 2006). All these benefits are partly attributed to the
existence of the MIS. In the subsequent analysis, these challenges of attribution will be
discussed.
48
3 CROSS-COUNTRY SYNTHESIS OF THE GENERIC DESIGN ISSUES OF
EMERGING AND TRADITIONAL MIS MODELS
3.1 Characteristics and Premises for the Support of Emerging MIS
This chapter analyses the premises that gave rise to the “emerging” or “new” MIS models
and how they deal with the generic design issues of any MIS relative to the “traditional”
or “old” MIS models. The “emerging” or “new” MIS models are also referred to as
second-generation MIS while the “traditional” or “old” MIS models are also referred to
as first-generation MIS (CIRAD-UMR-MOISA, 2010, J.Rakotoson, et al., 2010). First-
generation MIS are mostly housed in government ministries, departments, or semi-
autonomous bodies. Their mandate was to help attain efficient and “fairer” markets and
to provide information for the design of better policy and monitoring market
performance. First-generation MIS mostly started in the 1980s and early 1990s and
complemented structural reforms (liberalization and privatization) in many sub-Saharan
African countries. Examples (full names of MIS in Table 3 below) of first-generation
MIS include OMA in Mali, AMIC in Zambia, SIMA in Mozambique, Siam in Senegal,
SIMA and SIML in Niger, and SIPAG in Guinea Conakry. Second-generation MIS have
the following characteristics and premises that lead to their creation and support.
1. MIS perceived mandate: Second-generation MIS aimed at helping to attain
transparent and efficient markets under the premise that public MIS had not achieved
this objective (CIRAD-UMR-MOISA, 2010).
2. Institutional home and organizational innovations: Second-generation MIS are
mostly based in the private sector, farmer organizations (with the exception of OMA

49
in Mali), trader organizations, NGOs, and other professional bodies and were meant
to be decentralized. The premise was that locating the MIS in non-government
institutions would come with high-powered market incentives that would enable MIS
to be responsive to client needs, unlike the first-generation MIS that were located in
hierarchical organizations (government departments, ministries and autonomous
organizations (with the exception of ECX MIS section in Ethiopia) ) with low-
powered hierarchical incentive structures.
3. Information provided and frequency of provision: Second-generation MIS were
meant to provide more information products beyond mostly prices and quantities
traded in markets, and provide information at more frequent intervals. Moreover,
some of the second-generation MIS evolved towards exchange models with the
characteristics of collecting and disseminating “individualized” information such as
offers and bids— such as in KACE (Kundu and Mukhebi, 2010)—or buying prices
by traders – such as in Zambia (Mulozi, 2010)—or attributes of commodities that
individual sellers wish to sell or that buyers wish to buy (Davies, 2010). This was in
contrast with aggregated information, such as average and mode prices and that first-
generation MIS provided.
4. Start years: The second-generation MIS started in the late 1990s and 2000s compared
to the first-generation MIS that started in the 1980s and early 1990s. This period also
coincided with the increase in use of ICT, especially cell phones and to some extent
the internet in sub-Saharan Africa.
5. ICT used in transmission and diffusion of market information: Second-generation
MIS were meant to have more technological invitations in terms of ICT used in

50
diffusion and dissemination. The premises were that (1) reliance on the internet and
mobile phones for transmission from market collection sites to information
processing centers would increase timeliness and reduce errors; and (2) increased
dissemination through the internet and to some extent the cell phones would also
improve on timeliness and frequency of the information provided to users and
recovery of some production costs by enabling exclusion of free riders.
6. Financial sustainability and profit orientation of the MIS: Second-generation MIS
were meant to be financially sustainable, mostly through the sale of information.
7. Data collection methods: Second-generation MIS would use wiki approaches of data
collection, where multiple users would contribute information, thereby increasing
timeliness of the MIS compared to the first-generation MIS that mostly used
structured questionnaires with enumerators in the market.
8. Quality control methods: Second-generation MIS were expected to offer superior
quality control methods compared to first-generation MIS.
9. Feedback mechanisms: Second-generation MIS were expected to offer superior
feedback mechanisms compared to first-generation MIS.
10. Overall results: Expected results were that the second-generation MIS would be (1)
timely in providing information for decision making by market actors, (2) accessible
to market actors, and (3) sustainable even when there were no external donors.
Examples of second-generation MIS include Esoko in Ghana, KACE Market linkage in
Kenya, OdR in Madagascar, ZNFU 4455 SMS MIS in Zambia, INFOTRADE in Uganda,
RML in India, RATIN in Kenya, and the ECX MIS section in Ethiopia. In the
subsequent analysis, government MIS also mean public MIS or first-generation MIS and

51
non-government MIS refer to second-generation MIS. Non-government are sub-
categorized as farmer organization-based MIS, private MIS, and trader or NGO-based
MIS.
3.2 Key Research Questions
The key questions addressed in this chapter are:
1. What evidence is there that supports the premises stated above about the second-
generation MIS models in comparison to the first-generation MIS models?
2. How have different MIS models tried to address the generic design issues of any MIS
and what are the relative advantages of different models of MIS in addressing those
issues?
a. How have the different ways MIS try to address these issues affect their
performance; subject to the (i) characteristics of information demand and
supply, and (ii) the environment in which MIS operate?
b. Whom do the different model(s) serve and how well?
c. In which areas are different MIS models complementary or competitive to
each other?
d. What is the likely evolution of MIS structures over the next 5-10 years?
3. What are the implications for stakeholders in terms of promoting and supporting
different types of MIS?
3.3 Organization of the Chapter
Section 3.4 presents a summary of the conceptual, theoretical, and analytical framework
used in this chapter. Section 3.5 presents the sources and methods used to collect the
information and data and methods of analysis. Section 3.6 describes the different ways

52
MIS deal with the generic structural design issues, their relative advantages and
disadvantages, and discusses questions (a) to (d) listed above under each structural design
issue. Section 3.7 examines the different ways MIS deal with the generic conduct design
issues, their relative advantages and disadvantages, and discusses questions (a) to (d)
listed above under each conduct design issue. Section 3.8 presents the summary of the
key observations and conclusions from the synthesis. Section 3.9 addresses question 3
concerning the implications for stakeholders in terms of promoting and supporting
different types of MIS.
3.4 Conceptual, Theoretical, and Analytical Framework
Information has characteristics such as nonappropriability, non-rivalry, indivisibility,
quality uncertainty, and perishability that have that have limited private provision of such
information to less-than socially desirable levels. Each MIS has stakeholders, including
workers, some with conflicting interests and incentives that are not aligned with having
the MIS serve the needs of other stakeholders efficiently; thus, there is a need to align
their incentives, including noneconomic inducements, to achieve MIS “viability”
(Williamson, 1981)—i.e., provide information that meets user needs and that are
sustainable. Thus, concepts from information theory and organization theory such as
high-powered market incentives and low-powered hierarchical incentives (Williamson,
1985), are used to analyze which MIS types are best suited to meet the needs of various
stakeholders under different circumstances. A key element of the analytical framework
used is borrowed from industrial organization, consisting of the SCP paradigm described
in section 1.5 and summarized in Table 1 in chapter 1.

53
3.5 Methods Used in the Study
3.5.1 Sources of Information and Data
The analysis in this chapter is based on information obtained using several sources (each
is described in detail below): (1) A global literature review of MIS in USA, Asia, and
Africa; (2) Case studies of MIS stakeholders in Mozambique, Ethiopia, and Zambia; and
(3) an email survey (E-survey) of MIS practitioners in African countries carried out in
collaboration with the Agricultural Research for Developing Countries (CIRAD), and the
National Institute for Agricultural Research (INRA) in France; and (4) and from
discussions with MIS practitioners such as researchers, providers, and funders during
meetings, and a workshop on market information system in Sub-Saharan Africa
conducted by CIRAD/INRA and MSU in France in March 2010. This information is
triangulated with data from other secondary sources such as the World Bank’s World
Development Indicators and from past experience of the author working on MIS in the
East African Region. Table 3 gives the names of MIS included in the study, grouped by
their categories identified in section 1.3, their acronyms and “generation”, country(ies) of
operation, and methods used to collect the information from each.
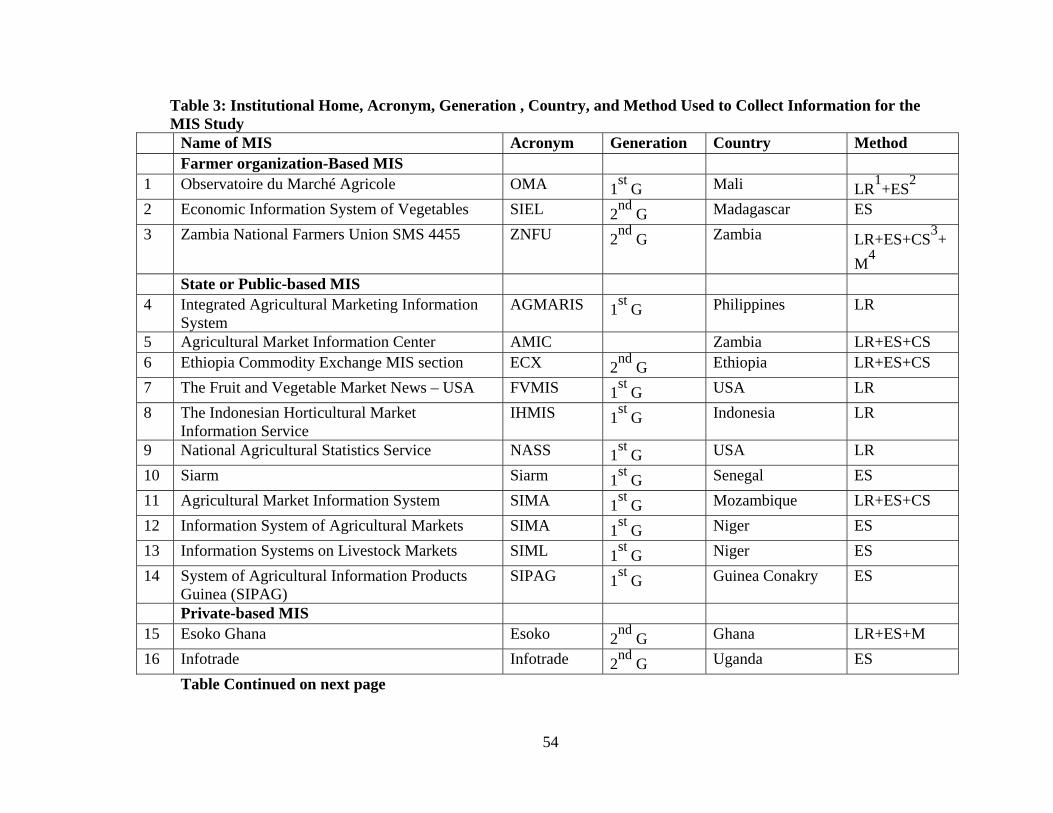
54
Table 3: Institutional Home, Acronym, Generation , Country, and Method Used to Collect Information for the MIS Study
Name of MIS Acronym Generation Country Method Farmer organization-Based MIS 1 Observatoire du Marché Agricole OMA 1st G Mali LR1+ES2 2 Economic Information System of Vegetables SIEL 2nd G Madagascar ES 3 Zambia National Farmers Union SMS 4455 ZNFU 2nd G Zambia LR+ES+CS3+
M4 State or Public-based MIS 4 Integrated Agricultural Marketing Information
System AGMARIS 1st G Philippines LR
5 Agricultural Market Information Center AMIC Zambia LR+ES+CS 6 Ethiopia Commodity Exchange MIS section ECX 2nd G Ethiopia LR+ES+CS 7 The Fruit and Vegetable Market News – USA FVMIS 1st G USA LR 8 The Indonesian Horticultural Market
Information Service IHMIS 1st G Indonesia LR
9 National Agricultural Statistics Service NASS 1st G USA LR 10 Siarm Siarm 1st G Senegal ES 11 Agricultural Market Information System SIMA 1st G Mozambique LR+ES+CS 12 Information System of Agricultural Markets SIMA 1st G Niger ES 13 Information Systems on Livestock Markets SIML 1st G Niger ES 14 System of Agricultural Information Products
Guinea (SIPAG) SIPAG 1st G Guinea Conakry ES
Private-based MIS 15 Esoko Ghana Esoko 2nd G Ghana LR+ES+M 16 Infotrade Infotrade 2nd G Uganda ES Table Continued on next page
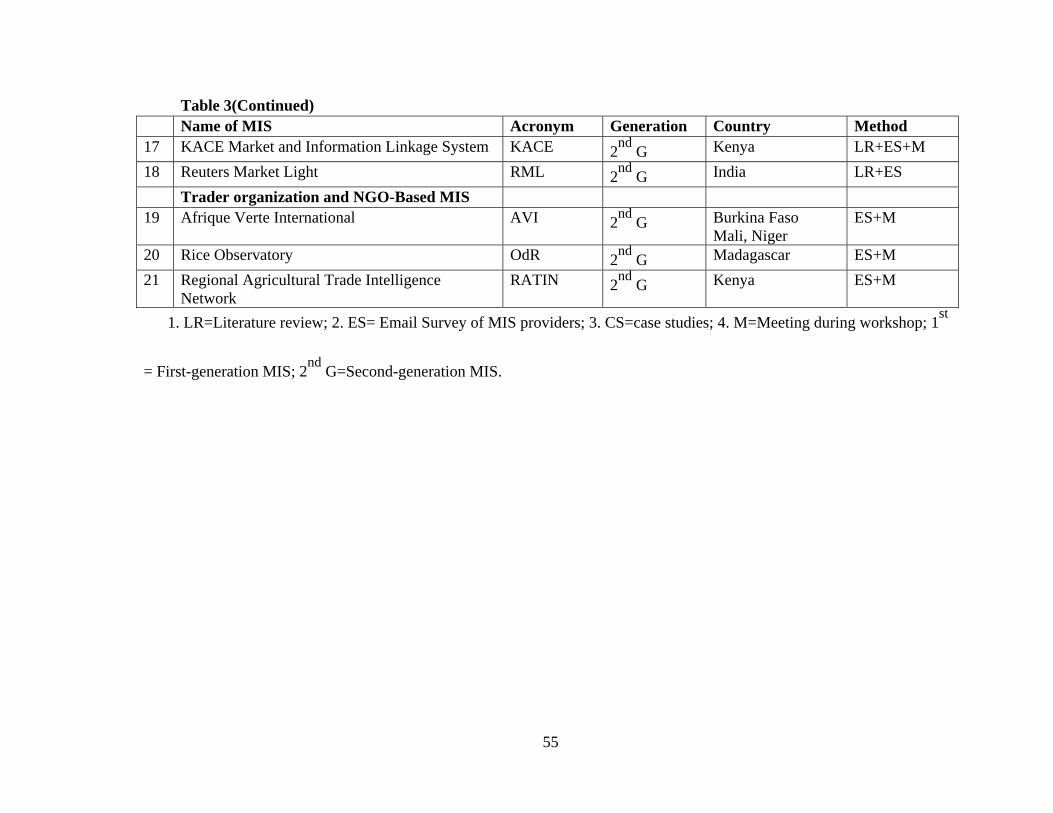
55
Table 3(Continued) Name of MIS Acronym Generation Country Method 17 KACE Market and Information Linkage System KACE 2nd G Kenya LR+ES+M 18 Reuters Market Light RML 2nd G India LR+ES Trader organization and NGO-Based MIS 19 Afrique Verte International AVI 2nd G Burkina Faso
Mali, Niger ES+M
20 Rice Observatory OdR 2nd G Madagascar ES+M 21 Regional Agricultural Trade Intelligence
Network RATIN 2nd G Kenya ES+M
1. LR=Literature review; 2. ES= Email Survey of MIS providers; 3. CS=case studies; 4. M=Meeting during workshop; 1st
= First-generation MIS; 2nd G=Second-generation MIS.

56
3.5.2 Global Review of Literature
This involved a review of documents about MIS from different countries. For each
model, the review focused on the following characteristics of interest: (1) the
organization’s perceived mandate (aims, objectives, and clientele served); (2) information
provided, frequency, and modes of diffusion (including use of ICT); (3) data collection
and quality control methods; (4) the institutional home and links with policy analysts, (5)
feedback mechanisms from users, (6) and the funding model for financial sustainability.
The process of literature review marked the beginning of compiling APPENDIX A—in
essence the beginning of data collection and tabulation for the qualitative analysis
conducted in this chapter. The appendix is therefore a major source of information used
in the qualitative analysis in this dissertation. Subsequently, a summary of the
characteristics of each MIS was tabulated and entered into a database together with other
information collected during the case studies explained in section 3.5.2 and the e-survey
described in section 3.5.4. The analysis of the information in the database consisted of
tabulating the number and percentage of the overall characteristic of interest by MIS
types (e.g., aims and objectives by government and non-government MIS) and sub-
classification of non-government MIS by their types (e.g., farmer organization-based
MIS, private MIS, and trader and NGO-based MIS), and examining whether these
characteristics clustered by MIS types. Note that the sample size was small and therefore
not sufficient to make any statistical tests and inference on several characteristics
(variables), and this weakness is pointed out in the sections 1.5.5 and 3.5.2.

57
3.5.3 Case Studies
This section gives the case study preparations and implementation including the units of
analysis, MIS selection criteria, data collection methods used within the case studies,
advantages and disadvantages of case studies, and the analysis conducted in the case
studies.
Units of analysis: The units of analysis in the case studies are three types of MIS: (1)
Two government MIS- the Mozambique Agricultural Market Information System
(SIMA), and the Zambian Agricultural Market Information Center (AMIC); (2) public-
private sector (autonomous) MIS - the Ethiopian Commodity Exchange; and (3) a farmer
organization-based MIS—ZNFU 4455 SMS MIS under the Zambia National Farmers
Union.
MIS selection criteria: No random sampling was used to select the MIS to be included
in the case studies. Instead, the MIS were purposively selected to obtain a broad
experience of the different MIS that epitomize each MIS category in SSA. The ECX was
the nearest proxy to a private MIS (replacing KACE Market Linkage, which demanded
research fees as one of its funding strategies for sustainability), although it is a private-
public autonomous MIS.
Data collection methods used in the case studies: The case study interviews in
Mozambique, Ethiopia, and Zambia were conducted with MIS personnel, especially data
collectors, who have interacted with MIS stakeholders over several years. Interviews
were also conducted with farmers, farmer group leaders, donors, large-scale traders,
governments, and food assistance organizations. Also, the study used direct observation
of during field visits. The 4 case studies vary in stakeholders covered and what

58
commodities the MIS covered. Therefore, a summary of characteristics of information
users, background information, and methods used in each country is given in section A. 2
of APPENDIX A. None of the case studies included consumers as a stakeholder group.
The information needs of consumers from previous studies, where available, are included
to give some insights.
Advantages and disadvantages of case studies: The case study approach was taken
because it can help identify factors (especially non-technological ones) that influence the
performance of MIS, but cannot accurately be estimated by sampling from a probability
distribution. In other words, no statistical inference is claimed in the case studies because
of small sample sizes and several unique features in many MIS. The disadvantages with
case studies are that they require much time and money to conduct, and also face the
problems of lack of generalization of results from one case study to another. The counter
argument to lack of generalization is that case studies can contribute to the development
of theories (induction as opposed to deduction), just like scientists generalize results
from experiments to theories (Yin, 2003).
During the case studies, selection and appointments with farmers and small-scale
traders were made with the assistance of MIS staff, NGOs, farmer organizations, and
local government officials. This may have introduced selection bias on one side, because
MIS staff, NGOs, farmer organizations and government officials could have selected
farmers and traders who can give favorable answers. On the other side, however, the
study targeted ideal information users who could give an informed opinion on the topics
of interest related to the information they receive. Interpreters were used to translate

59
responses from local languages to English for respondents who could not speak English.
This could also be a source of bias, if the interpreters translated the questions incorrectly.
Analysis in the case studies: The case studies use qualitative analysis consisting of
three general approaches (Yin, 2003): (1) defining and relying on theoretical
propositions, (2) defining and testing rival explanations from the case studies3, and (3)
developing a case description from the case studies. More specifically, the analysis in the
study uses pattern matching, explanation building, and cross-case synthesis. Cross-case
synthesis applies when analyzing an issue across two or more countries, for example,
whether the use of SMS to transmit and diffuse information increases timeliness of
receiving it by users across all MIS models.
These case descriptions from the four case studies and some qualitative analysis
unique to each MIS are included in APPENDIX A. The main characteristics (structure
and conduct issues) from the case studies were also summarized and included in the
database of MIS together with information from the global review described in section
3.5.2, the email survey described in section 3.5.4, and from the meetings and workshop
presentations with practitioners in described in section 3.5.5. The analysis of the
database of MIS is the same as that described in section 3.5.2. It consists of tabulating
the overall characteristic of interest by MIS types and examining whether these
characteristics clustered by MIS types.
3 Rival explanations means looking at rival hypotheses that may also affect the performance outcome under analysis.
60
3.5.4 Email Survey Design
This section gives the design details of the email survey including the population frame,
mail questionnaire development, MIS selection, interview timing, response rate, the
advantages and disadvantages of the mail questionnaires, and the data analysis conducted
on the collected data.
Population frame: For the E-survey, a list of MIS practitioners (population frame) was
constructed through contacts with people who have worked on MIS in Africa and Asia.
This list was complemented with a list from the Technical Centre for Agricultural and
Rural Co-operation ACP-EU (CTA), which had a mailing list of some MIS practitioners.
Main questionnaire development: The questionnaire, the English version of which is
included in APPENDIX B, had the following sections: (1) MIS identification; (2) aims,
objectives, and clientele of the MIS; (3) products covered, information collected and
geographical coverage of the MIS; (4) methods of transmission and quality control; (5)
information provided, frequency, and method of diffusion; (6) other services provided;
(7) organization and institutional aspects; (8) funding; (8) feedback; (9) changes; and (10)
additional comments.
MIS selection, interview timing, and response rate: No random sampling of MIS was
done, in essence making the exercise a census of MIS. The period of the e-survey lasted
from November 2009 to February 2010. The data collection period was long because
non-respondents were followed up multiple times. A questionnaire, mostly consisting of
pre-coded questions in English and French, was sent to 77 MIS initiatives, out of which
31 questionnaires were returned.

61
Not all returned questionnaires were useful, functional, or met the criterion of
what is defined as MIS in this dissertation as defined in section 1.3. Thus, only 17 out of
the 31 returned questionnaires are used in this analysis. The misunderstanding of the
definition of the MIS is a major issue that is discussed among MIS practitioners (CIRAD-
UMR-MOISA, 2010) and featured prominently in the workshop of MIS practitioners
discussed in section 3.5.4 below. This lack of an updated and standard definition of an
MIS also contributed to the long population frame, by including initiatives that are not
really MIS, and motivated the redefinition of what is an MIS in section 1.3.
Other reasons for the low return rate could have been (1) interview fatigue among
MIS; (2) no longer existing MIS, which can also be considered as an indicator of lack of
sustainability of MIS; or (3) no longer existing MIS, which can also be an indicator of
free entry and exit in the MIS business (i.e., indicator of a competitive MIS sector). The
third reason is theoretically possible but not practically the case. Some MIS did not want
to respond, probably thinking that the study was an evaluation, or due to interview
fatigue.
Advantages and disadvantages of email questionnaire: The advantage of the email
questionnaire is speed and low cost of data collection. The disadvantage of the emailed
questionnaire is that there is no direct observation of the interviewees to verify
observable activities like in the case of an interviewer-administered questionnaire. Also,
self-reporting used in the E-survey can induce the respondents to give biased information
(e.g., to report answers that align to those included in the project proposals, especially
when respondents know that the results will be shared with their donors, or if the study is
mistakenly considered as an evaluation). Although this advantage can apply to any

62
survey of the MIS, even one administered by an enumerator, being physically present in
the country can enable the enumerator to observe some of the things reported (e.g., one
can buy a newspaper or tune into a radio and verify diffusion of market information
reported by an MIS).
Data analysis: The information from the e-survey was entered in an access database and
later exported to Excel and merged with the information from the literature review
described in section 3.5.2 and from the case studies explained in section 3.5.2. The
analysis of the database of MIS is the same as that described in section 3.5.2. It consists
of tabulating the overall characteristics (structure and conduct design issues) of interest
by MIS types and examining whether these characteristics clustered and their percentages
by MIS types. Also, the sample size was small and therefore not sufficient to make any
statistical tests and inference on several characteristics (variables) and this weakness is
pointed out in the sections 1.5.5.
3.5.5 Meetings and Workshop
The researcher attended meetings with key informants with experience on MIS in Africa
and also attended presentations of 6 MIS providers during a workshop on “Agricultural
Market Information Systems in Africa: Renewal and Impact” in Montpelier, France from
March 29-31, 2010. Details of this workshop can be found at http://www.sim2g.org/.
The three main themes of the workshop were: (1) Overview of agricultural MIS in sub-
Saharan Africa; (2) Inventory of innovations within the MIS based on presentations of
specific cases; 3. Results (methodological or empirical) concerning the impact of MIS
(CIRAD-UMR-MOISA, 2010). The main contribution from the meeting was to refine

63
the premises that are analyzed in this chapter, and to fill in the details that were missed in
the literature review, e-survey, and the case study field visits.

64
3.6 Generic Structural Design Issues Facing Any MIS
The key generic structural design issues include: (1) the MIS’s perceived mandate (aims,
objectives, and clientele served), (2) institutional home and related organizational and
coordination features, and (3) the nature of the commodities covered by the MIS (e.g.,
staple, cash, or perishable commodities). The results presented below are the stated
responses of the MIS, which may or may not reflect reality.
3.6.1 MIS Perceived Mandate
The MIS perceived mandate relates to the aims and objectives of the MIS and its main
clientele. Understanding the perceived mandate of the MIS is essential in analyzing how
well it serves its intended clientele. One of the premises of supporting the creation of
second-generation MIS was that they would help to attain transparent and efficient
markets, and that public MIS had not achieved this objective. How do the aims and
objectives and the key targeted clientele of MIS models vary? What evidence is there
that supports the premise that non-government MIS are more likely to help attain
efficient markets than government-supported MIS?
Main Observation
Most first-generation MIS stated their main aims as attaining efficient marketing,
gathering information for making better policy formulation and for food security
planning and monitoring, and attaining “fairer” markets. In contrast, second-generation
MIS mostly saw their aims as attaining efficient marketing, linking producers to markets,
and enabling farmers to negotiate for better prices with traders (attaining “fairer”

65
markets.) Both first- and second-generation MIS consider farmers, traders, and
governments as their main clientele.
Comparison between MIS Models
Based on the literature review, e-survey, and case studies, it appears that most public MIS
state that they aim at attaining efficient marketing (82%); gathering information for
making better policy and monitoring (73%); attaining transparent markets and for food
security planning and monitoring (55%); and attaining “fairer” markets (45%). In
contrast, it appears that most non-government MIS state that they aim at attaining
efficient (competitive) marketing (50%), attaining transparent markets (60%), linking
producers to markets (40%), and enabling farmers to negotiate for better prices with
traders and for food security planning and monitoring (30%).
Total Overview
The most stated aims and objectives of MIS reported in Table 4 for 21 MIS include:
attaining efficient (competitive) marketing (67 %), attaining transparent markets (57%),
making better policy and monitoring (48%), and food security planning and monitoring
(43%). Some of these aims and objectives given by the MIS are related. For example,
attaining efficient (competitive) marketing is equivalent to attaining transparent markets.
Also, attaining “fairer” marketing is related to enabling farmers negotiate for fair prices
with traders. When attaining efficient (competitive) marketing and transparent markets
are considered as one objective, 18 out of 21 MIS aim at attaining efficient or transparent
markets. A detailed breakdown of the aims and objectives of MIS by MIS types is given
Table 4 and a breakdown by individual MIS is included in Table 41 is in section A. 9 in
APPENDIX A.

66
Table 4: Objectives of Selected MIS Models Government Non-government MIS Total
Farmer org.
Private firm
Trader org. and NGO Total
Total Number (N) and Percentage (%) N % N % N % N % N % N %
11 100 3 100 4 100 3 100 10 100 21 100Efficient (competitive) marketing 9 82 2 67 1 25 2 67 5 50 14 67Attain transparent markets 6 55 3 100 3 75 0 0 6 60 12 57Making better policy and monitoring 8 73 1 33 0 0 1 33 2 20 10 48Food security planning and monitoring 6 55 1 33 0 0 2 67 3 30 9 43Fair marketing 5 45 1 33 0 0 0 0 1 10 6 29Monitor market performance 3 27 1 33 0 0 1 33 2 20 5 24Linking producers to markets 0 0 2 67 2 50 0 0 4 40 4 19Negotiate for better prices with traders 1 9 2 67 1 25 0 0 3 30 4 19Make markets Secure/ reduce risks 2 18 0 0 1 25 0 0 1 10 3 14Increase productivity 0 0 0 0 1 25 1 33 2 20 2 10Provide price collection and distribution technologies 0 0 0 0 1 25 0 0 1 10 1 5Source: Literature review, case studies, and E-survey; N=Number; %=Percentage.

67
Table 5: Clientele of Selected MIS Models Government Non-government Total
Farmer org.
Private firm
Trader org. and NGO Total
Total Number (N) and Percentage (%)
N % N % N % N % N % N %11 100 3 100 4 100 3 100 10 100 21 100
Farmers/ Growers (small-scale) 11 100 3 100 4 100 3 100 10 100 21 100Farmers/ Growers (large-scale) 10 91 3 100 4 100 3 100 10 100 20 95Traders (crop and input small scale) 10 91 3 100 3 75 3 100 9 90 19 90Government policy analysts/makers 11 100 2 67 3 75 3 100 8 80 19 90Traders (large-scale) 8 73 3 100 3 75 3 100 9 90 17 81Food Assistance Agencies 8 73 2 67 3 75 3 100 8 80 16 76Consumers 6 55 2 67 3 75 3 100 8 80 14 67Donors 5 45 3 100 3 75 3 100 9 90 14 67NGOs 6 55 2 67 3 75 3 100 8 80 14 67Farmer associations / cooperatives 5 45 2 67 3 75 3 100 8 80 13 62Chamber of commerce 5 45 2 67 3 75 3 100 8 80 13 62Chamber of Agriculture 4 36 2 67 3 75 3 100 8 80 12 57Value Chain Actors (inter-professional) 4 36 2 67 3 75 3 100 8 80 12 57Researchers and education 6 55 1 33 3 75 2 67 6 60 12 57Banks 4 36 1 33 2 50 2 67 5 50 9 43Exporters / shippers 3 27 1 33 0 0 1 33 2 20 5 24Source: Literature review, case studies, and E-survey; N=Number; %=Percentage.
68
Key targeted clientele of MIS
Identifying key potential clients and their information needs is crucial to the sustainability
of the MIS since it is the clients who contribute financial resources or political support
that induces government or donor financial support for the MIS. Table 5 shows there is
not much difference between the stated clientele of government and non-government
MIS. For example, all government and non-government MIS stated that they consider
smallholder farmers as one of their most important clientele. Also, 91% of government
and 90% of non-government MIS stated that they consider traders as one of their most
important clientele. How well these MIS serve their stated clientele is not captured in
this study. A detailed breakdown of the MIS clientele by individual MIS is included in
Table 42 is in section A. 9 in APPENDIX A.
What evidence is there that supports the premise that non-government MIS are
likely to help attain efficient markets than government-supported MIS?
This question is related to assessing the impact of MIS, which is a challenge for several
reasons thus (Staatz, et al., 2010). (a) The first challenge is that measuring the effect of
second-generation MIS on market efficiency requires identification of the relevant
efficiency indicators (which are part of the performance indicators). Other challenges
include (b) identifying the pathways through which improved market information affects
the efficiency dimensions (and other performance indicators in general), (c) establishing
a reliable baseline against which to measure improved efficiency, (d) distinguishing
between investments in MIS and general improvements in information availability, (e)
assessing the contributions of complementary investments and policy changes that
frequently accompany the creation of MIS, (f) establishing a credible counterfactual
69
concerning the market situation that would have prevailed in the absence of the MIS, and
(g) interpreting the validity of stakeholders’ statements and governments’ revealed
preferences regarding the utility of MIS (Staatz, et al., 2010).
For example, as discussed in 2.4.5, the provision of information by public MIS is
complementary to other services such as infrastructure development, and its benefits are
endogenous with those from other government policies that also affect the welfare of
farmers, traders, and other stakeholders. Also, if information from public MIS improves
government policies that in turn improve market performance, then some other
stakeholders such as farmers and traders may also benefit from the MIS. In some
countries such as the US, private MIS also use some of the information provided by
public MIS. Therefore, it is difficult to determine which users benefit or which users are
hurt from the different MIS models due to the attribution and spillover problems. It is
also difficult to isolate the contribution of government and non-government MIS on
market efficiency especially when they co-exist, as is the case in some countries like
Zambia where there is AMIC and ZNFU 445S SMS MIS.
What are the implications of MIS mandate on their performance?
For all MIS models, their mandates influence the information provided, the frequency of
provision, whether the MIS produces its own information or concentrates on distributing
information produced by others (or some combination of the two), and the ICT used in
diffusion of information. Under different scenarios, the perceived mandate of any MIS
might influence its performance differently. For example, in terms of information
provided and frequency, many public MIS focus on providing structural and time series
information for government use in policy making and food security analysis. Since

70
policy analysis takes place at less frequent intervals, the MIS issue analytical reports at
less frequent intervals. When government-supported MIS provide only structural and
time series information, they may perform well in terms of timeliness to government
policy analysis but not for private traders who need some types of information more
frequently. However, when the government-supported MIS provide both current market
information more frequently, and structural and time series information at less frequent
intervals (e.g., in Mali and Senegal), they may perform well for both public and private
information users. This same scenario can occur for non-government MIS.
Whom do the different model(s) serve and how well?
Based on stated mandate and clientele served, public MIS more frequently see public
policy information needs as part of their mandate than do non-government MIS. For the
other main aims and objectives of helping to attain efficient and “fairer markets, no MIS
seems to have any specific niche in terms of clientele. They target all stakeholders such
as farmers and traders, depending on their mandate and the resources the MIS have at
their disposal.
In which areas are different MIS models complementary or competitive to each
other?
In terms of mandate, all MIS models compete with each other in the objective of
providing information to attain efficient and fairer markets among market participants,
especially farmers and traders.
What is the likely evolution of the mandates of MIS over the next 5-10 years?
The aims and objectives of public MIS (e.g., of gathering information for making better
policy formulation, and for food security planning and monitoring) and hence their key

71
clientele (especially policy makers and farmers) are not likely to change in the next 5 to
10 years due to the persistence (slow changes) of some of the environmental factors in
which the MIS operates. For example, there is persistent future price uncertainty in many
countries (e.g., the food crisis of 2007/08 and the current high-level of world food prices),
there is persistent variance in inflation in many sub-Saharan African countries, and there
is growing unpredictable agro-climatic conditions (cf. present debate on climate change),
and lack of effective demand for improved market information by some users. These
factors in the environment in which MIS exist are likely to create additional demand for
market information for policy analyses—particularly on the links between international
and domestic markets. Also, as incomes grow, there is likely to be an increased demand
for processed foods, and consequently a likely change in MIS mandate. Processing firms
will have specific information needs they will need filled, or are they may vertically
integrate and collect/diffuse their own information. Some of the information that farmers
or groups of farmers may need to participate in these more tightly coordinated markets
include grades and standards, food safety procedures and regulations, and traceability
compliance.
3.6.2 Institutional Home, Organizational Features, and Coordination Forms
Institutional home relates to whether the MIS is housed in the public sector, private
sector, farmer organization, trader organization, or in an NGO. Using these criteria,
second-generation MIS are mostly based in the private sector, farmer organizations,
trader organizations, NGOs, and other professional bodies. The premise was that
locating the MIS in non-government institutions would come with high-powered market
incentives that would enable MIS to be responsive to client needs, unlike the first-
72
generation MIS that were located in hierarchical organizations (government departments,
ministries and autonomous organizations) with low-powered hierarchical incentive
structures.
Organizational features relate to whether the: (1) parent institution or the MIS
provides other complementary services, especially those that generate information as a
byproduct or increase the value of information; (2) the geographic coverage (e.g., part of
a country, national, or regional) and range of commodities; (3) design of incentives for
MIS staff, such as level of staff salaries, level bureaucracy, and nature of resource sharing
rules; and (4) the profit orientation of the MIS. Assuring coordination among
information production stages relate to whether the MIS is (1) vertically integrated, (2)
conducts specialized activities, and (3) centralized or decentralized.
3.6.2.1 Provision of Complementary Services
Many MIS or the institutions in which they are housed provide complementary services,
some of which generate information as byproducts or increase the value of information
among users.
Main observation
Based on a qualitative assessment and examples, all types of MIS or institutions in which
they are housed provide complementary services, some of which generate information as
byproducts or help increase sustainability, reliability, and timeliness of information
among users. It appears that non-government MIS provide more categories of
complementary services compared to public MIS, although the performance outcomes
vary depending on the specific complementary services provided by MIS and not by MIS
types as a whole.

73
Comparison between MIS Models
Table 6 shows the number and percentage distribution of other complimentary services
provided by government and non-government MIS. The table shows that the percentage
of other complementary services provided by the MIS or organizations in which they are
housed is higher in non-government MIS than in government MIS (apart from issuance
of agricultural import, export, and transit permits, which is only done in government
MIS).
Total overview
Table 6 shows that out of the 21 MIS or institutions in which they are housed, the most
commonly provided complementary services include: training to users (62%), market
studies (52%), extension services and advice (48%), and organization, management, and
marketing services to producer organizations (43%). A detailed breakdown of the
services provided by selected MIS Models is included in Table 43 in section A. 9 in
APPENDIX A.
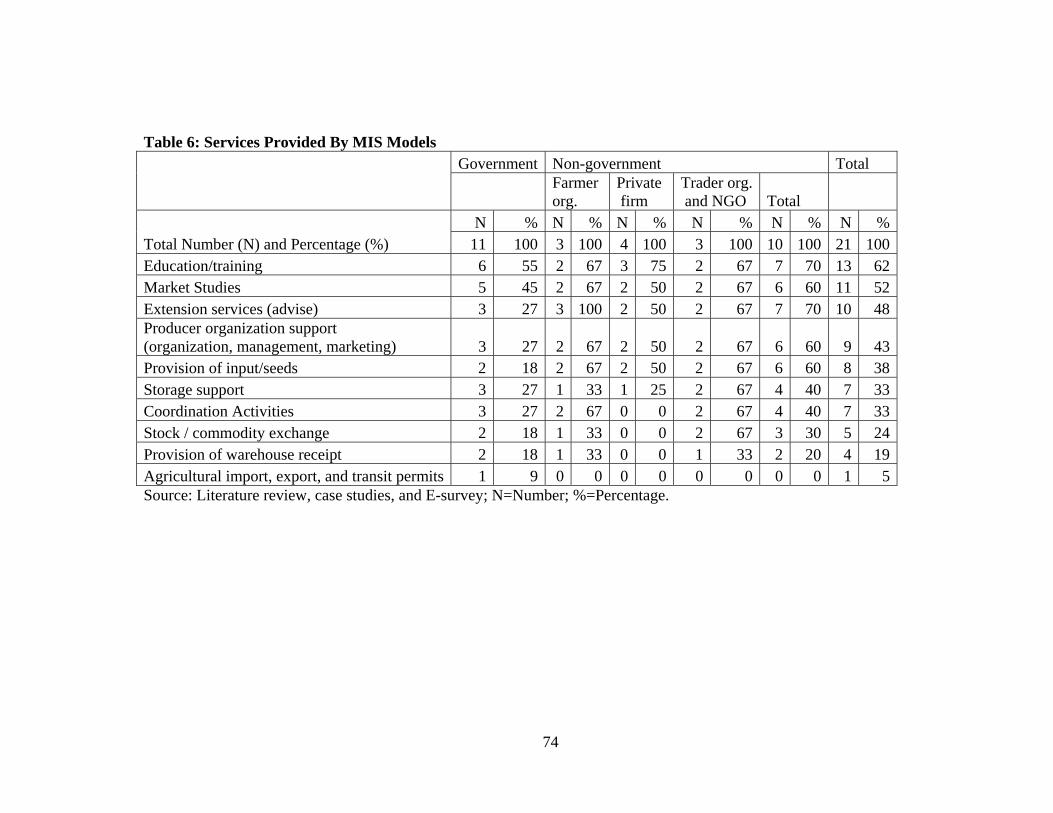
74
Table 6: Services Provided By MIS Models Government Non-government Total
Farmer org.
Private firm
Trader org. and NGO Total
Total Number (N) and Percentage (%)
N % N % N % N % N % N %11 100 3 100 4 100 3 100 10 100 21 100
Education/training 6 55 2 67 3 75 2 67 7 70 13 62Market Studies 5 45 2 67 2 50 2 67 6 60 11 52Extension services (advise) 3 27 3 100 2 50 2 67 7 70 10 48Producer organization support (organization, management, marketing) 3 27 2 67 2 50 2 67 6 60 9 43Provision of input/seeds 2 18 2 67 2 50 2 67 6 60 8 38Storage support 3 27 1 33 1 25 2 67 4 40 7 33Coordination Activities 3 27 2 67 0 0 2 67 4 40 7 33Stock / commodity exchange 2 18 1 33 0 0 2 67 3 30 5 24Provision of warehouse receipt 2 18 1 33 0 0 1 33 2 20 4 19Agricultural import, export, and transit permits 1 9 0 0 0 0 0 0 0 0 1 5Source: Literature review, case studies, and E-survey; N=Number; %=Percentage.
75
What are the implications of provision of complementary services on MIS
performance?
Based on a qualitative assessment and as illustrated in the following paragraphs, the
provision of some complementary services increases sustainability, reliability, and
timeliness of information provided by the MIS. More specifically, provision of some
complementary services: (1) increases the sustainability of the MIS through reduction in
the some data collection and diffusion costs; (2) increases reliability (accuracy) of
information, as they generate market information as a byproduct; (3) increases the
reliability (relevance) of some market information products; and (4) increases the
timeliness of releasing information products.
Public MIS
For example, the ECX in Ethiopia (categorized as a public MIS) provides a
trading floor system among traders, warehouse delivery centers, commodity handling
facilities, storage, and grading of agricultural commodities. These activities generate
market information as a byproduct, implying lower information production costs, and
thus higher sustainability potential. Generating information as a byproduct of
transactions also increases accuracy because it is based on real transactions. This may,
however, lead to biased prices if the volume traded on the exchange is a small proportion
of that traded in other marketing channels.
In Nampula province in Mozambique, SIMAP diffuses market information
together with extension information from the extension unit in a weekly 30-minute
agricultural radio program. In this case, market information complements extension
information, e.g., on contacts of sellers of inputs such as fertilizer and farm implements,

76
which increases the relevance of information to users on one hand, and reduces
dissemination cost faced by the MIS on the other.
Farmer organization-based MIS
In Zambia, the ZNFU (a farmer organization) trains farmers on grades they
should provide to millers to avoid disagreements over quality so as to bargain for higher
prices. Farmers are trained in workshops and through radio programs on the grades and
standards of maize required by traders. This also illustrates the importance of having
complementary services to just price information.
In some situations, however, relating MIS activities with other units offering
complementary services hurts the timeliness of releasing MIS bulletins. For example, in
Zambia, AMIC staff is sometimes deployed to distribute fertilizer, which encroaches on
the time dedicated to MIS activities, leading to untimely diffusion of market information.
Also, when the MIS or the institution housing the MIS also issues import, export, and
transit permits, or collects taxes as is proposed in Mozambique, there will be incentives
for traders to under-report the prices and the volumes of the traded items. Thus, like any
other business, MIS have to identify the mix of outputs it makes most sense to produce—
i.e., identify areas where there are economies of scope rather than diseconomies. This is
the type of analysis any business that produces multiple products needs to undertake.
Whom do the different model(s) serve and how well?
The performance outcomes vary depending on the specific complementary services
provided by MIS and not by MIS types as the whole. This is because the nature of
complementary services provided varies between individual MIS, even within the same
category of MIS. This means that no generalization can be made as to whether private-,

77
public-, farmer organization-, or trader and NGO-based MIS serve farmers, traders,
government or donors better based on the complementary services they provide.
3.6.2.2 Geographic Coverage and Range of Commodities Covered
Two structural features of early MIS were that they: (1) collected information over wide
geographic areas and (2) on a wide range of commodities.
Geographical coverage: Government MIS in the sample have a more national coverage
(91%) compared to non-government (60%). More non-government MIS in the sample
(50%) cover only part of a country than do government MIS (9%). In terms of regional
coverage, 36% of government MIS covered more than one country while 30% of non-
government MIS covered more than one country. In total, Table 7 shows that out of the
21 MIS examined, 76% have a national coverage, 29% cover only part of a country, and
33% have a regional coverage (more than one country).
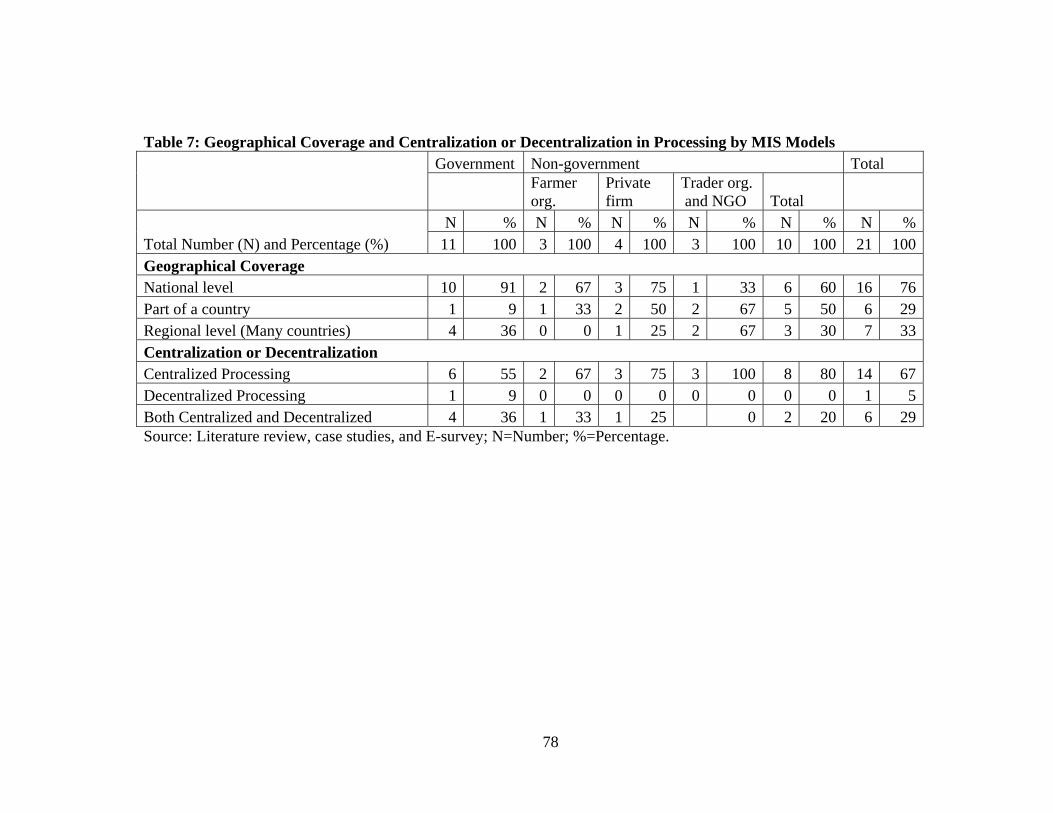
78
Table 7: Geographical Coverage and Centralization or Decentralization in Processing by MIS Models Government Non-government Total
Farmer org.
Private firm
Trader org. and NGO Total
Total Number (N) and Percentage (%)
N % N % N % N % N % N %11 100 3 100 4 100 3 100 10 100 21 100
Geographical Coverage National level 10 91 2 67 3 75 1 33 6 60 16 76Part of a country 1 9 1 33 2 50 2 67 5 50 6 29Regional level (Many countries) 4 36 0 0 1 25 2 67 3 30 7 33Centralization or Decentralization Centralized Processing 6 55 2 67 3 75 3 100 8 80 14 67Decentralized Processing 1 9 0 0 0 0 0 0 0 0 1 5Both Centralized and Decentralized 4 36 1 33 1 25 0 2 20 6 29Source: Literature review, case studies, and E-survey; N=Number; %=Percentage.

79
Range of commodities: In terms of number of crops covered, only one MIS (ECX)
predominantly collects and disseminates information on one cash crop (coffee). Both
first- and second-generation MIS cover several staple commodities compared to cash
crops. The number of commodities covered by MIS varies unsystematically between
MIS types: some government MIS monitor a smaller number of commodities than do
non-government MIS and the converse is true. For example, Esoko reported that it
monitors 150 commodities, which is much higher than the 18 agricultural commodities
monitored by AMIC in Zambia and the 25 agricultural commodities monitored by SIMA
in Mozambique. A within-country comparison in Zambia shows that the range of
commodities covered by AMIC (a public MIS) of 18 agricultural commodities and 9
inputs is higher than the range of commodities covered by the ZNFU 4455 SMS MIS (a
farmer based MIS) of 14 commodities. Therefore, there is no evidence to suggest that
first-generation MIS cover a higher number of commodities than second-generation
MIS—within our sample, the coverage varies widely within each category of MIS.
Number of markets monitored: The number of rural and urban markets covered by
MIS varies unsystematically: some, but not all, government MIS monitor more markets
than do non-government MIS. For example RML (a private MIS) reported that it
monitors 1,200 rural markets—much higher than all government and farmer
organization-based MIS. It is noted, however, that RML is in India, where the
geographic density of markets is much greater than in sub-Saharan Africa. This
illustrates the importance of the country setting in which the MIS exists. The details of
geographical coverage, the range of commodities, and the markets covered by individual
MIS are included in Table 44 in section A. 9 of APPENDIX A.

80
What are the implications of geographic coverage and range of commodities
covered on MIS performance? And whom do the different model(s) serve and how
well?
The geographic coverage and range of commodities covered by an MIS affect the
timeliness of releasing market information bulletins and the costs of data collection,
which affect sustainability. Some of the reasons MIS cover wide geographic areas may
be: (1) to gain economies of scale in collection and diffusion; (2) to obtain relevant
information that reflects the diversity in production, market conditions, and food security
within countries; and (3) the profit orientation of the MIS in relation to the size of country
of operation and density of the population.
Who benefits from gain in economies of scale? All MIS models can potentially gain
economies of scale in collection and diffusion from covering large geographical areas and
a wide range of commodities. Depending on the data collection methods, the larger the
geographical area and the wider the range of commodities an MIS covers, the higher the
total cost of data collection and monitoring, for example, in form of fuel and staff
allowances to go and monitor data collectors. However, once the fixed costs of setting up
an MIS to collect information from a given geographical area and for a given number of
commodities are met, the marginal cost of covering an additional area and additional crop
are relatively small. For example, once a data collector goes to a market to interview a
trader of one commodity (say about maize prices), the marginal cost of interviewing the
same trader about another commodity (say beans), or to interview another trader in the
same market are lower than the average costs. Thus, covering a larger geographical
region and a wider range of commodities leads to economies of scale in information

81
collection and dissemination of certain types of information, resulting in a lower unit cost
of information collected or per client served. From section 2.2.1 on indivisibility, how
well an MIS that attains economies of scale serves different users depends on whether it
becomes an efficient monopolist that charges a price equal to marginal cost, or one that
exercises its market power and charge a price higher than the marginal costs. If there are
economies of scale and the MIS charges marginal costs, then it won’t cover its total costs.
So then the question becomes, who pays the infra-marginal costs? It is noted, however,
that there may be an optimal point beyond which diseconomies of scale come into play.
For example, some of the MIS clientele may demand more customized information and
analysis that increase the marginal costs of processing and analyzing the extra data. For
example in Mozambique and Zambia, the WPF would like the MIS to collect information
from more districts where WFP conducts its activities and the MIS does not currently
cover but is aware of the financial implications of this demand on part of the MIS. WFP
conducts sample surveys that cover some of the districts where SIMA does not cover. In
this example, the marginal costs of the MIS can start to increase as the MIS expands
beyond the optimal size.
In deciding how large a geographical area to cover, the MIS faces a make-or-buy
decision—whether to gather the information itself or to cooperate with other MIS
covering other areas and exchange information. The latter is the approach that has been
taken by West African MIS, which have organized into a regional network (RESIMAO)
to promote exchange of information among MIS and to gain economies of scale in
developing improved methods for market monitoring.

82
Governments, donors, and poor farmers and traders benefit when they obtain
information that reflects the diversity in production, marketing conditions and food
security within countries. Governments have a mandate to ensure food security
throughout the country either through production or markets. Since different parts of the
country produce different commodities and have different food security situations, it
follows that public MIS such as SIMA and AMIC, and those MIS supported by
government, such as OMA, have to cover wide geographical areas and a wide range of
commodities. Related to this point is that if one wants to interpret changes in market
conditions at one level in a value chain (e.g., price variation in consumer markets), it is
often necessary to understand what is going on at other levels in the value chain (e.g.,
price variation at the farm level for both substitutes and complementary crops). These
are some of the reasons why many government supported MIS cover wider geographical
regions and a wide range of commodities. In contrast, private MIS and traders’
organization-based MIS mostly aim at promoting market transparency in areas where
trade occurs. This partly explains why the geographic coverage and range of
commodities of some private MIS is smaller. With greater market integration, the
geographical scope of private MIS (or their links with MIS in other countries) is likely to
expand in the next 5 to 10 years. Some farmers and traders also benefit from the
information from MIS that cover wide geographical areas, as diversity may open scope
for spatial arbitrage.
The interest in monitoring food security and market performance is not confined
to governments and government MIS. For example, two major reasons why donors
invested in MIS activities under the International Institute of Tropical Agriculture (IITA
83
FOODNET MIS) in Uganda in the late 1990s up to 2000s were: (1) monitor the
performance of cassava technology transfer programs and their effects on food security,
and (2) to guide and monitor the effects of commodity monetization so as not to distort
markets and domestic production of some crops such as oil seeds due to monetization of
cooking oil. In Uganda, cassava is widely grown as an important food security crop but
is not widely commercially processed for marketing. Donors were interested in
monitoring how the breeding and multiplication of mosaic virus-resistant cassava
varieties and the promotion of cassava processing technologies led to an increase in
cassava production and how the increase in production affected cassava prices and the
prices of other substitutes (e.g., sweet potatoes and maize) and complements (e.g., millet,
sorghum, and beans). This objective implied that the MIS had to cover a wider range of
commodities to facilitate the monitoring of substitutes and complementary effects of
technology development and diffusion. In relationship to the second objective, the MIS
produced customized information consisting of wholesale and retail prices, new market
entrants, and new varieties of cooking oil and wheat products for monetization purposes.
The Uganda example also illustrates how the mandate of the MIS influences its
sustainability. When the mandate of the MIS ended (i.e., when there was no more need
for monitoring technology transfer and monetization of crops by the main funders), the
MIS ceased to be sustainable (i.e., there were no stakeholders with effective demand).
Profit orientation of the MIS: In low-income countries, MIS that are profit oriented,
especially private MIS such as RML in India and KACE in Kenya, may be better-off in
terms of cost recovery when they cover small geographic areas with high population
densities where there is likely to be higher effective demand for information (e.g.,

84
through use of SMS requests) than covering areas with low population densities. The
problem, however, is that information will be under-provided (from a social-cost
perspective) to some users in some part of the countries with low population densities and
where some users such as poor farmers have no effective demand for information.
In which areas are different MIS models complementary or competitive to each
other?
Government-supported MIS may collect information from rural areas and on crops not
covered by private MIS, while non-government MIS collect information from urban areas
with high trade activity. Alternatively, governments and donors could subsidize non-
government MIS so that they can provide information to users without effective demands
if the government and donors judged that a non-government MIS could do this more
efficiently than government MIS. In practice, this was not done within the sample of MIS
covered by this study.
3.6.2.3 Assuring Coordination among MIS Activities and Production Stages
Given the characteristics of information and the environment in which MIS operate, what
does theory suggest about ways of coordinating information production activities such as
collection, analysis, and dissemination? For example, what are the advantages and
disadvantages of maintaining the activities of MIS in a single organization compared to
when activities are conducted in different organizations (integration or specialization in
MIS activities)? What are the tradeoffs of centralizing or decentralizing MIS activities?
What are the advantages and disadvantages of maintaining the production of all market
information products within a single organization compared to when information

85
products are produced by different organizations (integration or specialization in
information products)?
3.6.2.3.1 Vertical Integration of MIS Activities
In the context of MIS, vertical integration means that data collection, analysis, and
dissemination are done in one organization. There seems not to be a difference between
government and non-government MIS in terms of the degree of integration of MIS
activities such as collection, analysis and diffusion of market information.
Comparison between MIS Models
From case study interviews, first-generation MIS such as AMIC in Zambia and SIMA in
Mozambique are integrated in a sense that they collect, analyze, and disseminate market
news. However, some types of information such as international prices are obtained from
other organizations. In Mozambique, SIMAP gives the MIS bulletin to the
communication unit for dissemination. This is analogous to separating collection and
analysis of market news from diffusion of market news. In this example, SIMAP can be
considered to be integrated in collection and analysis, and the communication unit
diffuses the information. Second-generation MIS also have a tendency to be integrated in
the collection, analysis and dissemination of some types of information and not in other
types of information. For example, some private MIS such as KACE and RML produce
some information from within the MIS and obtain other types of information such as
weather information and agronomic information from external organizations.
What are the implications of integrating MIS activities on MIS performance?
Within the MIS, minimizing the involvement of many independent organizations in the
production of a perishable commodity (time-dependent information) by integrating

86
reduces the possibility of hold-up by strategic partners. For example, to some
information users such as farmers and traders of perishable crops, information is needed
at very frequent and time-specific intervals. Failure by the MIS to provide them with
market information on time can result in a loss of money or reputation. In this case,
coordinating all MIS activities (collection, analysis and diffusion) in one organization
(integration) increases the speed of producing information, and thus solves the problem
of perishability of information (temporal specificity). The MIS, however, may become
too large, develop bureaucratic procedures, and fail to produce information products at a
rate needed by users, thus reducing the reliability of the information generated. One way
of trying to attenuate these problems arising from integration is to decentralize, which is
discussed in section 3.6.2.3.2. Also, some types of information needed by users such as
weather forecasts, evaluation of factors driving future supply and demand, information on
government policies, are unlikely to be produced by a single organization, thus the need
to “buy” or “get it from someone else” decision instead of “make” or “produce the
information itself”.
Also, the separation of data collection and diffusion activities can introduce
delays and hold-up problems. For example, in the case of Mozambique SIMAP, the
communication unit might be more interested in disseminating information on extension,
and therefore allocate less time to market information.
Whom do the different model(s) serve and how well?
Private-, public-, farmer organization-, and trader and NGO-based MIS can be vertically
integrated (“make” or “produce the information itself”) or rely on the market (“buy” or
“get it from someone else”) for some of their activities. This means that the advantages
87
and disadvantages of vertically integrating MIS activities apply to all MIS models,
irrespective of their institutional home (MIS type), and to their stakeholders.
It is not clear whether there is any difference in the ease with which different
types of MIS can adopt a “buy” or “make” decision. It depends on the type of
information and who produces it, or the service the MIS wishes to “buy” or “make”. For
example, in case of metrological information collected by another government
department, the public MIS may have easy access to metrological data (“buy” or “get it
from someone else”). However, private MIS may also easily “buy” or “get it from
someone else” as is the case with metrological information and agronomical information
obtained from government agricultural research organizations by RML in India. Also,
with the exception of ECX in Ethiopia, public MIS such as AMIC in Zambia and SIMA
in Mozambique have not been able to get free broadcast time from public radio.
3.6.2.3.2 Centralization vs. Decentralization of MIS Activities
MIS can be centralized, where all the coordination of the production activities (collection,
analysis, and disseminated) are done from one central place, or decentralized, where
these activities are done in different locations. This is also related to the question of
horizontal coordination of MIS activities. In this context, decentralization is not
necessarily in terms of financial and administrative autonomy, but in terms of
information flow from the source to the end-users. Thus, private-, public-, farmer
organization-, and trader and NGO-based MIS can be centralized, decentralized, or both
centralized and decentralized in analysis and dissemination; but centralized in terms of
budgets and administration.
88
Main observation
Table 7 shows that more non-government MIS (80%) stated to be centralized than
government MIS (55%) in information processing and diffusion. Also, 1 of the 9
government MIS stated that it was decentralized and no non-government MIS reported to
be decentralized in information processing and diffusion. Furthermore, more government
MIS (36%) are mixed (both centralized and decentralized) in information processing and
diffusion than are non-government MIS (20%). In total, Table 7 shows that out of the 21
MIS examined, 67 are centralized, 1 is decentralized, and 29% are both centralized and
decentralized in information processing and diffusion. The details of how individual MIS
are centralization or decentralization in processing are included in Table 44 in section A.
9 of APPENDIX A.
What are the implications of centralization or decentralization on MIS
performance?
In terms of conduct, the advantages of decentralization are the increased capacity to
obtain feedback on local user needs. In terms of performance, decentralization together
with availability of ICT enables the MIS to provide customized reports to specific users
or regions, thus increasing relevance of the information. Moreover, decentralization also
increases the speed at which the MIS gets to collect and disseminate information—factors
that help MIS to provide relevant information to users. A decentralized MIS is also able
to tap local resources such as personnel in local administrative offices, office space, and
access to local radio, thus reducing the running costs of the MIS.
The weakness of dissemination from within a decentralized MIS is that there
might be omission of information from other areas that might be of interest to users in a

89
local area. This limits comparison of local information with that from distant markets,
which limits the potential to encourage spatial arbitrage among market actors. These
problems can be dealt with by networking the local MIS offices to each other and to the
central office, as in Mali.
The advantage with centralization is gain in economies of scale in processing and
dissemination, and producing more standardized information products from the MIS.
Also, information from a centralized MIS might have more information from distant
markets, thus promote spatial arbitrage. The disadvantage with centralization is that the
MIS may make the data collection and dissemination operations large, bringing in agency
problems due to lack of proper monitoring. The monitoring problem is compounded with
some cultural factors discussed in section 2.3.7 such as when there are many languages
used to disseminate information.
Whom do the different model(s) serve and how well?
Like in integration and specialization in MIS activities, all MIS models can be centralized
or decentralized. This means that the advantages and disadvantages resulting from
centralization and decentralization apply to all MIS models, irrespective of their
institutional home (MIS type), and to their stakeholders. It is not clear whether there is
any difference in the ease with which different types of MIS can decentralize MIS
activities. It seems like government-supported MIS can decentralize with ease compared
to non-government MIS model because of existing government investments such as
offices, personnel, and in some cases transport facilities in most parts of the country.
This means that the start-up investment costs at a decentralized level (e.g., a district or
county) are lower for an MIS that is government-based than one that is not.

90
Instead of decentralization, non-government MIS may remain centralized in data
collection and diffusion, but collaborate with NGOs working in different areas of
country, and with government departments at provincial and district levels to reduce the
costs required to invest in decentralized MIS. For example in Uganda, the MIS relied on
WFP facilities to email information from West Nile and on AVSI (an Italian NGO)
facilities to email information from North East Uganda, which reduced the need to invest
in communication facilities in those areas, in exchange for market information from other
districts to WFP and AVSI. These areas also happened to be unstable due to the LRA
war. The MIS also collaborated with district agricultural-, trade-, cooperatives-,
extension-, and production officers in different districts. This reduced the data collection
costs, since the MIS did not pay for office space, nor the full salaries of these officers, but
rather facilitated them with a small allowance as an incentive to do work they were
supposed and probably liked to do anyway.
3.6.2.3.3 Specialization in the Production of MIS Products
Another coordination method is to have the production of different MIS products
conducted under different organizations. For example, one organization can specialize in
production of market news, and another in the production of market analysis, and another
in the production of business reports. The alternative is to have two or more information
products produced in the same organization (integration of the production of information
products). Most MIS in sub-Saharan Africa included in this study are not specialized in
the production of MIS products than are those in developed countries.
Specialization in market news: For example, in the USA, the Fruits and Vegetables
Market News (F&VMN) collects and disseminates price data, the National Agricultural

91
Statistics Service (NASS) collects and disseminates supply and demand estimates, and
other organizations such as private firms and universities conduct more specialized
analysis on the data to produce market analysis for different users.
Specialization in market analysis: In the USA, market analysis such as forecasting is
done through publicly supported research institutions (e.g., USDA and land-grant
universities). This approach can also be done in developing countries, where the data
collected by public MIS is given to public universities or research units within
government to conduct market analysis for policy and food security analysis. Once the
public institutions finish analyzing the information, they disseminate it to users, including
the MIS. The MIS can also than disseminate the market analysis to other stakeholders.
Specialization in business reports: Presently, none of the MIS surveyed provide
business reports. Business reports include information that can help stakeholders identify
reliable trade partners, including their creditworthiness, sources of credit and interest
rates, and commissions paid by buyers. Theoretically, all MIS types can provide business
reports. Some complementary MIS activities, however, generate information that can be
amalgamated to make business reports. For example, ECX obtains more private
information (e.g., commissions paid by buyers and disputes among buyers and sellers)
that can be used to make credit reports. Such MIS would have the comparative
advantage of producing business reports compared to organization that don’t produce this
kind of private information. In some situations, some actors may be unwilling to provide
information they consider not good if they think such information could go into credit
reports or other business reports.
92
Integration of the production of information products: There has to be coordination
between what policy issues are analyzed and what data are collected to analyze those
issues. Thus, coordination of the production of market news and market analysis may be
smoother within a single organization than across different organizations. This
coordination issue applies to many types of information, not just policy issues alone. For
example, as new products enter the market, there has to be coordination between the
needs of business people for information on these new products and the decision about
whether to collect data on them.
What are the implications of specializing in MIS products on MIS performance?
Advantages: The advantage of specialized products is that it leads to gains in
comparative advantage because each product is produced by an organization that has
expertise in doing it. For example, having public MIS specialize in provision of basic
market news and other public institutions specializing in production of market analysis
leads to gains in comparative advantage in market news provision by public MIS.
Disadvantages: The separation of the provision of market news, market analysis, and
business reports can introduce potential delays and hold-up problems in the release of
market analysis and business reports that can make information perishable among some
users who need frequent information. The other disadvantage with separation of the
provision of information products is the risk of collecting data on issues that are no
longer relevant for many actors and miss collecting information on emerging
products/actors/issues important for business and policy makers because the needs of
these people for information are not effectively communicated to the agencies collecting
the data.

93
Whom do the different model(s) serve and how well?
Any MIS model can specialize in an MIS activity (collection, analysis, and diffusion) of
different MIS products (market news, market analysis, or business reports) and the
resulting advantages and disadvantages of specializing apply to all MIS models,
irrespective of their institutional home (MIS type), and to their stakeholders such as
farmers, traders, government, and other information users. It is not clear whether there is
any difference in the ease with which first- or second-generation MIS can specialize in
the production of information products. MIS in high-income are relatively specialized in
the production market news and other organization in the production of market analysis
and business reports than those in low-income countries. This may reflect the presence
of a larger corps of trained personnel in high-income countries than low-income
countries. In the latter, there may be relatively few analysts who understand the
dynamics of agricultural markets, and they may be concentrated in the MIS.
3.6.2.4 Designing Incentives for Staff to be Responsive to Client Needs
Two sources of problems in early generation MIS were poor incentive structures and
sharing of resources without clear sharing rules. For example, one of the reasons why
some stakeholders have pushed for private-sector MIS is to deal with the shirking
problems due to lack of aligned incentives that are often present in public-sector
organizations. In organization theory, it is important to align incentives, including
noneconomic inducements, to achieve enterprise viability (Williamson, 1981).
Williamson notes that there are high-powered incentives and low-powered incentives.
High-powered incentives are mostly provided by the market while low-powered
incentives are mostly provided by hierarchies. High-powered incentives go directly to

94
transacting parties, implying that efficiency gains from such transactions flow directly to
transacting parties. Low-powered incentives do not directly go to transacting parties,
although there might be long-term gains such as promotions and salary increments.
While in general high-powered incentives may promote efficiency, they may also
promote dishonesty (Williamson, 1985).
From case study observations, examples of poor incentive structures used by the
MIS or the institutions in which they are housed include: (i) low staff salaries; (ii) fixed
staff salaries to MIS employees with no residual claimancy of generated revenue by the
MIS; (iii) excessive bureaucracy, which leads to a nonflexible hiring and firing of
employees; and (iv) shirking and absence of output-based monitoring (e.g., demanding
for an MIS bulletin or a recorded MIS radio program) but instead reliance on behavioral
monitoring (e.g., good performance based on signing attendance books irrespective of
work done). The examples below illustrate how poor incentives affect the performance
of selected MIS categories.
Comparison between MIS Models
In Nampula Province in Mozambique, it is difficult for SIMAP to increase staff salaries.
The same applies to SIMA in Maputo, and to AMIC in Zambia. Contracts with low
remunerations retain less motivated personnel with low wage reservation utilities. More
motivated and experienced employees with high wage reservation utilities seek
employment with other employers who offer higher wages such as NGOs. This reduces
the capacity of MIS to retain high skilled workers who can produce high quality market
analytical and business reports. One of the constraints to raising wages is the low
budgets of the MIS. The low budgets reflect the low effective demand for quality market
95
information from government and donors. So the fundamental problem remains of how
to build demand, which in turn requires producing a relevant and timely product.
Limited evidence suggests that lack of wage flexibility is likely to be a bigger
problem in government MIS than non-government MIS. In Mali, during the restructuring
of the MIS from public to a farmer organization-based MIS, the MIS had to draw new
terms with the MIS workers, and some decisions involved negotiating with MIS staff to
accept contracts with lower salaries and benefits to reduce MIS costs and increase its
capacity to be financially sustainable and to make it attractive to be funded by external
donors. This would probably have been very difficult if the MIS was purely in a
government ministry or parastatal and is an example of wage flexibility in a farmer
organization-based MIS. From the authors’ personal experience working with the IITA
FOODNET MIS in Uganda (categorized as an NGO-based MIS), the MIS negotiated
with 16 MIS staff to take a 33 percent reduction in data collection allowances for six
months towards the end of the first round of the donor funded project as a new round
was being negotiated. Once the new project was approved, the data collection
allowances were reinstated to the previous levels. This is another example that shows
wage flexibility in a non-government MIS.
The personnel in SIMA in Mozambique and AMIC in Zambia are paid fixed
monthly salaries. In Mozambique, when SIMA gets consultancies, the money goes to the
treasury and comes back as low fixed salaries to employees. The MIS workers (as
agents) do not become the residual claimants of the revenue from consultancies and do
not face risk of loss of income when they reduce their efforts in the production of market
information. This payment structure encourages shirking, since employees benefit from

96
the full marginal utility of the reduction in effort and almost no disutility when they fail
to produce market information bulletins.
In Mozambique SIMAP and in Zambia AMIC, there is centralized hiring and
posting of staff through the central government. This means that the MIS cannot, due to
the bureaucratic rules, hire enumerators to replace those who are transferred, die, or
abscond. Also, the MIS cannot easily dismiss non-performing enumerators; thus there is
minimum threat of dismissal due to non-performance. Although the level of bureaucracy
in a public MIS is likely to be higher than in a private MIS, some private MIS also have
restrictive policies (such as failure to offer higher wages to some staff as indicated in the
example of Ethiopia above) that may hurt the performance of an MIS in a similar manner
to bureaucracy in public MIS. In the Nampula SIMAP, monitoring of provincial MIS
personnel is based on attendance and not outputs, probably because attendance is less
costly to monitor.
Another cause of problems in MIS is from sharing resources such as cars,
telephones, and budget-lines without prior resource-sharing rules. Sharing resources
reduces average costs, but without clear sharing rules and transparency, it can cause
inefficiencies and hidden action among MIS stakeholders. For example, in Nampula
province in Mozambique, one reason for the failure to use radio equipment and
telephones to call data collectors and to use pool cars for field supervision is because
these resources are also used for other administrative work, which is probably considered
more important than collection of market information. Also, lack of transparency and
accountability may lead to re-allocation of budget lines and equipment meant for MIS
activities such as data collection and supervision to other uses. This affects the timeliness
97
of the information, and in the long-run, the sustainability of MIS by discouraging
potential funders such as external donors.
What are the implications of the poor incentive structures on MIS performance?
The above poor incentive structures contribute to some of the problems faced by MIS
such as irregular collection and diffusion of information, limited supervision of data
collection, and the speed of adjustment by the MIS to changes in market structure such as
collecting information on new commodities and from new businesses or new markets.
And whom do the different model(s) serve and how well?
Poor incentives can be found in any MIS model, implying that the advantages and
disadvantages of having good or poor incentives can apply to any MIS model,
irrespective of their institutional home (MIS type), and to their stakeholders. It seems
however, that non-government MIS face more “high-power incentives” than public MIS
to deal with poor incentive problems, such as such as low staff salaries, fixed staff
salaries, excessive bureaucracy, shirking, and reliance on behavioral monitoring instead
of output-based monitoring. Failure to deal with these problems will quickly lead to
lower revenue, and therefore lack of MIS sustainability (viability).
3.6.2.5 Profit Orientation of the MIS
Profit orientation of the MIS relates to whether the MIS is designed to be a profit making
venture. Both government and non-government MIS may be profit-oriented, although it
seems like private MIS are more profit oriented than public-, farmer organization-, and
trader and NGO-based MIS. Most private MIS such as KACE and Esoko are designed to
be profit-oriented. In contrast, most public- and farmer organization-based MIS are not
profit-oriented.
98
What are the implications of the profit orientation of the MIS on their
performance? And whom do the different model(s) serve and how well?
Whether the MIS is designed to be a profit making venture affects its funding strategies
such as charging user fees. This is facilitated by the increase in ICT, which enables MIS
to turn some information products from being high exclusion cost goods to a low
exclusion cost goods, as discussed in section 2.2.2.
The advantage of an MIS being profit oriented is achieving sustainability through
revenue generation. Another potential advantage is the capacity of profit oriented MIS to
offer “high-powered” incentives to deal with the shirking behavior and bureaucratic
problems discussed in section 3.6.2.4. As noted in section 3.6.2.4, however, there is need
to study further the incentive structures in non-government MIS compared to government
MIS.
One disadvantage of an MIS being profit oriented is the potential to under-provide
information by covering only part of a country or by covering a narrow range of
commodities where the MIS activities are profitable. Another disadvantage is that
charging user fees affects accessibility to the information the MIS diffuses, especially by
poor farmers and small-scale traders who lack the effective demand to pay for the
information from a profit oriented MIS.
3.6.3 The Nature of Commodities Covered
The nature of commodities covered relates to whether the MIS provides information on
cash crops or staple crops.

99
Comparison between MIS Models
Nearly all types of MIS reviewed deal in several staple crops. Only ECX predominantly
deals with one cash crop (coffee).
What are the implications of the nature of commodities covered on MIS
performance?
The nature of the commodity covered by the MIS influences its funding strategies and
sustainability. For cash or export crops such as coffee that pass through only a few
export points, it is possible to control the marketing channels and tax the commodities, or
charge service fees to fund MIS activities, which contributes to financial sustainability of
the MIS. For example in Ethiopia, dealing with a cash crop (coffee) enables ECX to
charge membership seat fees, annual maintenance fees, transaction fees, and warehouse
fees on the commodity exchange to sustainably pay for all the running costs of the MIS,
which would not be possible for staple crops that have several informal marketing
channels.
Also, MIS that deal with perishable commodities (e.g., horticultural commodities
and dairy products) need and often provide information at more frequent intervals, and
use different information collection and dissemination strategies (e.g., use of cell phones)
because of the perishability of such information compared to those that provide
information in staple cereal commodities such as maize.
Whom do the different model(s) serve and how well?
As already stated, nearly all types of MIS reviewed deal in several staple crops and only
one dealt with predominantly one cash crop. Although the MIS that dealt with only one
cash crop is in the public sector, it could also be in a private sector, or in a trader

100
organization. This means that the advantages and disadvantages resulting from the nature
of commodity covered given in the section above can apply to any MIS model.
3.7 Generic Conduct Design Issues for Any MIS
The key conduct design issues are: (1) the information products provided and frequency
at which they are provided, (2) the ICT used in transmission and diffusion, (3) funding
strategies, (4) the data collection methods, (5) quality control methods used, and (6) the
feedback mechanism used by the MIS.
3.7.1 Information Provided and Frequency of Provision
One of the main problems of early generation MIS identified in section 1.2 was that they
often failed to meet the informational needs of the stakeholders because they collected
and provided mostly price information and in an untimely way. Second-generation MIS
were meant to provide more information products beyond mostly prices and quantities
traded in markets, and provide information at more frequent intervals compared to public
MIS.
Main observation
All types of MIS surveyed provide market news, especially wholesale prices (76%) and
retail prices (71%). In terms of market analysis such as reasons why prices change, 27%
of public MIS (AMIC in Zambia, ECX in Ethiopia, and SIMA in Mozambique) provide
market analysis while 30% of non-government MIS provide market analysis. Within
non-government MIS, only one farmer organization based MIS (OMA in Mali), which is
a government-supported MIS, and 67% of trader and NGO-based MIS provides market
analyses, while private firm MIS typically do not provide market analysis. None of the

101
MIS in the sample provide business reports that include information such as credit reports
and the creditworthiness of traders.
In total, Table 8 shows that out of the 21 MIS included in the study, the 4 most
common types of information provided and the number of MIS providing them are:
wholesale prices (76% of MIS), retail prices (71% of MIS), information on qualitative
assessment of traded volumes (52% of MIS), and supply and demand estimates (5% of
MIS). Beyond the price and quantity information typically reported by MIS (and which
some actors say that they can get more reliably from other sources), the surveys identify
the following kinds of information that most MIS do not currently provide:
a. Prospective information about how the market is likely to evolve, such as price
forecasts, crop harvest or production forecasts.
b. Analytical information about the major factors moving the market
c. Stock and inventory information
d. Information regarding major contracts and conditions needed to fulfill them
e. Quality requirements, grades and standards, and phytosanitary specifications
information.
f. Information about how to access supporting services – transport costs credit sources
g. Regulatory information
h. Information about production technology that will allow farmers to respond to new
market opportunities, weather information, and agronomic information.
The information that users report they need is described in detail in section A. 2 of
APPENDIX A.

102
Table 8:Information Provided by MIS Models
Government Non-government Total Farmer org.
Private firm
Trader org. and NGO Total
Total Number (N) and Percentage (%) N % N % N % N % N % N %
11 100 3 100 4 100 3 100 10 100 21 100Information Products Market News 11 100 3 100 4 100 3 100 10 100 21 100Market Analysis 3 27 1 33 0 0 2 67 3 30 6 29Business Reports 0 0 0 0 0 0 0 0 0 0 0 0Information provided Wholesale price 8 73 2 67 4 100 2 67 8 80 16 76Retail price 8 73 1 33 4 100 2 67 7 70 15 71Traded volume (qualitative assessment) 8 73 1 33 0 0 2 67 3 30 11 52Supply & demand estimates 7 64 1 33 1 25 2 67 4 40 11 52Producer price (or rural market) 6 55 2 67 0 0 2 67 4 40 10 48Traded volume (quantitative estimation) 7 64 2 67 0 0 1 33 3 30 10 48Traders stock 6 55 1 33 1 25 1 33 3 30 9 43Contacts of buyers and sellers 4 36 2 67 2 50 1 33 5 50 9 43Grades & standards 5 45 1 33 1 25 1 33 3 30 8 38Exchange rates 4 36 0 0 2 50 2 67 4 40 8 38Harvest or production forecasts 5 45 0 0 0 0 3 100 3 30 8 38Price forecasts 4 36 0 0 2 50 2 67 4 40 8 38Agricultural policy information 4 36 1 33 1 25 2 67 4 40 8 38Price CIF 5 45 0 0 0 0 2 67 2 20 7 33Production costs 3 27 1 33 1 25 2 67 4 40 7 33Marketing costs 4 36 0 0 1 25 2 67 3 30 7 33Table continued below

103
Table 8 (continued) Government Non-government Total
Farmer org.
Private firm
Trader org. and NGO Total
N % N % N % N % N % N %Total Number (N) and Percentage (%) 11 100 3 100 4 100 3 100 10 100 21 100Offers and bids 2 18 1 33 2 50 2 67 5 50 7 33Price FOB 4 36 0 0 0 0 2 67 2 20 6 29Import volumes 3 27 1 33 0 0 2 67 3 30 6 29Regulations 5 45 0 0 0 0 1 33 1 10 6 29Commercial policy information 4 36 1 33 0 0 1 33 2 20 6 29Export volumes 3 27 1 33 0 0 0 0 1 10 4 19Food aid information 2 18 1 33 0 0 1 33 2 20 4 19Marketing extension 2 18 1 33 0 0 1 33 2 20 4 19Buy and sell information 1 9 1 33 0 0 1 33 2 20 3 14Phytosanitary specs. 0 0 1 33 0 0 1 33 2 20 2 10Weather information 0 0 0 0 2 50 0 0 2 20 2 10Agronomic Information 0 0 0 0 1 25 1 33 2 20 2 10Credit sources 0 0 0 0 0 0 0 0 0 0 0 0
Source: Literature review, case studies, and E-survey; N=Number of MIS; %=percentage.

104
Table 9: Frequency of Information Diffusion by Selected MIS Models
Government Non-government Total Farmer org.
Private firm
Trader org. and NGO Total
Total Number (N) and Percentage (%)
N % N % N % N % N % N %
11 100 3 100 4 100 3 100 10 100 21 100Weekly 8 73 3 100 1 25 2 67 6 60 14 67Daily 4 36 2 67 2 50 1 33 5 50 9 43Monthly 4 36 0 0 0 0 3 100 3 30 7 33Annually 5 45 0 0 0 0 0 0 0 0 5 24Quarterly 3 27 0 0 0 0 1 33 1 10 4 19Longer intervals 3 27 0 0 0 0 0 0 0 0 3 14Real time 1 9 0 0 0 0 0 0 0 0 1 5Tri-weekly 1 9 0 0 0 0 0 0 0 0 1 5Bi-weekly 0 0 0 0 1 25 0 0 1 10 1 5Bi-Monthly 1 9 0 0 0 0 0 0 0 0 1 5
Source: Literature review, case studies, and E-survey; N=Number of MIS; %=percentage.

105
The information in the appendix shows that in many cases, the information needed by
users is actually provided by the MIS, but some users do not receive it because of lack of
access to the MIS’s diffusion channels or because some potential users listen to radios at
different times than those in which information is broadcast.
Comparison Frequency of Provision between MIS Models
In terms of frequency, Table 9 shows that 73% of government MIS provide weekly
information, 36% provide daily and monthly information and 45% provide annual
information. In contrast, the table also shows that 67% of non-government MIS provide
weekly information, 43% provide daily information, 33% provided monthly information,
and 24% provided annual information. These result imply that there are no clear patterns
to suggest that non-government MIS provide more market news and analysis than
government MIS nor that non-government MIS provided the information more frequently
than public MIS where bureaucracy is likely to be higher. A detailed breakdown of the
frequency of information diffusion by individual MIS is included in Table 46 in section
A. 9 in APPENDIX A.
What are the implications of information provided by MIS on their performance
and whom do the different model(s) serve and how well?
For MIS that do not provide market analyses and business reports, users who need this
information do not receive them. In terms of market news, it is clear that all MIS can
provide it. There is no information, however, on how the quality of the reports differs by
MIS type. In terms of market analysis, only government-supported MIS provide it for
uses that benefit many stakeholders (e.g., through improved food security in the whole
country), but other MIS could also develop the capacity to provide it if there were

106
effective demand articulated to them. In practice, this does not appear to be the case,
either because these MIS have not sought out this market or those who have such
demands prefer to operate through government-supported MIS. In terms of business
reports (e.g., with credit sources and credit worthiness of traders), none of the surveyed
MIS provide them.
3.7.2 ICT used in Transmission and Diffusion of Market Information
Market information and ICT are complementary goods, implying that MIS need ICT to
use in their information collection and diffusion strategies. On the one hand, MIS face a
problem of minimizing costs of transmission and disseminating information, and on the
other hand, maximizing the number of recipients of information directly or indirectly by
choosing the right combination of ICT to use in transmission and diffusion of
information. In this dissertation, ICT is divided into two categories (traditional and
modern ICT) for two major uses (transmission and diffusion). Transmission refers to
conveying information from markets to the MIS information processing center.
Diffusion refers to conveying information from the MIS to users.
Traditional ICT includes landline telephone for voice use, fax, post office, radio
equipment, and hand delivery of information. Modern ICT includes the internet (for web
and email use) and cell phones (for SMS and voice use). Second-generation MIS were
meant to have more technological invitations in terms of ICT used in diffusion and
dissemination. The premises were that (1) reliance on the internet and mobile phones for
transmission-timelines and reduction in errors, and (2) increased dissemination through
the internet and to some extent the cell phones would also improve on timeliness and

107
frequency of the data and cost recovery of some production costs by enabling exclusion
of free riders.
Main Observations
• Most non-government MIS started after 2005 after the increase in availability usage
of cell-phones in low-income countries, suggesting that the increase in availability
and usage of cell phones was a major factor that contributed to the start of these MIS
models in low-income countries.
• Most government MIS use traditional ICT to transmit information from markets to
the MIS, while non-government MIS mostly use modern ICT to transmit information.
• Most government MIS use both traditional and modern ICT to diffuse information,
while non-government MIS mostly use SMS and websites (modern ICT) to diffuse
information.
Some key issues about the role of ICT in provision of market information
The current information and communication technology for development (ICT4D)
literature is silent about the complementarities between traditional and modern ICT in
transmission and diffusion of market information. Also, limited analysis has been
conducted on how different ICT is used to improve MIS performance, such as
sustainability, accuracy of the information, and accessibility of information among
different stakeholders. Most studies concentrate on the lower base of the ICT pyramid as
shown in the Figure 1 below, where they examine the role of ICT (especially cell phones)
in facilitating exchange of information in society on market performance. Examples of
studies that examine how the presence of cell phone networks among market actors
improve access to information and the resulting improvements in market performance

108
include one among grain traders in Niger by Aker, one among fishermen in Kerala India
by Jensen, and another among small holder vegetable small holders in Sri Lanka by Silva
and Ratnadiwakara (Aker, 2008, Aker, 2010, Jensen, 2007, Silva and Ratnadiwakara,
2008). In these examples, market actors exchange information because of the
introduction of cell phones, without focusing on an established MIS. This phenomenon
also occurs in other countries such as Mozambique, Uganda, Mali, and Zambia, where
traders call other traders to obtain market information. Other studies analyze the role of
ICT in the upper pyramid, such the studies reviewed by Donner and Escobari on the role
of cell phones on the development of enterprises (Donner and Escobari, 2010).
Presence of ICT Infrastructure and usage for social-economic activities by public structures, private firms, and individuals
Use of ICT in within organizations (e.g., MIS or firms) to improve performance (e.g., diffusion, sales, management, marketing, policy formulation)
Figure 1: The ICT4D Pyramid Showing the Role of ICT within Organization Compared to Within Society

109
Increase in usage of cell-phones and increase in MIS models in low-income countries
The question of how increase in ICT has contributed to the increase in the number of MIS
is analyzed using statistics on ICT availability in comparison with the start years of
different MIS models. Table 10 shows that the usage of cell phones in Ghana and Kenya
was above 10 users per 100 people in 2005, while it was above 10 users per 100 people in
Mali, Mozambique, Zambia, and India in 2006. A review of the start date of MIS in SSA
included in Table 4 indicates that most public MIS in Africa such as AMIC in Zambia,
SIMA in Mozambique, SIMA and SIML in Niger, SIPAG in Guinea Bissau, and
government-supported OMA in Mali started in late 1980s and the early 1990s, before cell
phone use was above 10 users per 100 people. In contrast, farmer organization-based
MIS such as SIEL in Madagascar and the ZNFU 4455 SMS MIS, together with most of
the private MIS such as Esoko in Ghana, Infotrade in Uganda, and RML in India started
after 2005 when cell phone use was above 10 users per 100 people. This shows that the
start of most farmer organization-, private-, and trader and NGO-based MIS coincided
with the increase in usage of cell phones in low-income countries, suggesting that the
increase in the availability and usage of cell phones in these countries was a major factor
in contributing to the start of many private, farmer organization- and NGO-based MIS.

110
Table 10: Telephone Lines, Cellular Subscribers, and Internet Users per 100 Inhabitants in Selected Countries from 1998 - 2008 Main (fixed) telephone lines per 100 inhabitants 1998 1999 2000 2001 2002 2003 2004 2005 2006 2007 2008Ethiopia 0.26 0.3 0.35 0.42 0.51 0.57 0.67 0.82 0.95 1.12 1.11Ghana 0.72 0.84 1.09 1.22 1.34 1.39 1.46 1.47 1.59 1.65 0.62India 2.14 2.59 3.11 3.63 3.84 3.83 4.15 4.44 3.55 3.38 3.21Indonesia 2.79 3 3.25 3.47 3.68 3.77 4.79 6.16 6.68 8.69 13.36Kenya 0.97 0.95 0.93 0.96 0.97 0.97 0.86 0.8 0.8 0.7 0.63Mali 0.27 0.33 0.37 0.47 0.51 0.54 0.57 0.64 0.68 0.64 0.64Mozambique 0.43 0.44 0.47 0.48 0.43 0.39 0.34 0.33 0.33 0.36 0.35Philippines 3.34 3.8 3.94 4.18 4.1 4.06 4.1 3.94 4.17 4.44 4.51United States 63.98 66.6 66.88 65.83 64.37 61.61 59.27 57.86 54.78 51.32 49.62Zambia 0.78 0.81 0.8 0.8 0.8 0.79 0.8 0.81 0.78 0.75 0.72 Mobile cellular Subscriptions per 100 inhabitants 1998 1999 2000 2001 2002 2003 2004 2005 2006 2007 2008Ethiopia - 0.01 0.03 0.04 0.07 0.07 0.21 0.55 1.13 1.54 2.42Ghana 0.22 0.37 0.67 1.22 1.89 3.8 7.91 13.12 23.25 33.25 49.55India 0.12 0.18 0.34 0.62 1.21 3.07 4.69 7.97 14.47 20.06 29.36Indonesia 0.53 1.1 1.79 3.13 5.55 8.66 14.02 21.4 28.75 41.57 61.83Kenya 0.04 0.08 0.41 1.86 3.58 4.68 7.3 12.88 19.96 30.06 42.06Mali 0.04 0.06 0.1 0.22 0.42 2.19 3.52 6.44 12.49 20.4 27.07Mozambique 0.04 0.07 0.28 0.81 1.32 2.2 3.49 7.22 10.96 14.08 19.68Philippines 2.32 3.74 8.31 15.34 19.04 27.34 39.25 40.68 49.22 64.64 75.39United States 24.62 30.24 38.03 44.16 48.23 54.1 61.64 70.36 79.1 85.2 86.79Zambia 0.08 0.28 0.94 1.13 1.27 2.15 4.05 8.09 13.84 21.43 28.04 Table continued on next page

111
Table 10 (Continued) Internet users per 100 inhabitants 1998 1999 2000 2001 2002 2003 2004 2005 2006 2007 2008Ethiopia 0.01 0.01 0.02 0.04 0.07 0.11 0.16 0.22 0.31 0.37 0.45Ghana 0.03 0.1 0.15 0.2 0.83 1.19 1.72 1.83 2.72 3.85 4.27India 0.14 0.27 0.53 0.66 1.54 1.69 1.98 2.39 2.81 3.95 4.38Indonesia 0.26 0.44 0.93 2.02 2.13 2.39 2.6 3.6 4.76 5.79 7.92Kenya 0.05 0.11 0.32 0.62 1.21 2.94 3.02 3.1 7.53 7.95 8.67Mali 0.02 0.06 0.14 0.19 0.23 0.31 0.43 0.51 0.73 0.81 1.57Mozambique 0.02 0.06 0.11 0.16 0.26 0.42 0.68 0.85 0.84 0.91 1.56Philippines 1.1 1.43 1.98 2.52 4.33 4.86 5.24 5.4 5.74 5.97 6.22United States 30.09 35.85 43.08 49.08 58.79 61.7 64.76 67.97 68.93 71.83 74Zambia 0.03 0.15 0.19 0.23 0.48 0.98 2.01 2.85 4.16 4.87 5.55Source: ITU World Telecommunication/ICT Indicators Database.

112
Comparison of the Use of Modern vs. Traditional ICT for Data Transmission
In terms of modern ICT for data transmission, Table 11 shows that out of the 11 public
MIS, 36% use email, 27% use SMS, and 36% use web to transmit information from
markets to the MIS information processing center. Table 11 also shows that out of 10
non-government MIS, 60% use email, 70% use SMS, and 50% uses the web to transmit
information from markets to the MIS information processing center. In terms of
traditional ICT for data transmission, Table 11 shows that out of the 10 non-government
MIS, 60% use telephones for voice, 20% fax, the post office, and radio equipment to
transmit information from markets to the MIS information processing center. It can be
concluded, therefore, that the use of traditional ICT to transmit information from markets
to the MIS is dominant in government supported MIS compared to private sector MIS,
which mostly use modern ICT to transmit information.
Comparison of the Use of Modern vs. Traditional ICT for Information Diffusion
In terms of modern ICT for information diffusion to users, Table 12 shows that out of the
11 public MIS, 82% use email, 64% use the web, 27% use SMS, and 18% use electronic
billboards to diffuse information to users. In contrast, out of the 10 non-government
MIS, 70% uses email, the web, and SMS, and 10% use electronic billboards to diffuse
information to users. In terms of traditional ICT for diffusion, Table 12 shows that out of
the 11 public MIS, 55% use rural radio, 64% use national radio, 45% use newspapers,
64% use hand delivery, and 64% use telephone (voice) to diffuse information. In
contrast, out of the 10 non-government MIS, 60% use rural radio, 40% uses national
radio, 50% use newspapers, and 40% posters and blackboards in markets to diffuse
information. It can be concluded, therefore, that for diffusion purposes, private MIS
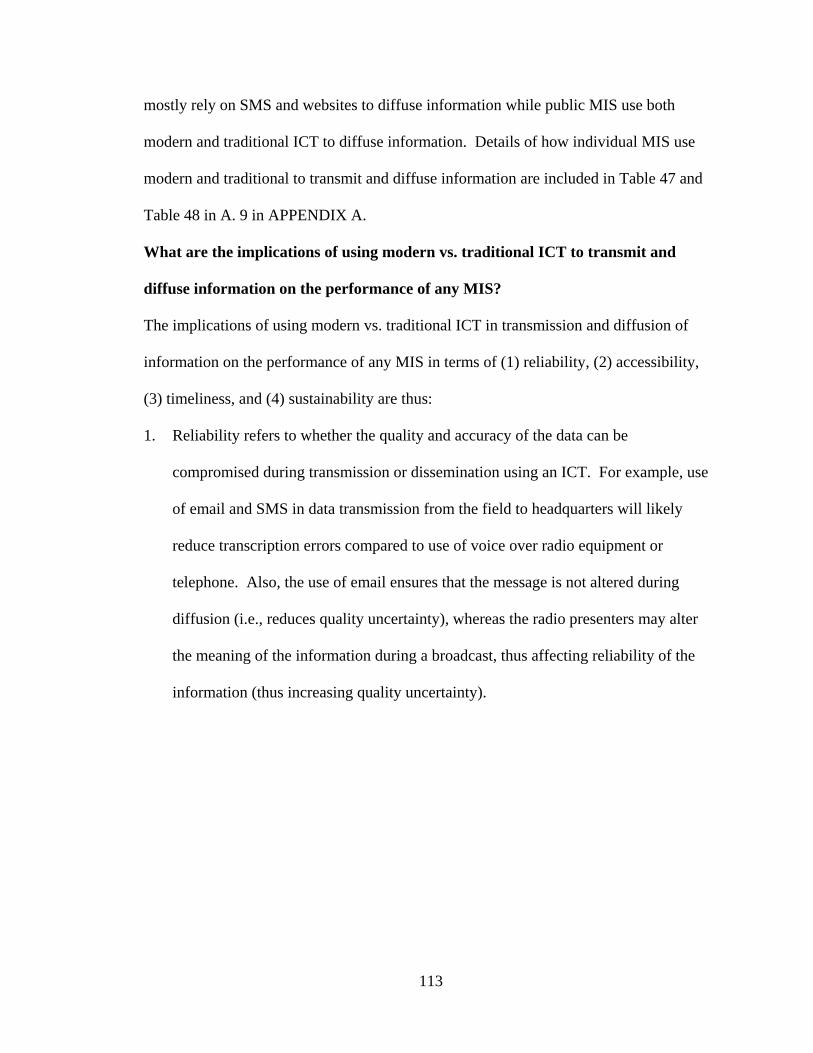
113
mostly rely on SMS and websites to diffuse information while public MIS use both
modern and traditional ICT to diffuse information. Details of how individual MIS use
modern and traditional to transmit and diffuse information are included in Table 47 and
Table 48 in A. 9 in APPENDIX A.
What are the implications of using modern vs. traditional ICT to transmit and
diffuse information on the performance of any MIS?
The implications of using modern vs. traditional ICT in transmission and diffusion of
information on the performance of any MIS in terms of (1) reliability, (2) accessibility,
(3) timeliness, and (4) sustainability are thus:
1. Reliability refers to whether the quality and accuracy of the data can be
compromised during transmission or dissemination using an ICT. For example, use
of email and SMS in data transmission from the field to headquarters will likely
reduce transcription errors compared to use of voice over radio equipment or
telephone. Also, the use of email ensures that the message is not altered during
diffusion (i.e., reduces quality uncertainty), whereas the radio presenters may alter
the meaning of the information during a broadcast, thus affecting reliability of the
information (thus increasing quality uncertainty).
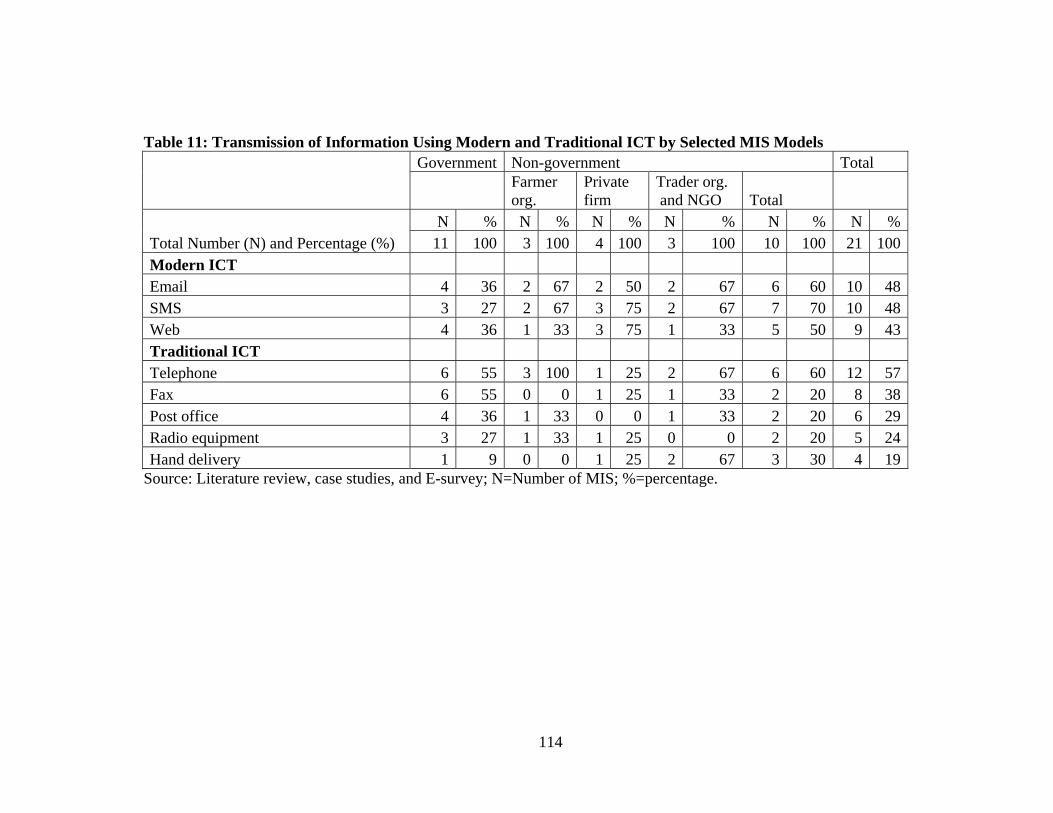
114
Table 11: Transmission of Information Using Modern and Traditional ICT by Selected MIS Models
Government Non-government Total Farmer org.
Private firm
Trader org. and NGO Total
Total Number (N) and Percentage (%) N % N % N % N % N % N %
11 100 3 100 4 100 3 100 10 100 21 100Modern ICT Email 4 36 2 67 2 50 2 67 6 60 10 48SMS 3 27 2 67 3 75 2 67 7 70 10 48Web 4 36 1 33 3 75 1 33 5 50 9 43Traditional ICT Telephone 6 55 3 100 1 25 2 67 6 60 12 57Fax 6 55 0 0 1 25 1 33 2 20 8 38Post office 4 36 1 33 0 0 1 33 2 20 6 29Radio equipment 3 27 1 33 1 25 0 0 2 20 5 24Hand delivery 1 9 0 0 1 25 2 67 3 30 4 19
Source: Literature review, case studies, and E-survey; N=Number of MIS; %=percentage.

115
Table 12: Dissemination Using Modern and Traditional ICT by MIS Selected MIS Models
Government Non-government Total Farmer org.
Private firm
Trader org. and NGO Total
Total Number (N) and Percentage (%)
N % N % N % N % N % N %11 100 3 100 4 100 3 100 10 100 21 100
Modern ICT Email 9 82 1 33 3 75 3 100 7 70 16 76Web 7 64 2 67 3 75 2 67 7 70 14 67SMS (Cell Phone) 3 27 1 33 4 100 2 67 7 70 10 48Billboards (electronic) 2 18 0 0 1 25 0 0 1 10 3 14Traditional ICT Rural radio 6 55 2 67 2 50 2 67 6 60 12 57National radio 7 64 1 33 1 25 2 67 4 40 11 52Newspapers 5 45 2 67 1 25 2 67 5 50 10 48Hand delivery 7 64 0 0 1 25 1 33 2 20 9 43Telephone (voice) 7 64 0 0 1 25 1 33 2 20 9 43Posters in markets 4 36 1 33 2 50 1 33 4 40 8 38TV 4 36 0 0 1 25 1 33 2 20 6 29Fax 4 36 0 0 1 25 0 0 1 10 5 24Blackboards 2 18 0 0 2 50 0 0 2 20 4 19Post office 2 18 0 0 0 0 0 0 0 0 2 10CD and DVD (mail) 1 9 0 0 0 0 0 0 0 0 1 5Pigeonholes 1 9 0 0 0 0 0 0 1 5
Source: Literature review, case studies, and E-survey; N=Number of MIS; %=percentage.

116
2. Accessibility refers to the ability of different users to have access to information
diffused using an ICT. For example, poor and illiterate households may be excluded
from information diffused using the SMS (cell phones) and the internet alone due to
lack of effective demand, or due to failure to digest the information. In contrast, rich
and literate users, such as traders, NGOs and Government workers, are likely to
access and understand information diffused through cell phones or internet.
However, illiterate and poor households will benefit from completion among other
users though spillover effects. In contrast, MIS that use mostly traditional ICT such
as radios are more likely to be are accessible to farmers and small-scale traders and
to poor and illiterate users. Accessibility may also be in terms of whether the
information can be stored and retrieved (accessed) in hard or soft copy for future
reference. For example, SMS, newspapers, emails may be stored and refereed to,
compared to information diffused via radio. Accessibility is also in form of the
capacity of the ICT to transmit and disseminate different information products
(market news, analysis, and time series data) to different users. For example, e-mails
have the capacity to transmit and diffuse more text than SMS.
3. Timeliness refers to the ability of an ICT to deliver the information to stakeholders
when needed for making critical decisions. For example, the use of SMS and email
to transmit and diffuse information is much faster than the use of the post office.
4. Sustainability refers the fixed and variable costs incurred, and the economies of scale
gained from the use of the ICT for transmission and diffusion on the part of the MIS,
and for reception of information on the part of the users. For example, using emails
and websites involves lower variable costs than using fax machines and radio to

117
disseminate information. To poor users, however, radio may be cheaper to use to
receive information than using an email or fax. Sustainability also includes the costs
of complementary investments (e.g., office space, electricity, and security) needed to
use the ICT. It also relates to the potential for the ICT to help recover production
costs, for example by excluding nonpaying users and minimizing free-riders. For
example, use of SMS has an advantage on potential to recover some costs than use of
broadcast radio. Accessibility may also include the costs needed to train MIS
personnel, and in some cases users to use the technology used to disseminate
information.
Whom do the different model(s) serve and how well?
All MIS models use both modern and traditional ICT for transmission and diffusion of
market information. This means that the advantages and disadvantages to different users
resulting from the ICT used to transmit and disseminate information can apply to any
MIS model. Given that the majority of non-government MIS are donor funded, and that
donors are their major clientele, it is possible that their use of modern ICT to diffuse
information is donor-driven or has a donor orientation, and not necessarily dependent on
the private effective demand of farmers and traders. This suggests that once external
donors pull out, such MIS models may be unlikely to be sustainable.
3.7.3 Funding Strategies of MIS
Many public-MIS face funding constraints to support many activities such as collection,
transmission, and dissemination of information, which affects MIS performance. For
example, in Zambia’s AMIC, there is lack of sufficient financial resources to hire and
train enumerators in some districts. This means that information is not collected

118
regularly, or is collected by untrained data collectors in some districts. Irregular
collection of data affects the timeliness of the MIS due to irregular transmission of data
from the provincial districts to the AMIC headquarters in Lusaka. Also, the use of
untrained enumerators affects the credibility and reliability of the information from the
MIS among some users.
In Nampula province in Mozambique, SIMAP used to collect information from
13 rural and 3 urban markets in 15 districts. Presently, due to limited resources to hire,
train, and to supervise enumerators, information is collected from only 4 districts. In
both Zambia and Mozambique, lack of sufficient funding leads to low staff salaries,
which contribute to the high turnover of trained staff at national, provincial, and district
levels.
Main observations
All MIS types in sub-Saharan Africa stated that they rely on external donors as their
major source of funding. No MIS in sub-Saharan countries has been able to wean itself
entirely from donor funding and graduate into a purely private sector MIS.
Total overview
Table 13 shows the stated sources of funding of selected MIS in the study. In total, the
most stated main sources of funding for the 21 MIS covered by the study include: (1)
donor funding (76% of MIS); (2) government funding (57% of MIS); (3) subscriptions
fees and information sales (52% of MIS); (4) in-kind contributions and exchange of
services (19% of MIS); (5) sponsorships from private companies (19% of MIS); (6)
consultancy and training services (14% of MIS); and (7) tie-in-sale of information (5% of
MIS).
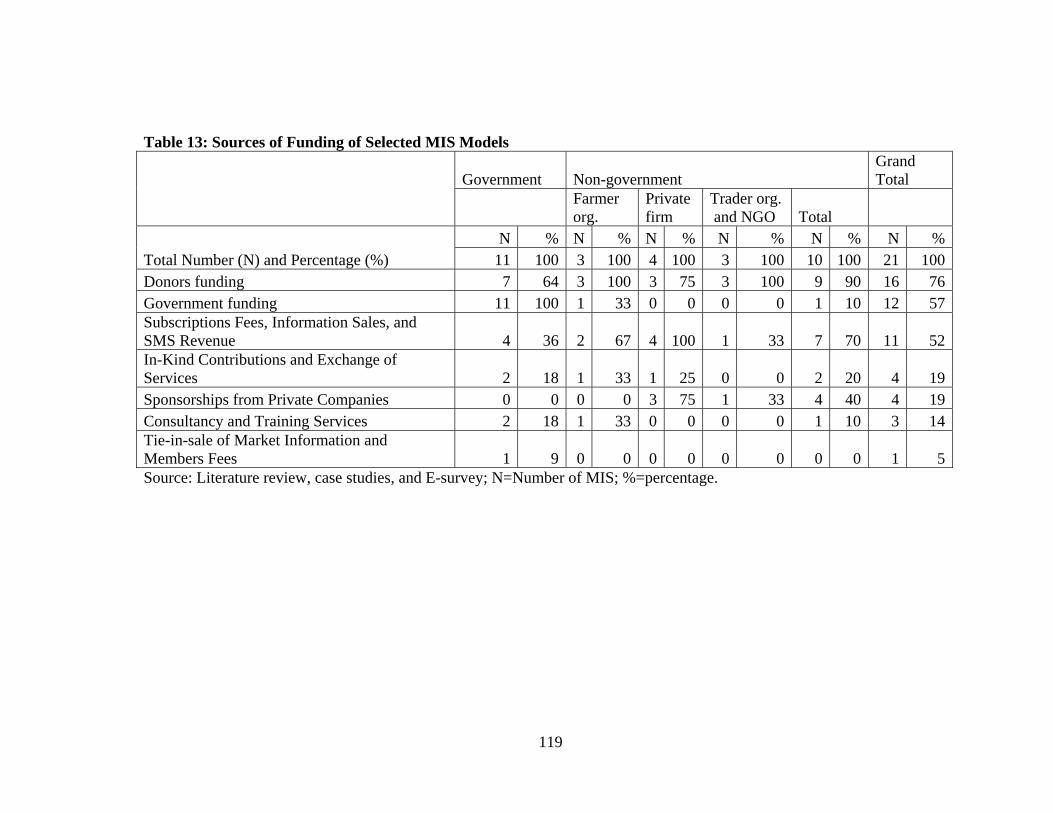
119
Table 13: Sources of Funding of Selected MIS Models
Government Non-government Grand Total
Farmer org.
Private firm
Trader org. and NGO Total
Total Number (N) and Percentage (%)
N % N % N % N % N % N %11 100 3 100 4 100 3 100 10 100 21 100
Donors funding 7 64 3 100 3 75 3 100 9 90 16 76Government funding 11 100 1 33 0 0 0 0 1 10 12 57Subscriptions Fees, Information Sales, and SMS Revenue 4 36 2 67 4 100 1 33 7 70 11 52In-Kind Contributions and Exchange of Services 2 18 1 33 1 25 0 0 2 20 4 19Sponsorships from Private Companies 0 0 0 0 3 75 1 33 4 40 4 19Consultancy and Training Services 2 18 1 33 0 0 0 0 1 10 3 14Tie-in-sale of Market Information and Members Fees 1 9 0 0 0 0 0 0 0 0 1 5Source: Literature review, case studies, and E-survey; N=Number of MIS; %=percentage.

120
Comparison of Sources of Funding Between MIS Models and Implications on Their
Performance
Donor funding: The most common source of funding for MIS is from external donors,
either directly or through contributions to the government budget. Donor funding also
includes funds from charity organizations, NGOs, research institutions, universities, and
UN bodies such as WFP and FAO. The specific figure of how much donors contribute to
MIS budgets was not established. Table 13 shows that 64% of government MIS and 90%
of non-government MIS are funded by donors. At The United Nations Economic
Commission for Africa (UNECA) meeting in Addis Ababa in Ethiopia in May 2011,
Mark Davies stated that Esoko gets 25% of its funding from donors. The rest is private
or self-generated funds. So for Esoko, donors are an important, but not “the major”
source of funding.
Government funding: By default, all public MIS are funded from taxpayers’
money from local and central government budgets. In contrast, 10% of non-government
MIS stated to receive some funding from government tax money. For example, AMIC is
funded by the Government of Zambia, and SIMA is funded by the Government of
Mozambique. Some of the funding from government budgets, however, is from donors.
Most of the MIS activities in high-income countries have benefited from long-term
government funding. For example, the activities of the USDA F&VMN have existed for
over 95 years and those of NASS for over 145 years on federal and state government
funding. In contrast, only one MIS—Mali’s OMA, which is based in a farmer
organization, is also funded by government tax money.

121
Subscriptions fees and information sales: Table 13 shows that 36% of public
MIS receive subscriptions or charge user fees while 70% of non-government MIS receive
subscriptions or charge user fees. Charging subscriptions and user fees is made possible
by increase in the use of modern ICT such as websites with passwords and SMS, which
makes some information a low exclusion cost good. One advantage of charging
subscriptions and user fees is that the MIS recovers some production costs when
individual users request for information, and how these resources are shared with
employees affect incentives for performance as indicated in section 3.6.2.4. Although
ZNFU SMS MIS, Esoko Ghana, and KACE in Kenya use ICT that can turn information
into low exclusion cost goods, they still receive funding from external donors to support
some of their operations. According to the manager of the ZNFU SMS MIS during
personal interviews in Lusaka in October 2009, the resources generated from SMS
requests cannot cover their operational costs of the SMS MIS. In India, RML has
170,000 subscribers spread in 12,000 villages, which seems to be small percentage of
households receiving information in the 8 Indian states in which it operates (Lokanathan
and Silva, 2010). It is noted, however, that information received by a few MIS
subscribers (e.g., traders) can improve the market competitiveness (e.g., through spatial
and temporal arbitrage) in a way that benefits farmers who do not subscribe to
information services.
In-kind contributions and exchange of services: Eighteen percent of
government MIS and 20% of non government MIS receive in-kind contributions. In-kind
contributions refer to contributions the MIS receives from stakeholders, sometimes in
exchange of services that lead to cost reductions on the part of the MIS. Some MIS

122
receive in-kind contributions from private sector firms, farmer organizations, and
research and education institutions. Examples of in-kind contributions include telephone
handsets from cell phone manufacturing companies to MIS. In India, government
agricultural institutes provide content to RML; and in Mali, a farmer organization (the
Chamber of Agriculture) provides office space to OMA.
Sponsorships from private companies: Private companies can sponsor some
MIS activities, especially when such support contributes to the profitability of the private
firms. Table 13 shows that at the time of the survey, no government MIS stated to
receive sponsorship from private firms while 40% of non-government MIS received
sponsorships from private companies. For example, cell phone companies could provide
cell phones and data cables for data collection, or facilitate the development of SMS
information exchange platforms. The incentives for the cell phone operators are that
users would use more airtime to request for market information, which would generate
extra revenue for the cell phone companies, the data management companies, and the
MIS. For example, in Niger, the MIS has recently signed a 3-way deal with Orange (a
cell provider), a data management company, and the SIMA to provide SMS market
information on a “pull” basis. The three entities will share the revenue from this service,
although it is not clear if Orange is providing any equipment to the SIMA.
Why don’t private companies sponsor as many government MIS as they do with
non-government MIS? One possible reason is that MIS workers are not aggressive in
negotiating with private companies to sponsor MIS programs as are workers in Non-
government MIS.
123
Also, input dealers could sponsor popular MIS programs in which they air
advertisements. Radio stations could provide free airtime to the MIS with the incentives
that the MIS information induces listeners to tune in to the radio station. The
disadvantage with receiving sponsorships from private companies is that some users may
develop negative perceptions about the objectivity and credibility of the information from
the MIS. One conclusion from the survey results is that it appears that non-government
MIS have been more aggressive in seeking other private-firm sponsorship of their
activities than have public-sector MIS.
Consultancy and training services: Some MIS such as OMA generate resources
through conducting specialized market research and producing specialized information
products demanded by government, donors, NGOs, and the private sector. Providing
services is a potential source of revenue for MIS. For example, in Nampula province in
Mozambique, some NGOs are interested in sponsoring farmers to participate in MIS
training workshops to learn how to use market information to make informed production
and marketing decisions. For NGOs to do this, they would like SIMAP to demonstrate
that the information it provides can lead to profitable market transactions, a classical
uncertainty problem that can cause market failure in the information subsector. In
Ghana, Esoko generates funding from designing internet-based information exchange
platforms where users can exchange market information using SMS and the internet.
Tie-in-sale of information: An example close to a tie-in sale of market
information is in the Ethiopia Commodity Exchange (ECX). The Government of
Ethiopia put in place legislation that compels most coffee traders and unions to trade
coffee on the exchange at a fee. Part of this fee goes towards supporting the running of

124
the MIS including disseminating market information to all coffee farmers in Ethiopia.
This means that as long as trading is sustained, information generation is also sustained.
Charging membership fees is possible for cash crops such as coffee with a controllable
and a narrow value chain, but not other staple commodities such as maize and beans with
many informal value chains, and those not frequently traded on the exchange.
Whom do the different model(s) serve and how well?
All types of MIS can be funded through the sources of funding identified in this section.
Even if the private MIS in this study reported not to receive funding from government,
governments could still fund them to provide market information to stakeholders if it is
determined that they can provide the information efficiently. This means that all
advantages and disadvantages resulting from different funding options can apply to all
MIS models and to their stakeholders, depending on the environment in which the MIS
operates and other structural and conduct issues discussed in this chapter such as
technologies used in dissemination which may affect the accessibility of information to
some users.
3.7.4 Data Collection Methods Used By MIS
One of the generic problems of early generation MIS were that they had poor data
methods. Moreover, data collection is expensive, and MIS need to reduce data collection
cost and at the same time maintain the quality of the data in terms of sampling and non-
sampling errors. Also, the methods used to collect data affect the reliability, timeliness,
and sustainability in terms of collection costs. The premise was that second-generation
MIS would use the wiki approach of data collection, where multiple users would
contribute information, thereby increasing timeliness of the MIS compared to first-

125
generation MIS that mostly used structured questionnaires with enumerators in the
market.
Main observations
Most MIS stated that they use structured questionnaires and interviewer observation
(57%) compared to a wiki approach (5%) to collect market information. There is weak or
limited supervision of data collection among many public MIS. The wiki approaches,
where used, do not use a standard method such as always observing the same grade of
product or always reporting actual transactions rather than offer prices, which makes the
reliability of such systems suspect in situations where there are relatively few
participants.
Comparison between MIS Models
Table 14 shows that out of the 11 government MIS, the most stated methods of data
collection are: structured questionnaires (64%), observation by enumerators (55%), and
telephone interviews (36%). In contrast, out of 10 non-government MIS, 50% use
structured questionnaires, 60% use observations by enumerators in the market, 30% use
telephone interviews, and 30% use administrative and secondary sources of information.
In total, all MIS mostly use structured questionnaires (57%), observation by enumerators
(57%), and telephone interviews (33%). Only one MIS uses a wiki approaches where
users SMS or update the web to collect information. The details of the data collection
methods used by individual MIS are included in Table 50 in section A. 9 in APPENDIX
A.
126
What are the implications of the different data collection methods used on MIS
performance?
From an industrial-organization point of view, the level of investment in data collection
can be viewed as a strategy to control critical assets and inputs, which can give an MIS
competitive advantage over new entrants. For example, in India, ‘RML’ incurred
substantial overheads to employ data collectors, which resulted in competitive advantage
over potential competitors (Lokanathan and Silva, 2010) This acts as a barrier of entry,
although it is reportedly intended to improve on quality of information by controlling the
collection process. The next subsections give the advantages and disadvantages of
different data collection methods.

127
Table 14: Data Collection Methods Used By Selected MIS Models
Government Non-government Grand Total
Farmer org.
Private firm
Trader org. and NGO Total
Total Number (N) and Percentage (%) N % N % N % N % N % N %
11 100 3 100 4 100 3 100 10 100 21 100Structured questionnaires (One-on-one interview by reporters in markets) 7 64 2 67 2 50 1 33 5 50 12 57Observation by reporters in markets 6 55 2 67 3 75 1 33 6 60 12 57Telephone interviews 4 36 1 33 0 0 2 67 3 30 7 33Questionnaires mailed to market participants 2 18 0 0 1 25 2 67 3 30 5 24Administrative/ secondary sources 2 18 0 0 0 0 2 67 2 20 4 19Obligatory declaration of information 2 18 0 0 0 0 1 33 1 10 3 14Wiki approaches (where users SMS or update the web) 0 0 0 0 1 25 0 0 1 10 1 5Byproduct of transactions on the exchange 1 9 0 0 0 0 0 0 0 0 1 5Source: Literature review, case studies, and E-survey; N=Number of MIS; %=percentage.
128
Structured questionnaires and observation by enumerators: When
questionnaires are well conceived and the data collection is adequately supervised, the
use of structured questionnaires and observation by field data collectors can lead to
reliable (high quality and accurate) information compared to use of telephone interviews
and wiki approaches (where users provide information using SMS and web). Telephone
interviews and wiki approaches, however, increase frequency (timeliness) of information
and are cheaper to conduct on part of the MIS (which increases sustainability). One of
the key issues is whether the MIS has a clear methodology regarding definition of
different levels in the marketing system where prices are observed and the grades of
products to be followed (e.g., how are “assembly markets” or “transit markets” defined?
How are “farmgate prices”, “retail prices” or “wholesale prices” defined?). Without
clarity on these issues, the price data collected in different places in the country are
unlikely to be comparable, and a structured questionnaire may be an indicator (but not a
guarantee one) that the MIS has gone through a structured process to address these
methodological issues, which more informal or wiki approaches may not do. The use of
structured questionnaires and observation by field data collectors is expensive because it
requires recruiting and training enumerators, transporting them to markets, and
supervising them on a regular basis.
Telephone interviews: Collecting information through telephones is cheaper
than driving to distant markets when the costs of calling are low. The disadvantage is
that there is no direct observation, implying that the information provided is difficult to
verify. Thus, the use of telephones to collect data requires a higher level of trust between
the MIS and the information providers. Also, telephone interviews cannot be conducted

129
in rural markets where telephone services are not available. In ZNFU SMS MIS,
information is collected using telephone interviews with commodity traders. Another
method of collecting market information, especially in developed countries such as the
US, is the use of telephone interviews through Computer Assisted Telephone
Interviewing (CATI).
Postal mail out/in questionnaires and on-line survey questionnaires: In
developed countries (e.g., NASS in the USA), MIS mail questionnaires through the post
or by email to market participants, agro-enterprises, and farmers who mail back filled
forms to the MIS. They also collect information from respondents through internet links
to online questionnaires. Although these methods involve lower collection costs, they are
not feasible in low-income countries where the postal systems are slow or not available in
rural areas, and where the use of the internet is very limited. These methods also require
enforceable laws that compel respondents to provide information. For example, in the
US, some producers and agribusiness (e.g., in dairy products) are given market
information forms which they are obligated by law to fill-in and fax or mail back to
NASS. This is also referred to as obligatory declaration of information. Such approaches
are more suited to collecting information on variables that change relatively slowly over
time (such as inventory levels or negotiated contract prices) rather than spot-market
prices.
Administrative and secondary sources: Some types of information are obtained
from administrative and secondary sources. Such information includes exchange rates
and regional and international prices of commodities. In Mozambique, as a sustainability
strategy in terms of reducing data collection costs, SIMAP would like the tax collectors

130
to also collect market information, since tax collectors are there in all markets, and tax
collection is a more sustainable activity. There is a tendency, however, for traders to fear
giving truthful market information to tax collectors for fear of being overtaxed. Thus,
this strategy may reduce the reliability and credibility of information from the MIS.
Wiki approaches: Another approach that MIS use to collect information is the
wiki approach. In this approach, information users provide the information, such as their
selling prices for commodities, using the web and cell phones. This approach is used by
Esoko Ghana, where users can use cell phones to post information on the internet about
agricultural commodities they wish to buy or sell. The advantages of this method is that
(1) the MIS incur little or no field collection costs, (2) providers post and look for the
exact information they need, which increases relevance among users, (3) the approach
increases the speed of information collection and dissemination, thereby increasing
timeliness. One disadvantage with wiki methods of collecting information is the
potential for strategic information contributors to destroy the credibility and reputation of
the MIS, for example by providing wrong information about the quality of products they
are selling. These potential errors may reduce as the number of users increase. In theory,
wiki-based approaches rely on the law of large numbers to help assure quality control—
i.e., if enough people contribute information, errors tend to get corrected quickly and
information goes towards indicators of central tendency. In sub-Saharan Africa, wiki-
based MIS approaches have relatively few contributors of information, so this correction
tendency may be weak. Another potential problem with allowing many users to
contribute information in wiki approaches is the inconsistent reporting across different
grades and standards of the products by different users and levels of the marketing system
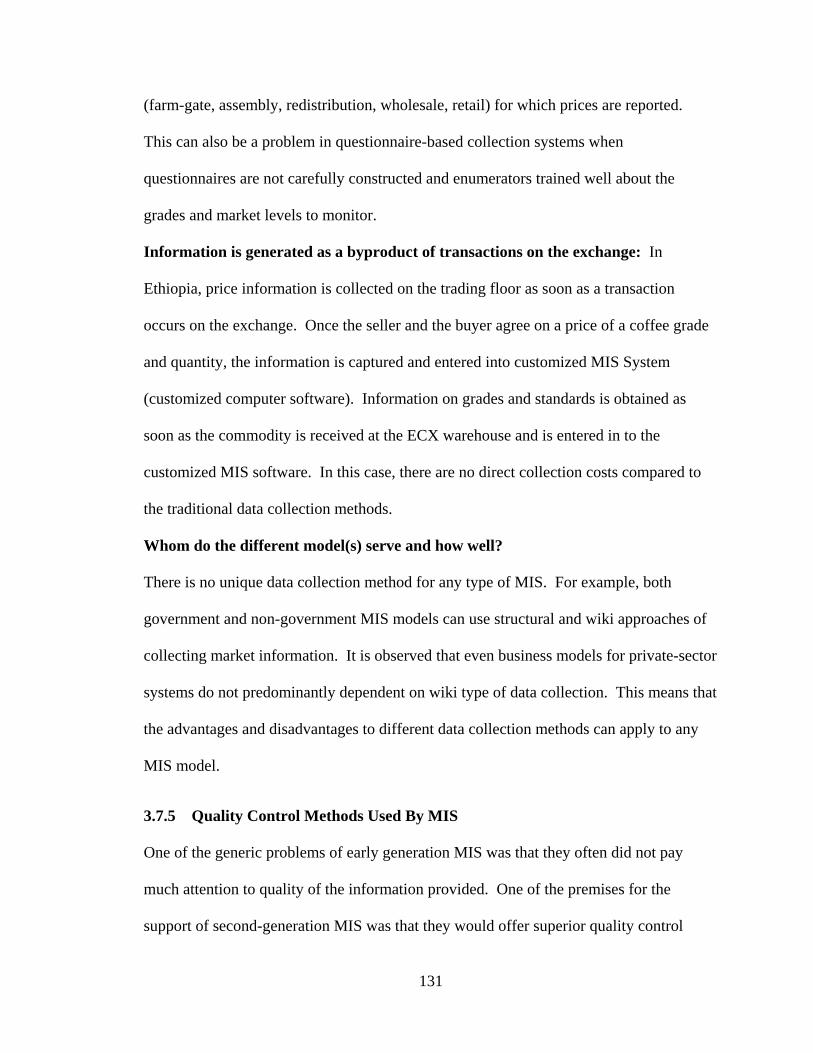
131
(farm-gate, assembly, redistribution, wholesale, retail) for which prices are reported.
This can also be a problem in questionnaire-based collection systems when
questionnaires are not carefully constructed and enumerators trained well about the
grades and market levels to monitor.
Information is generated as a byproduct of transactions on the exchange: In
Ethiopia, price information is collected on the trading floor as soon as a transaction
occurs on the exchange. Once the seller and the buyer agree on a price of a coffee grade
and quantity, the information is captured and entered into customized MIS System
(customized computer software). Information on grades and standards is obtained as
soon as the commodity is received at the ECX warehouse and is entered in to the
customized MIS software. In this case, there are no direct collection costs compared to
the traditional data collection methods.
Whom do the different model(s) serve and how well?
There is no unique data collection method for any type of MIS. For example, both
government and non-government MIS models can use structural and wiki approaches of
collecting market information. It is observed that even business models for private-sector
systems do not predominantly dependent on wiki type of data collection. This means that
the advantages and disadvantages to different data collection methods can apply to any
MIS model.
3.7.5 Quality Control Methods Used By MIS
One of the generic problems of early generation MIS was that they often did not pay
much attention to quality of the information provided. One of the premises for the
support of second-generation MIS was that they would offer superior quality control

132
methods compared to first-generation MIS, as quality control was essential to making
their user-supported business model successful.
Main observation
Non-government MIS stated that they used more quality control methods than did
government MIS. All types of MIS mostly use verification and inspection of data for
errors (67%), refresher training courses for data collectors (62%), and regular supervision
and monitoring of collectors (62%) as the main methods of quality control.
Comparison between MIS Models
Table 15 shows that out of the 11 government MIS, the most stated methods of quality
control include: verification and inspection of data collected for errors (55%), refresher
training courses for data collectors (64%), and regular supervision and monitoring of
collectors (55%). Out of the 10 non-government MIS, 80% stated that they use
verification and inspection of data collected for errors, 60% use refresher training courses
for data collectors, 70% use regular supervision and monitoring of collectors, and 60%
use unexpected market visits to monitor the data collectors and data entry control and
validation programs (e.g., use of data entry error check programs).
Total overview
Table 15 shows that out of 21 MIS, 67% use verification and inspection of data collected
for errors; 62% use refresher training courses for data collectors and regular supervision
and monitoring of collectors; and 48% use unexpected market visits to monitor the data
collectors, data entry control and validation programs (e.g., use of data entry error check
programs), and obtain feedback from user surveys about quality of the information from

133
the MIS. Details of the quality control methods used by individual MIS are included in
Table 50Table 51 in section A. 9 in APPENDIX A.
Some of the MIS in this study use standardized methods for data collection as a
method of quality control. Use of standardized questionnaires involves use of pre-coded
commodities and their units of measurements, including standardized definitions of
different levels in the marketing chain at which data are collected. Some MIS use
additional methods of quality control. For example, in Mozambique, the supervisors use
their local knowledge about production in the areas to see if the price increases or
decreases correspond with the production or supply in the area. They also use multiple
respondents in markets to control quality and ensure consistency. In the ZNFU SMS
MIS, regional managers verify whether the prices submitted by traders are the ones they
actually buying at by calling the traders and asking their buying prices anonymously and
comparing them with those offered to farmers. OMA has a monitoring department that
ensures that enumerator follow the established methods of data collection. OMA also has
technical and oversight committees that guide the MIS in its activities (Diarra, et al.,
2004).
134
Table 15: Quality Control Methods Used By Selected MIS Models
Government Non-government Grand Total
Farmer org.
Private firm
Trader org. and NGO Total
Total Number (N) and percentage (%) of MISN % N % N % N % N % N %11 100 3 100 4 100 3 100 10 100 21 100
Verification and tests after data capture for errors 6 55 2 67 3 75 3 100 8 80 14 67Refresher training courses for data collectors 7 64 1 33 3 75 2 67 6 60 13 62Regular supervision and monitoring of data collectors 6 55 1 33 3 75 3 100 7 70 13 62Unexpected market visits to data collectors 4 36 2 67 3 75 1 33 6 60 10 48Data entry control /validation programs 4 36 1 33 3 75 2 67 6 60 10 48Feedback from MIS user surveys 5 45 2 67 2 50 1 33 5 50 10 48User verification (e.g. in wiki MIS) 2 18 1 33 0 0 1 33 2 20 4 19Monitoring and supervisory committee 1 9 1 33 0 0 0 0 1 10 2 10Advice from advisory panel and boards 0 0 1 33 0 0 0 0 1 10 1 5Source: Literature review, case studies, and E-survey; N=Number of MIS; %=percentage.

135
The ECX information collection process has instant quality control mechanisms
in the sense that the seller and buyer sign the papers after a transaction is done. Both the
seller and buyer submit the paper to the counter for entry into the system and the funds
are transferred from the buyer’s account to the seller’s account. There is no room for
errors, as these would mean loss of funds by either the buyer or the seller. This increases
reliability of the data released by the MIS. Providing information as a byproduct
increases timeliness. Also, it increases in sustainability because the MIS does not incur
field collection costs.
In the USA F&VMN, quality control in collection is achieved by training market
reporters in data collection skills. In NASS, quality control is mostly ensured in the data
collection process by (1) careful selection and training of enumerators, (2) use of detailed
instruction manuals, (3) field supervision,(4) questionnaire checks, (5) comparison of
reported acreage with those measured on the aerial photographs, and (6) and follow-up
visits to some segments (NASS, 2009).
What are the implications of quality control methods for MIS performance?
From theory given in section 2.2.4, quality uncertainty makes risk-averse users under-
invest in information acquisition. This means that MIS need to assure high quality
information to users so as to create and maintain demand for its information products.
Whom do the different model(s) serve and how well?
The quality control methods can be adopted by any MIS depending on the resources
available. This implies that there is no sufficient evidence to claim that one type of MIS
model has better quality control methods than another. It also implies that the advantages
136
and disadvantages associated with different quality control methods can apply to all MIS
models and their stakeholders.
3.7.6 Feedback Mechanisms Used By MIS
One of the frequent criticisms is that, as bureaucratic organizations, public MIS had no
incentive to take stakeholders’ views into consideration during the design of MIS and had
limited feedback from users. This was one of the reasons why some stakeholders called
for more private-organized MIS, which presumably would have stronger incentives in
this regard. One of the premises for the support of second-generation MIS was that they
offer better feedback methods compared to first-generation MIS.
Main Observations
Non-government MIS reported using more feedback methods compared to government
MIS.
Total Overview
Table 16 shows that out of the 21 MIS, the most stated feedback mechanisms used
include: users' assessment or needs surveys (57%); customer satisfaction surveys,
meetings with users (including farmer or trader groups), and from monitoring or analysis
of information downloaded from websites or SMS requests (43%); and external
evaluations by donor, government, or third party(ies) (38%).
Comparison between MIS Models
Out of the 11 public MIS, the main feedback mechanisms include: users' assessment or
needs surveys (55%), customer satisfaction surveys and meetings with users (36%), and
from listenership groups (27%). Out of 10 non-government MIS, the main feedback
mechanisms include: users' assessment or needs surveys and external evaluations by

137
donor, government, or third party(ies) (60%), monitoring or analysis of information
downloaded from websites or SMS requests (80%), and customer satisfaction surveys
and during meetings with users (including farmer or trader groups) (50%). The details of
feedback methods used by individual MIS are included in Table 52in section A. 9 in
APPENDIX A.
Some MIS use unique feedback mechanisms. For example, the ECX receives
feedback from reviews from regulators (the Ethiopia Commodity Exchange Authority),
review of information from the customer service center hotline, information collected in
the compliance section of the exchange, and its public awareness programs.
In Monze district in Zambia, the MIS receives feedback from meetings with
farmer groups, through telephone calls to the radio program from listeners, and from
farmers who visit the MIS office. Also, MIS that disseminate information through SMS
and the web, such as Esoko, KACE, and the ZNFU, analyze SMS requests and webpage
hits and make inferences about usage. A high number of hits indicate users like the
information and a few hits indicate users do not like the information. The ZNFU
conducts raffles at district farmer shows where they quiz the farmers to gauge their
knowledge of the SMS MIS and whether they use the information.

138
Table 16: Feedback Mechanism Used By Selected MIS Models
Government Non-government Grand Total
Farmer org.
Private firm
Trader org. and NGO Total
Total Number (N) and Percentage (%) N % N % N % N % N % N %11 100 3 100 4 100 3 100 10 100 21 100
Potential MIS users' assessment /needs surveys 6 55 2 67 3 75 1 33 6 60 12 57Customer satisfaction surveys 4 36 2 67 2 50 1 33 5 50 9 43Meetings with users (including farmer or trader groups) 4 36 0 0 3 75 2 67 5 50 9 43Monitoring of information downloaded (SMS and website) 1 9 2 67 3 75 3 100 8 80 9 43External evaluations (by donor, government, or third party) 2 18 1 33 2 50 3 100 6 60 8 38Listenership groups 3 27 0 0 1 25 0 0 1 10 4 19Suggestion boxes 1 9 0 0 0 0 0 0 0 0 1 5Reviews from regulators 1 9 0 0 0 0 0 0 0 0 1 5Customer service center hotline 1 9 0 0 0 0 0 0 0 0 1 5Source: Literature review, case studies, and E-survey; N=Number of MIS; %=percentage.
139
What are the implications of feedback methods for MIS performance?
Obtaining feedback helps the MIS to evaluate the changing user needs and the evolution
of markets so that it evolves with the market and continues to supply useful products.
For the MIS to be effective in anticipating and responding to changing information needs,
the analysts need to understand the market structure, either through their own studies or
through obtaining such information from others, including users. For example, feedback
helps the MIS to understand the types of information users need, their preferred channels
and frequencies of receiving the information, and the types of value chains in which they
engage in.
Whom do the different model(s) serve and how well?
The conclusion from the various feedback methods used by different MIS is that non-
government MIS use more feedback methods compared to government MIS. One reason
for this is could be that non-government MIS are closer to the users and hence get
feedback from users than do government MIS.
3.8 Summary of Key Observations and Conclusions from the Synthesis
3.8.1 Summary of Key Observations
The main objective of this synthesis was to analyze the premises that gave rise to the
“second generation” MIS models and how they deal, relative to the “first-generation”
MIS models, with the generic design issues facing any MIS. The sample used in this
study is not representative of all MIS, and is primarily focused on Sub-Saharan Africa.
Therefore, the conclusions in this section are drawn based on the characteristics of the
MIS surveyed. The presentation of the main observations follows the analytical
framework used in the synthesis.

140
A. Generic Structural Design Issues Facing Any MIS
1. Perceived mandate
a. Most first-generation MIS aim at attaining efficient marketing, gathering
information for making better policy formulation, for food security planning
and monitoring, and attaining “fairer” markets. In contrast, second-generation
MIS mostly aim at attaining efficient marketing, linking producers to markets,
and enabling farmers to negotiate for better prices with traders (attaining
“fairer” markets.)
b. Both first- and second-generation MIS consider farmers, traders, and
governments as their main clientele.
2. Institutional Home, Organizational Features, and Coordination Forms
a. Provision of complementary services: Based on a qualitative assessment
and examples, all types of MIS or institutions in which they are housed
provide complementary services, some of which generate information as
byproducts or help increase sustainability, reliability, and timeliness of
information among users. It appears that non-government MIS provide more
categories of complementary services compared to public MIS, although the
performance outcomes vary depending on the specific complementary
services provided by MIS and not by MIS types as a whole.
b. Geographic coverage and range of commodities covered: Government MIS
have a more national coverage (91%) compared to non-government (60%).
More non-government MIS (50%) cover only part of a country than do
government MIS (9%). There is no evidence to suggest that first-generation

141
MIS cover a higher number of commodities than second-generation MIS—
within our sample, the coverage varies widely within each category of MIS.
The number of rural and urban markets covered by MIS varies
unsystematically: some, but not all, government MIS monitor more markets
than do non-government MIS.
c. Assuring coordination among MIS activities and production stages:
i. Vertical integration of MIS activities: There seems not to be a
difference between government and non-government MIS in terms of
the degree of integration of MIS activities such as collection, analysis
and diffusion of market information. On the one hand, both first- and
second-generation MIS are vertically integrated in a sense that they
collect, analyze and disseminate some types of market news
themselves, using a “make” or “produce the information itself” model.
On the other hand, both types of MIS are specialized in collection of
some types of information and get other types of information (e.g.,
weather and agronomic information) from outside organizations
analogous to the “buy” or “get it from someone else” model.
ii. Centralization vs. decentralization of MIS activities: More non-
government MIS (80%) stated that they were centralized than did
government MIS (55%) in information processing and diffusion.
Also, one government MIS stated that it was decentralized and no non-
government MIS reported to be decentralized in information
processing and diffusion. Furthermore, more government MIS (36%)
142
are mixed (both centralized and decentralized) in information
processing and diffusion than are non-government MIS (20%).
iii. Specialization in the production of MIS products: Most MIS in
sub-Saharan Africa included in this study are not specialized in the
production of MIS products than are those in developed countries.
MIS in high-income are relatively specialized in the production market
news and other organization in the production of market analysis and
business reports than those in low-income countries.
d. Designing incentives for staff to be responsive to client needs: It seems that
non-government MIS face more “high-power incentives” than public MIS to
deal with poor incentives problems such as low staff salaries, fixed staff
salaries, excessive bureaucracy, shirking, and reliance on behavioral
monitoring instead of output-based monitoring.
e. Profit orientation of the MIS: Most private MIS such as KACE and Esoko
are designed to be profit-oriented. In contrast, most public- and farmer
organization-based MIS are not profit-oriented.
3. The nature of commodities covered: Nearly all types of MIS reviewed deal in
several staple crops. Only ECX predominantly deals with one cash crop (coffee).
B. Generic Conduct Design Issues for Any MIS
4. Information provided and frequency of provision: All types of MIS provide
market news. In terms of market analysis, 27% of public MIS and 30% of non-
government MIS provide market analysis. None of the MIS in the sample provide
business reports. Non-government MIS do not engage market and policy analyses

143
compared to government supported MIS, but could provide data to units that do.
Currently they do not provide such information to policy analysis units. These results
imply that there are no clear patterns to suggest that non-government MIS provide
more market news and analysis than government MIS nor that non-government MIS
provided the information more frequently than public MIS where bureaucracy is
likely to be higher.
5. ICT used in transmission and diffusion of market information: Most non-
government MIS started after 2005 after the increase in availability usage of cell-
phones in low-income countries, suggesting that the increase in availability and usage
of cell phones was a major factor that contributed to the start of these MIS models in
low-income countries. Most government MIS use traditional ICT to transmit
information from markets to the MIS, while non-government MIS mostly use modern
ICT to transmit information. Most government MIS use both traditional and modern
ICT to diffuse information, while non-government MIS mostly use SMS and websites
(modern ICT) to diffuse information.
6. Funding strategies of MIS: All MIS types in SSA still heavily depend on external
donor funding as their sustainability strategy. Also, it appears that non-government
MIS have been more aggressive in seeking other private-firm sponsorship of their
activities than have public-sector MIS. Also, no MIS in sub-Saharan country has
been able to wean itself entirely from donor funding and graduate into a purely
private sector MIS.
7. Data Collection Methods Used By MIS: Most MIS (both first- and second-
generation) stated that they use structured questionnaires and interviewer observation

144
(57%) compared to a wiki approach (only one of the MIS surveyed) to collect market
information. There is weak or limited supervision of data collection among many
public MIS. The wiki approaches, where used, do not use a standard method such as
always observing the same grade of product or always reporting actual transactions
rather than offer prices, which makes the reliability of such systems suspect in
situations where there are relatively few participants.
8. Quality control methods used by MIS: Non-government MIS stated to use more
quality control methods than government MIS. All types of MIS mostly use
verification and inspection of data for errors (67%), refresher training courses for data
collectors (62%), and regular supervision and monitoring of collectors (62%) as the
main methods of quality control.
9. Feedback mechanisms used by MIS: Non-government MIS stated to use more
feedback methods compared to government MIS.
3.8.2 Conclusions from the Synthesis
1. There is great heterogeneity among MIS in terms of their structure and conduct
design issues as indicated in the summary above.
2. Whether or not an MIS is government-based explains very little in terms of its
performance. The key conclusion seems to be that just changing the institutional
home does not guarantee that the basic design dilemmas of an MIS are addressed.
Rather, those need to be addressed in any MIS, and the key issues are internal
principal-agent issues within the organization. These can be addressed in any type of
MIS, but often may be easier to address in a non-government MIS because they
provide high-powered market incentives compared to government MIS that provide

145
low-powered hierarchical incentives. At a minimum, financial and managerial
autonomy appears to be a precondition for the better performance of both types of
MIS.
3. There is a rapidly evolving market environment in terms of (a) market actors, and (b)
ICT availability and usage.
4. One cannot analyze the key design issues of MIS independent of overall environment
in which they operate.
3.9 Implications for Stakeholders in Terms of Promoting and Supporting
Different Types of MIS
1) Specialization in the Production of MIS Products
In SSA, public MIS can be designed to provide basic market news (i.e., specialize in
market news) needed by all users such as market prices and quantities supplied in critical
stages of value chains; and other MIS types and organizations (e.g., private- and farmer
organization-based MIS, universities, and private firms) provide more customized
information and specialized market analysis and business reports a fee to users with
effective demand. This arrangement would ensure that poor farmers who do not have
effective demand receive basic market news; users with effective demand receive market
analysis and business reports; and private MIS that produce market analysis and business
reports recover some production costs.
The public MIS does not have to conduct primary collection of all types of
“missing” market news. Instead, it can link with organizations (both public and private)
that collect other types of information and get it for free or for a cost depending on the
types of information. This would compare with specialization (“make”) to produce basic
146
information and relying on other outside sources (“buy”) for other types of market
information. For example, public MIS can get weather forecast from public metrological
offices and agronomic information from public agricultural research organization.
2) Designing Incentives for Staff to be Responsive to Client Needs
There is need for the MIS to offer efficient wages so as to retain good quality staff at
national, provincial, and district levels; and to increase incentives of MIS workers so that
they collect and disseminate information regularly (reduce shirking).
a) Increasing wages: One of the institutional changes may be for government to
allow MIS personnel to work for fewer days in a week (e.g., 3 work days in a
week). This would be equivalent to an increase in wages to workers, and leave
them with some extra time to engage in alternative activities to supplement their
incomes. The limitation of reducing work days is that enumerators usually carry
out other activities at the province or district such as provision of extension
services and distribution of fertilizer; thus they might be needed for the full week.
The equivalent action is to increasing wages, which would enable the MIS hire
good staff since it offers an efficiency-wage, but the question becomes how to
finance this. Given the financial constraints of the MIS, the first option seems
easier to implement than the second one.
b) Autonomy and residual claimancy: One solution is to give the MIS some level
of financial and managerial autonomy. Financial autonomy will enable MIS
generate revenue, and to allow the MIS to become the residual claimant of extra
revenues generated through consultancies like in Mali’s OMA. From a principal-
agent perspective, contracts with residual claimancy can deal with the shirking

147
problem better compared fixed-wage contracts (Hayami and Otsuka, 1993, Ray,
1998). Managerial autonomy can enable MIS to make hiring and firing decisions
and use of resources like vehicles, telephones, and computers. There is need to
develop clear rules for sharing resources by MIS that are funded by government
and donors. Managerial autonomy also implies that rules for sharing resources
are developed.
c) Hiring locally: MIS may also be encouraged to hire enumerators from within the
areas they are located. Local enumerators are likely to be sustained on a lower
salary or allowance since they are residents and may have homes and already
engaging in other income generating activities in their own localities. Other
institutional changes would be to contract staff on a short basis, where the threat
of not renewing contracts may induce employees to use more effort.
d) From behavioral to output monitoring: An option is to change from
monitoring based on attendance to monitoring based on output in form of a
weekly MIS bulletin.
e) Training MIS staff: Effective market information requires knowledge of the
structure and functioning of the markets, which is essential both to the design of
good price reporting systems, interpreting the price patterns in the MIS reports,
and to effectively communicate the MIS outputs to different users. Therefore,
there is need to train MIS personnel to (1) produce market analysis that can feed
in policy design, and (2) produce useful products to stakeholders such as farmers,
NGO, and traders. These stakeholders who benefit from such information can

148
then lobby the government, external donors, and charity organizations to support
the MIS.
3) Information Provided by MIS
Provision of price and quantity forecasts: One of the findings in this synthesis is that
most MIS do not provide price and quantity forecasts yet this information is needed by
many users. There is need for the MIS to provide price forecasts, especially during the
peak marketing months to enable farmers make arbitrage decisions. Unfortunately, most
MIS do not forecast and do not like to venture into forecasting. The reason is that when
forecasts do not come true, the MIS risks loss of credibility among users. Some of the
solutions to this problem are: (1) facilitating training and capacity building of MIS staff
to acquire better forecasting techniques and skills in reporting price and quantity forecasts
to information users of different skill levels and (2) educating information users on how
to interpret price and quantity forecasts.
Specialization in market analysis: It seems users need more specialized information
products, many involving higher analytical content, such as prospective information
about how the market is likely to evolve (e.g., price forecasts, crop harvest or production
forecasts), analytical information about the major factors moving the market (market
dynamics), and regulatory information. This is much more information than what many
MIS in sub-Saharan African countries currently provide. This implies (1) a need for
capacity strengthening in MIS to provide these specialized information products, or (2)
developing stronger links to other units that have that analytic capacity. The first option
is dealt with under the implication on training MIS staff under the section on designing
incentives for staff to be responsive to client needs above. In the second option, the MIS

149
can provide information to public universities or research units within government to
come up with these kinds of specialized information products, including market analysis
for policy formulation and food security analysis. For this to work and gain the support
of many stakeholders (which increases sustainability), the universities would need to
conduct the analysis in a useful way that meets the needs of the most stakeholders (e.g.,
smallholder farmers, small-scale traders, local government extension officials, NGO
workers, local policy analysis, and policy makers) and not focus on technical analysis
that meets the needs of academic journals.
4) Funding Strategies of MIS
Providing information subsidies: Governments and donors may subsidize information
on behalf of the poor farmers. This could be done either through direct funding of
government- or farmer-organization based MIS or through contracting with private MIS
to do so.

150
4 EFFECTS OF RECEIVING IMPROVED AGRICULTURAL MARKET
INFORMATION ON THE MARKETING BEHAVIOR OF FARMERS IN
MOZAMBIQUE
4.1 Introduction and Research Questions
This chapter analyzes factors that influence the reception of improved agricultural market
information from the MIS and other sources among farmers in Mozambique; and how the
reception of improved agricultural market information affects the marketing behavior of
farmers. In many sub-Saharan African countries, it is common that two nearby villages,
districts or markets have significantly different farmgate, assembly, wholesale, or retail
market prices for the same quantity and quality of agricultural produce. This can be
caused by many factors, such as lack of market information, poor roads and bridges
between the markets and/or villages, thin or near missing markets, insecurity, or policies
and actions that impede the flow of goods within and between countries. One of the
several possible actions that can help reduce price differences between locations at the
same marketing level (e.g., farmgate, assembly market, or urban wholesale prices) is the
provision of improved agricultural market information.
Agriculture is an important contributor to Mozambique’s GDP. According to
World Development Indicators from the World Bank, in 2008, the percentage of value
added to GDP from agriculture was 29 percent, and 63 percent of the population in
Mozambique lived in rural areas. In Mozambique, many studies point out the importance
of market information in improving market participation, sales revenue, and crop income
(Boughton, et al., 2007, Mabota, et al., 2003, Mather, 2009, Mather, et al., 2008).
151
However, no study has empirically studied factors that influence the reception of market
information by small-and medium-holder farmers in Mozambique. This chapter seeks to
fill this gap. The rationale is that farmers obtain value when they make informed
production and marketing decisions based on better information, such as decisions about
size of areas to cultivate, what crops to grow, and whether to engage in spatial and
temporal arbitrage. From economic theory, improved market information helps improve
market efficiency, redistribute welfare, or reduce the cost of being off-the equilibrium
price and quantity (Aker, 2010, Aker and Mbiti, 2010, Hayami and Peterson, 1972,
Jensen, 2007, Jensen, 2010, Kizito, 2009, Staatz, et al., 2010).
It is hypothesized that farmers who receive price information are more likely,
keeping other factors constant, to receive higher prices than do farmers without
information. Higher prices from the sale of staple food crops lead to higher sales
revenue, higher household incomes, improved food security, and reduction in poverty
levels. The higher prices, however, are obtained at a search cost, and theory suggests
that farmers will search up to that level where the marginal benefit equals the marginal
cost of search (Stigler, 1961), or until they get a price lower or equal to their reservation
price (Varian, 1980). Therefore, the specific research questions addressed in this chapter
are:
1. What factors influence the reception of improved agricultural market information
from the MIS and other sources among medium and smallholder farmers?
2. Keeping other factors constant, is receiving improved agricultural market information
positively associated with market participation in staple crop marketing?

152
3. Keeping other factors constant, are farmers who receive improved agricultural market
information more likely to receive higher maize prices compared to farmers who do
not?
4. How do the benefits from receiving improved agricultural market information
compare with the costs of searching for it for an average Mozambique farmer who
participates in the market as a maize seller?
The rest of the chapter is organized as follows. Section 4.2 gives the study hypotheses.
Section 4.3 describes the source of the data, the sampling design, and study coverage.
Section 4.4 presents the Market Information Systems in Mozambique between 2002 and
2005. Section 4.5 presents the indicators used to measure the impact of market
information. Section 4.6 presents the sources and channels of obtaining information in
Mozambique. Section 4.7 presents the theoretical and empirical models of reception of
market information and price received, and discusses how the main econometric and
statistical concerns are addressed in the analysis. Section 4.8 gives a descriptive and
econometric analysis of factors that affect the reception of market information. Section
4.9 gives a descriptive and econometric analysis of the effects of reception of information
on market participation. Section 4.10 gives a descriptive and econometric analysis of
reception of information on prices of maize received. Using results from the descriptive
and econometric analysis and other parameters observed during the field visits in
Northern Mozambique, Section 4.11 conducts an analysis of the benefits and costs of
information search with examples of radio, cell phones, and word-of-mouth search
modes. Section 4.12 summarizes the main findings and their implications for MIS

153
improvements and design. Finally, section 4.13 presents the limitations of the models
and identifies areas of further research.
4.2 Hypotheses
1. Factors that are hypothesized to be positively associated with reception of market
information by farmers in Mozambique include commodity(ies) produced, ownership
of a radio, presence of a cell phone signal (network) in the village, and availability of
tapped4 electricity in the village from electricity transmission lines (to power cell
phones, radios, and TV, although some farmers use old car and motorcycle batteries
to power radios and television, and type D and AA batteries to power radios in rural
areas). Other factors hypothesized to be positively associated with reception of
market information include ownership of a bicycle (which facilitates attending
extension meetings and going to markets where information is disseminated),
membership in farmer associations, and access to extension services. Also,
household size, age of household head, and the education level of the household head
(assuming some type of information and education are complementary goods-
illiterate farmers cannot read printed information) are hypothesized to be positively
associated with receiving market information. Other factors hypothesized to increase
the probability of reception of market information include geographical region and
the agro-ecological zone in which the household is located. Factors hypothesized to
reduce the probability of reception of market information include distance to the
4 In many African countries, untapped electricity lines pass through many villages, implying that such villages do not use the electricity transmitted through their villages.

154
nearest road with public transport, distance to village administrative post, distance to
district headquarters, and a household being headed by a female.
2. Households that receive improved market information are more likely to participate
in staple crop markets, keeping other factors constant. To address reverse causality
(endogeneity or simultaneity), market participation and reception of market
information are estimated as a recursive biprobit model, with reception of market
information appearing in the structural equation of market participation. The reverse-
loop effect of market participation on reception of market information is not the focus
of this chapter.
3. Receiving market information is positively associated with higher maize prices
received among households in Mozambique.
4.3 Data, Sampling Design, and Study Coverage
The above research questions are analyzed using panel data collected in the National
Agricultural Surveys conducted by the Directorate of Economics/ Department of
Statistics in Ministry of Agriculture in Mozambique called Trabalho de Inquerito
Agricola (TIA). Two-year panel data for 2002 and 2005 is used. The survey used a
stratified, cluster sampling design in both periods and covered 4,908 rural small- and
medium holder households from 80 out of 130 districts in both years (Mather, 2009).
This study analyses data from four provinces in Mozambique, namely Manica, Sofala,
Zambezia, and Nampula. These provinces are in the Northern part of Mozambique,
which is the main production area of the four main marketed staples (maize, common
beans, large- and small groundnuts). The northern provinces in Mozambique are the
main production areas in Mozambique; probably because they have better rains, high
155
rural populations and are near regional markets in neighboring countries such as
Zimbabwe, Zambia, and Malawi (Boughton, et al., 2007).
The survey data was triangulated by field study observation by the researcher,
who visited Mozambique and interacted with employees of the Agricultural Market
Information System (SIMA) in Maputo, employees of the Provisional Information
System for Agricultural Markets (SIMAP) in Nampula Province in Northern
Mozambique, farmers and farmer group leaders in Murrupula District in Nampula
Province, local and international Non-Governmental Organizations (NGOs), food
assistance organizations, donors, and traders in formal and informal market who utilize
market information from SIMA and other sources.
4.4 Market Information Systems in Mozambique between 2002 and 2005
Agricultural Market Information System (SIMA) of Mozambique
The Agricultural Market Information System (SIMA) of Mozambique started in 1991
with the aim of providing agricultural market information to farmers to enable them
negotiate for better prices with traders, for food security planning, and to make better
policy decisions. SIMA is decentralized and each province in Mozambique is supposed
to have a provincial market information system (SIMAP). Some provinces do not have
functional SIMAPs. The main commodities on which information is reported are white
maize grain and flours, common beans, cowpeas, rice, large and small groundnuts, wheat
flour, edible oil, and dry cassava. SIMA provides (1) market analysis covering
opportunities and outlook for selected commodities in selected provinces; (2)
transportation costs incurred by traders to move commodities between markets; (3)
producer, wholesale, and consumer weekly price levels and percentage changes in the

156
previous two weeks in major markets; (4) estimated quantities of commodities available
for sale and their percentage changes from the previous week in major wholesale
markets; (5) prices of white maize grain in non-standard local units by location; and (6)
regional and international FOB prices, future prices of major commodities, and foreign
exchange rates of neighboring and major countries’ currencies (Mabota, et al., 2003,
SIMA, 2009).
The main modes of diffusion used by SIMA at national level include email,
national Radio Mozambique, national television, website, and newspapers. The main
modes of diffusion used by SIMAP at provisional levels include local radio, email, notice
boards, blackboard, hand-delivery, and through mail bins (pigeon holes) at the province
headquarters once a month. Copies of the bulletin are given to local NGOs so that they
can distribute the information through their extension agents. Also, the provisional
officials take the market information bulletin with them when they go to visit the rural
areas in districts. In addition, some district enumerators in provinces are expected to
distribute the information they collect to the rural community radios. More about SIMA
is included in APPENDIX A, section A.3.1.
INFOCOM
INFOCOM in the Ministry of Commerce provides price information for a range of
consumer products from urban areas, primarily focused on the formal sector of
supermarkets and stores, but it does not cover some of the staple crops and the rural
markets covered by SIMA. The information from INFOCOM is published in the main
local newspaper, Noticias every Friday
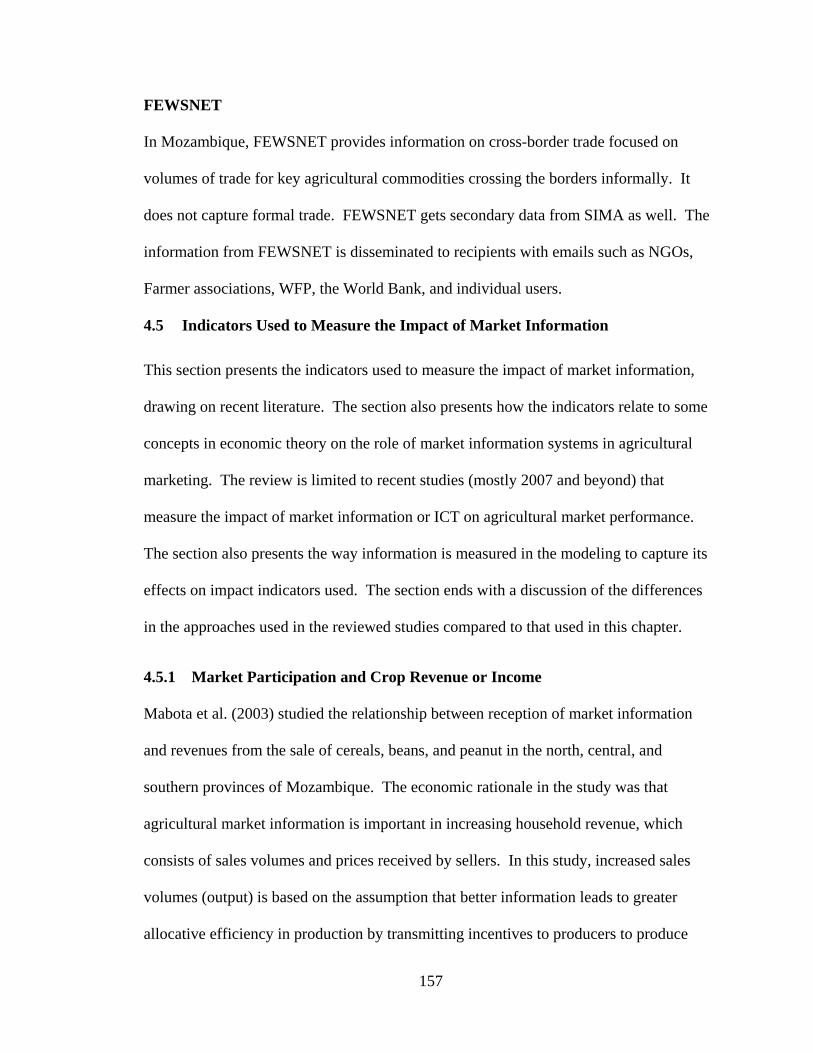
157
FEWSNET
In Mozambique, FEWSNET provides information on cross-border trade focused on
volumes of trade for key agricultural commodities crossing the borders informally. It
does not capture formal trade. FEWSNET gets secondary data from SIMA as well. The
information from FEWSNET is disseminated to recipients with emails such as NGOs,
Farmer associations, WFP, the World Bank, and individual users.
4.5 Indicators Used to Measure the Impact of Market Information
This section presents the indicators used to measure the impact of market information,
drawing on recent literature. The section also presents how the indicators relate to some
concepts in economic theory on the role of market information systems in agricultural
marketing. The review is limited to recent studies (mostly 2007 and beyond) that
measure the impact of market information or ICT on agricultural market performance.
The section also presents the way information is measured in the modeling to capture its
effects on impact indicators used. The section ends with a discussion of the differences
in the approaches used in the reviewed studies compared to that used in this chapter.
4.5.1 Market Participation and Crop Revenue or Income
Mabota et al. (2003) studied the relationship between reception of market information
and revenues from the sale of cereals, beans, and peanut in the north, central, and
southern provinces of Mozambique. The economic rationale in the study was that
agricultural market information is important in increasing household revenue, which
consists of sales volumes and prices received by sellers. In this study, increased sales
volumes (output) is based on the assumption that better information leads to greater
allocative efficiency in production by transmitting incentives to producers to produce

158
specific products. In addition, higher prices received represent a redistribution of income
towards producers and a movement towards more competitive prices, which also implies
a reduction of dead weight loss. The study also highlights the importance of the
information from the MIS to the design better food policy reforms in liberalized
economies. Using household-level survey data, the study used graphs to show that
households that received market information also received higher sales revenue than
those without market information (Mabota, et al., 2003). This descriptive study did not
control for other factors that might influence sales revenue.
Boughton et al. (2007) studied the role of market information on agricultural crop
income in maize, tobacco, and cotton markets in Mozambique. The economic theory in
this study is that access to market information as a “public good” enables farmers to
obtain higher crop revenue by reducing transaction costs, which enables them to move
from autarky towards specialization. When farmers’ transaction costs reduce, they get
the opportunity to specialize according to their comparative advantage and enjoy welfare
gains from trade. This study measures reception of a market information as a dummy
variable which shows that the village received market information. Using household-
level data and the Heckman’s two-step procedure, they found a positive correlation of
reception of market information with participation in high-return (cash crop) markets
(i.e., cotton and tobacco) and an insignificant relationship in low-return (staple crop)
markets (i.e., maize). The study did not find market information to significantly increase
the value of maize, cotton and tobacco sold (Boughton, et al., 2007).
Another study by Mather (2009) used a first-difference model to analyze the
effect of reception of market price information on the change in net crop income from all

159
crops sold by Mozambique households in 2002 and 2005. The study found that
households that received market price information increased household crop income by
23 percent in the central and 31 percent in southern regions of Mozambique (Mather,
2009).
The above studies show that reception of improved market information is
associated with higher sales revenue and incomes among rural households in
Mozambique, yet only 40 percent of rural households reported receiving market price
information. Moreover, one study has observed that some of the market information
disseminated is of limited practical use to farmers because they lack the capacity to act on
the information because of a lack of group marketing, lack of price forecasts, and the
failure to involve farmers in deciding the information to be collected by the MIS
(Whiteside and Lucas, 2006). This means that more research is needed to find factors
that affect reception of market information among farmers so that households can be
helped to receive more improved market information. The study by Mather (2009)
recommends more funding to MIS, an increase to the frequency of dissemination through
radio, improvement of the content and analysis of information, and provision of province-
specific information so that more households can obtain and use market information.
4.5.2 Changes in Price Dispersion or Variation
The impact of information is also measured in some studies as the reduction in price
dispersion through measures such as coefficients of variation, standard deviation,
variance, ranges, and absolute price differences of prices offered by buyers or received by
sellers between similar levels in different markets or geographical regions.

160
For example, Goyal (2010) measures the impact of market information as changes
in the coefficient of variation and standard deviation in the monthly price modes of
soybeans across mandis (government regulated wholesale agricultural markets) in the
Indian state of Madhya Pradesh. The economic theory driving Goyal’s study is that
providing information to farmers from a market information service through radio
programs increase profitability, increase the incentives to produce and improve quality
through the reduction of the appropriation of monopoly rents by intermediaries, and thus
leads to income distribution from buyers to sellers. This study shows that reception of
market information reduces price dispersion, which can arise for reasons other than
monopoly power. Therefore, the study also demonstrates how improved market
information among sellers helps the movement from “off-equilibrium” towards
equilibrium prices—a process that reduces deadweight loss among sellers and buyers.
Market information is measured as the a dummy variable that represents the introduction
of an information kiosks that provide daily wholesale prices of soybean offered by a
private buyer (soybean processor) and those offered in mandis. The Goyal paper assumes
that sellers go and check information at kiosks before they deliver produce to markets or
to the processor.
Using aggregated monthly price data from 1999 to 2006 in 37 districts, Aker
measures the impact of access to information as the absolute difference of prices of millet
between markets. The economic theory is that the introduction of cell phones—a
technology that facilitates the flow of information—reduces search costs and facilitates
arbitrage, which in turn helps to reduce price dispersion and contributes to overall market
efficiency and improvements in welfare. The variable associated with market

161
information is the presence of cell phone coverage in markets, which is measured with a
dummy variable equal to 1 for each month when there is cell phone coverage in a pair of
markets and zero otherwise (Aker, 2008, Aker, 2010). This study finds that introduction
of mobile phone service in Niger markets reduced grain price dispersion up to 10 to 16
percent.
In a study among fishing communities in the Indian state of Kerala, Jensen (2007)
computes the impact of access to information as changes in the spread of the maximum-
minimum prices and the coefficient of variation in prices when search costs reduce as a
result of introduction of cell phones in fishing communities. The economic rationale is
that the introduction of cell phones—a technology that facilitates the flow of
information—facilitates arbitrage, reduction in waste of outputs, and reduces information
asymmetries. Arbitrage leads to gains in efficiency and reduction in information
asymmetries increases the welfare of both sellers and buyers in supply chains. Using
weekly micro-level survey data (implicitly an aggregated time series data set), the
dummy variable representing access to market information is presence of a cell phone
network in a region and zero otherwise. The study shows that there was a reduction of up
to 5 rupees per kilogram in the average of the maximum minus minimum price spread
when mobile phones are introduced in coastal fishing regions. The study also shows that
there was a 38 percent reduction in the coefficient of variation when cell phones are
introduced in fishing regions.
4.5.3 Marketing Margins and Profits
The impact of reception of improved agricultural information on market performance
could also be measured as reduction in marketing margins, thus reducing the cost of food

162
(retail prices) on the consumer side, and to increasing the farmgate price of staple food
crops among rural agricultural households on the production side. This process leads to
economic efficiency and increases the welfare of both producers and consumers because
it improves their real incomes. This process can also be viewed as an improvement in the
food security of both rural and urban households (Diarra, et al., 2004, Holtzman, et al.,
1993). Changes in profits received by sellers could be another impact measure of
reception of information in market performance. Changes in profits (which is revenue
from crop sales minus production-, marketing-, and transaction costs) can be viewed as
(1) an increase in prices received by sellers (which is an increase sellers’ welfare); (2) an
increase in quantity sold (which is an increase in allocative efficiency in production), and
(3) a reduction in costs among sellers due to reception of improved agricultural market
information.
4.5.4 Consumer Surplus, Producer Surplus, and Dead Weight Loss
The benefits of access to information can also be measured by the changes in producer
surplus and, consumer surplus, and deadweight loss when consumers and producers
respond to market information in form of price or production news or forecasts from the
MIS (Goyal, 2010, Hayami and Peterson, 1972, Kizito, 2009) or with the introduction of
new technologies which facilitates the exchange of information (Aker, 2010, Jensen,
2007) In this approach, the economic theory is that access or reception of improved
market information leads to overall economic efficiency and an increase and
redistribution of welfare among market actors. For example, the Jensen (2007) study
computes the welfare changes among consumers and producers of fish when search costs
reduce. The study shows that on average, consumer prices reduced by 4 percent,

163
producer prices increased by 8 percent and consumer surplus in consumption areas
increased by 6 percent (Jensen, 2007).
The benefits of access to improved market information can also be measured as
the reduction in the cost of being off the equilibrium price and quantities (reduction in
dead weight loss) when producers obtain and act on improved market information in
form of price forecasts (Kizito, 2009). Kizito measures the potential payoffs of providing
improved agricultural market information to producers and consumers of maize, millet,
sorghum and paddy rice in Mali as the reduction in dead-weight loss (a gain in welfare by
both consumers and producers) when farmers and small-scale traders with rational
expectations respond to hypothetical improved price forecasts from the MIS. The study
finds that potential benefits from improved information, are greater when there is high
uncertainty about future prices, high own-price elasticity of supply, low own-price
elasticity of demand, and high value of crop output (Kizito, 2009).
4.5.5 Elimination of Waste
The Jensen (2007) study also measures the impact of information as change in waste
(unsold fish in markets with high supply) when an ICT (cell phone coverage) that
facilitates exchange of information is introduced in fishing regions. The study shows that
waste is reduced by 4.8 percentage points when mobile phones are introduced in coastal
fishing regions.
4.5.6 Household-level Prices Received by Sellers
Using household level panel data, Svensson and Yanagizawa measure the impact of
market information as the changes in the standardized households farmgate prices
received when households access information. The economic theory in Svensson and

164
Yanagizawa is that access to market information reduces asymmetric information,
thereby increasing bargaining between farmers and traders and improving farmers’
choices of what to produce. This then leads to a redistribution of welfare from traders to
farmers. The study uses household ownership of a radio and a household living in a
district in which the MIS disseminated information as proxies for reception of market
information (Svensson and Drott, 2010, Svensson and Yanagizawa, 2009).
4.5.7 Aggregated Prices Paid By Traders in Markets
Using monthly data, Goyal (2010) measures the impact of market information as the
changes in the average of the mode, minimum and maximum monthly aggregated prices
in mandis (Goyal, 2010). Conceptually, the difference between Goyal’s approach with
that used by used (Svensson and Drott, 2010, Svensson and Yanagizawa, 2009) is that
Goyal uses aggregated market-level data, while the later use more micro-household-level
survey data. The Goyal study finds that the presence of information kiosks, which is the
variable used to measure access to market information, increases the average of mode,
minimum and maximum monthly prices in mandis in the Indian state of Madhya Pradesh.
4.5.8 Sales Volumes
The Goyal (2010) study also measures the effects of the presence of kiosks that provide
information on volumes of soybeans sold in government controlled markets in the Indian
state of Madhya Pradesh (Goyal, 2010). The paper did not find the presence of kiosks to
reduce the volumes of soybeans sold in mandis. This implies that information did not
redistribute volumes from government controlled markets to the private buyer, but seems
to have induced an increase in marketed volume.

165
4.5.9 Integration of Markets
The impact of market information can also be measured as the level of market
integration, measured as the volume of trade that occurs between markets and correlation
of prices between markets (spatial arbitrage). Due to limited data on trade flows in
developing countries, market integration is usually measured by the correlation or
cointegration of prices between two or more markets during a specified time period
instead of the flow of homogeneous goods between them. Market integration is
frequently measured using cointegration regression models (Shahidur, 2004). The
weakness with market integration analysis is that markets can be integrated when they are
not efficient, and in some occasions, when there is even no physical trade between them.
4.5.10 Number of New Markets and Entrants into Value Chains
Measures of sales volumes in new markets, sales of new agricultural products and
numbers of new market entrants can also be used as indicators of the impact of market
information (Aker, 2010, Dembélé, et al., 2000, Jensen, 2007). For example, Jensen
shows that once cell phone towers where introduced in fishing regions, fishermen started
selling their fish in new markets where they could obtain information from (Jensen,
2007). Also, Aker shows that grain traders in Niger expanded their markets because of
the introduction of cell phones that enabled then get information from near and far
markets (Aker, 2010).
4.5.11 Effects on Production Decisions or Output Response
The impact of information can also be measured through its effects on production
decisions measured as changes in area planted, production, yield, and switching crops
grown. For example, Goyal (2010) analyzes the impact of the presence of an information

166
kiosk that provides information on the buying prices of soybeans in a government
controlled market and by a private buyer on the area planted, production and yield of
soybeans, rice, maize and groundnuts in the Indian state of Madhya Pradesh. The study
finds that the presence of the kiosk increased the area planted under soybeans, reduced
the area planted under rice, and increased the production of soybeans.
4.5.12 Decision-Theoretic Approaches
This method measures the benefit of improved market information as the difference
between the expected utility from information and the cost of obtaining the information.
The method uses subjective states of nature and their probabilities of occurrence to
estimate the expected utility from information. The method requires obtaining a utility
function, the wealth of information users, and the costs at which they receive information
(Eisgruber, 1978, Nicholson, 2002).
4.5.13 Revealed and Stated Preferences
The revealed preferences approach can be used to predict the value of market information
systems to stakeholders. When farmers or governments choose to invest in MIS rather
than other services in a bundle of services, then they reveal their preference for
information to the other services in the bundle. The bundle of marketing related services
may consist of provision of communal storage facilities, setting up a cooperative credit
saving scheme, setting up a marketing management practices training service, or
providing market information. Thus, such a choice would imply that market information
is directly revealed to be preferred to other services. In the stated preferences approach,
information users would state their preferences from a bundle of marketing services put
together. Empirically, these can be computed using willingness–to-pay and willingness-

167
to-accept models. Willingness to pay (WTP) is the maximum amount of money
individuals would be willing pay for information products. Willingness to accept (WTA)
is the amount of money individuals would accept to be compensated to forego the market
information service. WTP or WTA would then be aggregated to estimate the value of
information to smallholder farmers. One of the weaknesses of these methods is that users
may over- or under-estimate their willingness to pay or accept depending on their
perceived benefits from the survey. No study on the impact of agricultural market
information was identified by the author to have used this approach.
4.5.14 Difference in the Approach Used In This Dissertation with Those in Existing
Literature
Using household panel survey data, this dissertation measures the factors that
affect reception of market information from any source and through any channel among
farmers in Mozambique. The dissertation then measures the effect of reception of
information by individual households on individual-household-level maize prices
received. The general economic theory and the modeling style guiding the analysis in
this dissertation is that improved agricultural market information help farmers to make
better production and marketing decisions. In terms of production decisions, market
information is a non-physical input that helps farmers to decide how to use other inputs in
the production possibility set. In terms of marketing, improved agricultural market
information helps to reduce information asymmetries (increased market transparency or
reduction in transaction costs), increases market participation (linking farmers to
markets) and increases the capacity of farmers to negotiate for better prices with traders.
When informed farmers participate in markets, they earn an information rent or

168
information premium. Thus, this study focuses on how the provision of improved
agricultural market information benefits the sellers, in the form of higher prices, but does
not address whether that increase in higher prices comes at the expense of buyers or
through an increase in overall economic efficiency. Therefore, higher prices received are
used here as an indicator of the impact of market information on sellers’ welfare, but not
necessarily overall economic efficiency. Improved information helps move the price and
output levels closer to those of a competitive market and “leveling the playing field” and
income redistribution. Furthermore, reception of information leads to reduction in risk
and efficient allocation of productive resources (assuming that farmers are risk averse).
The main difference in the approach used in this study—and in essence its contributions
to MIS evaluation literature—from those used in recent literature are discussed below.
Many studies use proxies such as availability of a cell phone network (Aker,
2008, Aker, 2010) or ownership of radios or a household living in an area where there are
information broadcasts from an MIS (Svensson and Drott, 2010, Svensson and
Yanagizawa, 2009) as a measure of access or reception of information. Such studies
assume that access to these ICT implies reception of information. This is a weakness
because many households receive information (e.g., from friends, relatives and
neighbors) without owning a cell phone or a radio and many households do not receive
information even when they have radios and cell phones. This implies that these studies
may miss the spillover effects onto others of the ownership of cell phones or radios by
friends and neighbors. Also, the estimating the effects of information on market
performance using proxies increases attenuation bias and gives less precise estimated
results because there is no direct link between the reception of information and the

169
measured outcomes as would be the case when the variables used is reception of market
information by an individual household as is done in this dissertation.
The assumption that living in a district were an MIS was diffusing information
implies access or reception of market information, as was done in(Svensson and Drott,
2010, Svensson and Yanagizawa, 2009), creates an aggregation bias problem. This is
because all households in a region where the MIS diffuse information are assumed to be
treated (received information) and that those in regions without information broadcasts
not to be treated (did not receive information). Based on survey data in Mozambique and
on information obtained during field study visits in Ethiopia, Zambia, and Mozambique,
households that report to receive market news live in the same villages as with those that
report not to receive market news, even in areas covered by MIS broadcasts. This
situation most likely occurs in several other sub-Saharan African countries. Therefore,
studies that aggregate the treatment at higher meso levels (e.g., at market, district, or state
level) only estimate “intent to treat” effects or indirect treatment effects, and not the
“average treatment” effects or direct treatment effects. This dissertation identifies the
treatment at individual household level (reception of information) and thus gives a more
precise measure of the effects of reception of market information on the outcome than
studies that aggregate the treatment a higher level (e.g., at the district or market level).
Another weakness of papers that use market-level aggregated data such as prices
offered in markets and reported at market level (e.g., (Goyal, 2010)) is that they capture
less heterogeneous effects compared to when household-specific prices are used, as is
done in this dissertation. Moreover, the use of mode, minimum and maximum, but not
the mean, does not capture and therefore explain the full range of variation in the prices

170
paid by traders in the market. Thus, the advantages of using individual household-level
data is that it captures more heterogeneous effects and avoids aggregation problems as is
the case when meso data, which assumes all households in the delineated areas of the
study received the same prices.
In the Jensen and Aker studies, there is no direct presence of MIS in providing
information. This implies that these studies measure the effect of the presence of ICT
that can be used to search for information, and not necessarily the impact of reception of
information from an MIS or other sources as done in this dissertation.
All the reviewed paper do not directly capture the role of an MIS and several
other sources of market information, such as other traders and professional networks,
relatives, friends, extension and NGOs staff as sources of information. Also, the
reviewed papers do not capture the role of other channels such as the printed press and
word-of-mouth though meetings with friends, relatives and market actors in access or
reception of information. This means that these models do not fully internalize the
spillover problem or externality of receiving information from other secondary sources
and using other alternative channels on the impact variables.
Also, considering only one ICT as the channel through which information is
diffused leads to a lot of attribution bias because market actors use several channels to
receive information. For example, using the presence of cell phone network alone or
ownership of a radio alone as proxy for measuring the effects of reception on market
information on market performance indicators without controlling for other channels
thorough which households obtain information and other sources of information does not
give an independent effect on the measured impact indicators. This is because the

171
included proxy captures the effects of other sources of information and channels through
which information is received. Therefore, another main distinction between the approach
used in this dissertation and other studies is that this dissertation measures the direct role
of reception of market information while other studies measure the impact of owning or
presence of an ICT on performance. The use of difference in difference estimators,
natural experiments, and matching methods may reduce attribution bias. Another
solution is to caution the readers that the measured outcome indicator shows associative
effects and not independent effects of the included single proxy.
In summary, this dissertation recognizes that there are other several channels
through which information is transmitted to different information users for private and
public decision making in addition to cell phones and the radio, which are the most
studied ICT through which information is diffused in recent literature. The study also
recognizes that there are several sources of information rather than the MIS. Thus, a
major distinction between this study and the above studies is that this study analyses the
effects of reception of information by household irrespective of the channels used to
receive the information and sources of information. This then solves many of the
estimation problems encountered in impact assessment literature such as unobserved
treatment effects, attribution bias problems, and spillover effects or externalities as
explained in the last paragraph of section 4.6 below, and attenuation bias, which makes
the analysis simple and straightforward.
Furthermore, the literature review in this section shows that there are many
indicators used to measure the impact of information and ICT on market performance.
This dissertation measures the impact of reception of market information on prices

172
received by household using household-specific survey data. The reason for using prices
obtained by individual households, unlike other studies, was to avoid masking the
heterogeneity in the prices received by individual household, which is the reality in rural
villages in Mozambique, and in other countries in sub-Saharan Africa in general. A
positive impact of the reception of market information on the household-specific price
obtained measures the average increase in price (information premium or information
rent) by households in Mozambique. Other ways of looking at the outcomes is that
information reception increases household income; improves food security (if one
considers that the increased income may be used to purchase other consumables from the
market); helps to reduce poverty among rural farmers; improves the returns to farmers as
sellers—but not overall efficiency—in the market; and leads to welfare gains among
farmers who sell maize. Also, there are implicit welfare gains among consumers of
maize or its processed products.
Thus, another key difference between this dissertation and studies that look, for
example, at the impact of market information on price dispersion is that this study’s focus
is on the impact of improved agricultural market information on sellers’ welfare (a focus
of many funders who are interested in connecting farmers to more efficient markets), but
not the impact of the information on overall market efficiency.
4.6 Sources and Channels of Obtaining Information in Mozambique
What are the sources of market information and what channels are used to diffuse
information in Mozambique? In this study, sources of information and modes through
which information is diffused are separated. This separation has important implications
on measuring the impact of MIS on selected performance indicators through avoiding

173
complication related to spillovers and attribution bias. Sources of information refer to the
organization, firm, or person that collect and provide market information. An MIS is just
one of these sources. Others include traders, extension and NGO workers, neighbors,
friends, and relatives.
Modes or channels of diffusion refer to the methods used to disseminate
information to users such as radios, word-of-mouth during meetings, cell phones, and the
internet. Moreover, reception of market information implies access to market
information, but access to market information does not imply reception of market
information. For example, owning a radio or cell phone implies access to, but not
reception of market information. Reception of information from any source using any
channel and its effects on marketing behavior at household level is the focus of this
chapter.
In the 2005 household survey, the following question was asked about market
information. During the last 12 months, has the household received any information
about agricultural prices (1=yes, 2= no) through: (1) radio, (2) association, (3) rural
extension agent, (4) publication, (5) NGO, and (6) other sources? Note that (1) there was
no distinction between “sources” and “channels” through which information was received
in the survey; (2) a household could report receiving information from more than one
source or channel; and (3) information received from all the different sources and
channels could be from SIMA and other sources, implying that it is difficult to separate
information from SIMA and other sources. For example, information from extension
agents, NGOs, and associations could be from SIMA or from other sources such as

174
traders. Also, the information diffused though radio, TV and publications could all be
from SIMA or other sources.
Table 17 shows that 37 percent of all households reported receiving price
information in Mozambique in 2005. Without distinguishing between “sources” and
“channels”, 3 percent of all households received information from associations, 7 percent
from extension agents, 4 percent from NGOs, 7 percent from other sources, 3 percent
from publications such as newspapers and magazines, and 29 percent via radios. Other
sources include information from social networks such as neighbors, friends, relatives,
and traders, normally through word-of-mouth. Note that the total of “sources” and
“channels” of information is 53 percent yet the percentage of households that received
information is 37 percent. This is because households could report more than one source
or channel through which they received the information.
From observations during the case studies in Mozambique, households in
Mozambique receive market information from farmers, farmers’ associations, traders,
traders’ associations, rural extension workers, publication, and local and international
NGOs. In some cases, this is information originally generated by SIMA.
From observations during the case studies in Mozambique, in addition to radio
and publications, other channels through which market information is disseminated
include posts on notice boards at administrative headquarters, blackboards in urban
markets, and through meetings or contact with provincial extension and NGO workers.
The urban markets where information is disseminated are located near district
headquarters (i.e., in municipalities). Extension and community meetings are conducted
in trading centers, or near areas with commercial activities (e.g., shops and commodity

175
stores), administrative activities (e.g., district or village headquarters), or at community
amenities (e.g., at schools and churches). In more rural districts, some community and
extension meetings are conducted under large trees near junctions of main and feeder
roads.
Because there are many sources and channels through which households can
receive information, this study argues that it is better to simply analyze the effects of
receiving information from all possible sources (including the market) and using all
possible channels on marketing behavior and market performance other than trying to
analyze the effects of receiving information from one source (e.g., the MIS or extensions
agents) or from one channel (e.g., cell phone or radio). The advantages of this approach
are that the analysis avoids (1) the spillover effects problem in terms of different sources
of information and (2) the attribution problem in terms of which dissemination channel
contributed to better performance than the other.

176
Table 17: Sources and Channels Used To Receive Price Information in Mozambique in 2005 Nampula (N=510)
Zambezia (N=603)
Manica (N=392)
Sofala (N=307)
Total (N=1812)
(0=No, 1=yes) Mean Std. Dev. Mean
Std. Dev. Mean
Std. Dev. Mean
Std. Dev. Mean
Std. Dev.
Received Information1 0.59 0.49 0.27 0.44 0.25 0.43 0.49 0.50 0.37 0.48
Sources Association 0.06 0.24 0.01 0.11 0.00 0.06 0.04 0.19 0.03 0.16 Extension agent 0.09 0.28 0.06 0.24 0.03 0.17 0.15 0.35 0.07 0.26 NGO 0.04 0.19 0.06 0.24 0.00 0.00 0.02 0.15 0.04 0.19 Other sources 0.09 0.29 0.06 0.24 0.02 0.14 0.14 0.35 0.07 0.25
Modes/ Channels Publication 0.05 0.22 0.03 0.16 0.02 0.16 0.05 0.21 0.03 0.18 Radio 0.51 0.50 0.18 0.39 0.22 0.41 0.36 0.48 0.29 0.45 Source: Trabalho de Inquerito Agricola 2005 only – not collected in 2002; 1: this variable was collected in 2002 as well but computed for 2005 data only in this table. The percentage of households that received price information for both 2002 and 2005 is 42% and is given in Table 21. The rest of the variables in this table were not collected in 2002.

177
4.7 Theoretical and Empirical Models of Reception of Market Information and
Prices Obtained
The theoretical framework used in the analysis is based on the agricultural household
model (Singh, et al., 1986). Let p be a vector of prices; w a vector of input costs (e.g.,
marketing and search costs through radio and cell phones); q a vector of quantity sold;
X a vector of production inputs such as land labor and capital; Z is a vector of control
variables that affect prices received (such as market information, proximity to markets,
education, and gender, and agro-ecological zones); 0);,( =ZXqF is the production
possibility set, and information helps farmers decide how to use the inputs in the
production possibility set—i.e., it helps determine the production function itself; and θ is
the Arrow-Pratt measure of risk aversion that captures production related risks (e.g., due
to poor weather). Considering the production side of the household and using the mean-
variance model to account for price expectations and production- and marketing-related
risks, the farmers’ maximization problem using a linear function of profits and profit
variance is:
}0);,(:)(2/)({,
max),,(max =−−−= ZXqFwXpqVarwXpqEXq
Zwp θπ .
The first order conditions with respect to quantity sold, and inputs used are:
0);,(2 =∂
∂−−
iqZXqF
piqip λσθ
0),,(=
∂∂
−−iX
ZXqFiw λ ;

178
where 2pσ is the variance of the prices received by farmers and captures price
expectations and production related risks. Solving the FOC from the above equation
leads to the following inverse function for output supply, and input demands:
(1) Inverse of output supply: ),2,,( Zpwqsip σ=
(2) Input demand: ),2,,( ZpwpXiX σ=
From the model, it is observed that the amount supplied and the input demands are both
function of the variance of prices. From the FOC, farmers require a higher price than a
higher variance, which implies that input demand is negatively related to the variance of
prices. Thus, if farmers receive better market information, the perceived variance of
prices decreases, increasing both supply and input demand. At estimation though, since
information cannot be incremented because of the difficulty in measuring quantities of
information, instead, the probability of reception of information is computed.
4.7.1 Model of Receiving Information and Its Impact on Market Participation
The factors that affect the reception of market information and the effects of reception of
market information on market participation are estimated using a recursive bivariate
probit model because their error terms are likely to be contemporaneously correlated.
(3) ititZitI 1)1( μα +Φ=
(4) itTITIitYitS 2)*4321( μγγγγ ++++Φ=
0)2()1( == itEitE μμ ; 1)2(()1( == itVaritVar μμ ; ρμμ =)2,1( ititCov
In the reduced form equation (3), itI is a binary variable equal to zero when a
household did not receive market information and equal to one when it received market

179
information. Φ is the cumulative density function for the standard normal distribution,
and 1α is the vector of estimated parameters for itZ -the vector of exogenous variables
that affect reception of market information.
In equation (4), itS is a binary variable equal to one when a household sold
maize, large groundnuts, small groundnuts, or common beans, and zero otherwise. Y is a
vector of all exogenous variables that affect market participation other than market
information, and T is a time dummy. Equation (4) gives the expected probability that a
household participates in the market given that it receives market information. Holding
other factors constant, the estimated coefficient, 2γ in equation (4) give the sign of the
partial effects of access to different sources of market information on the probability of a
household to participate in the market as sellers of any of the four commodities in the
study (maize, small groundnuts, large groundnuts and common beans). Of importance
are the partial effects ])2([)|1(ˆiIiIfISP Δ≈=Δ γ . Equations (3) and (4) imply that
information search and market participation are simultaneous decisions. The strength of
this model is that it recognizes that farmers receive information from multiple sources
and through multiple channels, and thus does not suffer from spillover effects (in terms of
what was the source of information) and attribution problems (in terms of which
dissemination channel contributed to better performance than the other) encountered if
one attempts to measure reception of information from one source or using one channel
as is discussed in section 4.5.14 and in the last paragraph of section 4.6.

180
4.7.2 Model of Receiving Information and Its Impact on Prices Received
The following structural model is used to measure the impact of market information on
prices received.
(5) ititZTITIitp νβββββ +++++= 4*3210
where i=1,.., N households; p is the price of maize received; I is a market
information dummy, T is a time dummy, and itZ is a vector of control variables (other
than access to information) that affect prices received. For policy analysis, and in a
pooled cross section over time data structure, the estimated coefficient 3β on the
interaction of year and information dummies is also called the difference-in-difference
(DID) estimator (Wooldridge, 2002). The variables in itZ include quantity of maize
sold, growing other complementary or supplementary staple crops such as groundnuts
and common beans, distance to main roads with public transport, distance or
administrative centers (where most markets are located), ownership of a bicycle,
education levels, gender, dummies for agro-ecological conditions, availability of a cell
phone network in the village, and provincial dummies. Also, itZ contains the total
number of drought days during the main growing season and price variance at the district
level to capture production related risks, and itiait εν += is the composite random error
term, i.e., the sum of unobservable effects ia and the idiosyncratic error itε that affect
prices received. Typically, itν contains the known and unknown effects (e.g., missing
variables and unobserved effects) that affect prices received. The assumptions are that ia

181
and itε have a zero expected mean and a constant variance. Before discussing the
results, a description of how some econometric concerns were dealt with is given.
4.7.3 Econometric and Statistical Concerns
These econometric concerns address both structural models of market participation and
prices received. The information reception and market participation model is conducted
on all growers of any of the four staple crops, while the prices received model is
conducted for only households that sold maize alone. In Table 20 and Table 21, the
sample size for the information reception and market participation is 3624. The reason
for including the four crops in the model of reception of market information and market
participation was because SIMA disseminates information on these commodities, which
can influence a farmer’s decision to grow and market any of the four commodities.
The price model can only be conducted for households that participated in the
market (i.e., have positive prices and quantities sold). The price model was estimated for
only maize because it is the most traded staple crop in Mozambique. Also, from Table
20, this sample could be 924 households that sold maize, 185 that sold large groundnuts,
376 that sold small groundnuts, 97 that sold common beans, and 1275 if one attempted to
create “super” variables of prices and quantities sold that includes all households that
sold at least one of the four crops. The problem of creating the super variables is that
these are different crops with different underlining factors that influence their production.
This is therefore not attempted. An alternative approach could have been to estimate a
system of 4 equations—one for each crop. This, however, was not done because the data
for prices and quantities sold for common beans, large groundnuts, and small groundnuts,
as can be seen from the above figures, individually represented smaller samples, which

182
could have led to substantial loss of degrees of freedom if one attempted to conduct a
system of equation estimation (i.e., one would end up with only 97 observations). For
these reasons, the structural model of prices received is conducted for only maize. Even
from the only the 924 households that sold maize, part 3 of Table 20 shows that only 836
households had a positive price and quantity sold. Therefore, the econometric model for
prices of maize received in Table 23 is conducted for N=836 households. Imputations for
the missing prices and quantities sold are not done to avoid the potential to introduce
imputation bias in the estimates.
4.7.3.1 Endogeneity
Endogeneity means that one of the explanatory variables is related to the error term and
may be caused by (1) measurement errors (in the dependent and or independent
variables); (2) simultaneity, which means that one of the dependent variables is
determined together with the independent variable; and (3) omitted variables that are
correlated to the included variables (unobserved variables that are time-constant or time-
varying). Each of these sources of endogeneity when observed was dealt with as follows.
4.7.3.1.1 Measurement Error in Prices Obtained—a Dependent Variable
The price data was suspected to have measurement errors due to use of non-standardized
units of measurements such as modified liter tins (see below for details), in addition to
allegedly kilogram bags of varying weights. In many sub-Saharan countries, buyers alter
the shape of tins (or containers) by expanding the sides so as to pay a lower per unit cost
to sellers. In contrast, sellers contract the sides of tins so as to obtain a higher per unit
price from buyers. After examining the stem-and-leaf displays, the histogram, and the

183
results from the grubbs procedure in STATA during the analysis of maize prices, 37
observations (4 percent) of households that sold maize were dropped because they were
unusually high, which resulted in the following outcomes. Comparing the original and
cleaned pooled data on prices of maize received by households in Table 18, the sample
mean reduced from 3.1 to 2.8, the sample variance from 5.2 to 1.7, the skewness from 3.8
to 1.1, and the kurtosis from 25.2 to 4.8, representing a 66 percent relative gain in
precision and a significant improvement in the distribution of the data towards normality.
Normally distributed data has skewness of 0 (perfectly symmetric around the mean) and
kurtosis of 3 (flatness of the distribution). Precision is the inverse of the variance of
survey estimates; and sample estimates with low sample variances denote high precision.
The relative gain in precision )(GP between estimators 0θ and 1θ is defined as
100*)0var(
)1(var()0var(100*
))1var(/1(
))0var(/1())1var(/1(
⎥⎥⎦
⎤
⎢⎢⎣
⎡ −=
−=
θ
θθ
θ
θθGP (Kish, 1965). For the
pooled sample, the relative gain in precision resulting from the reduction in the sample
after removing outliers is computed as 100*
120
0211
⎥⎥⎥
⎦
⎤
⎢⎢⎢
⎣
⎡−=
ns
nsgp ; where 2
0s and 21s are the
pooled sample variances of prices received before and after correcting for measurement
errors; and 0n and 1n are the sample observations before and after correcting for
measurement errors respectively. From a survey sampling point of view, trading off 4
percent of the sample observations for movement towards normality and a 66 percent
relative gain in precision is an excellent way of dealing with non-sampling errors. Thus,

184
the simple action of removing 37 observations parsimoniously addresses most of the
problem of measurement errors in the maize price data.
The stem-and-leaf displays, the histogram, and the grubbs procedure in STATA
did not support or identify small prices as outliers. Indeed, it was observed that as one
removed the largest prices, the data converged towards a symmetric bell-shape (i.e., less
skewness and less kurtosis), yet as one removed the smaller prices, the data would move
away from normality—i.e., the kurtosis and skewness become absolutely larger.
Therefore, there was no justification to remove small observed prices since they did not,
in absolute terms, increase the skewness and kurtosis of the data as the big prices did.
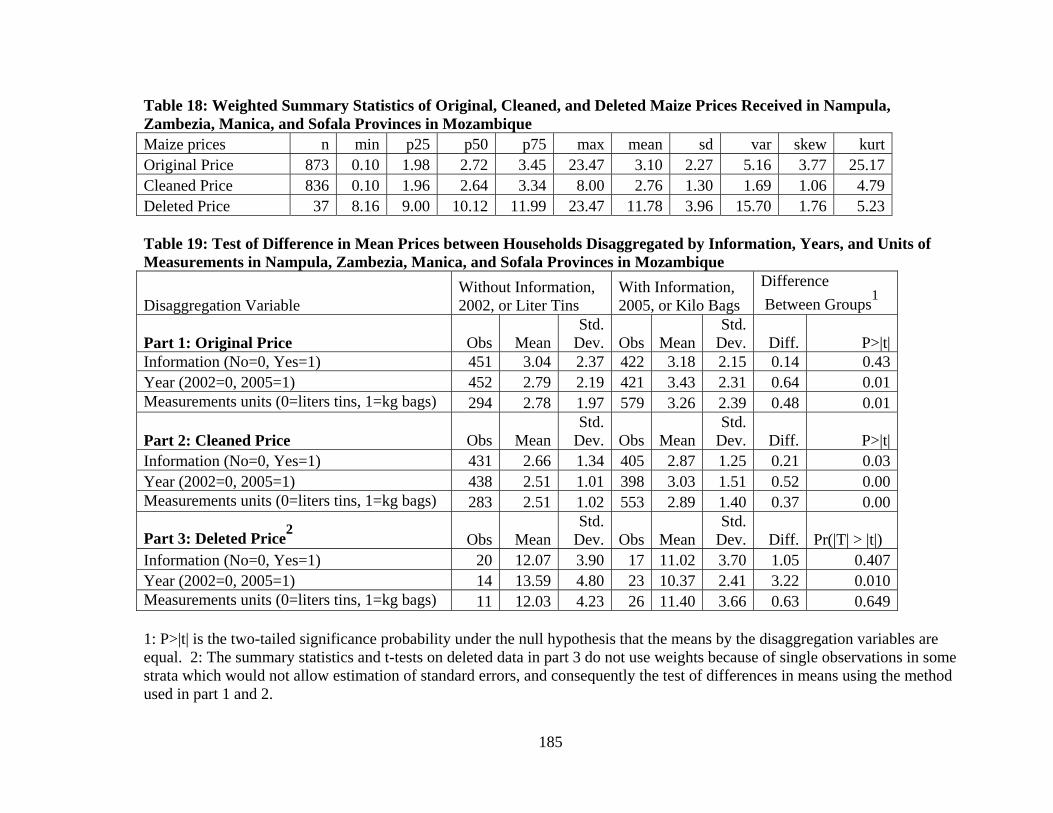
185
Table 18: Weighted Summary Statistics of Original, Cleaned, and Deleted Maize Prices Received in Nampula, Zambezia, Manica, and Sofala Provinces in Mozambique Maize prices n min p25 p50 p75 max mean sd var skew kurtOriginal Price 873 0.10 1.98 2.72 3.45 23.47 3.10 2.27 5.16 3.77 25.17Cleaned Price 836 0.10 1.96 2.64 3.34 8.00 2.76 1.30 1.69 1.06 4.79Deleted Price 37 8.16 9.00 10.12 11.99 23.47 11.78 3.96 15.70 1.76 5.23 Table 19: Test of Difference in Mean Prices between Households Disaggregated by Information, Years, and Units of Measurements in Nampula, Zambezia, Manica, and Sofala Provinces in Mozambique
Disaggregation Variable Without Information, 2002, or Liter Tins
With Information, 2005, or Kilo Bags
Difference Between Groups1
Part 1: Original Price Obs MeanStd.
Dev. Obs MeanStd.
Dev. Diff. P>|t|Information (No=0, Yes=1) 451 3.04 2.37 422 3.18 2.15 0.14 0.43Year (2002=0, 2005=1) 452 2.79 2.19 421 3.43 2.31 0.64 0.01Measurements units (0=liters tins, 1=kg bags) 294 2.78 1.97 579 3.26 2.39 0.48 0.01
Part 2: Cleaned Price Obs MeanStd.
Dev. Obs MeanStd.
Dev. Diff. P>|t|Information (No=0, Yes=1) 431 2.66 1.34 405 2.87 1.25 0.21 0.03Year (2002=0, 2005=1) 438 2.51 1.01 398 3.03 1.51 0.52 0.00Measurements units (0=liters tins, 1=kg bags) 283 2.51 1.02 553 2.89 1.40 0.37 0.00
Part 3: Deleted Price2 Obs MeanStd.
Dev. Obs MeanStd.
Dev. Diff. Pr(|T| > |t|) Information (No=0, Yes=1) 20 12.07 3.90 17 11.02 3.70 1.05 0.407Year (2002=0, 2005=1) 14 13.59 4.80 23 10.37 2.41 3.22 0.010Measurements units (0=liters tins, 1=kg bags) 11 12.03 4.23 26 11.40 3.66 0.63 0.649 1: P>|t| is the two-tailed significance probability under the null hypothesis that the means by the disaggregation variables are equal. 2: The summary statistics and t-tests on deleted data in part 3 do not use weights because of single observations in some strata which would not allow estimation of standard errors, and consequently the test of differences in means using the method used in part 1 and 2.

186
The use of liter tins (e.g., 20, 10, and 5 liter tins) as units of measurement is likely
to bias prices systematically, as the buyers tend to overfill the tins, and the conversion
factors do not adequately capture that overfilling. Part 3 of Table 19 shows that the
deleted observations were evenly distributed between households without information
(20) and those with information (17). Fewer households were deleted in 2002 (14)
compared to 2005 (23); and fewer households that used liter tins as units of
measurements (11) were deleted compared to those that used kilogram bags as units of
measurements (26). Part 3 of Table 19 also shows that the means of the deleted prices
are not significantly different when disaggregated by reception of information and units
of measurements, suggesting that their deletion does not systematically bias the
remaining clean sample in terms of reception of information or units of measurements.
Another assumption is that if there is any bias in prices due to errors in conversion
factors, then this error is randomly distributed among all farmers who quoted prices using
tins of different capacity.
In the econometric analysis, maize prices received are used as a dependent
variable and a second assumption is that any remaining measurement errors in dependent
variables do not violate any of the OLS assumptions (Greene, 2003, Pindyck and
Rubinfeld, 1998, Wooldridge, 2002). Thirdly, the price variable is transformed by taking
its natural logarithm. Taking logarithms of continuous variables stabilizes the variance
and hence reduces the effect of outliers (some of which result from measurement errors).
Also, when measurement errors are present (in addition to heteroskedastic errors), the use
of robust regression produces more efficient estimates than OLS.

187
4.7.3.1.2 Simultaneity
Using a Hausman simultaneity test, information reception was found to be endogenous
with market participation, but not with prices received. The test involved estimating a
linear probability model of information reception, and obtaining the residuals. The
residuals and the dummy variable for reception of information were included in the
structural probit model of market participation, and in the OLS structural model of prices
received. Using a t-test, the residuals were found to be significantly different from zero
at a one percent level of significance in the structural model of market participation,
confirming simultaneity between reception of market information and market
participation. Additionally, using a t-test, the residuals were not significantly different
from zero at a five percent level of significance in the structural model of prices received,
confirming that there was no simultaneity between reception of market information and
prices received. Endogeneity of reception of market information and market participation
is solved by estimating a recursive bivariate probit of reception of market information
and market participation.
Could the factors that affect growing any of the four staple crops in this analysis
be the same factors that affect reception of market information? We argue that the
answer to this question is no for two reasons. First, farmers can receive information
whether they chose to search for it or not because they naturally belong to networks in
which some information flows—i.e., they voluntarily and involuntarily receive market
information. Secondly, many farmers in Northern Mozambique have grown and sold
these 4 staple food crops before improved market information started to be provided,

188
although improved information makes them alter their production and marketing
decisions.
4.7.3.1.3 Omitted Variables Bias
The price model is also estimated using a fixed effects model. The use of a fixed effects
model deals with endogeneity caused by some of the missing variables (e.g., time-
constant unobserved effects). In all the models, any unknown or unobserved time-
varying independent variables are assumed to be randomly distributed in the sample and
left in the error term.
4.7.3.2 Identification
Exclusion restrictions require that there be some overlap of statistically significant
exogenous variables in the structural and reduced equations. The structural equation of
market participation is identified because the dummy variables for growing maize, cell
phone network in the village, the household having received extension services, and the
household being located in low-medium agro-ecological zones are excluded in the model
of market participation but included in the equation of information reception. The
equation of reception of market information is identified because the natural logarithm of
distance to district headquarters and the number of drought days during the main growing
season at the district level are excluded in the equation of reception of market information
but included in the market participation equation.
4.7.3.3 Attrition Bias
The attrition rates between the two surveys in the four provinces covered by this study
were 16 percent in Nampula, 17 percent in Zambezia, 18 percent in Manica, and 26
percent in Sofala (Mather, et al., 2008). Overall, 17 percent of the households in the TIA

189
were not re-interviewed in 2005 due to sample attrition. Eighty-three percent of the
attrition was due to 4 reasons: (1) households moved away (48.4 percent), (2) members
were not available at the time of the interview (16.1 percent), (3) the household was not
found in the household listing of the enumeration area (9.9 percent), and (4) death of the
household head resulted in household dissolution (8.4 percent) (Mather, et al., 2008).
All panel data estimates are made using sampling weights corrected to attrition bias
computed by Mather and Donovan using Inverse Probability Weights (Mather and
Donovan, 2008).
4.7.3.4 Multi-colinearity and Heteroscedasticity
Variables suspected to be collinear were detected by examining the Pearson correlation
matrix and by the variance inflation factors (vif) procedure in STATA. The interaction
terms between different sets of regions and crops were tried and dropped because they
introduced multi-colinearity and were not significant. Using the Breusch-Pagan test,
heteroskedasticity was detected in the linear probability model of reception of
information and in the OLS of prices received model; thus, robust standard errors were
used.
4.7.3.5 Transformation of Continuous Variables
Some continuous variables were transformed in order to improve on the normality of the
data and to stabilize potential outliers. This was done after inspecting the stem-and-leaf
plots, kurtosis, skewness, and the probability density functions of the data. In four
variables (distance to nearest road with public transport, distance to village administrative
post, value of total farm assets, and number of dry days in the main growing season), the
missing values generated due to taking natural logarithms of values with zero were

190
replaced with zeros after the transformation. This was because the natural logarithm of
zero is undefined and yet zero is a valid observed outcome. So implicitly, original
observations of zero were replaced with observations of one, as the natural logarithm of
one is zero, therefore slightly biasing the observations upwards.
4.7.3.6 Rural Price Inflators
The 2002 prices were adjusted to 2005 Meticais da Nova Familia (MTN – the currency
of Mozambique), based on rural price deflators and not the Consumer Price Index
because the CPI is constructed using consumer prices from only three towns consisting of
Maputo, Beira and Nampula (Mather, et al., 2008). The consumer prices in towns are
different from prices received by rural households in Mozambique. The rural price
deflators were derived from the consumption baskets identified by the national
Household Budget and Expenditure Surveys (Inquérito dos Agregados Familiares -IAF),
and prices from the national agricultural market information system (Sistema de
Informação de Mercados Agrícolas, SIMA) (Mather and Donovan, 2008).
4.7.3.7 Heterogeneous Effects
It is sometimes necessary to conduct post-stratification and analysis of the data according
to some variables of interest (e.g., different administrative regions, agro-ecological zones,
or production potential) and to come up with different estimates to account for
heterogeneity between strata. When well done, post-stratification increases efficiency of
sample estimates. This is not done in this study because analysis is conducted in
internally homogeneous strata, where the stratification variable of interest is the high
production potential of the four provinces.

191
4.8 Descriptive and Econometric Analysis of Factors that Affect Reception of
Market Information
Table 20 shows the summary statistics of the factors hypothesized to affect reception of
improved market information and market participation computed from the pooled data of
the 2002 and 2005 TIA surveys for four provinces in Mozambique. The descriptive
statistics are discussed concurrently with the econometric results in Table 21. Table 21
show results from a recursive bivariate probit estimation of receiving market information
(hhinfo) and market participation (mp) together with the marginal effects after the
biprobit. Table 21 includes a column on the hypothesized effects of the control variables
on reception of market information, and the estimated coefficients and their standard
errors in parentheses. The strength of this estimation method is that it (1) uses Full
Information Maximum Likelihood (FIML), which leads to gain in asymptotic efficiency,
(2) solves the endogeneity problem of information reception and market participation, (3)
gives robust errors and thus accounts for heteroskedasticity in the error terms, (4)
accounts for the sampling design used to collect the data, (5) accounts for the panel
structure of the data, and (6) corrects for attrition bias if there is any because it uses the
attrition bias corrected weights.
The coefficient correlation,ρ between the errors from the two equations is -.53
and the Wald test indicates that it is significantly different from zero at a 0.1 percent
level of significance, implying that probabilities of reception of market information and
market participation are dependent on each other (mutually dependent) and that
estimating the two equations jointly is satisfactory. The econometric model for reception
of information correctly predicts “with information” and “without information” 67

192
percent of the time. The model of market participation correctly predicts “participated in
the market” and “did not participate in the market” 66 percent of the time.

193
Table 20:Summary Statistics of Market Participation and Access to Market Information in Nampula, Zambezia, Manica, and Sofala in Mozambique in 2002 and 2005Variable Labels, Names Units, and Types of Variables
Without Information
With Information Pooled sample
Obs Mean Obs Mean Obs Mean Std. Dev.Part 1: Access to Market Information Variables HH grew maize (Yes=1, No=0) 2122 0.68 1502 0.76 3624 0.71 0.45HH grew large groundnuts(Yes=1, No=0) 2122 0.11 1502 0.20 3624 0.15 0.36HH grew small groundnuts (Yes=1, No=0) 2122 0.26 1502 0.39 3624 0.32 0.47HH grew beans-common (Yes=1, No=0) 2122 0.06 1502 0.07 3624 0.07 0.25HH grew at least one of the 4 crops (Yes=1, No=0) 2122 0.78 1502 0.91 3624 0.84 0.37HH has a radio (Yes=1, No=0) 2122 0.43 1502 0.64 3624 0.52 0.50Electricity within village (Yes=1, No=0) 2122 0.12 1502 0.17 3624 0.14 0.35Cell phone network within the village (Yes=1, No=0) 2122 0.17 1502 0.18 3624 0.18 0.38HH owns bicycle (Yes=1, No=0) 2122 0.29 1502 0.33 3624 0.31 0.46Distance to nearest road with public transport (Km) 2122 31.97 1502 32.57 3624 32.22 33.19Distance to village administrative post (Km) 2122 19.99 1502 17.74 3624 19.04 20.17Distance to district headquarters (Km) 2122 44.38 1502 41.23 3624 43.05 26.90HH belongs to an association (Yes=1, No=0) 2122 0.03 1502 0.08 3624 0.05 0.22HH received extension (Yes=1, No=0) 2122 0.07 1502 0.25 3624 0.15 0.35Female heads HH (Yes=1, No=0) 2122 0.26 1502 0.17 3624 0.22 0.42Age of HH head 2122 42.17 1502 40.48 3624 41.45 14.09Household size 2122 4.92 1502 5.16 3624 5.02 2.56HH members between 15 and 59 2122 2.35 1502 2.48 3624 2.41 1.26Years of education of HH head 2122 1.94 1502 2.50 3624 2.18 2.41No formal education (Yes=1, No=0) 2122 0.49 1502 0.36 3624 0.44 0.500- 4 years of formal education (Yes=1, No=0) 2122 0.36 1502 0.44 3624 0.39 0.495+ years of formal education (Yes=1, No=0) 2122 0.14 1502 0.20 3624 0.17 0.37Table continued on next page

194
Table 20 (continued) Variable Labels, Names Units, and Types of Variables
Without Information
With Information Pooled sample
Obs Mean Obs Mean Obs Mean Std. Dev.Total land area (hectares) 2122 1.66 1502 1.99 3624 1.80 1.72Value of total farm assets (05 meticais) 2122 1125 1502 1934 3624 1468 6439HH in Nampula province (Yes=1, No=0) 2122 0.25 1502 0.56 3624 0.38 0.49HH in Zambezia province (Yes=1, No=0) 2122 0.54 1502 0.23 3624 0.41 0.49HH in Manica province (Yes=1, No=0) 2122 0.12 1502 0.12 3624 0.12 0.32HH in Sofala province (Yes=1, No=0) 2122 0.10 1502 0.09 3624 0.10 0.29HH in Low Agro ecological Zone (Yes=1, No=0) 2122 0.12 1502 0.06 3624 0.10 0.30HH in Low to Medium Agro ecological Zone (Y=1, N=0) 2122 0.52 1502 0.53 3624 0.52 0.50HH in Medium to High Agro ecological Zone (Y=1, N=0) 2122 0.36 1502 0.41 3624 0.38 0.49Drought days in main growing season 2122 29.98 1502 23.63 3624 27.30 20.69Time dummy (2002=0, 2005=1) 2122 0.51 1502 0.48 3624 0.50 0.50Part 2: Market Participation1 HH sold maize (Yes=1, No=0) 1559 0.33 1198 0.34 2757 0.34 0.47HH sold large groundnuts(Yes=1, No=0) 284 0.30 316 0.32 600 0.31 0.46HH sold small groundnuts (Yes=1, No=0) 581 0.27 551 0.39 1132 0.33 0.47HH sold beans-common (Yes=1, No=0) 203 0.29 163 0.24 366 0.27 0.44HH sold at least one crop (mp) 2122 0.31 1502 0.41 3624 0.35 0.48Part 3: Maize Price and Quantity Variables2 Quantity of maize produced (kg) 431 562 405 694 836 623.85 944Season 1 area under corn (he) 431 0.75 405 0.83 836 0.79 0.88Quantity of maize sold (kg) 431 164 405 269 836 214 520HH-specific sale price of maize in 2005 meticais3 431 2.66 405 2.87 836 2.76 1.30Units of measurements (0=liters tins, 1=kg bags) 431 0.64 405 0.70 836 0.67 0.47Source: TIA 02 and TIA 05; 1: Percentages out of total households that grew crops; 2 Variables here cover only households that sold a positive quantity of maize; 3 in 2005, 1 dollar = 23.061 Meticais.

195
Table 21: Estimated Parameters and Robust Standard Errors in Parentheses from the Recursive Bivariate Probit Model of Reception of Market Information and Market Participation Hypothesized
Effect on hhinfo1
Bivariate Probit Marginal effects after biprobit
(dy/dx)2
Mean
VARIABLES hhinfo mp3 hhinfo mp X HH4 received market information 0.9369*** 0.342 0.42 (0.190) HH grew maize + 0.3050*** 0.117*** 0.71 (0.073) (0.027) HH grew large groundnuts + 0.3927*** 0.2917*** 0.155*** 0.111 0.15 (0.071) (0.081) (0.0280 HH grew small groundnuts + 0.3342*** 0.3201*** 0.131*** 0.120 0.32 (0.057) (0.073) (0.022) HH grew beans-common + -0.0034 0.5222*** -0.001 0.203 0.07 (0.096) (0.097) (0.038) HH has a radio + 0.4244*** -0.1018 0.164*** -0.037 0.52 (0.061) (0.069) (0.023) Cell phone Network in the Village + 0.2336** 0.092** 0.14 (0.090) (0.036) Electricity in the Village + 0.0562 -0.1914* 0.022 -0.068 0.18 (0.080) (0.080) (0.032) HH owns bicycle + -0.0857 0.0708 -0.033 0.026 0.31 (0.064) (0.063) (0.025) Log of distance to nearest road with public transport (KM)
- 0.0914*** 0.0518 0.036*** 0.019 2.87
(0.025) (0.027) (0.010) Log of distance to village administrative post - -0.0987*** -0.0067 -0.038*** -0.002 2.43 (0.028) (0.028) (0.011) Table continued on next page

196
Table 21 (Continued)
HypothesizedEffect
on hhinfo
Bivariate Probit Marginal effects after biprobit
(dy/dx)
Mean
VARIABLES hhinfo mp hhinfo mp X HH belongs to an association + 0.2646* -0.1394 0.105* -0.050 0.05 (0.126) (0.123) (0.050) HH received extension + 0.7457*** 0.290*** 0.15 (0.077) (0.028) Female heads HH - -0.1074 -0.0252 -0.042 -0.009 0.22 (0.070) (0.070) (0.027) Log of HH size + -0.0425 -0.0666 -0.017 -0.024 1.48 (0.052) (0.053) (0.020) Age of HH head + 0.0161 -0.0210* 0.006 -0.008 41.45 (0.010) (0.009) (0.004) Age of HH head squared + -0.0002* 0.0002* 0.000* 0.000 1917 (0.000) (0.000) (0.000) Head had 1 to 4 years of formal education (Yes=1, No=0)
+ 0.1256* -0.0910 0.049* -0.033 0.39
(0.061) (0.059) (0.024) Head had at least 5 years of formal education (Yes=1, No=0)
+ 0.1299 -0.2545** 0.051 -0.090 0.17
(0.083) (0.083) (0.033) Log of total land area + 0.0454 0.1233** 0.018 0.045 0.30 (0.039) (0.038) (0.015) Log of value of total farm assets + -0.0018 0.0528*** -0.001 0.019 5.50 (0.014) (0.014) (0.006) HH in Manica province (Yes=1, No=0) - -0.0808 0.2142 -0.031 0.081 0.12 (0.084) (0.138) (0.032) HH in Sofala province (Yes=1, No=0) - -0.1132 -0.2396* -0.044 -0.084 0.10 (0.073) (0.097) (0.028) Table continued on next page
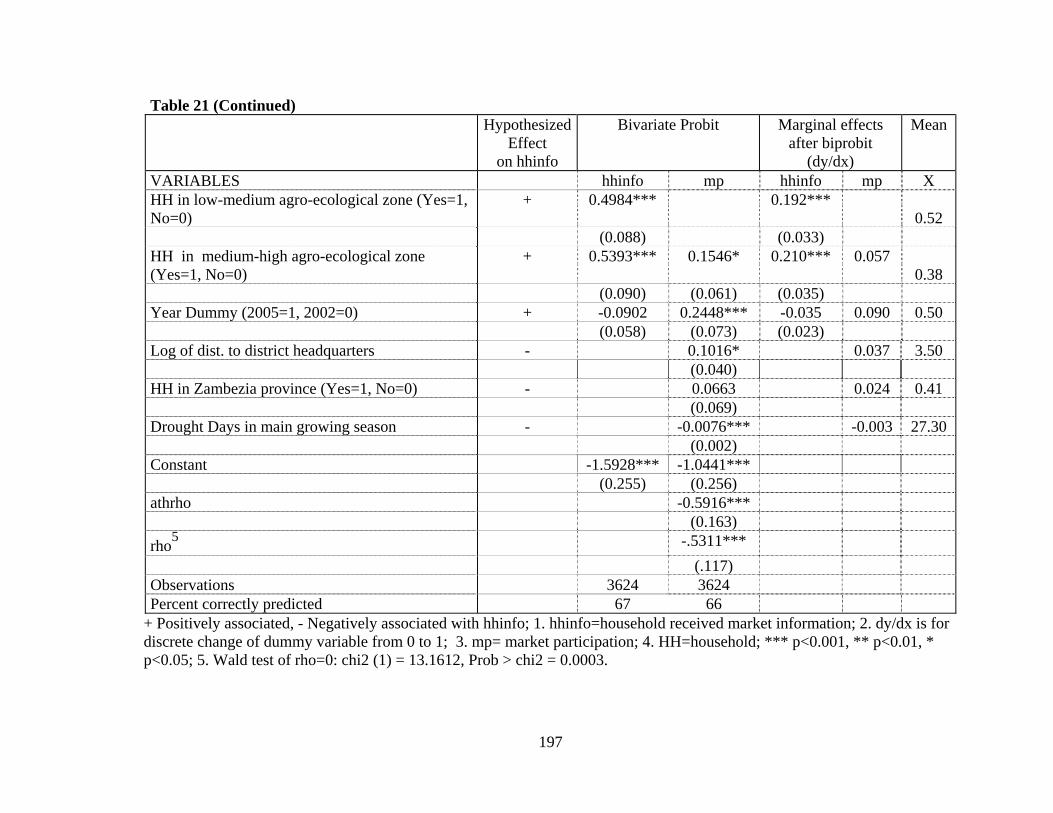
197
Table 21 (Continued)
HypothesizedEffect
on hhinfo
Bivariate Probit Marginal effects after biprobit
(dy/dx)
Mean
VARIABLES hhinfo mp hhinfo mp X HH in low-medium agro-ecological zone (Yes=1, No=0)
+ 0.4984*** 0.192*** 0.52
(0.088) (0.033) HH in medium-high agro-ecological zone (Yes=1, No=0)
+ 0.5393*** 0.1546* 0.210*** 0.057 0.38
(0.090) (0.061) (0.035) Year Dummy (2005=1, 2002=0) + -0.0902 0.2448*** -0.035 0.090 0.50 (0.058) (0.073) (0.023) Log of dist. to district headquarters - 0.1016* 0.037 3.50 (0.040) HH in Zambezia province (Yes=1, No=0) - 0.0663 0.024 0.41 (0.069) Drought Days in main growing season - -0.0076*** -0.003 27.30 (0.002) Constant -1.5928*** -1.0441*** (0.255) (0.256) athrho -0.5916*** (0.163) rho5 -.5311*** (.117) Observations 3624 3624 Percent correctly predicted 67 66
+ Positively associated, - Negatively associated with hhinfo; 1. hhinfo=household received market information; 2. dy/dx is for discrete change of dummy variable from 0 to 1; 3. mp= market participation; 4. HH=household; *** p<0.001, ** p<0.01, * p<0.05; 5. Wald test of rho=0: chi2 (1) = 13.1612, Prob > chi2 = 0.0003.

198
4.8.1 Staple Crops Grown
From Table 20, in the four provinces covered by the study, 71 percent of households
grew maize, 15 percent grew large groundnuts, 32 percent grew small groundnuts, and 7
percent grew common beans. Overall, 84 percent of the households grew at least one of
the four commodities in the study. From the econometric analysis in Table 21, growing
maize, growing large groundnuts and small groundnuts significantly increased the
probability of receiving information at a 0.1 percent level of significance. The expected
marginal effect resulting from growing maize on the probability of receiving market
information is 0.12, while that of growing large groundnuts is .16, and that of growing
small groundnuts is .13.
4.8.2 Ownership of a Radio
Table 20 shows that 52 percent of households in the 4 provinces in Mozambique own a
radio. In the econometric results in Table 21, owning a radio significantly increases the
probability of receiving market information at the 0.1 percent level of significance. The
expected marginal effect resulting from having a radio, holding other factors constant, to
reception of market information is 0.16. To triangulate this information, during field
visits in Nampula Province, farmers reported radio as the main channel through which
they receive market information. From interviews with farmer groups in Nampula
province, 5 out of 14 farmers interviewed had a radio.
4.8.3 Presence of a Cell Phone Network
In the 4 provinces under study, 18 percent of households had a cell phone network in
their village from the 2002 and 2005 panel data. Availability of a cell phone network in
199
the village increased the probability of information reception at a one percent level of
significance. From the econometric analysis in Table 21, the expected marginal effect of
availability of a cell phone network, ceteris paribus, on the probability of receiving
market information is 0.09. An alternative variable would have been ownership of a cell
phone, but these data were not collected in either round in the household surveys. To the
extent that those who own cell phones share information with neighbors, either directly or
through their actions in the market that affect other actors’ behavior, the presence of
mobile telephone network might actually be a better variable, as it picks up some of the
spillover effects.
According to World Bank figures, the number of cell phone subscribers in
Mozambique increased from 0 per 100 people in 1998 to 20 per 100 people in 2008. It is
highly likely that these data are skewed in such a way that the density of cell phone
networks is more near urban areas compared to distant villages. From interviews with
farmer groups in Nampula, where the researcher conducted a field visit, 1 out of the 7
farmers interviewed had a cell phone. Smallholder farmers and small-scale traders who
do not have cell phones can buy air time and use a friend’s telephone to call other traders
to ask about availability and prices of commodities in production areas and in other
markets. Although not included in the econometric analysis, it is worth noting that the
number of internet subscribers increased from 0 per 100 inhabitants in 1998 to
approximately 2 per 100 inhabitants in 2008. On a few occasions, the internet is used as
a transmission channel of market information from the SIMAP in Nampula province to
the SIMA headquarters in Maputo, and the internet is a common way for SIMA to
communicate information to NGOs, public sector, and others for diffusion. But

200
presumably, few if any farmers received, or are directly receiving information from the
internet. To the extent that internet has an effect on farmers’ reception or access to
information, it would be felt through greater information available through other
channels, such as radio (as the radio stations might now get more information via the
internet and then broadcast it to farmers.)
4.8.4 Availability of Electricity
In the 4 provinces under study in Mozambique, 14 percent of households have electricity
in their villages. Electricity is a complementary good with nearly all ICT equipment such
as TVs, radios, computers, and cell phones. Holding other factors constant, the
hypothesis that households in areas with electricity can use more ICT gadgets, and
therefore have a higher probability of receiving market information than those without
electricity was positive but not statistically significant at a 5 percent level of significance.
It was observed during the field visit in Murupula District in Nampula Province that
farmers use old car and motorcycle batteries as an alternative source of electricity to
power their radios and televisions in rural areas, and to charge cell phones. They also use
dry cell batteries for their radios, although some complained that their cost of 30 meticais
($1.07 using the 2009 exchange rate) in 2009 per pair was high. These alternative
sources of electricity could have reduced the effect of having electricity in the village on
information reception.
4.8.5 Ownership of Means of Transport and Access to Roads and Public Amenities
In the four provinces under study in Mozambique, 31 percent of households own a
bicycle, and the average distance to the nearest road with public transport is 32
kilometers. The average distance to the village administrative post is 19 kilometers, and

201
the average distance to the district headquarters is 43 kilometers. From the econometric
analysis in Table 21, an increase in the natural logarithm of the distance to the nearest
road in kilometers significantly increases the probability of receiving market information
at a 0.1 percent level of significance, rejecting the null hypothesis that households closer
to the roads with public transport are more likely to receive market information. The
expected marginal effect resulting from a unit increase in the natural logarithm of the
distance to the nearest road with public transport on the probability of receiving market
information is 0.04. It was hypothesized that a good road network brings in more
agricultural commodity traders who are a source of market information, although some
farmers in Mozambique do not trust information from traders. Thus, farmers near roads
with public transport, it was assumed, would be more likely to receive market
information, in addition to obtaining higher prices for their agricultural commodities than
those who are not. The possible reasons for this unexpected outcome could be that
distant farmers put in more search to avoid the risks and higher costs of delivering
produce to markets when prices are not favorable compared to farmers near roads with
public transport. In addition, in areas where markets are more competitive, farmers may
rely on the market itself as their “information source”, although they probably not report
this as a source of market information. The idea here is that the behavior of markets
themselves transmits information about supply and demand conditions, and if markets are
working well, they are efficient transmitters of this information, making MIS less needed.
In the field study interviews in Murupula District in Nampula province in
Mozambique, some farmers and traders reported not being able to afford to transport their
produce to markets in which the MIS announces higher prices. This is partly because the

202
transport costs are high and partly because of the low marketed surplus that cannot fetch
high enough revenues to cover transport and other marketing costs. Promotion of group
marketing may enable farmers to sell in bulk, and thus afford transporting produce to
markets in which the MIS reports higher prices.
From Table 21, holding other factors constant, an increase in the natural logarithm
of distance to village administrative post significantly decreases the probability of
receiving market information at a 0.1 percent level of significance, which is logical. The
expected marginal effect resulting from a change in the natural logarithm of the distance
to the nearest village administrative post by one unit, on the probability of receiving
market information is -0.04. In Mozambique, market information is also disseminated at
administrative headquarters (e.g., on blackboards and notice boards in markets and
district or provincial headquarters), implying that as households move further from these
locations, their probability of getting information, and other services declines. The policy
implication is that reception of market information could be improved if the government
moved services closer to the people by increasing decentralization of information
systems.
4.8.6 Belonging to Farmer Associations
In the provinces under study, only 5 percent of households belong to an association.
Membership to farmers’ associations increases the probability of receiving market
information and is significant at a 5 percent level of significance. From the econometric
analysis in Table 21, the expected partial effect of belonging to a farmer association,
ceteris paribus, on the probability of receiving market information is 0.11. In
Mozambique, many international NGOs such as ADRA in Zambezia, CLUSA and CARE

203
in Nampula, and national and local NGOs and organizations such as FELICIDADE,
IKURU, and OLIPA distribute the SIMA and SIMAP information bulletins in addition to
their own bulletins to farmers through farmer associations. Some smallholder farmers in
Murrupula are organized in farmer associations and jointly market maize sometimes.
Some farmer groups are legally registered and others are not. Registered farmer
associations usually have bank accounts and can sell to World Food Programme (WFP)’s
Purchase for Progress (P4P) program, and theoretically earn more money and minimize
price risks.
It is not clear what percentages of poorer farmers in Mozambique have a high
voice and are active participants in farmer association’s activities that can make them
benefit from increased reception of market information as are less-poor farmers. During
field study visits in Nampula province in Northern Mozambique, it was noted that there
were two types of farmer groups or associations as noted in section 4.8.6: The registered
and the unregistered associations. It could be observed that farmers in registered and
unregistered groups had different sets of characteristics that could affect their ability to
receive and act on improved market information. For example, the unregistered farmer
association had: no bank account, more female members, less literate members as noted
in section 4.8.10, less members with cell phones, less contact with intermediate traders
and NGO as described in 4.8.6, sold less quantities of different staples, mostly marketed
individually (because they sold different staples at different times), and reported not to
use storage facilities even when they were available in the village. In contrast, members
of the registered farmer group had: a bank account, more males members, they could all
speak and write Portuguese (higher literacy levels), all had cell phones, amalgamated

204
same products (mostly maize and pulse) and sold it as a group to local NGOs and WFP’s
P4P, and had the keys to- and used the village store. So it seems that if improved
information is given to these two types of farmer groups, the registered farmer groups are
likely to act on new information and benefit more than the unregistered group members.
4.8.7 Access to Extension Services
In some provinces in Mozambique such as Nampula, market information bulletins are
given to the extension unit for dissemination through radio or through meetings. In
addition, many national and international NGOs provide advisory services to farmers
including market information. In the provinces under study, 15 percent of households
received extension services in the 2002 and 2005 pooled data. From the econometric
analysis, access to extension services increases the probability of receiving market
information and is significant at a 0.1 percent level of significance. The expected partial
effect of receiving extension services, holding all other factors constant, on the
probability of receiving market information is 0.3. Extension has the largest partial effect
in the study, suggesting that improvements in extension services can lead to more
information reception among small-scale farmers (assuming causality), or that there have
been more investments in MIS where extension investments also occur (complementarily
of MIS with other services).
4.8.8 Gender of Household Head
In the 4 provinces under study, 22 percent of households are headed by females, and a
household having a female head reduces the probability of reception of market
information, although the decline in probability was not statistically significant at a 5
percent level of significance. Household activities impede the capacity of female
205
household heads to obtain market information from sources away from home, such as
association and community meetings where market information is disseminated by NGO
employees and extension workers. It may be argued, however, that females usually have
many domestic activities, which compels them to stay at home near radios compared to
males. Prolonged staying at home among female household heads can potentially
increase their probability of listening to market information from radio compared to male
household heads who work away from home (unless they travel with radios, such as
drivers of vehicles with radios).
4.8.9 Family Size and Age of Household Head
The average family size is 5 members, the average age of the household head is 41 years,
and the average number of household members between ages 19 and 59 years is 2.4.
From the econometric analysis in Table 21, the hypothesis that larger family sizes may be
positively associated with larger social networks and therefore increase the probability of
receiving market information was rejected at a 5 percent level of significance. From the
econometric analysis in Table 21, the hypothesis that reception of information increases
with age was not significant at a 5 percent level of significance, but had a positive
coefficient. The squared term of age of household head, however, was negative and
significant at a 5 percent level of significance. This implies that as the age of the
household head increases, the probability of receiving market information also increases
and reaches a maximum value at the age of 40 years after which an additional year starts
to reduce the probability of receiving market information.

206
4.8.10 Education and Literacy Level of Household Head
Table 20 shows that the average years at school of the household heads are 2.2.
Household heads with no formal education represent 44 percent of household heads in
the sample, those with 1 to 4 years of formal education are 39 percent, and those with
more than five years of formal education are 17 percent. According to the World Bank
World Development Indicators, the literacy rate in 2008 among adults aged 15 years and
above was 54 percent.
From the econometric analysis in Table 21, the household head receiving one to
four years of education increases the probability of reception of market information at a 5
percent level of significance compared to a household head having no formal education.
The expected marginal effect of a household head receiving between one to four years of
education, holding other factors constant, on reception of market information is 0.05.
This means that households with between one to four years of education and literacy are
likely to receive market information than those with a no level of education and literacy.
Having 5 or more years of formal education did not increase probability of receiving
market information significantly above that of those having no education. It is likely that
household heads with more than five years of formal education engage in other non-farm
activities or employment and participate in markets as net buyers of food—a group that
this study did not analyze due to lack of data on net staple crop food purchases.
Some farmers and traders do not speak and read Portuguese, the official language
in which some of the market information is commonly disseminated, although there are
some radio broadcasts in local languages. In the case-study interviews, only one out of

207
nine farmers could speak and read Portuguese in one group, and all farmers could speak
and read Portuguese in another group of four.
The education levels in some parts of Mozambique and in some age brackets are
low because of the civil war, which went on for an extended period of time, disrupting
schooling for many people. Although SIMAP in Nampula province uses mostly radio
broadcasts in local languages, implying that farmers do not need to read and write
Portuguese to listen to market information broadcast on radio, several other channels
through which information is diffused need some minimum level of literacy to
understand. Formal education and literacy5 and the use of market information are
complementary goods for some diffusion channels. For example, there is some minimum
level of education required to read and understand information diffused through
newspapers and emails, or to listen to information broadcasts in Portuguese. Even
information diffused through SMS and through a scroll bar below a TV screen needs
some minimum level of education and or literacy to utilize. For that reason, programs for
farmer organizations, such as CLUSA, include literacy and numeracy training in their
efforts.
4.8.11 Size of Land Holdings and Farm Assets
The demand for information depends on levels of production, which also depend on
factor inputs such as size of land holdings or cultivated area, and farm assets. In the four
provinces under study, the average value of total farm assets is 1,468 meticais (64 dollars
using the 2005 exchange rate), and the average size of household land is 1.8 hectares. In
5 Some people may be literate without formal education. So it is possible that some household heads with no level of education are literate and can access and use printed market information.

208
the econometric analysis in Table 21, the natural logarithm of total land area is positively
associated, but does not significantly influence, reception of market information at a 5
percent level of significance. The natural logarithm of the value of total farm assets is
negatively associated and does not significantly affect reception of market information at
5 percent level of significance. Variables for land cultivated under maize, beans and
groundnuts were not used because they individually represented a smaller sample, which
led to loss of degrees of freedom.
4.8.12 Geographical and Administrative Setting
Some provinces have relatively developed infrastructure such as markets, bridges, and
administrative facilities, implying that services such as transport, markets, and extension
are closer to farmers and traders in some provinces than others. Proximity to some of
these services increases the probability of receiving market information. Overall, 38
percent of households are located in Nampula, 41 percent in Zambezia, 12 percent in
Manica, and 10 percent in Sofala. Among households that do not receive information, 25
percent are in Nampula, 54 percent in Zambezia, 12 percent in Manica and 10 percent in
Sofala. Among households that receive information, 56 percent are in Nampula, 23
percent in Zambezia, 12 percent in Manica and 9 percent in Sofala. From the
econometric analysis in Table 21, a household being located in Manica and Sofala
reduces the probability of receiving market information compared to being located in
Nampula province, although the relationship is not statistically significant at a 5 percent
level of significance. During the period covered by this study, the Ministry of
Agriculture Provincial Directorate had a price information system with radio broadcasts
that could be heard in parts of Zambezia as well as Nampula. There was no such system

209
at the time in Sofala, and the Manica system functioned intermittently. This could be the
reason why being located in Manica or Sofala reduces the probability of receiving market
information.
4.8.13 Agro-Ecological Zones
Some areas are located in good agro-ecological zones with high production potential,
which increases the demand or market information. Three agro-ecological zones are
included in the analysis. From Table 20, they include: (1) the low potential agro-
ecological zone, where 10 percent of the households interviewed reside; (2) the low-
medium potential agro-ecological zone, with 52 percent of households; and (3) the
medium-high potential agro-ecological zone, with 38 percent of households. These
agro-ecological dummies are constructed from the new 10 agro-ecological zone
classifications by the Institute of Agricultural Research of Mozambique (IIAM) based on
agricultural potential taking into account (1) altitude, (2) precipitation, (3) temperature,
and (4) soil types as shown in Table 22.
The low potential agro-ecological zone is characterized by 500-800 millimeters of
rainfall per annum, temperatures ranging from 20.5 to 32.5 degrees Celsius, and variable
soils (including sandy, clay, red and heavy texture, and several medium-heavy texture
soils). The low-medium agro-ecological zone is characterized with an altitude between 0
to 200 meters above sea level, between 800 to 1000 millimeters of rainfall per annum,
temperatures ranging from 24 – 26 degrees Celsius, and has mostly sandy soils.
The medium-high potential agro-ecological zone has the most diverse agro-
ecological conditions. The altitude in some areas ranges from 200-500 meters, 200-1000
meters, and more than 1000 meters above sea level. The rainfall in some areas ranges

210
from 500 to 800 millimeters, between 800 to 1200 millimeters, and above 1200
millimeters per annum. Some areas have temperatures less than 22 degrees Celsius, 20.5
to 32.5 degrees Celsius, 20 to 25 degrees Celsius, and 24 to 26 degrees Celsius. This area
has a variety of soil types including clay, red and heavy texture soils, and several
medium-heavy texture soils.

211
Table 22: Agro-Ecological Zones in Nampula, Zambezia, Sofala, and Manica Provinces in Mozambique AEC Zones
IIAM1 Classification
Province Altitude (Meters)
Precipitation (Millimeters)
Temperature (Celsius) Soils
Low R6 Manica - 500-800 20.5-32.5 Variable Low R6 Sofala - 500-800 20.5-32.5 Variable Low R6 Zambezia - 500-800 20.5-32.5 Variable Low-Medium R5 Manica 0-200 >800 24-26 Sandy Low-Medium R5 Sofala 0-200 >800 24-26 Sandy Low-Medium R5 Zambezia 0-200 >800 24-26 Sandy Low-Medium R8 Nampula - 800-1000 25 Sandy Low-Medium R8 Zambezia >800 24-26 Sandy Medium-High R10 Manica >1200 Red and heavy texture Medium-High R10 Nampula >1000 >1200 <22 Clay Medium-High R10 Zambezia >1200 Red and heavy texture Medium-High R4 Manica 200-1000 500-800 20.5-32.5 Variable Medium-High R4 Sofala 200-1000 500-800 20.5-32.5 Variable Medium-High R7 Nampula 200-500 800-1200 20-25 Several medium-heavy texture Medium-High R7 Zambezia 200-1000 >800 24-26 Variable Source (1): Institute of Agricultural Research of Mozambique (IIAM)

212
In the econometric analysis in Table 21, the dummies for the low-medium
potential agro-ecological zone and medium-high potential agro-ecological zone capture
differences across agro-ecological zones. These dummies significantly and positively
affect the probability of reception of market information at a 0.1 percent level of
significance, compared to the probability in the low potential areas. The expected
marginal effect of a household being located in the low-medium potential agro-ecological
zone, ceteris paribus, on the reception of market information compared to a household in
the low-potential agro-ecological zone is 0.19, and that of a household being located in
the medium-high agro-ecological zone is 0.21. These results are consistent with the
theoretical argument that the demand for information is high in areas with high
production potential and with a high supply response to market information. Production
potential and supply responsiveness should be two main criteria for identifying target
crops for market information and areas where market information is diffused (Kizito,
2009).
4.9 Descriptive and Econometric Analysis of Reception of Information on Market
Participation
From the pooled sample of part 2 of Table 20, 34 percent of farmers who grow maize
participate in the markets as sellers, 31 percent of farmers who grow large groundnuts
participate in the market as sellers, 33 percent of farmers who grow small groundnuts
participate in the market as sellers, and 27 percent of farmers who grew common beans
participate in the market as sellers. All together, 35 percent sell at least one of these 4
main staple commodities. In this study, market participation is defined as a household
that sold at least one of these 4 main staples. This definition of market participation is
213
different from some definitions which divide market participation into two or three
categories - the net-sellers, net buyers, and autarkic for one or a bunch of commodities
(Bellemare and Barrett, 2006, Goetz, 1992, Key, et al., 2000) because data on purchasing
behavior of respondents was not collected. The analysis in this section only considered
sellers of the four staples. This implies that the effect of reception of market information,
as stated in the objectives in section 4.1, is analyzed from seller’s standpoint, not the
buyer’s standpoint.
The econometric results in Table 21 indicate that receiving market information
significantly increases market participation at a 0.1 percent level of significance. The
expected marginal effect resulting from reception of market information, holding other
factors constant, on the probability of market participation is .34 when evaluated at the
mean of 42 percent of households that received market information. This is in contrast
with a study by Boughton et al., (2007), which finds market information not to
significantly affect market participation. Some of the reasons why the results differ are:
(1) The Boughton, et al. (2007) study used national data for the whole country while this
study used data from the 4 main production provinces that also account for 57 percent of
the households in the 10 provinces of Mozambique. (2) This study analyzes reception of
information among the 4 main staple crops on which SIMA provides information on
unlike the Boughton, et al., (2007) study which included cash crops (cotton and tobacco)
on which SIMA does not provide price information about and only one staple crop
(maize).
Other factors that significantly increase the probability of market participation,
and their expected marginal effects (evaluated at their means) on the probability of

214
market participation and significance levels of the estimated biprobit coefficients in
brackets include: growing large groundnuts (.11, p<0.001), growing small groundnuts
(.12, p<0.001), growing beans (.2, p<0.001), the natural log of total land area (.05,
p<.01), the natural log of value of farm assets (.02,p<0.001), a household being located in
medium-high agro-ecological zone (.06,p<0.05), the year dummy (0.09,p<0.001), and the
natural log of value of distance to district headquarters (.04,p<0.05).
Factors that significantly reduce the probability of market participation, and their
expected marginal effects (evaluated at their means) on the probability of market
participation and significance levels of the estimated biprobit coefficients in brackets
include: presence of electricity in the village (-0.07, p<0.05), age of household head (-
0.01, p<0.05), household head having higher than 5 years of education (-0.09, p<0.01), a
household being located in Sofala province (-0.08, p<0.05), and the number of drought
days during the main growing season at the district level (-0.003, p < 0.001).
It was anticipated that presence of tapped electricity (public electricity network)
in a village would increase market participation since it increases the production stages
such as processing in the value chain of commodity subsectors (e.g., milling in case of
maize). It is not clear why this variable produced counter-intuitive results.
Holding other factors constant, each additional year of the household head age
reduces the probability of market participation, reaching the minimum value at the age 53
years, after which each additional year increases market participation. It was anticipated
that as age of household head increases, market participation would also increase, reach a
certain age and then start to decline —i.e., that age would be concave. There is no
apparent conjecture as to why this variable produced counter intuitive results. As for

215
drought, the intuition is that when there is drought, there is less production and therefore
less market participation by households as net-sellers, but probably more participation as
net staple crop buyers–again, something that this study was unable to analyze.
4.10 Descriptive and Econometric Analysis of Reception of Information on Prices
of Maize Received
4.10.1 Econometric Models Evaluation
This section estimates the effects of reception of information on prices of maize received.
Table 23 presents the results. To account for other confounders that may affect prices
received, the structural model of prices received is estimated using four estimation
methods and five equations: pooled OLS (including both a basic pooled OLS and a more
detailed model), a fixed effects model, a random effects model, and robust regression.
The basic pooled OLS (restricted model) includes reception of information, a year (time)
dummy, and the interaction term between reception of information and the time dummy
as the only independent variables. The detailed pooled OLS model is also called the
unrestricted model.
The random effects model assumes that the unobserved effects are random and puts
them in the error term. The fixed effects model assumes the unobserved effects are
correlated with the explanatory variables and is used to eliminate the unobservable fixed
effects ia explained in section 4.7.2. The unobserved effects ia are eliminated by a fixed
effects transformation (within transformation) which involves subtracting the means of
treatments from individual observations for all variables. When there are only two time
periods, as is the case in this model, fixed effects estimation and first differencing
procedure serve the same purpose—to eliminate the unobservable fixed effects ia —and
216
produce identical estimates and inference (Wooldridge, 2002). Therefore, there was no
need to use the first-differencing method in this study.
The estimated coefficients on the interaction of year and information dummies in
the restricted (basic) OLS, the unrestricted pooled OLS, and the fixed effects model are
also referred to as the difference-in-difference (DID) estimators in program evaluation
literature. Keeping everything else constant, these DID estimators measure the impact of
the “policy change”—in this case of providing market information on prices received—
between households that received information (treatment or experimental group) and
those that did not receive information (control group) (Wooldridge, 2002) between 2002
and 2005. These coefficients (DID estimators) were not significant in all the models
implying that there was no significant change in prices received by households that
received and did not receive market information between 2002 and 2005.
The Hausman's specification test failed to reject the null hypothesis that both the
fixed and random effects models are consistent, but that the fixed effects model is more
efficient than the random effects model. The alternative hypothesis under the Hausman’s
specification test is that fixed effects model is less efficient than the random effects
model. These results imply that the fixed effects model would be the model of choice.
Robust regression is used because the price data are suspected to be noisy, being
observed household-specific survey data, thus the need to compare results from other
regression methods with those obtained from robust regression which is considered to
perform better when there are outliers and measurement errors in addition to
heteroskedastic errors.

217
The results from the 5 equations in Table 23 are consistent in several aspects. The
estimated coefficients on reception of market information and on those which are
significant in all of the models have, in general, the same signs, which indicate
consistency of the models. The results obtained using robust regression have similar
signs with those obtained using the random effects model (apart from quantity of maize
produced). Also, the results obtained using robust regression have similar signs with
those obtained using the random effects model and pooled OLS (apart from belonging to
an association, and quantity of maize produced), suggesting that measurement errors in
the price data are not a major problem.
The fixed effects model produces 4 coefficients with unique changes in signs
(household has a radio (+), household received extension (+), female headed household
(+), and units of measurements (-)) compared to the other three methods (pooled OLS,
random effects, and robust regression). The fixed effects model by design drops all
variables that are time-invariant such as distance variables, and provincial and agro-
ecological zone dummies.
Overall, the models have weak explanatory power as indicated by the low adjusted
R2s, which are 0.04 for the basic pooled OLS model, 0.10 for the expanded pooled OLS
model, 0.14 for the fixed effects model, and 0.11 for the robust regression. This implies
that there is still a very large amount of unexplained variance in the data.

218
Table 23:Regressions of Reception of Market Information on Prices of Maize Received
Variable Name Basic Pooled OLS
Pooled OLS
Fixed Effects
Random Effects
Robust Regression
(1) (2) (3) (4) (5) (6) HH received market information 0.1440** 0.0702 0.1486 0.1131* 0.1010* (0.051) (0.052) (0.103) (0.053) (0.048) Variance of district price 0.0284 0.0188 0.0280 0.0472** (0.026) (0.051) (0.022) (0.017) HH grew large groundnuts -0.0881 -0.2490* -0.0681 -0.0705 (0.047) (0.122) (0.047) (0.043) HH has a radio -0.0614 0.0341 -0.0366 -0.0481 (0.044) (0.089) (0.042) (0.037) Cell phone Network in the Village 0.1238 0.1945 0.0891 0.0580 (0.068) (0.113) (0.060) (0.057) HH owns bicycle 0.0773 0.1775* 0.0869* 0.0586 (0.046) (0.079) (0.043) (0.036) HH belongs to an association 0.1070 0.0883 -0.0765 -0.0137 (0.077) (0.131) (0.093) (0.072) HH received extension -0.0388 0.0136 -0.0282 -0.0394 (0.046) (0.099) (0.047) (0.044) Female heads HH -0.0476 0.4026* -0.0434 -0.0383 (0.054) (0.205) (0.060) (0.047) Units used (0=liter tins, 1= kilogram bags) 0.0832 -0.0621 0.0711 0.0739 (0.044) (0.091) (0.043) (0.038) Log of dist. to nearest road1 (KM) -0.0079 -0.0210 -0.0219 (0.024) (0.021) (0.018) Log of dist. to district headquarters 0.0004 0.0247 0.0206 (0.029) (0.029) (0.024) HH members between 15 and 59 0.0796 0.1349 0.1004* 0.0552 (0.051) (0.139) (0.049) (0.038) Table continued to the next page
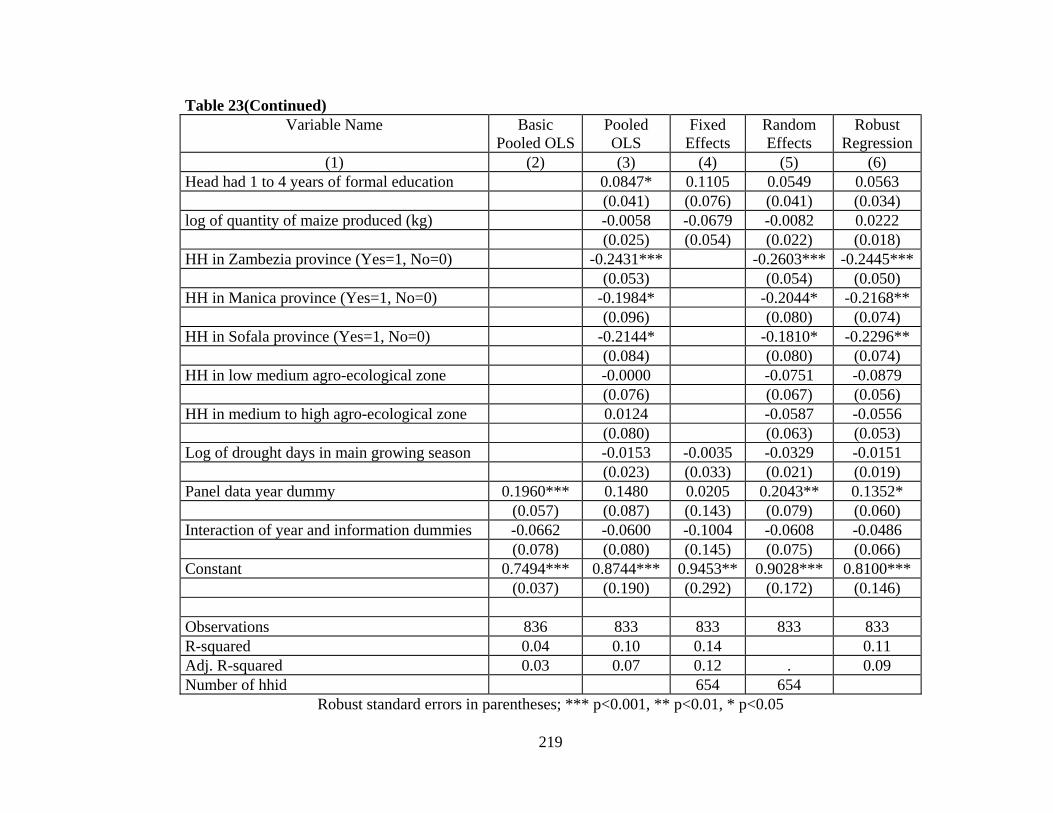
219
Table 23(Continued) Variable Name Basic
Pooled OLSPooled OLS
Fixed Effects
Random Effects
Robust Regression
(1) (2) (3) (4) (5) (6) Head had 1 to 4 years of formal education 0.0847* 0.1105 0.0549 0.0563 (0.041) (0.076) (0.041) (0.034) log of quantity of maize produced (kg) -0.0058 -0.0679 -0.0082 0.0222 (0.025) (0.054) (0.022) (0.018) HH in Zambezia province (Yes=1, No=0) -0.2431*** -0.2603*** -0.2445*** (0.053) (0.054) (0.050) HH in Manica province (Yes=1, No=0) -0.1984* -0.2044* -0.2168** (0.096) (0.080) (0.074) HH in Sofala province (Yes=1, No=0) -0.2144* -0.1810* -0.2296** (0.084) (0.080) (0.074) HH in low medium agro-ecological zone -0.0000 -0.0751 -0.0879 (0.076) (0.067) (0.056) HH in medium to high agro-ecological zone 0.0124 -0.0587 -0.0556 (0.080) (0.063) (0.053) Log of drought days in main growing season -0.0153 -0.0035 -0.0329 -0.0151 (0.023) (0.033) (0.021) (0.019) Panel data year dummy 0.1960*** 0.1480 0.0205 0.2043** 0.1352* (0.057) (0.087) (0.143) (0.079) (0.060) Interaction of year and information dummies -0.0662 -0.0600 -0.1004 -0.0608 -0.0486 (0.078) (0.080) (0.145) (0.075) (0.066) Constant 0.7494*** 0.8744*** 0.9453** 0.9028*** 0.8100*** (0.037) (0.190) (0.292) (0.172) (0.146) Observations 836 833 833 833 833 R-squared 0.04 0.10 0.14 0.11 Adj. R-squared 0.03 0.07 0.12 . 0.09 Number of hhid 654 654
Robust standard errors in parentheses; *** p<0.001, ** p<0.01, * p<0.05

220
4.10.2 Descriptive and Econometric Results of Information on Prices Obtained
From part 3 of Table 20, among households that sell maize, the average quantity of maize
produced is 624 kilograms, the average area under maize in the main production season is
0.79 hectares, the average quantity of maize sold is 214 kilograms, and the average sale
price that the farmers sold their maize at is 2.76 MZN/kg. Moreover, 67 percent of
household used kilogram bags as units of measurements, while the remaining 33 percent
used tins of different sizes as measurement units.
From Table 23, the basic pooled OLS estimates show that a household that receives
market information receives a price that is 16 percent higher and significantly than that
which does not receive market information. This figure is 7 percent but not significant
using the unrestricted pooled OLS model, 16 percent and not significant using fixed
effects estimates, 12 percent and significant using random effects estimates, and 11
percent and significant using robust regression estimates. Using the significant figures,
the average percentage difference in prices between households with and without
information is thus 12.7 percent.
In general, the modeling in this chapter focuses on sellers, but not buyers, of one
commodity-maize. This implies that the effect of reception of market information, as
stated in the objectives in section 4.1, is analyzed from seller’s standpoint, not the buyer’s
standpoint. One question from this is: how would the results of this analysis differ for net
buyers of maize? Answering this question would need future empirical research. The
author’s hypothesis, however, is that in the short run, the gains from reception of
improved information (e.g., increase in welfare and its redistribution) through increased

221
market participation are captured more by sellers than by buyer for the following
reasons:-
• First, households mostly sell maize grain and buy mostly maize flour, unless there
are well-developed hammer mills or grinding machines in rural areas, where
farmers can buy maize grain and take it to hammer mills for milling.
• Secondly, maize grain and maize flour are very different value chains with
different market players (e.g. traders). For example, maize flour is mostly
supplied from more competitive markets in urban towns where there are relatively
more large millers (e.g., in Zambia and Kenya) or from relatively developed
trading centers where there are hammer mills compared to relatively smaller
trading centers with small retailers. This, in part, means that there is not much
price uncertainty in prices of processed maize flour from urban processors
compared to farmgate prices of unprocessed maize grain from smallholder
farmers in rural villages. In other words, the prices of maize flour in source
markets (i.e., urban areas) are likely to be relatively more competitive and
predictable (i.e., with less price uncertainty as measured by indictors presented in
section 4.5) compared to the competitiveness and price uncertainty in producer
prices in the source markets for maize grain in rural villages, holding processing
and marketing costs constant. For example, there are likely to be more retailers of
maize flour (i.e. a low seller concentration ratio (e.g., CR-4)) than are buyers of
maize grain (i.e. a higher buyer CR-4) in rural trading centers and assembly
markets throughout the year.
222
• Thirdly, although many MIS in sub-Saharan Africa collect producer-, wholesale-,
and retail prices of maize grain and retail prices of maize flour, as indicated in the
synthesis on information provided in section 3.7.1 and in APPENDIX A, they
mostly disseminate wholesale prices of maize grain and less of retail prices of
maize flour. This information is usually targeted to sellers. Therefore; one would
expect sellers to benefit more than buyers.
• Fourthly, the value of improved market information is higher when there is high
uncertainty of future prices. This uncertainty, measured as price volatility or
dispersion as indicated in sections 4.5.2 (measures of price dispersion) and 4.5.3
(forecast errors), is likely to be higher in producer level prices of maize grain in
rural villages than at consumer level prices of maize flour—a processed
product—in trading centers where there are even likely to be more retailers (i.e.,
more competition) as noted in the second reason above.
In the long run, to the extent that improved market information leads farmers and
traders to invest in more efficient production and marketing systems, it is likely that
buyers would also benefit from the MIS. Moreover, even if the net gain from improved
market information to individual consumers is small, when the number of consumers is
large, then the aggregate net benefits to consumers may become more than those to
producers.
Another weakness of this model is that it does not show what part of the benefits
that farmers get more is from buyers. The model does not show what part of the benefits
from information is a net efficiency gain and what part of it is redistribution of income,
say from buyers to sellers. Therefore, one implication of the results from this study is

223
that they give suggestions of willingness of sellers to pay for improved market
information, but not the willingness of buyers to pay for improved market information.
This and the next paragraph give factors that significantly affect prices received
based on the results from the five estimated regression equations. The regression
equations are considered as a panel of judges, and the more a variable is declared
statistically significant by the models, the better it is considered to influence prices
received. Other factors that significantly and positively affect the prices of maize
received across the five estimated models include the district level variance of prices
received (from robust regression); household owning a bicycle (in the fixed and random
effects models); a female headed household (one of the unique signs produced by the
fixed effects model); the log of household members aged between 15 and 59 years (from
the random effects model); the household head had one to four years of education (from
pooled OLS); and the panel year dummy (from the basic pooled OLS, random effects,
and robust regression).
Other factors that significantly and negatively affect the prices of maize received by
households include the household’s growing large groundnuts (from the fixed effects
model); and a household being located in Zambezia, Manica, and Sofala provinces (from
pooled OLS, random effects and robust regression).
It was hypothesized that variation in prices may be due to the difference in units of
measurement used to sell maize. A dummy variable indicating whether households used
kilogram units or liter tins as units of measurements was included in the regressions and
was not found to be statistically significant in any of the regression equations at a 5
percent level of significance. This makes intuitive sense. If farmers were systematically

224
getting higher prices selling using one type of container over another, they would
probably figure this out over time and shift to selling more using the container offering
the higher price. So it appears that over time, the effective price per kilogram has
equalized across container types.
The variable on number of drought days in the main growing season was included
to control for seasonality effects that might affect prices received. The estimated
coefficients on this variable were not significant in the estimated models. It is likely that
more commercialized farmers can afford to store and sell in off-peak marketing months
(i.e., engage in temporal arbitrage) and thus receive higher prices than less
commercialized farmers who most likely sell their entire surplus output during the peak-
marketing months (i.e., do not engage in temporal arbitrage). These seasonality effects
associated with the peak and off-peak marketing periods between large and small farmers
is partly captured by including a quantity-sold variable in the price model. Another
variable that could have helped to capture these seasonality effects would be a dummy
variable that indicate whether farmers sold in the 4 peak marketing months or in the off-
peak marketing months. This variable was not included in the panel data analysis
because data on it was only collected in one round of the panel—the 2005 TIA.
The study did not control for the size and number of buyers in the regions. Some
provinces such as Manica have relatively larger buyers who may offer relatively higher
prices compared to small buyers in other provinces in Northern Mozambique. Also,
when there are many buyers, the market is likely to be more competitive, and become an
information system itself, thus reducing the need and value of information from an
independent MIS. These effects are partly captured by the regional (provincial) dummies

225
that were included in the model. The regional dummy indicating whether a household
was located in Manica is significant but negative in all models, which rejects the
hypothesis that households in regions with relatively larger buyers (as measured by a
regional dummy) receive higher prices.
In conclusion, the econometric analysis implies that holding other factors constant,
households are likely to participate in markets and obtain higher prices when
governments, external donors, charity organizations, and private sector firms provide
more funding and in-kind contribution for the collection and diffusion of improved
market information to farmers and small-scale traders. Increased market participation
and higher prices received from the sale of surplus staple crops translate into increased
incomes and improved wellbeing of households.
4.11 Cost-Benefit Analysis of Information Search
This section deals with research question number 4 in section 4.1 which is: How do the
benefits from receiving improved agricultural market information compare with the costs
of searching for it for an average Mozambique farmer who participates in the market as a
maize seller? The section uses results from the descriptive and econometric analysis to
compute the marginal and average benefits of reception of improved agricultural market
information by an average maize farmer in Mozambique. The section also estimates the
costs of searching market information by an average maize farmer using: (1) radio; (2)
cell phone; (3) and word-of-mouth through meetings with neighbors, friends, relatives,
traders, and extension and NGO workers; and (4) a combination of the three methods.
226
4.11.1 Model Parameters
Table 24 gives the parameters used in the benefit and cost estimations. The parameter
labels are long and elaborate (including sources of the data or the way they are calculated
in brackets) and only row 17 is explained here. In row 17, the travel cost and time of
attending meetings with neighbors, friends, relatives, traders, and extension and NGO
workers is valued at zero, although some travel time is used. This is done for two
reasons. The first is that farmers always travel to trading centers or road junctions where
meetings are held to conduct other activities such as shopping and networking. It is their
way of life that they interact within the village. Secondly, even when travel is
specifically done for searching information, it provides more utility than disutility (i.e., it
is more of a benefit than a cost), for example in form of allowances, food, drinks, and
social interaction enjoyed when they attend workshops, meetings, or when they visit
neighbors. In other words, the costs incurred in this type of search are compensated for
with other non-financial benefits from social networking. As a caveat, the marginal cost
curve of attending meetings must turn upwards at some point, so the farmers will not be
willing to attend an infinite number of meetings.
Note that the radio can be used to listen to other information apart from maize
prices. In other words, there is nonappropriability of the costs of use of radio batteries in
a sense that the cost of using them to receive information on one commodity is the same
as the cost of using them to receive information on many commodities during a market
information radio program. In the same way, cell phones are used to receive and send
other information other than maize market information.

227
Table 24: Parameters for Estimating the Benefits and Costs of Information Search in Mozambique
Row Model Parameters Value
1 Average HH1-specific sale price of maize (05 MZN per kg) without information (TIA data from Table 20) 2.67
2 Average HH-specific sale price of maize (05 MZN per kg) with information (TIA data from Table 20) 2.87
3 Basic pooled OLS information coefficient (column (2) in Table 23) 0.14404 Pooled OLS information coefficient (column (3) in Table 23) 0.07025 Fixed effects information coefficient (column (4) in Table 23) 0.14866 Random effects information coefficient (column (5) in Table 23) 0.11317 Robust regression information coefficient (column (6) in Table 23) 0.1010
8 Average Quantity of maize sold (kg) (TIA data (column (5) in Table 23)) 214
92 Cost of a pair of type D batteries (PDB) in MZN in 2009 (Field observation by researcher while in Nampula—Mozambique) 30.00
10 Cost of calling from Mcell to Mcell and other networks per minute in MZN in 2010 (http://www.mcel.co.mz) 7.04
11 Cost of calling from Vodacom to Vodacom and other networks per minute in MZN in 2010 (http://www.vm.co.mz/) 6.58
12 Average cost of calling on the two networks per minute in MZN in 2010 ((10)+(11))/2 6.81
13 Cost of SMS from Mcell to Mcell and other networks in MZN 2.11
14 Cost of SMS from Vodacom to Vodacom and other networks in MZN 1.97
15 Average cost of an SMS on two networks in 2010 ((13)+(14))/2 2.0416 Exchange rate of 1 USD to the MZN in 2005 23.06
17 Travel cost and time of attending meetings with neighbors, extension and NGO workers is valued at zero 0.00
18 Number of smallholder farmers (HHs) in Nampula (TIA 2008) 758,87919 Number of smallholder farmers (HHs) in Zambezia (TIA 2008) 825,45120 Number of smallholder farmers (HHs) in Manica (TIA 2008) 272,96121 Number of smallholder farmers (HHs) in Sofala (TIA 2008) 260,40022 Total HHs in 4 provinces: Row (18)+…+(21) 2,117,691 23 Percentage of HHs that grew maize (TIA data from Table 20) 71%
24 Percentage of HHs that sold maize given that they grew maize (TIA data from Table 20) 34%
25 Percentage of HHs that received information given that they sold maize=405/836 (TIA data from Table 20) 48%
26 Estimated HHs that received information given that they sold maize in the 4 provinces: Row (22)*(23)*(24)*(25)
244,675
1. HH= Household; 2. The cost of 1 type D battery ranges from 12-15 MZN while 1 smaller AA battery costs 6 MZN. Thus, using 15 MZN is conservative enough.
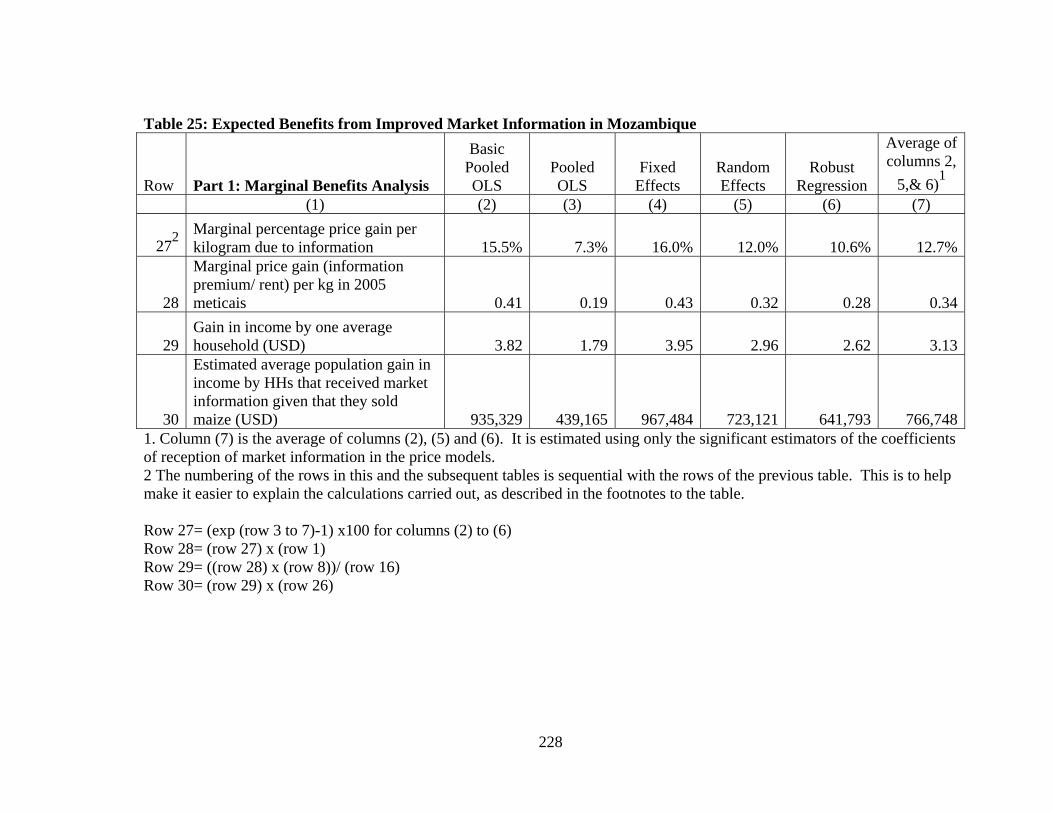
228
Table 25: Expected Benefits from Improved Market Information in Mozambique
Row Part 1: Marginal Benefits Analysis
Basic Pooled OLS
Pooled OLS
Fixed Effects
Random Effects
Robust Regression
Average of columns 2,
5,& 6)1 (1) (2) (3) (4) (5) (6) (7)
272 Marginal percentage price gain per kilogram due to information 15.5% 7.3% 16.0% 12.0% 10.6% 12.7%
28
Marginal price gain (information premium/ rent) per kg in 2005 meticais 0.41 0.19 0.43 0.32 0.28 0.34
29 Gain in income by one average household (USD) 3.82 1.79 3.95 2.96 2.62 3.13
30
Estimated average population gain in income by HHs that received market information given that they sold maize (USD) 935,329 439,165 967,484 723,121 641,793 766,748
1. Column (7) is the average of columns (2), (5) and (6). It is estimated using only the significant estimators of the coefficients of reception of market information in the price models. 2 The numbering of the rows in this and the subsequent tables is sequential with the rows of the previous table. This is to help make it easier to explain the calculations carried out, as described in the footnotes to the table. Row 27= (exp (row 3 to 7)-1) x100 for columns (2) to (6) Row 28= (row 27) x (row 1) Row 29= ((row 28) x (row 8))/ (row 16) Row 30= (row 29) x (row 26)

229
Table 26: Estimated Costs, Cost-Benefit Ratio, and Sensitivity Analysis of Search of Improved Market Information in Mozambique
Costs and Cost-Benefit Ratios of Information Search Combos: Pairs of D Batteries (PDB), Cell Phone Minutes (CPM), and SMS used
Combo 1: 1 PDB,
3 CPM, 2 SMS Combo 2:1 PDB, 4 CPM, 2 SMS
Combo 3: 1 PDB, 5 CPM, 2 SMS
Combo 4: 1 PDB, 6 CPM, 2 SMS
Search Modes One Month
Two months
One Month
Two months
One Month
Two months
One Month
Two months
(1) (2) (3) (4) (5) (6) (7) (8) (9) 31 Radio using Pair of D Batteries (PDB) 1.30 2.60 1.30 2.60 1.30 2.60 1.30 2.6032 Cell Phone Minutes (CPM) and SMS 1.06 2.12 1.36 2.72 1.65 3.31 1.948 3.9033 Meetings 0.00 0.00 0.00 0.00 0.00 0.00 0.00 0.0034 Radio, Cell Phone, and Meetings 2.36 4.73 2.66 5.32 2.95 5.91 3.25 6.5035 Cost-Benefit Ratio 0.75 1.51 0.85 1.70 0.94 1.89 1.04 2.07
Combo 5: 2 PDB,
3 CPM, 2 SMS Combo 6: 1 PDB,
3 CPM, 5 SMS Combo 7: 1 PDB 3 CPM, 10 SMS
Combo 8: 1 PDB, 3 CPM, 12 SMS
One Month
Two months
One Month
Two months
One Month
Two months
One Month
Two months
(1) (2) (3) (4) (5) (6) (7) (8) (9) 36 Radio using Pair of D Batteries (PDB) 2.60 5.20 1.30 2.60 1.30 2.60 1.30 2.6037 Cell Phone Minutes (CPM) and SMS 1.06 2.12 1.33 2.66 1.77 3.54 1.946 3.8938 Meetings 0.00 0.00 0.00 0.00 0.00 0.00 0.00 0.0039 Radio, Cell Phone, and Meetings 3.66 7.33 2.63 5.26 3.07 6.14 3.25 6.4940 Cost-Benefit Ratio 1.17 2.34 0.84 1.68 0.98 1.96 1.04 2.07Row 31, row 36 = (row 9) x PDB / (row 16) Row 32, row 37 = ((row 12) x CPM + (row 15) x SMS)/ (row 16) Row 34 = (row 31) + (row 32) + (row 33); Row 35 = (row 34) / (row 29, column 7) Row 39 = (row 36) + (row 37) + (row 38); Row 40 = (row 39) / (row 29, column 7)

230
Table 27: Estimated Costs, Cost-Benefit Ratio, and Sensitivity Analysis on Quantity Sold and Search of Improved Market Information in Mozambique
Quantity minimum, quartiles, maximum, and mean values of quantity sold in the sample
min p25 p50 p75 max mean41 Quantity sold (kg) 4 50 100 250 20010 214
42 Average marginal percentage price gain per kilogram due to information 12.7% 12.7% 12.7% 12.7% 12.7% 12.7%
43 Average marginal price gain (information premium/ rent) per kg 0.34 0.34 0.34 0.34 0.34 0.34
44 Average gain in income by one household (USD)= (41)*(43)/(16) 0.06 0.73 1.47 3.67 293.57 3.13
45
Estimated average population gain in income by HHs that received market information given that they sold maize (USD) 766,748
Pairs of D batteries (PDB) used in search combos46 Break-even Pairs of D batteries (PDB) 0 PDB 0 PDB 1 PDB 2 PDB 225 PDB 2 PDB
47 Break-even search costs using radio using Pair of D Batteries (PDB) 0.00 0.00 1.30 2.60 292.70 2.60
48 Cost Benefit Ratio (row 47) /(row 44) 0.00 0.00 0.89 0.71 1.00 0.83
Cell Phone Minutes (CPM) and SMS used in search combos
49 Break-even Cell Phone Minutes and SMS Used 0 CPM, 2 SMS
1 CPM, 2 SMS
4 CPM, 2 SMS
11 MM, 2 SMS
993 CPM, 2 SMS
9 CPM, 2 SMS
50 Break-even search costs using Cell Phone Minutes (CPM) and 2 SMS 0.18 0.47 1.36 3.42 293.31 2.83
51 Cost Benefit Ratio (row 50) / (row 44) 3.01 0.64 0.92 0.93 1.00 0.90Row 41= minimum, quartiles, maximum and mean of quantity sold in sample; Row 42 = (Row 27, column 7); Row 43= (Row (28, column 7); Row 44=(row 41)*(row 43)/ (row 16); Row 45=(row 44)*(row 26); Row 46=[(row 44) / ($1.30)]=[(row 44)/(row 9 / row 16)], where [X] means integer part of the quotient X; Row 47= (row 9)* PDB / (row 16); Row 48 = (row 47) / (row 44); Row 49= [((row 44 x rows 16) - (2 x row 15))/ (row 12)]; Row 50= ((Row 12) x CPM + (Row 15) x SMS)/ (row 16); Row 51= (row 50)/ (row 44).

231
4.11.2 Estimated Benefits Analysis
• Row 27 in Table 25 shows the marginal percentage price gain per kilogram due to
information from the econometric analysis reported in the second paragraph in
section 4.10.2. The column 7 of row 27 shows that the average marginal
percentage price gain per kilogram due to reception of information is 12.7
percent.
• Row 28 in Table 25 shows the marginal price gain in meticais equivalent and is
obtained by multiplying the marginal percentage price gain (row 27) by the price
received without information (row 1 in Table 24). The average marginal price
gain in meticais (row 28, column 7) is equivalent to about 0.34 meticais per
kilogram. This can also be considered as the average information premium or
average information rent per kilogram of maize sold by a household that received
information.
• Row 29 in Table 25 shows the gain in income by one average household (i.e., a
household that sold 214 kilograms of maize) in USD. It is obtained by
multiplying marginal price gain (row 28) by the average quantity sold (row 8 in
Table 24) and dividing it by the 2005 USD to MZN exchange rate (row 16 in
Table 24). The average gain in income by one household (row 29, column 7)
from improved market information per household is 3.13 USD over each main
marketing season using data for 2002 and 2005. This figure is considered as the
benefit of searching market information by an average household in 2002 and in
2005. This gain from information search is about 1% of the estimated average
gross total income of the households in the sample in 2005 meticais which was

232
$361. It is also about 1% of the estimated average value of net total income of
households in the sample in 2005 meticais which was $319. This implies that an
average farmer can search for information as long as the search costs are less than
$3.13 in the principal marketing season of a year using 2002 and 2005 panel data.
• Row 30 in Table 25 estimates the average population gain in income by all
households that received information given that they sold maize in the 4 provinces
of Nampula, Zambezia, Sofala, and Manica. It is obtained by multiplying the
gain in income by one household (row 29) by the number of households that
received market information given that they sold maize (row 26 in Table 24). The
number of households that received information given that they sold maize (row
26) is estimated by multiplying the number of households in the 4 provinces (row
22) by the probability of growing maize (row 23) times the conditional probability
of selling maize given that a farmer grew maize (row 24) times the conditional
probability of receiving information given that a farmer sold maize (row 25). The
average population gain in income by all household that received information,
given that they sold maize (row 30, column 7 in Table 25) is estimated to be
766,748USD per year based on 2002 and 2005 panel data.
• This finding implies that an MIS whose investment cost is less than or equal to
766,748USD per year would be a profitable investment.
4.11.3 Costs, Cost-Benefit Ratios, and Sensitivity Analysis on Search Modes
Table 26 shows the cost of searching information using three methods: (1) radio, (2) cell
phone, (3) word-of-mouth through meetings, and (4) a combination of the three methods.
Search costs are divided into several information search combos, each consisting of (a)
233
Radio using Pair of D Batteries (PDB), (b) Cell Phone Minutes (CPM) and SMS, and (c)
unlimited meetings. The fixed costs of buying a radio and a cell phone are considered as
sunk costs. Although two-month estimates are given, the one-month search period is
more consistent with the reality of maize marketing in rural Mozambique because sample
data, 78 percent of households sell during the 4 peak marketing months and 64 percent of
farmers sell most of their output in one transaction.
Sensitivity analysis of the cost-benefit analysis can be conducted on many
parameters which can change, such as number of minutes used to call for information
search, number of SMS sent for information search, cost of calling using cell phones, cost
of SMS, number of pairs of batteries, cost of batteries, exchange rates, quantities
produced, and price received. Table 26 incorporates sensitivity analysis of parameters
that can rapidly change in the short run (4 peak marketing months) and on which the
farmer has considerable influence in the short run, such as number of minutes called,
number of SMS used, pairs of batteries used in radios, and number of months in which
search is conducted. Table 27 presents sensitivity analysis on quantity of maize sold.
Sensitivity analysis is not conducted on parameters that may not change in the short run,
such as quantity of maize produced (implying inelastic supply in the short run) or those
that are relatively out of the influence of the farmer such as cost of calling using cell
phones, cost of SMS, exchange rates, and cost of type D batteries.
• Row 31 shows the search cost of a farmer who uses one pair of type D batteries (1
PDB) per month to listen to information via radio for one and two months. It is
obtained by dividing the cost of a pair of type D batteries (row 9 in Table 24) by
the USD exchange rate to the MZN (row 16) times the number of months. The

234
estimated cost of searching using radio is $1.30 per month and $2.60 for 2
months. This row shows that the cost of searching using only a radio which uses
one pair of D batteries for one or two months is less than the marginal benefits of
receiving information in a season for an average farmer which are $3.13 per year
(row 29, column 7).
• Row 32 shows the search costs of a farmer who makes three to six cell phone
minutes and sends two SMS (3 to 6 CPM, 2 SMS) to search for information for
one and two months. Although a farmer can use one SMS for search, the analysis
in this study uses a minimum of two SMS so that the analysis is comparable to
one of the current SMS based MIS-the ZNFU 4455 SMS MIS. To use the ZNFU
4455 SMS MIS, a user has to use at least 2 SMS plus a phone call of an
unspecified duration. Details of how the ZNFU 4455 SMS MIS works are
included in section A.4.2 in APPENDIX A. Row 32 is estimated as the sum of
the cost of making a cell phone call times minutes used (row (12) x number of
CPM) and the cost of sending an SMS times the number of SMS sent (row (15) x
number of SMS), all divided by the 2005 USD exchange rate to the MZN (row
16). The following can be observed and deduced from this row:
o The estimated cost of searching using three cell phone minutes and two
SMS (3 CPM, 2 SMS) is $1.06 per month and $2.12 for 2 months. The
estimated cost of searching using four cell phone minutes and two SMS (4
CPM, 2 SMS) is $1.36 for one month and $2.72 for two months. This
implies that the costs of searching for information via cell phone are lower
than those of searching using radio only when a farmer uses at most three

235
minutes of voice and two SMS. At the fourth minute, using a cell phone is
more expensive than using a radio which uses one pair of type D batteries
to search for information. A caveat about the quality or relevance of the
information received from the two different sources is given here. The
comparison in this paragraph assumes that the information delivered by
radio is equally valuable to the farmer as the information delivered by
SMS. On the one hand, it is likely that a “pull” SMS system potentially
allows the provision of information targeted much more to individual
users’ needs than a radio program. On the other hand, SMS information is
highly restricted to each crop per message compared to a radio, which can
be used to receive information for more than one crop and more than price
information at no additional cost (e.g., in a market information radio
program).
o The estimated cost of searching using five minutes of a cell phone call
and two SMS (5 CPM, 2 SMS) is $1.65 for one month and $3.31for 2
months. The cost of searching using 10 minutes of voice and 2 SMS (10
CPM, 2 SMS) for one month is $3.13, and that of using 11 cell phone
minutes and two SMS (11 CPM, 2 SMS) for one month is $3.42 (not
included in Table 26). This implies that the cost of searching using only a
cell phone for 10 minutes of voice and 2 SMS (10 CPM, 2 SMS) is the
upper break-even limit for an average farmer. Beyond this break-even
limit, the search costs exceed the marginal benefits (estimated to be

236
$3.13—see row 29, column 7) of receiving information per season for an
average farmer.
• Row 34 is the sum of the three search modes in row 31, row 32, and row 33. The
estimated cost of searching using combination (“combo”) 1 (1 PDB, 3 CPM, 2
SMS) is $2.36 per month and $4.73 for 2 months. The estimated cost of
searching using combo 2 (1 PDB, 4 CPM, 2 SMS) is $2.66 per month and $5.32
for 2 months. The estimated cost of searching using combo 3 (1 PDB, 5 CPM, 2
SMS) is $2.95 per month and $5.91 for 2 months. The estimated cost of
searching using combo 4 (1 PDB, 6 CPM, 2 SMS) is $3.25 per month and $6.50
for 2 months. This implies that a farmer can feasibly use combo 1 to combo 3 for
only one month because their costs are lower or equal to the benefits from search.
• Row 35 is the cost-benefit ratio of information search. It is obtained as the ratio
of cost of searching using any of the search combos 1 to 4 (row 33) over gain in
income by one average household (row 29, column 7). A cost-benefit ratio less
than or equal to one means the information search combo is profitable while a
ratio that is greater than one means it is not profitable. With respect to the cost-
benefit ratios, “profitable” means that the average gain in income by one
household in USD is greater than or equal to the search costs using radio, cell
phone, and meetings. Therefore, combos 1 to 3 for one month are profitable
because their costs are lower than or equal to the benefits from search.
• Combo 5 (2 PDB, 3 CPM, and 2 SMS) is not profitable because it uses two pairs
of batteries, which raise the search costs to $2.60 from radio in addition to 3
237
minutes of voice and 2 SMS. Combo 6 (1 PDB, 3 CPM, 5 SMS) and combo 7 (1
PDB, 3 CPM, and 10 SMS) are profitable for only one month of search.
In summary, Table 26 shows that the break-even information search
combinations for an average Mozambique maize farmer (defined as one who on average
sells about 214 kilograms of maize) are combo 1 to combo 3 for one month, which
involve: (1) listening to a radio that uses one pair of type D batteries a month (1 PDB);
(2) placing at most 5 cell phone minutes (5 CPM) and two SMS price requests (2 SMS);
(3) attending meetings with neighbors, friends, relatives, traders, and extension and NGO
workers in the village; and (4) any combination of all three search modes in the main
maize marketing season which lasts between June to September. There is another
important caveat that is placed on this analysis. The analysis calculates benefits only on
sales of maize. To the extent that getting market information on other crops is
complementary to getting information on maize (e.g., listening to the same radio
broadcast that reports both maize and beans prices) and that market information also
increases the average price received of other products, then the model underestimates the
benefits of market information relative to the costs.
Combos 6 and 7 also break-even for one month only. Combo 7 (a superset of
combo 6) involve (1) listening to a radio that uses one pair of type D batteries a month (1
PDB); (2) using 3 cell phone minutes (3 CPM) and at most 10 SMS price requests (10
SMS) per month; (3) attending an optimal number of meetings with neighbors, friends,
relatives, traders, and extension and NGO workers in the village; and (4) any
combination of all three search modes during the 4 peak marketing months. Beyond

238
these search combos, the cost of search would be higher than the marginal benefits of
search. The caveat in the previous paragraph also applies to this paragraph.
From the cost benefit analysis, it is difficult to determine whether the use of radio
to diffuse market information to smallholder farmers is more effective and efficient than
the use of cell phones and vice versa. This is because of: (1) the difficulty to accurately
disaggregate the quality or relevance of the information received from radio and cell
phones (voice and or SMS); and (2) due to the complementarities of the benefits of
getting information on one crop (e.g., increase in average price of maize) on the increase
of the average price received of other products (e.g., beans and groundnuts), which
potentially leads to underestimating the benefits of market information relative to the
costs. In this study, effectiveness is defined as impact (e.g., increase in income) per
person times the number of stakeholders (i.e., aggregate magnitude of impact receiving
information); and efficiency is defined as effectiveness divided by total costs in terms of
money and time (i.e., impact or gain per dollar of cost) (Axinn and Axinn, 1997).
The use of meetings (e.g., between NGO and extension workers and farmers) to
diffuse information is not monetarily costly to farmers over the current range of meetings
attended, as it is using radio and cell phones. The use of meetings to diffuse information
to farmers, however, is costly to governments and external donors.
Another implication of this analysis is the potential role of group action in
lowering the cost of information acquisition. For example, in Zambia, many villages
have women’s “listening clubs” where women get together to listen to a radio program
together and then discuss it. When a group owns a cell phone or a radio and uses it to
search for information, the cost per person of getting market information drops

239
dramatically than in the individual action used in the estimates of information search in
Table 24.
4.11.4 Sensitivity Analysis on Quantity Sold
Table 27 conducts a sensitivity analysis based on different values of quantity of maize
sold by farmers. Row 41 includes the minimum, quartiles, maximum and means of
quantity sold by households in the sample. Row 42 is the average marginal percentage
price gain per kilogram due to information from the econometrics analysis and explained
in first bullet in section 4.11.2. Row 43 is the average marginal price gain (information
premium/ rent) per kg in 2005 meticais and is explained in the second bullet in section
4.11.2. Row 44 is the average gain in income by one household that sold quantities of
maize included in row 41 in USD. It is obtained by multiplying the average information
rent (row 43) by the quantity sold (row 41) and dividing it by the 2005 USD to MZN
exchange rate (row 16 in Table 24). Assuming a fixed per kilogram gain, this row shows
that gains from information increase with level of market involvement by farmers. In
other words, more-commercialized farmers obtain higher gains in income due to
reception of information than do less-commercialized farmers.
Row 45 in Table 27 estimates the average population gain in income by all
households that received information evaluated at the average quantity sold. It is
obtained by multiplying the average gain in income by one household (row 44, column 7)
by the number of households that received information given that they sold maize (row
26 in Table 24).
Row 46 shows the break-even search strategy in terms of number of pairs of type
D batteries to buy to listen to information via radio for one month so as not to exceed the
240
average gain in income by one household (i.e., in order for the search strategy to be
break-even). It is the quotient obtained from dividing the average income gain (row 44)
by the cost of a pair of type D batteries ($1.30).
Row 47 shows the cost of the break-even PDB. Row 48 shows the cost-benefit
ratios assuming the cost of the indicated number of PDB and the average income gains
for each level of quantity sold. It shows that the break-even search option for a farmer
who sells less than or equal to 50 kilograms of maize is not to buy type D batteries, while
farmers who sell more than 50 kilograms of maize can afford search using a radio that
uses at least one pair of type D batteries. The break-even search costs (row 47) should be
less than the average gain in income by one household (row 44).
Row 49 shows the break-even search strategy in terms of cell phone minutes and
2 SMS used in search for market information for one month so as not to exceed the
average gain in income by one household (i.e., in order for the search strategy to be
break-even) It is the quotient of obtained by dividing the difference between the average
gain in income by one household (row 44 x rows 16) minus the cost of obtaining two
SMS (2 x row 15) by the cost of cell phone call (row 12).
Row 50 shows the cost of the break-even cell phone minutes (holding SMS at 2)
that can be used from the average income gains for each level of quantity. Row 51 shows
the cost-benefit ratios assuming the cost of the indicated number of cell phone minutes
and SMS for each level of quantity sold. It shows that the break-even search option for a
farmer who sells at least 50 kilograms of maize is to use one cell phone minute and 2
SMS. The number of break-even cell phone minutes increases with quantity of maize
sold.
241
This sensitivity analysis shows that stronger demand for information is likely to
be among more commercial farmers than the less commercial ones. This is important
and conceptually consistent with section 2.3.8, which states that some users have no
effective demand for information because they have a small level of market involvement.
Furthermore, based on the ICT used to diffuse information in section 3.7.2, it would
appropriate for small-scale farmers to put pressure on government to help support MIS
that target less commercial farmers, while more commercial farmers seek information
from MIS that mostly use modern ICT, notably cell phones, to disseminate information
such as ZNFU 4455 SMS MIS. Farmers pressuring government may entail the implicit
or explicit threat not to vote or re-elect leaders unless they provide services, including
market information.
4.11.5 MIS Operational Costs in Mozambique
Table 28 shows the total operating costs in SIMA at the national level and in two
SIMAPs in Nampula and Manica Province in 2002. The table shows that in 2002, the
total operational costs of the system (SIMA and the two SIMAPs), including staff
salaries, communication and transport, were around 3.3 billion meticais, or US$130,000
(Mabota, et al., 2003). Based on the number of households that reported receiving
improved market information from the TIA (2002), Mabota et. al. (2003) estimated that
the national average operational cost of providing market information to each rural
household was 2,267 meticais, or about US$0.09.
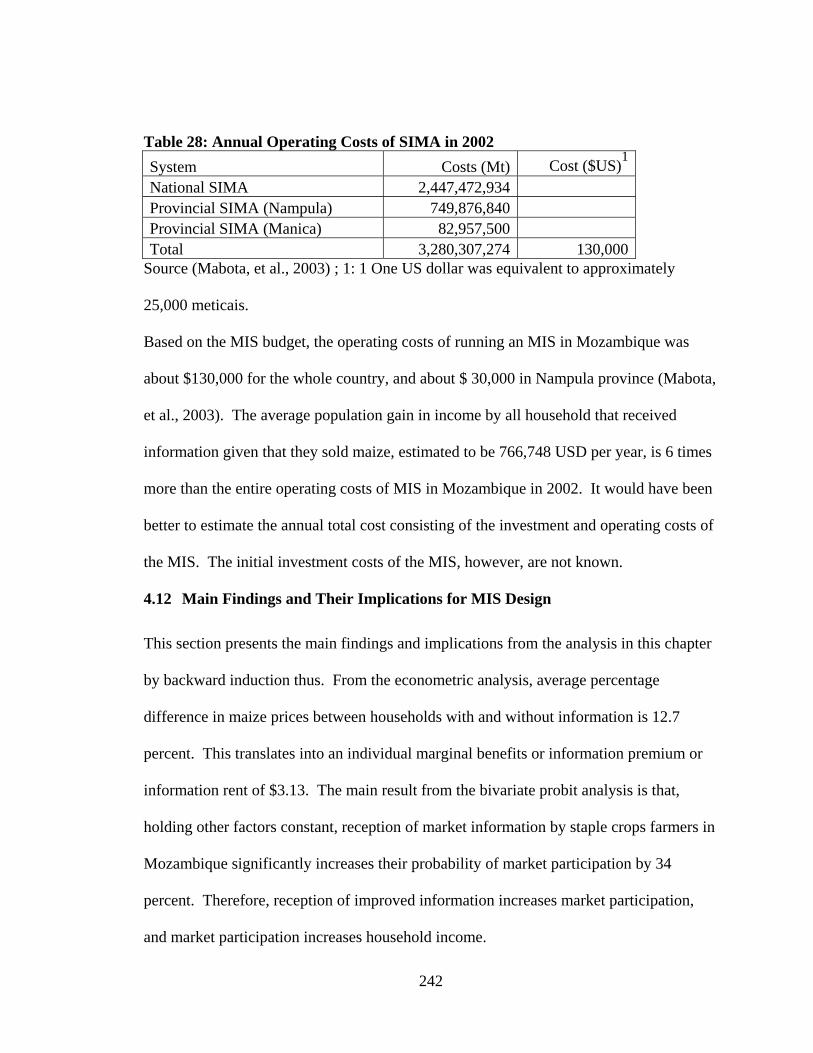
242
Table 28: Annual Operating Costs of SIMA in 2002 System Costs (Mt) Cost ($US)1 National SIMA 2,447,472,934 Provincial SIMA (Nampula) 749,876,840 Provincial SIMA (Manica) 82,957,500 Total 3,280,307,274 130,000
Source (Mabota, et al., 2003) ; 1: 1 One US dollar was equivalent to approximately
25,000 meticais.
Based on the MIS budget, the operating costs of running an MIS in Mozambique was
about $130,000 for the whole country, and about $ 30,000 in Nampula province (Mabota,
et al., 2003). The average population gain in income by all household that received
information given that they sold maize, estimated to be 766,748 USD per year, is 6 times
more than the entire operating costs of MIS in Mozambique in 2002. It would have been
better to estimate the annual total cost consisting of the investment and operating costs of
the MIS. The initial investment costs of the MIS, however, are not known.
4.12 Main Findings and Their Implications for MIS Design
This section presents the main findings and implications from the analysis in this chapter
by backward induction thus. From the econometric analysis, average percentage
difference in maize prices between households with and without information is 12.7
percent. This translates into an individual marginal benefits or information premium or
information rent of $3.13. The main result from the bivariate probit analysis is that,
holding other factors constant, reception of market information by staple crops farmers in
Mozambique significantly increases their probability of market participation by 34
percent. Therefore, reception of improved information increases market participation,
and market participation increases household income.

243
From the econometric analysis, the study finds that the generic factors that
influence the reception of improved agricultural market information include (a) growing
maize, large and small groundnuts; (b) owning a radio; (c) presence of a cell phone
network in the village; (d) membership to farmer association; (e) access to extension
services; (f) proximity to a road with public transport; (g) the distance to village
administrative post; (h) level of education; and (i) the agro ecological zone in which the
households is located.
These findings lead to the following question: how can the reception of improved
agricultural market information be increased among users so that they participate in
markets and increase their household income (i.e., so that they obtain an information
premium)?
a) The MIS provides information on major marketable staples. Higher reception of
market information, and hence higher market participation and increased
household income, can be achieved when the MIS provides more information on
the major marketable staples such as maize, groundnuts and common beans.
b) MIS prioritize radio as important diffusion channel of market information. Higher
reception of market information, and hence higher market participation and
increased household income, can be achieved when the MIS make radio an
important diffusion channel.
c) Making cell phones an important diffusion channel. The reason for this is the
same as the one given in (b) above. This option, however, is likely to benefits
more commercialized farmers who are likely to afford to purchase cell phones and
to buy airtime to use in search than the less commercialized ones.
244
d) Making associations an important MIS clientele. It is important for MIS to
consider associations and farmer groups as important clientele of MIS for the
same reason given in (b) above. It is not clear, however, what percentage of
poorer farmers in Mozambique have a high voice and are active participants in
farmer association’s activities that can make them benefit from increased
reception of market information as are less-poor farmers.
e) Making extension an important MIS clientele: The implications are that the
benefits from investing in MIS can significantly increase when the MIS provides
more information to extension workers and NGO workers to disseminate to users.
f) The econometric analysis also indicated that distance to the nearest road with
public transport, distance to village administrative post, a household head
receiving between one to four years of education, and the agro ecological zones in
which a household is located affects reception of market information. These
factors imply that information is useful when users can act on it and that
information is complementary with other government programs and policies such
as infrastructure development and investment in education. For example, some
types of information (e.g., higher prices in distant markets) are more useful when
farmers can transport their produce to markets on good feeder roads. Some types
of improved market information (e.g., favorable or unfavorable price and quantity
forecasts) are more useful when farmers can respond and produce more or less
based on their agro-ecological conditions. Some types of improved market
information (e.g., those diffused through newspapers, bulletins, SMS, television,
and billboards) are useful when farmers have formal education to gain the

245
capacity to read and write, and consequently the capacity to search and use
written market information. The capacity of the MIS, however, to influence these
factors is limited, since they depend on resource available to governments and
donors and their opportunity costs. If resources were available, and governments
and donors invested in these complementary services (e.g., universal education—
including adult education—and improvements in feeder road infrastructure), then
the results in the econometric analysis indicate that more households are likely
receive improved market information.
The cost-benefit analysis shows that demand for information is likely to be
stronger among more commercial farmers than the less commercial ones. Furthermore,
the cost-benefit analysis shows that information search using radio and cell phones is
affordable to more commercialized farmers than it is to less commercialized farmers.
The main questions are: (1) how can the search costs be lowered so that more households
(especially the less commercialized farmers) receive information? (2) What actions are
likely to increase the potential payoff of investing in improved agricultural market
information systems?
1) Increase competition in the information and communication sector:
a) License more radio providers to increase competition among radio stations. This
is likely to further bring down the costs of market information radio programs,
and thus increase the capacity of MIS to pay for radio airtime so as to disseminate
more information to the 52 percent of households that own radios. Also, as
competition increases among radio stations, they are more likely to sponsor
246
market information radio programs as they compete for listenership as is the case
in high-income countries.
b) License more cell phone providers to increase competition in the communication
sector, which in the long run lowers communication and search costs. As search
costs lower, more users are likely to receive information and the payoffs from
receiving market information are likely to increase.
c) From the cost-benefit analysis, it would be appropriate for small-scale farmers to
put pressure on government to help support MIS that target less commercial
farmers, while more commercial farmers seek information from MIS that mostly
use modern ICT, notably cell phones and the internet, to disseminate information
such as ZNFU 4455 SMS MIS or Esoko in Ghana.
d) Subject to resource availability and their opportunity cost, stakeholders with
effective demand for information (e.g., governments and donors) could subsidize
information for less commercialized farmers and small-scale traders who own
radios and cell phones by paying the MIS to provide information to users with no
effective demand for information. This would be through administrative funding
as explained in section 2.4.1 where the government uses taxpayers’ or donor
money to fund MIS activities; or through a combination of administrative and
donor funding and private effective demand as explained in section 2.4.2. In
both options, the provider can be a public-, private-, farmer organization-, trader
organization-, or and NGO-based MIS.
2) Promotion of marketing associations and group marketing: The econometric analysis
shows that a household head belonging to farmer associations significantly increases

247
the probability of reception of market information. Group marketing also enables
farmers to amalgamate their produce to attain higher volumes. The implication is that
there is need to encourage farmers to form or join marketing associations and to
market in groups, which is likely to increase reception of market information.
Another implication from the cost-benefit analysis is the potential role of group action
in lowering the cost per person of information acquisition. When a group owns a cell
phone or a crank radio and uses it to search for information, the cost per person of
getting market information reduces.
3) Moreover, from the cost-benefit analysis, the use of direct approaches of diffusing
information to farmers such as through meetings with extension and NGO workers is
not monetarily costly to farmer over the current range of meetings attended by
farmers, although costly to governments and external donors. This means that subject
to resource availability and their opportunity cost, donors and governments could
support more diffusion of information using these direct approaches, especially to
poor farmers without effective demand.
4) Another implication from the sensitivity analysis on quantity sold is that stronger
demand for information is likely to be among more commercial farmers than the less
commercial ones. More commercialized farmers are likely to afford search and to
gain more information rent than do the less commercial farmers. Marketing as a
group would be as if farmers are getting more commercialized in gross terms
(marketing higher volumes), and thus getting better pay offs from market information
than when they sell individually which represents a small level of market
involvement.

248
4.13 Limitations of the Study and Areas of Further Research
Market information is highly covariant with other explanatory variables because
improvements in the provision of improved market information have often gone hand-in-
hand with other market reforms and other investments that are not controlled for in this
model. This suggests that some of the attribution of the returns to market information
found in this chapter may be attributable to a whole package of actions rather than just
market information separately.
Due to data limitations, the models of reception of information, market
participation, and prices of maize received consider only recipients of information as
sellers (producers), but not buyers (traders and consumers). This means that the marginal
effects of reception of information are under-estimated since they are computed based on
selling decisions by producers only. Also, the model of prices received is estimated for
only maize, yet there are many other staple crops grown and sold in Mozambique on
which the MIS disseminate market information. This was because the sample sizes of
other commodities were small compared to maize which could lead to loss of degrees of
freedom if a system of questions where to be used. This also underestimates the effects
of reception of information on the production and marketing decisions of farmers
(producers).
The models limit themselves to only the first round effects of information
reception on market participation and prices received and do not estimate the general
equilibrium effects (e.g., the effects of reception of information on crops grown or area
planted) and the second order effects resulting from reception of market information.
Taking these general equilibrium effects into account would, however, require much
249
more data than were available for Mozambique and bigger multimarket models e.g., CGE
models, which were beyond the scope of this study.
The reverse loop of the effects of market participation on the reception of market
information is not estimated, although the endogeneity problem is dealt with by use of a
bivariate probit model. This is identified as an area of future research. Also, in the
future, the models could be estimated in the “differences”, to look at how changes in
explanatory variables affect changes in reception of market information, market
participation, and prices received. Also, econometric models can be run to determine the
effects of reception of market information among farmers on (1) area cultivated, (2) crops
grown, (3) temporal arbitrage behavior, (4) frequency of transaction, (5) spatial arbitrage
behavior, and (6) choice of forms of vertical coordination. Also, future studies could
look at the effects of seasonality on the effect of prices received and demand for
information.
250
5 SUMMARY, CONCLUSIONS, AND AREAS FOR FURTHER RESEARCH
This chapter synthesizes the whole dissertation. It presents (1) the links between the four
chapters and the appendices; (2) the consistencies and inconsistencies between
conceptual issues and analysis results; (3) the key messages and future research
questions; and (4) the key policy and operational implications of the findings.
5.1 The Links between Chapters
Chapter 1 presents the main set of questions this dissertation attempts to answer. These
are the following:
1. What evidence is there that supports the premises that second-generation
agricultural Market Information System (MIS) models are likely to meet user
needs and become financially sustainable relative to first-generation models?
2. How have different MIS models tried to address the generic design issues of any
MIS and what are the relative advantages of different models of MIS in
addressing those challenges?
3. What factors affect the reception of improved agricultural market information
among smallholder farmers in Mozambique; and how does reception of improved
agricultural market information affect their marketing behavior?
Chapter 2 presents key concepts in the economics of information and their
implications for MIS design and impact. This chapter describes the role of MIS in
agricultural marketing and identifies the economic theory through which information
affects market performance. This theory drives the conceptual and analytical frameworks
used to shape the analysis in chapter 3 and to analyze the performance of MIS among

251
sellers in chapter 4. Chapter 2 also gives the characteristics of information that affect its
demand and supply. These characteristics are used to draw the implications for funding
and impact of MIS at the end of the chapter. Chapter 2 also presents the environment in
which MIS operates. These environment features are used in the analysis of generic
structural and conduct design issues that face any MIS presented in chapter 3; and also in
the analysis of the effects of receiving improved agricultural market information on the
marketing behavior of farmers in Mozambique conducted in chapter 4.
Chapter 3 presents a cross-country synthesis of case studies that examines the
premises that gave rise to the second-generation MIS models and how they deal with the
generic design issues of any MIS relative to the first-generation MIS models, which are
the first two research objectives of the dissertation given in chapter 1. Chapter 3 also
looks at the MIS performance from the providers’ side (i.e., the MIS side), focusing on
the generic structural and conduct design issues facing any MIS. The link between
chapter 3 and 2 are the environment features in which MIS operates identified in chapter
2. The link between chapter 3 and APPENDIX A is that chapter 3 synthesizes the
information needs of stakeholders and experiences of current and emerging MIS models
presented in detail in APPENDIX A.
Chapter 4 analyzes the effects of receiving improved agricultural market
information on the marketing behavior of farmers in Mozambique. This chapter looks at
the performance of the MIS among one group of users—the sellers. There are two links
between chapter 4 and chapter 2 . The first link is in the economic theory driving the
analysis in chapter 4. The second link is the way the environment features in which MIS
operates given in chapter 2 affects users to receive and act on information.

252
The link between chapter 3 and 4 is that when MIS perform well by providing
information that meet users’ needs when they address their generic structural and conduct
design issues (analyzed in chapter 3), then their good performance translates into more
reception of improved market information by users (analyzed in chapter 4). Reception of
improved agricultural market information by users in turn improves market performance
among users. The impact of information on market performance is measured in chapter 4
as the changes in individual-household prices received by sellers. The link between
chapter 3 and 4, however, is subject to the roles of MIS in agricultural marketing, the
characteristics of information that affect its demand and supply, and the environment in
which MIS operates identified in chapter 2.
5.2 Consistencies and Inconsistencies between Conceptual Issues and Analysis
Results
Many findings in the study illustrate, reinforce, or contradict the conceptual issues
developed in chapter two about the role of improved market information in agricultural
markets; and about the environment features that affect structure and conduct of MIS
analyzed in chapter 3, and on the impact of MIS analyzed in 4. Some of the conceptual
issues were not tested due to lack of data or due to the measurement difficulties.
In chapter four, the main findings based on the econometric analysis are that (1)
market information increases market participation, and (2) increases household in
income—a welfare gain—among sellers. These results are consistent with the
observation that providing improved agricultural market information helps to link farmers
to markets, improves their welfare, and moves them to more efficient market outcomes,
as stated in the economic theory driving the analysis in the dissertation in chapter two.
253
It is shown in chapter four that several environment features identified in chapter
two actually affect the reception of improved market information. These include macro-
economic indicators (e.g., the level of transportation and conditions of feeder roads and
availability of sufficient electricity), social-economic characteristics (e.g., literacy and
education levels), agro-climatic conditions (e.g., agricultural potential in agro-ecological
zones), the level of ICT usage in a country (e.g., the ownership of a radio and presence of
a cell phone network in the village), and the geographical setting (e.g., provincial
dummies).
Also, the SCP analysis illustrates and reinforces several of the conceptual issues
in the environment features that affect MIS performance on the supply side (i.e., MIS
performance) and on the demand side (i.e. reception or demand for information among
users). For example, the results in SCP illustrate that the increase in the availability and
usage of cell phones in sub-Saharan countries was a major factor in contributing to the
start of many private, farmer organization- and NGO-based MIS. Other environment
features that affect performance include macro-economic indicators (e.g., availability of
storage and credit facilities), social-economic indicators (e.g., farmer voice), vertical
coordination forms and price discovery methods used in the market (e.g., information as a
byproduct from exchanges vs. spot markets on accuracy, timing, and sustainability of
MIS), cultural factors (e.g., the lack of trust by farmers in the information provided by
traders, and the many languages that affect dissemination costs), and lack of effective
demand (e.g., money to buy airtime and radio batteries and low levels of market
involvement) are discussed in the qualitative analysis in chapter three.

254
Some of the environmental features were not tested in the SCP analysis and in the
econometric model due to lack of data or due to the difficulty to measure them (e.g., in
the context of panel data where some government policy indicators do not vary across
observations in the sample). For example, some government policies (e.g., regional trade
and food price regulations), macro-economic indicators (e.g., inflation, interest rates,
GDP from agriculture, and employment levels), indicators of infrastructure availability
(e.g., physical market infrastructure, availability of storage facilities and availability of
credit facilities) are not included in the econometric model. Some of the results were
counter-intuitive or contradict the conceptual issues. For example, one contradiction of
the environment features observed was that availability of electricity in the village
reduced the reception of market information. Subject to data availability, future research
could include more macro-economic and social indicators that were not included in this
analysis in order to measure their effects on reception of market information.
5.3 The Key Messages and Future Research Questions
This study identifies two key issues that need further research. These are (1) the
incentives problems among government-based MIS and their potential solutions; and (2)
the role of market information in linking producers and consumers to markets, how MIS
improve producer and consumer welfare, and how they contribute to more efficient
outcomes for both producers and consumers.
• Incentives: The study finds that government MIS often lack “high-power incentives”
to motivate their employees (e.g., low staff salaries, fixed staff salaries, excessive
bureaucracy, and their reliance on behavioral monitoring instead of output-based
monitoring). There is need for further research that can identify ways of increasing

255
the incentive structure within public MIS. Examples of researchable questions
include: (a) How are contracts between non-government MIS and their staff,
information providers, and disseminators (e.g., radio stations, cell phone companies,
and data companies) structured to reduce the key internal principal-agent issues
within the MIS? And (b) can the structure of contracts in non-government MIS be
adopted by government MIS?
2) Linking farmers to markets and efficiency in market outcomes: The study was
not able to measure the magnitude of welfare transfer from consumers (buyers) to
sellers and vice versa. Therefore, the main future broadened empirical research
questions are: (1) what factors affect the reception of information among sellers and
buyers? (2) How does reception on market information affect market participation
and prices received by sellers and those paid by consumers? (3) What are the welfare
transfers from buyers to sellers or from sellers to buyers? (4) Under what conditions
does improved market information help different market participants the most? The
modeling in this future research, especially if using time series data, can include more
policy variables to measure their effects on the demand and impact of diffusing
improved market information.
5.4 Some Policy and Operational Implications of The Findings
The study also identifies some policy and operational implications for the design of
alternative MIS models. These include (1) the current lack by all African MIS surveyed
of price and quantity forecasts, customized analytical reports, and business reports; (2)
the choice of ICT used to diffuse information and its implications on who different MIS

256
serve best; (3) the projected mandate of MIS and implications for investment in public
MIS; and (4) the general market evolution and implications for alternative MIS design.
1) Forecast, analytical reports, and business reports: One of the findings in the study
is that most MIS do not provide price and quantity forecasts, yet many users express
need for this information. Also, none of the surveyed MIS provide business reports,
and most of the MIS do not provide analytical reports. For the few MIS that provide
analytical reports, they are not presented in a way that suits users of different skill
levels (e.g., a report that can be understood by a farmer vs. a report that can be
understood by a policy maker). There is need for further research and outreach to
assess (and develop) the capacity of MIS staff, local universities, and other research
institutions in sub-Saharan Africa to conduct and provide forecasts and to report them
in suitable ways to users of different skill levels and needs.
2) The choice of ICT used in diffusion and whom different MIS models serve best:
The results from the synthesis in chapter three indicate that the use of Wiki
approaches, where users can contribute information through internet and cell phone
updates, are not many in sub-Saharan Africa. Moreover, chapter four shows that the
use of mostly modern technology (cell phones and the internet) to search for
information is likely to directly benefit more-commercialized farmers, while the use
of traditional ICT methods (radio and direct meetings) is likely to directly benefit
more less-commercialized farmers. This implies that there is need to invest in MIS
that use both modern and traditional ICT for diffusion of information. Alternatively,
it is important for MIS that mostly use modern ICT to also use more traditional ICT

257
such as radio and direct meetings through extension staff and NGOs to diffuse
information to less-commercialized farmers.
3) Projected mandate of MIS and implications for investment in public MIS: The
mandate of MIS (especially for gathering information for making better policy
formulation, and for food security planning and monitoring), and hence their key
clientele (especially policy makers, donors, and poor farmers) is likely to increase in
the next 5 to 10 years due to the persistence of some of the environmental factors in
which the MIS operate. Some of these environmental factors include: (1) persistent
future price uncertainty; (2) persistent variance in inflation; (3) growing unpredictable
agro-climatic conditions; (4) lack of effective demand for improved market
information by some users; (5) the increase in regional, international and domestic
trade; and (6) the increased demand for processed foods as incomes in low-income
countries grow. This implies that there is need for governments to provide more
funding for MIS activities to monitor and provide information that will meet the
projected needs of users. Also, there is need for governments to provide more
funding to address the low incentives in public MIS so that they also help to address
some of these issues. Another thing to explore in the future is the scope for
contracting between the public sector and the private sector to provide such
information and analyses.
4) General market evolution and implications for alternative MIS design: The study
observes that increased commercialization, the evolution of markets (structure,
coordination, and price discovery methods), the spread of ICT, and changes in
government policies have implications for the design of future MIS models in the

258
next 5 to 10 years. For example, what are the nature of current and likely future
contracts between MIS stakeholders (e.g., between farmers and traders) when markets
evolve (e.g., with increased sales volumes through emerging commodity exchanges,
or with more transactions conducted as private treaties and bilateral transactions
rather than through open spot markets?). Should MIS be housed in commodity
exchanges, where they can obtain information as a byproduct and therefore reduce
data collection costs? If so, how representative would such information be given the
current and likely future volume traded through commodity exchanges in sub-Saharan
Africa?

259
APPENDICES

260
APPENDIX A THE INFORMATION NEEDS OF STAKEHOLDERS AND
EXPERIENCES OF CURRENT AND EMERGING MIS MODELS
A. 1 Introduction
This appendix examines and synthesizes the unmet information needs of selected
stakeholders and the experience of current and emerging models for providing
agricultural market information in Africa, Asia and USA. Each model is analyzed with
respect to the following characteristics: (1) the organization’s perceived mandate (aims,
objectives, and clientele served); (2) information provided, frequency, and modes of
diffusion (including use of ICT); (3) data collection methods, (4) quality control methods;
and (5) the institutional home and links with policy analysts,(6) feedback mechanisms
from users (critical to determining whether and how the system evolves over time), and
(7) funding model for financial sustainability.
The rest of the appendix is organized as follows: Section A. 2 presents the
information received and information needed by stakeholders. Section A. 3 gives the
characteristics of public MIS. Section A. 4 presents the characteristics of farmer-
organization-based MIS. Section A. 5 presents the characteristics of private MIS.
Section A. 6 gives the conclusions from global review and cases studies. Section A. 7
presents the checklist used in the case studies for information providers and user in
Mozambique, Ethiopia, and Zambia. Section A. 8 gives the categories, organizations,
and location of providers and users interviewed during case studies in Mozambique,
Ethiopia, and Zambia. Section A. 9 presents the expanded tables of MIS characteristics.

261
A. 2 Information Received and Information Needed by Stakeholders
What are the remaining critical unmet information needs of key actors that still need to be
addressed? This section explores and illustrates the diversity of the information needed
by different MIS users in 7 countries in sub-Saharan Africa (Mali, Guinea, Senegal,
Niger, Mozambique, Ethiopia, and Zambia), in light of the rapidly changing nature of
product demands (increased focus on product attributes), evolving commodity mix,
broadening set of potential market outlets, shift in market structures towards more
integrated supply chains, and rapidly evolving production and information technologies.
The section discusses the types of information received and the channels/modes used to
obtain it. The section then analyzes the types of information needed by the users, how
frequently they need the information, and the preferred channels/modes of obtaining it.
A.2.1 Information Received and Needed By Users in Mali, Guinea, Senegal, and
Niger
Information from the West African countries of Mali Guinea, Senegal, and Niger was
obtained from (1) literature review of existing documents and (2) from an email
questionnaire send to the MIS. The information from the literature review was from a
surveys conducted by PROMISAM (Project to Mobilize Food Security Initiatives in
Mali) and aimed at understanding the information needs of wholesalers with the aim of
increasing regional trade in West Africa (PROMISAM_APCAM_MSU, 2008,
PROMISAM_OMA_MALI, 2008, PROMISAM_SENEGAL, 2008,
PROMISAM_SENEGAL, 2008, PROMISAM_SIMA_Niger, 2008,
PROMISAM_SIMA_Niger, 2008, PROMISAM_SIPAG_Guinea, 2008)

262
This study did not cover the information needs of other users such as farmers and
consumers.
Table 29 shows the unmet information needs of wholesalers in four main value
chains (cereals, horticulture, livestock, and fishing) in Mali and Niger in 2008. In the
table, B means that traders need the information for making buying or purchasing
decisions and S for making selling decisions. From the table, examples of information
not provided in include supply of commodities from the areas or markets of production or
origin, availability of means and cost of transport, prices in areas or markets of
production or origin, prices in national markets, prices in regional markers, potential
source of financing (credit), quality requirements by the various actors, information about
tenders from large-scale and institutional buyers, prices in markets of final destination,
demand forecasts in major markets, and demand in national and regional markets. Only
actors in the horticultural value chain needed information on prices, technical information
on certified seeds, and information on international prices to enable them make buying
decisions.

263
Table 29: Non-available but necessary information to facilitate purchases and sales among selected value chain operators in Mali and Guinea in 2008
Value chain Cereals Horticulture Livestock Fishing Other1 Country Mali Guinea Mali Guinea Mali Guinea Mali Guinea
Supply in areas (markets) of production (origin) B,S B,S B,S S B,S B,S S Availability of means and cost of transport S B,S B S B S B,S B,S Prices in areas (markets) of production (origin) B,S B,S B,S S B,S B,S Prices in national markets B,S B,S B,S B,S S Prices in regional markets B B B,S B B,S B B Potential source of financing (credit) B B B B,S B B,S Quality requirements by the various actors S B,S S B S B S Tenders from large-scale and institutional buyers B,S B B B B B B Prices in markets of final destination S S S B Demand forecasts in major markets S S S Demand in national and regional markets B B,S Supply on regional markets B B B Trade regulations in national and regional markets S S S Directory of traders in destination markets S B Prices and technical information on certified seeds B Prices in major reference markets B S Stocks in different levels of the value chains S S Supply in national markets B B Conservation techniques S Prices in international markets B Subsidized selling prices and food aid distribution S 1. Includes passion, tubers, onions, coffee and pepper; B=Buying (purchasing), S=Selling; Source:
(PROMISAM_APCAM_MSU, 2008, PROMISAM_OMA_MALI, 2008, PROMISAM_SIPAG_Guinea, 2008).

264
Table 30 shows that traders in Niger lack information on potential source of
financing (credit), prices in regional markets, stocks in different levels of the value
chains, and information on tenders from large-scale and institutional buyers to enable
them make buying as selling decisions. Table 32 shows that traders in selected value
chains in Senegal need information on prices in production areas, final destination
markets, and supply information in areas of production.
Table 30: Availability of information for making buying and selling decisions among traders in Niger, 2008
Available information
Needed Information by some traders
Information
Available to some traders
Importers and export:
Wholesalers and other market actors
Availability of means and cost of transport B,S B,S B,S Demand in national markets B,S Potential source of financing (credit) B,S Prices in markets of final destination B,S Prices in markets of origin B,S Prices in regional markets B,S Prices of products in markets B,S Stocks in different levels of the value chains B,S B,S Supply in national markets B,S Tenders from large-scale and institutional buyers B,S Appreciation (quantity or stocks??) of the countryside (in rural markers??) B,S B,S Trade partners B,S
B=Buying (purchasing), S=selling; Source (PROMISAM_SIMA_Niger, 2008)

265
Table 31: Information needed for effective planning of purchases and sales by traders in Senegal in 2008
Domestic
traders
Local and regional traders
Local, regional, international
Distribution of traders 50% 12% 38% Prices in areas of production B,S B,S B,S Prices in markets of final destination B,S B,S B,S Supply in the areas of production B,S B,S B,S B=Buying (purchasing), S=selling ; Source (PROMISAM_SENEGAL, 2008,
PROMISAM_SENEGAL, 2008)
From a synthesis of studies of market information needs among traders in 4 west African
countries of Mali, Guinea, Niger and Senegal, the following information was deemed
useful but not available for increasing transactions among traders: (1) the cost of
products on the internal (domestic) and external (regional) markets; (2) the quantity
supplied in domestic and external markets; (3) the quantity of produce demanded in
internal and external markets; (4) the directory of operators; (5) regulations relating to
trade facilitation and possible remedies; (6) information on quality standards and
services; (7) information need for certification to import or export produce; (8)
information on the various networks and support structures and their roles; (9)
information on availability and cost of transportation; and (10) institutional purchases.
For all categories of operators, the radio seems to be the preferred channel of diffusion
this information (PROMISAM, 2009). This may be related to the low level of literacy in
these countries.
From the same study of traders in West Africa, a part from price and quantity
information needs, traders identified other constraints that hamper the movement of
goods and services within and between countries, some of which can be reduced with

266
availability of improved market information. Some of these constrains include: (1)
multiple formal and informal checkpoints and charges on the roads (with the
accompanied harassment at some checkpoints); (2) lack of information of the paperwork
needed to cross boarders; (3) lack of information about access to credit and sources of
market information; (4) inadequate operator (traders) training (the topics on which traders
need training are not specified in literature); (5) non-functional trader organizations; (6)
poor condition of some roads; (7) insecurity on the roads; (8) poor and inappropriate
means of transport; (9) scarcity of means of transportation on certain routes; (10) the high
cost of transportation (high fuel costs); (11) ban of cross-border movement of
commodities in spite of the available rules on free movement of persons and property
across borders (unpredictable government regional trade policies) ; and (12) refusal to
grant export permits and certificates of origin in some countries (PROMISAM, 2009) .
Consumers in Mali: The information about the information needs of consumer
was obtained from a study on identification of information needs of consumers in Mali
(Kone, 1999). From a random sample of 360 consumers in the towns of Bamako, Segou,
Sikasso, and Mopti, the information needs to make decisions about what market to go to
by order of importance were: (1) price of commodities in the market, (2) distance to the
market, (3) quality products in the market, (4) quantity available in the market, (5)
accessibility to the market. Information needed to make the decisions on choice to buy
products in order of importance were: (1) product quality, (2) price, (3) quantity
available, and (4) the ease of storage of products. Radio and television were the desired
modes of delivery of this information to 57% of the consumers interviewed. Other
channels desired were newspapers, newsletters or magazines, and word of mouth (Kone,

267
1999). With the increase in ICT in Mali, it is likely that the preferred modes of
delivering this information have changed over time.
A.2.2 Information Received and Needed By Users in Mozambique
Characteristics of Some Information Users and Background Information
In Mozambique, information was collected from (1) literature review, and (2) case
studies. The case study interview focused on stakeholders in main grown and marketed
staple food crops consisting of maize, common beans, and large- and small-groundnuts
on which the MIS disseminates information. The researcher interviewed 5 MIS workers
in SIMAP in Nampula, 3 SIMA workers in Maputo, and 2 NGO/Private sector providers.
In order to have some assessment of how the information flows from SIMA and SIMAP
to MIS users, interviews were conducted with different categories of MIS users
consisting of 13 farmer group members, 2 farmer group leaders, 2 early warning and food
security analysis organizations officials, 4 food assistance organizations officials, 1
marketing organization official, 7 NGO personnel, and 8 traders from transit and general
merchandise markets. There was no random selection of case study respondents due to
the lack of a sampling frame that reflected the heterogeneity of the information users in
terms of their activities. Also, there was no time and financial resources to construct a
representative sampling frame of the heterogeneous information users.
Farmers: Focus group interviews were conducted with staple crop farmers in
Murupula District in the Northern Province of Nampula. Farmers in the visited district
are subsistence and mixed farmers who grow several crops. The most common
commodities grown in the area include maize, large- and small-groundnuts, and common
beans. Other crops grown include pigeon peas, cow peas, soybean, rice, cassava, cashew

268
nuts, sesame, and sweet potatoes. Vegetables such as onions, cabbages, and lettuce are
also grown. Farmers also grow sorghum for home consumption. Five of the farmers
interviewed sold an average of 250 kilograms of maize each. These characteristics
suggest that these were mostly subsistence farmers who sold their surplus output.
Nampula province is considered to be one of the most productive provinces in
Mozambique. It is not clear, however, from the volume of surplus output sold by farmers
that Murupula District is surplus or deficit zones nor whether these farmers are net buyers
or net sellers of the four staple crops.
Traders: In Mozambique, three main types of traders were interviewed: 1)
small-scale traders, 2) medium-scale traders, and 3) large-scale traders. Each category
has the following characteristics:
Small-scale traders operate mostly in assembly and general merchandise markets.
Assembly markets are characterized by many traders of several types of commodities
ranging from food items, electronics, and second-hand clothes. They are located in
relatively rural settings, have mostly temporary structures and some operate daily while
others operate weekly. General merchandise markets are also characterized by many
traders of several types of commodities such as food items, electronics, and second-hand
clothes. General merchandise markets are located in municipalities and cities, have more
permanent structures, and operate daily. Examples of a general merchandise market are
Mwatala and Mercedo de Matadouro in Nampula. Other common type of market is road-
side markets, usually located near junctions of feeder and main tarmac roads. These
road-side markets specialize in mostly perishable agricultural produce such as cabbages,
269
onions, sweet-potatoes, and cassava. Road-side markets have small-scale traders who
retail and those who wholesale agricultural products to traveling traders or truckers.
Small-scale traders usually sell less than ten 100-kilogram bags of maize and
beans in a week. They buy the commodities from nearby villages and transport it on
bicycles or pick-up trucks to the market for sale. Others buy the produce at the market
and sell to consumers in the very market. Some of the commodities such as maize are
delivered on trucks in small quantities (e.g., one or two bag) after offloading other
commodities in the market. Some small-scale traders sell their products, e.g., maize and
beans on open platforms (stalls) that are about 3 feet high, 4 feet wide and about 6 to 10
feet long. In some markets, there are no storage facilities and these traders cover the
remaining stock with a canvas in the evening. Many small-scale traders do not own cell
phones but can buy airtime and use a friend’s cell phone or the public telephone booth
when available. They do not use the internet or fax machines. Many did not know how
to use a cell phone to send an SMS.
Medium-scale traders wholesale maize, groundnuts, pulses, and other
commodities such as potatoes, beans, eggs, and onions. They operate in transit
agricultural markets and have access to storage facilities (kiosks or lock-ups) that they
rent monthly or pay for storage costs on a per-bag–per-day basis. Transit markets are
mostly wholesale markets, operate daily, are located in municipalities and cities, and
specialize in agricultural commodities. Examples of transit markets include Mercado da
Gorongosa in Nampula and a section of Xipamanine Market (inside the quadrangle) in
Maputo. Medium-scale traders have cell phones but do not have fax machines, email,
and internet connections.
270
Large-scale traders are more formal and have independent premises. They are
registered business entities with offices; they buy mostly cereal and pulses in bulk; and
have access permanent storage facilities, email, internet connections, fax machines, and
cell phones. Some large-scale traders buy from organized farmer associations; they can
export or sell to large millers. A few emerging large-scale traders are based in transit
markets. These large-scale traders have knowledge of other institutional buyers such as
WFP and NGOs, and have interest in receiving information about government
agricultural trade policies.
Information Received and Modes Used To Receive It in Mozambique
Table 32 shows the information received and modes used to receive information by users
in Mozambique. Farmer group leaders receive information on contacts of buyers and
sellers, retail prices and wholesale prices through email, websites, meetings, and
television.

271
Table 32: Information Received and Modes Used To Receive Market Information by Users in Mozambique
Information Received Farm
er
orga
niza
tion.
Farm
ers
Gov
’t
NG
O/ N
PO1
Trad
er
WFP
/Don
ors
Contacts of buyers and sellers X X Producer prices X Retail prices X X X X X XWholesale prices X X X X X XTime series data X XModes Used To Receive Market Information Email X X X X XWebsite X X X X XFax X X Hand delivery (Bulletin) X X X X XMeetings / Technicians X X X National radio X X X Rural radio X X X Telephone X X TV X X Source: Case study of Market Information Systems in Mozambique, Ethiopia, and Zambia from September to October 2009 under the MSU-FSG-Hewlett project on Strengthening African Regional Trade through Improved Market Information: Alternative Models to Provide Agricultural Market Information; X means information received or mode used by group of stakeholders. 1: NPO=Non-Profit Organization
Farmers receive information about contacts of buyers and sellers, retail prices and
wholesale prices via national radio Mozambique and rural radios. They also receive
information included in SIMAP bulletin via hand delivery and through meetings with
local and international organization NGO staff and extension workers, but the
information sometimes arrives two months late, and at that time it is not useful. Farmers
also receive information from indirect methods such as meetings friends, relatives, and
traders. Some of the farmers interviewed do not trust the information from traders
272
because they think that traders can give wrong information in order to buy at a lower
price. They stated that if they could receive the SIMAP bulletin regularly, they would
not use information from traders.
Government workers receive retail prices, wholesale prices, and time series data
through email, website, hand-delivery, telephone, and fax. NGOs and NPOs receive
retail prices and wholesale prices from SIMA through most of the channels consisting of
email, website, fax, hand delivery (bulletin), meetings, national radio, and rural radio.
Small-scale traders receive wholesale, retail, and producer prices from SIMAP and SIMA
through national and rural radios. Large-scale traders receive this information through
emails, websites, hand-delivery, national and rural radios, telephone and television. WFP
and donors such as the World Bank officials in Maputo receive weekly information on
wholesale and retail prices through email, and from the website at any time when needed.
They can also collect the time series data from SIMA by-hand (hand delivery) when the
SIMA email does not work.
Information Needed, Frequency Needed, and Preferred Modes of Diffusion in
Mozambique
Farmer group: Table 33 summarizes the information needs and the frequency at which
the information is needed as stated by the users interviewed in Mozambique during the
case studies. Some of the information some users stated that they need is actuary
provided by the MIS as will be noted later. Farmer group leaders need information on
contacts of buyers and sellers daily and weekly, and on quality needed by buyers
seasonally.

273
Table 33: Information Needed and Frequency Needed By Users in Mozambique in 2009
Information Needed Farm
er
org
aniz
atio
n
Farm
ers
Gov
ernm
ent
NG
O/N
PO
Trad
ers
WFP
/Don
ors
Contacts of buyers and sellers X X X X X Price forecasts and trend analysis X X X Stock in markets X X Quality needed by buyers X X Prices from markets not covered MIS X X Prices on horticultural products X Harvest or production forecasts X Harvest or production volumes X International prices X Producer prices X Regional prices X Supply and demand estimates in markets X X Transport costs X X X Production volumes X Volumes traded X Horticultural prices X Cross border trade flows X Storage techniques X Quantities (inventory ) with farmers’ associations X How to cultivate horticultural crops X Do not need more information from SIMA X Availability and number of traders buying X Need information on potential input providers X Frequency Needed Bi-annually X Daily XSeasonally X X X Weekly X X X X X XMonthly X As needed (on demand) XSource: Case study of Market Information Systems in Mozambique, Ethiopia, and Zambia from September to October 2009 under the MSU-FSG-Hewlett project on Strengthening African Regional Trade through Improved Market Information: X means information mentioned as needed by at least one stakeholder. Alternative Models to

274
Provide Agricultural Market Information; X means information mentioned as needed by at least one stakeholder. Farmers: Farmers need information on contacts of buyers and sellers, price forecasts and
trend analysis, quality needed by buyers, and harvest or production forecasts. Some
farmers stated they needed information on supply and demand estimates in markets, and
transport costs of produce from rural parts of the district to the city through monthly MIS
bulletins. Other information needed include storage techniques, and monthly information
on how to cultivate horticultural crops like onions and cabbages from April to September
on notice board at association offices. These preferred modes of receiving market
information were stated during the focus group discussions. Farmers would like SIMAP
to report the quantity (inventory) of produce they have in each farmer association so that
traders start to contact them for produce. This information would be like some sort of
advertisement to traders on where produce is available. The majority of stakeholders
indicated that they wanted to receive the information using the modes they are already
receiving the information included in Table 32 above.
Government: Some of the information needed by government policy makers and food
security analysis include price forecasts and trend analysis. They also need prices from
markets and districts not covered MIS. This information was needed seasonally and
weekly.
NGOs and NPOs (non-profit organizations): NGOs and NPOs need information on
contacts of buyers and sellers, stocks in markets, international prices of commodities, and
prices in neighboring provinces where their farmers can sell agricultural commodities.
They also need information on contacts of input providers, and the flow of products in
different areas in order to design better selling strategies. Market information is needed

275
more frequently during the marketing season than the production period, and they prefer
to receive it by email.
Traders: Small-scale and medium-scale traders in assembly-, general merchandise-, and
transit markets need information on contacts of buyers and sellers and stocks in markets,
price of commodities in markets not covered by the MIS, and regional prices. They also
need information on supply and demand estimates in the markets, cost of transport from
production area to towns, and cross border trade flows. Large-scale traders state that they
do not need any information from SIMAP because they have cell phones which they use
to call other traders for current information. Some private sector companies such as
SEVITEL (a private company trying to set up an SMS based MIS) would like to receive
prices of agricultural products, and places where the product is available on a daily basis,
and transport costs on a bi-monthly basis. It can access this information through the
internet or by email.
World Food Program (WFP) and World Bank: WFP needs market analysis and price
forecasts on a quarterly basis. It also needs information on contacts of buyers and the
price they buy at weekly. WFP would like SIMA to cover more markets in remote
districts where it is working, although it understands the financial implication of this
demand. WFP would like SIMA to gain capacity to monitor cross-border trade, an
activity currently being done by FEWSNET. This information is needed for food
security analysis, and WFP prefers to receive it by email weekly or as needed. The WFP
has in the past committed financial support to SIMA through the treasury. The World
Bank needs information on production volumes, volumes traded, and prices on
horticultural products.

276
A.2.3 Information Received and Needed By Users in Ethiopia
Characteristics of Some Information Users and Background Information
In Ethiopia, information was collected through (1) literature review and (2) a case study
visit to the Ethiopia Commodity Exchange (ECX) MIS section. Coffee, which is a cash
crop, was the main commodity traded on the exchange and on which market information
was being provided in 2009 when the case study was conducted. Therefore, the study
focused mainly on actors in the coffee subsector. The researcher interviewed 4 MIS
workers in the MIS section of the ECX. In order to have some assessment of how the
information flows from ECX to various users, 2 focus group discussions were conducted
with 10 coffee farmers in Leku Woreda (district) located around 38 kilometers south of
Hawasa, the main town in Sidama region. Leku Woreda is located in Sidama region, a
major coffee-producing region in Ethiopia. Hawasa town is about 260 kilometers south
of Addis Ababa. Other information users interviewed included 3 cooperative union
officials, 1 educator and researcher, 2 exporters, 2 central government policy makers
(officials), 1 journalist, 7 regional government officers, and 3 agricultural commodity
traders. There was no random selection of case study respondents for the same reasons
given under Mozambique—no sampling frame of the heterogeneous information users,
and limited time and money to create one.
Farmers: The farmers interviewed in Leku by the researcher were mostly
smallholder farmers, who on average sold 1,133 kilograms of unprocessed coffee each in
the 2009 marketing season (year) and were all members of service cooperatives. Other
crops grown in the area include inset (false bananas), maize, sweet potatoes, and chilies.
Most coffee farmers are members of service cooperatives. A group of service

277
cooperatives forms a union (union cooperative). The farmers sell unprocessed red coffee
cherries to service cooperatives and share dividends at the end of the year. The coffee
marketing channel in Ethiopian villages is concentrated in a sense that farmers mostly
sell to service cooperatives. Other individual traders may buy coffee from the farmers
but in designated buying centers in the presence of local government inspectors to ensure
that the coffee is not adulterated. This creates limited competition between the service
cooperatives and the private coffee traders.
Figure 2: Ethiopia Total Coffee Exports from 2000-2009 in '000 60 kg bags
The service cooperatives sell the washed coffee to the unions, and unions sell
coffee to ECX. In 2009, some unions could export specialty coffee without selling
through ECX. ECX buyers export high quality coffee and sell the rest on the local
market. Coffee is the biggest foreign exchange earner in Ethiopia. In 2009, Ethiopia
exported 1,851 thousand 60 Kg bags of coffee (see Figure 2), representing about 2
percent of the global coffee exports.

278
Information Received and Modes Used to Receive it in Ethiopia
Farmer organizations: Farmer organization leaders receive information on buying and
selling prices, grades and standards, international prices and traded volumes via
electronic billboards, email, fax, hand delivery, national radio, newspapers, television,
and website.
Farmers: In Ethiopia, farmers receive information on buying and selling prices, grades
and standards, and traded volumes via radio and television. Farmer who are near or visit
some urban centers can receive information via electronic billboards.
Government: Government employees receive more detailed and specialized categories
of information than other users. Government employees receive buying and selling
prices at ECX, exports and domestic sales, international prices, market participants
(number of buyers and sellers), regulations, traded volume, training about overview of
ECX, warehouse arrivals; and weekly-, monthly-, quarterly-, and annual reports. This
information is delivered via CDs, email, hand delivery, national radio, telephone,
television, and website.
Exporters and Traders: Exporters buy on the exchange to export and sell the rest of the
coffee to local processors for domestic consumption. Traders buy coffee and other
commodities such as spices and pulses from farmers and other small-scale traders and
sell on the commodity exchange (in case of coffee) and through other marketing
channels. Exporters and traders receive information on buying and selling prices at ECX,
grades and standards of coffee traded, international prices, regulations, and traded
volumes. Exporters receive information through electronic billboards, hand-delivery,

279
television, and websites. Traders receive information through electronic billboards, fax,
hand-delivery, national radio, telephone, and television.
Journalist: One journalist interviewed received information on buying and selling prices
at ECX, grades and standards, qualitative harvest or production forecasts, regulations,
traded volumes via email, hand delivery, telephone, and website.

280
Table 34: Information Received and Modes Used To Receive Market Information by Users in Ethiopia
Information Received Farm
er
orga
niza
tion.
Farm
ers
Gov
ernm
ent
Expo
rter
Trad
er
Jour
nalis
t
Buying and selling prices at ECX X X X X X XExports and domestic sales X Grades & standards X X X X XHarvest or production forecasts XInternational prices X X X XMarket participants (number of buyers and sellers) X Regulations X X X XTraded volume X X X X X XTraining about overview of ECX X Warehouse arrivals X Weekly, monthly, quarterly and annual reports X Modes Used To Receive Market Information Billboards (electronic) X X X X Data on a CD X Email X X XFax X XHand delivery X X X X XNational radio X X X XNewspapers X Telephone X X XTelevision X X X X XWebsite X X X XSource: Case study of Market Information Systems in Mozambique, Ethiopia, and Zambia from September to October 2009 under the MSU-FSG-Hewlett project on Strengthening African Regional Trade through Improved Market Information: Alternative Models to Provide Agricultural Market Information; X means information mentioned as needed by at least one stakeholder.
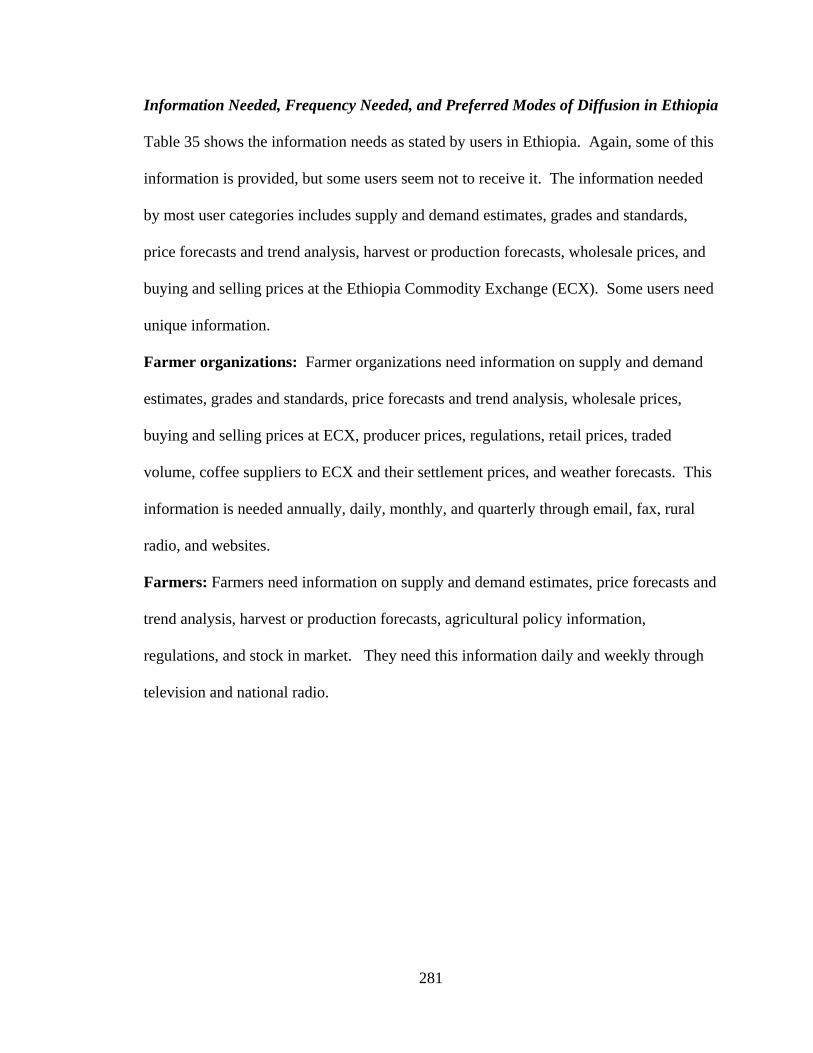
281
Information Needed, Frequency Needed, and Preferred Modes of Diffusion in Ethiopia
Table 35 shows the information needs as stated by users in Ethiopia. Again, some of this
information is provided, but some users seem not to receive it. The information needed
by most user categories includes supply and demand estimates, grades and standards,
price forecasts and trend analysis, harvest or production forecasts, wholesale prices, and
buying and selling prices at the Ethiopia Commodity Exchange (ECX). Some users need
unique information.
Farmer organizations: Farmer organizations need information on supply and demand
estimates, grades and standards, price forecasts and trend analysis, wholesale prices,
buying and selling prices at ECX, producer prices, regulations, retail prices, traded
volume, coffee suppliers to ECX and their settlement prices, and weather forecasts. This
information is needed annually, daily, monthly, and quarterly through email, fax, rural
radio, and websites.
Farmers: Farmers need information on supply and demand estimates, price forecasts and
trend analysis, harvest or production forecasts, agricultural policy information,
regulations, and stock in market. They need this information daily and weekly through
television and national radio.

282
Table 35: Information Needed, Frequency Needed, and Preferred Modes of Diffusion by Users in Ethiopia in 2009
Farm
er
org
aniz
atio
n
Farm
ers
Gov
ernm
ent
Expo
rter
Trad
er
Jour
nalis
t
Information Needed Supply & demand estimates X X X X XGrades & standards X X XPrice forecasts and trend analysis X X X X X XHarvest or production forecasts X X X XWholesale prices X X XBuying and selling prices at ECX X X XAgricultural policy information X X Buyers on the ECX X Producer prices X X Regulations X X Retail prices X XTraded volume X XCauses of poor quality in coffee X Coffee suppliers to ECX and their settlement prices X Commissions given by other coffee traders XCommitment of trade report (quantity sold, bought, prices) X Contacts of buyers and sellers X Exchange rates X International prices X Legal action taken by ECX against members X Market analysis and commentary X Marketing costs X Phytosanitary specifications XProduction costs X Quantity of coffee exported X Quantity of defective coffee X Stock in market X Weather information / forecasts X Table continued on next page

283
Table 35 (Continued)
Farm
er
org
aniz
atio
n
Farm
ers
Gov
ernm
ent
Expo
rter
Trad
er
Jour
nalis
t
Frequency Needed
Annually X As actions are taken X As needed X Bi-annually X Daily X X X X XMonthly X X X XQuarterly X X X XWeekly X X Preferred Mode of Diffusion
Billboards (electronic) X X Email X X X X XFax X Rural radio X Web X X Television X X National radio X XSource: Case study of Market Information Systems in Mozambique, Ethiopia, and Zambia from September to October 2009 under the MSU-FSG-Hewlett project on Strengthening African Regional Trade through Improved Market Information: Alternative Models to Provide Agricultural Market Information. X means information mentioned as needed by at least one stakeholder.
Government: Government needs information on supply and demand estimates, grades
and standards, price forecasts and trend analysis, harvest or production forecasts,
wholesale prices, buying and selling prices at ECX, producer prices, causes of poor
quality in coffee, international prices, legal action taken by ECX against members,
market analysis and commentary, and quantity of defective coffee. In general, regional
government employees needed more information than those based in Addis Ababa. This
information is needed at different intervals. For example, the government coffee

284
regulatory body needs information on legal enforcement actions taken by ECX against
members who violate rules as soon as actions are taken to verify whether the corrective
actions are done according to the law and to take remedial measures e.g., through the
creation of awareness among members not to make the same mistakes that cost them
money. Some type of information is needed daily, monthly, quarterly, and weekly. The
preferred mode of diffusion by government employees is email.
Exporters and Traders: Exporters need information on supply and demand estimates,
price forecasts and trend analysis, agricultural policy information, buyers on the ECX,
commitment of trade report (quantity sold, bought, prices), exchange rates, marketing
costs, production costs, and quantity of coffee exported. They like to receive this
information as needed (on demand), bi-annually, daily, and monthly via electronic
billboards, email, and on the website. Traders need information supply and demand
estimates, grades and standards, price forecasts and trend analysis, harvest or production
forecasts, wholesale prices, buying and selling prices at ECX, retail prices, traded
volumes, commissions given by other coffee traders, and contacts of buyers and sellers.
They would like to receive this information daily, monthly, or quarterly via electronic
billboards, email, television, and national radio.
Journalist: One international journalist interviewed would like to receive price forecasts
and trend analysis, harvest or production forecasts, and phytosanitary specifications on a
quarterly basis through email.

285
A.2.4 Information Received and Needed By Users in Zambia
Characteristics of Some Information Users and Background Information
In Zambia, interviews were conducted with 6 AMIC employees (3 in Lusaka, 2 in Monze
district, and 1 in Kabwe district) and one employee in the ZNFU 4455 SMS MIS in
Lusaka. Focus group discussions were conducted with two farmer groups in Monze
district (about 180 km south-west of Lusaka) in the Southern province, and one farmer
group in Kabwe district in the Central Province. The first group in Monze consisted of
11 farmers and the second group consisted of 10 farmers. The group in Kabwe consisted
of 8 farmers. Other users interviewed in Zambia included 2 employees of food assistance
organizations, 1 employee of food security analysis organization, 2 government
employees, 1 researcher, and 2 maize traders. Two large-scale millers declined to give
useful information during the interviews.
Farmers: In both Monze and Kabwe, the farmers interviewed mostly grow
maize, sweet potatoes, beans, and rear livestock including cattle, goats, and village
chickens. Other crops grown include cowpeas, groundnuts, sunflower, and vegetables
(rape, cabbages, onions, tomatoes, and eggplants). Overall, 17 out of the 29 farmers
interviewed in Monze and Kabwe reported to have produced and sold an average of 62
bags of maize, each weighing 50 kilograms in the 2009 marketing season. Farmers
reported to leave some maize for home consumption and to sell the rest.
Most farmers in Kabwe district (Central Province) harvest and sell their crops
starting in April to June, which are also the main harvesting months for maize in Zambia.
This is in contrast with farmers in Monze (Southern province), who reported the peak
286
marketing months for their crops (mostly maize, groundnuts, sweet potatoes sunflower
and cotton) to be between July and September.
It is not clear whether the farmers interviewed were net buyers or net sellers of
maize. Research in Zambia indicates that in 2007/08, 26 percent of smallholder farms
produced and sold maize; 35 percent of the rural population were net buyers of maize;
10-16 percent of the rural farm population were non-maize producing and buyers of
maize; and 23-35 percent of the rural population in areas where maize is the dominant
staple crop neither bought nor sold maize (Tembo, et al., 2009).
Traders: In comparison with traders in Mozambique given in section A.2.2,
traders interviewed in Zambia consisted of medium-scale traders and large-scale traders.
The medium-scale traders interviewed in Kabwe sell the highest volumes of maize
(average of 30 tons a day) between May and August. They have small lockups that act as
stores. Large-scale traders handled larger volumes compared to medium-scale traders
and have bigger storage facilities, offices, and some have fax machines.
Information Received and Modes Used to Receive it in Zambia
Farmers: Table 36 shows information received and the modes used to receive it in
Zambia. In Monze district, where the decentralized district MIS is very active, farmers
receive information such as harvest and production conditions, improved methods of
farming, livestock prices, marketing extension (e.g., how to sell maize across the border
or in other provinces), phytosanitary specifications and quality requirements of maize
traders, prices of agricultural inputs (fertilizer) by traders, and weather reports in addition
to retail and wholesale prices. The information is received via meetings, national radio,

287
and rural private radios. Farmers who belong to farmer associations receive hand-
delivered MIS bulletins by district agribusiness and marketing officer.
Traders: Traders in Monze and Kabwe reported to receive information contacts of
buyers and sellers, price of maize from millers and grain buyers, retail prices, and
wholesale prices. Some of this information was not from AMIC but other sources.
Traders receive information via email, national radio, rural radios, SMS, and television.
Government: Government workers receive market news such as import or export bans,
market trends of major staples and pulses, retail prices, and whole prices information
bulletins through email and by hand delivery.
WFP and NGOs: NGOs and WFP receive retail prices and wholesale prices in from
AMIC and other sources through email, hand delivery, meetings, SMS, telephone, and
website. SMS requests are used to receive information from the ZNFU 4455 SMS MIS
and not for information from AMIC.

288
Table 36: Information Received and Modes Used To Receive Market Information by Users Zambia
Information Received Farmers Trader Gov’t
WFP and NGO
Contacts of buyers and sellers X Harvest or production conditions X Improved methods of farming X Livestock prices X Market news (e.g., on import or export bans) X Market trends of major staples and pulses X Marketing Extension (e.g. how to sell maize across the border or in other provinces) X Phytosanitary specifications and quality requirements X price of maize from Millers and grain buyers X Prices of agricultural inputs (fertilizer) by traders X Retail prices X X X XWeather report X Wholesale prices X X X XWholesale prices but not from AMIC X Modes Used To Receive Market Information Email X X XBulletins on notice boards X Hand delivery X X XMeetings X XNational radio X X Rural radio X X SMS X XTelephone XTelevision X Website XSource: Case study of Market Information Systems in Mozambique, Ethiopia, and Zambia from September to October 2009 under the MSU-FSG-Hewlett project on Strengthening African Regional Trade through Improved Market Information: Alternative Models to Provide Agricultural Market Information; X means information mentioned as needed by at least one stakeholder.

289
Information Needed, Frequency Needed, and Preferred Modes of Diffusion in Zambia
Farmers: Farmers in Zambia (Monze and Kabwe) need information on storage
techniques for maize, and buyers’ contacts from April to September—the main marketing
season—through MIS bulletins on association notice boards.
In Monze district, farmers need livestock prices, and information on sources of
water for their livestock. In Kabwe district, farmers needed information on how to grow
alternative crops especially vegetables, soil sample tests and appropriate seed suitable for
the type of soils in their area, and harvest or production forecasts. This means that
providing market information along with extension information, e.g., on soil types and
suitable seeds, would benefit farmers in Kabwe district. Farmers need this information
monthly through hand delivery and notice boards at association headquarters.
Traders: Traders need information on harvest or production forecasts, price forecasts
and trend analysis, market analysis and commentary, grades and standards, terms of
payment, regional prices, retail prices, other traders’ and millers stocks, transport costs,
and weather forecasts. Some traders in Zambia, like in Mozambique, state that they do
not need any extra information from Agricultural Market Information Center (AMIC)
because they get enough information from other traders and friends. This could also
reflect their view that AMIC information is not reliable. Traders need this information
daily, monthly, seasonally, and weekly via email, hand delivery, post office mail, SMS
(cell phones), and website.
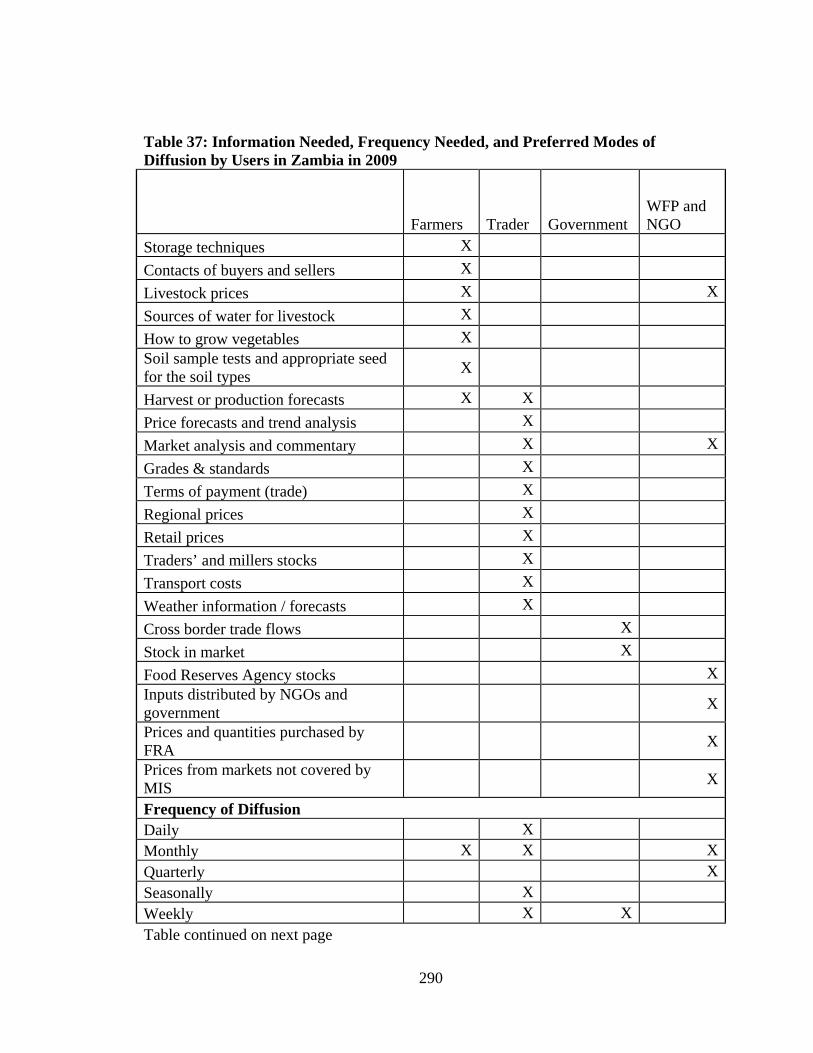
290
Table 37: Information Needed, Frequency Needed, and Preferred Modes of Diffusion by Users in Zambia in 2009
Farmers Trader Government WFP and NGO
Storage techniques X Contacts of buyers and sellers X Livestock prices X XSources of water for livestock X How to grow vegetables X Soil sample tests and appropriate seed for the soil types X
Harvest or production forecasts X X Price forecasts and trend analysis X Market analysis and commentary X XGrades & standards X Terms of payment (trade) X Regional prices X Retail prices X Traders’ and millers stocks X Transport costs X Weather information / forecasts X Cross border trade flows X Stock in market X Food Reserves Agency stocks XInputs distributed by NGOs and government X
Prices and quantities purchased by FRA X
Prices from markets not covered by MIS X
Frequency of Diffusion Daily X Monthly X X XQuarterly XSeasonally X Weekly X X Table continued on next page

291
Table 37(Continued) Preferred Mode of Diffusion
Farmers Trader Government WFP and NGO
Notice boards XEmail X X XHand delivery X X Post office mail X SMS (Cell Phone) X Web X XSource: Case study of Market Information Systems in Mozambique, Ethiopia, and Zambia from September to October 2009 under the MSU-FSG-Hewlett project on Strengthening African Regional Trade through Improved Market Information: Alternative Models to Provide Agricultural Market Information. X means information mentioned as needed by at least one stakeholder.
Government: In Zambia, government policy makers need information on cross-border
trade flows and stocks in market for food security monitoring weekly through email.
WFP and NGOs: WFP needs information on Food Reserve Agency (FRA6)stocks, the
types and quantity of inputs distributed by NGOs and government, prices and quantities
purchased by FRA, prices from markets not covered by MIS, and market analysis and
commentary. NGOs and needed information on livestock prices and market analysis and
commentary. This information is needed monthly and quarterly through email.
A.2.5 Summary and Implications
In terms of characteristics, some information users are smallholder farmers or small-scale
traders, subsistence farmers, mixed or diversified farmers, illiterate, lack storage
6 The Food Reserve Agency (FRA) is a government parastatal established in 1996 with three main functions of: (1) administering a national strategic reserve, (2) marketing and market facilitation and (3) management of storage facilities. FRA usually buys maize from sellers at a minimum price.

292
facilities, and lack access to cell phones. Also, some have limited alternative marketing
channels.
In terms of information needed, the main observations are that: (1) the
information needs of farmers tend to vary depending on the crops they grow. (2) Users
have many and varying information needs, with the implication that one MIS may fail to
meet all their needs, leading to the need for different MIS models to complement each
other. (3) Some types of information are needed by several stakeholders, and some types
of information are needed by only a few stakeholders. (4) In many cases, the information
needed by users is actually provided by the MIS, but some users do not receive it because
of lack of access to the diffusion channels used or because some potential users listen to
radios at different times than those in which information is broadcast. (5) The frequency
of need and preference on how to receive it also varies by information and users.
It seems like organized farmers (e.g., those in groups) in Zambia and
Mozambique, prefer to receive information that is tangible and easily storable, e.g.,
through bulletins which can be placed on the notice boards at the association offices.
This makes sense because it is easier for a group member to carry a market information
bulletin, say from the NGO located in an urban town to the village, and later convey this
information to other members during meetings or on the notice board than to try to
memorize or note down information broadcast over radio or television.
Users receive market information using different modes, suggesting that using
one or a few types of dissemination technologies may not deliver information to all users.
These observations suggest that small-scales farmers and traders are more likely to
receive market information through radio; large-scale traders are likely to receive

293
information through SMS and email; and NGOs and government through email and
internet. Thus, market information from government-supported MIS models that use
broadcast radio and direct contacts (meetings/extension) are more likely reach to
smallholder farmers and small-scale traders. Information from private MIS that use
mostly cell phones and the internet to collect, transmit and disseminate information is
more likely to reach large-scale and specialized traders. In the next 5 to ten years, more
smallholder farmers will more likely be able to receive information through SMS because
the number of cell phone subscribers is increasing over time and the costs of cell phones
and airtime are likely to reduce over time.
294
A. 3 Public MIS
A.3.1 The Mozambique Information System for Agricultural Markets (SIMA)
Aims, Objectives, and Clientele Served
The Information System for Agricultural Markets (SIMA) started in 1991 as a joint
project between Michigan State University and the Government of Mozambique to
facilitate agricultural marketing through reducing information asymmetries between
traders and rural farmers, to collect information for food security monitoring, and to
provide information to Government of Mozambique for better policy formulation. In
2000, the MIS was taken over by government of Mozambique. SIMA is decentralized
and has branches, called SIMAP, in each of the 10 provinces of Mozambique. Nampula
province has 18 districts, and the district in which the provincial headquarters is located
is referred to as the provincial district. Each SIMAP is also decentralized and is supposed
to have a presence in each district in the province (see Figure 3 below). The SIMAP in
Nampula was the first to be established, and is considered to be one of the best models
among the SIMAPs in Mozambique.
The Provincial Information System for Agricultural Markets (SIMAP) in Nampula
started in 1997 with the aim of providing agricultural market information to farmers to
enable them negotiate for better prices with traders. The SIMAP also aimed at generating
data for use in the computation of national accounts, and to estimate the value of the
agricultural sector’s contribution to the GDP. In addition, data collected by SIMAP
complements the data collected by the provincial unit of the institute of statistics, and is
used to compute the level of inflation. The main clientele of both SIMA and SIMAP

295
include farmers, traders, farmer associations NGOs, government parastatals and
institutions, local government departments and ministries, municipalities, local markets
officials, and individual users.
Information Provided, Frequency, and Modes of Diffusion
SIMA and SIMAP collect information on 25 agricultural products. The commodities on
which information is collected vary depending on the level of production and seasonality
of crops in the provinces. Price information for each commodity in each market is
collected from three traders for consistency. At the national level, information is
collected from 16 rural and 6 urban markets at producer, wholesale, and retail levels
spread over the nine provincial districts (SIMA, 2009). At the national level, market
news and analysis is compiled in a weekly bulletin called Quente-Quente.
In Nampula province, SIMAP collects negotiated prices at wholesale and retail
levels from 2 rural district markets in Rebawe and Murrupula districts and from formal
wholesalers in the cities of Nampula and Nacala (2 urban districts) on a weekly basis.
Market news and analysis is compiled into a monthly bulletin branded as ESISAPO7. In
the past, in Nampula province, where the author conducted a field visit, information used
to be collected from 15 districts (13 rural districts and 3 urban districts). Due to limited
funding to hire, train, and supervise enumerators, SIMAP is currently active in only two
rural districts and two urban districts. In rural districts, when there is no facilitation, such
as vehicle and fuel, information is not collected. In Nampula town, SIMA collects
information weekly from Mwatala market (retail prices) and Gorongosa market (for
wholesale prices).
7 Esisapo means negotiated prices in the local Makua language
296
In Nampula town, quantitative information on traded volume and stocks in terms
of number of bags of grain is also collected weekly. Contact information (e.g., names,
addresses and telephone numbers), a list of agricultural commodities bought by large-
scale buyers, and a list of agricultural inputs sold by input dealers in town are sometimes
collected and included in the information bulletin. Other information monitored every
week, although not always disseminated, includes transport costs.
Information Provided: At SIMA, the main commodities on which information is
reported include white maize, common beans, rice, large and small groundnuts, and dry
cassava. A typical SIMA bulletin has information on: (1) market analysis covering
opportunities and outlook for selected commodities in selected provinces; (2) the trend of
consumer price levels in the past four weeks, (3) transportation costs incurred by traders
to move commodities between markets, (4) producer, wholesale, and consumer weekly
price levels and percentage changes in the previous two weeks in major markets, (5)
estimated quantities of commodities available for sale and purchase, and their percentage
changes from the previous week in major wholesale markets; (6) prices of white maize
grain in non-standard local units by location; and (7) regional and international FOB and
futures prices of major commodities and foreign exchange rates for neighboring and
major countries (SIMA, 2009).
In Nampula, a typical SIMAP bulletin has information on the main highlight of
the week, such as the general price movements of main crops like white maize, sugar,
rice, and beans. The highlights summarize commodities whose prices have remained
stable, increased, or declined. The bulletin also includes other news related to marketing,
food security or storage of agricultural commodities. It also has contact information for
297
the main buyers of agricultural products such as their fax, telephone, and email contacts.
It also has a section on companies that have commodities for sale. Other information
provided includes advice to farmers not to sell all their commodities for food security
purposes, especially when poor weather (e.g., low rainfall) is predicted, and to diversify
and grow alternative crops.
Modes of Diffusion: The main modes of diffusion used by SIMA include email,
television, website, and newspapers. In Nampula province, SIMAP information is
disseminated through email, notice billboards, blackboard, hand delivery of the bulletins,
printing and placing the bulletin in district pigeon holes at the provincial government
headquarters once a month, and on the notice board at the entrance of the provincial
headquarters of directorate of agriculture at Nampula. Information is also written by
chalk on blackboards in the district markets, and at the provincial headquarters.
Blackboards in districts without enumerators remain blank, since it is the enumerators
who write on the blackboards. Also, the provincial officials such as the Provincial
Director of Agriculture take the market information bulletin with them when they go to
visit the rural areas and districts. In the past, information was disseminated via two 15-
minute broadcasts every Tuesday at 5:30 am and every Thursday at 5: 30 pm on Radio
Mozambique in a local language (Makua) after the regular news program. The radio
programs, which cost the SIMAP approximately 109,000 meticais ($3,893) every three
months, stopped in September 2008 due to limited funding from the province and other
donor projects. In Nampula province, the MIS bulletin is given to the unit of
communication (under the provincial services of extension) to be aired in a weekly 30-
298
minute agricultural radio program that includes complementary information on extension
and all other agriculture programs.
SIMAP does not send information to the three private radio stations in Nampula City
because they have limited coverage, and there is a perception that they do not reach the
farmers who are considered the main MIS clients. The SIMAP staff does not recognize
that there might be some positive spillover effects of having traders in urban areas having
access to information from the private FM stations. District enumerators are expected to
distribute the information they collect to the rural community radios. SIMAP prefers to
disseminate the bulletin through email because it minimizes the costs of buying paper,
printer and copier toner, and the costs associated with hand delivery of information.
Data Collection, Transmission, and Quality Control Methods
Collection and Transmission: District enumerators collect information from market
participants using one-on-one interviews and direct observation in markets. The
information is recorded on standardized questionnaires. The information is then
transmitted to the provincial headquarters using radio equipment by voice, which can
lead to transcription errors. In some cases, telephones are used to transmit information.
Information is also hand delivered to the provincial headquarters by enumerators from
markets in Nampula town.
At the national level, data analysts at the SIMA use mobile phones to call
enumerators at the provincial headquarters for market information. The introduction of
mobile phones has affected the collection of information by the SIMAP in some positive
and negative ways. For example, in Mozambique, the SIMA staff members call
enumerators at the provincial districts—bypassing the SIMAP supervisors at the

299
provincial level—and collect information in a short period of time. As a result, SIMAP
supervisors at the provincial level don’t regularly call district enumerators for data since
SIMA analysts no longer demand this information from the SIMAP supervisors and
coordinators at the provincial level. The result is that the MIS bulletins are not regularly
produced at the provincial level.
Another way of explaining why the bulletin is not regularly produced is that there
is no effective demand for the provincial SIMAP bulletins or somehow this demand, if it
exists, is not transmitted to the regional SIMAP supervisors. The provincial government
is the main clientele of SIMAP. Since the frequency at which the government needs the
information is low, the SIMAP staff produces outputs at less frequent intervals that meet
the needs of their most important client. Also, information is not collected regularly from
some districts due to lack of financial resources to hire enumerators to replace those who
are transferred, died, or absconded. In some situations, information is not transmitted
because of lack of initiative from SIMAP staff to request information from districts, even
when there are fax and radio equipment at the province and the district.
Quality Control: SIMAP reporters interview at least three traders in the market
for prices of commodities. This helps them to ensure that the information collected from
traders is consistent. The supervisor and coordinator also examine the price trends by
comparing current prices with the past week’s prices and other historical data. When
there is a sharp decline or increase, they send the enumerator back to the market to cross-
check the information. The problem with this is that the reporter can report the same
prices so that he does not reveal that he had collected the wrong prices in the first

300
instance. The ideal situation would have been the coordinator to visit or call the traders
to cross-check the prices and not to send the same enumerator.
The supervisors also use their local knowledge about production in the areas to see if the
price increases or decreases correspond with the production or supply in the area. For
example, when the price is reported to have increased sharply yet it is the harvest season,
this triggers a query, and the enumerator is sent back to the market. This approach
assumes that price decreases and increases are mostly due to production and ignores other
factors that may lead to price increases such as damaged roads, increase in transportation
costs, poor security on the roads, and increased demand from neighboring districts.
These factors may lead to a price increase even during the harvest season.
Supervision in the rural districts is limited due to lack of resources such as money
for per diems and fuel. Supervision in Nampula city is easy because there is no need to
pay per diem. The last supervision was two months from the date of the case study
interviews. The supervisor and coordinator of SIMAP staff were trained by SIMA staff
at the beginning of SIMAP in 1997.
The Development of an SMS Dissemination Platform in Mozambique
A private firm, SEVITEL, has a memorandum of understanding (MOU) with SIMA to
develop an SMS platform to diffuse market information. In the MOU, SEVITEL will not
pay the SIMA anything, and SIMA will not pay SEVITEL anything. The SMS platform
by SEVITEL is planned to receive daily data directly from the field collectors into the
MIS database. It is unlikely that SIMA enumerators will have the capacity to collect
market information on a daily basis due to financial constraints and the incentive
structure in the MOU unless donors facilitate SIMA to implement the data collection

301
activities. The planned procedure is that field collectors will fill in a predesigned format
on the cell phone and send it to the SMS database at SEVITEL.
A similar initiative is also being experimented by Technoserve (Esoko
Mozambique) based in Nampula in collaboration with Esoko Ghana. Esoko
Mozambique is planning to collect information in collaboration with local NGOs and sell
it to users on an SMS platform. There seems to be no collaboration between SEVITEL
and Esoko Mozambique, implying that there is a potential duplication of activities, and
thus costs if both initiatives take off, but also competition in the market for information.
Institutional Home, Feedback Mechanism Used, and Sources of Funding
Institutional Home: SIMA is a unit under the Department of Statistics in the Directorate
of Economics in the Ministry of Agriculture. In Nampula province, the SIMAP is a unit
under the Department of Economics, and the Department of Economics is under the
Provincial Directorate of Agriculture and Rural Development 8(Figure 3). At the
national level, SIMA has four permanent staff and two contract staff. SIMA has a
coordinator (the position is not official in the Ministry organogram), two technicians who
are graduates and three technicians who are undergraduates (two enumerators and one
data cleaner).
At the provincial headquarters in Nampula, the SIMAP has a coordinator, a
supervisor who also works as a processor or data analyst, and three enumerators, one of
them a dedicated SIMA enumerator. The enumerators at the provincial district collect
data from the provincial district. All employees of the SIMAP are permanent employees
of the provincial government (and implicitly the central government) since they are paid
8 Direcção Provincial de Agricultura e Desenvolvimento Rural de Nampula.

302
on government budget. At the district level, SIMAP is supposed to have two
enumerators. Due to limited resources, many districts do not replace enumerators when
they transfer, die or abscond from duty. This is also partly because the provinces can
only hire new enumerators with the approval of the central government.
The solid vertical lines in Figure 3 show the hierarchy and the flow of
bureaucracy within the national and provincial levels. The broken lines show the
linkages and nature of decentralization between SIMA and SIMAP. The performance in
terms of timeliness and quality of the data from the districts to the SIMAP and eventually
to SIMA depends on the incentives (e.g., data collection allowances) that flow along the
broken lines, and not the power of bureaucracy (e.g., threat of contract termination or
punishment for failure to deliver data) since the two levels are administratively delinked
as demonstrated by the lack of a solid line between the national and provincial levels.
Feedback: Feedback is partly obtained from users during occasional research
studies. The SIMA and SIMAP also use the information from the National Agricultural
Surveys conducted by the Directorate of Economics/ Department of Statistics in Ministry
of Agriculture in Mozambique called Trabalho de Inquerito Agricola (TIA). TIA
collected information about how farmers receive information and how they find the
information to be useful in 2002 and 2005. (This data formed the basis for the analysis in
chapter 4.) In the past, farmers and traders reported to the Provincial Director of
Agriculture whenever information was not disseminated on radio through the dedicated
market information program. This used to be one of the ways for feedback and also
made the numerators and the MIS personnel to be accountable to the stakeholders. Since
the province stopped funding the dissemination of information, the Provincial Director of
303
Agriculture (the principal) cannot penalize the SIMAP staff (agents) for failing to
disseminate information by radio.
Sources of Funding and Sustainability: SIMA is funded by the government of
Mozambique and donors. It also receives technical support from Michigan State
University. In 2008, WFP contributed to the national budget with the objective of
enabling SIMA to collect more information from more districts where WFP was
implementing the P4P (Purchase for Progress) program. As a sustainability strategy,
SIMAP would like the tax collectors to also collect market information, since tax
collectors are there in all markets, and tax collection is a more sustainable activity. There
is a tendency, however, for traders to fear giving truthful market information to tax
collectors for fear of being overtaxed. Thus, this strategy may reduce the reliability and
credibility of information from the MIS.

304
Figure 3: Organizational Chart of SIMA and SIMAP in Mozambique
National Level- SIMA
Ministry of Agriculture
National Directorates
Directorate of Economics (1 Director and 1 Deputy director)
Departments Department of Statistics (1 Chief)
Units Agricultural Market Information System (SIMA) 1 Coordinator (not official in the Ministry organogram) 2 Technicians/ analysts (graduate level or more) 3 Technicians (under graduate level consisting of 2-enumerator, 1-data cleaner)
Provincial Level- SIMAP (Mozambique has 10 provinces)
Directorate of Agriculture and Rural Development
Department of Economics (helps to link SIMA and enumerators)
Provincial Agricultural Market Information System (SIMAP) 1. coordinator 1. supervisor (processor / data analyst) 3 enumerators
District Level (Nampula has 18 districts)
Enumerators
(2 per district)

305
A.3.2 The Zambia Agricultural Market Information Center (AMIC)
Aims, Objectives, and Clientele Served
AMIC started in 1992 following privatization and liberalization of the Zambian economy,
with the aim of improving efficiency in agricultural marketing among private-sector
actors such as input dealers, farmers, and traders, through the provision of timely and
accurate market information. Another aim of AMIC is to collect information for
government planning and decision making on food security strategies. AMIC is a
decentralized MIS with a presence at each of the nine provinces of Zambia. Each
province consists of several districts, and the district in which the provincial headquarters
is located is called the provincial district.
Smallholder farmers and small-scale traders are considered to be the most
important clients of AMIC. The dissemination strategies of AMIC in Lusaka, however,
focus more on government institutions. In Monze District, in Southern Province, where
the author carried out a case study, the dissemination strategies focus more on local users
such as farmers and traders with radios who are interested in listening to market
information. NGOs, a few traders, and private individuals are also included on the AMIC
email distribution list of 162 users.
Information Provided, Frequency, and Modes of Diffusion
Information Collected: Information is collected once a week on retail and wholesale
prices from two or three traders in each market for selected commodities. The
information is collected from at least two markets in each of the nine provincial districts
through one-on-one interviews by market data reporters. When the provincial district is
small, information is collected from one market. Other non-provincial districts also

306
collect information and submit it to the province headquarters. The Central AMIC in
Lusaka, however, uses data only from the nine provincial districts. The national MIS
collects data on 18 agricultural commodities and products, 3 fertilizer commodities and 6
seed varieties at the retail and wholesale levels. Given the seasonality of production, not
all this information is obtained at any given period of time.
Other information collected at the retail level includes qualitative supply
assessment of commodities (i.e., abundant, good, fair, limited, or not available); and
hammer mill service costs and the millers’ qualitative estimate of her/his capacity
utilization (i.e., whether the mill is not operational, operational at 25 percent capacity, 75
percent capacity, or full capacity). At the retail level, the commodities on which market
information is collected includes white maize grain, breakfast meal, white roller meal,
bread flour, polished rice, beans, and groundnuts. Also, prices of inputs such as
fertilizers, seeds and chemicals are also collected. At the wholesale level, some of the
commodities on which market information is collected include white maize grain,
sorghum, paddy rice, beans, soybean, groundnuts, fertilizer, seed, and chemicals.
At the district level, information on local trade is expected to be collected, but its
collection is not enforced. Such information includes names of local traders, trader
contact details, their sale prices and the units, barter purchases, terms of transactions,
main sources of supply, and main sales destinations. Districts can also collect
information on commodities that are important in the districts. For example, in Monze
district, the MIS collects daily wholesale and retail prices on Kapenta (a small dried fish
variety), tomatoes, onions, white maize grain, breakfast meal, white roller meal, goat
prices, village chicken, honey, milk, groundnuts, beef, fertilizer, and maize seed.

307
Information Provided: AMIC produces a bimonthly market information
bulletin. The bulletin includes general price movements of white maize grain, breakfast
meal, and roller meal. This information is also graphed for selected districts, usually for
a period of 12 months, but not necessarily up to the current month, suggesting that the
database is not updated regularly. Other information in the bulletin includes tables of
retail prices of maize grain, breakfast meal, roller meal, mixed beans, cassava chips,
fertilizer, seeds, and the percentage changes in prices from the previous week. The
bulletin also includes SAFEX future prices for white and yellow maize, wheat, sunflower
and soya. Foreign exchange rates of major currencies, news in the agricultural sector,
and links to important food security websites are also included in the bulletin.
The districts are also expected to come up with independent market information bulletins.
In Monze, the district market development officer (DMDO) and his assistant collect price
information, enter it into the FAO Agri-market software and print out a table of average
prices of food commodities, fertilizer and seeds. A market information price sheet is
produced in Kabwe district by the Kabwe Agriculture Market Information Service, but
the service is no longer presently active as it was before February 2009.
Radio presenters in Monze disseminate information on prices, weights, and grades
and standards of maize required by buyers, and names of buyers and traders in the town.
Other information included in the MIS bulletin include terms of transactions such as
whether buyers pay instant cash or payments are collected after some time. When funds
are available, AMIC provides marketing extension, such as trainer of trainer workshops
on how to find markets, and requirements and ways of importing and exporting

308
agricultural commodities. Import, export, and transit permits are also issued within the
same department housing the MIS, although that is done by different staff.
Modes of Diffusion: At AMIC in Lusaka, the bulletin is emailed to
approximately 160 users, hand delivered to government offices, and faxed to a few users.
The AMIC bulletin is also uploaded on the MSU website
(http://aec.msu.edu/fs2/test/marketinformation/zambia/amic/). There are plans to start
posting the AMIC bulletin on the department website. In the past, market information
was disseminated via the national radio and the bulletin was hand delivered to traders and
millers who provided market information. This stopped due to financial constraints. In
Monze district, market information is disseminated through two local radio stations.
Other districts are expected to make arrangements with community radios to disseminate
market information.
Frequency of Diffusion: In Monze District, the information is delivered to the
FM radio stations, where it is disseminated via two radio programs weekly, each lasting
for 15 minutes. One radio program is on Star FM every Tuesday at 18:30, and another
program is on Radio Chikuni every Thursday at 18:30. The costs of disseminating
information through radio consists of airtime and producer allowances. The costs of
disseminating information for six months total to about 8.6 million kwacha ($1870) on
Star FM, and around 5.4 million kwacha ($1174) on Chikuni FM.
Data Collection and Quality Control Methods
Data collection methods: Data is collected by the District Marketing Officers and their
assistants through one-on-one interviews with traders. The information is then
transmitted by fax machines, telephone, or hand delivered to the provincial headquarters.

309
From the provincial headquarters, information is then transmitted to the AMIC
headquarters by fax machines, by telephone, or by hand delivery. Some districts with
donor support like Monze have the capacity to transmit information to Lusaka by email.
AMIC faces an infrastructural problem in terms of sufficient email connections. At
AMIC, SPSS is used to capture the data. There is no data entry check program used in
SPSS. Transmission of data using voice over the phone can lead to transcription errors
and capturing data without a data entry check program can lead to data entry errors.
Quality Control Methods: At AMIC in Lusaka, data is inspected for outliers
during data entry. When outliers are found, they are investigated. The supervisors also
proofread the bulletin and check for errors before it is disseminated. In the past, with
support from the Food Security Research Project (FSRP), AMIC used to train and
supervise all enumerators regularly. This is not currently done because of financial
constraints.
Institutional Home, Feedback Mechanism Used, and Sources of Funding
AMIC is located in the Market Support Services unit in the Department of Agribusiness
and Marketing in the Ministry of Agriculture and Cooperatives (MACO). At the
provincial level, the Agricultural Market Information Services (AMIS) activities are
located in the Department of Agribusiness and Marketing and at the district level, the
District AMIS is located in the Department of Agribusiness and Marketing (Figure 4). At
the provincial level, each group of districts within each of the nine provinces is expected
to produce a local market information bulletin, but this is no longer done for several
reasons such as lack of supervision and financial resources to motivate the workers to
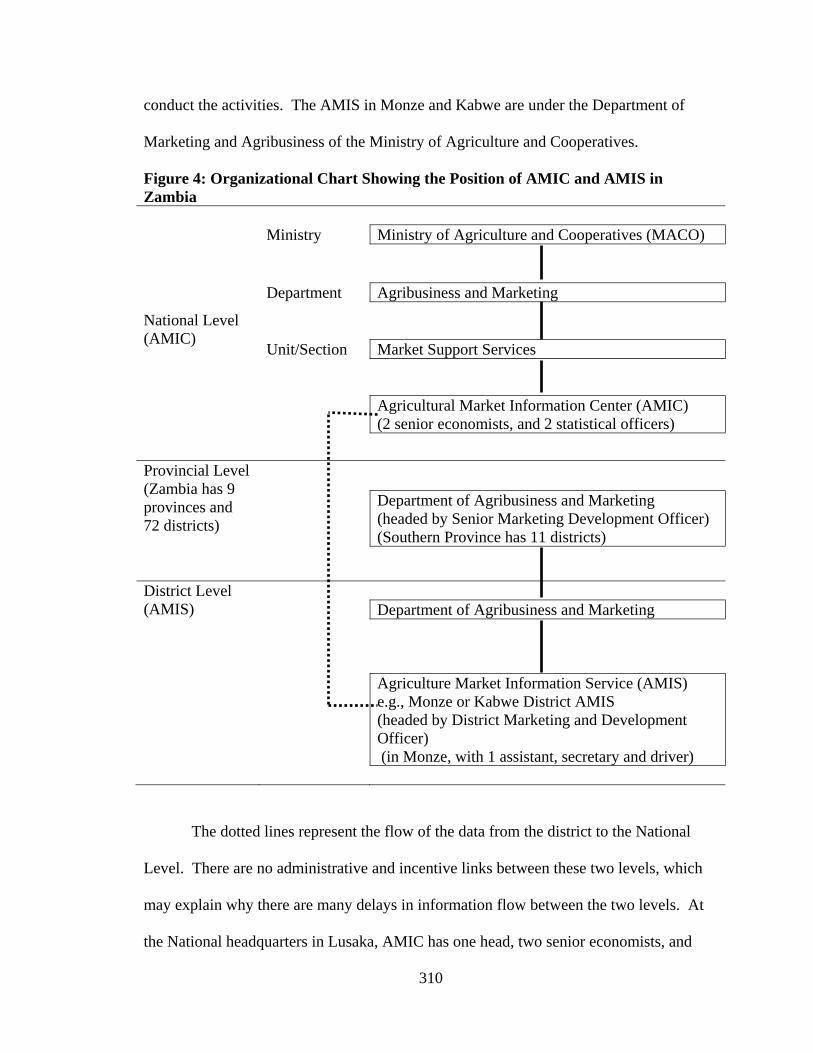
310
conduct the activities. The AMIS in Monze and Kabwe are under the Department of
Marketing and Agribusiness of the Ministry of Agriculture and Cooperatives.
Figure 4: Organizational Chart Showing the Position of AMIC and AMIS in Zambia
National Level (AMIC)
Ministry Ministry of Agriculture and Cooperatives (MACO)
Department Agribusiness and Marketing
Unit/Section Market Support Services
Agricultural Market Information Center (AMIC) (2 senior economists, and 2 statistical officers)
Provincial Level (Zambia has 9 provinces and 72 districts)
Department of Agribusiness and Marketing (headed by Senior Marketing Development Officer) (Southern Province has 11 districts)
District Level (AMIS)
Department of Agribusiness and Marketing
Agriculture Market Information Service (AMIS) e.g., Monze or Kabwe District AMIS (headed by District Marketing and Development Officer) (in Monze, with 1 assistant, secretary and driver)
The dotted lines represent the flow of the data from the district to the National
Level. There are no administrative and incentive links between these two levels, which
may explain why there are many delays in information flow between the two levels. At
the National headquarters in Lusaka, AMIC has one head, two senior economists, and
311
two statistical officers. At Monze and Kabwe districts, AMIS is headed by the District
Marketing Development Officer. In Monze, he is assisted by a secretary, a driver and an
assistant, who normally collects the information from the markets. All the staff at the
national, provincial and district levels are hired through the public service commission
and are permanent.
Feedback Mechanisms Used: In the past, when resources where available,
AMIC conducted user needs surveys. In Monze district, the MIS receives feedback from
farmer focus groups, through telephone calls to the radio program from listeners, and
from farmers who visit the district offices for information. According to the information
managers, a high number of farmers visiting the office for market information is an
indicator that users are not satisfied or not receiving enough information from radio, and
a small number of visitors means that users receive and are contented with the market
information from radio. The rival explanation for this occurrence is that a small number
of visitors could indicate that users think that information from the MIS is useless and
hence not worth the trouble contacting the MIS, while a high number of visitors could
mean that the users find the information useful and want more.
Sources of funding: AMIC is funded by the Government of Zambia. It has
received technical assistance from Michigan State University in form of staff
development and in-kind contribution of a fax machine and landline telephone. The
FSRP pays for the landline telephone and fax machine bills for AMIC. Other donors
facilitate data collection through provision of fuel for data collection. The dissemination
budget of the pilot MIS in Monze, Choma, and Livingstone is also supported with
funding from the World Bank through the Agricultural Development Support Program

312
(ADSP). ADSP also provided the MIS with a fax modem that can be used to receive and
send emails. The telephone lines bills at Monze are paid by the government of Zambia.
One idea by the researcher on future funding prospect is that under some value
chains, such as the maize subsector in Zambia, a possibility of taxing some stakeholders
at strategic levels in the subsector (e.g., at miller level) could be introduced. Part of this
fee could then be used to supplement the dissemination of market information to users.
A.3.3 The Ethiopia Commodity Exchange (ECX) Market Information Section
Aims, Objectives, and Clientele Served
The Ethiopia Commodity Exchange started in April 2008 with the aims of helping the
agricultural market in Ethiopia to become efficient, transparent, secure, and of integrity.
The ECX conducts many activities, including offering a trading floor system among
traders, warehousing delivery centers, and market information. Other services provided
by ECX include handling, storage, and grading of agricultural commodities. This case
study covers activities of the market information system in the ECX. At present, most of
the information generated is on coffee because the quantities of other commodities (e.g.,
maize, haricot beans, wheat, and sesame) traded through the exchange are limited and not
frequent, most likely because they have alternative unregulated marketing chains.
The ECX’s main clientele are the members who can be classified into two groups:
(1) members who buy on the trading floor (ECX buyers), and (2) members who sell
(ECX sellers or intermediaries). ECX buyers include coffee exporters and traders who
buy coffee to sell locally. ECX sellers include mostly private traders and cooperative
unions. Farmers are indirect members (clients) of ECX through their membership in
service cooperatives and unions. Farmers or traders who do not belong to a cooperative
313
may also be indirect members (clients) of ECX when they become clients of registered
ECX intermediaries (traders). There are several recipients and users of ECX information
such as NGO’s, government departments, donors, banks, researchers, and educational
institutions.
Members are also grouped in two types: full members and limited members. Full
members have a permanent membership seat which is freely transferable and can trade in
any commodity on the exchange. In 2009, when the researcher conducted a case study in
Ethiopia, full member seats were not being offered any more. Limited members have a
one year membership and can only trade one commodity and in one position (i.e., as
buyers or as sellers only) on the exchange. It is not clear why ECX was not offering full
membership at the time the case study was conducted. In terms of market efficiency, it
seems like it would be advantageous to have full members rather than limited members,
as that would ease on both temporal and spatial arbitrage.
Information Provided, Frequency, and Modes of Diffusion
Information provided includes price in Birrs, and volumes in Feresula9 for all the types10
and grades of coffee traded on the exchange. Other information provided includes
regulations, classes of coffee transacted, the New York Coffee closing and future prices,
a 30 day price trend for each type of coffee, the market share of coffee type, an ECX
coffee index, and a summary of international coffee news.
ECX diffuses information instantly, daily, weekly, and quarterly. ECX uses
multiple dissemination modes, including electronic display boards (Rural Electronic Price
9 A feresula is a unit commonly used in coffee trading, and it consists of 17 kilograms 10 The types include ECX washed coffee, unwashed coffee, and ECX local coffee.

314
Ticker (REPT)), its website, national public radio, private FM radios, newspapers,
national and private television, fax, email, telephones (voice), and hand delivery of some
reports and bulletins. For example, prices of the day, the closing price of the previous
day, and the real time coffee price on the New York Board of Trade are displayed on the
electronic billboards within 4 seconds of trade in Amharic and English. In 2009, there
were 24 electronic billboards, three of which were in Addis Ababa and 21 in the regions.
ECX has a target of installing 200 more electronic billboards throughout Ethiopia to
target more rural farmers. This information is also updated on the ECX website instantly
and targets all users who can access the internet. All information collected belongs to
ECX.
Daily and weekly reports are disseminated by email, fax, and hand delivered to
radio stations (Radio Ethiopia, Amahara-Region radio, Dire-Dawa FM and other private-
sector based radios), television (Ethiopia Television, Addis TV, and Oromigna TV),
newspapers (Addis Zemen, The Daily Monitor and Ethiopian Herald daily, and Capital
and Fortune weekly), and ECX members. The reports are written in four main languages
(Amharic, English, Oromifa, and Tigregna). Other information, such as market
regulations and coffee news is provided at less frequent intervals through the website, in
meetings with ECX members, and in a quarterly newsletter called Its Coffee Time! More
confidential information (e.g., quantities of inventories and warehouse receipts’ expiry
dates) is disseminated by phone, email, fax, or placed in members’ mail boxes. ECX also
trains its members through awareness workshops, posters, brochures, and by posting
materials on its website on how to trade on the commodity exchange, how to interpret
and use market information such as prices and on grades and standards of coffee.

315
ECX got a one-year concession from the Ethiopia Government to disseminate
market information through all government media channels for free. ECX will face full
dissemination costs after one year, and this is likely to increase its dissemination budget
significantly. It is also unlikely that private companies will pay to disseminate market
information to farmers. This is because in Ethiopia, farmers mostly sell coffee through
service cooperatives. The main functions of coffee cooperative unions are to buy coffee
from member service cooperatives and to import and distribute agricultural inputs and
equipment to farmer members. Thus, there is no incentive for cooperative unions to
advertise (increase costs at a lower level), and thus sponsor market information radio
programs, unless they are really farmer- based cooperatives interested in increasing the
incomes of their members. The cooperative unions and local governments, however, are
interested in disseminating information on how to improve on quality of the coffee
among value chain participants.
Besides, coffee farmers probably do not need a lot of market information because
they mostly sell to the service cooperatives, and earn dividends. Coffee farmers can
choose to sell to a few private coffee buyers who only operate in designated areas where
they can be monitored by local government inspectors to ensure that they do not
adulterate the coffee beans. Even if farmers fail to negotiate for higher prices with the
service cooperatives, they earn some dividend at the end of the year as long as the
management inefficiencies are less than the value of the profit of the cooperative and
assuming that all profits go back to members. Instead, it is both the service cooperatives
managers as sellers to union cooperatives and union cooperative managers as commission
agents for service cooperatives on the ECX who need information most since the

316
competition is between cooperatives and not between farmers. On the one side, the
service cooperatives aim at obtaining higher prices from union cooperatives, and are
therefore interested in knowing the price at which different grades of coffee are traded at
on the exchange. On the other side, union cooperatives compete to buy from service
cooperatives by charging the least commission on the sales of coffee on the exchange on
behalf of service cooperatives. If the union cooperatives were truly owned by the
member service cooperatives and themselves operated as cooperatives, then bargaining
between the service cooperatives and the unions would not be a big issue. If the unions
got a low price from the service cooperatives and earned a profit, the profit would be
rebated back to the service coops. To the extent that bargaining between the service
coops and the unions is important, it may reflect that the unions are not acting like a
cooperatives or that the gains they make are captured by their management.
On the other hand, getting information on the price differentials for different
grades of coffee would be important for the service cooperatives so that they can create
incentives for their members to produce higher-quality coffee. Note that prices and
grades of coffee traded on the exchange is public information, but the commission
charged by cooperative unions and private traders (the ECX sellers) is private
information, although it is known by the ECX. There is a potential effective demand for
this information among ECX sellers, because they want to compete among themselves to
attract sales from service cooperatives and other independent farmers.
Moreover, farmers sell coffee beans to the service cooperatives while the
information disseminated is for processed coffee. Although it is likely that the

317
information on processed coffee can be used in formula pricing for coffee beans, formula
pricing was not explicitly reported to be used by service cooperatives.
A system to transmit information by SMS and Interactive Voice Response (IVR)
in real time is under design. In the proposed SMS dissemination methods, ECX is
considering both the “push system,” where information is sent to users, and the “pull
system,” where the users request data at their own time, frequency, and schedule. In the
IVR, users will be able to dial a toll-free number and listen to market information. Paid-
up members of the exchange will be given passwords to enable them access more
detailed (more valuable or more private) information such as inventories, dates when
their warehouse receipts expire, and their account balances. Thus, the frequency of
diffusion varies by mode of diffusion, the targeted information users, and the type of
information.
Another observation was that exporters do not like ECX to publish prices and
grades of coffee over the internet, but ECX likes this information to be public so as to
promote competition. The exporters do not like this information on the internet because
international buyers get to know the prices at which the exporters bought the coffee. It
seems like this situation (symmetric information about export coffee prices between
coffee exporters and international coffee buyers), weakens the bargaining position of
exporters and strengthens that of international coffee buyers.
Data Collection, Transmission, and Quality Control Methods
Price information is collected on the trading floor as soon as a transaction occurs on the
exchange. Once the seller and the buyer agree on a price, quantity, and the grade of a
commodity, the information is captured and entered into customized MIS application
318
within the trading floor. From that point, the information is instantly ready for
dissemination on the billboards and website. There are no market data collectors in the
market. The MIS application generates daily and weekly reports ready for dissemination.
Information on grades and standards is obtained as soon as the commodity is received at
the ECX warehouse and data describing it is entered into the MIS application.
The ECX information collection process has instant quality control mechanisms
in the sense that the seller and buyer sign the papers after a transaction is done. Both the
seller and buyer submit the paper to the counter for entry into the system, and the funds
are transferred from the buyer’s account to the seller’s account. There is no room for
errors, as these would mean loss of funds by either the buyer or the seller.
Until the end of 2009, cooperatives and firms trading in specialty coffee were
allowed to export directly without trading through the commodity exchange. The rest of
the coffee is by law supposed to be traded through the exchange. This means that ECX is
not a thin market because it handles the whole volume of coffee traded, and the price
information generated as a byproduct of its exchange activities are representative of the
broader trends in the entire coffee market in Ethiopia (excluding specialty coffee by 2009
when the researcher conducted the case study). Specialty coffee has started to be traded
through the exchange as well.
Institutional Home, Feedback Mechanism Used, and Sources of Funding
The MIS is a section or unit under ECX. The ECX is an independent and autonomous
public-private partnership enterprise, partly owned by the Government of Ethiopia
together with other private owners, with a board of directors consisting of owners and
members. At a policy level, ECX has links with the Ministry of Agriculture and Rural
319
Development, and the Ethiopia Commodity Exchange Authority. ECX is not affiliated to
any MIS network at a regional level but has information gathering linkages with several
organizations such as Bloomberg and Reuters. ECX is not an organizer of any MIS
network. The MIS section is headed by one market data manager. It has three sections:
1) the market data and infrastructure section, 2) the market data research section, and 3)
dissemination section.
1. The market data and infrastructure section has four employees who ensure that the
dissemination infrastructure such as the electronic price tickers are functioning and
running smoothly. This section is in charge of the technical aspects of the SMS and
IVR that are currently being designed and piloted.

320
Figure 5: Organizational Chart of the Ethiopia Commodity Exchange Showing the Position of the Market Information Activities CEO Executive Assistant External Affairs Assistant General Legal Counsel Chief Economist Comptroller, Operations CFO CSO CCO CRO CBO CCSO CMDO CIO Finance Strategy Rules Surveill
ance Ware-
house Operations
Clearing House
Market Data
Architecture
Human
Resource Business
Devel’t Complianc
e Risk
Management
Quality Control
Central Depository
Dissemination
Business Apps
General
Service Research Discipline Settleme
nt Guara-ntee Fund Management
Trading Operations
Information center
IT Operations
Corp.
Comm’n Arbitration
Tribunal
Adopted from ECX organizational chart
Market Information Activities
321
2. The market research section has 3 employees who conduct research on why the prices
are going down or high (not shown on the organization chart).
3. The market data dissemination section has three employees who ensure that the
information is disseminated via all the channels in an efficient and timely manner.
This section is also in charge of the information center and the library.
ECX receives feedback from: 1) a market hotline telephone number to the exchange’s
information center (information users and members call when the website or the display
boards are not working); 2) monthly panel discussions with the members; 3) the member
relations section of the exchange, which gets comments from the members; 4) the
compliance section of the exchange, which monitors activities of the exchange; 5)
feedback about ECX’s public awareness programs through the media; and 6) the Ethiopia
Commodity Exchange Authority (ECEA) regarding complaints of members.
The money generated by the exchange is used to sustainably pay for all the
running costs of the MIS. ECX does not charge a user fee for the data disseminated, but
some users, such as members, indirectly pay for the information. Members pay
membership seat fees, annual maintenance fees, transaction fees (exchange transfer fees,
handling, and product certification), and warehouse fees. In the next phase, the MIS is
considering generating resources through SMS subscriptions, from sale of analytical
information products from the information center or through web subscriptions to
password enabled sections on its website. This may be a source of conflict since ECX
enjoys government support and would like farmers and traders to obtain as much
information as possible. Secondly, the ownership of cell phones and access to the
internet in Ethiopia is still very low.
322
A.3.4 The Fruit and Vegetable Market News - USA
Aims, Objectives, and Clientele Served
The Fruit and Vegetable Market News (F&VMN) was started in 1915 with the aim of
sharing information among growers, shippers, wholesalers, researchers, government and
other on supply, demand, and prices to ensure an efficient marketing systems (AMS,
1999, USDA, 2006).
Information Provided, Frequency, and Modes of Diffusion
The F&VMN disseminates market prices, supply estimates, and demand estimates on
over 400 fresh fruits, vegetables, nuts, ornamental and other specialty crops. Several
reports containing different types of information in various formats are disseminated
daily, weekly, annually, and at longer intervals through the website, e-mail, newspapers,
radio, television, fax, U.S. mail, and Market News Telephone Recorders. The Customer
Service Center in Fresno, CA, also provides customers with market information reports in
standardized formats (AMS, 1999, USDA, 2006).
The popularity and availability of each report changes by season. An example of
a daily report is the Shipping Point High/Low Highlights Report, which includes
information on imported and exported commodities through various US border crossing
points, the level (tone) of demand and supply, the basis of sale (e.g., FOB), the date of
entry, and low and high prices recorded. An example of a weekly report is the National
Fruit and Vegetable Retail Report, which includes weekly advertised prices by major
supermarkets and retail outlets for fruits and vegetables (AMS, 2008). Annual reports
include annual price summaries and fresh fruit and vegetable shipments (AMS, 2008,
AMS, 1999). Longer period reports include user guidance reports and manuals (USDA,

323
2006). Reports including rules and regulations related to import requirements for fruit
and vegetable are provided at longer intervals, usually more than a year (AMS, 1998).
Data Collection and Quality Control Methods
Data is collected by market reporters through confidential telephone and face-to-face
interviews. Quality control in collection is mostly achieved by training market reporters
throughout the United States in skills that enable them to collect and provide impartial,
current, and reliable information reports (AMS, 1999).
Institutional Home, Feedback Mechanism Used, and Sources of Funding
The F&VMN is part of the Agricultural Marketing Service (AMS) of the United States
Department of Agriculture (USDA). Feedback is obtained though (1) daily or almost
daily interactions with information providers, (2) customer and user surveys, and (3)
regular attendance and occasionally hosting industry events in order to interact directly
with the public and information users. Also, a customer satisfaction survey is conducted
on the AMS website by an independent company (Foresee Results). Information users
who visit the website are selected to fill in the customer satisfaction survey. The system
is funded by federal and state governments. Customers who need customized
information might be charged a fee depending on the complexity of their data requests.
A.3.5 National Agricultural Statistical Service (NASS) - USA
Historical Overview, Aims, Objectives, and Clientele Served
The collection of agricultural statistics in the USA dates back to the first population
census in 1790 which counted 4 million Americans at a time when 9 out of 10
Americans lived on farms (NASS, 2007). At that time, the distinction between
consumers and producers was small, and the government needed information on crops
324
planted and how to get good harvests. In 1840, detailed agricultural information was
collected through the first census of Agriculture. In 1862, USDA was established and in
1905, the USDA established the Agricultural Statistical Board. In 1961, USDA was
reorganized to create a statistical reporting service known as the National Agricultural
Statistical Service (NASS). Thus, the roots of NASS fall as back as 1863 when USDA
produced its first crop report (NASS, 2007). Presently, NASS disseminates information
on crop supply and demand estimates to enable farmers, businesses, policy makers,
researchers, and government to make better marketing, production, and storage and
investment decisions. NASS’s mission is it to provide timely, accurate, and useful
statistics in service to U.S. agriculture (NASS, 2010).
Information Provided, Frequency, And Modes of Diffusion
NASS provides information on approximately 27 crop categories disaggregated by state
and county level, and for different practices under which the crop is produced. A crop
may have several categories (e.g., corn for grain and corn for silage) and different
production practices (e.g., irrigated, or non-irrigated corn). Taking corn for grain as an
example, data is available for area planted in acres, area harvested in acres, yield per
harvested acre in bushels, production in bushels, marketing year average price per bushel
received by farmers, and the value of production in dollars (USDA-NAAS, 2008, USDA,
1999). Supply estimates consist of (1) beginning stock, (2) production, and (3) imports.
Disappearances include domestic use (food, seed, and feed) and exports. Other
information on government farm income- and price-support operations is provided such
as (1) income support payment rates per bushel in dollars and (2) program price levels
per bushel. Also, international information is published on area, yield, and production in
325
specified countries such as Argentina, Canada, European Union, India, and the Russian
Federation. Time series information is available on the NASS website.
Some reports are monthly (e.g. NASS crop production report) and World
Agricultural Supply and Demand Estimates (WASDE) released at 8:30 am between 9th
and 12th day of each month. Other annual reports are posted on the website (e.g.
Agricultural Statistics).
This information implies that NASS does not collect a lot of price data but
focuses on general agricultural statistics. For MIS in Africa, one critical question is how
they should relate to general statistics units within ministries of agriculture that are
charged with producing statistics on agricultural production (similar to NASS).
Data Collection and Quality Control Methods
NASS compiles US crop production data collected by approximately 50 different surveys
from farm operations and field observations, and from administrative sources. The types
of surveys include (1) Area Frame Samples which use satellite imaginary, aerial photos,
and maps to select segments of approximately 1 square mile but having enumerators visit
the segments to record information such as crops grown, animals reared, and grain
storage; (2) List Frame Samples in which selection of sampling units is based on a list
consisting of names, addresses, and telephone numbers of producers and agribusinesses
to obtain information on more concentrated commodities that are difficult to locate based
on area frame samples e.g., poultry. (3) Multiple Frame Samples which combine area
frame samples and list frame samples, (4) Nationwide Enumeration and Integrated
Surveys, and (5) Objective Yield Surveys.

326
The data collection methods vary by survey and commodity. Data may be
collected through Computer Assisted Telephone Interviewing (CATI), telephone
interviews, postal mail out/in questionnaires, on-line survey questionnaires, faxing back
filled in questionnaires, and by enumerators who visit producers and agribusinesses.
Taking corn in the crop/ stock survey as an example, information on what farmers
intend to plant is collected in March, information on acreage actually planted and acres
expected to be harvested is collected by survey from over 250,000 farmers by 2400
interviewers in June, and actual production data is collected in December mostly through
telephone interviews and computer-assisted telephone interviews (CATI). In some states,
a grain storage survey (on-farm grain stocks) is done in the first two weeks of December,
March, June, and September through telephone interviews and Computer Assisted
Telephone Interviewing.
Yield forecast are collected from a yield forecast survey of a subsample of
farmers growing crops of interests, and collected in May by enumerator who visit famer
fields and count the number of plants, ears, pods and bills. For some commodities and
programs, such as dairy product prices program, information reporting on production and
sales is mandatory. Administrative data are also obtained from private and public sources
such as area planted data for selected crops under the deficiency payments programs
before 1996; and utilization data about imports, exports, and cotton ginning.
Quality control is mostly ensured in the data collection process by (1) careful
selection and training of enumerators,(2)use of detailed instruction manuals, (3) field
supervision,(4) questionnaire checks, (5) comparison of reported acreage with those

327
measured on the aerial photographs, (6) and follow-up visits to some segments (NASS,
2009).
Institutional Home, Feedback Mechanism Used, and Sources of Funding
NASS is part of the United States Department of Agriculture and is funded by the federal
and state governments. Feedback on quality of information is collected through a random
customer satisfaction survey conducted by third party provider to the internet visitors.
Information users are given email, fax, and telephone contacts to send feedback to NASS.
A.3.6 The Indonesian Horticultural Market Information Service11
Aims, Objectives, and Clientele Served
The monitoring of vegetables prices in Indonesia started in 1979 with funding from the
German foreign assistance agency GTZ with the aim of helping producers to obtain
market information. Lack of market information and price fluctuations were a major
problem in horticultural marketing in Indonesia. The main clientele of the MIS are
farmers and traders; and government extension workers, planners and policymakers. The
monitoring of price information of other commodities in Indonesia started in the 1950s
(Shepherd and Schalke, 1995).
Information Provided, Frequency, and Modes of Diffusion
The MIS provides market news consisting of prices of vegetables, quality of the produce,
packaging of the produce, and minimum transaction volume. Information is collected at
production level (assembly markets) and at wholesale markets daily.
11The information in this review is from two dated reviews (Giovannucci and Shepherd, 2001, Shepherd and Schalke, 1995). There is limited literature on how the MIS is currently operating. The Ministry of Agriculture website has limited information on the MIS activities. The information in this section needs verification.

328
In 1995, information from markets was transmitted by phone, fax or radio to
headquarters. Presently, a method of using SMS to transmit cropped area, harvested area,
production, and farm level price data is being piloted. Information collected by SMS is
compiled in monthly and annual reports that are targeted for policy planers and policy
makers. In 1995, the MIS information was disseminated via local and national radio and
notice boards in markets daily. Information was also disseminated through newspapers
bi-weekly and on monthly basis12. At that time, there was limited feedback on how
relevant and useful the broadcast information was to users; there was no market analysis of
information at regional and national level for policy formulation, and no feedback and
return of analyzed reports from the headquarters to the regions.
Data Collection and Quality Control Methods
Data is collected by enumerators through face-to-face interviews and market observations
by reporters. In 1995, the MIS collected data for seventeen vegetables and fourteen
secondary food crops in the fourteen provinces. There were occasional failures to collect
information due to staff shortages when collectors are not replaced due to budget
restrictions. In some areas, there was limited training of enumerators, although the MIS
tried to conduct annual training of its staff.
Institutional Home, Feedback Mechanism, and Sources of Funding
By 1995, the National Market Information Service Unit was under the Ministry of
Agriculture in the Directorate of Food Crops and Horticultural Economics in the Sub-
Directorate of Marketing. At the provincial level, MIS activities were supervised by
Director of the Department of Food Crops and Horticulture in the Sub-Directorate of Food 12 There is need to verify whether the MIS presently uses email to transmit and diffuse information.

329
Crops and Horticultural Economics. At the district level, the MIS unit was under the
Marketing Section. At the start of the MIS, there were user needs studies. The MIS was
funded by government of Indonesia and received financial support from GTZ. There is no
recent literature on how feedback is sought.
A.3.7 The Integrated Agricultural Marketing Information System/ Agricultural
Marketing News Service (AGMARIS-AMNEWSS) - Philippines
Aims, Objectives, Clientele Served, and Historical Overview
The main aim of the AGMARIS is to provide information to producers and sellers of
agricultural commodities to make informed marketing decisions and to provide
information to be used by the public sector policy makers for food security planning and
monitoring. Agricultural Marketing News Services (AMNEWSS) was stated in 1968
under the Bureau of Agricultural Economics (BAEcon). AMNEWSS provided retail
prices mostly to be used by policy analysts in the Department of Agriculture. In 1987,
the Bureau of Agricultural statistics (BAS), in collaboration with many projects
supported by USAID, strengthened the collection, analysis, and dissemination of
information with more emphasis placed on private sector users. AMNEWSS expanded to
provide production, stock, and inventory data in addition to price data (Holtzman, et al.,
1993). In 1992, at the end of the projects, some of their activities were integrated to
create the Agricultural Market Information Systems (AGMARIS). In 1994,
AMNEWESS and AGMARIS were merged to create the Integrated AGMARIS-
AMNEWSS monitoring system (BAS, 2010).

330
Information Provided, Frequency, and Modes of Diffusion
Presently, AGMARIS-AMNEWSS provides buying and selling wholesale prices in 66
markets from 55 provinces or cities including Manila. AGMARIS-AMNEWSS also
provides retail prices from 105 markets from 81 provinces or cities including Manila
three times a week. The main commodity groups on which information is provided
include rice, fish, meat and poultry, vegetables, fruits, sugar, and cooking oil. The
information bulletins are available on the internet. BAS is one of the projects covered by
FAO countrySTAT, and its historical information can also be obtained from the internet.
Data Collection and Quality Control Methods
In the integrated MIS, the AGMARIS data collection method is applied in 30 markets,
and the AMNEWSS data collection method is applied in the rest of the markets.
AMNEWSS uses purposive sampling within markets, with 5 reporters chosen per
commodity three times a week. In the AGMARIS methodology, wholesale traders are
stratified by type (e.g., large distributor, provincial assembler, or medium distributor
among) and retail traders are stratified by location (e.g., whether they are inside the
market, outside the market or on streets). Five traders are selected per commodity to
provide information. The dates of collecting information from markets vary by market.
Several quality control methods are used in collection and analysis of the data. These
include spot checks of enumerators, data consistency checks, and review of entered forms
and questionnaires. During data entry and processing, data is inspected for missing data
(completeness), and inspection of tabulated data for any inconsistencies. Other methods
include looking at consistency of price with previous price trends and drastic changes in
price levels.

331
Institutional Home, Feedback Mechanism, and Sources of Funding
The AGMARIS-AMNEWSS is housed in the BAS and BAS is under the Department of
Agriculture. Funding for the system is from government.
A. 4 Farmer Organization-Based MIS
A.4.1 Observatoire du Marché Agricole (OMA) – Mali
Aims, Objectives, and Clientele Served
The Malian Agricultural Market Information System started in 1989 with the main aim of
helping government and donors to monitor how the cereals markets were performing
after the liberalization of the cereal markets, and to make informed food security policy
decisions. In addition, the MIS aimed at making the market transparent by providing
improved market information to private sector actors such as traders, farmers, consumers,
and cooperatives to enable them make better production, marketing, and consumption
decisions in a liberalized market. Banks are also important clients of OMA. The banks
use the price information to value grain inventories when traders pledge inventories as
collateral for loans for working capital.
In 1998, the MIS was restructured to ensure that it disseminated more reliable,
timely, and relevant information that met the specific needs of users in different
localities. The key elements of the restructuring included (1) transferring the institutional
home of the MIS from the grain board (OPAM) to a farmers’ organization, the Permanent
Assembly of the Chambers of Agriculture of Mali (APCAM); (2) decentralization, with
the creation of 24 local MIS offices (Unités locales de Collecte et Diffusion-ULCD)
around the country that collect and diffuse information; (3) linking the local offices to
local radio stations for localized market news broadcasts; (4) linking of the local offices

332
and the headquarters into a national and regional network (Dembélé, et al., 2000, Diarra,
et al., 2004, Keita, 2006, Traoré, et al., 2004).
Information Provided, Frequency, and Modes of Diffusion
OMA provides market news consisting of retail-, wholesale-, and producer prices;
traders’ stocks, and quantities traded; and market analysis to different users at different
frequencies using different modes of diffusion. For example, information on current and
past week prices and market supply collected from consumer and rural markets are
disseminated weekly via rural radios and newspapers to producers, merchants,
cooperatives, and consumers in local languages. A hard copy of the information bulletin
is hand delivered to at least one rural based radio per ULCD for diffusion in the main
local languages such as Bambara, Sarankole, Fulani, Dogon, Bobo, Songhai, Moor,
Tamachek, and French some locations. The list of annually contracted private radios
diffusing information is included in Table 38. OMA also uses the email and the internet
to obtain and disseminate national and regional information in ECOWAS countries’
market information networks (Traoré, et al., 2004). OMA is currently setting up an SMS
based dissemination platform to provide instant information to users.
OMA publishes monthly market information bulletins with market analysis on
how demand, supply and market prices of major crop commodities and livestock
products have evolved during the month and in the previous one-year period. The
information is provided on over 10 crop and livestock commodity categories. Major
crops include millet, sorghum, maize, rice, and horticultural commodities. Livestock and
livestock products include cattle, beef, goat, sheep, and poultry. The report also includes

333
information on quantities of crop commodities exported to neighboring countries (OMA,
2009). These reports are disseminated by email and are available on the website.
OMA also publishes special market reports with specialized analysis, such as the
effects of government policies, world production, and weather conditions on the
performance of agricultural food markets and food security in the country and in the
region. The analysis also includes factors that influence trends of market prices and
supply of major commodities (OMA, 2008). This kind of analysis targets policy makers,
donors, large-scale traders, and food aid agencies, and is mostly used in food security
planning.

334
Table 38: Contracted Private Radios Diffusing Market Information in Mali ULCD RADIO STATION START MONTH Number of
weekly broadcasts
1 KAYES RADIO RURALE (RRK)
JULY 2000 1
2 NIORO JAMANA AUGUST 2000 2 3 KITA JIGIYA AUGUST 2000 1 4 KOULIKORO JAMANA MAY 2000 1 5 DIOILA MARADEME AUGUST 2000 1 6 KATI BELEKAN MAY 2000 2 7 SIKASSO KENEDOUGOU JULY 2000 1 8 KOUTIALA UYESU JUNE 2000 2 9 SEGOU FOKO JUNE 2000 1 10 MACINA RADIO RURAL 105
MHZ JULY 2000 1
11 NIONO RADIO RURAL CESIRI JANUARY 2000 2 12 MOPTI JAMANA JUNE 2000 1 13 BANKASS SENO JANUARY 2003 1 14 BANDIAGARA RADIO BAGUINE JULY 2001 2 15 TOMBOUCTOU LAFIA JULY 2001 1 16 DIRE BINGHA JULY 2002 1 17 GAO ANNIA RFI SANEYE JUNE 2000 1 18 BAMAKO BENKAN JANUARY 2000 1 19 SAN PARANA NOVEMBER 2009 1 20 BLA PARANA 21 BOUGOUNI PARANA 22 NARA OUAGADOU OCTOBER 2009 2 23 KOURI OUAGADOU 24 DJENNE OUAGADOU 25 LERE LAFIA FEBRUARY 2008 2 26 KIDAL LAFIA 27 ORTM
(TV+RADIO) LAFIA
Source: OMA
Data Collection and Quality Control Methods
OMA employs 23 permanent and 10 temporary enumerators who collect information
from 21 rural and 30 urban markets using face-to-fate interview and observations. The

335
enumerators transmit the information by SMS or by email to the decentralized offices of
district chambers of agriculture and to the OMA central office in Bamako.
OMA tries to ensure data quality through use of trained enumerators, automated
processing and error check programs during data entry, and close supervision of
enumerators. OMA has a monitoring department that works to ensure that enumerator
follow the established methods of data collection. The MIS also has technical and
oversight committees that guide the MIS in its activities (Diarra, et al., 2004).
Institutional Home, Feedback Mechanism Used, and Sources of Funding
OMA is housed in a farmer organization called the Permanent Assembly of Chambers of
Agriculture of Mali (APCAM). The housing of the MIS in the farmer organization has
increased its credibility among farmers, who are one of the main clientele of the MIS.
The MIS obtains feedback from user needs surveys well as informal interaction with
market participants; external evaluation by donors; customer satisfaction surveys; and
analysis of SMS and website usage.
OMA is managerially autonomous and is partly funded by the government and
from own-generated resources generated through conducting specialized market research
at the request of customers such as the government and donors. The proposed SMS
platform for disseminating information will also be an additional source of revenue when
implemented. The MIS has collaborative links with research organizations in Mali, the
West African region; the West Africa Market Information System Network (RESIMAO),
for which it serves as the Technical Secretariat; and Michigan State University. These
collaborative linkages have facilitated OMA to develop a human capital base that can
produce high-value market research products that are used in policy making. This in turn
336
creates demand for its products from government and donors, and consequently
contributes to its financial sustainability.
Challenges to OMA
OMA has faced several challenges since the transition in 1998 from an MIS based in a
grain board (OPAM) to a farmers’ organization. These included long bureaucratic
routines, lack of entrepreneurial spirit, too few targeted products towards different users,
and lack of a strategy to wean the MIS system from external funding (Staatz, 2007).
OMA also faces challenges in meeting the future information needs of users resulting (1)
regionalization, (2) the need for market extension, and (3) the need for improved
information on grades and standards (Dembélé, et al., 2000) . Regionalization of the
Malian agricultural economy implies more inter-regional trade. This means that OMA
has to develop a cost-effective ways to provide timely regional market information to
Mali’s private sector to facilitate regional trade. OMA also has to provide regional
information to government for policy and food security analysis such as examining the
benefits of regional trade on the potential to design market-compatible safety nets for the
poor. OMA also faces a challenge of providing appropriate marketing extension
materials and to strengthen its capacity to develop and implement marketing extension
programs aimed at enabling information users to make better commercial decisions with
the information provided. OMA is also challenged with the need to provide market
participants with information on quality requirements in the in the different market
segments.

337
A.4.2 The Zambia National Farmers Union SMS Market Information Services
Aims, Objectives, and Clientele Served
The Zambia National Farmers Union ZNFU 4455 SMS MIS started in 2006 with the aim
of providing market information to smallholder farmers so as to increase their bargaining
power to negotiate for better prices, and to link them with local and national traders and
processors. Other targeted users of the SMS MIS include traders, commercial farmers,
donors, and millers.
Information Provided, Frequency, and Modes of Diffusion
The ZNFU SMS MIS collects and disseminates prices and buyer contact information on
four livestock and ten crop commodities on a weekly basis. The crop commodities
include beans, cassava, groundnuts, honey, maize, rice, sorghum, soybeans, sunflower
and wheat. Livestock commodities include beef, goats, pigs and sheep. Information is
uploaded weekly and users can request information at any time using a pull SMS system
on prices offered by registered traders and their contact details.
Users (sellers) send an SMS to 4455 including a commodity code and location for
which market information is needed (e.g., MAIZ PLSK for maize prices in Lusaka). The
sender receives a text message indicating the names of registered buyers and the prices
they offer for the selected commodity in the selected location. The sellers than send a
second SMS to 4455 including a preferred buyer code and receive contact details of the
particular buyer. The seller can then call the buyer to negotiate and conclude the
transaction. The users can access the data base for SMS information through the Zain
and Cell Z network. In 2009, MTN subscribers could not use the system. Price
information and trader contact details are also uploaded on the website
338
(www.famprices.co.zm). The system also disseminates market information and
information on how to use the service on a radio program.
Due to limited demand, the system planned to increase the number of
commodities to include information on vegetable traders, fertilizer and seed companies,
veterinary service providers, and transporters. This has not yet been done. The system
also advertised its services to increase its popularity among farmers, extension workers,
traders, and processors (SHEMP-ADC, 2006, ZNFU, 2007).
Crop-Specific and Seasonal Demand of SMS Information in Zambia
Table 39 shows that from October 2006 to November 2007, maize accounted for 58
percent of the SMS requests, and the top four commodities (maize, soybeans, goats, and
groundnuts) accounted for 83 percent of the total SMS requests in the ZNFU system in
Zambia. Figure 6 shows that the highest requests for SMS occurred in the month of June,
July and August, suggesting that the demand for SMS information is (1) crop-specific
and (2) seasonal. Figure 6 shows that the peak request months for maize, soybeans and
groundnuts were June, July, and August. These months fall in the middle of the peak
harvest and marketing months reported by farmers and traders, which range from April to
September, depending on the province.
Table 39 and Figure 6 suggest that the design of MIS can be based on (1) demand
for market information on specific crops and (2) seasonal demand of market information
during the peak marketing periods. For example, ZNFU could consider focusing on
providing market information for the 4 commodities for which information requests are
the highest. Alternatively, a seasonal MIS could be designed so that there is more
frequent collection and diffusion of market news and analytical information in the peak
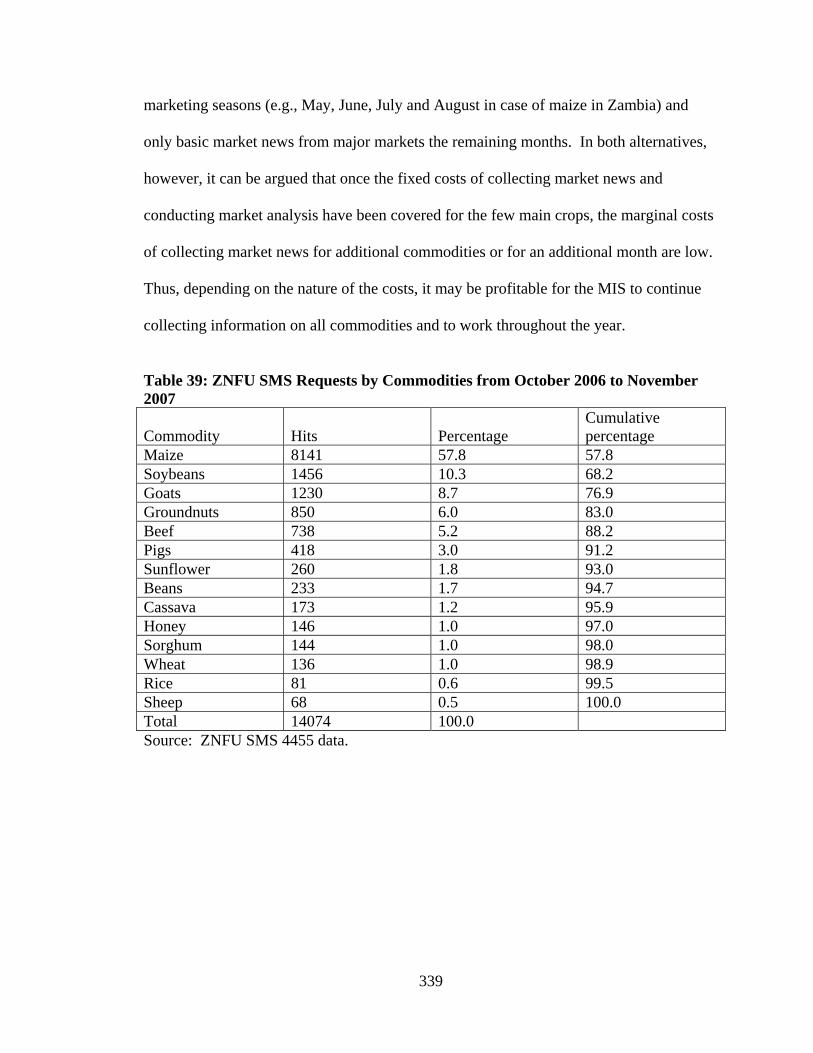
339
marketing seasons (e.g., May, June, July and August in case of maize in Zambia) and
only basic market news from major markets the remaining months. In both alternatives,
however, it can be argued that once the fixed costs of collecting market news and
conducting market analysis have been covered for the few main crops, the marginal costs
of collecting market news for additional commodities or for an additional month are low.
Thus, depending on the nature of the costs, it may be profitable for the MIS to continue
collecting information on all commodities and to work throughout the year.
Table 39: ZNFU SMS Requests by Commodities from October 2006 to November 2007
Commodity Hits Percentage Cumulative percentage
Maize 8141 57.8 57.8 Soybeans 1456 10.3 68.2 Goats 1230 8.7 76.9 Groundnuts 850 6.0 83.0 Beef 738 5.2 88.2 Pigs 418 3.0 91.2 Sunflower 260 1.8 93.0 Beans 233 1.7 94.7 Cassava 173 1.2 95.9 Honey 146 1.0 97.0 Sorghum 144 1.0 98.0 Wheat 136 1.0 98.9 Rice 81 0.6 99.5 Sheep 68 0.5 100.0 Total 14074 100.0 Source: ZNFU SMS 4455 data.
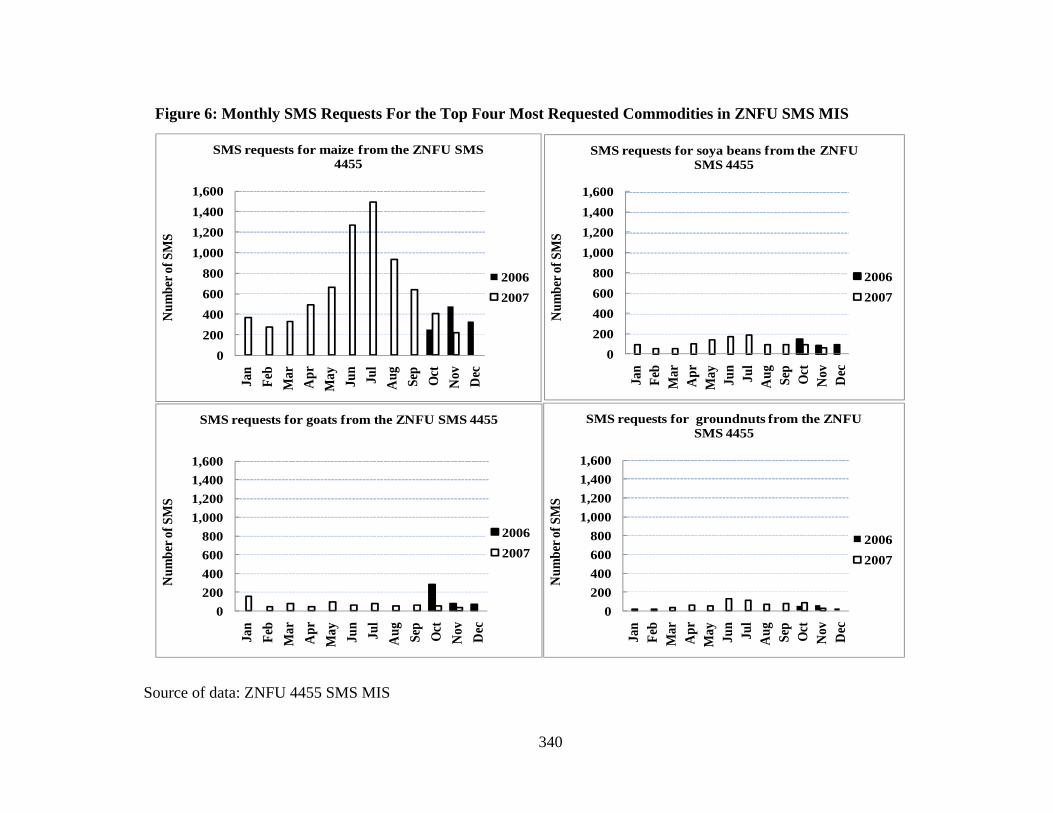
340
Source of data: ZNFU 4455 SMS MIS
Figure 6: Monthly SMS Requests For the Top Four Most Requested Commodities in ZNFU SMS MIS
0200400600800
1,0001,2001,4001,600
Jan
Feb
Mar
Apr
May Jun
Jul
Aug Sep
Oct
Nov Dec
Num
ber o
f SM
S
SMS requests for soya beans from the ZNFU SMS 4455
20062007
0200400600800
1,0001,2001,4001,600
Jan
Feb
Mar
Apr
May Jun
Jul
Aug Sep
Oct
Nov Dec
Num
ber o
f SM
SSMS requests for maize from the ZNFU SMS
4455
20062007
0200400600800
1,0001,2001,4001,600
Jan
Feb
Mar
Apr
May Jun
Jul
Aug Sep
Oct
Nov Dec
Num
ber o
f SM
S
SMS requests for goats from the ZNFU SMS 4455
20062007
0200400600800
1,0001,2001,4001,600
Jan
Feb
Mar
Apr
May Jun
Jul
Aug Sep
Oct
Nov Dec
Num
ber o
f SM
S
SMS requests for groundnuts from the ZNFU SMS 4455
20062007

341
Table 39 and Figure 6 do not show or identify the geographical variations in demand for
market information in different parts of the country. This is partly because it is difficult
to tell where users of mobile phones are located when they request for information. It is
likely that the location of users could be verified by the SMS (cell phone) service
providers, and a future study could look at the geographical variation in demand for
information. This information could also guide investments in SMS and other types of
MIS by refining the collection and targeting methods so that diffusion follows the
geographic and seasonality flow of information demand in various parts of countries with
SMS MIS.
Data Collection and Quality Control Methods
The information officer calls traders and millers to inquire about their buying prices.
Traders may also send emails or call ZNFU to provide the information on a weekly basis.
This information is then uploaded in a database at ZNFU weekly. It should be noted that
information users request by SMS may be received instantly but they may receive old
information in response, especially when information is not frequently updated on the
server.
Institutional Home, Feedback Mechanism, and Sources of Funding
The system is housed in the Zambia National Farmers Union, a farmer organization. The
ZNFU conducts other services such as farmer training; input provision (including
experimental cell phone distribution among members from cell phone companies);
organization, management and marketing support; and storage exchange.

342
For feedback, farmers are encouraged to write to their regional managers about
the quality of the information. The regional managers then present the comments during
monthly meetings at the national level. Also, regional managers verify whether the
prices submitted by traders and millers are the ones they are actually buying at by calling
the traders and asking their buying prices anonymously and comparing to those offered to
union members. The MIS has an enforcement code (punishment strategy) for traders or
millers who pay lower prices than those reported to the MIS. The punishment strategies
include suspending posting of the buying prices of a buyer on the ZNFU 4455 SMS MIS.
The problem is that market prices can change in a short interval after a buyer submits
information, and this may result in a punishment even when the true market prices have
changed. This is especially the case because it is the MIS manager who calls the traders
for information and not the other way round. The manager could take longer time to call
and update the information on the server. In other words, the MIS does not use a wiki-
approach where users can post information on the server. Even if the MIS used a wiki
approach, there may be situation where prices change but traders are not be able to update
information on the website, such as when there is a power cut, the internet is down, or
lack of airtime to update the server with information. Receiving a punishment due to
circumstances out of the control of the trader would hurt them.
The MIS also monitors weekly logs on the website to determine the location of
internet-based information users. A high number of hits indicate users like the
information and a lower number of hits indicate that they don’t. In addition, the MIS
conducts raffles at district shows where they quiz the farmers to gauge their knowledge of

343
the SMS MIS and whether they use the information. They also conduct user surveys
where they ask the opinion of users about the MIS.
To avoid disagreements over quality, farmers are expected to supply grade A maize to
millers and grain traders. Farmers are trained in workshops on the grades and standards
of maize required by traders. Farmers are also encouraged to take a sample of the produce
to buyers before they deliver large volumes on trucks. The process of farmers taking a
sample to traders declines over time as farmers learn the quality requirements and as
traders learn the reputation in terms of quality delivered by different farmers. This is
consistent with the hypothesis that the utility of market information is higher when it is
provided with other complementary services.
By 2007, the system was funded by the Ministry of Agriculture and Cooperatives
with support from IFAD and from other donors such as USAID. Other supporters
included Vodacom DRC and AfriConnect/CelTel (Gakuru, et al., 2009). These cell
phone companies presumably support the system in the belief that wider use of the
system will increase purchases of airtime. Presently, users are charged a fee of about
ZMK 500 (approximately US $0.11) per SMS depending on the network provider,
although the money obtained from SMS requests cannot meet the running costs such as
phone, internet, and administrative costs. Currently, the system is supported by the
ZNFU budget, project funding from donors, and some advertisement revenue.

344
A. 5 Private MIS
A.5.1 Reuters Market Light ('RML')
Aims, Objectives, and Clientele Served
The Reuters Market Light ('RML') started in October 2007 in India with the aim of
making agricultural markets more transparent by providing market information to farmers
and farmers associations, and consumers. Other users of RML services include traders,
chambers of agriculture and commerce, value chain actors, NGOs, researchers, and
government. It was anticipated that RML would contribute towards more efficient and
fair markets, and increase productivity among farmers in the Indian state of Maharashtra
(Thomson-Reuters, 2007). RML was designed explicitly as a profit-making venture and
presently provides market information in 13 states of Punjab, Haryana, Himachal
Pradesh, Uttar Pradesh, Uttarakhand, Madhya Pradesh, Rajasthan, Gujarat, Maharashtra,
Andhra Pradesh, Karnataka, Tamil Nadu, and West Bengal.
Information Provided, Frequency, and Modes of Diffusion
RML disseminates producer prices, quantities traded, weather forecasts, and crop
information (e.g., on pest or disease outbreak) through SMS to subscribing farmers every
24 to 48 hours. Other information provided includes export and import volumes, grades
and standards, credit sources, harvest and price forecasts, marketing extension, and
contacts of buyers and sellers. Initially, RML provided information on soybeans, cotton,
wheat, paddy, maize, onion, and gram. Presently RML provides information on more
commodities, including poultry feed, cattle fodder, fruits and vegetables, other cereals

345
and pulses, oilseeds, weather forecasts, crop advisory information, and other agricultural
news.
RML provides more kinds of information than that provided by African MIS.
This is most likely because RML does not produce all this information itself. Rather, it is
embedded in a system in India in which it can source such information from other public
and private providers. This points out the importance of making the distinction between
the system to distribute the information and the system to produce it. It also emphasizes
the importance of the capacity of the underlying system of the country in which the MIS
is based to generate the basic information.
Data Collection and Quality Control Methods
Data is collected daily by about 200 outsourced reporters from over 1200 rural and 50
urban markets in India and is transmitted entirely by SMS. The collectors are outsourced
through an agency and therefore not employees of RML. The quality control methods
used include refresher training courses for data collectors (implying that RML does not
use Wiki approaches where users SMS or update the web), regular supervision and
monitoring of data collectors, unexpected market visits to monitor the data collectors, and
data entry control and validation programs and procedures (such as use of data entry error
check programs).
Institutional Home, Feedback Mechanism Used, and Sources of Funding
The RML is a private MIS with funding from the markets division of Thomson Reuters,
and from user subscription fees. RML is now an integrated part of the Thomas Reuters
business, and is no longer an ‘innovation project’. Users subscribe to receive information
at the local post offices (Arango, 2008, Thomson-Reuters, 2007). The subscription fees

346
are Rs. 175 ($4) for three months, Rs. 350 ($8) for six months, and Rs. 650 ($15) for a
year. Subscribed users receive 4 SMS per day for two chosen crops (Mittal, et al., 2010).
The RML also gets support from handset manufacturers—e.g., Nokia’s Life Tools—and
in-kind contribution in form of content from government funded agricultural institutes
(Arango, 2008, Preethi, 2009, Thomson-Reuters, 2007). This implies that RML
distributes content provided by others, which enables it to provide more types of
information to users. Feedback is obtained from the analysis of URL usage and text
message requests, meetings with users and through users’ assessment and needs surveys,
and customer satisfaction surveys.
The challenges to the system include the low percentage of rural farmers with
mobile phones and low literacy rates among farmers (Arango, 2008). Another challenge
is in translating the information into local languages due to difference in fonts of the
different alphabets and lack of software upgrades by cell phone users (Preethi, 2009).
Other problems encountered were that there are many varieties of crops grown in the
different states, which make designing of the SMS database more difficult in terms of
putting the information in formats that can be presented to end users.
A.5.2 Esoko – Ghana
Aims, Objectives, and Clientele Served
Esoko stated in 2005 under the name Tradenet, initially with the aim of linking producers
to markets at national and regional levels in eight African countries consisting of Ghana,
Mali, Burkina Faso, Nigeria, Ivory Coast, Sudan, Mozambique, and Madagascar.
Presently, Esoko-Ghana aims at providing internet-based technologies (software) for
price collection and distribution to private and public institutions in several countries.

347
Thus, the main distinction of Esoko from other MIS is that it is mainly in the business of
developing and selling a market information distribution platform to various countries.
Only in Ghana does it engage in market information collection itself, and the subsequent
description is for Esoko – Ghana only.
Information Provided, Frequency, and Modes of Diffusion
In Ghana, Esoko provides market information (retail and wholesale prices), exchange
rates, offers to buy and sell different commodities (inventory of sellers), transport costs,
weather disease notification, and extension messages. Esoko uses a push SMS (see
below), its website, and email to disseminate information to users. In the push SMS
system, market information is compiled in text messages and is sent to subscribing users.
The majority of the subscribing users are subsidized by development projects (e.g.,
Nestle, Unilever, and USAID). The projects distribute phones to users and pay Esoko to
disseminate the information of interest to the users (Kutsoati and Bartlett, 2008). This
implies that the effective demand for information is mostly from development projects on
behalf of farmers. Users can also post information about the commodities they want to
sell and buy using an SMS. The information is posted on the website and also sent using
the push SMS system to other subscribed users.
Data Collection and Quality Control Methods
Esoko collects data using three approaches. In the first approach, 30 enumerators
employed by Esoko collect information by observation in the approximately 30 urban
markets weekly. Data processing is conducted by 8 permanent employees. Esoko has a
total of 40 permanent staff and 5 contract employees. In the second approach, secondary
data from other established MIS in different countries is uploaded to an internet-based

348
database. In the third approach, individual MIS users can use SMS to upload the
information about the commodities they wish to sell or buy. Some of the information
users can load by SMS onto the internet includes the country where the goods are located,
the origin, quantity in metric tons, price, grade, the duration of the offer, payment
method, delivery point, delivery time, and the name and telephone contact of the seller.
The Esoko system is not similar to the ZNFU 4455 SMS MIS where users obtain only
prices and contact information of commodity traders. The main question in the third
approach is on how information provided by users is verified and how conflicts arising
from transactions based on wrong information are settled between sellers and buyers.
Quality control in Esoko-Ghana is through training enumerators, regular supervision and
monitoring of data collectors, unexpected market visits to monitor the data collectors, the
use of data entry control and validation programs and procedures, and verification and
test after data capture.
Institutional Home, Feedback Mechanism Used, and Sources of Funding
Esoko is a private sector MIS firm. The feedback mechanisms used by Esoko include
potential MIS users’ assessment or needs surveys, customer satisfaction surveys,
meetings with users, and monitoring information downloaded from SMS and websites.
Funding for Esoko activities comes from subscription fees from NGOs, and farmers’ and
traders’ organizations, and private firms. Esoko also receives contributions from donors,
charity organizations, and generates funds from its other activities. All information on
the website can be accessed without restrictions, but users incur their personal internet
access costs. Esoko is piloting the following pricing strategy among 4 categories of users
for the usage of its information exchange platform: The first category, called the Bronze

349
group, consists of individual traders and researchers. Members in this category are
charged up to $25 for 10 SMS alerts per week. The second category, called the Silver
group, consists of small businesses and exporters and is charged $250 to use the Esoko
information web-based platform and to send 10 SMS alerts to a maximum of 200
members per week. The third category, called the Gold group, consists of farmer groups,
businesses and small NGOS and is charged up to $1,500 to use all tools on the Esoko
information exchange platform and to send information up to 2,000 members per week.
The fourth category, called the Platinum group, consists of large businesses and
associations, consumer brand companies, large NGOs, and government and is charged
$8,000 use all tools on the Esoko information exchange and to provide information
products to an unlimited number of users per week (Davies, 2010). Esoko predicts that it
will take it 4 years to become profitable, and its target is to have 6,000 subscribers in the
bronze group, 2,000 subscribers in the silver group, 200 subscribers in the gold group,
and 20 subscribers in the platinum group. Esoko faces the challenges of lack of empirical
ways of evaluating how effective their services are benefiting users. This has probably
limited financial support from some stakeholders such as donors, private companies, and
government.
The cost of use of the service by individual farmers is likely to be the same as that
of individual traders ($25 for 20 SMS alerts per week). It is not clear whether this
information covers the subscribers’ costs of sending an SMS to request for information or
whether it covers the cost of receiving the “push” SMS from the MIS for information
users subscribe for only. The use of information per week, however, cannot be
generalized to yearly usage because farmers may be selling once or twice in a year
350
(season(s)). This makes comparison of cost per usage and the GDP per capita (estimated
at $709 in 2008) difficult.
A.5.3 KACE Market and Information Linkage System – Kenya
Aims, Objectives, and Clientele Served
The Kenya Agricultural Commodity Exchange (KACE) Market and Information Linkage
System is a private firm and started in 1997 with the aim of facilitating linkages between
sellers and buyers of agricultural commodities. KACE’s clientele consists of traders,
farmers, importers, exporters, brokers, processors, and consumers (Meuleman, 2007).
KACE also aims at increasing market transparency, increasing the bargaining power, and
the competitiveness of farmers and traders in agricultural markets.
Information Provided, Frequency, and Modes of Diffusion
KACE provides daily market news (retail, wholesale, and producer prices, exchange
rates, offers to sell, and bids to buy) to market participants at different frequencies and
using several methods. For example, fax machines, telephones, websites, and emails are
used to send information from KACE headquarters in Nairobi to the district-level Market
Information Centers (MICs) in Eldoret, Bungoma, and Kisumu, and to rural based
Market Information Points (MIPS) in Western, Nyanza, Rift Valley, and Eastern
provinces of Kenya. The MICs and MIPs were established by KACE.
The information is then posted on bulletin boards in MICs and MIPS, where
farmers can read it. Market information is also disseminated using SMS (SMS Sokoni) at
a user fee equivalent to the cost of the SMS. Also, an Interactive Voice Response (IVR)
enables users to dial a telephone number into a voice mail to listen to market information.
A website with a restricted area where access is at a fee is also used to disseminate

351
information. In addition, market information consisting of price, offers and bids for
maize and beans is disseminated weekly through a radio program (Meuleman, 2007,
Tollens, 2006). Although the KACE Market and Information Linkage System is linked
to an exchange, the prices it disseminates are not a byproduct of the trading activities on
the exchange because of low volumes traded and low frequency of trade, probably
because maize and other staple commodities in Kenya have several alternative marketing
channels.
Data Collection and Quality Control Methods
Data is collected by 8 permanent and 2 part-time reporters from 4 rural and 5 urban
markets using one-on-one interviews and direct observation. KACE also has 5
employees in the processing unit. Some of the methods used to ensure that data is of
good quality are training enumerators, regular supervision and monitoring of data
collectors, unexpected market visits to monitor the data collectors, the use of data entry
control and validation programs and procedures, verification and test after data capture,
and obtaining opinions of the MIS users.
Institutional Home, Feedback Mechanism Used, and Sources of Funding
The KACE Market and Information Linkage is housed in a commodity exchange. The
feedback mechanisms used by KACE include potential MIS users’ assessment or needs
surveys, customer satisfaction surveys, external evaluations by donors and third parties,
meetings with users, and monitoring information downloaded from SMS and websites.
KACE was started using personal savings of the director. Other sources of
funding include funding from donors, fees paid by bidders to place commodities for sale
through the exchange and on accomplished bids and offers by individual farmers and

352
traders. Some resources are obtained from researchers (research fees), subscriptions for
information, SMS information requests and use of IVR services. For example, traders or
farmers are charged an initial placement fee of about $1.50-$15 per offer or bid
depending on volume of the bid or offer. Once the trade occurs, a 0.5 percent to 5
percent commission is charged. Researchers are charged negotiable fees ranging from
$2,000 to $ 4,000 per visit for conducting research with KACE. KACE also charges
approximately $500 for time series data on a commodity for a year and information
subscription fees of US$ 65 for 6 months and US$ 125 for 12 months (Kundu and
Mukhebi, 2010). KACE also transformed or franchised its MIPs into Market Resource
Centers with more income-generating activities such as offering storage, fax, computer,
and photocopying services at a cost to users (Meuleman, 2007).
The main changes observed by KACE are that communication has been made
easier and faster with the increase in mobile phones. The main challenge is that the
literacy rate among farmers is still high, which means that some channels of
disseminating information that require literacy are not effective. This means the MIS has
to use multiple channels to disseminate information, which increases costs. KACE also
notes that running the service is expensive and that there is poor infrastructure (e.g.,
feeder roads), which in some cases makes farmers to fail to respond to useful
information.
A. 6 Conclusions From Global Review and Cases Studies
The main issues that come out of the case studies of MIS are that:
1. There is a large range of information beyond price and quantity data that users stated
they need, but which most MIS are not providing. Such information includes price
353
and quantity forecasts, regulatory information, analytical information about market
dynamics, stock and inventory information, contracts and conditions needed to fulfill
them, quality requirements, grades and standards, and phytosanitary specifications.
Other “missing” information includes transport costs, and credit sources.
2. Most MIS reviewed collect and disseminate basic market information on prices on
major commodities in the countries but not market analysis and business reports.
Most MIS do not provide information on transport costs and transport availability and
price forecasts.
3. The information from private MIS is mostly targeted to farmers and traders. In
contrast, in addition to providing information to farmers and traders, public MIS
provide extra information products, such as market analysis, to governments and
donors for policy formulation and monitoring. Public MIS also tend to cover more
products, wider geographical areas, and provide more market analysis than private
and farmer managed MIS.
4. Private MIS put a lot of emphasis on the use of cell phones in information
dissemination. It is not clear, however, whether rural farmers can effectively use cell
phones to receive market information. It seems that more organized farmers (e.g.,
farmer group and associations members) prefer to receive tangible and storable
information, which makes bulletins their preferred channel of disseminating
information.
5. There is weak or limited supervision of data collection among public MIS. (e.g.,
Mozambique SIMA and Zambia AMIC).

354
6. There is weak or lack of effective demand for some of the information products from
some of the publically funded MIS by individual users, private sector firms, and
farmer organizations (e.g., Mozambique SIMA and Zambia AMIC).
7. Apart from RML, most of the private and farmer organization -based MIS are still
substantially subsidized by external donors, projects, and NGOs. It is worth noting
that RML operates in India, where the density of potential clients (farmers, traders,
and input providers) is much higher than in Sub-Saharan Africa.
8. Radio may still be the most efficient way of disseminating information to farmers and
rural based traders, while print media (e.g., bulletins, magazines, and newspapers) can
be used to diffuse information to some literate farmers and traders in urban areas.
9. There is need to increase incentives of MIS workers so that they collect information
regularly and to for the MIS to be able to retain good quality staff at national,
provincial, and district levels.
10. MIS have limited budget support from governments for funding data collection
equipment and facilities such as vehicles, computers, phone lines, and motorbikes and
allowances.

355
A. 7 Checklist Used in The Case Studies for Information Providers and User In
Mozambique, Ethiopia, and Zambia
Part I: For the Market Information Systems 1. Aims, objectives, and clientele served
a. What are the main objectives of the MIS? b. Who are the main clientele of the MIS?
2. Information provided, frequency, and modes of diffusion a. What information is provided to MIS clients? b. How frequently do you provide each type of information? c. What are the channels/modes of dissemination of the information to users? d. What are the advantages and opportunities of disseminating information using
each type of dissemination channels/modes? e. What are the disadvantages and challenges of disseminating information using
each type of dissemination channel? f. How have the costs of disseminating information changed due to the use of
different information and communication technologies (e.g., cell phones and the internet)?
g. How has the time duration from collection to dissemination of information changed due to the use of different information and communication technologies?
h. Who is the owner of the information collected by the MIS? i. What are the other sources of information for the MIS information users?
3. Data collection and quality control methods a. How is market information collected from the markets b. Who collects the information? c. What are the technologies used to transmit market information from the markets
to the MIS? d. How has the introduction of mobile phones and the internet changed the cost of
collecting Market information? e. What quality control methods are used by the MIS to ensure that users obtain
accurate, timely, and reliable information during data collection, transmission, and dissemination?
4. Feedback mechanism used and decisions made with the information by stakeholders
a. What is the institutional home of the MIS? b. What methods are used by MIS to understand the needs of the users? c. How does the MIS obtain feedback from information users? d. How are the MIS outputs used by stakeholders (e.g., governments, donors,
consumers, traders, farmers) in decision-making?
5. Fund mechanisms to ensure sustainability. a. What are the different ways in which the MIS generate funds for their activities?
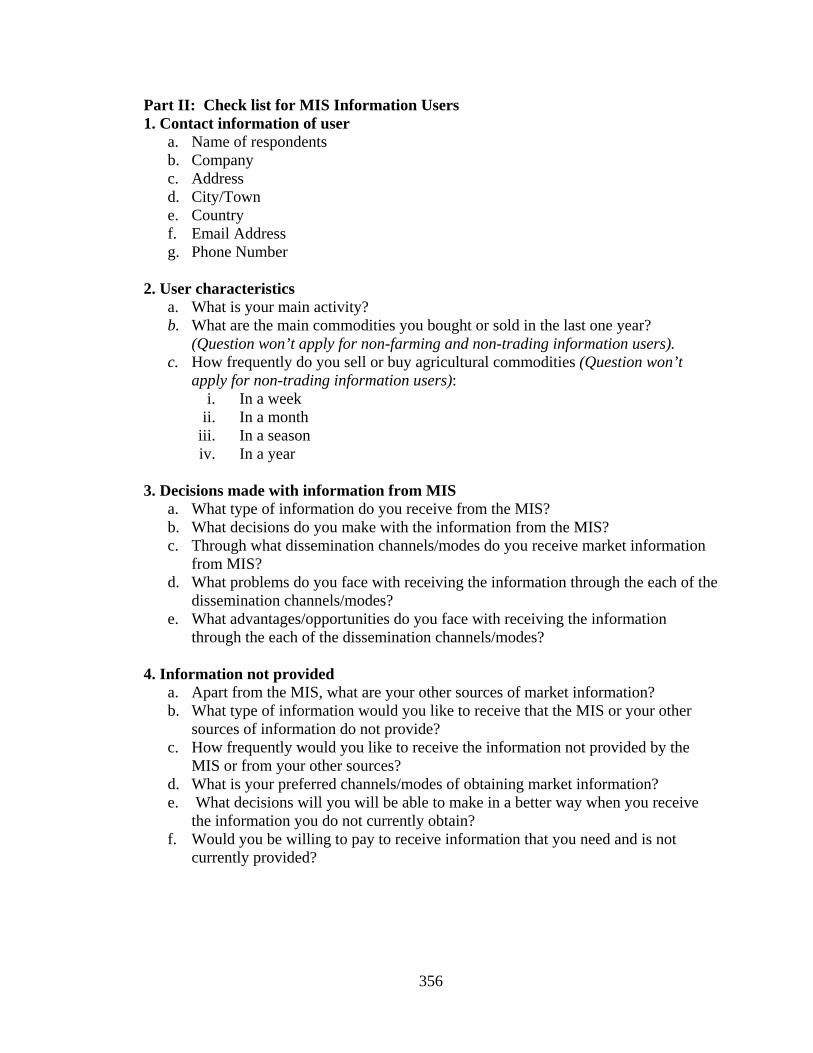
356
Part II: Check list for MIS Information Users 1. Contact information of user
a. Name of respondents b. Company c. Address d. City/Town e. Country f. Email Address g. Phone Number
2. User characteristics
a. What is your main activity? b. What are the main commodities you bought or sold in the last one year?
(Question won’t apply for non-farming and non-trading information users). c. How frequently do you sell or buy agricultural commodities (Question won’t
apply for non-trading information users): i. In a week
ii. In a month iii. In a season iv. In a year
3. Decisions made with information from MIS
a. What type of information do you receive from the MIS? b. What decisions do you make with the information from the MIS? c. Through what dissemination channels/modes do you receive market information
from MIS? d. What problems do you face with receiving the information through the each of the
dissemination channels/modes? e. What advantages/opportunities do you face with receiving the information
through the each of the dissemination channels/modes?
4. Information not provided a. Apart from the MIS, what are your other sources of market information? b. What type of information would you like to receive that the MIS or your other
sources of information do not provide? c. How frequently would you like to receive the information not provided by the
MIS or from your other sources? d. What is your preferred channels/modes of obtaining market information? e. What decisions will you will be able to make in a better way when you receive
the information you do not currently obtain? f. Would you be willing to pay to receive information that you need and is not
currently provided?
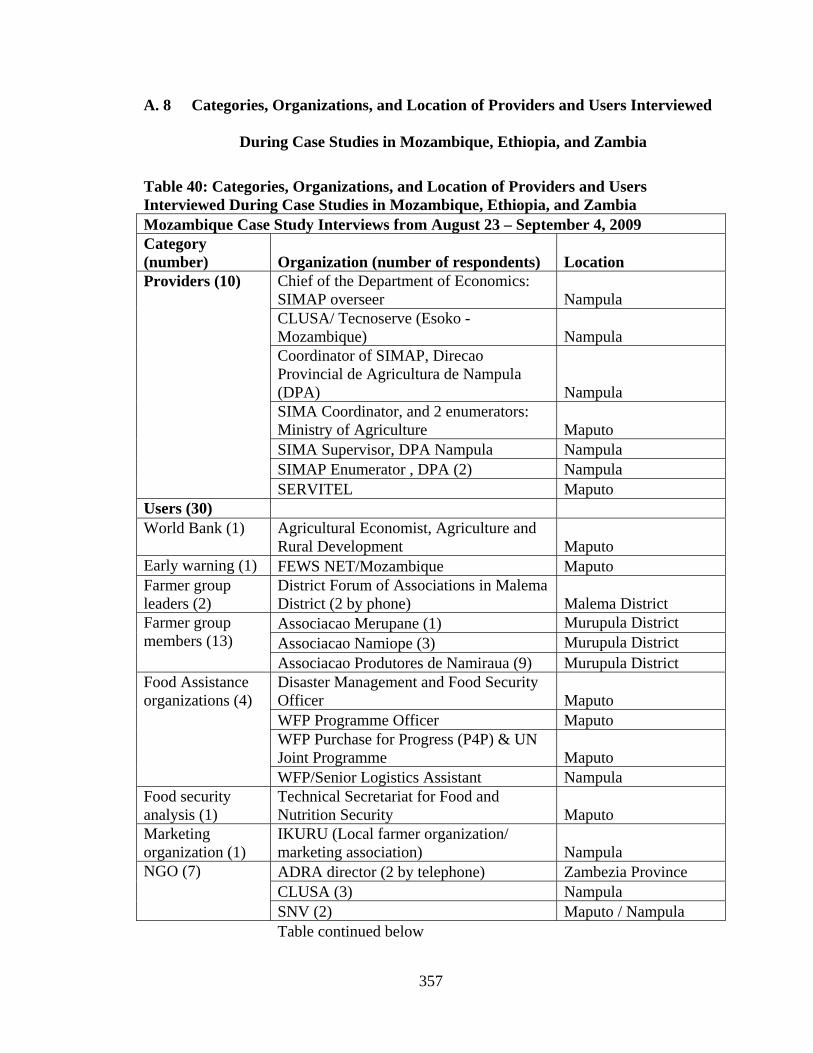
357
A. 8 Categories, Organizations, and Location of Providers and Users Interviewed
During Case Studies in Mozambique, Ethiopia, and Zambia
Table 40: Categories, Organizations, and Location of Providers and Users Interviewed During Case Studies in Mozambique, Ethiopia, and Zambia Mozambique Case Study Interviews from August 23 – September 4, 2009 Category (number) Organization (number of respondents) Location Providers (10) Chief of the Department of Economics:
SIMAP overseer Nampula CLUSA/ Tecnoserve (Esoko -
Mozambique) Nampula Coordinator of SIMAP, Direcao Provincial de Agricultura de Nampula (DPA) Nampula SIMA Coordinator, and 2 enumerators: Ministry of Agriculture Maputo SIMA Supervisor, DPA Nampula Nampula SIMAP Enumerator , DPA (2) Nampula SERVITEL Maputo
Users (30) World Bank (1) Agricultural Economist, Agriculture and
Rural Development Maputo Early warning (1) FEWS NET/Mozambique Maputo Farmer group leaders (2)
District Forum of Associations in Malema District (2 by phone) Malema District
Farmer group members (13)
Associacao Merupane (1) Murupula District Associacao Namiope (3) Murupula District Associacao Produtores de Namiraua (9) Murupula District
Food Assistance organizations (4)
Disaster Management and Food Security Officer Maputo WFP Programme Officer Maputo WFP Purchase for Progress (P4P) & UN Joint Programme Maputo WFP/Senior Logistics Assistant Nampula
Food security analysis (1)
Technical Secretariat for Food and Nutrition Security Maputo
Marketing organization (1)
IKURU (Local farmer organization/ marketing association) Nampula
NGO (7) ADRA director (2 by telephone) Zambezia Province CLUSA (3) Nampula SNV (2) Maputo / Nampula
Table continued below

358
Table 40(Continued) Category (number) Organization (number of respondents) Location Traders (8) Gorongosa, Matadouro and Mwatala (6) Nampula
Xipamanine market (2) Maputo Ethiopia Case Study Interviews from September 13 - 24, 2009 Category Organization (Number of respondents) Location Providers (4) CEO, ECX Addis Ababa
Chief Market Data Officer, ECX Addis Ababa Market Data Research Manager, ECX Addis Ababa Market Data Section, ECX Addis Ababa
Users (29) Cooperative Unions (3) Sidama Coffee union
Wensho, Yirgalem, Hawassa
Sidama Elto Farmer’s Cooperative Union Hawasa Ethiopia Southern Region Farmers Cooperative Federation Hawasa Ethiopia
Education and Research (1)
Dean, College of Commerce, Addis Ababa University Addis Ababa
Exporters (2) Addis Exporters Limited Addis Ababa KAS International Trading Plc Addis Ababa
Government policy makers/officials (2)
Marketing Official, Ministry of Agriculture and Rural Development Addis Ababa Senior market surveillance and oversight officer , Ethiopia Commodity Exchange Authority Addis Ababa
Journalist (1) Bloomberg Correspondent Addis Ababa Regional Government officers (7)
Marketing Process, Marketing Research, Promotion and Linkage Experts (2) Hawassa Ministry of Agriculture and Rural Development Extension Officer Bedelle Oromia Quality Control of Agricultural Products Expert Hawasa Rural Agricultural Marketing Process Expert Hawassa Sidama Zone Cooperative Promotion and Development Process Promoter Hawassa Small Scale Appropriate Technology Quality Control, Supply and Monitoring Expert Hawassa
Service Cooperative (10) Holeso Service Cooperative members (7)
Leku Woreda, Shebedido
Taramesa Service Cooperative (3) Leku Woreda Table continued below
Table 40(Continued)

359
Category Organization (Number of respondents) Location Traders (3) Jemo General Business Share Co Addis Ababa
Private trader (By phone interview) Mekele Hagas Grain Wholesale Plc (by phone) Nekemte
Zambia Case Study Interviews from October 4-16, 2009Category Organization (Number of respondents) Location Providers (7) Senior Economist AMIC/MACO Lusaka
AMIC Statistical Officers (2) Lusaka ZNFU SMS MIS Manager Lusaka District Marketing Development Officer (DMDO)
Monze District
District Cooperative Development Officer (DCDO)
Kabwe District
Monze District Extension Officer Monze District Users (37) Farmer group members (29)
Kabwe farmers (8) Kabwe District Monze farmers (11) Monze District Monze farmers, near St Mary’s Church (10)
Monze District
Food Assistance organizations (2)
VAM Officer Lusaka WFP National program officer – P4P Lusaka
Food security analysis (1)
Fewsnet Lusaka
Government officials (2)
MACO Early warning unit (2) Lusaka
Researcher (1) MSU FSRP Researcher Lusaka Traders (2) Traders Kabwe Note: Names and contacts have been left out of the table to meet the informed consent requirements on confidentiality.

360
A. 9 Expanded Tables of MIS Characteristics
Table 41: Objectives of Selected MIS Models
Farmer org. Government Private firm
Trader org. and NGO
Start year & aims and objectives OM
A (M
L)
SIEL
(MG
)
ZNFU
(ZM
) A
GM
AR
IS (P
H)
AM
IC (Z
M)
ECX
(ET)
FVM
IS (U
S)
IHM
IS (I
D)
NA
SS (U
S)
Siar
m (S
N)
SIM
A (M
Z)
SIM
A (N
E)
SIM
L (N
E)
SIPA
G (G
N)
Esok
o(G
H)
Info
trade
(UG
)
KA
CE
(KE)
RM
L (I
N)
AV
I (B
F,N
E,M
L)
OdR
(MG
) R
ATI
N (K
E)
Tota
l
Start year 1989
2006
2006
19
68
1992
2008
1915
1979
1863
1997
1991
1989
1988
1993
2007
2008
1997
2007
2001
2005
20
03
Efficient (competitive) marketing 1 0 1 1 0 1 1 1 1 1 1 1 0 1 0 0 0 1 1 0 1 14Attain transparent markets 1 1 1 1 1 0 1 0 1 1 0 1 0 1 1 1 0 0 0 12Making better policy and monitoring 1 0 0 1 1 0 0 1 1 0 1 1 1 1 0 0 0 0 0 1 0 10Food security planning and monitoring 1 0 0 1 1 0 0 0 1 1 1 1 0 0 0 0 0 1 1 9Fair marketing 1 0 0 1 0 0 0 1 1 0 1 0 0 1 0 0 0 0 0 0 0 6Monitor market performance 1 0 0 0 0 0 1 0 1 0 0 1 0 0 0 0 0 1 0 5Linking producers to markets 1 0 1 0 0 0 0 0 0 0 0 1 0 1 0 0 0 0 4Negotiate for better prices 1 0 1 0 0 0 0 1 0 0 0 0 0 1 0 0 0 0 4Make markets Secure/ reduce risks 0 0 0 1 1 0 0 0 0 0 0 0 0 1 0 0 0 0 3Increase productivity 0 0 0 0 0 0 0 0 0 0 0 0 0 0 1 0 0 1 2Provide price collection and distribution technologies 0 0 0 0 0 0 0 0 0 0 0 1 0 0 0 0 0 0 1Source: Literature review, case studies, and E-survey; 1= Yes, 0 or blank =not observed or mentioned.

361
Table 42: Clientele of Selected MIS Models
Farmer org. Government Private firm
Trader and NGO
OM
A (M
L)
SIEL
(MG
) ZN
FU (Z
M)
AG
MA
RIS
(PH
) A
MIC
(ZM
)
ECX
(ET)
FVM
IS (U
S)
IHM
IS (I
D)
NA
SS (U
S)
Siar
m (S
N)
SIM
A (M
Z)
SIM
A (N
E)
SIM
L (N
E)
SIPA
G (G
N)
Esok
o(G
H)
Info
trade
(UG
)
KA
CE
(KE)
R
ML
(IN
)
AV
I(B
F,N
E,M
L)
OdR
(MG
)
RA
TIN
(KE)
Tot
al
Farmers/ Growers (small-scale) 1 1 1 1 1 1 1 1 1 1 1 1 1 1 1 1 1 1 1 1 1 21Farmers/ Growers (large-scale) 1 1 1 1 0 1 1 1 1 1 1 1 1 1 1 1 1 1 1 1 1 20Traders (small-scale) 1 1 1 1 1 1 1 1 1 1 1 1 1 1 1 1 0 1 1 1 19Government policy analysts 1 1 0 1 1 1 1 1 1 1 1 1 1 1 1 1 1 0 1 1 1 19Traders (large-scale) 1 1 1 1 0 1 1 1 1 1 1 1 1 1 1 0 1 1 1 17Food Assistance Agencies 1 1 0 1 1 0 0 1 1 1 1 1 1 1 1 1 0 1 1 1 16Consumers 1 1 0 1 0 0 0 1 1 0 1 1 1 1 1 1 0 1 1 1 14Donors 1 1 1 0 0 0 1 1 1 1 1 1 1 1 0 1 1 1 14NGOs 1 1 0 0 1 0 1 1 1 1 1 1 1 1 0 1 1 1 14Farmer associations & coops. 1 1 0 0 1 0 1 0 1 1 1 1 1 1 0 1 1 1 13Chamber of commerce 1 1 0 0 1 0 1 0 1 1 1 1 1 1 0 1 1 1 13Chamber of Agriculture 1 1 0 0 0 0 1 0 1 1 1 1 1 1 0 1 1 1 12Value Chain Actors 1 1 0 0 0 0 1 0 1 1 1 1 1 1 0 1 1 1 12Researchers and education 1 0 0 1 0 1 1 1 0 1 0 1 0 1 1 1 0 0 1 1 12Banks 1 0 0 0 0 0 1 1 0 1 0 1 1 0 1 0 0 1 1 9Exporters / shippers 1 0 0 0 1 1 0 0 0 1 0 0 0 0 0 0 0 1 5Source: Literature review, case studies, and E-survey; 1= Yes, 0 or blank =not observed or mentioned.

362
Table 43: Services Provided By Selected MIS Models
Farmer org. Government Private firm
Trader org. and NGO
Other Services provided O
MA
(ML)
SI
EL (M
G)
ZNFU
(ZM
) A
GM
AR
IS (P
H)
AM
IC (Z
M)
ECX
(ET)
FV
MIS
(US)
IH
MIS
(ID
) N
ASS
(US)
Si
arm
(SN
) SI
MA
(MZ)
SI
MA
(NE)
SI
ML
(NE)
SI
PAG
(GN
) Es
oko(
GH
) In
fotra
de (U
G)
KA
CE
(KE)
R
ML
(IN
) A
VI(
BF,
NE,
ML)
OdR
(MG
) R
ATI
N (K
E)
Tot
al
Education/training 1 0 1 1 1 0 1 0 1 1 1 1 1 1 0 1 0 1 13Market Studies 1 0 1 0 0 0 1 1 1 1 1 0 1 1 0 0 1 1 11Extension services (advice) 1 1 1 1 0 0 0 1 0 1 0 1 1 0 0 1 0 1 10Producer organization support(organization, management, marketing) 1 1 0 0 0 0 1 0 1 1 0 1 0 1 0 1 0 1 9Provision of input/seeds 1 0 1 1 0 0 0 0 1 0 0 1 0 1 0 1 0 1 8Storage support 1 0 0 0 1 0 1 0 1 0 0 0 0 1 0 1 0 1 7Coordination Activities 1 0 1 0 0 0 1 0 1 1 0 0 0 0 0 0 1 1 7Stock / commodity exchange 1 0 0 0 1 0 0 0 1 0 0 0 0 0 0 1 0 1 5Provision of warehouse receipt 1 0 0 0 1 0 0 0 1 0 0 0 0 0 0 0 0 1 4Agricultural import, export, and transit permits 0 0 0 1 0 0 0 0 0 0 0 0 0 0 0 0 0 0 1Source: Literature review, case studies, and E-survey; 1= Yes, 0 or blank =not observed or mentioned.
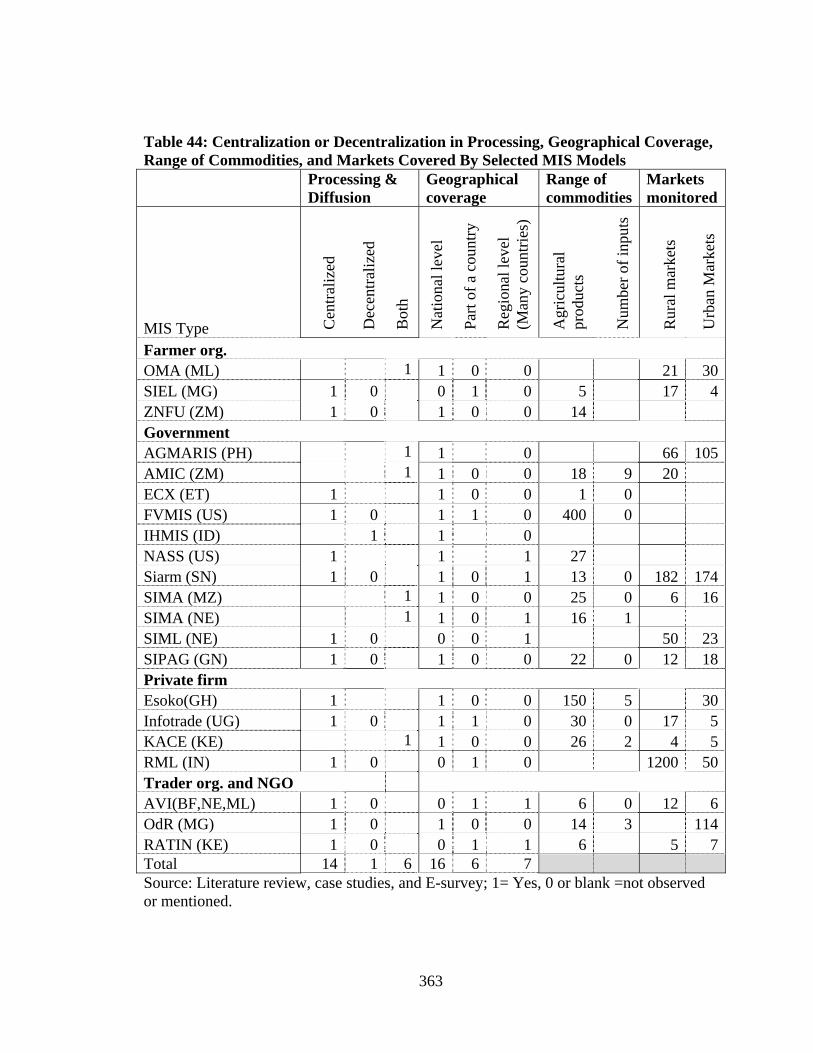
363
Table 44: Centralization or Decentralization in Processing, Geographical Coverage, Range of Commodities, and Markets Covered By Selected MIS Models
Processing & Diffusion
Geographical coverage
Range of commodities
Markets monitored
MIS Type Cen
traliz
ed
Dec
entra
lized
Bot
h
Nat
iona
l lev
el
Part
of a
cou
ntry
Reg
iona
l lev
el
(Man
y co
untri
es)
Agr
icul
tura
l pr
oduc
ts
Num
ber o
f inp
uts
Rur
al m
arke
ts
Urb
an M
arke
ts
Farmer org. OMA (ML) 1 1 0 0 21 30SIEL (MG) 1 0 0 1 0 5 17 4ZNFU (ZM) 1 0 1 0 0 14 Government AGMARIS (PH) 1 1 0 66 105AMIC (ZM) 1 1 0 0 18 9 20 ECX (ET) 1 1 0 0 1 0 FVMIS (US) 1 0 1 1 0 400 0 IHMIS (ID) 1 1 0 NASS (US) 1 1 1 27 Siarm (SN) 1 0 1 0 1 13 0 182 174SIMA (MZ) 1 1 0 0 25 0 6 16SIMA (NE) 1 1 0 1 16 1 SIML (NE) 1 0 0 0 1 50 23SIPAG (GN) 1 0 1 0 0 22 0 12 18Private firm Esoko(GH) 1 1 0 0 150 5 30Infotrade (UG) 1 0 1 1 0 30 0 17 5KACE (KE) 1 1 0 0 26 2 4 5RML (IN) 1 0 0 1 0 1200 50Trader org. and NGO AVI(BF,NE,ML) 1 0 0 1 1 6 0 12 6OdR (MG) 1 0 1 0 0 14 3 114RATIN (KE) 1 0 0 1 1 6 5 7Total 14 1 6 16 6 7Source: Literature review, case studies, and E-survey; 1= Yes, 0 or blank =not observed or mentioned.

364
Table 45:Information Provided by Selected MIS Models
Farmer org. Government Private firm
Trader org. and NGO
OM
A (M
L)
SIEL
(MG
)
ZNFU
(ZM
)
AG
MA
RIS
(PH
)
AM
IC (Z
M)
ECX
(ET)
FVM
IS (U
S)
IHM
IS (I
D)
NA
SS (U
S)
Siar
m (S
N)
SIM
A (M
Z)
SIM
A (N
E)
SIM
L (N
E)
SIPA
G (G
N)
Esok
o(G
H)
Info
trade
(UG
)
KA
CE
(KE)
RM
L (I
N)
AV
I (B
F,N
E,M
L)
OdR
(MG
) R
ATI
N (K
E)
Tota
l
Information Products Market News 1 1 1 1 1 1 1 1 1 1 1 1 1 1 1 1 1 1 1 1 1 21Market Analysis 1 0 0 1 1 0 0 0 1 0 0 0 0 0 0 0 0 1 1 6Business Reports 0 0 0 0 0 0 0 0 0 0 0 0 0 0 0 0 0 0 0 0 0 0Information provided Wholesale price 1 1 0 1 1 0 1 1 1 1 1 0 1 1 1 1 1 1 0 1 16Retail price 1 0 0 1 1 0 1 0 1 1 1 1 1 1 1 1 1 0 1 1 15Traded volume (qualitative assessment) 1 0 0 0 0 1 1 1 1 1 1 1 1 0 0 0 0 0 1 1 11Supply & demand estimates 1 0 0 0 0 1 1 0 1 1 0 1 1 1 0 1 0 0 0 1 1 11Producer price 1 1 0 0 0 0 1 1 1 1 1 0 1 0 0 0 0 0 1 1 10Traded volume (quantitative estimation) 1 1 0 0 0 1 1 1 1 0 1 1 1 0 0 0 0 0 0 1 10Traders stock 1 0 0 0 0 1 1 0 1 1 0 1 0 1 0 1 0 0 0 0 1 9Buyers and sellers contacts 1 0 1 0 1 1 0 0 0 1 0 0 1 0 1 0 1 0 0 0 1 9Grades & standards 0 0 1 0 0 1 1 1 1 0 0 0 0 1 0 1 0 0 0 0 1 8Exchange rates 0 0 0 0 0 0 0 0 0 1 0 1 1 1 1 0 1 0 0 1 1 8Table continued below

365
Table 45 (Continued)
Farmer org. Government Private firm
Trader org. and NGO
OM
A (M
L)
SIEL
(MG
)
ZNFU
(ZM
)
AG
MA
RIS
(PH
)
AM
IC (Z
M)
ECX
(ET)
FVM
IS (U
S)
IHM
IS (I
D)
NA
SS (U
S)
Siar
m (S
N)
SIM
A (M
Z)
SIM
A (N
E)
SIM
L (N
E)
SIPA
G (G
N)
Esok
o(G
H)
Info
trade
(UG
)
KA
CE
(KE)
RM
L (I
N)
AV
I (B
F,N
E,M
L)
OdR
(MG
) R
ATI
N (K
E)
Tota
l
Harvest or production forecasts 0 0 0 0 0 0 1 0 1 1 0 0 1 1 0 0 0 0 1 1 1 8Price forecasts 0 0 0 0 0 0 1 0 1 0 1 0 1 1 1 0 0 0 1 1 8Agricultural policy infor. 1 0 0 0 0 1 0 0 1 0 0 1 1 0 1 0 0 1 0 1 8Price CIF 0 0 0 0 0 0 1 0 1 1 0 1 1 0 0 0 0 0 1 1 7Production costs 0 1 0 0 0 1 1 0 1 0 0 0 0 0 1 0 0 0 1 1 7Marketing costs 0 0 0 0 1 0 0 0 1 1 1 0 0 0 1 0 0 0 1 1 7Offers and bids 1 0 0 0 0 0 0 0 0 1 0 0 0 1 1 0 1 0 0 1 1 7Price FOB 0 0 0 0 0 0 0 0 1 1 0 1 1 0 0 0 0 0 1 1 6Import volumes 1 0 0 0 0 0 1 0 1 1 0 0 0 0 0 0 0 0 0 1 1 6Regulations 0 0 0 0 0 1 1 0 1 0 1 0 0 1 0 0 0 0 0 0 1 6Commercial policy infor. 1 0 0 0 0 1 1 0 1 0 0 0 1 0 0 0 0 0 0 1 6Export volumes 1 0 0 0 0 0 1 0 1 0 0 0 1 0 0 0 0 0 0 0 0 4Food assistance information 1 0 0 0 0 0 0 0 0 0 0 1 1 0 0 0 0 1 0 0 4Marketing extension 1 0 0 0 0 0 0 0 1 0 0 1 0 0 0 0 0 0 0 1 4Buy and sell information 0 0 1 0 0 1 0 0 0 0 0 0 0 0 0 0 0 0 0 1 3Phytosanitary specs. 1 0 0 0 0 0 0 0 0 0 0 0 0 0 0 0 0 1 2Table continued below

366
Table 45 (Continued)
Farmer org. Government Private firm
Trader org. and NGO
OM
A (M
L)
SIEL
(MG
)
ZNFU
(ZM
)
AG
MA
RIS
(PH
)
AM
IC (Z
M)
ECX
(ET)
FVM
IS (U
S)
IHM
IS (I
D)
NA
SS (U
S)
Siar
m (S
N)
SIM
A (M
Z)
SIM
A (N
E)
SIM
L (N
E)
SIPA
G (G
N)
Esok
o(G
H)
Info
trade
(UG
)
KA
CE
(KE)
RM
L (I
N)
AV
I (B
F,N
E,M
L)
OdR
(MG
) R
ATI
N (K
E)
Tota
l
Weather information 0 0 0 0 0 0 0 0 0 0 0 0 0 0 1 0 0 1 0 0 0 2Agronomic Information 0 0 0 0 0 0 0 0 0 0 0 0 0 0 0 0 0 1 0 1 0 2Credit sources 0 0 0 0 0 0 0 0 0 0 0 0 0 0 0 0 0 0 0 0 0 0Source: Literature review, case studies, and E-survey; 1= Yes, 0 or blank =not observed or mentioned; 1. Information is updated weekly although it can be retrieved at any time by users.

367
Table 46: Frequency of Information Diffusion by Selected MIS Models
Farmer org. Government Private firm Trader org. and NGO
OM
A (M
L)
SIEL
(MG
)
ZNFU
(ZM
)
AG
MA
RIS
(PH
)
AM
IC (Z
M)
ECX
(ET)
FVM
IS (U
S)
IHM
IS (I
D)
NA
SS (U
S)
Siar
m (S
N)
SIM
A (M
Z)
SIM
A (N
E)
SIM
L (N
E)
SIPA
G (G
N)
Esok
o(G
H)
Info
trade
(UG
)
KA
CE
(KE)
RM
L (I
N)
AV
I (B
F,N
E,M
L)
OdR
(MG
)
RA
TIN
(KE)
Tota
l
Frequency Real time 0 0 0 0 0 1 0 0 0 0 0 0 0 0 0 0 0 0 0 0 0 1Daily 1 1 0 0 0 1 1 1 0 1 0 0 0 0 0 0 1 1 0 0 1 9Tri-weekly 0 0 0 1 0 0 0 0 0 0 0 0 0 0 0 0 0 0 0 0 0 1Bi-weekly 0 0 0 0 0 0 0 0 0 0 0 0 0 0 0 0 0 1 0 0 0 1Weekly 1 1 11
121 1 0 0 1 1 1 1 1 1 0 0 0 0 1 1 14
Bi-Monthly 0 0 0 1 0 0 0 0 0 0 0 0 0 0 0 0 0 0 0 0 1Monthly 0 0 0 0 0 1 1 1 0 1 0 0 0 0 0 0 0 1 1 1 7Quarterly 0 0 0 0 1 0 0 1 0 0 0 0 1 0 0 0 0 0 0 1 4Annually 0 0 0 0 1 1 1 1 0 0 0 1 0 0 0 0 0 0 0 0 5Longer intervals 0 0 0 0 0 1 0 1 0 1 0 0 0 0 0 0 0 0 0 0 3Source: Literature review, case studies, and E-survey; 1= Yes, 0 or blank =not observed or mentioned; 1. Information is updated weekly although it can be retrieved at any time by users; 2. The decentralized MIS in Monze, Livingstone and Choma disseminate weekly.

368
Table 47: Transmission of Information Using Modern and Traditional ICT by Selected MIS Models
Farmer org Government Private firm Trader org. and NGO
OM
A (M
L)
SIEL
(MG
)
ZNFU
(ZM
)
AG
MA
RIS
(PH
)
AM
IC (Z
M)
ECX
(ET)
FVM
IS (U
S)
IHM
IS (I
D)
NA
SS (U
S)
Siar
m (S
N)
SIM
A (M
Z)
SIM
A (N
E)
SIM
L (N
E)
SIPA
G (G
N)
Esok
o(G
H)
Info
trade
(UG
)
KA
CE
(KE)
RM
L (I
N)
AV
I(B
F,N
E,M
L)
OdR
(MG
)
RA
TIN
(KE)
Tota
l
Modern ICT
Email 1 1 0 0 0 0 1 1 0 0 1 1 0 1 1 0 1 1 10SMS 1 0 1 0 0 0 1 0 0 0 1 1 0 1 1 1 0 1 1 10Web 0 0 1 0 1 0 1 1 0 0 0 0 1 1 1 1 0 0 1 9Traditional ICT Telephone 1 1 1 1 1 0 0 1 1 1 1 0 0 0 0 0 1 0 1 1 12Fax 0 0 0 1 0 0 1 1 1 1 0 1 0 0 0 1 0 0 1 8Post office 1 0 0 0 0 0 0 1 0 0 1 1 1 0 0 0 0 0 1 6Radio equipment 1 0 0 0 0 0 1 0 0 0 1 1 0 0 1 0 0 0 0 5Hand delivery 0 0 0 1 0 0 0 0 0 0 0 0 0 0 1 0 0 1 1 4Source: Literature review, case studies, and E-survey; 1= Yes, 0 or blank =not observed or mentioned.

369
Table 48: Dissemination Using Modern and Traditional ICT by MIS Selected MIS Models
Farmer org Government Private firm Trader org. and NGO
OM
A (M
L)
SIEL
(MG
)
ZNFU
(ZM
)
AG
MA
RIS
(PH
)
AM
IC (Z
M)
ECX
(ET)
FVM
IS (U
S)
IHM
IS (I
D)
NA
SS (U
S)
Siar
m (S
N)
SIM
A (M
Z)
SIM
A (N
E)
SIM
L (N
E)
SIPA
G (G
N)
Esok
o(G
H)
Info
trade
(UG
)
KA
CE
(KE)
RM
L (I
N)
AV
I(B
F,N
E,M
L)
OdR
(MG
)
RA
TIN
(KE)
Tota
l
Modern ICT Email 1 0 0 1 1 1 1 1 1 1 1 1 1 1 1 0 1 1 1 16Web 1 0 1 1 1 1 1 0 1 1 0 1 1 1 1 0 1 0 1 14SMS (Cell Phone) 0 0 1 0 0 0 0 0 0 1 1 1 1 1 1 1 0 1 1 10Billboards (electronic) 0 0 0 0 1 0 0 0 0 0 1 0 0 1 0 0 0 0 0 3Traditional ICT Rural radio 1 1 0 1 1 0 1 0 0 1 1 1 0 0 1 1 0 0 1 1 12National radio 0 0 1 0 1 1 1 0 0 1 1 1 1 0 0 1 0 0 1 1 11Newspapers 1 1 0 0 1 1 1 0 0 1 1 0 0 0 1 0 0 0 1 1 10Hand delivery 0 0 0 1 1 1 0 0 1 1 1 1 0 0 1 0 0 1 0 9Telephone (voice) 0 0 0 0 1 1 1 1 0 1 1 1 0 0 1 0 0 0 1 9Posters in markets 0 1 0 0 1 0 1 0 0 0 1 1 0 0 1 1 0 0 0 1 8TV 0 0 0 0 1 1 0 0 1 0 1 0 0 1 0 0 0 0 1 6Fax 0 0 0 0 1 1 0 1 0 0 1 0 0 0 1 0 0 0 0 5Blackboards 0 0 0 0 0 0 1 0 0 1 0 0 0 0 1 1 0 0 0 0 4Post office 0 0 0 0 0 1 1 0 0 0 0 0 0 0 0 0 0 0 0 2CD and DVD 0 0 0 0 0 0 1 0 0 0 0 0 0 0 0 0 0 0 0 1Pigeonholes 1 1Source: Literature review, case studies, and E-survey; 1= Yes, 0 or blank =not observed or mentioned.
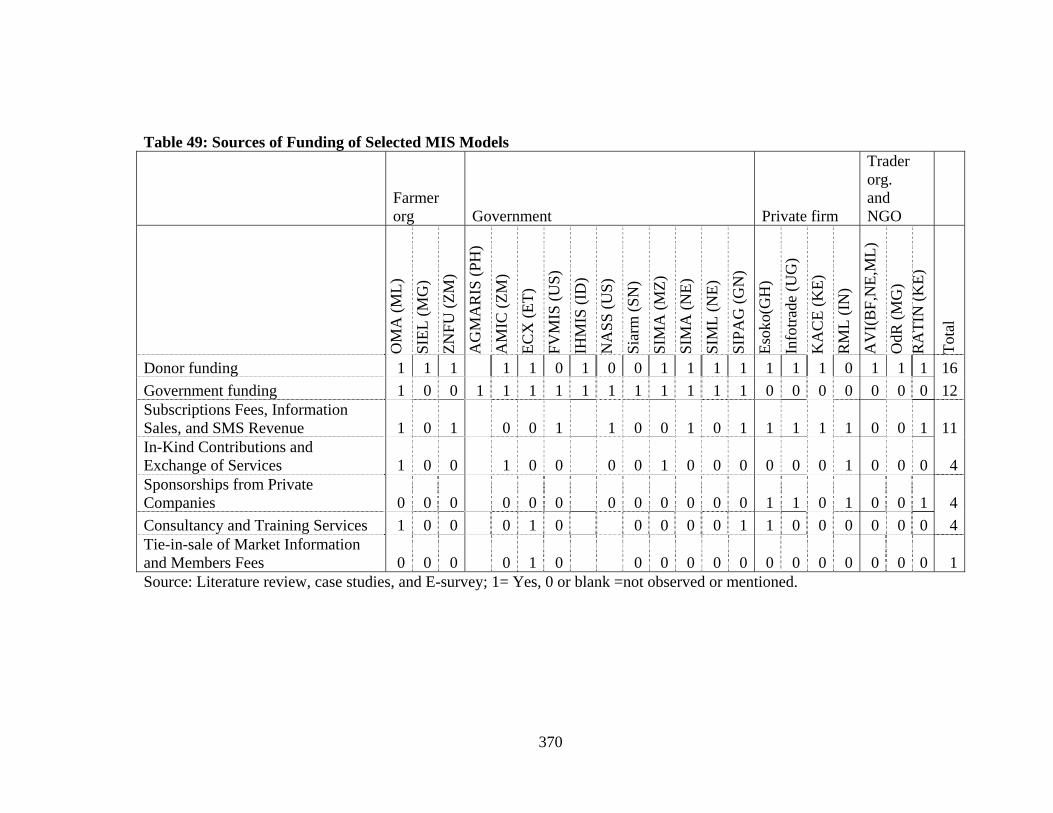
370
Table 49: Sources of Funding of Selected MIS Models
Farmer org Government Private firm
Trader org. and NGO
OM
A (M
L)
SIEL
(MG
)
ZNFU
(ZM
)
AG
MA
RIS
(PH
)
AM
IC (Z
M)
ECX
(ET)
FVM
IS (U
S)
IHM
IS (I
D)
NA
SS (U
S)
Siar
m (S
N)
SIM
A (M
Z)
SIM
A (N
E)
SIM
L (N
E)
SIPA
G (G
N)
Esok
o(G
H)
Info
trade
(UG
)
KA
CE
(KE)
RM
L (I
N)
AV
I(B
F,N
E,M
L)
OdR
(MG
) R
ATI
N (K
E)
Tota
l
Donor funding 1 1 1 1 1 0 1 0 0 1 1 1 1 1 1 1 0 1 1 1 16Government funding 1 0 0 1 1 1 1 1 1 1 1 1 1 1 0 0 0 0 0 0 0 12Subscriptions Fees, Information Sales, and SMS Revenue 1 0 1 0 0 1 1 0 0 1 0 1 1 1 1 1 0 0 1 11In-Kind Contributions and Exchange of Services 1 0 0 1 0 0 0 0 1 0 0 0 0 0 0 1 0 0 0 4Sponsorships from Private Companies 0 0 0 0 0 0 0 0 0 0 0 0 1 1 0 1 0 0 1 4Consultancy and Training Services 1 0 0 0 1 0 0 0 0 0 1 1 0 0 0 0 0 0 4Tie-in-sale of Market Information and Members Fees 0 0 0 0 1 0 0 0 0 0 0 0 0 0 0 0 0 0 1Source: Literature review, case studies, and E-survey; 1= Yes, 0 or blank =not observed or mentioned.

371
Table 50: Data Collection Methods Used By Selected MIS Models
Farmer org. Government Private firm
Trader org. and NGO
OM
A (M
L)
SIEL
(MG
)
ZNFU
(ZM
)
AG
MA
RIS
(PH
)
AM
IC (Z
M)
ECX
(ET)
FVM
IS (U
S)
IHM
IS (I
D)
NA
SS (U
S)
Siar
m (S
N)
SIM
A (M
Z)
SIM
A (N
E)
SIM
L (N
E)
SIPA
G (G
N)
Esok
o(G
H)
Info
trade
(UG
)
KA
CE
(KE)
RM
L (I
N)
AV
I(B
F,N
E,M
L)
OdR
(MG
) R
ATI
N (K
E)
Tot
al
Structured questionnaires (One-on-one interview by reporters) 1 1 0 1 0 1 1 1 1 1 0 1 0 0 1 1 0 0 1 12Observation by reporters in markets 1 1 0 1 0 0 1 1 1 1 0 1 1 1 1 0 0 0 1 12Telephone interviews 0 0 1 0 0 1 1 1 0 0 1 0 0 0 0 0 1 1 0 7Questionnaires mailed to market participants 0 0 0 0 0 0 1 0 0 0 1 0 0 1 0 0 1 1 0 5Administrative/ secondary sources 0 0 0 0 0 0 1 1 0 0 0 0 0 0 0 0 1 1 4Obligatory declaration of information 0 0 0 1 0 0 1 0 0 0 0 0 0 0 0 0 0 0 1 3Wiki approaches (where users SMS or update the web) 1 1Byproduct of transactions on the exchange 1 1Source: Literature review, case studies, and E-survey; 1= Yes, 0 or blank =not observed or mentioned.

372
Table 51: Quality Control Methods Used By Selected MIS Models
Farmer org. Government Private firm
Trader org. and NGO
Quality control methods used by MIS O
MA
(ML)
SIEL
(MG
)
ZNFU
(ZM
)
AG
MA
RIS
(PH
)
AM
IC (Z
M)
ECX
(ET)
FVM
IS (U
S)
IHM
IS (I
D)
NA
SS (U
S)
Siar
m (S
N)
SIM
A (M
Z)
SIM
A (N
E)
SIM
L (N
E)
SIPA
G (G
N)
Esok
o(G
H)
Info
trade
(UG
)
KA
CE
(KE)
RM
L (I
N)
AV
I(B
F,N
E,M
L)
OdR
(MG
) R
ATI
N (K
E)
Tota
l
Verification and tests after data capture 1 1 0 1 0 0 1 1 1 1 1 1 1 1 0 1 1 1 14Refresher training courses for data collectors 1 0 0 1 0 0 1 1 1 1 1 1 1 1 1 0 0 1 1 13Regular supervision and monitoring of data collectors 1 0 0 1 0 0 1 1 1 1 1 1 1 1 0 1 1 1 13Unexpected market visits to data collectors 1 1 0 0 0 0 1 0 1 1 1 1 1 1 0 0 0 1 10Data entry control /validation programs 1 0 0 1 0 0 0 1 1 0 1 1 1 1 0 0 1 1 10Feedback from MIS user surveys 1 1 0 0 0 1 1 0 0 1 1 1 0 1 1 0 1 0 0 10User verification (e.g. in wiki MIS) 0 0 1 0 0 0 0 0 1 0 1 0 0 0 0 1 0 0 4Monitoring and supervisory committee 1 0 0 0 0 0 0 0 1 0 0 0 0 0 0 0 0 0 2Advice from advisory panel and boards 1 0 0 0 0 0 0 0 0 0 0 0 0 0 0 0 0 0 1Source: Literature review, case studies, and E-survey; 1= Yes, 0 or blank =not observed or mentioned.

373
Table 52: Feedback Mechanism Used By Selected MIS Models
Farmer org. Government Private firm
Trader org. and NGO
OM
A (M
L)
SIEL
(MG
) ZN
FU (Z
M)
AG
MA
RIS
(PH
) A
MIC
(ZM
) EC
X (E
T)
FVM
IS (U
S)
IHM
IS (I
D)
NA
SS (U
S)
Siar
m (S
N)
SIM
A (M
Z)
SIM
A (N
E)
SIM
L (N
E)
SIPA
G (G
N)
Esok
o(G
H)
Info
trade
(UG
) K
AC
E (K
E)
RM
L (I
N)
AV
I (B
F,N
E,M
L)
OdR
(MG
)
RA
TIN
(KE)
Tot
al
Potential MIS users' assessment /needs surveys 1 1 0 1 0 1 1 1 1 1 1 1 1 1 0 0 0 1 13Customer satisfaction surveys 1 0 1 0 0 1 1 1 0 0 1 1 1 0 1 0 0 0 1 10Meetings with users (including farmer or trader groups) 0 0 0 1 1 1 1 0 0 1 0 1 1 1 1 0 1 1 0 11Monitoring of information downloaded (SMS and website) 1 0 1 0 0 0 0 0 0 0 1 1 1 1 0 1 1 1 9External evaluations (by donor, government, or third party) 1 0 0 0 0 0 0 0 0 1 1 0 1 1 0 1 1 1 8Listenership groups 0 0 0 1 0 0 1 0 0 0 1 0 1 0 0 0 0 0 4Suggestion boxes 0 0 0 0 0 0 1 0 0 0 0 0 0 0 0 0 0 0 0 1Reviews from regulators 1 1Customer service center hotline 1 1Compliance section of the exchange 1 1Source: Literature review, case studies, and E-survey; 1= Yes, 0 or blank =not observed or mentioned.
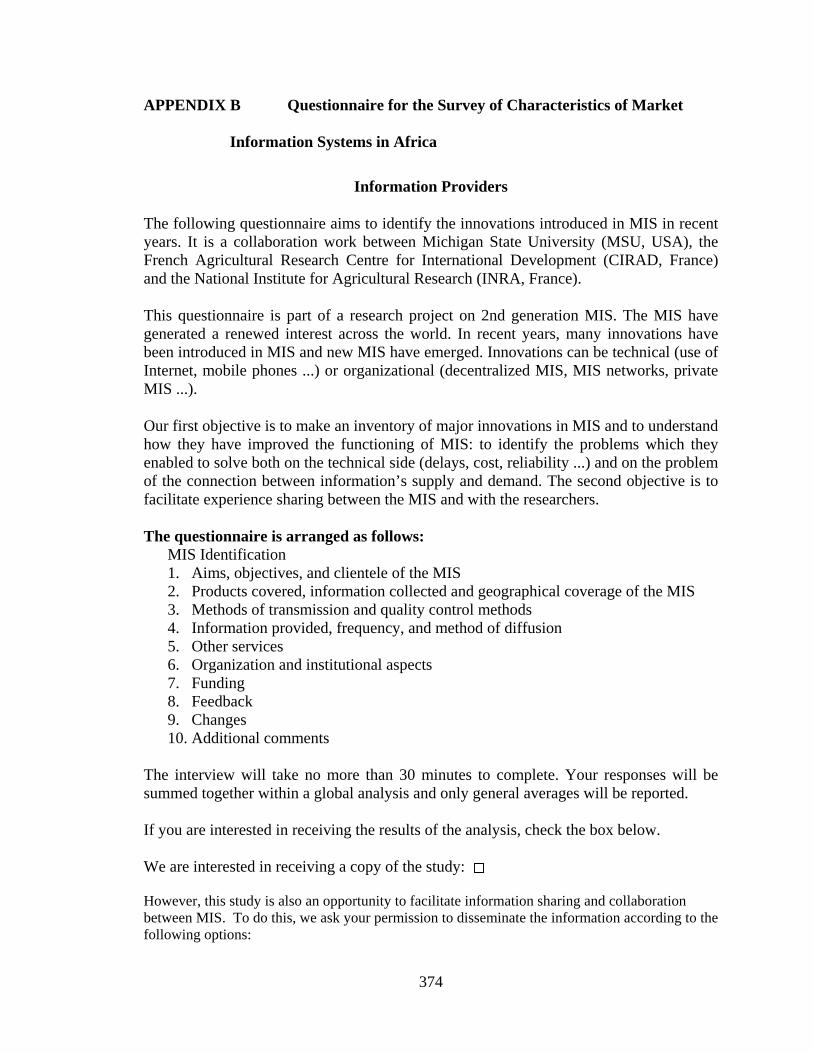
374
APPENDIX B Questionnaire for the Survey of Characteristics of Market
Information Systems in Africa
Information Providers
The following questionnaire aims to identify the innovations introduced in MIS in recent years. It is a collaboration work between Michigan State University (MSU, USA), the French Agricultural Research Centre for International Development (CIRAD, France) and the National Institute for Agricultural Research (INRA, France).
This questionnaire is part of a research project on 2nd generation MIS. The MIS have generated a renewed interest across the world. In recent years, many innovations have been introduced in MIS and new MIS have emerged. Innovations can be technical (use of Internet, mobile phones ...) or organizational (decentralized MIS, MIS networks, private MIS ...).
Our first objective is to make an inventory of major innovations in MIS and to understand how they have improved the functioning of MIS: to identify the problems which they enabled to solve both on the technical side (delays, cost, reliability ...) and on the problem of the connection between information’s supply and demand. The second objective is to facilitate experience sharing between the MIS and with the researchers.
The questionnaire is arranged as follows: MIS Identification 1. Aims, objectives, and clientele of the MIS 2. Products covered, information collected and geographical coverage of the MIS 3. Methods of transmission and quality control methods 4. Information provided, frequency, and method of diffusion 5. Other services 6. Organization and institutional aspects 7. Funding 8. Feedback 9. Changes 10. Additional comments
The interview will take no more than 30 minutes to complete. Your responses will be summed together within a global analysis and only general averages will be reported. If you are interested in receiving the results of the analysis, check the box below. We are interested in receiving a copy of the study: However, this study is also an opportunity to facilitate information sharing and collaboration between MIS. To do this, we ask your permission to disseminate the information according to the following options:

375
We allow the team to disseminate the questionnaire:
Information concerning the identification of MIS (section 1)
Information concerning the identification, the products and variables covered and the distribution channels (sections 1, 2&4)
Information of all sections If you have any questions about this questionnaire, please contact: Andrew Kizito (English version): [email protected] Or Yuanyuan Shen (French version): [email protected] MIS Identification 1. Contact information of respondent and of MIS: Name: Name of MIS: Name of institution housing the MIS: Web site of the MIS: Address: Address 2: City/Town: State: ZIP/Postal Code: Country: Email Address: Phone Number: 1. Aims, objectives, and clientele of the MIS 1.1 When was the MIS created? 1.2. What are the aims and objectives of the MIS? Since its creation* Nowadays
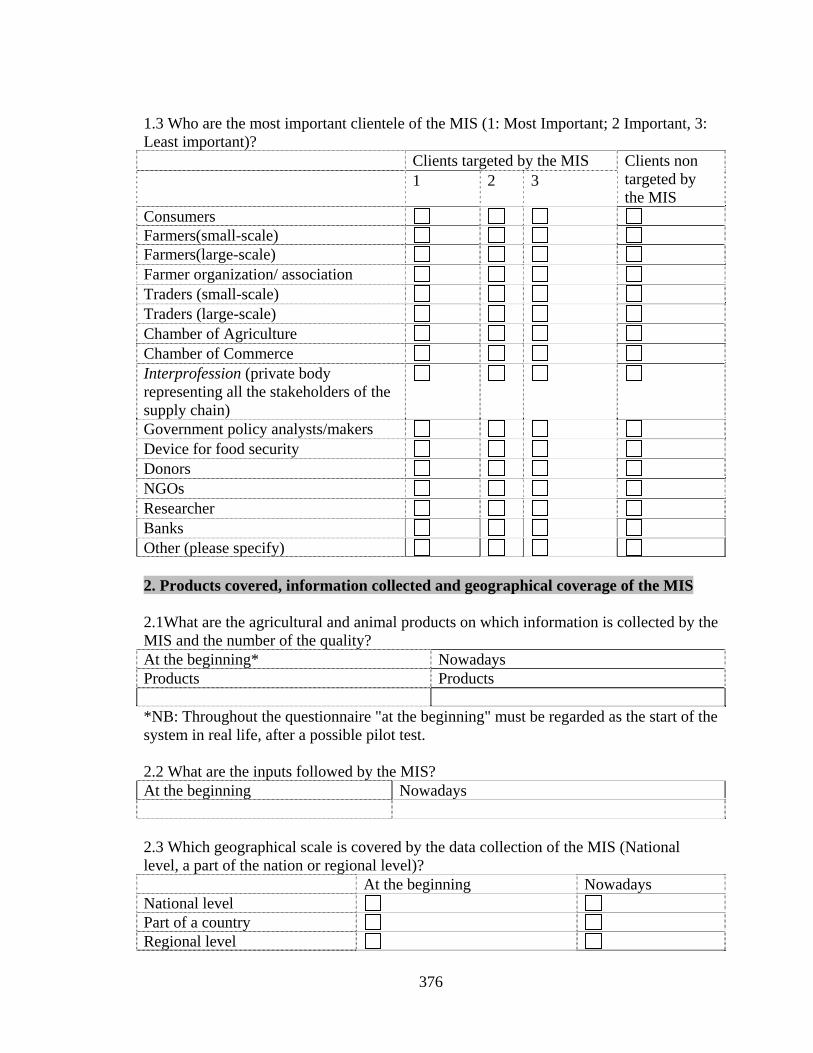
376
1.3 Who are the most important clientele of the MIS (1: Most Important; 2 Important, 3: Least important)? Clients targeted by the MIS Clients non
targeted by the MIS
1 2 3
Consumers Farmers(small-scale) Farmers(large-scale) Farmer organization/ association Traders (small-scale) Traders (large-scale) Chamber of Agriculture Chamber of Commerce Interprofession (private body representing all the stakeholders of the supply chain)
Government policy analysts/makers Device for food security Donors NGOs Researcher Banks Other (please specify) 2. Products covered, information collected and geographical coverage of the MIS 2.1What are the agricultural and animal products on which information is collected by the MIS and the number of the quality? At the beginning* Nowadays Products Products *NB: Throughout the questionnaire "at the beginning" must be regarded as the start of the system in real life, after a possible pilot test. 2.2 What are the inputs followed by the MIS? At the beginning Nowadays 2.3 Which geographical scale is covered by the data collection of the MIS (National level, a part of the nation or regional level)? At the beginning Nowadays National level Part of a country Regional level

377
2.4 How many markets are covered by the MIS? At the beginning Nowadays Number of the rural market Number of the urban markets 2.5 What variables regarding prices and quantity are followed by the MIS? Since its creation Nowadays Retail price Wholesale price Producer price (or rural market) Price CAF Price FOB Traders’ stock Traded volume (quantitative estimation) Traded volume (qualitative assessment) Other (please specify) 2.6 What other information is monitored by the MIS? At the beginning nowadays Export volumes Import volumes Production costs Marketing costs Supply & demand estimates Grades & standards Regulations Credit sources Exchange rates Harvest (production) forecasting Price forecasting Food aid Agricultural policy information Commercial policy information Technical extension Marketing extension Contacts of buyers and sellers Offers and bids Phytosanitary specs. Other (please specify)
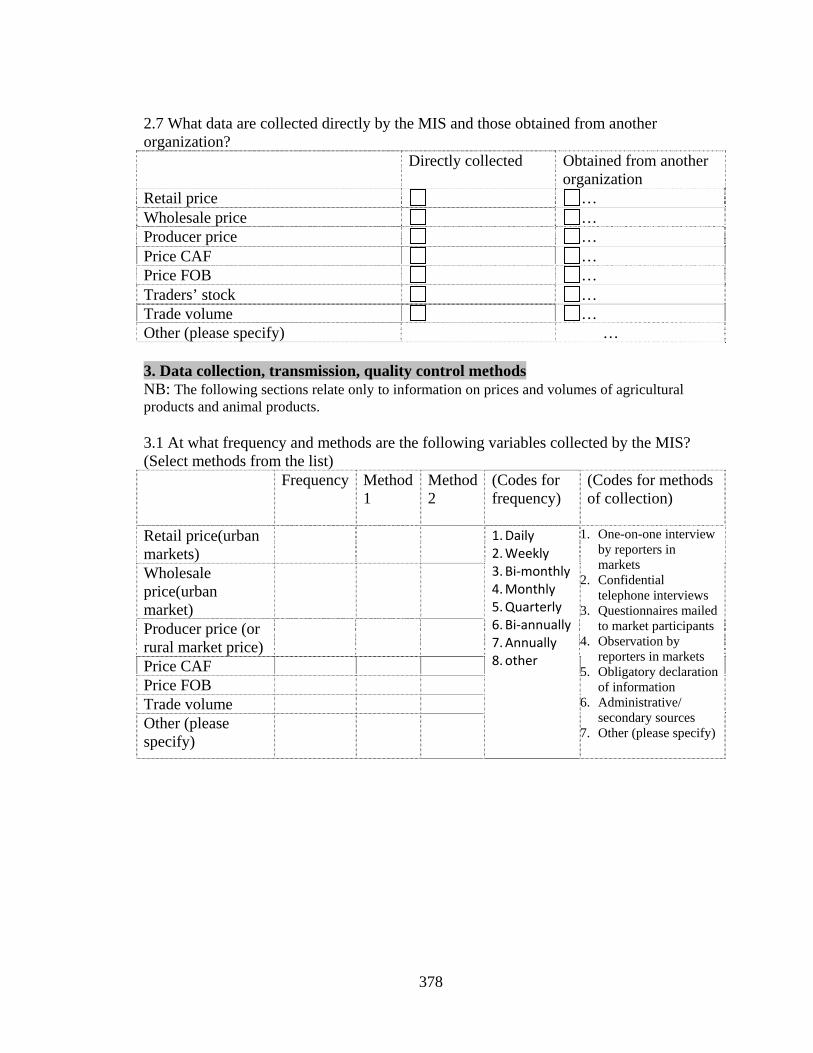
378
2.7 What data are collected directly by the MIS and those obtained from another organization? Directly collected Obtained from another
organization Retail price … Wholesale price … Producer price … Price CAF … Price FOB … Traders’ stock … Trade volume … Other (please specify) … 3. Data collection, transmission, quality control methods NB: The following sections relate only to information on prices and volumes of agricultural products and animal products. 3.1 At what frequency and methods are the following variables collected by the MIS? (Select methods from the list) Frequency Method
1
Method 2
(Codes for frequency)
(Codes for methods of collection)
Retail price(urban markets)
1. Daily 2. Weekly 3. Bi‐monthly 4. Monthly 5. Quarterly 6. Bi‐annually 7. Annually 8. other
1. One-on-one interview by reporters in markets
2. Confidential telephone interviews
3. Questionnaires mailed to market participants
4. Observation by reporters in markets
5. Obligatory declaration of information
6. Administrative/ secondary sources
7. Other (please specify)
Wholesale price(urban market)
Producer price (or rural market price)
Price CAF Price FOB Trade volume Other (please specify)

379
3.2 What methods are used to transmit data from market participants to the MIS, and who transmits the data/information? Methods used to transmit Who transmits the
data/information Means At the
beginning Nowadays MIS
Reporters Producers or traders
Post office Fax Hand delivery Telephone Radio equipment Email SMS Web Other (please specify)
3.3. What quality control methods are used in data and information collection, transmission, processing, and dissemination? (Please check all that apply). Refresher training courses for data collectors Regular supervision and monitoring of data collectors Unexpected market visits to monitor the data collectors Data entry control /validation programs and procedures (including use of data entry error check programs)
Verification and test after data capture (Data inspection and processing to check errors)
Stock declared Opinion request from MIS’ users (survey, advisory panel/boards) Monitoring committee / supervisory committee User verification (e.g. in wiki MIS) Other (please specify)

380
4. Information provided, frequency and modes of diffusion 4.1 How does the MIS transmit the information to the users and what kind of information is distributed for each channel? Diffusion channels Importance of diffusion method
1. Important 2. Not Important 3. Not used
Main types of data disseminated for each channel
Bulletin Email Billboards (electronic) Blackboards Fax Hand delivery National radio Rural radio Newsletters Newspapers Post office Posters in markets Radio equipment SMS (Cell Phone) Telephone (voice) TV Web
Other (specify)
4.2 For the market traders, the information supplied by the MIS is: Free Paid Types of information
All-in-one payment (specify the cost
Pay by unit (specify the cost)
Real-time price Serial price
Forecasting

381
5. Other services 5.1 What are the other services provided by the MIS, by the housing institution of or by other institutions in collaboration with the MIS? Provided
by MIS By the housing institution
By partner
Studies Education/training Provision of input/seeds Technical extension Producer organization support(organization, management, marketing)
Storage support Provision of warehouse receipt Stock exchange Device coordination Other (please specify) 6. Organization and institutional aspects 6.1 What’s the MIS’s institutional home? At the
beginning Nowadays
Farmer organization/cooperative/association Development project Trader organization/cooperative Chamber of Agriculture Chamber of commerce Interprofession (private body representing all the stakeholders of the supply chain)
Private firm Government ministry Government parastatals Government (local/decentralized) NGO Research organization Other (please specify)

382
6.2 How many staff in the MIS? (Processing and dissemination units, investigators) Executives No executives Processing units Collectors 6.3 What is the staff status in the MIS? Number of officials : Number of contract staff : 6.4 Is the information disseminated in the covered zones by the MIS? Identical (same products, same markets) Different (specified products or markets) Mixed (common base + specificities according to the zones) 6.5 Is the data processing Centralized Decentralized (different data processing units in the zones) Mixed (central unit and different data processing units in the regions) 6.6 Is the MIS member of a MIS network? No Yes If yes specify which one 6.7 Is the MIS organizer of a MIS network? No Yes If yes, specify 7. Funding 7.1 Which of the main funders/supporters of the MIS? (Major funder, small funder, not at all) Main
funder Minor funder
Not at all
Government central Government –local/decentralized Donors (agencies of aid and cooperation ) NGO Farmers’ and traders’ groups/associations Market traders Research institution Private firms/companies Individual farmers and traders Charity organization Other (please specify)

383
7.2 In what way do the funders/supporters fund/support the MIS? (Most important, least important, not at all) Most important Least important Not at all Budget Project funds Information sales Subscription Classified advertisement Service sales (ex. consulting)
Advertising Other (please specify) 7.3 If there are user fees, what actions are taken to ensure that users who cannot afford the information also benefit? 8. Feedback 8.1 How do you know if the MIS has satisfied the information need of users? (Please check all that apply). Potential MIS users’ assessment /needs surveys Customer satisfaction surveys External evaluations (by donor, government, or third party) Listenership groups Meetings with users (including farmer or trader groups) Suggestion boxes MIS information needs monitoring or information downloaded (SMS, website…) Other (please specify) 8.2 How do you know whether the information supplied by the MIS is used or not?

384
8.3. For which market participants is the MIS most useful (most useful, little useful, not at all)? Most useful Little useful Not at all Consumers Farmers (small-scale) Farmers (large-scale) Farmer organizations / associations
Traders (small-scale) Traders (large-scale) Chamber of Agriculture Chamber of commerce Interprofession Government policy analysts / makers
Donors NGOs Ministry of commerce and agriculture
Banks Other 9. Changes 9.1 What are the main changes has the MIS met since its creation? 9.2. What are the problems met and resolved by the MIS? 9.3 What are the problems met still to be solved by the MIS? 10. Other comments or remarks? Thank you very much for participating in this survey.

385
REFERENCES

386
REFERENCES Aker, J. C. "Does Digital Divide or Provide? The Impact of Cell Phones on Grain
Markets in Niger." (2008).
Aker, J. C. "Information from Markets Near and Far: Mobile Phones and Agricultural Markets in Niger." American Economic Journal: Applied Economics 2, no. 3(2010): 46-59.
Aker, J. C., and I. M. Mbiti. "Mobile Phones and Economic Development in Africa." Journal of Economic Perspectives 24, no. 3(2010): 207-32.
Akerlof, G. A. "The Market for "Lemons": Quality Uncertainty and the Market Mechanism." The Quarterly Journal of Economics 84, no. 3(1970): 488-500.
Aldridge, K. M. "A Framework for Analyzing Alternative Institutional Arrangements for the Cereals Market Information System in Mali." Michigan State University, 1992.
Aldridge, K. M. "Predicting the Path of Grain Prices with Limited Data: A Case Study From Mali." Michigan State University, 1999.
AMS. "Fresh Fruit and Vegetable Shipments By Commodities, States, and Months." U. S. Department of Agriculture, Agricultural Marketing Service, Fruit and Vegetable Programs, Market News Branch.
AMS. "Fruit and Vegetable Import Requirements, Fruit and Vegetable Programs." Agricultural Marketing Service, U. S. Department of Agriculture, Revised May 1998.
AMS (1999) Fruit and Vegetable Market News, Fruit and Vegetable Programs, Agricultural Marketing Service, U. S. Department of Agriculture.
AMS. "National Fruit and Vegetable Retail Report." U. S. Department of Agriculture, Agricultural Marketing Service, Fruit and Vegetable Programs, Market News Branch, Thursday, August 21, 2008.
Arango, T. (2008) Market Data, Far From the Market. New York.

387
Axinn, G. H., and N. W. Axinn. Collaboration in International Rural Development: A Practitioner's Handbook. New Delhi/Thousand Oaks/London.: Sage Publications, 1997.
Azzam, A. M., and J. R. Schroeter. "The Tradeoff Between Oligopsony Power and Cost Efficiency in Horizontal Consolidation: An Example from Beef Packing." American Journal of Agricultural Economics 77, no. 4(1995): 825-36.
BAS (2010) Bureau of Agricultural Statistics: CountrySTAT Phillipines.
Bellemare, M. F., and C. B. Barrett. "An Ordered Tobit Model of Market Participation: Evidence from Kenya and Ethiopia." American Journal of Agricultural Economics 88, no. 2(2006): 324-337.
Benkler, Y. (2008) The Wealth of Networks: How Social Production Transforms Markets and Production, Yale University Press.
Boughton, D., et al. "Market Participation by Rural Households in a Low-Income Country: An Asset-Based Approach Applied to Mozambique." Faith and Economics 50(2007): 64-101.
Caves, E. R. American Industry; Structure, Conduct and Performance: Harvard University, Prentice Hall, 1992.
CIRAD-UMR-MOISA (2010) Agricultural market information systems in Africa: renewal and impact. Summary of the workshop held from 29th to 31st March 2010. Montpellier, France.
Davies, M. (2010) The top 10 Misconceptions about MIS: Notes from the field. Workshop on Agricultural Market Information Systems in Africa: Renewal and Impact, Montpellier, France.
Dembélé, N. N., and J. M. Staatz (2000) The Response of Cereals Traders to Agricultural Market Reform in Mali, ed. R. J. Bingen, D. Robinson, and J. M. Staatz. East Lansing, MI, Michigan State University Press.
Dembélé, N. N., and J. M. Staatz. (1999) The Impact of Market Reform on Agricultural Transformation in Mali, Paper Presented At the Workshop on Agricultural Transformation. Nairobi Kenya, Michigan State University Press.

388
Dembélé, N. N., J. F. Tefft, and J. M. Staatz (2000) Mali's Market Information System: Innovative Evolution In Support Of A Dynamic Private Sector. East Lansing-Michigan State University.
Diarra, S., A. Traoré, and J. M. Staatz (2004) Developing Sustainable Agricultural Information Services: Lessons from Mali. East Lansing, MSU Agricultural Economics Presentation.
Donner, J., and M. X. Escobari. "A review of evidence on mobile use by micro and small enterprises in developing countries." Journal of International Development 22, no. 5(2010): 641-658.
Eisgruber, L. M. "Developments in the Economic Theory of Information." American Journal of Agricultural Economics 6, no. 5(1978): 901-905.
Gakuru, M., K. Winters, and F. Stepman. "Inventory of Innovative Farmer Advisory Services using ICTs." The Forum for Agricultural Research in Africa (FARA), February 2009.
Goetz, S. J. "A Selectivity Model of Household Food Marketing Behavior in Sub-Saharan Africa." American Journal of Agricultural Economics 74, no. 2(1992): 444-452.
Goyal, A. "Information, Direct Access to Farmers, and Rural Market Performance in Central India." American Economic Journal: Applied Economics 2, no. 3(2010): 22-45.
Greene, W. H. Econometric Analysis. Fifth ed: Prentice Hall, 2003.
Hayami, Y., and K. Otsuka. The Economics of Contract Choice: An Agrarian Perspective: Clarendon Press Oxford, 1993.
Hayami, Y., and W. Peterson. "Social Returns to Public Information Services: Statistical Reporting of U.S farm Commodities." The American Economic Review 62, no. 1/2(1972): 119-130.
Holtzman, J. S., et al. (1993) Market Information Services: Lessons from the AMIS Project Experience. Bethesda, Maryland 20814, Abt Associates.

389
J.Rakotoson, et al. (2010) What's New About MIS in Sub-Saharan Africa? An Overview of MIS Evolution. Montpellier, France, CIRAD, INRA, MSU
Jensen, R. "The Digital Provide: Information (Technology), Market Performance, and Welfare in the South Indian Fisheries Sector*." Quarterly Journal of Economics 122, no. 3(2007): 879-924.
Jensen, R. T. "Information, efficiency, and welfare in agricultural markets." Agricultural Economics 41(2010): 203-216.
Keita, N. (2006) Economic Statistics and Agricultural Policy in African context: Example of Market Information Systems in Cereal Market Reform of Mali. Gold Coast, Australia.
Key, N., E. Sadoulet, and A. de Janvry. "Transactions Costs and Agricultural Household Supply Response." American Journal of Agricultural Economics 82, no. 2(2000): 245-259.
Kish, L. Survey Sampling: John Wiley & Sons, Inc, 1965.
Kizito, A. "Estimating The Benefits From Improved Market Information." Michigan State University, 2009.
Kone, H. "Etude Sur L'identification Des Besoins D'information Des Consommateurs: Rapport Definitif." Ministere Du Developpement, Rural Et De L’eau, APCAM/PASIDMA, Republique Du Mali.
Kundu, J., and A. Mukhebi (2010) Linking Farmers to Markets in Kenya: KACE Model. Workshop on Agricultural Market Information Systems in Africa: Renewal and Impact, Montpellier, France.
Kutsoati, E., and S. Bartlett (2008) Texting TradeNet: What's the price of soya beans?
Lokanathan, S., and H. d. Silva. "Leveraging Mobile 2.0 in India for Agricultural Market Access." (2010).
390
Mabota, A., et al. "A Informação: Alavanca de Baixo Custo para o Desenvolvimento dos Mercados Agrários?" SIMA, Departamento de Análise de Políticas MADER-Direcção de Economia, 23 de Setembro de 2003.
Mabota, A., et al. "Market Information: A Low Cost Tool for Agricultural Market Development?" SIMA-DEST and Department of Policies Analysis MADER-Directorate of Economics, September 23, 2003.
Mather, D. "Determinants of Crop Income in Rural Mozambique, 2002-2005." Directorate of Economics, Ministry of Agriculture, July 2009.
Mather, D., B. Cunguara, and D. Boughton. "Household Income and Assets in Rural Mozambique, 2002-2005: Can Pro-Poor Growth Be Sustained?" Ministry of Agriculture, Directorate of Economics, Republic of Mozambique.
Mather, D., and C. Donovan. "The Impacts of Prime-Age Adult Mortality on Rural Household Income, Assets, and Poverty in Mozambique." Ministry of Agriculture and Rural Development; Directorate of Economics, Republic of Mozambique, April 2008.
Meuleman, L. "Impact study of the Market Information System KACE in Kenya." Katholieke Universiteit Leuven, 2007.
Mittal, S., S. Gandhi, and G. Tripathi (2010) Socio-Economic Impact of Mobile Phones on Indian Agriculture, Indian Council for Research on International Economic Relations.
Mulozi, P. (2010) MIS in Africa: The Zambian (ZNFU 4455). Workshop on Agricultural Market Information Systems in Africa: Renewal and Impact, Montpellier, France.
NAADS (2004) What is a Farmer's Forum Under NAADS? Kampala Uganda, National Agricultural Advisory Services Secretariat.
NASS. "The Fact Finders For Agriculture." USDA NASS.
NASS. "Fact Finders for U.S. Agriculture: 2010 Guide To Products and Services." USDA, National Agricultural Statistics Service.

391
NASS (2009) NASS Surveys: The Foundation of Estimates.
Nicholson, W. Microeconomic Theory, Basic Principles and Extensions. Eight ed: South-Western Thomson Learning, 2002.
Olson, M. The Logic of Collective Action: Public Goods and the Theory of Groups. Harvard Economic Studies v124 Cambridge: Harvard University Press, 1965.
OMA. "Bulletin de conjuncture: Bulletin d’analyse prospective du marché agricole." Observatoire du Marché Agricole, Réalisé conjointement avec le PROMISAM – MSU - USAID, Décembre 2008.
OMA. "Le Reflect: Bulletin mensuel du marché agricole." Observatoire du Marché Agricole (OMA), Permanent Assembly of Chambers of Agriculture of Mali (APCAM), Mars 2009.
Pindyck, R., and D. Rubinfeld. Econometric Models and Economic Forecasts McGraw-Hill Book Co, 1998.
Preethi, J. (2009) Reuters Market Light Goes To Himachal; Pan-India With Nokia; Txt vs. GPRS vs. Voice.
PROMISAM. "Etude sur : Identification des besoins d’information Des operateurs economiques Pour le developpement des echanges En afrique de l’ouest ". Projet De Mobilisation Des Initiatives En Matiere De Securite Alimentaire Au Mali (PROMISAM).
PROMISAM_APCAM_MSU. "Workshop of refund and validation of the study on the identification needs for information of the economic operators food agro sector." May 2008.
PROMISAM_OMA_MALI. "Requirements of Information for the Wholesalers for an Increase for Volume for the Exchanges in West Africa." OMA APCAM, February 2008.
PROMISAM_SENEGAL. "Study on the information needs of operations (import / export) and preferred means of dissemination: final report." SIM Senegal, PROMISAM, and RESIMAO, March 2008.

392
PROMISAM_SENEGAL. "Workshop of refund and validation of the study on the pegging for information Operators of the sector Agro-alimentary of Senegal." 1st JULY 2008.
PROMISAM_SIMA_Niger. "Pegging for information of the users for the development of the exchanges in under area OA." March 2008.
PROMISAM_SIMA_Niger. "Workshop of refund of the results of the survey "Pegging for information of the users for the development of the exchanges in under African Western area"." Information System on Agricultural Steps of Niger (SIMA), June 20, 2008.
PROMISAM_SIPAG_Guinea. "Recensement des besoins d’information des opérateurs économiques pour une augmentation du volume des échanges entre la Guinée, le Mali, le Niger et le Sénégal." Ministere De L’agriculture Et De L’elevage Republique De Guinee, Système d’information sur les Produits Agricoles en Guinée, Mars 2008.
Rashid, S., A. Gulati, and R. J. Cummings (2008) From Parastatals to Private Trade: Lessons from Asian Agriculture, ed. S. Rashid, A. Gulati, and R. J. Cummings. Washington DC. 20006, International Food Policy Research Institute.
Ray, D. Development Economics. Princeton: Princeton University Press, 1998.
Rothschild, M. "Searching for the Lowest Price When the Distribution of Prices is Unknown." The Journal of Political Economy 82, no. 4(1974): 689-711.
Schmid, A. A. Conflict and Cooperation, Institutional and Behavioral Economics: Blackwell Publishing, 2004.
Shahidur, R. " Spatial Integration of Maize Markets in Post-liberalised Uganda." Journal of African Economies 13, no. 1(2004): 102-133.
SHEMP-ADC (2006) SMS Trade/Market Information System, SHEMP-Agribusiness Development Component.
Shepherd, A. W. (1997) Market Information Services - Theory and Practices. Rome, Food and Agriculture Organization of the United Nations.

393
Shepherd, A. W., and A. J. F. Schalke (1995) An Assessment of the Indonesian Horticultural Market Information Service Rome, Marketing and Rural Finance Service, Agricultural Support Systems Division, Food and Agriculture Organization of the United Nations.
Silva, H. d., and D. Ratnadiwakara (2008) Using ICT to reduce transaction costs in agriculture through better communication: A case-study from Sri Lanka. 12 Balcombe Place, Colombo 00800, Sri Lanka.
SIMA (2009) Quente-Quente: Informação Semanal de Mercados Agrícolas no País, Região e Mundo. Maputo Mozambique, pp. 8.
SIMA (2009) Sistema De Informação De Mercados Agrícolas De Moçambique (SIMA).
Singh, I., L. Squire, and J. Strauss. Agricultural household models: Extension, application and policy. Edited by I. Singh, L. Squire, and J. Strauss. Baltimore, MD: Johns Hopkins University Press, 1986.
Staatz, J. (2007) Market Information and Grading. East Lansing, Michigan State University, pp. AEC 841: Analysis of Food System Organization and Performance Lecture Notes.
Staatz, J. M., et al. "Pathways from Improved Market Information to Better Market Performance: Implications for the Evaluation of Investments in Agricultural Market Information Systems." Submitted to CAHIERS AGRICULTURES Special issue on Market Information Systems (2010).
Stigler, G. J. "The Economics of Information." Journal of Political Economy 69, no. 30(1961): 213-225.
Stiglitz, J. E., and A. Weiss. "Credit Rationing in Markets with Imperfect Information." The American Economic Review 71, no. 3(1981): 393-410.
Svensson, J., and D. Y. Drott (2010) Tuning in the Market Signal: The Impact of Market Price Information on Agricultural Outcomes.
Svensson, J., and D. Yanagizawa. "Getting Prices Right: The Impact of the Market Information Service In Uganda." Journal of the European Economic Association 7 (2-3)(2009).

394
Tembo, G., et al. "Fostering Agricultural Market Development in Zambia." Working Paper No. 40, Food Security Research Project, July 2009.
Thomson-Reuters (2007) Reuters Market Light now available in local post offices across Maharashtra, Thomson Reuters.
Tollens, E. "The History and Effects of the Arabica Market Information System (AMIS – Phase I and II)." Consultant Report. The United States Agency for International Development Mission to Cameroon, Yaounde Cameroon Office of Economic Analysis and Policy Reform Implementation March 10, 1994.
Tollens, E. F. (2006) Market Information Systems in Sub-Sahara Africa Challenges and Opportunities. Gold Coast, Australia
Traoré, A., et al. (2004) Role of Information and Communication Tools in Food and Nutritional Security in the ACP Countries: The Experience of the Agricultural Market Information System (OMA) of Mali. Maputo, Mozambique.
USDA-NAAS (2008) Agricultural Statistics 2008. United States Government Printing Office Washington, Agricultural Statistics Board, National Agricultural Statistics Service (NASS), United States Department of Agriculture.
USDA (2006) Fruit and Vegetable Market News Users Guide, U.S. Department of Agriculture, Agricultural Marketing Service, Fruit and Vegetable Programs.
USDA (1999) Understanding USDA Crop Forecasts, National Agricultural Statistics Service, Office of the Chief Economist, World Agricultural Outlook Board.
Varian, H. R. "A Model of Sales." The American Economic Review 70, no. 4(1980): 651-659.
Weber, M. T., Cynthia Donovan, John M. Staatz and Niama Nango Dembélé. "Guidelines for Building Sustainable Market Information Systems in Africa with Strong Public-Private Partnerships." Paper prepared for the CTA. Michigan State University, November.
Whiteside, M., and A. Lucas. "Agricultural Marketing in Nampula Province – Constraints and Opportunities." CARE International in Mozambique.
395
Williamson, O. E. The Economic Institutions of Capitalism: Firms, Markets, Relational Contracting: The Free Press: New York, 1985.
Williamson, O. E. "The Modern Corporation: Origins, Evolution, Attributes." Journal of Economic Literature 19, no. 4(1981): 1537-1568.
Wooldridge, J. M. Econometric Analysis of Cross Section and Panel Data. Second ed: The MIT Press, 2002.
Yin, R. K. Case Study Research: Design and Methods, Third Edition, Applied Social Research Methods Series, Vol 5. Third Edition ed. Vol. 5. Applied Social Research Methods Series: Sage Publications, Inc, 2003.
ZNFU (2007) The Zambia National Farmers’ Union SMS Market and Trade Information System (ZNFU 4455).