the role of perceived value in a high involvement purchase ...
381
(1) THE ROLE OF PERCEIVED VALUE IN A HIGH INVOLVEMENT PURCHASE DECISION PROCESS: A CASE STUDY IN HOME BUYING By Nucharee Supatn A Dissertation Submitted in Partial Fulfillment of the Requirements for the Degree of Doctor of Business Administration, Marketing Major The Joint Doctoral Program in Business Administration (JDBA) Thammasat University, Chulalongkorn University, and The National Institute of Development Administration 2006
-
Upload
khangminh22 -
Category
Documents
-
view
2 -
download
0
Transcript of the role of perceived value in a high involvement purchase ...

(1)
THE ROLE OF PERCEIVED VALUE IN A HIGH INVOLVEMENT PURCHASE DECISION PROCESS:
A CASE STUDY IN HOME BUYING
By
Nucharee Supatn
A Dissertation Submitted in Partial Fulfillment of the Requirements for the Degree of Doctor of Business Administration, Marketing Major
The Joint Doctoral Program in Business Administration (JDBA) Thammasat University, Chulalongkorn University, and The National Institute of Development Administration
2006

(2)
The Role of Perceived Value in a High Involvement Purchase Decision Process: A Case Study in Home Buying
By
Nucharee Supatn
นุจรี สุพัฒน
A Dissertation Submitted in Partial Fulfillment of the Requirements for the Degree of Doctor of Business Administration in Marketing
Faculty of Commerce and Accountancy, Thammasat University 2006

(3)
Thammasat University Faculty of Commerce and Accountancy
A Doctoral Dissertation
by Nucharee Supatn
Titled
The Role of Perceived Value in a High Involvement Purchase Decision Process:
A Case Study in Home Buying
has been approved as a partial fulfillment of the requirement for the degree of Doctor of Business Administration (D.B.A.) in Marketing
For the Joint Doctoral Program in Business Administration (JDBA)
On December 20th 2006 by Chairperson and Major Advisor _____ __ _______ (Assoc. Prof. Dr. Ruth Banomyong) Committee Member ____ __ _______ (Prof. Dr. Robert T. Green) Committee Member ____ __ _______ (Assoc. Prof. Dr. Pradit Wanarat) Committee Member ____ __ _______ (Asst. Prof. Dr. Thanawan Sangsuwan) Dean ____ __ _______
(Assoc. Prof. Gasinee Witoonchart)

(4)
ABSTRACT Decision making process and choice models has been of interest in marketing literatures for years (Richarme, 2005). The purchase decision knowledge is valuable for marketers to understand the consumers and optimize marketing strategies (Colias, 2005). Previous researches on purchase decisions focused on some particular parts of decision process. This current research attempts to study the entire process of consumer decision on a high involvement purchase.
The purpose of this research was to develop and test a model of purchase decision for the real estate products. Prospect theory of decision has been extended by applying the details of perceived value and its antecedents. A two-stage model of purchase decision covering consideration set formation and choice selection has been proposed. The six antecedents of perceived value were put in the theoretical framework for choice selection. All antecedents were categorized into two contradictory groups: benefits and sacrifices. Benefits included product quality, sales service quality, brand equity, while sacrifices composed of perceived risk, perceived price, and customer involvement. In addition to previously proposed antecedents, the new construct, relationship quality which is comprised of trust, commitment, and satisfaction was added as a mediating construct in the model. Empirical assessment of the theoretical framework included focus group discussions and two surveys with the recent and prospective home buyers. The proposed research model was tested with regression in structural equation modeling technique. The results provided overall support for the proposed research model. As hypothesized, results suggested that perceived value is determined by product quality, sales service quality, brand equity, perceived risk and perceived price. Moreover, relationship quality mediates the relationship between most antecedents and perceived value. However, the impact of customer involvement was not found. The results further suggested that relationship quality plays an important role in predicting choice selection and purchase intention. Two non-hypothesized findings included a strong and significant impact of service quality on perceived value when it is mediated by personal
(5)
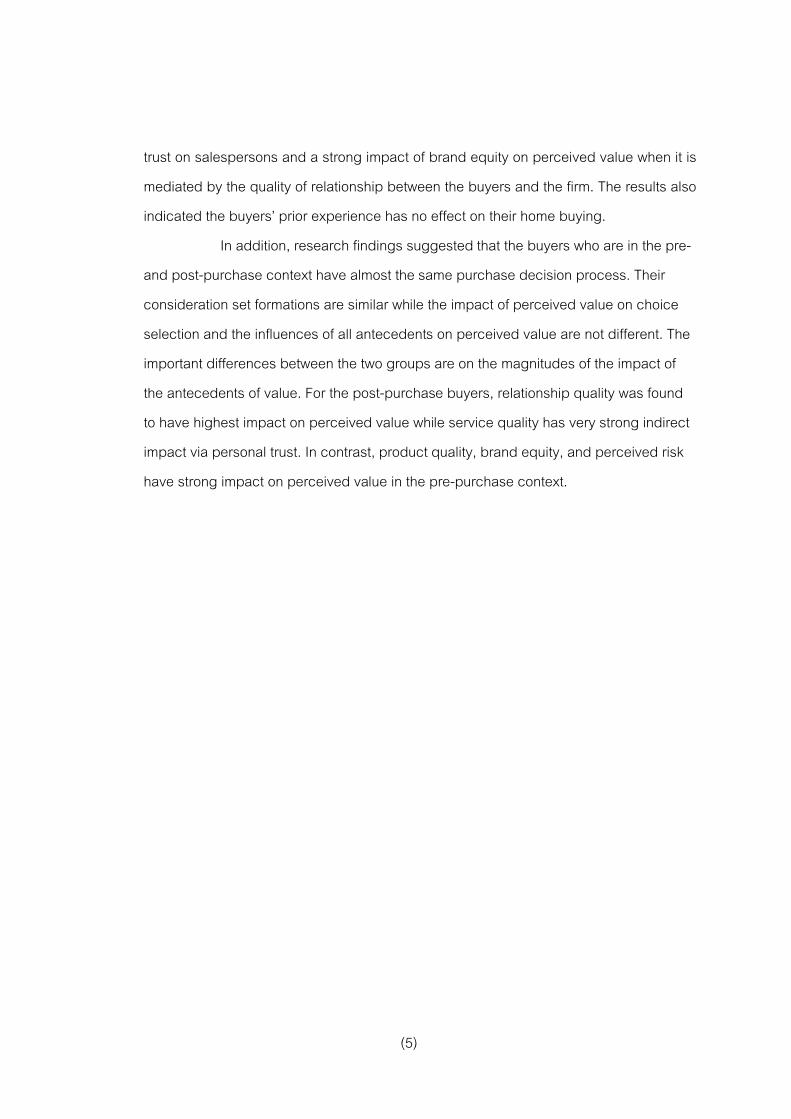
trust on salespersons and a strong impact of brand equity on perceived value when it is mediated by the quality of relationship between the buyers and the firm. The results also indicated the buyers’ prior experience has no effect on their home buying. In addition, research findings suggested that the buyers who are in the pre- and post-purchase context have almost the same purchase decision process. Their consideration set formations are similar while the impact of perceived value on choice selection and the influences of all antecedents on perceived value are not different. The important differences between the two groups are on the magnitudes of the impact of the antecedents of value. For the post-purchase buyers, relationship quality was found to have highest impact on perceived value while service quality has very strong indirect impact via personal trust. In contrast, product quality, brand equity, and perceived risk have strong impact on perceived value in the pre-purchase context.

(6)
ACKNOWLEDGEMENTS The successful completion of this dissertation results from the help of many people who have supported me during a period of my study. I gratefully appreciate their helps for everything. First, I would like to sincerely thank my advisor, Assoc. Prof. Dr. Ruth Banomyong, who was most responsible for helping me complete this dissertation as well as challenging me to explore several things that lie behind the research. He was always available to meet and discuss about my ideas and to provide me with good comments and suggestions to help me think through my problems whether philosophical or analytical. Without his encouragement and support, I could not have finished this dissertation.
Second, I would like to offer my sincere gratitude to the members of the examination committee: Prof. Dr. Robert T. Green, Assoc. Prof. Dr. Pradit Wanarat, and Asst. Prof. Dr. Thanawan Sangsuwan for their time and effort to read my dissertation as well as their constructive comments to improve my work. Third, I am particularly grateful to Assoc. Prof. Dr. Guntalee Ruenrom and Assoc. Prof. Dr. Pipop Udorn who gave me valuable academic suggestions as well as the encouragement and emotional support when I had critical problems during my doctoral study. They made me realize that I am not alone in this world. Whenever I need help, I would have someone who is willing to support me always. Fourth, I would like to thank Assumption University (AU) for the scholarship and also the ABAC School of Management especially the Dean, Dr. Cherdpong Sibunruang, and the Associate Dean, Dr. Uree Cheasakul, who gave a lot of support for the completion of this dissertation. In addition, I am particularly grateful to Dr. Vindhai Cocracul, AU Deputy V.P. for Academic Affairs, who was extremely supportive in advising me throughout the program. Many thanks are also given to Dr. Chandhaluk Heesawat who helped me collect data, gave me free movie tickets, and also offered me other support to help me relax. Special thanks go to Sandra Sue Hanutsaha who spent her valuable time to edit my writing. Also, I want to thank my friends and many

(7)
colleagues at Assumption University that I worked with during my dissertation period. Their support was too much to be mentioned here. Moreover, the special thanks are given to the students who cordially helped me collecting the data. I am indebted to the people of the cooperating real estate companies, who allowed me to contact their customers for focus group interviews. To preserve their anonymity, I would not mention their names. Next, I appreciate the help and support of my best friend, Vouravis Veerakachen who have joined the JDBA program at the same time. We share all knowledge, happiness, and even pain together since the beginning of the program. I appreciate the friendship we have had and also support and helps we gave to each other. I really enjoy the academic talks on our dissertations and other related issues and also social talks we had about everyday life. Moreover, he always motivated me in times of trouble. His emotional, psychological, and also, spiritual support are very valuable for me and also enriching my life. Our true friendship made my doctoral period interesting and enjoyable. Finally, I would like to wholeheartedly thank my family for their indispensable support. More than special thanks go to my mother, Vimon Tachapanyachai and Lieutenant Colonel Vorachet Supatn, my dearest husband who always love and support me for everything I have and even have not asked for. I would particularly like to thank Chanchanok and Chantanin Supatn for their endless love and understanding. My family provides me a solid foundation of life by showing what is important in life. Without a doubt, their unending love, care, and support motivate me to complete this D.B.A. program. Therefore, I would like to dedicate this dissertation to my beloved family. Without the valuable contributions from these aforementioned people and organizations, the completion of my doctorate degree would not have been possible. Thank you very much. Nucharee Supatn Thammasat University 2006

(8)
TABLE OF CONTENTS
Page Abstract .............................................................................................................. (4) Acknowledgement ................................................................................................. (6) Table of Content .................................................................................................... (8) List of Tables.......................................................................................................... (12) List of Figures ........................................................................................................ (16) Chapter
1. Introduction ............................................................................................... 1
Background of the Research................................................................ 1 Purpose of the Research ..................................................................... 2 Research Objectives ............................................................................ 3 Research Questions ............................................................................. 4 Research Methodology......................................................................... 5 Expected Outcomes ............................................................................ 6 Contribution of the Dissertation ............................................................ 6 Structure of the Research ..................................................................... 7
2 Real Estate Industry................................................................................... 9
Real Estate Business Context............................................................... 10 Development of Thai Real Estate Industry............................................ 11 Price Level and Payment Methods of Thai Real Estate Products ......... 17 Consumer Home Buying Behavior ....................................................... 19 Summary............................................................................................... 27
3 Literature Review....................................................................................... 29
Consumer Purchase Decision Process ................................................ 30

(9)
Perceived Value.................................................................................... 45 Factors Considered as Benefits that Influence Perceived Value.......... 56 Product Quality .............................................................................. 56 Sales Service Quality..................................................................... 62 Brand Equity.................................................................................. 68 Relationship Quality....................................................................... 72 Factors Considered as Sacrifices that Influence Perceived Value ....... 77 Perceived Price ............................................................................. 77 Perceived Risk .............................................................................. 79 Consumer Involvement.................................................................. 82 Summary............................................................................................... 83
4 Hypotheses Development and Research Methodology ............................ 85 Hypotheses Development .................................................................... 87 The Influence of Benefits and Sacrifices on Perceived Value .............. 87 Mediating Effects of the Relationship Quality ....................................... 98 Relationship between Perceived Value and Choice Selection ............. 103 Research Methodology......................................................................... 109 Research Design ........................................................................... 110 Population, Sample, and Sampling ............................................... 111 Survey Research Tool ................................................................... 115 Questionnaire Layout .................................................................... 115 Development of Measurement Constructs .................................... 116 Operational Definition.................................................................... 121 Pre-test and Pre-test Results ......................................................... 123 Survey Data Collection .................................................................. 130 Data Analysis ................................................................................ 132 Extensive Qualitative Data Collection and Analysis ...................... 132 Summary............................................................................................... 134

(10)
5 Content Analysis for the Consideration Set Formation .............................. 135 Consideration Set Formation Criteria .................................................... 137 Size of Consideration Sets.................................................................... 144 Decision Rules...................................................................................... 146 Summary............................................................................................... 149
6 Structural Equation Analysis and Hypothesis Testing ............................... 150 Sample Profiles and Characteristics of the Houses.............................. 151 Recent Home Buyers Characteristics ........................................... 152 Prospective Home Buyers Characteristics.................................... 156 Mean Comparisons between Each Type of Home Buyers............ 161 Assessment of Reliability and Validity of the Measurement Items........ 168 Item Analyses................................................................................ 168 Exploratory Factor Analysis........................................................... 170 Assumption and Requirement Checks for the SEM ...................... 181 Confirmatory Factor Analysis of the Measurement Models ........... 185 Assessment of Structural Equation Model and Hypotheses Testing
for Recent Home Buyers .................................................... 194 Assessment of Structural Relationships for Base Model ............... 194 Structural Model Fitting ................................................................. 197 Hypotheses Testing....................................................................... 198 Assessment of Structural Equation Model and Hypotheses Testing
for Prospective Home Buyers ............................................. 215 Structural Model Fitting ................................................................. 215 Hypotheses Testing....................................................................... 216 Summary............................................................................................... 227

(11)
7 Research Findings and Discussion ........................................................... 229 Discussions of the Findings from Post-Purchase Buyers .................... 229 Alternative model for the Post-Purchase Buyers .................................. 248 Discussions of the Findings from Pre-Purchase Buyers ...................... 253 Alternative model for the Pre-Purchase Buyers .................................... 259 Comparison of the Pre- and Post-Purchase Buyers’ Decisions............ 263 Summary............................................................................................... 270
8 Conclusions and Recommendations......................................................... 271
Conclusions .......................................................................................... 271 Theoretical Contributions...................................................................... 278 Managerial Implications........................................................................ 281 Limitations and Suggestions for Future Research ................................ 284 References............................................................................................................. 288 Appendices ........................................................................................................... 311
A. Interview guide and Discussion guide ...................................................... 312 B. Research Questionnaires .......................................................................... 316 C. Normal Q-Q Plots for Univariate Normality and Tests of Multivariate Normality 339 D. Pairwise Parameter Comparisons for SEM: Multi-group Analyses ............ 343 E. Presentation Slides .................................................................................... 347

(12)
LIST OF TABLES Tables Page
2.1 Real Estate Changes and Developmental Issues in Thailand .............. 13 2.2 Housing Completions in BMR and Vicinity in 1993-2004...................... 16 2.3 Primary and Secondary Reasons for Buying a New House.................. 20 2.4 Number of Housing Completions in BMR and Vicinity During 1993 to 2004 ............................................................................. 22 3.1 Five decision Making Strategies........................................................... 41 3.2 Definitions of Value Related Construct ................................................. 46 3.3 The Different Proposed Names of Perceived Value.............................. 46 3.4 Scope and Definitions of Perceived Value Proposed in Previous Studies ................................................................................... 48 3.5 Comparison of Garvin’s and Kotler’s Product Quality Dimensions....... 57 3.6 The Comparison of Housing Factors from Some Previous Studies ...... 59 3.7 The Definitions of the Environmental Factors........................................ 61 3.8 Comparison of the Environmental Criteria of the Real Estate Product.. 61 3.9 The Seven Gaps in Service Quality ...................................................... 65 3.10 Five Key Categories of Service Quality................................................. 66 3.11 How Real Estate Services were Valued and Rated .............................. 67 3.12 Proposed Dimensions of Relationship Quality in the Previous Studies. 74 4.1 List of Hypotheses ................................................................................ 105 4.2 The Numbers of Samples in Each Group Categorized by Price Level . 114 4.3 Content of Questions Proposing in the Questionnaire .......................... 116 4.4 List of Variables and their Operational Definitions................................ 122 4.5 Summary of Scale Reliability and their Internal Consistency................ 124 4.6 Factor Analysis Results and Scale Reliability for Product Quality......... 125 4.7 Factor Analysis Results and Scale Reliability for Service Quality ......... 125 4.8 Factor Analysis Results and Scale Reliability for Brand Equity ............ 126

(13)
Tables Page 4.9 Factor Analysis Results and Scale Reliability for Relationship Quality . 127 4.10 Factor Analysis Results and Scale Reliability for Perceived Risk ......... 128 4.11 Factor Analysis Results and Scale Reliability for Consumer Involvement ......................................................................... 129 4.12 Factor Analysis Results and Scale Reliability for Perceived Price........ 129 4.13 Factor Analysis Results and Scale Reliability for Perceived Value ....... 129 4.14 Proposed Statistical Techniques Selected for the Data Analysis ......... 133 4.15 Stages of Data Analysis........................................................................ 134 5.1 The Demographic Details of Focus Group Discussion......................... 136 6.1 Characteristics of the Recent Home Buyers ......................................... 152 6.2 Characteristics of the Houses Owned by Recent Home Buyers........... 153 6.3 The Reasons of Recent Home Buyers to Buy the House...................... 155 6.4 Brand of the House Owned by Recent Home Buyers........................... 155 6.5 Profile of the Respondents for Prospective Home Buyers .................... 156 6.6 Housing Characteristics of Interest to Prospective Home Buyers ........ 159 6.7 Brand of the House of Interest to Prospective Home Buyers................ 160 6.8 The Reasons of Prospective Home Buyers to Buy the House .............. 161 6.9 Mean Comparisons between Recent and Prospective Home Buyers .. 162 6.10 Means and Standard Deviations of Major Constructs Categorized by
Real Estate Brand ................................................................................. 164 6.11 Means and Standard Deviations of Major Constructs Categorized by Price Level ............................................................................................ 166 6.12 Means and Standard Deviations of Major Constructs Categorized by
Samples’ Experience ............................................................................ 167 6.13 Reliability Analyses Results .................................................................. 169 6.14 Inter-Item Correlation Matrix for Housing Factors ................................. 170 6.15 Measurement Items for each Construct and their Pertaining Variable
Names................................................................................................... 171

(14)
Tables Page 6.16 Exploratory Factor Analysis Results of Perceived Value....................... 174 6.17 Exploratory Factor Analysis Results of Product Quality ........................ 175 6.18 Exploratory Factor Analysis Results of Service Quality......................... 176 6.19 Exploratory Factor Analysis Results of Brand Equity ............................ 176 6.20 Exploratory Factor Analysis Results of Perceived Risk ......................... 177 6.21 Exploratory Factor Analysis Results of Consumer Involvement ............ 178 6.22 Exploratory Factor Analysis Results of Perceived Price........................ 178 6.23 Reliability and Exploratory factor analysis for Relationship Quality....... 179 6.24 Summary of the Modified dimensions of the Research Constructs ...... 180 6.25 Regression Analysis Results ................................................................. 184 6.26 Correlations between Latent Constructs............................................... 184 6.27 The Comparisons between the Fit indices of the Proposed Model
and the Recommended Level............................................................... 197 6.28 Direct Relationship Estimated for perceived value and its
antecedents .......................................................................................... 199 6.29 Structural Relationship Estimated of the Dimensions of Product Quality
and Perceived Risk ................................................................................ 202 6.30 Structural Relationship Estimated of the Dimensions of Relationship
Quality................................................................................................... 204 6.31 Regression Equation Tests for Mediating Effects of the Base Model
for Recent Home Buyers....................................................................... 206 6.32 Total Effects on Perceived Value for Base Model of Recent Home
Buyer..................................................................................................... 207 6.33 Summary of Premium and Non-Premium Subgroup Analyses of
Recent Home Buyers ............................................................................ 211 6.34 Summary of Price level Subgroup Analyses of Recent Home Buyers .. 212 6.35 Summary of First Time and Non-First Time Subgroup Analyses........... 213

(15)
Tables Page 6.36 The Conclusion of Hypotheses Testing Results for the Recent Home
Buyers................................................................................................... 214 6.37 Direct Relationship Estimated for perceived value and its
antecedents .......................................................................................... 217 6.38 Structural Relationship Estimated of the Dimensions of Product Quality
and Perceived Risk ................................................................................ 219 6.39 Structural Relationship Estimated of the Dimensions of Relationship
Quality................................................................................................... 221 6.40 Regression Equation Tests for Mediating Effects of the Base Model
for Prospective Home Buyers ............................................................... 222 6.41 Total Effects on Perceived Value for Base Model of Prospective
Home Buyer .......................................................................................... 223 6.42 Summary of Premium and Non-Premium Analysis of Prospective
Home Buyers ........................................................................................ 224 6.44 The Conclusion of Hypotheses Testing Results for Prospective Home
Buyers................................................................................................... 226 7.1 Results of Model Fitting Procedure for Recent Home Buyers ............... 250 7.2 Fit Indices for the Proposed and Alternative Model of Recent Home
Buyers................................................................................................... 251 7.3 Total Effects on Perceived Value for Alternative Model ........................ 251 7.4 Results of Model Fitting Procedure for Recent Home Buyers ............... 260 7.5 Fit Indices for the Proposed and Alternative Model of Prospective
Home Buyers ........................................................................................ 261 7.6 Total Effects on Perceived Value for Alternative Model ........................ 261 8.1 Conclusions of Research Questions and the Corresponding Answers 277
(16)
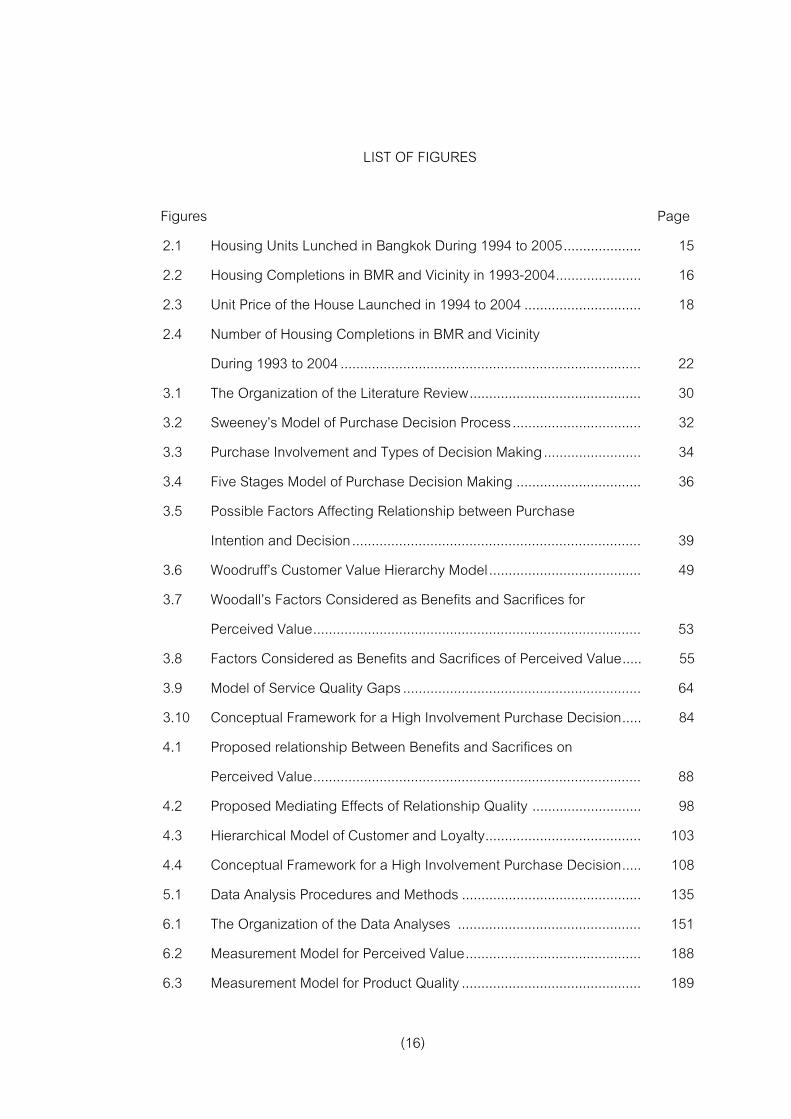
LIST OF FIGURES Figures Page
2.1 Housing Units Lunched in Bangkok During 1994 to 2005.................... 15 2.2 Housing Completions in BMR and Vicinity in 1993-2004...................... 16 2.3 Unit Price of the House Launched in 1994 to 2004 .............................. 18 2.4 Number of Housing Completions in BMR and Vicinity During 1993 to 2004 ............................................................................. 22 3.1 The Organization of the Literature Review............................................ 30 3.2 Sweeney’s Model of Purchase Decision Process................................. 32 3.3 Purchase Involvement and Types of Decision Making......................... 34 3.4 Five Stages Model of Purchase Decision Making ................................ 36 3.5 Possible Factors Affecting Relationship between Purchase Intention and Decision.......................................................................... 39 3.6 Woodruff’s Customer Value Hierarchy Model....................................... 49 3.7 Woodall’s Factors Considered as Benefits and Sacrifices for Perceived Value.................................................................................... 53 3.8 Factors Considered as Benefits and Sacrifices of Perceived Value..... 55 3.9 Model of Service Quality Gaps ............................................................. 64 3.10 Conceptual Framework for a High Involvement Purchase Decision..... 84 4.1 Proposed relationship Between Benefits and Sacrifices on Perceived Value.................................................................................... 88 4.2 Proposed Mediating Effects of Relationship Quality ............................ 98 4.3 Hierarchical Model of Customer and Loyalty........................................ 103 4.4 Conceptual Framework for a High Involvement Purchase Decision..... 108 5.1 Data Analysis Procedures and Methods .............................................. 135 6.1 The Organization of the Data Analyses ............................................... 151 6.2 Measurement Model for Perceived Value............................................. 188 6.3 Measurement Model for Product Quality .............................................. 189

(17)
Figures Page 6.4 Measurement Model for Service Quality............................................... 190 6.5 Measurement Model for Brand Equity .................................................. 190 6.6 Measurement Model for Perceived Risk ............................................... 191 6.7 Measurement Model for Customer Involvement ................................... 192 6.8 Measurement Model for Perceived Price.............................................. 192 6.9 Measurement Model for Relationship Quality ....................................... 193 6.10 AMOS Graphical Model for Both Data Sets (Base Model) ................... 196 6.11 Structural Relations and Coefficients for the Base Model of Recent
Home Buyers ........................................................................................ 197 6.12 Coefficients for the Second Structural Model of Recent Home Buyers. 202 6.13 Coefficients for the Third Structural Model of Recent Home Buyers..... 204 6.14 Structural Relations and Coefficients for the Base Model of
Prospective Home Buyers .................................................................... 216 6.15 Coefficients for the Second Structural Model of Prospective Home
Buyers................................................................................................... 219 6.16 Coefficients for the Third Structural Model of Prospective Home
Buyers................................................................................................... 221 7.1 The Alternative Structural Model for Recent Home Buyers................... 250 7.2 The Alternative Structural Model for Prospective Home Buyers ........... 260

1
CHAPTER 1
INTRODUCTION
Background of the Research Understanding consumer purchase decision making is beneficial for both marketers and consumers. As marketers manipulate the various principles of marketing, so do the consumers they seek to reach by choosing which products and brands to buy and which to ignore. Many marketing studies have focused on the decision making process and choice models (Richarme, 2005) since purchase decision knowledge is valuable for marketers to optimize marketing strategy, determine optimal pricing strategy, create effective promotional offers, maximize the appeal of product features, optimize product lines, define bundles of features and benefits that maximize profitability, and predict market share and the source of volume for new brands or products (Colias, 2005). Research on decision making has been concentrated on descriptive studies using decision models or has been done to evaluate information usage based primarily on the environment in which the decisions are being made. Little effort has been made to define the behavior of decision makers based on the role of and dependence on marketing information and related constructs (Albaum and Herche, 1995). The theoretical foundation of consumer behavior on buying decisions indicates that consumers do not consider all alternatives that are available in the market when they want to buy a product (Shiffman and Kanuk, 2004). According to Narayana and Markin (1975), a consumer would undertake a two step decision making process: consideration set formation and final choice selection. This model demonstrates that a consumer makes an initial decision to form a consideration set and a subsequent decision to choose from within the consideration set. In the first stage, the alternatives can be perceived differently by consumers. Some alternatives are not known by the

2
consumers at all, while some are known but are not readily accessible in memory, and others are ruled out as unsatisfactory. Only a small number of alternatives are considered as the "consideration" set, from which one alternative is likely to be purchased.
In the final choice selection, consumers usually put different degrees of effort in the different decision situations; less effort is applied for a routine purchase decision i.e., buying a consumer product while more effort is put in a high involvement purchase in which an expensive, durable, and high involvement product is bought. Scholars have been working diligently to understand the choice process and key influencing factors in the context of purchase and consumption decisions (Lin and Liu, 2006). The utility of the product, the brand of the product, the influence of sales, or other factors have been considered until Kahneman and Tversky (1979) suggested that consumers make their decision based on the “value” given to each alternative. According to this proposition, the importance of utility and each individual attribute of a product are diminished, while consumer value is widely mentioned and accepted as a key factor of choice selection. Consumers would choose the alternative that provides them the highest value. Based on this perspective, the major research questions of this research are twofold. First, what are the common criteria and decision rules consumers depend on when they are forming their consideration set? Second, how do consumers determine their perceived value of a product and how does their perceived value influence their choice selection? Purpose of the Research
The main purpose of this research is to develop and test a model that
enhances the understanding of the entire process of consumer purchase decisions. The focus is on what underlines consumers’ purchase decision when the situation is a high involvement one. Both steps of decision making, consideration set formation and final choice selection process, will be investigated. The underlying criteria for consideration set formation as well as the understanding of how consumers evaluate and choose their

3
alternative choices will be explicated. Perceived value, regarded as the key influencing factor for decision making (Kahneman and Tversky, 1979) which is capable of predicting purchase decision, is selected as a central construct of this research. Since value is defined as the consumer’s overall assessment of the utility of a product based on perceptions of what is received or the benefits and what is given or the sacrifices (Zeithaml, 1988), the impact of both benefits and sacrifices on value creation will be examined.
Product quality, sales service quality, and brand equity are considered benefits for value while perceived price, perceived risk and consumer involvement are considered the sacrifices. More specifically, this study introduces relationship quality which is comprised of trust, commitment, and satisfaction to be another value influencing factor. The effects of relationship quality can be interpreted as the reasons why some consumers give more value to a product than others. Hence, the mediating effect of relationship quality on the relationship between perceived value and the benefit and sacrifice construct will be examined. Next, to investigate the impact of brand equity on a purchase decision, this research attempts to examine whether the construction of perceived value is different between consumers who select the brands that are their first recalls and those who do not. Research Objectives
The research objectives of this research can be specified as follows: 1. To identify the criteria for consideration set formation quality-related
factors that influence a consumer’s decision making process to purchase a durable product.
2. To identify the factors, both benefits and sacrifices, that determine consumer perceived value of each product choice and investigate how those factors influence the value formation.

4
3. To examine the mediating role of relationship quality on the relationship among benefits, sacrifices, and perceived value.
4. To examine the significance of the direct impact of a brand on consumer choice selection.
5. To identify specific characteristics of the quality of product, sales service, brand, perceived price, perceived risk, and consumer involvement that affect value formation in the home buying context.
Research Questions . To elicit the process of consideration set formation and the construction of consumer perceived value and its impact on choice selection, the real estate industry has been selected based on its products’ immoveable, durable, and expensive characteristics. These product characteristics make home buying a high involvement purchase in which both stages of decision would be performed. Eight specifying research questions can be proposed as follows:
1. What are the key attributes consumers use in developing a consideration set?
2. How do consumers develop their perceived value for each choice? 3. What are the key determinants for value creation? 4. What are the relationships among those determinants? 5. How does perceived value affect the final choice selection? 6. How does brand affect consumer decisions? 7. What are the specific characteristics of perceived risk in the home buying
process? 8. Do the effects of the antecedents of perceived value and purchase decision
differ between experienced and less experienced customers?

5
In sum, this research investigates the entire process of the consumer purchase decision. The process of consideration set formation will be examined first. Then, the evaluation of the choice in the choice selection stage will be studied by measuring the criteria consumers use to form their perceived value of each choice. The strengths of the relationships among the major constructs will then be scrutinized. Research Methodology This study investigates consumers’ pre- and post-purchase evaluations of buying a house. The perceived value literature and real estate context are reviewed. A conceptual model that explains the high involvement decision process is synthesized. Based on this literature review, it is proposed that choice selection is made based on perceived value of the product which is resulted from the experienced benefits and sacrifices of the buying. It covers perceptions of product quality, service quality, brand equity, relationship quality, perceived price, perceived risk, and consumer involvement. Twelve hypotheses are proposed. The research methodology can be categorized into three parts: exploratory study, qualitative method, and survey method. The objective of exploratory research is to understand the nature of a research problem. Therefore, in-depth interviews with five real estate professionals are conducted. The qualitative research has been designed for two major objectives: 1) to uncover facts about the criteria and decision rules used in the formation of the consideration set and 2) to confirm the information generated from the survey and to gather details of all major research constructs applied in the final choice selection process. Ten focus group interviews with the recent home buyers were conducted. The conceptual model was empirically tested by the survey data. A “home buying survey” questionnaire has been developed and used as a major research tool. Data were collected from 420 recent home buyers who recently bought single detached houses and 421 prospect home buyers who attempted to buy a house. Non-probability with quota sampling and snowballing technique was applied (See the details in chapter 4). Structural equation modeling analysis was performed to test the major hypotheses.

6
Expected Outcomes The following outcomes are expected from this research:
1. Knowledge concerning the consumer purchase decision typical in the home buying process i.e., the specific criteria for the formation of the consideration set and final selection will be explicated.
2. The impact of product quality, service quality, brand equity, and relationship quality on value creation at both the construct and attribute levels will be illustrated. Also, the influence of perceived price, perceived risk, and consumer involvement on value will be examined. Details and patterns of relationships among perceived value and its antecedents will be understood.
3. A useful guideline for marketers to design a high quality product and sales service and to create essential marketing strategies and tactics to enhance the relationship among consumers, salespersons, and the firm as well as to prevent consumer’s post purchase dissatisfaction can be created based on the research findings.
Contribution of the Dissertation This dissertation contributes to the existent marketing literature in that it identifies all relevant attributes consumers consider as benefits and sacrifices to give value to their alternative choices when they engage in the purchase decision process. In-depth information on the entire consumer purchase decision is generated. Both stages of decision, consideration set formation and final choice selection are clarified. All benefit and sacrifice constructs are considered simultaneously, unlike in previous studies where only a segment or some constructs were focused on. The various types of data collection, i.e., cross-section survey, in-depth interview, and focus group discussion lead to the gathering of extensive information. Interpretation of the research
7
findings could provide an in-depth understanding of the entire purchase decision process of the consumers. Structure of the Research
The content of this dissertation is organized as follows. Chapter 1: Introduction
Background, rationale, and importance of the research are described. Then the purpose, objectives, research questions, and brief methodology followed by expected outcomes and contributions of the research are proposed.
Chapter 2: The Real Estate Industry The home buying characteristics and current real estate business context
are reviewed. Specific characteristics of the industry and also consumer-related behaviors are discussed.
Chapter 3: Literature Review This chapter provides an overview of the literature on decision making and
consumer perceived value. Not only a background on the concept of perceived value, but also its impact on the purchase decision process, the classifications of value and also the main determinants of perceived value are reviewed. Based on the perceived value literature, antecedents of value have been determined to include product quality, sales service quality, and brand equity as benefits of value formation and perceived price, perceived risk, and consumer involvement as sacrifices for the formation of value. Relationship quality and its mediating role on relationship among benefits, sacrifices, and perceived value are also discussed. The research framework is proposed in the end of this chapter.
Chapter 4: Hypotheses Formation and Methodology This chapter explains how hypotheses are generated and the methodology
is used to test the research model and the underlying hypotheses. The process and results of constructing and testing the measurement constructs are reported.

8
Chapter 5: Content Analysis for the Consideration Set Formation This chapter discusses and reports the findings from focus group
discussions. The main objective is to explain the consideration set formation process. The findings from content analysis are reported. The characteristics of consideration set are described. The key criteria and decision rules used by the home buyers to form their consideration are identified.
Chapter 6: Structural Equation Analysis and Hypotheses Testing This chapter presents the results of all survey data analyses in an attempt to explain the choice selection process. Two survey datasets from pre- and post-purchase home buyers are used. The item analysis, exploratory, and confirmatory factor analyses are performed. The analysis of structural equation models is applied. The fits of the proposed model to pre- and post-purchase datasets and also the structural relations among constructs in each model are examined. The results of all hypotheses testing are presented.
Chapter 7: Research Findings and Discussion All key important findings from each group of respondents: pre- and post-
purchase buyers are presented and discussed. The alternative structural models for both pre- and post-purchase context are proposed. Finally, the similarity and differences between the two groups are identified. Chapter 8: Conclusion and Recommendation The conclusions of the entire research and its findings are presented in this final chapter. The theoretical contributions, managerial implications, limitations and direction for future research are discussed.

9
CHAPTER 2
REAL ESTATE INDUSTRY
The residential real estate industry has developed in Thailand over the past 40 years. In 1958, 46% of Bangkok’s population lived in small houses adjacent to each other in small communities located uniformly in the center of the Bangkok Metropolitan (Pornchokchai, 1985). Housing areas have expanded from the center of the town to the outskirts and vicinities around Bangkok. There were only 1,036,411 housing units in Bangkok in 1982, the bicentennial anniversary of the Bangkok Metropolitan. Twenty years later, by the end of 2001, it was reported that there were already 3,354,165 housing units in Bangkok (Agency for Real Estate Affairs, 2003). This implies that the number of housing units has increased over three times during the past three decades, faster than any time during the first 200 years of the city’s establishment (Pornchokchai, 2004). Most new housing units are developed by private real estate developers. During 1982-2001, only 130,000 housing units were constructed by the government sector which was less than ten percent of the total houses constructed in that period. Since 90 percent of real estate developments are of the residential sector particularly in owner-occupied housing projects, private real estate developers seem to play a major role in shaping the characteristics of Thai residential real estate development. Therefore, there is complete market competition in the real estate industry. Consequently, not only has the number of housing units increased but the design and constructional technology have also been also developed. Western styles and functions are popularly displayed. This has changed the looks and features of the houses dramatically. The massive real estate development has resulted from economic growth, the increasing population, the expansion of the town, and also marketing competitiveness.

10
This chapter aims to discuss some specific characteristics of the real estate business that make housing products different from other product categories. The real estate context will be described first. Then, the development of the Thai real estate industry, the price level and payment methods of Thai real estate products, and consumer home buying behavior will be discussed, respectively.
Real Estate Business Context
Real estate is immovable property that encompasses land along with
anything permanently affixed to the land, such as buildings. Real estate is often considered synonymous with real property. For technical purposes, some people prefer to distinguish real estate, referring to the land and fixtures themselves, from real property, which refers to ownership rights over real estate.
The real estate industry has evolved into several distinct fields. Some kinds of real estate business include:
• Appraisal - Professional valuation services • Brokerages - Assisting buyers and sellers in transactions • Development - Improving land for use by adding or replacing buildings • Property management-Managing a property for its owner(s) • Real estate marketing-Managing the sales side of the property business • Relocation services-Relocating people or businesses to a different country Within each field, a business may specialize in a particular type of real
estate, such as residential, commercial or industrial property. Commercial property is real estate intended for use by for-profit businesses, such as office complexes, shopping malls, service stations and restaurants. Residential property is zoned for single-family homes, multi-family apartments, townhouses, condominiums, and so on (The American Heritage Dictionary, 2004). Residential real estate, hereafter called “a house” or “housing product,” for sale can be categorized into four types - single detached house, duplex style house, townhouse, and condominium - as follows:

11
Single detached house – This is considered the top of all types of houses, not only because of the highest level of privacy offered but also because of the additional social benefits home buyers gain since a single detached house is likely to indicate the high economic status of the buyers. However, the social value of the house is also related to its size, price, and luxury. Legally, the land size should equal or exceed 50 square wah (Agency for Real Estate Affairs, 2004). Most single detached houses available in the real estate market are two-story houses, while one- or three-story ones are rarely available. Duplex house (Twin house) - This is a two-separate-part residence, usually side-by-side, but sometimes on two different floors. The form often looks like two houses put together, sharing a wall; the latter usually appears as a townhouse, but with two different entrances. This type of house is like two houses in one single detached house. Legally, the smallest size of a duplex house would be 35 square wah (Theptharanon, 2006). However, this type of the house is not really favored by Thai consumers. Townhouse - Also called row house or terraced home, this refers to a housing style where, generally, identical individual houses are conjoined into rows - a line of houses which directly abut each other, each sharing a wall with its adjacent neighbor. Townhouses are typically multiple stories; however, the most popular townhouses available in the Thai market are two-stories while one- and three-story townhouses are fairly available. Legally, the size of each townhouse unit must be equal to or larger than 30 square meters (Theptharanon, 2006). Condominium - This is a relatively self-contained housing unit in a building which is owned by an individual person or family. A condominium, or condo for short, is a form of housing tenure. Often, a condominium building consists of units in a multi-unit dwelling where the unit is individually owned and the common areas like hallways and recreational facilities are jointly owned by all the unit owners in the building.
Development of the Thai Real Estate Industry
The development of the real estate market is closely related to the economic development of the country. Thai real estate development as affected largely by the

12
economic crisis in 1997 can be divided into three stages (Pornchokchai, 2002). From 1986 to 1996, before the economic crisis, the real estate situation can be considered as “the boom.” The situation then became “the bust” during the economic crisis from 1996 to 2001. The recovery period from 2001 to present is referred to as “the current situation.” The details of each stage are discussed below. The Boom (1986 - 1996)
In 1990, Thailand liberalized its financial system by removing many capital controls to allow money to flow better both inside and outside the country. The Thai economy was noticeably strengthened by direct foreign manufacturing activities. The massive flow of currency into Thailand boosted economic activities and caused GDP to be significantly greater than in the past. Thailand's economy began to grow rapidly and the country experienced a real gross domestic product growth of more than eight percent annually (Layne, 2002). This also led to a boom in the real estate industry. Not only were a large number of new houses offered in the market but a significant number of new real estate developers entered the market.
In the boom period, the real estate developers and consumers enjoyed low interest rates and low prices of cement and other construction materials. Home buyers bought the houses for both personal use and monetary speculation. Low-priced single detached houses and townhouses for lower income consumers were largely available in the market. Other real estate products apart from housing such as farm land subdivisions, golf courses, and office buildings were introduced to the higher income group. In the late stage of the boom, during the period from 1991 to 1993, land and other luxurious projects became less popular; people turned their attention to investing in low-priced condominiums instead. Thus the overgrowth and overvaluing of housing and other real estate products occurred.
Evidence of the overgrowth in the real estate industry was the number of unoccupied houses. The oversupply of houses resulted from massive production.

13
Approximately 300,000 housing units in Bangkok in 1995 were practically unoccupied since most of them were sold out to individual buyers but no one moved in (Agency for Real Estate Affairs, 1995). Moreover, a total of 565,758 new units were launched in the market from 1994 to 1997 causing the number of unoccupied housing to increase to 13.7 percent of the total housing units in Bangkok in 1998 (Agency for Real Estate Affairs, 1998). Most of these unoccupied houses were low-priced condominiums and townhouses in the fringe areas of the Bangkok Metropolitan.
Other evidence of real estate overgrowth is the increasing land price. During the period from 1971 to 1986, annual increases of land prices in Bangkok were only three percent. The prices of the land increased dramatically by six percent annually between 1980 and 1986 caused the land prices in 1991 to be 21.5 times more compared to that of 1985 (Agency for Real Estate Affairs, 1999). This unusual phenomenon resulted from a fundamental change in the Thai economy from an agricultural- to an industrial-based economy (Pornchokchai 2004). The real estate changes during the boom are illustrated in Table 2.1.
Table 2.1: Real Estate Changes and Developmental Issues in Thailand
Year Sector Real estate changes 1991 Land prices Land prices increased, on average, by 21.5 times from 1985 to 1991 1993 Housing 23% of those buying a house off the plan at the 1993 Annual Home Expo
were speculators. It was 31% in the case of condominiums. 1994 Housing Only half of the people who paid a deposit to buy a house off the plan at
the 1994 Annual Home Expo were considered real home buyers. The rest bought for speculation-related purposes.
1994 Low-cost condominiums
Only 35% of the owners of low-cost condominiums were end-users who came to live in the units they bought. Speculation prevailed in these units.
1995 Unoccupied housing
300,000 units of completed, developers' owner-occupied housing units in the BMR were unoccupied (mostly sold out to individual buyers already).
1996 BMR housing 17% of the housing projects surveyed were expected to be cancelled. 1997 BMR housing 40.7% of the housing projects surveyed were expected to be cancelled in
the near future. 1998 Un-occupied
housing 350,000 units of completed, developers' owner-occupied housing units in the BMR were unoccupied (mostly sold out to individual buyers already).
Remark: BMR stands for Bangkok Metropolitan Region Sources: Adapted from Pornchokchai 2001 & Agency for Real Estate Affairs, 1999

14
The Bust (1997 - 2001)
In 1996, the overvalued baht caused Thailand to lose its competitive advantage in the world market while the Bank of Thailand was unsuccessful in defending the baht. The Bank of Thailand decided to float the baht’s exchange rate in July 1997 causing the baht to steadily lose its value. Thailand’s capital and foreign-exchange markets eventually collapsed, and more than half of the country’s financial institutions became insolvent (Layne 2002). The economic developments impacted almost all Thai business sectors including real estate. As a result, the real estate boom ended with a drop in real estate market prices and values in late 1997 to early 1998.
After the economic crisis hit, many inexperienced real estate developers and even few experienced ones, large and small, were forced out of the market. Most developers could not run their ongoing projects and became NPLs (non-performing loans) of financial institutions. In 1998, around 350,000 unoccupied housing units were found. Moreover, there was a dramatic decline in the number of new project launches. There were just 2,407 new units introduced into the market with a total value of 3.2 billion baht in 1998 while the total number of cancelled housing units was 215,246, from 1997 to 2000 (Agency for Real Estate Affairs, 2000). Most of them were in the hands of the private developers and still in the process of construction (Agency for Real Estate Affairs, 1997). Current Situation (2001-Present)
Even though Thailand’s economic situation has currently continued to improve, economic growth was approximately only 2.5 percent in 2002 and 3.9 percent in the first half of 2005 (The Government Public Relations Department, 2006). This slow economic recovery has made the housing market’s recovery sluggish.
The total real estate investment may be seen as a sign of recovery. In 2005, the total real estate investment was 180,477 million baht which is more than the 150,404 million baht and 60,123 million baht investment in 2002 and 2003 respectively

15
(Prachachart Business Newspaper, 2006). However, the total investment in 2005 is less than that of 2004. This may be the indirect impact of other economic factors especially the gasoline price which dramatically fluctuated and increased. The slowdown of real estate investment in 2005 will be discussed later in this chapter. Compared to the boom stage, real estate investment in 2005 was only half of the 356,560 million baht investment in 1994 (Prachachart Business Newspaper, 2006). This seems to imply that a certain period of time may have been needed for recovery prior to the actual take-off of the new real estate boom cycle.
The trend of the real estate industry’s recovery can be seen from the curve presented in Figure 2.1 in which both housing units and investment value is shown to continuously decline from 1994. The lowest real estate investment occurred in 1998 to 1999 and the recovery began in 2000.
Characteristics of the housing projects launched in 2001 to present are
rather smaller. The average housing units in one project have decreased from 257 to 82 units (Agency for Real Estate Affairs, 2001). This may be because the smaller size of projects can minimize the business risk in the early recovery period. Besides this other required characteristics of housing projects such as location, price, and payment plan have also changed. Recently launched projects tend to be single detached houses located closer to town along major new road networks where there exists certain potential for development instead of the suburbs where land is cheaper. Hence, site selection would be much more scrutinized in order to assure the project’s marketability (Pornchokchai, 2002).
Figure 2.1: Housing Units Lunched from 1994 to 2005
Year: 1994 1995 1996 1997 1998 1999 2000 2001 2002 2003 2004 2005 Source: Adapted from Prachachart Business Newspaper, February 2, 2006
Million Baht

16
Recent research findings indicate that the top five prime locations in and around Bangkok for home buyers are Rangsit, Chaeng Wattana, Bang Bua Thong, Hatairat and Sukhapiban 2 and 3 (The Nation Review, 2005). The main reasons for choosing these locations were good transportation and proximity to places of work. In addition, the demand for houses priced at five million baht continued to grow slightly in some locations, including projects on Sukhumvit-Sathorn Road, Phahon Yothin Road, and Rama 5-Ratchapruk Road (Agency for Real Estate Affairs, 2005). The details of the houses categorized by type are shown in Table 2.2 and Figure 2.2.
Table 2.2: Housing Completions in BMR and Vicinity in from 1993 to 2004
Year Single Detached House
Duplex (Twin)
Town House/ Commercial Condo Total
1993 46,840 527 45,080 41,639 134,086 1994 46,110 255 47,349 67,572 161,286 1995 48,909 1,089 61,944 60,477 172,419 1996 44,877 791 60,373 60,744 166,785 1997 41,305 1,009 43,480 59,561 145,355 1998 23,985 196 11,895 27,788 63,864 1999 16,381 153 2,251 13,074 31,859 2000 23,128 539 2,728 5,633 32,028 2001 24,041 227 5,062 4,693 34,023 2002 24,973 80 7,011 1,971 34,035 2003 34,592 1,144 12,950 1,908 50,594
2004(Jan-Nov) 40,065 845 12,901 1,327 55,138 Remark: BMR stands for Bangkok Metropolitan Region. Source: District Office in Bangkok Municipalities and Provincial Office in the Adjacent Areas, 2004
Figure 2.2: Housing Completions in BMR and Vicinity from 1993 to 2004
Year 1993 1994 1995 1996 1997 1998 1999 2000 2001 2002 2003 2004 Source: District Office in Bangkok Municipalities and Provincial Office in the Adjacent Areas, 2004
200,000
175,000
150,000
125,000
100,000
75,000
60,000
25,000
0
Units

17
Many real estate developers listed on the Stock Exchange of Thailand recorded net profit growth of at least 20 percent in the first half of 2003 compared with the same period of 2002. Land and House PLC posted a net profit of 2.7 billion baht or an increase of 75 percent, while Lalin Property PLC recorded an increase of 58 percent. Golden Land PLC also reported a 78 percent rise in net profit for the first half of 2003 (The Nation Review, 2003). All of these firms have expanded business by targeting the luxury housing segment, which includes single detached houses and condominiums. In addition, housing product with units priced at three to five million baht had the highest market value of 24.2 billion baht in 2002, followed by houses with units priced at five to ten million baht worth 23.14 billion baht and finally houses with units priced at ten to 20 million baht worth 14.52 billion baht (The Nation Review, 2003).
However, the Kasikorn Research Center (2006) found the trend of the real estate industry to be slowing down according to numerous negative factors in 2005. The real estate industry was also dealt a blow from rising oil prices and the inflation rate. As a result, demand in the real estate market was adversely affected which, in turn, would impact consumer confidence and decisions on real estate purchases. The investment in the real estate indicated by the Kasikorn Research Center (2006) was shown to rise in 2005 by some 8.4 percent at constant prices, down from the growth of 15.2 percent in 2004. Surges in oil prices led to increases in the prices of various products and interest rates, thus, adversely affecting consumer spending including the decision to buy a house. The Kasikorn Research Center expects that investment in the real estate sector may increase by some eight percent in 2006, slightly lower than the year before.
Price Level and Payment Methods of Thai Real Estate Products
Interestingly, the single detached houses offered in the current market have been priced at three million baht and over to serve higher income consumers. Many of them were already constructed and almost ready for customers to move into. In contrast, it was observed very few condominium projects were launched in 2000 and 2001 with most of them located in the inner areas of Bangkok.

18
An increased customer demand in the luxury housing segment, which has prices ranging from three million baht to over five million baht, was found. In contrast, demand for the lower priced projects, which were up to 1.5 million baht in value, decreased (The Nation, 2003). Moreover, it was found that the consumers’ reason for buying luxury houses changed from 40 percent for speculative purposes in 1992 to seven percent in 2002 while the remaining 93 percent of home buyers had bought houses for their own living. The average prices per unit of the houses offered in 1994 to 2004 are illustrated in Figure 2.3.
Figure 2.3: Unit Price of the Houses Launched in 1994 to 2004 Unit Price for houses Launched in 1994-2004
3.734
1.409 1.455 1.5331.768
1.366
1.042
1.9251.9412.058
2.7
0
0.5
1
1.5
2
2.5
3
3.5
4
1994 1995 1996 1997 1998 1999 2000 2001 2002 2003 2004
Year
Price (Million Baht)
The average unit price of a house has been increasing, from a post-crisis low of one million baht to 3.7 million baht per unit in 2004. Most real estate developers perceive this current situation as a prime time to launch aggressive marketing strategies to earn more profit in the coming year (Kunakornporamut, in The Nation Review, 2003). Prices of housing products tend to increase in accordance with the price of construction materials, which have continuously increased since 2001 (Aswabhokin, in The Nation Review, 2003)1.
1 Anant Aswabhokin, President and Chief Executive of Land and House PLC; Phongchai Kunakornporamut, Executive Director of Golden Land Property PLC. Both were the informants for the “Property Market: Housing Boom Continues to Gather Pace, wrote by Somluck Srimalee, The nation Review, Published on August 20, 2003.
Source: Adapted from Agency for Real Estate Affairs, 2005

19
In addition to price level, most consumers do not make cash payment immediately when they decide to buy a house. Since the price of a house is relatively expensive, most home buyers have to get financial support from financial institutes.
Various payment plans are offered by real estate developers. Each plan is related to both completion of the housing construction and the purchasing power of the home buyers. Based on the interviews with the real estate developers in the exploratory stage of this research, if the house is under construction, down payment for six to 36 months is usually offered. For a house that is already constructed, only around 50,000 baht cash is required. However, this amount of money is dependent on the total price of the house. Then, home buyers make their six to 36 monthly down payments without interest or at a very low interest rate. After that they can obtain a housing loan from any financial institute. With this option, home buyers can move into the house during the down payment period. Alternatively a home buyer can request for a 100-percent loan from financial institutes without any down payment.
Moreover, most real estate developers offer many payment options for consumers. For example, Land and House PLC offers an “Auction Loan” via its website allowing consumers to put their personal data such as salary, number of family members, accepted interest rate, and so on, after which various payment plans will be presented as payment alternatives. In contrast, Property Perfect PLC offers “Perfect Alliance” that offers not only various payment plans but also a lower interest rate and special discount for the house and furniture. This ease-of-payment information gathered from the real state developers and various payment choices that are available for consumers would help consumers to evaluate their ability to pay for a house.
Consumer Home Buying Behavior
To understand how home buyers buy a house, consumer behavior and factors associated with the home buying process will be discussed. Firstly, the factors influencing consumers to start thinking of buying a house will be reviewed. Then, three
20
types of housing products, namely 1) the new houses provided in a housing project, 2) new houses constructed by the homeowner, and 3) used houses, will be categorized in “Selecting a Real Estate Product.” Finally, some characteristics of the houses provided by real estate developers will be discussed. Reason for Buying a House
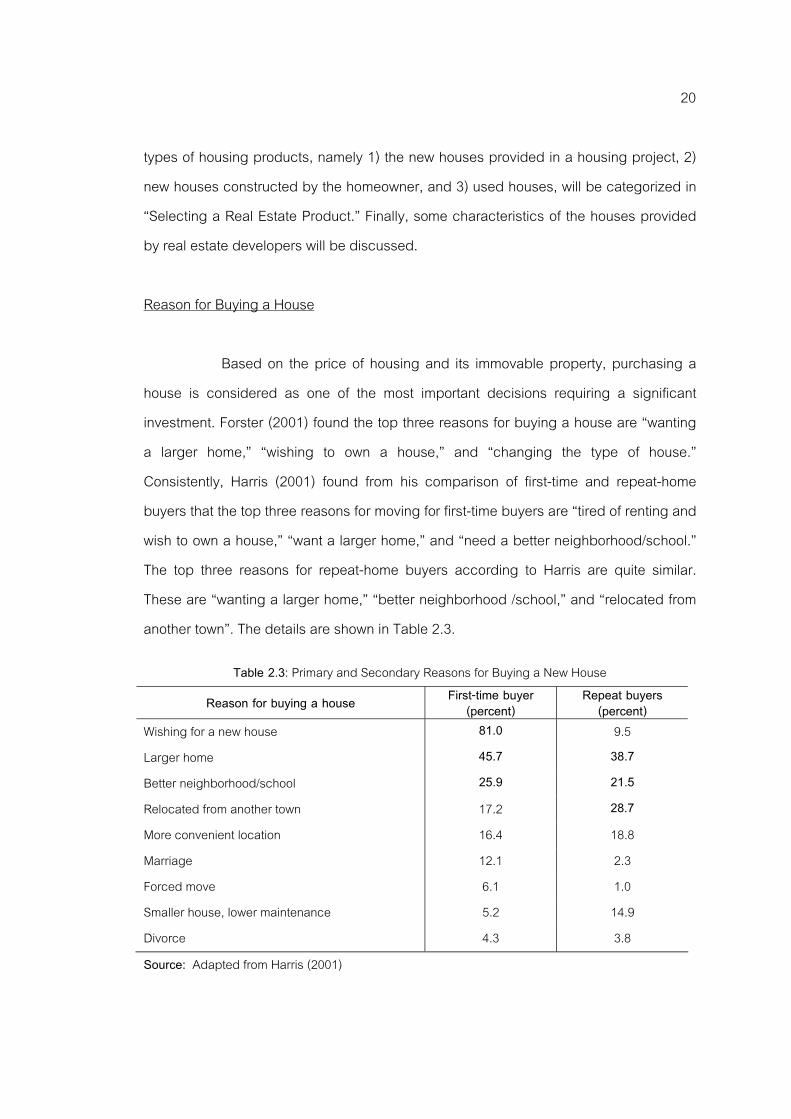
Based on the price of housing and its immovable property, purchasing a house is considered as one of the most important decisions requiring a significant investment. Forster (2001) found the top three reasons for buying a house are “wanting a larger home,” “wishing to own a house,” and “changing the type of house.” Consistently, Harris (2001) found from his comparison of first-time and repeat-home buyers that the top three reasons for moving for first-time buyers are “tired of renting and wish to own a house,” “want a larger home,” and “need a better neighborhood/school.” The top three reasons for repeat-home buyers according to Harris are quite similar. These are “wanting a larger home,” “better neighborhood /school,” and “relocated from another town”. The details are shown in Table 2.3.
Table 2.3: Primary and Secondary Reasons for Buying a New House
Reason for buying a house First-time buyer (percent)
Repeat buyers (percent)
Wishing for a new house 81.0 9.5 Larger home 45.7 38.7 Better neighborhood/school 25.9 21.5 Relocated from another town 17.2 28.7 More convenient location 16.4 18.8 Marriage 12.1 2.3 Forced move 6.1 1.0 Smaller house, lower maintenance 5.2 14.9 Divorce 4.3 3.8 Source: Adapted from Harris (2001)

21
Selecting a Real Estate Product
Home buyers usually use different criteria to choose a house based on their personality and constraints such as time, social, and financial constraints. The types of housing products that are available in the Thai real estate market can be categorized into three groups.
New house provided in a housing project: A home buyer chooses a house that is already designed or constructed by real estate developers. The modification of the product can be done in limited areas. Mostly, home buyers cannot change or modify the major specifications of the house such as the design, construction materials, utility functions or even external color scheme in some cases. However, consumers can gain some additional facilities such as open space and view, nice and green environment, parks and recreational facilities, and adequacy of public utilities e.g., safety of routes into and out of the area, streetlights, swimming pool, fitness centre, better neighbors and also social value and respect from the brand of the real estate firm.
New house constructed by the home owner: This product is a construction service in which consumers want a house to be constructed on their own land. The real estate firms usually have many standard house designs. Consumers can choose a standard design, change some parts, or request for a new design that fits with their needs. All material specifications can be modified. Each house is unique as it is customized for the individual client. The price is thus relatively high compared to that offered in a housing project.
Used house: The third option is to buy a used house from real estate brokers, banks, or other home owners. A used house can be either a house located inside or outside a housing project. The choices are various and widely different depending on the characteristics of each alternative.
There is no formal report on the amount of used-home buying/selling in the Thai real estate context. The proportion of the first two house types shown in Table 2.4 and Figure 2.4 indicates that the houses provided in a housing project are more favored by Thai consumers. The proportion of the houses constructed by real estate developers

22
was about 70 to 80 percent before the 1997 economic crisis. The proportion declined to 40 to 50 percent during the currency crisis and increased to 70 percent in the current economic situation.
Table 2.4: Number of Housing Completions in BMR and Vicinity During 1993 to 2004
Number of Units and Construction Types Year Constructed by
House Owner Constructed by
Developer Total Proportion of
construction by developer
1993 36,459 97,627 134,086 72.8 1994 35,150 136,104 171,254 79.5 1995 32,118 140,301 172,419 80.4 1996 28,059 138,726 166,785 83.2 1997 27,418 117,937 145,355 81.1 1998 22,716 41,148 63,864 64.4 1999 15,497 17,885 33,382 53.6 2000 18,064 13,964 32,028 43.6 2001 19,639 14,384 34,023 42.3 2002 17,693 16,342 34,035 48.0 2003 18,598 31,996 50,594 63.2
2004(Jan-Nov) 18,046 37,092 55,138 67.3 Source : Agency for Real Estate Affairs, 2005
Figure 2.4: Number of Housing Completions in BMR and Vicinity During 1993 to 2004
Source: Agency for Real Estate Affairs, 2005

23
Selecting a House from a Real Estate Developer
Prior to the economic crisis in 1997, real estate developers would make a land development plan for a housing project, build some houses to be samples and then start selling process. The construction of a house would start after the customer signed “The Contract of Sale and Purchase” and made the first down payment. Therefore, customers had to wait and pay monthly for at least six months to three years before the houses were ready for them to move into.
The impact of the economic crisis made many real estate developers incapable of maintaining their businesses as discussed previously meaning that the houses of many customers who already paid some of the down payment were never completed (Kasinpila, 2004). Due to the decline of the real estate market after the 1997 crisis, many real estate developers have changed their marketing strategies to win back customers’ trust back by making “ready-to-live-in” houses as guarantees that the housing product already exists. This marketing strategy categorizes housing products into two types: ready-to-live-in and made-to-order houses.
The construction of a ready-to-live-in house is about 80 to 90% complete and the house is open for customers to assess before buying. In case a customer selects the house, he/she would wait for, at least, one to two months for the house to be completely constructed before moving into it. This period of time does not cover the interior decoration which normally would be handled by the home buyers after getting the proprietary right over the house. Mostly customers are allowed to choose some decorative items such as carpeting, wall paper, floor tiles, and fittings from the material list offered by the real estate firm.
To make this ready-to-live-in house affordable to customers, most real estate firms offer a special payment plan with a six- to 12-month down payment period without interest and allow customers to move into the house during the down payment period. Also, real estate firms usually find bank financial aids for the customers. Many firms offer several mortgage plans. Therefore, the customers have a chance to select
24
the best mortgage by themselves. Moreover, customers can negotiate about the price, materials, timing, and other sales promotions until both the home buyers and real estate firm agree to the terms of the sale.
The buying process for a made-to-order house is almost similar to that of a ready-to-live-in house but customers do not have access to the real house at the point of sale. The location and housing plan are shown to customers on paper. Thus, customers have to make a decision based on the paper. The waiting time and down payment period are usually related to the construction period which may be at least six months or last up to 36 months. The specific advantage home buyers could gain from this type of house is that the design and utility plan of the house and also all construction materials are modifiable since the construction hasn’t started yet. However, customers may need to negotiate more on price, sales promotions, specifications of construction materials, and timing before both the firm and customers agree to the terms of the sale. The time home buyers have to spend seems to be longer than the ready-to-live-in house. The real estate developers can be categorized into two major groups. The first group consists of public companies which are listed as companies in the Stock Exchange of Thailand (SET). The companies’ brands and also the names of their housing projects are recognized by most consumers. Most of them offer many housing projects in various zones of Bangkok, its vicinity, and other major cities. The real estate developers that are in this group are, for example, Land & Houses, Property-Perfect, Sansiri, Areeya, Golden Land, Noble Home, Preecha Group, Wangthong Group, Supalai, and so on.
The other group includes the local real estate developers offering only one or two housing projects in limited zones. Because of their limited products, the companies’ brands and the names of their housing projects are mostly known to local customers. The real estate developers considered to be in this group are, for example, The Lagoon (Better Living Property), Bouthong Property, Panchasarb, Baan Sathaporn, and so on.
25
Steps to Buying a House
After selecting the type of house, home buyers normally enter the purchase decision process. Most home buyers start their buying behavior by searching for housing information, after which they make a choice. This part will discuss these two steps of buying a house - information search and choice selection - respectively.
Information Search Searching for relevant information is a common method implemented by
consumers. The information about the type and details of housing products that are available in the market would first help home buyers to create a set of possible housing choices from which they can choose. Then, more detailed information about each housing product will be searched for and used for final choice selection.
Information search can be categorized into two major types, namely internal and external search. Internal search means consumers recall, recognize and consider the information that is already available in their minds, while external search means consumers search for the information from an external source. The details of internal and external search will be discussed in the next chapter. For external information search, Andreasen (1968) classified the sources of information into four categories: impersonal advocate, impersonal independent, personal advocate, and personal independent. Impersonal advocate sources include print media and broadcast advertising, while impersonal independent sources consist of information gathered from popular articles and broadcast programming. Personal advocate sources refer to information received from salespersons, and personal independent sources include facts gathered from friends and relatives. Consumers’ preference for personal information sources results from the flexibility and credibility of such sources. For a high involvement purchase like buying a house, both flexibility and credibility of information would play a significant role in information searching behavior (Locander and Hermann, 1979).
All four sources of housing information are available in the Thai real estate marketing context. For the impersonal advocate sources, print media and broadcast

26
advertising are broadly available. The various advertisements for real estate firms, housing projects, and promotional campaigns are usually placed in newspapers. Some housing offers are directly or indirectly advertised on many television and radio programs. Moreover, the most popular, and maybe most effective impersonal advocate source is the roadside billboards which are available on the main roads of Bangkok and its surrounding areas. These sources of information could provide the information about real estate firms or housing projects available in the nearby area as well as some differentiated or competitive characteristics of those particular firms or housing projects. Even though there are some housing magazines available in the Thai real estate market, most of them are home decoration magazines and used home buying guides. Real estate journals and magazines about new houses and housing projects are rarely available. However, there are some broadcast programs, both TV and radio, themed to provide housing and construction knowledge and to advertise real estate brands and housing projects. The direct advertising of housing projects operated by Sansiri PLC, Property Perfect PLC, and Land & House Plc can be frequently seen on TV while some indirect advertisements can be heard and seen on both TV and radio programs.
All home buyers in the focus group discussion conducted in the qualitative stage of this study reported that they first searched for housing information from this source. Personal independent sources which include facts gathered from friends and relatives varied. From the focus group discussion, around one third of the participants obtained the housing information from their friends and relatives and most of them made the decision to buy a house from the same housing projects as their opinion leaders. Finally, personal advocate sources, which refer to housing information received from salespersons and other related persons, could be considered as the major source of housing information.
The focus group discussion results indicated that the information from all of the above sources is not sufficient enough for consumers to gather relevant information about their choices. To make a decision, they have to visit the housing project to get
27
direct information from a salesperson and their own observation. Consumers thus have to visit all housing projects they are interested in or, on the other hand, all choices available in their consideration set. For each visit to a housing project they have to spend their time listening to the real estate salespersons, asking for more information, looking around to estimate the quality and reliability of the project and evaluate its environmental surroundings. The information obtained from the real estate salespersons is not only about the house and its environment, but also about the housing mortgage, payment plan, sales promotion, and other related information which may be sufficient enough for a home buyer to make their choice. Mostly, the negotiation on price, timing, constructional materials, and so on can be made.
Consumer Procedure for Buying a House After making a decision, home buyers can inform their real estate sales
salespersons. A legal contract between the home buyer and the real estate representative will be signed. In the next stage, home buyers have to deal with various real estate representatives such as construction officers, engineers, financial officers, and so on, not the salesperson. Most home buyers will have long term interaction with their real estate representatives, as long as the construction period lasts. The quality of service provided by real estate representatives in all stages of the home buying process would influence consumers’ perception of the value of housing product and, in turn, affect the consumers’ choice decision .Finally, after moving into the new house, consumers have to be concerned not only about the quality of the house but also the maintenance of environmental surroundings and public facilities.
Summary
The Thai real estate industry has been recovering from the impact of the 1997 economic crisis. The total market value is now over thousands million baht a year with a growth rate of 8 % (Kasikorn Research Center, 2006).

28
The most favorable type of house for Thai home buyers is a single detached house in the housing project offered by real estate developers. The average price of a house in 2004 was 3.73 million baht per unit. This unit price was expected to increase in the next two or three years. Even though each consumer has his or her own reason and criteria for buying a house, most of them prefer buying a house from a housing project because they could gain good environmental surroundings and facilities as well. The two types of housing products available in the market are ready-to-live-in and made-to-order product with different characteristics and buying conditions. In the Thai real estate context, home buyers have to play an active role in visiting housing projects to search for information on their own since the use of brokers or individual sales agents are not favorable especially when buying a new house. Most information home buyers obtained are from the real estate personnel at the housing projects. Understanding consumers’ decision making process would help real estate developers to design their products and services to fit well with consumers’ needs and wants.

29
CHAPTER 3
LITERATURE REVIEW
The question “How do consumers make decisions?” has been the core of marketing studies over the past 50 years since it is important to both marketers and consumers. For marketers, this knowledge would help them to design their products to fit well with consumers’ needs and wants while understanding the purchase decision process would help consumers to reach their own wants–choosing the right products that provide the highest benefits as expected. Each decision-making situation requires a different degree of effort to handle. For a routine or learned situation, consumers seem to have a set of established criteria for their choice selection; therefore, the decision can be made immediately or easily without having to go through a complex cognitive process. In contrast, for an infrequent purchase of a durable or high involvement product such as an automobile, a house, an expensive electronic or electric appliance, consumers are likely to engage in a more complex decision process. This chapter will discuss the literature of consumer purchase decision. Three decision making theories: utility theory, bounded rationality, and prospect theory will be briefly presented. Then, purchase involvement theory and five stages of decision process including decision rules will be discussed. This dissertation follows the main concept of the prospect theory that the perceived value is the key influencing factor for consumers’ decision. Therefore, the theories and previous studies on perceived value and its antecedents will be focused. Since the factors affecting perceived value can be grouped into 2 types called benefits and sacrifices, the related literature will be reviewed accordingly. The details of all benefits for value including product and sales service quality, brand equity, and relationship quality will be discussed. Finally, the factors considered as sacrifices for value which are perceived price, perceived risk, and consumer involvement will be presented. The layout of this chapter is shown in figure 3.1:

30
Figure 3.1: The Organization of the Literature Review
Source: Author
Consumer Purchase Decision Process
Since decision making has been studied by theorists for many decades, several theories and studies have been done in this area. In general, decision making theories can be categorized into three major models: 1) the utility theory, 2) the bounded rationality or satisficing theory, and 3) the prospect theory. To extend the decision making theories to explain consumer behaviors, three related theories- the purchase involvement theory, the five-stage model of purchase decision, and decision strategies –will be introduced. The purchase involvement theory explains the level of effort that is different across situations. The five-stage model is aimed at explaining consumer behavior step by step when they engage in the purchase decision process, while the decision strategies are used to explain how a consumer considers and evaluates his choices. To understand the entire decision making process, this part will be divided into five parts. First of all, the three general models of decision making will be briefly discussed. Then,
Consumer Purchase Decision Process - Three Decision-Making Theories - Purchase Involvement Theory - The Five-stage Model of Decision Making - Decision Rules
Perceived value - Types of Value - Definition of Perceived Value - Key Dimensions of Perceived Value - Factors Influencing Perceived Value Benefits that influence Perceived Value
- Product Quality - Sales Service Quality - Brand Equity - Relationship Quality
Sacrifices that influence Perceived Value - Perceived Price - Perceived Risk - Consumer Involvement

31
the purchase involvement theory will be considered. In the next two parts, the five-stage model and decision strategies will be discussed. Three Decision-Making Models
Early study of the buyer decision process started with the utility theory introduced by Bernoulli in 1738 to explain people’s choice behavior. Bernoulli assumed that people tried to maximize their utility, not expected value. Two centuries later John Von Neumann and Oskar Morgenstern revolutionized Bernoulli’s utility theory and presented it in their book in 1944 (McDermott, 2001). This theory proposed that consumers make decisions based on the expected outcomes of their decisions or, on the other hand, expected utility of the choice. According to this theory, consumers were viewed as complete rational actors who were able to estimate the probabilistic outcomes of uncertain decisions and select the outcome which maximized their well-being. In reality, consumers are typically not completely rational and the awareness of all various elements that enter into their decision making is impossible. These two limitations led to serious shortcomings in the utility theory that could not be explained. Therefore, this theory couldn’t be applied practically even though it was viewed as the dominant decision-making paradigm.
Later in the mid-1950s, Herbert Simon proposed a simpler decision model known as the bounded rationality theory or satisficing model, in which consumers got approximately what they wanted or set up an acceptable criteria of the choice which is called “satisficing” and then stopped the decision-making process when they obtained a choice that meet their expectation (George and Jones, 2005). Searching a new house would be an example of this decision model. According to the utility theory, consumers would evaluate all houses that are available in a market, consider the course of action of each choice, and then select the house that had the highest overall utility score. In contrast, with satisficing, consumers might just evaluate houses within a certain distance to their desired location and certain price they expected, then, stop searching when

32
they find a house that is “good enough.” This theory seemed to explain what consumers do, but it could not predict the behavior consumers would have in their choice behavior. Therefore, significant room was still left in the area of prediction.
In the late 1970s, the prospect theory was developed by two psychologists, Daniel Kahneman and Amos Tversky (1979). The prospect theory encompassed the best aspects of both the utility theory and satisficing theory. Two major elements, value and endowment, were added to explain the consumer decision process. Value was used to replace the utility found in the utility theory. It provided a reference point and evaluated both gains and losses from that reference point. The concept of value is widely accepted in the marketing field. Extended from Sweeney et al. (1997), is their proposed purchase decision model, as seen in Figure 3.2, explaining how value influences decision making by focusing on consumer willingness to purchase. Additionally, the model incorporates key variables such as perceived product quality, service quality, and price which were considered as antecedents of value.
Figure 3.2: Sweeney’s Model of the Purchase Decision Process
Source: Sweeney et al. (1997)
The concept of value was of great interest to theorists. Several studies
related to value were conducted. The details of value and its antecedents and influence on the decision making process will be discussed in the next part.

33
Purchase Involvement Theory
Purchase involvement refers to the level of consumers’ concern for their purchase process. Involvement is illustrated by the amount of effort applied to the decision-making process (Hawkins et al., 2001). The degree of involvement is related to the level of importance that the consumer places on acquisition of the product. Purchase involvement is not necessarily a function of the price, but is more related to the perceived impact on the quality of life of the consumer. The quality of life can come directly from the benefits supplied by the product, or indirectly from social acceptance or sanctions. Thus, as the purchase process changes, purchase involvement changes (Mowen, 1988).
The degree of purchase involvement results from the interaction of two major factors: perceived importance of product and frequency of buying. A very high involvement purchase tends to arise when consumers buy a durable product that is expensive and important to them such as automobiles, houses, home appliances, home and office furnishings, photographic equipment, and jewelry. However, the degree of involvement seems to be lower when they buy less expensive and unimportant products such as lawn and garden equipment and sporting goods even though these products are also infrequently bought. Laurent and Kapferer (1985) found that consumers’ involvement in products moderated their reactions to marketing and advertising stimuli. Moreover, the value of the product i.e., product class, consequence of the purchase, especially, mis-purchase probability and consequences would also influence the degree of purchase involvement.
Three types of decision making could be categorized based on purchase involvement as nominal decision making, limited decision making, and extended decision making. The comparisons of the process of these three types of decision are illustrated graphically in Figure 3.3. The details of each type of decision will be discussed in the following parts.

34
Figure 3.3: Purchase Involvement and Types of Decision Making
Nominal Decision Making, which is also called habitual decision making, occurs under conditions of low involvement and the absence of significant brand differences. According to Kotler (2000), consumers of this type do not pass through the normal sequence of belief, attitude, and behavior. They do not search extensively for information, do not evaluate product characteristics and do not make decisions regarding brand choices. Instead, they merely follow information found on television or in print advertisement. Internal information search within consumers’ mind provides a single preferred solution or brand to be purchased. Nominal decision usually occurs in two purchase situations: brand loyal purchases and repeat purchases.
Limited Decision Making covers the middle ground between nominal decision making and extended decision making. Its degree of involvement is slightly
Problem recognition Selective
Problem recognition Generic
Problem recognition Generic
Information Search Limited internal
Information Search Internal External
Information Search Internal Limited external
Alternative Evaluation Many attributes
Complex decision rules Many alternatives
Alternative Evaluation Few attributes Simple decision rules Few alternatives
Purchase Purchase Purchase
Post purchase No dissonance
Very limited evaluation
Post purchase Dissonance
Complex evaluation
Post purchase No dissonance
Limited evaluation
Low involvement purchase High involvement purchase
Nominal decision making Extended decision making Limited decision making
Source: Hawkins et al. (2001)

35
higher than that of nominal decision making (Hoyer, 1989). In general it involves recognizing a problem for which there are several possible solutions. Consumers normally search for the information internally in their mind together with very limited information from external sources. However, a few alternatives are simply evaluated, which makes this type of decision different from the previous one. The purchase and use of the product are given little evaluation afterwards unless there is a service problem or product failure.
Extended Decision Making, also called complex purchase decision, occurs when consumers are highly involved in a purchase and they are also aware of significant differences among brands (Kotler, 2000). The decision making process involves an extensive information search from both internal and external sources followed by a complex evaluation of multiple alternatives. After the purchase, doubt about its correctness is likely and a thorough evaluation of the purchase takes place. However, relatively few consumer decisions reach this level of complexity. A durable product which is expensive, bought infrequently, risky, and highly self-expressive, such as a house, is purchased via extended decision making. Also, a high involvement product with significant differences among brands leads to the highest complex purchasing decision while a low involvement product with significant differences among brands leads to variety-seeking, the search for more choices and comparison of some simple attributes among those alternatives (Kotler, 2000). Complex purchase decision making is heavily emotional and may involve a substantial cognitive effort. Decision makers search for information as much as they can in order to learn what is available in the market (Hawkins et al., 2001). Even though purchase involvement has been frequently mentioned, not many studies focus on how consumers behave when they are in any type of decision making situation especially extended decision making which is the most complex one. The effort consumers put into making their purchase decision would indicate the degree of purchase involvement. Therefore, the link between the degrees of purchase
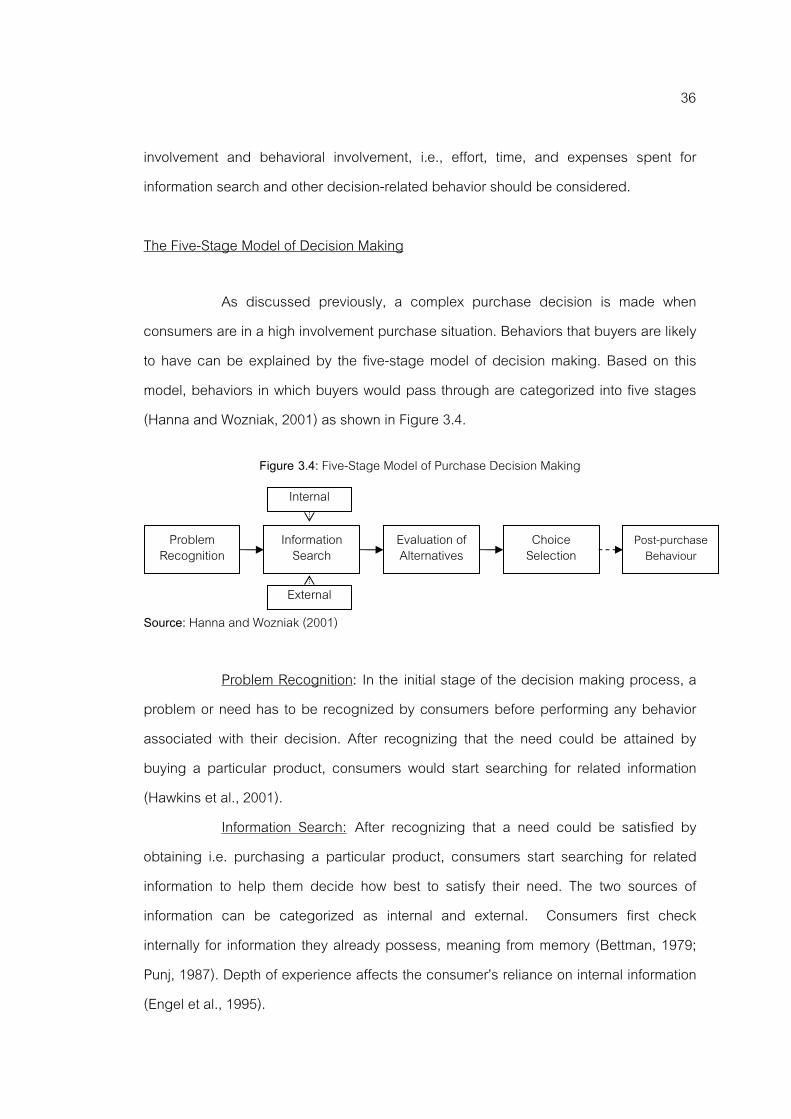
36
involvement and behavioral involvement, i.e., effort, time, and expenses spent for information search and other decision-related behavior should be considered. The Five-Stage Model of Decision Making
As discussed previously, a complex purchase decision is made when consumers are in a high involvement purchase situation. Behaviors that buyers are likely to have can be explained by the five-stage model of decision making. Based on this model, behaviors in which buyers would pass through are categorized into five stages (Hanna and Wozniak, 2001) as shown in Figure 3.4.
Figure 3.4: Five-Stage Model of Purchase Decision Making
Source: Hanna and Wozniak (2001)
Problem Recognition: In the initial stage of the decision making process, a problem or need has to be recognized by consumers before performing any behavior associated with their decision. After recognizing that the need could be attained by buying a particular product, consumers would start searching for related information (Hawkins et al., 2001).
Information Search: After recognizing that a need could be satisfied by obtaining i.e. purchasing a particular product, consumers start searching for related information to help them decide how best to satisfy their need. The two sources of information can be categorized as internal and external. Consumers first check internally for information they already possess, meaning from memory (Bettman, 1979; Punj, 1987). Depth of experience affects the consumer’s reliance on internal information (Engel et al., 1995).
Problem Recognition
Information Search
Evaluation of Alternatives
Choice Selection
External
Internal
Post-purchase Behaviour

37
For the external search, the information is gathered from a consumer’s surroundings such as public sources, media, comparison shopping, or friends and co-workers. Two well-established theoretical perspectives of external information search are economic and psychological information processing approaches (Gibler and Nelson, 2003). The economic perspective examines search on a cost/benefit basis, with consumers searching as long as the marginal benefit of obtaining an additional piece of information exceeds the marginal cost. The psychological approach examines the cognitive process in which consumers go through deciding what and how much information to search, gather, and process. Since information search provides consumers with an information base for making decisions, a successful information search leaves consumers with possible and relevant alternatives. Therefore, when selecting an infrequent purchase product, i.e. a durable product such as a residential real estate, an automobile, electronic and electric home appliance, etc., consumers rarely rely solely on past knowledge; rather they also undertake an external information search (Hawkins et al., 2001).
Not only are secondary sources of information such as newspapers, friends, and relatives available to consumers, they can also obtain external information directly from personal inspection such as doing comparison shopping, visiting a showroom, or even visiting a housing project (Gibler and Nelson, 2003). Consumers with extremely limited knowledge such as first-time buyers may rely heavily on personal sources such as friends, relatives, and sales agents (Kaynak, 1985). In contrast, experienced consumers who are able to explore and understand technical information would undertake a more extensive external search on their own (Bettman and Sujan, 1987).
In addition, prior knowledge can reduce the search by allowing consumers to rely more heavily on internal information. Previous experience may reduce the information search (Baryla and Zumpano, 1995). In contrast, consumers’ existing knowledge may also encourage them to search for more information by enabling them to make more effective use of newly acquired information. This implies that there may be an inverted-U relationship between knowledge and quantity of the external search

38
(Moorthy et al., 1997). Consumer search is also related to a consumer’s personality (Gibler and Nelson, 2003). Some beliefs and attitudes may affect the information search. Consumers who enjoy shopping or information searching would likely search for more information than those who do not (Beatty and Smith, 1987). Besides this situational constraints and time pressure may influence a consumer’s information search (Beatty and Smith, 1987). Time constraints are reflected in purchase decisions by reducing the extent of the information search. In case a consumer has to make a purchase decision in a short period of time, they may perform less information search than others (Baryla and Zumpano, 1995).
Evaluation of Alternatives: After identifying and acquiring sufficient information, consumers would move to the next stage which is an evaluation of alternatives (Hanna and Wozniak, 2001). The goal of this stage is to develop a set of choices that are possible to be selected by consumers and then compare all choices to one another. The set of possible choices developed by an individual consumer is called a “consideration set” (Engel et al., 1995). Mostly, consumers consider the choices by their attributes and compare the same attributes across choices they have. Therefore, if the attribute is more important or stands out from others, it would have a greater impact on determining consumer selections (Engel et al., 1995).
Choice Selection: As an outcome of the search and evaluation process, a choice will be selected. The degree of ease or difficulty of choice selection is associated with purchase commitment and various constraints such as financial, social, and psychological factors (Gibler and Nelson, 2003). There is always a possibility that constraints such as time, lack of funds, and availability of product/service may intervene and delay the purchase. Also, a consumer may decide not to buy a product even though there is an intention to buy. This suggests the fact that the decision process may be terminated at any point.
The choice model is consistent with two-stage decision processes in which a subset of product alternatives is selected from the universal set, which is called “consideration set” and the final product choice is from that consideration set (Gilbride

39
and Allenby, 2004). Shocker et al. (1991) defined consideration sets as being “purposefully constructed and can be viewed as consisting of those goal-satisfying alternatives accessible on a particular occasion.” Hauser and Wernerfelt (1990) defined consideration sets as subsets of offerings that receive serious consideration during the purchase occasion. Gilbride and Allenby (2004) operationalized consideration sets as comprising alternatives that survive a screening process. Based on these definitions, a consideration set is used to filter out the alternatives that could not meet preliminary criteria set by consumers. The choices that meet or exceed these criteria would be included in the consideration set. Even though the definitions of consideration set are slightly different, all are related to each other. Therefore, a consideration set can be defined as a subset of alternative choices developed by an individual consumer that that particular consumer could possibly select. Additionally, to produce a consideration set, two types of information; “list of brands” and “important product attributes” are usually considered as the preliminary criteria (Hawkins et al., 2001).
The final product choice which is the second stage of the choice model is a more comprehensive stage during which consumers select one choice from their consideration set. Bettman and Park (1980) provided evidence that the formation of the consideration set is linked to a subset of attributes and that the final selection is more holistic. Kotler (2000) indicated that the attitudes of others and unanticipated situational factors could interfere in the relationship between purchase intention and choice selection as seen in Figure 3.5. Even though a choice is perceived as the best, consumers may not select that choice if their friends do not like their choice or there are more serious problems to solve.
Figure 3.5: Possible Factors Affecting Relationship between Purchase Intention and Decision
Source: Kotler (2000)
Evaluation of
Alternatives Purchase Intension
Choice selection
Unanticipated situational factors
Attitudes of others

40
The degree of influence of another’s attitude on a consumer’s decision depends on the intensity of the other person’s attitude towards the consumer’s preferred alternative, in both a positive and negative way, together with the consumer’s motivation to comply with the other person’s wishes. Unanticipated situational factors may influence consumers to change their purchase decisions. For instance other purchases may be more urgent and important. To understand the choice selection process, many studies focused on some product attributes that consumers consider when they make their purchase decisions such as product performance, reliability, durability, brand, price, and so on. However, there are not many studies that considered all decision-influencing factors simultaneously.
Post Purchase Behavior: After the purchase of product is made, satisfaction or dissatisfaction toward that product would induce consumers to engage in post-purchase behavior (Kotler and Armstrong, 1999). The buyer’s satisfaction is a function of the closeness between consumer expectations and the actual performance of the product. The degree of post purchase analysis consumers undertake depends on the importance of the purchase and the experience acquired in using the products. Thus, a consumer’s post purchase evaluation feeds back as experience to a consumer’s psychological field and serves to influence related future decisions (Shiffman and Kanuk, 2004). If the product’s performance falls short of customer expectations, the customer is disappointed; if it meets expectations, the customer is satisfied (Kotler, 1994). As a result, post purchase evaluation usually leads to customer satisfaction which, in turn, may cause both positive and negative long term consumer responses. Consumer post purchase dissatisfaction was found to be associated with brand switching, unfavorable word-of-mouth communications, and complaint behavior (Hawkins et al., 2001). Decision-Making Strategies
To make a final choice, consumers have several ways to evaluate and
select the choices as shown in Table 3.1 as follows:

41
Table 3.1: Five Decision Making Strategies
Decision Strategies Details Examples Conjunctive rule The consumer establishes a minimally
acceptable level that is established as a cutoff point for each attribute. If any choice falls below the cutoff point on any one attribute, the choice is eliminated from consideration.
I selected the product that had no bad features.
Disjunctive rule The consumer establishes a minimally acceptable level as a cutoff point for each attribute. If an alternative meets or exceeds the cutoff established for any one attribute, it is accepted.
I picked up the product that excelled in at least one attribute.
Elimination by aspects The consumer ranks the evaluative criteria in terms of their importance and establishes a cutoff point for each criterion. Those that do not surpass the cutoff point are dropped from the consideration set. The consideration will be done attribute by attribute.
I selected this product since all attributes exceed my standard requirement.
Lexicographic rule The consumer first ranks the attributes in terms of perceived relevance or importance. He then compares the various brand alternatives in terms of the single attribute that is considered most important. If one choice scores sufficiently high on this top-ranked attribute, it is selected, and the process ends.
I looked at the feature that was most important to me and choose the product that ranked highest on that attribute.
Compensatory rules The consumer evaluates brand options in terms of each relevant attribute and computes a weighted or summated score for each brand.
I selected the product that came out best when I balanced the good ratings against the bad ratings.
Source: Adapted from Schiffman and Kanuk (2004)
Since a choice comprises of many attributes, consumers may set up standard criteria for some important attributes of the product, consider each attribute one at a time or consider many attributes together, and then, make a choice selection accordingly. The strategies applied during a choice selection can be called decision strategies or decision rules which can be categorized into five types (Schiffman and Kanuk, 2004). The details of each decision strategy can be discussed as follows:
42
Conjunctive decision rule is a decision-making rule of thumb in which the consumer is assumed to set up minimum cut-offs for minimum acceptable levels on all important attributes or dimensions of a product or thing and eliminates any alternative that does not meet all the minimums. If the choice does not meet all of the minimum criteria, it is rejected. If several choices are acceptable, the consumer can either raise the cut-offs or use another decision rule to make the final choice. If none of the properties meets all the cut-off requirements, the consumer must either change the acceptable minimums or change the decision rule (Grether and Wilde, 1984). The conjunctive rules suggests that consumers establish a minimum acceptable level for each choice criterion and accept an alternative only if it equals or exceeds the minimum cut-off level for every criterion (American Marketing Association, 2006).
Disjunctive decision rule assumes that consumers develop acceptable standards for each dimension. According to Bettman (1998), if a product, brand, or alternative passes that standard for any attribute, it is accepted. The evaluation process yields groups of acceptable and unacceptable alternatives. The disjunctive rule suggests that consumers establish acceptable standards for each criterion and accept an alternative if it exceeds the standard on at least one criterion.
Elimination-by-aspects decision rule refers to a choice process that represents the ultimate selection decision after a series of eliminations. Each alternative available for choice is viewed as having some set of aspects e.g. product features. At the choice process, the most important aspect is selected and this aspect of all alternatives is considered. As a result, the alternatives that do not possess the selected aspect are eliminated. Then, the next attributes are considered in the order of their perceived importance. The process continues until only one alternative remains and that remaining item is assumed to be the one chosen by the consumer (Tversky, 1972).
Lexicographic decision rule assumes that attributes of products can be ordered in terms of importance. In making a choice, alternative brands are first compared with respect to the most important attribute. With a lexicographic rule, the consumer ranks the determinant attributes in order of importance (Schiffman and Kanuk,
43
2004). If one alternative is preferred over all others for this attribute, then that alternative is chosen regardless of the values the alternatives have on the other attributes. If two brands are equal on the most important attribute, the second attribute is considered, then the third, and so on (Engel et al., 1995).
Compensatory decision rule suggests that a consumer will select the alternative with the highest overall evaluation on a set of choice criteria. Criteria evaluations are done separately and, then, combined arithmetically such that positive evaluations can offset or balance or compensate for negative evaluations. This term is also called compensatory integration or compensatory process (American Marketing Association, 2006). With a weighted additive compensatory decision rule, the consumer identifies all the determinant attributes for the product being considered, assigns importance to each attribute, then rates all the alternatives on each attribute, and selects the alternative that generates the highest summated weighted score (Engel et al., 1995).
Consumers may combine several decision rules in choosing a product, first simplifying the decision by narrowing down the choices with a non-compensatory rule, then using a compensatory process to make the final choice. Since consumers are usually limited in their ability to determine the optimal choice based on all important characteristics (Capon and Kuhn, 1982), they may use simplified methods for comparing alternatives on a limited number of determinant characteristics. With this information, consumers can create a cut off point to qualify products, such as setting a price range and minimum sizing of the house to consider. If a property does not possess the minimum requirement on one important attribute, then it will not be considered despite its attractiveness on other attributes. Dibb (1994) indicated that decision makers use such a sequential decision strategy. First, they apply a non-compensatory decision rule to eliminate properties that do not possess the minimum requirements on primary issues such as price, size and location. Then they use a compensatory rule to evaluate each property across a wide range of secondary criteria. Some product attributes appear to be used only in forming choice sets, while others are used in both screening and final product choice. To form a
44
consideration set, conjunctive rules are often used since it can result in several alternatives (Schiffman and Kanuk, 2004). Gilbride and Allenby (2004) empirically supported this point since the conjunctive decision was found, in their study, to be a regular decision rule consumers used to screen their alternatives. In addition, Gilbride and Allenby (2004) indicated that consumers screen alternatives using attributes that are well known rather than new or novel. However, this finding may be inconsistent with the perception of most marketers who think that a novel attribute of a product would influence a consumer’s decision to buy the product. To make a final choice, especially in high involvement decisions, consumers may apply not only more complex decision strategies i.e. the compensatory rule but may also evaluate different attributes of the product using different rules at each stage of the decision (Alden et al., 1994).
In the opposite point of view, Tversky and Sattath (1979) suggested that decision makers would evaluate only the value of each alternative they have in their consideration sets, not individual attributes of the products. When the overall value of each choice is evaluated, the optimal choice with highest value, in the decision maker’s point of view, would be selected. This idea was widely accepted and various studies were done on this basis. For example, as discussed previously, Sweeny et al. (1997) proposed their model of the purchase decision process explaining the relationship between some key attributes of the choice, value, and also willingness to buy (See figure 3.1). It was recommended that value does not only influence customer choice behavior but also affects their satisfaction, intention to recommend and return behavior at the post purchase phase (Dodds et al., 1991; Parasuraman and Grewal 2000; Petrick 2001). However, despite its strategic importance for marketing, perceived value did not receive enough investigation in the literature. For each product, marketers need to understand the specific decision-making strategy utilized by each consumer segment acquiring that product. If this is done, marketers can position their product in such a manner that the decision-making strategy leads consumers to select the marketers’ products. To understand the high involvement purchase decision process, the relationship between decision strategies and perceived value should be examined.

45
To present the whole process of decision making based on value proposition, the rest of chapter will be organized into three major parts. The following part will discuss perceived value of the product. The types, definition, and key dimensions of perceived value will be discussed. Next, the factors influencing perceived value will be examined. Factors influencing value or the antecedents of value can be categorized into two types: benefits and sacrifices. Then the details of benefits and sacrifices will also be specified.
Perceived Value
Types of Value
The terminologies applied to the field of value are various, substantially
overlapping, and different across scholars. The value terminologies frequently mentioned in the marketing context are customer value, product value, supplier value, customer lifetime value, relationship value, shareholder value, and brand value (Brennan, 2004).
In short, product value means the value of the seller’s market offering to the customer; customer value means just the same. Supplier value and customer lifetime value similarly mean the value of doing business with the customer to the supplier. Relationship value means the holistic value associated with doing business with an exchange partner, or it may mean the relational components of that holistic value. Shareholder value refers to the net present value of future cash flows streaming from its tangible and intangible assets, discounted at an appropriate rate and adjusted for inflation and risk (Kerin and Sethuraman, 1998). And finally, brand value reflects how a product’s name, or company name, is perceived by the marketplace. Table 3.2 concludes the definitions of value-related constructs and Table 3.3 presents the names which are associated with the demand-side notions of value.

46
Table 3.2: Definitions of Value Related Constructs
Value Construct Definition Product Value/Customer Value
The value of the seller’s market offering to the customer; means just the same
Supplier Value The value of doing business with the customer to the supplier. Customer Lifetime Value/ Relationship Value
The holistic value associated with doing business with an exchange partner, or it may mean the relational components of that holistic value.
Shareholder Value The net present value of future cash flows streaming from its tangible and intangible assets, discounted at an appropriate rate and adjusted for inflation and risk.
Brand Value How a product’s name, or company name, is perceived by the marketplace, whether that is a target audience for a product or the marketplace in general.
Source: Adapted from Brennan (2004)
Table 3.3: The Different Proposed Names of Perceived Value
Name Author Remarks Perceived Value Liljander and Strandvick (1992); Patterson and
Spreng (1997); Zeithaml (1988) Customer Value Anderson and Narus (1998); Dodds (1999);
Holbrook (1996); Woodruff (1997) Product Value Berry and Yadav (1996);De Ruyter et al (1997),
Ostrom and Iacobucci (1995)
Substantially and commonly used
Consumption Value Sheth, Newman and Gross (1991) Value for the Customer Reichheld (1996) Value for Customers Treacy and Wiersema (1993) Customer Perceived Value Grönroos (1997), Heskett (1997) Consumer Value Holbrook (1999) Perceived Customer Value Lai (1995) Buyer Value Slater and Narver (1994) Subjective Expected Value Bolton (1998) Perceived Value for Money Sweeney, et al. (1999) Net Customer Value Butz and Goodstein (1996) Consumer Surplus Anderson (1995) Expected Value Huber et al (1997)
Infrequently used
Source: Adapted from Woodall (2003)
The type of value that most likely influences a consumer purchase decision is the product or customer value. However, lots of scholars proposed several names about product/customer value. Meanings of all proposed names are closely-related to product/customer value. As the first three names are substantially and commonly used, hereafter, the term “perceived value” will be used to represent any related technical terms.

47
Definition of Perceived Value
Zeithaml (1988) explored the concepts of perceived price, perceived quality, and perceived value. She found that customers thought of value in four ways: 1) Value is low price, 2) Value is whatever consumers want in a product, 3) Value is quality consumers get for the price they pay, and 4) Value is what consumers get for what they give. Based on this finding, Zeithaml (1988) proposed the definition of customer perceived value as “the consumer’s overall assessment of the utility of a product based on perceptions of what is received and what is given … value represents a trade-off of the salient give and get components.” This implies that different consumers would have different “give and get” components and weight the importance of these components differently. All benefits consumers receive from the product are “get” such as the utility of the product, social gain, and satisfaction, while both monetary and non-monetary elements consumers sacrifice to obtain the product could be considered as “give” components such as money, time, thought, and effort. Both give and get components include a range of different attributes. This give-get or trade-off definition is at the heart of many conceptual and empirical enquiries into customer value (Blois 2003; Lapierre 2000; Anderson and Narus 1999; Christopher 1996). Many subsequent authors have used Zeithaml’s definition as the essence of their own definition of customer value.
Heskett et al. (1997) proposed the customer value equation suggesting that the value of goods and services delivered to customers is equivalent to the results created for them as well as the quality of the processes used to deliver the results, all in relation to the price of the product to the customers and other costs incurred by the customer in acquiring the product. Therefore, customer value is the ratio of the sum of results and process quality and the sum of price and consumer access cost. This definition expanded Zeithaml’s “give and get” definition into the sophisticated details.
Consistently, Christopher (1996) made customer value a ratio of perceived benefits to total costs of ownership, and argued that both benefits and costs should be measured relative to competitive offers. Ravald and Grönroos (1996) and Kothandaraman and Wilson (2001) also proposed a ratio model, but put price (or
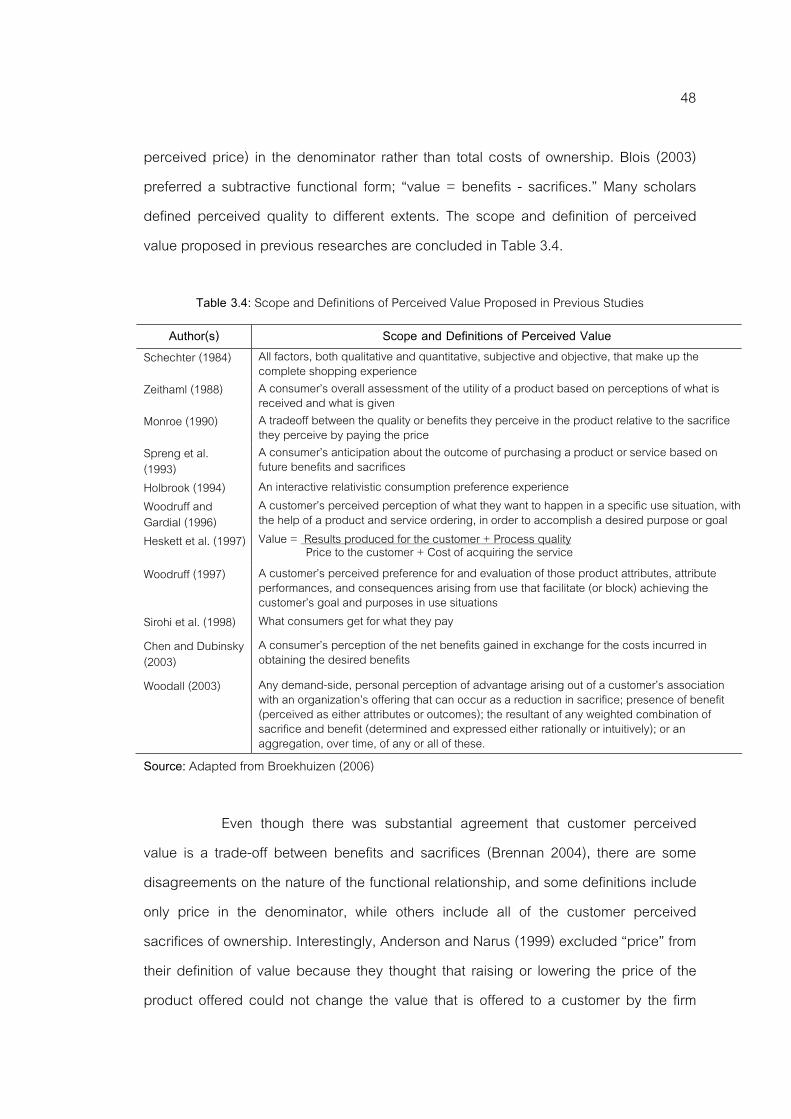
48
perceived price) in the denominator rather than total costs of ownership. Blois (2003) preferred a subtractive functional form; “value = benefits - sacrifices.” Many scholars defined perceived quality to different extents. The scope and definition of perceived value proposed in previous researches are concluded in Table 3.4.
Table 3.4: Scope and Definitions of Perceived Value Proposed in Previous Studies
Author(s) Scope and Definitions of Perceived Value Schechter (1984) All factors, both qualitative and quantitative, subjective and objective, that make up the
complete shopping experience Zeithaml (1988) A consumer’s overall assessment of the utility of a product based on perceptions of what is
received and what is given Monroe (1990) A tradeoff between the quality or benefits they perceive in the product relative to the sacrifice
they perceive by paying the price Spreng et al. (1993)
A consumer’s anticipation about the outcome of purchasing a product or service based on future benefits and sacrifices
Holbrook (1994) An interactive relativistic consumption preference experience Woodruff and Gardial (1996)
A customer’s perceived perception of what they want to happen in a specific use situation, with the help of a product and service ordering, in order to accomplish a desired purpose or goal
Heskett et al. (1997) Value = Results produced for the customer + Process quality Price to the customer + Cost of acquiring the service
Woodruff (1997)
A customer’s perceived preference for and evaluation of those product attributes, attribute performances, and consequences arising from use that facilitate (or block) achieving the customer’s goal and purposes in use situations
Sirohi et al. (1998) What consumers get for what they pay Chen and Dubinsky (2003)
A consumer’s perception of the net benefits gained in exchange for the costs incurred in obtaining the desired benefits
Woodall (2003) Any demand-side, personal perception of advantage arising out of a customer’s association with an organization’s offering that can occur as a reduction in sacrifice; presence of benefit (perceived as either attributes or outcomes); the resultant of any weighted combination of sacrifice and benefit (determined and expressed either rationally or intuitively); or an aggregation, over time, of any or all of these.
Source: Adapted from Broekhuizen (2006) Even though there was substantial agreement that customer perceived
value is a trade-off between benefits and sacrifices (Brennan 2004), there are some disagreements on the nature of the functional relationship, and some definitions include only price in the denominator, while others include all of the customer perceived sacrifices of ownership. Interestingly, Anderson and Narus (1999) excluded “price” from their definition of value because they thought that raising or lowering the price of the product offered could not change the value that is offered to a customer by the firm

49
Rather, it may change only the customer’s incentive to purchase that offering. Therefore, they defined customer value as the benefits that the customer receives minus the costs that the customer incurred other than the purchase price. However, Desarbo et al. (2001) and Lapierre (2000) disagreed with Anderson and Narus’s model. They proposed the price be an important factor determining customer value. Desarbo et al. (2001) defined customer value as the “trade-off between customer perceived quality and customer perceived price while Lapierre (2001) defined customer value, like the “give-get” model, as the difference between benefits and the sacrifices, explicitly including all monetary and non-monetary costs among the sacrifices. More importantly, Lapierre found that a value proposition implies much more than a trade-off between product quality and price.
Flint and Woodruff (2001) proposed the gap model that customer perceived value is the discrepancy of “received” value and “desired” value as shown in Figure 3.6.
Figure 3.6: Woodruff’s Customer Value Hierarchy Model
Source: Flint and Wooddruff (2001); Woodruff (1997)
Received value is the value that customers actually experience through
specific product-customer interactions, while desired value is the value that customers want to receive from products/services and their providers. Desired value is defined as the entire bundle of product attributes, and resulting consequences, both positive and negative and monetary and non-monetary, that the customer wants.
50
Woodruff (1997) identified a number of common aspects in the definition of customer value that are linked to product use based on customer perception rather than an objective phenomenon. He argued that customer value is developed hierarchically as a means-end chain, with desired product attributes at the first level leading to the achievement of desired consequences in use situations at the intermediate level and then to the fulfillment of customer goals and purposes at the highest level. Therefore, Woodruff defined customer value in a long term perspective as a customer’s perceived preference for and evaluation of those product attributes, attribute performances, and consequences arising from use that facilitates or blocks achieving the customer’s goals and purposes in use situations. Additionally, Parasuraman (1997) suggested that the nature and determinants of customer value may change depending on the stage in the customer life-cycle.
Even though various definitions of perceived value were proposed, most of them are based on the “give and get” concept proposed by Zeithaml (1988) which are, later, called benefits and sacrifices. The extents of the scope of value are most likely about what determine value. Several studies expanded the value equation of Heskett et al. (1997) in terms of how product and process quality determine value. Consistently, costs of acquiring the products were widely mentioned, but not sufficiently studied. In contrast, some studies disagree with this model in that price, either real or perceived, might not be an influencing factor for perceived value while many studies insisted the price to be the key sacrifice that significantly determined value. Since there is no final conclusion, a study on the relationship between price and perceived value including some intervening factors, if any, should be conducted. The details of benefits and sacrifices will be discussed after the key dimensions of perceived value. Key Dimensions of Perceived Value
Apart from a trade-off between benefits and sacrifices which is considered as the nature of perceived value, its multi-dimensional nature is also broadly confirmed. The five value dimensions or components identified by Sheth et al., (1991) are broadly
51
adopted in the later studies. According to their framework, value can be distinguished into five dimensions: 1) functional value (attributed-related or utilitarian benefits), (2) social value (social or symbolic benefits), (3) emotional value (experiential or emotional benefits), (4) epistemic value (curiosity-driven benefits), and (5) conditional value (situation-specific benefits). The details of each dimension are as follows:
Functional value is concerned with a products’ features and functionality. It can be referred to as economic value of the product which is related to the evaluation of how the product features and functions are worth to customers in terms of time and money.
Social value is the utility derived from the product’s ability to enhance social self-concepts, such as status of the consumers (Sweeney and Soutar, 2001).
Emotional value refers to the utility derived from the feelings, or affective states that a product generates. It is acquired when a product/service arouses feelings or affections.
Epistemic value refers to the surprise or novelty of a product; a product’s capacity to arouse curiosity, offer novelty or satisfy a desire for knowledge.
Conditional value refers to the situation in which the value judgment is made. Holbrook (1994) suggested that this type of value depends on the context in which the value judgment occurs and exists only within a specific situation. Such situations may be seasonal, once in a lifetime events or emergency situations (Sheth et al., 1991). Context is based on the time, location and social and technological environment, and user specified criteria e.g. mood, work or free time (Kontti, 2004).
Based on the five dimensions of perceived value proposed by Sheth et al. (1991), Sweeney and Soutar (2001) developed a multiple item scale called PERVAL to measure perceived value. However, the conditional value and epistemic value were omitted. Conditional value was omitted because it arises from temporary situational factors, whereas epistemic value was excluded because the novelty or surprise aspect might only be apparent for hedonic products rather than for a wider product range (Broekhuizen, 2006). However, Zeithaml et al. (1988) spited up functional value into

52
quality and price arguing that perceived value is dependent on a balance between qualities and price. The two components—quality and price—have different effects on perceived value for different consumers. Therefore, the perceived value scale should comprise four dimensions: quality/performance, price/value for money, emotional value and social value (Broekhuizen, 2006). Price or value for money is said to be financial value. Kotler (1997) also confirmed that customer value can be understood in terms of product value, service value, employee value, and image value. In addition, Lemmink, De Ruyter et al., (1998) proposed three value dimensions for services: emotional, practical, and logical value. The emotional value represents the affective side of the consumption experience, while the practical dimension refers to the functional consumption-related benefits and, finally, the logical dimension focuses on the evaluation of the benefits against its costs. Even though the names are different, the dimensions of perceived value proposed by De Ruyter et al. (1998) are not different from the three value dimensions; functional value, emotional value and social value proposed by Sheth et al. (1991) and Sweeney and Soutar (2001). Therefore, it could be said that the Sheth’s (1991) and Sweeney’s (2001) model of multidimensional perceived value are most acceptable and widely used to study perceived value of the product. The Benefits and Sacrifices Value Proposition
To develop value, consumers evaluate both objective and subjective attributes of the product. Based on Zeithaml’s “give and get” model (1988), value is viewed as a consumer’s overall assessment of the product based on perceptions of what is received and what is given, so factors influencing consumer perceived value should be categorized into two major categories: benefits and sacrifices. According to Woodall (2003), benefits can be gained from two sources, namely attributes and outcome of the product, whereas sacrifices are composed of both monetary and non-monetary factors.
Figure 3.7 shows possible benefits and sacrifices which are considered as antecedents of perceived value proposed by Woodall (2003). This model identifies

53
similar value-based components to those suggested by Kotler and Turner as the “value proposition” which later, were modified by LaPierre and Deneault (1997). However, Woodall’s model is more extensive since the list of monetary costs was added in order to acknowledge the complete consumption life-cycle.
Figure 3.7: Woodall’s Factors Considered as Benefits and Sacrifices of Perceived Value
Based on this model, the antecedents of perceived value are grouped
consistently with Zeithaml (1988), Heskett (1997), and other scholars into benefits and sacrifices. Good quality of product, core product feature, service quality, additional service quality, and product customization are all considered as “attributes” which are the first dimension of perceived benefit. Then the outcomes of the product are categorized into five types - strategic, personal, social, practical, and financial benefit - are proposed as another dimension of benefit. On the other hand, sacrifices are divided into two groups: monetary and non-monetary. For monetary sacrifices, the price of the product and also other related costs consumer spend such as search cost, acquisition cost, opportunity cost, learning cost, maintenance cost, and disposal cost are included while relationship cost, psychological cost and the time and effort consumers spend to acquire that product are considered as non-monetary sacrifice. The level of perceived value is unique since it results from the debate of both benefits and sacrifices (Woodall, 2003).
Perceived Value
Benefits Sacrifices
Attributes
Good Quality
Service Quality Core Product
Features Additional Service
Features
Non-Monetary
Relationship Costs Psychological Costs
Time
Effort
Monetary
Price
Search Costs
Acquisition Costs
Opportunity Costs
Outcomes
Strategic Benefits
Personal Benefits
Social Benefits
Practical Benefits
Financial Benefits Learning Costs Maintenance Costs
Disposal Costs Customization
Source: Woodall 2003

54
For the benefits, both attributes and outcomes of the products display substantial variety to value. However, some overlapping and blurring within and between the elements are found such as goods quality and core product features and service quality and additional service quality. Moreover, customization may also be viewed as a part of product quality. All outcomes viewed by Woodall (2003) as various types of benefits may be very difficult to differentiate from product quality and service quality. Even Woodall himself was concerned about this problem (Woodall, 2003). Therefore, the dimension of “attribute” may be categorized into only two factors, namely product and service quality where details of service and product quality should be different based on the type of product. For the “outcome” dimension, five types of benefits - strategic, personal, social, practical, and financial - were mentioned. Unfortunately, the scope and definition of each type of benefit haven’t been sufficiently clarified in Woodall’s study. However, several studies were focused on other benefits that may influence consumers’ perceived value of the product, not product and service quality, and the widely interested benefit is related to the brand of the product.
Dodds et al., (1991) indicated that brand is strongly related to product evaluations and perceived value of the product which, in turn, influences consumers’ willingness to buy. Brand name has been viewed to influence quality judgment, price evaluation, value interpretation, and purchase probability. Brand name however, is not the only cue used by the consumer to evaluate products and services, it can also impact consumer evaluation and choice decisions (Stader and Shaw, 1999; Donthu, 1999). To study brand name, the concept of brand equity was generally applied in many research studies. Since the impact of brand equity on perceived value has been widely recognized, it should be included as one dimension of perceived benefit. In addition, several research studies indicated relationship quality to be another important factor influencing buyer perceived value. A good relationship increases relationship benefits and reduces relationship costs, which in turn influences customer value perception (Wong and Zhou, 2006); the higher the relationship benefits and the lower the relationship costs, the higher the customer perceived value. Moreover, as a good
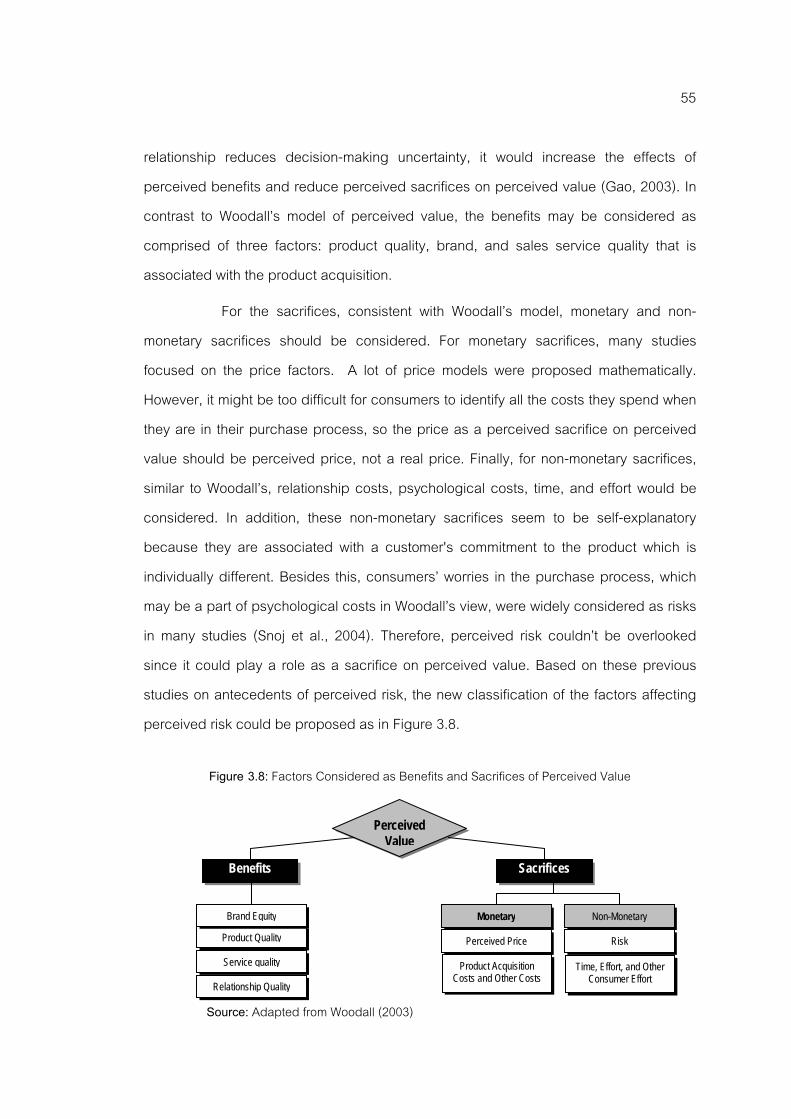
55
relationship reduces decision-making uncertainty, it would increase the effects of perceived benefits and reduce perceived sacrifices on perceived value (Gao, 2003). In contrast to Woodall’s model of perceived value, the benefits may be considered as comprised of three factors: product quality, brand, and sales service quality that is associated with the product acquisition. For the sacrifices, consistent with Woodall’s model, monetary and non-monetary sacrifices should be considered. For monetary sacrifices, many studies focused on the price factors. A lot of price models were proposed mathematically. However, it might be too difficult for consumers to identify all the costs they spend when they are in their purchase process, so the price as a perceived sacrifice on perceived value should be perceived price, not a real price. Finally, for non-monetary sacrifices, similar to Woodall’s, relationship costs, psychological costs, time, and effort would be considered. In addition, these non-monetary sacrifices seem to be self-explanatory because they are associated with a customer's commitment to the product which is individually different. Besides this, consumers’ worries in the purchase process, which may be a part of psychological costs in Woodall’s view, were widely considered as risks in many studies (Snoj et al., 2004). Therefore, perceived risk couldn’t be overlooked since it could play a role as a sacrifice on perceived value. Based on these previous studies on antecedents of perceived risk, the new classification of the factors affecting perceived risk could be proposed as in Figure 3.8.
Figure 3.8: Factors Considered as Benefits and Sacrifices of Perceived Value
Source: Adapted from Woodall (2003)
Perceived Value
Benefits Sacrifices
Product Quality
Service quality
Relationship Quality
Non-Monetary
Risk
Monetary
Perceived Price
Time, Effort, and Other Consumer Effort
Brand Equity
Product Acquisition Costs and Other Costs

56
Factors Considered as Benefits That Influence Perceived Value Product Quality
The concept of product quality approach has its roots in various disciplines. Initially, product quality was traditionally linked to the technical specifications of goods, with most definitions of quality arising from the manufacturing sector. Later on, the focus of product quality expanded from the production point of view to the marketing perspective. Crosby (1979) firstly defined quality of goods as “conformance to requirements.” Juran (1980) defined it as “fitness for use” while Garvin (1983) measured product quality by counting the incidence of “internal” failures—those observed before a product left the factory—and “external” failures—those incurred in the field after a unit had been installed.
However, though these product-based definitions of quality may be appropriate to the goods-producing sector, they may be insufficient to understand consumer perception. On the consumer-based point of view, product quality was defined by Ozeki and Asaka (1990) as the product which 1) meets customer standards, 2) meets and fulfills customer needs, 3) meets customer expectations, and 4) will meet unanticipated future needs and aspirations. Thus, product quality can be defined as how well a product exceeds a consumer’s preconceived idea about its features and performance. Dimensions of Product Quality
Product quality was proposed as a multidimensional construct by several researchers. Garvin’s (1987) suggested that product quality could be categorized into eight dimensions: performance, features, reliability, conformance, durability, serviceability, aesthetics and perceived quality. Apart from Garvin’s framework, Kotler (2003) stated that quality of products should be categorized into four dimensions: 1) conformance quality which is the degree to which the product is identical and meets the promised specifications, 2) durability which is a measure of the product’s expected

57
operating life, 3) reliability which is a measure of the probability that a product will not malfunction or fail within a specified time period, and 4) repairability which is a measure of the ease of fixing a product when it malfunctions or fail. Even though Garvin’s and Kotler’s framework illustrated different numbers, names, and details of product quality dimensions, some similar characteristics of product quality could be found when comparing these two frameworks as shown in Table 3.5.
Table 3.5: Comparison of Garvin’s and Kotler’s Product Quality Dimensions Dimensions of Product Quality
Kotler’s Garvin’s Definition Performance The primary operating characteristics of the products Features* The secondary characteristics of a product that supplement its basic
functioning Reliability
Reliability* The product’s probability of failure-free performance over a specified period of time
Conformance Conformance The degree to which a product’s physical and performance characteristics meet design specifications
Durability Durability A measure of useful product life, i.e., the amount of use a customer gets from a product before it deteriorates or must be replaced
Serviceability The ease , speed, courtesy, and competence of repair Aesthetics* How the product looks, feels, sounds, tastes, or smells; a matter of
personal preference Repairability
Perceived* Quality based on image, brand name or advertising rather than product attributes that is subjectively assessed
Source: Garvin (1987) and Kotler (2003) Remark: * Not included in Kotler’s product quality framework. Dimensions of Housing Product Quality
Each housing product has its specific characteristics on its immovable property. A housing product includes a house itself and physical environmental surroundings around the house, the atmosphere or “look” of the project, public facilities provided such as a clubhouse, swimming pools, security, street lights, and so on. Moreover, the new neighbor, location, and distance to some places such as workplace, kids’ school, shopping centers, city center, and so on may impact the lifestyles of home buyers. Bender et al. (1998) stated that the quality of housing products could be categorized into two types: intrinsic and environmental factors. Intrinsic factors, also called housing factors, are characterized as the housing objects such as size, construction quality, number of bathrooms, number of parking spaces, and so on. Another type, the environmental factors, includes not only physical surroundings but

58
also proximity to public transport, distance to city centre, and distance to commercial areas, etc. Slightly different, Bender et al. (2003) suggested two housing product qualities: 1) the actual housing such as size (number of bedrooms), type of tenure, housing costs, and 2) location attributes. Additionally, Yan (2004) found that land use and vegetation had a significant impact on property values. The details of housing, or intrinsic factors, and environmental factors, can be discussed as follows: Housing Factor The researchers seem to view housing factors in different ways. For example, Healey and Baker (1987) ranked building design factors in order of importance from their national survey in the UK from 1986 to 1987 as 1) internal environmental control, 2) heating system, 3) car parking, 4) quality of internal finishes, 5) security, 6) provision for cable trunk, 7) toilet facilities, 8) entrance hall, 9) lift performance/reliability, 10) arrangements for kitchen/ catering facilities, and 11) external appearance of building. Baum (1994) also concluded that the building design factors clearly had an impact on the perceived quality of the housing product. Bender (2000) categorized housing or intrinsic factors into six attributes: the surface in square meters, number of rooms, number of bathrooms, construction quality, existence of an elevator, and number of parking spaces.
Baum (1994) proposed that there are eight significant housing attributes which could be grouped into four dimensions: configuration, durability of materials, internal specification, and external appearance. Hunt (1991) proposed 129 housing factors in his building quality assessment scale (BQA) involving an on-site inspection for assessing. However, Hunt’s scale is criticized as too technical. Therefore, it may be more appropriate for real estate professionals, not consumers (Ho et al., 2005). Adapted from Hunt (1991), Ho, Newell, and Walker (2005) proposed a scale to evaluate housing quality called “Building Quality Index” comprising five dimensions with 30 building quality attributes. Using their “Building Quality Index,” Ho et al. (2005) ranked the building quality dimensions in order of importance as 1) functionality 2) services, access, and circulation, 3) presentation 4) management and 5) amenities. Housing
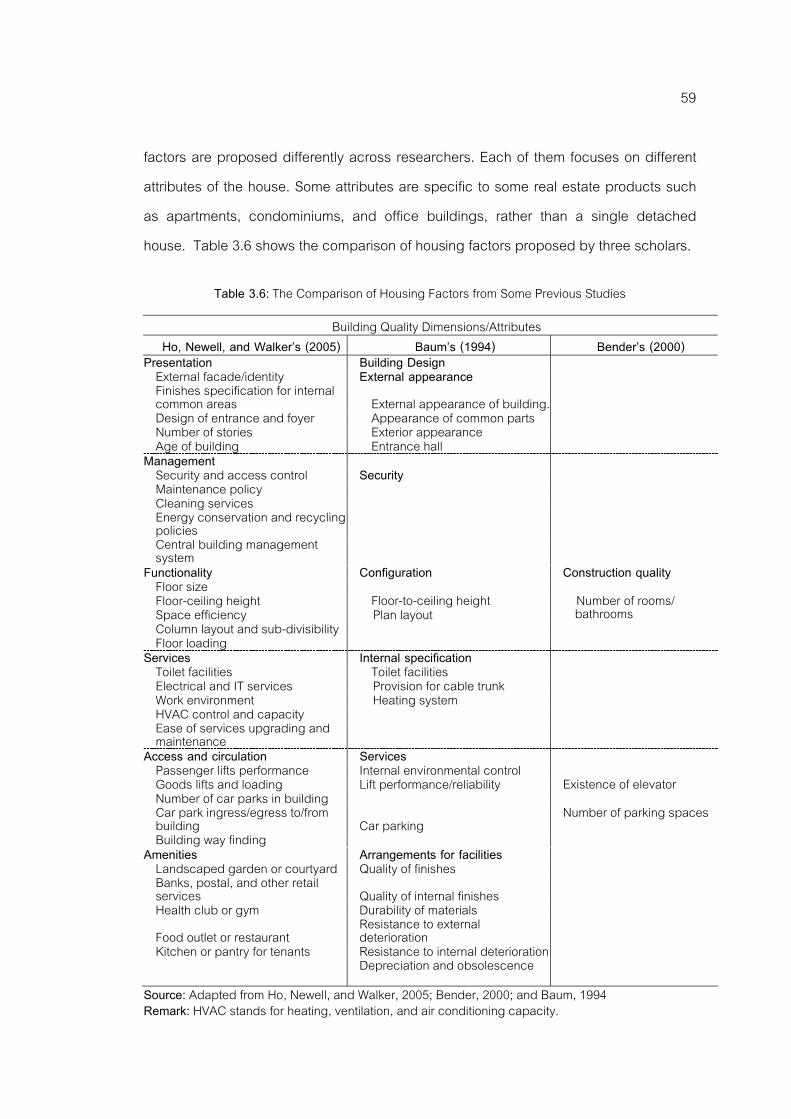
59
factors are proposed differently across researchers. Each of them focuses on different attributes of the house. Some attributes are specific to some real estate products such as apartments, condominiums, and office buildings, rather than a single detached house. Table 3.6 shows the comparison of housing factors proposed by three scholars.
Table 3.6: The Comparison of Housing Factors from Some Previous Studies
Building Quality Dimensions/Attributes Ho, Newell, and Walker’s (2005) Baum’s (1994) Bender’s (2000)
Presentation Building Design External facade/identity External appearance Finishes specification for internal common areas External appearance of building.
Design of entrance and foyer Appearance of common parts Number of stories Exterior appearance Age of building Entrance hall
Management Security and access control Security Maintenance policy Cleaning services Energy conservation and recyclingpolicies
Central building management system
Functionality Configuration Construction quality
Floor size Floor-ceiling height Floor-to-ceiling height Space efficiency Plan layout
Number of rooms/ bathrooms
Column layout and sub-divisibility Floor loading
Services Internal specification Toilet facilities Toilet facilities Electrical and IT services Provision for cable trunk Work environment Heating system HVAC control and capacity Ease of services upgrading and maintenance
Access and circulation Services
Passenger lifts performance Internal environmental control Goods lifts and loading Lift performance/reliability Existence of elevator Number of car parks in building Car park ingress/egress to/from building Car parking
Number of parking spaces Building way finding
Amenities Arrangements for facilities Landscaped garden or courtyard Quality of finishes Banks, postal, and other retail services Quality of internal finishes
Health club or gym Durability of materials Food outlet or restaurant
Resistance to external deterioration
Kitchen or pantry for tenants Resistance to internal deterioration
Depreciation and obsolescence
Source: Adapted from Ho, Newell, and Walker, 2005; Bender, 2000; and Baum, 1994 Remark: HVAC stands for heating, ventilation, and air conditioning capacity.

60
In order to evaluate the quality of a house based on the scale proposed by Ho et al. (2005), consumers must have sufficient knowledge on the housing products since the scale covers not only the housing object but also management jobs such as security and access control, cleaning service, energy conservation and recycling policies and so on. Indeed, some attributes are too detailed for some consumers. Therefore, this scale may be used as a checklist for some consumers who want to inspect more details of the housing product. In contrast, the housing quality proposed by Bender (2000) seems to be too broad with some important attributes, such as the design, appearance, and internal inspections, not mentioned. Baum’s model seems to be more appropriate for consumers to use to evaluate the quality of the house. However, some housing attributes proposed in Baum’s housing quality still need some modification. Some could be deleted and some other attributes should be added based on the type of house and real estate context. Environmental Factors
The environmental factors cover three related dimensions: location, environmental surroundings, and neighborhood (Bender, 2000). Location can be characterized by a set of externalities or environmental amenities. Tse (2002) found the relationship between house values and location. Better integrating land-use and vegetation should help to lower the spatial autocorrelation in error terms. Numerous studies highlighted the positive impact of vegetation and environmental surroundings in the real estate industry (Yan, 2004).
Bender (2000) found that the quality of environmental factors was perceived differently by home buyers from different zones. Among the eight criteria, degree of quietness and distance to nature or greenness were found to be the two most important factors rated in Geneva, whereas quality of view was considered as the most important for Zurich’s respondents. Accessibility to the city centre and the social value of the neighborhood appeared to be the less decisive factors in Geneva. Thus, they categorized environmental factors into eight criteria covering all three environmental dimensions: location, environmental surrounding, and neighborhood. The details of each criterion are illustrated in Table 3.7.
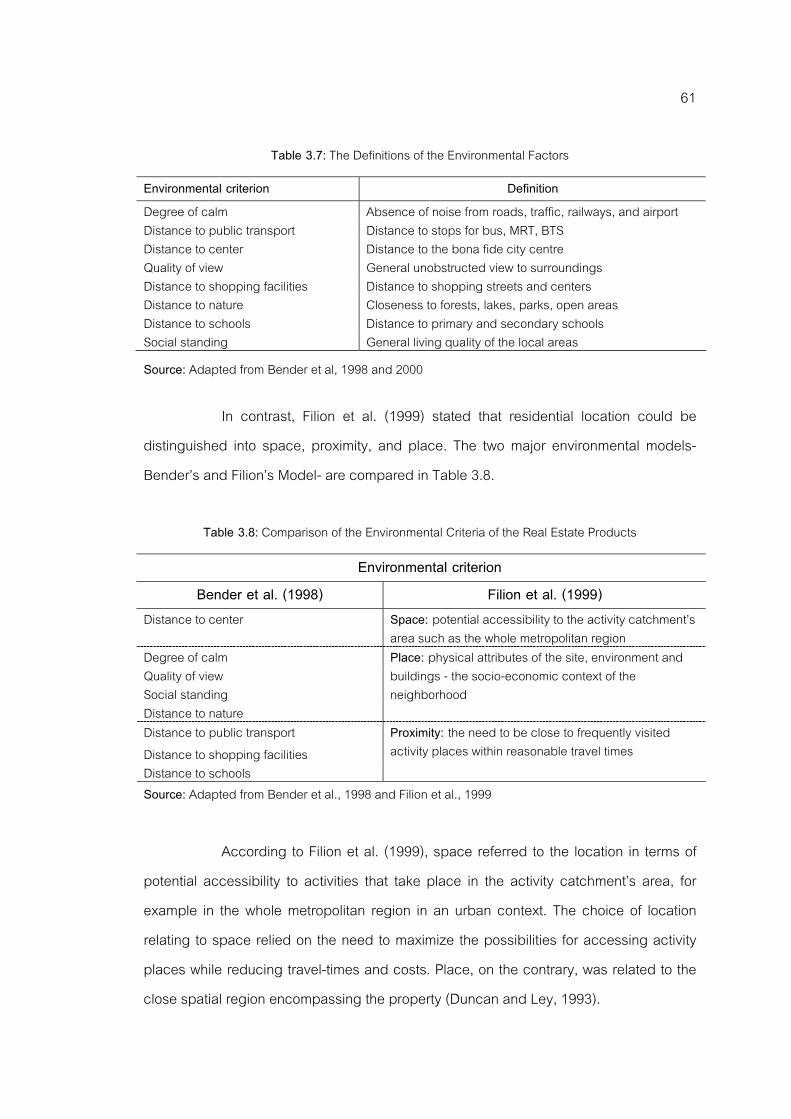
61
Table 3.7: The Definitions of the Environmental Factors
Environmental criterion Definition Degree of calm Absence of noise from roads, traffic, railways, and airport Distance to public transport Distance to stops for bus, MRT, BTS Distance to center Distance to the bona fide city centre Quality of view General unobstructed view to surroundings Distance to shopping facilities Distance to shopping streets and centers Distance to nature Closeness to forests, lakes, parks, open areas Distance to schools Distance to primary and secondary schools Social standing General living quality of the local areas Source: Adapted from Bender et al, 1998 and 2000
In contrast, Filion et al. (1999) stated that residential location could be distinguished into space, proximity, and place. The two major environmental models-Bender’s and Filion’s Model- are compared in Table 3.8.
Table 3.8: Comparison of the Environmental Criteria of the Real Estate Products
Environmental criterion Bender et al. (1998) Filion et al. (1999)
Distance to center Space: potential accessibility to the activity catchment’s area such as the whole metropolitan region
Degree of calm Quality of view Social standing Distance to nature
Place: physical attributes of the site, environment and buildings - the socio-economic context of the neighborhood
Distance to public transport Distance to shopping facilities Distance to schools
Proximity: the need to be close to frequently visited activity places within reasonable travel times
Source: Adapted from Bender et al., 1998 and Filion et al., 1999 According to Filion et al. (1999), space referred to the location in terms of
potential accessibility to activities that take place in the activity catchment’s area, for example in the whole metropolitan region in an urban context. The choice of location relating to space relied on the need to maximize the possibilities for accessing activity places while reducing travel-times and costs. Place, on the contrary, was related to the close spatial region encompassing the property (Duncan and Ley, 1993).

62
Place was principally characterized by the physical attributes of the site, environment and buildings, which were also good indicators of the socio-economic context of the neighborhood. Place and space did not cover the entire range of spatial factors tied to residential location choice. Proximity referred to the need to be close to frequently visited activity places such as within reasonable travel times or within a long walk or short drive.
In addition, some researchers have mentioned other environmental qualities such as impact of noise (Huang and Palmquist, 2001), air quality (Beron et al., 2001; Smith and Huang, 1995), water quality (Leggett and Bockstael, 2000) and proximity to potential toxic sites (Boyle and Kiel, 2001). However, the impact of pollution seems to play a less critical role in the real estate industry than the immediate interaction with the surroundings. Since Bender’s criteria for evaluation of quality of environmental factors of the house can cover the important environmental attributes and are applicable in all types of real estate products including a single detached house. Bender’s criteria were widely used in previous research studies. Sales Service Quality
Product distribution channels are different across product types. Consumers can buy products online, from retail stores or supermarkets, from sales agents, and so on. For some types of products that require specific information and negotiation for buying decisions, consumers have to buy the product from sales agents. This includes buying a house. Harris (2001) found that most home buyers visit houses or housing projects they are interested in to acquire accurate information during the buying process. Therefore, the real estate salesperson at the housing projects would play the roles of information provider and seller simultaneously.
Weitz (1978) identified three strategic roles a salesperson may play in influencing a buyer's decision. The salesperson could 1) propose decision criteria, 2) guide buyers through the addition or deletion of product alternatives from the

63
consideration set, or 3) modify the buyer's choice rules. In the home buying process, the interaction between customers and salespersons constitutes a unique and important dimension of performance. As such, it stands to have a strong impact on customer satisfaction, which, in turn, would enhance the perceived value of the house. In the competitive business context with similar housing products, salesperson performance can be a deciding factor in the consumer patronage decision. It is clear, therefore, that salesperson performance is crucial to consumers’ perceived value if the real estate firm is to provide high quality sales service.
Parasuraman et al. (1988) defined service quality as “the degree of discrepancy between customers' normative expectations for the service and their perceptions of the service performance.” Perceived service quality is then interpreted from the differences in degree and direction between perceptions and expectations. Therefore, service quality can be said to be a form of an attitude, related but not equivalent to satisfaction. Service quality results from the comparison of expected service levels with perceived performance of that service (Parasuraman et al., 1988). In other words, consumers would expect a certain level of service when they enter their service consumption and, simultaneously, they would observe actual service performance during that consumption experience. Perceived service quality is the subjective evaluation of consumer on how well or poorly that actual performance compares to expected performance. High-quality products and associated service designed to meet customer needs will create high levels of customer satisfaction. Consequently, the high level of satisfaction will lead to greatly increased customer purchase intentions and also loyalty to the firm (Shepherd, 1999).
Gap Model of Service Quality The discrepancy between expected service levels and perceived
performance of the service consumers experience is said to be a gap. Parasuraman et al. (1985) developed a service quality model based on gap analysis. Seven gaps within

64
and between the two levels of consideration, consumer and service provider level (as shown in Figure 3.9) were proposed to explain service quality.
Figure 3.9: Model of Service Quality Gaps
Parasuraman (1985) defined GAP 5, which is considered as consumers’ perceived service quality, as a function of the differences between expectation and performance along the quality dimensions. GAP 5 depends on the size and direction of the first four gaps associated with the delivery of service quality on the marketer’s side. According to this model, service quality is a function of perception and expectations (SQ = f (Eij–Pij)) where SQ is overall service quality; P is performance perception of stimulus i with respect to attribute j; and E is service quality expectation for attribute j that is the relevant norm for stimulus (Parasuraman et al., 1988). The details are concluded in Table 3.9.
Source: Parasuraman et al 1985

65
Table 3.9: The Seven Gaps in Service Quality
Gap Meaning Gap 1 Difference between consumers’ expectations and management's perceptions of those
expectations, i.e. not knowing what consumers expect Gap 2 Difference between management's perceptions of consumers’ expectations and service
quality specifications, i.e. improper service-quality standards and absence of goal setting Gap 3 Difference between service quality specifications and service actually delivered i.e. the
service performance gap as a result of role ambiguity and conflict, poor employee-job fit and poor technology-job fit, inappropriate supervisory control systems, or lack of perceived control and lack of teamwork
Gap 4 Difference between service delivery and the communications to consumers about service delivery, i.e. whether promises match delivery
Gap 5 Difference between consumers’ expectations and their perceptions of the service delivered, as a result of the influences exerted from the customer side and the shortfalls (gaps) on the part of the service provider. In this case, customer expectations are influenced by the extent of personal needs, word of mouth recommendation and past service experiences.
Gap 6 The discrepancy between customer expectations and employees’ perceptions, as a result of the differences in the understanding of customer expectations by front-line service providers.
Gap 7 The discrepancy between employees’ perceptions and management perceptions, as a result of the differences in the understanding of customer expectations between managers and service providers
Source: Parasuraman et al. (1985) Dimensions of Service Quality In an effort to understand the main concepts incorporated under the
umbrella of service quality better, many conceptual quality models have been postulated. Sasser et al. (1978) listed seven service attributes, while Grönroos (1978) argued that service quality comprises three dimensions: “technical quality of the outcome,” the “functional quality of the encounter,” and the “company corporate image.” Lehtinen and Lehtinen (1991) believed that service quality comprises three dimensions: 1) physical quality i.e. products and/or services, 2) corporate quality, i.e. the company image, and 3) interactive quality, where the dimensions of quality originate in the interaction between the consumer and the service organization. Parasuraman et al. (1985) offered the most widely reported set of service quality dimensions. They suggested that the criteria used by consumers that are important in molding their expectations and perceptions of delivered service fit into ten dimensions: tangibles,
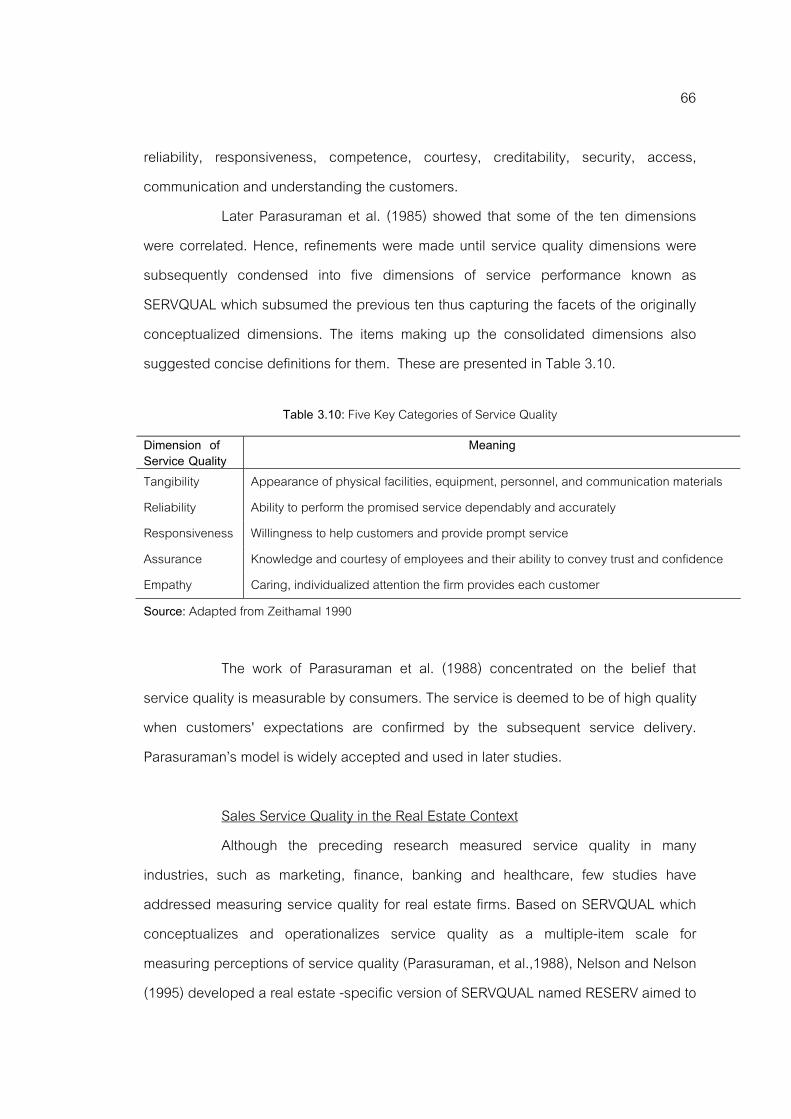
66
reliability, responsiveness, competence, courtesy, creditability, security, access, communication and understanding the customers.
Later Parasuraman et al. (1985) showed that some of the ten dimensions were correlated. Hence, refinements were made until service quality dimensions were subsequently condensed into five dimensions of service performance known as SERVQUAL which subsumed the previous ten thus capturing the facets of the originally conceptualized dimensions. The items making up the consolidated dimensions also suggested concise definitions for them. These are presented in Table 3.10.
Table 3.10: Five Key Categories of Service Quality
Dimension of Service Quality
Meaning
Tangibility Appearance of physical facilities, equipment, personnel, and communication materials Reliability Ability to perform the promised service dependably and accurately Responsiveness Willingness to help customers and provide prompt service Assurance Knowledge and courtesy of employees and their ability to convey trust and confidence Empathy Caring, individualized attention the firm provides each customer Source: Adapted from Zeithamal 1990
The work of Parasuraman et al. (1988) concentrated on the belief that
service quality is measurable by consumers. The service is deemed to be of high quality when customers' expectations are confirmed by the subsequent service delivery. Parasuraman’s model is widely accepted and used in later studies.
Sales Service Quality in the Real Estate Context Although the preceding research measured service quality in many
industries, such as marketing, finance, banking and healthcare, few studies have addressed measuring service quality for real estate firms. Based on SERVQUAL which conceptualizes and operationalizes service quality as a multiple-item scale for measuring perceptions of service quality (Parasuraman, et al.,1988), Nelson and Nelson (1995) developed a real estate -specific version of SERVQUAL named RESERV aimed to

67
measure specific service quality provided in the real estate industry (Seilaer et al., 2000). The RESERV (REal Estate SERVice quality) scale includes 18 original SERVQUAL items as well as five new items for the real estate industry: always on time, sincere interest in problems, things right the first time, explanation of buying process neat appearance of staff, and pamphlets visually appealing. Later, Torbica (1997) proposed his HOMBSAT (HOMe-Buyer SATisfaction) scale designed to measure consumers’ satisfaction on real estate service quality. However both HOMSAT and RESERV are designed for real estate service in general rather than sales service quality. Harris (2001) suggested the service required from real estate salespersons when consumers are in their purchase decision process includes several services attributes as shown in Table 3.11.
Table 3.11: How Real Estate Services Were Valued and Rated Valued as important (%) Service First time buyer Repeat buyers
Keeping informed 79.4 67.2 Helping find appropriate houses 79.3 75.7 Preparing contract 72.9 71.1 Negotiating 70.5 58.9 Providing tour in homes 65.1 70.6 Getting ready for closing 61.3 49.8 Determining how much to offer 57.0 41.5 Qualifying 45.7 31.5 Providing neighborhood information 45.3 38.6 Referring mortgage lender 42.9 28.6 Explaining loan choice 32.1 24.1 Source: Adapted from Harris (2001)
Dabholkar et al., 1996 undertook an additional reformulation of SERVQUAL with a direct application to retail stores resulting in an instrument that came closer to the assessment of salesperson performance. However, the instrument appears to be intended for all retail purchases, rather than focusing on high-involvement purchase situations. Darian et al. (2001) performed a conjoint analysis to examine customers’ priorities for salesperson performance attributes and found that the most important attribute is respect for the customer. Talking down to the customer is viewed more negatively than any other service. The second most important attribute is the
68
salesperson’s knowledge about the product. Consumers are significantly more likely to buy a product from a knowledgeable salesperson. The third attribute given great consideration is the salesperson’s responsiveness followed by friendliness while the last important attribute is salesperson availability. Respondents indicated that they were more likely to buy if the salesperson immediately greets customers as they enter.
Even though the sales service attributes applied in Darain’s studies are derived from the original SERVQUAL service attributes proposed by Parasuraman et al (1998), Darain’s findings indicated the rank of service attributes based on their order of importance. The conjoint analysis techniques applied in Darain’s study, made their scales capable of capturing the specific service attribute in the sales context. Compared to Torbica’s (1997) HOMBSTAT and RESERV proposed by Seilaer, Webb, and Whipple (2000), Darian’s scale has more power to measure the quality of sales service. Brand Equity
Another benefit consumers gain from buying a house is the social recognition associated with the brand of the real estate firm. Consumers’ overall evaluation of the brand is integrated into a sophisticated construct namely “brand equity.” This construct is defined as “the differential effect of brand knowledge on consumer response to the marketing of the brand” (Keller, 2001; Aaker, 1991).
The American Marketing Association (2006) defined a brand as a name, term, sign, symbol, or design, or a combination of these intended to identify the goods or services of one seller or group of sellers and to differentiate them from those of competitors. The name of the organization can also serve as a brand. The brand value reflects how a product's name, or company name, is perceived by the marketplace, whether that is a target audience for a product or the marketplace in general. Clearly, brands can have different meanings and therefore create different values. Based on the value of brand loyalty which is a dimension of brand equity, it can be said that there is a positive differential effect that knowing the brand name has on customer response to the product or service that has been focused (Kotler, 2003).

69
Brand equity results in customers showing a preference for one product over another when they are basically identical. Brand equity is critically important to make points of differentiation that lead to competitive advantages based on non-price competition (Aaker, 1991). Brand equity creates value for both the customer and the firm while value for the customer would enhance value for the firm (Aaker, 1991). As a result, brand equity was found to increase the probability of brand choice, willingness to pay premium prices, marketing communication effectiveness, and brand licensing opportunities. Moreover it decreases vulnerability to competitive marketing actions and elastic responses to price increases (Simon and Sullivan 1993).
Keller (1993) referred to brand equity as the differential effect of brand knowledge on consumer response to the marketing of a brand. According to Keller, brand equity consisted of two dimensions – brand knowledge and brand image. Aaker (1991) defined brand equity as a set of brand assets and liabilities linked to a brand, meaning its name and symbol that add to or subtract from the value provided by a product or service to a firm and/or to that firm's customers. Aaker also categorized brand equity into the four dimensions of brand awareness, brand associations, perceived quality, and brand loyalty with other proprietary assets. Although Aaker (1991) and Keller (1993) conceptualized brand equity differently, both defined brand equity from a consumer perspective. Many studies such as Pappu et al. (2005), Washburn and Plank (2002), Yoo and Donthu (2002), Sinha and Pappu (1998) Cobb-Walgren et al., (1995) conceptualized brand equity and its dimensions similarly to that of Aaker (1991) and Keller (1993). To provide a better understanding of the impact of brand equity on the consumer purchase decision process, the four major dimensions of brand equity, according to Aaker (1991) are discussed in the paragraphs that follow.
Brand Awareness Brand awareness refers to the strength of a brand's presence in consumers’
minds. Brand equity represents a condition in which the consumer is familiar with the brand and recalls some favorable, strong, and unique brand associations. In making a

70
purchase decision, brand awareness is important not only for generating a consideration set for a consumer, but also influencing a choice selection since it helps consumers to gain specific knowledge and information related to that particular brand in consumers’ memory in the first place. Without the brand image in consumers’ minds, consumers would not consider that brand in their choice selection process since that brand is not an alternative in the consumers’ mindset (Pitta and Katsanis, 1995).
Aaker (1991) mentioned several levels of brand awareness, ranging from mere recognition of the brand to dominance, which refers to the condition where the brand involved is the only brand recalled by a consumer. Keller (1993) conceptualized brand awareness as consisting of both brand recognition and brand recall. According to Keller, brand recall refers to consumers’ ability to retrieve the brand from memory. Recall indicates the highest level of brand awareness which is illustrated by a situation in which consumers could mention the brand immediately when they think of or want to buy a product. Recall can be described as the strongest strength of association of a brand name with a product (Pitta and Katsanis, 1995). Recognition, also called aided recall, is considered as the second level of brand awareness. Aided recall is insufficient to generate a consumer choice by itself, since the consumer is unable to generate the name or a picture of the brand. A consumer would have to encounter the brand and recognize it as a potential purchase choice (Pitta and Katsanis, 1995).
Brand Associations This dimension is believed to contain the meaning of the brand for
consumers (Keller, 1993). Unique brand associations have been classified into three major categories: attributes, benefits, and attitudes.
Brand attribute can be divided into product related and non-product related attributes. Product related attributes are connected to the physical characteristics of the product and vary by product category; therefore, they are familiarly called product features (Pitta and Katsanis, 1995). Non-product related attributes are defined as external aspects which relate to a purchase or consumption of that product. Non-

71
product related attributes include four types of information: price, packaging, the identity of the typical consumer, and where or in which situations the product is used (Kim et al., 2003). The non-product attributes have little to do with product function, but may serve as important cues to help create further associations. Consumers often associate price and quality with brands. Associations with the other two non-product attributes can be formed by consumer observation, and often can reflect some consumer inferences.
Benefit of brand represents the level of satisfaction consumers expect product features to convey. They are often specific and represent consumer value. Benefits are often further classified as functional, experiential or symbolic (Park et al., 1986). Functional benefits pertain to the intrinsic features possessed by the product and are often linked to relatively low level needs. Experiential benefits are also linked to features and pertain to how it feels to use the product. The last type, symbolic benefits, relate to consumers’ self-concept which can be linked to higher order needs like social or self-esteem needs.
Brand attitude, the last and most important association, is the consumer attitude toward a brand. Brand attitudes have been conceptualized as a multiattribute expectancy value model (Fishbein and Ajzen, 1975). The model views attitudes as the sum of all the beliefs a consumer holds about a product or service, multiplied by the strength of evaluation of each of those beliefs as good or bad (Pitta et al., 1995). An important implication of the model is that many positively evaluated beliefs can be overcome by a few strong negatively evaluated beliefs. However, brand attitudes can be associated with both product related and non-product related attributes.
Perceived Quality Perceived quality of the product from the brand is another important
dimension of brand equity (Aaker, 1991). Perceived quality is not the actual quality of the product but the consumer's subjective evaluation of the product (Zeithaml, 1988). Perceived quality also provides value to consumers by differentiating the brand from competing brands and also by providing them with a reason to buy.

72
Brand Loyalty The last major component of brand equity is brand loyalty. Aaker (1991)
defined brand loyalty as the attachment that consumers have to a brand. Rossiter and Percy (1987) argued that brand loyalty is often characterized by a favorable attitude towards a brand and repeated purchases of the same brand over time. Slightly different, Yoo and Donthu (2001) defined brand loyalty from an attitudinal perspective as the tendency to be loyal to a focal brand, which is demonstrated by the intention to buy the brand as a primary choice. Chaudhuri and Holbrook (2001) argued that attitudinal brand loyalty includes a degree of dispositional commitment in terms of some unique value associated with the brand.
In contrast, the definitions of brand loyalty based on the behavioral perspective emphasized the consumer's actual loyalty to the brand as reflected in purchase choices. The definitions based on an attitudinal perspective accentuated consumer intentions to be loyal to the brand. Since the definition of brand loyalty seems to be different in behavioral and attitudinal perspective, in its actual behavior or just an intention to buy, in purchasing a durable product such as a house, Pappu (2005) indicated that brand equity should be conceptualized on the basis of consumer perceptions and not on the their behavior.
The four brand equity dimensions of brand awareness, brand associations, perceived quality and brand loyalty have associative relationships among each other. Consumer’s perception of quality seems to be associated with their brand loyalty. The higher the brand loyalty consumers have, the more they are likely to perceive the brand as offering superior quality. Similarly, the more favorable association consumers have towards a brand, the more their loyalty. Relationship Quality
The three major benefits consumers get from buying a product - perceived
product quality, sales service quality, and also brand equity - would influence buyers to

73
develop a bond with the product, the brand, the firm, and even salespersons. The quality of this bond would impact the formation of the value put on the product (Bendapudi and Berry, 1997). The overall depth and climate of this bond is called relationship quality (Grönroos, 1990). Crosby et al. (1990) defined relationship quality from a people-based approach as when "the customer is able to rely on the firm and the salesperson's integrity and has confidence in the salesperson's future performance because the level of past performance has been consistently satisfactory." Johnson (1999) indicated that relationship quality refers to customer’s perceptions of how well the whole relationship fulfils the expectations, predictions, goals and desires the customer has concerning the whole relationship. Hennig-Thurau and Klee (1997) defined relationship quality between customers and firms as the "degree of appropriateness of a relationship to fulfill the needs of the customer associated with the relationship." General consensus on the definition of relationship quality among researchers such as Crosby et al (1990), Dwyer and Oh (1987) and Kumar et al (1995) was that relationship quality is a higher order construct made of several distinct, though related dimensions. Dimensions of Relationship Quality
Similar to product and service quality, relationship quality can be regarded as a multidimensional structure composed of several key components reflecting the overall nature of relationships between companies and consumers. Gummesson (1987) categorized relationship quality into two levels of relationships. The first, person-to- person, indicated an interpersonal relationship between customers and the salesperson, while the second, person-to-company, represented a relationship between customer and the firm. The recognition of this difference would facilitate a sophisticated understanding of the different dimensions and attributes of relationship quality. Several dimensions of relationship quality were proposed in previous studies as presented in Table 3.12.

74
Table 3.12: Proposed Dimensions of Relationship Quality in the Previous Studies RQ Dimensions Brief description of dimension Sources
Trust in partner’s honesty
One party’s belief that their needs will be fulfilled by the other party in the future. This requires judgment as to the integrity and reliability of an exchange partner. Trust is central to nearly all attempts to evaluate relationships.
Anders and Weitz (1989); Anderson and Narus (1990); Crosby et al (1990); Moorman et al (1992); Ganesan (1994);Morgan and Hunt (1994); Kumar et al (1995); Ramsey and Sohi (1997); Roberts, Sajeev and Varki (2003)
Trust in partner’s benevolence
Extent to which the firm is concerned for the customer’s welfare and has intentions and motives beneficial to the customer when new conditions arise for which a commitment has not been made.
Rempel et al (1985); Anderson and Narus (1990); Crosby et al (1990); Boon (1994); Ganesan (1994); Kumar (1995); Roberts, Sajeev and Varki (2003)
Affective commitment An affective attachment to an organization. How a consumer feels about their relationship and whether they want to continue their relationship.
Mcgee and Ford (1987); Berry and Parasuraman (1991); Meyer et al (1993); Morgan and Hunt (1994); Kumar et al (1995)
Satisfaction Cognitive and affective evaluation based on personal experience across all service episodes within the relationship. Past interactions influence expectations of the future interaction quality and the evaluations of the relationship.
Hunt (1977); Shaver et al (1987); Westbrook (1987); Crosby (1990); Bolton and Drew (1991); Oliva et al (1992); Storbacka et al (1994); Danaher and Haddrell (1996)
Affective conflict Ongoing tension between parties to a relationship that arises from the incompatibility of actual and desired responses. It provides a summary of past interactions with the firm and influences a consumer’s willingness to develop and maintain relationships.
Raven and Kruglanski (1970); Frazier (1983); Dwyer et al (1987); Kaufman and Stern (1988); Brown et al (1991), Kumar et al (1995)
Communication A two-way process: sending messages and listening/shared understanding. Communication is an antecedent or driver of relationship quality.
Anderson and Narus (1990); Morgan and Hunt (1994); Berry (1995); Ramsey and Sohi (1997); Duncan and Moriarty (1998)
Selling orientation The extent to which sales people try to help their customers make purchase decisions that will satisfy customer needs. This seems to overlap with other dimensions of RQ.
Saxe and Weitz (1982); Wray et al (1994); Dorsh et al (1998); Bejou et al (1996)
Opportunism Self –interest seeking with guile. It is an antecedent of relationship quality which is inconsistent with the relationship outcomes.
Williamson (1975); Morgan and Hunt (1994); Dwyer et al (1987); Dorsh et al (1998)
Economic benefits Price breaks, discounts, loyalty program benefits, or time savings as a result of not having to look for a new provider. Just as price discounts do not indicate SQ or RQ but have a long term effect on consumer’s preference.
Peterson (1995); O’Brien and Jones (1995); Berry (1995)
Customized benefits Benefits from customizing the service received. It’s found to have a mixed effect on behavioral intentions.
Suprenant and Solomon (1987); Berry (1995); Bitner (1995); Gwinner et al (1998)
Mutual goals The degree to which partners share goals that can only be accomplished through joint action and the maintenance of the relationship.
Wilson (1995)
Closeness Measured in the past using satisfaction, emotional content and a self perceived measure of closeness. Alternative measures of relationship closeness (satisfaction and emotional content) are included in the RQ scale. A specific closeness measure has not been clearly defined or included.
Barns (1997)
Ethical profile Perceptions regarding right or wrong. Ethical profile shares meaning with benevolence, and thus is already partially taken into account.
Lagace et al 1991; Bejou et al 1996; Wray 1994; Dorsch et al 1998
Equity Perceived equity depends on an individual’s assessment of the value and relevance of participants’ inputs and outcomes. Equity is a necessary precursor to building quality relationship
Kumer et al 1995; Gundlach and Murphy 1993
Source: Adapted from Roberts et al. (2003)

75
Although there is not a common consensus regarding the dimensions of relationship quality (HennigThurau, 2000), there is general agreement that customer trust in the product/service provider and commitment to the relationship are core dimensions of relationship quality and consumers’ satisfaction with the performance of the product/service provider, (Hennig-Thurau et al., 2002). The details of the core dimensions of relationship quality - trust, commitment and satisfaction - can be discussed as follows:
Trust has been broadly defined as “one party's belief that its needs will be fulfilled in the future by actions undertaken by the other party” (Anderson and Weitz, 1989) or “a willingness to rely on an exchange partner in whom one has confidence” (Moorman et al., 1992). It has also been considered as “the belief that a partner’s word or promise is reliable and a party will fulfill his/her obligations in the relationship” (Schurr and Ozanne, 1985). Thus, trust requires judgment as to the integrity and reliability of the exchange partner (Morgan and Hunt, 1994). Based on these definitions, it can be inferred that trust serves to reduce perceived risk of customers (Lin and Ding, 2005). Gwinner et al. (1998) find the psychological benefit of trust allows parties to develop confidence which would enhance the effectiveness and efficiency of both long run and short-term relationships. Trust exists if a customer believes a service provider to be reliable and to have a high degree of integrity (Moorman et al., 1992). Trust is seen by several authors as a necessary ingredient for long-term relationships (Bendapudi and Berry, 1997). The relationship between consumers and product, firm, or salespersons would make consumers develop a positive attitude towards products and, in turn, enhance consumer perceived value of the product. As several studies proposed the consistent idea that trust is related to reliability and reliability is also a dimension of product quality, service quality, and brand equity, there should be a relationship between trust and three other perceived benefits of the product.
Commitment is originally defined by psychologists as decisions or cognitions that fix or bind an individual to a behavioral disposition (Kiesler, 1971). Commitment is characterized by intent to remain, along with certain personal and
76
environmental factors that underpin intent (Mowday et al., 1982). Dwyer et al. (1987) stated that commitment represents the highest stage of relational bonding. Moorman et al. (1992) defined commitment as an enduring desire to maintain a valued relationship which is the belief that commitment exists only when the relationship is considered important. This implies a higher level of obligation to make a relationship succeed and to make it mutually satisfying and beneficial (Gundlach et al., 1995). Since commitment is higher among individuals who believe that they receive more value from a relationship, highly committed customers should be willing to reciprocate effort on behalf of a firm due to past benefits received (Mowday et al., 1982). Therefore, it can be inferred that a consumer's commitment to a firm is an important indicator of the quality of a relationship, and thus should be included as a dimension of relationship quality. This perspective is consistent with Berry and Parasuraman (1991) who view commitment as an indicator of service relationships. The value customers place on the relationship with a salesperson is associated with commitment to the firm as long as the salesperson remains at that firm (Macintosh and Lawrence, 1997). This will be reflected in a positive association between commitment to the salesperson/firm and relationship quality.
Satisfaction is an emotional state that occurs in response to an assessment of buyer-seller interaction experiences which indicates the "customers' cognitive and affective evaluation based on their personal experience across all episodes within the relationship" (Storbacka et al., 1994). Based on this definition, satisfaction can take an important role as a measure of relationship. It stands to reason that a customer who is not satisfied with the service received by a service provider cannot be expected to have a good relationship with the salesperson and, therefore, cannot be expected to have a good relationship with the firm, as the satisfaction of customer needs is at the core of the exchange relationship. Dorsch et al. (1998) found that more satisfied buyers have higher quality relationships with the firm. Also, the more satisfied buyers were more knowledgeable about the roles assumed and performed by the firms, and were more discriminating about the quality of their relationships with the firms (Roberts et al., 2003).

77
Satisfaction causes long-term perpetuation of relationships and can also indicate trust (Lin and Ding, 2005).
Relationship quality with three core dimensions, trust, commitment, and satisfaction is associated with both perceived value and perceived benefits of the product. Some previous studies indicated relationships between relationship quality and product quality, service quality and brand equity. However, very rare studies have proven the direct relationship between relationship quality and value empirically and also the mediating effect of relationship quality on product quality, service quality, brand equity and perceived value. Therefore, this particular point should be considered.
Factors Considered as Sacrifices that Influence Perceived Value
Based on the theoretical foundation of value, perceived sacrifices, both monetary and non-monetary factors, could negatively influence the perceived value of the product. As proposed earlier in Figure 3.8, monetary sacrifices include the perceived price of the product and other costs while non-monetary sacrifices cover risk and consumer effort which are time and effort spent to obtain the product. The details of each sacrifice can be discussed as follows: Perceived Price
Price is a major sacrifice which is the consumers’ first concern when they buy a product. Dodds et al. (1991) found a negative relationship tested between price and willingness to buy. However, product quality tends to play a moderating role between price and perceived value and also willingness to buy. This finding was confirmed by Parik and Weseley (2005) who discovered that as prices increase, buyers assume increases in product quality. However, buyers' perceptions of the value of the goods and their willingness to buy initially increase and then decrease. Moreover, the brand name was found to influence consumer perception of price and opinions of quality. Price can be perceived differently across consumers based on the individual

78
differences in preferences, knowledge, and socioeconomic status. Therefore, it would be more appropriate to consider “perceived price” from the consumers’ perspective instead of real price. Consumers with different income levels and family expenses would perceive one price differently. Moreover, not only whether the price is perceived as reasonable, but also the affordability affects consumers’ purchase decisions.
A house is considered as a high price product with regards to the construction and land cost. However, buying a house means acquiring a long-life, and permanent asset which consumers could spend their life in for a long period of time. Most consumers can accept its high price and are willing to pay if it is affordable. The price of a house is related mainly to two factors, land price and construction cost. Land price is not uniformly valuable everywhere. It depends largely on zoning, location, and most importantly, land development cost which is charged by the real estate developers (Nelson et al., 2002). The discrepancy of the price of a house is related to many factors including the land development cost, environment and public facilities, construction materials and technology and also the brand of the real estate developers. In contrast, Nelson et al. (2002) found that the price of a house primarily depends on market demand, not land constraints and construction cost. The prices of houses located in areas with adequate public facilities may be higher than those located elsewhere.
Stone (1993) suggested that upper income and smaller households can afford to spend much more than 30 percent of their incomes on housing and still have enough income left over to satisfy other basic needs. Therefore, it could be concluded that a decision to buy a house depends largely on perceived price and affordability. However, some other related factors may contribute to housing affordability such as declining interest rates, payable mortgage plan, and property tax exemption. Additionally other sales promotions such as a small amount of down payment, full furnishing, and so on would help consumers to have more money at hand to pay for the house (Glaeser et al., 2001).
Since the price itself does not directly affect perceived value, the interaction between quality, price and value should be considered simultaneously. For some cases,

79
with a different point of view, a higher price may indicate luxury. If a firm with a high level of brand equity offers a premium price product, it may create a high perceived value for that product. Therefore, the interaction of price, brand, quality and perceived value is interesting and should be studied. Perceived Risk
Risk is often viewed as an antecedent of purchase involvement (Choffee and McLeod, 1973) particularly when the price of the product is high and the consumer risks losing money. Risk can be considered as objective and subjective which is similar to real world risk or perceived risk. Bauer (1960) strongly emphasized that only subjective risk or the degree of risk perceived by consumers could be applied when the study is on consumers. When consumers face a new purchase which they have never encountered before, an accurate assessment of objective risk is almost impossible (Mitchell, 1999).
To reduce risk, high involvement with a single brand is normally used as a major risk reducer for consumers (Roselius, 1971). However, brand loyalty is not the only way to reduce perceived risk. Sometimes, the cost of a premium brand product may cause some consumers to be unable to afford it, while the brand couldn’t guarantee satisfaction in other situations. Consumers may reduce their risk by searching for more relevant information and alternative choices and creating different values for each choice. These prior research findings indicate the relationship between risk, brand, price and also perceived value of the product.
Nature and Definition of Risk In classical decision theories, risk is most commonly conceived as
reflecting variation in the distribution of possible outcomes, their likelihoods and their subjective values. In general, the theories assume that decision makers prefer smaller risks to larger ones when other related factors are constant (Arrow, 1965). Bauer (1967) conceptualized perceived risk as two dimensions: the amount that would be lost if the

80
consequences of an act were not favorable (negative consequences) and the individual’s subjective feeling of certainty that the consequences will be unfavorable (uncertainty). Consistently, Bettman, (1973) defined risk as a two-dimensional construct comprising the uncertainty involved in a purchase decision and the consequences of taking an unfavorable action. Sjoberg (1980) defined risk as an ambiguous situation associated with many attributes. Stone and Winter (1987) viewed risk as an expectation of loss. The more certain one is about this expectation, the greater the risk is for that individual.
Sweeney et al. (1999) defined risk as a subjective anticipation of loss of some degree. In other words, risk is a subjective estimation by consumers connected with possible consequences of a wrong decision; a possibility the product will not offer all its expected benefits. Hawkins et al. (2004) defined risk as a situation associated with unsatisfactory product performance. Therefore, it varies from one consumer to another and for the same consumer from one product to another and from one situation to another. Even though there are various definitions of risk, all are consistent. Some differences are just minor. In conclusion, risk can be defined as the uncertainty that consumers face when they cannot foresee the consequence of their purchase decision.
Perceived risk is related to consumer purchase and consumption of the product or service. Since an important property of risk is that it is thought to arise from potentially negative outcomes, each product has risk inherently associated with it, which may become prominent to the consumers when they interact with the product in some manner (Dholakia, 2001). Generally, perceived risk is considered to have a typical influence in the information search and alternative evaluation stages of the consumer buying process (Zeithaml and Bitner, 2003). It is theorized that when perceived risk is small, it has little effect on buying intention and is essentially ignored (Greatorex and Mitchell, 1999). In contrast, an extremely high level of perceived risk can cause a consumer to postpone or avoid a purchase entirely. Therefore, perceived risk is said to be negative related to the perceived value of products.

81
Dimensions of Risk Vann (1984) suggested that to overcome the confusion of perceived risk,
different dimensions of risk would be considered. Jacoby and Kaplan (1972) suggested that perceived risk should be considered a multidimensional concept entailing multiple types of risks, including financial, performing, physical, psychological, and social risk.
Psychological risk is viewed as the experience of anxiety or psychological discomfort arising from anticipated post behavioral affective reactions such as worry and regret (Perugini and Bagozzi, 1999) from purchasing and using the product. Thus, psychological risk is the risk of choosing a wrong product that might have a negative effect on a consumer's ego.
Functional risk refers to the risk the product may not work as expected by a consumer (Dholakia, 2001). Functional risk includes performance risk and physical risk, which are cognitively-evaluated types of risk arising from objective features of the product i.e., cost, performance features, the possibility of bodily harm, and the possibility of excessive investment of time, respectively. Mumel (1999) added also the time risk, which is a risk that time spent searching for a product will be lost, if a product does not perform according to a consumer's expectations.
Financial risk refers to the risk that a consumer is losing his money, because the product does not meet his expectations; a risk that rather than having more benefits, a consumer invests more money in acquiring a product.
Social risk is concerned with the adverse consequences associated with unfavorable opinions of significant other people on account of the purchase and use of the product. This type of risk is particularly prominent in the case of socially conspicuous products especially high-involvement products such as houses, automobiles or health-club memberships. It is the risk that by choosing a product, a consumer's status will change among his friends and/or his family and/or his colleagues.
Even though the concept of risk was focused and widely studied in several marketing contexts, the real estate risk or perceived risk that consumers experience when they are buying their houses are not specifically studied.
82
Consumer Involvement
Consumer involvement for the purchase activity is one important behavior that cannot be overlooked. Consumer involvement is concerned with the extent to which people believe the consequences of risky decision making will be personally relevant (Williams and Wong, 1999). It can also be considered as a temporary perception of product importance based on the consumer’s desire to obtain particular extrinsic goals that may derive from the purchase and/or usage of the product (Bloch and Richins, 1983). Consumer involvement results from the effort and involvement they spend on the purchase. Zaichkowsky (1985) defined involvement as the personal relevance of an object based on inherent needs, values and interests. In this respect, involvement can be synonymous with importance, interest, attachment and/or motivation manifested toward an object (Larocheet et al., 2003). In general, Consumer involvement refers to the non-emotional investments including time, effort, and the related expense sacrificed or made by the consumers (Baker et al., 2002). Consumer involvement may result in the detailed evaluation of objective stimuli such as cost or performance features of the product, and/or the social and psychological environment surrounding its purchase and consumption. Consumer involvement is closely related to risk in that risk could be considered either as an antecedent or as a consequence of effort (Dholakia, 2001; Laurent and Kapferer, 1985).
Consumers who are highly involved with the product and their purchase may perceive the situation as high risk. On the other hand, since they perceive the situation as high risk, they try to put more time and effort in gaining more information and choices which would help them reduce their uncertainty and perceived risk. Consumer involvement affects consumers’ decision behavior by influencing their perceptions of the decision situation, evaluation of alternatives, choices made, and other decision-related actions taken in response to risk” (Pablo et al., 1996). Stone (1984) found that behavior involvement of a consumer can be indicated by his effort in searching, questioning, and arguing about the product and purchasing that product. Consistently, Dholakia (2001) mentioned that purchase involvement would identify the information searching and
83
information disseminating behavior of consumer. Based on this perspective, information search can be considered the major activity consumers perform when they are involved in their purchase. Gathering information about the product requires consumers to put in a lot of effort, time, and money. However, behavioral involvement is individual different like other perception such as price, risk, preference, and so on. Buyers may perceive their effort, time and expense as another sacrifice if it is difficult. In turn, would influence the perceived value of the product. However, there are no previous studies that indicate the direction of consumer effort and perceived value of the product. Therefore, the impact of consumer effort and perceived value of the product should be examined empirically.
Summary As the high involvement purchase decision is the focus of this study, while the concept of perceived value proposed by Tversky and Sattath (1979) was adopted, this chapter reviews all related constructs beginning with the purchase decision process. According to Tversky and Sattath (1979), decision makers evaluate only the value of each alternative available in their consideration set, not overall utility, or individual attributes of the product. Hence, the theory of perceived value was reviewed. The specific characteristic of perceived value is that it resulted from the trade-off between what buyers get from and give to obtaining the product (Zeithaml, 1988). The key determinants of perceived value can be categorized into two major types, give and get or, on the other hand, perceived benefits and perceived sacrifices. According to Heskett et al. (1997), Woodall (2001), and other previous studies, perceived benefits comprised four major factors: product quality, service quality, brand equity, and relationship quality while sacrifices include perceived price, perceived risk and consumer effort. Each attribute of benefit and sacrifices was discussed in detail and also some real estate contexts, real estate being the selected industry, were mentioned. Based on the analysis of related literature and previous studies, the conceptual model of this dissertation can be proposed in Figure 3.10 as follows:

84
Figure 3.10: Conceptual Framework for a High Involvement Purchase Decision
Source: Author.
Perceived Value
- Financial Value - Functional Value - Emotional Value - Social Value
Choice
Selection
Relationship Quality - Trust - Commitment - Satisfaction
Consumer Effort - Time - Effort
Product Quality - Housing Factors - Environmental Factors - Sales Service Quality
Perceived Price
Perceived Risk - Psychological Risk - Functional Risk - Social Risk - Financial risk
Brand Equity - Brand Awareness - Brand Loyalty - Brand Association - Perceived Quality
ANTECEDENTS for the Consideration Set
- Location - Price Level - Style of the House

85
CHAPTER 4
HYPOTHESES DEVELOPMENT AND RESEARCH METHODOLOGY
This dissertation is an attempt to study the consumer purchase decision process. Home buying has been selected based on the nature of the product, which is durable, expensive, immovable and infrequently purchased. These characteristics make home buying a high involvement purchase. Home buyers usually make a complex decision by evaluating and valuing each alternative before making a final choice selection (Hawkins, 2001). Based on the real estate context which is a perfect competitive market, there are so many housing alternatives for consumers. It is impossible for a consumer to consider all the alternatives that are available in the market. Therefore, the home buyer has to enter a two-stage decision process (Cahill, 1994). The potential choices will be chosen first, and then, the final choice will be made in the later stage. In the first stage, the home buyer develops a “consideration set” which is a subset of product alternatives that meet or exceed preliminary criteria set by the decision maker (Dibb, 1994). Thus, the consideration set is a reduced set of the product alternatives that are available for decision makers to select. In the second stage, one final choice will be selected from the consideration set. Based on the prospective theory proposed by Kahneman and Tversky (1979) the choice with highest value will be selected (Sweeney et al. 1997). Based on previous literature, it was discovered that consumers usually use some criteria to form a consideration set. Earlier real estate research studies indicated that the three major criteria consumers use to develop their consideration sets are location, level of the price, and style of the house (Gibler and Nelson, 2003). Additionally, simple decision rules such as the conjunctive rule, disjunctive rule, or others (see the details in Chapter 3) are expected to perform (Dibb, 1994). Home buyers gather information on broad-based environment and location variables to narrow down geographic areas for consideration. Then, information on individual housing units or project is considered.

86
Housing determinants or characteristics of the house such as price level, style, design, utility function, innovation and technology, i.e. smart home or home automation, and other housing features can influence the formation of the consideration set. If homebuyers perceive few differences between various properties of the house, they are likely to make fewer comparisons and view fewer product features (Kiel and Layton 1981). This literature implied that the initial criteria consumers use to form a consideration set are all about the housing product covering the house-related factors and its environments. Two important questions may be raised: 1) “Is the characteristic of the product only one criterion consumers consider when they develop their consideration sets?” and 2) “What decision rules do consumers use to form their consideration sets?” To answer these specifying research questions, the qualitative data on consideration set formation and the decision making process will be collected and analyzed. The antecedents and process of consideration set formation in the first stage of the purchase decision process will be indicated as a result (See Figure 3.10.). The details of data collection and analysis will be discussed in the methodology part in this chapter. In the second stage of the purchase decision process, more information will be sought externally. Then, the potential course of action associated with each alternative will be considered i.e., consumers will search for related information before evaluating and valuing each alternative. Finally, one choice will be selected. Previous literature stated that consumers may use some complicated decision rules in this stage (Alden et al., 1994). According to Kahneman and Tversky (1979), consumers make their final choice selection based on their perceived value of each alternative. Value, as the key decision factor, is viewed as the overall assessment of the utility of a product based on the trade-off of what is received and what is given in obtaining the product (Zeithaml, 1988). To create value for the product, the decision maker has to consider two sets of antecedents: benefits or what is received from buying a product and sacrifices or what is given to obtain the product. Therefore, the major research question here is “How do

87
consumers perceive the value of the product and how their perceived value do influence their choice selection?”
Hypotheses Development As proposed in the conceptual framework (See Figure 3.10.), product quality, sales service quality, brand equity, and relationship quality are considered as benefits for value creation while perceived price, risk, and consumer involvement are considered as sacrifices for value. This dissertation will explore the relationship among these benefits, sacrifices, and the perceived value of the product and also the relationship between perceived value and final choice selection. The hypotheses that are related to the research framework can be proposed in three groups. The first group will examine the direct influence of benefits and sacrifices on perceived value. The second group will focus on the mediating effect of the relationship quality on the antecedents and perceived value. The third hypothesis will focus on the relationship between perceived value and final choice selection. The details of all hypotheses can be proposed as follows:
The Influence of Benefits and Sacrifices on Perceived Value
As indicated in previous literature, consumers create their perceived value
of a product from several factors which can be categorized into two major groups: benefits and sacrifices (Zeithaml et al., 1988; Heskett, 1997). Four major constructs considered as benefits for value creation are product quality, sales service quality, brand equity, and relationship quality whereas sacrifices include perceived price, perceived risk, and consumer involvement. All four benefit and three sacrifice constructs are hypothesized as the determinants of perceived value of the product.
Since each benefit and sacrifice construct has different characteristics, as discussed in the previous chapter, the relationship between each construct and perceived value will be proposed separately. Figure 4.1 illustrates a part of research
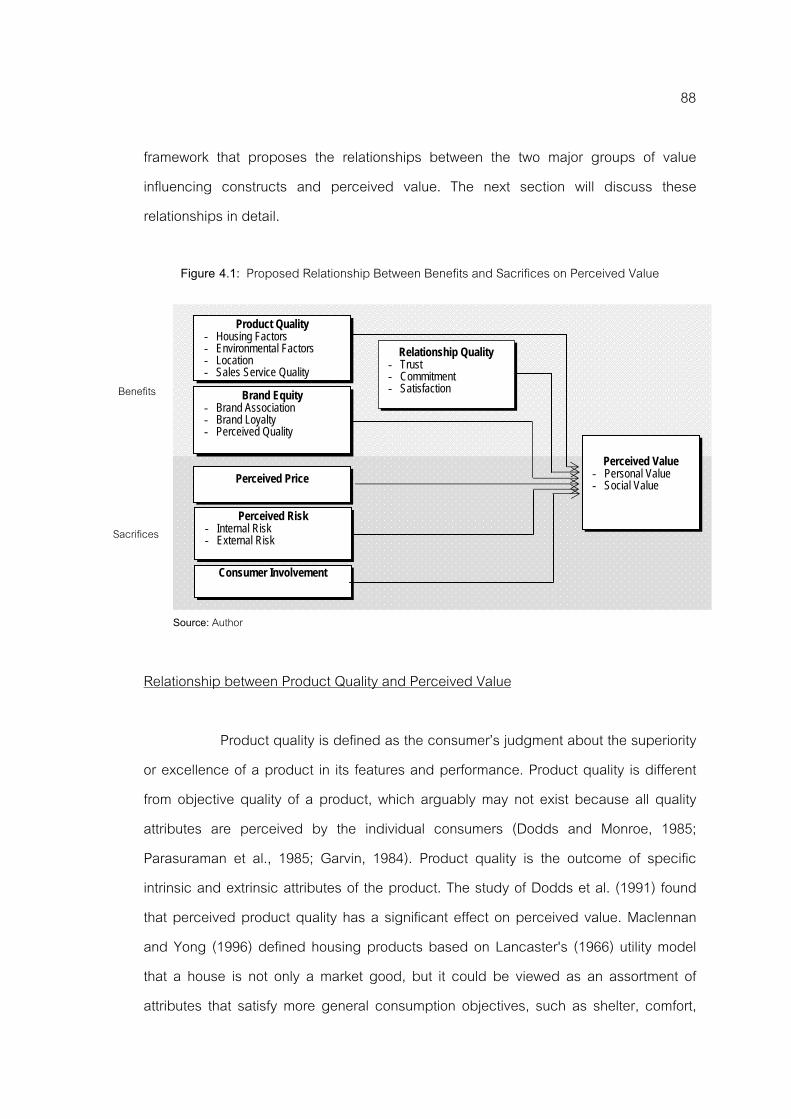
88
framework that proposes the relationships between the two major groups of value influencing constructs and perceived value. The next section will discuss these relationships in detail.
Figure 4.1: Proposed Relationship Between Benefits and Sacrifices on Perceived Value
Relationship between Product Quality and Perceived Value
Product quality is defined as the consumer’s judgment about the superiority or excellence of a product in its features and performance. Product quality is different from objective quality of a product, which arguably may not exist because all quality attributes are perceived by the individual consumers (Dodds and Monroe, 1985; Parasuraman et al., 1985; Garvin, 1984). Product quality is the outcome of specific intrinsic and extrinsic attributes of the product. The study of Dodds et al. (1991) found that perceived product quality has a significant effect on perceived value. Maclennan and Yong (1996) defined housing products based on Lancaster's (1966) utility model that a house is not only a market good, but it could be viewed as an assortment of attributes that satisfy more general consumption objectives, such as shelter, comfort,
Source: Author
Perceived Value
- Personal Value - Social Value
Relationship Quality - Trust - Commitment - Satisfaction
Consumer Involvement
Product Quality - Housing Factors - Environmental Factors - Location - Sales Service Quality
Perceived Price
Perceived Risk - Internal Risk - External Risk
Brand Equity - Brand Association - Brand Loyalty - Perceived Quality
Benefits
Sacrifices
89
aesthetics and accessibility. Housing product quality is composed of two dimensions, housing quality and environmental quality (Bender et al., 1998). Housing factors, defined as the housing product attributes, are characterized as the housing objects, including design, size, space utility, privacy, and so on (Baum,1994) while environmental factors are defined as a set of externalities or environmental amenities, cover location, proximity to open areas, attractive views, public facilities, and so on (Bender, 2000). Portnov et al. (2005) proposed different dimensions of housing product quality as social and physical factors instead of housing and environmental factors. However, all Portnov’s details of social and physical attribute are not different from that of Bender (2000) and Baum (1994), just different categorizations. Portnov et al. (2005) found that all housing attributes are perceived as property characteristics and the quality of environmental factors and building characteristics highly affect consumers on their perception of property values. Besides this, Plaut and Plaut (2003) found that the physical size of the house and its environmental characteristics, such as the number of rooms, location, etc. influence the perceived value of the house. Sungur and Cagdas (2003) found some housing elements such as housing system, greenery, cleanliness, landscape view, location, low traffic level, and construction quality, strongly influence the monetary value of the house. Yizhak et al. (2003) indicated that unfavorable environmental conditions might lead to a lower level of perceived value of the house. In contrast, favorable environmental conditions are likely to lead to a higher level of perceived value of the house. Based on these studies, it can be implied that there is a relationship between housing attributes and perceived value. However this relationship hasn’t been directly examined. In this research, the relationship between product and perceived value will be examined by focusing on the quality of the product instead of the actual product characteristics and features to avoid the problem of the differences of needs across consumers. Thus, the perceived value of a house is expected to be influenced by the perceived quality of the product which can be hypothesized as follows:
Hypothesis 1: Product quality is positively related to the perceived value of the house.

90
However, product quality is comprised of three dimensions: environment, housing factors and location. These two dimensions of product quality have their independent characteristics. The influences of each dimension on perceived value may be unequal. Thus, the related hypotheses can be proposed as follows:
Hypothesis 1a: The quality of housing factors is positively related to the perceived value of the house.
Hypothesis 1b: The quality of environment is positively related to the perceived value of the house.
Hypothesis 1c: The quality of location is positively related to the perceived value of the house.
Relationship between Sales Service Quality and Perceived Value Heinonen (2004) found that service quality reflects the “value received.” A product is perceived as having a high value as expressed by customer satisfaction, if the service delivered with the product is reliable. This is because consumers perceive that service provided by the firms’ representatives is part of the quality of the product offered by the firm. Consumers perceive value as the direct function of service experience. This means that the perceived value is directly determined by the service experience which either adds or subtracts value to customers’ perceptions (Tseng et al., 1999). As a result, perceived value can be either positively or negatively influenced by service quality since customer found that both functional and technical service quality influence perceived value of the product and, then, lead to willingness to buy (See figure 3.1). Liljander and Strandvik (1995) recommended that service quality is a key determinant of value. Additionally, the service management literature stated that perceived value results from an evaluation of the expected and experienced service (Grönroos, 1988; Parasuraman et al., 1985). In a home buying situation, the service that home buyers receive is sales service quality. The real estate salesperson plays the roles of information provider and seller. Darian et al. (2001) found in the sales context that the most important attribute of

91
sales service quality is respect for the customer; the second is the salesperson’s knowledge about the product and the third is the salesperson’s responsiveness and friendliness while the last important attribute is salesperson availability. The findings of Darian’s study implied that the five dimensions of service quality (Parasuraman et al. (1985) can be viewed as one aggregate factor which is sales service quality if all important service attributes are covered. Based on this evidence, service quality adapted from Parasuraman et al. (1985) will be proposed as one construct while its five dimensions including tangibility, reliability, responsiveness, assurance, and empathy will not be focused on separately. Since the service quality was found to influence perceived value (Sweeney et al., 1997; Liljander and Strandvik, 1995; Grönroos, 1982), sales service quality is also expected to influence perceived value of a housing product. Thus, the hypothesis can be proposed as follows:
Hypothesis 1d: Sales service quality is positively related to the perceived value of the house.
Relationship between Brand Equity and Perceived Value
Brand equity has been described as the set of brand assets and liabilities linked to a brand that augment or diminish the value of a good or service to a firm and its customers (Aaker, 1991). Aaker (1991) suggested the brand value is the outcome of brand equity. The individual brand name represents the unobserved and unmeasured intrinsic value of the brand. By definition, brand equity is considered as a factor that increases perceived value of a product i.e., comparing two products with the same product and sales service quality, the product with higher brand equity would earn more value. Kerin and Sethuraman (1998) found that there was a fairly strong positive relationship between brand and value of the firm in the American consumer products industry. Their results clearly provide support for the theory that the development of successful brands brings about improvements in perceived value toward products.
Aaker (1991) also proposed his brand equity model explaining the relationship between brand equity and value. His model indicated that both firm and customer value are enhanced by the level of brand equity. Brand equity adds value to

92
the product, makes the product superior, and enhances a consumer’s willingness to buy and pay for a premium price. According to Aaker (1991), brand equity directly leads to both value of the firm and value to customers. Consumers would perceive the product with high brand equity to have more value than those with lower brand equity. Aaker’s theory was empirically confirmed by a recent study by Myers (2003) who found the impact of brand equity on choice process. Comparing various products with the same price and product attributes, consumers give more value to the product with higher brand equity and they are more likely to purchase that product. However, Myer’s study (2003) was focused on soft drinks, a non-durable and low involvement product; its generalizability has not been proved. Although the real estate context emphasized in this research is excessively different from the consumer product, the same relationship between brand equity and perceived value is expected. Thus:
Hypothesis 2: Brand equity of the real estate firm is positively related to the perceived value of the house.
Relationship between Relationship Quality and Perceived Value
Relationship quality is defined as the degree of appropriateness of a relationship to fulfill the needs of the customer associated with that relationship (Henning-Thurau et al., 1997). To conceptualize relationship quality, Crosby et al. (1991) viewed relationship quality as the salesperson’s ability to reduce perceived uncertainty. The important function of relationship quality is not only to reduce uncertainty but also to enhance interaction efficiency between the customer and firm and fulfill the social needs of the customer which leads to commitment to a salesperson and firm. As relationship quality is viewed as a multidimensional construct, various dimensions of relationship quality were proposed in several previous studies. The three core dimensions of relationship quality, which are 1) trust in the salesperson and firm, 2) commitment to salesperson and firm, and 3) satisfaction with the salesperson and firm, were illustrated (Roberts et al., 2003). Trust is defined here as the willingness to rely on an exchange partner in whom one has confidence (Anderson & Narus, 1990), while commitment is

93
defined as a customer’s long-term ongoing orientation toward a relationship grounded on both an emotional bond to the relationship (affective aspect) and on the conviction that remaining in the relationship will yield higher net benefits than terminating it (Young & Denize, 1995). Satisfaction is the confirmation or disconfirmation of expectations associated with the service or product experience. In addition, Gummesson (1987) categorized relationship quality into two levels of relationships; person-to-person indicated an interpersonal relationship between customers and the salesperson and person-to-company represented a relationship between customer and the firm. Gummesson (1987) found that these two categorizations of relationship quality facilitate more understanding of the different dimensions and attributes of relationship quality.
Morgan & Hunt (1994) found that trust and commitment lead directly to cooperative behaviors of consumers. Customers who have developed a relationship with a firm would perceive the product and service to be more satisfactory. The buyers’ trust in and commitment to salespersons is largely based on friendships that occur between the buyer and service providers or sellers (Panda, 2003). Long term relationships with the firms can enhance some psychological benefits for consumers. Most consumers develop a feeling of comfort and security in having a relationship with the firm. Trust and confidence in the firm appear to develop over time after a relationship between the customer and the firm has been established. According to the motivation model for developing relationships with businesses, the economic benefits that customers receive for engaging in relational exchanges are both monetary and time saving (Peterson, 1995). The benefits consumers receive from high- quality relationships in both person-to-person and person-to-company would influence consumers to perceive the product offered by the firm to have higher value. Therefore, high-quality relationships, that is, high levels of trust, commitment, and satisfaction would lead to a high level of perceived value of the product. However, the pretest results indicated that the three core dimensions - trust, commitment and satisfaction - in two levels - personal and firm level - should be combined into three dimensions which are 1) personal trust in real estate salesperson, 2) personal commitment on salesperson and 3) relations to real

94
estate firm. Therefore, these three dimensions are focused in this dissertation in which each of them is hypothesized as antecedent of the perceived value. Thus:
Hypothesis 3: Relationship quality with the real estate firm is positively related to the perceived value of the house.
Hypothesis 3a: Personal trust in a real estate salesperson is positively related to the perceived value of the house.
Hypothesis 3b: Personal commitment to a real estate salesperson is positively related to perceived value of the house.
Hypothesis 3c: Relationship to real estate firm is positively related to the perceived value of the house.
Relationship between Perceived Price and Perceived Value
Monroe (1990) regarded product quality and perceived sacrifice as antecedents to perceived value from his empirical exploring of the antecedents of perceived value. He also viewed sacrifice as influenced by perceived price. From the consumer’s perspective, price is what is given up or sacrificed to obtain a product. Many previous research studies supported the distinction between objective and perceived price (Allen et al., 1976). Allen’s studies revealed that most consumers could not remember actual prices of products. Instead, consumers encode prices in ways that are meaningful to them (Dickson and Sawyer, 1985). Perceived price is often defined as the consumer’s perception of the product’s price compared to other products with similar specifications, and it is measured by comparing the price of the good to those of other goods with equivalent features. Perceived price is also affected by consumer’s intention to invest (Gabriel, 2001) which is also associated with the affordability of buyers. Therefore, to study the relationship between price and value, perceived price of the house will be used instead of the actual price.
Perceived price is expected to influence the value of the product. Moreover, perceived price is also associated with some price-related factors such as buyer’s affordability, price comparison i.e., the price level that is relatively cheaper than that of

95
competitors, interesting sales promotional campaigns, and economical payment (Glaeser et al., 2001). Dodds et al. (1991) found price to have a negative effect on a product’s value for money. The study of Dodds et al. (1995) confirmed that as price increases, buyers assume an increase in product quality and monetary sacrifice. The higher the quality of a product, the higher the value it is given. Therefore, the hypothesis can be proposed as:
Hypothesis 4 Perceived price has an influence on perceived value. Relationship between Perceived Risk and Perceived Value
Risk is defined as a situation associated with unsatisfactory product performance (Hawkins, 2001). Risk in a purchase decision situation is a two-dimensional construct comprising the uncertainty involved in a purchase decision and the consequences of taking an unfavorable action (Bettman, 1973). Greatorex and Mitchell, (1993) explained the role of risk in purchase decisions that if the degree of risk is less than consumers’ concern, that risk is ignored but if the risk exceeds the acceptable level, consumers would consider not buying that particular product. This is because the risk may potentially lead to negative outcomes (Dholakia, 2001). Even though there are many studies that focused on the relationship between risk and decision making, very few studies examine the relationship between risk and perceived value of the product especially risk in buying a house. The negative effect of perceived risk on perceived value is hypothesized as:
Hypothesis 5: Perceived risk is negatively related to the perceived value of the house.
Risk is theorized to be made of four dimensions: psychological, social,
functional, and financial risk (Jacoby and Kaplan, 1972). However, psychological and functional risk shares their common characteristics as they are based on buyers’ internal factors while social and financial risks are related to the external factors. Thus the two dimensions of risk can be used in this research as internal and external risk.

96
For the real estate industry, the housing products appear to be different from other products in that it is immoveable, durable, high involvement and expensive, the inherent risk of buying a house is due to the uncertain utility of a house, quality of its environment, and also financial uncertainty. Moreover, the uncertainty of information obtained from a salesperson, who is the representative of the firm, is usually questionable, whether it is reliable and trustable. The inferior construction quality of the house based on cheating on construction materials, the time the product is delivered, other paid money, and so on would induce the perceived risk of buying a house. In the Thai real estate context, most new houses, both ready-to-live-in and made-to-order that are currently available in the market are not perfectly constructed (See the details in Chapter 2). For the made-to-order house, the buyers could see only the location and housing plan on paper, the actual house could not be inspected at the decision time. Therefore, the buyers may perceive this type of house as high risk. For the ready-to-live-in house, the house is about 80-90 percent constructed at the decision time. Buyers can see the actual house, but most are still under construction. At least, some decoration materials such as floor tiles, carpet, flooring wood, wall paper, and so on are not yet installed. This makes it impossible for buyers to see the finished product before buying it and more importantly the structure of the house cannot be inspected because it has already been constructed. So, buying a new house in Thailand is generally regarded as psychological and functional risky. As these risks are considered to be related to consumers’ internal factors, home buyers are exposed with the internal risk, not matter which type of house they select. Thus, the value of the product would be related to the level of internal risk as:
Hypothesis 5a: Internal risk is negatively related to the perceived value of the house.
Houses that are located in the same area may offer different prices since
the price is related to construction, land developing cost, the brand of the real estate developer, and also market demand (Nelson et al., 2002). In order to judge whether the price of a house offered by a real estate firm is reasonable, home buyers have to search

97
for pricing information and make a comparison on their own. Besides, different real estate developers usually offer various sales promotional campaigns that require consumers to judge which one provides the best benefit for them. Consumers may experience some uncertainty in judging this issue. The uncertainty of the price and the efficiency of a sales promotion may lead consumers to experience some financial risk. Hence, financial risk would impact the home buyers to negatively value the house.
Another concern of consumers on buying a house is about the social reaction. The acceptance from friends, co-workers, and relatives on the selected house is critical to the home buyer since some attributes of the house such as location, sizing, and brand of the real estate developer or housing project could represent their social class. Therefore, the perception on financial and social risks would influence the value of the product. However, as financial and social risks are regarded as external risk, the following hypothesis can be proposed as:
Hypothesis 5b: External risk is negatively related to the perceived value of the house.
Relationship between Consumer Involvement and Perceived Value
Consumer involvement refers to the non-emotional investments including time, effort, and the related expense sacrificed by the consumers (Baker et al. 2002). The utilitarian theory explains that consumers would achieve their information search and buying process with minimum investments in time and effort. To improve utilitarian shopping value, consumers must apply time saving and put less effort in the buying process (Hoffman et al., 1999). In this point of view, the time and effort required for a purchase situation would reduce the perceived value of the product. If time and effort is considered as an investment, a negative relationship between consumer involvement and perceived value would be expected. In contrast, the shopping literature indicated that consumers also experience positive feelings from their information search which is called “hedonic shopping benefits” (Babin and Darden, 1995). The hedonic feeling consumers derive from the shopping process would lead consumers to experience a

98
higher emotional value toward the product (Sheth et al., 1991). In this respect, the time and effort would entertain the consumer and increase their enjoyment. Therefore, the positive relationship between consumer involvement and value should be illustrated. Since there are two different points of view in the direction of relationship between consumer involvement and perceived value, the direction of the related hypotheses on this construct should not be proposed. Thus:
Hypothesis 6: Consumer involvement is related to the perceived value of the product.
Mediating Effects of Relationship Quality on Perceived Value and Its Antecedents
As presented in the proposed research model (Figure 3.10), relationship quality is positioned as a mediating variable, i.e. mediating the relationships between perceived value and some perceived benefits and sacrifices as illustrated in Figure 4.2.
Figure 4.2: Proposed Mediating Effects of Relationship Quality
Perceived Value - Personal Value - Social Value
Relationship Quality - Trust - Commitment - Satisfaction
Consumer Involvement
Product Quality - Housing Factors - Environmental Factors - Location - Sales Service Quality
Perceived Risk - Internal Risk - External Risk
Brand Equity - Brand Association - Brand Loyalty - Perceived Quality
Benefits
Sacrifices
Source: Author

99
The role of relationship quality and its three core dimensions of trust, commitment, and satisfaction are not only determinants of perceived value as proposed in Hypothesis 3, but can play a mediating role between perceived value and some of its antecedents. As discussed in the development of Hypothesis 3, the quality of relationship is expected to influence perceived value. However, relationship between consumer and the firm or the firm’s representatives is developed based on the perception of consumers on the product, service, and brand (Hennig-Thurau and Klee, 1997). In addition, quality of the relationship is based on the reliability of the overall quality of the product including the perception of the brand or the reputation of the firm that offers the product. Since relationship quality is a result of the overall product and brand quality and relationship quality influences perceived value, relationship quality is said to play a mediating role between all product benefits and perceived value. In contrast, perceived risk and consumer involvement which are considered as the factors sacrificed to obtain the product were found to relate to trust in and commitment to the product and the firm (Broekhuizen, 2006). As trust and commitment are the core components of relationship quality, the relationship quality would mediate the relationship between perceived value and risk and effort. The details can be discussed in the two following parts. The Mediating Effect of Relationship Quality on Perceived Benefits and Perceived Value
The overall quality of the product that has an impact on relationship quality includes product quality and sales service quality. Crosby et al. (1990) indicated that service quality can be considered as a necessary but not sufficient condition for relationship quality. The reason was about the longevity of the relationship. Satisfying exchange episodes are likely to lead to an enduring buyer-seller relationship if these exchanges are done so in a way that pleases the customer. So the high quality of service would satisfy the customers and make customers maintain a long term relationship with the firm (Grönroos, 1991). Product quality is another factor that
100
influences the quality of the relationship. When the quality of the product and service is high, consumers would experience satisfaction. Hennig-Thurau and Klee (1997) found the positive effect of consumer satisfaction on commitment and trust in the product and the firm that offers the product. Customer satisfaction results from a comparison of the customer’s expectations with the evaluation of a single product and service encounter. The high quality of the product leads to customer satisfaction. For trust, in the early stage of developing a relationship between a firm and consumers, the overall quality plays a role as the predominant source for the development of the relationship (Anderson & Sullivan, 1993). In the next stage, a consistent sequence of positive experiences that the firm kept its promise by providing the expected performance may lead to the development of trust through the aforementioned process of generalization to future transactions (quantitative aspect) and other relational fields (qualitative aspect) (Moorman et al., 1992). Therefore the overall quality of the product is related to trust. The trust can be developed at the person-to-person and person-to-company level. In addition, a high level of overall quality leads directly to cognitive and affective dimensions of commitment. A high level of quality provides the customer with repeated positive reinforcement and creates emotional bonds between consumers and the product. If the buying process involves person-to-person-interactions, i.e. personal contact with the salespersons, that overall quality includes sales service quality would fulfill buyer’s social needs connected with a product as reflected in the ‘responsiveness’ and ‘empathy’ and other dimensions of the SERVQUAL scale (Brown and Bond, 1995). A repeated fulfillment of these social needs is likely to lead to bonds of an emotional kind that constitute the affective dimension of commitment (Hennig-Thurau and Klee, 1997). Thus, overall quality, including product and sales service quality, affects all dimensions of relationship quality. As relationship quality influences perceived quality, the mediating effect of relationship quality on the relationship between overall quality and perceived value is expected. Thus:
Hypothesis 7: Relationship quality mediates the relationship between product quality and the perceived value of the house.

101
Hypothesis 7a: Relationship quality mediates the relationship between sales service quality and the perceived value of the product.
Based on the relationship marketing concept, it is unlikely for a company to
develop personal relationships with each consumer since there are too many anonymous consumers in the consumer market. Thus, the company creates a brand and induces its consumers to develop a relationship with the brand, which becomes a substitute for human contact between the company and its customers (Sheth and Parvatiyar, 1995). Hiscock (2001) suggested that the main ingredient of the bond between a consumer and a firm is trust. MacLeod (2000) considers the vocabulary of modern brand building uses words associated with personal relationship; one important word popularly mentioned by consumers is also trust. Consistently, Blackston (1992) found trust to be one component of consumers’ relationships with brands. Therefore, trust can be said to be a key construct developed through the relationship between consumers and the brand. Chaudhuri and Holbrook (2001) indicated that the unique value perceived in a brand by consumers is associated with trust with that particular brand. As trust refers to the perceived credibility and benevolence of consumers (Doney and Cannon, 1997), relationships that are characterized as high trust are highly valued by exchange participants. Since brand equity is the overall asset of the brand, trust would play a mediating role between brand equity and perceived value. Based on trust, consumers would perceive the firm as honest, believable, and low risk. As a result, commitment consumers have for the firm would be extended (Moorman et al., 1992). The high level of brand equity is likely to lead to high levels of trust, commitment to the relationship, and overall perceived relationship quality (Moorman et al., 1992; Morgan and Hunt, 1994). If the quality of the relationship with the firm is high, the overall value of a product offered by that firm would be perceived as high. Thus, brand equity leads to relationship quality and the relationship quality leads to the perceived value of the product. Moreover, relationship quality mediates the relationship between brand equity and perceived value. Thus, the following relationship is expected:

102
Hypothesis 8: The relationship between brand equity of the real estate firm and the perceived value of the house is mediated by the relationship quality.
Hypothesis 8a: The brand equity of the real estate firm is positively related to personal trust in salesperson.
Hypothesis 8b: The brand equity of the real estate firm is positively related to personal commitment on salesperson.
Hypothesis 8c: The brand equity of the real estate firm is positively related to relations to real estate firm.
Trust and risk are closely interrelated (Mayer et al., 1995). Stewart et al.
(2001) explained that trust is the subjective probability with which consumers believe that a buying transaction will occur in a manner consistent with their confident expectations. So trust in salespersons would reduce the buyer’s perception of risks on that purchase situation (Jarvenpaa et al., 1999). Consistently, Berry (1995) found risk to be related to trust. Doney and Cannon (1997) indicated the reputation and size of a business firm is related to consumers’ willingness to maintain the relationship with the firm. Perceived risk is an antecedent for trust and an outcome of trust building is a reduction in the perceived risk of the transaction or relationship. Thus if relationships develop and trust builds, risk will decrease (Mitchell, 1998). The consequence of the related perceived risk and trust would, in turn, influence consumers’ perceptions of the product value and also their purchase decisions. Trust in either the firm or salesperson can influence perceived risk. Since risk is expected to be negatively related to the perceived value of the product as proposed in Hypothesis 6, it would be reduced by trust. Therefore, the effects of trust and risk on the perceived value of the product should be considered simultaneously. Thus:
Hypothesis 9: Relationship quality mediates the relationship between perceived risk and the perceived value of the product.

103
Additionally, if consumers have high levels of trust for the firm or salesperson, consumers are expected to give more credibility to the information received from the sales persons and the firm. Therefore, consumer would put less effort in searching for more information from other external sources. Therefore, consumer involvement is expected to be negatively related to trust. As such, the related hypothesis can be proposed as:
Hypothesis 10: Relationship quality mediates the relationship between consumer involvement and the perceived value of the product.
Relationship between Perceived Value and Choice Selection
Consumer values are reflected in purchase behaviors, i.e., final choice selection. Walter et al., (2001) empirically confirmed Kahneman and Tversky (1979) that value rests in the perceptions of decision makers and can clearly impact their choice selection. Millward Brown IntelliQuest's1 (2006) proposed the brand loyalty model explaining the three hierarchies of the development of consumer loyalty as shown in Figure 4.3.
Figure 4.3: Hierarchical Model of Customer and Loyalty
1 Millward Brown IntelliQuest's is a private company providing information-based marketing
services. It can be reached at http://mbinteractive.com/home/.
Source: Millward Brown IntelliQuest's, 2006

104
The underlying theory of the model indicated that the choice selection is directly influenced by customers’ perceived value of the product. The perceived value is driven by product and sales service quality, brand, and price. High perceived value would motivate consumers to be loyal to the firm. The important point is not only how consumers develop their perceived value of the product but also their potential behaviors resulting from the perceived value. This explanation is consistent with that of Sweeney (1997) (see Figure 3.1) who indicated that perceived value directly impacts consumer’s willingness to buy. Therefore, for the prospective home buyers:
Hypothesis 11a: Perceived value of a house influences a consumer’s purchase intention.
In a high involvement purchase situation, the comparisons of the total value
of each choice would be done while the highest value choice selection is expected to be selected. If the recent buyers select their final choice based on the value, not the individual attributes of the product such as brand or price level, they would perform the same value formation process. Hence, there is no doubt that perceived value influences a choice selection if all buyers perform the same value formation process even though the products they selected are different. Thus, for the recent home buyers:
Hypothesis 11b: Value formation process of home buyers who choose different types of product i.e. different brand and price level are not different.
Differences in Importance of Criteria between More and Less Experienced Home Buyers
Dabholkar and Bagozzi (2002) argue that most studies tend to study the direct effects of external factors. Many researchers such as Baron and Kenny (1986), Mittal and Kamakura (2001), and also Dabholkar and Bagozzi (2002) suggest that it would be much more meaningful to investigate the moderating effects of external factors, such as consumer traits and situational influences especially prior experience of the buyers. Prior research suggested that the nature and strength of relationships between value-influencing constructs may change during the various stages of a

105
customer’s familiarity or experience with a company (Parasuraman, 1997; Parasuraman and Grewal, 2000; Woodruff, 1997). Bolton (1998) addressed that the relationship between cumulative satisfaction and retention is enhanced by the level of experience customers have with the continuous service provider. In other words, more experienced customers rely stronger on their cumulative satisfaction – compared to those who have less experience– as they can rely more strongly on their own experiences. Past research also suggested that the level of experience with a retailer can moderate the relationships between important relational constructs and also the antecedents of user adoption and use of an information technology (IT) change with experience (Karahanna et al., 1999). In sum, there was evidence that the level of prior experience may act as a moderator of the relationships in the conceptual model since customers may have different weights of the antecedents of value. However, most prior researches were done in service industry and non-durable with low involvement products which is different from the product focused in this current research. Thus, the moderating effect of prior experience might or might not be consistent in the real estate context. In the real estate context, Harris (2001) compared the first-time and repeated home buyers and found only some different reasons home buyers used in their home buying while the previous studies on the value formation of first-time and non first-time home buying process could not be found. Therefore, the moderating influence of prior home buying experience would be examined. Hence, the impact of prior experience of home buying is hypothesized as follows:
Hypothesis 12: Prior home buying experience influences a consumer’s choice selection.
The summary of all proposed hypotheses is presented in Table 4.1
Table 4.1: List of Hypotheses
Hypothesis No. /Construct Hypotheses Expected Direction
H1 Product Quality Perceived Value Product quality is positively related to the perceived value of the house.
Positive
H1a Housing Factors Perceived Value The quality of housing factors is positively related to the perceived value of the house.
Positive
H1b Environment Perceived Value The quality of environment is positively related to the perceived value of the house.
Positive
H1c Location Perceived Value The quality of location is positively related to the perceived value of the house.
Positive
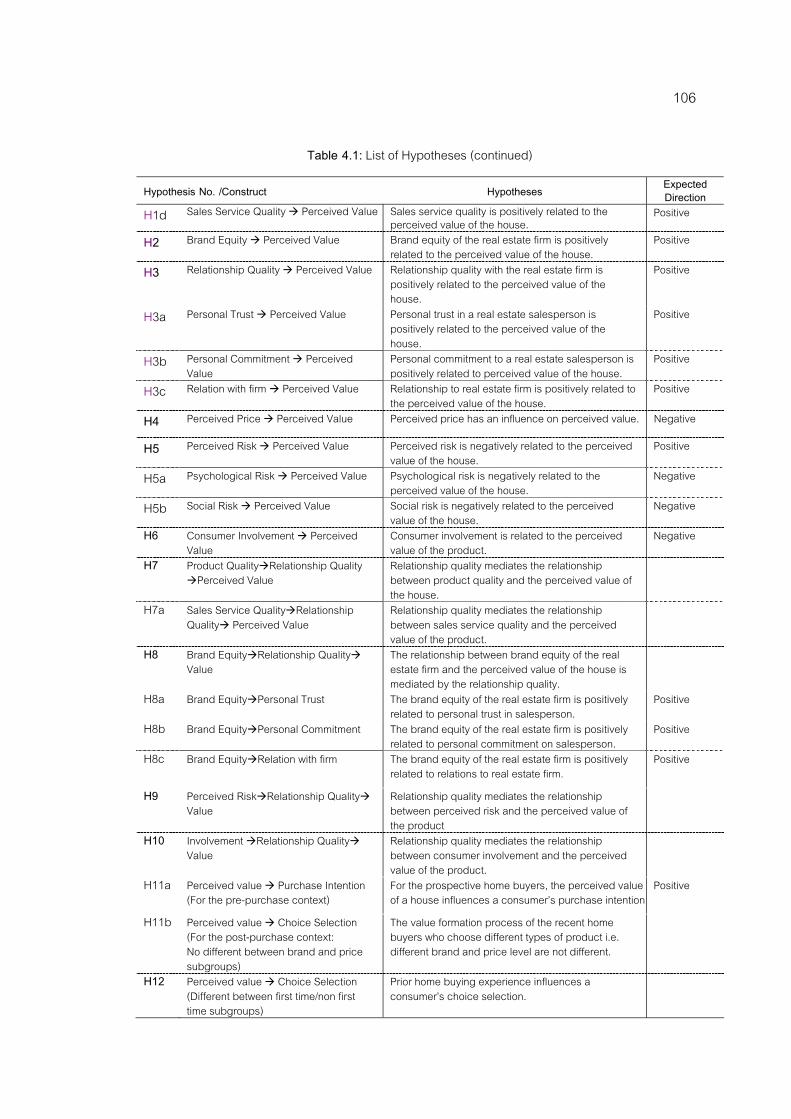
106
Table 4.1: List of Hypotheses (continued)
Hypothesis No. /Construct Hypotheses Expected Direction
H1d Sales Service Quality Perceived Value Sales service quality is positively related to the perceived value of the house.
Positive
H2 Brand Equity Perceived Value Brand equity of the real estate firm is positively related to the perceived value of the house.
Positive
H3 Relationship Quality Perceived Value Relationship quality with the real estate firm is positively related to the perceived value of the house.
Positive
H3a Personal Trust Perceived Value Personal trust in a real estate salesperson is positively related to the perceived value of the house.
Positive
H3b Personal Commitment Perceived Value
Personal commitment to a real estate salesperson is positively related to perceived value of the house.
Positive
H3c Relation with firm Perceived Value Relationship to real estate firm is positively related to the perceived value of the house.
Positive
H4 Perceived Price Perceived Value Perceived price has an influence on perceived value. Negative
H5 Perceived Risk Perceived Value Perceived risk is negatively related to the perceived value of the house.
Positive
H5a Psychological Risk Perceived Value Psychological risk is negatively related to the perceived value of the house.
Negative
H5b Social Risk Perceived Value Social risk is negatively related to the perceived value of the house.
Negative
H6 Consumer Involvement Perceived Value
Consumer involvement is related to the perceived value of the product.
Negative
H7 Product Quality Relationship Quality Perceived Value
Relationship quality mediates the relationship between product quality and the perceived value of the house.
H7a Sales Service Quality Relationship Quality Perceived Value
Relationship quality mediates the relationship between sales service quality and the perceived value of the product.
H8 Brand Equity Relationship Quality Value
The relationship between brand equity of the real estate firm and the perceived value of the house is mediated by the relationship quality.
H8a Brand Equity Personal Trust The brand equity of the real estate firm is positively related to personal trust in salesperson.
Positive
H8b Brand Equity Personal Commitment The brand equity of the real estate firm is positively related to personal commitment on salesperson.
Positive
H8c Brand Equity Relation with firm The brand equity of the real estate firm is positively related to relations to real estate firm.
Positive
H9 Perceived Risk Relationship Quality Value
Relationship quality mediates the relationship between perceived risk and the perceived value of the product
H10 Involvement Relationship Quality Value
Relationship quality mediates the relationship between consumer involvement and the perceived value of the product.
H11a Perceived value Purchase Intention (For the pre-purchase context)
For the prospective home buyers, the perceived value of a house influences a consumer’s purchase intention
Positive
H11b Perceived value Choice Selection (For the post-purchase context: No different between brand and price subgroups)
The value formation process of the recent home buyers who choose different types of product i.e. different brand and price level are not different.
H12 Perceived value Choice Selection (Different between first time/non first time subgroups)
Prior home buying experience influences a consumer’s choice selection.

107
To understand the entire process of the purchase decision, the conceptual framework for a high involvement purchase decision is proposed. Based on the decision making theory, the two-stage purchase decision is selected in order to understand the entire process of decision making. The consideration set is expected to develop in the first stage by using simple decision rules with some important decision criteria. Then the information associated with the choices that are available in the consideration set will be sought. The value of each choice will be derived and compared. Then, the choice with the highest value will be selected as the final choice.
To understand this process clearly, the development of perceived value is studied. Based on the theoretical foundation of value, perceived value results from the trade-off between benefits buyers receive from the product and the factors buyers sacrifice to obtain that product. Therefore, the determinants of value can be divided into two groups, the benefits which are expected to relate positively to value and sacrifices which would be negatively related to value. The factors considered as benefits are product quality, sales service quality, brand equity, and relationship quality while perceived price, perceived risk and consumer involvement are proposed as sacrifices. However, the relationship quality has specific characteristics that mediate relationships between perceived value and other determinants. Therefore, both the direct relationship and mediating relationship among variables were proposed. The dimensions of each variable and direction of relationship among variables are illustrated in the research framework as shown in Figure 4.4.
The research framework covers both stages of decision making, the formation of the consideration set and the choice selection. According to the characteristics of each stage that are different by nature, the research methodologies designed for each stage are different. Qualitative data collection and analysis will be applied to answer the research questions regarding the consideration set formation, as discussed in the beginning of this chapter. Then the hypothesized relationships among all constructs related to the choice selection will be tested empirically. The details of the research methodology will be presented in the next part.

108
Figure 4.4: Conceptual Framework for a High Involvement Purchase Decision
Source: Author
+ ve
- ve
-ve
- ve
+ ve
+ ve
+ ve
- ve
- ve
Perceived Value
- Personal Value - Social Value
Choice
Selection
Relationship Quality - Personal Trust - Personal Commitment - Relations with firm
Consumer Involvement
Product Quality - Housing Factors - Environmental Factors - Location - Sales Service Quality
Perceived Price
Perceived Risk
- Internal Risk - External Risk
Brand Equity - Brand Association - Perceived Quality - Brand Loyalty
ANTECEDENTS of the Consideration Set
- Location - Price Level - Style of the House - Etc.
1st Stage of Purchase Decision Process 2nd Stage of Purchase Decision Process

109
Research Methodology Even though the proposed research framework is a generic model, the real
estate context or home buying situation has been selected to control the potential problem of different product types varying the details of the buying process. To understand the process of consideration set formation and the construction of consumer perceived value and its impact on choice selection, seven specifying research questions can be derived from the conceptual framework:
1. What are the key attributes consumers use in developing a consideration set?
2. How do consumers develop their perceived value for each choice? 3. What are the key determinants for value creation? 4. What are the relationships among those determinants? 5. How does perceived value affect the final choice selection? 6. How brand affects consumer decision? 7. What are the specific characteristics of perceived risk in home buying
process? 8. Do the effects of the antecedents of perceived value and purchase decision
differ between experienced and less experienced customers?
The major variables proposed in the research framework can be categorized into three groups: 1) the dependent variables which are the perceived value and final choice selection; 2) independent variables include all benefit and sacrifice factors i.e. product and sales service quality, brand equity, perceived price, perceived risk, and consumer involvement; and 3) mediating variable which is the relationship quality. To answer all the research questions, many research methods are used. The discussion on research methodology is organized into fourfold: 1) research design will 2) population, sample, and sampling; 3) survey research tool including questionnaire development and pretest results; and 4) data collection methods and data analysis plan. The details of each part are as follows:

110
Research Design
This study is a descriptive research consisting of three major means to collect data, a depth interview, focus group discussion, and cross sectional survey. The triangulation of data collection was designed to gather meaningful, accurate, and sufficient data. A three-stage research study consisting of exploratory research, qualitative research design and survey research were designed.
Exploratory research was conducted to understand the nature of the purchase decision process and the context of the real estate industry. The literature was first reviewed. Then an experience survey with real estate professionals was conducted. A series of semi-structured interview guide was prepared and depth interviews with five real estate professionals were performed (See Appendix A for the interview guide.). The scope of the interview covered the background of real estate business in Thai context including types of products, pricing factors, marketing strategies, and also the consumer purchase decision process in business operators’ point of view. Door-to-door personal interviews with telephone appointment were performed.
The qualitative method was designed to uncover information about 1) the major antecedents for consideration set formation and 2) decision rules performed in this stage of the decision. Ten focus group interviews were conducted (See Appendix A: discussion guide). The target samples for this part were 71 recent home buyers. Ten focus group discussions categorized by two criteria, the brand of real estate developers and price level, were designed. The participants in each group were characterized as:
Group 1-2: Consumers who each bought a house of less than five million baht from the same real estate firm.
Group 3-4: Consumers who each bought a house of at least five million baht from the same real estate firm.
Group 5-7: Consumers who each bought a house of less than five million baht from any real estate firm.
Group 8-10: Consumers who each bought a house of five million baht or more from any real estate firm.

111
The scope of the focus group discussion covered the purchase decision process including the factors influencing their decisions, detailed procedures, and sequences of purchase behaviors. The similar and different thoughts and behaviors individual participants had and performed were gathered and analyzed. The group process can be divided into three stages; firstly, the rapport and relaxing climate was created to make all participants feel comfortable. The pertinent information about the research i.e. the objectives, confidentiality of the data, steps of the group process was explained. In the second stage, the interview and conversation started with broad questions and becomes more specific as the interview progresses. The researcher had also identified those terms that were common to the interviewers and the culture under study as well as those terms that had multiple or divergent meanings. Furthermore, questions were carefully worded to obtain pertinent information because respondents were consumers who might not be familiar with the academic terminologies. In the final stage of the group process, the researcher debriefed the participants by reviewing and summarizing what the researcher understands to be the important parts of the interview and also gave respondents ample opportunity to clarify or refine aspects that might cause confusion or dissatisfaction. Survey design: A cross sectional survey with recent home buyers was designed. A “Home Buying Survey” questionnaire was developed and used as a major research tool to collect data quantitatively. The details of survey procedures will be discussed in the later in this chapter. Population, Sample, and Sampling
Target Population and Population Element Home buyers were selected as the target population for this study. The unit
of analysis was the individual home buyer. However, the two types of home buyers were specified according to their home buying context i.e. pre and post purchase decision. For the post purchase context, the recent home buyers who bought a single detached

112
house from any housing project in Bangkok and its vicinity (Samutprakarn, Nonthaburi, Patumthani) were included. For the pre-purchase context, the prospective home buyers who were seeking for a house were focused. The houses specified by both recent and prospective home buyers must be a single detached house offered by real estate developers with the unit priced at three million baht or more in order to control over the possible effects of the different types of the house. A house offered by real estate developers was selected because this type of housing product currently holds the highest market share. The proportion of houses constructed by real estate developers was around 67.3 percent compared to those constructed by home owners (Agency for Real Estate Affairs, 2005). The single detached house was selected because the average price of single houses was much higher than that of other types of houses and the market size of single houses was about 73 percent of the overall real estate market in 2004 (Agency for Real Estate Affairs, 2005). Since the pricing factor is one variable focused on in this study, different price levels of the product would impact the consumer decision process which is a key factor discussed in this dissertation. Therefore, other types of houses such as townhouses and condominiums were excluded from the research framework. Bangkok and its vicinity were focused on because: 1) the market value of real estate business in Bangkok and its vicinity is around 87 percent of the real estate market (Agency of Real Estate Affairs, 2005) and 2) the price level of the houses in Bangkok and its vicinity is higher than that of other provinces based on the different land prices and market demand. (See the details in Chapter 2).
Sample Size Determination There were two methods used to determine sample size in this study, the
number of variables and proportion of the customers who buy or do not buy a house from a housing project. Firstly, sample size was calculated based on the number of independent variables related to the conceptual framework, which can be categorized into two groups, three independent variables and two mediated variables. The two major constructs, benefits and sacrifices, contain 20 sub-variables, two attributes of product

113
quality, one sales service quality, four attributes of brand equity, three attributes of relationship quality, four attributes of perceived risk, one aggregate score for perceived price and another one for consumer involvement and finally, four attributes for perceived value. Based on Hair et al (1995), five to 20 samples were required for each variable. Therefore, the sample size of the study would be 400 samples (20 variables x 20 samples per variable).
The second method to determine sample size, based on the probability theory, is the use of the proportion of customers who bought and didn’t buy a house from a housing project. Based on the Agency of Real Estate Affairs (2005), the proportion of houses constructed by real estate developers is about 67.3 per cent while those constructed by home owners is 32.7 per cent. These proportions (p=.673, q=.327) could be used to determine the sample size. However, to overcome the market fluctuation, the worse possible case in which the proportion of the two groups are equal (p=q=.5) was selected instead. According to Zigmund (2003) and Churchill and Iacobucci (2002), the sample size can be determined by the following formula:
n = Z2pq E2
Where: p = Proportion of success; q = Proportion of failure (1-p); Z = Z-score at the accepted level of confidence; and E = the acceptable level of error
At a 95% level of confidence, Z equaling 1.96 and the accepted error at 5%,
the sample size should be totally 384 samples. Since the two methods yield a slightly different number of samples, a sample size of 400 for each group of home buyers was applied.
Sampling Procedure Related to the infinite characteristic of population, the non-probability
sampling technique should be applied. As one antecedent of the study was the price level, some details about the price level were considered for the recent home buyers.
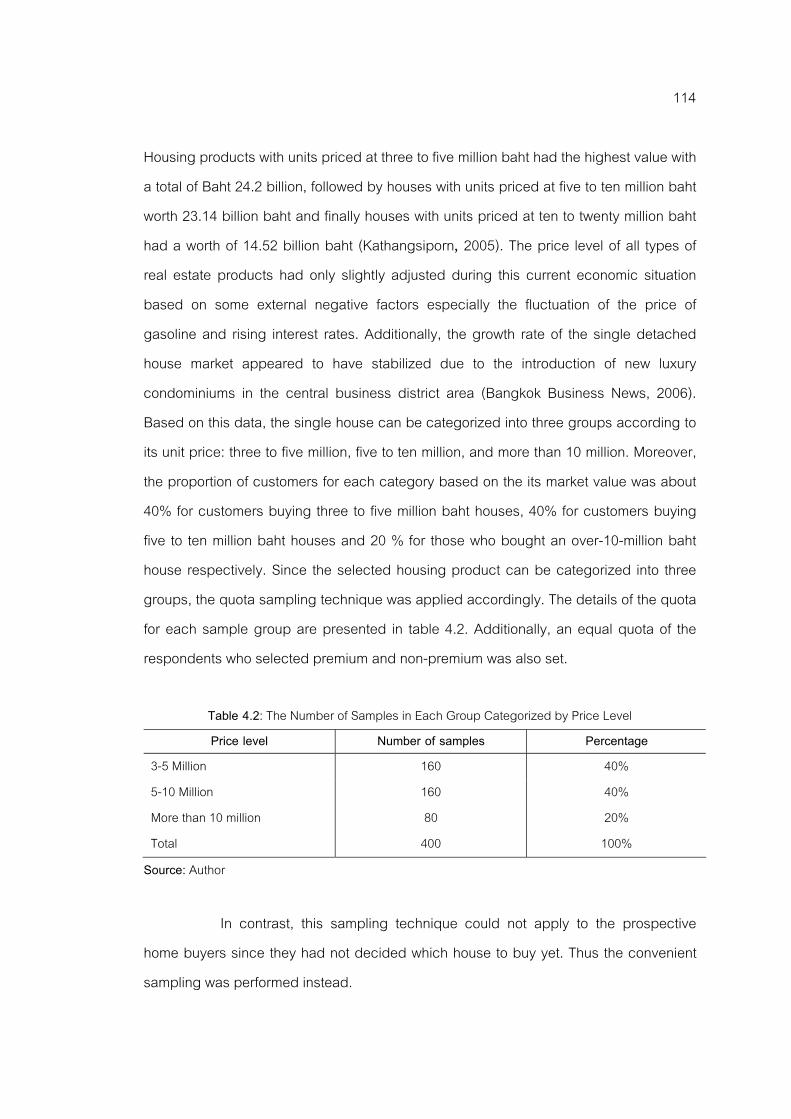
114
Housing products with units priced at three to five million baht had the highest value with a total of Baht 24.2 billion, followed by houses with units priced at five to ten million baht worth 23.14 billion baht and finally houses with units priced at ten to twenty million baht had a worth of 14.52 billion baht (Kathangsiporn, 2005). The price level of all types of real estate products had only slightly adjusted during this current economic situation based on some external negative factors especially the fluctuation of the price of gasoline and rising interest rates. Additionally, the growth rate of the single detached house market appeared to have stabilized due to the introduction of new luxury condominiums in the central business district area (Bangkok Business News, 2006). Based on this data, the single house can be categorized into three groups according to its unit price: three to five million, five to ten million, and more than 10 million. Moreover, the proportion of customers for each category based on the its market value was about 40% for customers buying three to five million baht houses, 40% for customers buying five to ten million baht houses and 20 % for those who bought an over-10-million baht house respectively. Since the selected housing product can be categorized into three groups, the quota sampling technique was applied accordingly. The details of the quota for each sample group are presented in table 4.2. Additionally, an equal quota of the respondents who selected premium and non-premium was also set.
Table 4.2: The Number of Samples in Each Group Categorized by Price Level Price level Number of samples Percentage
3-5 Million 160 40% 5-10 Million 160 40% More than 10 million 80 20% Total 400 100%
Source: Author In contrast, this sampling technique could not apply to the prospective home buyers since they had not decided which house to buy yet. Thus the convenient sampling was performed instead.

115
Survey Research Tool A “Home Buying Survey Questionnaire” had been designed as a major survey research tool for this dissertation. The questionnaire is constructed based on the literature and previous studies associated to each variable. It is necessary to develop valid and reliable scales that have robust psychometric properties (Hair et al., 1998). Multiple indicators for each construct are measured to account for measurement error (Steenkamp and Baumgartner, 2000). Two equivalent versions of the questionnaire, English and Thai, have been developed. The respondents can request for either the Thai or English version. To validate the scale, two marketing instructors and one marketing officer from a private firm had been invited to check the content validity of the questionnaire. Then, one hundred and ten sets of questionnaires are distributed to recent home buyers as a pre-test. A reliability analysis and exploratory factor analysis are performed. The details of the questionnaire layout, content, and pretest results are discussed in the following part. Questionnaire Layout
The “Home Buying Survey Questionnaire” is comprised of three major parts: 1) the measurement of all major constructs as proposed in the research framework, 2) descriptive data about the house owned by the respondents, 3) personal data of the respondents (See the sample of the questionnaire in Appendix C). Most question items measuring the major constructs are derived from previous research. Some items are modified based on to the specific characteristics of real estate industry. Some questions items are developed based on the in-depth interviews results conducted in the exploratory research. All the constructs in the questionnaire were measured by multiple items with six-point Likert scales, anchoring at 1 (strongly disagree) and 6 (strongly agree) or six-category scales varying from “none” to “substantial” as well as “least” to “highest.”
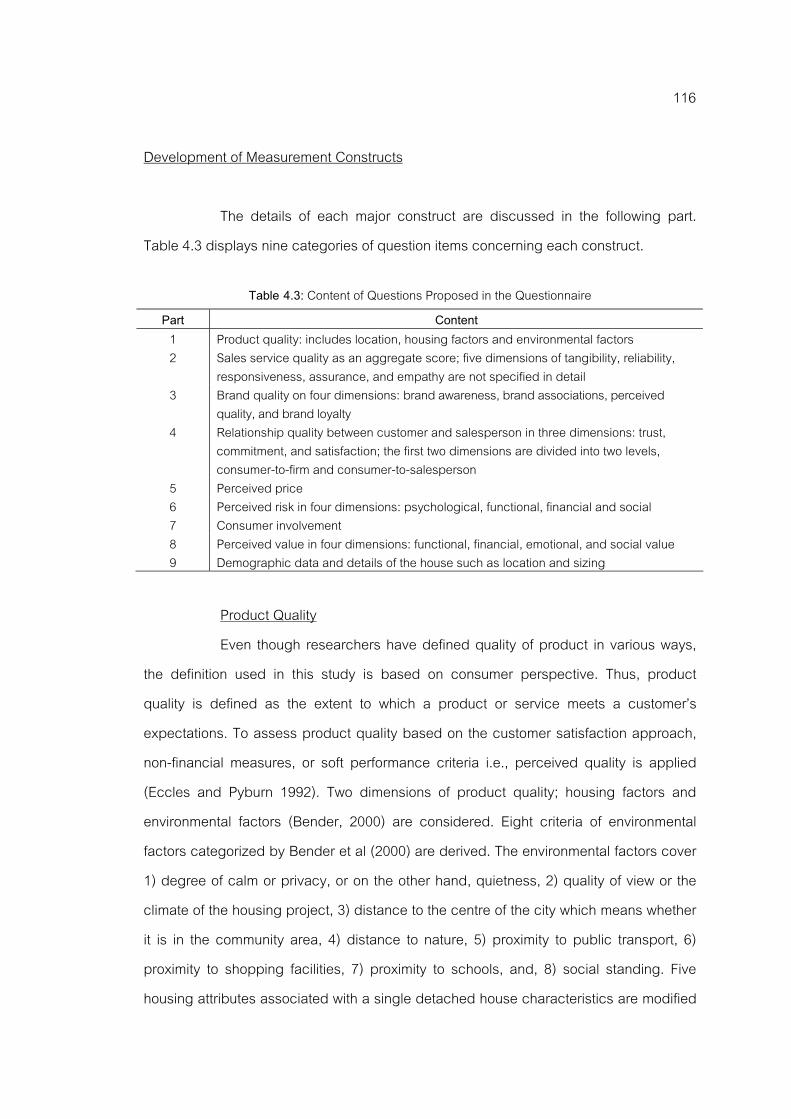
116
Development of Measurement Constructs The details of each major construct are discussed in the following part. Table 4.3 displays nine categories of question items concerning each construct.
Table 4.3: Content of Questions Proposed in the Questionnaire Part Content
1 Product quality: includes location, housing factors and environmental factors 2 Sales service quality as an aggregate score; five dimensions of tangibility, reliability,
responsiveness, assurance, and empathy are not specified in detail 3 Brand quality on four dimensions: brand awareness, brand associations, perceived
quality, and brand loyalty 4 Relationship quality between customer and salesperson in three dimensions: trust,
commitment, and satisfaction; the first two dimensions are divided into two levels, consumer-to-firm and consumer-to-salesperson
5 Perceived price 6 Perceived risk in four dimensions: psychological, functional, financial and social 7 Consumer involvement 8 Perceived value in four dimensions: functional, financial, emotional, and social value 9 Demographic data and details of the house such as location and sizing
Product Quality
Even though researchers have defined quality of product in various ways, the definition used in this study is based on consumer perspective. Thus, product quality is defined as the extent to which a product or service meets a customer’s expectations. To assess product quality based on the customer satisfaction approach, non-financial measures, or soft performance criteria i.e., perceived quality is applied (Eccles and Pyburn 1992). Two dimensions of product quality; housing factors and environmental factors (Bender, 2000) are considered. Eight criteria of environmental factors categorized by Bender et al (2000) are derived. The environmental factors cover 1) degree of calm or privacy, or on the other hand, quietness, 2) quality of view or the climate of the housing project, 3) distance to the centre of the city which means whether it is in the community area, 4) distance to nature, 5) proximity to public transport, 6) proximity to shopping facilities, 7) proximity to schools, and, 8) social standing. Five housing attributes associated with a single detached house characteristics are modified

117
from Torbica & Stroh 1999’s HOMBSAT model and another five items derived from depth interviews are included. Sales Service Quality
Regarding the service quality model proposed by Parasuraman et al (1985), the consumer's subjective evaluation of how well or poorly that actual performance compares to expected performance is widely accepted as the definition of perceived service quality. The five dimensions of tangibility, reliability, responsiveness, assurance, and empathy are considered. However, based on the study of sales service quality conducted by Darian et al. (2001), one aggregate score for all five dimensions of service quality can be applied. One reliability item, one responsiveness item, one assurance item, and three empathy items are examined. The question items were modified from RESERV (REal Estate SERVice Quality), which is the modified version of SERVQUAL for real estate specific contexts (Seilaer, Webb, and Whipple, 2000) and Torbica and Stroh’s (1999) HOMBSAT scale in order for the content of the item to be specific to the industrial context. Brand Equity
The best known theories explaining brand equity are Aaher’s and Keller’s theory. Aaker (1991) defined brand equity as a set of brand assets and liabilities linked to a brand, its name and symbol that add to or subtract from the value provided by a product or service to a firm and/or to that firm's customers while Keller (1993) defined brand equity as the differential effect of brand knowledge on consumer response to the marketing of a brand. Aaker (1991) categorized brand equity into four major dimensions: brand awareness, brand associations, perceived quality, and brand loyalty. However, Kotler (2003) gave a broader definition that brand equity is the positive differential effect that knowing the brand name has on customer response to the product or service. Therefore, brand equity is closely related to the value of the brand, causing a customer to show a preference and be willing to pay more for one product over another when they are basically identical. To measure brand equity, the original Aaker’s measurement which was modified by Ha (1997) has been selected.

118
Relationship Quality The concept of relationship quality is based on the customer loyalty concept
which is largely determined by the factors reflecting "the degree of appropriateness of a relationship" from the customer's perspective (Hennig-Thurau and Klee, 1997). The general concept of relationship quality describes the overall depth and climate of a relationship. Relationship quality was operationalized as a customer’s perceptions of how well the whole relationship fulfils the expectations, predictions, goals and desires the customer has concerning the whole relationship (Johnson, 1999). The three dimensions of relationship quality, trust, commitment and satisfaction were specified.
Trust has been broadly defined as “one party's belief that its needs will be fulfilled in the future by actions undertaken by the other party” (Anderson and Weitz, 1989). An expectation of trust is created by ability, reliability, intentionality, and honesty and integrity of the firm and salespersons (Crosby et al., 1990; Lin and Ding. 2005). To measure trust, the measurement items were modified from the items used in previous studies (Spake, et al., 2003; Roberts, et al. 2001; Henning-Thurau, et al., 1997; Morgan & Hunt, 1994; Crosby et al., 1990). Two levels of trust, person-to-person, i.e., trust in the salesperson, and person-to-firm, i.e., trust in the firm was applied.
Commitment: Moorman et al. (1992) defined commitment as an enduring desire to maintain a valued relationship. The term “valued relationship” emphasized the belief that commitment exists only when the relationship is considered important. This implies a higher level of obligation to make a relationship succeed and to make it mutually satisfying and beneficial (Gundlach et al., 1995; Morgan and Hunt, 1994). Two levels of commitment, particularly person-to-person, i.e., commitment to the salesperson, and person-to-firm, i.e., commitment to the firm were applied. The measurement items were modified from Swan et al (1988); Crosby et al. (1990); Spake, et al. (2003); Morgan & Hunt (1994); Mowday et al. (1982); and Henning-Thurau, et al. (1997).
Satisfaction is an emotional state that occurs in response to an assessment of buyer-seller interaction experiences which indicates the customers’ cognitive and

119
affective evaluation based on their personal experience across all service episodes within the relationship (Storbacka et al., 1994). Thus, satisfaction can take an important role as a measure of relationship. Three question items were derived from Henning-Thurau, et al. (1997) and Woo & Ennew (2004).
Perceived Price Another factor considered to be an antecedent of perceived value was
perceived price. Consumers, mostly, evaluate the quality of a housing product based on their perception that the price is affordable for them (Glaeser et al., 2001). Moreover, some additional financial factors such as interest rates, a payable mortgage plan, property tax exemption, and other sales promotion such as a small down payment amount, etc, would influence a consumer’s perception. In this study, price will be measured based on consumers’ perspectives by asking whether consumers perceive 1) the price of the house to be cheaper than other houses with the same quality, 2) the price of the house to be at an affordable level, 3) the price of the house to be reasonable, 4) that interesting sales promotional campaign is offered, and 5) economical payment conditions to be available.
Perceived Risk Similar to perceived price, perceived risk was considered instead of actual
risk. As Jacoby and Kaplan (1972) suggested that perceived risk should be considered a multidimensional concept. The four dimensions of risk are considered as psychological, functional, financial, and social risk, Psychological risk is psychological discomfort arising from issues such as worry and regret (Perugini and Bagozzi, 1999) experienced from purchasing and using the product. Functional risk arises when the product does not work as expected (Dholakia, 2001). Functional risk includes performance risk and physical risk, and time risk (Mumel, 1999) arises from objective features of the product. Financial risk is related to losing money when the product does not satisfy the expectations. Social risk is the uncertainty of social reaction towards the particular decision. The three to four risk measurement items were modified from the previous studies conducted by Dholakia (2000). A total of 11 items were used.

120
Consumer Involvement Consumer involvement is the non-emotional factors given by consumers.
The amount of consumer involvement is related closely to consumer involvement with the purchase. Consumer involvement includes time, effort, and the related expense (Baker et al., 2002). Consumer involvement is also related to risk (Dholakia, 2001; Laurent and Kapferer, 1985) in that consumers who are highly involved with the product and perceive the purchase situation as high risk would put more effort in searching for more information and choices. Actual time and effort as well as perceived effort were measured. The actual consumer involvement was measured by asking about the total time consumers spent for the home buying process, for information search, for final choice selection and the total number of housing projects consumer visited. The measurement items for perceived effort were modified from Dholakia (2001).
Perceived Value of the Product In this study, perceived value is considered as a dependent variable and
also moderating factor between all quality-attributes final choice selection. The definition of perceived value proposed by Zeithaml (1988) as “Perceived value is the consumer’s overall assessment of the utility of a product based on perceptions of what is received and what is given” was used with four dimensions proposed by Sheth et al. (1991). Similar to Sweeney and Soutar (2001), the conditional and epistemic values were excluded since they were too subjective and situation specific. Therefore, the functional value, emotional value and social value were examined together with one other dimension, financial value, proposed by Zeithaml (1988).
Functional value is concerned with the consumer evaluation of how much the product features and functions are worth to customers in terms of time and money. Social value is the value that is related to social acceptance and reaction. Emotional value focuses on the feelings, or affective states that a product generates. Financial value is the value of the money spent on the product. A total of nine question items modified from Sweeney and Soutar (2001), Wang (2004), and Menon et al. (1997) were applied.
121
Choice Selection In contrast to the Utility Theory which states that consumers select the
choice that provides the highest utility, Kahneman and Tversky (1979) stated that value should replace the “utility” concept since value provides a reference point and evaluated both gains and losses obtained from the product from that reference point. Consumers determine the value of a product by evaluating criteria representing both objective attributes and subjective factors of a product (Tversky and Kahneman, 1992). Choice selection is made based on the level of value a consumer places on the product. Therefore, perceived value seems to play a significant role in the consumers’ purchase decision process. Based on this argument, choice decision was defined as the possibility to choose a choice based on the perceived value of the product, in this study. Thus, a single measurement item asking respondents to estimate the probability to buy the house that they specified previously with the number 1-100 was used to assess the possible choice selection for the prospective home buyers.
This dissertation, however, is designed to be a recent home buyer survey and one major concern is about the brand perception and relationship. In order to measure the choice selection objectively, respondents were categorized into two groups based on their brand selection whether it is a premium or non-premium brand. A comparison of the final choice selection process between the respondents who bought the premium and non-premium brand was performed. To ensure the relationship between perceived value and choice selection, the respondents were also categorized by the price level of their house and then same comparison procedures were applied. Operational Definitions
The definitions and details of key constructs proposed in this study have already been discussed in the previous part. All constructs and their dimensions can be summarized in Table 4.4 as follows:

122
Table 4.4: List of Variables and Their Operational Definitions Variables/ Dimensions Operational Definition Product Quality The consumer’s judgment about the superiority or excellence of a product in its features
and performance which can be categorized into housing factors and environmental factors
Housing Factor Housing product attributes characterized as the housing objects, includes design, size, space utility, privacy, etc.
Environmental Factor A set of environmental amenities covers, proximity to open areas, attractive views, public facilities, and so on
Location A set of externalities includes location, distance to the central business area or workplace/kids’ school as well as the traffic.
Sales Service Quality The consumer's subjective evaluation of how well or poorly that actual service performance compares to expected service performance
Brand Equity A set of brand assets and liabilities linked to a brand that augment or diminish the value of a good or service to a firm and its customers. Brand equity is composed of four dimensions: brand awareness, brand association, perceived quality, and brand loyalty.
Relationship Quality Customers’ perceptions of how well the whole relationship fulfills the expectations, predictions, goals and desires the customers have concerning the whole relationship. Relationship quality can be categorized into three dimensions: trust, commitment, and satisfaction. Two levels of trust and commitment: consumer-to-firm and consumer-to-salespersons are separated.
Trust The willingness to rely on an exchange partner in whom one has confidence, it also refers to the consumer's belief that his needs will be fulfilled in the future by actions undertaken by the firm
Commitment A customer’s long-term ongoing orientation toward a relationship grounded on both an emotional bond to the relationship (affective aspect) and on the conviction that remaining in the relationship with the firm or its representatives (cognitive aspect.)
Satisfaction An emotional state that occurs in response to an assessment of buyer-seller interaction experiences which indicates the customers’ cognitive and affective evaluation based on their personal experience
Perceived Price A consumer’s perception of the product’s price compared to other products with similar specifications, and it is measured by comparing the price of the good to other goods with equivalent features
Perceived Risk A situation associated with unsatisfactory product performance comprising the uncertainty involved in a purchase decision and the consequences of taking an unfavorable action
Psychological Risk The experience of anxiety or psychological discomfort arising from anticipated post behavioral affective reactions such as worry and regret from purchasing and using the product
Functional Risk The risk that the product does not work as expected by a consumer. Functional risk includes performance risk and physical risk, arising from objective features of the product
Financial Risk A risk that a consumer is losing his money, because the product does not satisfy his expectations; a consumer invests more money in acquiring a product
Social Risk The adverse consequences associated with unfavorable opinions of significant other people on account of the purchase and use of the product. This type of risk is based on social concern.
Consumer Involvement The non-emotional investments including time, effort, and the related expense sacrificed or made by the consumers
Perceived Value The consumer’s overall assessment of the utility of a product based on perceptions of what is received and what is given
Financial Value The utility derived from the perception that a product is value for money Functional Value The utility derived from the product’s features and functional ability that has worth to the
customers in terms of time and money. Emotional Value The utility derived from the feelings, or affective states that a product generates. It is
acquired when a product/service arouses feelings or effects. Social Value The utility derived from the product’s ability to enhance social self-concepts, such as
social status Choice Selection The product which is selected by the buyer as the final choice

123
Pre-Test and Pre-Test Result
Pre-Test To examine the quality of the questionnaire, a pre-test was performed. The
pre-test was carried out from February to March 2006. One hundred and ten questionnaires were handed to target samples. The samples were home buyers who recently bought a single house. Even though some home buyers reported that the decisions were made by all members of the family, the key decision makers were identified and asked to complete the questionnaire. The time required to complete the questionnaire was 15 to 20 minutes. Four incomplete questionnaires were discarded; the 106 responses can be used as pre-testing data for the questionnaire analysis.
Measure of Reliability and Validity The reliability of the questionnaire is assessed by two techniques, item-to-
total correlation & Cronbach’s coefficient alpha analyses. All the coefficient alpha value exceeded the threshold value of 0.7 recommended by Nunnally (1978) suggesting a reasonable degree of internal consistency between the corresponding items will be accepted. In fact, the level of alpha acceptable depends on the researcher’s objectives, and more particularly on the stage of the research process. Magnitudes between 0.5 and 0.6 are acceptable for the early stages of research. Coefficients above 0.8 are acceptable for the final stages of research (Nunnaly 1994; Peterson, 1994; Churchill, 1979). The questionnaire will be modified based on the results gathered from statistical analysis of the pre-test. All constructs are latent variables i.e. not directly observable and as such must be measured using observable variables, which are assumed to be indicators of these latent, non-directly observable variables. The exploratory factor analysis (EFA) is used to identify values for factors which represent these latent variables. Therefore construct validity is examined. Then, the scale items for major constructs will be analyzed using principle components analysis, in order to check for the convergent validity. Trait validity, which tests whether or not variables load on one factor only and discriminant validity, which tests whether or not variables will load in the same way on other different factors, will be analyzed. The measurement scale will be

124
purified by deleting the question items that loaded on several factors or on other factors inconsistent with the proposed construct.
Pre-Test Results Pre-test results indicated that the measurement items of all key variables are
highly internally consistent since the Cronbach’s alpha co-efficient of the key constructs exceeds 0.8 (Nunnally, 1978) as .984, .934. .969, .959, .968, .764, .857, .894, and .913 for product quality, sales service quality, brand equity, relationship quality, perceived price, perceived risk, consumer involvement, and perceived value, respectively. (See table 5.11). The Cronbach’s alpha coefficients for all dimensions of each key construct were also considered satisfactory since their magnitudes vary from the least of 0.717 to the highest of 0.974. The details are illustrated in the next part.
Table 4.5: Summary of Scale Reliability and Their Internal Consistency Construct Reliability (Cronbach’s Alpha)
Product Quality .934 Sales Service Quality .928 Brand Equity .959 Relationship Quality .968 Perceived Price .764 Perceived Risk .895 Consumer Involvement .894 Perceived Value .913
Principle component analysis (PCA) and exploratory factor analysis (EFA)
were used to undertake two operations: first, to test for trait and discriminant validity; and, second, to extract factor scores i.e. the values that the latent variables would have received had they been directly observable. Results of the principle component analysis indicated that all observable variables demonstrated correlation coefficients greater than 0.3 with at least one other variable. Measuring the appropriateness of the data for undertaking factor analysis should be the first step in factor analytical procedures (Dimanche et al., 1991). However, three question items of brand equity were deleted since they were loaded in several factors, according to the factor analysis result.
Three factors of product quality were extracted from the PCA solution, explaining 67.51 percent of the observed variance. Three dimensions of product quality including two subtypes of environmental factors:1) distance and location, 2) quality of
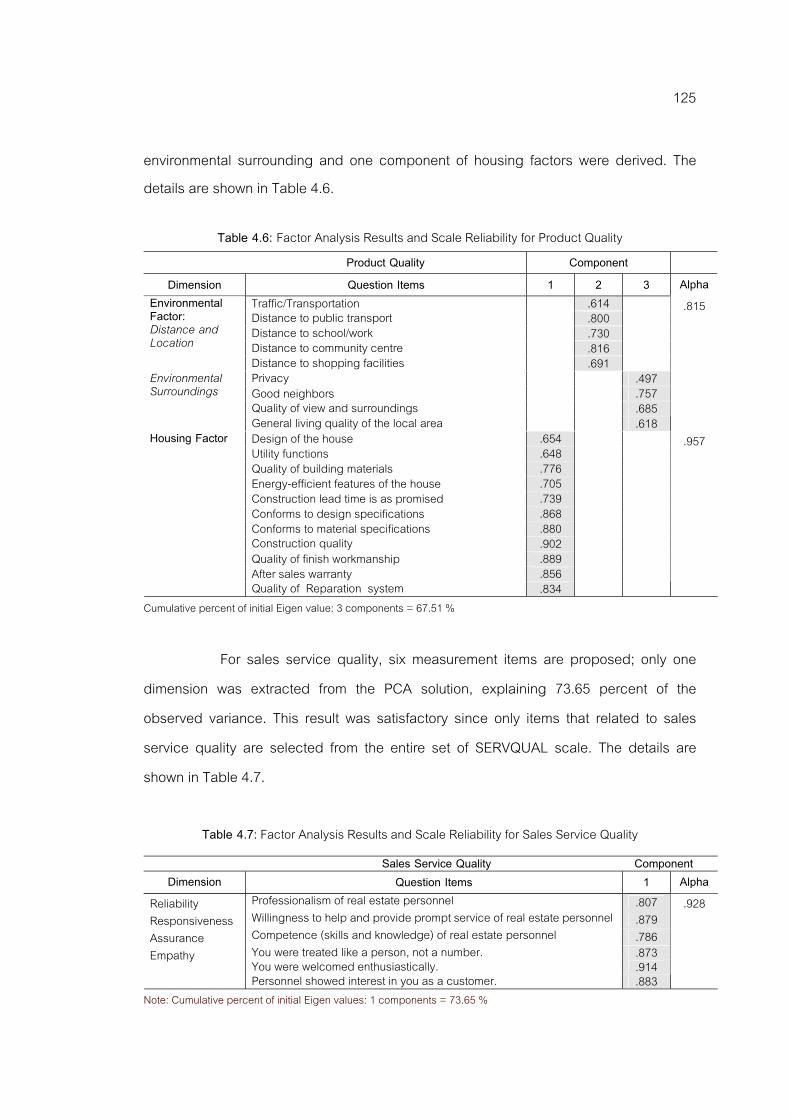
125
environmental surrounding and one component of housing factors were derived. The details are shown in Table 4.6.
Table 4.6: Factor Analysis Results and Scale Reliability for Product Quality Product Quality Component
Dimension Question Items 1 2 3 Alpha Traffic/Transportation .614 Distance to public transport .800 Distance to school/work .730 Distance to community centre .816
Environmental Factor: Distance and Location Distance to shopping facilities .691
Privacy .497 Good neighbors .757 Quality of view and surroundings .685
Environmental Surroundings
General living quality of the local area .618
.815
Design of the house .654 Utility functions .648 Quality of building materials .776 Energy-efficient features of the house .705 Construction lead time is as promised .739 Conforms to design specifications .868 Conforms to material specifications .880 Construction quality .902 Quality of finish workmanship .889 After sales warranty .856
Housing Factor
Quality of Reparation system .834
.957
Cumulative percent of initial Eigen value: 3 components = 67.51 % For sales service quality, six measurement items are proposed; only one
dimension was extracted from the PCA solution, explaining 73.65 percent of the observed variance. This result was satisfactory since only items that related to sales service quality are selected from the entire set of SERVQUAL scale. The details are shown in Table 4.7.
Table 4.7: Factor Analysis Results and Scale Reliability for Sales Service Quality
Sales Service Quality Component Dimension Question Items 1 Alpha
Reliability Professionalism of real estate personnel .807 Responsiveness Willingness to help and provide prompt service of real estate personnel .879 Assurance Competence (skills and knowledge) of real estate personnel .786
You were treated like a person, not a number. .873 You were welcomed enthusiastically. .914 Empathy
Personnel showed interest in you as a customer. .883
.928
Note: Cumulative percent of initial Eigen values: 1 components = 73.65 %

126
For brand equity, 16 measurement items with four dimensions were proposed. However, only two dimensions were extracted from the PCA solution, explaining 71.62 percent of the observed variance. Brand awareness, brand loyalty and brand association were loaded in the same component. Perceived quality was loaded in another component. It could be said that all dimensions associated with the brand except perceived quality could be viewed as one dimension about the attitude toward the brand. Another component was different by nature since it explained how consumers relate to the brand and quality of the product. However, there were three brand association items that were loaded in both components. The three items were asking about pride of the firm and also disappointment from the firm. Therefore, it was difficult to distinguish them from the perceived quality. Thus these three items were considered to be deleted. The details are shown in Table 4.8.
Table 4.8: Factor Analysis Results and Scale Reliability for Brand Equity Brand Equity Component
Dimension Question Items 1 2 Alpha When talking about a house, you think of this real estate firm immediately. .600 Brand
Awareness This real estate firm is the most popular brand in the industry. .776
.855
The house provided by this real estate firm is luxurious. .847 You won’t mind paying a higher price for this house offered by this real estate firm. .836 This real estate brand would compensate me in some way for the problem with the product. .733 The image of this real estate firm represents what you would like to be. .805 You are so proud of buying this house* .418 .661 This real estate firm never disappoints customers* .456 .751
Brand Association
Proud to tell others about living at this housing project* .418 .697
.918
Quality of the houses offered by this real estate firm is consistent. .861
The house offered by this real estate firm is very durable. .853 The house offered by this real estate firm is very reliable. .823
Perceived Quality
The quality of the houses offered by this real estate firm is superior to other brands. .720
.915
You feel you are loyal to this real estate firm. .699 The house offered by this real estate firm is my first choice. .674
Brand Loyalty
Even with more choices, you will not choose other brands. .717
.892
Note: Cumulative percent of initial Eigenvalues: 2 components = 71.62 % * Items deleted.

127
Three factors of relationship quality were extracted from the PCA solution, explaining 75.50 percent of the observed variance. Trust in and commitment to a firm together with satisfaction with the firm was loaded in the same factor. Trust in a salesperson and some commitment to the salesperson was loaded together in the sales factor. Another four items on commitment to salesperson were loaded separately in the other factor. These four items aim to measure perception of the relationship with the salespersons while other commitment to salespersons was designed to the perception of the salesperson himself/herself. The trust-in-salesperson items were found to similarly measure the perception of the salesperson. Therefore, the dimension of relationship quality could be modified to be three dimensions: relationship quality to a firm and personal trust in and personal commitment on the salesperson. The details are shown in Table 4.9.
Table 4.9 Factor Analysis Results and Scale Reliability for Relationship Quality Relationship Quality Component
Dimensions Question Items 1 2 3 Alpha Personnel are responsible. .836 Personnel are honest about problem solving. .870 Personnel can be trusted at all times. .844 Personnel put the customers' interest before their own. .858 Personnel are reliable. .817 Personnel are honest. .833 The relationship with your real estate personnel is very much at ease. .780 Personnel are able to handle the complaints. .830
Trust in personnel
Personnel are collaborative in resolving conflicts with us. .772
.967
You feel emotionally attached to personnel. .701 You plan to maintain relationship with real estate personnel. .771 You regarded the overall relationship with personnel as very close. .764
Commitment to personnel
Relationship with real estate personnel is important. .722
.864
The real estate firm understands the customer. .584 The real estate firm can be trusted at all times. .498
Trust in firm The real estate firm can be counted on to do what the right. .604
.884
This housing project is the best of all possible places for living. .751 You are committed to your real estate firm. .786 You intend to continue associating with the housing project. .772 Your relationship to this firm deserves your maximum effort to maintain. .759
Commitment to firm
Your choice to use this company was a wise one. .800
.911
You’re always delighted with the service provided by this real estate firm. .769 The performance of the real estate firm exceeds customer expectation. .724
Satisfaction
You think you did the right thing when I decided to use this firm .799
.910
Note: Cumulative percent of initial Eigen values: 3 components = 75.50 % The alpha-coefficient of relationship quality toward firm is .953

128
For perceived risk, 11 measurement items with four dimensions are proposed. However, only three dimensions were extracted from the PCA solution, explaining 75.26 percent of the observed variance. Social risk and financial risk were loaded together. It was highly possible for social risk to be loaded with other dimensions since there were only two measurement items for this dimension. Therefore, these two factors were combined and renamed as “external risk.” The rest, psychological and functional risk, were loaded separately in another two components as proposed. However, these two dimensions shared some common characteristics of risk that are associated with the internal factors of a person. The details are shown in Table 4.10.
Table 4.10: Factor Analysis Results and Scale Reliability for Perceived Risk
Perceived Risk Component Dimensions Question Items 1 2 3 Alpha
When you thought about buying a house, you experienced tension. .918 The thought of buying a house would make you feel uncomfortable. .872
Psychological Risk
You would worry a lot when buying a house. .449
.857
When buying a house, you would worry about how reliable the house will be. .871 You are afraid that the house would not provide you the level of benefits that you expected to it. .857
Functional Risk
You are afraid that the house would not provide you the level of housing quality that you expected to it. .896
.919
You are concerned that someone may look down on you, if you made a bad choice in selection of the house.
.791 Social Risk
When buying the house, you are concerned about the neighbors who buy houses in the same project. .620 You are afraid that the house you buy may be more expensive than other choice. .828 You are not sure whether you made a sufficient price bargaining. .872
Financial Risk
You are afraid that the price you paid for your house may be higher than other customers. .750
.881
Note: Cumulative percent of initial Eigen values: 3 components = 75.26 %
For consumer involvement and perceived price, the results were satisfactory since all items loaded in each one dimension as proposed and with the 70.59 and 53.49 percent of the observed variance explained for consumer involvement and price, respectively. The details are presented in Table 4.11 and 4.12.

129
Table 4.11: Factor Analysis Results and Scale Reliability for Consumer Involvement Consumer Involvement Component
Question Items 1
Alpha Before buying the house, you would obtain substantial information about all available choices. .801 .894 You would acquire a great deal of information about the house and its environment before buying. .748 You have spent a lot of time in the purchase process of this house. .923 You have put a lot of effort in the purchase process of this house. .934
Consumer involvement
It costs you a lot of money to search for the most suitable house for you. .776 Note: Cumulative percent of initial Eigen values: 1 component = 70.59 %
Table 4.12 Factor Analysis Results and Scale Reliability for Perceived Price
Perceived Price Component Question Items 1 Alpha Comparing to other houses with the same quality, price of the house is…cheaper/ more expensive .599 Based on your economic status, the price of your house is said to be….affordable/unaffordable .813 In your opinion, the price of your house is … reasonable/unreasonable .833 Sales promotional campaign offered for your house is interesting/ not motivating .619
Price
Payment condition offered for your house affects you to make decision…less or more difficult. .761
.764
Note: Cumulative percent of initial Eigen values: 1 component = 53.49 %
For perceived value, nine measurement items with four dimensions were proposed. Only two dimensions were extracted from the PCA solution, explaining 74.34 percent of the observed variance. Financial value, functional value and emotional value were loaded together while social value was loaded separately. This result indicated that perceived value for buying a house could be categorized into two major dimensions: value created by the evaluation or internal consideration of the buyers and value created based on the influence of others. Thus, the combined dimensions represented personal and social value of the product. The details are in Table 4.13.
Table 4.13 Factor Analysis Results and Scale Reliability for Perceived Value
Perceived Value Components Dimensions Question Items 1 2 Alpha
Your house is value for money. .671 Financial value Quality of your house is value for money compared with that of major competitors. .604
.737
Your house can be considered as a superior housing product. .652 Functional value You are confident in your house. .808 .824
You like to live in your house. .899 Emotional value Your house makes you feel good. .866 .918
Your house would improve the way you are perceived. .700 Your house would help you make a good impression on other people. .917
Social value
A houses offering in this housing project would give its owners social approval. .913
.891
Note: Cumulative percent of initial Eigen values: 2 component = 74.34 %
130
Based on the pretest results, most reliability analysis results were satisfactory. The alpha coefficients of all constructs and their dimensions, except price and financial value, varied from 0.815 to 0.980 which exceeded the recommended level of 0.7 (Nunnaly 1994; Peterson, 1994; Churchill, 1979). However, the pretest analyses yielded the alpha coefficient of 0.764 for price and 0.737 for financial value which still acceptable according to Nunnally (1978) since they exceeded 0.7. For the exploratory factor analysis, the results were also satisfactory. The factors loadings of most items were consistent with the literature. Most of them were loaded in their corresponding components as proposed. Only three question items of brand equity were deleted in order to purify the scale. These three items were designed to measure the brand association but they loaded with both brand association and perceived quality. Therefore, the “Home Buying Survey Questionnaire” was modified by discarding the three question items of brand equity. This questionnaire will be used as the major research tool for the survey. Survey Data Collection: Two Survey Studies
To ensure enough variation in home buying decision processes, two
groups of home buyers were focused. The data were collected from both groups separately with the different methods. The details of each group are as follows:
Recent Home Buyers For the first group, recent home buyers who bought a house from a
housing project developed by a real estate developer within this 2 year-period were focused. Each product selected was categorized by the brand of the housing projects or the real estate developers who offered the house as premium and non-premium brand. The brand was categorized based on the reputation of the real estate developers mentioned in the focus group discussion. Premium brands included all housing projects developed by 17 real estate developers which were Areeya Property, Golden Land, KC Group, Krisda-nakorn, Lalin Property, Land and Houses, MK Real Estate, NC Group,

131
Noble House, Preuksa, Property Perfect, Quality House, Sammakorn, Sansiri, Supalai, Tararom, and Wangthong Property. The list of premium brand was gathered from the focus group discussion conducted in the initial stage of this research. Other housing projects that their names were not mentioned in any focus group discussion or not respected by focus group participants as premium brand were considered as non-premium brand. Since there were large numbers of housing projects, non-probability sampling procedure with a snowball technique was performed to collect data according to the quota proposed previously. Thirty-five housing projects developed by seventeen “premium brand” real estate developers and fifty-two housing projects with non-premium brand were randomly selected. Then, one to five home owners of each project were personally approached to be a respondent and also data collector. Each home owner was asked to respond to the questionnaire and also distribute two to five questionnaires to their neighbors who owned a house in the same housing project. To filter the respondents, the key decision maker of each family/home was firstly identified and asked to fill up the questionnaire by him/herself. In case that there was more than one person performed that home buying decision, the most decision influence person was asked to respond to the questionnaire. Due to their home buying experience, most respondents were expected to fill in the questionnaire without any trouble. Data were collected during May 3, 2006 to June 5, 2006. Total of 425 questionnaires were returned which 420 were usable. Since four hundred samples are required, the total of 420 sample sizes was considered as sufficient enough for subsequent analyses. The details of housing and sample profile were illustrated in Chapter 6. Prospective Home Buyers The focal population of the second study was the prospective home buyers. People who were in any stage of home buying process were included. Even though this group may have no experience on the entire home buying decision process as they had not selected their final choice yet, they were targeted because they would be free from any cognitive dissonance of the post-purchase bias. The respondents were requested to specify only one highest interesting house in a housing project and also its details

132
such as its sizing, price, and etc. moreover, to cover the final choice selection, purchase intention on their specifying house was identified by asking each respondent to estimate the probability to buy that house in percent i.e., selecting one number of 0 to 100.
The data was collected from the prospective home buyers who went to the 14th Housing and Condo Exhibition. This housing exhibition was conducted at Queen Sirikit National Conventional Center on May 4 to 7, 2006. The event offered its customers an opportunity to shop and select a variety of new houses, condominiums and properties from almost 500 housing projects which were currently available in the market. Customers who visited the exhibition were assumed to be the customers who were prospective to buy a house. However, to ensure that the respondents could represent the target population, two filter questions were applied to examine whether 1) they were the key decision maker for home buying process and 2) the houses they were seeking is a single detached house with the price of three million baht or higher. Convenience sampling with either mall intercept interview or drop-off survey technique were performed. Four hundred twenty seven respondents agreed to respond to the questionnaire. A total of 421 questionnaires were usable. The data were collected during May 5 to 7, 2006. The responses are deemed sufficient for subsequent analyses. Data Analysis
The data was firstly analyzed descriptively as respondent demographics. Then, the important characteristics related to customers’ purchasing decision process were presented in frequency and percentage. The means and standard deviations of each construct were computed and compared. Both exploratory and confirmatory factor analyses were conducted through the structural equation modeling technique as well as establishing that the hypothesized model fitted the data reasonably. Correlated factors hypothesized in the model were examined. Then, the hypotheses testing were done. The details of statistical techniques used to analyze the data are proposed in Table 4.14.
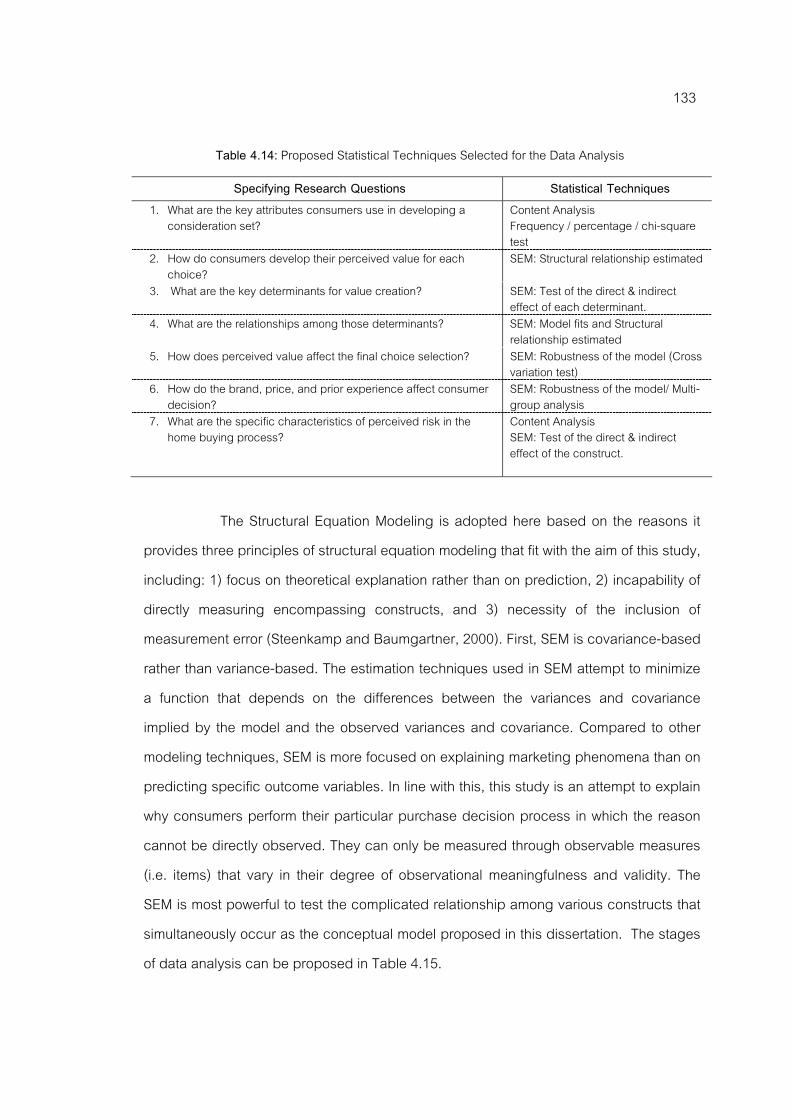
133
Table 4.14: Proposed Statistical Techniques Selected for the Data Analysis
Specifying Research Questions Statistical Techniques 1. What are the key attributes consumers use in developing a
consideration set? Content Analysis Frequency / percentage / chi-square test
2. How do consumers develop their perceived value for each choice?
SEM: Structural relationship estimated
3. What are the key determinants for value creation? SEM: Test of the direct & indirect effect of each determinant.
4. What are the relationships among those determinants? SEM: Model fits and Structural relationship estimated
5. How does perceived value affect the final choice selection? SEM: Robustness of the model (Cross variation test)
6. How do the brand, price, and prior experience affect consumer decision?
SEM: Robustness of the model/ Multi-group analysis
7. What are the specific characteristics of perceived risk in the home buying process?
Content Analysis SEM: Test of the direct & indirect effect of the construct.
The Structural Equation Modeling is adopted here based on the reasons it
provides three principles of structural equation modeling that fit with the aim of this study, including: 1) focus on theoretical explanation rather than on prediction, 2) incapability of directly measuring encompassing constructs, and 3) necessity of the inclusion of measurement error (Steenkamp and Baumgartner, 2000). First, SEM is covariance-based rather than variance-based. The estimation techniques used in SEM attempt to minimize a function that depends on the differences between the variances and covariance implied by the model and the observed variances and covariance. Compared to other modeling techniques, SEM is more focused on explaining marketing phenomena than on predicting specific outcome variables. In line with this, this study is an attempt to explain why consumers perform their particular purchase decision process in which the reason cannot be directly observed. They can only be measured through observable measures (i.e. items) that vary in their degree of observational meaningfulness and validity. The SEM is most powerful to test the complicated relationship among various constructs that simultaneously occur as the conceptual model proposed in this dissertation. The stages of data analysis can be proposed in Table 4.15.

134
Table 4.15: Stages of Data Analysis Stage Analysis Purpose
1 Qualitative data analysis Investigation of the antecedents buyers used to perform the consideration set Investigation of the decision rules applied in the formation of the consideration set
2 Item analysis
Investigation of sample characteristics (sample profile) Investigation of item means Investigation of item-to-total correlations
3 Exploratory factor analysis
Exploration of loadings; removal of items with low loadings and high cross-loadings Assessment of number of latent factors Assessment of reliability (Cronbach’s alpha)
4 Confirmatory factor analysis
Assessment of convergent validity Assessment of discriminant validity Assessment of construct reliability Assessment of correlations and multicollinearity Assessment of structural relationships (baseline models) Assessment of measurement invariance A. Across contexts: testing the relative importance of criteria of perceived value and moderating effect of relationship quality: H1-H11
5 Multiple Group Confirmatory Factor Analysis for base model
B. Across groups of buyers: testing the moderating effect of perceived value: H 12
6 Multiple Group Confirmatory Factor Analysis for extended model
Assessment of structural relationships Assessment of measurement invariance Repeat Stage 5 for the extended/alternative models
7 Presentation of results
Discussion of findings
Summary
The objectives of this chapter are twofold. The first objective is to explain the research model and research questions. The operational definitions of all major constructs and their dimensions are presented. The associations among all major constructs are hypothesized as 12 hypotheses. The second objective is to provide the explanations of methodology applied in this research. The research design, population, sample, and sampling technique are illustrated. The research design can be categorized into three parts: 1) exploratory research, 2) qualitative research for both stages of decision making - consideration set formation and final choice selection, and 3) survey method. Furthermore, items that were used to test the constructs of the research model are presented in the development of research tool section. Also, research procedures that include a pretest, pretest results, and the modification of the measurement items are illustrated. Finally, the survey data collection and data analysis are proposed.

135
CHAPTER 5
CONTENT ANALYSIS FOR THE CONSIDERATION SET FORMATION
Three data analysis procedures, namely content analysis, descriptive analysis, and analysis of structural equation modeling & hypotheses test were performed in this research (Arnold and Reynolds, 2003; Duman, 2002). Content analysis was chosen to analyze the qualitative data gathered from the focus group discussions. Its main purpose was to identify the process and factors influencing the consideration set formation which is usually formed in the initial stage of decision making. In the second procedure, two survey datasets from recent and prospective home buyers were analyzed descriptively to understand the characteristics of home buyers in the pre- and post-purchase context. The sample profiles, housing characteristics and means comparisons between samples were presented. The third procedure was designed to examine the structural relationships among constructs as proposed in the conceptual framework. The analyses were comprised of two parts; the item analysis and the test of structural equation modeling. The confirmatory factor analysis, assessment of structural relationship, hypothesis testing, and multi-group comparisons were performed in this part. Table 5.1 concludes the three procedures of data analyses.
Figure 5.1: Data Analysis Procedures and Methods
Descriptive Analysis Qualitative Analysis SEM Analysis Content Analysis of data gathered
from focus groups and depth interviews to identify the process
and details of Consideration Set and other Decision Related Factors
Survey Data Preparation and Assumption Checks
Confirmatory Factor Analysis
Descriptive analysis of respondents’ housing and demographic profile
Structural Equation Modeling Analysis*: Fit Indices and
Parameters Estimates Assessment of Scale validity and Reliability (Conbach’s Alpha and
Exploratory Factor Analysis Hypotheses Testing*
Alternative Model and Multi-group Analysis*
Remarks: Adapted from Arnold and Reynolds, 2003; Duman, 2002 * SEM analysis, hypothesis testing/alternative model &multi-group analyses were separately performed for recent
and prospective home buyers

136
This chapter presents the results of the first procedure of the data analysis. Content analysis technique was used to analyze the data gathered from the focus groups discussions. The focus of this part is to gain insight in consideration set formation which usually performs by the buyers in the first decision stage. Two specifying objectives of the data analysis were set as: 1) to identify the major criteria and the process of consideration set formation, and 2) to study the decision rules home buyers use in this stage. Ten focus group discussions were conducted from January to March 2006. A total of 71 participants were included. All participants were recent home buyers who bought their houses within the past twelve months. Sixty-five participants already moved into their new houses while the rest had not moved in yet. All of them were grouped by the characteristics of their houses i.e., prices and brands.
To avoid the extraneous effects of some factors such as price and brand of the real estate firm, the participants were categorized into groups as follows:
Table 5.1: The Demographic Details of Focus Group Discussion
Group Characteristics of the house No. of participants
No. of housing project(s) Location of the house
1 7 1 Rangsit 2
Three to five million Baht from one real estate developer 8 1 Rattanatibet
3 7 3 Wacharapol 4
Three to five million Baht from various real estate developers 9 3 Ramkhumhang
5 7 1 Rangsit 6 6 1 Kaset-Navamintr 7
More than five million Baht from one real estate developer
7 1 Rattanatibet 8 7 3 Ratchapruk 9 6 3 Rama 2 10
More than five million Baht from various real estate developers
7 4 Wacharapol
To control the effect of the price, participants were categorized into two major groups, those who bought a three to five million baht house and those who bought a more than five million baht house. Participants who bought three to five million baht house were divided into four subgroups. Each subgroup had seven to nine participants.
137
Next, all members of the first two groups were categorized by their housing projects i.e., groups of those who owned the houses in the same housing project and of those houses in various housing projects. Finally, a total of ten subgroups were formed: four had three to five million baht with two from the same housing projects and another two from various projects and six were higher price subgroups in which three came form the same housing projects and the rest from various housing projects. The details of the number of participants, housing projects, and their location were presented in Table 5.1. Qualitative data related to the common criteria and decision rules used for choice consideration and developmental processes of the consideration set were gathered (The details are shown in the discussion guide in Appendix A). By performing a content analysis, the key criteria and the formation process of consideration set were specified. In addition, the similarities and differences of the characteristics of consideration set formation of various types of home buyers were identified. As such, the content analysis results are categorized into three parts as: 1) consideration set formation criteria, 2) size of the consideration set, and 3) the decision rules home buyers use when they are establishing their consideration set. The criteria and process of consideration set formation were included in the first parts. The findings are as follows:
Consideration Set Formation Criteria To buy a product, consumers usually have to choose a choice form many products choices that are available in the market. It is most likely for the buyers to unable to consider all choices based on some limitations and constraitns. To deal with this problem, the buyers were likely to form a reduced set of choices by using some criteria to screen out the unqualified product choices. As a result, they could focus on only a small number of choices when making their choice selection. This reduced set is known as a consideration set. The criteria consumers use to form their consideration set were firstly derived from the internal information which was currently available in their mind (Bettman, 1979; Punj, 1987). If the internal information was insufficient, more

138
information would be searched externally in order to gain more specific criteria. Choices that passed the cutoff point of each criterion were included in the consideration set. In the home buying situation, some previous research indicated that price level, style, design, utility function, housing innovation and technology, and other important housing features were common criteria home buyers used when they formed their consideration set (Kiel and Layton, 1981; Gibler and Nelson, 2003). However, Rosiers et al. (2005) found only location to be the major component of house consideration. As such, the key important housing features should be the major criteria for home buying consideration. The data gathered from the focus groups indicated that most home buyers used four common criteria to develop their consideration set. These four criteria were location, price level, size and style of the houses, and finally, brands of real estate developers. Most home buyers used these four factors as their key consideration criteria although they considered them in the different details based on his/her knowledge, past experience, financial constraints, and even psychographic factors. The results also indicated that most home buyers tended to engage in almost similar processes when they were developing their consideration set. The details of each criterion are presented in the following part. Location
The first consideration criterion mentioned by most home buyers was the location of the house. All participants specified it as the first and most important criterion even though it was sometimes perceived in a slightly different way. Home buyers initially thought of zoning areas in which the housing projects would be located, i.e., Northern, western, northeastern, southern, eastern, and central Bangkok. There were three major characteristics of location that influenced home buyers to specify their interested location: 1) distance to their own and/or their spouse’s family, 2) distance to their workplace and/or children’s school, and 3) traffic. Most participants reported that the first factor they

139
considered was the area where he/she or his/her couple had been living. They tried to find houses that were located in the same area of their family houses because they felt comfortable with its geographical characteristics and, in addition, it is not difficult to visit their parents and relatives. However, some participants disregarded this idea and look for other locations that would serve the other personal needs of the buyers.
For some families in which both of the husband and wife had to go out for work, they preferred to the area where they could reach their workplace easily. For families with children, they specified the area which was near their children’s school. However these factors seemed to help home buyers to select the zone of the house but not a specific area. The more important location factor was about transportation and traffic. Home buyers liked to get the location with few traffic problems. The location might be either at or away from the main road i.e., in the soi if it was not too small and had little traffic congestion since home buyers usually used their private cars for transportation. As such, the high potential housing locations which received interest from most home buyers were the areas close to express ways, near the main roads, or linked directly to the business area of Bangkok. The public transportation facilities such as BTS or MRT received less interest from home buyers because they perceived that the mass transportation services could not cover all areas of Bangkok. Even though their houses were close to the BTS or MRT station, they might get to the BTS or MRT easily but they could not arrive at all places they would like to go. They had to use other public transportation such as buses or taxi to reach the place they would like to go which would be more expensive and less convenient. Thus, the current mass transportation services are not attractive enough in their opinion. Moreover, the houses that are within walking distance of the BTS or MRT station were usually high-priced condominiums, not a single-detached house. Therefore, the types of the house in the central area i.e., near mass transportation station would not match well with home buyers who wanted a single-detached house of course. As a result, the most attractive location for the recent home buyers who bought houses within this 12 month-period were Kaset-Navamintr, Ekamai-Ramindra, Rama 5, Ratchaphruek, Kalpapreuk and new Pinklao-Sathorn road

140
because they thought that these areas are the extension of the city with high business potential, and they could travel comfortably. However, very few participants bought houses in these areas because of the high price level was very high i.e. varying from six to 30 million baht per unit.
As the first consideration criterion for home buying, various aspects of location were considered especially the traffic and the distance to central area, workplace and/or children’s school. Some home buyers want a house that is near their family house while some buyers look for a house that is in the high potential area. The traffic was only one aspect that was mentioned by most home buyers while the other preferred locations were based on the buyers’ individual preferences.
Price Level The second criterion for consideration set formation was the price level of the house. Most home buyers thought of their capability to pay for both down payments to the real estate developers and monthly payments to the financial institutes. Consequently, they set up a range of the price or maximum price of the house that they could afford. Most participants reported that they set up both minimum and maximum price. These buyers did not consider the houses that were cheaper than the minimum price since they thought that the house is a durable and valuable asset to invest. As such, they would like to get the best possible house. This made some participants consider the houses with higher prices than their set-up budget in order not to miss any good choices that may be worth their money. In the opposite point of view, some home buyers said they excluded all unaffordable houses out of their consideration since it would be impossible to purchase them. However, the price expected in the first stage of consideration set formation was usually lower than the actual prices of the houses that were available in the market. Most home buyers who bought a less than ten million baht house reported that they considered the price and sales promotional campaigns such as cash discount,

141
a period of low-interest or no-interest payment, and premiums especially furniture, air conditioners, landscape decoration, and other household appliances simultaneously. They usually trade off these sales promotions with the actual price of the house. In contrast, those who bought the higher priced houses indicated that they considered only the price and cash discount. Any premiums such as furniture, home appliances, or other items were not of interest to these home buyers since they were mot match well with the interior decoration of their houses. Also, they were not interested in the low or no interest down payment since the down payment was perceived as affordable for them. So, the price discount was the only sales promotion in which they were interested. Price was usually considered with the buyers’ financial capability. The buyers seemed to set up the affordable price and use that price level as a criterion to form their consideration sets. Most home buyers considered all sales promotion and other monetary offers together with the price of the house. However, only price and cash discount could attract the buyers who bought the more-than ten million baht houses. Style, Design, and Sizing of the House Family characteristics of each home buyer influenced the size and design of the house. Home buyers with different family sizes tended to use different criteria to form their consideration sets. The evaluation criteria were dependent on whether the houses occupied were only for the home buyers themselves, or also for their children and/or for their parents. Therefore, the sizing and utility function of the houses were different across home buyers.
Most home buyers are likely to have a broad idea about the size, style, design, and utility of the house which was related to their preferences and life styles. Home buyers mostly drew only a rough picture of the house such as oriental style, eastern/ western style, Thai northern style, Bali style, modern style, etc or how many bedrooms and bathrooms it should have. Most participants reported that they could not specify the style of the house in detail i.e., what they have are only the broad ideas of the looks of the house and also housing projects. However, most home buyers wish to
142
get a house that provides them all possible facilities with a green environment and relaxing garden. New couples who had just started their married lives and worked outside did not desire a large size house but would like to get a modern house with flexible usage area, high technology, convenience to live, and also proximity to green nature. However, most home buyers felt that all housing projects they visited seemed to have the same designs in both landscape and the house. They found very rare places that were different from others, for instance houses with special interior design providing more utilization of the space, Bali’s gardening style, or home automation, etc.
Home buyers seemed to have different personal reasons to select the different types of the house. Some buyers preferred houses that are under construction while others liked ready-to-live-in houses. Many experienced home buyers reported that they considered only the houses that are under construction because they thought they could control over construction quality, i.e. structure of the house and construction materials. Besides this, they could modify some structures of the house to match well with their interior decoration either on their own or with the aid of interior designers. In contrast, most first time home buyers reported that they considered only “ready-to-live-in” houses since the actual features of the house and the construction quality could be seen. Therefore, both first-time and non first-time home buyers used the type of the house as a criterion of their consideration set formation but in the different ways. However, some first time home buyers preferred the under construction houses and also some repeat home buyers preferred the ready-to-live-in houses. The preferred type of houses was associated with home buyers’ prior knowledge and experience, life constraints, and individual preferences.
The selection of the types of the houses also depended on time and other individual constraints. Home buyers who had some personal or family constraints, such as getting married, changing the workplace, or other problems that forced them to move into a new house within a short period of time, would consider a ready-to-live-in house. Those who have no time constraints seem to consider both types of house. Some home buyers said that the type of house was not an important point of concern. They had not

143
seen the discrepancy between these two types of houses. This group seemed not to consider this factor as a criterion for their consideration set formation.
Home buyers mostly had an unclear picture of the design and style of the houses at the beginning of their consideration set formation. Most buyers judged whether a choice was attractive when they saw an actual mock-up house or a housing model shown in the sales offices or in the brochures. The size and utility function of the house mostly depended on the family size, life styles, and personal needs of the buyers. Home buyers’ preference on each type of the houses- the under-construction and ready-to-live-in houses- was inconclusive. The selection of the type of the house depended upon the buyers’ individual constraints and personal reasons. Brand
Most home buyers consider the brand of the house based on either the company name of the real estate developers or the name of housing projects. The brand of the house can be categorized into two groups: premium and non-premium brands. Premium brands represent the real estate developers that have provided several housing projects in various areas of Bangkok and its vicinity. They may provide only a few housing projects but the sizes of the projects were very large or the prices were very expensive. These brands are generally known by consumers as “Land and Houses,” “Sansiri,” “Property Perfect,” “Areeya,” “Quality House,” “Nobel House,” “Golden Land,” “Lalin Property,” “Supalai,” and so forth. Most of them are public companies that are registered in the Stock Exchange of Thailand.
The houses with premium brands were perceived as high quality, high standard, high credibility, good customer service, and high price. It is common that most home buyers could recall and/or recognize these brands. Non-premium brands, in contrast, represented the housing projects or real estate developers that operated only a few housing projects in one area. These brands were usually known by the home buyers who were searching for a house in that particular area. The houses with non-premium brands were likely to be perceived as less quality, lower standard, and also lower price.

144
Some home buyers included only the premium brands in their consideration sets while some buyers consider both premium and non-premium brands. Most home buyers were likely to exclude the non-premium brands from their consideration set if their prices were not significantly lower than that of premium brands in the nearby area.
Most participants reported that even though the brands of the real estate developers were known and premium, they had not much information about them especially in their location, price level, types of the house etc. home buyers started their home buying process i.e., consideration set formation by searching for related information from newspapers and home buying guide magazines. Then, they looked for information from roadside billboards. Some participants said that after specifying the location, they made their mini survey by driving by their interested area to collect information about the housing projects that are available in that particular area.
Brands, in the real estate context, had some typical characteristics that seemed to be different from the brands of other product categories. The buyers showed less loyalty on the brands and also could not associate the brands with the quality of the house. The brands of the real estate developers or the housing projects could be categorized into two major groups: premium and non-premium brands. Most home buyers were aware of the premium brands i.e. most premium brands could be recalled or recognized by the buyers but they had not much information about the brands and the products offered under those brands. Thus, the key competitive advantage of the premium brands was about the level of social acceptance. Home buyers considered the brands together with other criteria especially prices and locations when they formed their consideration sets.
Size of Consideration Sets
The number of choices included in the consideration set was different across home buyers. One participant said he considered only one choice. He made a decision whether to buy a house in a housing project that was very near his family

145
house. However, this seemed to be an extreme case. Most home buyers reported that the numbers of houses they considered varied from two to three housing projects to five to ten projects. The discrepancy between the sizes of consideration sets was based on consumer individual differences and their constraints. Home buyers who had time constraints tended to make a smaller-size of consideration set. Participants who reported that they had to move to the new houses within a limited period of time for any reason seemed to have broad requirement in each criterion and, considered only few choices. Thus, a smaller consideration set was formed. One participant who had to move to a new house within three months for work reasons used only three criteria for his consideration set formation: the type of house, location, and price level. In terms of other details, he considered only the ready-to-live-in house not farther than 20 kilometers from his new office for the location and not more than five million baht. He spent only one week searching and discovered three housing projects that met his requirements. He finally chose one within two weeks after starting his home buying process.
In addition, if the buyers limited the location of interest in one area in which only few houses were available, the numbers of choices included in the consideration sets would also be small. Some home buyers who enjoyed searching for information and having more knowledge on housing products seemed to have larger size of consideration sets. Moreover, they hadn’t fixed the number of choices in their consideration set when they began searching for information from any sources but tended to add more choices when they got some more information. These home buyers often used a longer period of time for information search and final choice selection. Five participants of the focus groups who enjoyed searching information spent almost two years and visited 20 to 30 housing projects before choosing their final choice.
However, the size of the consideration set was sometimes dependent on the requirements on each criterion. One participant reported that he had only three criteria for house selection. First, the distance from the new house to his factory should not exceed ten kilometers meaning that it should be in the Rama 2 road. The second criterion was about the size of the house which should not be smaller than 200 square

146
wah. The last criterion was that the house should be luxury with the price range of about 20 to 30 million baht. Based on his criteria, he found only three housing projects that met his requirement. So his consideration set consisted of only three choices which were very small in size.
The number of choices included in the buyers’ consideration sets depended on both choices’ and buyers’ characteristics. The time and family constraints seemed to influence the buyers to consider the less numbers of choices while some buyers’ personality could involve the buyers to search more information and, as a consequence, form a large size of consideration set.
Decision Rules
Decisions involving widely disparate alternatives require the consumer to
use criteria that were more abstract to evaluate the alternatives. To use four criteria: location, price level, housing style, and brands to develop the consideration sets, the buyers had to use some rules to evaluate those criteria (Engel et al., 1995). The decision rules would help the buyers to make decision whether to include any particular choices in their consideration. Home buyers commonly set up the minimum requirement of each criterion. The cutoff points such as limited location, specific price range, and minimum size, and so on were usually set. The minimum requirement of each criterion must be attained. The choices were included in the consideration sets if all criteria exceeded those cutoff points. The less-than-requirement criterion could not be compensated by any superior characteristics of other factors. Thus, the non-compensatory decision rule was usually applied in this stage. However, there are two possible processes for the buyers to form their consideration set, by using either conjunctive or disjunctive rule. Home buyers who used a conjunctive rule set minimum acceptable levels on all attributed criteria and eliminate the alternatives that do not meet all the minimums. If the choices meet all the minimums, then home buyers will include those choices in

147
their consideration set. Most participants reported that they first set up a limited acceptable level for their criteria which may be too difficult or too easy to meet. For example, the location may be not more than five kilometers from the express way, the size of the house must be at least 100 square wah, the price should be three to five million baht, and the brand ought to be premium. Many of them said that mostly they found none of the housing choices meets all of their first cutoff requirements. In case home buyers found that their initial criteria were not practical, some of them modified their acceptable minimum requirements such as reducing the required size, and broadening the location area or accepting a longer distance to the express way and so on but all of them said they could not increase the maximum price level since it was related to their affordability. Some buyers used disjunctive rules to screen the choices by establishing a minimally acceptable level and used it as a cutoff point for each criterion. If an alternative met or exceeded only one cutoff point, they included that choice in their consideration set. For example, one home buyer’s criteria were that the house should be located not farther than ten kilometers from the children’s school. The house ought to be 100 square wah or more with a large yard, and the price should not exceed five million baht. He included all the choices that met one of the three criteria in his consideration set.
The decision rules seemed to be not strict. The buyers might use one rule and switched to another rule when they found that those rules were not appropriate. However, only non-compensatory rules were used in this consideration set formation. In contrast, the decision rules used in the next stage, choice selection, seemed to be more complicated. Home buyers used various types of decision rules such as lexicographic rules, elimination by attribute, compensatory rules, and so forth. For those who used lexicographic rules, they first rank all determinant attributes by the order of importance. Then, the choices that excelled in the highest important attribute will be accepted. This means that if one choice is better than all the others on the most important attribute, the home buyer selected that choice. If the home buyer perceived two or more as equal on

148
the most important criterion, then the choices were compared with regards to the second most important determinant attribute. For example, one home buyer decided that the traffic was the most important criterion, the green environment of the housing project was the second most important, and neighbor was the third important. This home buyer found many housing projects available in his preferred district, so he compared the environmental surroundings and found two to three housing projects provide the same environmental quality. Therefore, he went on to consider the neighbors. Finally he could select one house as his final choice.
However, most home buyers reported that their choice selection processes were more complicated. Most of them considered all attributes, not just price, types, location, and other product attributes but they also considered the credibility of the real estate developers, service, risk, by applying a compensatory decision rule. All related housing attributes and other factors were considered simultaneously. The tradeoffs among all superior and inferior characteristics were made. Home buyers identified all the determinant attributes, integrated all factors together and placed value to each choice. Strengths in one attribute could offset weaknesses in another. A large house in the non-premium brand might be equally attractive to the buyer as a small house in the premium brand. Home buyers who used compensatory rules would have sufficient knowledge and ability to identify determinant attributes, rank them, score the alternatives, and calculate a relatively complex answer which may be inconsistent with reality. In the actual situation, home buyers may have incomplete information or an inability to complete the complicated comparison and computation. Thus, they might make a less than optimal decision.
To understand the choice selection process, the research model proposed a conceptual framework that focused on the choice selection. The perceived value of the product was proposed as the key influencing factors of the choice selection while another six factors about the product, brand, sales service, price, risk and the involvement of the buyers together with relationship quality were proposed as
149
antecedents of perceived value. This framework was examined and its results will be presented in the next chapter.
Most home buyers used a combination of decision rules in choosing a housing product as a sequential decision strategy. First, they apply a non-compensatory decision rule, either conjunctive or disjunctive rule, to eliminate choices that do not possess the minimum requirements on primary criteria such as location, price, style, design, size, and brand. Next, they use a compensatory rule to evaluate each choice across a wide range of secondary criteria such as product quality, sales service quality, brand, potential risk, price and also their behavioral involvement to make the final choice selection.
Summary This chapter presents the results of content analyses in an attempt to explain the consideration set formation which is the first stage of decision making. Data gathered from ten focus group discussions with 71 recent home buyers were used. The analyses were done to explain three major points: 1) the consideration set formation criteria, 2) the size of consideration set, and 3) the decision rules. The results indicated that home buyers commonly used four criteria to form their consideration sets which were location, price level, brands, and size & style of the house. Home buyers mostly considered all four criteria by setting a minimum requirement for each criterion. The decision rules used was mostly non-compensatory rules in that any criteria that were less-than-requirement could not be compensated by other superior factors. The size of consideration sets varied from two to three housing projects to five to ten projects. However, some home buyers considered only one choice while some buyers include 20 to 30 choices into their consideration sets.

150
CHAPTER 6
STRUCTURAL EQUATION ANALYSIS AND HYPOTHESES TESTING
As discussed in Chapter 5, three data analyses: content analysis, descriptive analysis, and test of structural equation model were performed in this research. This chapter presents the results of the second and the third procedures in order to explain the choice selection process which is the second stage of decision making. Two survey datasets, 420 from recent and 421 from prospective home buyers were used (see the details in Chapter 4). In the descriptive data analyses, each dataset was separately described to understand the characteristics of home buyers in pre- and post-purchase context. The sample profiles corresponding to the personal data of respondents and their housing characteristics were presented followed by the comparisons of the means of the major research constructs between recent and prospective home buyers and the subgroups of each dataset. In the third procedure, the structural relationships among constructs as proposed in the conceptual framework were examined. The analyses were comprised of four parts: 1) the item analysis including reliability test and exploratory factor analysis; 2) assessment of confirmatory factor analysis; 3) test of structural equation modeling for the post-purchase dataset; and 4) test of structural equation modeling for the pre-purchase dataset. The assessments of structural relationship of the base model were performed in part 3 and 4 and hypotheses 1 to 10 were tested. The multi-group comparisons were performed in addition to test Hypotheses 11 and 12. The data were analyzed by AMOS 6 and SPSS 14. The diagram shown in Figure 6.1 presents the organization of overall structural equation analyses and hypotheses testing. The details of all data analyses are discussed in the following part.

151
Figure 6.1: The Organization of the Data Analyses Part 1: Sample Characteristics
Sampling Profiles & Characteristics of the house - Recent Home Buyers - Sample Profiles - Housing Profiles - Prospective Home Buyers - Sample Profiles - Housing Profiles
Part 2: Mean Comparisons of Samples Mean Comparisons between
- Recent VS. Prospective buyers - Comparisons of Subgroups - Premium & Non-premium Brand - Three Price Level
Part3: Tests of Hypotheses Validity and Reliability Assessment
- Item Analyses - Exploratory Factor Analyses
Confirmatory Factor Analyses - Assumption Checks - Determination of SEM Fit Indices - CFA results
Model fits and Hypotheses tests for the Recent Home Buyers
- Assessment of Fits of the Base Model - Hypotheses Testing - Direct Effects of Antecedents (H1-H6) - Direct Effects of Sub-Dimensions of Antecedents (H1a-c; H5a-b) - Direct Effects of Sub-Dimensions of Mediators (H3a-c; H8a-c) - Indirect Effects of Antecedents (H7-H10) - Robustness of the Model (H11) - Effect of the Moderator (H12)
Model fits and Hypotheses tests for the Prospective Home Buyers
- Assessment of Fits of the Base Model - Hypotheses Testing - Direct Effects of Antecedents (H1-H6) - Direct Effects of Sub-Dimensions of Antecedents (H1a-c; H5a-b) - Direct Effects of Sub-Dimensions of Mediators (H3a-c; H8a-c) - Indirect Effects of Antecedents (H7-H10) - Robustness of the Model (H11)
Source: Author
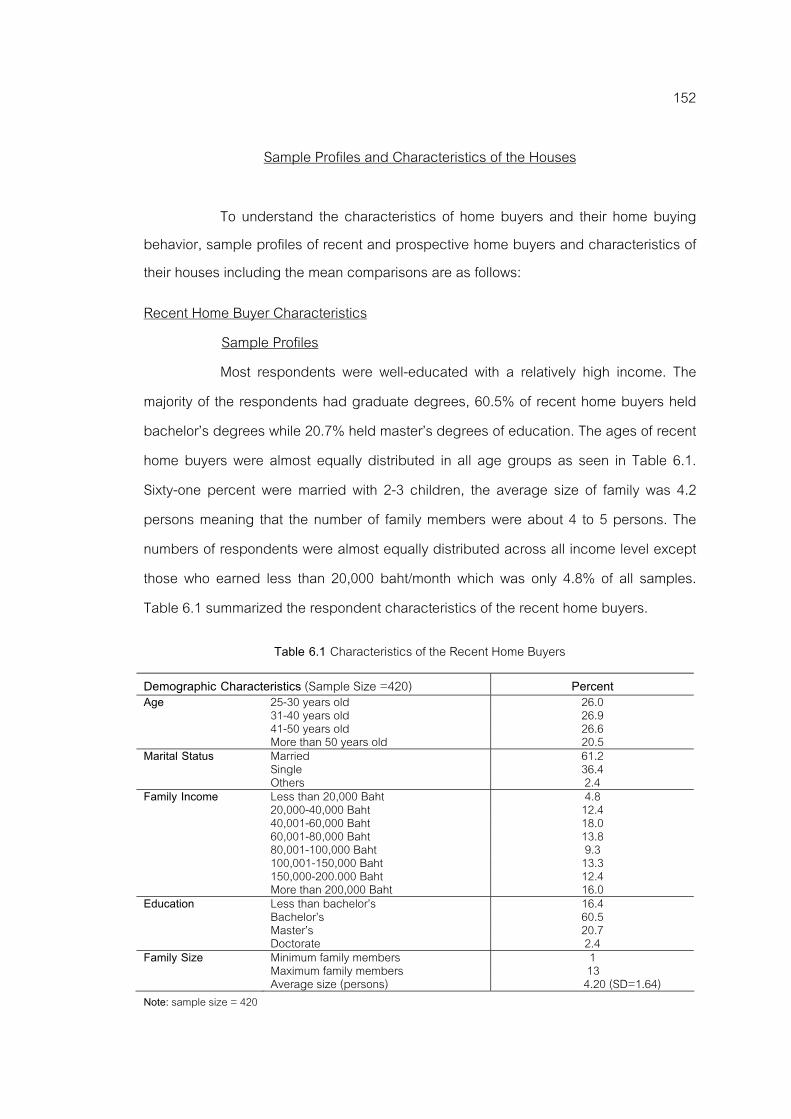
152
Sample Profiles and Characteristics of the Houses
To understand the characteristics of home buyers and their home buying behavior, sample profiles of recent and prospective home buyers and characteristics of their houses including the mean comparisons are as follows: Recent Home Buyer Characteristics Sample Profiles Most respondents were well-educated with a relatively high income. The majority of the respondents had graduate degrees, 60.5% of recent home buyers held bachelor’s degrees while 20.7% held master’s degrees of education. The ages of recent home buyers were almost equally distributed in all age groups as seen in Table 6.1. Sixty-one percent were married with 2-3 children, the average size of family was 4.2 persons meaning that the number of family members were about 4 to 5 persons. The numbers of respondents were almost equally distributed across all income level except those who earned less than 20,000 baht/month which was only 4.8% of all samples. Table 6.1 summarized the respondent characteristics of the recent home buyers.
Table 6.1 Characteristics of the Recent Home Buyers
Demographic Characteristics (Sample Size =420) Percent Age 25-30 years old 26.0 31-40 years old 26.9 41-50 years old 26.6 More than 50 years old 20.5 Marital Status Married 61.2 Single 36.4 Others 2.4 Family Income Less than 20,000 Baht 4.8 20,000-40,000 Baht 12.4 40,001-60,000 Baht 18.0 60,001-80,000 Baht 13.8 80,001-100,000 Baht 9.3 100,001-150,000 Baht 13.3 150,000-200.000 Baht 12.4 More than 200,000 Baht 16.0 Education Less than bachelor’s 16.4 Bachelor’s 60.5 Master’s 20.7 Doctorate 2.4 Family Size Minimum family members 1 Maximum family members 13 Average size (persons) 4.20 (SD=1.64) Note: sample size = 420
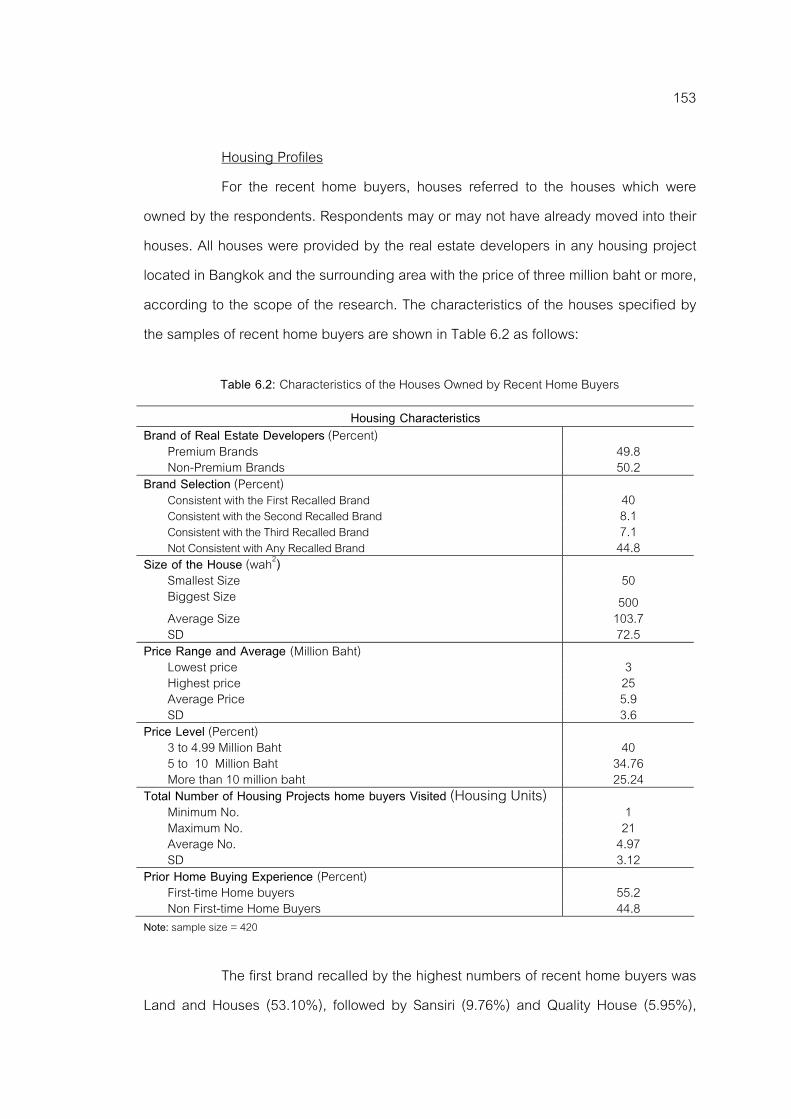
153
Housing Profiles For the recent home buyers, houses referred to the houses which were
owned by the respondents. Respondents may or may not have already moved into their houses. All houses were provided by the real estate developers in any housing project located in Bangkok and the surrounding area with the price of three million baht or more, according to the scope of the research. The characteristics of the houses specified by the samples of recent home buyers are shown in Table 6.2 as follows:
Table 6.2: Characteristics of the Houses Owned by Recent Home Buyers
Housing Characteristics Brand of Real Estate Developers (Percent)
Premium Brands 49.8 Non-Premium Brands 50.2
Brand Selection (Percent) Consistent with the First Recalled Brand 40 Consistent with the Second Recalled Brand 8.1 Consistent with the Third Recalled Brand 7.1 Not Consistent with Any Recalled Brand 44.8
Size of the House (wah2) Smallest Size 50 Biggest Size 500 Average Size 103.7 SD 72.5
Price Range and Average (Million Baht) Lowest price 3 Highest price 25 Average Price 5.9 SD 3.6
Price Level (Percent) 3 to 4.99 Million Baht 40 5 to 10 Million Baht 34.76 More than 10 million baht 25.24
Total Number of Housing Projects home buyers Visited (Housing Units) Minimum No. 1 Maximum No. 21 Average No. 4.97 SD 3.12
Prior Home Buying Experience (Percent) First-time Home buyers 55.2 Non First-time Home Buyers 44.8
Note: sample size = 420 The first brand recalled by the highest numbers of recent home buyers was Land and Houses (53.10%), followed by Sansiri (9.76%) and Quality House (5.95%),

154
respectively. However, there were only 21.7% of the samples who bought the houses from Land and Houses PCL. Most samples (44.8%) bought the houses with the brand that they hadn’t mentioned while 40% bought the houses provided by the real estate developer that they first recalled. The rest selected houses that were consistent within their second recall (8.1%), and third recall (7.1%), respectively. The numbers of respondents who selected the houses that were consistent with their recalled and non-recalled brand may reflect the importance or impact of the brands on choice selection. However, the more analysis of effect of the brand will be discussed in the structural relation analysis. The size of the houses varied from 50 to 500 square wah with the average size of 103.55 and standard deviation of 72.55 square wah. The price varied from three to 25 million with average price of 5.89 and a standard deviation of 3.62 million baht. Forty percent of the samples owned three to 4.99 million baht houses while 34.76% owned five to ten million baht houses and 25.24% owned the more than ten million baht houses. Approximately fifty-five percent were first time home buyers. Most samples took around four to six months (40.5%) and seven to 12 months (27.9%) for their entire decision process while spending around one to three months (38.8%) and less than one month (24.3%) to select their final choice by visiting the housing projects they selected by one to twenty times (The average was 3.3 times with a standard deviation of 2.4 times). The number of housing projects they visited before choosing their final choice varied from one to twenty one with an average of five times and a standard deviation of 3.1 times. The reasons to buy the houses were different across home buyers. Most respondents bought their houses in order to get a better environmental surrounding (21.0%), to have larger houses (20.7%), to avoid transportation and traffic problems (18.1%) and to ensure long term security (12.3%), respectively. However, some of them bought their houses because they planned to get married (8.4%), to have a house nearby their office (8.3%), to move from their parents’ house (7.1%), and for monetary speculation (4.0%). The details are shown in Table 6.3:

155
Table 6.3: The Reasons of Recent Home Buyers to Buy the House Reason for buying a house Percent
Move from the parents’ house 7.1 Get married 8.4 Wishing for a better environment 21.0 Transportation and Traffic 18.1 Want a bigger house 20.7 For long term security 12.3 For monetary speculation 4.0 Want a nearby-office house 8.3 Total 100
Note: sample size = 420 The numbers of the houses with premium and non-premium brands were almost equal, with percentage of 50.3 and 49.7% respectively. Actually, the number of houses with premium and non-premium brands selected by consumers would indicate the brand selection of the respondents. However, based on the data collection method in which an equal quota of the respondents who selected premium and non-premium was first set, the samples of each group were randomly selected accordingly. Therefore, the proportion of samples for premium and non-premium brands in this research could not represent the actual characteristics of brand selection of the home buyers. Table 6.4 shows the details of the brands selected by the samples of the recent home buyers.
Table 6.4: Brand of the House Owned by Recent Home Buyers
Housing Project Percent Land and Houses 21.7 Quality House 6.9 Sansiri 5.5 Noble House 4.8 Areeya Property 2.6 Property Perfect 2.4 Supalai 2.4 MK Real Estate 1.2 Preuksa 1.2 Golden Land 0.5 Lalin Property 0.5 NC Group 0.5 Wangthong 0.5 KC 0.2 Premium Brands 50.7 Non-Premium Brands 49.3 Total 100
Note: sample size = 420

156
Prospective Home Buyers Sample Profiles Table 6.5 summarizes the respondent characteristics of the prospective home buyer as follows:
Table 6.5: Profile of the Respondents for Prospective Home Buyers
Demographic Characteristics Percent Age 25-30 years old 47.7 31-40 years old 34.7 41-50 years old 13.3 More than 50 years old 4.3 Marital Status Married 32.1 Single 66.7 Others 1.2 Family Income Less Than 20,000 Baht 2.4 20,000-40,000 Baht 39.4 40,001-60,000 Baht 30.9 60,001-80,000 Baht 12.6 80,001-100,000 Baht 7.1 100,001-150,000 Baht 3.1 150,000-200.000 Baht 1.6 More Than 200,000 Baht 2.9 Education Less than Bachelor 14.0 Bachelor 69.8 Master 15.7 Doctorate 0.4 Family Size Minimum family members 1 Maximum family members 9 Average size (persons) 3.17 (SD=1.69) Note: sample size = 421 Most prospective home buyers were well-educated with relatively high income. The majority of the respondents had a graduate background - 69.8% hold bachelor’s degrees while 15.7% hold master’s degrees of education, while the rest have less than a bachelor’s degree (14%) and doctoral degree (0.4%), respectively. Most of them were 25 to 30 and 31 to 40 years old (47.7% and 34.7%) while 13.3% and 4.3% were 41 to 50 years old and more than 50 years old. The number of young home buyers
157
aged 25 to 40 years old was significantly more than the older home buyers aged 41 and more (χ2= 198.26, p<.01). The age of recent and prospective home buyers seemed to be different in that the ages of recent home buyers were uniformly distributed in all age groups while most prospective home buyers (84.5%) were 25-40 years old. The fact that some young home buyers might terminate their home buying process without buying any houses could explain the difference in age groups between recent and prospective home buyers. Thus, these prospective home buyers had never become recent home buyers. The data showed that the marital statuses of recent and prospective home buyers were not different while family sizes of both groups were slightly different with the family sizes of recent home buyers being larger (x=4.20 and 3.17, t=10.05, p<.001). However, no clear pattern could be found. In addition, the income of prospective home buyers was significantly different from that of recent home buyers (χ2(7)= 177.20 p<.01), The recent home buyers’ incomes were equally distributed across all income levels while the incomes of most prospective home buyers were mostly 20,000-40,000 and 40,001-60,000 baht/month which were 39.4% and 30.9% respectively. The distinction of sample characteristics between recent and prospective home buyers might be explained by the theory of relationship between purchase intention and actual purchasing behavior. Sun & Morwitz (2004) found that purchase intention is an imperfect indicator for the actual purchasing since intention can change over time. The correlation between intention and actual purchase would also be imperfect. The actual purchase will be more accurately predicted if intention is transformed into a latent value by subtracting the willingness-to-pay with the price and the effect of promotions (Infosino, 1986). This indicates that the prospective home buyers may stop their home buying process for any reasons at any decision stage. Thus, some prospective home buyers may fail to complete their home buying process. In contrast, the recent home buyers were customers who already completed their home buying process. Based on this reason, it is undoubted that the demographic characteristics of the recent and prospective home buyers were different.
158
Another characteristic different between recent and prospective home buyers was the marital status since most recent home buyers (61.2%) were married while most prospective home buyers (66.7%) were single. The descriptive information on age and marital status indicated some different demographic characteristics of the recent and prospective home buyers. The prospective home buyers seemed to be somewhat younger and most were unmarried. However, based on the observation and short interview with the samples, most prospective home buyers visited housing exhibitions with their girlfriends or boyfriends while some reported that they plan get married within a short period of time. Housing Profile For the prospective home buyers, a house referred to the choice in which he/she was most highly interested since these respondents had not made any choice yet. In the data collection process, the respondents were asked to explore their own internal information and select one best or highest interested house. That house must be provided by the real estate developers in any housing project and located in Bangkok or its vicinity with the price of three million baht or more. All data given in the questionnaire would be based on that particular house. The houses selected by most respondents (43.2%) were consistent with the first brand they had recalled. The size of the houses varied from 50 to 250 square wah with an average size of 75.6 square wah and a standard deviation of 41.64 square wah. The price varied from three to 33 million baht with an average price of 3.93 million baht and a standard deviation of 2.18 million baht. Most respondents (82.4%) were interested in three to 4.99 million baht house, while 15.2% and 2.4% were interested in the houses with five to ten million baht and more than 10 million baht. The prospective home buyers appeared to be attracted by lower price level since 82.4% selected 3 to 4.99 million baht house while only 40% of recent home buyers chose this price. The reason might be related to the current upward interest rate trend (Thailand Property Report, 2006) which would reduce the home buyers’ affordability to pay for the house.

159
Table 6.6 Housing Characteristics of Interest to Prospective Home Buyers Housing Characteristics Percent
Brand of Real Estate Developers (Percent) Premium Brands 63.2 Non-premium Brands 36.8
Brand Selection (Percent) Consistent with the First Recalled Brand 43.4 Consistent with the Second Recalled Brand 12.1 Consistent with the Third Recalled Brand 7.4 Not Consistent with Any Recalled Brand 37.1
Size of the House (wah2) Smallest Size 50 Biggest Size 250 Average Size 75.6 SD 41.6
Price Range and Average (Million Baht) Lowest price 3 Highest price 33 Average Price 3.9 SD 2.2
Price Level (Percent) 3 to 4.99 Million Baht 82.4 5 to 10 Million Baht 15.2 More than 10 Million Baht 2.4
Total Number of Housing Projects Home Buyers Visited (Housing Units) Minimum No. 1 Maximum No. 30 Average No. 6.71 SD 5.94
Prior Home Buying Experience (Percent) First-time Home buyers 68.2 Non First-time Home Buyers 31.8
Note: sample size = 421 The different proportions of premium and non-premium brands would infer the home buyers’ brand interest since the data were collected with the convenient sampling technique. Thus, the respondents were free to select any brand. The statistical difference (χ2(1)= 29.26 p<.01) between the numbers of respondents who were interested in the premium and non-premium brands indicated that the prospective home buyers were significantly interested in houses with premium brands more than those with non-premium brands. The top five premium brand for prospective home buyers were Land and Houses, Sansiri, Property Perfect, Supalai, and Quality House, respectively as seen in Table 6.7.

160
Table 6.7: Brand of the House of Interest to Prospective Home Buyers
Note: sample size = 421 The total number of housing projects home buyers visited varied from only one project to the highest of thirty with an average of 6.71 projects and a standard deviation of 5.94 projects. The average number of visited projects seemed to be slightly higher than that of the recent home buyers. The proportions of first time and non-first time home buyers were slightly different across two samples in which proportion of prospective first time home buyers was slightly higher than the recent first time home buyers (68.2% for prospective first time home buyers versus 55.2% for recent first time home buyers). The prospective home buyers reported that the reasons to search for a new house were to avoid the transportation and traffic problems (17.7%), to obtain long term security (16.8%), to get a bigger house (16.2%), to have a nearby-office house (16.1%), and to get a better environmental surrounding (16.0%), respectively. However, some of them search for the house because they planned to get married (6.7%), to move from their parents’ house (6.1%), and to conduct monetary speculation (4.2%). The details are shown in Table 6.8.
Housing Project Percent Land and Houses 16.6 Sansiri 7.1 Property Perfect 6.2 Supalai 5.5 Quality House 4.0 Preuksa 4.0 Areeya Property 3.6 Noble House 3.6 Lalin Property 3.1 KC 2.4 MK Real Estate 2.1 Krisda 1.4 NC Group 1.2 Sammakorn 0.7 Tararom 0.7 Wangthong 0.7 Golden Land 0.2
Premium Brands 63.2 Non-Premium Brands 36.8 Total 100.0

161
Table 6.8: The Reasons of Prospective Home Buyers to Buy the House
Reason to buy a house Percent Move from the parent's house 6.1% Get married 6.7% Wishing a better environment 16.0% Transportation and Traffic 17.7% Want a bigger house 16.2% For the long term security 16.8% For monetary speculation 4.2% Want a nearby-office house 16.1% Total 100.0%
Note: sample size = 421 Mean Comparisons between Each Type of Home Buyers Comparison of Recent and Prospective Home Buyers To understand the level of value and perceptual differences on value influencing factors, comparisons of the means of all major constructs were performed. Since the questions were designed as multi-item measurements for all constructs, the mean and standard deviation for each major construct will be presented instead of the mean and standard deviation for each measurement item. Based on the nature of the samples, recent and prospective home buyers were analyzed separately since they were independent groups. The mean differences between both samples were investigated. Also, the mean differences among subgroups of each sample were examined. Since brand, price, and consumer experience might have moderating effects on value development and the decision process, both sample groups were categorized by 1) brand of the real estate developer with home buyers categorized by brand into premium and non-premium groups, 2) price level of the houses with home buyers divided into three groups by the price of the house (3 to 4.99 million baht, 5-10 million baht, and more than ten million baht), and 3) prior experience in home buying with respondents categorized into two groups (first time and non-first time home buyers). To identify the difference between pre- and post-purchase context, the differences of level of value and its influencing factors between the recent and prospective home buyers

162
were analyzed. The means, standard deviations, and mean differences among subgroups are concluded as follows:
Table 6.9: Meana Comparisons between Recent and Prospective Home Buyers
Construct All Home Buyers
(n=841) Recent Home Buyers (n=420)
Prospective Home Buyers (n=421)
Mean Differenceb
Product Quality 4.63 (0.69)
4.62 (0.69)
4.64 (0.69)
-0.02 (-0.33)
Sales Service Quality 4.19 (0.97)
3.60 (0.69)
4.78 (0.84)
-1.17 (-22.10)***
Brand Equity 4.00 (0.78)
4.03 (0.73)
3.98 (0.82)
0.05 (0.90)
Personal Trust 4.31 (0.83)
4.03 (0.69)
4.58 (0.86)
-0.56 (-10.32)***
Personal Commitment 3.57 (0.74)
3.55 (0.59)
3.58 (0.86)
-0.03 (-0.63)
Relationship Quality: Firm Level
3.89 (0.70)
3.79 (0.59)
3.99 (0.78)
-0.20 (-4.25)***
Perceived Risk 3.74 (0.87)
3.91 (0.70)
3.58 (0.98)
0.33 (5.63)***
Consumer Involvement 4.34 (0.91)
4.32 (0.71)
4.35 (1.06)
-0.03 (-0.43)
Perceived Price 3.14 (0.73)
3.22 (0.66)
3.06 (0.80)
0.16 (3.16)***
Perceived Value 4.29 (0.67)
4.06 (0.62)
4.52 (0.63)
-0.45 (-10.49)***
Notes: a Each item is measured based on 6-point Likert scale (1=Strongly Disagree/Lowest, 6=Strongly Agree/Highest); Standard Deviations are shown in parentheses.
b Mean Differences were tested by independent t-test; t-value is illustrated in italic parentheses * p < .05; ** p < .01; *** p < .001 Both groups agreed that the value of the houses they selected was slightly high (x=4.29) meaning that most home buyers perceived the houses they selected as high value. The means of all constructs were higher than the mid-point of 3.5 except perceived price which was less than the mid-point. This indicated the positive perception on all benefits i.e., product quality, sales service quality, brand equity, and relationship quality (x=4.63, 4.19, 4.00, and 4.31, respectively) while the sacrifices i.e., perceived risk and consumer involvement (x= 3.74 and 4.34) were also perceived as slightly high. The significance of the positive effects of benefits and negative effects of sacrifices will be examined later in the test of model fit. The lower score on perceived price with a mean of 3.14 (3.22 for recent home buyers and 3.06 for prospective home buyers) indicated that the price is
163
reasonable for home buyers. Although the means of all major constructs of both recent and prospective home buyers were illustrated in the same directions, some different details of means were exhibited. As shown in Table 6.9, the comparison of the perceived value indicated a significantly higher value for the prospective home buyers than the recent home buyers (t=10.49, p<.001). The prospective home buyers also perceived the benefit factors e.g., product quality, sales service quality, and relationship quality to be more positive than the recent home buyers and perceived the sacrifice factors to be less negative than the recent home buyers. Significantly higher means of sales service quality (t = 22.10, p<.001), personal trust (t = 10.32, p<.001), and relations to real estate firm (t =4.25, p<.001) were illustrated. On the other hand, significantly lower means of perceived risk (t = 5.63, p<.001) and perceived price (t = 3.16, p<.001) for the prospective home buyers were also found. However, the different perception on product quality, brand equity, commitment with sales person, and consumer involvement were not shown to be different. It is not surprising that perceived value and some of its influencing tended to decline in the post purchase period. Since home buying is a long term process in which home buyers have to confront with several problems such as technical, monetary, timing, and even communication that may evoke some stress and negative feelings for the recent home buyers. This finding was consistent with the focus group results in which each recent home buyer complained a lot about several unexpected and unsolved problems about their houses. However, as the samples of recent and prospective home buyers in this research were independent, the analyses of their home buying processes were performed separately. Comparison of the Subgroups of Home Buyers To compare the level of perceived value and its influencing factors among subgroups of home buyers, the home buyers were categorized by the brands and price levels of the houses they selected and also their prior home buying experience. The first comparison was between premium and non premium brands. The results are illustrated in table 6.10.

164
Table 6.10: Means and Standard Deviations of Major Constructs Categorized by Real Estate Brand
Recent Home Buyers Prospective Home Buyers Construct Premium
Brand (n=209)
Non-PremiumBrand
(n=211) Mean
Difference b Premium Brand
(n=266) Non-Premium
Brand (n=155)
Mean Difference b
Product Quality 4.71 (0.67)
4.53 (0.70)
0.18 (2.64)**
4.63 (.68)
4.65 (.71)
-0.02 (-0.29)
Sales Service Quality 3.67 (0.71)
3.54 (0.67)
0.13 (-1.95)
4.73 (.81)
4.85 (.89)
-0.12 (-1.43)
Brand Equity 4.12 (0.76)
3.93 (0.69)
0.19 (2.67)**
3.97 (.81)
3.99 (.84)
-0.01 (-0.15)
Personal Trust 4.08 (0.72)
3.97 (0.65)
0.11 (1.69)
4.58 (.81)
4.59 (.96)
-0.01 (-0.14)
Personal Commitment 3.62 (0.65)
3.48 (0.53)
0.15 (2.55)*
3.55 (.84)
3.64 (.89)
-0.09 (-0.98)
Relationship Quality: Firm Level 3.87
(0.60) 3.71
(0.56) 0.16
(2.82)*** 4.00 (.76)
3.96 (.82)
0.04 (0.5)
Perceived Risk 3.86 (0.71)
3.96 (0.69)
-0.09 (-1.34)
3.62 (.97)
3.51 (1.00)
0.10 (1.03)
Consumer Involvement 4.35 (0.72)
4.30 (0.70)
0.06 (0.81)
4.34 (1.07)
4.37 (1.06)
-0.03 (-0.27)
Perceived Price 3.22 (0.63)
3.21 (0.68)
0.01 (0.17)
3.10 (.79)
3.00 (.81)
0.10 (1.23)
Perceived Value 4.09 (0.60)
3.98 (0.59)
0.11 (1.86)
4.51 (.62)
4.53 (.65)
-0.02 (-0.27)
Notes: a Each item is measured based on 6-point Likert scale (1=Strongly Disagree/Lowest, 6=Strongly Agree/Highest); Standard Deviations are shown in parentheses. b Mean Differences were tested by independent t-test; t-value is illustrated in italic parentheses.
* p < .05; ** p < .01; *** p < .001 The differences of perceived value and its influencing factors i.e., product quality, brand equity, commitment on sales person, relationship quality toward firm among subgroups were found. Even though the perceived value of the products were not different between home buyers who bought premium or non-premium brands, recent home buyers who bought premium brands significantly perceived the quality of product and brand as higher than those who bought non-premium brands (t=2.64, and 2.67, p<.01). They also developed significantly higher levels of relationship quality toward real estate firms (t=2.82, p<.001) and slightly higher commitments to salespersons (t=2.55, p<.05) than the non-premium home buyers. The higher level of perceived product quality and brand equity for the premium home buyers may come from the effect of the brand. Dodds et al., (1991) indicated that brand is strongly related to product evaluations of the product. Brand name could influence quality judgment, price evaluation, value interpretation, purchase probability and also post purchase evaluation (Stader and Shaw, 1999; Donthu, 1999). Therefore, the premium brand names of real
165
estate developers such as Land and Houses, Sansiri, Quality Houses, Property Perfect and so on would make their consumers proud of the houses they bought and cause them value their house, product quality, and brand equity as higher than other home buyers. Besides, the higher levels of relationship quality toward real estate firm of premium home buyers may be the result of high levels of product quality and brand equity. Since relationship quality is the cognitive and affective evaluation of a relationship based on the consumer’s personal experience concerning the product (Storbacka et al., 1994), perception on product quality and brand equity would take the role of antecedents for relationship quality. Dorsch et al. (1998) found that more satisfied buyers have higher quality relationships with the firm. Satisfaction with the real estate firm would cause long-term perpetuation of relationships between home buyers and real estate developers (Lin and Ding, 2005).
In contrast, the differences of value and all value influencing factors between premium and non premium groups of prospective home buyers were not explicit. It would infer that the brand might not affect the home buyers who were in pre-purchase context. The brand might influence positive post-purchase perceptions on the products for those who bought a premium brands. It might have too less effect to the value formation and choice selection for those who had not bought the products yet. However, to investigate whether the magnitudes of brand perception and also other value influencing constructs influenced value creation and decision making, the structural path analysis would be done in the test of model fit. The model fit and structural path analyses results will be presented in the next part.
The next comparison is of the subgroups of home buyers who bought houses with different price levels. Recent and prospective home buyers were separately divided into three groups according to the prices of their houses i.e., three to 4.99 million baht, five to ten million baht, and more than ten million baht respectively. The difference tests were done separately for recent and prospective home buyers. The analyses of variance were applied to identify the significance of differences among sub- groups.
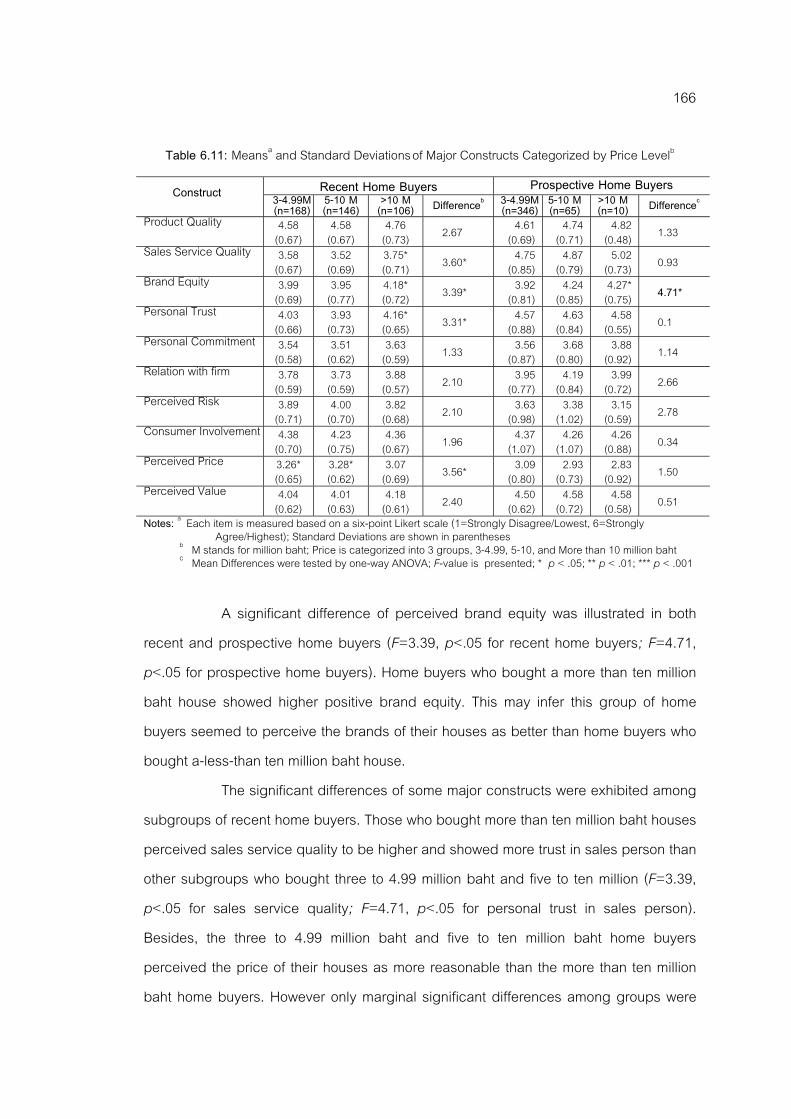
166
Table 6.11: Meansa and Standard Deviations of Major Constructs Categorized by Price Levelb Recent Home Buyers Prospective Home Buyers Construct 3-4.99M
(n=168) 5-10 M (n=146)
>10 M (n=106) Differenceb 3-4.99M
(n=346) 5-10 M (n=65)
>10 M (n=10) Differencec
Product Quality 4.58 (0.67)
4.58 (0.67)
4.76 (0.73) 2.67 4.61
(0.69) 4.74
(0.71) 4.82
(0.48) 1.33 Sales Service Quality 3.58
(0.67) 3.52
(0.69) 3.75* (0.71) 3.60* 4.75
(0.85) 4.87
(0.79) 5.02
(0.73) 0.93 Brand Equity 3.99
(0.69) 3.95
(0.77) 4.18* (0.72) 3.39* 3.92
(0.81) 4.24
(0.85) 4.27*
(0.75) 4.71* Personal Trust 4.03
(0.66) 3.93
(0.73) 4.16* (0.65) 3.31* 4.57
(0.88) 4.63
(0.84) 4.58
(0.55) 0.1 Personal Commitment 3.54
(0.58) 3.51
(0.62) 3.63
(0.59) 1.33 3.56 (0.87)
3.68 (0.80)
3.88 (0.92) 1.14
Relation with firm 3.78 (0.59)
3.73 (0.59)
3.88 (0.57) 2.10 3.95
(0.77) 4.19
(0.84) 3.99
(0.72) 2.66 Perceived Risk 3.89
(0.71) 4.00
(0.70) 3.82
(0.68) 2.10 3.63 (0.98)
3.38 (1.02)
3.15 (0.59) 2.78
Consumer Involvement 4.38 (0.70)
4.23 (0.75)
4.36 (0.67) 1.96 4.37
(1.07) 4.26
(1.07) 4.26
(0.88) 0.34 Perceived Price 3.26*
(0.65) 3.28* (0.62)
3.07 (0.69) 3.56* 3.09
(0.80) 2.93
(0.73) 2.83
(0.92) 1.50 Perceived Value 4.04
(0.62) 4.01
(0.63) 4.18
(0.61) 2.40 4.50 (0.62)
4.58 (0.72)
4.58 (0.58) 0.51
Notes: a Each item is measured based on a six-point Likert scale (1=Strongly Disagree/Lowest, 6=Strongly Agree/Highest); Standard Deviations are shown in parentheses
b M stands for million baht; Price is categorized into 3 groups, 3-4.99, 5-10, and More than 10 million baht c Mean Differences were tested by one-way ANOVA; F-value is presented; * p < .05; ** p < .01; *** p < .001 A significant difference of perceived brand equity was illustrated in both recent and prospective home buyers (F=3.39, p<.05 for recent home buyers; F=4.71, p<.05 for prospective home buyers). Home buyers who bought a more than ten million baht house showed higher positive brand equity. This may infer this group of home buyers seemed to perceive the brands of their houses as better than home buyers who bought a-less-than ten million baht house. The significant differences of some major constructs were exhibited among subgroups of recent home buyers. Those who bought more than ten million baht houses perceived sales service quality to be higher and showed more trust in sales person than other subgroups who bought three to 4.99 million baht and five to ten million (F=3.39, p<.05 for sales service quality; F=4.71, p<.05 for personal trust in sales person). Besides, the three to 4.99 million baht and five to ten million baht home buyers perceived the price of their houses as more reasonable than the more than ten million baht home buyers. However only marginal significant differences among groups were

167
found indicating that the perceptual differences of perceived sales service quality, trust in salespersons, perceived price and even brand equity were very small. These differences of theses value influencing constructs suggested that the recent home buyers who bought expensive houses, i.e. more than ten million baht perceived that the benefits they got from purchasing their houses were more positive than those who bought less expensive houses. In contrast, for prospective home buyers, differences in perceived value and also value influencing factors among three priced groups were not exhibited except brand equity as discussed previously. This is not surprising, since the prospective home buyers had not selected the house yet, they might focus their attention on the product and have less concerns on the sales service quality and trust in the salespersons. The last comparison is on the prior home buying experience. Each group of home buyers was categorized into first- time and non- first-time subgroups. The first time home buyers were assumed to have less home buying experience while the non-first time home buyers were assumed to have more experience since this buying situation was their repeat buying. The results indicated that there were no different in perceived value and its influencing factors between these groups as seen in Table 6.12.
Table 6.12: Means and Standard Deviations of Major Constructs Categorized by Samples’ Experience
Recent Home Buyers Prospective Home Buyers Construct First time
(n=232) Non-first time(n=188)
Mean Difference b
First time (n=287)
Non-first time (n=134)
Mean Difference b
Product Quality 4.62 (0.69) 4.63 (0.70) -0.01 (-0.17) 4.62 (0.71) 4.68 (0.66) -0.06
(-0.89) Sales Service Quality 3.61 (0.65) 3.59 (0.74) 0.03
(0.42) 4.75 (0.88) 4.83 (0.76) -0.08 (-0.93)
Brand Equity 4.05 (0.71) 4.01 (0.76) 0.04 (0.57) 3.92 (0.85) 4.10 (0.75) -0.18
(-2.14*) Personal Trust 4.04 (0.66) 4.01 (0.72) 0.03
(0.51) 4.57 (0.87) 4.60 (0.85) -0.03 (-0.29)
Personal Commitment 3.57 (0.62) 3.52 (0.56) 0.05 (0.83) 3.58 (0.83) 3.59 (0.92) 0.01
(-0.05) Relationship Quality: Firm Level 3.82 (0.56) 3.75 (0.62) 0.07
(1.24) 3.97 (0.78) 4.04 (0.78) -0.07 (-0.89)
Perceived Risk 3.92 (0.67) 3.90 (0.73) 0.02 (0.36) 3.64 (1.01) 3.45 (0.91) 0.19
(1.98) Consumer Involvement 4.28 (0.69) 4.37 (0.74) -0.09
(-1.31) 4.37 (1.08) 4.31 (1.03) 0.06 (0.55)
Perceived Price 3.20 (0.67) 3.24 (0.64) -0.03 (-0.50) 3.11 (0.82) 2.94 (0.74) 0.17
(2.08*) Perceived Value 4.09 (0.61) 4.03 (0.64) 0.06
(0.94) 4.50 (0.64) 4.55 (0.62) -0.04 (-0.66)
Notes: a Each item is measured based on 6-point Likert scale (1=Strongly Disagree/Lowest, 6=Strongly Agree/Highest); Standard Deviations are shown in parentheses
b Mean Differences were tested by independent t-test; t-value is illustrated in italic parentheses * p < .05; ** p < .01; *** p < .001

168
All results illustrated in this part were only the comparison of each construct among subgroups. To identify the structural relationships among constructs and their differences among groups, the model fit and structural path analyses were done and their results will be presented later in this chapter.
Assessment of Reliability and Validity of the Measurement Items Item Analyses Item analyses were performed to investigate the validity and reliability of the measurement items pertaining to the research constructs i.e., perceived value and its influencing factors in both recent and prospective home buyers. The data of recent and prospective home buyers were pooled. The pooled dataset was used for alpha co-efficient analysis, exploratory factor analysis, and confirmatory factor analysis. Even though the respondents of two sample groups were independent, the data of both groups should be pooled because all constructs and measurement items were similar and aimed to measure the same thing across both contexts, pre- and post- purchase. Thus, the validity and reliability of both data sets should be consistent. Therefore, the recent and prospective home buyer data were examined simultaneously. All scale items were refined based on the generally accepted guidelines provided by Hair et al. (1998).
First, Cronbach’s alpha coefficient analyses were performed to assess the reliability of each construct. Cronbach’s alpha provides a summary measure of the inter-correlation that exists among a set of items. A high value of Cronbach’s alpha (maximum value of 1.0) indicates high internal consistency and a low value (minimum value of 0.0) indicates low reliability. Cronbach’s alpha coefficient of .70 or higher was suggested by Nunnally (1978) to be a conventional criterion of reliability. Simultaneously, item-to-total correlations were examined for each set of items measuring a construct. Items with corrected item-to-total subscale correlations below .50 were considered to be deleted (Nunnally, 1978) since they might not share equality in the

169
common core of the construct (Churchill, 1999). Second, correlations among items measuring the same dimension were examined. Items with inter-item correlations smaller than .40 with similar traits would be considered for deletion.
Results from reliability analyses were satisfactory since all Cronbach’s alpha coefficients were exceeded the cutoff point of .70 recommended by Nunnally (1978) in both pooled and separate datasets. The results obtained from both parts were consistent. Cronbach’s alpha for all constructs varied from .842 to .974 which was consistent with the pretest results. After investigation, none of the items were removed since all alphas exceeded .70. The details of Cronbach’s alphas for each dimension and its dimensions are presented in Table 6.13.
Table 6.13: Reliability Analyses Results
Cronbach’s Alpha Construct / Dimensions Construct Level Dimension Lvel
Perceived Value .931 (.912/.934) Personal Value .924 (.901/ .928) Social Value .908 (.844/ .946)
Product Quality .971(.958/.957) Location .931 (.930/ .932) Environment .918 (.917/ .919) Housing Factor .974 (.974/ .974)
Sales Service Quality .959 (.922/.945) Brand Equity .952 (.950/.953)
Brand Awareness & Brand Association .947 (.945/ .948) Perceived Quality .940 (.938/ .943) Brand Loyalty .877 (.874/ .879)
Relationship Quality .952 (.964/.968) Personal Trust .969 (.951/ .975) Personal Commitment .910 (.842/ .944) Relationship Quality with Real Estate Firm .961 (.954/ .970)
Perceived Risk .962 (.944/.974) Internal Risk .954 (.927/ .970) External Risk .943 (.891/ .954)
Customer Involvement .929 (.925/.938) Perceived Price .894 (.908/.883) Note: Figures in parentheses represent each sample result. The first figure refers to the post-purchase context
(recent home buyers), and the second figure to the pre-purchase context (prospective home buyers). Even though all Cronbach’s alpha coefficients were high to satisfactory
level, the results obtained from the inter-item correlations in the second phase indicated inadequate coefficients of two measurement items of product quality. Design (ph1) and
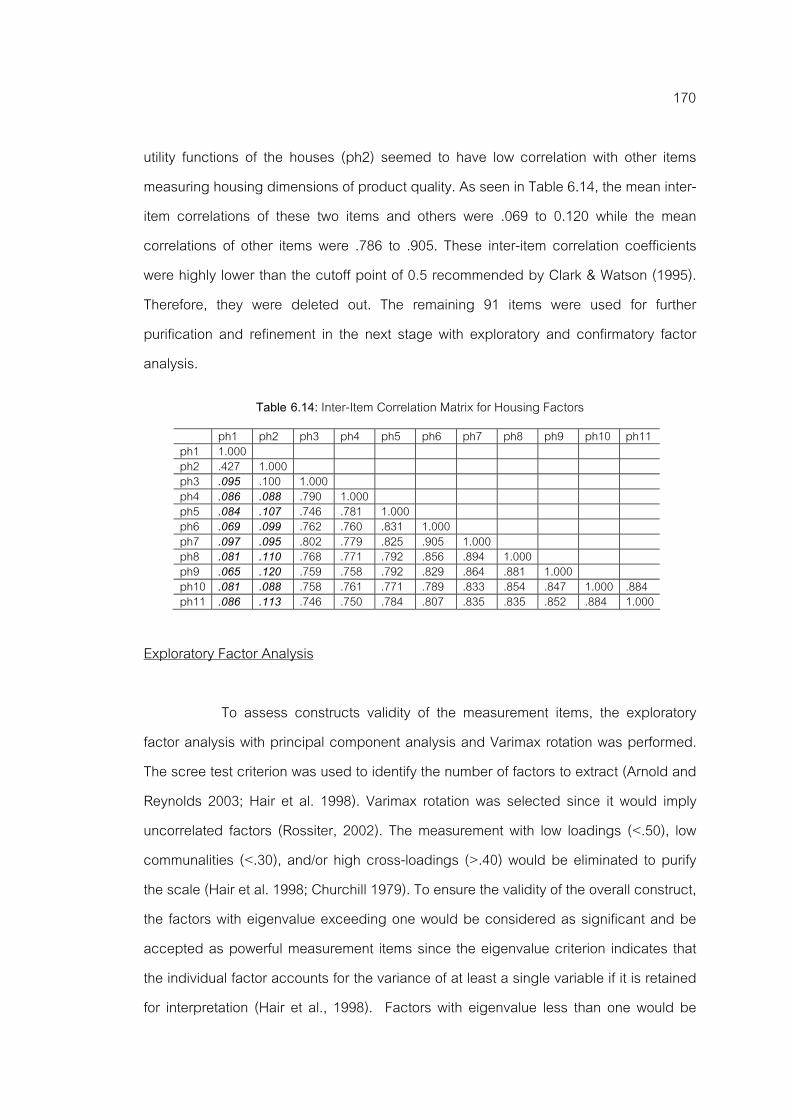
170
utility functions of the houses (ph2) seemed to have low correlation with other items measuring housing dimensions of product quality. As seen in Table 6.14, the mean inter-item correlations of these two items and others were .069 to 0.120 while the mean correlations of other items were .786 to .905. These inter-item correlation coefficients were highly lower than the cutoff point of 0.5 recommended by Clark & Watson (1995). Therefore, they were deleted out. The remaining 91 items were used for further purification and refinement in the next stage with exploratory and confirmatory factor analysis.
Table 6.14: Inter-Item Correlation Matrix for Housing Factors
ph1 ph2 ph3 ph4 ph5 ph6 ph7 ph8 ph9 ph10 ph11 ph1 1.000 ph2 .427 1.000 ph3 .095 .100 1.000 ph4 .086 .088 .790 1.000 ph5 .084 .107 .746 .781 1.000 ph6 .069 .099 .762 .760 .831 1.000 ph7 .097 .095 .802 .779 .825 .905 1.000 ph8 .081 .110 .768 .771 .792 .856 .894 1.000 ph9 .065 .120 .759 .758 .792 .829 .864 .881 1.000 ph10 .081 .088 .758 .761 .771 .789 .833 .854 .847 1.000 .884 ph11 .086 .113 .746 .750 .784 .807 .835 .835 .852 .884 1.000
Exploratory Factor Analysis
To assess constructs validity of the measurement items, the exploratory factor analysis with principal component analysis and Varimax rotation was performed. The scree test criterion was used to identify the number of factors to extract (Arnold and Reynolds 2003; Hair et al. 1998). Varimax rotation was selected since it would imply uncorrelated factors (Rossiter, 2002). The measurement with low loadings (<.50), low communalities (<.30), and/or high cross-loadings (>.40) would be eliminated to purify the scale (Hair et al. 1998; Churchill 1979). To ensure the validity of the overall construct, the factors with eigenvalue exceeding one would be considered as significant and be accepted as powerful measurement items since the eigenvalue criterion indicates that the individual factor accounts for the variance of at least a single variable if it is retained for interpretation (Hair et al., 1998). Factors with eigenvalue less than one would be

171
disregarded. The cumulative percentages of the variance were also examined to ensure practical significance for the derived factors since it indicated the linear combination formed by that individual factor (Hair et al, 1998).
Besides, the Kaiser-Meyer-Olkin (KMO) measure which is normally used to determine whether the data is sufficient enough for a factor analysis was also performed. The index ranges between 0 and 1, where the value of 1 implies that every item can be predicted without error from other items in the set (Kim and Mueller, 1978). According to Hair et al (1998), a KMO of .80 or above is considered meritorious; between .80 and .70 is middling; between .70 and .60 is mediocre; between .60 and .50 is miserable; below .50 is unacceptable. In addition, Bartlett’s test of Sphericity was applied to test the significance of the corresponding correlation matrix together with the KMO test. The p-value of less than .05 illustrates a significant correlation among all items indicating that the factor analysis is suitable for the analysis of that particular dataset (Hair et al., 1998).
However, to avoid the possible confusion with the long statement of measurement items, variable names were used instead of each statement when explaining all item analyses results gathered from exploratory and confirmatory factor analyses. Ninety-one variable names were consistent with all measurement items in which 18 items measured product quality, six items sales service quality, 13 items brand equity, 24 items relationship quality, 11 items perceived risk, five items customer involvement, five items perceived price and another nine items perceived value. The following table shows all measurement items and their pertaining variable names.
Table 6.15: Measurement Items for each Construct and their Pertaining Variable Names
Construct/ Dimension
Measurement Items* Variable Name
Your house is value for money. vp1 The quality of your house is value for money compared with that of major competitors vp2 Your house can be considered as a superior housing product vp3 You are confident in your house. vp4 You like to live in your house. vp5
Perceived Value: Personal Value
Your house makes you feel good. vp6 Your house would improve the way you are perceived vs1 Your house would help you make a good impression on other people vs2
Social Value A houses offering in this housing project would give its owners the social approval vs3

172
Table 6.15: Measurement Items for each Construct and their Pertaining Variable Names (Continued) Construct/ Dimension
Measurement Items* Variable Name
Traffic/Transportations pl1 Distance to public transport pl2 Distance to school/work pl3 Distance to community center pl4
Product Quality: Location
Distance to shopping facilities pl5 Privacy pe1 Good neighbors pe2 Quality of view and surroundings pe3
Environment
General living quality of the local area pe4 Design of the house** ph1 Utility functions** ph2 Quality of building materials ph3 Energy-efficient features of the house ph4 Construction lead time is as promised. ph5 Conforms to design specifications ph6 Conforms to material specifications ph7 Construction quality ph8 Quality of finish workmanship ph9 After sales warranty ph10
Housing Factor
Quality of reparation system ph11 Professionalism of real estate personnel sq1 Willingness to help and provide prompt service of real estate personnel sq2 Competence (skills and knowledge) of real estate personnel sq3 You were treated like a person, not a number. sq4 You were welcomed enthusiastically. sq5
Sales Service Quality
Personnel showed interest in you as a customer sq6 When talking about a house, you think of this real estate firm immediately baw1 This real estate firm is the most popular brand in the industry baw2 The house provided by this real estate firm is luxurious ba1 You won’t mind paying a higher price for this the house offered by this real estate firm ba2 This real estate brand would compensate me in some way for the problem with the product ba3
Brand Equity Brand
Awareness& Association
The image of this real estate firm represents what you would like to be ba4 Quality of the houses offered by this real estate firm is consistent bq1 The house offered by this real estate firm is very durable bq2 The house offered by this real estate firm is very reliable bq3
Perceived Quality
The quality of the houses offered by this real estate firm is superior to other brands bq4 You feel you are loyal to this real estate firm bl1 The house offered by this real estate firm is my first choice bl2 Brand Loyalty Even with more choices, you will not choose other brands bl3 Personnel are responsible rpt1 Personnel are honest about problem solving rpt2 Personnel can be trusted at all times rpt3 Personnel put the customers' interest before their own rpt4 Personnel are reliable rpt5 Personnel are honest rpt6 The relationship with your real estate personnel is very much at ease rpt7 Personnel are able to handle the complaints rpt8
Relationship Quality Personal Trust
Personnel is collaborative in resolving conflicts with us rpt9 Feel emotionally attached to personnel rpc1 You plan to maintain relationship with real estate personnel rpc2 You regarded the overall relationship with personnel as very close rpc3
Personal Commitment
Relationship with real estate personnel is important rpc4 The real estate firm understands the customer rft1 The real estate firm can be trusted at all times rft2 The real estate firm can be counted on to do what the right rft3 This housing project is the best of all possible place for living rfc1 You are committed to your real estate firm rfc2 You intend to continue associating with the housing project rfc3 Your relationship with this firm deserves maximum effort to maintain rfc4 Your choice to use this company was a wise one rfc5 You’re always delighted with the service provided by this real estate firm rfs1 The performance of the real estate firm exceeds customer expectation. rfs2
Relations with the firm
You think you did the right thing when you decided to use this firm. rfs3

173
Table 6.15 Measurement Items for each Construct and their Pertaining Variable Names (Continued) Construct/ Dimension
Measurement Items* Variable Name
When you thought about buying a house, you experienced tension. riskp1 The thought of buying a house would make you feel uncomfortable. riskp2 You would worry a lot when buying a house. riskp3 When buying a house, you would worry about how reliable the house will be. riskf1 You are afraid that the house would not provide you the level of benefits that you expected to it riskf2
Perceived Risk Internal Risk
You are afraid that the house would not provide you the level of housing quality that you expected it to.
riskf3 You are concerned that someone may look down you, if you made a bad choice in selection of the house.
risks1 When buying the house, You are concerned about the neighbors who buy the house in the same project.
risks2 You are afraid that the house you buy may be more expensive than other choices. riskm1 You are not sure whether you made a sufficient price bargaining. riskm2
External Risk
You are afraid that the price you paid for your house may be higher than that of other customers.
riskm3 Before buying the house, you would obtain substantial information about all available choices inv1 You would acquire a great deal of information about the house and its environment before buying
inv2 You have spent a lot of time in the purchase process of this house inv3 You have put a lot of effort in the purchase process of this house inv4
Customer Involvement
It costs you a lot of money to search for the most suitable house for you. inv5 Compared to other houses with the same quality, price of the house is…cheaper/ more expensive.
pr1 Based on your economic status, the price of your house is said to be….affordable/unaffordable
pr2 In your opinion, the price of your house is … reasonable/unreasonable pr3 The sales promotional campaign offered for your house is interesting/ not motivating pr4
Perceived Price
Payment condition offered for your house affects you to make decision it…less difficult/ more difficult.
pr5 Notes: * All measurement items were consistently used for both recent and prospective home buyer samples ** Variable ph1 and ph2 were already deleted from the set of measurement items. These two variables will not
be included in the further stages of data analyses. The pooled dataset of recent and prospective home buyers was used for
the exploratory analyses. Eight exploratory analyses regarding the constructs proposed in the research model i.e., perceived value, three constructs regarding benefit, three sacrifices, and also relationship quality as mediating factor were separately analyzed. However, to ensure the consistent characteristics and underlying structure of pre- and post-purchase decisions, the dataset of recent and prospective home buyers would also analyzed separately. The results of pooled and separate datasets for each construct are presented together in the following part. Perceived Value Three exploratory factor analyses were performed, for the pooled dataset of 841 respondents (420 recent home buyers, 421 prospective home buyers), and the recent and prospective home buyers, respectively. The exploratory factor analyses of

174
pooled and separate datasets showed consistent results which were also consistent with the results obtained from the pretest. Two dimensions of perceived value were extracted. The first dimension covered financial value, function value, and emotional value which could be said to be personal concern value. The second dimension was associated with social concern value. Based on this result, four proposed dimensions of perceived value were combined into two dimensions: personal value and social value. The factor solutions accounted for approximately 76.7% for pooled data, 70.61 and 79.53% of the total variance for the recent and prospective home buyers respectively. The KMO (Kaiser-Meyer-Olkin) measures of sampling adequacy were .931 for pooled data, .917 for the recent home buyers and .919 for the prospective home buyers. Bartlett’s test with p <.000 showed a significant support on the use of factor analysis. Factor loadings for each item were all exceeded the cutoff point of .05 (Hair et al. 1998). Therefore, all items would be used for the data analyses in the next stage. Table 6.16 shows the results for all datasets.
Table 6.16: Exploratory Factor Analysis Results of Perceived Value Components Construct/
Dimensions Items
1 2 Remarks
vp1 .76 (.76/.76) vp2 .75 (.66/.81) vp3 .80 (.81/.79) vp4 .81 (.80/.81) vp5 .81 (.80/.83)
Perceived Value: Personal Value
vp6 .80 (.75/.82) vs1 .85 (.83/.87) vs2 .85 (.82/.89)
Social Value vs3 .86 (.82/.90)
Variance extracted=76.70% (70.61%/79.53%) KMO measure=.931 (.917/.919) , Bartlett’s test: p<.000
Notes: Pattern Matrix shown, Extraction Method: Principal Component Analysis. Rotation Method: Varimax with Kaiser Normalization. Loadings <.30 are not shown
Figures in parentheses represent the each sample results. The first figure refers to the Post-purchase context (recent home buyers), the second figure to the pre-purchase context (prospective home buyers).
Benefit Constructs: Product Quality, Sales Service Quality, and Brand Equity Similar to perceived quality, three datasets of each benefit construct; product quality, sales service quality, and brand equity were analyzed separately. All results were consistent to each other and also consistent with the pre-test result. For product quality, three factors were extracted from the PCA solution, explaining 75.34% for the pooled dataset. The first dimension was related to the location of the house, the

175
second dimension was about the quality of the environment while the third component was associated with the details of the house as shown in Table 6.17
Table 6.17: Exploratory Factor Analysis Results of Product Quality Components Construct/
Dimensions Items
1 2 3 Remarks
pl1 .74 (.74/.74) pl2 .76 (.77/.76) pl3 .70 (.70/.71) pl4 .83 (.82/.83)
Product Quality: Location
pl5 .79 (.79/.79) pe1 .69 (.69/.68) pe2 .78 (.79/.76) pe3 .79 (.79/.78) Environment pe4 .79 (.80/.78) ph3 .73 (.73/.72) ph4 .75 (.75/.74) ph5 .79 (.80/.79) ph6 .84 (.85/.84) ph7 .87 (.87/.86) ph8 .86 (.87/.86) ph9 .85 (.86/.86) ph10 .82 (.82/.82)
Housing Factor
ph11 .83 (.83/.83)
Variance extracted = 75.34% (76.37%/74.92%) KMO measure = .963 (.958/.964) Bartlett’s test: p<.000
Notes: Pattern Matrix shown, Extraction Method: Principal Component Analysis. Rotation Method: Varimax with Kaiser Normalization. Loadings <.30 are not shown
Figures in parentheses represent each sample’s results. The first figure refers to the post-purchase context (recent home buyers), the second figure to the pre-purchase context (prospective home buyers).
For sales service quality, all items loaded on the same factor as proposed. The factor solutions accounted for approximately 83.08% of the total variance of the pooled dataset. All factor loadings of each item were higher than the cutoff point of .50. Finally, three dimensions of brand equity were extracted. Brand awareness and brand association loaded on the factor while perceived quality and brand loyalty loaded separately as the second and the third component. The cumulative variance extracted was 81.37% of the total variance of the pooled dataset. All results of the pooled dataset, recent and prospective home buyers were consistent and also consistent with the pre-test results. The KMO measures of sampling adequacy were .963 for product quality, .929 for sales service quality, and .937 for brand equity, with p<.000 for Bartlett’s tests indicated that the factor analysis results were significantly usable. Factor loadings for each item varied from .73 to .86 for product quality, from .89 to .93 for sales service quality, and from .74 to .84 for brand equity, which were exceeding the cutoff point of

176
.50 (Hair et al., 1998). Based on these results, all measurement items pertaining to the three benefit constructs could be used for further analyses without any modification. The results of each separate dataset i.e., recent and prospective home buyers and other details of pooled data are shown in Table 6.18 and Table 6.19 as follows.
Table 6.18: Exploratory Factor Analysis Results of Sales Service Quality Components Construct/ Dimensions Items
1 Remarks
sq1 .89 (.86/.86) sq2 .92 (.87/.89) sq3 .91 (.84/.89) sq4 .91 (.86/.87) sq5 .93 (.85/.91)
Sales Service Quality
sq6 .91 (.82/.90)
Variance extracted = 83.08% (72.0/78.7%) KMO measure = .929 (.925/.894)
Bartlett’s test: p<.000
Notes: Pattern Matrix shown, Extraction Method: Principal Component Analysis. Rotation Method: Varimax with Kaiser Normalization. Loadings <.30 are not shown.
Figures in parentheses represent the each sample’s results. The first figure refers to the post-purchase context (recent home buyers), the second figure to the pre-purchase context (prospective home buyers).
Table 6.19: Exploratory Factor Analysis Results of Brand Equity
Components Construct/ Dimensions
Items 1 2 3
Remarks baw1 .77 (.76/.77) baw2 .84 (.84/.83) ba1 .83 (.83/.83) ba2 .82 (.82/.81) ba3 .79 (.78/.80)
Brand Equity: Brand Awareness & Brand Association ba4 .74 (.73./75)
bq1 .81 (.81/.80) bq2 .83 (.83/.82) bq3 .83 (.83/.83)
Perceived Quality
bq4 .85 (.85/.85) bl1 .79 (.80/.78) bl2 .84 (.84/.84) Brand Loyalty bl3 .79 (.79/.79)
Variance extracted = 81.37% (80.95%/81.81%) KMO measure =.937 (.935/.939) Bartlett’s test: p<.000
Notes: Pattern Matrix shown, Extraction Method: Principal Component Analysis. Rotation Method: Varimax with Kaiser Normalization. Loadings <.30 are not shown.
Figures in parentheses represent the each sample’sresults. The first figure refers to the post-purchase context (recent home buyers), the second figure to the pre-purchase context (prospective home buyers).
Sacrifice Constructs: Perceived Risk, Perceived Price and Consumer Involvement As proposed in Chapter 4, sacrifice constructs were comprised of perceived risk, perceived price and customer involvement. Similar to benefit constructs, three datasets of each sacrifice were analyzed separately. The exploratory factor

177
analyses results obtained from recent and prospective home buyers were consistent and also consistent with the pre-test result. For perceived risk, two dimensions: internal and external risk were extracted with the factor solutions which accounted for approximately 81.59 % of the total variance of the pooled dataset. The factor loadings of all items varied from .76 to .85 which exceeded the recommended cutoff point of .50 (Hair et al, 1998). Thus, the two dimensions of risk will be used in the further analyses. The related details are shown in Table 6.20.
Table 6.20: Exploratory Factor Analysis Results of Perceived Risk Components Construct/
Dimensions Items
1 2 Remarks
riskp1 .76 (.79/.76) riskp2 .79 (.80/.81) riskp3 .81 (.79/.81) riskf1 .85 (.81/.83) riskf2 .82 (.71/.85)
Perceived Risk: Internal Risk
riskf3 .82 (.72/.84) risks1 .82 (.73/.78) risks2 .81 (.74/.80) riskm1 .79 (.68/.81) riskm2 .82 (.77/.81)
External Risk
riskm3 .83 (.80/.84)
Variance extracted = 81.59% (71.9%/86.08%) KMO measure = .957 (.945/.963) Bartlett’s test: p<.000
Notes: Pattern Matrix shown, Extraction Method: Principal Component Analysis. Rotation Method: Varimax with Kaiser Normalization. Loadings <.30 are not shown.
Figures in parentheses represent the each sample’s results. The first figure refers to the post-purchase context (recent home buyers), the second figure to the pre-purchase context (prospective home buyers).
For customer involvement and perceived price, all items loaded together on the one factor for each construct as proposed. The factor solutions accounted for approximately 78.29% and 70.29% of the total variance of customer involvement and perceived price respectively. The factor loadings of each item varied from .82 to .93 for customer involvement and from .79 to .87 for perceived price which were higher than the cutoff point of .50. The KMO measures of sampling adequacy were .963 for perceived risk, .929 for customer involvement, and .937 for perceived price. Bartlett’s test with p <.000 for all three sacrifices showed a significant support on the use of these factor analysis results. Regarding to these results, all measurement items associated with three sacrifice constructs were sufficiently qualified for further analyses without any

178
modification or deletion. The results of each dataset i.e., pooled, recent, and prospective home buyers showed the consistent results. Table 6.21 and Table 6.22 show the related details of the results of customer involvement and perceived price.
Table 6.21: Exploratory Factor Analysis Results of Consumer Involvement Components Construct/ Dimensions Items
1 Remarks
inv1 .86 (.84/.89) inv2 .89 (.87/.90) inv3 .93 (.90/.94) inv4 .92 (.91/.93)
Customer Involvement inv5 .82 (.87/.81)
Variance extracted = 78.09% (77.12%/80.16%) KMO measure = .829 (.865/.826) Bartlett’s test: p<.000
Notes: Pattern Matrix shown, Extraction Method: Principal Component Analysis. Rotation Method: Varimax with Kaiser Normalization. Loadings <.30 are not shown.
Figures in parentheses represent the each sample’s results. The first figure refers to the post-purchase context (recent home buyers), the second figure to the pre-purchase context (prospective home buyers).
Table 6.22: Exploratory Factor Analysis Results of Perceived Price
Components Construct/ Dimensions Items 1
Remarks
pr1 .79 (.86/.77) pr2 .85 (.88/.83) pr3 .87 (.87/.87) pr4 .84 (.83/.85)
Perceived Price pr5 .83 (.83/.83)
Variance extracted = 70.29% (73.25%/68.34%) KMO measure = .868 (.867/.860) Bartlett’s test: p<.000
Notes: Pattern Matrix shown, Extraction Method: Principal Component Analysis. Rotation Method: Varimax with Kaiser Normalization. Loadings <.30 are not shown.
Figures in parentheses represent the each sample’s results. The first figure refers to the post-purchase context (recent home buyers), the second figure to the pre-purchase context (prospective home buyers).
The Mediating Construct: Relationship Quality As proposed in research framework, relationship quality was considered as a mediating variable between perceived value of the houses and some benefit and sacrifice constructs. The exploratory factor analysis was also performed to assess construct validity of the measurement items pertaining to relationship quality. Even though five dimensions- personal trust, personal commitment, trust in firm, commitment to firm and satisfaction with firm were proposed, only three dimensions were extracted. The factor solutions accounted for approximately 76.49 % of the total variance of the

179
pooled dataset. The results of each dataset i.e., pooled, recent, and prospective home buyers, were shown in Table 6.23.
Table 6.23: Reliability and Exploratory factor analysis for Relationship Quality Components Construct/
Dimensions Items
1 2 3 Remarks
rpt1 .79 (.76/.81) rpt2 .81 (.76/.85) rpt3 .84 (.79/.85) rpt4 .83 (.75/.84) rpt5 .84 (.76/.86) rpt6 .85 (.76/.89) rpt7 .79 (.75/.84) rpt8 .84 (.77/.88)
Relationship Quality: Personal Trust
rpt9 .84 (.76.88) rpc1 .83 (.65/.88) rpc2 .83 (.73/.88) rpc3 .84 (.76/.88)
Personal Commitment
rpc4 .82 (.71/.89) rft1 .74 (.69/.78) rft2 .73 (.66/.76) rft3 .78 (.71/.82) rfc1 .73 (.69/.78) rfc2 .80 (.75/.83) rfc3 .80 (.72/.84) rfc4 .81 (.73/.84) rfc5 .80 (.77/.83) rfs1 .78 (.69/.84) rfs2 .79 (.89/.84)
Relationship Quality with Real estate firm
rfs3 .76 (.70/.82)
Variance extracted=76.49% (68.09/81.29%) KMO measure=.967 (.971/.965) Bartlett’s test: p<.000
Notes: Pattern Matrix shown, Extraction Method: Principal Component Analysis. Rotation Method: Varimax with Kaiser Normalization. Loadings <.30 are not shown.
Figures in parentheses represent the each sample’s results. The first figure refers to thepost-purchase context (recent home buyers), the second figure to the pre-purchase context (prospective home buyers).
Two personal level dimensions of relationship quality, personal trust, and personal commitment, were extracted as proposed but all items associated with the relationship on real estate firm loaded in the same factor. As such, the three firm level dimensions of relationship quality were combined into one, named relations with firm. The factor loadings of all items varied from .73 to .84 which exceeded the recommended cutoff point of .50. The KMO measures of sampling adequacy were .967 with significant Bartlett’s test of p <.000. The exploratory factor analysis results obtained from recent and prospective home buyers were consistent and also consistent with the pre-test result. Based on these results, all measurement items pertaining relationship quality were included for further analyses without any modification or deletion.

180
Satisfactory results were obtained from the investigation by exploratory factor analysis. All measurement items could be used for the analyses in the next stage. However, the combination of some dimensions denoted by the exploratory factor analysis was performed. Table 6.24 concludes all modifications from the EFA results.
Table 6.24: Summary of the Modified dimensions of the Research Constructs Constructs Proposed Dimensions Modified Dimensions
Financial Value Functional Value Personal Value Emotional Value
Perceived Value
Social Value Social Value Location Location Environment Environment
Product Quality
Housing Factor Housing Factor Brand Awareness Brand Association Brand Awareness & Association Perceived Quality Perceived Quality
Brand Equity
Brand Loyalty Brand Loyalty Psychological Risk Functional Risk Internal Risk Social Risk
Perceived Risk
Financial Risk External Risk Trust on personnel Personal Trust Commitment to personnel Personal Commitment Trust on firm Commitment to firm
Relationship Quality
Satisfaction Relationship with firm
Note: No Modification Sales Service Quality, Customer Involvement and, Perceived Price: Only one dimension was proposed for each construct
Four proposed dimensions of perceived value were combined into two dimensions. Brand awareness and brand association were combined resulting in three dimensions of brand equity. Another four dimensions of perceived risk were categorized into two dimensions. Three dimensions of relationship quality were obtained instead of the first proposed five dimensions. Only, product quality retains its three dimensions, and also sales service quality, customer involvement, and perceived price remain having one dimension as proposed. The modified dimensions of these constructs were used for the confirmatory factor data analyses in the next stage. After performing exploratory factor analyses, confirmatory factor analyses (CFAs) were conducted with AMOS 6.0. Based on the assumption of the structural

181
equation modeling (SEM), to test structural relations among latent constructs, relationships between observed items and latent constructs which are called the measurement model would be analyzed before examining the structural model (Anderson and Gerbing, 1988). This is known as the two-stage analysis (Hair et al., 1998). The logic of this argument is that it is essential to understand what one is measuring prior to testing relationships (Vandenberg and Lance, 2000). This approach has several advantages, such as avoiding the interaction of the measurement and structural model, reducing the number of parameters to be estimated, etc. However, before performing a confirmatory factor analysis and structural model test, some assumptions and requirements of the structural equation modeling should be checked to ensure that the dataset is qualified enough for the SEM.
Assumption and Requirement Checks for the SEM
SEM generally assumes linear relationships, although it is possible to account for nonlinearity (Hair et al., 1998). This assumption seemed not to be troublesome, as other perceived value studies also commonly assumed and found linear relationships between the identified factors (Dodds et al. 1991; Sweeney et al., 1999). A maximum likelihood estimation (MLE) based on the variance-covariance matrix was used. To ensure that the dataset was qualified enough for the SEM, the sample size, missing data, continuous variables, normal distribution of the data—both univariate and multivariate, correlations and multicollinearity among latent constructs had to be checked before performing SEM analyses. The assumption and requirement checks are presented in the following part while the CFA results will be shown in the next part. Sample Size: SEM requires relatively large sample sizes for robust estimates. Comrey and Lee (1992) suggested that a sample size of 50 is very poor, 100 is poor, 200 is fair, 300 is good, 500 is very good, and 1,000 is excellent. However, Hair et al. (1998) suggested relatively large sample sizes, i.e. n > 200 as there are many factors impacting the required sample size. A larger sample size than 200 is needed

182
when the model is overly large or complex. A minimum of at least five respondents for each estimated parameter, with a ratio of 10 respondents per parameter was considered as most appropriate (Hair et al. 1998; Kline, 1998). As the proposed model was relatively complex in which the estimation of approximately 45 parameters would be performed, the SEM analysis required a minimum sample size of 225. As the sample size was 420 and 421 for recent and prospective home buyers, they exceeded the minimum requirement and were considered usable. Missing Data: The listwise deletion was selected to treat missing data in this study. The listwsie deletion is one standard method for dealing with incomplete data by eliminating any observations where some data were missing (Hair et al. 1998). Another method which is commonly used to treat missing data for SEM is the pairwise deletion method. For the pairwise deletion, an observation with missing values is temporarily excluded from the analysis when it is needed for the computation (Arbuckle and Wothke, 1999). Thus, the missing values would be replaced with imputed values. The listwise deletion method was selected here because it can avoid any possible errors from value plugging and the sample size was large enough to drop the samples with the missing values. The total of 11 samples, five recent home buyers and six prospective home buyers were excluded. After performing listwise deletion, a sample size of 420 recent home buyers and 421 prospective home buyers remained for the confirmatory factor analysis. As the sub-sample sizes still exceeded the commonly required sample size of 200 (Hair et al. 1998), the results of listwise deletion were acceptable. Continuous Variables/Univariate&Multivariate Normal Distribution: Checking whether the variables are continuous and normally distributed were the next two related assumptions for the SEM. As all variables used in the structural equation model were measured on an interval scale, i.e., six-Likert scale type, they would meet the assumption for continuous variables (Zigmund, 2003). For the check of univariate normality, although the Kolmogorov-Smirnov statistical tests of univariate normality of each item were significant (p<.05) indicating the non-normal distribution of the data, the visual inspection of the Q-Q plots for each construct showed no severe violations of

183
normality. All points clustered around the straight diagonal line. Next, multivariate normal distribution was checked because it was required by maximum likelihood estimation (MLE), which was used in SEM for estimating structure (path) coefficients in this research. A lack of multivariate normality is particularly troublesome because it substantially inflates the chi-square statistic and creates upward bias in critical values for determining coefficient significance (Hair et al., 1998). Specifically, MLE requires normally distributed endogenous variables (Garson, 2006). Therefore, multivariate normality of two endogenous variables, perceived value and relationship quality, were examined. Based on AMOS test of normality results, skewness and kurtosis were investigated. The distributions of the pooled datasets (n=420 and 421 for recent and prospective home buyers) showed no strong skewness and kurtosis of the distribution of the two endogenous variables. Thus, no adaptations were required. The coefficient of multivariate non-normality for perceived value was not significant (multivariate=.794; z=-.818, p>.05). All indicator variables (i.e., measurement items) in the measurement model of perceived value did not exceed 2.57 (p>.01) indicating the normal distribution of the data. Consistently, most indicator variables in the measurement model of relationship quality did not exceed 2.57 (p>.01). Only one of the 24 indicator variables exceeded 2.57 (rcf3; z=2.689; p<.01). As such, the data could be used in the further analyses without any transformations or deletion (see normality test and Q-Q plots in Appendix C). Correlations and Multicollinearity: The last assumption check was to assess the multicollinearity among the latent variables. The regression with unweighted summated scores and correlation analyses were performed for both datasets. The tolerance and variance inflation factor were extracted to examine the multicollinearity. A tolerance close to 1 means there is little multicollinearity, whereas a value close to 0 suggests that multicollinearity may be a threat while the variance inflation factor (VIF) shows how much the variance of the coefficient estimate is being inflated by multicollinearity. As seen in Table 6.25, no multicollinearity problems were encountered since the variance inflation (VIF) value varied 1.11 from to 6.32. The largest VIF of 6.32 was lower than the common cutoff point of 10 suggested by Hair et al. (1998). Also, the

184
tolerance test showed satisfactory results. Therefore, the multicollinearity problem had not been shown in this model.
Table 6.25: Regression Analysis Results Recent Home Buyers Prospective Home Buyers Constructs β Tolerance VIF β Tolerance VIF
Product Quality .147*** .471 2.121 .121*** .273 3.658 Sales Service Quality .063* .211 4.732 .013 .486 2.057 Brand Equity .060** .448 2.232 .085*** .404 2.475 Perceived Risk -.114*** .577 1.733 -.140*** .385 2.601 Perceived Price -.081*** .668 1.496 -.041** .746 1.341 Consumer Involvement .029 .757 1.322 .014 .898 1.114 Personal Trust .134*** .158 6.315 .202*** .383 2.612 Personal Commitment .130*** .462 2.165 .050*** .761 1.315 Relationships with Firm .379*** .305 3.282 .235*** .248 4.034
Notes: Dependent Variable is Perceived Value; F= 383.20, p=.000; R2 = .894; F= 398.75, p=.000; R2 = .897; * p < .05; ** p < .01; *** p < .001
Consistently, pairwaise correlation results showed no multicollinearity problems since all correlations between independent variables were less than the cutoff point of .90 suggested by Hair et al. (1998). A number of correlations between the constructs are high i.e., above .60. The highest pairwise correlation was for sales service quality and relationship quality in the post purchase context (ρ=.81). This is not surprising, as the value influencing factors, both benefits and sacrifices, were naturally strongly correlated and played an interactive role in determining perceived value of the product. Table 6.26 shows the pairwise correlations among latent constructs for both recent and prospective home buyers.
Table 6.26: Correlations between Latent Constructs
PQ SQ BQ RQ RISK INV PRICE PQ .624** .670** .812** -.661** -.110* -.428** SQ .515** .425** .606** -.401** .043 -.402** BQ .658** .526** .704** -.636** -.108* -.356** RQ .667** .814** .674** -.720** -.090 -.440** RISK -.485** -.407** -.519** -.605** .258** .420** INV .245** .450** .241** .435** -.193** .068 PRICE -.391** -.429** -.462** -.557** .398** -.207** Notes: - PQ=Product quality; SQ=Sales Service Quality; BQ= Brand Equity; RQ=Relationship Quality;
Risk=Perceived risk; INV= Consumer Involvement; Price=Perceived price - Correlations for recent home buyer were shown below diagonal; correlations for prospective home buyer
context were shown above diagonal. * p < .05; ** p < .01; *** p < .001

185
Confirmatory Factor Analysis of the Measurement Models Confirmatory Factor Analysis (CFA) was used to test whether the set of measurement items identified the hypothetical latent construct and confirmed the theory-generated model (Kelloway, 1998). Each latent construct was separately analyzed by CFA to assess convergent validity. The measurement items for each construct were considered as a reflective model, not a formative model, meaning that the observed items were caused by the latent construct. Thus, the latent constructs were not caused by the items. As such, dropping any items would not alter the meaning of the construct (Jarvis et al., 2003). The reasons for choosing reflective over formative models were based on the expectation that the measurement items were likely to be affected by the same antecedents and have the same consequences and the high degree of covariation among items. Consequently, some measurement items could be deleted if the CFA results became unsatisfactory. Criteria for evaluating CFA results are non significant chi-square value (χ2) p>.05 and high fit indices of >.90. However, most chi-square statistics of the measurement model showed their significance (p<.001), indicating that the specification of the factor loadings, factor variances/covariances, and error variances for the models were not valid. This is not uncommon, as the chi-square statistic is sensitive to departures from large sample sizes. As recommended by Hair et al (1998), chi-square is appropriate for the sample size between 100 and 200. Thus, the chi-square was not be considered or reported in this research since the sample size was 420 for the post-purchase context and 421 for the pre-purchase context which exceeded the recommended size to determined by chi-square (Maruyama 1998; Hair et al. 1998). Due to the sensitivity of the chi square statistic, a number of fit indices were used to assess the fit of measurement model. The following four fit indices were selected:
1. Absolute fit measures: the ratios of the chi-square to the degrees of freedom which would be beneath the recommended level of 3.00 (Byrne 2001). The χ2/df is an absolute index which explains whether the residual or unexplained variance remained after model fitting is appreciable (Maruyama 1998).

186
2. Incremental fit measures: Incremental fit index (IFI) and Tucker-Lewis coefficient (TLI), as called non-normed fit index (NNFI), which are relative indices that address the question of how well the proposed model explains the set of observed data when compared with other possible models (Hu and Bentler, 1995). The recommended level of IFI and NNFI are >.90 (Bentler & Bonett, 1980; Bentler, 1990; Hair et al. 1998).
3. Parsimonious fit measures: Comparative fit index (CFI) which measures the relative improvement of fit of the hypothesized models compared with the independence model. A value of >.90 was considered representative of a well-fitting model (Bentler, 1992).
4. Root mean Square Error of Approximation (RMSEA) which is the representative of the goodness of fit that could be expected if the model were estimated in the population. The suggested level for the good fitting model is a RMSEA of less than .05 or, at least, less than .08 (Maruyama 1998). However, the Normed Fit Index (NFI) which used to be widely used was not proposed in this research since it’s currently not recommended due to its value that is directly affected by sample size. The CFAs were performed for all exogenous variables i.e., benefit and
sacrifice antecedents of perceived value and endogenous variables which are relationship quality and perceived value. Each CFA was run for the individual variable without any structural relationships. The results yielded that the fit indices of all CFA were satisfactory meaning that all sets of measurement models could identify their related latent constructs effectively. The details are illustrated in the next part. CFA tests were also used to test convergent validity of the constructs. Convergent validity assesses the degree to which two measures of the same construct are correlated (Hair et al. 1998). It can be assessed from the measurement model by determining whether each item’s estimated maximum likelihood loading on its assigned construct factor is significant (Anderson and Gerbing, 1988). The assessment of the measurement properties of all items indicated that the factor loadings were high and

187
significant (p < 0.001), which satisfies the criteria for convergent validity (Hair et al. 1998). In addition, discriminant validity between the constructs can be established by analyzing average variance extracted values. If the square of the path coefficient linking the two constructs, which were being examined for discriminant validity, was less than the average variance extracted value for the constructs, then discriminant validity between these constructs was established (Fornell and Larcker, 1981). Therefore, the average variance extracted (AVE) and constructed reliability were computed. The AVE which exceeded the recommended level of .50 showed that the variance captured by constructs was larger than the variance due to error (Fornell and Larcker, 1981). Besides, the minimum construct reliabilities of .60 demonstrated that the scales were reliable (Bagozzi and Yi, 1988). The AVE and construct reliability were shown with the model fit results of each CFA result. In sum, an examination of the CFA showed that AVE values exceeded the square of the correlations between constructs in all cases indicating that discriminant validity between the constructs in all models was established (see Table 6.26 as references). Thus, the measurement model showed evidence for convergent validity, as well as construct reliability. Consequently, the structural analyses could be performed with an acceptable level of confidence in the measurement models. Based on the CFA results, the model would consequently be refined by eliminating items contributing most to lack of fit, as indicated by the standardized residuals and modification indices (Steenkamp and Van Trijp, 1991). However, as all measurement models showed reasonable fit indices, no items were excluded after this iterative process. The results of CFA for each measurement set are as follows:
Perceived Value Perceived value was measured by nine measurement items. According to
SEM, a measurement item was considered as an observed variable for the latent construct. Perceived value was composed of two dimensions: psychological and social value. Psychological value was measured by six observed variables: VFIN1, VFIN2, VFUNC1, VFUNC2, VEMO1, and VEMO2. Social value was measured with three observed variables: VSOC1, VSOC2, and VSOC3. The measurement model was fitted

188
well to the data since all fit indices exceeded .90 (IFI=.996; NNFI=.994; CFI=.996), RMSEA = .034, and χ2/df = 1.953. The regression coefficient between each observed variable and its corresponding dimension in the first order CFA varied from .79 to .87 were significant (p<.001). Also, the regression coefficient between each dimension and perceived value in the second order CFA were significant (p<.001) at .82 and .83. Finally, both average variance extracted (AVE) and construct validity were satisfactory at .77 and .97, respectively. The details are shown in Figure 6.2. All numbers illustrated in the model indicated the standardized coefficient of each structural relationship.
FIGURE 6.2: Measurement Model for Perceived Value
Notes: χ2/df = 1.953; GFI=.988; IFI=.996; NNFI=.994; CFI=.996; RMSEA=.034
AVE = .77; Construct Reliability (α) = .97 .
Product Quality Product quality was composed of three dimensions; location, environment and housing factors. The quality of location was measured by five observed variables; PL1, PL2, PL3, PL4, and PL5. The environmental factor was measured by four observed variables; PE1, PE2, PE3, and PE4. The housing factor was measured by nine observed variables, PH3 to PH11 while PH1 and PH2 were already dropped previously. The CFA model showed a good fit with the data since all fit indices exceeded .90 (IFI=.981; NNFI=977; CFI=.981), RMSEA = .056, and χ2/df = 3.67. Moreover, all fit indices i.e., CFI, GFI, IFI, and NNFI that were greater than 0.95 indicated an excellent fit of the data. Even though the acceptable value of the ratio of chi-square/degrees of freedom was
.83 .82 Psychological Value VFUNC1
VFUNC2 VFIN1 VFIN2 VEMO1 VEMO2 VSOC1 .88 VSOC2 VSOC3
.87 .88 Social Value
.80
.85
.81 .79
.84 Perceived Value
.83

189
less than 3, the slightly higher than three, the slightly-higher-than-three value could be considered as acceptable with large sample analyses, i.e. n>200 (Kline, 1998). Therefore, the χ2/df = 3.67 of this measurement model would be considered acceptable. For the first order CFA, the regression coefficients between each observed variable and its corresponding dimension varied from .78 to .93, all were all significant (p<.001). Consistently, for the second order CFA, regression coefficients of product quality and its dimensions were significant (p<.001) at .85, .88 and .89 respectively. In addition, both average variance extracted (AVE) and construct validity were satisfactory at .78 and .98. CFA results for product quality are illustrated in Figure 6.3 as follows:
FIGURE 6.3: Measurement Model for Product Quality
Note: χ2/df = 3.67; RMSEA=.056; GFI=.942; IFI=.981; NNFI=.977; CFI=.981; AVE = .783; Construct Reliability (α) = .98
Sales Service Quality Only one dimension of sales service quality was proposed. Six observed variables - SQ1, SQ2, SQ3, SQ4, SQ5, and SQ6 – were significantly related to its latent construct. The regression coefficients varied from .86 to .91 (p<.001). A. good fit in CFA model was illustrated (χ2/df=3.465; RMSEA=.054; GFI=.992; IFI.997; NNFI=.993;
Environment PE1 PE2 PE3 PE4 PH3 PH4 PH5 PH6 PH7 PH8 PH9 PH10
Housing Factors
PL1 PL2 PL3 PL4 PL5
Location
.89
.88
.85
Product Quality
.84
.84
.87
.88
.93
.88
.85
.79
.78
.90
.94
.93 .92
.84
.84 .87
.90
.90
PH11

190
CFI=.997). The average variance extracted (AVE) indicated that the model could explain 68.5 % of the variation of sales service quality with construct validity of .93. The details are shown in Figure 6.4.
FIGURE 6.4: Measurement Model for Sales Service Quality
Note: χ2/df = 3.465; RMSEA=.054; GFI=.992; IFI.997; NNFI=.993; CFI=.997;
AVE = .685; Construct Reliability (α) = .93
Brand Equity Three dimensions of brand equity were proposed; Brand awareness &
association, perceived quality, and brand loyalty. Brand awareness & association was measured by six observed variables: BAW1, BAW2, BAS1, BAS2, BAS3, and BAS4. Perceived quality was measured by four observed variables - BQ1, BQ2, BQ3, and BQ4 - and brand loyalty was measured by nine observed variables, BL1, BL2, and BL3. Details of the CFA model for brand equity are illustrated in Figure 6.5 as follows:
FIGURE 6.5: Measurement Model for Brand Equity
Note: χ2/df = 3.81; RMSEA=.063; GFI=.962; IFI=.985; NNFI=.979; CFI=.985; AVE = .721; Construct Reliability (α) = .97
Sales Service Quality SQ2 SQ3
.89
.89 SQ4 SQ5
.90
.91
SQ1 .86
SQ6 .89
Perceived Quality
BA4 BQ1 BQ2 BQ3 BQ4 BL1 BL2 BL3
Brand Loyalty
BAW1 BAW2 BA1 BA2 BA3
Brand Association
.82
.83
.87
Brand Equity .90 .91 .88 .90
.83
.84
.86
.90
.88
.82
.85 .85
.84

191
The CFA model showed good fit with the data. All fit indices exceeded .95 (IFI=.985; NNFI=.979; CFI=.985), RMSEA = .063, and χ2/df = 3.81. For the first order CFA, the regression coefficients varied from .82 to .91, were all significant (p<.001) while regression coefficients for the second order CFA were at .87, .83 and .82 which were all significant (p<.001). The average variance extracted (AVE) was 72.1% and construct validity was .97. In sum, CFA results for brand equity showed high reliability and validity.
Perceived Risk Referring to the EFA results, two dimensions of perceived risk were proposed. Internal risk was measured by six observed variables: RISKP1 to 3 and RISKF 1 to 3. External risk was measured by five observed variables; RISKS 1to 2, RISKM1 to 3. The CFA analysis showed excellent fit with the data. All fit indices exceeded .95 (IFI=.994; NNFI=.992; CFI=.994), RMSEA = .042, and χ2/df = 2.45. For the first order CFA, the regression coefficients varied from .83 to .91l were all significant (p<.001) while regression coefficients for the second order CFA were.88 and 93 and .82 (p<.001). The average variance extracted (AVE) was 73.5% and construct validity was .97. Consequently, CFA results for perceived risk showed high reliability and validity as seen in the details of Figure 6.6.
FIGURE 6.6: Measurement Model for Perceived Risk
Note: χ2/df = 2.45; RMSEA=.042; GFI=.979; IFI=.994; NNFI=.992; CFI=.994; AVE = .735; Construct Reliability (α) = .97
.93
.88
External Risk
risks1 risks2
riskp1 riskp2 riskp3 Internal Risk riskf1 riskf2 riskf3
riskm1 riskm2 riskm3
.86
.86
.89
.87
.87
.89
.91
.88
.84
.89
.83 Perceived Risk

192
Perceived Price PR2 PR3
.83
.86 PR4 PR5
.75
.73
PR1 .75
Customer Involvement INV2 INV3
.75
.96 INV4 INV5
.90
.73
INV1 .70
Customer Involvement Five observed variables were proposed to measure customer involvement. All the observed variables, INV1 to INV5 were in the same dimension. From CFA, all of them were significantly related to its latent construct. The regression coefficients varied from .70 to .90 (p<.001). Good fit in CFA model was illustrated. (GFI=.995; IFI=.998; NNFI=.993; CFI=.998; χ2/df = 3.635; RMSEA=.056). The average variance extracted was 61.5% and construct validity was .89. As a result, this set of observed variables could effectively represent consumer involvement. The details are shown in Figure 6.7.
FIGURE 6.7: Measurement Model for Customer Involvement
Note: χ2/df = 3.635; RMSEA=.056; GFI=.995; IFI=.998; NNFI=.993; CFI=.998; AVE = .615; Construct Reliability (α) = .89
Perceived Price
Only one dimension with five observed variables of perceived price was proposed. The CFA results indicated a good fit with the data. All fit indices exceeded .95 (GFI=.993; IFI=.996; NNFI=.990; CFI=.996), RMSEA =.054, and χ2/df = 3.446. The observed variables PR1 to PR6 are significantly related to its latent construct. The regression coefficients varied from .73 to .86 (p<.001). The average variance extracted (AVE) was 62.6% and construct validity was .89. Consequently, CFA results for perceived price showed high reliability and validity as seen in the details of Figure 6.8.
FIGURE 6.8: Measurement Model for Perceived Price
Note: χ2/df = 3.446; RMSEA=.054; GFI=.993; IFI=.996; NNFI=.990; CFI=.996; AVE = .626; Construct Reliability (α) = .89

193
Relationship Quality Based on the EFA results, relationship quality was composed of three dimensions: personal trust in salesperson, personal commitment to salesperson and relationship with the real estate firm. The first dimension was measured by nine observed variables: RPT1 to RPT9. Four observed variables, RPC1 to RPC4, were accounted for personal commitment. Finally, relationship quality with the firm, was measured with eleven observed variables: RFT1, RFT2, RFT3, RFC1, RFC2, RFC3, RFC4, RFC5, RFS1, RFS2, and RFS3. Figure 6.9 shows the details of the CFA model.
FIGURE 6.9: Measurement Model for Relationship Quality
Note: χ2/df = 2.54; RMSEA=.043; GFI=.940; IFI=.982; NNFI=.979; CFI=.982; AVE = .763; Construct Reliability (α) = .98
The CFA model showed good fit with the data. All fit indices exceeded .95 (IFI=.982; NNFI=.979; CFI=.982), RMSEA = .043, and χ2/df = 2.54. The first order CFA
.78
.89
.88
.89
.89
.85 .88 .89
.88
.86
Personal Trust
.88
.64 .83 .87 .86 .83
.82
.81
.82
.83
.84
.85
.84
.81
.83
Personal Commitment
Relation with firm
.84
.82
Relationship Quality
RPC1
RPC3 RPC4
RPT1
RPT3
RPT5 RPT6 RPT7 RPT8 RPT9
RFS2 RFS3
RFT3 RFC1 RFC2 RFC3 RFC4 RFC5 RFS1
RPT2
RPT4
RPC2
RFT1 RFT2

194
yielded significant (p<.001) regression coefficients of .81 to .89. Also, regression coefficients obtained in the second order CFA were .78, .64, and .88 which were all significant (p<.001). In addition, average variance extracted (AVE) was 76.3% while construct validity was .98. Thus, CFA results showed high validity and reliability for relationship quality.
Assessment of Structural Equation Model and Hypotheses Testing for Recent Home Buyers
After evaluating the measurement models, the fit of the proposed conceptual model was examined. Since there were two independent sets of data, recent and prospective home buyers and both groups performed their home buying decisions in different stage, two datasets were analyzed separately. The post purchase context of the recent home buyers might allow the respondents to develop stronger relationships with the real estate firms, personnel, and with the houses they bought. Also, they could possibly experience the unaware post-purchase bias with the product. In contrast, the prospective home buyers who had not finalized the choice on which houses to buy would possibly end their decision process without buying any houses. Based on these differences, each data set would be analyzed and reported separately. Hence, the structural model fitting of the prospective home buyers will be presented in the next part. For the post-purchase data set, the base model, i.e. the proposed conceptual model, was used to test the major hypotheses. The assessment of the fit of structural model and the significances of relationships among constructs as proposed in the research model will be investigated. Finally, the results of hypotheses testing will be presented. Assessment of Structural Relationships for Base Model
To analyze a structural equation model, two common practices are available: first, creating composite scores across indicators of each construct and using one indicator for each construct and second using each individual item as the indicator
195
of its construct. The first method may be used for the reason of simplicity reason and to avoid the possible collinearity in correcting for measurement errors if exogenous variables are highly correlated. For the first method, the analysis of individual measurement items is avoided by summing the items that define a measurement scale together and entering only the corresponding total score into the structural equation model. This practice, of course, simplifies the complexity of the analysis by dramatically reducing the number of manifest variables. However, simplification may be obtained at the loss of rigor and meaning as the relations of the individual items with each other and the latent variables are ignored (Gerbing et al., 1994).
Since the multicollinearity problem of both data sets had not been shown, the second approach was selected. All measurement items were included in the model as first and second order factors. The second-order factor (Gerbing & Anderson, 1984) representing three independent variables were the exogenous constructs which were product quality and brand equity, and perceived risk. The second-order factor also applied for two endogenous constructs, relationship quality and perceived value. The model was defined by 91 Likert items. First forty one items identified eight distinct dimensions underlying the three independent constructs i.e., three dimensions of product quality (17 items), three dimensions of brand equity (13 items), and two dimensions of perceived risk (11 items). For the two endogenous constructs, perceived value was composed of two dimensions with nine measurement items and relationship quality was composed of three dimensions with 13 measurement items. The rest related constructs in the model were directly operationaized as the first-order factor. These included sales service quality, consumer involvement, and perceived price. Only one facet i.e., one dimension was manifested for each construct. Hence, the hypothesized conceptual model (see the conceptual model in Chapter 4) was transformed into an AMOS model as shown in Figure 6.10 All first-order confirmatory factors and their corresponding items together with the second-order factor are illustrated in the model.

196
Figure 6.10: AMOS Graphical Model for Both Data Sets (Base Model) er1
er2
er3 pl3
pl2
pl11
1
1pql
1
er7
er8
er9 pe4
pe3
pe2
pqe
1
1
1
1
er14
er15
er16
er17 ph8
ph7
ph6
ph5
pqh
1
1
1
1
er12 ph31
er18 ph91
er19 ph101
er20 ph111
er35
er36
er37
er38
er39 sq6
sq5
sq4
sq3
sq2
sq
1
1
1
er43
er44 inv5
inv4
inv3 inv
er45
er46
er47 pr3
pr2
pr1
pric
1
er34 sq11
1
er21
er22 baw2
baw11
1
er23
er24
er25
er26 ba4
ba3
ba2
ba1bqas
1
1
1
1
er27
er28
er29
er30 bq4
bq3
bq2
bq1
bqq
1
1
1
1
1
er31
er32
er33 bl3
bl2
bl1
bql
1
1
1
1
bq
risk
1
riskp1 riskp2 riskp3 riskf1 riskf2 riskf3 riskm1 riskm2 riskm3
er74 er75 er76 er77 er78 er79 er82 er83 er84
1 1 1 1 1 1 1 1 1
pqrpt6rpt5rpt4
er55er54er53
rqtp
111
rpt9rpt8rpt7
er58er57er56
111
rpt3rpt2rpt1
er52er51er50
111
rpc3rpc2rpc1
er61er60er59
1
1
rpc4
er62
1
rqcp
er70
er69
er68
er67
er66rfc1
rfc2
rfc3
rfc4
rfc5
rqf
1
1
1
1
11
er73
er72
er71rfs1
rfs2
rfs31
1
1
z21
z1
z15
z3
z5
z6
z7
z9
z10rpsy rfin
z16
z17
1
1
1
value
vp2
vp3
vp4
vp5
vp6
vs1
vs2
vs3
vp1 er85
er87
er88
er89
er90
er91
er92
er93
er86
1
1
1
1
1
1
1
1
1
z4
z14
z13
z12
z8
z11
z24
er4 pl41
er5 pl51
er6 pe11
er13 ph41
er40 inv1
er41 inv21
er48 pr4
er49 pr5
er65rft31
er64rft21
er63rft11
11
Pval
Sval
risks1 risks2
er80 er81
1 1
1
1
1
1
z23
z22
1
1
1
1
1
1
1
1
1
1
1
1
1
1
1
Probability to select the choice
er100
1
1
1
1
1
1
1
1
1
1
1
1
1
1
1
1
er1011
1
rq
z18
1
1
1
1
Remark: “Probability to select the choice” was not included in the AMOS model for recent home buyers

197
Structural Model Fitting The assessment of model fit was similar to the confirmatory factor analyses. Four major criteria, χ2/df, IFI & NNFI, CFI, and RMSEA, were used to examine the fit of the structural model. The fit indices showed a marginal acceptable fit for the hypothesized model (χ2/df = 1.800; IFI=.910; NNFI=.907; CFI=.910; RMSEA=.044). The details are shown graphically in Figure 6.11 and the fit results were shown in Table 6.27.
Figure 6.11: Structural Relations and Coefficients for the Base Model of Recent Home Buyers
Notes: χ2/df = 1.800; RMSEA=.044; IFI=.910; NNFI=.907; CFI=.910 The standardized structural coefficients were displayed; * p < .05; ** p < .01; *** p < .001. NS represents coefficients that are not significant from zero at a .05 significance level.
Table 6.27: The Comparisons between the Fit indices of the Proposed Model and the Recommended Level Fit Indices Recommended Level Hypothesized Model Fits χ2/ df <3.00 1.800 IFI >.90 .910 NNFI >.90 .907 CFI >.90 .910 RMSEA <.08 (<.05) .044 Remarks: IFI = Incremental Fit Index; NNFI = Non-Normed Fit Index; CFI = Comparative Fit Index; RMSEA= Root
Mean Square Error of Approximation
Since the hypothesized model showed a marginal fit, i.e. all fit indices were around the cut-off point of 0.9, its structural relations could be investigated. However, the modification of the model in an attempt to improve its fit was performed, and the alternative model will be proposed at the end of this part. Based on the
Perceived Risk
Relationship Quality
External Risk
Personal Trust
Personal Commitment
Product Quality
Location
Environment
Housing Factors
Brand Association
Perceived QualityBrand Loyalty
Brand Equity
Service Quality
Customer Involvement
Perceived Price
Perceived Value
Personal Value
Social Value
Relation with Firm
Internal Risk
.879***
.838***
.887***
.874***
. 823***
.808***
.936***
.820***
.171***
.890*** .920*** .919***
.151** .596***
.109**
.425*** -.177*** NS NS -.108**
.105* -.174***.921*** .935***
.180***

198
proposed model, the corresponding path diagram for the structural equation can be proposed as:
Perceived value = βpq*PQ+βsq*SQ+βbq*BQ+βpric*Pric+βrisk*RISK+βinv1*INV+βrq*RQ+ε
The above .90 of many fit indices indicated an acceptable approximation of the proposed relationships among the constructs. Thus, the results should be interpreted meaningfully. Moreover, the squared multiple correlations (r2) suggested that the predictors accounted for 63.3% of the variance associated with perceived value. (See the details in Table 6.27). Since the expected relationships between constructs were empirically supported, the nomological validity ensuring the degree to which the measures of those constructs behaved as they should could be assumed to a certain degree (Peter, 1981). As such, the structural relationships and their related hypotheses could be tested accordingly. Hypotheses Testing The results of twelve hypotheses testing together with thirteen sub-hypotheses are presented in this part. All hypotheses could be categorized into four major groups based on their characteristics. The first group focused on the direct relationship between antecedents, i.e. benefit and sacrifice constructs and perceived value and also those antecedents and relationship quality. These hypotheses could be tested by analyzing the base model. The second group of hypotheses focused on the relationship between perceived value and the sub-dimensions of the antecedents and the mediator. Two additional structural models were investigated. The third group hypothesized the mediating relationship of value influencing factor and perceived value, the series of regression analyses and Sobel test were applied to test these hypotheses. The last group of hypotheses focused on the robustness of the model and moderating effect of some consumer characteristics. The SEM Multi-group analyses were performed to test these hypotheses. The list of proposed hypotheses was presented in Table 4.1: Chapter 4. The details of each group of hypotheses testing are as followed:

199
Hypotheses Test for the Direct Effects of the Antecedents The hypotheses were tested by analyzing the t-values at a significance level
of .05 or less. The proposed model included structural relationships between all major antecedent constructs for perceived value. As such, Hypotheses 1 to Hypothesis 10 together with sub-hypotheses 1c and 7a could be tested. Hypotheses 1-3: Product quality & sales service quality (H1), brand equity (H2),
relationship quality (H3) were positively related to perceived value Hypotheses 4-6: perceived price (H4), perceived risk (H5), and customer involvement
(H6) were negatively related to perceived value. Hypotheses 1 to 6 aimed to test the direct effects of antecedents to
perceived value while Hypotheses 7 to 10 were designed to test the relationship between all antecedents and the relationship quality which was proposed as the mediator of the model. The results of the structural relationships between constructs are shown in Table 6.28 as follows:
Table 6.28: Direct Relationship Estimated for perceived value and its antecedents
Hypotheses and Paths in the Model Estimated Relationship Coefficients
t-value p-value SMC
Antecedents H1 Product Quality Perceived Value .158*** (.180) 4.282 .000 .633a H1d Sales Service Quality Perceived Value .090* (.105) 2.109 .035 H2 Brand Equity Perceived Value .123** (.109) 2.585 .010 H4 Perceived Price Perceived Value -.110*** (-.108) -2.669 .008 H5 Perceived Risk Perceived Value -.138*** (-.174) -4.128 .000 H6 Involvement Perceived Value .067 (.067) 1.510 .131 Mediator H3 Relationship Quality Perceived Value .421*** (.596) 11.035 .000 .293b H7 Product Quality Relationship Quality .213*** (.171) 3.582 .000 H7a Sales Service Quality Relationship Quality .514*** (.425) 7.683 .000 H8 Brand Equity Relationship Quality .241*** (.151) 3.082 .002 H9 Perceived Risk Relationship Quality -.199*** (-.177) -3.688 .000 H10 Involvement Relationship Quality .091 (.065) 1.242 .214 Notes: Figures shown in each cell indicate the unstandardized coefficients. Figures in the brackets indicate the standardized coefficients.
t-values are significant at * p<.05 ** p<.01 *** p<.001. SMC stands for Squared Multiple Correlations as follows: a Represents the SMC (r2) of perceived value b Represents the SMC (r2) of relationship quality

200
Hypotheses 1 to 6 aimed to test the direct effects of antecedents to perceived value. All but one of the six proposed hypotheses was supported by the data. The structural relationship between perceived value and all antecedents showed significant relationships, except that of customer involvement. The unstandardized coefficients (β) of the structural paths were consistent with the prediction in both direction and magnitudes. Product quality (H1), brand equity (H2), and relationship quality (H3) were significantly and positively related to perceived value of the product (t=4.282, 2.585, 11.035; p<.001, respectively). Perceived price (H4) and perceived risk (H5) were significantly and negatively related to perceived value as proposed (t=-2.669 and -4.128; p<.001, respectively). In addition, sales service quality (H1d) was also found to be positively related to perceived value. However, its significance was only at the marginal level (t=2.109, p=.035). Thus, the relationship between this construct and perceived value would be reconsidered in the next step of structural model modification. Customer involvement (H6) did not have a significant relationship with perceived value (t=.067, p>.05). This is not surprising, since home buyers seemed to perceive their effort to search for the houses in various ways. According to the focus group discussions, some recent home buyers who put a high effort into information searching and have much experience and knowledge about the houses reported that their houses were much better than others i.e., the houses’ values were very high while other high-degree-experience home buyers felt that all houses, including their houses, were not so different. Therefore, the involvement and effort home buyers put into their house selections tended to influence the customers in different way. Thus, customer involvement was not statistically related to the value of the house. Another five structural paths between value and each influencing factor were significant. Product quality, sales service quality, and brand equity positively related to perceived value with standardized coefficients of .180, .105, and .109, while perceived risk and priced were negatively related to value as hypothesized with the standardized coefficients of -.108 and -.174. Also, the positive relationship between relationship quality and value was found with a standardized coefficient of .596 which was the highest among all antecedents.

201
Compared with the unstandardized coefficients, standardized coefficients are better capable of representing the relative contribution of the predictors in explaining endogenous variables. Comparing all standardized coefficients appearing in the post purchase model, perceived value, received the strongest influence from relationship quality (.421) followed by product quality (.158), perceived risk (-.138), brand equity (.123), perceived price (-.110), and sales service quality, respectively. Moreover, the standardized coefficient of relationship quality was so much higher than those of other factors which would indicate that the relationship quality largely explained perceived value of the house while other antecedents affected perceived value in almost the same level since their standardized coefficients were not really different. The strong impact of relationship quality was consistent with the literature (e.g. Bendapudi and Berry, 1997; Macintosh and Lawrence, 1997; Lin and Ding, 2005). Each benefit and sacrifice gained from buying a product could affect perceived value less than the psychological or emotional bonding with the product, the brand, the firm, and even salespersons would also influence consumer perception of the value of the product (Grönroos, 1990; Crosby et al., 1990). This might be because the degree of appropriateness of a relationship could fulfill the needs of the customer (Hennig-Thurau and Klee, 1997). Therefore, the quality of bonding would impact the formation of value of the product (Bendapudi and Berry, 1997). Hypotheses Test for the Sub-Dimensions of the Antecedents and Mediator In addition to main hypotheses 1 to 6, sub-hypotheses on the relationships between perceived value and 1) the dimensions of some antecedents i.e., product quality and perceived risk and 2) the dimensions of relationship quality were proposed in an attempt to test the first set of sub-hypotheses. Thus, the second structural model was used to test Hypotheses 1a, 1b, 1c, 5a and 5b. Hypotheses 1a, b, c: The quality of housing factors, environment, and location were
positively related to the perceived value of the house. Hypotheses 5a, b: Internal risk and external risk were negatively related to the
perceived value of the house.

202
To test these sub-hypotheses, each dimension of product quality and perceived risk was separated and included in this model. Figure 6.12 shows the second structural model.
Figure 6.12: Coefficients for the Second Structural Model of Recent Home Buyers
Notes: χ2/df = 2.262; RMSEA=.055; IFI=.857; NNFI=.853; CFI=.857 The standardized structural coefficients were displayed; * p < .05; ** p < .01; *** p < .001. NS represents coefficients that are not significant from zero at a .05 significance level.
The SEM results indicated some significant and not significant relationships
between perceived value and each dimension of the antecedents as concluded in Table 6.29:
Table 6.29: Structural Relationship Estimated of the Dimensions of Product Quality and Perceived Risk
Hypotheses and Paths in the Model Estimated Relationship Coefficients t-value p-value
H1a Housing Factors Perceived Value .014 (.017) .559 .576 H1b Environment Perceived Value .039 (.049) 1.567 .117 H1c Location Perceived Value .080 (.098) 3.157 .002 H5a Internal Risk Perceived Value -.145 (-.191) -5.947 .000 H5b External Risk Perceived Value -.001 (-.001) -.021 .983 Notes: Figures shown in each cell indicate the unstandardized coefficients. Figures in the brackets indicate the standardized coefficients.
t-values are significant at * p<.05 ** p<.01 *** p<.001.
Most unstandardized coefficients (β) of the structural paths were not significant. The relationship between housing factors (H1a) and environment (H1b) and perceived value was not significant (t=.559 and 1,567; p>.05). Only the relationship between location and perceived value (H3) was significantly positive (t=3.157; p<.01). Thus, hypotheses 1c was supported while hypotheses 1a and 1b were not supported.
C u s to m e r In vo lv e m e n t
R e la t io n sh ip Q u a lity
P e rso n a l T ru s t
P e rso na l C om m itm en t
H ou s in g F a c to rs
B ra n d A s so c ia t io n
P e rce iv e d Q u a lityB ra n d L o ya lty
B ra n d E q u ity
S e rv ic e Q u a lity
E x te rn a l R is k
P e rc e iv e d P r ic e
P e rc e iv e d V a lu e
P e rs o n a l V a lu e
S o c ia l V a lu e
R e la tio n w ith F irm
-.1 9 1 ** - .0 0 1
L o ca tio n E n v iro nm en t
In te rn a lR is k
.0 9 8 * * .0 4 9 .0 1 7

203
The value of the house was associated with its location, not its environment or housing factors in the recent home buyers’ perspective.
For Sub-hypotheses 5a and 5b, the relationship coefficients indicated a significant negative relationship between internal risk and perceived value (t=-5.947; p<.001) while the relationship between external risk and perceived value was found to be negative as proposed but not significant (t=-.021; p>.05). External risk that was not statistically significant might be because these home buyers already considered their houses as low social and financial risk before selecting those houses. As social risk was related to the brand, the price, and the size of housing and housing project, it was possible for home buyers to evaluate these factors before the actual selection of the house. Consistently, recent home buyers might be unaware of the financial risk since they perceived that the houses were affordable for them. Based on these reasons, the two external risk; social and financial risk might not negatively influence the value of the house in the recent home buyers’ opinion. Thus, Hypothesis 5a was supported while Hypothesis 5b was not supported. Another set of sub-hypotheses on the relationships between perceived value and the dimensions of relationship quality as proposed in Hypotheses 3a to 3c and the relationships between brand equity and each dimension of relationship quality as proposed in Hypotheses 8a to 8c could be tested by the third structural model. The details of sub-hypotheses were presented as follows: Hypotheses 3a, b, c: Personal trust, commitment, and relationship to real estate firm
were positively related to perceived value of the house Hypotheses 8a, b, c: The brand equity of the real estate firm is positively related to
personal trust, commitment, and relationship to real estate firm
In this model all antecedents were considered as the second order factors while three dimensions of the intervening factor, i.e. relationship quality was separately analyzed. The third structural model and its hypothesized coefficients are illustrated graphically in Figure 6.13 and the relationship coefficients and their significances are shown in Table 6.30 as follows:

204
Figure 6.13: Coefficients for the Third Structural Model of Recent Home Buyers
Notes: χ2/df = 1.595; RMSEA=.038; IFI=.933; NNFI=.931; CFI=.933 The standardized structural coefficients were displayed. * p < .05; ** p < .01; *** p < .001 NS represents coefficients that are not significant from zero at a .05 significance level.
Table 6.30: Structural Relationship Estimated of the Dimensions of Relationship Quality
Hypotheses and Paths in the Model Unstandardized Relationship Estimated
t-value p-value H3a Personal Trust Perceived Value .077 (.320) 5.958 .000 H3b Commitment Perceived Value .151 (.258) 4.193 .000 H3c Relations with the firm Perceived Value .314 (.672) 8.314 .000 Notes: Figures shown in each cell indicate the unstandardized coefficients. Figures in the brackets indicate the standardized coefficients.
t-values are significant at * p<.05 ** p<.01 *** p<.001. Structural relationship coefficients (Unstandardized β) indicated that all
dimensions of relationship quality were significantly and positively related to perceived value. The t-value of 8.314, 5.958, and 4.193 for the relationships between perceived value and relations with the firm, personal trust, and personal commitment were statistically significant (p<.001). The results were consistent with the sub-hypotheses proposed previously. Thus, sub-hypotheses 3a, 3b, and 3c were supported. Moreover, the standardized coefficient of .672 of relationships with the firm indicated that it had the highest impact on perceived value while personal trust (β=.320) and commitment (β=.258) were the second and the last, respectively. Similarly, brand equity was found to be significantly and positively related to all dimensions of relationship quality (β=.208, .478, and .612; t=. 4.926, 8.045, and 10.450; p<.000).
Perceived Risk
Personal Commitment
External Risk
Product Quality
Location
Environment
Housing Factors
Brand Association
Perceived QualityBrand Loyalty
Brand Equity
Service Quality
Customer Involvement
Perceived Price
Perceived Value
Personal Value
Social Value
Internal Risk
.612***
.208***
.478***
Relation with Firm
Personal Trust
.672***
.320***
.258***

205
Hypotheses Test for the Indirect Effects of the Antecedents Hypotheses 7 to 10 and sub-hypothesis 7a, aimed to test the mediating
effect of the intervening variable which is relationship quality. Since a significant relationship between relationship quality (mediator) and perceived value (dependent variable) was already shown in the previous stage, the structural relationship between all antecedents and mediator would be tested first. As seen in Table 6.27, all but one relationship were significant. Product quality, sales service quality, and brand equity were significantly and positively related to relationship quality (t= 3.582, 7.683, and 3.082; p<.001, respectively). Perceived risk was significantly and negatively related to relationship quality as proposed (t=-3.688; p<.001). However, consumer involvement was found to be not significantly related to relationship quality (t=1.242, p>.05). In order to better understand the mediating effects of relationship quality, the total influence of the exogenous factors (antecedents) on the endogenous factor perceived value, both direct and indirect effects were investigated. Indirect effects represented the influence of the exogenous factors on an endogenous factor as mediated by the intervening factor, which could be derived by multiplying the unstandardized parameter estimates of the intervening factors (Diamantopoulos and Siguaw, 2000). The test of mediation can be performed in two comparable ways. One was the analysis of direct, indirect, and total effects in the structural equation models and the second one was the formal test of mediation as suggested by Baron and Kenny (1986) using regression analysis (Sweeney et al., 1999). Both methods were done to test H7 to H10 since the first method yielded the coefficients of all exogenous and mediating factors together with the predictive indicator, i.e. r2 of each variable, while the second method would be done to test the significance of mediating relationships. The results of the first test are shown in Table 6.30. According to Baron and Kenny (1986), the second method could be done by estimating three regression models: 1) the model in which the dependent variable was regressed on the independent variable, 2) the model in which the mediator was regressed on the independent variable, and 3) the model in which the dependent variable was regressed on both the independent variable and the mediating variable.

206
To interpret the result, a mediating effect was shown if a) both effects in models one and two are significant, b) the mediator significantly affects the dependent variable in the third model, and, c) the effect of independent variable in the third model is less than its effect in the first model. The full mediation effect was shown if the effect of the independent variable became not significant in the third equation. If this effect was reduced significantly but was still significant in the third equation then the mediation effect was partial (Baron & Kenny, 1986; Kenny, Kashy & Bolger, 1998). According to the regression analyses results presented in Table 6.31, a full mediating effect of relationship quality was found in sales service quality and involvement while a partial mediating effect was found for product quality, brand equity, perceived price and perceived risk. Table 6.31: Regression Equation Tests for Mediating Effects of the Base Model for Recent Home Buyers
Relationship Estimated Equation 1 Equation 2 Equation 3 Paths in the Model β t-value β t-value β t-value
Mediation Effect
Antecedents Product Quality Value 0.242
(.262) 9.18*** 0.135 (.166) 5.68*** 0.149
(.165) 6.93*** Partial Sales Service Quality Value 0.273
(.304) 10.79*** 0.401 (.493) 17.54*** 0.004
(.004) -0.14 Full Brand Equity Value 0.129
(.152) 4.97*** 0.098 (.128) 4.19*** 0.061
(.072) 2.95*** Partial Price Value -0.154
(-.163) -6.58*** -0.111 (-.129) -5.24*** -0.078
(-.082) -4.09*** Partial Perceived Risk Value -0.227
(-.255) -9.95*** -0.153 (.190) -7.44*** -0.121
(-.136) -6.37*** Partial Involvement Value 0.062
(.071) 3.04** 0.062 (.078) 3.34** 0.020
(.022) 1.202 None Mediator Relationship Quality Value 0.69
(.625) 16.19*** - Notes: Figures shown in each cell indicate the unstandardized coefficients. Figures in the brackets indicate the standardized coefficients.
t-values are significant at * p<.05 ** p<.01 *** p<.001.
The amount of mediation, called the indirect effect, refers to the reduction of the effect of the initial variable on the outcome. The amount of reduction in the effect of the exogenous on endogenous variable is not equivalent to either the change in variance explained or the change in an inferential statistic such as F or a p value. It is possible for the F from the initial variable to the outcome to decrease dramatically even

207
when the mediator has no effect on the outcome. It is also not equivalent to a change in partial correlations. To calculate the significance of mediation, a single test proposed by Sobel (1982) is highly recommended (MacKinnon et al., 2002). The unstandardized coefficients and their individual standard errors are required. However the Aroian version of the Sobel test was suggested in Baron and Kenny (1986) for use because it does not make the unnecessary assumption that the product of sa and sb is vanishingly small. The significance test could be achieved by the formula of Sobel test (Aroian version) as:
z-value = a*b/(b2*sa2 + a2*sb2 + sa2*sb
2)
Where “a” is a raw (unstandardized) regression coefficient for the association between the independent variable and mediator; sa is a standard error of “a”; “b” equals raw coefficient for the association between the mediator and the dependent variable (when the independent variable is also a predictor of the dependent variable); and sb refers to a standard error of “b” (Baron and Kenny, 1986).
Table 6.32: Total Effects on Perceived Value for Base Model of Recent Home Buyer
Relationship Estimated Sobel Test Paths in the Model Direct Effect Indirect Effect Total Effect z-value p-value Antecedents Product Quality Value .158 (.180) .090 (.102) .248 (.282) 3.419 .000 Sales Service Quality Value .09 (.105) .216 (.253) .306 (.358) 6.289 .000 Brand Equity Value .123 (.109) .102 (.090) .225 (.200) 2.965 .003 Price Value -.110 (-.108) - -.110 (-.108) Perceived Risk Value -.138 (-.174) -.084 (-.106) -.222 (-.280) 3.484 .000 Involvement Value .067 (.067) .039(.038) .106 (.105) NS NS Mediator Relationship Quality Value .421 (.596) - .421 (.596) Notes: Figures shown in each cell indicate the unstandardized coefficients; Figures in the brackets indicate the
standardized coefficients; Figures in the bold brackets indicate the mediating effect. Square Multiple Correlation (SMC-r2) of perceived value is .633 and relationship quality is 2.93. z-value of the difference between direct and indirect coefficients is calculated by the Sobel test. * p<.05; **p<.01; ***p<.001; NS=Not Significant. Table 6.32 shows the total effects (direct and indirect) of the predictors of
perceived value. The mediation effects were calculated and their significances were tested by the Sobel test as seen in the table. Thus, these results would be sufficient to test hypotheses 7 to 10 as:

208
Hypotheses 7-10: Relationship quality mediates the relationship between product quality (H7), sales service quality (H7a), brand equity (H8), perceived risk (H9), customer involvement (H10) and perceived value.
The significant test of all mediation effects showed that all predictors except
customer involvement were significantly mediated by relationship quality with z=3.419 p<.001 for product quality (H7), z=6.289; p<.001 for sales service quality (H7a), z=2.965, p<.01 for brand equity (H8), and z=3.484, p <.001 for perceived risk (H9). Therefore, Hypotheses 7, 7a, 8, and 9 were supported. In contrast, the not significant mediation effect of relationship quality on customer involvement was found. Thus, Hypothesis 10 was not supported. Since the direct effect of consumer involvement on perceived value was also found to be not significant, as seen in Hypothesis 6, customer involvement had neither a direct nor indirect relationship with perceived value. For sales service quality, its direct relationship with perceived value (H1d) was found to be marginally significant while its indirect relationship mediated by relationship quality was found to be full. Thus, the stronger indirect relationship of sales service quality on perceived value than its direct relationship was illustrated.
As discussed previously about the direct effect of predictors on perceived value, relationship quality was found to have the strongest relationship among all predictors while other antecedents seemed to have a similar impact ranking from product quality, perceived risk, brand equity, perceived price, and the least, sales service quality with standardized β of .180, .171, .109, .107, and .105 respectively. In contrast, sales service quality was found to have the highest indirect relationship with perceived value (β=.253) while other factors seemed to show rather similar indirect effects. The standardized coefficients were .106 for perceived risk, .102 for product quality, and .090 for brand equity. This high indirect effect made sales service quality have the second highest total effect on perceived value (β=.358) while the highest total effect was relationship quality (β=.596). The next ranks of the total effects were placed on product quality (β=.282), perceived risk (β=.280), brand equity (β=.200), and perceived price (β=.108).

209
Testing the Robustness of the Proposed Model To test hypothesis 11 on whether the perceived value of a real estate product influences a consumer’s choice selection, two subgroup analyses were performed. As proposed in Hypothesis 11b: “Value formation process of home buyers who choose different types of product i.e. different brand and price level are not different,” the recent home buyers were categorized into subgroups based on the brands and prices of their houses. The value creation process that is not different among home buyers who buy different products indicates that the proposed model can be used to explain the decision making process of all types of buyers. Thus, the robustness of the proposed model could be ensured. Moreover, if the patterns of the estimated structural paths are the same across subgroups, these similarities would indicate the robustness of the model indicating that the structural paths of the model held true across contexts (Udorn, 1999). The real estate brands, as discussed previously in the content analyses of the focus group data, were perceived as two classes, premium and non-premium brands. Therefore, the differences of the structural models of these two subgroups were analyzed. Next, with the same logic, the recent home buyers were categorized into three groups based on the prices of their houses i.e. 1) three to 4.99 million baht, 2) five to ten million baht, and 3) more than ten million baht. Then, the structural relationships of the perceived values of the houses and its antecedents were compared accordingly. For both subgroups’ analyses, the indifference among subgroups was expected in order to conclude that the proposed conceptual model fits well with all types of home buyers, not matter which types of product they selected. This could infer that home buyers selected their houses based on the value they placed on the product, not the product itself. Thus, the results of Hypothesis 11 testing could indicate the relationship between perceived value and consumers’ choice selection.
To identify whether these structural models held true across all subgroups, the multi-group analyses were performed step by step. The measurement model test was first conducted to examine whether the measurement items could measure the same thing and to the same degree in all contexts (Bollen, 1989) before comparing the structural

210
parameters across samples. This prerequisite test would ensure the substantive logic to conducting meaningful cross-group or cross-context comparisons (Vandenberg and Lance, 2000). The measurement models of all subgroups were expected to be not different. In the next step, two structural models, variant and invariant were created. For the variant model, each pair of the structural relations of all subgroups was constrained to be equal while those pairs of structural relations were allowed to be freely estimated in the invariant model. The two nested models were then compared by χ2 different test. The two possible results may be either a significant or not significant different between the constrained and freely estimated models. If the results are shown to be not statistically significant, it could be concluded that the structural paths in both subgroups were not different from each other. Contrastingly, if the χ2 difference was statistically significant, the structural paths are said to be different between the subgroups. Two subgroups analyses were examined in this part. The first subgroup analysis was the comparison between premium and non-premium brands. The results of the comparison of the measurement model test were shown to be not different. The χ2 result of 68.449 with 75 degrees of freedom was not statistically significant (p=.690). It indicated that the measurement items could measure the same thing for both subgroups. Thus, the structural parameters of two subgroups could be compared. As discussed previously, if the proposed model was robust, the relationships among perceived value and its antecedents should remain the same, regardless of the brand level. The support for this assertion was found. The χ2 difference test indicated that the structural paths of the two subgroups were not statistically different (χ2=5.082; df=12; p= .955). The results suggested that the research model was robust. Although the sizes of some estimated parameters appeared to be different between subgroups of premium and non-premium brands, the significance of these differences were not found. Even though the effect of product quality on perceived value, both direct and indirect, appeared to be different between premium and non-premium brands (β=.203 and .120 for direct effect and β=.301 and .150 for indirect effect), but the pairwise parameter comparisons showed that these differences were not significant (z=-1.113 and-1.258; p>.05). The results of pairwise comparisons of other structural relations in the models were also found to be not statistically significant (p>.05). These results indicated

211
that there were no differences between all pairs of estimated parameters of premium and non-premium brands. Table 6.33 summarizes the findings from the premium and non-premium brand subgroups analyses.
Table 6.33: Summary of Premium and Non-Premium Subgroup Analyses of Recent Home Buyers Brand of Real Estate Developers Parameters Premiumab Non-Premium
Difference (z-value)c
Antecedents Product Quality Value .203*** (.212) .120* (.144) -1.113 Sales Service Quality Value .079 (.091) .113 (.133) 0.401 Brand Equity Value .113 (.099) .126 (.110) 0.128 Perceived Price Value -.113 (.102) -.112 (-.120) 0.023 Perceived Risk Value -.093* (-.114) -.204* (-.262) -1.664 Involvement Value .094 (.089) .050 (.052) -0.493 Relationship Quality Value .445*** (.613) .367 (.539) -1.138 Mediator Product Quality Relationship Quality .301*** (.229) .150 (.123) -1.258 Sales Service Quality Relationship Quality .481*** (.406) .551***(.443) 0.554 Brand Equity Relationship Quality .224* (.142) .232* (.139) 0.052 Perceived Risk Relationship Quality -.196* (-.174) -.194* (-.171) 0.013 Involvement Relationship Quality .126 (.087) .073 (.052) -0.358 Comparison of the Models: χ2=5.082 df =12 P-value=.955 Notes: a. Figures shown in the column represent unstandardized coefficients of the structural relationships.
b. The significances were analyzed based on t-test: * p<.05; ** p<.01; *** p<.001. c. Z-values of the different between parameters of two models were gathered from the pairwise parameter comparisons. All of them are not significant in this multi-group analysis.
To confirm that the research model was robust, further model test in the different context was required. Therefore, subgroup comparison on the houses’ price level was performed. The comparison was done among three subgroups: three to 4.99 million baht, five to ten million baht, and more than ten million baht. The first result of CFA comparison indicated that the measurement models of all subgroups were not different (χ2 = 136.693; df=150; p=.774). For the comparisons of the structural parameters, the χ2 difference test indicated that the structural paths of the three price subgroups were not different (χ2=13.995; df = 24; p= .947). Thus, the proposed research model was robust. Although the sizes of some estimated parameters appeared to be different among subgroups looked different such as the relationships between product quality and perceived value (β = .229, .227, and .078) and brand equity-perceived value (β = .159, 214, .016), the significance of those differences were not found (See the details in Table 6.34). Thus, the overall results indicated that the value formation process of the three subgroups of recent home buyers who bought the houses with different price were not significantly differences as expected.

212
Table 6.34: Summary of Price level Subgroup Analyses of Recent Home Buyers
Notes: a. Figures shown in the column represent unstandardized coefficients of the structural relationships. b. The significances were analyzed based on t-test: * p<.05; ** p<.01; *** p<.001. c. Z-values of the different between parameters were gathered from the pairwise parameter comparisons. N.S. = Not Significant i.e., all z-value of the difference between parameters of three subgroups were not
significant. As discussed at the beginning of this part, if Hypothesis 11 is proved to be correct, the value formation process of each subgroup of the home buyers that are not different would indicate that the buyers select their final choice based on value, not individual attribute of the product. The data analyses results indicated that values given by each subgroup were not significantly different (t=1.86, p>.05 for the comparison of premium & non-premium brands and f= 2.40, p>.05 for the comparison of the three price level groups: see Table 6.32 and 6.33 for the details). Thus hypothesis 11b was supported. Similar value formation and choice selection process among different types of products inferred that home buyers engaged in the same purchase process and made their decisions based on the value of the house, not the characteristics of the house. The results indicated that the proposed relationships between perceived value and its antecedents remained the same regardless of the price level of the house and the brands of the real estate developers. Thus, the robustness of the model could be ensured. Therefore, it could be concluded that the proposed model was reasonably robust across contexts (Udorn, 1999). The influence of perceived value of the product on consumer’s choice selection can be inferred.
Price Level (Million Baht) Parameters 3-4.99 5-10 More Than 10 Difference (z-value)c
Antecedents Product Quality Value .209***(.245) .227***(.262) .078***(.081) N.S. Sales Service Quality Value .137 (.161) .076 (.091) .068 (.074) N.S. Brand Equity Value .159 (.140) .214 (.206) .016 (.013) N.S. Perceived Price Value -.150 (-.153) -.057 (-.054) -.097 (-.90) N.S. Perceived Risk Value -.183 (-.238) -.095 (-.124) -.097 (-.109) N.S. Involvement Value .046 (.046) .051 (.054) .132 (.115) N.S. Relationship Quality Value .319***(.475) .375***(.540) .546***(.715) N.S. Mediator Product Quality Relationship Quality .285** (.225) .309** (.247) .230** (.024) N.S. Sales Service Quality Relationship Quality .568*** (.450) .449*** (.373) .496***(.414) N.S. Brand Equity Relationship Quality .172* (.102) .258* (.172) .352* (.214) N.S. Perceived Risk Relationship Quality -.181* (-.158) -.091* (-.083) -.303* (-.260) N.S. Involvement Relationship Quality .070 (.047) .134 (.100) .109 (.073) N.S. Comparison of the Models: χ2=13.995; df =24; P-value=.947
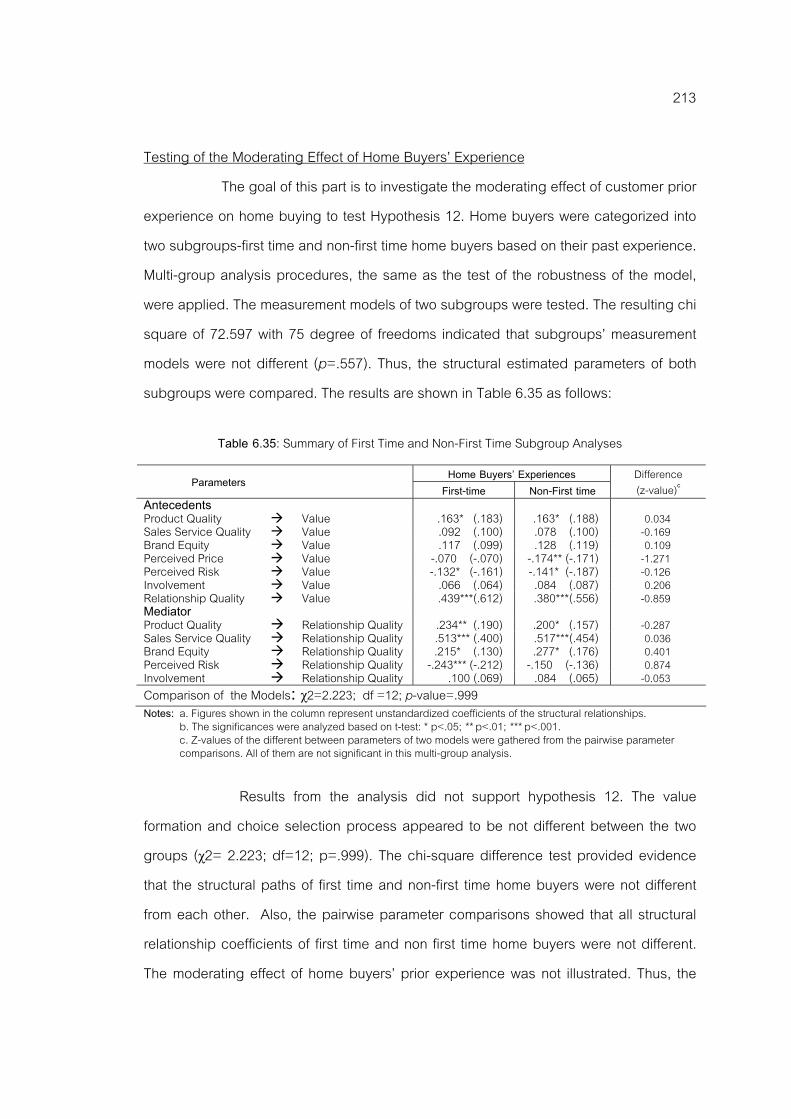
213
Testing of the Moderating Effect of Home Buyers’ Experience The goal of this part is to investigate the moderating effect of customer prior experience on home buying to test Hypothesis 12. Home buyers were categorized into two subgroups-first time and non-first time home buyers based on their past experience. Multi-group analysis procedures, the same as the test of the robustness of the model, were applied. The measurement models of two subgroups were tested. The resulting chi square of 72.597 with 75 degree of freedoms indicated that subgroups’ measurement models were not different (p=.557). Thus, the structural estimated parameters of both subgroups were compared. The results are shown in Table 6.35 as follows:
Table 6.35: Summary of First Time and Non-First Time Subgroup Analyses Home Buyers’ Experiences Parameters First-time Non-First time
Difference (z-value)c
Antecedents Product Quality Value .163* (.183) .163* (.188) 0.034 Sales Service Quality Value .092 (.100) .078 (.100) -0.169 Brand Equity Value .117 (.099) .128 (.119) 0.109 Perceived Price Value -.070 (-.070) -.174** (-.171) -1.271 Perceived Risk Value -.132* (-.161) -.141* (-.187) -0.126 Involvement Value .066 (.064) .084 (.087) 0.206 Relationship Quality Value .439***(.612) .380***(.556) -0.859 Mediator Product Quality Relationship Quality .234** (.190) .200* (.157) -0.287 Sales Service Quality Relationship Quality .513*** (.400) .517***(.454) 0.036 Brand Equity Relationship Quality .215* (.130) .277* (.176) 0.401 Perceived Risk Relationship Quality -.243*** (-.212) -.150 (-.136) 0.874 Involvement Relationship Quality .100 (.069) .084 (.065) -0.053 Comparison of the Models: χ2=2.223; df =12; p-value=.999 Notes: a. Figures shown in the column represent unstandardized coefficients of the structural relationships.
b. The significances were analyzed based on t-test: * p<.05; ** p<.01; *** p<.001. c. Z-values of the different between parameters of two models were gathered from the pairwise parameter comparisons. All of them are not significant in this multi-group analysis.
Results from the analysis did not support hypothesis 12. The value formation and choice selection process appeared to be not different between the two groups (χ2= 2.223; df=12; p=.999). The chi-square difference test provided evidence that the structural paths of first time and non-first time home buyers were not different from each other. Also, the pairwise parameter comparisons showed that all structural relationship coefficients of first time and non first time home buyers were not different. The moderating effect of home buyers’ prior experience was not illustrated. Thus, the

214
relationships between perceived value and its antecedents were not different between experienced and less-experienced home buyers. To conclude the overall hypotheses testing of the post-purchase home buyers' dataset, Table 6.36 provides the related results and the conclusions.
Table 6.36: The Conclusion of Hypotheses Testing Results for the Recent Home Buyers
Hypothesis Unstandardized β
Standardized β t-value p-value Hypothesis testing
H1 Product Quality Perceived Value .158 .180 4.282 .000 Supported H1a Housing Factors Perceived Value .014 .017 .559 .576 Not Supported H1b Environment Perceived Value .039 .049 1.567 .117 Not Supported H1c Location Perceived Value .080 .098 3.157 .002 Supported H1d Sales Service Quality Perceived Value .090 .105 2.109 .035 Supported H2 Brand Equity Perceived Value .123 .109 2.585 .010 Supported H3 Relationship Quality Perceived Value .421 .596 11.035 .000 Supported H3a Personal Trust Perceived Value .077 .320 5.958 .000 Supported H3b Commitment Perceived Value .151 .258 4.193 .000 Supported H3c Relation with firm Perceived Value .314 .672 8.314 .000 Supported H4 Perceived Price Perceived Value -.110 -.108 -2.669 .008 Supported H5 Perceived Risk Perceived Value -.138 -.174 -4.128 .000 Supported H5a Internal Risk Perceived Value -.145 -.191 -5.947 .000 Supported H5b External Risk Perceived Value -.001 -.001 -.021 .983 Not Supported H6 Involvement Perceived Value .067 .067 1.510 .131 Not Supported H8a Brand Equity Personal Trust .380 .208 4.926 .000 Supported H8b Brand Equity Commitment .358 .478 8.045 .000 Supported H8c Brand Equity Relation with firm .574 .612 10.450 .000 Supported Product Quality Relationship Quality .213 .171 3.582 .000 Significant Sales Service Quality Relationship Quality .514 .425 7.683 .000 Significant Brand Equity Relationship Quality .241 .151 3.082 .002 Significant Perceived Risk Relationship Quality -.199 -.177 -3.688 .000 Significant Involvement Relationship Quality .091 .065 1.242 .214 Not Significant H7 Product Quality Relationship Quality Value 0.102 - 3.419 .000 Supported H7a Sales Service Quality Relationship Quality Value 0.253 - 6.289 .000 Supported H8 Brand Equity Relationship Quality Value 0.090 - 2.965 .003 Supported H9 Perceived Risk Relationship Quality Value 0.105 - 3.484 .000 Supported H10 Involvement Relationship Quality Value NS - NS NS Not Supported H11b Perceived value choice selection
(No different between brand and price subgroups) - - - NS Supported H12 Prior experience choice selection
(Different between first time/non first time subgroups) - - - NS Not Supported Note: For H7-H10: mediating effects were shown in coefficient estimates column and z-value and its significance
calculated by a Sobel test were shown.
215
The twelve hypotheses together with thirteen sub-hypotheses were tested with the structural base model i.e. proposed research model and two additional structural models in which the sub-dimensions of some the constructs were proposed instead. The series of regression analyses and Sobel test were applied to test the mediating effects of relationship quality and the structural multi-group comparisons were performed to test the relationship of perceived value and choice selection and also moderating effect of home buyers’ past experience. Most hypotheses were supported except Hypothesis 6 and 10 on the direct and indirect influences of the customer involvement and Hypothesis 12 about the moderating effect of home buying experience. However, three sub-hypotheses: H1a, 1b, and 5d on the relationship between environment, housing factors, and external risk and perceived value were not supported.
Assessment of Structural Equation Model and Hypotheses Testing for
Prospective Home Buyers Similar to the post-purchase dataset, the base model i.e. proposed conceptual model was tested with the pre-purchase dataset. The structural model fitting of the prospective home buyers was examined first, followed by the assessment of structural relationships among constructs in the base model. Finally, all twelve hypotheses were tested. The results of these analyses are presented as follows: Structural Model Fitting The assessment of model fit was similar to that of the confirmatory factor analyses and the model fit for recent home buyer. Four major criteria, χ2/df, IFI & NNFI, CFI, and RMSEA were used to examine the fit of structural model. All fit indices of the hypothesized model showed acceptable fit with the prospective home buyers’ dataset, at a marginal level since all three fit indices exceeded the cutoff point of .9 and RMSEA at less than .05 (χ2/df = 1.984; IFI=.912; NNFI=.909; CFI=.912; RMSEA=.048). Thus, the hypotheses could be tested. The details are shown graphically in Figure 6.14.
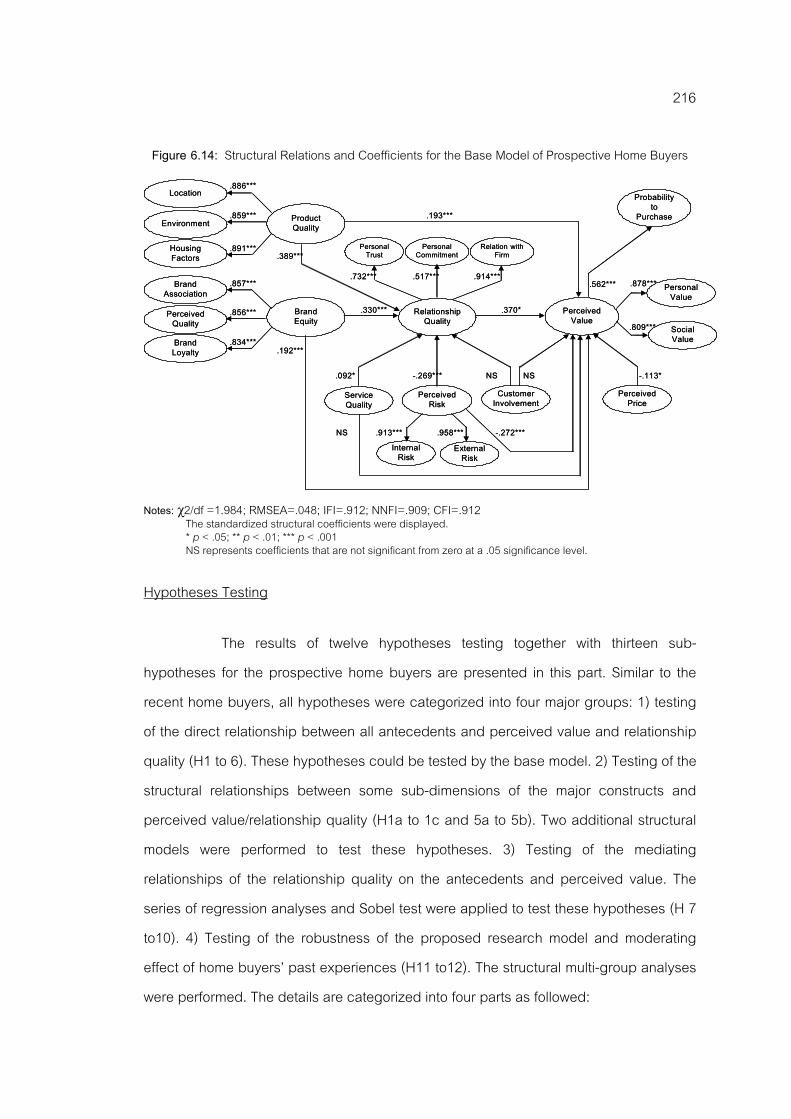
216
Figure 6.14: Structural Relations and Coefficients for the Base Model of Prospective Home Buyers
Notes: χ2/df =1.984; RMSEA=.048; IFI=.912; NNFI=.909; CFI=.912
The standardized structural coefficients were displayed. * p < .05; ** p < .01; *** p < .001 NS represents coefficients that are not significant from zero at a .05 significance level.
Hypotheses Testing The results of twelve hypotheses testing together with thirteen sub-hypotheses for the prospective home buyers are presented in this part. Similar to the recent home buyers, all hypotheses were categorized into four major groups: 1) testing of the direct relationship between all antecedents and perceived value and relationship quality (H1 to 6). These hypotheses could be tested by the base model. 2) Testing of the structural relationships between some sub-dimensions of the major constructs and perceived value/relationship quality (H1a to 1c and 5a to 5b). Two additional structural models were performed to test these hypotheses. 3) Testing of the mediating relationships of the relationship quality on the antecedents and perceived value. The series of regression analyses and Sobel test were applied to test these hypotheses (H 7 to10). 4) Testing of the robustness of the proposed research model and moderating effect of home buyers’ past experiences (H11 to12). The structural multi-group analyses were performed. The details are categorized into four parts as followed:
Perceived Risk
Relationship Quality
External Risk
Personal Trust
Personal Commitment
Product Quality
Location
Environment
Housing Factors
Brand Association
Perceived QualityBrand Loyalty
Brand Equity
Service Quality
Customer Involvement
Perceived Price
Perceived Value
Personal Value
Social Value
Relation with Firm
Internal Risk
Probability to
Purchase
.886***
.859***
.891***
.857***
.856***
.834***
.878***
.809***
.389***
.732*** .517*** .914*** .562***
.330*** .370*
.192***
.092* -.269*** NS NS -.113*
NS -.272***.913*** .958***
.193***

217
Hypotheses Test for the Direct Effects of the Antecedents The hypotheses were tested by analyzing the t-values at a significance level of .05 or less. The proposed model included structural relationships between perceived value and its major influencing constructs. Similar to the post purchase dataset, the first six hypotheses were tested. Hypotheses 1 to 6 were designed to test the direct effects of all antecedents on the perceived value as seen in details as follows: Hypotheses 1-3: Product quality & sales service quality (H1), brand equity (H2),
relationship quality (H3) were positively related to the perceived value Hypotheses 4-6: Perceived price (H4), perceived risk (H5), and customer involvement
(H6) were negatively related to the perceived value. The first six hypotheses could be tested by the analyses of the structural relationship coefficients of the base model as seen in Table 6.37.
Table 6.37: Direct Relationship Estimated for perceived value and its antecedents
Hypotheses and Paths in the Model Estimated
Relationship Coefficients
t-value p-value SMC
Antecedents H1 Product Quality Perceived Value .162 (.193) 3.618 .000 .467a H1d Sales Service Quality Perceived Value .065 (.078) 1.728 .084 H2 Brand Equity Perceived Value .200 (.192) 3.612 .000 H4 Perceived Price Perceived Value -.105 (-.113) -2.451 .014 H5 Perceived Risk Perceived Value -.170 (-.272) -5.404 .000 H6 Involvement Perceived Value .018 (.021) .482 .630 Mediator H3 Relationship Quality Perceived Value .247 (.370) 5.836 .000 .342b H7 Product Quality Relationship Quality .213***(.171) 3.582 .000 H7a Sales Service Quality Relationship Quality .514***(.425) 7.683 .000 H8 Brand Equity Relationship Quality .241***(.151) 3.082 .002 H9 Perceived Risk Relationship Quality -.199***(-.177) -3.688 .000 H10 Involvement Relationship Quality .091 (.065) 1.242 .214 Notes: Figures shown in each cell indicate the unstandardized coefficients. Figures in the brackets indicate the standardized coefficients
t-values are significant at * p<.05 ** p<.01 *** p<.001. SMC stands for Squared Multiple Correlations. SMC values correspond to the endogenous variables as follows: a Represents the SMC (r2) of perceived value
b Represents the SMC (r2) of relationship quality

218
Similar to post-purchase dataset, all but one hypothesis were supported by the data. The structural relationships between perceived value and all antecedents showed significant relationship, except that of sales service quality and customer involvement. The unstandardized coefficients (β) of the structural paths were consistent with proposed in both direction and magnitudes. Product quality (H1), brand equity (H2), and relationship quality (H3) were significantly and positively related to perceived value of the product (t=3.618, 3.612, 5.836; p<.001, and t=.2.974; p<.01, respectively). Perceived price (H4) and perceived risk (H5) were significantly and negatively related to perceived value as proposed (t=-5.404 and -2.451; p<.001, respectively). Customer involvement and perceived value (H6) was not significantly related (t=.482, p>.05). However, in contrast to the post-purchase buyers, the relationship between sales service quality and perceived value (H1d) was found to be not statistically significant (t=1.728, p>.05). Thus, all results except the direct relationship of sales service quality on perceived value (H1d) were similar to the recent home buyers; Hypotheses 1, 2, 3, 4, and 5 were supported while Hypothesis 1d and 6 was not supported by the data.
Hypotheses Test for the Sub-dimensions of the Antecedents and Mediator The sub-hypotheses 1a, 1b, 1c, 5a and 5b were set to test the relationships between perceived value and the dimensions of product quality and perceived risk as: Hypotheses 1a, b, c: The quality of housing factors, environment, and location were
positively related to the perceived value of the house. Hypotheses 5a, b: Internal risk and external risk were negatively related to the
perceived value of the house. To test these sub-hypotheses, three sub-dimensions of product quality and two sub-dimensions of perceived risk were separately proposed in second structural model instead of the product quality and perceived risk constructs. The SEM analysis of the second model was performed as shown in Figure 6.15.

219
Figure 6.15: Coefficients for the Second Structural Model of Prospective Home Buyers
Notes: χ2/df = 2.449 RMSEA=.059; IFI=.870; NNFI=.866; CFI=.869 The standardized structural coefficients were displayed. * p < .05; ** p < .01; *** p < .001
In contrast to the recent home buyers, the SEM results showed all
significant relationships between perceived value and all dimensions of product quality and perceived risk. The relationships between environment, housing factor, and external risk which were not statistic significant in the post-purchase dataset were found to be significant in the prospective home buyers as seen in Table 6.38.
Table 6.38: Structural Relationship Estimated of the Dimensions of Product Quality and Perceived Risk
Hypotheses and Paths in the Model Estimated Relationship Coefficients
t-value p-value
H1a Housing Factors Perceived Value .110 (.155) 3.367 .000 H1b Environment Perceived Value .070 (.106) 2.239 .025 H1c Location Perceived Value .054 (.095) 2.045 .041 H5a Internal Risk Perceived Value -.117 (-.221) -4.720 .000 H5b External Risk Perceived Value -.200.(-192) -3.612 .000 Notes: Figures shown in each cell indicate the unstandardized coefficients Figures in the brackets indicate the standardized coefficients
t-values are significant at * p<.05 ** p<.01 *** p<.001.
Customer Involvement
Relationship Quality
Personal Trust
Personal Commitment
Housing Factors
Brand Association
Perceived QualityBrand Loyalty
Brand Equity
Service Quality
ExternalRisk
Perceived Price
Perceived Value
Personal Value
Social Value
Relation with Firm
Probability to
Purchase
-.113* -.221***
Location Environment
InternalRisk
.095* .106* .155***

220
All Sub-hypotheses 1a, 1b, 1c, 5a, and 5b were supported by the significant unstandardized coefficients (β) of the structural paths (t=3.367, 2.239, 2.045, -4.270 and -3.612, respectively). The standardized coefficient of housing factors (β=.155) showed its higher impact on perceived value than the environment and location sub-dimensions. The significant relationships of the environment and housing factors were different from the recent home buyers. Therefore, the prospective home buyers seemed to value their houses based on the location, environment, and housing factors while the location was only one factor that was important to the recent home buyers.
The significant effects of the two dimensions of perceived risk on perceived value were also different from the recent home buyers in that external risk had significant effect on the perceived value. As the prospective home buyers had not decided on which houses to buy yet, they would concern for the social acceptance and possible financial problems receiving from the choice while the recent home buyers might concern less on this issue since they already considered these issues and made their final choices. Thus, this showed a different value formation process between the recent and prospective home buyers. The next sub-hypotheses tests on the relationships between the sub-dimensions of relationship quality and perceived value were proposed in Hypotheses 3a to 3c and relationships between brand equity and each dimension of relationship quality as proposed in Hypotheses 8a to 8c. The details of sub-hypotheses were: Hypotheses 3a, b, c: Personal trust, commitment, and relationships with the real
estate firm were positively related to the perceived value of the house.
Hypotheses 8a, b, c: The brand equity of the real estate firm is positively related to personal trust, commitment, and relationships with the firm.
The third structural model in which the relationship quality was separated into three dimensions was performed. The third structural model and its hypothesized coefficients are illustrated graphically in Figure 6.16 and the Sub-hypotheses testing results are presented in Table 6.39 as follows:

221
Figure 6.16: Coefficients for the Third Structural Model of Prospective Home Buyers
Notes: χ2/df = 2.034; RMSEA=.050; IFI=.907; NNFI=.904; CFI=.907 The standardized structural coefficients were displayed. * p < .05; ** p < .01; *** p < .001; NS represents coefficients that are not significant
Table 6.39: Structural Relationship Estimated of the Dimensions of Relationship Quality
Hypotheses and Paths in the Model Unstandardized Relationship Estimated t-value p-value
H3a Personal Trust Perceived Value .158 (.421) 8.227*** .000 H3b Commitment Perceived Value .000 (.000) .008 .993 H3c Relations with the firm Perceived Value .110 (.247) 2.974*** .003 Notes: Figures shown in each cell indicate the unstandardized coefficients Figures in the brackets indicate the standardized coefficients; t-values are significant at *** p<.001.
Structural relation coefficients (Unstandardized β) indicated that only personal
trust and relationship with the firm were significantly and positively related to perceived value. The t-value of 2.974 (p<.01) and 8.227 (p<.001) were found. The standardized coefficient of personal trust (β=.421) showed its stronger effect on perceived value than that of the relations with the firm (β=.247). In contrast to the recent home buyers, personal commitment was found to have no significant effect of perceived value. This result indicated that the prospective home buyers perceived the value of the product based on their relationships with the real estate firm and personal trust in the salespersons, not the commitment on any real estate representatives. Thus, personal commitment might be developed after the choice process. Thus, Sub-hypotheses 3a, 3c, were supported while Sub-hypothesis 3b was not supported. For the relationship between brand equity and each dimension of relationship quality, only the relationship between brand equity and personal trust and relations with firm were found to be significant (β=.444 and .791; t=9.797 and 14.195; p<.000) while the relationship between brand equity and personal commitment was found to be not statistically significant (β=.042, t=1.752, p>.005). Thus, Hypotheses 8a and 8c were supported while Hypotheses 8b was not supported.
P e rc e iv e d R is k
P e rs o n a l C o m m itm e n t
E x te rn a lR is k
P ro d u c t Q u a l ity
L o c a t io n
E n v ir o n m e n t
H o u s in g F a c to r s
B ra n d A s s o c ia t io n
P e rc e iv e d Q u a l ityB ra n d
L o y a lty
B ra n d E q u ity
S e rv ic e Q u a lity
C u s to m e r In v o lv e m e n t
P e rc e iv e d P r ic e
P e rc e iv e d V a lu e
P e rs o n a l V a lu e
S o c ia l V a lu e
In te rn a l R is k
P ro b a b i l ity to
P u rc h a s e
.7 9 1 * * *
.4 4 4 * * *
N S
R e la t io n w ith F irm
P e rs o n a l T ru s t
.2 4 7 * *
.4 2 1 * * *
N S
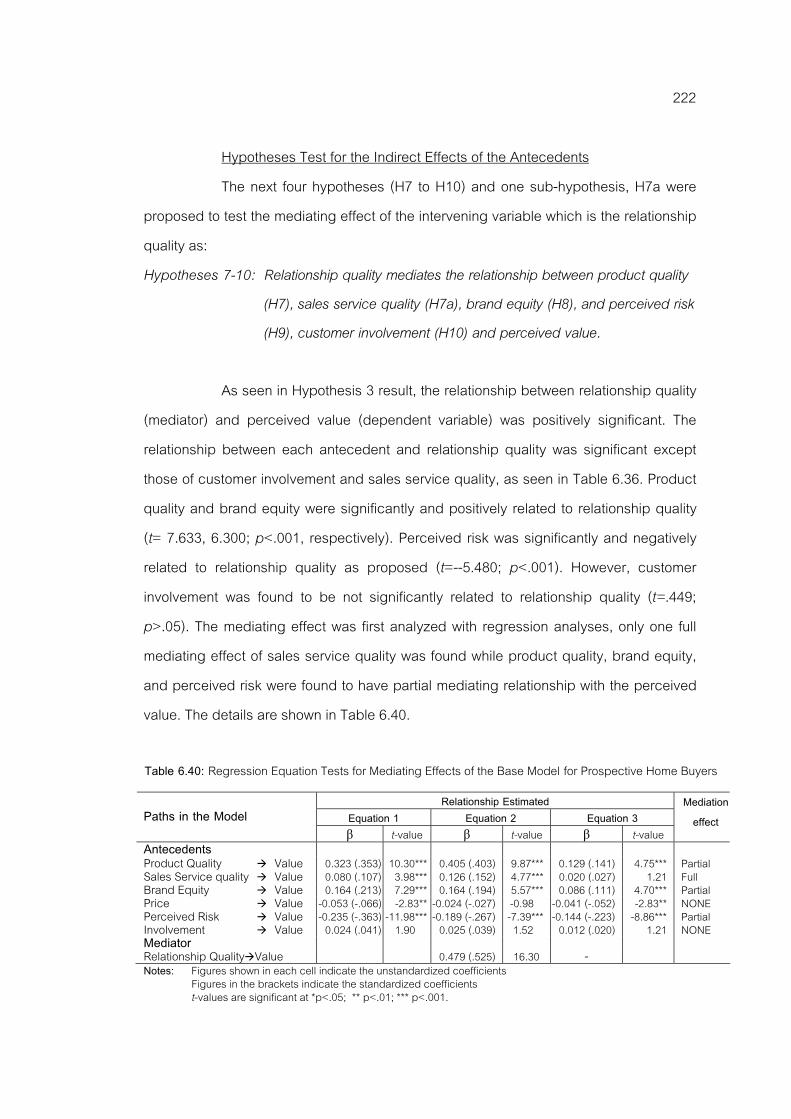
222
Hypotheses Test for the Indirect Effects of the Antecedents The next four hypotheses (H7 to H10) and one sub-hypothesis, H7a were
proposed to test the mediating effect of the intervening variable which is the relationship quality as: Hypotheses 7-10: Relationship quality mediates the relationship between product quality
(H7), sales service quality (H7a), brand equity (H8), and perceived risk (H9), customer involvement (H10) and perceived value.
As seen in Hypothesis 3 result, the relationship between relationship quality
(mediator) and perceived value (dependent variable) was positively significant. The relationship between each antecedent and relationship quality was significant except those of customer involvement and sales service quality, as seen in Table 6.36. Product quality and brand equity were significantly and positively related to relationship quality (t= 7.633, 6.300; p<.001, respectively). Perceived risk was significantly and negatively related to relationship quality as proposed (t=--5.480; p<.001). However, customer involvement was found to be not significantly related to relationship quality (t=.449; p>.05). The mediating effect was first analyzed with regression analyses, only one full mediating effect of sales service quality was found while product quality, brand equity, and perceived risk were found to have partial mediating relationship with the perceived value. The details are shown in Table 6.40. Table 6.40: Regression Equation Tests for Mediating Effects of the Base Model for Prospective Home Buyers
Relationship Estimated Equation 1 Equation 2 Equation 3 Paths in the Model β t-value β t-value β t-value
Mediation effect
Antecedents Product Quality Value 0.323 (.353) 10.30*** 0.405 (.403) 9.87*** 0.129 (.141) 4.75*** Partial Sales Service quality Value 0.080 (.107) 3.98*** 0.126 (.152) 4.77*** 0.020 (.027) 1.21 Full Brand Equity Value 0.164 (.213) 7.29*** 0.164 (.194) 5.57*** 0.086 (.111) 4.70*** Partial Price Value -0.053 (-.066) -2.83** -0.024 (-.027) -0.98 -0.041 (-.052) -2.83** NONE Perceived Risk Value -0.235 (-.363) -11.98*** -0.189 (-.267) -7.39*** -0.144 (-.223) -8.86*** Partial Involvement Value 0.024 (.041) 1.90 0.025 (.039) 1.52 0.012 (.020) 1.21 NONE Mediator Relationship Quality Value 0.479 (.525) 16.30 - Notes: Figures shown in each cell indicate the unstandardized coefficients Figures in the brackets indicate the standardized coefficients
t-values are significant at *p<.05; ** p<.01; *** p<.001.

223
The mediating effect was then analyzed by the SEM analysis while the significance of mediation effect was tested by the Sobel test. All direct, indirect, and mediating effects are shown in Table 6.41 as follows:
Table 6.41: Total Effects on Perceived Value for Base Model of Prospective Home Buyer
Relationship Estimated Sobel Test Paths in the Model Direct Effect Indirect Effect Total Effect z-value p-value Antecedents Product Quality Value 0.162 (.193) 0.121 (.144) 0.284 (.337) 4.643 .000 Sales Service quality Value 0.065 (.078) 0.029 (.034) 0.094 (.112) 1.864 .062 Brand Equity Value 0.200 (.192) 0.128 (.122) 0.328 (.314) 4.272 .000 Price Value -0.105 (-.113) -0.105 (-.113) Perceived Risk Value -0.17 (-.272) -0.063 (-.100) -0.233 (-.371) 3.511 .000 Involvement Value 0.018 (.021) 0.006 (.008) 0.024 (.029) NS NS Mediator Relationship Quality Value 0.247 (.037) - 0.247 (.370) Notes: Figures shown in each cell indicate the unstandardized coefficients Figures in the brackets indicate the standardized coefficients Figures in the bold brackets indicate the mediating effect
Square Multiple Correlation (SMC-r2) of perceived value is .467 and relationship quality is 3.42 z-value of the difference between direct and indirect coefficients calculated by the Sobel test * p<.05 ** p<.01 ***p<.001. The significant test of the mediating effects showed that all antecedents
except sales service quality and customer involvement were significantly mediated by relationship quality with z=4.643 for product quality (H7), z=1.864; p>.05 for sales service quality (H7a), z=4.272, p<.001 for brand equity (H8), and z=3.511, p <.001 for perceived risk (H9). Therefore, Hypotheses 7, 8, and 9 were supported. Even though the regression analysis results indicated the full mediating effect of relationship quality on sales service quality and perceived value, the results from SEM was not consistent. From SEM analysis, sales service quality was found to be no indirect effect to perceived value. This indicated that although the indirect impact of sales service quality was shown, its magnitude was too small to determine perceived value. Thus, Hypothesis 7a was not supported. In addition, the mediation effect of relationship quality on customer involvement was not found. Thus, hypothesis 10 was not supported. The results of the test of Hypotheses 6 and 10 indicated that customer involvement had no effect on perceived value in both direct and indirect ways.

224
Considering the standardized coefficients of all relationships, all antecedents seemed to have the sale level of impact on perceived value except sales service quality (β=.337 for product quality, .314 for brand equity, .371 for perceived risk, and .371 for relationship quality). Sales service quality had very small impact on perceived value, direct and indirect, comparing to other antecedents. The total impact of sales service quality was almost equal to that of perceived price (β =.112 and .113).
Testing the Robustness of the Proposed Model
To examine whether the perceived value of real estate product influences a consumer’s choice selection, a subgroup analysis was performed in an attempt to test the robustness of the model. Prospective home buyers were categorized into two subgroups based on the brand of the houses they mentioned. The subgroups of premium and non-premium brands were focused and the differences of the structural models of these two subgroups were analyzed. The comparisons of sub-groups’ measurement models showed no differences. The χ2 test with 75 degrees of freedom appeared non-significant difference (χ2 =60.496, df=75, p=.888) indicating that the measurement items could measure the same thing for both subgroups. Thus, the structural parameters of two subgroups could be compared. The details of premium and non-premium brand comparisons are presented in Table 6.42.
Table 6.42 Summary of Premium and Non-Premium Analysis of Prospective Home Buyers
Brand of Real Estate Developers Parameters Premiumab Non-Premium Difference (z-value)c
Antecedents Product Quality Value .162***(.213) .211* (.288) 0.609 Sales Service Quality Value .052 (.070) .109* (.159) 0.913 Brand Equity Value .135* (.143) .084 (.090) -0.514 Perceived Price Value -.090 (-.109) -.071 (-.082) 0.24 Perceived Risk Value -.169*** (-.312) -.123* (-.226) 0.865 Involvement Value .015 (.028) .018 (.032) 0.056 Relationship Quality Value .229*** (.395) .234*** (.412) 0.073 Mediator Product Quality Relationship Quality .451*** (.345) .639*** (.497) 1.565 Sales Service Quality Relationship Quality .099 (.076) .013 (.011) -0.765 Brand Equity Relationship Quality .662*** (.407) .532*** (.323) -0.828 Perceived Risk Relationship Quality -.273*** (-.293) -.260*** (-.271) 0.149 Involvement Relationship Quality -.004 (.004) .070 (.072) 0.853 Comparison of the Models: χ2=3.343, df =12,P-value=.993 Notes: a. Figures shown in the column represent unstandardized coefficients of the structural relationships. b. The significances were analyzed based on t-test: * p<.05; ** p<.01; *** p<.001. c. Z-values of the different between parameters of two models were gathered from the pairwise parameter comparisons. All of them are not significant in this multi-group analysis.

225
As discussed previously, if the proposed model was robust, the relationships among perceived value and its antecedents should remain the same, regardless of the brand level. The support for this assertion was found. The χ2 difference test indicated that the structural paths of the two subgroups were not different (χ2= 3.343; df = 12; p= .993). These results suggested that the model is robust. Comparing each pair of coefficients between groups, no significant differences were found. The comparisons among three price-subgroups could not be performed in the pre-purchase context since the number of respondents who selected five to ten and more than ten-million baht houses were too small comparing to three to five million baht group (2.4%, 15.2%, and 82.4%, respectively). However, since the purchase intention of the prospective buyers was measured as “what is the possibility to buy the specified house?”, this data could be used to test the relationship between perceived value and purchase intention as proposed in Hypothesis 11a: “the perceived value of a house influences a consumer’s purchase intention.” The structural relationship between perceived value and purchase intention was examined. The standardized coefficient of .562 as shown in Table 6.43 indicated significant and positive relationship between perceived value and purchase intention (t=.11.655, p<.001). The similarity of the value formation process between subgroups of the prospective home buyers indicated the robustness of the model. Prospective home buyers who selected different brands engaged in the same value creation process and made their decisions based on the value of the house, not the actual characteristics of the house. This finding together with the significant structural relationship between perceived value and purchase intention indicated that there was a relationship between value and potential choice selection. Thus, Hypothesis 11 was supported, perceived value significantly related to choice selection. In contrast to the post purchase context, the moderating effect of the buyers’ home buying experience proposed in Hypothesis 12 could not be investigated in the pre-purchase context. Since the prospective home buyers have not completed their home buying decision yet, the effect of their prior home buying experience would be not clear. Therefore, Hypotheses 12 was not tested in the prospective home buyers.

226
Table 6.44 concluded the overall hypotheses testing results for the prospective home buyers as follows:
Table 6.44: The Conclusion of Hypotheses Testing Results for Prospective Home Buyers
Hypothesis Unstandardized β
Standardized β t-value p-value Hypothesis testing
H1 Product Quality Perceived Value .162 .193 3.618 .000 Supported H1a Housing Factors Perceived Value .110 .155 3.367 .000 Supported* H1b Environment Perceived Value .070 .106 2.239 .025 Supported* H1c Location Perceived Value .054 .095 2.045 .041 Supported H1d Sales Service Quality Perceived Value .065 .078 1.728 .084 Not Supported*
H2 Brand Equity Perceived Value .200 .192 3.612 .000 Supported H3 Relationship Quality Perceived Value .110 .370 5.836 .000 Supported
H3a Personal Trust Perceived Value .158 .320 8.227 .000 Supported H3b Commitment Perceived Value .000 .258 .008 .993 Not Supported* H3c Relation with Firm Perceived Value .110 .247 2.974 .003 Supported
H4 Perceived Price Perceived Value -.105 -.113 -2.448 .014 Supported H5 Perceived Risk Perceived Value -.170 -.272 -5.404 .000 Supported
H5a Internal Risk Perceived Value -.057 -.113 -2.451 .014 Supported H5b External Risk Perceived Value -.117 -.221 -4.720 .000 Supported*
H6 Involvement Perceived Value .018 .021 .482 .630 Not Supported H8a Brand Equity Personal Trust .528 .208 9.797 .000 Supported H8b Brand Equity Commitment .090 .478 1.752 .080 Not Supported* H8c Brand Equity Relation with Firm .799 .612 14.195 .000 Supported
Product Quality Relationship Quality .491 .389 7.633 .000 Significant Sales Service Quality Relationship Quality .116 .092 1.960 .050 Significant Brand Equity Relationship Quality .517 .330 6.300 .000 Significant Perceived Risk Relationship Quality -.253 -.296 -5.480 .000 Significant Involvement Relationship Quality .026 .021 .449 .653 Not Significant H7 Product Quality Relationship Quality Value .491 .389 7.633 .000 Supported
H7a Sales Service Quality Relationship Quality Value .094 .112 1.864 .062 Not Supported* H8 Brand Equity Relationship Quality Value .517 .330 6.300 .000 Supported H9 Perceived Risk Relationship Quality Value -.253 -.269 -5.480 .000 Supported H10 Involvement Relationship Quality Value .026 .021 .449 .653 Not Supported H11a Perceived value Purchase Intention 14.990 .562 11.655 .000 Supported
H12 Prior experience choice selection (Different between first time/non first time) - - - N/A Not Applicable
Note: For H7-H10: mediating effects were shown in coefficient estimates column and z-value and its significance calculated by a Sobel test were shown.
* The hypotheses testing results were different from the post-purchase dataset.
227
Consistent with the post-purchase context, the eleven hypotheses together with thirteen sub-hypotheses were tested with the pre-purchase dataset. The structural base model and two additional models were investigated. The series of regression analyses, Sobel test and multi-group comparisons were performed Most hypotheses were supported except Hypothesis 6 and 10 on the direct and indirect influence of customer involvement and Hypothesis 12 about the moderating effect of home buying experience like those of post-purchase dataset. The result of the test of sub-hypotheses 5d on the relationship between external risk and perceived value were also not supported like the post-purchase dataset. The major different findings of pre- and post-purchase context were about: 1) the effects of sales service quality on perceived value, 2) the significances of the relationship between perceived value and the two dimensions of product quality: environment and housing factors 3) the significances of the relationship between perceived value and external risk factors. The explanation of all findings from pre- and post-purchase datasets including their similarities and differences will be discussed in the next chapter.
Summary
This chapter presents the results of the survey data analyses in an attempt to explain the choice selection process which is the second stage of decision making. Two survey datasets, 420 pre-purchase and 421 post-purchase datasets were used. The pooled dataset was analyzed with item analysis, exploratory and confirmatory factor analyses to assess the reliability and validity of the data. The results showed high reliability and validity of the data. Each dataset gathered from the pre- and post-purchase buyers was separately analyzed. The structural relationships among constructs were analyzed to test all proposed hypotheses. The hypotheses could be categorized into three groups: 1) hypotheses test for the direct effects of the antecedents on perceived value; 2) hypotheses test for the indirect effects of the antecedents on perceived value via mediator; and 3) hypotheses test for the moderating effect and the robustness of the research model. All main hypotheses were supported

228
by both datasets except those of the customer involvement while some sub-hypotheses were found to be not supported. The results from the first group of hypotheses indicated that, product quality, sales service quality, and brand equity are significantly and positively related to perceived value. Perceived risk and perceived price, in the opposite direction, were found to have significantly and negatively related to perceived value. For the second group of hypothesis, relationship quality was found to play a significant mediating role between all antecedents and perceived value. Product quality, sales service quality, brand equity, and perceived risk are found to have significant indirect impact on perceived value. All results are consistent in both pre- and post-purchase context. The results of the third group of hypotheses on the robustness of the model indicated that the decision process of the recent buyers who choose different types of product were not different. Therefore, the relationship between perceived value and choice selection could be inferred. In the different context, the significant relationship between perceived value and purchase intention was found in the pre-purchase group. These results indicated that the research model is reasonably robust across contexts. Similar value formation and choice selection process among different types of products indicated that the choice was selected based on the value of the product, not the individual attributes of the product. In addition, prior home experience was found to have no moderating impact on purchase decision process of the home buyers. Even though most structural relationships of the pre- and post-purchase models were found to be similar, some differences between the relationships between some dimensions of the predictors and perceived value were shown. The details are discussed in the next chapter.
229
CHAPTER 7
RESEARCH FINDINGS AND DISCUSSION
This research aimed to enhance the understanding of consumers’ purchase decisions by investigating the entire process of decision making. The conceptualization of this research provided a simple but a more complete view of the purchase decision process. The proposed purchase decision model emphasized two major stages of the purchase decision process: consideration set formation and final choice selection. This research provided the empirical evidence of these two stages. For the first stage, qualitative data was used to analyze the consideration set formation while quantitative data gathered from both recent and prospective buyers were used to investigate the value formation and choice selection process in the pre- and post-purchase contexts. Even though the findings from the pre- and post-purchase buyers were similar in most aspects, there were some different points between these two groups that provide more advanced understanding of the purchase decision. As such, the findings from each group will be discussed first and then the comparisons of the two groups will be presented. The following findings of this research are noteworthy.
Discussions of the Findings from Post-Purchase Buyers The findings from post-purchase buyers can be categorized into eight points: 1) the entire process of decision making; 2) the direct and indirect roles of product quality, perceived risk, and brand equity; 3) the strong indirect role of sales service quality; 4) the direct role of perceived price; 5) the distinctive and important mediating role of relationship quality; 6) the non-statistically significant role of consumer involvement; 7) the non-statistically significant moderating effect of prior home buying experience; 8) the significant prediction power of perceived value on choice selection. In addition, the alternative structural model explaining the decision process of the recent buyers modified from the proposed research model will be proposed. The details can be discussed as follows:
230
The Entire Process of Decision Making
According to Narayana and Markin (1975), a consumer would go through a two - stage purchase decision process: consideration set formation and final choice selection. The findings of this research confirmed this concept in that all home buyers were engaged in both stages of the purchase decision process. In fact, not all purchase situations involve both stages of decision making. These two decision stages are accomplished only when the situation is perceived as a complex purchase decision in which consumers are highly involved (Kotler, 2000). The degree of involvement is related to the level of importance that the consumer places on the acquisition of the product (Hawkins et al., 2001; Laurent and Kapferer, 1985). A durable product which is expensive, bought infrequently, risky, and highly self-expressive usually leads to high involvement and a complex purchase decision. As buying a house is commonly considered a high involvement purchase, it is not surprising that the respondents reported that the two decision stages were included in their home buying processes. The details of each of decision stage are discussed in the following paragraphs.
The First Stage of a Purchase Decision: Consideration Set Formation In the first decision stage, home buyers appeared to use four criteria to form
their consideration sets which were location, price level, size and style of the houses, and the brand of real estate developer. The core characteristics of these criteria were similar across buyers. Most home buyers wanted a house that is near the main road, shortcut roads, and express way. Price must be in the affordable level and should match the quality of the product. The size and style of the houses varied across customers.
Although most home buyers mentioned “location” as the first and most important criterion, they considered location, price level, and size and style of the house simultaneously. It is interesting that each of these three criteria is the characteristic of the product. However, this is not surprising, since prior literature indicates that the most common criteria for consideration set formation are the important or prominent attributes of the product (Schiffman and Kanuk, 2004). Hawkins et al. (2001) found that the “list of

231
brands” and “important product attributes” are usually considered as the preliminary criteria to produce a consideration set. Additionally, the findings of consideration set formation criteria in this research study are not different from that of previous research on real estate. Bender (2000) found that one of the most important criteria for home buying is the location of the house, especially the accessibility to the city center. The style and size of the house were also widely mentioned in past real estate research (e.g., Healey and Baker, 1987; Baum, 1994; Bender, 2000; Hunt, 1991; Ho et al., 2005).
Another consideration set formation criterion mentioned by home buyers was the brand of the real estate developers or the housing project. Most home buyers mentioned one brand –Lands and Houses- as the first recalled one though they did not perceive that brand as much better than others. It seemed that most people had only high awareness of that brand but did not have the loyalty to the brand and also did not perceive the brand as distinctive high quality or illustrate the positive brand association. In fact, home buyers categorized the brands into two major groups: premium and non-premium brands. Premium brands referred to those that were well-known by home buyers and also other people. Mostly, those real estate developers with premium brands offered many housing projects in various locations in Bangkok, its vicinity, and other provinces. On the other hand, there were some premium real estate firms that might offer only one or a few housing projects, with the difference being that their products were luxury and expensive. The non-premium brands in the real estate context referred to real estate developers that offered only one or small numbers of housing projects in one area of Bangkok or its vicinity.
Even though the premium brand did not guarantee for the quality of the real estate product, it could provide more social value and lead to less perceived risk. Some home buyers considered the products of premium brands before those of non-premium brands while some buyers considered only the premium-brand products when they found that the products offered by the two types of brands-premium and non-premium- were not much different in term of the quality, environment, and especially price level. Consistent with the brand literature which indicated that the brand usually leads the
232
buyers to show their preference for one product (with a premium brand) over another when they are basically identical (Aaker, 1991). Thus, a real estate brand is important in making points of differentiation that lead to competitive advantages. The positive differential effect that knowing the brand name had on customer response to the product was illustrated. This effect of the brand of the real estate product seemed to be similar to other products (Kotler, 2003). Hence, the brand of the real estate developer is one other important factor that home buyers consider when they form their consideration set.
The home buyers reported that the consideration criteria were first set up based on their internal information. Checking for information readily available from memory was a common part of the initial stage of information search (Bettman, 1979; Punj, 1987; Engel et al., 1995). The home buyers in this particular study explored their needs and wants and thought of the size, style, location and price of the house they wanted. These thoughts provided them blurred pictures of the products.
In order to get clearer criteria, the buyers searched for more information using external sources especially newspapers and roadside billboards. The external information search from sources such as public ones, media, comparison shopping, or friends and co-workers in the next stage was normal practice for any information search (Gibler and Nelson, 2003). Moreover, most of the home buyers visited the housing projects they were interested in to acquire sufficient and accurate information about the product. The fact that visiting housing projects was common in the buying process is consistent with the findings of Harris (2001). The relevant and sufficient information should help the buyers to screen out some alternatives that are less than their minimum requirements. Thus, sufficient and accurate information from various sources would be necessary for the home buyers to form their consideration set.
The research findings indicated that most home buyers were fixed with these four criteria. They set up the cutoff point or minimum requirement for each criterion and the choices that could not meet those cutoff points were not included in their consideration set. The less-than-requirement criterion could not be compensated or substituted by other product attributes although those attributes were good or high quality. Thus, the non-compensatory decision rule was usually applied in this stage.

233
However, the rules of consideration did not seem to be so strict. Their flexibility was mostly related to the actual buying situation. If the minimum requirements of each criterion were hardly attained, the home buyers were likely to decrease their minimum requirements and keep on those four consideration criteria. One consideration criterion that did not meet the minimum requirement could not be compensated with another criterion that was perceived as one of high quality. For example, the buyers might reduce the expected size of the house if they found that their first requirement was not practical to the actual market situation. Even though the minimum requirement was changed, the buyers still considered the size of the house as their consideration criterion. This is because the buyers commonly screened the alternatives with critically important attributes (Gilbride and Allenby, 2004). However, the use of this decision rule was not different from the formation of the consideration sets for other product categories (Capon and Kuhn, 1982). In contrast, home buyers appeared to use more complex decision strategies and consider different and more complicated factors (Alden et al., 1994) in the next stage- choice selection.
As an initial part of the decision process, the formation of a consideration set was a general process which all home buyers had to perform before getting into the choice selection. Consideration set formation made by either recent or prospective home buyers seemed to be similar since it was the first stage where all buyers screened their possible choices. After forming a consideration set, a home buyer would get into his choice selection process which is the second stage of their decision. Even though there were some differences in choice selection processes between recent and prospective home buyers as they performed different stages of decision process, their consideration set formations did not seem to be different.
The Second Stage of a Purchase Decision: Final Choice Selection For the second stage of decision making, choice selection, home buyers
considered the choices that were available in their consideration sets. All choices were compared and only one choice was chosen in the final stage. It was proven that the home buyers chose their choices based on their values, not on the product attributes or

234
the individual benefits or sacrifices gained from that purchase. The choice with the highest value in the buyer’s point of view was selected. Although different buyers may value the same choice differently depending on home buyers’ knowledge and psychographic characteristics, they tended to have the same value formation process and consider similar factors such as product quality, brand, sales service, price, risk, and so on as proposed in the research framework.
Overall, the results supported the conceptual model. Most proposed relationships in the base model were confirmed by the data. The fit of the model was in the acceptable level (χ2/df = 1.800; IFI=.910; NNFI=.907; CFI=.910; RMSEA=.044). the perceived value was predominantly defined by three benefits and two sacrifice factors. The three benefits of product quality, sales service quality, and brand equity were found to have positive relationships with perceived value. Consistently, the perceived value could be explained by two sacrifices; perceived risk and perceived price. Both of them provided negative influence on the perceived value of the product. Only one proposed predictor, customer involvement, had no significant relationship with the perceived value in both direct and indirect paths.
The impact of the related factors on value could be categorized into four groups: the factors that provided both direct and indirect impacts, those that yielded only a dominant direct or indirect impact, and the ones that provided a mediating influence. These details together with the impact of value on choice selection can be discussed in the following part. The Direct and Indirect Roles of Product Quality, Brand Equity, and Perceived Risk
Even though all predictors except customer involvement significantly impacted perceived value, the magnitudes of the impacts were different. Product quality and perceived risk were highly related to perceived value (t= 4.282 and -4.128; p<.001) while sales service quality, brand equity, and perceived price were marginally related to perceived value (t= 2.190, 2.585, and -2.669; p<.05). All directions of the structural relations were as proposed, i.e. all benefits which include product quality, sales service

235
quality, and brand equity, were positively related to perceived value and all the sacrifices including perceived risk and price were negatively related (See Hypotheses 1 to 6). The comparison of the standardized coefficients of the structural relations indicated that product quality and perceived risk highly influenced perceived value (β=.180 and .174) while the impact of sales service quality, brand equity, and perceived price were only about a half of the first two factors (β=.105, .109, and .108).
Besides this, product quality, sales service quality, brand equity, and perceived risk also provided a significant indirect impact on perceived value through the relationship quality (β=.102, .253, .090, and .106; p<.001) as seen in Hypotheses 7, 7a, 8, and 9. It could be concluded that all four factors provided both direct and indirect effects on perceived value. In contrast to other factors, sales service quality appeared to have stronger indirect effect than its direct effect on perceived value. Because of its different characteristics, sales service quality and its influence on perceived value will be discussed in the next part while the impacts of product quality, perceived risk, and brand equity on perceived value are discussed below:
The Effects of Product Quality on Perceived Value The significant impact of product quality on perceived value was consistent
with many previous research findings such as those of Tse (2002) and Filion et al. (1999). To understand how product quality affected perceived value, three sub-hypotheses (H1a, 1b, and 1c) were also tested to examine the relationship between perceived value and the three dimensions of product quality. The results indicated that not all three dimensions of product quality were significantly related to perceived value, only location had a significant impact (t=3.157; p<.001) while environment and housing factors were not significantly related (t= 1.567 and 559; p>.05). Filion et al. (1999) found the positive relationship between values of the house and its location especially in terms of potential accessibility to life activities such as shopping, sports, work, school, and so forth that take place in the activity catchment’s area. The location that allowed home buyers access to the activity places while reducing travel-times and costs would gain high value (Duncan and Ley, 1993).

236
In contrast to the prior research findings (e.g. Bender et al., 2000), the environmental surroundings and housing factors did not show any statistical significant relationships with the perceived value of the house in this research. Two possible reasons could be used to explain these findings. First, the environment and housing factors could not impact the perceived value might have been because the Thai real estate context where the designs and quality of housing products in terms of both the houses themselves and their environments and landscape designs were not different from each other. This explanation could be confirmed with the focus group results which showed most participants perceived all housing projects to be quite similar in the design of the house, major architectural design, construction materials, technology, and quality. All discrepancies were only due to interior or exterior decoration that was too minor to consider.
A second explanation of the non-statistical significant influence of environment and housing factors might come from the nature of home buying which entails a long period of time and a long process of buying. It was likely that the buyers might experience some negative feelings or receive some incorrect information on their houses and/or the environments. From the focus group results, most home buyers reported that based on irrelevant and insufficient information from real estate salespersons they set expectations of the houses that were too high. Without studying or searching for other important details, home buyers commonly developed their expectation based on the mock-up houses that the real estate developers had furbished with attractive interiors and landscape designs. As a result, some home buyers felt disappointed when they saw the actual construction quality and materials. Moreover, most home buyers could not imagine the finished housing products and environment since they bought semi-constructed houses.
Even though the unattained expectations of the recent home buyers affected the values they placed on the houses, they might not always play a negative role in value formation because most home buyers could not decide whether the cause of their unattained expectations was the low quality of the product or the high

237
expectations they had set. In addition, an unattained expectation could be compensated by other benefits of the house especially a competitive location. Therefore, it is not likely that the environment and housing factors would play a significant role on the perceived value, only location was found to be significantly impact the perceived value of the house for the recent home buyers.
The indirect effect of product quality on perceived value through relationship quality was also consistent with the findings of previous studies as there was a general agreement that consumer satisfaction with the performance of the product would lead to customer trust in not only that product but also the product/service provider (Hennig-Thurau et al., 2002). Moorman et al., (1992) found that trust exists if a customer believes a product is reliable and has a high degree of integrity. The relationship between a consumer and product, firm, or salesperson would cause consumer to develop a positive attitude towards a product and enhance consumer’s perceived value of the product (Bendapudi and Berry, 1997). Thus, the product quality led home buyers to develop trust in real estate representatives which, in turn, influenced the perceived value of the house. Since personal trust is one core dimension of relationship quality, it could be concluded that the relationship quality mediated the relationship between product quality and perceived value.
The Effects of Perceived Risk on Perceived Value Next to product quality, another predictor that had both direct and indirect
negative relationships with perceived value was perceived risk. Risk is an individual’s subjective feeling of uncertainty of the consequences of the purchase decision (Bettman, 1973) when the situation is ambiguous (Sjoberg, 1980). The data analyses indicated that risk in the home buying context could be categorized into two dimensions; internal and external risk. Internal risk included concerns of psychological and functional factors i.e. whether the consequences were less than the expectations while external risk included social and functional concerns regarding the possible loss of money and social acceptance if the outcomes were not as expected (Stone and Winter, 1987).

238
To understand how perceived risk affected perceived value, two additional Sub-hypotheses, H5a, and 5b were examined. Only internal risk was found to have significantly negative impact on perceived value (t=-5.947, p<.001) while the relationship between external risk and perceived value was not statistically significant (t=-.021, p>.05). Since internal risk included psychological and functional factors, it could be said that home buyers appeared to feel uncertain of the quality and functions of the house. This might be because the specific characteristics of the housing product which could not be verified before the actual purchase and also the systematic quality assurance on housing product that had not been available. Home buyers could see only the general appearance and list of construction materials while the durability, utilization, function, repair services, and other details from the real estate firm could not be evaluated at the point of sale. Therefore, if there was a higher possibility that the house may have low quality and serviceability, it would be reasonable for the home buyer to determine a lower value for that particular product. Thus, a negative relationship between the perceived risk and perceived value was indicated.
In contrast, external risk which included financial concerns and social approval was not found to be significantly related to perceived value. The too small impact of external risk may be related to the sales promotions offered by both real estate developers and financial institution that only small amount of cash, i.e. around 50,000 baht, from home buyers to make a deposit on a house. Moreover, home buyers could request a 100-percent loan from financial institutes. This offer would ensure all home buyers had financial backing when buying a house whether they were in need of the monetary loan or not.
The non-statistically significant influence of external risk on the perceived value of the house might also be based on the current marketing strategy employed by real estate developers which involved offering products most of which were ready-to-live-in houses. This means to say that about 80 to 90% of each house’s construction was complete and the central facilities and environmental surroundings of the housing project were mostly 100% finished. Thus, home buyers could ask for comments from

239
their relatives and friends and also check for their social acceptance before making any purchase decision since most housing attributes, environment, and location together with the reputation of the real estate developer were illustrated. Hence, external risk did not appear to be a major factor influencing the value they placed on the house.
Perceived risk also had an indirect impact on perceived value since it significantly and negatively influenced relationship quality at the firm level. This indirect relationship was supported by Mayer et al. (1995) who stated that trust and risk are closely interrelated. Since trust is the core dimension of relationship quality, trust in a firm would reduce the buyer’s perception of risk of that purchase situation (Jarvenpaa et al., 1999; Doney and Cannon, 1997). Perceived risk was considered as an antecedent for trust and an outcome of trust building is a reduction in the perceived risk of the transaction or relationship. Thus if relationships developed and trust was built, risk would decrease (Mitchell, 1999). As both perceived risk and relationship quality directly influenced the perceived value of the product, the interactive relationship between these two constructs would enhance their impact on value. Therefore, it was unquestionable that perceived risk had both direct and indirect negative relationships with value and the relationship between perceived risk and perceived value was mediated by relationship quality.
The Effects of Brand Equity on Perceived Value For brand equity, prior literatures suggested that brand equity could
increase the probability of brand choice, willingness to pay premium prices, and elastic responses to price increases (Aaker, 1991; Simon and Sullivan 1993). Another benefit consumers gain from buying a house is the social recognition associated with the brand of the real estate firm (Keller, 2001; Aaker, 1991). Since brand had an integrated meaning, buyers could get a lot of benefit from brand such as functional benefits pertaining to the intrinsic features of the product, experiential benefits which linked to the psychological feeling on the product and the last type, symbolic benefits, which was related to consumers’ self-concept and social desire, the benefit of brand would satisfy home buyers in several ways.
240
For the post-purchase buyers, brand equity was found to have a small direct effect on perceived value but a stronger indirect effect through the relationship quality. This can be true for this industry since there were a large number of real estate brands available in the market i.e. more than 400 non-premium brand housing projects (See the details in Chapter 2). On the other hand, home buyers appeared to place more value on the location of the house (as shown in Hypothesis 1). As such, home buyers tended to determine the value of a house based on its location rather than its brand. Therefore, the direct relationship of brand equity on perceived value was only in the marginal level.
The positive relationship between brand equity and relationship quality would indicate another role of the brand in that it enhanced home buyers’ trust in and satisfaction with real estate firms. The brand image and brand association could play this role since they provided more positive information about the product (Pitta and Katsanis, 1995). The positive brand image would lead the product to receive higher social acceptance. The social benefits gained from brand equity would indirectly influence home buyers to place more value on the product. The higher the brand equity, the more trust and satisfaction on the real estate firm would be seen. Thus, it could be concluded that brand equity indirectly influenced perceived value via the quality of relationship with a firm. This relationship illustrated another benefit of the brand in that it could enhance the quality of relationship between consumers and the firm. As such, the influence of brand equity on perceived value was both direct and indirect.
In conclusion, the important findings about these three constructs were that all of them had both direct and indirect impacts on perceived value. The direct impacts of product quality and perceived risk on perceived value were stronger than their indirect impact. The impacts of brand equity on perceived value were almost the equal in the direct and indirect paths. The total impacts of product quality and perceived risk were stronger than that of sales service quality, brand equity, and perceived price. Moreover, only location and internal risk significantly influenced perceived value while environment, housing factor and external risk had no impact on the perceived value of the house.

241
The Strong Indirect Role of Sales Service Quality
Sales service quality and brand equity were found to be similar to product quality and perceived risk in that they provided both direct and indirect impacts on perceived value. However, the magnitudes of their impacts were contradictory. As discussed in the previous part, the magnitude of the direct impact of these two constructs were only about half of that of product quality and perceived risk. In contrast, the indirect impact of sales service quality on perceived value (β=.253) was about double of that of product quality and perceived risk (β=.102 and .106) while the indirect impact of brand equity was in the same level as product quality and perceived risk (β=090). The finding that sales service quality had strong indirect effects on perceived value is important since it is new to marketing literature.
The prior research studies (Baker 1987; Sweeney et al. 1999) found that sales service quality persistently and strongly made buyers seek more advice from salespersons (Sirdeshmukh et al., 2002; Sweeney et al. 1999). Also, sales service quality was found to enhance favorable perceptions towards a seller’s reliability and problem solving (Wolfinbarger and Gilly, 2003). It was likely that buyers feel secure with the purchase situation when a seller showed sincere interest in fulfilling their individual needs, keeping its promises, having professional knowledge, responding quickly at an appropriate time, and treating them courteously (Parasuraman et al. 1985; Wolfinbarger and Gilly 2003). Besides this, the findings of this study offered new insights of sales service quality in that it created personal trust in the salesperson which in turn influenced the value of the product without sales service quality itself influencing the value.
Home buyers did not expect only tangibility, reliability, responsiveness, assurance, and empathy (Zeithamal et al., 1990) from the salespersons’ service but also relevant information about the house and other related factors in order to make a more accurate decision. Therefore, the interaction between home buyers and salespersons constituted a unique and important influence on decision (Weitz, 1978). Based on this

242
premise, it is undoubted that high quality sales service would enhance the perceived value of the house.
Since sales service quality provided a strong impact on value when it was mediated by relationship quality, the cognitive and affective evaluation of the quality of the relationship between buyers and the salesperson would be concerned (Crosby, 1990). Satisfaction, emotional content, and closeness between salespersons and home buyers would determine the evaluation of sales service quality. The reliability of salespersons together with the high service assurance would create trust in salespersons while responsiveness of the service and empathy, i.e. respecting the home buyer as an important person, would enhance with the commitment to both the real estate firm and salespersons and, in turn, affect the perceived value. As the value customers place on relationships would directly impact the perceived value of the product, (Macintosh and Lawrence, 1997) it was clear that salesperson performance or sales service quality was crucial to consumers’ perceived value indirectly through the relationship quality.
The Direct Impact of Perceived Price on Perceived Value
The results also demonstrated the direct negative impact of perceived price
on perceived value (t=-2.669; p<.01). Even though price was shown to influence perceived value, its impact was only in the marginal level of significancey. This may be because home buyers considered only the houses that were affordable for them (Stone, 1993) and the price was usually considered with the quality of the product i.e., product, brand, sales service quality and so on (Glaeser et al., 2001). According to Dodds et al. (1991) product quality usually played a moderating role between price and perceived value and also willingness to buy. Moreover, the brand name was found to influence consumer perceptions of price and opinions of quality. Price could be perceived differently across buyers based on their individual differences in preferences, knowledge, and socio-economic status. As price played a major monetary sacrifice role in value formation, its reasonability and affordability was considered by the buyer

243
(Dodds et al. 1985; 1991). Home buyers’ perception on the reasonability of prices and their ability to buy influenced their “perceived price”. If the price of a house was perceived as unreasonable, not affordable, or too high, home buyers mostly deleted this choice out of their consideration set. In contrast, if the price was perceived as reasonable and affordable, regardless of whether it was high or low, home buyers would consider whether to select that house based on factors other than its price. Therefore, perceived price was at a minimum level in influencing the perceived value of the product.
The Distinctive and Important Mediating Role of Relationship Quality
Relationship quality, defined as the appropriateness of a relationship in
fulfilling the needs of the customer (Henning-Thurau et al 1997), was found to have significant positive relationship with perceived value (t=11.035; p<.001). Compared to other value predictors, relationship quality played the strongest role in determining perceived value (β= .596 for relationship quality and .282, .358, .200, .280. .108 for the total effects of product quality, sales service quality, brand equity, perceived risk and perceived price, respectively). Relationship quality did not only play a role as an antecedent of value but also played a mediating role as an intervening factor that received the impacts from other antecedent especially sales service quality, brand equity, product quality, and perceived risk and then transferred these impacts to the perceived value of the product. Therefore, it was reasonable that relationship quality had the highest impact among all antecedents on perceived value where sales service quality was the second highest and product quality and perceived risk were the third.
The strong impact of relationship quality was related to its important function of not only reducing uncertainty of the product and purchase situation but also enhancing interaction efficiency between the customer and firm and fulfilling the social needs of the customer which led to commitment to the salesperson and firm (Crosby et al., 1991). The three components of relationship quality including trust, commitment, and satisfaction would benefit home buyers in trusting and exchanging their

244
partnership/friendship with the real estate firm and its representative with confidence and also making a long-term emotional bond (Young & Denize, 1995). This relationship would satisfy both home buyers and the real estate firms and their representatives. Trust and commitment led directly to the cooperative behavior of home buyers and made home buyers perceive the products and service to be more satisfactory (Morgan & Hunt, 1994). The long term relationships with the firms could provide some psychological benefits to home buyers such as, at the very least, a feeling of comfort and security as well as reduced anxiety and uncertainty concerning the firms and their products. Based on this premise, the relationship quality would strongly influence the level of the perceived value of the product.
Relationship quality can be divided into two levels, personal and firm. Trust in real estate representatives was only one dimension of relationship quality in the personal level that was significant while trust in, commitment to, and satisfaction with the real estate firm were the three important dimensions of relationship quality in the firm level. Personal trust and relations with the firm were found to have stronger power in explaining perceived values and purchase decisions than product quality and perceived risk. The uncovering of the genuine effect of relationship quality was one major contribution of this research since most value literature focused on only either the positive or negative direct effect of the benefits or sacrifices on value. Relationship quality was distinct from other benefit or sacrifice constructs in that it was the consequence of other benefits and sacrifices and was established spontaneously in consumers’ minds from the quality of other constructs.
The prominent role of relationship quality suggested that the relationship quality should be included as an intervening construct in the purchase decision and value formation models. The mediating effects of relationship quality between perceived value and its antecedent especially sales service quality, brand equity, product quality, perceived risk, and perceived price were important. Even though some antecedents could influence perceived value directly, most of them also showed significant indirect effects on value via relationship quality. This finding was consistent with a recent research finding on the important role of emotional aspects of the consumption in

245
defining value perceptions (Sweeney and Soutar, 2001). Thus, to better understand the total or actual effects of all antecedents on value, the relationship quality could not be disregarded. The Non-Statistically Significant Role of Customer Involvement
Customer involvement was only one factor in the model that had no significant relationship with perceived value in both direct (t=1.510; p>.05) and indirect paths (t=1.242; p>.05). Prior literature mentions the importance of customer involvement or effort on value formation (e.g. Dholakia, 2001; Laurent and Kapferer, 1985; Stone, 1984). Consumer involvement was closely related to the efforts they put in searching, questioning, and arguing about the product and purchasing that product (Stone, 1984; Dholakia, 2001).
Even though the effort, time and expense the buyers spent during their beginning process could be considered as sacrifices, some home buyers may be satisfied with the knowledge gained from their effort. Buyers might also enjoy information search when the put their effort to shopping around. Based on this positive feeling, the buyers might add more value to the product. In contrast, some buyers perceived their effort as an investment and treated it as a sacrifice of the value. Buyers’ involvement which was perceived as loss would reduce the perceived value of the product. Customer involvement seemed to provide two contrast effects to the buyers in that it could make buyers enjoy or suffer with their buying simultaneously. Thus, it might be difficult for the buyers to judge whether the consequences of their involvement and effort were benefits or sacrifices.
On the other point of view, it is possible that the buyers had not concerned with their involvement when they valued their choice. Moreover, with the long time period required for home buying, the buyers may feel less negative about their involvement and effort since these were invested at the beginning of the process a long time ago. Bloch and Richins (1983) suggested that customer involvement is only a

246
temporary perception of product importance based on the customer’s desire to obtain particular extrinsic goals that may derive from the purchase. Baker et al. (2002) perceived customer involvement as the unavoidble investments of time, effort, and the related expense to obtain the product. Therefore, the buyers might disregard the sacrifice of their effort and involvement. Based on these reasons, it is possible for the customer involvement to have no effect on perceived value as found in this research. The Non-Statistically Significant Moderating Effect of Prior Home Buying Experience
This study extended the understanding of the purchase decision process by investigating the moderating influence of prior home buying experience. This moderating effect was investigated by examining the differences of the entire process of value formation and choice selection between experienced and less experienced buyers, i.e. first-time and non-first-time home buyers. The results indicated that the prior experience of home buyers could not moderate the model or its structural paths (χ2 difference = 2.223; df=12; p>.05). The not statistically significant moderating effect of buyer experience was not consistent with prior research findings. Many researchers, such as Baron and Kenny (1986), Mittal and Kamakura (2001), Karahanna et al (1999) and also Dabholkar and Bagozzi, suggested meaningful moderating effects of the prior experience of the buyers. Prior research suggested that the nature and strength of relationships between value-influencing constructs may change during the various stages of a customer’s familiarity or experience with a company (Parasuraman 1997; Parasuraman and Grewal 2000; Woodruff 1997). The different findings of this research might be related to the different context of the product. Since most prior research studies were done on the service industry or non-durable and low involvement products, consumers’ decisions could be based largely on their prior experience. In contrast, the home buying characteristics focused on this research were different since a house is a durable and high involvement product. For the non-first time buyers, they may have had their home buying experience

247
several years ago. Based on technological and marketing changes, their experiences were mostly outdated and less applicable to the current home buying situation. Therefore, a moderating effect of buyers’ experience was not found in the home buying context. However, this investigation was only an exploratory study since there were no theoretical reasons to predict the parameters would be different between first time and non-first-time or repeat home buyers in the real estate context. Even though Harris (2001) suggested the these two subgroups seemed to have different reasons for buying a house and required different services from real estate salespersons, these factors could not influence buyers to develop different purchase decision processes. Thus, it could be concluded that prior home buying experience could not moderate the influences of the proposed antecedents and perceived value. First time and non-first time home buyers tended to consider all influencing factors, place values on housing products, and choose their final choices in the same way. The Significant Prediction Power of Perceived Value on Choice Selection This study also demonstrated that the concept of perceived value (i.e. the tradeoff between all important purchase-related sacrifices and benefits) could be used to explain final choice selection. To link the proposed structural model and final choice selection, the robustness of the model was tested. The results demonstrated that the model could fit well across contexts. Home buyers were categorized by brand and price level, and then subgroup comparisons were performed. The subgroups’ structural model and each pair of structural relationship coefficients in the models that were not different indicated that all home buyers, whether they bought premium or non-premium brands or at high or low prices, valued the products similarly and made decisions to buy their houses based on the same model. These results were consistent with the findings of Sweeney et al. (1997) which indicated how value influences decision making by focusing on consumer willingness to purchase by incorporating key variables such as perceived product

248
quality, sales service quality, and price as antecedents of value. Also, the robustness of the proposed model confirmed the prospective theory in which Tversky and Sattath (1979) suggested that decision makers would evaluate only the value of each alternative they have in their consideration sets, not individual attributes of the products, and then choose the choice with the highest value. Thus, home buyers were shown to engage in the same process when they placed value on the products and finally, they selected their final choices based on their perceived value of those particular products (Dodds et al., 1991; Parasuraman and Grewal 2000; Petrick 2001). The multi-group analyses results showing that there was no difference between each group of customers in each context suggested that consumers selected their choices based on the value of the product, not on the characteristics or types of the products. This proved that perceived value could be successfully used to explain choice decision and purchase intention.
Alternative model for the Post-Purchase Buyers Since the research results indicated some marginal and not statistically significant structural relations in the proposed model, the model modifications were considered to improve the fit of the model (Hair et al. 1998). The purpose of these modifications was to achieve the most parsimonious model that provided the best fit among the alternatives based on the examination of the normalized residuals and the modification indices (Byrne, 2001). As such, relationships in the models were modified either by removing the existing non-statistically significant relationships or by adding some new relationships to the model that were suggested by modification indices. The details of modifications were as follows: First, based on the analyses of structural relations, the three dimensions of the mediating variable—relationship quality –showed their unequal roles in determining perceived value. Relationship quality was considered to be separated into three individual intervening variables i.e. personal trust, personal commitment and relation with the firm. Personal commitment, which was defined as the home buyer’s
249
commitment to salespersons, was found to have the lowest effect on perceived value and, moreover, a weak relationship with other predictors. Since relationship quality played the roles of both predictor and mediator, when this dimension could not perform well as a moderator, i.e. its weak relationship with other predictors, it was deleted from the model. Thus only two moderators, personal trust and the relation with the firm were included in the model. Second, because of the non-statistically significant relationship between customer involvement and perceived value in terms of both direct and indirect effects, this construct was also removed from the model. The next consideration was on perceived price. When the total effect of the perceived price was compared with those of other predictors, its coefficient was smallest among the group, which is only half of the higher consecutive coefficient, i.e. brand equity with standardized β of .200 and a perceived price with β of .108. Considering the structural relationship between perceived price and perceived value, even though its coefficient was significant (p<.01), it was in only the marginal level. Hence, the total fit of the model was found to be improved if perceived price was removed. Therefore, this predictor was considered not for inclusion in the modified model. Similar to perceived price, the direct effects of sales service quality and brand equity on perceived value were found to have only marginal significant effects (β of sales service quality = .105, p=.035; β of brand equity = .109, p=.010). Thus, for the same reason, the direct relationship between perceived value & sales service quality and perceived value & brand equity were removed from the modified model. Moreover, the modification indices suggested that three additional relationships between sales service quality & brand equity, brand equity & product quality, and brand equity & perceived risk would improve the fit of the model. Thus, these three relationships between predictors were added into the modified model based on statistical and theoretical arguments (Byrne 2001) However, there were no deletions of other dimensions of predictors such as financial risk, environment and housing factors even though they appeared to have no statistical impact on the endogenous variable.

250
The number of model modifications to be low while the maintaining of these factors showed no virtual differences in the strength of the other significant (MacCullum et al. 1992; Steenkamp and Baumgartner 1998). Table 7.1 presents the results of the model fitting procedure for the recent home buyer dataset.
Table 7.1: Results of Model Fitting Procedure for Recent Home Buyers Models Initial Relationships Modification Reason for Modification
Relationship Quality Second order factor (with 3-first order facets)
Two first-order factors: Personal commitment was removed (No second order construct)
Model Parsimony
Personal Commitment Yes Removed Model Parsimony Customer Involvement Yes Removed Not Significant Coefficient Perceived Price Yes Removed Model Parsimony Sales Service Quality Perceived Value Yes Removed Model Parsimony Brand Equity Perceived Value Yes Removed Model Parsimony Sales Service Quality Brand Equity No Added Model Fit Brand Equity Product Quality No Added Model Fit Perceived Risk Brand Equity No Added Model Fit After the modifications, the models showed good fit indices for the recent home buyers as seen in the following table. The modified model and its fit indices are shown graphically in Figure 7.1 and Table 7.2:
Figure 7.1: The Alternative Structural Model for Recent Home Buyers
Notes: χ2/df = 1.426; RMSEA=.032; IFI=.961; NNFI=.959; CFI=.961
The standardized structural coefficients were displayed. * p < .05; ** p < .01; *** p < .001
Product Quality
Location
Environment
Housing Factors
Brand Association
Perceived QualityBrand Loyalty
Brand Equity
Service Quality
Perceived Value
Personal Value
Social Value
.892***
.886***
.891***
.866***
.819***
.914***
.983***
.964***
.840***
.212***.209***
-.126***
Relation with Firm
Personal Trust
Internal Risk
External Risk
Perceived Risk
..849***
.929***.946***
-.638***
. 476***
. 291***.876***
.541***
-.293***

251
Table 7.2: Fit Indices for the Proposed and Alternative Model of Recent Home Buyers Fit index Recommended level Proposed model Alternative model χ2/ df <3.00 1.800 1.426 IFI >.90 .910 .961 NNFI >.90 .907 .959 CFI >.90 .910 .961 RMSEA <.08 (<.05) .044 .032 Note: IFI=Incremental Fit Index; NNFI=Non-Normed Fit Index; CFI=Comparative Fit Index; RMSEA=Root Mean Square Error of
Approximation. The improved fit indices improved from .907-.910 to .959-.960 with lower χ2/df and RMSEA indicated that the modified model provides a more powerful explanation of the purchase decision of post-purchase buyers than the proposed model. Moreover, the results generally support the higher prediction power of the modified model since the greater variance of the endogenous factors was explained by their predictors –based on the squared multiple correlations (SMCs-r2) (Byrne 2001; Hair et al 1998). As seen in Table 7.3, the square multiple correlation of perceived value was increased from .633 in the proposed model to .878 in the modified model. Consistently, the square multiple correlation of relationship quality was increased from .293 in the proposed model to .917 for personal trust and .732 for relations with firm in the modified model. The details of the coefficients of the structural relations are also presented in Table 7.3.
Table 7.3: Total Effects on Perceived Value for Alternative Model Relationship Estimated a
Paths in the Model Direct Effect
Indirect Effect
Total Effect
t-valueb (Direct effect)
z-value c (Moderating
effect) SMC d
(r2)
Antecedents Product Quality Value .150 (.209) .044 (.061) .193(.270) 6.621*** 6.253*** .878 Sales Service Quality Value .477 (.629) .477 (.629) Brand Equity Value .452 (.710) .452 (.710) Perceived Risk Value -.074 (-.126) -.081(-.140) -.155 (-.266) -4.698*** 5.614*** Mediator Personal Trust Value .221 (.291) - .221 (.291) 11.078*** Relation with firm Value .410 (.476) - .410 (.476) 11.677*** Sales Service Quality Brand Equity .644 (.541) - 11.016*** .293 Sales Service Quality Personal Trust .839 (.840) - 21.068*** .917 Brand Equity Relation with firm .472 (.638) - 12.627*** .732 Brand Equity Product Quality .780 (.876) - 19.533*** .768 Brand Equity Perceived Risk -.697 (-.638) - -13.108*** .407 Note: a Figures shown in each cell indicate the unstandardized coefficients Figures in the brackets indicate the standardized coefficients Figures in the bold brackets indicate the moderating effect b t-value of the direct effect of each predictor on endogenous variable: * p<.05; ** p<.01; *** p<.001. c Figures in the brackets indicate the z-value and its significance calculated by the Sobel Test d Shows a Square Multiple Correlation for the Dependent ( Endogenous) variable of the structural relation

252
There were only four predictors left in the model since perceived price and customer involvement were deleted from the model. All predictors showed significant effects on the endogenous variables, both direct and indirect effects. No direct relationship from sales service quality and brand equity to perceived value was proposed. Therefore the total effects of these two predictors were indirect through the mediators. Since sales service quality was proposed to be related to brand equity and personal trust, the total effect of sales service quality to perceived value was mediated by both factors. The coefficient of the structural relationship between sales service quality and personal trust and brand equity was significant (standardized β =840/.541, p<.001). Similarly, brand equity indirectly influenced perceived value through relations with the firm, product quality and also perceived risk (with standardized β of .638, .876, and .638; p<.001). Two relationship quality items, personal trust and relations with firm, that were proposed as mediators had significant direct effects on perceive value (standardized β = .291 and .476; p<.001). The other two predictors remaining in the model, product quality and perceived risk, had a significant relationship with perceived value in both direct and indirect ways. The mediating effects of both predictors were also significant (z= 6.253 and 5.614, p<.001, respectively). When the effects of each predictor to perceived value were compared, sales service quality and brand equity seemed to have the highest effect. However, their relationships were all indirectly through many mediators, i.e. personal trust, relations with the firm and also other predictors. However, for the four predictors that have direct effects on perceived value, the data showed that relations with the firm had the highest impact on perceived value (standardized β=.476; p<.001), followed by personal trust (standardized β=.291; p<.001), product quality (standardized β=.270; p<.001), and perceived value (standardized β=.266; p<.001) respectively. These significant relationships indicated that relations with the firm which was influenced by brand equity and perceived risk had the highest impact on perceived value while the rest including product quality, perceived risk and personal trust tended to have the same level of impact on perceived value since all coefficients varied from .266 to .291 were not largely different.

253
The structural relations of all related constructs in the modified model indicated that the value given to the house was based on five major predictors: 1) product quality which had both direct and indirect effects on perceived value; 2) sales service quality which provided only an indirect effect on perceived value via personal trust; 3) brand equity with only an indirect impact on perceived value through relationships with the firm; 4) perceived risk in both direct and indirect relationships; and 5) the direct and mediating impact of two separated dimensions of relationship quality: personal trust and relations with the firm. Thus, the alternative model that had a much better fit compared to the base model seemed to be an efficient structural model to explain the perceived value of the product and its antecedents in the post-purchase home buying context.
Discussions of the Findings from Pre-Purchase Buyers
The same conceptual model was tested with the data gathered from the
prospective home buyers. Most of the findings in this pre-purchase context were consistent with those of the post-purchase buyers. The purchase decision process of the prospective home buyers was comprised of two major stages - consideration set formation and choice selection - like that of the post-purchase buyers. The consideration set formation was totally similar to the first group since this procedure is common practice for all home buyers. Some discrepancies appeared in the second stage since the product mentioned by the buyers was not a selected choice but rather the one in which a buyer was most interested one and could cancel or change at any time. The different levels of commitment to the choice and the different stages of buying, i.e. pre- and post-purchase, would allow some differences in the value formation and choice selection between the two groups of buyers. Overall, the results supported the proposed conceptual model. The fit of the model was in the acceptable level (χ2/df = 1.984; IFI=.912; NNFI=.909; CFI=.912; RMSEA=.048). Perceived value was predominantly defined by three benefits and two

254
sacrifice factors: product quality, sales service quality, and brand equity and perceived risk and perceived price. Customer involvement could not play a significant role in influencing perceived value in both direct and indirect paths. Compared to the post-purchase buyers, the results of the pre-purchase buyers were similar in most aspects. Most structural relations in the model were consistent. Similar to the post-purchase buyers, perceived price was found to have a direct impact on perceived value at a marginal level (t=-2.448; p<.05) while customer involvement had no significant influence in both direct (t=.482; p>.05) and indirect paths (t=.449; p>05). Prior home buying experience had no moderating impact on purchase decisions (χ2difference= 3.908; df=12; p>.05) like for the post-purchase buyers. In addition, the relationship quality also showed its strongest impact on perceived value (β=.370; t=5.386; p<.001) compared to other constructs in the model (The β of other constructs varied from .192 to .272). Since these four findings were consistent with the post-purchase buyers and also prior research findings (e.g. Henning-Thurau et al., 1997; Young & Denize, 1995; Morgan & Hunt, 1994), they will not be repeatedly discussed in this part. The important different findings concerning the pre-purchase buyers from the post-purchase groups were illustrated in five points: 1) the almost equal impact of product quality, brand equity and perceived risk; 2) the significant relationship of all dimensions of product quality and perceived value; 3) the significant relationship of both dimensions of perceived risk on perceived value; 4) the non-statistically significant impact of sales service quality in both direct and indirect paths; and 5) the successful explanation power of perceived value on purchase intention. The details of each point can be discussed in the paragraphs below. The Equal Impact of Product Quality, Brand Equity, and Perceived Risk
Similar to the post-purchase context, all predictors except customer involvement significantly influenced perceived value; the magnitudes of the impact were different among the factors and also different from the recent home buyers. Perceived

255
risk had the highest direct impact on value (β=-.272; t=5.040; p<.001) while product quality and brand equity had almost equal impacts (β=.193 and .192; t=3.618 and 3.6128; p<.001). Price had the lowest direct impact (β =.113; t=2.451; p<.05) while sales service quality had no significant impact on value (β =.078; t=1.728; p>.05). This indicated that the pre-purchase buyers highly considered risk as an important factor during their buying process. The higher the risk was, the lower the value of the product that was shown. This is no doubt that the buyers who wanted to buy a house but had not selected a choice yet would experience high risk and allow that risk to influence the perceived value of the product since home buying was mostly a new purchase they had never encountered before (Mitchell, 1999). The strong influence of risk on value formation also resulted from home buying being high involvement and infrequent, which would lead buyers to be concerned about the uncertain factors of the product and buying process (Choffee and McLeod, 1973).
Product quality, brand equity, and perceived risk also influenced perceived value indirectly through the relationship quality (β=.144, .112, and .100; p<.001) as seen in Hypotheses 7, 8, and 9. The magnitudes of the coefficients of their indirect effects were not much different. Moreover, the results indicated that the total effects of these three factors were almost equal (β=.337, .314, and .371 for product quality, brand equity, and perceived risk, respectively). Compared with the recent home buyers, the prospective buyers were more concerned with brand equity.
For the first group, product quality and perceived risk played superior roles in determining value while brand equity seemed to play a less dominant role. In contrast, the brand played a more important role in the second group. Since the brand is critically important to make points of differentiation among choices (Aaker, 1991), especially for those who were searching for the best possible choice like the prospective home buyers, the brand would increase the probability of brand choice, willingness to buy, and willingness to pay premium prices (Simon and Sullivan, 1993). It could be concluded that the prospective buyers who had not selected a choice yet weighted the real estate brand as equal to quality of the product, the brand and the perceived risk

256
when they placed value on the product, while the recent home buyers who already selected the product considered the brand as less important than the quality and perceived risk of the product. The Significant Relationship of All Dimensions of Product Quality and Perceived Value
The significant impact of product quality on perceived value was consistent with the post purchase buyers and many previous research findings (Tse, 2002; Filion et al. 1999). However, the test of three sub-hypotheses (H1a, 1b, and 1c) to examine the impact of each dimension of product quality indicated that all three dimension including location, environment, and housing factors were significantly related to the perceived value of the product (t=2.045, 2.239, and 3.367; p<.05). Unlike the recent home buyers who considered only location, these results indicated that the prospective home buyers took all dimensions of product into consideration when they valued their choice. This finding was consistent with many prior research findings such as Ho et al (2005), Bender (2000), and Baum (1994)
A comparison of the standardized coefficients of all three dimensions showed housing factors had the highest impact on perceived value (β=.155) while environment and location provided a bit less influence (β=.106 and .095). The prospective home buyers thus gave a greater deal of attention to the housing factors. As housing factors were comprised of many attributes of the house such as the utility function, size, construction material & quality, style & design of the house and also the warranty from the real estate developers (Ho et al., 2005; Bender, 2000; Garvin, 1987; Baum, 1994), the attributes of the house would play an important role in determining the choice selection of the prospective home buyers.
The second factor of concern to the prospective home buyers was the environment of the housing project which included the degree of calm, quality of the view, space, proximity to the neighbors, and the socio-economics of the neighborhood (Bender et al, 1998; 2000; Filion et al., 1999). Location - the last dimension of product including the distance to public transport, center of the city, shopping facilities, and

257
workplace/children’s schools - seemed to be perceived as less important than the house itself and its environment. The Significant Relationship of Both Dimensions of Perceived Risk on Perceived Value
In contrast to the recent home buyers, the prospective home buyers perceived both dimensions of perceived risk, namely internal (β=.221; t=-4.720; p<.001) and external risk (β=.192; t=-3.612; p<.001), as sources of significant impact on perceived value while the first group considered only on internal risk (See Hypothesis 5a and 5b). It is not surprising that both recent and prospective home buyers were concerned about internal risk since it included psychological and functional uncertainty meaning whether the house and its utility functions could attain the home buyers’ expectations (Stone and Winter, 1987). External risk, comprised of social and financial concerns on the possible loss of money and social reaction and approval of the product, played a significant role in the prospective buyers’ points of view, not the recent home buyers’. The pre-purchase situation made the prospective home buyers feel uncertain of possible outcomes of their buying due to the search process which required trading off benefits and sacrifices of each choice. The breadth and depth of all benefits and sacrifices should be considered in order to make an efficient tradeoff of all related factors. Various sales and financial promotions received from several real estate projects might be loaded information for the buyers. The insufficient analysis of the choices especially in monetary items might increase the buyers’ uncertainty in their choice selection. Moreover, the social approval of the selected choice was also important. Prospective home buyers tended to consider the premium brands more than non-premium ones to reduce their external risk. Prior literature suggested the association between the brand and external risk in that the involvement with a single dominant brand is a major risk reducer for consumers (Roselius, 1971) as the cost of a premium brand product could trade off with the less uncertainty. However, as discussed previously, home buyers and other people categorized the brands into premium and

258
non premium ones. Consumers recognized some premium brands but they did not associate those premium brands with distinctive quality and those brands had not exactly provided a distinctive higher level of social acceptance. Moreover, the most-frequent mentioned brand was not perceived as the best or highest quality brand but only as the best-known brand. As the premium brand played a role of higher awareness but could not exactly predict social reaction from any product attributes, brand, or other related factors (Dholakia, 2001), it could not reduce the external risk perception in the real estate context. Therefore, the prospective buyers would greatly concern themselves with external risk. The Non-Statistically Significant Impact of Sales Service Quality
In contrast to the post-purchase buyers, sales service quality could not provide a significant effect on perceived value in both direct (t=1.728; p>.05) and indirect ways (t=1.864; p>.05). Although prior literature on service quality indicated a direct relationship between service quality and perceived value (e.g. Seilaer et al., 2000; Torbica 1997; Dabholkar et al., 1996; Darian et al., 2001), the relationship was not found for the pre-purchase buyers. The non-statistically significant impact of sales service quality may be related to the characteristics of the pre-purchase situation in which the prospective home buyers sought information to make their choice and had no actual experience of the final choice selection. They might consider the prominent factors, in their point of view, especially the attributes of product such as the house itself, the brand, and risk and treat other factors like sales service quality as minor or less important.
The prospective home buyers might increase their awareness of the importance of sales service quality when they actually choose a choice (Weitz, 1978). In that stage, more breath and depth of the information is required since relevant, accurate, and sufficient information is important and necessary for the buyers to decide which choice is to be chosen (Gibler and Nelson, 2003; Bettman and Sujan, 1987). The quality of the sales service would facilitate the buyers in performing their decisions effectively (Torbica 1997; Dabholkar et al., 1996). Therefore, the non-statistically significant impact

259
of sales service quality was illustrated in the pre-purchase context because the individual buyers were engaged in the early stage of choice selection. However, a high degree of concern is expected for sales service quality in the later choice selection stage, i.e. at the point of selection. The Significant Prediction Power of Perceived Value on Purchase Intention For the value formation and choice selection, like the recent home buyers, the prospective home buyers tended to choose the choice that was perceived as having the highest value. In the pre-purchase context, this hypothesis was proved by the significant relationship between perceived value and purchase intention (β=.562; t=11.655; p<.001) and confirmed by the undistinguished value formation and choice selection process of the sub-groups of home buyers i.e. those who bought premium and non-premium brands(χ2=76.464; p>.05). The results indicated that the purchase intention or possibility of the choice selection was related to the perceived value of the product, buyers would select the choice that had the highest value, not matter what kind of product it was. Even though the purchase intention was used in the pre-purchase context instead of the final choice selection, the results were not different. The significant relationship between perceived value and purchase intention indicated that the higher the perceived value, the more buying possibility buyers have. This finding was consistent with the previous research findings such as that of Sweeney et al. (1997), Parasuraman and Grewal (2000), and Petrick (2001). Thus, the processes of value formation of all home buyers, pre- and post-purchase, did not appear to be different.
Alternative Model for the Pre-Purchase Buyers To improve the fit of the model with the pre-purchase dataset, an alternative structural model for the pre-purchase buyers was proposed. The same procedures suggested by Hair et al. (1998) and Byrne (2001) as used with the recent home buyer dataset were performed. The model was modified from the base model using the modification indices and the level of significance of the structural coefficients. Two
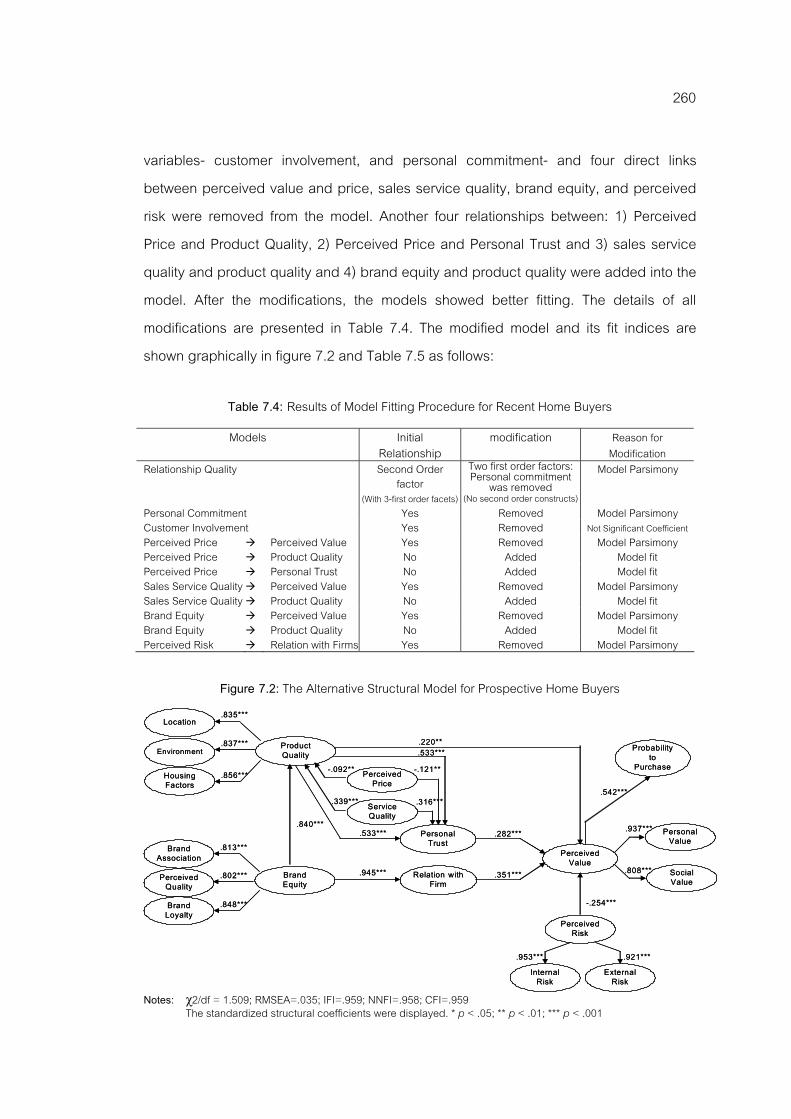
260
variables- customer involvement, and personal commitment- and four direct links between perceived value and price, sales service quality, brand equity, and perceived risk were removed from the model. Another four relationships between: 1) Perceived Price and Product Quality, 2) Perceived Price and Personal Trust and 3) sales service quality and product quality and 4) brand equity and product quality were added into the model. After the modifications, the models showed better fitting. The details of all modifications are presented in Table 7.4. The modified model and its fit indices are shown graphically in figure 7.2 and Table 7.5 as follows:
Table 7.4: Results of Model Fitting Procedure for Recent Home Buyers Models Initial
Relationship modification Reason for
Modification Relationship Quality Second Order
factor (With 3-first order facets)
Two first order factors: Personal commitment was removed (No second order constructs)
Model Parsimony
Personal Commitment Yes Removed Model Parsimony Customer Involvement Yes Removed Not Significant Coefficient Perceived Price Perceived Value Yes Removed Model Parsimony Perceived Price Product Quality No Added Model fit Perceived Price Personal Trust No Added Model fit Sales Service Quality Perceived Value Yes Removed Model Parsimony Sales Service Quality Product Quality No Added Model fit Brand Equity Perceived Value Yes Removed Model Parsimony Brand Equity Product Quality No Added Model fit Perceived Risk Relation with Firms Yes Removed Model Parsimony
Figure 7.2: The Alternative Structural Model for Prospective Home Buyers
Notes: χ2/df = 1.509; RMSEA=.035; IFI=.959; NNFI=.958; CFI=.959 The standardized structural coefficients were displayed. * p < .05; ** p < .01; *** p < .001
Product Quality
Location
Environment
Housing Factors
Brand Association
Perceived QualityBrand Loyalty
Brand Equity
Perceived Price
Perceived Value
Personal Value
Social Value
Probability to
Purchase
.835***
.837***
.856***
.813***
.802***
.848***
.937***
.808***
.542***.316***
.840***
-.254***
-.092**
.220**
-.121**
Relation with Firm
Personal Trust
Internal Risk
External Risk
Perceived Risk
Service Quality
.945***
.921***.953***
.351***
.282***
.533***
.533***
.339***

261
Table 7.5: Fit Indices for the Proposed and Alternative Model of Prospective Home Buyers Fit Index Recommended level Proposed model Alternative model χ2/ df <3.00 1.984 1.509 IFI >.90 .912 .959 NNFI >.90 .909 .958 CFI >.90 .912 .959 RMSEA <.08 (<.05) .048 .035 Note: IFI=Incremental Fit Index; NNFI=Non-Normed Fit Index; CFI=Comparative Fit Index; RMSEA=Root Mean Square Error of
Approximation. The improved fit indices from .909-.912 to .958-.959 with lower χ2/df and RMSEA indicated that the modified model is much better than the proposed model in terms of the explanation power on the purchase decision process for the prospective home buyers. Similar to the recent home buyer, the results generally support the higher prediction power of the modified model since the higher variance of the endogenous factors was explained by their predictors – based on the squared multiple correlations (SMCs-r2) (Byrne 2001; Hair et al 1998). As seen in Table 7.6, the square multiple correlation of perceived value increased from .467 in the proposed model to .864 in the modified model. Consistently, the square multiple correlation of relationship quality increased from .342 in the proposed model to .894 for personal trust and .525 for relations with the firm in the modified model. The details of coefficients of the structural relations were also presented in Table 7.6:
Table 7.6: Total Effects on Perceived Value for Alternative Model Relationship Estimated a
Paths in the Model Direct Effect
Indirect Effect
Total Effect t-valueb (Direct effect)
z-value c (Moderating
effect) SMC
d (r2)
Antecedents Product Quality Value .177 (.220) .121 (.150) .298 (.370) 2.974** 5.468*** .829 Sales Service Quality Value .137 (.215) .137 .215) Brand Equity Value .532 (.643) .532 (.643) 16.387*** Perceived Risk Value -.123 (-.254) -.123 (-.254) -5.089*** Mediator Personal Trust Value .204 (.282) - .204 (.282) 6.430*** .525 Relation with firm Value .241 (.351) - .241 (.351) 5.488*** .894 Sales Service Quality Product Quality .268 (.339) 268 (.339) . 9.324*** Sales Service Quality Personal Trust .137 (.215) .137 (.215) Price Personal Trust -.051 (-.068) -.051 (-.068) -3.002** Brand Equity Product Quality .864 (.840) 14.491*** Price Product Quality -.085 (-.092) -.085 (-.092) -.276** Brand Equity Perceived Risk -.697 (-.638) - -13.108*** Notes: a Figures shown in each cell indicate the unstandardized coefficients; Figures in the brackets indicate the standardized coefficients; Figures in the bold brackets indicate the moderating effect SMC for perceived value is .864; for Purchase intention is .294. b t-value of the direct effect of each predictor on endogenous variable: * p<.05; ** p<.01; *** p<.001. c Figures in the brackets indicate the z-value and its significance calculated by the Sobel Test d Shows a Square Multiple Correlation for the Dependent ( Endogenous) variable of the structural relation
262
Based on the modification indices and the magnitude of the structural relation coefficient, the direct relationship of sales service quality, brand equity and perceived price were removed from the model. Product quality and perceived risk were the two antecedents that directly impacted perceived value. According to the non-statistically significant structural relationships of personal commitment on perceived value in the base model, only two dimensions of relationship quality, namely personal trust and relation with firm, were put in the model as two mediating constructs, while the third dimension, personal commitment was removed. Both relationship quality constructs had a direct relationship with perceived value at a significant level but different magnitudes, i.e. relations with the firm had a higher impact on perceived value (β =.351) than personal trust (β =.282). Each relationship quality construct also played a different mediating role. Relations with the firm mediated the relationship between brand equity and perceived value while personal trust mediated the relationship between perceived value and product quality, sales service quality, and perceived price. Sales service quality as mediated by product quality and personal trust and brand equity mediated by relations with a firm provided strong indirect influence on perceived value. This can infer that sales service quality itself could not directly impact perceived value but it played an intense role in influencing personal trust, which in turn, indirectly influenced perceived value of the product. Sales service quality that was able to enhance the value of the product would be the one that induced buyers to trust salespersons. Consistently, brand equity played a highly significant role in determining perceived value through the relationship with the firm meaning that the brand could enhance the value of the product when it induced the quality of buyers’ relationships with firms. Price, another factor that indirectly influenced perceived value, played a minor role in influencing value directly. However, a suitable price was found to enhance buyers’ trust on salespersons and promote a more positive perception of product quality which, in turn, would influence the value of the product and choice selections indirectly. Therefore, unlike with the post-purchase buyers, perceived price played an indirect role in determining perceived value via product quality and personal trust in the pre-purchase context.

263
Comparison of the Pre- and Post-Purchase Buyers’ Decisions The two datasets used in this research had their own characteristics since one was collected from recent home buyers in the post-purchase situation while another one was gathered from the prospective home buyers in the pre-purchase context. For the recent buyers, the post purchase situation might induce them to engage in a post-purchase bias based on the cognitive dissonance process (Kotler and Armstrong, 1999). It was common for customers to feel that the selected choice was preferable especially in the circumstances that the product was durable with no immediate repurchase intention. The buyers were likely to experience psychological discomfort if they felt that the selected choice was not as good as expected or the choice tended to be less acceptable to others. Such psychological discomfort commonly motivated changes in buyers’ minds after buying that particular product. The buyers would not only justify their own belief systems but also try to persuade others to feel and behave in the same way to defend and protect themselves from the possible effects of decision mistakes (Aronson, 1997). Hence, recent home buyers with their post purchase dissonance might rate the value of a product as more highly positive than it actually was. The invariant or less variant data may be critical. Indeed, this problem was not found in this research though data was also collected from prospective home buyers in the pre-purchase home buying context to identify the similarities and differences between buyers in different stages of choice selection.
The important characteristic of the pre-purchase buyers is the fact that they had not yet selected their choice. Their inexperience at performing actual final choice selection limits researchers in using purchase intention as a dependent variable instead of choice selection. The criticism was on the validity of the use of purchase intention to predict the actual choice selection since their relationship was questioned. Kotler (2000) indicated the interferences of several unanticipated situational factors and attitudes of other people on this particular relationship. Moreover, the convenience and familiarity factors together with the different levels of need, i.e. basic, security, social, esteem, and actualization needs according to Maslow (O’Brien, 2006), would also

264
interrupt the relationship between intention and actual purchase behavior. Even though the buyers perceived one choice as the best, they might not select that choice if their friends did not like that choice (Kotler, 2000). There was little evidence showing the consistency of purchase intention and behavior. Prior research studies suggested a general pattern of greater instability in the relationship between purchase intention and behavior when products were durable and not easily affordable. To overcome the limitations of each sample group, the surveys of both pre- and post-purchase consumers were performed in this research.
The comparison of the model fits and structural relations among constructs of the two groups showed some minor differences while most of the results were consistent in the weight and direction of each pair of relationship among constructs
(χ2=47.25, df=12). The indifferent of the pre- and post-purchase home buyers indicated that the proposed research model could be used to explain the value formation and choice selection of the home buyers in general. However, to analyze the data elaborately, different alternative models for pre- and post-purchase customers proposed in the previous part would reliably and accurately explain the behavior of each group of customers.
The similarity of major findings from both groups is not surprising since both pre- and post-purchase buyers shared the common objective of buying a house. All home buyers would engage in the same complete and complex decision process for this high involvement and infrequent buying situation. The differences between the two groups depended on the different stages of buying they were engaged in when the data were collected while the process of their purchase decisions including the factors they considered was the same. All directions of the impacts from all related factors were similar, with only the level of the magnitude of some structural relationship coefficients different. As the main objective of this research is to explain the entire process of the purchase decision, the prominent similar and different characteristics between pre- and post-purchase buyers can be presented in the parts that follow.

265
Important Similarity between Pre- and Post Purchase Buyers The similarity of the purchase decision process and its influencing factors between buyers who were in the different home buying stages, pre and post context, could be categorized into five points as follows: Two stages decision process All buyers undertook two-stage decision making. They formed their consideration sets in the initial stage to gain a reduced set of choices that they considered in detail in their second stage. Most home buyers used the same criteria and non-compensatory decision rules to form their consideration sets. The second stage of decision making was the final choice selection. The recent buyers who already chose a choice and the prospective buyers who were choosing a choice considered the value of the product instead of each individual attribute of the product. They considered all related factors simultaneously by compensating for the positive and negative characteristics of each factor and placed value on their choices. Each choice was selected based on its value, i.e. usually the highest value choice. Benefit and Sacrifice Constructs To form value, all related factors were perceived as benefits or sacrifices. The important benefits included product quality, brand equity, and sales service quality. They played positive roles in enhancing the level of perceived value. The key sacrifices included perceived price and perceived risk. These two factors were negatively related to perceived value. Value was created by the debate or tradeoff of all benefits and sacrifices. Product Quality Product quality had both direct and indirect influences on value. Its indirect impact on value was mediated by personal trust. Thus, the quality of a product could enhance its value directly and also indirectly if it induced the buyers to trust the salesperson. Personal trust in salespersons was created when the quality of the product

266
exceeded or met the buyers’ minimum requirement or expectation suggested by the salesperson or the real estate firm. Sales Service Quality Not all aspects of sales service quality significantly influenced perceived value. The strong indirect relationship of sales service quality with value which was mediated by personal trust indicated that only some aspects of sales service quality that induced buyers’ trust in salespersons could enhance perceived value. Therefore, reliable and assured services provided by the salesperson would be the most important factors. The typical characteristics of housing products that are technical and detailed required the salespersons to play an important role as information providers to facilitate obtaining relevant information to help home buyers choose the most appropriate choice. Thus, the quality of service depended largely on the reliability, accuracy, and also overall quality of information provided by the salespersons. Brand Equity Brand equity, similar to sales service quality, significantly and strongly influenced perceived value when it induced high quality relationships between the buyers and the real estate firms. Since the relationship quality was comprised of trust, commitment, and satisfaction, the brand that enhanced perceived value would be the brand that made the buyers trust, commit to, and be satisfied with the real estate firm. As discussed previously in the consideration set formation and finding of brand equity, the brands in the real estate context seemed to be different from other product categories/industries in that most people were aware of some premium brands but did not associate those brands with the quality or other aspects. Only one association currently illustrated was on the price. People tended to perceive premium brands as expensive and luxury. This perception may result in two possible consequences: higher social approval or a too- expensive and unaffordable price. This brand perception was not very beneficial for value formation and choice selection. Brands that can enhance value should be brands that promote trust in, commitment to, and satisfaction with the real estate firm.

267
Relationship Quality Personal trust and the relationship with the firm played an important role in mediating the relationship between most benefits and sacrifices and perceived value. These two constructs of relationship quality were the key factors that provided an advanced understanding of how buyers relate the attributes of products and other related factors and the value of the products. Even though some related factors could provide direct impacts on value, stronger relationships were found when they were mediated by personal trust and the relationship quality with the firm. Important Differences between Pre- and Post-Purchase Buyers The differences between the purchase decision processes and the influencing factors between recent and prospective home buyers are categorized into four major points as described below. The Higher-Concern Factors for the Prospective Buyers The research findings indicated that the prospective buyers gave more concern to the brand than the recent home buyers. The recent home buyers appeared to be less concerned about the brand than the product quality and perceived risk. In contrast, the prospective buyers seemed to almost equally consider the three factors of product quality, brand, and risk. Even though the magnitude of the effect of a brand was relatively higher in the prospective buyers, its characteristics were not different from that of recent home buyers. The difference of the magnitudes indicated that the brand tended to have more impact on the value for the pre-purchase buyers than the post-purchase ones. The magnitudes of the impacts of product quality were not different between pre- and post- purchase buyers but their characteristics were different. The recent home buyers considered only the location of the house, while the prospective home buyers pondered all three dimensions of product, i.e. location, environment, and

268
housing factors. Thus, prospective home buyers searching for a house considered all attributes of the house, while the recent home buyers who had already bought their houses valued the houses on location only. Similar to product quality, the magnitudes of the impacts of perceived risk were not different between pre- and post- purchase buyers but their characteristics were different. The recent home buyers concerned themselves with only internal risk which included the uncertainty of psychological and functional factors while the prospective home buyers considered both internal and external risk. Since external risk covered both social and financial risk, the pre-purchase buyers seemed to be concern about all aspects of risk. The Less-Concern Factors for the Prospective Buyers In contrast to the recent home buyers, prospective buyers seemed to give very low concern to sales service quality. The direct impact of sales service quality was not found while the indirect relationship with perceived value was also not illustrated when it was mediated by all three dimensions of relationship quality. Only one significant impact of sales service quality on perceived value was its indirect impact via personal trust. For the recent home buyers, sales service quality highly impacted perceived value through both direct and indirect paths. The indirect impact of sales service quality was very strong when it was mediated by either all dimensions of relationship quality or only personal trust. The difference of the importance of sales service quality in a purchase decision in the pre- and post-purchase contexts is new and interesting for marketing literature The Different Effect of Perceived Risk The impacts of perceived risk on other constructs were different between the pre- and post-purchase models. In the pre-purchase context, risk tended to provide a strong direct impact on perceived value. Although the indirect impact of risk on value was significant, its magnitude was typically less than that of its direct impact. Thus, perceived risk provided a strong direct impact on value in the pre-purchase context. In contrast, the recent home buyers perceived risk differently. Not only did it have a direct

269
impact on perceived value, it also provided an indirect impact on value via relationship with the firm. Moreover, perceived risk was strongly and negatively related to the brand equity. These findings indicated that the post-purchase buyers traded off their perceived risks with the quality of the relationship with the firms and the brand of those real estate developers. Both recent and prospective buyers shared their common goal to buy a house. Their differences were based largely on the stage of their decision. Also, both groups already passed the first decision stage of the consideration set formation. They were in different stages of choice selection. The value formation and choice selection of the prospective buyers who sought choices, i.e. did not engage in the point of selection, should be explained by the structural model for the pre-purchase buyers. The prospective buyers appeared to consider all related factors especially product quality, brand, and perceived risk. Since the buyers tended to compensate the positive and negative characteristics of one factor with those of another in their value formation, more positive values could be created. Perceived risk as a sacrifice by nature could be reduced or compensated by other benefits such as higher product quality and more brand equity. If the prospective buyers receive sufficient and relevant knowledge about the house, its environment, the location and some aspects of brand that create trust in, commitment to, and satisfaction with the firm, they would perceive that particular choice as of higher value. Since the prospective buyers seemed to give less credibility to the quality of sales service, providing high quality information on all related housing attributes and brand would be suitable for enhancing the perceived value of the product. In contrast, the home buyers who were in the point of selection, i.e. deciding which choice to choose, would process their value formation like what the recent home buyers did. Thus, the structural model for the post-purchase buyers could be used to explain the value formation and purchase decision process of this group. The key value influencing factors were different from the prospective buyers. The buyers who were engaged in this stage showed less concern for the product quality and brand. The quality of the products and brands seemed to meet their minimum requirements
270
before they considered the choice to be selected. Thus, they took only the location of the house, one level of brand equity, and internal risk factors into consideration. The buyers seemed to be more concerned about the quality of service and the relationship with the real estate firms and salespersons. For the buyers, selecting one choice meant that they had to deal with that real estate firm and its personnel throughout a long process and for long period of time. Thus, to create a more positive value for this group, a positive relationship i.e. trust in, commitment to, and satisfaction with the real estate firm, and also trust in the salesperson should be promoted.
Summary
This chapter discusses the important findings of the research. The important findings from the post-purchase buyers were first presented in eight important points: 1) the entire process of decision making; 2) the direct and indirect roles of product quality, perceived risk, and brand equity; 3) the strong indirect role of sales service quality; 4) the direct role of perceived price; 5) the distinctive and important mediating role of relationship quality; 6) the non-statistically significant role of consumer involvement; 7) the non-statistically significant moderating effect of prior home buying experience; 8) the explanation power of perceived value on choice selection. Next, the important findings from the pre-purchase buyers were discussed. The findings were categorized into five points: 1) the almost equal impact of product quality, brand equity and perceived risk; 2) the significant relationship of all dimensions of product quality and perceived value; 3) the significant relationship of both dimensions of perceived risk on perceived value; 4) the non-statistically significant impact of sales service quality in both direct and indirect paths; and 5) the explanation power of perceived value on purchase intention. The alternative structural models that fit well with characteristics of each type of buyer were proposed. Finally, the comparisons between pre- and post-purchase buyers were discussed. From this, the major similarities and differences in their purchase decisions were identified.

271
CHAPTER 8
CONCLUSION AND RECOMMENDATIONS
This chapter is divided into four parts: conclusions, theoretical contributions, managerial implications, and limitations and suggestions for future research. The details of each part are discussed below:
Conclusions
The purpose of this dissertation research was to study the purchase decision process and its underlying factors. The main objectives of this dissertation were to develop a conceptual framework to identify the process of and the factors that influence the consideration set formation and the choice selection and to test the framework empirically. The proposed conceptual model focuses on the understanding of how a consumer values a product and how that value influences his or her purchase decision. The concept of perceived value was chosen as it represents a tradeoff between all purchase-related sacrifices and benefits, and therefore enables comparisons among the choices that are available for the consumers. Since it has been shown that perceived value is capable of predicting purchase decisions (Kahneman and Tversky, 1979; Sweeney et al., 1997), the related literature was reviewed to reveal the determinants of value from a consumer perspective. The research model comprising six major antecedents of value: three benefits and three sacrifices together with one mediating factor was developed. One product, single detached house, was selected. Due to the product’s immoveable, durable, and expensive characteristics, home buying is considered a high involvement purchase for which the entire purchase decision process should be performed. Data collected from focus group discussions and two surveys of the recent and prospective home buyers were used for the data analyses. A content analysis was conducted to

272
identify the consideration set formation process from the focus group data. For the survey data, a descriptive data analysis was performed to understand the personal and housing characteristics of the respondents. The item analysis was done to evaluate a reliability and validity of measures used in the surveys. The result was satisfactory, indicating that the measures could be used for further analysis. Structural equation modeling analyses were performed in the last part to test twelve main hypotheses and also nine sub-hypotheses. All but one main hypothesis were supported by both datasets from pre- and post-purchase buyers. Results of the analysis suggested that home buyers engaged in the two-stage decision making process. The consideration set formation was done in the first stage and choice selection was performed based on the perceived value in the second stage. Based on the findings gained from all data analyses, five proposed objectives of the dissertation were successfully met. The details are as follows: Objective 1: To identify the criteria for consideration set formation quality-related factors that influence a consumer’s decision making process to purchase a durable product.
The four criteria of consideration set formation: location, price level, size and style of the house and brands of the real estate developers were identified. The details of each criterion as well as the decision rules used in the decision making process were explained. Quality-related factors were not directly related to the choice selection but they did determine the perceived value which, in turn, strongly influenced the choice selection. Thus, this objective could be achieved. Objective 2: To identify the factors, both benefits and sacrifices, that determine consumer perceived value of each product choice and investigate how those factors influence the value formation. All important benefits and sacrifices of value were identified. Three benefits of product quality, sales service quality, brand equity- and two sacrifices of perceived price and perceived risk were found to determine consumer perceived value, directly

273
and indirectly. The benefits were positively related to the perceived value while sacrifices negatively influenced the perceived value. Objective 3: To examine the mediating role of relationship quality on the relationship among benefits, sacrifices and perceived value. To meet this objective, the mediating role of relationship quality was tested. Research findings showed the significant mediating effect of relationship quality on the relationship between all three benefits and one sacrifice-perceived risk- and perceived value. The strong mediating effect of personal trust on the relationship between sales service quality and the perceived value as well as the mediating effect of relations with the firm on the relationship between brand equity and perceived value were illustrated. Objective 4: To examine the significance of the direct impact of a brand on consumer choice selection. The impact of brand on perceived value was investigated to achieve this objective. It was found to have significantly direct impact on perceived value. However, the impacts of the brand on perceived value of the pre- and post-purchase buyers were different in that its impact seemed to be higher for the pre-purchase buyers. Objective 5: To identify specific characteristics of the quality of product, sales service, brand, perceived price, perceived risk, and customer involvement that affect value formation in the home buying context. Product quality, brand, and perceived risk provided significant impacts on perceived value, directly and indirectly. Perceived price showed only direct relationship with perceived value. Sales service quality strongly influenced perceived value only when it was mediated by trust on salespersons. Customer involvement had no any effects on perceived value. Thus, this objective was met by these findings. This dissertation not only achieves the proposed research objectives, but also answers the eight specifying research questions. The details of which are in the subsequent paragraphs:
274
Question 1: What are the key attributes consumers use in developing a consideration set? Most home buyers used four common criteria to form their consideration sets
which were location, price level, size & style of the houses, and brands of real estate developers. They initially sought information and set up the minimum requirements or the cutoff point of each criterion. All criteria must exceed those minimum requirements. The buyers commonly did not compensate any less-than-requirement criteria with other criteria or other product attributes. The choices that could not meet the minimum requirement of each criterion were excluded from the consideration. They instead reduced their minimum requirements to be more practical or suitable with the actual context. Question 2: How do consumers develop their perceived value for each choice?
In the second stage of decision making, the details of each choice were considered. The value of the choice was created and the highest valued choice was almost always selected. The tradeoffs of the loss and gain from all physical, psychological, and social-related attributes were performed. The value would be perceived as high if the benefits gained from the choice exceed all things that buyers have to sacrifice or the things that they may lose to obtaining that choice. The value formation process is not simple. In contrast, it rather complicates and involves with many determinants. Relationships among all related factors were illustrated in both direct and indirect ways. Question 3: What are the key determinants for value creation? The three benefits of product quality, sales service quality, and brand equity and two sacrifices of perceived risk and perceived price were found to determine perceived value in direct and/or indirect ways as proposed in the conceptual model. The new proposed construct -relationship quality- was found to strongly influence value. Question 4: What are the relationships among those determinants?
In both contexts, the three constructs of product quality, perceived risk, and relationship quality played dominant roles in explaining value formation while sales service

275
quality, brand equity, and perceived price were of lesser importance. However, sales service quality and brand equity played important roles in determining the relationship quality. Contradictory to this, customer involvement was found to have no effect on value in both direct and indirect ways.
Comparing the direct effects of all three benefits, sales service quality showed least impact on perceived value. It was found to have no impact in the pre-purchase group and marginal significant impact in the post-purchase context. Perceived risk showed a higher negative effect than perceived price. The impact of perceived risk on value was in the same level as that of product quality and brand equity. Relationship quality displayed the highest impact on value in both pre- and post-purchase datasets. The significant mediating effect of relationship quality on perceived value and product quality, sales service quality, brand equity, and perceived risk was illustrated. The strongest indirect effect of sales service quality via personal trust in salespersons was shown. Question 5: How does perceived value affect the final choice selection?
To answer this question, it was investigated whether there were differences in the value formation processes between the home buyers who bought different types of products, i.e. premium and non-premium brands and three different price levels. The research results confirmed that there was no difference in the value formation among buyers who bought different types of houses. Overall, the buyers chose their final choices based on the value of the product not individual benefits or sacrifices of the product. In addition, the value formation process of all types of buyers did not appear to be different. The results were consistent for both pre-purchase and post-purchase buyers. Purchase intention was used to explain the impact of perceived value on the decision making of prospective home buyers instead of choice selection since the final choices were not performed yet. Its significant relationship indicated that the higher the perceived value buyers have, the higher the possibility of buying. Thus, the results confirmed that perceived value significantly influenced choice selection.

276
Question 6: How does brand affect consumer decisions? Brand is one important criterion the buyers consider in the initial stage of
decision when they form their consideration set. The structural path analyses of the choice selection model showed significant relationship between brand equity and perceived value in both direct and indirect paths. It could infer that the brand does not only directly enhance perceived value but, in addition, it indirectly enhances value if it could create trust in, commitment to, and satisfaction with the firm. Based on these findings, brand could affect consumers in both stages of decision making. It influenced buyers to include the choice in or exclude the choice from their consideration sets in the first stage and also played a significant role as one antecedent of value which influenced the buyers’ choice selection in the second stage.
The results also indicated that the awareness and perceptions of brand such as its reputation, reliability, level of premium, quality product offered by the firm, and also customers’ loyalty could impact home buyers in developing trust in, commitment to, and satisfaction with the real estate firm. Thus, brand could directly affect value formation and also played an important indirect role in impacting value creation and choice selection through the quality of relationship with the firm. Question 7: What are the specific characteristics of perceived risk in home buying? In contrast to the past literature, perceived risk in the real estate context could be categorized into two dimensions, internal and external risk. The internal risk includes psychological and functional factors that are related to the product while external risk covers both social and financial related factors. The internal risk showed that the unsure utility functions of the house might create some feelings of worry and anxiety which led to psychological risk. Since it was impossible for home buyers to live in the houses before buying them, the uncertain quality of the houses could be developed and the matching of the utility functions of the houses and buyers’ life styles would be questioned. For the external risk, social and financial factors of the house were perceived as closely related. As financial risk is a monetary concern, it would be related to price. Since price is perceived as related to quality, the higher price would indicate quality and luxury of the

277
house and the social status of the buyers. It is reasonable that the buyers relate both social and financial risk together since the money they paid might lead to financial risk but, on the other hand, it could reduce social risk. Question 8: Do the effects of the antecedents of perceived value and purchase
decisions differ between experienced and less experienced customers? To answer the last research question, the differences between the value formation and choice selection between experienced and less experienced buyers (i.e. between first-time and non first-time home buyers) were investigated. The result was different from that of other research studies in that the moderating effect of prior home buying experience was not found in this research. All home buyers with or without home buying experience developed the same value formation and final choice selection processes. All research questions and their key answers can be concluded in Table 8.1.
Table 8.1: Conclusions of Research Questions and the Corresponding Answers Specifying Research Question
No Content Key Answers
1 Key criteria for consideration set formation
Location, price level, size and style of the house and the brand of real estate developers
2 Developmental process of perceived value
Consideration of all related factors simultaneously by making tradeoffs of all benefits and sacrifices
3 Key determinants for value creation Three benefits - product quality - sales service quality - brand equity
Two sacrifices: - perceived risk - Perceived price
One mediator - Relationship quality 4 Relationships among key determinants
of value Three benefits are positively related to value in both
direct and indirect way. Two sacrifices are negatively related to value. Risk has both direct and indirect influence Price has only direct impact.
5 The effect of perceived value on choice selection
Significant and positive effect 6 The effect of brands on perceived value Significant and positive effect: directly and indirectly
via the quality of relationship with firm 7 Characteristics of perceived risk in the
real estate context Two risk dimensions found: Only internal risk is negatively impact value in the
post purchase context. Both internal and External risk are negatively impact
value in the pre-purchase context 8 Moderating Effect of prior experience Not statistically significant effect

278
Theoretical Contributions The theoretical contribution can be categorized into six points including: 1) an advanced understanding of the entire process of decision making, 2) the distinct and important mediating role of relationship quality, 3) the indirect role of sales service quality and brand equity, 4) the non-statistically significant role of consumer involvement, 5) the non-statistically significant moderating effect of prior home buying experience, and 6) the explanation power of perceived value on choice selection. The details can be discussed as follows: Advanced Understanding of the Entire Process of Decision Making
In this present research, the study of both decision making stages, which are consideration set formation and choice selection were focused. Thus, the entire process of decision making was understood in advance as expected. The use of actual choice selection as dependent variable of the model instead of purchase intention like in other research studies would enhance the accuracy and validity of the findings. An extension of the study of Sweeney et al. (1997) on the relationship between product value and purchase intention by applying the Zeithaml’s (1988) “give and get” concept of value formation was made. All important benefits and sacrifices reviewed in the prior literature were included with the new proposed mediating construct- relationship quality. The research model could provide a more complete view of value formation and choice selection process.
The findings from this research could be generalized to the actual business settings since the impact of all related constructs were tested simultaneously and empirically. Moreover, this study used actual customers as samples not like a number of prior studies on perceived value that used students in experimental settings would provide natural settings and render a more realistic understanding of consumer behavior.

279
Moreover, the surveys were performed in both pre- and post-purchase contexts. The comparisons of the model fits and structural relations among constructs of the two groups showed some minor differences (χ2=47.25, df=12) while most structural paths were the same in the weights and directions of each pair of relationships. The differences of the pre- and post-purchase home buyers indicated the discrepancies of the value formation and choice selection processes of the buyers who are in different stages of choice selection. The Distinct and Important Mediating Role of Relationship Quality
The results indicated a significant mediating role of relationship quality which was a new construct for the value literature. Two dimensions of relationship quality - personal trust and relations with the firm - were found to have stronger power in explaining perceived value and choice selections than other benefit or sacrifice factors such as product quality, sales service quality, brand, price, and risk. The uncovering of the genuine effect of relationship quality is one major contribution of this research since most value literature focused on only either positive or negative direct effects of the benefits or sacrifices on value. Relationship quality is distinctive from other antecedents of value in that it is the product of other benefits and sacrifices and is established in consumers’ minds when they evaluate the quality of other constructs. The prominent role of relationship quality suggested that to better understand the total or actual effects of all antecedents on value, the mediating role of relationship quality should not be disregarded. The Indirect Role of Sales Service Quality and Brand Equity
An important finding was that sales service quality and brand equity had strong indirect effects on perceived value in both the pre- and post-purchase contexts. The prior studies suggested only direct effect of sales service quality on value. In

280
contrast, sales service quality was found to enhance favorable perceptions towards a seller’s reliability, and trust in this research. It is likely that customers were able to build trust if a seller showed sincere interest in fulfilling the buyers’ individual needs, keeping promises, having professional knowledge, responding quickly at an appropriate time, and treating them courteously. Trust which was created based on the quality of service was found to enhance value. Thus, the findings of this research offered new insights of sales service quality in that it created personal trust in the salesperson and the value of the product was influenced by personal trust, not sales service quality itself.
Similar to sales service quality, the results showed an indirect effect of brand equity on perceived value via buyers’ relations with firm. This sophisticated effect of brand demonstrated that the brand can induce the buyers’ feeling of trust in, commitment of, and satisfaction with the firm. It illustrated a new significant effect of brand in that it could enhance product value indirectly through relationship quality with the firm even though its direct impact on value was minor especially for the buyers who already excluded unwanted brands from their consideration sets. Thus, findings of the strong impact of sales service quality and brand equity on perceived value when they are influencing by personal trust and relationships with the firm are also the contributions of this research. The Non-Statistically Significant Role of Consumer Involvement
This study could not find clear evidence of consumer involvement playing any influencing roles, whether they be direct or indirect or positive or negative, on perceived value. The findings were the same in both the pre- and post-purchase contexts. Thus, it seemed that consumer involvement was based largely on individual differences of the buyers and its effect was too minor to consider and its direction was not clear. The Non-Statistically Significant Moderating Effect of Prior Home Buying Experience
This study extended the understanding of the purchase decision process by investigating the moderating influence of prior home buying experience. A non-

281
statistically significant influence of the prior experience on value formation and choice selection was found. It might be a specific characteristic of the real estate context that there is no moderating effect of past experience on home buying decision since the product is a durable and very infrequent buy. The Explanation Power of Perceived Value on Choice Selection This study also demonstrated that the concept of perceived value could be used to explain choice selection. The research results explained a sufficient part of the variance in choice selection since no differences were found when the buyers were categorized into subgroups by the brands and prices of the products. This proved that perceived value could be successfully used to explain choice decision and purchase intention.
Managerial Implications
The recognition of the importance of the value consumers place on products, its formation process, and its influences on the actual purchase decisions would help marketers to achieve their sustainable competitive advantage (e.g. Bolton and Drew 1991; Cronin et al., 2000; Dodds et al. 1991; Holbrook 1994; 1996; Woodruff and Gardial 1996; Woodruff 1997; Zeithaml 1988). Since the results of this research indicated that perceived value was the key factor for consumers to make a final choice selection, it is necessary for marketers to understand what defined value, how consumers traded off all important sacrifices (costs) and benefits, and how value influenced purchase decisions. This research built upon the existent perceived value literature and brought about important findings that could help practitioners to understand customers’ purchase decisions in the home buying context.
As consumers usually undertake two major stages in their decision process including consideration set formation and choice selection, marketers or real estate
282
developers should focus their attention on both stages and design relevant marketing strategies accordingly.
For the first stage, the real estate developers must design and present their products in a way that can attract home buyers and make home buyers include their product in the buyers’ consideration sets. To do so, marketers should focus on the four important factors– location, price level, size & style of the houses, and brands of real estate developers. For the first criterion, location, home buyers would like to have houses that are located in lower traffic areas. The housing projects which are located on or near the main road, near the express way, or any shortcut roads would gain more attention from home buyers. Thus, the real estate developers should be concern with this point when they select the locations for the new housing projects.
Price level as the second criterion seems to be more complicated. The price is almost always perceived to be not directly linked to the product quality and the affordability. The real estate developers should segment home buyers based on the price level of the house, select the group of customers that are suitable for their products, and produce products that can serve the needs and wants of their targeted customers. Thus, the specific characteristics of the target customers including their needs, wants, and expectations should be known. To gain consumers’ attention, the real estate developers should offer products that look better or more attractive than other products with the same price level in the customers’ point of view.
The next criterion, size & style of the houses, is varied based on customer’s individual differences. However, most home buyers agreed that most of the houses that are currently available in the market look indifferent. If a product has a prominent and remarkably different design, it would be attractive and gain more interest from the home buyers.
The real estate developers should also be aware of the last criterion: the brand. A brand that is recognized by the home buyers and other people would gain more interest from the home buyers since it could yield more social acceptance and perceived as less risky. The real estate developers may consider how to build up their brands and also enhance the equity of the brand.

283
For the second stage of decision making, the marketers should set up some strategies to create more product value for buyers to perceive since perceived value was proven to be the key factor for choice selection. As indicated by the research findings, the most powerful predictor of value is relationship quality. The key success factor of real estate business is the creation of quality of the relationship between home buyers and the firm which includes building personal trust in the real estate representatives and producing trust in, commitment to and satisfaction with the real estate firm.
As sales service quality is found to have a substantial impact on personal trust and relations with a firm, it is yet another important factor for marketers. Real estate developers should reconsider the quality of salespersons and their expected performance. Since only some aspects of sales service quality can heighten perceived value i.e. the aspects that can induce buyers’ trust in real estate personnel, those aspects should be emphasized. Not only should they have professional knowledge and courtesy and be good looking, the salespersons should also be sufficiently reliable, trustworthy, and empathetic. Real estate developers must give importance to this fact and think of how to choose salespersons and how to prepare them to have sufficient knowledge, genuineness, and a service mind since these characteristics seem to be overlooked by most real estate firms.
Considering the brand, the research results indicated that the relationship between brand and perceived value is mediated by relationship quality at the firm level. Most home buyers did not buy their first-recalled brand. Thus, the awareness of a brand is necessary but is not sufficient enough to enhance perceived value. The real estate developer should aid consumers in associating its brand with the trustworthiness and perceive the product offered by the firm as high quality. The ordinary marketing communication techniques such as mass media and roadside billboards may increase the brand awareness but not brand association, perceived quality and brand loyalty.
To create trustworthiness and high perceived quality for the real estate brand, the real estate firms may use other more powerful communication techniques

284
such as word of mouth from the current customers of the firm and viral marketing in which the opinion leaders propose their opinions on any aspect of the real estate firm on the website. Thus, the opinions from peers or other home buyers would ensure the quality, reliability, and trustworthiness of the firm. However, before encouraging current customers to promote the real estate firm to other prospective buyers or rewarding them for doing so, the real estate developers must make the current customers trust in, commit to, and be satisfied with the firm first. The recruitment of new buyers will be successful if the current customers, as opinion leaders, truly possess high quality of relationships with the firm. The high relationship quality would ensure they provide positive and effective word of mouth for the products. Moreover, the product value and brand equity would be enhanced if the real estate developer can establish consumers’ loyalty to the real estate firm.
Limitations and Suggestions for Future Research
This study contributes a better understanding of the entire process of a consumers’ purchase decision involving a durable and high involvement product. However, this research has some important limitations which could be categorized into four points: 1) cross-sectional survey data collection method; 2) one product category; 3) segmentation of the population; and 4) measurement of sales service quality. Limitation 1: Cross-Sectional Survey Data Collection Method
Even though the cross-sectional survey data were collected from two groups, recent and prospective home buyers, the results may provide a snapshot of each group of customers since pre- and post-purchase samples are different persons. Although the value formation and decision process of each group can be investigated and compared, the entire decision process of one individual buyer could not be tracked. Thus, the limitation of each dataset could not be overcome.
Replicated research using a longitudinal survey should be conducted in the future. A panel study may be designed by collecting data from the same samples of

285
consumers over a period of time (Zigmund, 2003) when they start thinking of buying a house until they choose their final choice or cancel their home buying idea. Such a longitudinal study would provide more understanding on the entire process of consumers’ purchase decision. The data collection should start from how each individual customer searches for data, forms his/her consideration set, how choice is valued, and why a certain customer chooses a final choice. The longitudinal survey data may assess to what degree the value influencing constructs are weighted in each stage of the purchase decision and also post-purchase reaction. Thus, the entire process of value formation and choice selection could be examined. Limitation 2: One Product Category
Since the focus of this research is one industry, real estate, the generalizability of the findings to other product categories should be made with care. There is no doubt that the research findings can be applied in explaining a complex decision i.e. purchasing a durable and high involvement product, not consumer products or services. The effects of product quality and perceived risk may be not different among product categories but the strong indirect effects on value of sales service quality and brand equity may be specific for the home buying context. For other durable product such as automobiles, the technical knowledge and car performance testing information are widely distributed in car magazines and the quality assurance of the product and production is more systematic than that of housing products. Therefore, the mediating effects of relationship quality, i.e. trust, commitment, and satisfaction may be less when buying an automobile than buying a house. Hence, to extend the understanding of the purchase decision process to other products, there is a need to assess the importance and the effect of relationship quality. Limitation 3: Segmentation of the Population
This research does not investigate an individual’s value formation and decision process, but rather measures the collective perceptions of a group of buyers.

286
For instance, it does not account for heterogeneity across home buyers. The categorization of the home buyers by premium and non-premium brands and price level of the product they have selected might be too limited to provide understanding of all types of buyers. For example, the buyers may select their choice based on their financial, social, and family and other types of constraints. On the other hand, some buyers may create their consideration set based on their personal favors and life styles. Thus, their consideration set may be limited by these reasons. Although the choice they finally chose is the highest value choice, that choice is selected from a limited consideration set. To understand the effects of personal constrains, the buyers would be segmented based on their personal constraints, psychographic characteristics, and life styles. Limitation 4: Measurement of Sales Service Quality Finally, certain limitations regarding the measurement of the constructs also need to be addressed. Sales service quality is only measured as one factor in this research. Since the findings indicated the importance of sales service quality that strongly but indirectly impact product value via personal trust in salespersons, the five dimensions of sales service quality including tangibility, reliability, assurance, responsiveness, and empathy should be emphasized. Future research could incorporate additional items to measure all dimensions of service quality to ensure that the full domain of the rather complex constructs is captured. The measurement of service quality in details would offer better insights into how sales service quality enhances personal trust which, in turn, influences perceived value of the product. Suggestions for Future Research Based on the limitations of this research, suggestions for related future research could be as follows:

287
1. The longitudinal survey research designed to collect data from the same sample of consumers over a period of time can be conducted. It would be very fruitful to investigate all stages of the decision process. The data collection should start from how each individual customer searches for the data, forms his/her consideration set, how he/she values each choice, and why a certain customer chooses a final choice to assess the entire process of the purchase decision of an individual person.
2. More than one product category can be focused on in the future research. The comparisons of the purchase decision processes of the same buyers in different buying situations would provide an advanced understanding and generailizability of the research findings.
3. Target population can be segmented based on the buyers’ personal constraints, psychographic characteristics, and life styles to understand the purchase decision of all types of buyers. The consideration set and value formation process can be compared and contrasted. Also, future research should focus on the non-buying customer i.e. the prospective buyers who end their purchase intention without any choice selection. The reasons why these prospective buyers give up their purchasing intention are important and should be identified.
4. A research study that focuses on the sophisticated details of sales service quality and personal trust can be conducted in the future. The tool designed to measure sales service quality and trust in salespersons in detail should provide better insights of what and how sales service quality induces trust which in turn enhances value and choice selection.

288
REFERENCES Aaker, D. and Keller, K. (1990). Consumer Evaluations of Brand Extensions. Journal of
Marketing. 54(1) 27–41. Aaker, D. (1991). Managing Brand Equity: Capitalizing on the Value of a Brand Name.
New York: The Free Press. Agency for Real Estate Affairs (1995). A Comprehensive Survey of BMR Unoccupied
Housing. Bangkok: Agency for Real Estate Affairs. __________. (1998). A Comprehensive Survey of BMR Unoccupied Housing. Bangkok:
Agency for Real Estate Affairs. __________. (1999). Thailand Property Outlook 1999. Bangkok: Agency for Real Estate Affairs. __________. (2005). Housing Market Mid-2005. Bangkok: Agency for Real Estate Affairs. Albaum G. and Herche, J. (1995). Decision Making Style Influences on the Evaluation
and Use of Information by Managers. Journal of Marketing Theory and Practice. 3(2), 1-19.
Alden, D., Douglas M., and Wayne D. (1994). The Evaluation Strategies of American and Thai Consumers: A Cross-Cultural Comparison. Psychology and Marketing. 11 (2), 145-162.
Allen, J., Harrell, G. and Hutt, M. (1976). Price Awareness Study, Washington, DC: Food Marketing Institute
American Marketing Association (2006). Dictionary of Marketing Terms. Available at http://www.marketingpower.com. Retrieved on November 5, 2005.
Anderson E. and Sullivan M. W. (1993). The Antecedents and Consequences of Customer Satisfaction for Firms. Marketing Science. 12 (2), 125- 142.
Anderson, E. and Weitz B. (1989). Determinants of Continuity In Conventional Industrial Channel Dyads. Marketing Science 8 (Fall), 310-323.
Anderson, J. and Gerbing, D. (1988). Structural Equation Modeling in Practice: A Review and Recommended Two-Step Approach. Psychological Bulletin, 103, 411-423.
Anderson J. and Narus J. (1990). A Model of Distributor Firm and Manufacturer Firm Working Partnerships. Journal of Marketing. 54 (1), 42-58.
__________. (1999). Business Market Management: Understanding, Creating, and Delivering Value. Upper Saddle River, NJ: Prentice-Hall.
289
Andreasen, A. (1968). Attitudes and Customer Behavior: A Decision Model. In H. H. Kassarjian and T. S. Robertson (Eds.), Perspectives in Consumer Behavior, Glenview, IL: Scott, Foresman and Company.
Arbuckle, J. and Wothke W. (1999), Amos 4.0 User's Guide. Chicago: Smallwaters. Arnold, M. and Reynolds K. (2003). Hedonic Shopping Motivations. Journal of Retailing,
79(2), 77-95. Aronson, E. (1997). Back to the Future. Retrospective Review of Leon Festinger's - A
Theory of Cognitive Dissonance. American Journal of Psychology, 110 (Spring), 127-137.
Augoustinos, M. and Walker, I. (1995). Social Cognition. California and London: Sage Publications Inc.
Babin, B. and Darden, W. (1995). Consumer Self-Regulation in a Retail Environment. Journal of Retailing. 71 (1), 47-70.
Baker, J., Parasuraman, A., Grewal, D., and Voss, B. (2002). The Influence of Multiple Store Environment Cues on Perceived Merchandise Value and Patronage Intentions. Journal of Marketing. 66 (2), 120-141.
Bangkok Business News. (2006). The Decline of Thai Real Estate Market Value in the First Trimester of 2006. Published on March 31, 2006.
Barlow, H. (1992). The Social Role of Consciousness: Commentary on Bridgman on Consciousness. Psycholoquy. 3(19), 4.
Baron, R. and Kenny, D. (1986). The Moderator-Mediator Variable Distinction in Social Psychological Research: Conceptual, Strategic, and Statistical Considerations. Journal of Personality and Social Psychology. 51, 1173-1182.
Bagozzi, R. and Yi. Y. (1988). On the Evaluation of Structural Equation Models. Journal of the Academy of Marketing Science 16, 74-94.
Baryla, E. and Zumpano L. (1995). Buyer Search Duration in the Residential Real Estate Market. Journal of Real Estate Research. 10 (1), 1-13.
Bauer, R. (1960). Consumer behavior as risk taking. in Hancock, R.S. (Eds), Dynamic Marketing for a Changing World, Proceedings of the 43rd Conference of the American Marketing Association, 389-398.
Bauer, R. and Cox, D. (1967). Rational vs. Emotional Communications: A New Approach. In Cox, D.F. (Eds), Risk Taking and Information Handling in Consumer Behavior. Boston: Harvard University.

290
Baum A. (1994). Quality and Property Performance. Journal of Property Valuation and Investment. 12(1), 31-46.
Beatty, S. and Smith, S. (1987). External Search Effort. Journal of Consumer Research. (14) 1, 83-95.
Beauvois, J. and Joule, R. (1996). A Radical Dissonance Theory. Bristol, PA: Taylor & Francis Inc.
Bendapudi, N. and Berry, L. (1997). Customers' Motivations for Maintaining Relationships with Service Providers. Journal of Retailing. 73(1), 15-37.
Bender, A., Din, A., Hoesli, M., and Brocher ,S. (2000).Environmental Preferences of Homeowners: Further Evidence Using the AHP Method. Journal of Property Investment and Finance. 18 (4), 445-455.
Bender, A., Din, A., Favarger, P., Hoesli, M., and Laakso, J. (1997). An Analyses of Perceptions Concerning Environmental Quality of Housing in Geneva. Urban Studies. 34 (3), 503-13.
Bender, A., Din, A., Hoesli, M., and Laakso, J. (1998). Environmental Quality Perceptions of Urban Commercial Real Estate. Journal of Property Research. 17 (3), 280-296.
Bentler P. and Bonette, D. (1980). Significance Tests and Goodness of Fit in the Analysis of Covariance Structures. Psychological Bulletin. 88, 588-606
Bentler, P. (1990). Comparative Fit Indexes in Structural Models. Psychological Bulletin, 107, 238-246.
Bentler, P. (1992). On the Fit of Models in Structural Models. Psychological Bulletin, 112(3), 400-404.
Bennett, R., and Gabriel, H. (2001) Reputation, Trust and Supplier Commitment: the Case of Shipping Company/Seaport Relations. Journal of Business and Industrial Marketing, 16 (6), 424-38.
Beron. K., Hanson, Y., Murdoch, J., and Thayer, M. (2001). Hedonic Price Functions and Spatial Dependence: Implications for the Demand for Urban Air Quality. in Anselin, L. Florax, R. Eds. New Advances in Spatial Econometrics. New-York: Springer-Verlag.
Berry, L. and Parasuraman, A. (1992). Prescriptions for a Service Quality Revolution in America. Organizational Dynamics. 20 (4), 5-15
Berry, L. and Parasuraman, A. (1992). Marketing Services: Competing Through Quality. New York: The Free Press.

291
Berry, L., Zeithaml, V, and Parasuraman, A. (1985). Quality Counts in Services Too. In Lovelock. Managing Services: Marketing, Operations, and Human Resources, NJ: Prentice-Hall, 1988.
Bettman, J. (1973). Perceived Risk and Its Components: A Model and Empirical Test. Journal of Marketing Research. 10 (May), 184-190.
__________. (1979). An Information Processing Theory of Consumer Choice. MA: Addison Wesley.
Bettman, J., and Park C. W. (1980). Effects of Prior Knowledge and Experience and Phase of the Choice Process on Consumer Decision Analysis: A Protocol Analysis. Journal of Consumer Behavior. (7) 234–248.
Bettman, J. and Sujan, M. (1987). Effects of framing on evaluation of comparable and non-comparable alternatives by expert and novice consumers. Journal of Consumer Research. 14 (2), 141-154.
__________. (1987). Research in Consumer Information Processing. Review of Marketing. 197-235.
Bettman, J., Luce M., and Payne, J. (1998). Constructive Consumer Choice Processes. Journal of Consumer Research 25, 187–217.
Blackston, M. (1992). A Brand with an Attitude: A Suitable Case for the Treatment. Journal of the Market Research Society. 34 (3), 231-241.
Blaschuk, M. (2006). Marketing of Real Property Using the Internet: Supply Driven Models to Demand Driven Models. Available at http://www.thaiappraisal.org. Retrieved on March 31, 2006.
Bloch, P. and Richins, M. (1983). A Theoretical Model for the Study of Product Importance Perceptions. Journal of Marketing. 47 (summer), 69-81.
Blois, K. (2003). Using Value Equations to Analyze Exchanges. Marketing Intelligence and Planning. 21(1), 16-22.
Bollen, K.A. (1989). A New Incremental fit index for general Structural Equation Models. Sociological Methods and Research. 17, 303-316.
Bolton, R.N. (1998). A Dynamic Model of the Duration of the Customer's Relationships with a Continuous Service Provider: The Role of Satisfaction. Marketing Science. 17(1), 45-65.
Bolton, R.N. and James H. D. (1991). A Multistage Model of Customers' Assessments of Service Quality and Value. Journal of Consumer Research. 17(4), 375-384.
292
Boyle, M. and Kiel, K. (2001). A Survey of House Price Hedonic Studies of the Impact of Environmental Externalities. Journal of Real Estate Literature. 9, 117 – 144.
Brehm, J. and Cohen, A. (1962). Explorations in Cognitive Dissonance. New York and London: John Wiley & Sons
Brehm, J. and Wicklund, R. (1976). Perspectives on Cognitive Dissonance. Hillsdale, New Jersey: John Wiley & Sons.
Broekhuizen, T. (2006). Understanding Channel Purchase Intentions: Measuring Online and Offline Shopping Value Perceptions. Dissertation, University of Groningen.
Brown, S. and Bond, E. (1995). The Internal Market/External Market Framework and Service Quality: Toward Theory in Services Marketing. Journal of Marketing Management. 11 (1-3), 25-39.
Byrne, B. (2001). Structural Equation Modeling with AMOS, Basic Concepts, Applications, and Programming. Hillsdale, New Jersey: Lawrence Erlbaum Associates.
Capon, N., and Kuhn, D., (1982). Can Consumers Calculate Best Buys? Journal of Consumer Research. 8 (March), 449-453.
__________. (2004). What's So Good About Problem-Based Learning?. Cognition and Instruction. 22 (1) 61-79.
Chandon, P., Morwitz V.G., and Reinartz W.J. (2005). Do Intentions Really Predict Behavior? Self-Generated Validity Effects in Survey Research. Journal of Marketing, 69(2), 1-14.
Chaudhuri, A. and Holbrook, M. (2001). The Chain of Effects from Brand Trust and Brand Affect to Brand Performance: The Role of Brand Loyalty. Journal of Marketing, 65 (2), 81-93.
Choffee, S. and McLeod, J. (1973). Consumer Decisions and Information Use", in Ward, S., Robertson, T.S. (Eds). Consumer Behavior: Theoretical Sources, Englewood Cliffs, NJ: Prentice-Hall.
Choi, S., Stahl, D., and Whinston, A. (1997). The Economics of Electronic Commerce. Indianápolis: McMillan Technical Publishing.
Christopher, M. (1996). From Brand Values to Customer Value. Journal of Marketing Practice: Applied Marketing Science, 2(1), 55-66.
Churchill, G.A. (1999). Marketing Research Method Foundations. 7th ed. Marketing New York: The Dryden Press.

293
Churchill LL, G and Iacobucci, D. (2002). Marketing Research: Methodological Foundations. 8th ed. London. Harcourt Publishing.
Clark, L. A., and Watson, D. B. (1995). Constructing Validity: Basic Issues in Scale Development. Psychological Assessment. 7, 309-319.
Cobb-Walgren, C., Beal, C., and Donthu, N. (1995). Brand Equity, Brand Preferences, and Purchase intent. Journal of Advertising. 24 (3) 25-40.
Colias, J. (2005). Choice Modeling Analytics–Benefits of New Methods. White paper, Decision Analysts Inc. Available at http://www. decisionanalyst.com. Retrieved on January 5, 2006.
Comrey, A. and Lee H. (1992). A First Course in Factor Analysis. Hillsdale, NJ: Erlbaum. Cooper, J. and Fazio, R. (1984). A New Look at Dissonance Theory. In L. Berkowitz
(Ed.), Advances in Experimental Social Psychology. (17), 229-264. Orlando, FL: Academic Press
Cronin, J., Brady, M., and Hult, G. (2000). Assessing the Effects of Quality, Value, and Customer Satisfaction on Consumer Behavioral Intentions in Service Environments. Journal of Retailing 72 (2), 193-218.
Cronk, D. (2000). The Importance of Young Home Buyers. Real Estate News and Advice. Available at http://realtytimes.com. Retrieved on March 20, 2006.
Crosby, P. (1979). Quality is Free. New York: McGraw-Hill. __________. (1990). Leading. New York: McGraw-Hill. Crosby, L., Evans, K., and Cowles, D. (1990). Relationship Quality in Services Selling: An
Interpersonal Influence Perspective. Journal of Marketing. 54 (3). 68-81. Dabholkar, P. and Bagozzi R. (2002). An Attitudinal Model of Technology-Based Self-
Service: Moderating Effects of Consumer Traits and Situational Factors. Journal of the Academy of Marketing Science. 30(3), 184-201.
Dabholkar, P. and Overby, J. (2005). Linking Process and Outcome to Service Quality and Customer Satisfaction Evaluations: An Investigation of Real Estate Agent Service. International Journal of Service Industry Management. 16 (1), 10-27.
Dabholkar, P., Shepherd C., and Thorpe D. (2000). A Comprehensive Framework for Service Quality: An Investigation of Critical Conceptual and Measurement Issue Through a Longitudinal Study. Journal of Retailing. 76(2), 139-172.
294
Dabholkar, P., Thorpe, D., and Rentz, J. (1996). A Measure of Service Quality for Retail Stores: Scale Development and Validation. Journal of the Academy of Marketing Science. 24 (1), 3-16.
De Ruyter, K., Wetzels, M., and Bloemer, J. (1997). The Dynamics of the Service Delivery Process: a Value-Based Approach. International Journal of Research in Marketing. 14, 231-243.
Desarbo, W., Jedidi, K., and Sinha, I. (2001). Customer Value Analysis in a Heterogeneous Market. Strategic Management Journal, 22, 845-857.
Dholakia, U. (2000). Temptation and Resistance: An Integrated Model of Consumption Impulse Formation and Enactment. Psychology and Marketing, 17, 955-882.
__________. (2001). A Motivational Process Model of Product Involvement and Consumer Risk Perception. European Journal of Marketing. 35 (11/12), 1340-1360.
Dholakia, N. and Zwick D., (2001) “Privacy and Consumer Agency in the Information Age: Between Prying Profilers and Preening Webcams. Journal of Research for Consumers, 1 (1), 2001.
Diamantopoulos, A., and Winklhofer, H. (2001). Index Construction with Formative Indicators: An Alternative to Scale Development. Journal of Marketing Research. 38 (May), 269-277.
Dibb, S. (1994). Modeling in New Housing Choice - An Application. Omega. 22 (6), 589-600. Dickson, P. and Sawyer, A. (1985). Point of Purchase Behavior and Price Perceptions of
Supermarket Shoppers. Working Paper, Marketing Science Institute. Dodds, W. and Lewis, C. (1995). Market Cues Affect on Consumers’ Product
Evaluations. Journal of Marketing 3 (2), 50-63. Dodds, W. and Monroe, K. (1985). The Effect of Brand and Price Information on Subjective
Product Evaluations. Advances in Consumer Research. 12, 85-90. Dodds, W., Monroe, K. and Grewal, D (1991), Effects of Price, Brand and Store
Information on Buyers Product Evaluation. Journal of Marketing Research. 28, 307-319.
Doney, P. and Cannon, J. ( 1997). An Examination of the Nature of Trust in Buyer-Seller Relationships. Journal of Marketing. 61 (2), 35-51.
Donthu, N. (1999). The Internet Shopper. Journal of Advertising Research. 39, 52-58.

295
Dorsch, M., Scott, R., and Kelley, S. (1998). The Role of Relationship Quality in the Stratification of Vendors as Perceived by Customers. Journal of the Academy of Marketing Science. 26 (2), 128-42.
Duman, T. (2002). A model of Perceived Value for Leisure Travel Product. Dissertation. The Pennsylvania State University.
Duncan , J. and Ley, D. (1993). Place/Culture/Representation. London : Routledge. Dwyer, F., Schurr, P., and Oh, S. (1987). Developing Buyer-Seller Relationships. Journal
of Marketing. 51 (2), 11-27. Eccles, R. G. and Pyburn, P. J. (1992). Creating a Comprehensive System to Measure
Performance. Management Accounting. 74 (4), 41-44. Engel, J.F., Kollat, D.T, & Blackwell, R.D. (1968). Consumer Behavior. New York: Holt, Rinehart & Winston. Engel, J., Blackwell, R., and Miniard, P. (1995). Consumer Behavior. Fort Worth, TX:
Harcourt Brace College Publishers: The Dryden Press. Filion, P, Bunting, T, and Warriner, K. (1999). The Entrenchment of Urban Dispersion:
Residential Preferences and Location Patterns in the Dispersed City. Urban Studies. 36, 1317-1347.
Fishbein, M. and Ajzen, I. (1975). Belief, Attitude, Intention and Behavior: An Introduction to Theory and Research. Reading, MA: Addison-Wesley.
Flint, D. and Woodruff, R. (2001). The Initiators of Changes in Customers’ Desired Value. Industrial Marketing Management. 30 (4), 321-337.
Fornell C., and Larcker, D. F. (1981). Evaluating Structural Equation Models with Unobservable Variables and Measurement Error. Journal of Marketing Research, 18(1), 39-50.
Forster, E. (2001) Migration and Housing Choice Survey. Edinburgh: Napier University. Gabriel S. (2001). The Decision to Own. Mortgage Banking. 62 (1), 102-107. Gao, T. (2003). Effects of Relationship Quality on Customer Perceived Value in Organizational
Purchasing. Dissertation, Virginia Polytechnic Institute and State University Garson D.G. (2006). Statistics Solutions: Structural Equation Modeling SEM. Available at
http://www.statisticssolutions.com. Retrieved on August 1, 2006. Garvin, D. (1983). Quality on the Line. Harvard Business Review. 61 (5), 65-73. __________. (1987). Competing on the Eight Dimensions of Quality. Harvard Business
Review. 65 (6), 101-09.

296
Gerbing, D. and Anderson, J. (1984). On the Meaning of Within-Factor Correlated Measurement Errors. Journal of Consumer Research. 11: 572-580.
Gerbing, D., Hamilton, J. and Freeman, E. (1994). A Large-Scale Second-Order Structural Equation Model of the Influence of Management Participation on Organizational Planning Benefits. Journal of Management. 20 (Winter), 1-19.
George, J. and Jones, G. (2005). Understanding and Managing Organizational Behavior. 4th ed. Upper Saddle River, NJ: Pearson Prentice Hall.
Gibler, K. and Nelson, S. (2003). Consumer Behavior Applications to Real Estate Education. Journal of Real Estate Practice and Education. 6 (1) 63-84.
Gilbride, T. and Allenby, G. (2004). A choice model with conjunctive, disjunctive, and compensatory screening rules. Marketing Science. 23 (3), 391–406.
Glaeser, E. and Gyourko, J. (2003), “The Impact of Building Restrictions on Housing Affordability”, Federal Reserve Bank of New York Economic Policy Review, 9 (2), 21-39.
Glaeser, E., Gyourko, J. and Hilber, C. (2001). Housing Affordability and Land Prices: Is There a Crisis in American Cities? (First Draft: December 12, 2001). Available at http://personal.lse.ac.uk. Retrieved on February 8, 2006.
Greatorex, M. and Mitchell, V-W. (1993). Developing the Perceived Risk Concept. Emerging Issues in Marketing. In Davies, M, et al, (Eds), Proceedings, Marketing Education Group Conference (405-415). Loughborough.
Grether, R. and Wilde, D. (1984). An Analysis of the Conjunction Choice: Theory and Experiments. Journal of Consumer Research 10 (4), 373-385.
Grönroos C. (1978). A Service Oriented Approach to Marketing of Services. European Journal of Marketing, 12 ( 8), 588 – 601.
__________. (1982). Strategic Management and Marketing in the Service Sector. Hellingfors: Swedish School of Economics and Business Administration.
__________. 1997. "Value-Driven Relational Marketing: From Products to Resources and Competencies. Journal of Marketing Management. 13, 407-419.
Gummesson, E (1987). The New Marketing – Developing Long-Term Interactive Relationships. Long Range Planning. 20 (4), 10–20.
__________. (1994). Making Relationship Marketing Operational. International Journal of Service Industry Management. 5 (5), 5-20.
297
Gundlach, G., Ravi, T. Achrol, S. and Mentzer, J. (1995). The Structure of Commitment in Exchange. Journal of Marketing, 59 (1), 78-92
Gwinner, K., Gremler, D. and Bitner, M. (1998). Relational Benefits in Services Industries: The Customer’s Perspective. Journal of the Academy of Marketing Science. 26 (2), 101-114.
Hair, J. Anderson, R., Tatham, L. and Black, W. (1998). Multivariate Data Analysis. Sydney: Prentice Hall.
Harmon-Jones, E. and Mills, J. (1999). Cognitive Dissonance Progress on a Pivotal Theory in Social Psychology. Washington, D.C.: Braun Brumfield, Inc.
Hanna, N., and Wozniak, R. (2001). Consumer Behavior: An Applied Approach. Upper Saddle River, NJ: Prentice Hall.
Harris, J. (2001). First time buyers are keys, Tierra Grande. The Real Estate Center Journal. Available at http://recenter.tamu.edu. Retrieved on November 2, 2005.
Hauser, B. (1990). An Evaluation Cost Model of Consideration Sets. Journal of Consumer Research. 16 (March), 393-408.
Hawkins, D., Best, R., and Coney, K. (2001). Consumer Behavior. 8th ed. Boston: McGraw-Hill.
__________. (2003). Consumer Behavior. 9th ed. Boston: McGraw-Hill. Hennig-Thurau T. and Klee A. (1997). The Impact of Customer Satisfaction and
Relationship Quality on Customer Retention: A Critical Reassessment and Model Development. Journal of Psychology and Marketing. 4 (8), 737–764.
Hennig-Thurau, T. and Hansen, U. (2000). Relationship Marketing: Gaining Competitive Advantage through Customer Satisfaction and Customer Retention. New York: Springer.
Hennig-Thurau, T., Gwinner, K., and Gremler, D. (2002). Understanding Relationship Marketing Outcomes: An Integration of Relational Benefits and Relationship Quality. Journal of Service Research 4 (3), 230-247.
Heskett, J., Sasser, W. and Schlesinger, L. (1997). The Service Profit Chain: How Leading Companies Link Profit and Growth to Loyalty, Satisfaction and Value. New York: The Free Press.

298
Ho, D., Newell, G., and Walker, A. (1995). The Importance of Property Specific Attribute in Assessing CBD office quality. Journal of Property Investment and Finance. 23 (5) 424-444.
Hoffman, D., Novak, T. and Peralta, M. (1999). Information Privacy in the Marketspace: Implications for the Commercial Uses of Anonymity on the Web. Information Society. 15 (2), 129-139.
Holbrook, M. (1994). The Nature of Customer Value: An Axiology of Services in the Consumption Experience. in Rust and R. L. Oliver, (eds), Service Quality: New Directions in Theory and Practice, Thousand Oaks, CA: Sage
Holbrook, M. (1996). Customer Value: A Framework for Analysis and Research. Advances in Consumer Research. 23(1), 138-142.
__________. (1999). Consumer Value: A Framework for Analysis and Research. New York, NY: Routledge.
Houghton Mifflin Company (2004). The American Heritage Dictionary of the English Language. Available at http://www.answers.com/ Retrieved on November 1, 2005.
Hoyer, W. (1984). An Examination of Consumer Decision Making for a Common Repeat Purchase. Journal of Consumer Research. 11, 822-829.
Hu, L. and Bentler P.M. (1999). Cutoff Criteria for Fit Indexes in Covariance Structural Analysis: Conventional Criteria versus New Alternatives. Structural Equation Modelin. 6(1), 1-55.
Huang J. and Palmquist, R. (2001). Environmental Conditions, Reservation Prices, and Time on the Market for Housing. Journal of Real Estate Finance and Economics. 22 (2/3), 206-219.
Infosino, W.J. (1986). Forecasting New Product Sales From Likelihood of Purchase Ratings. Marketing Science. 5(Fall), 372-384.
Jacoby, J., and Kaplan, L. (1972). The Components of Perceived Risk. In: Venkatesh, M. (Ed.). Proceedings of the Third Annual Conference of the Association for Consumer Research.
Jacoby, J. and Hoyer, W. (1989). The Comprehension/Miscomprehension of Print Communication: Selected Findings. Journal of Consumer Research. 15 (March), 434-443.

299
Jarvenpaa, S. and Tractinsky, N. (1999). Consumer Trust in an Internet Store: A Cross Cultural Validation. Journal of Computer-Mediated Communication. 1 (1, 2), 45-71.
Jarvis, C.B., MacKenzie S.B., and Podsakoff P.M. (2003). A Critical Review of Construct Indicators and Measurement Model Misspecification in Marketing and Consumer Research. Journal of Consumer Research. 30(2), 199-218.
Johnson, J. (1999). Strategic Integration in Industrial Distribution Channels: Managing the Interfirm Relationship as a Strategic Asset. Academy of Marketing Science. 27 (1), 4-18
Jones, E. (1985). Major Developments in Social Psychology During the Past Five Decades. In G. Lindsey & E. Aronson (Eds), The Handbook of Social Psychology . 3rded. (pp. 47-108). New York: Random House.
Juran, J. (1988). Juran on Planning for Quality. New York: Free Press. Juran, J. and Gryna, F. (1980). Quality Planning and Analysis. New York, NY: McGraw-Hill. Kahneman, D. and Tversky, A. (1979): Prospect Theory: An analysis of decision under
risk. Econometrica. 47 (2), 263-292. __________. (1996). On the Reality of Cognitive Illusions. Psychological Review 103, 582–591. __________. (2000). Choices, Values, and Frames. New York: Cambridge University Press. Karahanna, E., Straub D.W., and Chervany N.L. (1999). Information Technology Adoption
across Time: A Cross-Sectional Comparison of Pre-Adoption and Post-Adoption Beliefs. MIS Quarterly. 23(2), 183-213.
Kahneman, D., Slovic, P. and Tversky, A. Eds. (1982). Judgment under Uncertainty: Heuristics and Biases. New York: Cambridge University Press.
Kasikorn Research Center (2006). Real Estate Industry Outlook, 2006: Slowing Steadily. Published on January 18, 2006.
Kasinpila, Borisud . (2004). Ready Made housing Product: An Advantage or Burden? Business Thai Newspaper. Published on July 10, 2004.
Katharangsiporn, Kanjana. (2005). Property outlook for the second half of 2005: Sales steady but prices to drop. Thai Appraisal Foundation. Available at http://www.thaiappraisal.org. Retrieved on February 3, 2006.
Kaynak, E. (1985). Transfer of Technology from Developed to Developing Countries: Some Insights from Turkey. In Samli A. (Ed.) Technology Transfers. New York: Quorum Books.

300
Keller, K. (1993). Conceptualizing, Measuring, and Managing Customer-Based Brand Equity. Journal of Marketing. 57, 1–22.
Keller, K. (2001). Building Customer Based Brand Equity. Marketing Management, 10 (2), 16-26.
Kelloway, E. K. (1998). Using LISREL for Structural Equation Modeling: A Researcher’s Guide. Thousand Oaks, CA: Sage.
Kenny, D.A., Kashy, D.A. and Bolger, N. (1998). Data Analysis in Social Psychology. In D. Gilbert, S. T. Fiske, & G. Lindzey (Eds.), Handbook of Social Psychology (4th Ed.) (pp. 233-265). New York: McGraw-Hill.
Kerin, R. and Sethuraman, R. (1998). Exploring the Brand Value-Shareholder Value Nexus for Consumer Goods Companies. Journal of the Academy of Marketing Science, 26 (4), 260-273.
Kiel, G, and Layton, R. (1981). Dimensions of Consumer Information Seeking Behavior. Journal of Consumer Research. 18(May), 233-239.
Kiesler, C. (1971). The Psychology of Commitment. New York: Academic Press Kim, C., Lavack, A., and Smith, M. (2001). Consumer Evaluation of Vertical Brand
Extensions and Core Brands. Journal of Business Research. 52, 211-222. Kim, H., Kim, W., and An, J. (2003). The Effect of Consumer-Based Brand Equity on Firm
Financial Performance. Journal of Consumer Marketing 20 (4) 335-351. Kim, J. Mueller, C. (1978). Factor Analysis: Statistical Methods and Practical Issues.
London: Sage Publishing. Kothandaraman, P. and Wilson, D. (2001). The Future of Competition: Value Creating
Networks. Industrial Marketing Management. 30 (4), 379-389. Kline, R. (1998). Principles and Practice of Structural Equation Modeling. New York: The
Guilford Press. Kotler, P. (1994). Principles of Marketing. Englewood Cliffs, NJ: Prentice-Hall. __________. (1997). Marketing Management: Analysis, Planning, Implementation and
Control. Upper Saddle River, NJ: Prentice Hall. __________. (2000). Marketing Management, 10th ed. New Jersey: Pearson Education. __________. (2003). Marketing Management. 11th ed. New Jersey: Pearson Education. Kotler P, and Armstrong, G, (1999). Principles of marketing. 8th edition, New Jersey:
Prentice-Hall International.

301
Lancaster, K. (1966). A New Approach to Consumer Theory. Journal of Political Economics 74, 132-157.
Lapierre, J. (2000). Customer-Perceived Value in Industrial Contexts. Journal of Business and Industrial Marketing.15 (2/3), 122-140.
LaPierre, J., and Deneault, D. (1997). Customer Perceived Value: A Demand-Side View of Its Antecedents and Outcomes in High Technology. Proceedings of the Annual Conference – European Marketing Academy.
Laroche, M., Bergeron, J., and Goutaland, C. (2003). How Intangibility Affects Perceived Risk: The Moderating Role of Knowledge and Involvement. Journal of Services Marketing. 7 (2), 122-140.
Laurent, G., and Kapferer, J. (1985). Measuring Consumer Involvement Profiles. Journal of Marketing Research. 22 (2), 42-53.
Layne, D. (2002) The State of Valuation in Thailand. The Appraisal Journal, LXX (3). Available at http://www.thaiappraisal.org. Retrieved on December 1, 2005.
Leggett, C. and Bockstael, N. (2000). Evidence on the Effects of Water Quality on Residential Land Prices. Journal of Environmental Economics and Management. 39, 121-144.
Lehtinen, U., Lehtinen, J. (1991). Two Approaches to Service Quality Dimensions. The Service Industries Journa. 11, (July) 287-303.
Lemmink, J., De Ruyter, K., and Wetzels, M. (1998). The Role of Value in the Delivery Process of Hospitality Services. Journal of Economic Psychology. 19 (2): 159-177.
Liljander, V., and Strandvik, T. (1995). The nature of customer relationship in services. In Swartz, T., Bowen, E. and Brown, S. (Eds.). Advances Service Marketing and Management. 4, 10–17.
Lin, C. and Ding, C. (2005). Opening the Black Box: Assessing the Mediating Mechanism of Relationship Quality and the Moderating Effects of Prior Experience in ISP Service. International Journal of Service Industry Management. 16 (1), 55-80.
Lin, H. and Liu, C. (2006). Key Factors Affecting Cell Phone Purchase Decisions by Young Chinese Consumers. Presented at PTC’06 Conference (Pacific Telecommunication Council), Honolulu, January 2006.

302
Locander, W. and Hermann, P. (1979). The Effect of Self Confidence and Anxiety on Information Seeking in Consumer Risk Reduction. Journal of Marketing Research. 16 (May), 268-274.
Macintosh, G. and Lawrence S. (1997). Retail Relationships and Store Loyalty: A Multi-Level Perspective. International Journal of Research in Marketing. 14 (5), 487-497.
MacCallum, R., Roznowski M., and Necowitz L. (1992). Model Modifications in Covariance Structure Analysis: The Problem of Capitalization on Chance. Psychological Bulletin. 111(3), 490-504.
Maclennan, D. and Yong, T. (1996). Economic Perspective on the Structure of Local Housing Systems. Housing Studies. 11 (3), 387–400.
MacKinnon D.P., Lockwood C.M., Hoffman J.M., West S.G., and Sheets V. (2002). A Comparison of Methods to Test Mediation and Other Intervening Variable Effects. Psychological Methods. 7(1), 83-104.
MacLeod, C. (2000). Does Your Brand Need a Makeover? Marketing. 21 (September), 24-27. Maruyama, G. M. (1998). Basics of Structural Equation Modeling. Thousand Oaks, CA:
Sage. Mayer, R., Davis, J., and Shoorman, F. (1995). An Integrative Model of Organizational
Trust. The Academy of Management Review. 20 (3), 709-734. Menon, A. Jaworski J.and. Kohli, A. (1997) “Product Quality: Impact of Interdepartmental
Interactions. Journal of the Academy of Marketing Science. 25 (3), 187-200. Millward Brown IntelliQuest's (2006). Customer Satisfaction and Loyalty Management
Research. Working paper. Available at http://www.intelliquest.com/ on January 7, 06
Mitchell, V-W. (1999). Consumer Perceived Risk: Conceptualisations and Models. European Journal of Marketing. 33(1/2), 163-195.
Mittal, V. and Kamakura W.A. (2001). Satisfaction, Repurchase Intent, and Repurchase Behavior: Investigating the Moderating Effect of Customer Characteristics. Journal of Marketing Research. 38(1), 131-142.
Monroe, K. (1990), Pricing: Making Profitable Decisions. 2nd ed. Boston: McGraw-Hill Moorman, C., Deshpandé, R., and Zaltman, G. (1992). Relationships between Providers
and Users of Market Research: The Dynamics of Trust Within and Between Organizations. Journal of Marketing Research. 29 (August), 314-28.

303
__________. (1993) Factors Affecting Trust in Market Research Relationships. Journal of Marketing. 57, 81-101.
Moorthy, S., Ratchford, B.T., and Talukdar, D. (1997). Consumer Information Search Revisited: Theoretical and Empirical Analysis. Journal of Consumer esearch. 23 (March), 263-277.
Morgan, R. and Hunt S. (1994). The Commitment-Trust Theory of Relationship Marketing. Journal of Marketing. 58 (7), 20-38.
Myers, C. (2003). Managing Brand Equity: A Look at the Impact of Attributes. The Journal of Product and Brand Management. 12 (1), 39-51.
Narayana, C. and Markin, R.(1975). Consumer Behavior and Product Performance: An Alternative Conceptualization. Journal of Marketing. 39 (October), 1-6.
Nelson A. Pendall R., Dawkins C., and Knaap G. (2002). The Link Between Growth Management and Housing Affordability: The Academic Evidence. The Brookings Institution Center on Urban and Metropolitan Policy, Available at www.brookings.edu/ on February 8, 2006.
Nunnaly, J. (1978). Psychometric Theory. 2nded. New York, NY: McGraw Hill. Nunnally, J. and Bernstein, I. (1994), Psychometric Theory, 3rded. New York: McGraw-Hill O’Brien, S. (2006). Interview – Buyer Decision Process. Available at
http://www.geocities.com/Sunday_aiu. Retrieved on Jan 14, 2006. Ozeki, K. and Asaka, T. (1990): Handbook of Quality Tools, The Japanese Approach.
Cambridge, MA: Productivity Press, Inc. Panda, T. (2003). Creating Customer Life Time Value through Effective CRM in Financial
Service Industry. Journal of Services Research, 2 (2), 157-171. Pappu, R., Quester, P., and Cooksey. R.(2005) Consumer-Based Brand Equity:
Improving the Measurement – Empirical Evidence. Journal of Product and Brand Management. 14 (3), 143-154.
Parasuraman, A. (1997). Reflections on Gaining Competitive Advantage Through Customer Value. Journal of the Academy of Marketing Science, 25(2), 154-
__________. (1998) Customer Service in Business-to-Business Markets: An Agenda for Research. Journal of Business and Industrial Marketing. 13 ( 4/5), 309-321.
Parasuraman A. and Grewal, D. (2000). Serving Customers and Consumers Effectively in the 21st Century: A Conceptual Framework and Overview. Journal of the Academy of Marketing Science. 28 (1), 9-16.

304
Parasuraman, A., Zeithaml, V. and Berry, L. (1985). A Conceptual Model of Service Quality and Its Implications for Future Research. Journal of Marketing. 49, 41-50.
__________. (1988). SERVQUAL: A Multiple-Item Scale for Measuring Consumer Perceptions of Service Quality. Journal of Retailing. 64 (1), 12–40.
Parik, A. and Weseley, A. (2005). The Effect of Price Level and Price Type on Perceptions of a Restaurant. Journal of Research for Consumer. 7, 1-9.
Perugini, M., and Bagozzi, R. (1999). The Role of Desires and Anticipated Emotions in Goal-directed Behaviors: Expanding and Deepening the Theory of Planned Behavior. Working Paper, University of Michigan.
Peter, J. (1981). Construct Validity: A Review of Basic Issues and Marketing Practices. Journal of Marketing Research. 18 (May), 133-145.
Peterson, R. (1994). A Meta-analysis of Cronbach`s Coefficient Alpha. Journal of Consumer Research, 21 (2), 381-391.
Peterson, R. (1995). Relationship marketing and the consumer. Journal of the Academy of Marketing Science. 23 (4), 278-281.
Pitta, D. and Katsanis, L. (1995). Understanding brand equity for successful brand extension. Journal of Consumer Marketing. 12 (4), 51-64.
Plaut, P. and Plaut, S. (2003). The inversion of the land gradient in the inner city of Haifa, Israel. Journal of Real Estate. (25) 4, 557-576.
Pornchokchai, Sopon (1985). Slum Dwellers: The Less-Privileged Segment of Urban Population, A Case of Bangkok Slum-and-Squatter Settlements. Presented at the Regional Seminar on Migrants and the Informal Sector, Jakarta, Indonesia.
__________. (2001). GIS and Modern Valuation Practices in Thailand. Paper presented at the Ninth World Valuation Congress, Singapore.
__________. (2002). Property Information Centre: An Intelligent Unit to Tackle with Real Estate Crisis in Thailand. Presented at the 2002 ASRES/AREUEA Joint International Conference, Seoul, Korea.
__________. (2004). The Real Estate Situation in the Bangkok Metropolitan Region, Thailand. Available at http://www.thaiappraisal.org. Retrieved on December 15, 2005.

305
Portnov, B. Odish, Y., and Fleishman L. (2005). Factors Affecting Housing Modifications and Housing Pricing: A Case Study of Four Residential Neighborhoods in Haifa, Israel. Available at http://sbaeweb.fullerton.edu. Retrieved on March 1, 2006
Prachachart Business Newspaper (2006). Statistical Report for Real Estate Investment. Published on February 2, 2006.
Punj, G. (1987). Pre-Search Decision Making in Consumer Durable Purchases. Journal of Consumer Marketing. 4 (Winter), 71-82.
Richarme, M.( 2005). Consumer Decision-Making Models, Strategies, and Theories, Oh My!. White paper, available at http://www.decisionanalyst.com. Retrieved on March, 2006.
Ravald, A., and Grönroos, C. (1996). The Value Concept and Relationship Marketing. European Journal of Marketing, 30 (2), 19-30.
Roberts K., Varki S., and Brodie R. (2003). Measuring the Quality of Relationships in Consumer Services: An Empirical Study. European Journal of Marketing. 37 (1/2), 169-196.
Roselius, E. (1971). Consumer Rankings of Risk Reduction Methods. Journal of Marketing. 35, 56-61.
Rossiter, J., (2002). The C-OAR-SE Procedure for Scale Development in Marketing. International Journal of Research in Marketing. (19) 305–335.
Rossiter, J. and Percy, L. (1987). Advertising and Promotion Management. New York: McGraw-Hill.
Rosiers, F. Thériault, M., and Ménétrier, L. (2005). Spatial Versus Non-Spatial Determinants of Shopping Center Rents: Modeling Location and Neighborhood - Related Factors. Journal of Real Estate Research. 27(3), 293-320.
Sabbahy,H., Ekinci, Y. and Riley, M. (2003). An Examination of Perceived Value Dimensions in the Hospitality Industry. Manuscript, .Available at http://www.ttra.com. Retrieved on November, 2005.
Sasser, W., Olsen, R., and Wyckoff, D. (1978), Management of Service Operations. Boston, MA: Allyn and Bacon.
Schurr, P. and Ozanne, J. (1985). Influences on Exchange Processes: Buyers’ Preconceptions of a Seller’s Trustworthiness and Bargaining Toughness. Journal of Consumer Research. 11 (March), 939-953.
306
Seiler, V., Webb, J., and Whipple, T. (2000). Assessment to Real Estate Brokerage Service Quality with a Practicing Professional’s Instrument. Journal of Real Estate Research. 20 (1/2), 105-117.
Sheth, J., Newman, B., and Gross, B. (1991). Why We Buy What We Buy: A Theory of Consumption Values. Journal of Business Research. 22 (2), 159-170.
Sheth, J. and Parvatiyar, A. (1995). Relationship Marketing in Consumer Markets: Antecedents and Consequences. Journal of the Academy of Marketing Science. 23 (4), 255-271.
Shiffman, L. and Kanuk, L. (2004). Consumer Behavior. 8thed. NJ: Pearson Education. Simon, C. and Sullivan, M. (1993). The Measurement and Determinants of Brand Equity:
A Financial Approach. Marketing Science. 12 (1), 28-52. Sinha, A. and Pappu, R. (1998). Parceling of the Sub Components of Consumer-Based
Brand Equity Using Factorial Survey: An Empirical Investigation in the New Zealand Consumer Electronics Sector. Presented at Australia New Zealand Marketing Academy Conference (ANZMAC), December, 1998.
__________. (1998). Measuring Brand Equity: An Application to the New Zealand Electronic Industry. Presented at Australia New Zealand Marketing Academy Conference (ANZMAC), December, 1998.
Sirdeshmukh, D., Singh J., and Sabol B. (2002). Consumer Trust, Value, and Loyalty in Relational Exchanges. Journal of Marketing. 66(1), 15-37.
Sjoberg, L. (1980). The Risks of Risk Analysis. Acta Psychologica. 45, 301-321. Smith, V. and Huang J. (1995). Can Markets Value Air Quality?: A Meta Analysis of Hedonic
Property Value Models. Journal of Political Economy. 103 (1), 209–327. Snoj, B., Korda, A. and Mumel A. (2004). The Relationships among Perceived Quality,
Received risk and Received Product Value. Journal of Product and Brand Management. 13 (3), 156-167.
Sobel, M. E. (1982). Asymptotic Intervals for Indirect Effects in Structural Equations Models. In S. Leinhart (Ed.), Sociological Methodology. (pp.290-312). San Francisco: Jossey-Bass.
Song, Y. and Knaap, G. (2004). Are Mixed Land Uses Marketable: Reexamining Consumers’ Preferences. Regional Science and Urban Economics. 34 (6): 663-680.
307
Spake, D. Beatty, S. Brockman, B., and Crutchfield, T. (2003). Consumer Comfort in Service Relationships: Measurement and Importance. Journal of Service Research. 5 (4), 316–332.
Srimalee, Somluck (2003). The Property Market: Housing Boom Continues to Gather Pace. The Nation Review. Published on August 20, 2003.
Stader, T. and Shaw, M. (1999), Consumer Cost Differences for Traditional and Internet Markets. International Research: Electronic Networking Application and Policy 9, 82-92.
Steele, C. (1988). The Psychology of Self-Affirmation: Sustaining the Integrity of the Self. In L. Berkowitz (Ed.), Advances in Experimental Social Psychology. 21, (pp.261-302). San Diego, CA: Academic Press.
Steenkamp, J. and Baumgartner, H. (2000). On the Use of Structural Equation Models in Marketing Modeling. International Journal of Research in Marketing. 17 (2-3), 195-202.
Steenkamp, J. and Trijp H. (1991). The Use of LISREL in Validating Marketing Constructs. International Journal of Research in Marketing. 8(4), 283-299.
Stephen, E. (2000). The New Real Estate Market. Mortgage Banking, 60 (4), 62-67. Stewart, D., Pavlou, P. and Ward, S. (2001). Media Influences on Marketing
Communications. In Bryant, J. and Hillsdale, D. (eds) Media Effects: Advances in Theory and Research. N.J: Erlbaum,
Stone, R. (1984). The Marketing Characteristics of Involvement", in Kinnear, T. (Ed), Advances in Consumer Research, Association for Consumer Research.
__________. (1993). Shelter Poverty: New Ideas on Housing Affordability. Philadelphia: Temple University Press.
Stone, R. and Winter, F. (1987). Risk: Is It Still Uncertainty Times Consequences? In Belk, R. (Ed), Proceedings of the American Marketing Association, Winter Educators Conference, Chicago.
Storbacka, K., Strandvik, T., and Grönroos, C. (1994). Managing customer relationships for profit: The dynamics of relationship quality. International Journal of Service Industry Management. 5 (5), 21-38.
Straub, D., Boudreau, M.-C., and Gefen, D. (2004). Validation Guidelines for IS Positivist Research. Communications of AIS. 13(24), 380-427.

308
Sun B. and Morwitz V. (2004). Predicting Purchase Behavior from Stated Intentions: A Unified Model. Working Papers, New York University, Leonard N. Stern School of Business.
Sungur, C. and Cagdas, G. (2003). Effects of housing morphology on user satisfaction. Presented at the 4th International Space Syntax Symposium, London.
Sweeney, J. and Soutar, G. (2001). Consumer perceived value: The development of a multiple item scale. Journal of Retailing. 77 (2), 203-220.
Sweeney, J., Soutar, G., and Johnson, L. (1997). Perceived Service Quality and Perceived Value. A Comparison of Two Models. Journal of Retailing and Consumer Services. 4 (1), 39-48.
__________. (1999). The Role of Perceived Risk in the Quality-Value Relationship: A Study in a Retail Environment. Journal of Retailing. 75 (1), 77-105.
The Government Public Relations Department. (2006). Improvement in Thailand’s Economic Situation (01/12/2005). Available at http://thailand.prd.go.th. Retrieved on March 27, 2006.
Thailand Property Report - August 06 – News. Available at http://www.property-report.com. Retrieved on August 9, 2006.
Theptaranon, Yod-yaim. (2006). Residentail and Comercial Real Estate Law. Architect’ s Answers. Available at http://se-ed.net/winyou/ Retrieved on March 12, 2006.
Torbica, Z. (1997). Total Quality Management and Customer Satisfaction in Home Building. Dissertation. University of Florida, Gainesville, Florida.
Torbica, Z and Stroh, R. (1999). An Assessment Model for Quality Performance Control in Residential Construction. Journal of Construction Education. 4 (3). 332-340.
Tse, R. (2002). Estimating Neighborhood Effects in House Prices: Towards a New Hedonic Model Approach. Urban Studies. 39, 1165-1180.
Tseng, M., Qinhai, M., and Su, C. (1999). Mapping Customers' Service Experience for Operations Improvement. Business Process Management Journal. 5 (1) 50- 65.
Tucker, R. 1990). The Biq “Q”. The Construction Specifier. May, 151-152. Tversky, A. (1972). Elimination by Aspects: A Theory of Choice. Psychological Review,
79, 281–299. Tversky, A., and Kahneman, D. (1992). Advances in Prospect Theory: Cumulative
Representation of Uncertainty, Journal of Risk and Uncertainty, 5, 297–323.

309
Tversky, A., and Sattath, S. (1979). Preference Trees. Psychological Review 86: 542–573.
Udorn P. (1999). The Antecedents and Consequences of Consumer Commitment. Dissertation, University of North Carolina at Chapel Hill.
Vandenberg, R. and Lance C. (2000). A Review and Synthesis of the Measurement Invariance Literature: Suggestions, Practices, and Recommendations for Organizational Research. Organizational Research Methods. 3(1), 4-69.
Vann, J. (1984). .A Multi-Distributional Conceptual Framework for the Study of Perceived Risk", in Kinnear, T. (Ed), Advances in Consumer Research, Association for Consumer Research.
Walter, A., Ritter, T., and Gemunden, H. (2001). Value Creation in Buyer-Seller Relationships. Industrial Marketing Management. 30, 365-377.
Wang, M. and Yang, J. (1998). A Multi-Criteria Experimental Comparison of Three Multi-Attribute Weight Measurement Methods. Journal of Multi-Criteria Decision Analysis. 7 (6), 340-350.
Washburn, J. and Plank, R. (2002). Measuring Brand Equity: An Evaluation of a Consumer-Based Brand Equity Scale. Journal of Marketing Theory and Practice. 10 (1): 46-61.
Weitz, B. (1978). The Relationship between Salesperson Performance and Understanding of Customer Decision Process. Journal of Marketing Research. 15, 501-517.
Williams, S. and Wong, Y. (1999). The Effects of Mood on Managerial Risk Perceptions: Exploring Affect and the Dimensions of Risk. Journal of Social Psychology, 139, 268–87.
Wolfinbarger, M. and Gilly M.C. (2003). eTailQ: Dimensionalizing, Measuring and Predicting etail Quality. Journal of Retailing. 79(3), 183-198.
Wong, A. (2004). The Role of Emotional Satisfaction in Service Encounters. Managing Service Quality. 14 (5), 365-76.
Wong, A. and Zhou, L. (2006). Determinants of Relationship Quality: A Conceptual Model and Empirical Investigation. Journal of International Consumer Marketing, 18 (3), 81-105.
Wood, L. (2000). Brands and Brand Equity: Definition and Management. Management Decision, 38 (9), 662-669.

310
Woodall, T. (2003). Conceptualising Value for the Customer': An Attributional, Structural and Dispositional Analysis. Academy of Marketing Science Review (on line). Available: http://www.amsreview.org. Retrieved on October 25, 2005.
Woodruff, R. (1997). Customer Value: The Next Source for Competitive Advantage. Journal of the Academy of Marketing Science. 25 (2), 139-153.
Woodruff, R. and Gardial, S. (1996). Know Your Customer: New Approaches to Understanding Customer Value and Satisfaction. Cambridge: Blackwell.
Yizhak, H., Portnov B. and Meron, E. (2003). A Mathematical Model of Segregation Patterns in Residential Neighborhoods. Environment and Planning. 33, 149–72.
Yong,C. and Gruca, T. (2004). The Influence of Pre- and Post-Purchase Service on Prices in the Online Book Market. Journal of Interactive Marketing, 18 (4), 51-62.
Yoo, B., Donthu, N. (2001). Developing and Validating a Multidimensional Consumer-Based Brand Equity Scale. Journal of Business Research. 52 (1),1-14.
_________. (2002). Testing Cross-Cultural Invariance of the Brand Equity Creation Process. Journal of Product and Brand Management. 11 (6), 380-98.
Young, L. and Denize S. (1995). A Concept of Commitment: Alternative Views of Relational Continuity in Business Service Relationships. Journal of Business and Industrial Marketing, 10 (5), 22-37.
Zaichkowsky, J. (1985). Measuring the Involvement Construct. Journal of Consumer Research. 12, 341-352.
Zeithaml, V. (1988). Consumer Perceptions of Price, Quality, and Value: A Means-End Model and Synthesis of Evidence. Journal of Marketing. 52 (July), 2-22
Zeithaml, V., Bitner, M. (2003). Services Marketing. Integrating Customer Focus across the Firm. 3rded. Irwin: McGraw-Hill.
Zeithaml, V. Parasuraman, A. and Berry, L. (1990). Delivering Quality Service: Balancing Customer Perception and Expectations. New York: Free Press.
Zigmund, W. (2003). Business Research Methods. 7th.ed. Ohio: Thomson

311
APPENDICES

312
APPENDIX A Interview and discussion guides
For Exploratory Studies and Qualitative Data Collection

313
Interview guide/ discussion guides: for the recent home buyers Attributes
− What are the key decision factors consumers use to consider the housing product? How can they make a set of choice that they would like to consider? How to use those key attributes or those first attribute? What are the patterns of their cognitive process?
− What is the consumers’ expectation on look, style, class of the house? What pricing level consumer expect?
− Do consumers imagine a clear picture of the house before searching for the housing information? What are the first pictures of the house?
− Could the houses that are available in the market attain or exceed the expectation of consumers? If yes, what is the process of decision? If no, what is consumer’s response?
− If consumers like some features of the house and don’t like any of them, i.e., the house could not achieve consumers’ wants, how do the consumers respond? How consumers trade-off all related factors?
− How consumers value the house? What factors determine their value formation and how?
− What are the brand or real estate firm/housing projects that consumers could recall? How do they perceive those firms?
− How real estate brand or reputations of the firm influence consumers’ perception and decision making?
− How consumers perceive consumers who bought the house from the top brands of real estate firm and those who bought the house from a small, less-known housing projects/ firm? How consumers value the brand of real estate developers?
− If perfect housing alternatives are available, what are consumers’ responses? Can they make their decision immediately? Why or why not? How long they use to make decision? What are their actual behaviors regarding this issue?

314
Information search
− What are influencing media? What advertisement, which magazine or other source?
− How consumers start their information search, step by step? − How much information consumers could memorize after visiting a housing
project? What is the key information that is long-term existing in consumers’ minds?
− How many housing projects consumers have visited before making their decision?
− How many times consumers visit the housing project before making their decision?
− What attributes or features consumers are interested in when they are visiting the housing project?
− What are the sales promotions or special offers that motivate consumers to consider the product?
− How consumers negotiate with the real estate representatives/firm? Do they satisfy with the negotiation process? How?
− How real estate representatives i.e., salesperson, flow-man, engineer, project managers influence consumers’ information search and perception towards the housing product? Explain in all related aspects.
− How consumers perceive their real estate representatives? − What are the expectations towards those real estate representatives? − Could performance of real estate representatives attain the consumer
expectation? Decision making process
− What are consumers’ decision making processes? Explain step by step.

315
Interview guide for the real estate personals
− What are the themes of the product designs? − What is the price level o the house? − What are the key competitive issues among real estate developers? − What is the nature or specific characteristics of real estate market? − What is the level/degree of competition/cooperation among the firms? − What are the marketing strategies of the firm? − How consumers make their decision? Explain the process based on the
experiences with their customers? − How the real estate firms perceive and treat their representatives i.e.,
salesperson, flow-man, engineer, project managers? Are there any training or specific policies for their representatives who have to deal with consumers?

316
APPENDIX B
Survey Questionnaires

317
Home Buying Survey Questionnaire
Dear Home Buyer, This questionnaire is a part of a research study currently being carried out by a doctoral candidate in the Faculty of Commerce and Accountancy from the Joint Doctoral Program in Business Administration (JDBA) at Chulalongkorn University, Thammasat University, and National Institute of Development and Administration (NIDA). The researcher is exploring the factors that influence the home buying decision process. The results of this study will make marketers to understand the process of consumer decision making and its influencing factors. This will help the marketers and business operators to enhance their potential to develop and increase the quality of product and sales services to satisfy consumers in real estate industry and, also, other industries. Since you are a home buyer, your profound knowledge and direct experience in home buying decision, your participation and valuable information will be very beneficial to this study. Please complete the questionnaire with answers that best representing facts and your opinion in all questions. This questionnaire consists of 4 major parts asking your opinion about; 1) your house and housing project 2) sales service quality 3) real estate developer and its personnel and 4) your decision making process. It will take about 15-20 minutes to finish. Please be assured that your response is strictly confidential and only aggregate results are reported. Thank you for your contribution to this research. Your cooperation is highly appreciated. Sincerely Yours, Nucharee Supatn Doctoral Candidate Faculty of Commerce and Accountancy Thammasat University Remarks: In case that you have questions or concerns with this questionnaire, you may contact the
researcher via telephone at 05-0222555 or via e-mail at [email protected] .
Thammasat University (TU), Chulalongkorn University (CU) National Institute of Development Administration (NIDA)

318 Home Buying Survey Questionnaire
(RECENT HOME BUYERS)
1. What is the most concerning factor when you are thinking of buying a house? (Please choose only one choice) Look of the house Utility function of the house Environment of the Project Payment Condition Price Location Reputation of Housing Project Sales Promotion Others (Specify) ___________
2. Please specify the first three names of real estate developers or housing projects that come to your mind when talking about the home buying:
1st Name _____________________ 2nd Name _____________________ 3rd Name ____________________
3. What is your opinion about your house and housing project? (Please make a in the box that most represents your feelings)
Housing and Sales Service Factors Level of Quality Highest <-------------------------------> Lowest
Quality of the house and housing project Traffic/Transportations 6 5 4 3 2 1 Distance to public transport 6 5 4 3 2 1 Distance to school/work 6 5 4 3 2 1 Distance to community centre 6 5 4 3 2 1 Distance to shopping facilities 6 5 4 3 2 1 Privacy 6 5 4 3 2 1 Good neighbors 6 5 4 3 2 1 Quality of view and surroundings 6 5 4 3 2 1 General living quality of the local area 6 5 4 3 2 1 Design of the house 6 5 4 3 2 1 Utility functions 6 5 4 3 2 1 Quality of building materials 6 5 4 3 2 1 Energy-efficient features of the house 6 5 4 3 2 1 Construction lead time is as promised 6 5 4 3 2 1 Conforms to design specifications 6 5 4 3 2 1 Conforms to material specifications 6 5 4 3 2 1 Construction quality 6 5 4 3 2 1 Quality of finish workmanship 6 5 4 3 2 1 After sales warranty 6 5 4 3 2 1 Quality of Reparation system 6 5 4 3 2 1 Sales Service quality Professionalism of real estate personnel 6 5 4 3 2 1 Willingness to help and provide prompt service of real estate personnel 6 5 4 3 2 1 Competence (skills and knowledge) of real estate personnel 6 5 4 3 2 1 You were treated like a person, not a number. 6 5 4 3 2 1 You were welcomed enthusiastically. 6 5 4 3 2 1 Personnel showed interest in you as a customer. 6 5 4 3 2 1

319Housing and Sales Service Factors Your Opinion
Strongly Agree <------->Strongly Disagree Reputation of your real estate developer When talking about a house, you think of this real estate firm immediately. 6 5 4 3 2 1 This real estate firm is the most popular brand in the industry. 6 5 4 3 2 1 The house provided by this real estate firm is luxurious. 6 5 4 3 2 1 You won’t mind paying a higher price for this house offered by this real estate firm. 6 5 4 3 2 1
This real estate brand would compensate me in some way for the problem with the product. 6 5 4 3 2 1
The image of this real estate firm represents what you would like to be. 6 5 4 3 2 1 Quality of the houses offered by this real estate firm is consistent. 6 5 4 3 2 1 The house offered by this real estate firm is very durable. 6 5 4 3 2 1 The house offered by this real estate firm is very reliable. 6 5 4 3 2 1 The quality of the houses offered by this real estate firm is superior to other brands. 6 5 4 3 2 1
You feel you are loyal to this real estate firm. 6 5 4 3 2 1 The house offered by this real estate firm is my first choice. 6 5 4 3 2 1 Even with more choices, you will not choose other brands. 6 5 4 3 2 1
4. What is your opinion about your real estate developer and its personnel? (Please make a in the box that most represents your feelings)
Real Estate Firm and Personnel Factors Your Opinion
Strongly Agree <------->Strongly Disagree Your real estate personnel Personnel are responsible. 6 5 4 3 2 1 Personnel are honest about problem solving. 6 5 4 3 2 1 Personnel can be trusted at all times. 6 5 4 3 2 1 Personnel put the customers' interest before their own. 6 5 4 3 2 1 Personnel are reliable. 6 5 4 3 2 1 Personnel are honest. 6 5 4 3 2 1 The relationship with your real estate personnel is very much at ease. 6 5 4 3 2 1 Personnel are able to handle the complaints. 6 5 4 3 2 1 Personnel are collaborative in resolving conflicts with us. 6 5 4 3 2 1 Feel emotionally attached to personnel. 6 5 4 3 2 1 You plan to maintain relationship with real estate personnel. 6 5 4 3 2 1 You regarded the overall relationship with personnel as very close. 6 5 4 3 2 1 Relationship with real estate personnel is important. 6 5 4 3 2 1 Your real estate firm The real estate firm understands the customer. 6 5 4 3 2 1 The real estate firm can be trusted at all times. 6 5 4 3 2 1

320
Real Estate Firm and Personnel Factors Your Opinion
Strongly Agree <------->Strongly Disagree The real estate firm can be counted on to do what the right. 6 5 4 3 2 1 This housing project is the best of all possible place for living 6 5 4 3 2 1 You are committed to your real estate firm 6 5 4 3 2 1 You intend to continue associating with the housing project 6 5 4 3 2 1 Your relationship with this firm deserves maximum effort to maintain 6 5 4 3 2 1 Your choice to use this company was a wise one 6 5 4 3 2 1 You’re always delighted with the service provided by this real estate firm 6 5 4 3 2 1 The performance of the real estate firm exceeds customer expectation. 6 5 4 3 2 1 You think you did the right thing when you decided to use this firm. 6 5 4 3 2 1
5. Please make a in the box that most represents the feeling you experienced when you are in your home buying
process.
Home Buying Experiences Your opinion
Strongly Agree <------->Strongly Disagree When you thought about buying a house, you experienced tension. 6 5 4 3 2 1 The thought of buying a house would make you feel uncomfortable. 6 5 4 3 2 1 You would worry a lot when buying a house. 6 5 4 3 2 1 When buying a house, you would worry about how reliable the house will be. 6 5 4 3 2 1 You are afraid that the house would not provide you the level of benefits that you expected to it 6 5 4 3 2 1
You are afraid that the house would not provide you the level of housing quality that you expected it to. 6 5 4 3 2 1
You are concerned that someone may look down you, if you made a bad choice in selection of the house. 6 5 4 3 2 1
When buying the house, You are concerned about the neighbors who buy the house in the same project. 6 5 4 3 2 1
You are afraid that the house you buy may be more expensive than other choices. 6 5 4 3 2 1
You are not sure whether you made a sufficient price bargaining. 6 5 4 3 2 1 You are afraid that the price you paid for your house may be higher than that of other customers. 6 5 4 3 2 1
Before buying the house, you would obtain substantial information about all available choices 6 5 4 3 2 1
You would acquire a great deal of information about the house and its environment before buying 6 5 4 3 2 1
You have spent a lot of time in the purchase process of this house 6 5 4 3 2 1 You have put a lot of effort in the purchase process of this house 6 5 4 3 2 1 It costs you a lot of money to search for the most suitable house for you. 6 5 4 3 2 1 Your house is value for money. 6 5 4 3 2 1
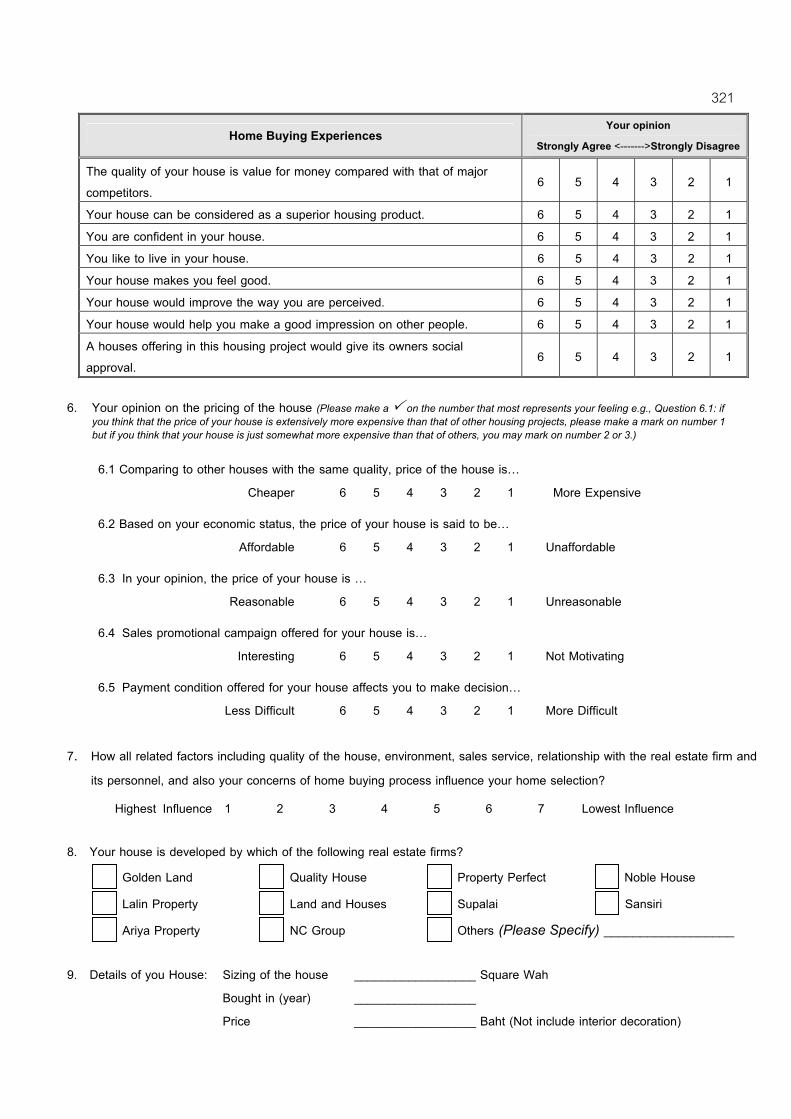
321
Home Buying Experiences Your opinion
Strongly Agree <------->Strongly Disagree The quality of your house is value for money compared with that of major competitors. 6 5 4 3 2 1
Your house can be considered as a superior housing product. 6 5 4 3 2 1 You are confident in your house. 6 5 4 3 2 1 You like to live in your house. 6 5 4 3 2 1 Your house makes you feel good. 6 5 4 3 2 1 Your house would improve the way you are perceived. 6 5 4 3 2 1 Your house would help you make a good impression on other people. 6 5 4 3 2 1 A houses offering in this housing project would give its owners social approval. 6 5 4 3 2 1
6. Your opinion on the pricing of the house (Please make a on the number that most represents your feeling e.g., Question 6.1: if
you think that the price of your house is extensively more expensive than that of other housing projects, please make a mark on number 1 but if you think that your house is just somewhat more expensive than that of others, you may mark on number 2 or 3.)
6.1 Comparing to other houses with the same quality, price of the house is… Cheaper 6 5 4 3 2 1 More Expensive
6.2 Based on your economic status, the price of your house is said to be… Affordable 6 5 4 3 2 1 Unaffordable
6.3 In your opinion, the price of your house is … Reasonable 6 5 4 3 2 1 Unreasonable
6.4 Sales promotional campaign offered for your house is… Interesting 6 5 4 3 2 1 Not Motivating
6.5 Payment condition offered for your house affects you to make decision… Less Difficult 6 5 4 3 2 1 More Difficult
7. How all related factors including quality of the house, environment, sales service, relationship with the real estate firm and
its personnel, and also your concerns of home buying process influence your home selection?
Highest Influence 1 2 3 4 5 6 7 Lowest Influence 8. Your house is developed by which of the following real estate firms? Golden Land Quality House Property Perfect Noble House Lalin Property Land and Houses Supalai Sansiri Ariya Property NC Group Others (Please Specify) __________________ 9. Details of you House: Sizing of the house __________________ Square Wah Bought in (year) __________________ Price __________________ Baht (Not include interior decoration)

32210. How many housing project you have visited before buying your house? _______________ Projects How many times you have visited your housing project before buying your house? _______________ Times 11. How long you use to make your decision after the first visit to your housing project? Less than 1 month 1-3 months 4-6 months 7 months –1 year More than 1 year 12. How long you use to make your decision after the first thought of buying a house? Less than 3 months 4-6 months 7-12 months 1–2 years More than 2 years Personal Data 1. Educational Level Less than Bachelor Bachelor Master Doctorate 2. Age (years old) Less than 25 25-30 31-40 41-50 More than 50 3. Marital Status Married: Number of kids _________ Single Others _________ 4. Family Income (Thai Baht per month) Less Than 20,000 20,000-40,000 40,001-60,000 60,001-80,000 80,001-100,000 100,001-150,000 150,001-200,000 More Than 200,000 5. Number of family members __________________ Maid (if any) __________________ 6. Is this home buying your first time? Yes, it’s my first time (Skip to question 8) No, I used to buy house(s) before 7. What is the type of the house you have bought before? Condominium Commercial real estate unit Town House Single Detached house 8. Have you moved in to your house? Already moved in Not moved yet 9. What are your reasons of buying this house? (Can choose than one choice) Move from the parent’s house Get married Wishing a better environment Transportation and Traffic Want a bigger house For the long term security For monetary speculation Want a nearby-office house Others ____________________
Thanks for your kind cooperation

323 Home Buying Survey Questionnaire
(PROSPECT HOME BUYERS)
1. What is the most concerning factor when you are thinking of buying a house? (Please choose only one choice) Look of the house Utility function of the house Environment of the Project Payment Condition Price Location Reputation of Housing Project Sales Promotion Others (Specify) ___________
2. Please specify the first three names of real estate developers or housing projects that come to your mind when talking about the home buying:
1st Name _____________________ 2nd Name _____________________ 3rd Name ____________________
3. Please specify the name of the housing project that you are most interested in: _____________________________________________________________
4. What is your opinion about the house and housing project that you are interested in? (Please make a in the box that most represents your feelings)
Housing and Sales Service Factors Level of Quality Highest <-------------------------------> Lowest
Quality of the house and housing project Traffic/Transportations 6 5 4 3 2 1 Distance to public transport 6 5 4 3 2 1 Distance to school/work 6 5 4 3 2 1 Distance to community centre 6 5 4 3 2 1 Distance to shopping facilities 6 5 4 3 2 1 Privacy 6 5 4 3 2 1 Good neighbors 6 5 4 3 2 1 Quality of view and surroundings 6 5 4 3 2 1 General living quality of the local area 6 5 4 3 2 1 Design of the house 6 5 4 3 2 1 Utility functions 6 5 4 3 2 1 Quality of building materials 6 5 4 3 2 1 Energy-efficient features of the house 6 5 4 3 2 1 Construction lead time is as promised 6 5 4 3 2 1 Conforms to design specifications 6 5 4 3 2 1 Conforms to material specifications 6 5 4 3 2 1 Construction quality 6 5 4 3 2 1 Quality of finish workmanship 6 5 4 3 2 1 After sales warranty 6 5 4 3 2 1 Quality of Reparation system 6 5 4 3 2 1 Sales Service quality Professionalism of real estate personnel 6 5 4 3 2 1 Willingness to help and provide prompt service of real estate personnel 6 5 4 3 2 1 Competence (skills and knowledge) of real estate personnel 6 5 4 3 2 1 You were treated like a person, not a number. 6 5 4 3 2 1 You were welcomed enthusiastically. 6 5 4 3 2 1 Personnel showed interest in you as a customer. 6 5 4 3 2 1
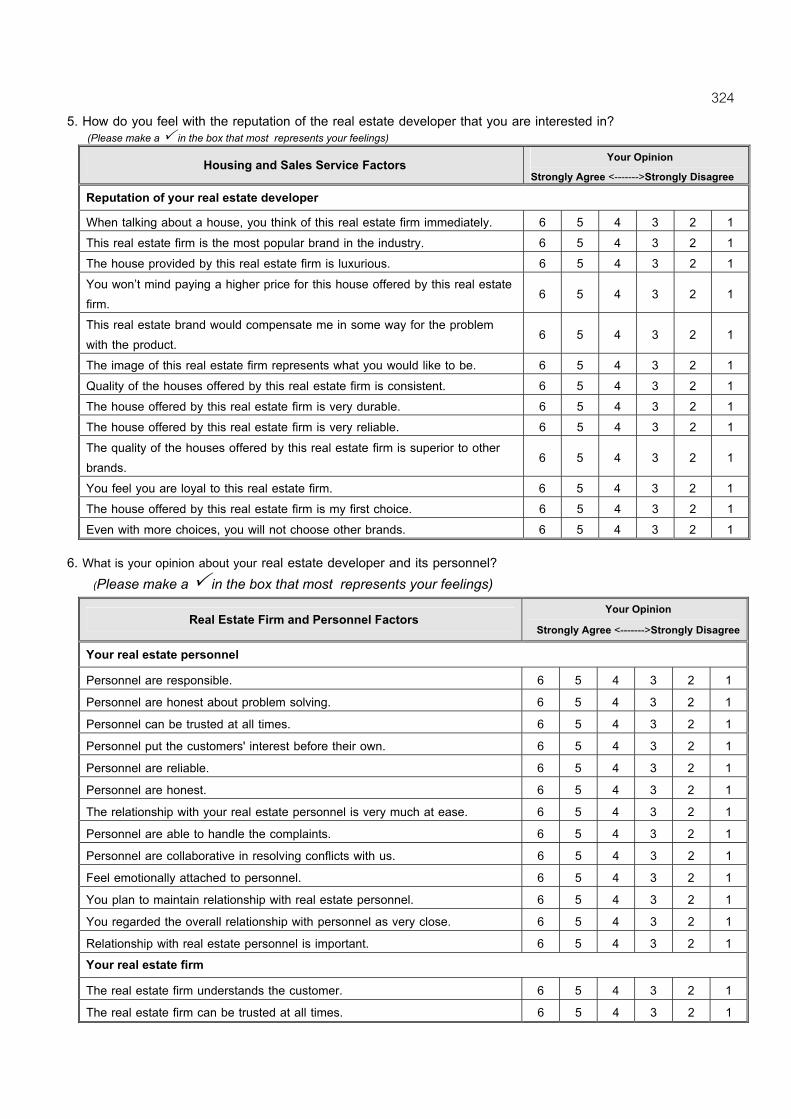
3245. How do you feel with the reputation of the real estate developer that you are interested in? (Please make a in the box that most represents your feelings)
Housing and Sales Service Factors Your Opinion Strongly Agree <------->Strongly Disagree
Reputation of your real estate developer When talking about a house, you think of this real estate firm immediately. 6 5 4 3 2 1 This real estate firm is the most popular brand in the industry. 6 5 4 3 2 1 The house provided by this real estate firm is luxurious. 6 5 4 3 2 1 You won’t mind paying a higher price for this house offered by this real estate firm. 6 5 4 3 2 1
This real estate brand would compensate me in some way for the problem with the product. 6 5 4 3 2 1
The image of this real estate firm represents what you would like to be. 6 5 4 3 2 1 Quality of the houses offered by this real estate firm is consistent. 6 5 4 3 2 1 The house offered by this real estate firm is very durable. 6 5 4 3 2 1 The house offered by this real estate firm is very reliable. 6 5 4 3 2 1 The quality of the houses offered by this real estate firm is superior to other brands. 6 5 4 3 2 1
You feel you are loyal to this real estate firm. 6 5 4 3 2 1 The house offered by this real estate firm is my first choice. 6 5 4 3 2 1 Even with more choices, you will not choose other brands. 6 5 4 3 2 1
6. What is your opinion about your real estate developer and its personnel? (Please make a in the box that most represents your feelings)
Real Estate Firm and Personnel Factors Your Opinion
Strongly Agree <------->Strongly Disagree Your real estate personnel Personnel are responsible. 6 5 4 3 2 1 Personnel are honest about problem solving. 6 5 4 3 2 1 Personnel can be trusted at all times. 6 5 4 3 2 1 Personnel put the customers' interest before their own. 6 5 4 3 2 1 Personnel are reliable. 6 5 4 3 2 1 Personnel are honest. 6 5 4 3 2 1 The relationship with your real estate personnel is very much at ease. 6 5 4 3 2 1 Personnel are able to handle the complaints. 6 5 4 3 2 1 Personnel are collaborative in resolving conflicts with us. 6 5 4 3 2 1 Feel emotionally attached to personnel. 6 5 4 3 2 1 You plan to maintain relationship with real estate personnel. 6 5 4 3 2 1 You regarded the overall relationship with personnel as very close. 6 5 4 3 2 1 Relationship with real estate personnel is important. 6 5 4 3 2 1 Your real estate firm The real estate firm understands the customer. 6 5 4 3 2 1 The real estate firm can be trusted at all times. 6 5 4 3 2 1

325
Real Estate Firm and Personnel Factors Your Opinion
Strongly Agree <------->Strongly Disagree The real estate firm can be counted on to do what the right. 6 5 4 3 2 1 This housing project is the best of all possible place for living 6 5 4 3 2 1 You are committed to your real estate firm 6 5 4 3 2 1 You intend to continue associating with the housing project 6 5 4 3 2 1 Your relationship with this firm deserves maximum effort to maintain 6 5 4 3 2 1 Your choice to use this company was a wise one 6 5 4 3 2 1 You’re always delighted with the service provided by this real estate firm 6 5 4 3 2 1 The performance of the real estate firm exceeds customer expectation. 6 5 4 3 2 1 You think you did the right thing when you decided to use this firm. 6 5 4 3 2 1
7. Please make a in the box that most represents the feeling you experienced when you are in your home buying
process.
Home Buying Experiences Your opinion
Strongly Agree <------->Strongly Disagree When you thought about buying a house, you experienced tension. 6 5 4 3 2 1 The thought of buying a house would make you feel uncomfortable. 6 5 4 3 2 1 You would worry a lot when buying a house. 6 5 4 3 2 1 When buying a house, you would worry about how reliable the house will be. 6 5 4 3 2 1 You are afraid that the house would not provide you the level of benefits that you expected to it 6 5 4 3 2 1
You are afraid that the house would not provide you the level of housing quality that you expected it to. 6 5 4 3 2 1
You are concerned that someone may look down you, if you made a bad choice in selection of the house. 6 5 4 3 2 1
When buying the house, You are concerned about the neighbors who buy the house in the same project. 6 5 4 3 2 1
You are afraid that the house you buy may be more expensive than other choices. 6 5 4 3 2 1
You are not sure whether you made a sufficient price bargaining. 6 5 4 3 2 1 You are afraid that the price you paid for your house may be higher than that of other customers. 6 5 4 3 2 1
Before buying the house, you would obtain substantial information about all available choices 6 5 4 3 2 1
You would acquire a great deal of information about the house and its environment before buying 6 5 4 3 2 1
You have spent a lot of time in the purchase process of this house 6 5 4 3 2 1 You have put a lot of effort in the purchase process of this house 6 5 4 3 2 1 It costs you a lot of money to search for the most suitable house for you. 6 5 4 3 2 1 Your house is value for money. 6 5 4 3 2 1

326
Home Buying Experiences Your opinion
Strongly Agree <------->Strongly Disagree The quality of your house is value for money compared with that of major competitors. 6 5 4 3 2 1
Your house can be considered as a superior housing product. 6 5 4 3 2 1 You are confident in your house. 6 5 4 3 2 1 You like to live in your house. 6 5 4 3 2 1 Your house makes you feel good. 6 5 4 3 2 1 Your house would improve the way you are perceived. 6 5 4 3 2 1 Your house would help you make a good impression on other people. 6 5 4 3 2 1 A houses offering in this housing project would give its owners social approval. 6 5 4 3 2 1
8. Your opinion on the pricing of the house (Please make a on the number that most represents your feeling e.g., Question 6.1: if you think that the price of your house is extensively more expensive than that of other housing projects, please make a mark on number 1 but if you think that your house is just somewhat more expensive than that of others, you may mark on number 2 or 3.)
8.1 Comparing to other houses with the same quality, price of the house is… Cheaper 6 5 4 3 2 1 More Expensive
8.2 Based on your economic status, the price of your house is said to be… Affordable 6 5 4 3 2 1 Unaffordable
8.3 In your opinion, the price of your house is … Reasonable 6 5 4 3 2 1 Unreasonable
8.4 Sales promotional campaign offered for your house is… Interesting 6 5 4 3 2 1 Not Motivating
8.5 Payment condition offered for your house affects you to make decision… Less Difficult 6 5 4 3 2 1 More Difficult
9. How all related factors including quality of the house, environment, sales service, relationship with the real estate firm and
its personnel, and also your concerns of home buying process influence your home selection?
Highest Influence 1 2 3 4 5 6 7 Lowest Influence 10. Please estimate the probability to buy the house that is specified previously. Already bought it Not deciding yet but the probability to buy is _______________________ (Please specify the number 0-100) 11. Details of your interested house: Sizing of the house __________________ Square Wah Price __________________ Baht (Not include interior decoration)

32712. Is this home buying your first time? Yes, it’s my first time (Skip to question 14) No, I used to buy house(s) before. 13. What is the type of the house you have bought before? Condominium Commercial real estate unit Town House Single Detached house 14. How many housing project you have visited? ______________________ Projects How many times you have visited this housing project? ______________________ Times 15. How long you use to make your decision after the first visit to your housing project? Less than 1 month 1-3 months 4-6 months 7 months –1 year More than 1 year Personal Data 1. Educational Level Less than Bachelor Bachelor Master Doctorate 2. Age (years old) Less than 25 25-30 31-40 41-50 More than 50 3. Marital Status Married: Number of kids _________ Single Others _________ 4. Family Income (Thai Baht per month) Less Than 20,000 20,000-40,000 40,001-60,000 60,001-80,000 80,001-100,000 100,001-150,000 150,001-200,000 More Than 200,000 5. Number of family members __________________ Maid (if any) __________________ 6. What are your reasons of buying this house? (Can choose than one choice) Move from the parent’s house Get married Wishing a better environment Transportation and Traffic Want a bigger house For the long term security For monetary speculation Want a nearby-office house Others ____________________
Thanks for your kind cooperation

328
แบบสอบถามความคิดเห็นเก่ียวกับการซื้อบาน
เรียน ทานเจาของบาน/ผูกําลังซื้อบาน แบบสอบถามฉบับนี้ เปนสวนหนึ่งของการศึกษาวิจัยโดยนักศึกษาปริญญาเอกในโครงการรวมผลิตบัญฑิต ระดับปริญญา เอก สาขาบริห า รธุ รกิ จของคณะพาณิชย ศ าสตร และการบัญชี แห ง จุฬาลงกรณมหาวิ ทยาลั ย มหาวิทยาลัยธรรมศาสตร และ สถาบันบัณฑิตพัฒนบริหารศาสตร (The Joint Doctoral Program in Business Administration or JDBA) เนื่องดวยผูวิจัยกําลังศึกษาเกี่ยวกับปจจัยสําคัญที่มีอิทธิพลตอการตัดสินใจซื้อบาน ซึ่งผลของการศึกษาในครั้งนี้ จะชวยใหเขาใจถึงกระบวนการการตัดสินใจและความตองการที่แทจริงของลูกคาอันจะนําไปสูการเพิ่มคุณภาพของสินคา และการพัฒนากลยุทธในการใหบริการดานการตลาด เพ่ือสรางความพึงพอใจสูงสุดแกลูกคา ซึ่งนอกจากจะเปนการยกระดับการใหบริการในวงการอสังหาริมทรัพยแลว ผลการศึกษาในครั้งนี้ยังสามารถนําไปปรับใชเพ่ือเพ่ิมศักยภาพในการใหบริการดานการตลาดกับธุรกิจอ่ืนอีกดวย เนื่องจากทานเปนผูหนึ่งที่มีความรูและประสบการณตรงจากการซื้อบานในโครงการบานพักอาศัยที่จะมีสวนสําคัญอยางยิ่งในการใหความรูและขอเสนอแนะที่จะเปนประโยชนอยางยิ่งตองานวิจัยนี้ จึงเรียนมาเพื่อขอความรวมมือจากทานในการตอบแบบสอบถามฉบับนี้ใหครบถวนตามขอเท็จจริงหรือความคิดเห็นของทานมากที่สุด แบบสอบถามฉบับนี้ประกอบดวย 4 สวนหลักคือ 1) ความคิดเห็นเกี่ยวกับบานและโครงการบานพักอาศัย 2) ความคิดเห็นเกี่ยวกับการบริการดานการขาย 3) ความรูสึกตอผูประกอบการฯ และเจาหนาที่ และ 4) ความรูสึกที่เกิดขึ้นในระหวางการตัดสินใจเลือกซื้อบาน ซึ่งจะใชเวลาในการตอบคําถามทั้งส้ินโดยประมาณ 15-20 นาที ขอมูลและความคิดเห็นของทานจะถูกปกปดเปนความลับโดยไมมีการวิเคราะหเปนรายบุคคล และนําไปใชในการวิเคราะหทางสถิติโดยภาพรวมเทานั้น ผูวิจัยใครขอขอบพระคุณในความอนุเคราะหของทานมา ณ โอกาสนี้ ขอแสดงความนับถือ นุจรี สุพัฒน นักศึกษาระดับปริญญาเอก คณะพาณิชยศาสตรและการบัญชี มหาวิทยาลัยธรรมศาสตร
หมายเหต:ุ ในกรณีที่ทานมีขอสงสัยประการใดเกี่ยวกับการตอบแบบสอบถามในครั้งน้ี ทานสามารถติดตอผูวิจัยไดที่หมายเลขโทรศัพท 05-0222555 หรือทาง e-mail ที่ [email protected]
Thammasat University (TU), Chulalongkorn University (CU) National Institute of Development Administration (NIDA)

329แบบสอบถามความคิดเหน็เกี่ยวกบัการซื้อบานแบบสอบถามความคิดเห็นเกี่ยวกับการซื้อบาน
(สําหรับผูท่ีซื้อบานแลว)
1. ปจจัยหลักที่ทานคํานึงถึงเมื่อทานตองการซื้อบานคืออะไร (กรุณาเลือกปจจัยที่สําคัญที่สุดเพียงขอเดียว) รูปลักษณของบาน การจัดพ้ืนที่ใชสอยภายในบาน สภาพแวดลอมของโครงการ เง่ือนไขทางการเงิน ระดับราคา ทําเลที่อยู ชื่อเสียงของโครงการ การสงเสริมการขาย อ่ืนๆ (ระบุ)______________
2. เมื่อพูดถึงโครงการบานพักอาศัย ทานคิดถึงโครงการของหมูบาน หรือบริษัทใดเปนอันดับแรก (สามอันดับ) อันดับที่ 1 ____________________ อันดับที่ 2 _____________________ อันดับที่ 3 ____________________ 3. ทานมีความคิดเห็นเกี่ยวกับบานและโครงการบานพักอาศัยของทานอยางไร
(กรุณาใสเครื่องหมาย ลงในชองที่ตรงกับความรูสึกของทาน) คุณภาพของบานและการบริการ ระดับการประเมนิ
มากที่สุด <------------------------------->นอยที่สุด คุณภาพของบานและสภาพแวดลอมของโครงการ มีความสะดวกในการเดินทาง 6 5 4 3 2 1 ใกลระบบขนสงมวลชน 6 5 4 3 2 1 ใกลโรงเรียนลูก/ที่ทํางาน 6 5 4 3 2 1 ใกลแหลงชุมชน 6 5 4 3 2 1 ใกลหางสรรพสินคา 6 5 4 3 2 1 มีความเปนสวนตัว 6 5 4 3 2 1 เพ่ือนบานมีระดับ 6 5 4 3 2 1 สภาพแวดลอมภายในโครงการมีความสวยงาม 6 5 4 3 2 1 สภาพแวดลอมของโครงการชวยเพิ่มคุณภาพชีวิต 6 5 4 3 2 1 รูปแบบบานถูกใจ (design, look, style) 6 5 4 3 2 1 การจัดพ้ืนที่ใชสอย/ฟงกชั่นลงตัว 6 5 4 3 2 1 วัสดุกอสราง/ตกแตงมีคุณภาพ 6 5 4 3 2 1 ใชวัสดุที่ชวยประหยัดพลังงาน 6 5 4 3 2 1 สงมอบบานตรงตามสัญญา 6 5 4 3 2 1 โครงสรางและการกอสรางตรงตามสเปคที่กําหนดไว 6 5 4 3 2 1 ใชวัสดุกอสรางตรงตามสเปคที่กําหนดไว 6 5 4 3 2 1 งานกอสรางมีคุณภาพ 6 5 4 3 2 1 ชางกอสรางมีคุณภาพ 6 5 4 3 2 1 มีการประกันคณุภาพของบานในระยะเวลาที่เหมาะสม 6 5 4 3 2 1 ระบบการประกันหลังการขายมีคุณภาพ 6 5 4 3 2 1 คุณภาพการบริการขณะทานดูบานท่ีสํานักงานขาย เจาหนาที่ ฯ มีความรูเพียงพอแบบมืออาชีพ 6 5 4 3 2 1 เจาหนาที่ ฯ เต็มใจ กระตือรือรนที่จะใหบริการ 6 5 4 3 2 1 เจาหนาที่ ฯ มีความรูและทักษะในเรื่องบาน 6 5 4 3 2 1 เจาหนาที่ ฯ ไมดูถูกลูกคา 6 5 4 3 2 1 เจาหนาที่ ฯ ใหการตอนรับเปนอยางดี 6 5 4 3 2 1 เจาหนาที่ ฯ ใหความสําคัญกับทานในฐานะลูกคา 6 5 4 3 2 1

330
คุณภาพของบานและการบริการ ระดับความคิดเห็น
เห็นดวยอยางย่ิง <------->ไมเห็นดวยอยางย่ิง ชื่อเสียงของบริษัทผูประกอบการบานจัดสรรที่ทานซื้อ เมื่อพูดถึงบานจัดสรรทานคิดถึงชื่อบริษัทที่ทานซื้อบานทันที 6 5 4 3 2 1 บริษัทนี้จัดเปนบริษัทบานจัดสรรที่มีชื่อเสียงที่สุดในวงการ 6 5 4 3 2 1 บานที่จัดสรรโดยบริษัทนี้จัดเปนบานในระดับหรูหราที่สุดแหงหนึ่ง 6 5 4 3 2 1 ทานยินดีจายเงินแพงกวาเพ่ือซื้อบานที่จัดสรรโดยบริษัทนี้ 6 5 4 3 2 1 ความมีชื่อเสียงของบริษัทชวยชดเชยขอบกพรองเล็กๆนอยๆ ของตัวบานได 6 5 4 3 2 1 ภาพลักษณของบริษัทตรงกับตัวทาน 6 5 4 3 2 1 บานที่จัดสรรโดยบริษัทนี้มีคุณภาพเทาเทียมกันทุกหลัง 6 5 4 3 2 1 บานที่จัดสรรโดยบริษัทนี้มีความทนทาน 6 5 4 3 2 1 บานที่จัดสรรโดยบริษัทนี้มีคุณภาพที่เชื่อถือได 6 5 4 3 2 1 บานที่จัดสรรโดยบริษัทนี้มีคุณภาพเหนือกวาของบริษัทอื่น 6 5 4 3 2 1 หากทานจะซื้อบานหลังใหมทานจะซื้อบานจากบริษัทนี้เทานั้น 6 5 4 3 2 1 ทานเลือกบานที่จัดสรรโดยบริษัทนี้เปนอันดับแรก 6 5 4 3 2 1 ถึงจะมีบานจากบริษัทอื่นที่คุณภาพใกลเคียงกันใหทานเลือก ทานก็ยังคงเลือกบานจากบริษัทนี้อยูดี 6 5 4 3 2 1
4. ทานมีความคิดเห็นเกี่ยวกับบริษัทผูประกอบการบานจัดสรรและเจาหนาที่โครงการที่ทานซื้อบานอยางไร (กรุณาใสเครื่องหมาย ลงในชองที่ตรงกับความรูสึกของทาน)
ความรูสึกตอบริษัทผูประกอบการและเจาหนาท่ี ระดับความคิดเห็น
เห็นดวยอยางย่ิง <------->ไมเห็นดวยอยางย่ิง ความรูสึกของทานท่ีมีตอเจาหนาท่ีโครงการบานจัดสรรที่ทานซื้อ เจาหนาที่ฯ มีความรับผิดชอบ 6 5 4 3 2 1 เจาหนาที่ฯ มีความจริงใจในการแกปญหา 6 5 4 3 2 1 เจาหนาที่ฯ สามารถเชื่อใจไดวาจะทําตามสัญญาที่ใหไว 6 5 4 3 2 1 เจาหนาที่ฯ คํานึงถึงความตองการของลูกคาเปนสําคัญ 6 5 4 3 2 1 เจาหนาที่ฯ มีความนาเชื่อถือ 6 5 4 3 2 1 เจาหนาที่ฯ มีความซื่อสัตย 6 5 4 3 2 1 เจาหนาที่ฯ คอนขางพูดงาย 6 5 4 3 2 1 เจาหนาที่ฯ สามารถแกปญหาตางๆของลูกคาได 6 5 4 3 2 1 เจาหนาที่ฯ ใหความรวมมือในการแกไขปญหาตางๆเปนอยางดี 6 5 4 3 2 1 ทานรูสึกผูกพันกับเจาหนาที่โครงการที่คอยดูแลทาน 6 5 4 3 2 1 ทานคงพูดคุยติดตอกับเจาหนาที่ฯไปเรื่อยๆ แมจะซื้อบานไปแลว 6 5 4 3 2 1 โดยภาพรวมทานสนิทสนมกับเจาหนาที่ฯ ในระดับหนึ่ง 6 5 4 3 2 1 ทานคิดวาสัมพันธภาพที่ดีกับเจาหนาที่โครงการเปนส่ิงสําคัญ 6 5 4 3 2 1 ความรูสึกของทานท่ีมีตอบริษัทผูประกอบการบานจัดสรรที่ทานซื้อ บริษัทผูประกอบการบานจัดสรรของทานเขาใจลูกคาเสมอ 6 5 4 3 2 1 บริษัทผูประกอบการบานจัดสรรของทานเชื่อใจไดทุกเรื่อง 6 5 4 3 2 1 บริษัทผูประกอบการบานจัดสรรของทานมักจะทําถูกตองเสมอ 6 5 4 3 2 1 ทานรูสึกวาหมูบานนี้เปนโครงการบานพักอาศัยที่ดีที่สุดแหงหนึ่ง 6 5 4 3 2 1 ทานรูสึกผูกพันกับบริษัทที่ทานซื้อบาน 6 5 4 3 2 1 ทานไมเคยคิดอยากยายไปอยูหมูบานอื่น 6 5 4 3 2 1 ทานจะพยายามถึงที่สุดที่จะรักษาความสัมพันธกับบริษัทนี้ไว 6 5 4 3 2 1 การซื้อบานหลังนี้เปนการตัดสินใจที่ถูกตองที่สุดครั้งหนึ่งในชีวิต 6 5 4 3 2 1 ทานรูสึกพอใจในบริการที่ไดรับจากบริษัท ฯ เสมอ 6 5 4 3 2 1 บริการตางๆ ของโครงการฯ ที่ทานไดรับดีเกินความคาดหมาย 6 5 4 3 2 1 ทานคิดวาทานเลือกถูกแลวที่มาซื้อบานจากบริษัท ฯ นี้ 6 5 4 3 2 1

3315. ทานมีความคิดเห็นเกี่ยวกับบานที่ทานซื้อ และกระบวนการซื้อบานของทานอยางไร (กรุณาใสเครื่องหมาย ลงในชองที่ตรงกับความรูสึกของทาน)
ความรูสึกท่ีมีตอการซื้อบาน ระดับความคิดเห็น
เห็นดวยอยางย่ิง <----->ไมเห็นดวยอยางย่ิง เมื่อคิดถึงตอนซื้อบานทานรูสึกเครียดทันที 6 5 4 3 2 1 ความยุงยากของการเลือกซื้อบานทําใหทานรูสึกอึดอัด 6 5 4 3 2 1 ทานรูสึกวิตกกังวลเวลาอยางมากตอนตัดสินใจเลือกบาน 6 5 4 3 2 1 ตอนตัดสินใจเลือกทานรูสึกกังวลวาคุณภาพของบานจะเชื่อถือไดเพียงใด 6 5 4 3 2 1 ทานกลัววาบานของทานอาจไมสามารถใชประโยชนไดอยางที่คาดไว 6 5 4 3 2 1 ทานกลัววาคุณภาพของบานที่ทานซื้อจะไมไดตามระดับที่คาดหวังไว 6 5 4 3 2 1 ทานกลัวจะถูกดูถูกหากซื้อบานในหมูบานที่ไมมีชื่อเสียง 6 5 4 3 2 1 ตอนเลือกบานทานกังวลวาจะไดเพ่ือนบานที่ดีหรือไม 6 5 4 3 2 1 ทานกลัววาบานที่ซื้อจะแพงกวาหมูบานอื่นในระดับเดียวกัน 6 5 4 3 2 1 ทานไมแนใจวาหากทานตอรองอีกหมูบานจะลดราคาใหทานหรือไม 6 5 4 3 2 1 ทานกลัววาทานจะซื้อบานแพงกวาลูกคาคนอื่น 6 5 4 3 2 1 ตอนที่ทานซื้อบานทานพยายามหาขอมูลเพ่ือเปรียบเทียบโครงการบานจัดสรรที่ขายอยูในขณะนั้นใหไดมากที่สุด 6 5 4 3 2 1
ทานตองไดขอมูลที่เกี่ยวของทั้งหมดเกี่ยวกับตัวบาน ส่ิงแวดลอม และบริษัทผูประกอบการกอนตัดสินใจซื้อ 6 5 4 3 2 1
ทานทุมเทเวลาอยางมากในการในตระเวณดูและตัดสินใจเลือกซื้อบาน 6 5 4 3 2 1 ทานทุมเทแรงกายแรงใจอยางมากในการเลือกซื้อบาน 6 5 4 3 2 1 ทานเสียคาใชจายในตระเวณดูบานเปนอยางมาก 6 5 4 3 2 1 โดยภาพรวมทานคิดวาคุณภาพของบานที่ทานซื้อคุมคาสมราคา 6 5 4 3 2 1 บานของทานคุมคาสมราคากวาบานในหมูบานอื่น 6 5 4 3 2 1 บานของทานจัดอยูในระดับที่สูงกวามาตรฐานทั่วไป 6 5 4 3 2 1 ทานเชื่อในคุณภาพของบานที่ทานซื้อ 6 5 4 3 2 1 ทานชอบที่จะใชชีวิตในบานหลังนี้ 6 5 4 3 2 1 การไดเปนเจาของบานหลังนี้ทําใหทานรูสึกดี 6 5 4 3 2 1 การไดเปนเจาของบานหลังนี้ทําใหคนมองทานดีขึ้น 6 5 4 3 2 1 บานที่ทานซื้อชวยใหคนอื่นประทับใจในตัวทาน 6 5 4 3 2 1 บานที่ทานซื้อมีสวนทําใหทานไดรับการยอมรับในสังคม 6 5 4 3 2 1
6. ความคิดเห็นเกี่ยวกับราคาบานที่ทานซื้อ (กรุณาใสเครื่องหมาย ทับบนตัวเลขที่ตรงกับความรูสึกของทานที่สุดเชนในขอ 6.1 หากทานคิดวาบานที่ทานซื้อแพงกวาบานในหมูบานอื่นมากใหทานใสเครื่องหมายทับเลข 1 แตหากทานคิดวาบานที่ทานซื้อคอนขางแพงกวาบานในหมูบานอื่นทานอาจเลือกใสเครื่องหมายบนตัวเลข 2 หรือ3 เปนตน)
6.1 เมื่อเปรียบเทียบกับหมูบานอื่นในระดับเดียวกันบานของทาน ถูกกวา 6 5 4 3 2 1 แพงกวา
6.2 ราคาบานที่ทานซื้ออยูในระดับที่ทาน รับผิดชอบไดสบายๆ 6 5 4 3 2 1 ตองใชจายอยางระวัง
6.3 ราคาบานที่ทานซื้ออยูในระดับที่ เหมาะสม 6 5 4 3 2 1 ไมเหมาะสม
6.4 รายการสงเสริมการขาย นาสนใจ 6 5 4 3 2 1 ไมนาสนใจ
6.5 เง่ือนไขการชําระเงินชวยใหทานตัดสินใจ งายขึ้น 6 5 4 3 2 1 ยากขึ้น

3327. ปจจัยขางตนโดยรวมทั้งทางดานทําเล ตัวบาน ราคา คุณภาพการบริการ และ ความสัมพันธกับบริษัท ฯ มีอิทธิพลตอการ
ตัดสินใจซื้อบานของทานเพียงไร (กรุณาใสเครื่องหมาย ทับบนตัวเลขที่ตรงกับความรูสึกของทานที่สุด) มากที่สุด 1 2 3 4 5 6 7 นอยที่สุด
8. ทานเปนเจาของบานในโครงการที่พักอาศัยใด โกลเดน แลนด ควอลิต้ี เฮาส พร็อพเพอรต้ี เพอรเฟค โนเบิล ลลิล พร็อพเพอรต้ี แลนด แอนด เฮาส ศุภาลัย แสนสิริ อารียา เอ็น ซี อ่ืนๆ (ระบุ) ___________________________
9. บานที่ทานซื้อมีขนาด _________________ ตารางวา ซื้อเมื่อป พ.ศ. _____________________ ราคา ____________________________ บาท (โดยไมรวมคาตกแตงหรืออื่นๆ ซ่ึงไมใชบริการของบริษัทผูประกอบการบานจัดสรร) การซื้อบานหลังนี้เปนการซื้อบานหลังแรกของทานใชหรือไม ใช ไมใช
10. ทานไดเขาชมโครงการบานจัดสรรท้ังหมดกี่แหงกอนตัดสินใจซื้อ จํานวนโครงการที่เขาชม _______________แหง ทานไดเขาชมโครงการบานท่ีซื้อกี่ครั้งกอนตัดสินใจซื้อ จํานวนครั้งที่เขาชม ________________ครั้ง
11. ทานใชเวลานานเทาไร ในการตัดสินใจหลังจากท่ีมาชมโครงการที่ทานซื้อ นอยกวา 1 เดือน 1-3 เดือน 4-6 เดือน 7 เดือน–1 ป มากกวา 1 ป
12. ทานใชเวลานานเทาไรต้ังแตเร่ิมดูบานจนถึงตัดสินใจซื้อ นอยกวา 3 เดือน 4-6 เดือน 7-12 เดือน 1–2 ป มากกวา 2 ป ขอมูลสวนบุคคล 1. ระดับการศึกษา ตํ่ากวาปริญญาตรี ปริญญาตรี ปริญญาโท สูงกวาปริญญาโท 2. อายุ ตํ่ากวา 25 ป 25-30 ป 31-40 ป 41-50ป มากกวา 50 ป 3. สถานภาพสมรส สมรส จํานวนบุตร_________ คน โสด อ่ืนๆ _________ 4. รายไดของครอบครัวตอเดือน ไมเกิน 20,000 บาท 20,000-40,000 บาท 40,001-60,000 บาท 60,001-80,000 บาท 80,001-100,000 บาท 100,001-150,000 บาท 150,001-200,000 บาท 200,000 บาทขึ้นไป 5. จํานวนสมาชิกในครอบครัว __________________ คน คนรับใช __________________ คน

3336. การซื้อบานครั้งนี้เปนการซื้อบานหลังแรกของทานใชหรือไม ใช (กรุณาขามไปขอ 8) ไมใช 7. บานที่ทานเคยซื้อมากอนเปนบานแบบใด คอนโดมิเนียม อาคารพาณิชย ทาวนเฮาส บานเดี่ยว อ่ืนๆ _________ 8. ขณะนี้ทานไดยายเขาอยูในบานหลังนี้แลวหรือยัง เขาอยูแลว ยังไมไดเขาอยู 9. เหตุผลที่ทานซื้อบาน (เลือกไดมากกวา 1 ขอ) แยกครอบครัว แตงงาน ตองการสภาพแวดลอมที่ดีขึ้น เดินทางสะดวก ตองการที่อยูอาศัยที่กวางขึ้น ซื้อเก็บไวในอนาคต ซื้อเพ่ือการลงทุน อยากไดบานใกลที่ทํางาน อ่ืน ๆ (ระบุ) ________________
ขอขอบคุณทกุทานที่ใหความรวมมือในการตอบแบบสอบถาม

334แบบสอบถามความคิดเหน็เกี่ยวกบัการซื้อบาน
(สําหรับผูกําลังซื้อบาน) 1. ปจจัยหลักที่ทานคํานึงถึงเมื่อทานตองการซื้อบานคืออะไร (กรุณาเลือกปจจัยที่สําคัญที่สุดเพียงขอเดียว) รูปลักษณของบาน การจัดพ้ืนที่ใชสอยภายในบาน สภาพแวดลอมของโครงการ เง่ือนไขทางการเงิน ระดับราคา ทําเลที่อยู ชื่อเสียงของโครงการ การสงเสริมการขาย อ่ืนๆ (ระบุ)______________
2. เมื่อพูดถึงโครงการบานพักอาศัย ทานคิดถึงโครงการของหมูบาน หรือบริษัทใดเปนอันดับแรก (สามอันดับ) อันดับที่ 1 ____________________ อันดับที่ 2 _____________________ อันดับที่ 3 ____________________ 3. จากประสบการณในการเลือกดูบานของทานที่ผานมา ทั้งที่ไปดูที่โครงการฯ และในงานมหกรรมบานตางๆ ทานคิดวาโครงการ
บานพักอาศัยใดท่ีนาสนใจสําหรับทานมากที่สุด โครงการ _____________________________________________ (กรณุาระบุชื่อโครงการหรือบริษัท) 4. ทานมีความคิดเห็นเกี่ยวกับบานและโครงการบานพักอาศัยที่ทานใหความสนใจที่สุดตามคําตอบในขอ 3 อยางไร
(กรุณาใสเครื่องหมาย ลงในชองที่ตรงกับความรูสึกของทาน) คุณภาพของบานและการบริการ ระดับการประเมนิ
มากที่สุด <------------------------------->นอยที่สุด คุณภาพของบานและสภาพแวดลอมของโครงการ มีความสะดวกในการเดินทาง 6 5 4 3 2 1 ใกลระบบขนสงมวลชน 6 5 4 3 2 1 ใกลโรงเรียนลูก/ที่ทํางาน 6 5 4 3 2 1 ใกลแหลงชุมชน 6 5 4 3 2 1 ใกลหางสรรพสินคา 6 5 4 3 2 1 มีความเปนสวนตัว 6 5 4 3 2 1 เพ่ือนบานมีระดับ 6 5 4 3 2 1 สภาพแวดลอมภายในโครงการมีความสวยงาม 6 5 4 3 2 1 สภาพแวดลอมของโครงการชวยเพิ่มคุณภาพชีวิต 6 5 4 3 2 1 รูปแบบบานถูกใจ (design, look, style) 6 5 4 3 2 1 การจัดพ้ืนที่ใชสอย/ฟงกชั่นลงตัว 6 5 4 3 2 1 วัสดุกอสราง/ตกแตงมีคุณภาพ 6 5 4 3 2 1 ใชวัสดุที่ชวยประหยัดพลังงาน 6 5 4 3 2 1 สงมอบบานตรงตามสัญญา 6 5 4 3 2 1 โครงสรางและการกอสรางตรงตามสเปคที่กําหนดไว 6 5 4 3 2 1 ใชวัสดุกอสรางตรงตามสเปคที่กําหนดไว 6 5 4 3 2 1 งานกอสรางมีคุณภาพ 6 5 4 3 2 1 ชางกอสรางมีคุณภาพ 6 5 4 3 2 1 มีการประกันคณุภาพของบานในระยะเวลาที่เหมาะสม 6 5 4 3 2 1 ระบบการประกันหลังการขายมีคุณภาพ 6 5 4 3 2 1 คุณภาพการบริการขณะทานติดตอกับพนักงานขาย เจาหนาที่ ฯ มีความรูเพียงพอแบบมืออาชีพ 6 5 4 3 2 1 เจาหนาที่ ฯ เต็มใจ กระตือรือรนที่จะใหบริการ 6 5 4 3 2 1

335คุณภาพของบานและการบริการ ระดับการประเมนิ
มากที่สุด <------------------------------->นอยที่สุด เจาหนาที่ ฯ มีความรูและทักษะในเรื่องบาน 6 5 4 3 2 1 เจาหนาที่ ฯ ไมดูถูกลูกคา 6 5 4 3 2 1 เจาหนาที่ ฯ ใหการตอนรับเปนอยางดี 6 5 4 3 2 1 เจาหนาที่ ฯ ใหความสําคัญกับทานในฐานะลูกคา 6 5 4 3 2 1
5. ทานมีความคิดเห็นเกี่ยวกับชื่อเสียงของบริษัทผูประกอบการโครงการบานพักอาศัยที่ทานใหความสนใจที่สุดอยางไร
(กรุณาใสเครื่องหมาย ลงในชองที่ตรงกับความรูสึกของทาน)
ชื่อเสียงของบริษทัผูประกอบการโครงการบานพักอาศัยท่ีทานสนใจ ระดับความคิดเห็น เห็นดวยอยางย่ิง <------->ไมเห็นดวยอยางย่ิง
เมื่อพูดถึงบานจัดสรรทานคิดถึงชื่อบริษัทที่ทานซื้อบานทันที 6 5 4 3 2 1 บริษัทนี้จัดเปนบริษัทบานจัดสรรที่มีชื่อเสียงที่สุดในวงการ 6 5 4 3 2 1 บานที่จัดสรรโดยบริษัทนี้จัดเปนบานในระดับหรูหราที่สุดแหงหนึ่ง 6 5 4 3 2 1 ทานยินดีจายเงินแพงกวาเพ่ือซื้อบานที่จัดสรรโดยบริษัทนี้ 6 5 4 3 2 1 ความมีชื่อเสียงของบริษัทชวยชดเชยขอบกพรองเล็กๆนอยๆ ของตัวบานได 6 5 4 3 2 1 ภาพลักษณของบริษัทตรงกับตัวทาน 6 5 4 3 2 1 บานที่จัดสรรโดยบริษัทนี้มีคุณภาพเทาเทียมกันทุกหลัง 6 5 4 3 2 1 บานที่จัดสรรโดยบริษัทนี้มีความทนทาน 6 5 4 3 2 1 บานที่จัดสรรโดยบริษัทนี้มีคุณภาพที่เชื่อถือได 6 5 4 3 2 1 บานที่จัดสรรโดยบริษัทนี้มีคุณภาพเหนือกวาของบริษัทอื่น 6 5 4 3 2 1 ทานจะซื้อบานจากบริษัทนี้เทานั้น 6 5 4 3 2 1 ทานจะพิจารณาเลือกบานที่จัดสรรโดยบริษัทนี้เปนอันดับแรก 6 5 4 3 2 1 ถึงจะมีบานจากบริษัทอื่นที่คุณภาพใกลเคียงกันใหทานเลือก ทานก็ยังคงเลือกบานจากบริษัทนี้อยูดี 6 5 4 3 2 1
6. ทานมีความคิดเห็นเกี่ยวกับบริษัทผูประกอบการบานจัดสรรและเจาหนาที่โครงการที่ทานใหความสนใจอยางไร (กรุณาใสเครื่องหมาย ลงในชองที่ตรงกับความรูสึกของทาน)
ความรูสึกตอบริษัทผูประกอบการและเจาหนาท่ี ระดับความคิดเห็น เห็นดวยอยางย่ิง <------->ไมเห็นดวยอยางย่ิง
ความรูสึกของทานท่ีมีตอเจาหนาท่ีโครงการบานจัดสรรที่ทานสนใจ เจาหนาที่ฯ มีความรับผิดชอบ 6 5 4 3 2 1 เจาหนาที่ฯ มีความจริงใจในการแกปญหา 6 5 4 3 2 1 เจาหนาที่ฯ สามารถเชื่อใจไดวาจะทําตามสัญญาที่ใหไว 6 5 4 3 2 1 เจาหนาที่ฯ คํานึงถึงความตองการของลูกคาเปนสําคัญ 6 5 4 3 2 1 เจาหนาที่ฯ มีความนาเชื่อถือ 6 5 4 3 2 1 เจาหนาที่ฯ มีความซื่อสัตย 6 5 4 3 2 1 เจาหนาที่ฯ คอนขางพูดงาย 6 5 4 3 2 1 เจาหนาที่ฯ สามารถแกปญหาตางๆของลูกคาได 6 5 4 3 2 1 เจาหนาที่ฯ ใหความรวมมือในการแกไขปญหาตางๆเปนอยางดี 6 5 4 3 2 1

336
ความรูสึกตอบริษัทผูประกอบการและเจาหนาท่ี ระดับความคิดเห็น เห็นดวยอยางย่ิง <------->ไมเห็นดวยอยางย่ิง
ทานรูสึกผูกพันกับเจาหนาที่โครงการที่คอยดูแลทาน 6 5 4 3 2 1 ทานคงพูดคุยติดตอกับเจาหนาที่ฯไปเรื่อยๆ แมจะซื้อบานไปแลว 6 5 4 3 2 1 โดยภาพรวมทานสนิทสนมกับเจาหนาที่ฯ ในระดับหนึ่ง 6 5 4 3 2 1 ทานคิดวาสัมพันธภาพที่ดีกับเจาหนาที่โครงการเปนส่ิงสําคัญ 6 5 4 3 2 1 ความรูสึกของทานท่ีมีตอบริษัทผูประกอบการบานจัดสรรที่ทานสนใจ บริษัทผูประกอบการบานจัดสรรของทานเขาใจลูกคาเสมอ 6 5 4 3 2 1 บริษัทผูประกอบการบานจัดสรรของทานเชื่อใจไดทุกเรื่อง 6 5 4 3 2 1 บริษัทผูประกอบการบานจัดสรรของทานมักจะทําถูกตองเสมอ 6 5 4 3 2 1 ทานรูสึกวาหมูบานนี้เปนโครงการบานพักอาศัยที่ดีที่สุดแหงหนึ่ง 6 5 4 3 2 1 ทานรูสึกผูกพันกับบริษัทนี้ 6 5 4 3 2 1 ทานไมเคยคิดจะซื้อบานจากบริษัทอื่น 6 5 4 3 2 1 ทานจะพยายามถึงที่สุดที่จะรักษาความสัมพันธกับบริษัทนี้ไว 6 5 4 3 2 1 การซื้อบานในโครงการนี้นาจะเปนการตัดสินใจที่ถูกตองที่สุดครั้งหนึ่งในชีวิต 6 5 4 3 2 1 ทานรูสึกพอใจในบริการที่ไดรับจากบริษัท ฯ เสมอ 6 5 4 3 2 1 บริการตางๆ ของโครงการฯ ที่ทานไดรับดีเกินความคาดหมาย 6 5 4 3 2 1 ทานคิดวาทานเลือกถูกแลวที่จะซื้อบานจากบริษัท ฯ นี้ 6 5 4 3 2 1
7. ทานมีความคิดเห็นเกี่ยวกับกระบวนการเลือกซื้อบานของทานอยางไร (กรุณาใสเครื่องหมาย ลงในชองที่ตรงกับความรูสึกของทาน)
ความรูสึกท่ีมีตอการซื้อบาน ระดับความคิดเห็น
เห็นดวยอยางย่ิง <----->ไมเห็นดวยอยางย่ิง เมื่อคิดถึงตอนซื้อบานทานรูสึกเครียดทันที 6 5 4 3 2 1 ความยุงยากของการเลือกซื้อบานทําใหทานรูสึกอึดอัด 6 5 4 3 2 1 ทานรูสึกวิตกกังวลอยางมากตอนตัดสินใจเลือกบาน 6 5 4 3 2 1 ตอนตัดสินใจเลือกทานรูสึกกังวลวาคุณภาพของบานจะเชื่อถือไดเพียงใด 6 5 4 3 2 1 ทานกลัววาบานที่ทานจะซื้ออาจไมสามารถใชประโยชนไดอยางที่คาดไว 6 5 4 3 2 1 ทานกลัววาคุณภาพของบานที่ทานจะซื้ออาจไมไดตามระดับที่คาดหวังไว 6 5 4 3 2 1 ทานกลัวจะถูกดูถูกหากซื้อบานในหมูบานที่ไมมีชื่อเสียง 6 5 4 3 2 1 ตอนเลือกบานทานกังวลวาจะไดเพ่ือนบานที่ดีหรือไม 6 5 4 3 2 1 ทานกลัววาบานที่ซื้อจะแพงกวาหมูบานอื่นในระดับเดียวกัน 6 5 4 3 2 1 ทานไมแนใจวาหากทานตอรองมากขึ้นกวานี้ ทางโครงการจะลดราคาใหทานหรือไม 6 5 4 3 2 1 ทานกลัววาทานอาจจะซื้อบานแพงกวาลูกคาคนอื่น 6 5 4 3 2 1 ทานพยายามหาขอมูลเพ่ือเปรียบเทียบโครงการบานจัดสรรที่ขายอยูในปจจุบันใหไดมากที่สุด 6 5 4 3 2 1
ทานตองไดขอมูลที่เกี่ยวของทั้งหมดเกี่ยวกับตัวบาน ส่ิงแวดลอม และบริษัทผูประกอบการกอนตัดสินใจซื้อ 6 5 4 3 2 1
ทานทุมเทเวลาอยางมากในการในตระเวณดูและตัดสินใจเลือกซื้อบาน 6 5 4 3 2 1 ทานทุมเทแรงกายแรงใจอยางมากในการเลือกซื้อบาน 6 5 4 3 2 1 ทานเสียคาใชจายในตระเวณดูบานเปนอยางมาก 6 5 4 3 2 1

337
ความรูสึกท่ีมีตอการซื้อบาน ระดับความคิดเห็น
เห็นดวยอยางย่ิง <----->ไมเห็นดวยอยางย่ิง โดยภาพรวมทานคิดวาคุณภาพของบานที่ทานสนใจคุมคาสมราคา 6 5 4 3 2 1 บานที่ทานสนใจคุมคาสมราคากวาบานในหมูบานอื่น 6 5 4 3 2 1 บานที่ทานสนใจจัดอยูในระดับที่สูงกวามาตรฐานทั่วไป 6 5 4 3 2 1 ทานเชื่อในคุณภาพของบานที่ทานสนใจ 6 5 4 3 2 1 ทานชอบที่จะใชชีวิตในบานหลังนี้ 6 5 4 3 2 1 การไดเปนเจาของบานหลังนี้นาจะทําใหทานรูสึกดี 6 5 4 3 2 1 ทานคิดวาการไดเปนเจาของบานหลังนี้ทําใหคนมองทานดีขึ้น 6 5 4 3 2 1 บานที่ทานจะซื้อนาจะชวยใหคนอื่นประทับใจในตัวทาน 6 5 4 3 2 1 บานที่ทานจะซื้อนาจะมีสวนทําใหทานไดรับการยอมรับในสังคม 6 5 4 3 2 1
8. ความคิดเห็นเกี่ยวกับราคาบานที่ทานซื้อ (กรุณาใสเครื่องหมาย ทับบนตัวเลขที่ตรงกับความรูสึกของทานที่สุดเชนในขอ 6.1 หากทานคิดวาบานที่ทานซื้อแพงกวาบานในหมูบานอื่นมากใหทานใสเครื่องหมายทับเลข 1 แตหากทานคิดวาบานที่ทานซื้อคอนขางแพงกวาบานในหมูบานอื่นทานอาจเลือกใสเครื่องหมายบนตัวเลข 2 หรือ3 เปนตน)
8.1 เมื่อเปรียบเทียบกับหมูบานอื่นในระดับเดียวกันบานที่ทานสนใจ ถูกกวา 6 5 4 3 2 1 แพงกวา
8.2 ราคาบานที่ทานสนใจอยูในระดับที่ทาน รับผิดชอบไดสบายๆ 6 5 4 3 2 1 ตองใชจายอยางระวัง
8.3 ราคาบานที่ทานสนใจอยูในระดับที่ เหมาะสม 6 5 4 3 2 1 ไมเหมาะสม
8.4 รายการสงเสริมการขายของบานที่ทานสนใจ นาสนใจ 6 5 4 3 2 1 ไมนาสนใจ
8.5 เง่ือนไขการชําระเงินชวยใหทานตัดสินใจ งายขึ้น 6 5 4 3 2 1 ยากขึ้น
9. ปจจัยขางตนโดยรวมทั้งทางดานทําเล ตัวบาน ราคา คุณภาพการบริการ และ ความสัมพันธกับบริษัท ฯ มีอิทธิพลตอการตัดสินใจ
ซื้อบานของทานเพียงไร (กรุณาใสเครื่องหมาย ทับบนตัวเลขที่ตรงกับความรูสึกของทานที่สุด) มากที่สุด 1 2 3 4 5 6 7 นอยที่สุด
10. ทานคาดวาทานมีโอกาสที่จะตัดสินใจซื้อบานหลังนี้เพียงใด ตัดสินใจซื้อเรียบรอยแลว ยังไมไดตัดสินใจแตคิดวาโอกาสที่จะซื้อนาจะเปน _________________ เปอรเซนต (กรุณาตอบเปนตัวเลขจาก 0 ถึง 100) 11. บานที่ทานสนใจมีขนาด _________________ ตารางวา ราคา ____________________________ บาท (โดยไมรวมคาตกแตงหรืออื่นๆ ซ่ึงไมใชบริการของบริษัทผูประกอบการบานจัดสรร)

33812. การซื้อบานครั้งนี้เปนการซื้อบานหลังแรกของทานใชหรือไม ใช (กรุณาขามไปขอ 14) ไมใช 13. บานที่ทานเคยซื้อมากอนเปนบานแบบใด คอนโดมิเนียม อาคารพาณิชย ทาวนเฮาส บานเดี่ยว อ่ืนๆ _________ 14. นับตั้งแตเริ่มดูบานจนถึงปจจุบันทานไดเขาชมโครงการบานจัดสรรท้ังหมดแลวจํานวน _______________แหง ทานไดเขาชมโครงการบานท่ีทานสนใจที่สุดแหงน้ีมาแลว ________________ครั้ง 15. ทานใชเวลานานเทาไรต้ังแตเร่ิมดูบานจนถึงปจจุบัน นอยกวา 3 เดือน 4-6 เดือน 7-12 เดือน 1–2 ป มากกวา 2 ป ขอมูลสวนบุคคล 1. ระดับการศึกษา ตํ่ากวาปริญญาตรี ปริญญาตรี ปริญญาโท สูงกวาปริญญาโท 2. อายุ ตํ่ากวา 25 ป 25-30 ป 31-40 ป 41-50ป มากกวา 50 ป 3. สถานภาพสมรส สมรส จํานวนบุตร_________ คน โสด อ่ืนๆ _________ 4. รายไดของครอบครัวตอเดือน ไมเกิน 20,000 บาท 20,000-40,000 บาท 40,001-60,000 บาท 60,001-80,000 บาท 80,001-100,000 บาท 100,001-150,000 บาท 150,001-200,000 บาท 200,000 บาทขึ้นไป 5. จํานวนสมาชิกในครอบครัว __________________ คน คนรับใช __________________ คน 6. เหตุผลที่ทานซื้อบาน (เลือกไดมากกวา 1 ขอ) แยกครอบครัว แตงงาน ตองการสภาพแวดลอมที่ดีขึ้น เดินทางสะดวก ตองการที่อยูอาศัยที่กวางขึ้น ซื้อเก็บไวในอนาคต ซื้อเพ่ือการลงทุน อยากไดบานใกลที่ทํางาน อ่ืน ๆ (ระบุ) _________________
ขอขอบคุณทกุทานที่ใหความรวมมือในการตอบแบบสอบถาม

339
APPENDIX C
Normal Q-Q Plots for Univariate Normality And
Tests of Multivariate Normality

340
Tests of Univariate Normality
Kolmogorov-Smirnov(a) Shapiro-Wilk
Statistic df Sig. Statistic df Sig. PERCEIVED VALUE .061 841 .000 .988 841 .000PRODUCT QUALITY .044 841 .001 .986 841 .000SERVICE QUALITY .082 841 .000 .973 841 .000BRAND EQUITY .055 841 .000 .990 841 .000Personal Trust .060 841 .000 .986 841 .000Personal Commitment .088 841 .000 .986 841 .000
RQ: Firm Level .062 841 .000 .994 841 .002PERCEIVED RISK .043 841 .001 .993 841 .000CONSUMER INVOLVEMENT .096 841 .000 .977 841 .000
PERCEIVED PRICE .079 841 .000 .983 841 .000
a Lilliefors Significance Correction
642
Observed Value
2.5
0.0
-2.5
Expe
cted
Nor
mal
Normal Q-Q Plot of PERCEIVED VALUE
642
Observed Value
3
2
1
0
-1
-2
-3
-4
Exp
ecte
d N
orm
al
Normal Q-Q Plot of PRODUCT QUALITY
7654321
Observed Value
2
1
0
-1
-2
-3
-4
Expe
cted
Nor
mal
Normal Q-Q Plot of SERVICE QUALITY
7654321
Observed Value
2.5
0.0
-2.5
Expe
cted
Nor
mal
Normal Q-Q Plot of BRAND EQUITY

341
642
Observed Value
3
2
1
0
-1
-2
-3
Expe
cted
Nor
mal
Normal Q-Q Plot of RQ: Personal Trust
642
Observed Value
2.5
0.0
-2.5
Expe
cted
Nor
mal
Normal Q-Q Plot of RQ: Personal Commitment
642
Observed Value
3
2
1
0
-1
-2
-3
-4
Expe
cted
Nor
mal
Normal Q-Q Plot of RQ: Firm Level
7654321
Observed Value
3
2
1
0
-1
-2
-3
-4
Expe
cted
Nor
mal
Normal Q-Q Plot of PERCEIVED RISK
7654321
Observed Value
3
2
1
0
-1
-2
-3
Expe
cted
Nor
mal
Normal Q-Q Plot of CONSUMER INVOLVEMENT
642
Observed Value
2.5
0.0
-2.5
Expe
cted
Nor
mal
Normal Q-Q Plot of PERCEIVED PRICE

342
Tests of Multivariate Normality Measurement Model for Perceived Value Variable min max skew c.r. kurtosis c.r. vs1 2.000 6.000 .041 .483 -.132 -.779 vs3 2.000 6.000 .036 .423 -.707 -4.186 vs2 2.000 6.000 .071 .838 -.512 -3.028 vp6 2.000 6.000 -.197 -2.334 -.432 -2.559 vp5 2.000 6.000 -.060 -.705 -.280 -1.660 vp4 2.000 6.000 -.056 -.660 -.439 -2.596 vp3 2.000 6.000 -.093 -1.099 -.260 -1.537 vp2 2.000 6.000 -.179 -2.120 -.033 -.195 vp1 2.000 6.000 -.199 -2.358 .862 5.104 Multivariate -.794 -.818 Measurement Model for Relationship Quality Variable min max skew c.r. kurtosis c.r. rpc1 1.000 6.000 .022 .262 .034 .200 rfc5 1.000 6.000 -.160 -1.899 -.198 -1.171 rfs1 2.000 6.000 .023 .270 -.302 -1.785 rfs2 1.000 6.000 -.094 -1.113 -.151 -.892 rfs3 2.000 6.000 .001 .008 -.114 -.674 rfc1 2.000 6.000 -.060 -.707 -.058 -.341 rfc2 1.000 6.000 -.169 -1.995 .088 .518 rfc3 1.000 6.000 -.227 -2.689 .250 1.481 rfc4 1.000 6.000 -.151 -1.791 -.054 -.322 rft1 1.000 6.000 -.063 -.741 -.152 -.903 rft2 1.000 6.000 .069 .822 -.012 -.072 rft3 1.000 6.000 .020 .236 .172 1.016 rpc2 1.000 6.000 .102 1.207 .160 .949 rpc3 1.000 6.000 .116 1.373 .112 .661 rpc4 1.000 6.000 .126 1.492 -.245 -1.451 rpt1 2.000 6.000 -.162 -1.916 -.289 -1.710 rpt2 2.000 6.000 -.016 -.192 -.414 -2.450 rpt3 2.000 6.000 .027 .323 -.374 -2.212 rpt4 2.000 6.000 .064 .760 -.465 -2.753 rpt5 2.000 6.000 .109 1.292 -.501 -2.966 rpt6 2.000 6.000 .095 1.120 -.492 -2.914 rpt7 2.000 6.000 .021 .244 -.415 -2.454 rpt8 2.000 6.000 .050 .591 -.557 -3.298 rpt9 2.000 6.000 .022 .256 -.466 -2.761 Multivariate 31.422 12.897

343
APPENDIX D
Pairwise Parameter Comparisons For
SEM: Multi-group Analyses

344
Critical Ratios for Differences between Parameters Recent Home Buyers: Brand Comparison
Differences of each pair of the Estimated Structural Relation Coefficients between Premium & Non Premium Brand
Constructs z-value Significant level* Product Quality Perceived Value -1.113 NS Service Quality Perceived Value 0.401 NS Brand Equity Perceived Value 0.128 NS Perceived Price Perceived Value 0.023 NS Perceived Risk Perceived Value -1.664 NS Customer Involvement Perceived Value -0.493 NS Relationship Quality Perceived Value -1.138 NS Product Quality Relationship Quality -1.258 NS Service Quality Relationship Quality 0.554 NS Brand Equity Relationship Quality 0.052 NS Perceived Risk Relationship Quality 0.013 NS Customer Involvement Relationship Quality -0.358 NS
* Z-values of the different between parameters were gathered from the pairwise parameter comparisons. Z-value of >1.96 is significant at p<.05; N.S. = Not Significant
Critical Ratios for Differences between Parameters
Recent Home Buyers: Price Comparison Differences of each pair of the Estimated Structural Relation Coefficients between Price Level
Constructs z-value S-M M-L S-L
Significant level*
Product Quality Perceived Value 0.200 -1.572 -1.417 NS Service Quality Perceived Value -0.603 -0.081 -0.650 NS Brand Equity Perceived Value 0.504 -1.613 -1.160 NS Perceived Price Perceived Value 0.958 -0.374 0.517 NS Perceived Risk Perceived Value 1.182 -0.027 0.978 NS Customer Involvement Perceived Value 0.042 0.701 0.743 NS Relationship Quality Perceived Value 0.701 1.922 2.590 NS Product Quality Relationship Quality 0.170 -1.805 -1.700 NS Service Quality Relationship Quality -0.775 0.281 -0.461 NS Brand Equity Relationship Quality 0.482 0.478 0.904 NS Perceived Risk Relationship Quality 0.724 -1.507 -0.892 NS Customer Involvement Relationship Quality 0.369 -0.128 0.206 NS
* Z-values of the different between parameters were gathered from the pairwise parameter comparisons. Z-value of >1.96 is significant at p<.05; N.S. = Not Significant S = 3-4.99 Million Baht; M= 5-10 Million; L=More Than 10 Million Baht Houses
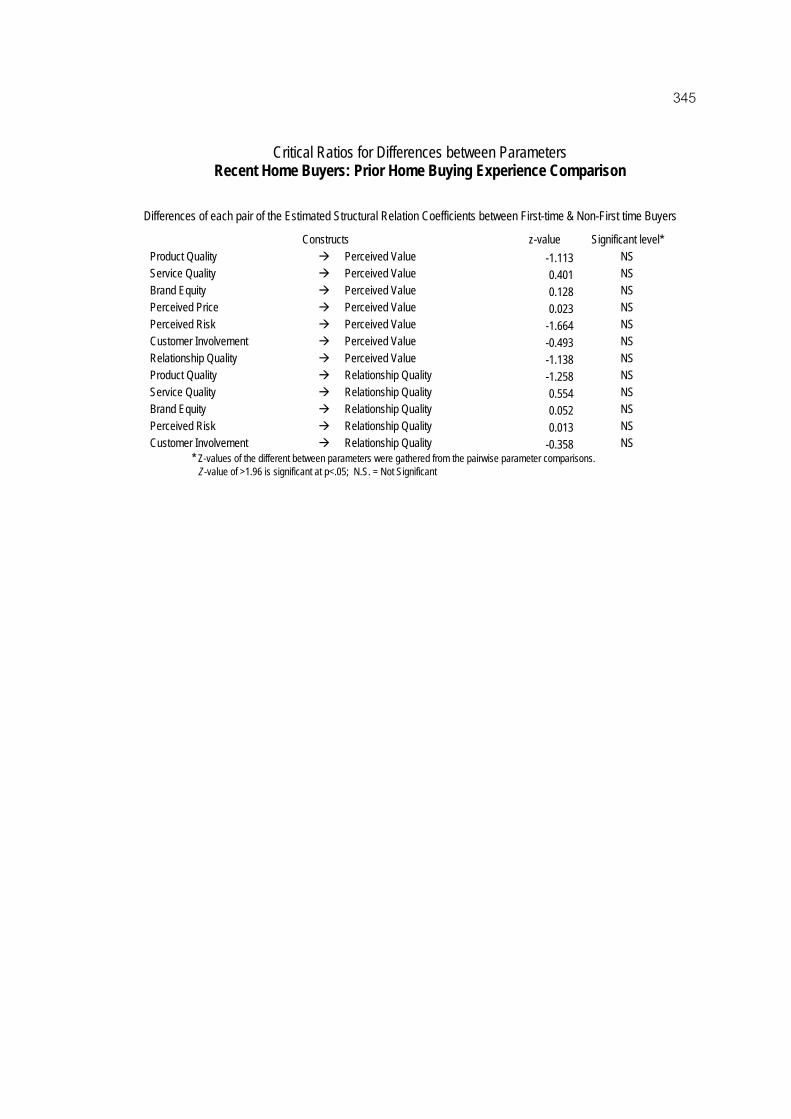
345
Critical Ratios for Differences between Parameters Recent Home Buyers: Prior Home Buying Experience Comparison
Differences of each pair of the Estimated Structural Relation Coefficients between First-time & Non-First time Buyers
Constructs z-value Significant level* Product Quality Perceived Value -1.113 NS Service Quality Perceived Value 0.401 NS Brand Equity Perceived Value 0.128 NS Perceived Price Perceived Value 0.023 NS Perceived Risk Perceived Value -1.664 NS Customer Involvement Perceived Value -0.493 NS Relationship Quality Perceived Value -1.138 NS Product Quality Relationship Quality -1.258 NS Service Quality Relationship Quality 0.554 NS Brand Equity Relationship Quality 0.052 NS Perceived Risk Relationship Quality 0.013 NS Customer Involvement Relationship Quality -0.358 NS
* Z-values of the different between parameters were gathered from the pairwise parameter comparisons. Z-value of >1.96 is significant at p<.05; N.S. = Not Significant

346
Critical Ratios for Differences between Parameters Prospect Home Buyers: Brand Comparison
Differences of each pair of the Estimated Structural Relation Coefficients between Premium & Non Premium Brand
Constructs z-value Significant level* Product Quality Perceived Value 0.609 NS Service Quality Perceived Value 0.913 NS Brand Equity Perceived Value -0.514 NS Perceived Price Perceived Value 0.24 NS Perceived Risk Perceived Value 0.865 NS Customer Involvement Perceived Value 0.056 NS Relationship Quality Perceived Value 0.073 NS Product Quality Relationship Quality 1.565 NS Service Quality Relationship Quality -0.765 NS Brand Equity Relationship Quality -0.828 NS Perceived Risk Relationship Quality 0.149 NS Customer Involvement Relationship Quality 0.853 NS
* Z-values of the different between parameters were gathered from the pairwise parameter comparisons. Z-value of >1.96 is significant at p<.05; N.S. = Not Significant
Critical Ratios for Differences between Parameters Prospect Home Buyers: Prior Home Buying Experience Comparison
Differences of each pair of the Estimated Structural Relation Coefficients between First-time & Non-First time Buyers
Constructs z-value Significant level* Product Quality Perceived Value -0.176 NS Service Quality Perceived Value 0.028 NS Brand Equity Perceived Value 0.844 NS Perceived Price Perceived Value -0.381 NS Perceived Risk Perceived Value 1.012 NS Customer Involvement Perceived Value 0.755 NS Relationship Quality Perceived Value -0.256 NS Product Quality Relationship Quality 0.99 NS Service Quality Relationship Quality -0.703 NS Brand Equity Relationship Quality 0.844 NS Perceived Risk Relationship Quality 0.098 NS Customer Involvement Relationship Quality 0.042 NS
* Z-values of the different between parameters were gathered from the pairwise parameter comparisons. Z-value of >1.96 is significant at p<.05; N.S. = Not Significant

347
APPENDIX E
Presentation Slides

348
The Role of Perceived Value in a High Involvement Purchase DecisThe Role of Perceived Value in a High Involvement Purchase Decision Process: A Case Study in Home Buyingion Process: A Case Study in Home Buying
The Role of Perceived Value in a High Involvement Purchase Decision Process:
A Case Study in Home Buying
Presented by
Nucharee Supatn
Advisor: Assoc. Prof. Dr. Ruth Banomyong
Committee members:Prof. Dr. Robert T GreenAssoc. Prof. Dr. Pradit WanaratAsst. Prof. Dr. Thanawan Sangsuwan
December 20, 2006
The Role of Perceived Value in a High Involvement Purchase DecisThe Role of Perceived Value in a High Involvement Purchase Decision Process: A Case Study in Home Buyingion Process: A Case Study in Home Buying
AgendaAgenda
• Introduction• Research Questions• Research Framework• Research Methodology-Data Collection• Results• Discussions and Conclusions• Contributions of the research
– Theoretical contributions– Managerial Implications
• Limitations, Recommendations, and Suggestions for the future research

349
The Role of Perceived Value in a High Involvement Purchase DecisThe Role of Perceived Value in a High Involvement Purchase Decision Process: A Case Study in Home Buyingion Process: A Case Study in Home Buying
IntroductionIntroduction
The focus of the dissertation is to examine the major decision-making models and factors that underline consumer’s decision processes– Entire Process of Decision Making– High Involvement Purchase– Real Estate Industry
• Purchasing of a single detached house
““How do consumers make decisions?How do consumers make decisions?””
The Role of Perceived Value in a High Involvement Purchase DecisThe Role of Perceived Value in a High Involvement Purchase Decision Process: A Case Study in Home Buyingion Process: A Case Study in Home Buying
2nd stage decision1st stage decision
Stages Model of decision makingStages Model of decision making
Stage 1Problem
Recognition
Stage 1Stage 1Problem
Recognition
Stage 2Information
Search
Stage 2Stage 2Information
Search
Stage 3Evaluation of Alternatives
Stage 3Stage 3Evaluation of Alternatives
Stage 4Choice
Selection
Stage 4Stage 4Choice
Selection
External
Internal
Stage 5Post-purchase
Behavior
Stage 5Stage 5Post-purchase
Behavior
Consideration SetConsideration Set Final Choice SelectionFinal Choice Selection
Major Research QuestionsMajor Research Questions• What are the common criteria and decision rules consumers use
when they are forming their consideration set?• How consumers create their perceived value of a product and
how their perceived value influences their choice selection?
Source: Engel et al, 1968; Hanna & Wozniak, 2001
Source: Howard and Sheth, 1969; Narayana & Markin, 1975; Bettman and Park, 1980.

350
The Role of Perceived Value in a High Involvement Purchase DecisThe Role of Perceived Value in a High Involvement Purchase Decision Process: A Case Study in Home Buyingion Process: A Case Study in Home Buying
1st Stage Purchase Decision 2nd stage Purchase Decision
Perceived ValuePerceived Value Choice SelectionChoice
SelectionANTECEDENTS
for the Consideration SetANTECEDENTS
for the Consideration Set
Relationship QualityRelationship Quality
Consumer InvolvementConsumer Involvement
Product Quality & Sales Service QualityProduct Quality & Sales Service Quality
Perceived PricePerceived Price
Perceived RiskPerceived Risk
Brand EquityBrand Equity
PERSONAL FIRM
Specifying research questions1. What are the key attributes consumers use in developing a consideration set? 2. How do consumers develop their perceived value for each choice?3. What are the key determinants for value creation?4. What are the relationships among those determinants? 5. How does brand affect consumer decision? 6. What are the specific characteristics of perceived risk in home buying process? 7. How does perceived value affect the final choice selection?8. Do the effects of the antecedents of perceived value and purchase decision differ between
experienced and less experienced customers?
Research FrameworkResearch Framework
The Role of Perceived Value in a High Involvement Purchase DecisThe Role of Perceived Value in a High Involvement Purchase Decision Process: A Case Study in Home Buyingion Process: A Case Study in Home Buying
Data CollectionData Collection
• Exploratory phase: Focus Group Discussion – To study the major antecedents for consideration set formation – Ten focus group discussions with 70 recent home buyers
categorized by price and brand• Price at <5 million/ one real estate developer (group 1 & 2)• Price at <5 million/ various real estate developers (group 3 & 4)• Price at =5 million/ one real estate developer (group 5, 6, & 7)• Price at =5 million/ various real estate developers (group 8, 9, & 10)
• Survey

351
The Role of Perceived Value in a High Involvement Purchase DecisThe Role of Perceived Value in a High Involvement Purchase Decision Process: A Case Study in Home Buyingion Process: A Case Study in Home Buying
SurveySurvey• Population & sampling • Group 1: Recent home buyers
– who already bought single detached houses within 2 years – Sample size: 420 home buyers (400 expected)– Sampling Procedure:
• Non-probability-Quota sampling with snowball techniques– 210 Premium-brand samples and 210 Non-premium brand samples– During May 3- 30, 2006
• Group 2: Prospective home buyers – Sample size: 421 home buyers (400 expected)– Sampling Procedure:
• Non-probability sampling - In Person-Drop off survey– The “14th Housing and Condo Exhibition”
at Queen Sirikit National Conventional Center – During 4-7 May, 2006
The Role of Perceived Value in a High Involvement Purchase DecisThe Role of Perceived Value in a High Involvement Purchase Decision Process: A Case Study in Home Buyingion Process: A Case Study in Home Buying
Focus Group Discussion ResultsFocus Group Discussion Results
Content Analysis of the data gathered from FGD• Four common criteria
– Location– Brand– Size and style– Price

352
The Role of Perceived Value in a High Involvement Purchase DecisThe Role of Perceived Value in a High Involvement Purchase Decision Process: A Case Study in Home Buyingion Process: A Case Study in Home Buying
SURVEY RESULTSSURVEY RESULTS• Sample Profile• Item Analyses
– Reliability & item-to-total Analyses– EFA– CFA
• SEM Analysis: – Model fits and hypotheses tests for the recent home buyers– Model fits and hypotheses tests for the prospective home
buyers – Comparisons between recent and prospective home buyers– Alternative models
Mean comparison
EFA
CFA
Assumption Check
Fit Indices
Discriminant Valiity
The Role of Perceived Value in a High Involvement Purchase DecisThe Role of Perceived Value in a High Involvement Purchase Decision Process: A Case Study in Home Buyingion Process: A Case Study in Home Buying
Sample Profiles Sample Profiles
3.17 (SD=1.69)91
0.4 %15.7 %69.8 %14.0 %
2.9 %1.6 %3.1 %7.1 %
12.6 %30.9 %39.4 %2.4 %1.2 %
66.7 %32.1 %4.3 %
13.3 %34.7 %47.7 %
Prospective (n=421)
4.20 (SD=1.64)Average size (persons)13Maximum family members1Minimum family membersFamily Size
2.4 %Doctorate20.7 %Master’s60.5 %Bachelor’s16.4 %Less than bachelor’s Education16.0 %More than 200,000 Baht12.4 %150,000-200.000 Baht13.3 %100,001-150,000 Baht9.3 %80,001-100,000 Baht
13.8 %60,001-80,000 Baht18.0 %40,001-60,000 Baht12.4 %20,000-40,000 Baht4.8 %Less than 20,000 BahtFamily Income2.4 %Others
36.4 %Single61.2 %MarriedMarital Status20.5 %More than 50 years old26.6 %41-50 years old26.9 %31-40 years old26.0 %25-30 years oldAge
Recent (n=420)Demographic Characteristics

353
The Role of Perceived Value in a High Involvement Purchase DecisThe Role of Perceived Value in a High Involvement Purchase Decision Process: A Case Study in Home Buyingion Process: A Case Study in Home Buying
Housing Profiles Housing Profiles
44.8 %55.2 %
3.124.97211
25.24 %34.76 %
40 %3.65.9253
72.5103.750050
44.8 %7.1 %8.1 %40 %
50.2 %49.8 %Recent
31.8 %68.2 %
5.946.71301
2.4 %15.2 %82.4 %
2.23.9333
41.675.625050
37.1 %7.4 %
12.1 %43.4 %36.8 %62.3 %
Prospective
Non First-time Home Buyers First-time Home buyers Prior Home Buying Experience SDAverage No.Maximum No.Minimum No.Projects Visited (Numbers)More than 10 million baht5 to 10 Million Baht3 to 4.99 Million BahtPrice Level SD Average Price Highest price Lowest price Price Range and Average (Million Baht)SDAverage Size Biggest Size Smallest Size Size of the House (wah2)Not Consistent with Any Recalled BrandConsistent with the Third Recalled Brand Consistent with the Second Recalled Brand Consistent with the First Recalled Brand Brand Selection Non-Premium BrandsPremium BrandsBrand of Real Estate Developers
Housing Characteristics
The Role of Perceived Value in a High Involvement Purchase DecisThe Role of Perceived Value in a High Involvement Purchase Decision Process: A Case Study in Home Buyingion Process: A Case Study in Home Buying
Item AnalysesItem Analyses
Reliability & item-to-total Analyses• Delete 2 PQ items due to low
correlation with other items:– Design (ph1) – utility functions of the houses (ph2)
• EFA• CFA
SamplesPretest
.929 (.925/.938)
.962 (.944/.974)
.894 (.908/.883)
.952 (.964/.968)
.952 (.950/.953)
.959 (.922/.945)
.971(.958/.957)
.931 (.912/.934)
.894Customer Involvement
.895Perceived Risk
.764Perceived Price
.968Relationship Quality
.959Brand Equity
.928Service Quality
.934Product Quality
.913Perceived Value
αConstruct
Mean comparison
EFA
CFA
Assumption Check
Fit Indices
Discriminant Valiity

354
The Role of Perceived Value in a High Involvement Purchase DecisThe Role of Perceived Value in a High Involvement Purchase Decision Process: A Case Study in Home Buyingion Process: A Case Study in Home Buying
Exploratory Factor Analysis (EFA)Exploratory Factor Analysis (EFA)
Factor LoadingsAll exceeded the cutoff point of .50
Variance extractedvaried from 70.29% to 83.08%
KMO measurevaried from .829 to .967 cut off point =.7
Bartlett’s test:p<.000
Relationship QualityRelationship Quality
Consumer InvolvementConsumer Involvement
Product QualityProduct Quality
Perceived PricePerceived Price
Perceived RiskPerceived Risk
Brand EquityBrand Equity
Perceived ValuePerceived ValueChoice
SelectionChoice
Selection
Personal Trust
Relations with Firm
Personal Commitment
Housing Factor
Sales Service Quality
Environmental FactorsLocation
Brand AssociationPerceived QualityBrand Loyalty
Psycho & Functional RiskSocial & Financial Risk
Psychological Value
Social Value
EFA
The Role of Perceived Value in a High Involvement Purchase DecisThe Role of Perceived Value in a High Involvement Purchase Decision Process: A Case Study in Home Buyingion Process: A Case Study in Home Buying
Confirmatory Factor Analysis (CFA)Confirmatory Factor Analysis (CFA)
• CFA of PQ, SQ, BQ, RISK, PRICE, INV by AMOS 6 were done. • Results are consistent with the results of EFA • No modification from CFA results • Discriminant Validity was illustrated• Assumption and Requirement Checks for the SEM
Sample Size; Missing Data; Continuous Variables; Univariate & Multivariate Normal Distribution;Correlations and Multicollinearity
.83
.82Psychological ValueVFUNC1
VFUNC2
VFIN1
VFIN2
VEMO1
VEMO2
VSOC1 .88
VSOC2
VSOC3
.87.88
Social Value
.80
.85
.81
.79
.84
Perceived Value
.83
Perceived Value
χ2/df = 1.953; GFI=.988; IFI=.996; NNFI=.994; CFI=.996; RMSEA=.034AVE = .77; Construct Reliability (α) = .97
CFA

355
The Role of Perceived Value in a High Involvement Purchase DecisThe Role of Perceived Value in a High Involvement Purchase Decision Process: A Case Study in Home Buyingion Process: A Case Study in Home Buying
er1
er2
er3 p l3
p l2
p l11
1
1pql
1
er7
er8
er9 p e4
p e3
p e2
pqe
1
1
1
1
er14
er15
er16
er17 p h 8
p h 7
p h 6
p h 5
pqh
1
1
1
1
er12 p h 31
er18 p h 91
er19 p h 101
er20 p h 111
er35
er36
er37
er38
er39 sq 6
sq 5
sq 4
sq 3
sq 2
sq
1
1
1
er43
er44 in v5
in v4
in v3 inv
er45
er46
er47 p r3
p r2
p r1
pric
1
er34 sq 11
1
er21
er22 baw2
baw11
1
er23
er24
er25
er26 ba4
ba3
ba2
ba1bqas
1
1
1
1
er27
er28
er29
er30 bq 4
bq 3
bq 2
bq 1
bqq
1
1
1
1
1
er31
er32
er33 bl3
bl2
bl1
bq l
1
1
1
1
bq
risk
1
riskp 1 riskp 2 riskp 3 risk f1 risk f2 risk f3 riskm1 riskm2 riskm3
er74 er75 er76 er77 er78 er79 er82 er83 er84
1 1 1 1 1 1 1 1 1
pqrp t6rp t5rp t4
er55er54er53
rqtp
111
rp t9rp t8rp t7
er58er57er56
111
rp t3rp t2rp t1
er52er51er50
111
rp c3rp c2rp c1
er61er60er59
1
1
rp c4
er62
1
rqcp
er70
er69
er68
er67
er66rfc1
rfc2
rfc3
rfc4
rfc5
rqf
1
1
1
1
11
er73
er72
er71rfs1
rfs2
rfs31
1
1
z21
z1
z15
z3
z5
z6
z7
z9
z10rpsy rf in
z16
z17
1
1
1
value
vp 2
vp 3
vp 4
vp 5
vp 6
vs1
vs2
vs3
vp 1 er85
er87
er88
er89
er90
er91
er92
er93
er86
1
1
1
1
1
1
1
1
1
z4
z14
z13
z12
z8
z11
z24
er4 p l41
er5 p l51
er6 p e11
er13 p h 41
er40 in v1
er41 in v21
er48 p r4
er49 p r5
er65rft31
er64rft21
er63rft11
11
Pval
Sval
risks1 risks2
er80 er81
1 1
1
1
1
1
z23
z22
1
1
1
1
1
1
1
1
1
1
1
1
1
1
1
Probability to select the choice
er100
1
1
1
1
1
1
1
1
1
1
1
1
1
1
1
1
er1011
1
rq
z18
1
1
1
1
AMOS Graphical Model for Both Data Sets AMOS Graphical Model for Both Data Sets ((Base ModelBase Model))
The Role of Perceived Value in a High Involvement Purchase DecisThe Role of Perceived Value in a High Involvement Purchase Decision Process: A Case Study in Home Buyingion Process: A Case Study in Home Buying
Structural Relations and Hypotheses Test: Recent Home BuyersStructural Relations and Hypotheses Test: Recent Home Buyers
R2 =.633 (perceived Value)
.044.910.907.9101.800Hypothesized Model Fits<.08 (<.05)>.90>.90>.90<3.00Recommended Level
RMSEACFINNFIIFI?2/ dfFit Indices
Remarks: IFI = Incremental Fit Index; NNFI = Non-Normed Fit Index; CFI = Comparative Fit Index; RMSEA= Root Mean Square Error of Approximation
H1:PQ Val
-.174***
Relationship Quality
Perceived Value
.171***
.596***
.425***
Perceived Risk
Social Risk
Personal Trust
Personal Commitment
Product Quality
Location
Environment
Housing Factors
Brand Association
Perceived Quality
Brand Loyalty
Brand Equity
Service Quality
Customer Involvement
Perceived Price
Personal Value
Social Value
Relation with Firm
Psycho-Risk
.879***
.838***
.887***
.874***
. 823***
.808***
.936***
.820***
.890*** .920*** .919***
.151**
.109**
-.177*** NS NS -.108**
.105* .921*** .935***
.180***
H5:Risk Val
H4:Price Val
H3: RQ Val
H2: BQ Val H6- Inv Val
H7: PQ RQ Val
H8: BQ RQ Val
H9: Risk RQ Val
H10: Inv RQ ValH7a: SQ RQ Val
H1d:SQ Val
Regression
Sobel Recent
Sobel Test

356
The Role of Perceived Value in a High Involvement Purchase DecisThe Role of Perceived Value in a High Involvement Purchase Decision Process: A Case Study in Home Buyingion Process: A Case Study in Home Buying
Hypotheses Test for the SubHypotheses Test for the Sub--dimensions of the Antecedentsdimensions of the Antecedents
χ2/df = 2.262; RMSEA=.055; IFI=.857; NNFI=.853; CFI=.857
Housing Factors
Social Risk
Location Environment
PsychoRisk
Perceived Value
Customer Involvement
Relationship Quality
Personal Trust
Personal Commitment
Brand Association
Perceived QualityBrand Loyalty
Brand Equity
Service Quality
Perceived Price
Personal Value
Social Value
Relation with Firm
-.191** -.001
.098** .049 .017H1c: Location Val
H1a: House ValH1b: Env Val
H5a: Psy risk Val
H5b: Soc risk Val
The Role of Perceived Value in a High Involvement Purchase DecisThe Role of Perceived Value in a High Involvement Purchase Decision Process: A Case Study in Home Buyingion Process: A Case Study in Home Buying
Hypotheses Test for the SubHypotheses Test for the Sub--dimensions of the Mediatordimensions of the Mediator
χ2/df = 1.595; RMSEA=.038; IFI=.933; NNFI=.931; CFI=.933
H3a: Trust Val
H3b: Commit Val
H3c: RQ-firm Val
Personal Commitment
Brand Equity
Perceived Value
Relation with Firm
Personal Trust
Perceived Risk
Social Risk
Product Quality
Location
Environment
Housing Factors
Brand Association
Perceived QualityBrand Loyalty
Service Quality
Customer Involvement
Perceived Price
Personal Value
Social Value
Psycho-Risk
.612***
.208***
.478***
.672***
.320***
.258***
H8a: BQ trust
H8b: BQ Commit
H8c: BQ Relations with firm

357
The Role of Perceived Value in a High Involvement Purchase DecisThe Role of Perceived Value in a High Involvement Purchase Decision Process: A Case Study in Home Buyingion Process: A Case Study in Home Buying
Hypotheses Test for the moderating effect and robustness of the Hypotheses Test for the moderating effect and robustness of the modelmodelPost Post ––Purchase BuyersPurchase Buyers
• Hypothesis 11: Perceived value choice selection– The Multi-group analyses among subgroups– Premium/non-premium brand: χ2=5.082; df=12; p-value = .955– Three price levels: χ2=13.995; df =24; p-value=.947– No differences across brand and price subgroups H11 was supported
• Hypothesis 12: Prior experience choice selection– Experienced-non experienced customers: χ2=2.223; df =12; p-value=.999– No Difference between first time/non first time buyers H12 was NOT supported
Perceived Risk
Relationship Quality
Social Risk
Personal Trust
Personal Commitment
Product Quality
Location
EnvironmentHousing FactorsBrand
AssociationPerceived QualityBrand Loyalty
Brand Equity
Service Quality
Customer Involvement
Perceived Price
Perceived Value
Personal Value
Social Value
Relation with Firm
Psycho-Risk
NS
NS
NS
NS
NS
NS
NS
NS
NSNS NS NS
NS NS
NSNS NS NS NS NS
NS NSNS NS
NS
The Role of Perceived Value in a High Involvement Purchase DecisThe Role of Perceived Value in a High Involvement Purchase Decision Process: A Case Study in Home Buyingion Process: A Case Study in Home Buying
Structural Relations and Hypotheses Test: Prospective Home BuyerStructural Relations and Hypotheses Test: Prospective Home Buyerss
R2 =.467 (perceived
Value) .048.912.909.9121.984Hypothesized Model Fits<.08 (<.05)>.90>.90>.90<3.00Recommended Level
RMSEACFINNFIIFI?2/ dfFit Indices
Remarks: IFI = Incremental Fit Index; NNFI = Non-Normed Fit Index; CFI = Comparative Fit Index; RMSEA= Root Mean Square Error of Approximation
H1:PQ Val
-.272***
Relationship Quality
Perceived Value
.389***
.370***
.092*
Perceived Risk
Social Risk
Personal Trust
Personal Commitmen
t
Product Quality
Location
Environment
Housing Factors
Brand Association
Perceived QualityBrand
Loyalty
Brand Equity
Service Quality
Customer Involvement
Perceived Price
Personal Value
Social Value
Relation with Firm
Psycho-Risk
.886***
.859***
.891***
.857***
. 856***
.834***
.878***
.809***
.732*** .517*** .914***
.330***
.192***
-.269*** NS NS -.113*
NS .913*** .958***
.193***
H5:Risk Val
H4:Price Val
H3: RQ Val
H2: BQ Val H6- Inv Val
H7: PQ RQ Val
H8: BQ RQ Val
H9: Risk RQ Val
H10: Inv RQ ValH7a: SQ RQ Val
H1d:SQ Val
Probability to
Purchase
.562***H11: Val PI
Regression
Sobel Prospect
Sobel Test

358
The Role of Perceived Value in a High Involvement Purchase DecisThe Role of Perceived Value in a High Involvement Purchase Decision Process: A Case Study in Home Buyingion Process: A Case Study in Home Buying
Hypotheses Test for the SubHypotheses Test for the Sub--dimensions of the Antecedentsdimensions of the Antecedents
Housing Factors
Social Risk
Location Environment
PsychoRisk
Perceived Value
Customer Involvement
Relationship Quality
Personal Trust
Personal Commitment
Brand Association
Perceived QualityBrand Loyalty
Brand Equity
Service Quality
Perceived Price
Personal Value
Social Value
Relation with Firm
Probability to
Purchase
-.113* -.221***
.095* .106* .155***
χ2/df = 2.449 RMSEA=.059; IFI=.870; NNFI=.866; CFI=.869
H1c: Location Val H1a: House ValH1b: Env Val
H5a: Psy risk Val
H5b: Soc risk Val
The Role of Perceived Value in a High Involvement Purchase DecisThe Role of Perceived Value in a High Involvement Purchase Decision Process: A Case Study in Home Buyingion Process: A Case Study in Home Buying
Hypotheses Test for the SubHypotheses Test for the Sub--dimensions of the Mediatordimensions of the Mediator
χ2/df = 2.034; RMSEA=.050; IFI=.907; NNFI=.904; CFI=.907
H3a: Trust Val
H3b: Commit Val
H3c: RQ-firm Val
Personal Commitment
Brand Equity
Perceived Value
Relation with Firm
Personal Trust
Perceived Risk
Social Risk
Product Quality
Location
Environment
Housing Factors
Brand Association
Perceived QualityBrand Loyalty
Service Quality
Customer Involvement
Perceived Price
Personal Value
Social Value
Psycho-Risk
Probability to
Purchase
.791***
.444***
NS
.247**
.421***
NS
H8a: BQ trust
H8b: BQ Commit
H8c: BQ Relations with firm

359
The Role of Perceived Value in a High Involvement Purchase DecisThe Role of Perceived Value in a High Involvement Purchase Decision Process: A Case Study in Home Buyingion Process: A Case Study in Home Buying
Hypotheses Test for the moderating effect and robustness of the Hypotheses Test for the moderating effect and robustness of the modelmodelPrePre--purchase buyerspurchase buyers
• Hypothesis 11: Perceived value choice selection– The Multi-group analyses among Premium/non-premium brand subgroups– χ2=3.343, df =12, p-value=.993 No differences across brand – β (perceived value purchase intention) = 14.99; t = 11.655; p-value =.000– H11 was supported
Perceived Risk
Relationship Quality
Social Risk
Personal Trust
Personal Commitment
Product Quality
Location
EnvironmentHousing FactorsBrand
AssociationPerceived QualityBrand Loyalty
Brand Equity
Service Quality
Customer Involvement
Perceived Price
Perceived Value
Personal Value
Social Value
Relation with Firm
Psycho-Risk
NS
NS
NS
NS
NS
NS
NS
NS
NSNS NS NS
NS NS
NS
NS NS NS NS NS
NS NSNS NS
NSPurchase Intention
.562***H11: Val PI
The Role of Perceived Value in a High Involvement Purchase DecisThe Role of Perceived Value in a High Involvement Purchase Decision Process: A Case Study in Home Buyingion Process: A Case Study in Home Buying
Hypotheses Testing Results Hypotheses Testing Results
N/ANot SupportedPrior experience choice selection(Different between first time/non first time)H12
SupportedSupportedPerceived value choice selection/Intention(Indifferent across brand and price subgroups)
H11
Not SupportedNot SupportedInvolvement Relationship Quality ValueH10SupportedSupportedPerceived Risk Relationship Quality ValueH9SupportedSupportedBrand Equity Relationship Quality ValueH8
Not Supported*SupportedService Quality Relationship Quality ValueH7aSupportedSupportedProduct Quality Relationship Quality ValueH7
Not SignificantNot SignificantRelationship QualityInvolvementSignificantSignificantRelationship QualityPerceived RiskSignificantSignificantRelationship QualityBrand EquitySignificantSignificantRelationship QualityService QualitySignificantSignificantRelationship QualityProduct QualitySupportedSupportedRelation with FirmBrand EquityH8c
Not SupportedSupportedCommitmentBrand EquityH8bSupportedSupportedPersonal TrustBrand EquityH8a
Not SupportedNot SupportedPerceived ValueInvolvementH6Supported*Not SupportedPerceived ValueSocial RiskH5bSupportedSupportedPerceived ValuePsychological RiskH5aSupportedSupportedPerceived ValuePerceived RiskH5SupportedSupportedPerceived ValuePerceived PriceH4SupportedSupportedPerceived ValueRelation with FirmH3c
Not Supported*SupportedPerceived ValueCommitmentH3bSupportedSupportedPerceived ValuePersonal TrustH3aSupportedSupportedPerceived ValueRelationship QualityH3SupportedSupportedPerceived ValueBrand EquityH2
Not Supported*SupportedPerceived ValueService QualityH1dSupportedSupportedPerceived ValueLocationH1cSupported*Not SupportedPerceived ValueEnvironmentH1bSupported*Not SupportedPerceived ValueHousing FactorsH1aSupportedSupportedPerceived ValueProduct QualityH1
Pre-Purchase ContextPost-Purchase ContextHypotheses

360
The Role of Perceived Value in a High Involvement Purchase DecisThe Role of Perceived Value in a High Involvement Purchase Decision Process: A Case Study in Home Buyingion Process: A Case Study in Home Buying
Major Research Findings: Major Research Findings: PostPost--purchase Buyerspurchase Buyers
1. The buyers perform a two-stage decision making process when buying a house.
2. Relationship quality has highest direct impact on value and also play an important mediating role.
3. Product quality (location) and perceived risk (psycho & functional risk) show almost equal impact on value.
4. The impact of brand and perceived price are less than other factor.5. Service quality provides strong indirect influence on value.6. Customer involvement has no impact on value.7. Prior home buying experience has no moderating effect.8. Perceived value shows a significant prediction power of on choice
selection.
The Role of Perceived Value in a High Involvement Purchase DecisThe Role of Perceived Value in a High Involvement Purchase Decision Process: A Case Study in Home Buyingion Process: A Case Study in Home Buying
1. Relationship quality shows the highest impact on value. However, only personal trust and relationship with firm provide significant effects while personal commitment has no impact.
2. Product quality, brand equity, and perceived risk provide almostequal impact on value.
3. All dimensions of product quality and perceived risk impact value4. Service quality has no impact on value in both direct and indirect
paths.5. Customer involvement has no impact on value.6. Perceived value is positively related to purchase intention.
Major Research Findings: Major Research Findings: PrePre--purchase Buyerspurchase Buyers
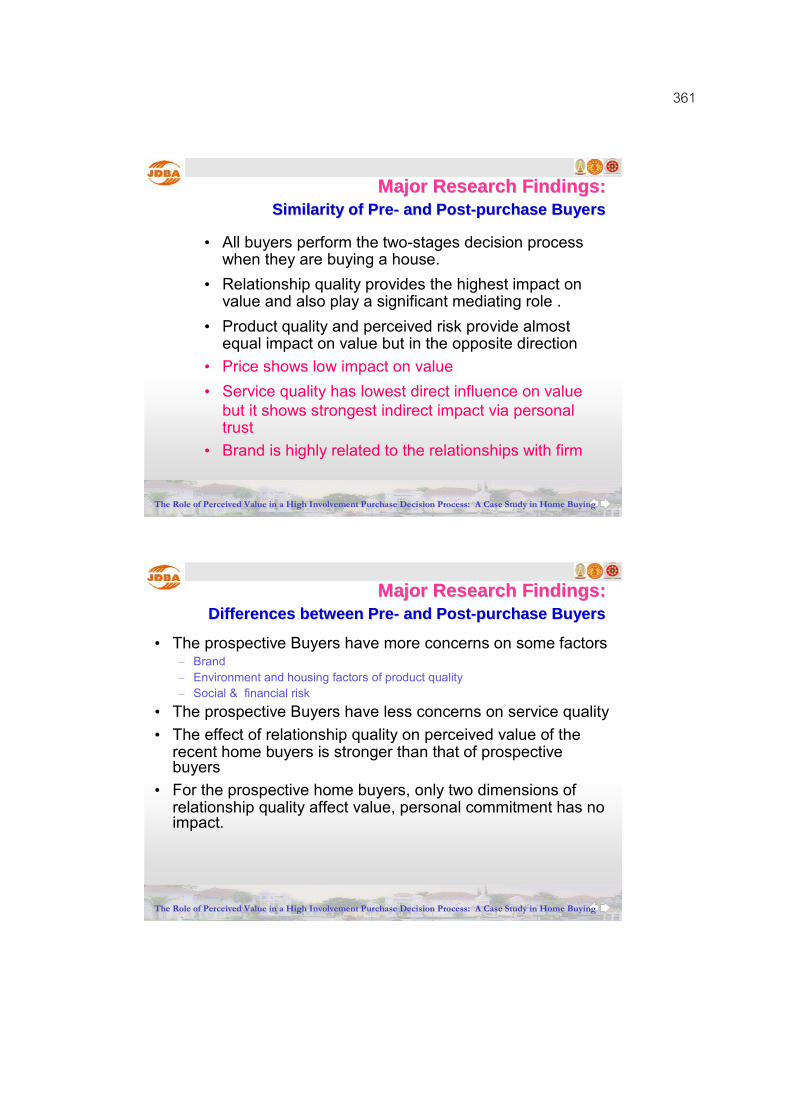
361
The Role of Perceived Value in a High Involvement Purchase DecisThe Role of Perceived Value in a High Involvement Purchase Decision Process: A Case Study in Home Buyingion Process: A Case Study in Home Buying
• All buyers perform the two-stages decision processwhen they are buying a house.
• Relationship quality provides the highest impact on value and also play a significant mediating role .
• Product quality and perceived risk provide almost equal impact on value but in the opposite direction
• Price shows low impact on value• Service quality has lowest direct influence on value
but it shows strongest indirect impact via personal trust
• Brand is highly related to the relationships with firm
Major Research Findings: Major Research Findings: Similarity of PreSimilarity of Pre-- and Postand Post--purchase Buyerspurchase Buyers
The Role of Perceived Value in a High Involvement Purchase DecisThe Role of Perceived Value in a High Involvement Purchase Decision Process: A Case Study in Home Buyingion Process: A Case Study in Home Buying
• The prospective Buyers have more concerns on some factors– Brand– Environment and housing factors of product quality– Social & financial risk
• The prospective Buyers have less concerns on service quality• The effect of relationship quality on perceived value of the
recent home buyers is stronger than that of prospective buyers
• For the prospective home buyers, only two dimensions of relationship quality affect value, personal commitment has no impact.
Major Research Findings: Major Research Findings: Differences between PreDifferences between Pre-- and Postand Post--purchase Buyerspurchase Buyers

362
The Role of Perceived Value in a High Involvement Purchase DecisThe Role of Perceived Value in a High Involvement Purchase Decision Process: A Case Study in Home Buyingion Process: A Case Study in Home Buying
Alternative Model for Post Alternative Model for Post ––Purchase BuyersPurchase Buyers
.878.633R2 (value)
Model Fits
.961.910CFI
.959.907NNFI
.961.910IFI
.032.044RMSEA
1.4261.800χ2/df
Alternative ModelBase ModelFit Index
Product Quality
Location
Environment
Housing Factors
Brand Association
Perceived Quality
Brand Loyalty
Brand Equity
Service Quality
Perceived Value
Personal Value
Social Value
.892***
.886***
.891***
.866***
.819***
.914***
.983***
.964***
.840***
.212***.209***
-.126***
Relation with Firm
Personal Trust
Psycho Risk Social Risk
Perceived Risk
.849***
.929***.946***
-.638***
. 476***
. 291***.876***
.541***
-.293***
The Role of Perceived Value in a High Involvement Purchase DecisThe Role of Perceived Value in a High Involvement Purchase Decision Process: A Case Study in Home Buyingion Process: A Case Study in Home Buying
Alternative Model for PreAlternative Model for Pre––Purchase BuyersPurchase Buyers
.864.467R2 (value)
Model Fits
.959.912CFI
.958.909NNFI
.959.912IFI
.035.048RMSEA
1.5091.984χ2/df
Alternative Model
Base ModelFit Index
Product Quality
Location
Environment
Housing Factors
Brand AssociationPerceived QualityBrand Loyalty
Brand Equity
Perceived Price
Perceived Value
Personal Value
Social Value
Probability to
Purchase
.835***
.837***
.856***
.813***
.802***
.848***
.937***
.808***
.542***.316***
.840***
-.254***
-.092**
.220**
-.121**
Relation with Firm
Personal Trust
Psycho Risk Social Risk
Perceived Risk
Service Quality
.945***
.921***.953***
.351***
.282***
.533***
.533***
.339***

363
The Role of Perceived Value in a High Involvement Purchase DecisThe Role of Perceived Value in a High Involvement Purchase Decision Process: A Case Study in Home Buyingion Process: A Case Study in Home Buying
Discussions and conclusionsDiscussions and conclusions
Not statistically significant effect What is the moderating effects of prior home buying experience on home buying?
Two risk dimensions found:Only psychological risk is negatively impact value in the post purchase
context.Both psychological and social risk are negatively impact value in the pre-
purchase context
Significant and positive effect: directly and indirectly via the quality of relationship with firm
Significant and positive effect
Three benefits are positively related to value in both direct and indirect way.Two sacrifices are negatively related to value.
Product & Risk has both direct and indirect influence Price has only direct impact.
Three benefits - product quality, sales service quality, brand equity Two sacrifices: - perceived risk, perceived priceOne mediator - relationship quality
Consideration of all related factors simultaneously by making tradeoffs of all benefits and sacrifices
Location, price level, size and style of the house and the brand of real estate developers
Findings
What are the specific characteristics of perceived risk in home buying process?
How brand affects consumer decision?
How perceived value affects the final choice selection?
What are the relationships among key determinants of value?
What are the key determinants for value creation?
How consumers develop their perceived value for each choice?
What are the key criteria consumers use in developing a consideration set?
Research Questions
The Role of Perceived Value in a High Involvement Purchase DecisThe Role of Perceived Value in a High Involvement Purchase Decision Process: A Case Study in Home Buyingion Process: A Case Study in Home Buying
Theoretical Contributions of the DissertationTheoretical Contributions of the Dissertation
– Confirmation of two-stage decision model– Confirmation of the explanation power of perceived value on
choice selection. – The important mediating effect of relationship quality on
perceived value is found. – The indirect impact of service quality on value which is
mediated by personal trust is found.– The indirect impact of brand equity on value which is
mediated by relationship quality with firm is found.– Customer involvement is different across person and has no
impact on value– Prior home buying experience does not show the moderating
impact on purchase decision.
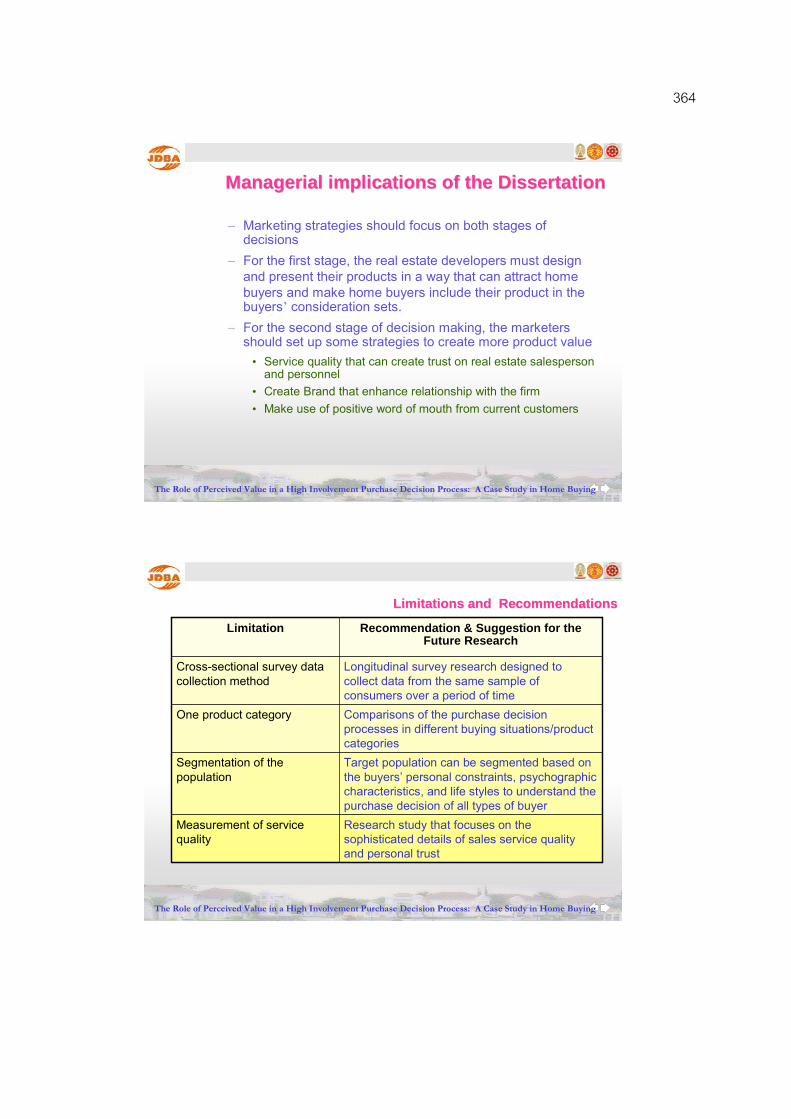
364
The Role of Perceived Value in a High Involvement Purchase DecisThe Role of Perceived Value in a High Involvement Purchase Decision Process: A Case Study in Home Buyingion Process: A Case Study in Home Buying
– Marketing strategies should focus on both stages of decisions
– For the first stage, the real estate developers must design and present their products in a way that can attract home buyers and make home buyers include their product in the buyers’ consideration sets.
– For the second stage of decision making, the marketers should set up some strategies to create more product value
• Service quality that can create trust on real estate salespersonand personnel
• Create Brand that enhance relationship with the firm• Make use of positive word of mouth from current customers
Managerial implications of the DissertationManagerial implications of the Dissertation
The Role of Perceived Value in a High Involvement Purchase DecisThe Role of Perceived Value in a High Involvement Purchase Decision Process: A Case Study in Home Buyingion Process: A Case Study in Home Buying
Limitations and RecommendationsLimitations and Recommendations
Research study that focuses on the sophisticated details of sales service quality and personal trust
Measurement of service quality
Target population can be segmented based on the buyers’ personal constraints, psychographic characteristics, and life styles to understand the purchase decision of all types of buyer
Segmentation of the population
Comparisons of the purchase decision processes in different buying situations/product categories
One product category
Longitudinal survey research designed to collect data from the same sample of consumers over a period of time
Cross-sectional survey data collection method
Recommendation & Suggestion for the Future Research
Limitation