the relationship between internationalization and capital ...
12
The International Journal of Business and Finance Research ♦ Volume 2 ♦ Number 1 ♦ 2008 THE RELATIONSHIP BETWEEN INTERNATIONALIZATION AND CAPITAL STRUCTURES OF TAIWAN FIRMS Yi-Chein Chiang, Feng Chia University, Taiwan Sheng-Wei Chen, Feng Chia University, Taiwan ABSTRACT Using a sample of Taiwan firms over the period of 2001 to 2005, this study investigates the relationship between internationalization and a firm’s capital structure, measured by the leverage ratio. Univariate tests show that multinational corporations (MNCs) are significantly less leveraged than domestic corporations (DCs). In addition, MNCs have lower business risks, lower exchange rate risks and higher agency costs, and are more profitable than DCs. The results of multivariate regressions show that some threshold of internationalization exists. The degree of internationalization is negatively associated with a firm’s leverage ratio only before this threshold, and there will be a positive relationship beyond this threshold. JEL: F23, G24, G32 INTRODUCTION aiwan is a small open economy, where firms have always been forced to direct most of their business operations toward foreign countries, due to the scarcity of natural resources and the small-sized home markets. Successful firms need funds in every stage of expansion, including foreign expansion. An interesting question is whether firms favor equity or debt financing when they expand abroad; this paper investigates the relationship between internationalization and a firm’s capital structure. T Chen, Cheng, He and Kim (1997) and Chkir and Cosset (2001) demonstrate a positive, linear relationship between leverage ratios and internationalization. On the other hand, Lee and Kwok (1988), Burgman (1996), and Singh, Davidson and Suchard (2003) find a negative, linear relationship. Further confounding the issue are the U-shaped relationship findings of Mansi and Reeb (2002). These studies almost exclusively focus on US and other major developed countries. A general consensus of these studies is that international diversification has some effects on the capital structure of firms. However, very little is understood outside these countries. Using a sample of Taiwan firms over the period of 2001-2005, this paper investigates the relationship between internationalization and capital structure, measured by the leverage ratio. First, we use univariate tests separately for each variable affecting the leverage ratio to examine whether MNCs and DCs are significantly different from each other. We then use multivariate analyses on five-year data to explore the relationship between internationalization and the leverage ratio, after controlling for firm sizes, business risks, exchange rate risks, agency costs and profitability. Our results show that MNCs are significantly less leveraged than DCs. In addition, MNCs have lower business risks, lower exchange rate risks, higher agency costs and are more profitable than DCs. The results of multivariate regressions show a nonlinear U-shaped relationship between leverage ratio and internationalization. Our results are consistent with Mansi and Reeb (2002). 1
-
Upload
khangminh22 -
Category
Documents
-
view
1 -
download
0
Transcript of the relationship between internationalization and capital ...

The International Journal of Business and Finance Research ♦ Volume 2 ♦ Number 1 ♦ 2008
THE RELATIONSHIP BETWEEN INTERNATIONALIZATION AND CAPITAL
STRUCTURES OF TAIWAN FIRMS Yi-Chein Chiang, Feng Chia University, Taiwan Sheng-Wei Chen, Feng Chia University, Taiwan
ABSTRACT
Using a sample of Taiwan firms over the period of 2001 to 2005, this study investigates the relationship between internationalization and a firm’s capital structure, measured by the leverage ratio. Univariate tests show that multinational corporations (MNCs) are significantly less leveraged than domestic corporations (DCs). In addition, MNCs have lower business risks, lower exchange rate risks and higher agency costs, and are more profitable than DCs. The results of multivariate regressions show that some threshold of internationalization exists. The degree of internationalization is negatively associated with a firm’s leverage ratio only before this threshold, and there will be a positive relationship beyond this threshold. JEL: F23, G24, G32 INTRODUCTION
aiwan is a small open economy, where firms have always been forced to direct most of their business operations toward foreign countries, due to the scarcity of natural resources and the small-sized home markets. Successful firms need funds in every stage of expansion, including
foreign expansion. An interesting question is whether firms favor equity or debt financing when they expand abroad; this paper investigates the relationship between internationalization and a firm’s capital structure.
T Chen, Cheng, He and Kim (1997) and Chkir and Cosset (2001) demonstrate a positive, linear relationship between leverage ratios and internationalization. On the other hand, Lee and Kwok (1988), Burgman (1996), and Singh, Davidson and Suchard (2003) find a negative, linear relationship. Further confounding the issue are the U-shaped relationship findings of Mansi and Reeb (2002). These studies almost exclusively focus on US and other major developed countries. A general consensus of these studies is that international diversification has some effects on the capital structure of firms. However, very little is understood outside these countries. Using a sample of Taiwan firms over the period of 2001-2005, this paper investigates the relationship between internationalization and capital structure, measured by the leverage ratio. First, we use univariate tests separately for each variable affecting the leverage ratio to examine whether MNCs and DCs are significantly different from each other. We then use multivariate analyses on five-year data to explore the relationship between internationalization and the leverage ratio, after controlling for firm sizes, business risks, exchange rate risks, agency costs and profitability. Our results show that MNCs are significantly less leveraged than DCs. In addition, MNCs have lower business risks, lower exchange rate risks, higher agency costs and are more profitable than DCs. The results of multivariate regressions show a nonlinear U-shaped relationship between leverage ratio and internationalization. Our results are consistent with Mansi and Reeb (2002).
1

Y.C. Chiang, S.W. Chen ⎪ The International Journal of Business and Finance Research ♦Vol. 2 ♦ No. 1 ♦ 2008 The remainder of the paper is organized as follows. First, we discuss the literature about capital structure. Second, we provide a description of data sources and sample selection procedures, as well as variables used in this study. Then, we present the empirical methodology and the results. LITERATURE REVIEW The capital structure of a firm has always been a big issue in the finance research. In a pioneering study, Modigliani and Miller (1958) proposed that under certain assumptions (perfect capital markets and no taxes), a firm’s value was not affected by the proportion of debt and equity in its capital structure. Modigliani and Miller (1963) stated that a firm’s value was maximized with total debt in its capital structure when the corporate income tax was taken into consideration. Corporate tax laws favor debt financing because interest paid by the company to its creditors is a tax-deductible expense while dividends and retained earnings are not. Miller (1977) extended the analyses to include personal income taxes. Other studies argued that firms do not expect to benefit from the tax deductibility feature of interest payments without incurring bankruptcy costs (Stglitz, 1972; Kraus and Litzenberg, 1973) and agency costs (Jensen and Meckling, 1976; Barnea, Haugen, and Senbet, 1981) at the same time. Intertwined with the above are three theories about a firm’s capital structure: the trade-off theory, the agency cost theory and the pecking order theory. (1) In the trade-off theory, firms choose their capital structures by trading off the tax benefits of debt with the expected bankruptcy costs (Kraus and Litzenberger, 1973). The prediction is that firms with higher bankruptcy costs or lower tax advantages should incur less debt. (2) In the agency cost theory, there are underinvestment (Myers, 1977) and asset substitution problems (Jensen and Meckling, 1976) due to the potential conflicts of interests between debtholders and stockholders. The prediction is that firms with higher agency costs should incur less debt. (3) In the pecking order theory (Myers, 1984), firms prefer not to borrow externally when internally generated funds are available. Hence, firms are expected to prefer sources of financing in the following sequence: internally generated funds, debt financing and issuance of equity. The prediction is that firms with higher profitability should incur less debt. The capital structure of MNCs is of great interest to international finance studies. The three theories mentioned above were extended to MNCs to determine if MNCs have differing capital structure relative to DCs and the relationship between internationalization and leverage ratio. It is often argued that MNCs should be able to support more debt than DCs, since international diversification leads to a lower volatility of earnings and lower bankruptcy costs, as MNCs have cash flows in imperfectly correlated markets (Eiteman and Stonehill, 1994; Madura, 1995; Shapiro, 1992). However, MNCs are exposed to additional risks such as political and exchange rate risks, which are not found in a domestic market (Lee and Kwok, 1988; Burgman, 1996; Chen, Cheng, He, and Kim, 1997; Chkir and Cosset, 2001). As for the taxes, Shapiro (1978) notes that if foreign taxes are higher than domestic taxes and a withholding tax exists, dividends will also lead to greater taxes. MNCs will then use more debt to get a larger benefit of debt. Rhee, Chang and Koveos (1985), Madura and Fosberg (1990), and Liu and Hsueh (1993) indicate that MNCs have greater potential tax benefits of debt relative to DCs based on the ability to borrow in multiple markets. Borrowing in countries with high tax rates leads to higher firm value. In addition, host government may provide subsidized loans to MNCs as incentives to attract foreign investments. Thus, MNCs should have greater debt in their capital structure relative to DCs. Hodder and Senbet (1990) found that corporate tax arbitrage played an important role in generating an international capital structure equilibrium. According to the trade-off theory, it’s hard to predict the relationship between internationalization and leverage ratio. On the other hand, MNCs always have greater growth opportunities (Bodnar and Weintrop, 1997) and higher profitability (Chen, Cheng, He, and Kim, 1997) than DCs. Thus, the pecking order theory predicts
2

The International Journal of Business and Finance Research ♦ Volume 2 ♦ Number 1 ♦ 2008 a negative relationship between internationalization and the leverage ratio because of information asymmetry between managers and outside investors, and that profitable firms prefer not to raise external equity in order to avoid potential dilution of ownership. Moreover, the fact that MNCs are more geographically diversified than DCs increases information asymmetries, and renders active monitoring more difficult and expensive for MNCs compared to DCs, due to cultural differences, higher auditing costs, differing legal systems, and language differences. Debt holders require higher interest payments on debts of MNCs that are more susceptible to information asymmetries and greater monitoring costs (Doukas, and Pantzalis, 2003). Thus, a negative relationship is predicted by the agency cost theory. Since the three theories take different variables into account, they do not have the same prediction for the relationship between internationalization and the leverage ratio. Thus the examination of the difference in capital structures between MNCs and DCs taking the three theories into account is an empirical issue. Chen, Cheng, He and Kim (1997) and Chkir and Cosset (2001) demonstrate a positive relationship between leverage ratios and internationalization that result from the risk reduction inherent in having operations in imperfectly correlated markets. However, Lee and Kwok (1988), Burgman (1996), and Singh, Davidson and Suchard (2003) find a negative relationship because of the increases risk from agency costs, exchange rate risks and political risks. In addition, a strictly linear specification may not fully capture the impact of firm international expansion on debt financing. Mansi and Reeb (2002) argue the capital structure of a firm may change with differing levels of internationalization and demonstrate a U-shape relationship. Taxes are frequently a capital structure consideration. As this paper examines the capital structure of Taiwan firms, it is important to discuss the nature of taxation in Taiwan. In Taiwan, the corporate income tax rate is 25%. All income earned in Taiwan are taxed by any taxpayer, domestic or foreign corporations. As for the treatment of foreign-source incomes, all incomes earned outside Taiwan are tax-free because the territorial method of declaring a tax jurisdiction is adopted. Thus, there is no double taxation of foreign-source incomes for Taiwan’s MNC. In addition, Taiwan has signed bilateral tax treaties with 19 countries to avoid double taxation for foreign firms investing in Taiwan in order to attract foreign direct investments. METHODOLOGY, DATA AND VARIABLES In this study, data is collected from the non-financial firms listed on the Taiwan Stock Exchange (TSE) during the period of 2001 to 2005. Firms’ financial data is obtained from the Taiwan Economic Journal (TEJ) database and the website of Taiwan Securities & Futures Information Center. The frequency of data is annual. A firm is classified as a DC if its foreign sales ratio or foreign assets ratio is less than 10%, and a MNC if its foreign sales ratio or foreign assets ratio is 10% or more. This selection procedure results in 136 firms as DCs and 244 firms as MNCs under the classification criteria of the foreign sales ratio, and 252 firms as DCs and 128 firms as MNCs under the classification criteria of the foreign assets ratio. The variables considered are: 1. Leverage ratio: Total Debts / Total Assets The leverage ratio (DB) is treated as an endogenous variable surrogate for a firm’s financing decision,
measured as total debts over total assets. We use this proxy following prior studies such as Lee and Kwok (1988), Titman and Wessels (1988), and Chen, Cheng, He and Kim (1997).
2. Foreign sales ratio: Total Foreign Sales / Total Sales
The foreign sales ratio (FS) is a proxy of the degree of firm’s international activity (DOI). It provides a
3

Y.C. Chiang, S.W. Chen ⎪ The International Journal of Business and Finance Research ♦Vol. 2 ♦ No. 1 ♦ 2008
measure of a firm’s dependence on overseas markets for sales revenues (Gomes and Ramaswamy, 1999).
3. Foreign assets ratio: Total Foreign Assets / Total Assets
The foreign assets ratio (FA) is another proxy of the degree of a firm’s international activity. It provides a measure of a firm’s dependence on overseas production (Gomes and Ramaswamy, 1999). Exports play an important role in Taiwan firms, but the high export ratio does not mean that firms have any foreign operations; hence, we use FA in addition to FS to proxy DOI.
4. Size: Ln (Total Assets)
The size measure is the logarithm of a firm’s total assets. Several studies have suggested that leverage is a function of firm size, such as Smith (1977) and Titman and Wessels (1988). Large firm sizes may have positive effects on leverages because they reduce bankruptcy risks.
5. Business risk: Standard Deviation of EBIT/Total Sales
Following Chaplinsky (1984) and Lee and Kwok (1988), the business risk (BR) measure is a surrogate for a firm’s expected costs of bankruptcy. It is often argued that, due to their ability to diversify across less perfectly correlated national economies, MNCs should have less business risks than DCs, and that MNCs should therefore be able to support more leverage.
6. Foreign exchange risk: 2β
Like Jorion (1990) and many subsequent studies, the foreign exchange exposure ( 2β ) is estimated using the following equation:
itxtimtiiit uRRR +β+β+β= 210 (1)
where is the return on stock in period t, and is the percentage change in the exchange rate in period t. The exchange rate used is the U.S. Dollar (USD) in terms of the New Taiwan Dollar (NTD). We also control for market movements by including the return on the market portfolio in period t, (The market portfolio, TAIEX, is a market capitalization-weighted index of Taiwan) The market portfolio, TAIEX, is a market capitalization-weighted index of Taiwan. is the error term.
itR
R
i xtR
mt
itu It seems natural to assume that firms operating multinationally are more exposed to exchange rate risks, and thus support less leverage. On the other hand, MNCs may not be exposed more since they can use financial and operational hedges. Furthermore, foreign debt can be used as a hedging instrument against the exchange rate risk, so MNCs may support more leverage.
7. Agency Cost: Free Cash Flows/Total Assets
Free cash flows are defined as (Operating Income Before Depreciation – Interest Expenses – Taxes – Dividends), representing the liquidity of a firm’s assets and reflect the available free cash flows that can be manipulated by shareholders at the expense of debtholders. We follow Doukas and Pantzalis (2003) to use the ratio of free cash flows over total assets as a proxy of agency costs.
Since MNCs are more susceptible to information asymmetries and greater monitoring costs; therefore, MNCs have higher agency costs than DCs and support less leverage.
8. Profitability: Net Income / Total sales
4
The International Journal of Business and Finance Research ♦ Volume 2 ♦ Number 1 ♦ 2008
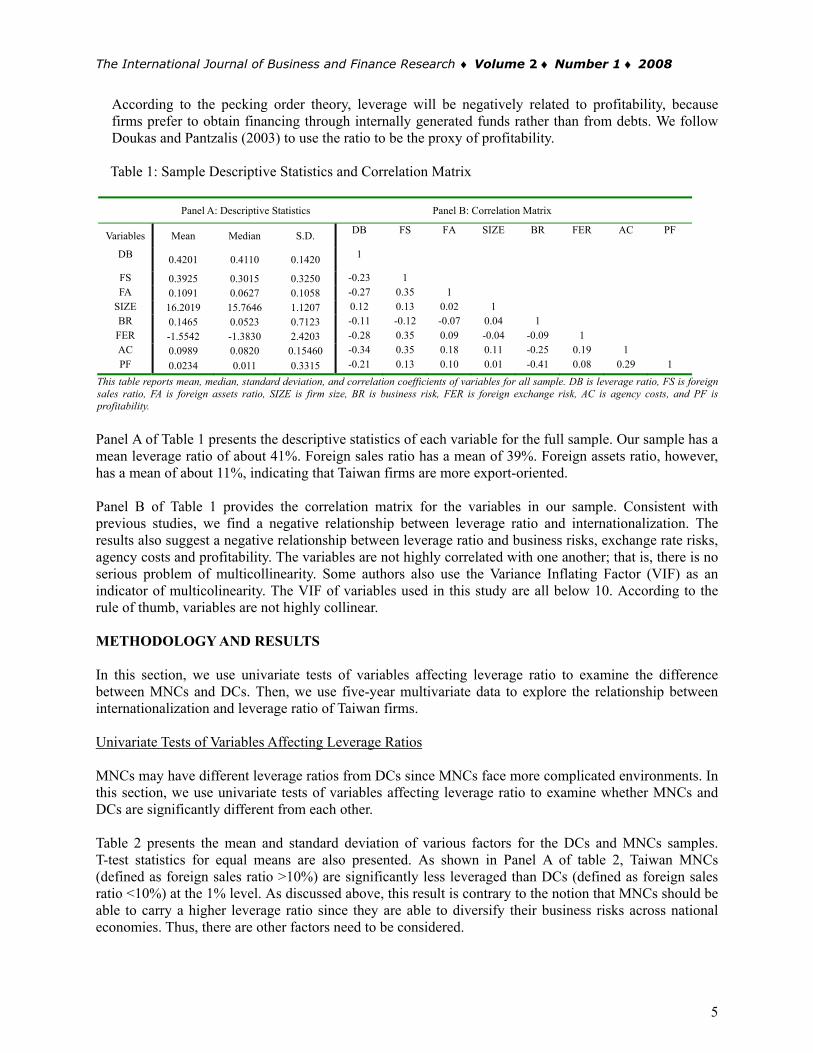
According to the pecking order theory, leverage will be negatively related to profitability, because firms prefer to obtain financing through internally generated funds rather than from debts. We follow Doukas and Pantzalis (2003) to use the ratio to be the proxy of profitability. Table 1: Sample Descriptive Statistics and Correlation Matrix
Panel A: Descriptive Statistics Panel B: Correlation Matrix
Variables Mean Median S.D. DB FS FA SIZE BR FER AC PF
DB 0.4201 0.4110 0.1420 1
FS 0.3925 0.3015 0.3250 -0.23 1 FA 0.1091 0.0627 0.1058 -0.27 0.35 1
SIZE 16.2019 15.7646 1.1207 0.12 0.13 0.02 1 BR 0.1465 0.0523 0.7123 -0.11 -0.12 -0.07 0.04 1 FER -1.5542 -1.3830 2.4203 -0.28 0.35 0.09 -0.04 -0.09 1 AC 0.0989 0.0820 0.15460 -0.34 0.35 0.18 0.11 -0.25 0.19 1 PF 0.0234 0.011 0.3315 -0.21 0.13 0.10 0.01 -0.41 0.08 0.29 1
This table reports mean, median, standard deviation, and correlation coefficients of variables for all sample. DB is leverage ratio, FS is foreign sales ratio, FA is foreign assets ratio, SIZE is firm size, BR is business risk, FER is foreign exchange risk, AC is agency costs, and PF is profitability.
Panel A of Table 1 presents the descriptive statistics of each variable for the full sample. Our sample has a mean leverage ratio of about 41%. Foreign sales ratio has a mean of 39%. Foreign assets ratio, however, has a mean of about 11%, indicating that Taiwan firms are more export-oriented. Panel B of Table 1 provides the correlation matrix for the variables in our sample. Consistent with previous studies, we find a negative relationship between leverage ratio and internationalization. The results also suggest a negative relationship between leverage ratio and business risks, exchange rate risks, agency costs and profitability. The variables are not highly correlated with one another; that is, there is no serious problem of multicollinearity. Some authors also use the Variance Inflating Factor (VIF) as an indicator of multicolinearity. The VIF of variables used in this study are all below 10. According to the rule of thumb, variables are not highly collinear. METHODOLOGY AND RESULTS In this section, we use univariate tests of variables affecting leverage ratio to examine the difference between MNCs and DCs. Then, we use five-year multivariate data to explore the relationship between internationalization and leverage ratio of Taiwan firms. Univariate Tests of Variables Affecting Leverage Ratios MNCs may have different leverage ratios from DCs since MNCs face more complicated environments. In this section, we use univariate tests of variables affecting leverage ratio to examine whether MNCs and DCs are significantly different from each other. Table 2 presents the mean and standard deviation of various factors for the DCs and MNCs samples. T-test statistics for equal means are also presented. As shown in Panel A of table 2, Taiwan MNCs (defined as foreign sales ratio >10%) are significantly less leveraged than DCs (defined as foreign sales ratio <10%) at the 1% level. As discussed above, this result is contrary to the notion that MNCs should be able to carry a higher leverage ratio since they are able to diversify their business risks across national economies. Thus, there are other factors need to be considered.
5

Y.C. Chiang, S.W. Chen ⎪ The International Journal of Business and Finance Research ♦Vol. 2 ♦ No. 1 ♦ 2008 According to Panel B of table 2, MNCs are significantly larger than DCs. Smith and Watts (1992) hypothesize that leverage ratios of larger firms are less limited by the costs of financial distress because they have more diversification than smaller firms. In addition, the trade-off theory postulates a positive relationship between firm sizes and debts, since larger firms have shown to have lower bankruptcy risks and relatively lower bankruptcy costs (Deesomsak, Paudyal, and Pescetto, 2004). Our results provide consistently supporting evidence for Smith and Watts’ hypothesis and the trade-off theory of a firm’s capital structure. In addition, MNCs have significantly lower business risks and exchange rate risks than DCs. Since the operations of MNCs are geographically diversified, the business risks are expected to be lower than those of DCs, and MNCs can use operational hedges in addition to financial hedges to manage exchange rate risks. Lower risks of MNCs give them higher capacity to sustain high leverage ratio, according to the trade-off theory. However, they carry less leverage than DCs, and thus, other factors need to be considered. MNCs with significantly higher agency costs than DCs demonstrate the fact that the geographic structure of MNCs exacerbates the inherent conflicts between shareholders and debt holders. Higher agency costs of MNCs lead to less leverage according to the agency cost theory. Furthermore, our results show that MNCs are significantly more profitable than DCs, supporting the pecking order theory, which postulates that managers prefer to finance projects internally. Therefore, the lower leverage ratio of MNCs may come from their higher agency costs and higher profitability that exceed the lower bankruptcy costs (due to lower business and foreign exchange risks) of MNCs. Table 2: Univariate Tests of Variables Affecting Leverage Ratios
Panel A: MNC is FS>10% and DC is FS<10% Panel B: MNC is FA>10% and DC is FA<10% MNCs (N=244) DCs (N=136) MNCs (N=128) DCs (N=252) Mean S.D. Mean S.D. t-value Mean S.D. Mean S.D. t-value
DB 0.3958 0.1232 0.4547 0.3805 -3.32*** 0.3657 0.1309 0.4275 0.3721 -5.23*** SIZE 15.8451 1.2046 15.6507 1.3845 1.81** 15.7161 0.9513 15.8568 1.1631 -1.31 BR 0.0739 0.0935 0.2761 0.0713 -2. 24** 0.0746 0.1845 0.1723 0.0723 -1.86** FER -1.1821 2.5564 -2.4371 1.1462 4.16*** -1.1205 2.4670 -1.7735 -1.1605 2.79*** AC 0.1065 0.1828 0.017 0.1283 4.35*** 0.1153 0.1312 0.0891 0.1267 3.38*** PF 0.0123 0.0954 -0.0331 0.0213 1.92** 0.0189 0.0790 -0.0273 0.0123 2.15**
This table compares the means of all variables of DC and MNC. The criterion of MNC in panels A and B are foreign sales ratio (FS) and foreign assets ratio (FA), respectively. DB is leverage ratio, FS is foreign sales ratio, FA is foreign assets ratio, SIZE is firm size, BR is business risk, FER is foreign exchange risk, AC is agency costs, and PF is profitability. * Significant at the 10% level, ** Significant at 5% level, *** Significant at 1% Panel B of Table 2 presents the mean and standard deviation of the various factors for DCs (defined as foreign assets ratio <10%) and MNCs (defined as foreign asset ratio >10%) sample. T-test statistics for equal means are also presented. Panel B shows the same results as panel A, except that firm sizes are not significantly different. MNCs are also significantly larger and have lower business risks, lower exchange rate risks and higher agency costs and are more profitable than DCs. Multivariate Regressions Four models are used to investigate the relationship between a firm’s capital structure and internationalization, including linear models, diversification models, curvilinear models and piecewise linear models. Linear Model: first, we use the linear model to examine whether the degree of international activities can explain variations in capital structure, after controlling for the effects of firm sizes, business risks, exchange rate risks, agency costs and profitability. The specification is shown in the following equation:
6

The International Journal of Business and Finance Research ♦ Volume 2 ♦ Number 1 ♦ 2008 Leverage Ratio = 0α + 1α (DOI) + 2α (Size) + 3α (Business Risk)+ 4α (Exchange Rate Risk) + 5α (Agency Cost) + 6α (Profitability) +ε (2) Panel A of Table 3 reports the results of the linear models. The degree of internationalization (DOI) of equations (a) and (b) is foreign sales ratio (FS) and foreign assets ratio (FA), respectively. Standard errors are corrected for autocorrelation and heteroscedasticity using the Newey-West method. All regression models are statistically significant at the 1% level with an adjusted- 2R of about 30 percent, indicating that the variables explain a substantial part of debt ratios across firms. The coefficients for DOI variables (FS or FA) are all negatives, and significantly negative when the DOI proxy is FA. This indicates that international activities lead to lower levels of leverage in firms’ capital structures after controlling other determinants of capital structure. Hence, international activity is a significant determinant of capital structure across Taiwan firms. As for the control variables, two equations have the same results. Firms with larger sizes, lower business risks, lower exchange rate exposures, lower agency costs and lower profitability have higher levels of leverage. Our results support the trade-off theory, the agency cost theory and the pecking order theory of a firm’s capital structure. Diversification Model: in the previous model, the proxy for the degree of internationalization is just the international involvement (foreign sales ratio and foreign assets ratio). However, a firm could have a high degree of international involvement, and yet all of its foreign involvement could be in a single high-risk country. Following Burgman (1996), we define the diversification proxy as a combination of a firm’s international involvement and the number of countries in which a firm has subsidiaries (NOC), which may be a much better indicator of international diversification. Leverage Ratio = 0α + 1α (DOI*NOC)+ 2α (Size)+ 3α (Business Risk)+ 4α (Exchange Rate Risk) + 5α(Agency Cost) + 6α (Profitability) +ε (3)
Panel B of Table 3 reports the results of the diversification models. Standard errors are corrected for autocorrelation and heteroscedasticity using the Newey-West method. All regression models are also statistically significant at the 1% level with an adjusted- 2R of about 30 percent, indicating that the variables explain a substantial part of debt ratios across firms
.
he coefficients on Diversification variables (FS*NOC and FA*NOC) are all negative, and significantly
urvilinear Model: to test for the possibility of a non-linear relationship between debt financing and
Tnegative when the Diversification proxy is FA*NOC. Our results are the same as those in the linear models, but the coefficients on Diversification variables are lower than the coefficients on DOI variables in the linear models. This indicates that if one firm exports to or invests in a lot of countries and other firm just exports to or invests in a few countries, then the latter has lower debt relative to the former. That is, the fewer countries a firm exports to or invests in, the lower levels of its leverage. As for the control variables, they have the same results as those in the linear models. Cfirm’s international activity, we regress the firm’s leverage ratio on the proxy of DOI, the square of DOI and various control measures such as firm sizes, business risks, exchange rate risks, agency costs and profitability. The specification is as the following quadratic functional form of DOI. The quadratic regression models allow the turning point to be determined endogenously.
7

Y.C. Chiang, S.W. Chen ⎪ The International Journal of Business and Finance Research ♦Vol. 2 ♦ No. 1 ♦ 2008
(DOI) + 2α2( )DOI + 3α0α + 1α (Size) + 4α (Business Risk)+ 5αLeverage Ratio = (Exchange Rate Risk)
+ 6α (Agency Cost) + 7α (Profitability) +ε
Panel C of Table 3 reports the results of the curvilinear models for the total sample. Standard errors are
(4)
corrected for autocorrelation and heteroscedasticity using the Newey-West method. The coefficients on DOI and 2DOI are both significant. The negative sign of the DOI coefficient (FS or FA) suggests
vels of internationalization, a decreasing level of debt financing is associated with internationalization; the positive sign of 2DOI suggests that at later stages of internationalization, an increasing level of debt financing is associated with internationalization. That is, a nonlinear U-shaped relationship exists in the curvilinear model. Our results are consistent with Mansi and Reeb (2002).
that in the early
he turning point can be computed by taking the partial derivative of regression with respect to the DOI
le
Tas follows: ( ) /leverage ratio DOI∂ ∂ = 1 22 DOIα α+ . Since this partial derivative represents the slope of the c stituting the urve, it is zero at the crossover point; by sub α coefficients, the turning point can be obtained. It is at the 46.5% levels of FS, and 34.6% levels of F respectively. In early levels of internationalization, firms may not diversify enough to reduce the business risks, and firms may suffer from more exchange rate exposures and agency costs but still lack the experience to manage these problems. The increasing risks lead to lower leverage until a threshold is reached where firms may diversify enough from international activities. Their business risks then decrease, and they are more familiar with managing exchange rate exposures and agency costs. Their leverage ratios increase as they become more international. In addition, the results of control variables are the same as those in the linear models.
A,
able 3 Results of Three Models
Var le
Panel A: Linear Models
Panel B: Diversification Models Panel C: Curvilinear Models
T
iab (a) FS (b) FA (a) FS (b) FA (a) FS (b) FA
Constant 0.1372 0.146((1.4224)
0 1.8101)*
0.1392 0.1(1.1278)
824 (1.3982)
0.1984 (
0.(1.6405)*
1729 1.7861)*
FS -0.0274 ( -1.3645)
-0.1541 (- * 2.1870)*
FA -0. (- *
-0.2752 (-
26354.8697)** 3.672)***
FS* -0.0192 NOC (-1.2254)
FA*NOC -0.0645 (- * 2.1359)**
FS0.1656
( 2
1.9825)*
FA2
0.3983
( 1.8746)*
SIZ E 0.0256 (3 *
0.0178 (3 *
0.0275 (3 *
0.0256 (3 *
0.0205 (3 * (.9245)** .4523)** .5814)** .9239)** .9578)**
0.0194 3. * 6512)**
BR -0.0048 (-2 * .7741)**
-0.0051 (- 2.5236)**
-0.0048 (- *2.6231)**
-0.0047 (- *2.6815)**
-0.0053 (- *2.5681)**
-0.0048 (- *2.2508)**
FER -0.0068 (-2 * .8523)*
-0.0074 (-3 * .7423)**
-0.0097 (-2 * .8224)**
-0.0077 (-3 * .9845)**
-0.0069 (-2 * .8126)**
-0.0068 (-2 * .9674)**
AC -0.4037 -1 *( ( ( ( ( 0.3612)**
-0.3665 -1 *0.3805)**
-0.4824 -1 *0.2475)**
-0.3923 -1 *0.5690)**
-0.4361 (- * 1.6372)**
-0.3740 -1 *0.6558)**
PF -0.0135 ( -1.4725)
-0.0186 ( -1.4834)
-0.0092 ( -1.4892)
-0.0094 ( -1.4057)
-0.0098 ( -1.4997)
-0.0086 ( -1.4169)
Adjusted- 2R
F-statistic 45 * 38 * 51 * 56 * 50 * 55 *
0.2469 .1294**
0.2454 .9433**
0.2305 .7197**
0.2908 .1737**
0.2685 .0467**
0.2665 .3262**
Thi s the ooled three r Mode tion M rvilinea is s ttable presen results for a p regression of models: Linea ls, Diversifica odels, and Cu r Models. DBleverage ratio, FS is foreign sales ratio, FA is foreign assets ratio, SIZE is firm size, BR is business risk, FER is foreign exchange risk, AC is agency costs, and PF is profitability. *, **, *** Significant at the 10%, 5%, 1% level. The figure in ( ) is t-value.
8

The International Journal of Business and Finance Research ♦ Volume 2 ♦ Number 1 ♦ 2008 Piecewise Linear Model We then use a piecewise linear model to determine the turning point (switching point) again, following the method of Goldfeld and Quandt (1973). It’s also a nonlinear model. By definition, the piecewise linear model uses two linear pieces to form the equation, and the switching point is also determined endogenously. Our perspective is that either the curvilinear or the piecewise linear model offers benefits beyond those of a single piece linear model. We estimate two versions of the degree of internationalization: (i) with no switching point, (ii) with one switching point. In equation (5), only the linear effect of DOI is included. In equation (6), a piecewise linear function with one switching point (I) is used to express the nonlinear effect of DOI. The locations of switching points are estimated using the grid search technique, and the number and location of switching points are chosen based on the log likelihood function. (i) With no switching point Leverage Ratio = 0α + 1α (DOI) + 2α (Size) + 3α (Business Risk)+ 4α (Exchange Rate Risk) + 5α (Agency Cost)+ 6α (Profitability) +ε (5) (ii) With one switching point Leverage Ratio = 0α + 1α ( 1DOI )+ 2α ( 2DOI ) + 3α (Size) + 4α (Business Risk) + 5α (Exchange Rate Risk) + 6α (Agency Cost) + 7α (Profitability) +ε (6)
1
DOI if DOI IDOI
I if DOI I
⎧ <⎪= ⎨≥⎪⎩
2
0 if DOI IDOI
DOI I if DOI I
⎧ <⎪= ⎨− ≥⎪⎩
The log likelihood ratio test is given by 2( 1log ( ) log ( )e i e iL L+ − ) where is the value of the log
likelihood function with i number of switching points. The statistic is asymptotically 2
log ( )e iLχ -distributed.
Table 4 Results of piecewise linear models with FS and FA
Panel A : FS Panel B: FA Switching Lo
lik hood
P-value Switching Loglikelihood
ood
s
P-value Point
g Likelielihood
function Ratio statistic
Point Likelih
function Ratio tatistic
No switching point 641.92 661.92 Single switching point 0. 7. 0.006*** 0.37 3. 0.051* 41 638.19 46 659.99 86
This for a d regre e piecewise linear model.. *, **, *** Significan 0%, 5 level table presents the results poole ssion of th t at the 1 %, 1%
Panel A and B of Table 4 present the likelihood ratio tests of the piecewise linear models, indicating a switching point of 41% when DOI is FS and a switching point of 37% when DOI is FA. That is, the degree of internationalization is negatively associated with a firm’s leverage only before some threshold of internationalization, and there will be a positive relationship beyond this threshold. CONCLUSION Using a sample of Taiwan firms over the period of 2001 to 2005, this paper investigates the relationship between internationalization and capital structure. In the univariate tests, our results demonstrate that MNCs are significantly less leveraged than DCs. In addition, MNCs have lower business risks, lower exchange rate risks and higher agency costs, and are more profitable than DCs. The lower leverage ratios of MNCs may come from the fact that higher agency costs and profitability exceed the lower bankruptcy costs, due to lower business and exchange rate risks.
9

Y.C. Chiang, S.W. Chen ⎪ The International Journal of Business and Finance Research ♦Vol. 2 ♦ No. 1 ♦ 2008 In the multivariate models, we have the following results. (1)If two firms have the same size, business
EFERENCES
arnea, A., R. A. Haugen, and L. W. Senbet, (1981), “Market imperfection, agency problems and capital
odnar, G. and J. Weintrop, (1997), “The valuation of the foreign income of U.S. multinational firms: a
urgman, T. A., (1996), “An empirical examination of multinational corporate capital structure”, Journal
utler, K. C. (2004), Multinational Finance. Third edition. Canada: Thomson.
hen, J. P., C. S. Cheng, J. He, and J. Kim, (1997), “An investigation of the relationship between
hen, S. S., K. W. Ho, C. F. Lee, and K. Sherestha, (2004), “Nonlinear models in corporate finance
hkir, I. E. and J. C. Cosset, (2001), “Diversification strategy and capital structure of multinational
eesomsak, R., K. Paudyal, and G. Pescetto, (2004), “The determinants of capital structure: evidence
oukas, J. A., and C. Pantzalis, (2003), “Geographic diversification and agency costs of debt of
iteman, D. and A. Stonehill, (1994), Multinational Business Finance. Seventh edition. Reading, Mass:
oldfeld, S. and R. Quandt, (1973), “The estimator of structural shifts by switching regressions”, Annals
omes, L., and K. Ramaswamy, (1999), “An empirical examination of the form of the relationship
risks, exchange rate risks, agency costs and profitability, but one is MNC and the other is DC, then the MNC will have a lower leverage ratio than the DC (linear model). In addition, the fewer countries a firm exports to or invests in, the lower levels of its leverage (diversification model). Furthermore, the curvilinear and the piecewise linear models show that there is a turning point of the level of internationalization. Internationalization is negatively associated with a firm’s leverage only before some threshold of internationalization. There will be a positive relationship beyond this threshold. (2)Our results support the trade-off theory, the agency cost theory and the pecking order theory of a firm’s capital structure since firms with larger sizes, lower business risks, lower exchange rate exposures, lower agency costs and lower profitability have higher levels of leverage. R Bstructure”, Financial Management 10, pp. 7-22. Bgrowth opportunities perspective”, Journal of Accounting and Economics 24, pp.69-98. Bof International Business Studies 27, pp.553-570. B Cinternational activities and capital structure”, Journal of International Business Studies 28, pp. 563-577. Cresearch: review, critique, and extensions”, Review of Quantitative Finance and Accounting 23, pp.141-169. Ccorporations”, Journal of Multinational Financial Management 11, pp.17-37. Dfrom the Asia Pacific region”, Journal of Multinational Financial Management 14, pp. 387-405. Dmultinational firms”, Journal of Corporate Finance 9, pp.59-92. EAddison-Wesley. Gof Economic and Social Measurement 2, pp.475-485. Gbetween multinationality and performance”, Journal of International Business Studies 30, pp.173-188.
10

The International Journal of Business and Finance Research ♦ Volume 2 ♦ Number 1 ♦ 2008 Hodder, J. E. and L. W. Senbet, (1990), “International capital structure equilibrium”, Journal of Finance
raus, A. and R. Litzenberg, (1973), “A state preference model of optimal financial leverage”, Journal of
ensen, M. C. and W. H. Meckling, (1976), “Theory of the firm: managerial behavior, agency cost, and
orion, P., (1990), “The exchange rate exposure of U.S. multinationals”, Journal of Business, pp.331-345.
ee, K.C. and C. Y. Kwok, (1988), “Multinational corporations vs. domestic corporations: international
iu, Y. A. and L. P. Hsueh, (1993), “Tax effect on the debt denomination decision of multinational
adura, J and R. Fosberg (1990), “The impact of financing sources on multinational projects”, Journal of
ansi, S., and D. M. Reeb, (2002), “Corporate international activity and debt financing”, Journal of
iller, M., (1977), “Debt and taxes”, Journal of Finance 32, pp. 261-275.
odigliani, F and M. Miller (1958), “The cost of capital, corporation finance, and the theory of
odigliani, F and M. Miller (1963), “Corporate income taxes and the cost of capital”, American
yers, S. C., (1977), “Determinants of corporate borrowing”, Journal of Financial Economics 5,
yers, S. C., and N. S. Majluf, (1984), “Corporate financing and investment decisions when firms have
ewey, W. K., and K. D. West, (1987), “A simple positive-definite heteroskedasticity and
hee, G., R. Chang and R. Koveos, (1985), “The currency-of-denomination decision for debt financing”,
hapiro, A. C., (1992), Multinational financial management. Fourth edition. Boston: Allyn and Bacon.
ingh, M., W. N. Davidson, and J. Suchard, (2003), “Corporate diversification strategies and capital
mith, C., (1977), “Alternative methods of raising capital: rights versus underwritten offerings”, Journal
45, pp.1495-1516. KFinance 28, pp. 911-922. Jownership structure”, Journal of financial Economics 3, pp.305-360. J Lenvironmental factors and determinants of capital structure”, Journal of International Business Studies 19, pp.195-217. Lprojects”, Journal of International Business Studies 23, pp. 145-154. MFinancial Research 13, pp. 61-69. MInternational Business Studies, pp.129-147. M Minvestment”, American Economic Review 48, pp. 261-297. MEconomic Review 53, pp. 433-443. Mpp.146-175. Minformation investors do not have”, Journal of Financial Economics 13, pp.187-221. Nautocorrelation-consistent covariance matrix”, Econometrica 55, pp.703-708. RJournal of International Business Studies 16, pp. 143-150. S Sstructure.” Quarterly Review of Economics and Finance 43, pp.147-167. Sof Financial Economics 5, pp.273-307.
11

Y.C. Chiang, S.W. Chen ⎪ The International Journal of Business and Finance Research ♦Vol. 2 ♦ No. 1 ♦ 2008
mith, C. W., and R. Watts, (1992), “The investment opportunity set and corporate financing, dividend,
tglitz, J., (1972), “Some aspects of the pure theory of corporate finance: bankruptcies and take over”,
itman, S. and R. Wessels, (1988), “The determinants of capital structure choice”, Journal of Finance 43,
Sand compensation policies”, Journal of Financial Economics 32, pp.263-292. SBell Journal of Economics and Management 3, pp. 458-482. Tpp.1-19.
12