THE PROVEN LEADER IN BOND INSURANCE
314
2013 ANNUAL REPORT THE PROVEN LEADER IN BOND INSURANCE
-
Upload
khangminh22 -
Category
Documents
-
view
1 -
download
0
Transcript of THE PROVEN LEADER IN BOND INSURANCE

2 013 A n n uA l R e p o R t
The Proven Leader in Bond insurance

Assured Guaranty ltd., through its
subsidiaries (collectively, Assured
Guaranty), guarantees scheduled
principal and interest payments when
due on municipal, public infrastructure
and structured finance transactions in
the united states and select markets
around the world.
The Proven Leader in Bond insurance

PAGE 1
In 2013, we:
• Generated $609 million of operating income, resulting in $2.4 billion of operating income generated
over the past four years;*
• Brought operating shareholders’ equity per share to an all-time high of $33.83 and adjusted book
value per share to $49.58 at year-end;*
• Became a tax resident of the United Kingdom in order to enhance capital management capabilities;
• Reduced our insured leverage by 15% during the year (and 45% over the last four years) to increase
our financial strength;
• Returned $264 million to our shareholders through share repurchases and, in addition, raised our quar-
terly dividend in both 2013 and 2014, resulting in a 22% dividend increase over the past two years;
• Established Municipal Assurance Corp. (MAC), our new muni-only insurance platform, in response to
market needs and to provide a valuable strategic component for our company’s future;
• Successfully closed three U.K. infrastructure transactions, the first bonds of this type launched since
2008, producing $18 million in present value new business production (PVP);*
Dear Fellow ShareholDerS & PolicyholDerS
Dominic J. FredericoPresident and Chief Executive Officer
I am pleased to report that 2013 was a year of significant accomplishments for Assured Guaranty.
We continued to execute our key strategies in a challenging market, achieving highly successful results.
* Please see note 4 on page 14 regarding non-GAAP financial measures used in this Annual Report.

PAGE 2
20132012201120102009
$609$535$601
$655
$278
0
100
200
300
400
500
600
700
800
OPERATING INCOME
(dollars in millions)
20132012201120102009
$49.58$23.30
$2.82
$22.14
ADJUSTED BOOK VALUE PER SHARE
0
10
20
30
40
50
$21.08
$2.31
$25.53
$19.12
$1.66
$28.54
$15.98
$1.14
$30.05
$14.95
$0.80
$33.83
$47.17$49.32$48.92$48.26
Net unearned premium reserve on financial guaranty contracts in excess of net expected loss to be expensed less deferred acquisition costs, after tax
Net present value of estimated net future credit derivative revenue, after tax
Operating shareholders’ equity per share
2013201220112010
$3.6
$0.7$0.5
$1.8
$0.4
0.0
0.5
1.0
1.5
2.0
2.5
3.0
3.5
4.0
R&W REPURCHASE AND SETTLEMENT COMMITMENTS
(dollars in billions)
Estimated total, gross of reinsurance, of (i) settlement receipts and commitments and (ii) R&W putbacks and putback commitments. The putbacks flow through the transaction waterfalls and do not necessarily benefit Assured Guaranty dollar-for-dollar.
20132012201120102009
$392$390$393
$361
$262
0
50
100
150
200
250
300
350
400
OPERATING NET INVESTMENT INCOME
(dollars in millions)
Represents amounts included in operating income.
2009& Prior
$0.2 Lifetime Total
20132012201120102009
$609$535$601
$655
$278
0
100
200
300
400
500
600
700
800
OPERATING INCOME
(dollars in millions)
20132012201120102009
$49.58$23.30
$2.82
$22.14
ADJUSTED BOOK VALUE PER SHARE
0
10
20
30
40
50
$21.08
$2.31
$25.53
$19.12
$1.66
$28.54
$15.98
$1.14
$30.05
$14.95
$0.80
$33.83
$47.17$49.32$48.92$48.26
Net unearned premium reserve on financial guaranty contracts in excess of net expected loss to be expensed less deferred acquisition costs, after tax
Net present value of estimated net future credit derivative revenue, after tax
Operating shareholders’ equity per share
2013201220112010
$3.6
$0.7$0.5
$1.8
$0.4
0.0
0.5
1.0
1.5
2.0
2.5
3.0
3.5
4.0
R&W REPURCHASE AND SETTLEMENT COMMITMENTS
(dollars in billions)
Estimated total, gross of reinsurance, of (i) settlement receipts and commitments and (ii) R&W putbacks and putback commitments. The putbacks flow through the transaction waterfalls and do not necessarily benefit Assured Guaranty dollar-for-dollar.
20132012201120102009
$392$390$393
$361
$262
0
50
100
150
200
250
300
350
400
OPERATING NET INVESTMENT INCOME
(dollars in millions)
Represents amounts included in operating income.
2009& Prior
$0.2 Lifetime Total

PAGE 3
• Purchased, at 70% of par value, $331 million of bonds we insured, which miti-
gated expected losses and contributed to adjusted book value;
• Terminated or agreed to terminate $7 billion of net par outstanding on policies
across which we accelerated the earning of 100% of the total expected premiums.
Total terminations including certain other accelerations contributed $144 million to
pre-tax operating earnings for the year; and
• Caused representation and warranty (R&W) providers and other responsible
parties to pay or agree to pay over $700 million in residential mortgage-backed
securities (RMBS) recoveries; the cumulative recovery to date from RMBS putbacks,
settlements and litigation has now reached $3.6 billion.
SucceSSfully executInG Our StrAteGIeSOur 2013 operating income of $609 million was 14% higher than in 2012. This was
our fourth consecutive year with an operating income that exceeded half a billion
dollars, and during this four-year period of difficult economic times and turmoil in the
financial guaranty industry, we generated $2.4 billion in operating income despite
paying $4 billion of insurance claims for RMBS and some other transactions—a truly
remarkable result.
Also during this timeframe, we significantly deleveraged our exposure, reducing
our insured portfolio by $181 billion—of which $101 billion was structured finance
exposure—taking the total portfolio from $640 billion of net par outstanding at
year-end 2009 to $459 billion at year-end 2013. We also significantly changed the
risk composition, with public finance exposure now representing 84% of our
insured portfolio. At the same time, our statutory capital increased from $4.8 billion
to $6.1 billion, or 27%, and the ratio of our net par outstanding to statutory capital
decreased 45%.
It is important to note that since the beginning of the global financial crisis six years
ago, Assured Guaranty companies paid a total of $6 billion in claims, yet we still
added $1.4 billion to our consolidated statutory capital—a further confirmation of
our sound performance and our ability to handle adverse credit conditions.
As an aside, if you told me at the end of 2007 that we would pay $6 billion in
claims over the next six years—but still increase our capital by $1.4 billion, signifi-
cantly deleverage our insured portfolio and improve its risk profile—I would have
concluded that our financial strength ratings today would be super AAA. But, I am
sorry to say, our financial guaranty ratings by some rating agencies no longer
reflect the amount or consistency of operating results or our capital adequacy.
continuing to execute our key
strategies, we produced more
than $500 million of operating
income for the fourth consecu-
tive year, raised operating
shareholders’ equity per share
to an all-time high and ended
the year with adjusted book
value per share at $49.58.

executive oFFicerS
Robert B. Mills Chief Operating Officer
James M. MichenerGeneral Counsel and Secretary
Robert A. BailensonChief Financial Officer
executive oFFicerS
What is undisputable is that we proved the financial resilience of our company dur-
ing one of the worst economic cycles of the last century. Year after year, we have
accurately assessed the market, defined our strategies accordingly and executed
those strategies effectively.
enhAncInG cApItAl flexIbIlItyLooking back, our assessment going into 2013 was that our insured portfolio would
experience a net decrease in par outstanding during the year due to scheduled run-
off, as well as the low interest rate environment that would likely continue to limit
the demand for new bond insurance. Therefore, we enhanced our capital manage-
ment strategy by returning $264 million to our shareholders through the repurchase
of 12.5 million common shares as part of our ongoing share buyback program. On a
per-share basis, these repurchases, at an average price of $21.12, were accretive to
earnings, operating book value and adjusted book value. We also increased our
quarterly dividend per share by 11% in February of 2013, and further increased it
by an additional 10% in February of 2014.
Seeing that we would benefit from greater capital flexibility within our corporate
structure, we took two further important steps during 2013. First, we obtained
regu latory permission from Maryland and New York insurance regulators that
increased unencumbered assets at AG Re, a key source of funding for our share
repurchase program. Second, we became a tax resident of the United Kingdom.
Both of these actions will make it easier to manage capital efficiently across our
group, as we continue to evaluate and respond to business opportunities and
market conditions.
ServInG Our MArketSTo strengthen our competitive position in the U.S. public finance market, we
established a new municipal-only bond insurance company that provides Assured
Guaranty a response to the market’s desire for a U.S. muni-only insurer and gives us
valuable strategic flexibility as we assess market demand in the future. We successfully
launched MAC in July of 2013, with $1.5 billion of claims-paying resources and an
initial statutory unearned premium reserve of $709 million.
Unlike other start-ups, MAC started out in a strong competitive position because
it does not have any of the key risks associated with many start-ups. From day one,
MAC benefited from market acceptance through Assured Guaranty’s ownership
and from a highly granular and geographically diversified insurance portfolio that
produces positive operating results. We are pleased with the market’s reception
of MAC, which is rated in the AA category by both Kroll Bond Rating Agency and
Standard & Poor’s Ratings Services. MAC’s Kroll rating of AA+, Stable Outlook,
is the highest in the industry from any nationally recognized statistical rating
organization.
PAGE 5
year after year, we have
accurately assessed the
market, defined our strategies
accordingly and executed
those strategies effectively.
In 2013, we enhanced our
capital management strategy
by returning $264 million
to shareholders through
share repurchases.

PAGE 6
With regard to international business, early in the year I spoke publicly about the
growing international infrastructure finance opportunities that we envisioned for
2013. Our prediction was on target. In the second half of the year, we guaranteed
approximately £240 million of U.K. infrastructure bonds across three separate trans-
actions to produce $18 million of PVP. Our years of commitment to international
infrastructure finance clearly began to pay off in 2013, and we are confident
that our U.S. structured finance business will also benefit from the same level
of strategic commitment.
Companywide, in all of our markets, we generated PVP totaling $141 million by
writing $9.4 billion of financial guarantees. We achieved this in a market environ-
ment full of headwinds, as municipal issuance was down by 15%, interest rates
generally remained low and credit spreads were relatively tight.
WOrkInG WIth MunIcIpAlItIeS tO reSOlve fInAncIAl StreSSAssured Guaranty remains committed to working cooperatively with financially
stressed municipalities whose bonds we have insured, including those in default. In
this regard, we have an important advantage as a single point of representation for
negotiation. This may allow us to help prevent a default before it occurs, relieves a
burden for investors and, when a restructuring becomes necessary, streamlines the
process for issuers.
In an excellent example, during 2013, we and other stakeholders devised an innova-
tive solution to facilitate an exit from bankruptcy for Jefferson County, Alabama.
As part of the county’s restructuring plan, which involved the issuance of $1.8 bil-
lion in securities, our insurance facilitated an optimal sale of $600 million of senior
sewer revenue warrants, which we guaranteed based on the county’s improved
credit. Our participation in the county’s bankruptcy exit plan underscores our unique
ability to assist issuers in accessing the capital markets to help them achieve critical
financial objectives.
Also in 2013, we reached a final agreement with Harrisburg, Pennsylvania, and a
tentative settlement with Stockton, California, in connection with debt restructuring
plans that should contribute to stabilizing these cities’ financial condition.
Our expOSure tO DetrOIt AnD puertO rIcOTwo of our insured credits, Detroit and Puerto Rico, have been prominent in recent
financial headlines. Although both must address significant financial problems, their
political leaders have chosen very different approaches.
The City of Detroit has filed a plan of adjustment with the bankruptcy court that we
believe is not confirmable. Besides unfairly discriminating against bondholders, the
plan fails to respect state law restrictions on voter-approved special tax revenues and
bankruptcy code protections for secured creditors. In the case of Detroit’s water
and sewer revenue bonds, which account for 85% of our insured Detroit exposure,
the plan disregards some of the protections afforded to holders of special revenue
bonds of solvent water and sewer systems.
We launched MAc, our new
u.S. muni-only bond insurer,
in July 2013 to strengthen our
competitive position in the
market for small and medium-
size municipal transactions.
In the united kingdom,
we guaranteed the first
wrapped infrastructure
bonds since 2008.

executive oFFicerS
Howard W. Albert Chief Risk Officer
Russell B. Brewer II Chief Surveillance Officer
Bruce E. Stern Executive Officer

PAGE 8
20132012201120102009
$609$535$601
$655
$278
0
100
200
300
400
500
600
700
800
OPERATING INCOME
(dollars in millions)
20132012201120102009
$49.58$23.30
$2.82
$22.14
ADJUSTED BOOK VALUE PER SHARE
0
10
20
30
40
50
$21.08
$2.31
$25.53
$19.12
$1.66
$28.54
$15.98
$1.14
$30.05
$14.95
$0.80
$33.83
$47.17$49.32$48.92$48.26
Net unearned premium reserve on financial guaranty contracts in excess of net expected loss to be expensed less deferred acquisition costs, after tax
Net present value of estimated net future credit derivative revenue, after tax
Operating shareholders’ equity per share
2013201220112010
$3.6
$0.7$0.5
$1.8
$0.4
0.0
0.5
1.0
1.5
2.0
2.5
3.0
3.5
4.0
R&W REPURCHASE AND SETTLEMENT COMMITMENTS
(dollars in billions)
Estimated total, gross of reinsurance, of (i) settlement receipts and commitments and (ii) R&W putbacks and putback commitments. The putbacks flow through the transaction waterfalls and do not necessarily benefit Assured Guaranty dollar-for-dollar.
20132012201120102009
$392$390$393
$361
$262
0
50
100
150
200
250
300
350
400
OPERATING NET INVESTMENT INCOME
(dollars in millions)
Represents amounts included in operating income.
2009& Prior
$0.2 Lifetime Total
2013
$75
$.12
DIVIDENDS
Per share ($) Total paid ($ millions)
0
10
20
30
40
50
60
70
80
0.00
0.05
0.10
0.15
0.20
0.25
0.30
0.35
0.40
$.12$.14
$.16$.18 $.18 $.18 $.18
$.36
$9 $9 $10 $11$16
$22
$33 $33
$69
$.40
2004* 2005 2006 2007 2008 2009 2010 2011 2012
In February 2014, we increased our quarterly dividend by 10% to $0.11 per share.
*In 2004, dividends were paid following our April IPO. The amount shown is the quarterly dividend, annualized.
20132012201120102009
$6.1$5.9$5.7
$4.9$4.8
0
1
2
3
4
5
6
7
8
CONSOLIDATED QUALIFIED STATUTORY CAPITAL
(dollars in billions)
20132012201120102009
$12,147$12,328$12,839$12,630$13,051
CONSOLIDATED CLAIMS-PAYING RESOURCES AND INSURED PORTFOLIO LEVERAGE
(dollars in millions)
Consolidated claims-paying resources Ratio of statutory net par outstanding to total claims-paying resources
30
40
50
0
3000
6000
9000
12000
15000
40x42x
47x48x
36x

PAGE 9
While our exposure to the unlimited tax general obligation (ULTGO) bonds is limited
to $146 million, the plan’s proposed treatment of those bonds has serious implica-
tions for Detroit, and more generally, for municipal finance in the State of Michigan.
The plan proposes that ULTGO bondholders effectively receive 20% of what they
are owed, and it proposes to divert special tax revenues specifically approved by the
voters only to pay debt service on ULTGO bonds to the city’s general fund and to
fund distributions to other, unsecured creditors. Additionally, the secured ULTGO
bonds ultimately may be treated less favorably than other unsecured general fund
debt, which challenges fundamental principles underpinning the entire municipal
bond market.
Situations like this are rare in our portfolio, but in this highly publicized case, the
behavior of some Michigan elected officials and their appointees is alarming. To
claim, or support the proposition, that ULTGO bonds are unsecured, despite a pledge
of the city’s taxing authority and resources—approved, in Detroit’s case, by the City
Council, Detroit voters, and the Michigan State Treasurer—is at best misguided but,
more directly, morally and ethically reprehensible.
Further, there is no legal or ethical basis for the city’s proposal to insulate selected
assets, like the art museum’s, to obtain additional funding from outside sources—
such as foundations or the state—and then apply those funds preferentially to simi-
larly situated or lower ranking classes of creditors.
The situation in Puerto Rico provides a stark contrast. The Commonwealth is still
current on all of its debt service payments and recently issued new bonds intended
to allow more time for it to resolve its problems. We recognize that its administra-
tion has shown it knows the importance of finding solutions that both improve its
financial stability and honor its obligations to creditors. However, based on our
analysis of the economic conditions and dynamics regarding Puerto Rico, including
its access and potential costs for future financing, we internally downgraded these
credits and established reserves, which are reflected in our 2013 results.
That said, S&P and Moody’s have both made clear that Assured Guaranty’s expo-
sures to Detroit and Puerto Rico have not affected the ratings or stable outlooks of
Assured Guaranty Municipal or Assured Guaranty Corp. In fact, S&P upgraded both
of their ratings, as well as MAC’s, to AA, Stable Outlook, on March 18, 2014. This is
the highest rating S&P currently assigns to active financial guarantors.
MAC, by the way, has no exposure to either of these distressed credits.
We reduced our insured lever-
age by 15% during 2013 and
45% over the last four years,
while repositioning the insured
portfolio composition to 84%
public finance. Over those four
years, our statutory capital
increased 27% from $4.8
billion to $6.1 billion.

Senior ManageMent
Ling ChowDeputy General Counsel, Corporate
Stephen Donnarumma Chief Credit Officer
Ivana M. GrilloManaging Director, Human Resources
Donald H. PastonManaging Director and Treasurer

PAGE 11
Of course, holders of Detroit, Puerto Rico or any other bonds that we insure are fully
protected by our unconditional guaranty that they will receive their principal and
interest payments on time and in full in accordance with the terms of Assured
Guaranty’s insurance policies. Even now, holders of Detroit and Puerto Rico bonds
we guarantee are benefiting from their insured bonds’ relative price stability when
compared with the same issuers’ uninsured obligations.
While we don’t believe these credits reflect a systemic trend in public finance, it is
important to note that headlines about municipal risk do generate interest in bond
insurance, reinforcing the value that our bondholder protection provides in troubled
situations and the relative price stability of our insured bonds.
With direct insurance in force on approximately 10,000 municipal credits, our under-
writing track record is outstanding. We expect ultimate losses on fewer than a
dozen municipal credits, and during the fourth quarter of 2013, we made claim
payments on only five.
envISIOnInG the next yeAr AnD beyOnDWe are well-positioned for 2014 with $12 billion in claims-paying resources, close
to $400 million of annual investment income and $4.1 billion in consolidated net
unearned premium reserves.
Ultimately, the need to replace the aging U.S. infrastructure and to fund new proj-
ects will support the issuance of municipal bonds. And, in the longer run, we are
confident that interest rates will rise as the economy continues to improve and that
credit spreads will, in due course, widen—creating improved conditions for new
business origination.
Senior ManageMent
20132012201120102009
$609$535$601
$655
$278
0
100
200
300
400
500
600
700
800
OPERATING INCOME
(dollars in millions)
20132012201120102009
$49.58$23.30
$2.82
$22.14
ADJUSTED BOOK VALUE PER SHARE
0
10
20
30
40
50
$21.08
$2.31
$25.53
$19.12
$1.66
$28.54
$15.98
$1.14
$30.05
$14.95
$0.80
$33.83
$47.17$49.32$48.92$48.26
Net unearned premium reserve on financial guaranty contracts in excess of net expected loss to be expensed less deferred acquisition costs, after tax
Net present value of estimated net future credit derivative revenue, after tax
Operating shareholders’ equity per share
2013201220112010
$3.6
$0.7$0.5
$1.8
$0.4
0.0
0.5
1.0
1.5
2.0
2.5
3.0
3.5
4.0
R&W REPURCHASE AND SETTLEMENT COMMITMENTS
(dollars in billions)
Estimated total, gross of reinsurance, of (i) settlement receipts and commitments and (ii) R&W putbacks and putback commitments. The putbacks flow through the transaction waterfalls and do not necessarily benefit Assured Guaranty dollar-for-dollar.
20132012201120102009
$392$390$393
$361
$262
0
50
100
150
200
250
300
350
400
OPERATING NET INVESTMENT INCOME
(dollars in millions)
Represents amounts included in operating income.
2009& Prior
$0.2 Lifetime Total

buSineSS leaDerS
William J. Hogan Senior Managing Director, Public Finance
Paul R. LivingstoneSenior Managing Director, Structured Finance
William B. O’KeefeSenior Managing Director, Public Finance Marketing
Nicholas J. ProudSenior Managing Director, International
Robert S. TuckerManaging Director, Investor Relations and Corporate Communications

buSineSS leaDerS
PAGE 13
So what is our vision for 2014?
• We believe we can achieve growth in new business production with contributions
from all of our business areas.
• We expect opportunities to augment both our production results and our unearned
premium reserve through the reassumption of previously ceded business or acqui-
sitions of insured portfolios from legacy insurers.
• We will continue to extract value where we find it through our loss mitigation
strategies.
• Finally, we intend to continue optimizing our capital management across the
group, which would include utilizing, when appropriate, our $400 million share
repurchase authorization.
With our success in achieving greater capital flexibility, continuing to deleverage
our exposure, launching MAC, capturing more recoveries, and resolving troubled
credits, Assured Guaranty is clearly in a very good position for the future. We have
proven that we have the strength, flexibility and human capital to deal with even
the most challenging market conditions.
I would like to thank our shareholders and policyholders for their continued support,
and I look forward to updating you on our future business developments and finan-
cial results.
Dominic J. FredericoPresident and Chief Executive OfficerMarch 2014
2013
$75
$.12
DIVIDENDS
Per share ($) Total paid ($ millions)
0
10
20
30
40
50
60
70
80
0.00
0.05
0.10
0.15
0.20
0.25
0.30
0.35
0.40
$.12$.14
$.16$.18 $.18 $.18 $.18
$.36
$9 $9 $10 $11$16
$22
$33 $33
$69
$.40
2004* 2005 2006 2007 2008 2009 2010 2011 2012
In February 2014, we increased our quarterly dividend by 10% to $0.11 per share.
*In 2004, dividends were paid following our April IPO. The amount shown is the quarterly dividend, annualized.
20132012201120102009
$6.1$5.9$5.7
$4.9$4.8
0
1
2
3
4
5
6
7
8
CONSOLIDATED QUALIFIED STATUTORY CAPITAL
(dollars in billions)
20132012201120102009
$12,147$12,328$12,839$12,630$13,051
CONSOLIDATED CLAIMS-PAYING RESOURCES AND INSURED PORTFOLIO LEVERAGE
(dollars in millions)
Consolidated claims-paying resources Ratio of statutory net par outstanding to total claims-paying resources
30
40
50
0
3000
6000
9000
12000
15000
40x42x
47x48x
36x

(Dollars in millions, except per share amounts)Year ended December 31, 2013 2012 2011 2010 2009
Summary of OperationsRevenues included in operating income:Net earned premiums1 $ 811 $ 1,006 $ 995 $ 1,235 $ 930Net investment income 392 390 393 361 262Net realized investment gains (losses) (4) 7 0 — —Credit derivative revenues 121 127 188 210 171Other income (3) 97 40 54 28
Total revenues in operating income 1,317 1,627 1,616 1,860 1,391
Expenses included in operating income:Loss expense: Financial guaranty insurance1 175 568 555 478 394 Credit derivatives (1) 28 (62) 209 239Interest expense 82 92 99 100 63Other expenses2, 3 230 226 229 267 328
Total expenses in operating income 486 914 821 1,054 1,024
Operating income before taxes 831 713 795 806 367Tax provision (benefit) on operating income 222 178 194 151 89
Operating income4 609 535 601 655 278
Items not included in operating income:5
Realized gains (losses) on investments 40 (4) (20) 1 (34)Non-credit impairment unrealized fair value gains (losses) on credit derivatives (40) (486) 244 13 (82)Fair value gains (losses) on committed capital securities 7 (12) 23 6 (80)Foreign exchange gains (losses) on remeasurement of premiums receivable and loss and loss adjustment expense reserves (1) 15 (3) (25) 23Effect of consolidating financial guaranty variable interest entities 193 62 (72) (166) —Goodwill and settlement of pre-existing relationship — — — — (23)
Net income attributable to Assured Guaranty Ltd. $ 808 $ 110 $ 773 $ 484 $ 82
Operating income per diluted share $ 3.25 $ 2.81 $ 3.24 $ 3.46 $ 2.15Net income per diluted share 4.30 0.57 4.16 2.56 0.63
Balance Sheet DataShareholders’ equity attributable to Assured Guaranty (book value) $ 5,115 $ 4,994 $ 4,652 $ 3,670 $ 3,455Book value per share 28.07 25.74 25.52 19.97 18.76
Operating shareholders’ equity4 $ 6,164 $ 5,830 $ 5,201 $ 4,691 $ 4,076Operating shareholders’ equity per share4 33.83 30.05 28.54 25.53 22.14
Adjusted book value4 $ 9,033 $ 9,151 $ 8,987 $ 8,989 $ 8,887Adjusted book value per share4 49.58 47.17 49.32 48.92 48.26
New Business and Financial Guaranty Insured PortfolioPresent value of new business production (PVP)4 $ 141 $ 210 $ 243 $ 363 $ 640
Net debt service outstanding (end of period)6 $ 690,535 $ 780,356 $ 844,447 $ 926,698 $ 958,037
Net par outstanding (end of period):6
Public finance $ 386,179 $ 425,469 $ 442,119 $ 467,739 $465,853 Structured finance 72,928 93,303 114,711 148,947 174,341
Total net par outstanding $ 459,107 $ 518,772 $ 556,830 $ 616,686 $ 640,194
Claims-Paying ResourcesPolicyholders’ surplus $ 3,202 $ 3,579 $ 3,116 $ 2,627 $ 2,962Contingency reserve 2,934 2,364 2,572 2,288 1,879
Qualified statutory capital $ 6,136 $ 5,943 $ 5,688 $ 4,915 $ 4,841
Claims-paying resources $ 12,147 $ 12,328 $ 12,839 $ 12,630 $ 13,051
(1) Starting in 2010, amounts include net earned premiums and loss and loss adjustment expenses on policies where the variable interest entities are consolidated under accounting principles generally accepted in the United States of America (GAAP).
(2) Includes operating expenses, expenses related to the acquisition of Assured Guaranty Municipal Holdings Inc. and amortization of deferred acquisition costs.(3) 2011 and earlier comparative years have been restated to incorporate the impact of adopting the new accounting guidance on policy acquisitions effective January 1, 2012.(4) Operating income, operating income per diluted share, operating shareholders’ equity, operating shareholders’ equity per share, adjusted book value, adjusted book value per share and PVP are financial
measures that are not in accordance with GAAP, and we refer to them as non-GAAP financial measures. Please see Assured Guaranty’s annual report on Form 10-K, around which this Annual Report is wrapped, for a definition of these non-GAAP financial measures and a reconciliation of these non-GAAP financial measures to the most comparable financial information prepared in accordance with GAAP.
(5) Represents after-tax components of net income that are not included in operating income.(6) Net debt service and net par outstanding amounts exclude amounts related to securities Assured Guaranty has purchased for loss mitigation purposes, which securities we refer to as “loss mitigation
bonds.” See annual report on Form 10-K, Note 3, Outstanding Exposure, of the Financial Statements and Supplementary Data for additional information.
Financial highlightS
PAGE 14

Board of directors of Assured Guaranty ltd.Robin Monro-DaviesChairman of the Board and of the Executive Committee
Dominic J. FredericoPresident and Chief Executive Officer and member of the Executive Committee
Neil BaronMember of the Finance and Risk Oversight Committees
Francisco L. BorgesChairman of the Compensation Committee; member of the Nominating and Governance, Risk Oversight and Executive Committees
G. Lawrence Buhl Chairman of the Risk Oversight Committee and member of the Compensation Committee
Stephen A. Cozen Chairman of the Nominating and Governance Committee and member of the Compensation Committee
Bonnie L. HowardMember of the Audit and Finance Committees
Patrick W. KennyChairman of the Audit Committee; member of the Nominating and Governance and Executive Committees
Simon W. LeathesMember of the Audit, Finance and Executive Committees
Michael T. O’KaneChairman of the Finance Committee and member of the Audit Committee
Wilbur L. Ross, Jr.Director
Corporate HeadquartersAssured Guaranty Ltd. 30 Woodbourne Avenue Hamilton HM 08 Bermuda Phone: 1 441 279 5700
other locationsBermuda Assured Guaranty Re Ltd. 30 Woodbourne Avenue Hamilton HM 08 Phone: 1 441 279 5700
United States Assured Guaranty Municipal Corp. Municipal Assurance Corp. Assured Guaranty Corp. 31 West 52nd Street New York, NY 10019 Phone: 1 212 974 0100
Assured Guaranty Municipal Corp. Assured Guaranty Corp. One Market, 1550 Spear Tower San Francisco, CA 94105 Phone: 1 415 995 8000
AG & Company 8105 Irvine Center Drive 9th Floor Irvine, CA 92618 Phone: 1 949 954 7888
United Kingdom Assured Guaranty (Europe) Ltd. 1 Finsbury Square London, EC2A 1AE Phone: 44 0 20 7562 1900
Australia Assured Guaranty Corp. Assured Guaranty Services (Australia) Pty Ltd Level 39, Aurora Place 88 Phillip Street Sydney, NSW 2000 Phone: 61 2 9241 3455
stock exchange listingAssured Guaranty Ltd. is listed on the New York Stock Exchange under the symbol AGO.
Investor InquiriesOur annual report on Form 10-K, quarterly reports on Form 10-Q, proxy statement, quarterly earnings releases and other investor infor-mation may be obtained at no cost by contacting the Investor Rela tions Department. Links to our SEC filings, press releases and product and other information may be found on our website at AssuredGuaranty.com.
Our Code of Conduct, Governance Guidelines and Categorical Standards of Director Independence, Board Committee Charters and other information relating to corporate governance are also available on our website at AssuredGuaranty.com/governance.
The Investor Relations Department can be contacted at: Assured Guaranty Ltd. Investor Relations Department 30 Woodbourne Avenue Hamilton HM 08 Bermuda Phone: 1 441 279 5705 E-mail: [email protected]
Independent AuditorsPricewaterhouseCoopers LLP 300 Madison Avenue New York, NY 10017
transfer Agent of shareholder RecordsShareholder correspondence should be mailed to: Computershare P.O. Box 30170College Station, TX 77842-3170
Overnight correspondence should be sent to: Computershare 211 Quality Circle, Suite 210College Station, TX 77845
Shareholder website www.computershare.com/investor
Shareholder online inquiries https://www-us.computershare.com/ investor/Contact
In the U.S. Phone: 1 866 214 2267Outside the U.S. Phone: 1 201 680 6578For hearing impaired in the U.S. Phone: 1 800 231 5469For hearing impaired outside the U.S. Phone: 1 201 680 6610
Corporate & Shareholder InformatIonA
nnua
l Re
po
rt D
esi
gn
by
Cur
ran
& C
onn
ors
, Inc
. / w
ww
.cur
ran
-co
nno
rs.c
om

30 Woodbourne Avenue, Hamilton HM 08, Bermuda | 1 441 279 5700 | AssuredGuaranty.com

The Proven Leader in Bond insurance
Assured Guaranty Municipal | Municipal Assurance Corp. | Assured Guaranty Corp.

STRATEGY

Assured Guaranty bond insurance
helps issuers realize savings
through cost-efficient access to
capital. For investors, we guaran-
tee timely debt service payments
and provide added value through
our experienced credit selection,
underwriting and surveillance.
The Proven Leader in Bond insurance

VISIONWe focus on the long term while continually evaluating and adjusting for near-term conditions and opportunities. Our drive to build the value of our product and our company has made us the leader in bond insurance.

securiTy for invesTors and soLuTions for issuersAssured Guaranty provides increased security and enhanced market liquidity for investors in our guaranteed municipal bonds, as well as improved protec-tion for infrastructure and structured finance transactions. We offer bond investors unconditional and irrevocable guarantees that principal and interest will be paid in full, on time, every time, and we back those promises with $12 billion in claims-paying resources across our group of companies.
For almost three decades, we have been a steady source of credit protection and a reliable provider of disciplined credit selection, underwriting, due diligence and ongoing surveillance. And with $400 million of daily trading volume, the market provides a high level of liquidity for our insured municipal bonds.
Because investors value these benefits, issuers enjoy more cost-efficient access to capital. No other bond insurer has our capacity or diversified capabilities, and we take pride in the responsive service we provide and our ability to help issuers launch cost-saving insured bonds with speed and certainty.
Proven and TrusTedOne reason we are trusted by the holders of more than $325 billion of our guar-anteed municipal bonds is our record of sound underwriting and risk manage-ment. Our highly experienced management team leads the financial guaranty industry’s largest staff of underwriters, attorneys and risk management and surveillance professionals. Investors appreciate the knowledge and experience we put into making certain the bonds we insure meet our investment grade underwriting standards, as well as our monitoring of each issue to maturity.
In recent years, a small number of high-profile defaults have raised awareness of the risks in public finance and also proven the value of our insurance. As owners of our insured bonds in Detroit, Michigan; Stockton, California; or Jefferson County, Alabama can attest, Assured Guaranty policyholders have never missed an interest or principal payment—even when an issuer defaults. No other financial guarantor has our track record of meeting all obligations while maintaining capital strength and positive operating performance.
The Proven Leader in Bond insurance
2013
$75
$.12
DIVIDENDS
Per share ($) Total paid ($ millions)
0
10
20
30
40
50
60
70
80
0.00
0.05
0.10
0.15
0.20
0.25
0.30
0.35
0.40
$.12$.14
$.16$.18 $.18 $.18 $.18
$.36
$9 $9 $10 $11$16
$22
$33 $33
$69
$.40
2004* 2005 2006 2007 2008 2009 2010 2011 2012
In February 2014, we increased our quarterly dividend by 10% to $0.11 per share.
*In 2004, dividends were paid following our April IPO. The amount shown is the quarterly dividend, annualized.
20132012201120102009
$6.1$5.9$5.7
$4.9$4.8
0
1
2
3
4
5
6
7
8
CONSOLIDATED QUALIFIED STATUTORY CAPITAL
(dollars in billions)
20132012201120102009
$12,147$12,328$12,839$12,630$13,051
CONSOLIDATED CLAIMS-PAYING RESOURCES AND INSURED PORTFOLIO LEVERAGE
(dollars in millions)
Consolidated claims-paying resources Ratio of statutory net par outstanding to total claims-paying resources
30
40
50
0
3000
6000
9000
12000
15000
40x42x
47x48x
36x

The Proven Leader in Bond insurance
77% U.S. Public FinanceA average rating
13% U.S. Structured FinanceAA- average rating
7% Non-U.S. Public Finance BBB+ average rating
3% Non-U.S. Structured FinanceAA+ average rating
$459.1 billion, A average rating
Ratings on this page are based on our internal rating scale.CONSOLIDATED NET PAR OUTSTANDING
As of December 31, 2013
$352.2 billion
U.S. PUBLIC FINANCE NET PAR OUTSTANDING BY RATING
As of December 31, 2013
1.4% AAA
30.5% AA
54.8% A
10.7% BBB
2.6% BIG*
$352.2 billion, A average rating
U.S. PUBLIC FINANCE NET PAR OUTSTANDING BY SECTOR
As of December 31, 2013
44% General Obligation
19% Tax-Backed
16% Municipal Utilities
9% Transportation
4% Healthcare
4% Higher Education
4% Other Public Finance
20132012201120102009
$10,7999$11,011$11,091
$10,566$10,852
0
2000
4000
6000
8000
10000
12000
AVAILABLE-FOR-SALE INVESTMENT PORTFOLIO AND CASH
(dollars in millions)
*Below investment grade
GAAP basis investment portfolio and cash, excluding other invested assets.

StrategyOur strategic choices have proven effective. We have
consistently met our obligations to investors, protected our capital base, worked responsively with issuers to help
them save money, and produced positive operating performance.
The Proven Leader in Bond insurance

executIONIn every aspect of our business—from underwriting and surveillance to paying claims, loss mitigation and capital management—we have demonstrated we have the strength, flexibility and human capital to succeed.

executIONchoices To saTisfy invesTor PreferencesAssured Guaranty serves various investor segments through three operating subsidiaries:
Assured Guaranty Municipal Corp. (AGM), committed to insuring only U.S. municipal bonds across the broadest range of credit types and for large, medium and small transactions, and to guaranteeing infrastructure transac-tions in select countries;
Municipal Assurance Corp. (MAC), launched with $1.5 billion in claims-paying resources in 2013 to guarantee only select categories of municipal bonds issued in U.S. states and the District of Columbia, particularly for medium and small size transactions; as of March 18, 2014, MAC was licensed in all states except Alabama, California, New Mexico and Wyoming; and
Assured Guaranty Corp. (AGC), our most diversified financial guarantor, insuring both public finance and structured finance obligations, including asset-backed securities.
Our three bond insurance platforms, and our reinsurance affiliate Assured Guaranty Re Ltd., share our experience, culture of prudent risk management and business infrastructure. And each is built on our robust business model, with the embedded earnings power of substantial unearned premium reserves and sizable investment portfolios.
sTrengTh, TransParency, commiTmenTOur financial position is enhanced by our broad, ready access to capital, which includes both debt and equity markets. We are a public company listed on the New York Stock Exchange (NYSE: AGO) and therefore not dependent on a lone capital funder or small group of funders that may have changing interests or commitment. Our public ownership also means we are held to higher legal standards of disclosure, oversight and transparency than non-public companies.
With our financial strength and proven business model, we are committed to serving our markets as the premier financial guaranty insurer.
The Proven Leader in Bond insurance
77% U.S. Public FinanceA average rating
13% U.S. Structured FinanceAA- average rating
7% Non-U.S. Public Finance BBB+ average rating
3% Non-U.S. Structured FinanceAA+ average rating
$459.1 billion, A average rating
Ratings on this page are based on our internal rating scale.CONSOLIDATED NET PAR OUTSTANDING
As of December 31, 2013
$352.2 billion
U.S. PUBLIC FINANCE NET PAR OUTSTANDING BY RATING
As of December 31, 2013
1.4% AAA
30.5% AA
54.8% A
10.7% BBB
2.6% BIG*
$352.2 billion, A average rating
U.S. PUBLIC FINANCE NET PAR OUTSTANDING BY SECTOR
As of December 31, 2013
44% General Obligation
19% Tax-Backed
16% Municipal Utilities
9% Transportation
4% Healthcare
4% Higher Education
4% Other Public Finance
20132012201120102009
$10,7999$11,011$11,091
$10,566$10,852
0
2000
4000
6000
8000
10000
12000
AVAILABLE-FOR-SALE INVESTMENT PORTFOLIO AND CASH
(dollars in millions)
*Below investment grade
GAAP basis investment portfolio and cash, excluding other invested assets.

The Proven Leader in Bond insurance

STRATEGY

Assured Guaranty Municipal | Municipal Assurance Corp. | Assured Guaranty Corp.
Assured Guaranty Ltd. 30 Woodbourne Avenue
Hamilton HM 08 Bermuda
Phone: 1 441 279 5700
Assured Guaranty Municipal Corp. Municipal Assurance Corp.
Assured Guaranty Corp.31 West 52nd StreetNew York, NY 10019
USAPhone: 1 212 974 0100
Assured Guaranty Municipal Corp. Assured Guaranty Corp.
One Market, 1550 Spear TowerSan Francisco, CA 94105
USAPhone: 1 415 995 8000
Assured Guaranty Re Ltd. 30 Woodbourne Avenue
Hamilton HM 08Bermuda
Phone: 1 441 279 5700
Assured Guaranty (Europe) Ltd. 1 Finsbury Square
London, EC2A 1AEUnited Kingdom
Phone: 44 0 20 7562 1900
Assured Guaranty Corp. Assured Guaranty Services (Australia) Pty Ltd
Level 39, Aurora Place88 Phillip Street
Sydney, NSW 2000Australia
Phone: 61 2 9241 3455
AssuredGuaranty.com
These materials are for informational purposes only. They may not and do not constitute an offer to sell or a solicitation of an offer to buy any security, insurance product or other product or service or financial, legal, regulatory, accounting, tax, investment or other professional advice. These materials do not constitute advice with respect to any municipal financial products, or the issuance of any municipal securities, including with respect to the structuring, timing or terms of any such financial products or issuances. Not all of the products or services described in these materials are available in all jurisdictions or to all potential customers or investors.

ASSURED GUARANTY2013 FORM 10-K
Forward-Looking Statements Forward-looking statements are being made in this Annual Report that reflect the current views of Assured Guaranty with respect to future events and financial performance. They are made pursuant to the safe harbor provisions of the Private Securities Litigation Reform Act of 1995. Actual results could differ materially from these statements. Assured Guaranty’s forward-looking statements, including those about its financial resources; its financial strength ratings and rating agency capital; the demand for its insurance product in different markets; the opportunities available to reassume business or acquire insured portfolios from legacy insurers; its ability to mitigate losses effectively; and its ability to effectuate its capital management strategies could be affected by a number of factors, including those identified in Assured Guaranty’s filings with the Securities and Exchange Commission, which are available on its website. Do not place undue reliance on these forward-looking statements, which are made only as of March 20, 2014. Assured Guaranty does not undertake to publicly update or revise any forward-looking statements, whether as a result of new information, future events or otherwise, except as required by law.

[ This Page Intentionally Left Blank ]
0345r4.indd 2 3/19/14 3:27 PM

UNITED STATESSECURITIES AND EXCHANGE COMMISSION
Washington, D.C. 20549____________________________________________________________________________
FORM 10-K�� ANNUAL REPORT UNDER SECTION 13 OR 15(d) OF THE SECURITIES
EXCHANGE ACT OF 1934For the fiscal year ended December 31, 2013
Or
�� TRANSITION REPORT PURSUANT TO SECTION 13 OR 15(d) OF THESECURITIES EXCHANGE ACT OF 1934
For the transition period from to
Commission File Number 001-32141
ASSURED GUARANTY LTD.(Exact name of Registrant as specified in its charter)
Bermuda(State or other jurisdiction ofincorporation or organization)
98-0429991(I.R.S. Employer Identification No.)
30 Woodbourne AvenueHamilton HM 08 Bermuda
(441) 279-5700(Address, including zip code, and telephone number,
including area code, of Registrant's principal executive office)None
(Former name, former address and former fiscal year, if changed since last report)
Securities registered pursuant to Section 12(b) of the Act:
Title of each class Name of each exchange on which registeredCommon Shares, $0.01 per share New York Stock Exchange, Inc.
Securities registered pursuant to Section 12(g) of the Act: None
Indicate by check mark if the registrant is a well-known seasoned issuer, as defined in Rule 405 of the Securities Act. Yes � No �
Indicate by check mark if the registrant is not required to file reports pursuant to Section 13 or Section 15(d) of the Act. Yes � No�
Indicate by check mark whether the registrant: (1) has filed all reports required to be filed by Section 13 or 15(d) of the Securities Exchange Act of1934 during the preceding 12 months (or for such shorter period that the Registrant was required to file such reports), and (2) has been subject to such filingrequirements for the past 90 days. Yes � No �
Indicate by check mark whether the registrant has submitted electronically and posted on its corporate Web site, if any, every Interactive Data Filerequired to be submitted and posted pursuant to Rule 405 of Regulation S-T during the preceding 12 months (or for such shorter period that the registrant wasrequired to submit and post such files). Yes � No�
Indicate by check mark if disclosure of delinquent filers pursuant to Item 405 of Regulation S-K is not contained herein, and will not be contained, tothe best of registrant's knowledge, in definitive proxy or information statements incorporated by reference in Part III of this Form 10-K or any amendment tothis Form 10-K.�
Indicate by check mark whether the registrant is a large accelerated filer, an accelerated filer, a non-accelerated filer, or a smaller reporting company.See the definitions of "large accelerated filer," "accelerated filer," and "smaller reporting company" in Rule 12b-2 of the Exchange Act.
Large accelerated filer � Accelerated filer �
Non-accelerated filer�(Do not check if a
smaller reporting company) Smaller reporting company�
Indicate by check mark whether the registrant is a shell company (as defined in Rule 12b-2 of the Exchange Act). Yes � No �
The aggregate market value of Common Shares held by non-affiliates of the Registrant as of the close of business on June 30, 2013 was$3,659,040,438 (based upon the closing price of the Registrant's shares on the New York Stock Exchange on that date, which was $22.06). For purposes of thisinformation, the outstanding Common Shares which were owned by all directors and executive officers of the Registrant were deemed to be the only shares ofCommon Stock held by affiliates.
As of February 21, 2014, 182,355,159 Common Shares, par value $0.01 per share, were outstanding (including 48,273 unvested restricted shares)
DOCUMENTS INCORPORATED BY REFERENCECertain portions of Registrant's definitive proxy statement relating to its 2014 Annual General Meeting of Shareholders are incorporated by
reference to Part III of this report.
0345r4.indd 3 3/19/14 3:27 PM

[ This Page Intentionally Left Blank ]
0345r4.indd 4 3/19/14 3:27 PM

Forward Looking Statements
This Form 10-K contains information that includes or is based upon forward looking statements within the meaning ofthe Private Securities Litigation Reform Act of 1995. Forward looking statements give the expectations or forecasts of futureevents of Assured Guaranty Ltd. (“AGL” and, together with its subsidiaries, “Assured Guaranty” or the “Company”). Thesestatements can be identified by the fact that they do not relate strictly to historical or current facts and relate to future operatingor financial performance.
Any or all of Assured Guaranty’s forward looking statements herein are based on current expectations and the currenteconomic environment and may turn out to be incorrect. Assured Guaranty’s actual results may vary materially. Among factorsthat could cause actual results to differ materially are:
• rating agency action, including a ratings downgrade, a change in outlook, the placement of ratings on watch fordowngrade, or a change in rating criteria, at any time, of Assured Guaranty or any of its subsidiaries and/or oftransactions that Assured Guaranty’s subsidiaries have insured;
• reduction in the amount of available insurance opportunities and/or in the demand for Assured Guaranty'sinsurance;
• developments in the world’s financial and capital markets that adversely affect obligors’ payment rates, AssuredGuaranty’s loss experience, or its exposure to refinancing risk in transactions (which could result in substantialliquidity claims on its guarantees);
• the possibility that budget shortfalls or other factors will result in credit losses or impairments on obligations ofstate and local governments that the Company insures or reinsures;
• the failure of Assured Guaranty to realize insurance loss recoveries or damages through loan putbacks, settlementnegotiations or litigation;
• deterioration in the financial condition of Assured Guaranty’s reinsurers, the amount and timing of reinsurancerecoverables actually received and the risk that reinsurers may dispute amounts owed to Assured Guaranty underits reinsurance agreements;
• increased competition, including from new entrants into the financial guaranty industry;
• rating agency action on obligors, including sovereign debtors, resulting in a reduction in the value of securities inthe Company’s investment portfolio and in collateral posted by and to the Company;
• the inability of Assured Guaranty to access external sources of capital on acceptable terms;
• changes in the world’s credit markets, segments thereof or general economic conditions;
• the impact of market volatility on the mark-to-market of Assured Guaranty’s contracts written in credit defaultswap form;
• changes in applicable accounting policies or practices;
• changes in applicable laws or regulations, including insurance and tax laws;
• other governmental actions;
• difficulties with the execution of Assured Guaranty’s business strategy;
• contract cancellations;
• loss of key personnel;
• adverse technological developments;
• the effects of mergers, acquisitions and divestitures;
0345r4.indd 5 3/19/14 3:27 PM

• natural or man-made catastrophes;
• other risks and uncertainties that have not been identified at this time;
• management’s response to these factors; and
• other risk factors identified in Assured Guaranty’s filings with the U.S. Securities and Exchange Commission (the“SEC”).
The foregoing review of important factors should not be construed as exhaustive, and should be read in conjunctionwith the other cautionary statements that are included in this Form 10-K. The Company undertakes no obligation to updatepublicly or review any forward looking statement, whether as a result of new information, future developments or otherwise,except as required by law. Investors are advised, however, to consult any further disclosures the Company makes on relatedsubjects in the Company’s reports filed with the SEC.
If one or more of these or other risks or uncertainties materialize, or if the Company’s underlying assumptions prove tobe incorrect, actual results may vary materially from what the Company projected. Any forward looking statements in thisForm 10-K reflect the Company’s current views with respect to future events and are subject to these and other risks,uncertainties and assumptions relating to its operations, results of operations, growth strategy and liquidity.
For these statements, the Company claims the protection of the safe harbor for forward looking statements containedin Section 27A of the Securities Act of 1933, as amended (the “Securities Act”), and Section 21E of the Securities ExchangeAct of 1934, as amended (the “Exchange Act”).
Convention
Unless otherwise noted, ratings on Assured Guaranty's insured portfolio and on bonds purchased pursuant to lossmitigation or risk management strategies are Assured Guaranty’s internal ratings. Internal credit ratings are expressed on arating scale similar to that used by the rating agencies and generally reflect an approach similar to that employed by the ratingagencies, except that Assured Guaranty's internal credit ratings focus on future performance, rather than lifetime performance.
0345r4.indd 6 3/19/14 3:27 PM

ASSURED GUARANTY LTD.
INDEX TO FORM 10-K
PagePART I 7Item 1. Business 7
Overview 7The Company's Financial Guaranty Portfolio 9Credit Policy and Underwriting Procedure 12Risk Management Procedures 13Importance of Financial Strength Ratings 16Investments 18Competition 18Regulation 19Tax Matters 33Description of Share Capital 40Other Provisions of AGL's Bye-Laws 42Employees 42Available Information 43
Item 1A. Risk Factors 44Item 1B. Unresolved Staff Comments 63Item 2. Properties 63Item 3. Legal Proceedings 63Item 4. Mine Safety Disclosures 67PART II 69Item 5. Market for Registrant's Common Equity, Related Stockholder Matters and Issuer Purchases of Equity
Securities 69Item 6. Selected Financial Data 71Item 7. Management’s Discussion and Analysis of Financial Condition and Results of Operations 73
Introduction 73Executive Summary 73Results of Operations 79Non-GAAP Financial Measures 97
Insured Portfolio 101Exposure to Residential Mortgage Backed Securities 113Liquidity and Capital Resources 117
Item 7A. Quantitative and Qualitative Disclosures About Market Risk 131Item 8. Financial Statements and Supplementary Data 136
Report of Independent Registered Public Accounting Firm 137Consolidated Balance Sheets as of December 31, 2013 and December 31, 2012 138
Consolidated Statements of Operations for Years Ended December 31, 2013, 2012 and 2011 139
0345r4.indd 7 3/19/14 3:27 PM
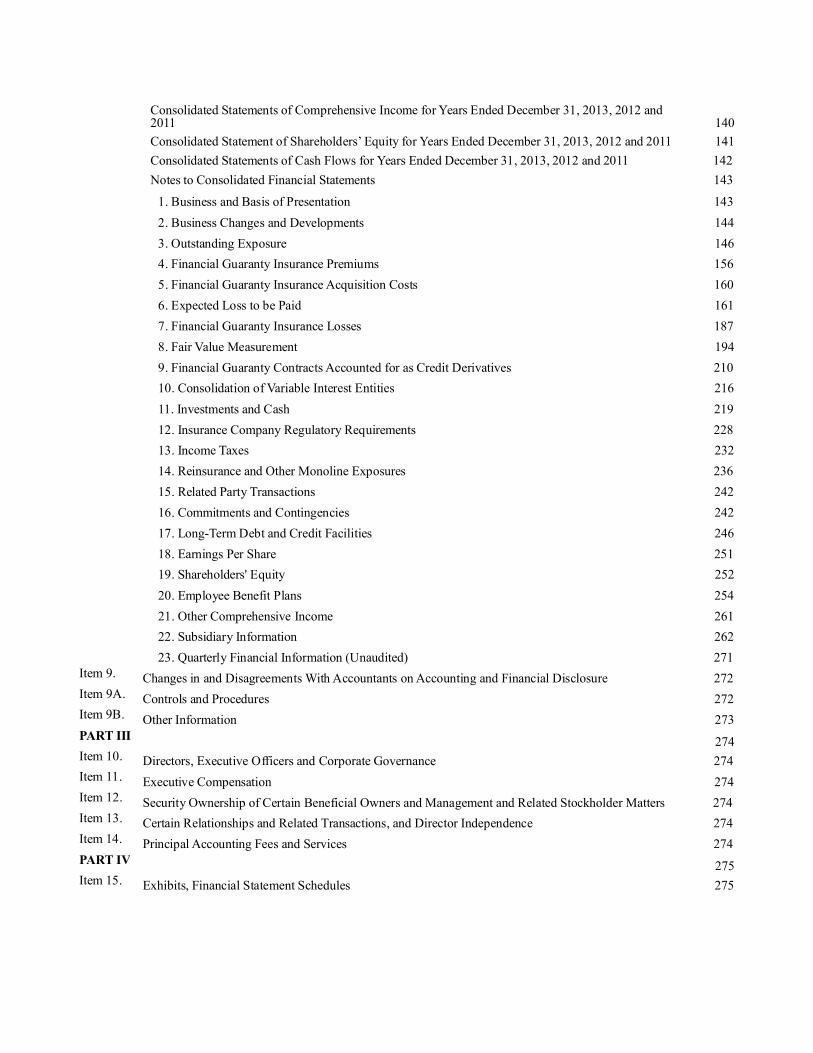
Consolidated Statements of Comprehensive Income for Years Ended December 31, 2013, 2012 and2011 140Consolidated Statement of Shareholders’ Equity for Years Ended December 31, 2013, 2012 and 2011 141Consolidated Statements of Cash Flows for Years Ended December 31, 2013, 2012 and 2011 142Notes to Consolidated Financial Statements 143
1. Business and Basis of Presentation 1432. Business Changes and Developments 1443. Outstanding Exposure 1464. Financial Guaranty Insurance Premiums 1565. Financial Guaranty Insurance Acquisition Costs 1606. Expected Loss to be Paid 1617. Financial Guaranty Insurance Losses 1878. Fair Value Measurement 1949. Financial Guaranty Contracts Accounted for as Credit Derivatives 21010. Consolidation of Variable Interest Entities 21611. Investments and Cash 21912. Insurance Company Regulatory Requirements 22813. Income Taxes 23214. Reinsurance and Other Monoline Exposures 23615. Related Party Transactions 24216. Commitments and Contingencies 24217. Long-Term Debt and Credit Facilities 24618. Earnings Per Share 25119. Shareholders' Equity 25220. Employee Benefit Plans 25421. Other Comprehensive Income 26122. Subsidiary Information 26223. Quarterly Financial Information (Unaudited) 271
Item 9. Changes in and Disagreements With Accountants on Accounting and Financial Disclosure 272Item 9A. Controls and Procedures 272Item 9B. Other Information 273PART III 274Item 10. Directors, Executive Officers and Corporate Governance 274Item 11. Executive Compensation 274Item 12. Security Ownership of Certain Beneficial Owners and Management and Related Stockholder Matters 274Item 13. Certain Relationships and Related Transactions, and Director Independence 274Item 14. Principal Accounting Fees and Services 274PART IV 275Item 15. Exhibits, Financial Statement Schedules 275
0345r4.indd 8 3/19/14 3:27 PM

7
PART I
ITEM 1. BUSINESS
Overview
Assured Guaranty Ltd. (“AGL” and, together with its subsidiaries, “Assured Guaranty” or the “Company”) is aBermuda-based holding company incorporated in 2003 that provides, through its operating subsidiaries, credit protectionproducts to the United States (“U.S.”) and international public finance (including infrastructure) and structured financemarkets. The Company applies its credit underwriting judgment, risk management skills and capital markets experience to offerfinancial guaranty insurance that protects holders of debt instruments and other monetary obligations from defaults inscheduled payments. If an obligor defaults on a scheduled payment due on an obligation, including a scheduled principal orinterest payment (“Debt Service”), the Company is required under its unconditional and irrevocable financial guaranty to paythe amount of the shortfall to the holder of the obligation. Obligations insured by the Company include bonds issued by U.S.state or municipal governmental authorities; notes issued to finance international infrastructure projects; and asset-backedsecurities issued by special purpose entities. The Company markets its financial guaranty insurance directly to issuers andunderwriters of public finance and structured finance securities as well as to investors in such obligations. The Companyguarantees obligations issued principally in the U.S. and the United Kingdom ("U.K"). The Company also guaranteesobligations issued in other countries and regions, including Australia and Western Europe.
The Company conducts its financial guaranty business on a direct basis from the following companies: AssuredGuaranty Municipal Corp. ("AGM"), Assured Guaranty Corp. ("AGC"), Municipal Assurance Corp. ("MAC") and AssuredGuaranty (Europe) Ltd. ("AGE"). It also conducts business through Assured Guaranty Re Ltd. ("AG Re"), a Bermuda-basedreinsurer. The following is a description of AGL's principal operating subsidiaries:
Assured Guaranty Municipal Corp. AGM is located and domiciled in New York, was organized in 1984 andcommenced operations in 1985. Since mid-2008, AGM has provided financial guaranty insurance on debt obligations issued inthe U.S. public finance and global infrastructure markets. Previously, AGM also offered insurance and reinsurance in the globalstructured finance market. AGM formerly was named Financial Security Assurance Inc. It was acquired, together with itsholding company Financial Security Assurance Holdings Ltd. (renamed Assured Guaranty Municipal Holdings Inc., "AGMH")and the subsidiaries owned by that holding company, by Assured Guaranty on July 1, 2009.
Municipal Assurance Corp. MAC is located and domiciled in New York and was organized in 2008. AssuredGuaranty acquired MAC (formerly named Municipal and Infrastructure Assurance Corporation) on May 31, 2012. On July 16,2013, Assured Guaranty completed a series of transactions that increased the capitalization of MAC and resulted in MACassuming a portfolio of geographically diversified U.S. public finance exposure from AGM and AGC. Management believesMAC enhances the Company’s overall competitive position because:
• MAC only has exposure to U.S. public finance risk and no exposure to structured finance risk;• MAC insures only U.S. public finance risk, focusing on investment grade obligations in select sectors of the
municipal market;• MAC had approximately $1.5 billion of claims-paying resources as of December 31, 2013, consisting of $834
million of statutory capital and $671 million of statutory unearned premium reserve; and• MAC has strong financial strength ratings from two rating agencies: AA+ (stable outlook) from Kroll Bond
Rating Agency ("Kroll") and AA- (stable outlook) from Standard & Poor's Rating Services ("S&P").
MAC issued its first financial guaranty insurance policy in August 2013.
Assured Guaranty (Europe) Ltd. AGE is a U.K. incorporated company licensed as a U.K. insurance company andauthorized to operate in various countries throughout the European Economic Area ("EEA"). It was organized in 1990 andissued its first financial guarantee in 1994. AGE issues financial guarantees in both the international public finance andstructured finance markets and is the primary entity from which the Company writes business in the EEA. As discussed furtherunder "Business" below, AGE has agreed with its regulator that new business it writes would be guaranteed using a co-insurance structure pursuant to which AGE would co-insure municipal and infrastructure transactions with AGM, andstructured finance transactions with AGC. AGE must obtain the approval of the Prudential Regulation Authority ("PRA")before it can guarantee any new structured finance transaction.
0345r4.indd 9 3/19/14 3:27 PM

8
Assured Guaranty Corp. AGC is located in New York and domiciled in Maryland, was organized in 1985 andcommenced operations in 1988. It is the only financial guaranty insurer providing insurance on debt obligations in the globalstructured finance market. It also guarantees obligations in the U.S. public finance and international infrastructure markets.
Assured Guaranty Re Ltd. AG Re is incorporated under the laws of Bermuda and is licensed as a Class 3B insurerunder the Insurance Act 1978 and related regulations of Bermuda. AG Re owns, indirectly, Assured Guaranty Re Overseas Ltd.("AGRO"), which is a Bermuda Class 3A and Class C insurer. AG Re and AGRO underwrite financial guaranty reinsurance.They write business as reinsurers of third-party primary insurers and of certain affiliated companies.
Since 2009, the Company has been the most active provider of financial guaranty insurance. The Company's positionin the market benefited from its acquisition of AGMH in 2009, its ability to maintain strong financial strength ratings, its strongclaims-paying resources, and its ability to achieve recoveries in respect of the claims that it has paid on insured residentialmortgage-backed securities. However, since 2009, the Company has continued to face challenges in maintaining its marketpenetration. The challenges in 2013 were primarily due to:
• Sustained low interest rate environment in the U.S. Within the last five years, interest rates in the U.S. had beenat low levels by historical standards. Although such interest rates did rise slightly in 2013 from record lows in2012, they are expected to remain low for the near future. As a result, the difference in yield (or the credit spread)between a bond insured by Assured Guaranty and an uninsured bond has provided comparatively little room forissuer savings and insurance premium, and Assured Guaranty has seen a lower demand for its financial guarantyinsurance from issuers than it had prior to 2008.
• Continued low volume of issuance in the U.S. public finance market. According to industry compilations, U.S.municipalities issued only $311.9 billion of bonds in 2013, 15% less than in 2012. With the exception of 2011,the 2013 volume of issuance in the U.S. public finance market was the lowest since 2001. The decline wascaused in part by fewer refunding transactions — approximately $132 billion in 2013, compared withapproximately $189 billion in 2012. In 2014, the Company expects the volume of issuance to continue to be low,in light of austerity measures municipalities have been implementing in order to address budget shortfalls,including those resulting from increased pension and healthcare costs.
• Increased competition. The Company estimates, based on third party industry compilations, that of the insuredU.S. public finance bonds issued in the primary market in 2013, the Company insured approximately 62.3% of thepar, while Build America Mutual Assurance Company ("BAM"), a newly formed insurance company thatcommenced operations in 2012, insured 36.8% of the par. The continued presence in the market of BAM, as wellas any other new entrants, may affect the Company's insured volume as well as the amount of premium theCompany is able to charge.
• Continued uncertainty over the Company's financial strength ratings. When Assured Guaranty issues afinancial guaranty on a debt obligation, the rating agencies generally raise the debt or short-term credit ratings ofthe obligation to the same rating as the financial strength rating of the Assured Guaranty subsidiary that hasguaranteed that obligation. Accordingly, investors in products insured by AGM, AGC, MAC or AGE frequentlyrely on rating agency ratings, and a failure of the insurer to maintain strong financial strength ratings oruncertainty over such ratings would have a negative impact on the demand for its insurance product. TheCompany's financial strength ratings have been subject to substantial uncertainty in recent years due to changes inrating agency methodologies for rating financial guaranty insurance companies, periodic rating agency reviewsfor possible downgrade and actual downgrades. For example, in March 2012, Moody's Investors Service, Inc.("Moody's") placed the ratings of AGL and its subsidiaries, including the financial strength ratings of AGL'sinsurance subsidiaries, on review for possible downgrade. Moody's did not complete its review until January2013, when it downgraded the financial strength ratings of AGM and AGC from Aa3 to A2 and A3, respectively,and that of AG Re from A1 to Baa1. In February 2014, Moody's affirmed the financial strength ratings andoutlooks of AGM and AGC, and affirmed AG Re's financial strength rating but changed AG Re's outlook tonegative, citing its vulnerability to adverse developments within its insured portfolio. The uncertainty over theCompany's financial strength ratings over time has had a negative effect on the demand for the Company'sfinancial guaranties. If the financial strength rating of one or more of the Company's insurance subsidiaries werereduced below current levels, the Company expects that would reduce the number of transactions that wouldbenefit from the Company's insurance and consequently harm the Company's new business opportunities.
In addition, the Company's business continues to be affected by negative perceptions of the value of the financialguaranty insurance sold by other companies that had been active in the industry. The losses suffered by such other insurers
0345r4.indd 10 3/19/14 3:27 PM

9
resulted in those companies being downgraded to below investment grade levels by the rating agencies and/or subject tointervention by their state insurance regulators. In a number of cases, the state insurance regulators prevented the distressedfinancial guaranty insurers from paying claims or paying such claims in full; in addition, such financial guaranty insurers wereperceived by market participants not to be actively conducting surveillance on transactions or fully exercising rights andremedies to mitigate losses.
The Company believes that issuers and investors in securities will continue to purchase financial guaranty insurance,especially if interest rates rise and credit spreads widen. U.S. municipalities have budgetary requirements that are best metthrough financings in the fixed income capital markets. In particular, smaller municipal issuers frequently use financialguaranties in order to access the capital markets with new debt offerings at a lower all-in interest rate than on an unguaranteedbasis. In addition, the Company expects long-term debt financings for infrastructure projects will grow throughout the world, aswill the financing needs associated with privatization initiatives or refinancing of infrastructure projects in developed countries.
The Company's Financial Guaranty Portfolio
The Company primarily conducts its business through subsidiaries located in the U.S., Europe and Bermuda. TheCompany generally insures obligations issued in the U.S., although it has also guaranteed securities issued in Europe, Australiaand other international markets.
Financial guaranty insurance generally provides an unconditional and irrevocable guaranty that protects the holder of adebt instrument or other monetary obligation against non-payment of scheduled principal and interest payments when due.Upon an obligor's default on scheduled principal or interest payments due on the debt obligation, the Company is generallyrequired under the financial guaranty contract to pay the investor the principal or interest shortfall then due.
Financial guaranty insurance may be issued to all of the investors of the guaranteed series or tranche of a municipalbond or structured finance security at the time of issuance of those obligations or it may be issued in the secondary market toonly specific individual holders of such obligations who purchase the Company's credit protection.
Both issuers of and investors in financial instruments may benefit from financial guaranty insurance. Issuers benefitwhen they purchase financial guaranty insurance for their new issue debt transaction because the insurance may have the effectof lowering an issuer's interest cost over the life of the debt transaction to the extent that the insurance premium charged by theCompany is less than the net present value of the difference between the yield on the obligation insured by Assured Guaranty(which carries the credit rating of the specific subsidiary that guarantees the debt obligation) and the yield on the debtobligation if sold on the basis of its uninsured credit rating. The principal benefit to investors is that the Company's guarantyprovides certainty that scheduled payments will be received when due. The guaranty may also improve the marketability ofobligations issued by infrequent or unknown issuers, as well as obligations with complex structures or backed by asset classesnew to the market. This benefit to market liquidity, which we call a "liquidity benefit," results from the increase in secondarymarket trading values for Assured Guaranty-insured obligations as compared with uninsured obligations by the same issuer. Ingeneral, the liquidity benefit of financial guaranties is that investors are able to sell insured bonds more quickly and, dependingon the financial strength rating of the insurer, at a higher secondary market price than for uninsured debt obligations.
As an alternative to traditional financial guaranty insurance, the Company also has provided credit protection relatingto a particular security or obligor through a credit derivative contract, such as a credit default swap ("CDS"). Under the terms ofa CDS, the seller of credit protection agrees to make a specified payment to the buyer of credit protection if one or morespecified credit events occurs with respect to a reference obligation or entity. In general, the credit events specified in theCompany's CDS are for interest and principal defaults on the reference obligation. One difference between CDS and traditionalprimary financial guaranty insurance is that credit default protection is typically provided to a particular buyer of creditprotection, who is not always required to own the reference obligation, rather than to all investors in the reference obligation.As a result, the Company's rights and remedies under a CDS may be different and more limited than on a financial guaranty ofan entire issuance. Credit derivatives may be preferred by some investors, however, because they generally offer the investorease of execution and standardized terms as well as more favorable accounting or capital treatment. The Company has notprovided credit protection through a CDS since March 2009, other than in connection with loss mitigation and otherremediation efforts relating to its existing book of business.
The Company also offers credit protection through reinsurance, and in the past has provided reinsurance to otherfinancial guaranty insurers with respect to their guaranty of public finance, infrastructure and structured finance obligations.The Company believes that the opportunities currently available to it in the reinsurance market consist primarily of potentiallyassuming portfolios of transactions from inactive primary insurers and recapturing portfolios that it has previously ceded tothird party reinsurers.
0345r4.indd 11 3/19/14 3:27 PM

10
The Company's financial guaranty direct and assumed businesses provide credit enhancement, on public finance,infrastructure and structured finance obligations. For information on the geographic breakdown of the Company's financialguaranty portfolio and on its income and revenue by jurisdiction, see "Geographic Distribution of Net Par Outstanding" in Note3, Outstanding Exposure, and "Provision for Income Taxes" in Note 13, Income Taxes, of the Financial Statements andSupplementary Data.
U.S. Public Finance Obligations The Company insures and reinsures a number of different types of U.S. publicfinance obligations, including the following:
General Obligation Bonds are full faith and credit bonds that are issued by states, their political subdivisions andother municipal issuers, and are supported by the general obligation of the issuer to pay from available funds and by apledge of the issuer to levy ad valorem taxes in an amount sufficient to provide for the full payment of the bonds.
Tax-Backed Bonds are obligations that are supported by the issuer from specific and discrete sources of taxation.They include tax-backed revenue bonds, general fund obligations and lease revenue bonds. Tax-backed obligationsmay be secured by a lien on specific pledged tax revenues, such as a gasoline or excise tax, or incrementally fromgrowth in property tax revenue associated with growth in property values. These obligations also include obligationssecured by special assessments levied against property owners and often benefit from issuer covenants to enforcecollections of such assessments and to foreclose on delinquent properties. Lease revenue bonds typically are generalfund obligations of a municipality or other governmental authority that are subject to annual appropriation orabatement; projects financed and subject to such lease payments ordinarily include real estate or equipment serving anessential public purpose. Bonds in this category also include moral obligations of municipalities or governmentalauthorities.
Municipal Utility Bonds are obligations of all forms of municipal utilities, including electric, water and sewerutilities and resource recovery revenue bonds. These utilities may be organized in various forms, including municipalenterprise systems, authorities or joint action agencies.
Transportation Bonds include a wide variety of revenue-supported bonds, such as bonds for airports, ports,tunnels, municipal parking facilities, toll roads and toll bridges.
Healthcare Bonds are obligations of healthcare facilities, including community based hospitals and systems, aswell as of health maintenance organizations and long-term care facilities.
Higher Education Bonds are obligations secured by revenue collected by either public or private secondaryschools, colleges and universities. Such revenue can encompass all of an institution's revenue, including tuition andfees, or in other cases, can be specifically restricted to certain auxiliary sources of revenue.
Housing Revenue Bonds are obligations relating to both single and multi-family housing, issued by states andlocalities, supported by cash flow and, in some cases, insurance from entities such as the Federal HousingAdministration.
Infrastructure Bonds include obligations issued by a variety of entities engaged in the financing of infrastructureprojects, such as roads, airports, ports, social infrastructure and other physical assets delivering essential servicessupported by long-term concession arrangements with a public sector entity.
Investor-Owned Utility Bonds are obligations primarily backed by investor-owned utilities, first mortgage bondobligations of for-profit electric or water utilities providing retail, industrial and commercial service, and also includesale-leaseback obligation bonds supported by such entities.
Other Public Finance Bonds include other debt issued, guaranteed or otherwise supported by U.S. national orlocal governmental authorities, as well as student loans, revenue bonds, and obligations of some not-for-profitorganizations.
A portion of the Company's exposure to tax-backed bonds, municipal utility bonds and transportation bonds constitute"special revenue" bonds under the U.S. Bankruptcy Code. Even if an obligor under a special revenue bond were to seekprotection from creditors under Chapter 9 of the U.S. Bankruptcy Code, holders of the special revenue bond should continue toreceive timely payments of principal and interest during the bankruptcy proceeding, subject to the special revenues being
0345r4.indd 12 3/19/14 3:27 PM

11
sufficient to pay debt service and the lien on the special revenues being subordinate to the necessary operating expenses of theproject or system from which the revenues are derived. While "special revenues" acquired by the obligor after bankruptcyremain subject to the pre-petition pledge, special revenue bonds may be adjusted if their claim is determined to be"undersecured."
Non-U.S. Public Finance Obligations The Company insures and reinsures a number of different types of non-U.S.public finance obligations, which consist of both infrastructure projects and other projects essential for municipal function suchas regulated utilities. Credit support for the exposures written by the Company may come from a variety of sources, includingsome combination of subordinated tranches, excess spread, over-collateralization or cash reserves. Additional support also maybe provided by transaction provisions intended to benefit noteholders or credit enhancers. The types of non-U.S. public financesecurities the Company insures and reinsures include the following:
Infrastructure Finance Obligations are obligations issued by a variety of entities engaged in the financing ofinternational infrastructure projects, such as roads, airports, ports, social infrastructure, and other physical assetsdelivering essential services supported either by long-term concession arrangements with a public sector entity or aregulatory regime. The majority of the Company's international infrastructure business is conducted in the U.K.
Regulated Utilities Obligations are issued by government-regulated providers of essential services andcommodities, including electric, water and gas utilities. The majority of the Company's international regulated utilitybusiness is conducted in the U.K.
Pooled Infrastructure Obligations are synthetic asset-backed obligations that take the form of CDS obligations orcredit-linked notes that reference either infrastructure finance obligations or a pool of such obligations, with a defineddeductible to cover credit risks associated with the referenced obligations.
Other Public Finance Obligations include obligations of local, municipal, regional or national governmentalauthorities or agencies.
U.S. and Non-U.S. Structured Finance Obligations The Company insures and reinsures a number of different typesof U.S. and non-U.S. structured finance obligations. Credit support for the exposures written by the Company may come from avariety of sources, including some combination of subordinated tranches, excess spread, over-collateralization or cash reserves.Additional support also may be provided by transaction provisions intended to benefit noteholders or credit enhancers. Thetypes of U.S. and Non-U.S. Structured Finance obligations the Company insures and reinsures include the following:
Pooled Corporate Obligations are securities primarily backed by various types of corporate debt obligations, suchas secured or unsecured bonds, bank loans or loan participations and trust preferred securities ("TruPS"). Thesesecurities are often issued in "tranches," with subordinated tranches providing credit support to the more seniortranches. The Company's financial guaranty exposures generally are to the more senior tranches of these issues.
Residential Mortgage-Backed Securities ("RMBS") are obligations backed by closed-end and open-end first andsecond lien mortgage loans on one-to-four family residential properties, including condominiums and cooperativeapartments. First lien mortgage loan products in these transactions include fixed rate, adjustable rate and optionadjustable-rate mortgages. The credit quality of borrowers covers a broad range, including "prime", "subprime" and"Alt-A". A prime borrower is generally defined as one with strong risk characteristics as measured by factors such aspayment history, credit score, and debt-to-income ratio. A subprime borrower is a borrower with higher riskcharacteristics, usually as determined by credit score and/or credit history. An Alt-A borrower is generally defined as aprime quality borrower that lacks certain ancillary characteristics, such as fully documented income. The Companyhas not insured a RMBS transaction since January 2008.
Financial Products is the way in which the Company refers to the guaranteed investment contracts ("GICs")portion of a line of business previously conducted by AGMH that the Company did not acquire when it purchasedAGMH in 2009 from Dexia SA. That line of business, which the Company refers to as the former "Financial ProductsBusiness" of AGMH, was comprised of its guaranteed investment contracts business, its medium term notes businessand the equity payment agreements associated with AGMH's leveraged lease business. When AGMH was stillconducting Financial Products Business, AGM issued financial guaranty insurance policies on GICs and in respect ofthe GIC business; those policies cannot be revoked or canceled. Assured Guaranty is indemnified by Dexia SA andcertain of its affiliates ("Dexia") against loss from the former Financial Products Business. The Financial ProductsBusiness is currently being run off by Dexia.
0345r4.indd 13 3/19/14 3:27 PM

12
Consumer Receivables Securities are obligations backed by non-mortgage consumer receivables, such as studentloans, automobile loans and leases, manufactured home loans and other consumer receivables.
Commercial Mortgage-Backed Securities ("CMBS") are obligations backed by pools of commercial mortgages onoffice, multi-family, retail, hotel, industrial and other specialized or mixed-use properties.
Commercial Receivables Securities are obligations backed by equipment loans or leases, aircraft and aircraftengine financings, business loans and trade receivables. Credit support is derived from the cash flows generated by theunderlying obligations, as well as property or equipment values as applicable.
Insurance Securitization Obligations are obligations secured by the future earnings from pools of various types ofinsurance/reinsurance policies and income produced by invested assets.
Other Structured Finance Obligations are obligations backed by assets not generally described in any of the otherdescribed categories. One such type of asset is a tax benefit to be realized by an investor in one of the Federal or stateprograms that permit such investor to receive a credit against taxes (such as Federal corporate income tax or stateinsurance premium tax) for making qualified investments in specified enterprises, typically located in designated low-income areas.
Credit Policy and Underwriting Procedure
Credit Policy
The Company establishes exposure limits and underwriting criteria for sectors, countries, single risks and, in the caseof structured finance obligations, servicers. Single risk limits are established in relation to the Company's capital base and arebased on the Company's assessment of potential frequency and severity of loss as well as other factors, such as historical andstressed collateral performance. Sector limits are based on the Company's assessment of intra-sector correlation, as well asother factors. Country limits are based on long term foreign currency ratings, history of political stability, size and stability ofthe economy and other factors.
Critical risk factors that the Company would analyze for proposed public finance exposures include, for example, thecredit quality of the issuer, the type of issue, the repayment source, the security pledged, the presence of restrictive covenantsand the issue's maturity date. The Company also focuses on the ability of obligors to file for bankruptcy or receivership underapplicable statutes (and on related statutes that provide for state oversight or fiscal control over financially troubled obligors);the amount of liquidity available to the obligors for debt payment, including the obligors' exposure to derivative contracts andto debt subject to acceleration; and the ability of the obligors to increase revenue. In addition, the Company recently hasemphasized an obligor's pension and other post-employment benefits funding policies and practices, the potential impact of theAffordable Care Act, and the risk of a rating agency downgrade of an obligation's underlying uninsured rating. Underwritingconsiderations also include (1) the classification of the transaction, reflecting economic and social factors affecting that bondtype, including the importance of the proposed project to the community, (2) the financial management of the project and of theissuer, (3) the potential refinancing risk, and (4) various legal and administrative factors. In cases where the primary source ofrepayment is the taxing or rate setting authority of a public entity, such as general obligation bonds, transportation bonds andmunicipal utility bonds, emphasis is placed on the overall financial strength of the issuer, the economic and demographiccharacteristics of the taxpayer or ratepayer and the strength of the legal obligation to repay the debt. In cases of not-for-profitinstitutions, such as healthcare issuers and private higher education issuers, emphasis is placed on the financial stability of theinstitution, its competitive position and its management experience.
0345r4.indd 14 3/19/14 3:27 PM

13
Structured finance obligations generally present three distinct forms of risk: (1) asset risk, pertaining to the amountand quality of assets underlying an issue; (2) structural risk, pertaining to the extent to which an issue's legal structure providesprotection from loss; and (3) execution risk, which is the risk that poor performance by a servicer contributes to a decline in thecash flow available to the transaction. Each risk is addressed in turn through the Company's underwriting process. Generally,the amount and quality of asset coverage required with respect to a structured finance exposure is dependent upon the historicperformance of the subject asset class, or those assets actually underlying the risk proposed to be insured or assumed throughreinsurance. Future performance expectations are developed from this history, taking into account economic, social andpolitical factors affecting that asset class as well as, to the extent feasible, the subject assets themselves. Conclusions are thendrawn about the amount of over-collateralization or other credit enhancement necessary in a particular transaction in order toprotect investors (and therefore the insurer or reinsurer) against poor asset performance. In addition, structured securitiesusually are designed to protect investors (and therefore the guarantor) from the bankruptcy or insolvency of the entity whichoriginated the underlying assets, as well as the bankruptcy or insolvency of the servicer of those assets. The Company conductsextensive due diligence on the assets in its insured transactions.
For international transactions, an analysis of the country or countries in which the risk resides is performed. Suchanalysis includes an assessment of the political risk as well as the economic and demographic characteristics of the country orcountries. For each transaction, the Company performs an assessment of the legal jurisdiction governing the transaction and thelaws affecting the underlying assets supporting the obligations.
Underwriting Procedure
Each transaction underwritten by the Company involves persons with different expertise across various departmentswithin the Company. The Company's transaction underwriting teams include both underwriting and legal personnel, whoanalyze the structure of a potential transaction and the credit and legal issues pertinent to the particular line of business or assetclass, and accounting and finance personnel, who review the more complex transactions for compliance with applicableaccounting standards and investment guidelines.
In the public finance portion of the Company's financial guaranty direct business, underwriters generally analyze theissuer's historical financial statements and, where warranted, develop stress case projections to test the issuers' ability to maketimely debt service payments under stressful economic conditions. In the structured and infrastructure finance portions of theCompany's financial guaranty direct business, underwriters generally use computer-based financial models in order to evaluatethe ability of the transaction to generate adequate cash flow to service the debt under a variety of scenarios. The models includeeconomically stressed scenarios that the underwriters use for their assessment of the potential credit risk inherent in a particulartransaction. Stress models developed internally by the Company's underwriters and reflect both empirical research as well asinformation gathered from third parties, such as rating agencies or investment banks. The Company may also engage advisorssuch as consultants and external counsel to assist in analyzing a transaction's financial or legal risks. The Company may alsoconduct a due diligence review that includes, among other things, a site visit to the project or facility, meetings with issuermanagement, review of underwriting and operational procedures, file reviews, and review of financial procedures andcomputer systems.
Upon completion of the underwriting analysis, the underwriter prepares a formal credit report that is submitted to acredit committee for review. An oral presentation is usually made to the committee, followed by questions from committeemembers and discussion among the committee members and the underwriters. In some cases, additional information may bepresented at the meeting or required to be submitted prior to approval. Each credit committee decision is documented and anyfurther requirements, such as specific terms or evidence of due diligence, are noted. The Company currently has four creditcommittees composed of senior officers of the Company. The committees are organized by asset class, such as for publicfinance or structured finance, or along regulatory lines, to assess the various potential exposures.
Risk Management Procedures
Organizational Structure
The Company's policies and procedures relating to risk assessment and risk management are overseen by its Board ofDirectors. The Board takes an enterprise-wide approach to risk management that is designed to support the Company's businessplans at a reasonable level of risk. A fundamental part of risk assessment and risk management is not only understanding therisks a company faces and what steps management is taking to manage those risks, but also understanding what level of risk isappropriate for the Company. The Board of Directors annually approves the Company's business plan, factoring riskmanagement into account. It also approves the Company's risk appetite statement, which articulates the Company's tolerancefor risk and describes the general types of risk that the Company accepts or attempts to avoid. The involvement of the Board in
0345r4.indd 15 3/19/14 3:27 PM

14
setting the Company's business strategy is a key part of its assessment of management's risk tolerance and also a determinationof what constitutes an appropriate level of risk for the Company.
While the Board of Directors has the ultimate oversight responsibility for the risk management process, variouscommittees of the Board also have responsibility for risk assessment and risk management. The Risk Oversight Committee ofthe Board of Directors oversees the standards, controls, limits, underwriting guidelines and policies that the Companyestablishes and implements in respect of credit underwriting and risk management. It focuses on management's assessment andmanagement of both (i) credit risks and (ii) other risks, including, but not limited to, financial, legal and operational risks, andrisks relating to the Company's reputation and ethical standards. In addition, the Audit Committee of the Board of Directors isresponsible for, among other matters, reviewing policies and processes related to the evaluation of risk assessment and riskmanagement, including the Company's major financial risk exposures and the steps management has taken to monitor andcontrol such exposures. It also reviews compliance with legal and regulatory requirements. The Compensation Committee ofthe Board of Directors reviews compensation-related risks to the Company. The Finance Committee of the Board of Directorsoversees the investment of the Company's investment portfolio and the Company's capital structure, financing arrangementsand any corporate development activities in support of the Company's financial plan. The Nominating and GovernanceCommittee of the Board of Directors oversees risk at the Company by developing appropriate corporate governance guidelinesand identifying qualified individuals to become board members.
The Company has established a number of management committees to develop underwriting and risk managementguidelines, policies and procedures for the Company's insurance and reinsurance subsidiaries that are tailored to their respectivebusinesses, providing multiple levels of credit review and analysis.
• Portfolio Risk Management Committee—This committee establishes company-wide credit policy for theCompany's direct and assumed business. It implements specific underwriting procedures and limits for theCompany and allocates underwriting capacity among the Company's subsidiaries. The Portfolio RiskManagement Committee focuses on measuring and managing credit, market and liquidity risk for the overallcompany. All transactions in new asset classes or new jurisdictions must be approved by this committee.
• U.S. Management Committee—This committee establishes strategic policy and reviews the implementation ofstrategic initiatives and general business progress in the U.S. The U.S. Management Committee approves riskpolicy at the U.S. operating company level.
• Risk Management Committees—The U.S., U.K. and AG Re risk management committees conduct an in-depthreview of the insured portfolios of the relevant subsidiaries, focusing on varying portions of the portfolio at eachmeeting. They assign internal ratings of the insured transactions and review sector reports, monthly product linesurveillance reports and compliance reports.
• Workout Committee—This committee receives reports from Surveillance and Workout personnel on transactionsthat might benefit from active loss mitigation and develops and approves loss mitigation strategies for suchtransactions.
• Reserve Committees—Oversight of reserving risk is vested in the U.S. Reserve Committee, the AG Re ReserveCommittee and the U.K. Reserve Committee. The committees review the reserve methodology and assumptionsfor each major asset class or significant below-investment grade ("BIG") transaction, as well as the loss projectionscenarios used and the probability weights assigned to those scenarios. The reserve committees establish reservesfor the relevant subsidiaries, taking into consideration supporting information provided by Surveillance personnel.
The Company's surveillance personnel are responsible for monitoring and reporting on all transactions in the insuredportfolio, including exposures in both the financial guaranty direct and assumed businesses. The primary objective of thesurveillance process is to monitor trends and changes in transaction credit quality, detect any deterioration in credit quality, andrecommend remedial actions to management. All transactions in the insured portfolio are assigned internal credit ratings, andsurveillance personnel recommend adjustments to those ratings to reflect changes in transaction credit quality.
The Company's workout personnel are responsible for managing workout and loss mitigation situations. They worktogether with the Company's surveillance personnel to develop and implement strategies on transactions that are experiencingloss or could possibly experience loss. They develop strategies designed to enhance the ability of the Company to enforce itscontractual rights and remedies and mitigate potential losses. The Company's workout personnel also engage in negotiationdiscussions with transaction participants and, when necessary, manage (along with legal personnel) the Company's litigation
0345r4.indd 16 3/19/14 3:27 PM

15
proceedings. They may also make open market purchases of securities that the Company has insured. The Company's workoutpersonnel work with servicers of residential mortgage-backed securities transactions to enhance their performance.
Direct Business
The Company monitors the performance of each risk in its portfolio and tracks aggregation of risk. The review cycleand scope vary based upon transaction type and credit quality. In general, the review process includes the collection andanalysis of information from various sources, including trustee and servicer reports, financial statements, general industry orsector news and analyses, and rating agency reports. For public finance risks, the surveillance process includes monitoringgeneral economic trends, developments with respect to state and municipal finances, and the financial situation of the issuers.For structured finance transactions, the surveillance process can include monitoring transaction performance data and cashflows, compliance with transaction terms and conditions, and evaluation of servicer or collateral manager performance andfinancial condition. Additionally, the Company uses various quantitative tools and models to assess transaction performanceand identify situations where there may have been a change in credit quality. For all transactions, surveillance activities mayinclude discussions with or site visits to issuers, servicers or other parties to a transaction.
Assumed Business
For transactions that the Company has assumed, the ceding insurers are responsible for conducting ongoingsurveillance of the exposures that have been ceded to the Company. The Company's surveillance personnel monitor the cedinginsurer's surveillance activities on exposures ceded to the Company through a variety of means, including reviews ofsurveillance reports provided by the ceding insurers, and meetings and discussions with their analysts. The Company'ssurveillance personnel also monitor general news and information, industry trends and rating agency reports to help focussurveillance activities on sectors or credits of particular concern. For certain exposures, the Company also will undertake anindependent analysis and remodeling of the exposure. In the event of credit deterioration of a particular exposure, morefrequent reviews of the ceding company's risk mitigation activities are conducted. The Company's surveillance personnel alsotake steps to ensure that the ceding insurer is managing the risk pursuant to the terms of the applicable reinsurance agreement.To this end, the Company conducts periodic reviews of ceding companies' surveillance activities and capabilities. That processmay include the review of the insurer's underwriting, surveillance and claim files for certain transactions.
Ceded Business
As part of its risk management strategy, the Company has sought in the past to obtain third party reinsurance orretrocessions and may also periodically enter into other arrangements to reduce its exposure to risk concentrations, such as forsingle risk limits, portfolio credit rating or exposure limits, geographic limits or other factors. At December 31, 2013, theCompany had ceded approximately 6% of its principal amount outstanding to third party reinsurers.
The Company has obtained reinsurance to increase its underwriting capacity, both on an aggregate-risk and a single-risk basis, to meet internal, rating agency and regulatory risk limits, diversify risks, reduce the need for additional capital, andstrengthen financial ratios. The Company receives capital credit for ceded reinsurance based on the reinsurer's ratings in thecapital models used by the rating agencies to evaluate the Company's capital position for its financial strength ratings. Inaddition, a number of the Company's reinsurers are required to pledge collateral to secure their reinsurance obligations to theCompany. In some cases, the pledged collateral augments the rating agency credit for the reinsurance provided. In recent years,most of the Company's reinsurers have been downgraded by one or more rating agency, and consequently, the financial strengthratings of many of the reinsurers are below those of the Company's insurance subsidiaries. While ceding commissions orpremium allocation adjustments may compensate in part for such downgrades, the effect of such downgrades, in general, is todecrease the financial benefits of using reinsurance under rating agency capital adequacy models. However, to the extent areinsurer still has the financial wherewithal to pay, the Company could still benefit from the reinsurance provided.
The Company's ceded reinsurance may be on a quota share, first-loss or excess-of-loss basis. Quota share reinsurancegenerally provides protection against a fixed specified percentage of all losses incurred by the Company. First-loss reinsurancegenerally provides protection against a fixed specified percentage of losses incurred up to a specified limit. Excess-of-lossreinsurance generally provides protection against a fixed percentage of losses incurred to the extent that losses incurred exceeda specified limit. Reinsurance arrangements typically require the Company to retain a minimum portion of the risks reinsured.
In past, the Company had both facultative (transaction-by-transaction) and treaty ceded reinsurance contracts withthird party reinsurers, generally arranged on an annual basis for new business. The Company also employed "automaticfacultative" reinsurance that permitted the Company to apply reinsurance with third party reinsurance to transactions it selectedsubject to certain limitations. The remainder of the Company's treaty reinsurance provided coverage for a portion, subject in
0345r4.indd 17 3/19/14 3:27 PM

16
certain cases to adjustment at the Company's election, of the exposure from all qualifying policies issued during the term of thetreaty. The reinsurer's participation in a treaty was either cancellable annually upon 90 days' prior notice by either the Companyor the reinsurer, or had a one-year term. Treaties generally provide coverage for the full term of the policies reinsured duringthe annual treaty period, except that, upon a financial deterioration of the reinsurer or the occurrence of certain other events, theCompany generally has the right to reassume all or a portion of the business reinsured. Reinsurance agreements may be subjectto other termination conditions as required by applicable state law.
The Company's treaty and automatic facultative program covering new business with third party reinsurers ended in2008, but such reinsurance continues to cover ceded business until the expiration of exposure, except that the Company hasentered into commutation agreements reassuming portions of the ceded business from certain reinsurers. The Companycontinues to reinsure occasionally new business on a facultative basis.
AGC, AGM and MAC have entered into an aggregate excess of loss reinsurance facility with a number of reinsurers,effective as of January 1, 2014. The facility covers losses occurring either from January 1, 2014 through December 31, 2021, orJanuary 1, 2015 through December 31, 2022, at the option of AGC, AGM and MAC. It terminates on January 1, 2016, unlessAGC, AGM and MAC choose to extend it. The facility covers certain U.S. public finance credits insured or reinsured by AGC,AGM and MAC as of September 30, 2013, excluding credits that were rated non-investment grade as of December 31, 2013 byMoody’s or S&P or internally by AGC, AGM or MAC and is subject to certain per credit limits. Among the credits excludedare those associated with the Commonwealth of Puerto Rico and its related authorities and public corporations. The facilityattaches when AGC’s, AGM’s and MAC’s net losses (net of AGC’s and AGM's reinsurance (including from affiliates) and netof recoveries) exceed $1.5 billion in the aggregate. The facility covers a portion of the next $500 million of losses, with thereinsurers assuming pro rata in the aggregate $450 million of the $500 million of losses and AGC, AGM and MAC jointlyretaining the remaining $50 million of losses. The reinsurers are required to be rated at least AA- or to post collateral sufficientto provide AGM, AGC and MAC with the same reinsurance credit as reinsurers rated AA-. AGM, AGC and MAC are obligatedto pay the reinsurers their share of recoveries relating to losses during the coverage period in the covered portfolio. AGC, AGMand MAC have paid approximately $19 million of premiums during 2014 for the term January 1, 2014 through December 31,2014 and deposited approximately $19 million of securities into trust accounts for the benefit of the reinsurers to be used to paythe premium for January 1, 2015 through December 31, 2015. This facility replaces the $435 million aggregate excess of lossreinsurance facility that AGC and AGM had entered into on January 22, 2012.
Importance of Financial Strength Ratings
Low financial strength ratings or uncertainty over the Company's ability to maintain its financial strength ratingswould have a negative impact on issuers' and investors' perceptions of the value of the Company's insurance product.Therefore, the Company manages its business with the goal of achieving high financial strength ratings, preferably the highestthat an agency will assign. However, the models used by rating agencies differ, presenting conflicting goals that may make itinefficient or impractical to reach the highest rating level. In addition, the models are not fully transparent, contain subjectivefactors and change frequently.
Historically, insurance financial strength ratings reflect an insurer's ability to pay under its insurance policies andcontracts in accordance with their terms. The rating is not specific to any particular policy or contract. Insurance financialstrength ratings do not refer to an insurer's ability to meet non-insurance obligations and are not a recommendation to purchaseany policy or contract issued by an insurer or to buy, hold, or sell any security insured by an insurer. The insurance financialstrength ratings assigned by the rating agencies are based upon factors relevant to policyholders and are not directed toward theprotection of investors in AGL's common shares. Ratings reflect only the views of the respective rating agencies and are subjectto continuous review and revision or withdrawal at any time.
Following the financial crisis, the rating process has become increasingly challenging for the Company due to anumber of factors, including:
• Instability of Rating Criteria and Methodologies. Rating agencies purport to issue ratings pursuant to publishedrating criteria and methodologies. In recent years, the rating agencies have made material changes to their ratingcriteria and methodologies applicable to financial guaranty insurers, sometimes through formal changes and othertimes through ad hoc adjustments to the conclusions reached by existing criteria. Furthermore, these criteria andmethodology changes are typically implemented without any transition period, making it difficult for an insurer tocomply quickly with new standards.
0345r4.indd 18 3/19/14 3:27 PM

17
• Increasingly Severe Stress Case Loss Assumptions. A major component in arriving at a financial guaranty insurer'srating has been the rating agency’s assessment of the insurer’s capital adequacy, with each rating agency employing itsown proprietary model. These capital adequacy models include “stress case” loss assumptions for various risks or riskcategories. In reaction to the financial crisis, the rating agencies materially increased stress case loss assumptionsacross numerous risk categories. However, the stress case loss assumptions applied to financial guaranty insurers donot always appear consistent with, and can appear to be materially more severe than, the assumptions the ratingagencies use when rating securities in those risk categories.
• More Reliance on Qualitative Rating Criteria. In prior years, the financial strength ratings of the Company’sinsurance company subsidiaries were largely consistent with the rating agency’s assessment of the insurers’ capitaladequacy, such that a rating downgrade could generally be avoided by raising additional capital or otherwiseimproving capital adequacy under the rating agency’s model. In recent years, however, both S&P and Moody’s haveapplied other factors, some of which are subjective, such as the insurer's business strategy and franchise value or theanticipated future demand for its product, to justify ratings for the Company’s insurance company subsidiariessignificantly below the ratings implied by their own capital adequacy models. Currently, for example, S&P hasconcluded that AGM has “AAA” capital adequacy under the S&P model (but subject to a downward adjustment due toa “large obligor test” and Moody’s has concluded that AGM has “Aa” capital adequacy under the Moody’s model(offset by other factors including the rating agency’s assessment of competitive profile, future profitability and marketshare).
Despite the difficult rating agency process following the financial crisis, the Company has been able to maintainstrong financial strength ratings. However, if a substantial downgrade of the financial strength ratings of the Company'sinsurance subsidiaries were to occur in the future, such downgrade would adversely affect its business and prospects and,consequently, its results of operations and financial condition. The Company believes that if the financial strength ratings ofAGM, AGC and/or MAC were downgraded from their current levels, such downgrade could result in downward pressure onthe premium that such insurance subsidiary would be able to charge for its insurance. Currently, AGM, AGC and MAC all havefinancial strength ratings in the double-A category from S&P (AA- (Stable Outlook)). MAC also has a AA+ (Stable) financialstrength rating from Kroll, while AGM and AGC have financial strength ratings in the single-A category from Moody's (A2(Stable Outlook) and A3 (Stable Outlook), respectively. The Company believes that so long as AGM, AGC and/or MACcontinues to have financial strength ratings in the double-A category from at least one of the legacy rating agencies (S&P orMoody’s), they are likely to be able to continue writing financial guaranty business with a credit quality similar to thathistorically written. However, if both legacy rating agencies were to reduce the financial strength ratings of AGM, AGC and/orMAC to the single-A level or below, or if either legacy rating agency were to downgrade AGM, AGC and/or MAC below thesingle-A level, it could be difficult for the Company to originate the current volume of new business with comparable creditcharacteristics. See "Item 1A. Risk Factors—Risks Related to the Company's Financial Strength and Financial EnhancementRatings" and "Item 7. Management's Discussion and Analysis of Financial Condition and Results of Operations" for moreinformation about the Company's ratings.
0345r4.indd 19 3/19/14 3:27 PM
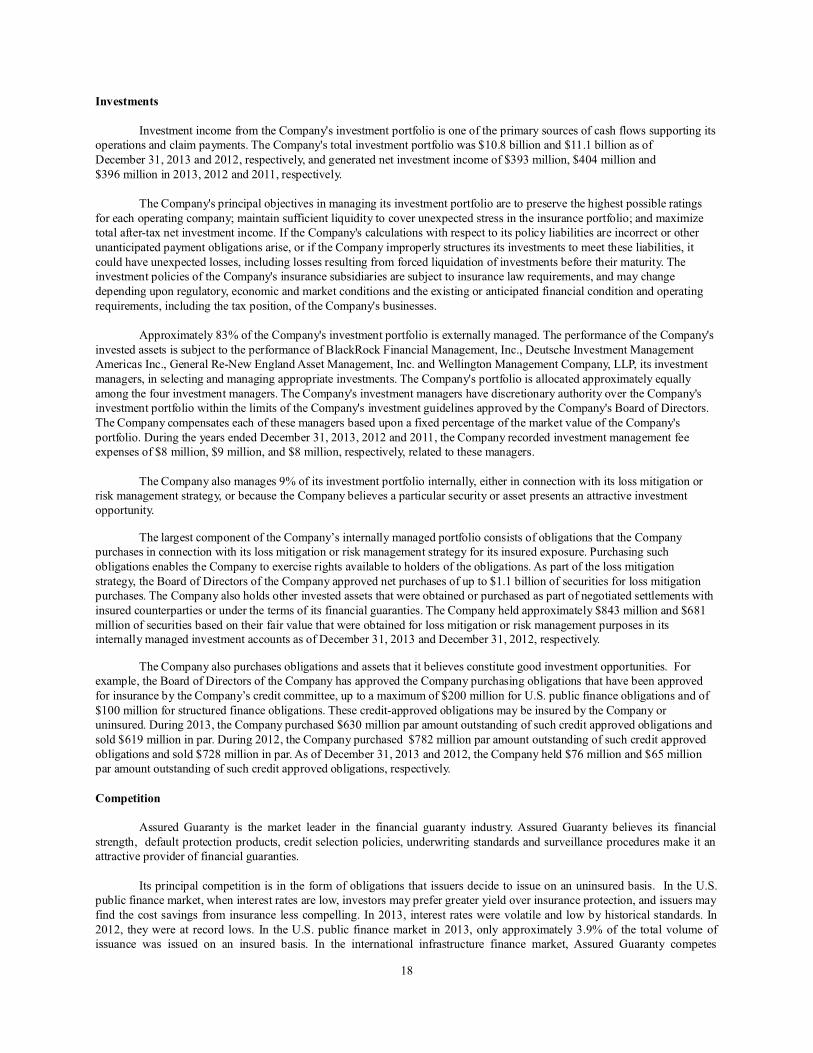
18
Investments
Investment income from the Company's investment portfolio is one of the primary sources of cash flows supporting itsoperations and claim payments. The Company's total investment portfolio was $10.8 billion and $11.1 billion as ofDecember 31, 2013 and 2012, respectively, and generated net investment income of $393 million, $404 million and$396 million in 2013, 2012 and 2011, respectively.
The Company's principal objectives in managing its investment portfolio are to preserve the highest possible ratingsfor each operating company; maintain sufficient liquidity to cover unexpected stress in the insurance portfolio; and maximizetotal after-tax net investment income. If the Company's calculations with respect to its policy liabilities are incorrect or otherunanticipated payment obligations arise, or if the Company improperly structures its investments to meet these liabilities, itcould have unexpected losses, including losses resulting from forced liquidation of investments before their maturity. Theinvestment policies of the Company's insurance subsidiaries are subject to insurance law requirements, and may changedepending upon regulatory, economic and market conditions and the existing or anticipated financial condition and operatingrequirements, including the tax position, of the Company's businesses.
Approximately 83% of the Company's investment portfolio is externally managed. The performance of the Company'sinvested assets is subject to the performance of BlackRock Financial Management, Inc., Deutsche Investment ManagementAmericas Inc., General Re-New England Asset Management, Inc. and Wellington Management Company, LLP, its investmentmanagers, in selecting and managing appropriate investments. The Company's portfolio is allocated approximately equallyamong the four investment managers. The Company's investment managers have discretionary authority over the Company'sinvestment portfolio within the limits of the Company's investment guidelines approved by the Company's Board of Directors.The Company compensates each of these managers based upon a fixed percentage of the market value of the Company'sportfolio. During the years ended December 31, 2013, 2012 and 2011, the Company recorded investment management feeexpenses of $8 million, $9 million, and $8 million, respectively, related to these managers.
The Company also manages 9% of its investment portfolio internally, either in connection with its loss mitigation orrisk management strategy, or because the Company believes a particular security or asset presents an attractive investmentopportunity.
The largest component of the Company’s internally managed portfolio consists of obligations that the Companypurchases in connection with its loss mitigation or risk management strategy for its insured exposure. Purchasing suchobligations enables the Company to exercise rights available to holders of the obligations. As part of the loss mitigationstrategy, the Board of Directors of the Company approved net purchases of up to $1.1 billion of securities for loss mitigationpurchases. The Company also holds other invested assets that were obtained or purchased as part of negotiated settlements withinsured counterparties or under the terms of its financial guaranties. The Company held approximately $843 million and $681million of securities based on their fair value that were obtained for loss mitigation or risk management purposes in itsinternally managed investment accounts as of December 31, 2013 and December 31, 2012, respectively.
The Company also purchases obligations and assets that it believes constitute good investment opportunities. Forexample, the Board of Directors of the Company has approved the Company purchasing obligations that have been approvedfor insurance by the Company’s credit committee, up to a maximum of $200 million for U.S. public finance obligations and of$100 million for structured finance obligations. These credit-approved obligations may be insured by the Company oruninsured. During 2013, the Company purchased $630 million par amount outstanding of such credit approved obligations andsold $619 million in par. During 2012, the Company purchased $782 million par amount outstanding of such credit approvedobligations and sold $728 million in par. As of December 31, 2013 and 2012, the Company held $76 million and $65 millionpar amount outstanding of such credit approved obligations, respectively.
Competition
Assured Guaranty is the market leader in the financial guaranty industry. Assured Guaranty believes its financialstrength, default protection products, credit selection policies, underwriting standards and surveillance procedures make it anattractive provider of financial guaranties.
Its principal competition is in the form of obligations that issuers decide to issue on an uninsured basis. In the U.S.public finance market, when interest rates are low, investors may prefer greater yield over insurance protection, and issuers mayfind the cost savings from insurance less compelling. In 2013, interest rates were volatile and low by historical standards. In2012, they were at record lows. In the U.S. public finance market in 2013, only approximately 3.9% of the total volume ofissuance was issued on an insured basis. In the international infrastructure finance market, Assured Guaranty competes
0345r4.indd 20 3/19/14 3:27 PM

19
primarily with privately funded executions where no bonds are sold in the public markets. In the asset-backed market, theprincipal competition comes from credit or structural enhancement embedded in transactions, such as throughovercollateralization, first loss insurance, excess spread or other terms and conditions that provide investors with additionalcollateral or cash flow.
Assured Guaranty is the only financial guaranty company active before the global financial crisis of 2008 that hasmaintained sufficient financial strength to write new business continuously since the crisis began. As a result of rating agencydowngrades of the financial strength ratings of financial guaranty companies that had previously been active in the market,Assured Guaranty faced virtually no bond insurer competition since it acquired AGM, in 2009, through 2012.
Based on industry statistics, the Company estimates that, of the U.S. public finance bonds issued with insurance in2013, the Company insured approximately 62.3% of the par, while Build America Mutual Assurance Company ("BAM"),which commenced business in 2012, insured approximately 36.8% of the par. BAM is effective in competing with theCompany for small to medium sized U.S. public finance transactions in certain sectors and its pricing and underwritingstrategies may have a negative impact on the amount of premium the Company is able to charge for its insurance. However, theCompany believes it has competitive advantages over BAM due to: AGM's and MAC's larger capital base; AGM's ability toinsure larger transactions and issuances in more diverse U.S. bond sectors; and AGM's and MAC's strong financial strengthratings from multiple rating agencies (in the case of AGM, AA- from S&P and A2 from Moody's, and in the case of MAC, AA+from Kroll and AA- from S&P, compared with BAM's AA solely from S&P).
Another potential competitor to the Company on U.S. public finance transactions is National Public FinanceGuarantee Corporation (“National”). In 2009, MBIA Insurance Corporation (“MBIA”), one of the legacy insurers that is notwriting new business, transferred its U.S. public finance exposures to its affiliate National. The transfer was challenged inlitigation that was not settled until May 2013. Subsequently, S&P has raised National’s financial strength rating from BBB to A,noting that S&P no longer viewed MBIA’s rating as a limitation on National’s rating, and Moody’s has upgraded National'sfinancial strength rating from Baa2 to Baa1. National has publicly stated its intention to resume insuring municipal bonds and itis possible it may do so in 2014.
In the global structured finance and infrastructure markets, Assured Guaranty is the only financial guaranty insurancecompany currently guaranteeing structured financings. Management considers this diversification to be a competitiveadvantage in the long run because it means the Company is not wholly dependent on conditions in any one market.
In the future, additional new entrants into the financial guaranty industry could reduce the Company's future newbusiness prospects, including by furthering price competition or offering financial guaranty insurance on transactions withstructural and security features that are more favorable to the issuers than those required by Assured Guaranty.
In addition to monoline insurance companies, Assured Guaranty competes with other forms of credit enhancement,such as letters of credit or credit derivatives provided by banks and other financial institutions, some of which are governmentalenterprises, or direct guaranties of municipal, structured finance or other debt by federal or state governments or governmentsponsored or affiliated agencies. Alternative credit enhancement structures, and in particular federal government creditenhancement or other programs, can interfere with the Company's new business prospects, particularly if they provide directgovernmental-level guaranties, restrict the use of third-party financial guaranties or reduce the amount of transactions thatmight qualify for financial guaranties.
Regulation
General
The business of insurance and reinsurance is regulated in most countries, although the degree and type of regulationvaries significantly from one jurisdiction to another. Reinsurers are generally subject to less direct regulation than primaryinsurers. The Company is subject to regulation under applicable statutes in the U.S., the U.K. and Bermuda, as well asapplicable statutes in Australia.
United States
AGL has three operating insurance subsidiaries domiciled in the U.S., which the Company refers to collectively as the"Assured Guaranty U.S. Subsidiaries."
0345r4.indd 21 3/19/14 3:27 PM

20
• AGM is a New York domiciled insurance company licensed to write financial guaranty insurance and reinsurance in50 U.S. states, the District of Columbia, Guam, Puerto Rico and the U.S. Virgin Islands. It also does business inSydney, through a service company.
• MAC is a New York domiciled insurance company licensed to write financial guaranty insurance and reinsurance in47 U.S. jurisdictions, including the District of Columbia (with license applications pending in the remaining states).MAC will only insure U.S. public finance debt obligations, focusing on investment grade bonds in select sectors ofthat market.
• AGC is a Maryland domiciled insurance company licensed to write financial guaranty insurance and reinsurance(which is classified in some states as surety or another line of insurance) in 50 U.S. states, the District of Columbiaand Puerto Rico. It is registered as a foreign company in Australia and currently operates through a representativeoffice in Sydney. AGC currently intends for the representative office to conduct activities so that it does not have apermanent establishment in Australia.
The Company also owned Assured Guaranty Municipal Insurance Company ("AGMIC"), a New York domiciledinsurance company (formerly FSA Insurance Company) that was redomesticated to New York from Oklahoma in 2010.AGMIC never issued any direct policies and its only outstanding business in 2013 was as reinsurer, pursuant to anintercompany reinsurance pooling agreement, of direct business written by AGM. Effective as of July 1, 2013, AGMreassumed such business from AGMIC and the parties terminated such pooling agreement. Effective as of July 16, 2013,AGMIC merged with and into AGM, with AGM as the surviving company of the merger.
In addition, the Company owned Assured Guaranty Mortgage Insurance Company ("AG Mortgage"), a New Yorkdomiciled insurance company that was authorized solely to transact mortgage guaranty insurance and reinsurance. AGMortgage was licensed as a mortgage guaranty insurer in the State of New York and in the District of Columbia, and was anapproved or accredited reinsurer in the States of California and Illinois. In 2012, the last policy to which AG Mortgage hadexposure expired. In the third quarter of 2013, AG Mortgage surrendered or cancelled, as applicable, its insurance license inthe District of Columbia and its accredited reinsurer status in California and Illinois. It is intended that AG Mortgage will bemerged with and into AGM, with AGM as the surviving company of the merger, effective as of March 3, 2014.
Insurance Holding Company Regulation
AGL and the Assured Guaranty U.S. Subsidiaries are subject to the insurance holding company laws of theirjurisdiction of domicile, as well as other jurisdictions where these insurers are licensed to do insurance business. These lawsgenerally require each of the Assured Guaranty U.S. Subsidiaries to register with its respective domestic state insurancedepartment and annually to furnish financial and other information about the operations of companies within their holdingcompany system. Generally, all transactions among companies in the holding company system to which any of the AssuredGuaranty U.S. Subsidiaries is a party (including sales, loans, reinsurance agreements and service agreements) must be fair and,if material or of a specified category, such as reinsurance or service agreements, require prior notice and approval or non-disapproval by the insurance department where the applicable subsidiary is domiciled.
Change of Control
Before a person can acquire control of a U.S. domestic insurance company, prior written approval must be obtainedfrom the insurance commissioner of the state where the domestic insurer is domiciled. Generally, state statutes provide thatcontrol over a domestic insurer is presumed to exist if any person, directly or indirectly, owns, controls, holds with the power tovote, or holds proxies representing, 10% or more of the voting securities of the domestic insurer. Prior to granting approval ofan application to acquire control of a domestic insurer, the state insurance commissioner will consider such factors as thefinancial strength of the applicant, the integrity and management of the applicant's board of directors and executive officers, theacquirer's plans for the management of the applicant's board of directors and executive officers, the acquirer's plans for thefuture operations of the domestic insurer and any anti-competitive results that may arise from the consummation of theacquisition of control. These laws may discourage potential acquisition proposals and may delay, deter or prevent a change ofcontrol involving AGL that some or all of AGL's stockholders might consider to be desirable, including in particular unsolicitedtransactions.
0345r4.indd 22 3/19/14 3:27 PM

21
State Insurance Regulation
State insurance authorities have broad regulatory powers with respect to various aspects of the business of U.S.insurance companies, including licensing these companies to transact business, accreditation of reinsurers, admittance of assetsto statutory surplus, regulating unfair trade and claims practices, establishing reserve requirements and solvency standards,regulating investments and dividends and, in certain instances, approving policy forms and related materials and approvingpremium rates. State insurance laws and regulations require the Assured Guaranty U.S. Subsidiaries to file financial statementswith insurance departments everywhere they are licensed, authorized or accredited to conduct insurance business, and theiroperations are subject to examination by those departments at any time. The Assured Guaranty U.S. Subsidiaries preparestatutory financial statements in accordance with Statutory Accounting Practices, or SAP, and procedures prescribed orpermitted by these departments. State insurance departments also conduct periodic examinations of the books and records,financial reporting, policy filings and market conduct of insurance companies domiciled in their states, generally once everythree to five years. Market conduct examinations by regulators other than the domestic regulator are generally carried out incooperation with the insurance departments of other states under guidelines promulgated by the National Association ofInsurance Commissioners.
The Maryland Insurance Administration (the "MIA"), the regulatory authority of the domiciliary jurisdiction of AGC,conducts a periodic examination of insurance companies domiciled in Maryland every five years. In 2013, the MIA issued anExamination Report with respect to AGC for the five year period ending December 31, 2011; no significant regulatory issueswere noted in such report.
The New York State Department of Financial Services (the "NY DFS"), the regulatory authority of the domiciliaryjurisdiction of AGM and MAC, and of AGMIC and AG Mortgage (prior to each such company's merger with AGM), alsoconducts a periodic examination of insurance companies domiciled in New York, also usually at five-year intervals. In 2012,the NY DFS commenced examinations of AGM, MAC, AGMIC and AG Mortgage in order for its examinations of thesecompanies to coincide with the MIA's examination of AGC. In 2013, the NY DFS completed its examinations and issuedReports on Examination of (i) AGM and AG Mortgage for the four-year period ending December 31, 2011; (ii) AGMIC for thefive-year period ending December 31, 2011; and (iii) MAC for the period September 26, 2008 through June 30, 2012. Thereports also did not note any significant regulatory issues concerning those companies.
State Dividend Limitations
New York. One of the primary source of cash for the payment of debt service and dividends by the Company is thereceipt of dividends from AGM. Under the New York Insurance Law, AGM may only pay dividends out of "earned surplus,"which is that portion of the company's surplus that represents the net earnings, gains or profits (after deduction of all losses)that have not been distributed to shareholders as dividends or transferred to stated capital or capital surplus, or applied to otherpurposes permitted by law, but does not include unrealized appreciation of assets. AGM may pay dividends without the priorapproval of the New York Superintendent of Financial Services ("New York Superintendent") that, together with all dividendsdeclared or distributed by it during the preceding 12 months, does not exceed 10% of its policyholders' surplus (as of its lastannual or quarterly statement filed with the New York Superintendent) or 100% of its adjusted net investment income duringthat period. The maximum amount available during 2014 for AGM to pay dividends to its parent AGMH without regulatoryapproval, after giving effect to dividends paid in the prior 12 months, will be approximately $173 million. AGM paid dividendsof $163 million and $30 million during 2013 and 2012, respectively, to AGMH. It did not declare or pay any dividends in 2011because in connection with the Company's acquisition of AGMH in 2009, it had committed to the NY DFS that AGM wouldnot pay any dividends for a two year period without the prior approval of the New York Superintendent. This constraint hasexpired.
Maryland. Another primary source of cash for the payment of debt service and dividends by the Company is thereceipt of dividends from AGC. Under Maryland's insurance law, AGC may, with prior notice to the MIA, pay an ordinarydividend that, together with all dividends paid in the prior 12 months, does not exceed 10% of its policyholders' surplus (as ofthe prior December 31) or 100% of its adjusted net investment income during that period. The maximum amount availableduring 2014 for AGC to pay ordinary dividends to its parent Assured Guaranty US Holdings Inc. ("AGUS"), after giving effectto dividends paid in the prior 12 months, will be approximately $69 million. A dividend or distribution to a stockholder inexcess of this limitation would constitute an "extraordinary dividend," which must be paid out of "earned surplus" and reportedto, and approved by, the MIA prior to payment. "Earned surplus" is that portion of the company's surplus that represents the netearnings, gains or profits (after deduction of all losses) that have not been distributed to shareholders as dividends or transferredto stated capital or capital surplus, or applied to other purposes permitted by law, but does not include unrealized capital gainsand appreciation of assets. Currently, AGC does not have any earned surplus and therefore the Company expects AGC only topay ordinary dividends in 2014. AGC may not pay any dividend or make any distribution, including ordinary dividends, unless
0345r4.indd 23 3/19/14 3:27 PM

22
it notifies the MIA of the proposed payment within five business days following declaration and at least ten days beforepayment. The MIA may declare that such dividend not be paid if it finds that AGC's policyholders' surplus would beinadequate after payment of the dividend or the dividend could lead AGC to a hazardous financial condition. AGC paiddividends of $67 million, $55 million and $30 million during 2013, 2012 and 2011, respectively, to AGUS.
Contingency Reserves
New York. Under the New York Insurance Law, each of AGM and MAC must establish a contingency reserve toprotect policyholders. As financial guaranty insurers, each is required to maintain a contingency reserve:
• with respect to policies written prior to July 1, 1989, in an amount equal to 50% of earned premiums less permittedreductions; and
• with respect to policies written on and after July 1, 1989, quarterly on a pro rata basis over a period of 20 years formunicipal bonds and 15 years for all other obligations, in an amount equal to the greater of 50% of premiums writtenfor the relevant category of insurance or a percentage of the principal guaranteed, varying from 0.55% to 2.50%,depending on the type of obligation guaranteed, until the contingency reserve amount for the category equals theapplicable percentage of net unpaid principal. The contingency reserve is then taken down over the same period oftime that it was established.
Maryland. In accordance with Maryland insurance law and regulations, AGC also maintains a statutory contingencyreserve for the protection of policyholders. The contingency reserve is maintained quarterly on a pro rata basis over a period of20 years for municipal bonds and 15 years for all other obligations, in an amount equal to the greater of 50% of premiumswritten for the relevant category of insurance or a percentage of the principal guaranteed, varying from 0.55% to 2.50%,depending on the type of obligation guaranteed, until the contingency reserve amount for the category equals the applicablepercentage of net unpaid principal. The contingency reserve is then taken down over the same period of time that it wasestablished.
In both New York and Maryland, when considering the principal amount guaranteed, the insurer is permitted to takeinto account amounts that it has ceded to reinsurers. In addition, releases from the insurer's contingency reserve may bepermitted under specified circumstances in the event that actual loss experience exceeds certain thresholds or if the reserveaccumulated is deemed excessive in relation to the insurer's outstanding insured obligations.
From time to time, AGM and AGC have obtained approval from their regulators to release contingency reserves basedon losses and, in the case of AGM, also based on the expiration of its insured exposure. In 2012, AGM obtained NY DFSapproval of contingency reserve releases of approximately $510 million based on the expiration of exposure. In addition, inJuly 2013, AGM obtained approval from the NY DFS, and AGC obtained approval from the MIA, to reassume in three annualinstallments all of the outstanding contingency reserves that AGM and AGC, respectively, ceded to its affiliate AG Re and tocease ceding further contingency reserves to AG Re. In July 2013, AGM and AGC each implemented the first of these threeannual installments by reassuming approximately $73 million and $88 million, respectively, of ceded contingency reserves.These first reassumptions together permitted the release of assets from the AG Re trust accounts securing AG Re's reinsuranceof AGM and AGC by approximately $130 million, after adjusting for increases in the amounts required to be held in suchaccounts due to changes in asset values, thereby increasing the Company’s liquidity. The second and third reassumptioninstallments are intended to be completed on the one and two year anniversaries, respectively, of the first reassumptioninstallment, and are subject to further approval by the NY DFS and MIA.
Financial guaranty insurers are also required to maintain a loss and loss adjustment expense ("LAE") reserve andunearned premium reserve on a case-by-case basis.
Single and Aggregate Risk Limits
The New York Insurance Law and the Code of Maryland Regulations establish single risk limits for financial guarantyinsurers applicable to all obligations issued by a single entity and backed by a single revenue source. For example, under thelimit applicable to qualifying asset-backed securities, the lesser of:
• the insured average annual debt service for a single risk, net of qualifying reinsurance and collateral, or
0345r4.indd 24 3/19/14 3:27 PM

23
• the insured unpaid principal (reduced by the extent to which the unpaid principal of the supporting assets exceeds theinsured unpaid principal) divided by nine, net of qualifying reinsurance and collateral, may not exceed 10% of the sumof the insurer's policyholders' surplus and contingency reserves, subject to certain conditions.
Under the limit applicable to municipal obligations, the insured average annual debt service for a single risk, net ofqualifying reinsurance and collateral, may not exceed 10% of the sum of the insurer's policyholders' surplus and contingencyreserves. In addition, insured principal of municipal obligations attributable to any single risk, net of qualifying reinsurance andcollateral, is limited to 75% of the insurer's policyholders' surplus and contingency reserves. Single-risk limits are alsospecified for other categories of insured obligations, and generally are more restrictive than those listed for asset-backed ormunicipal obligations. Obligations not qualifying for an enhanced single-risk limit are generally subject to the "corporate" limit(applicable to insurance of unsecured corporate obligations) equal to 10% of the sum of the insurer's policyholders' surplus andcontingency reserves. For example, "triple-X" and "future flow" securitizations, as well as unsecured investor-owned utilityobligations, are generally subject to these "corporate" single-risk limits.
The New York Insurance Law and the Code of Maryland Regulations also establish aggregate risk limits on the basisof aggregate net liability insured as compared with statutory capital. "Aggregate net liability" is defined as outstandingprincipal and interest of guaranteed obligations insured, net of qualifying reinsurance and collateral. Under these limits,policyholders' surplus and contingency reserves must not be less than a percentage of aggregate net liability equal to the sum ofvarious percentages of aggregate net liability for various categories of specified obligations. The percentage varies from 0.33%for certain municipal obligations to 4% for certain non-investment-grade obligations. As of December 31, 2013, the aggregatenet liability of each of AGM, MAC and AGC utilized approximately 34.4%, 57.8% and 25.9% of their respective policyholders'surplus and contingency reserves.
The New York Superintendent has broad discretion to order a financial guaranty insurer to cease new businessoriginations if the insurer fails to comply with single or aggregate risk limits. In practice, the New York Superintendent hasshown a willingness to work with insurers to address these concerns.
Group Regulation
In connection with AGL’s establishment of tax residence in the United Kingdom, as discussed in greater detail under"Tax Matters" below, AGL has been discussing the regulation of AGL and its subsidiaries as a group with the PrudentialRegulation Authority in the U.K. and with the NY DFS. The NY DFS has indicated that it will assume responsibility forregulation of the Assured Guaranty group. Group supervision by the NYDFS would result in additional regulatory oversightover Assured Guaranty, and may subject Assured Guaranty to new regulatory requirements and constraints.
Investments
The Assured Guaranty U.S. Subsidiaries are subject to laws and regulations that require diversification of theirinvestment portfolio and limit the amount of investments in certain asset categories, such as below investment grade fixed-maturity securities, equity real estate, other equity investments, and derivatives. Failure to comply with these laws andregulations would cause investments exceeding regulatory limitations to be treated as non-admitted assets for purposes ofmeasuring surplus, and, in some instances, would require divestiture of such non-qualifying investments. The Companybelieves that the investments made by the Assured Guaranty U.S. Subsidiaries complied with such regulations as ofDecember 31, 2013. In addition, any investment must be approved by the insurance company's board of directors or acommittee thereof that is responsible for supervising or making such investment.
Operations of the Company's Non-U.S. Insurance Subsidiaries
In addition to the regulatory requirements imposed by the jurisdictions in which they are licensed, the businessoperations of the Company's reinsurance subsidiaries are affected by regulatory requirements in various states of the UnitedStates governing "credit for reinsurance", which are imposed on the ceding companies of the reinsurers. The Nonadmitted andReinsurance Reform Act (“NRRA”) of the Dodd-Frank Wall Street Reform and Consumer Protection Act (the “Dodd-FrankAct”) streamlined the regulation of reinsurance by applying single state regulation for credit for reinsurance. Under the NRRA,credit for reinsurance determinations are controlled by the ceding company’s state of domicile and non-domiciliary states areprohibited from applying their reinsurance laws extraterritorially. In general, a ceding company which obtains reinsurancefrom a reinsurer that is licensed, accredited or approved by the ceding company's state of domicile is permitted to reflect in itsstatutory financial statements a credit in an aggregate amount equal to the ceding company's liability for unearned premiums(which are that portion of premiums written which applies to the unexpired portion of the policy period), loss and loss expensereserves ceded to the reinsurer. The great majority of states, however, permit a credit on the statutory financial statements of a
0345r4.indd 25 3/19/14 3:27 PM

24
ceding insurer for reinsurance obtained from a non-licensed or non-accredited reinsurer to the extent that the reinsurer securesits reinsurance obligations to the ceding insurer by providing a letter of credit, trust fund or other acceptable securityarrangement. A few states do not allow credit for reinsurance ceded to non-licensed reinsurers except in certain limitedcircumstances and others impose additional requirements that make it difficult to become accredited. The Company'sreinsurance subsidiaries AG Re and AGRO are not licensed, accredited or approved in any state and have established trusts tosecure their reinsurance obligations.
U.S. Federal Regulation
The Company’s businesses are subject to direct and indirect regulation under U.S. federal law. In particular, theDodd-Frank Act could require certain of AGL's subsidiaries to register with the SEC as major security-based swap participantswhen those registration rules take effect. Major security-based swap participants would need to satisfy the SEC's regulatorycapital requirements and would be subject to additional compliance requirements. In addition, certain of AGL's subsidiariesmay need to post margin with respect to either future or legacy derivative transactions when rules relating to margin take effect.At this time, AGL does not believe its subsidiaries are required to register with the Commodity Futures Trading Commission("CFTC") as major swap participants, but their status could change based on official guidance from the CFTC.
Furthermore, pursuant to the Dodd-Frank Act, the Financial Stability Oversight Council ("FSOC") has been chargedwith identifying certain non-bank financial companies to be subject to supervision by the Board of Governors of the FederalReserve System. In a parallel international process, the International Association of Insurance Supervisors ("IAIS"), which hasbeen identifying global systemically important insurers ("GSII"), published a proposed assessment methodology that deemedfinancial guaranty insurance to be an activity that poses increased systemic risk relative to more traditional insurance activities.The Company does not at this time expect to be designated as a Systemically Important Financial Institution ("SIFI") by theFSOC or a GSII by the IAIS, but the Company's status could change pursuant to new criteria from the FSOC or the IAIS.
Bermuda
AG Re and AGRO are each an insurance company currently registered and licensed under the Insurance Act 1978 ofBermuda, amendments thereto and related regulations (collectively, the "Insurance Act"). AG Re is registered and licensed as aClass 3B insurer and AGRO is registered and licensed as a Class 3A insurer and a Class C long-term insurer. The Companyalso owned Assured Guaranty (Bermuda) Ltd. ("AGBM"), which was registered and licensed as a Class 3 insurer. EffectiveJuly 17, 2013, AGBM was merged with and into AG Re with AG Re surviving the merger.
Bermuda Insurance Regulation
The Insurance Act imposes on insurance companies certain solvency and liquidity standards; certain restrictions on thedeclaration and payment of dividends and distributions; certain restrictions on the reduction of statutory capital; certainrestrictions on the winding up of long-term insurers; and certain auditing and reporting requirements and also the need to havea principal representative and a principal office (as understood under the Insurance Act) in Bermuda. The Insurance Act grantsto the Bermuda Monetary Authority (the "Authority") the power to cancel insurance licenses, supervise, investigate andintervene in the affairs of insurance companies and in certain circumstances share information with foreign regulators. Class 3Aand Class 3B insurers are authorized to carry on general insurance business (as understood under the Insurance Act), subject toconditions attached to the license and to compliance with minimum capital and surplus requirements, solvency margin,liquidity ratio and other requirements imposed by the Insurance Act. Class C insurers are permitted to carry on long-termbusiness (as understood under the Insurance Act) subject to conditions attached to the license and to similar compliancerequirements and the requirement to maintain its long-term business fund (a segregated fund). Each of AG Re and AGRO isrequired annually to file statutorily mandated financial statements and returns, audited by an auditor approved by the Authority(no approved auditor of an insurer may have an interest in that insurer, other than as an insured, and no officer, servant or agentof an insurer shall be eligible for appointment as an insurer's approved auditor), together with an annual loss reserve opinion ofthe Authority approved loss reserve specialist and in respect of AGRO, the required actuary's certificate with respect to thelong-term business. AG Re is also required to file annual financial statements prepared in conformity with accountingprinciples generally accepted in the United States of America ("GAAP"), which must be available to the public. As Class 3Ainsurer, AGRO has received an exemption from the Authority from making such filing. In addition, AG Re is required to file acapital and solvency return that includes the company's Bermuda Solvency Capital Requirement ("BSCR") model (or anapproved internal capital model in lieu thereof), a schedule of fixed income investments by rating categories, a schedule of netreserves for losses and loss expense provisions by line of business, a schedule of premiums written by line of business, aschedule of risk management, a schedule of fixed income securities, a schedule of commercial insurer's solvency selfassessment ("CISSA"), a schedule of catastrophe risk return, a schedule of loss triangles or reconciliation of net loss reserves
0345r4.indd 26 3/19/14 3:27 PM

25
and a schedule of eligible capital. AG Re is also required to file quarterly financial returns which consist of quarterly unauditedfinancial statements and details of material intra-group transactions and risk concentrations.
AGRO is also required to file a capital and solvency return that includes, among other details, the company's BermudaSolvency Capital Requirement—Small and Medium Entities ("BSCR-SME") model (or an approved internal capital model inlieu thereof), the CISSA and a schedule of eligible capital.
Shareholder Controllers
Pursuant to provisions in the Insurance Act, any person who becomes a holder of 10% or more, 20% or more, 33% ormore or 50% or more of the Company's common shares must notify the Authority in writing within 45 days of becoming such aholder. The Authority has the power to object to such a person if it appears to the Authority that the person is not fit and properto be such a holder. In such a case, the Authority may require the holder to reduce their shareholding in the Company and maydirect, among other things, that the voting rights attaching to their common shares shall not be exercisable. A person that doesnot comply with such a notice or direction from the Authority will be guilty of an offense.
Notification of Material Changes
All registered insurers are required to give notice to the Authority of their intention to effect a material change withinthe meaning of the Insurance Act. For the purposes of the Insurance Act, the following changes are material: (i) the transfer oracquisition of insurance business being part of a scheme falling under section 25 of the Insurance Act or section 99 of theCompanies Act 1981 of Bermuda (the "Companies Act"), (ii) the amalgamation with or acquisition of another firm,(iii) engaging in unrelated business that is retail business, (iv) the acquisition of a controlling interest in an undertaking that isengaged in non-insurance business which offers services or products to non-affiliated persons, (v) outsourcing all orsubstantially all of the functions of actuarial, risk management, compliance and internal audit, (vi) outsourcing all or a materialpart of an insurer's underwriting activity, (vii) transferring other than by way of reinsurance all or substantially all of a line ofbusiness and (viii) expanding into a material new line of business.
No registered insurer shall take any steps to give effect to a material change unless it has first served notice on theAuthority that it intends to effect such material change and, before the end of 14 days, either the Authority has notified suchcompany in writing that it has no objection to such change or that period has lapsed without the Authority having issued anotice of objection. A person who fails to give the required notice or who effects a material change, or allows such materialchange to be effected, before the prescribed period has elapsed or after having received a notice of objection shall be guilty ofan offence.
Minimum Solvency Margin and Enhanced Capital Requirements
Under the Insurance Act, AG Re and AGRO must each ensure that the value of its general business assets exceeds theamount of its general business liabilities by an amount greater than the prescribed minimum solvency margin and eachcompany's applicable enhanced capital requirement.
The minimum solvency margin for Class 3A and Class 3B insurers is the greater of (i) $1 million, or (ii) 20% of thefirst $6 million of net premiums written; if in excess of $6 million, the figure is $1.2 million plus 15% of net premiums writtenin excess of $6 million, or (iii) 15% of net discounted aggregate loss and loss expense provisions and other insurance reserves,or (iv) 25% of that insurers applicable enhanced capital requirement reported at the end of its relevant year.
In addition, as a Class C long-term insurer, AGRO is required, with respect to its long-term business, to maintain aminimum solvency margin equal to the greater of $500,000 or 1.5% of its assets for the 2013 financial year. For the purpose ofthis calculation, assets are defined as the total assets pertaining to its long-term business reported on the balance sheet in therelevant year less the amounts held in a segregated account. AGRO is also required to keep its accounts in respect of its long-term business separate from any accounts kept in respect of any other business and all receipts of its long-term business formpart of its long-term business fund.
Each of AG Re and AGRO is required to maintain available statutory capital and surplus at a level equal to or inexcess of its applicable enhanced capital requirement, which is established by reference to either its BSCR model or anapproved internal capital model. The BSCR model is a risk-based capital model which provides a method for determining aninsurer's capital requirements (statutory capital and surplus) by taking into account the risk characteristics of different aspectsof the insurer's business. The BSCR formula establish capital requirements for eight categories of risk: fixed income investmentrisk, equity investment risk, interest rate/liquidity risk, premium risk, reserve risk, credit risk, catastrophe risk and operational
0345r4.indd 27 3/19/14 3:27 PM

26
risk. For each category, the capital requirement is determined by applying factors to asset, premium, reserve, creditor, probablemaximum loss and operation items, with higher factors applied to items with greater underlying risk and lower factors for lessrisky items.
While not specifically referred to in the Insurance Act, the Authority has also established a target capital level ("TCL")for each insurer subject to an enhanced capital requirement equal to 120% of its enhanced capital requirement. While such aninsurer is not currently required to maintain its statutory capital and surplus at this level, the TCL serves as an early warningtool for the Authority and failure to maintain statutory capital at least equal to the TCL will likely result in increased regulatoryoversight.
For each insurer subject to an enhanced capital requirement, the Authority has introduced a three-tiered capital systemdesigned to assess the quality of capital resources that a company has available to meet its capital requirements. Under thissystem, all of an insurer's capital instruments will be classified as either basic or ancillary capital which in turn will beclassified into one of three tiers based on their “loss absorbency” characteristics. Highest quality capital is classified as Tier 1Capital; lesser quality capital is classified as either Tier 2 Capital or Tier 3 Capital. Under this regime, up to certain specifiedpercentages of Tier 1, Tier 2 and Tier 3 Capital (determined by registration classification) may be used to support the company'sminimum solvency margin, enhanced capital requirement and TCL.
Restrictions on Dividends and Distributions
The Insurance Act limits the declaration and payment of dividends and other distributions by AG Re and AGRO.Under the Insurance Act:
• The minimum share capital must be always issued and outstanding and cannot be reduced. For AG Re, which isregistered as a Class 3B insurer, the minimum share capital is $120,000. For AGRO, which is registered both as aClass 3A and a Class C long-term insurer, the minimum share capital is $370,000.
• With respect to the distribution (including repurchase of shares) of any share capital, contributed surplus or otherstatutory capital:
(a) any such distribution that would reduce AG Re's or AGRO's total statutory capital by 15% or more of theirrespective total statutory capital as set out in their previous year's financial statements requires the priorapproval of the Authority. Any application for such approval must include an affidavit stating that thecompany will continue to meet the required margins; and
(b) as a Class C long-term insurer, AGRO may not use the funds allocated to its long-term business fund, directlyor indirectly, for any purpose other than a purpose of its long-term business except in so far as such paymentcan be made out of any surplus certified by AGRO's approved actuary to be available for distributionotherwise than to policyholders;
• With respect to the declaration and payment of dividends:
(a) each of AG Re and AGRO is prohibited from declaring or paying any dividends during any financial year if itis in breach of its solvency margin, minimum liquidity ratio or enhanced capital requirement, or if thedeclaration or payment of such dividends would cause such a breach (if it has failed to meet its minimumsolvency margin or minimum liquidity ratio on the last day of any financial year, the insurer will beprohibited, without the approval of the Authority, from declaring or paying any dividends during the nextfinancial year). Dividends, are paid out of each insurer's statutory surplus and, therefore, dividends cannotexceed such surplus. See "—Minimum Solvency Margin and Enhanced Capital Requirements" above and "—Minimum Liquidity Ratio" below;
(b) an insurer which at any time fails to meet its minimum solvency margin or comply with the enhanced capitalrequirement may not declare or pay any dividend until the failure is rectified, and also in such circumstancesthe insurer must report, within 14 days after becoming aware of its failure or having reason to believe thatsuch failure has occurred, to the Authority in writing giving particulars of the circumstances leading to thefailure and giving a plan detailing the manner, specific actions to be taken and time frame in which theinsurer intends to rectify the failure. A failure to comply with the enhanced capital requirement will alsoresult in the insurer furnishing certain other information to the Authority within 45 days after becoming awareof its failure or having reason to believe that such failure has occurred;
0345r4.indd 28 3/19/14 3:27 PM

27
(c) as a Class 3B insurer, AG Re may not declare or pay, in any financial year, dividends of more than 25% of itstotal statutory capital and surplus (as set out on its previous year's financial statements) unless it files (at leastseven days before payment of such dividends) with the Authority an affidavit stating that it will continue tomeet the required margins; and
(d) as a Class C long-term insurer, AGRO may not declare or pay a dividend to any person other than apolicyholder unless the value of the assets of its long-term business fund, as certified by AGRO's approvedactuary, exceeds the extent (as so certified) of the liabilities of AGRO's long-term business, and the amount ofany such dividend shall not exceed the aggregate of (1) that excess; and (2) any other funds properlyavailable for the payment of dividends being funds arising out of AGRO's business other than its long-termbusiness.
The Companies Act also limits the declaration and payment of dividends and other distributions by Bermudacompanies such as AGL and its Bermuda subsidiaries (including AG Re and AGRO). Such companies may only declare andpay a dividend or make a distribution out of contributed surplus (as understood under the Companies Act) if there arereasonable grounds for believing that the company is and after the payment will be able to meet and pay its liabilities as theybecome due and the realizable value of the company's assets will not be less than its liabilities. The Companies Act alsoregulates and restricts the reduction and return of capital and paid in share premium, including the repurchase of shares andimposes minimum issued and outstanding share capital requirements.
Based on the limitations above, in 2014 AG Re has the capacity to (i) make capital distributions in an aggregateamount up to $126 million without the prior approval of the Authority and (ii) declare and pay dividends in an aggregateamount up to the limit of its outstanding statutory surplus, which is $278 million. Such dividend capacity is further limited bythe actual amount of AG Re’s unencumbered assets, which amount changes from time to time due in part to collateral postingrequirements. For more information concerning AG Re’s capacity to pay dividends and or other distributions, see Note 12,Insurance Company Regulatory Requirements, of the Financial Statements and Supplementary Data. The Company does notexpect AGRO to declare or pay any dividends or other distributions at this time.
Minimum Liquidity Ratio
The Insurance Act provides a minimum liquidity ratio for general business. An insurer engaged in general business isrequired to maintain the value of its relevant assets at not less than 75% of the amount of its relevant liabilities. Relevant assetsinclude cash and time deposits, quoted investments, unquoted bonds and debentures, first liens on real estate, investmentincome due and accrued, accounts and premiums receivable, reinsurance balances receivable and funds held by cedingreinsurers. There are certain categories of assets which, unless specifically permitted by the Authority, do not automaticallyqualify as relevant assets, such as unquoted equity securities, investments in and advances to affiliates and real estate andcollateral loans.
The relevant liabilities are total general business insurance reserves and total other liabilities less deferred income taxand sundry liabilities (by interpretation, those not specifically defined) and letters of credit and corporate guarantees.
Insurance Code of Conduct
Each of AG Re and AGRO is subject to the Insurance Code of Conduct, which establishes duties, standards,procedures and sound business principles which must be complied with by all insurers registered under the Insurance Act.Failure to comply with the requirements under the Insurance Code of Conduct will be a factor taken into account by theAuthority in determining whether an insurer is conducting its business in a sound and prudent manner as prescribed by theInsurance Act. Such failure to comply with the requirements of the Insurance Code of Conduct could result in the Authorityexercising its powers of intervention and investigation and will be a factor in calculating the operational risk charge applicablein accordance with the insurer's BSCR model.
Certain Other Bermuda Law Considerations
Although AGL is incorporated in Bermuda, it is classified as a non-resident of Bermuda for exchange control purposesby the Authority. Pursuant to its non-resident status, AGL may engage in transactions in currencies other than Bermuda dollarsand there are no restrictions on its ability to transfer funds (other than funds denominated in Bermuda dollars) in and out ofBermuda or to pay dividends to U.S. residents who are holders of its common shares.
0345r4.indd 29 3/19/14 3:27 PM

28
Under Bermuda law, "exempted" companies are companies formed for the purpose of conducting business outsideBermuda from a principal place of business in Bermuda. As an "exempted" company, AGL (as well as each of AG Re andAGRO) may not, without the express authorization of the Bermuda legislature or under a license or consent granted by theMinister of Education and Economic Development, participate in certain business and other transactions, including: (1) theacquisition or holding of land in Bermuda (except that held by way of lease or tenancy agreement which is required for itsbusiness and held for a term not exceeding 50 years, or which is used to provide accommodation or recreational facilities for itsofficers and employees and held with the consent of the Bermuda Minister of Education and Economic Development, for aterm not exceeding 21 years), (2) the taking of mortgages on land in Bermuda to secure a principal amount in excess of$50,000 unless the Minister of Education and Economic Development consents to a higher amount, and (3) the carrying on ofbusiness of any kind or type for which it is not duly licensed in Bermuda, except in certain limited circumstances, such as doingbusiness with another exempted undertaking in furtherance of AGL's business carried on outside Bermuda.
The Bermuda government actively encourages foreign investment in "exempted" entities like AGL that are based inBermuda, but which do not operate in competition with local businesses. AGL is not currently subject to taxes computed onprofits or income or computed on any capital asset, gain or appreciation. Bermuda companies pay, as applicable, annualgovernment fees, business fees, payroll tax and other taxes and duties. See "—Tax Matters—Taxation of AGL andSubsidiaries—Bermuda."
Special considerations apply to the Company's Bermuda operations. Under Bermuda law, non-Bermudians, other thanspouses of Bermudians and individuals holding permanent resident certificates or working resident certificates, are notpermitted to engage in any gainful occupation in Bermuda without a work permit issued by the Bermuda government. A workpermit is only granted or extended if the employer can show that, after a proper public advertisement, no Bermudian, spouse ofa Bermudian or individual holding a permanent resident certificate or working resident certificate is available who meets theminimum standards for the position. Currently, all of the Company's Bermuda based professional employees who require workpermits have been granted work permits by the Bermuda government.
United Kingdom
This section concerns AGE and its affiliates, Assured Guaranty (UK) Ltd. ("AGUK") and Assured Guaranty FinanceOverseas Ltd (“AGFOL”), each of which is regulated in the U.K., as well as Assured Guaranty Credit Protection Ltd.("AGCPL"), which is an authorized representative of AGE. AGUK is a U.K. insurance company that the Company elected toplace into runoff.
General
Financial services relating to deposits, insurance, investments and certain other financial products fall under the U.K.'sFinancial Services and Markets Act 2000 (“FSMA”), and the entities that provide them are authorized and regulated by thePRA and the Financial Conduct Authority ("FCA"). In addition, the regulatory regime in the U.K. must be consistent withrelevant European Union (“EU”) legislation, which is either directly applicable in, or must be implemented into national lawby, all EU member states. Key EU legislation includes the Markets in Financial Instruments Directive (“MiFID”), whichharmonizes the regulatory regime for investment services and activities across the EEA, the Insurance Directives, whichharmonize the regulatory regime for, respectively, life (long term) and non-life (general) insurance and the BankingConsolidation Directive, which harmonizes the regulatory regime for credit institutions. The Capital Adequacy Directive(“CAD”) contains capital requirements for MiFID firms.
Under FSMA, effecting or carrying out contracts of insurance, within a class of general or long-term insurance, byway of business in the U.K., each constitute a “regulated activity” requiring authorization. An authorized insurance companymust have permission for each class of insurance business it intends to write.
The PRA and the FCA were established on April 1, 2013 as part of the reform of financial regulation in the U.K.Immediately prior to that date, there was a single statutory regulator for financial services in the U.K., called the FinancialServices Authority (“FSA U.K.”). The new regulatory framework was established by the U.K. Financial Services Act 2012.These two new regulatory bodies cover the following areas:
• the PRA, a subsidiary of the Bank of England, is responsible for prudential regulation of key systemicallyimportant firms (which includes insurance companies, among others), and
• the FCA is responsible for the prudential regulation of all non-PRA firms, the conduct of business regulationof all firms and the regulation of market conduct.
0345r4.indd 30 3/19/14 3:27 PM

29
These two new regulators inherited the majority of the FSA U.K.'s existing functions. While they co-ordinate and co-operate insome areas, they have separate and independent mandates and separate rule-making and enforcement powers. AGE and AGUKare regulated by both the PRA and the FCA.
The PRA carries out the prudential supervision of insurance companies through a variety of methods, including thecollection of information from statistical returns, review of accountants' reports, visits to insurance companies and regularformal interviews. Like the FSA U.K. before it, the PRA has adopted a risk-based approach to the supervision of insurancecompanies.
The PRA's rules are intended to align capital requirements with the risk profile of each insurance company and ensureadequate diversification of an insurer's or reinsurer's exposures to any credit risks of its reinsurers. AGE has calculated itsminimum required capital according to the PRA's individual capital adequacy criteria and is in compliance.
The PRA applies threshold conditions, which insurers must meet, and against which the PRA assesses them on acontinuous basis. These conditions are that:
• an insurer's head office, and in particular its mind and management, must be in the United Kingdom if it isincorporated in the United Kingdom;
• an insurer's business must be conducted in a prudent manner — in particular the insurer must maintainappropriate financial and non-financial resources;
• the insurer must be fit and proper, and be appropriately staffed; and
• the insurer and its group must be capable of being effectively supervised.
The PRA supervises insurers to judge whether they are acting in a manner consistent with safety and soundness andappropriate policyholder protection, and so whether they meet, and are likely to continue to meet, the threshold conditions. Itweights its supervision towards those issues and those insurers that, in its judgment, pose the greatest risk to its objectives. It isforward-looking, assessing its objectives not just against current risks, but also against those that could plausibly arise furtherahead and will rely significantly on the judgment of its supervisors. Its risk assessment framework will look at the potentialimpact of failure of the insurer, its risk context and mitigating factors. Solvency II (discussed below) will bring further changesto the supervisory framework for insurers. The PRA believes its plans are consistent with Solvency II requirements.
Position of U.K. Regulated Entities within the AGL Group
AGE is authorized to effect and carry out certain classes of general insurance, specifically: classes 14 (credit), 15(suretyship) and 16 (miscellaneous financial loss) for commercial customers. This scope of permission is sufficient to enableAGE to effect and carry out financial guaranty insurance and reinsurance. The insurance and reinsurance businesses of AGE aresubject to close supervision by the PRA. AGE also has permission to arrange and advise on transactions it guarantees, and totake deposits in the context of its insurance business.
Following the Company's decision in 2010 to place AGUK into run-off, the Company has been utilizing AGE as theentity from which to write business in the EEA. It was agreed between management and the then regulator, the FSA U.K., thatany new business written by AGE would be guaranteed using a co-insurance structure pursuant to which AGE would co-insuremunicipal and infrastructure transactions with AGM, and structured finance transactions with AGC. AGE must obtain theapproval of the PRA before it can guarantee any new structured finance transaction. AGE's financial guaranty will cover aproportionate share (expected to be approximately 3 to 10%) of the total exposure, and AGM or AGC, as the case may be, willguarantee the remaining exposure under the transaction (subject to compliance with EEA licensing requirements). AGM orAGC, as the case may be, will also issue a second-to-pay guaranty to cover AGE's financial guarantee. AGE also is theprincipal of AGCPL. AGCPL is not PRA or FCA authorized, but is an appointed representative of AGE. This means AGCPLcan carry on advising and arranging activities without a license, because AGE has regulatory responsibility for it.
AGFOL, a subsidiary of AGL, is authorized by the FCA to carry out designated investment business activities in that itmay “advise on investments (except on pension transfers and pension opt outs)” relating to most investment instruments. Inaddition, it may arrange or bring about transactions in investments and make “arrangements with a view to transactions ininvestments.” In all cases, it may deal only with clients who are eligible counterparties or professional customers (so no retailclients), or, when arranging in relation to insurance contracts, commercial customers. It should be noted that AGFOL is notauthorized as an insurer and does not itself take risk in the transactions it arranges or places, and may not hold funds on behalf
0345r4.indd 31 3/19/14 3:27 PM

30
of its customers. AGFOL's permissions also allow it to introduce business to AGC and AGM, so that AGFOL can arrangefinancial guaranties underwritten by AGC and AGM, even though AGFOL's role will be limited to acting as a pure introducerof business to AGC and AGM. AGFOL is an “Exempt CAD” firm: although it is a MiFID investment firm, it does not have tocomply with the CAD. Its activities are limited to receiving and transmitting orders and giving investment advice and it cannothold client money.
AGCPL is subject to the requirements of Regulation (EU) No 648/2012 of the European Parliament and of the Councilof 4 July 2012 on OTC derivatives, central counterparties and trade repositories ("EMIR") which, as a European regulation, isdirectly applicable in all the member states of the European Union. AGCPL has notified the European Securities and MarketsAuthority ("ESMA") and the FCA of its status under EMIR as a non-financial counterparty which has exceeded the clearingthreshold (an “NFC+”) as described in Article 10 of EMIR. As an NFC+, AGCPL is subject to certain requirements underEMIR with respect to its portfolio of derivative contracts including recordkeeping and risk mitigation techniques. Certainrequirements have been applicable since March 15, 2013 (timely confirmations and daily valuations), while others have beenapplicable since September 15, 2013 (dispute resolution, portfolio reconciliation and portfolio compression requirements). Inaddition, AGCPL will be subject to certain reporting requirements under EMIR with respect to its outstanding portfolio ofderivative contracts. Although the start date in respect of the reporting obligation was February 12, 2014, a ninety day graceperiod applies to the reporting of derivative contracts which were outstanding before August 16, 2012 and which were stilloutstanding on February 12, 2014. Because all of AGCPL’s outstanding derivative contracts fall within this category, AGCPLwill not be required to report its derivative contracts until mid-May 2014. AGCPL is the only European entity within the AGLgroup which has entered into derivative contracts and as such it is the only entity in the group which is directly subject toEMIR. The Company is aware that circumstances exist in which EMIR may apply directly to non-European entities whentransacting derivatives, but has determined that these circumstances do not apply to the non-European entities in AGL’s group.
Solvency Requirements
The Prudential Sourcebooks require that non-life insurance companies such as AGUK and AGE maintain a margin ofsolvency at all times in respect of the liabilities of the insurance company, the calculation of which depends on the type andamount of insurance business a company writes. The method of calculation of the solvency margin (known as the minimumcapital requirement) is set out in the Prudential Sourcebooks, and for these purposes, the insurer's assets and liabilities aresubject to specified valuation rules. If and to the extent that the premiums it collects for specified categories of insurance, suchas credit and property, exceed certain specified minimum thresholds, a non-life insurance company must have extra technicalprovisions, called an equalization reserve, in addition to its minimum capital requirements. The purpose of the equalizationreserve, calculated in accordance with the Prudential Sourcebooks, is to ensure that insurers retain additional assets to providesome extra protection against uncertainty as to the amount of claims.
The Prudential Sourcebooks also require that AGUK and AGE calculate and share with the PRA their “enhancedcapital requirement” based on risk-weightings applied to assets held and lines of business written. In 2007, the FSA U.K.replaced the individual capital assessment for financial guaranty insurers with a “benchmarker” capital adequacy model devisedby the FSA U.K. Should the level of capital of AGUK or AGE fall below the capital requirement as indicated by thebenchmarker, the PRA may require the Company to undertake further work, following which Individual Capital Guidance mayresult. Failure to maintain capital at least equal to the minimum capital requirement in the benchmarker model is one of thegrounds on which the wide powers of intervention conferred upon the PRA may be exercised.
The European Union's Solvency II Directive (Directive 2009/138/EC), which itself is to be amended by the proposedOmnibus II Directive (collectively, “Solvency II”), is currently due to be implemented on January 1, 2016. The solvencyrequirements described above will be replaced at that point. Among other things, Solvency II introduces a revised risk-basedprudential regime which includes the following features:
• assets and liabilities are generally to be valued at their market value;
• the amount of required economic capital is intended to ensure, with a probability of 99.5%, that regulatedfirms are able to meet their obligations to policyholders and beneficiaries over the following 12 months; and
• reinsurance recoveries will be treated as a separate asset (rather than being netted off the underlyinginsurance liabilities).
In many instances, Solvency II is expected to require insurers to maintain a somewhat increased amount of capital to satisfy thenew solvency capital requirements. AGE was accepted by the then regulator, the FSA U.K., into the pre-application process andhas begun the process to apply for approval from the PRA for use of the “Partial Internal Model” methodology for calculation
0345r4.indd 32 3/19/14 3:27 PM

31
of its solvency capital requirement, which combines standard formulas developed by the European Insurance and OccupationalPensions Authority under the direction of the European Commission, for calculation of certain capital requirements with aninternally developed model for calculation of other capital requirements. AGE remains in the pre-application process (nowbeing run by the PRA); however, the formal application process has been delayed due to the delay in the implementation ofSolvency II.
In anticipation of Solvency II, the PRA has issued a Supervisory Statement (“Solvency II: applying EIOPA'spreparatory guidelines to PRA-authorised firms”, Supervisory Statement 4/13, dated December 12, 2013) requiring certaininformation to be submitted to it before the 2016 commencement date. AGE and AGUK are among the firms required to submitinformation to the PRA under this Supervisory Statement.
In addition, a U.K. insurer (which includes a company conducting only reinsurance business) is required to performand submit to the PRA a group capital adequacy return in respect of its ultimate insurance parent. For groups with an EEAinsurance parent, the calculation must show a positive result. AGE and AGUK do not have an EEA insurance parent and,accordingly, do not need to comply with this requirement. However, they do still need to report to the PRA on group capitaladequacy at the level of the ultimate insurance parent outside the EEA and, if the report at that level raises concerns, the PRAmay take regulatory action.
Further, an insurer is required to report in its annual returns to the PRA all material connected-party transactions (suchas intra-group reinsurance whose value is more than the sum of Euro 20,000 and 5% of the insurer's liabilities arising from itsgeneral insurance business, net of reinsurance).
Restrictions on Dividend Payments
U.K. company law prohibits each of AGE and AGUK from declaring a dividend to its shareholders unless it has“profits available for distribution.” The determination of whether a company has profits available for distribution is based on itsaccumulated realized profits less its accumulated realized losses. While the U.K. insurance regulatory laws impose no statutoryrestrictions on a general insurer's ability to declare a dividend, the PRA's capital requirements may in practice act as arestriction on dividends. The Company does not expect AGE or AGUK to distribute any dividends at this time.
Reporting Requirements
U.K. insurance companies must prepare their financial statements under the Companies Act 2006, which requires thefiling with Companies House of audited financial statements and related reports. In addition, U.K. insurance companies arerequired to file regulatory returns with the PRA, which include a revenue account, a profit and loss account and a balance sheetin prescribed forms. Under the Prudential Sourcebooks, audited regulatory returns must be filed with the PRA within twomonths and 15 days of the financial year end (or three months where the delivery of the return is made electronically). Asnoted above, AGE and AGUK also will submit information to the PRA pursuant to Supervisory Statement 4/13, in anticipationof Solvency II requirements.
Supervision of Management
Individuals who perform one or more “controlled functions” such as significant influence functions or the customerfunction within authorized firms must be approved by PRA or FCA (as appropriate) to carry out that function. The managementof insurance companies falls within the scope of significant influence functions, which require approval from the PRA.Individuals performing these functions are “Approved Persons” for the purpose of Part V of FSMA and staff performing thesespecified “controlled functions” within an authorized firm must be approved by the PRA.
Change of Control
Under FSMA, when a person decides to acquire or increase “control” of a U.K. authorized firm (including aninsurance company) they must give the PRA notice in writing before making the acquisition. The PRA has up to 60 workingdays (without including any period of interruption) in which to assess a change of control case. Any person (a company orindividual) that directly or indirectly acquires 10% or 20% (depending on the type of firm, the “Control Percentage Threshold”)or more of the shares, or is entitled to exercise or control the exercise of the Control Percentage Threshold or more of the votingpower, in a U.K. authorized firm or its parent undertaking is considered to “acquire control” of the authorized firm. Broadlyspeaking, the 10% threshold applies to banks, insurers and reinsurers (but not brokers) and MiFID investment firms, and the20% threshold to insurance brokers and certain other firms that are non-directive firms.
0345r4.indd 33 3/19/14 3:27 PM

32
Intervention and Enforcement
The PRA has extensive powers to intervene in the affairs of an authorized firm, culminating in the sanction of thesuspension of authorization to carry on a regulated activity. The PRA can also vary or cancel a firm's permissions under its owninitiative if it considers that the firm is failing, or is likely to fail, to satisfy the Threshold Conditions. FSMA gives the PRAsignificant investigation and enforcement powers. It also gives the PRA a rule-making power, under which it makes the variousrules that constitute its Handbook of Rules.
The PRA also has the power to prosecute criminal offenses arising under FSMA, and the FCA has the power toprosecute offences under FSMA and to prosecute insider dealing under Part V of the Criminal Justice Act of 1993, and breachesby authorized firms of money laundering and terrorist financing regulations.
“Passporting”
EU directives allow AGFOL, AGUK and AGE to conduct business in EU states other than the U.K. where they areauthorized by the PRA or FCA under a single market directive. This right extends to the EEA. A firm taking advantage of aright under a single market directive to conduct business in another EEA state can rely on its "home state" authorization. Thisability to operate in other jurisdictions of the EEA on the basis of home state authorization and supervision is sometimesreferred to as “passporting.” Passporting is not applicable to firms not authorized in the EEA, such as AGM and AGC.Accordingly, the co-insurance model described above cannot be “passported” throughout the EEA. Instead, it is a question oflocal law in each EEA member state as to whether AGM's or AGC’s participation in a co-insurance structure, protectinginsureds or risks located in that jurisdiction, would amount to the conduct of insurance business in that jurisdiction.
Fees and Levies
Each of AGUK, AGE and AGFOL is subject to regulatory fees and levies based on its gross premium income andgross technical liabilities. These fees are collected by the FCA (though they relate to regulation by both the PRA and the FCA).The PRA also requires authorized firms, including authorized insurers, to participate in an investors' protection fund, known asthe Financial Services Compensation Scheme. The Financial Services Compensation Scheme was established to compensateconsumers of financial services firms, including the buyers of insurance, against failures in the financial services industry.Eligible claimants (identified in the Compensation Sourcebook of the PRA Handbook) may be compensated by the FinancialServices Compensation Scheme when an authorized insurer is unable, or likely to be unable, to satisfy policyholder claims.General insurance in class 14 (credit) is not protected by the Financial Services Compensation Scheme, nor is reinsurance inany class; however, other direct insurance classes written by AGUK and AGE are covered (namely, classes 15 (suretyship) and16 (miscellaneous financial loss)).
Material Contracts
AGE's New York affiliate, AGM, currently provides support to AGE through an amended and restated quota share andstop loss reinsurance agreement (the "Reinsurance Agreement") and an amended and restated net worth maintenance agreement(the "Net Worth Agreement"). For transactions closed prior to 2011, AGE typically guaranteed all of the guaranteed obligationsdirectly and AGM reinsured approximately 92% of AGE's retention after cessions to other reinsurers under the quota sharecover of the Reinsurance Agreement. In 2011, AGE implemented a co-guarantee structure pursuant to which AGE directlyguarantees a portion of the guaranteed obligations in an amount equal to what would have been AGE's pro rata retentionpercentage under the quota share cover. AGM directly guarantees the balance of the guaranteed obligations and also provides asecond-to-pay guarantee for AGE's portion of the guaranteed obligations. AGM's ability to provide such direct guarantiesoutside of the U.K. is uncertain. See "Passporting" above.
Under the stop loss cover of the Reinsurance Agreement, AGM is required to make payments to AGE when AGE'sannual net incurred losses and expenses exceeds AGE's annual net earned premium plus any amounts deducted from AGE'sequalization reserve during the year. The stop loss cover has an annual limit of liability equal to 20% of AGE's guaranteed netprincipal amount outstanding at the prior year-end, plus AGE's guaranteed net principal outstanding at the prior year-end ofAGE's two largest transactions.
The quota share and stop loss covers each exclude transactions guaranteed by AGE on or after July 1, 2009 that are notmunicipal, utility, project finance or infrastructure risks or similar types of risks.
Under the Net Worth Agreement, AGM is obligated to cause AGE to maintain capital resources equal to 110% of thegreatest of the amounts as may be required by the PRA as a condition for maintaining its authorization to carry on a financial
0345r4.indd 34 3/19/14 3:27 PM

33
guarantee business in the U.K., provided that contributions (a) do not exceed 35% of AGM's policyholders' surplus asdetermined by the laws of the State of New York, and (b) are in compliance with a provision of the New York Insurance Lawrequiring notice to or approval by the NY DFS for transactions between affiliates that exceed certain thresholds. AGM hasnever been required to make any contributions to AGE's capital under the current Net Worth Agreement or its prior net worthmaintenance agreement.
AGE and AGM have pending a second amended and restated quota share and stop loss reinsurance agreement (the“Second A&R Reinsurance Agreement”) and an second amended and restated net worth maintenance agreement (the "SecondA&R Net Worth Agreement"). These agreements have been approved by the PRA, and Moody’s and S&P have confirmed thattheir implementation will not adversely impact AGE’s or AGM’s ratings. The agreements are under review by the NY DFS, andimplementation awaits NY DFS non-disapproval.
The quota share cover of the Second A&R Reinsurance Agreement is unchanged from that in the ReinsuranceAgreement. The stop loss cover is replaced entirely by an excess of loss cover. Under the excess of loss cover, AGM will payAGE quarterly the amount by which AGE’s incurred losses calculated in accordance with UK GAAP as reported by AGE in itsfinancial returns filed with the PRA and AGE’s paid losses and loss adjustment expenses, in both cases net of all otherperforming reinsurance, exceed AGE’s capital resources under UK law minus of the greatest of the amounts as may be requiredby the PRA as a condition for maintaining its authorization to carry on a financial guarantee business in the U.K. In addition,the Second A&R Reinsurance Agreement adds the following events permitting AGE to terminate to the existing terminationevent of a downgrade of AGM’s ratings by Moody’s below Aa3 or by S&P below AA-: AGM’s insolvency, failure to maintainthe minimum capital required under AGM’s domiciliary jurisdiction, filing a petition in bankruptcy, going into liquidation orrehabilitation or having a receiver appointed. The agreement provides that no amounts are owing under the excess of losscover or the stop loss cover under the Reinsurance Agreement with respect to any quarter ending prior to the effective date ofthe Second A&R Reinsurance Agreement.
AGM’s obligation to pay under the Second A&R Net Worth Agreement is unchanged from that in the Net WorthMaintenance Agreement, except for the addition of a provision clarifying that any amounts due under this agreement shall takeinto account all amounts paid or reasonably expected to be paid under the Second A&R Reinsurance Agreement. In addition,termination provisions substantially similar to those in the Second A&R Reinsurance Agreement have been added.
Tax Matters
Taxation of AGL and Subsidiaries
Bermuda
Under current Bermuda law, there is no Bermuda income, corporate or profits tax or withholding tax, capital gains taxor capital transfer tax payable by AGL or its Bermuda subsidiaries. AGL, AG Re and AGRO have each obtained from theMinister of Finance under the Exempted Undertakings Tax Protection Act 1966, as amended, an assurance that, in the eventthat Bermuda enacts legislation imposing tax computed on profits, income, any capital asset, gain or appreciation, or any tax inthe nature of estate duty or inheritance, then the imposition of any such tax shall not be applicable to AGL, AG Re or AGRO orto any of their operations or their shares, debentures or other obligations, until March 31, 2035. This assurance is subject to theproviso that it is not to be construed so as to prevent the application of any tax or duty to such persons as are ordinarily residentin Bermuda, or to prevent the application of any tax payable in accordance with the provisions of the Land Tax Act 1967 orotherwise payable in relation to any land leased to AGL, AG Re or AGRO. AGL, AG Re and AGRO each pays annual Bermudagovernment fees, and AG Re and AGRO pay annual insurance license fees. In addition, all entities employing individuals inBermuda are required to pay a payroll tax and there are other sundry taxes payable, directly or indirectly, to the Bermudagovernment.
United States
AGL has conducted and intends to continue to conduct substantially all of its foreign operations outside the U.S. andto limit the U.S. contacts of AGL and its foreign subsidiaries (except AGRO and AGE, which have elected to be taxed as U.S.corporations) so that they should not be engaged in a trade or business in the U.S. A foreign corporation, such as AG Re, that isdeemed to be engaged in a trade or business in the United States would be subject to U.S. income tax at regular corporate rates,as well as the branch profits tax, on its income which is treated as effectively connected with the conduct of that trade orbusiness, unless the corporation is entitled to relief under the permanent establishment provision of an applicable tax treaty, asdiscussed below. Such income tax, if imposed, would be based on effectively connected income computed in a mannergenerally analogous to that applied to the income of a U.S. corporation, except that a foreign corporation would generally be
0345r4.indd 35 3/19/14 3:27 PM

34
entitled to deductions and credits only if it timely files a U.S. federal income tax return. AGL, AG Re and certain of the otherforeign subsidiaries have and will continue to file protective U.S. federal income tax returns on a timely basis in order topreserve the right to claim income tax deductions and credits if it is ever determined that they are subject to U.S. federalincome tax. The highest marginal federal income tax rates currently are 35% for a corporation's effectively connected incomeand 30% for the "branch profits" tax.
Under the income tax treaty between the U.S. and the U.K. (the “U.K. Treaty”), AGL would not be subject to U.S.income tax on any income found to be effectively connected with a U.S. trade or business unless that trade or business isconducted through a permanent establishment in the United States. AGL intends to conduct its activities so that it does not havea permanent establishment in the United States. It is AGL's opinion that it will qualify for the benefits of the U.K. Treaty.
Under the income tax treaty between Bermuda and the U.S. (the "Bermuda Treaty"), a Bermuda insurance companywould not be subject to U.S. income tax on income found to be effectively connected with a U.S. trade or business unless thattrade or business is conducted through a permanent establishment in the U.S. AG Re and AGRO currently intend to conducttheir activities so that they do not have a permanent establishment in the U.S.
An insurance enterprise resident in Bermuda generally will be entitled to the benefits of the Bermuda Treaty if(i) more than 50% of its shares are owned beneficially, directly or indirectly, by individual residents of the U.S. or Bermuda orU.S. citizens and (ii) its income is not used in substantial part, directly or indirectly, to make disproportionate distributions to,or to meet certain liabilities of, persons who are neither residents of either the U.S. or Bermuda nor U.S. citizens.
Foreign insurance companies carrying on an insurance business within the U.S. have a certain minimum amount ofeffectively connected net investment income, determined in accordance with a formula that depends, in part, on the amount ofU.S. risk insured or reinsured by such companies. If AG Re or another of the Company's Bermuda subsidiaries is considered tobe engaged in the conduct of an insurance business in the U.S. and is not entitled to the benefits of the Bermuda Treaty ingeneral (because it fails to satisfy one of the limitations on treaty benefits discussed above), the Internal Revenue Code of 1986,as amended (the "Code"), could subject a significant portion of AG Re's or another of the Company's Bermuda subsidiary'sinvestment income to U.S. income tax.
Foreign corporations not engaged in a trade or business in the U.S., and those that are engaged in a U.S. trade orbusiness with respect to their non-effectively connected income are nonetheless subject to U.S. withholding tax on certain"fixed or determinable annual or periodic gains, profits and income" derived from sources within the U.S. (such as dividendsand certain interest on investments), subject to exemption under the Code or reduction by applicable treaties. The standard non-treaty rate of U.S. withholding tax is currently 30%. The Bermuda Treaty does not reduce the U.S. withholding rate on U.S.-sourced investment income. The U.K. Treaty reduces or eliminates U.S. withholding tax on certain U.S. sourced investmentincome (to 5% or 0%), including dividends from U.S. companies to U.K. resident persons entitled to the benefit of the U.K.Treaty.
The U.S. also imposes an excise tax on insurance and reinsurance premiums paid to foreign insurers with respect torisk of a U.S. person located wholly or partly within the U.S. or risks of a foreign person engaged in a trade or business in theU.S. which are located within the U.S. The rates of tax applicable to premiums paid are 4% for direct casualty insurancepremiums and 1% for reinsurance premiums.
AGRO and AGE have elected to be treated as U.S. corporations for all U.S. federal tax purposes and, as such, each ofAGRO and AGE, together with AGL's U.S. subsidiaries, is subject to taxation in the U.S. at regular corporate rates.
If AGRO were to pay dividends to its U.S. holding company parent and that U.S. holding company were to paydividends to its Bermudian parent AG Re, such dividends would be subject to U.S. withholding tax at a rate of 30%.
None of AGL or its principal subsidiaries will be subject to any additional U.S. taxes, including withholding tax, as aresult of AGL becoming a U.K. tax resident.
United Kingdom
In November 2013, AGL became tax resident in the U.K. AGL will remain a Bermuda-based company and itsadministrative and head office functions will continue to be carried on in Bermuda. The AGL common shares will not changeand will continue to be listed on the New York Stock Exchange.
0345r4.indd 36 3/19/14 3:27 PM

35
As a company that is not incorporated in the U.K., AGL will be considered tax resident in the U.K. only if it is“centrally managed and controlled” in the U.K. Central management and control constitutes the highest level of control of acompany’s affairs. Effective November 6, 2013, the AGL board of directors currently intends to manage the affairs of AGL insuch a way as to establish and maintain its status as a company that is tax resident in the U.K.
As a U.K. tax resident company, AGL is subject to the tax rules applicable to companies resident in the U.K.,including the benefits afforded by the U.K.’s tax treaties.
As a U.K. tax resident, AGL is required to file a corporation tax return with Her Majesty’s Revenue & Customs(“HMRC”). AGL will be subject to U.K. corporation tax in respect of its worldwide profits (both income and capital gains),subject to any applicable exemptions. The main rate of corporation tax is 23% currently; such rate will fall to 21% as of April 1,2014 and to 20% as of April 1, 2015. AGL has also registered in the U.K. to report its value added tax (“VAT”) liability. Thecurrent rate of VAT is 20%.
Assured Guaranty does not expect that becoming U.K. tax resident will result in any material change in the group’soverall current tax charge. Assured Guaranty expects that the dividends AGL receives from its direct subsidiaries will beexempt from U.K. corporation tax due to the exemption in section 931D of the U.K. Corporation Tax Act 2009. In addition, anydividends paid by AGL to its shareholders should not be subject to any withholding tax in the U.K. The U.K. governmentimplemented a new tax regime for “controlled foreign companies” ("CFC regime") effective January 1, 2013, stating anintention to target more accurately profits that should be subject to U.K. taxation and to improve the attractiveness of the U.K.as a location for a holding company of a multinational group. The non-U.K. resident subsidiaries intend to operate in such amanner that their profits are outside the scope of the CFC regime charge. Accordingly, Assured Guaranty does not expect anyprofits of non-U.K. resident members of the group to be attributed to AGL and taxed in the U.K. under the CFC regime and hasobtained clearance from HMRC confirming this on the basis of current facts and intentions.
Taxation of Shareholders
Bermuda Taxation
Currently, there is no Bermuda capital gains tax, or withholding or other tax payable on principal, interest or dividendspaid to the holders of the AGL common shares.
United States Taxation
This discussion is based upon the Code, the regulations promulgated thereunder and any relevant administrativerulings or pronouncements or judicial decisions, all as in effect on the date hereof and as currently interpreted, and does nottake into account possible changes in such tax laws or interpretations thereof, which may apply retroactively. This discussiondoes not include any description of the tax laws of any state or local governments within the U.S. or any foreign government.
The following summary sets forth the material U.S. federal income tax considerations related to the purchase,ownership and disposition of AGL's shares. Unless otherwise stated, this summary deals only with holders that are U.S. Persons(as defined below) who purchase their shares and who hold their shares as capital assets within the meaning of section 1221 ofthe Code. The following discussion is only a discussion of the material U.S. federal income tax matters as described herein anddoes not purport to address all of the U.S. federal income tax consequences that may be relevant to a particular shareholder inlight of such shareholder's specific circumstances. For example, special rules apply to certain shareholders, such aspartnerships, insurance companies, regulated investment companies, real estate investment trusts, financial asset securitizationinvestment trusts, dealers or traders in securities, tax exempt organizations, expatriates, persons that do not hold their securitiesin the U.S. dollar, persons who are considered with respect to AGL or any of its foreign subsidiaries as "United Statesshareholders" for purposes of the controlled foreign corporation ("CFC") rules of the Code (generally, a U.S. Person, as definedbelow, who owns or is deemed to own 10% or more of the total combined voting power of all classes of AGL or the stock ofany of AGL's foreign subsidiaries entitled to vote (i.e., 10% U.S. Shareholders)), or persons who hold the common shares aspart of a hedging or conversion transaction or as part of a short-sale or straddle. Any such shareholder should consult their taxadvisor.
If a partnership holds AGL's shares, the tax treatment of the partners will generally depend on the status of the partnerand the activities of the partnership. Partners of a partnership owning AGL's shares should consult their tax advisers.
For purposes of this discussion, the term "U.S. Person" means: (i) a citizen or resident of the U.S., (ii) a partnership orcorporation, created or organized in or under the laws of the U.S., or organized under any political subdivision thereof, (iii) an
0345r4.indd 37 3/19/14 3:27 PM

36
estate the income of which is subject to U.S. federal income taxation regardless of its source, (iv) a trust if either (x) a courtwithin the U.S. is able to exercise primary supervision over the administration of such trust and one or more U.S. Persons havethe authority to control all substantial decisions of such trust or (y) the trust has a valid election in effect to be treated as a U.S.Person for U.S. federal income tax purposes or (v) any other person or entity that is treated for U.S. federal income taxpurposes as if it were one of the foregoing.
Taxation of Distributions. Subject to the discussions below relating to the potential application of the CFC, relatedperson insurance income ("RPII") and passive foreign investment company ("PFIC") rules, cash distributions, if any, made withrespect to AGL's shares will constitute dividends for U.S. federal income tax purposes to the extent paid out of current oraccumulated earnings and profits of AGL (as computed using U.S. tax principles). Dividends paid by AGL to corporateshareholders will not be eligible for the dividends received deduction. To the extent such distributions exceed AGL's earningsand profits, they will be treated first as a return of the shareholder's basis in the common shares to the extent thereof, and thenas gain from the sale of a capital asset.
AGL believes dividends paid by AGL on its common shares to non-corporate holders will be eligible for reduced ratesof tax at the rates applicable to long-term capital gains as "qualified dividend income," provided that AGL is not a PFIC andcertain other requirements, including stock holding period requirements, are satisfied.
Classification of AGL or its Foreign Subsidiaries as a Controlled Foreign Corporation. Each 10% U.S. Shareholder(as defined below) of a foreign corporation that is a CFC for an uninterrupted period of 30 days or more during a taxable year,and who owns shares in the foreign corporation, directly or indirectly through foreign entities, on the last day of the foreigncorporation's taxable year on which it is CFC, must include in its gross income for U.S. federal income tax purposes its pro ratashare of the CFC's "subpart F income," even if the subpart F income is not distributed. "Subpart F income" of a foreigninsurance corporation typically includes foreign personal holding company income (such as interest, dividends and other typesof passive income), as well as insurance and reinsurance income (including underwriting and investment income). A foreigncorporation is considered a CFC if 10% U.S. Shareholders own (directly, indirectly through foreign entities or by attribution byapplication of the constructive ownership rules of section 958(b) of the Code (i.e., "constructively")) more than 50% of the totalcombined voting power of all classes of voting stock of such foreign corporation, or more than 50% of the total value of allstock of such corporation on any day during the taxable year of such corporation. For purposes of taking into account insuranceincome, a CFC also includes a foreign insurance company in which more than 25% of the total combined voting power of allclasses of stock (or more than 25% of the total value of the stock) is owned by 10% U.S. Shareholders, on any day during thetaxable year of such corporation. A "10% U.S. Shareholder" is a U.S. Person who owns (directly, indirectly through foreignentities or constructively) at least 10% of the total combined voting power of all classes of stock entitled to vote of the foreigncorporation. AGL believes that because of the dispersion of AGL's share ownership, provisions in AGL's organizationaldocuments that limit voting power (these provisions are described in "Description of Share Capital") and other factors, no U.S.Person who owns shares of AGL directly or indirectly through one or more foreign entities should be treated as owning(directly, indirectly through foreign entities, or constructively), 10% or more of the total voting power of all classes of shares ofAGL or any of its foreign subsidiaries. It is possible, however, that the Internal Revenue Service ("IRS") could challenge theeffectiveness of these provisions and that a court could sustain such a challenge. In addition, the direct and indirect subsidiariesof AGUS are characterized as CFCs and any subpart F income generated will be included in the gross income of the applicabledomestic subsidiaries in the AGL group.
The RPII CFC Provisions. The following discussion generally is applicable only if the RPII of AG Re or any otherforeign insurance subsidiary that has not made an election under section 953(d) of the Code to be treated as a U.S. corporationfor all U.S. federal tax purposes or are CFCs owned directly or indirectly by AGUS (each a "Foreign Insurance Subsidiary" orcollectively, with AG Re, the "Foreign Insurance Subsidiaries") determined on a gross basis, is 20% or more of the ForeignInsurance Subsidiary's gross insurance income for the taxable year and the 20% Ownership Exception (as defined below) is notmet. The following discussion generally would not apply for any taxable year in which the Foreign Insurance Subsidiary's grossRPII falls below the 20% threshold or the 20% Ownership Exception is met. Although the Company cannot be certain, itbelieves that each Foreign Insurance Subsidiary has been, in prior years of operations, and will be, for the foreseeable future,either below the 20% threshold or in compliance with the requirements of 20% Ownership Exception for each tax year.
RPII is any "insurance income" (as defined below) attributable to policies of insurance or reinsurance with respect towhich the person (directly or indirectly) insured is a "RPII shareholder" (as defined below) or a "related person" (as definedbelow) to such RPII shareholder. In general, and subject to certain limitations, "insurance income" is income (includingpremium and investment income) attributable to the issuing of any insurance or reinsurance contract which would be taxedunder the portions of the Code relating to insurance companies if the income were the income of a domestic insurancecompany. For purposes of inclusion of the RPII of a Foreign Insurance Subsidiary in the income of RPII shareholders, unlessan exception applies, the term "RPII shareholder" means any U.S. Person who owns (directly or indirectly through foreign
0345r4.indd 38 3/19/14 3:27 PM

37
entities) any amount of AGL's common shares. Generally, the term "related person" for this purpose means someone whocontrols or is controlled by the RPII shareholder or someone who is controlled by the same person or persons which control theRPII shareholder. Control is measured by either more than 50% in value or more than 50% in voting power of stock applyingcertain constructive ownership principles. A Foreign Insurance Subsidiary will be treated as a CFC under the RPII provisions ifRPII shareholders are treated as owning (directly, indirectly through foreign entities or constructively) 25% or more of theshares of AGL by vote or value.
RPII Exceptions. The special RPII rules do not apply if (i) at all times during the taxable year less than 20% of thevoting power and less than 20% of the value of the stock of AGL (the "20% Ownership Exception") is owned (directly orindirectly through entities) by persons who are (directly or indirectly) insured under any policy of insurance or reinsuranceissued by a Foreign Insurance Subsidiary or related persons to any such person, (ii) RPII, determined on a gross basis, is lessthan 20% of a Foreign Insurance Subsidiary's gross insurance income for the taxable year (the "20% Gross Income Exception),(iii) a Foreign Insurance Subsidiary elects to be taxed on its RPII as if the RPII were effectively connected with the conduct ofa U.S. trade or business, and to waive all treaty benefits with respect to RPII and meet certain other requirements or (iv) aForeign Insurance Subsidiary elects to be treated as a U.S. corporation and waive all treaty benefits and meet certain otherrequirements. The Foreign Insurance Subsidiaries do not intend to make either of these elections. Where none of theseexceptions applies, each U.S. Person owning or treated as owning any shares in AGL (and therefore, indirectly, in a ForeignInsurance Subsidiary) on the last day of AGL's taxable year will be required to include in its gross income for U.S. federalincome tax purposes its share of the RPII for the portion of the taxable year during which a Foreign Insurance Subsidiary was aCFC under the RPII provisions, determined as if all such RPII were distributed proportionately only to such U.S. Persons atthat date, but limited by each such U.S. Person's share of a Foreign Insurance Subsidiary's current-year earnings and profits asreduced by the U.S. Person's share, if any, of certain prior-year deficits in earnings and profits. The Foreign InsuranceSubsidiaries intend to operate in a manner that is intended to ensure that each qualifies for either the 20% Gross IncomeException or 20% Ownership Exception.
Computation of RPII. For any year in which a Foreign Insurance Subsidiary does not meet the 20% OwnershipException or the 20% Gross Income Exception, AGL may also seek information from its shareholders as to whether beneficialowners of shares at the end of the year are U.S. Persons so that the RPII may be determined and apportioned among suchpersons; to the extent AGL is unable to determine whether a beneficial owner of shares is a U.S. Person, AGL may assume thatsuch owner is not a U.S. Person, thereby increasing the per share RPII amount for all known RPII shareholders. The amount ofRPII includable in the income of a RPII shareholder is based upon the net RPII income for the year after deducting relatedexpenses such as losses, loss reserves and operating expenses. If a Foreign Insurance Subsidiary meets the 20% OwnershipException or the 20% Gross Income Exception, RPII shareholders will not be required to include RPII in their taxable income.
Apportionment of RPII to U.S. Holders. Every RPII shareholder who owns shares on the last day of any taxable yearof AGL in which a Foreign Insurance Subsidiary does not meet the 20% Ownership Exception or the 20% Gross IncomeException should expect that for such year it will be required to include in gross income its share of a Foreign InsuranceSubsidiary's RPII for the portion of the taxable year during which the Foreign Insurance Subsidiary was a CFC under the RPIIprovisions, whether or not distributed, even though it may not have owned the shares throughout such period. A RPIIshareholder who owns shares during such taxable year but not on the last day of the taxable year is not required to include ingross income any part of the Foreign Insurance Subsidiary's RPII.
Basis Adjustments. An RPII shareholder's tax basis in its common shares will be increased by the amount of anyRPII the shareholder includes in income. The RPII shareholder may exclude from income the amount of any distributions byAGL out of previously taxed RPII income. The RPII shareholder's tax basis in its common shares will be reduced by theamount of such distributions that are excluded from income.
Uncertainty as to Application of RPII. The RPII provisions are complex and have never been interpreted by thecourts or the Treasury Department in final regulations; regulations interpreting the RPII provisions of the Code exist only inproposed form. It is not certain whether these regulations will be adopted in their proposed form or what changes orclarifications might ultimately be made thereto or whether any such changes, as well as any interpretation or application ofRPII by the IRS, the courts or otherwise, might have retroactive effect. These provisions include the grant of authority to theTreasury Department to prescribe "such regulations as may be necessary to carry out the purpose of this subsection includingregulations preventing the avoidance of this subsection through cross insurance arrangements or otherwise." Accordingly, themeaning of the RPII provisions and the application thereof to the Foreign Insurance Subsidiaries is uncertain. In addition, theCompany cannot be certain that the amount of RPII or the amounts of the RPII inclusions for any particular RPII shareholder, ifany, will not be subject to adjustment based upon subsequent IRS examination. Any prospective investor which does businesswith a Foreign Insurance Subsidiary and is considering an investment in common shares should consult his tax advisor as to theeffects of these uncertainties.
0345r4.indd 39 3/19/14 3:27 PM

38
Information Reporting. Under certain circumstances, U.S. Persons owning shares (directly, indirectly orconstructively) in a foreign corporation are required to file IRS Form 5471 with their U.S. federal income tax returns.Generally, information reporting on IRS Form 5471 is required by (i) a person who is treated as a RPII shareholder, (ii) a 10%U.S. Shareholder of a foreign corporation that is a CFC for an uninterrupted period of 30 days or more during any tax year ofthe foreign corporation and who owned the stock on the last day of that year; and (iii) under certain circumstances, a U.S.Person who acquires stock in a foreign corporation and as a result thereof owns 10% or more of the voting power or value ofsuch foreign corporation, whether or not such foreign corporation is a CFC. For any taxable year in which AGL determines thatthe 20% Gross Income Exception and the 20% Ownership Exception does not apply, AGL will provide to all U.S. Personsregistered as shareholders of its shares a completed IRS Form 5471 or the relevant information necessary to complete the form.Failure to file IRS Form 5471 may result in penalties. In addition, U.S. shareholders should consult their tax advisors withrespect to other information reporting requirements that may be applicable to them.
For taxable years beginning after March 18, 2010, the Code requires that any individual owning an interest in“specified foreign financial assets,” including an interest in a foreign entity (such as AGL) that is not held in an accountmaintained by a financial institution, the value of which in the aggregate exceeds certain thresholds, attach IRS Form 8938 tohis or her tax return for the year that provides detailed disclosure of such assets. Penalties may be assessed for failure tocomply. Future guidance is expected to provide that certain domestic entities would also be subject to this reportingrequirement in the future.
Tax-Exempt Shareholders. Tax-exempt entities will be required to treat certain subpart F insurance income, includingRPII, that is includible in income by the tax-exempt entity as unrelated business taxable income. Prospective investors that aretax exempt entities are urged to consult their tax advisors as to the potential impact of the unrelated business taxable incomeprovisions of the Code. A tax-exempt organization that is treated as a 10% U.S. Shareholder or a RPII Shareholder also mustfile IRS Form 5471 in certain circumstances.
Dispositions of AGL's Shares. Subject to the discussions below relating to the potential application of the Codesection 1248 and PFIC rules, holders of shares generally should recognize capital gain or loss for U.S. federal income taxpurposes on the sale, exchange or other disposition of shares in the same manner as on the sale, exchange or other dispositionof any other shares held as capital assets. If the holding period for these shares exceeds one year, any gain will be subject to taxat a current maximum marginal tax rate of 20% for individuals and 35% for corporations. Moreover, gain, if any, generally willbe a U.S. source gain and generally will constitute "passive income" for foreign tax credit limitation purposes.
Code section 1248 provides that if a U.S. Person sells or exchanges stock in a foreign corporation and such personowned, directly, indirectly through foreign entities or constructively, 10% or more of the voting power of the corporation at anytime during the five-year period ending on the date of disposition when the corporation was a CFC, any gain from the sale orexchange of the shares will be treated as a dividend to the extent of the CFC's earnings and profits (determined under U.S.federal income tax principles) during the period that the shareholder held the shares and while the corporation was a CFC (withcertain adjustments). The Company believes that because of the dispersion of AGL's share ownership, provisions in AGL'sorganizational documents that limit voting power and other factors that no U.S. shareholder of AGL should be treated asowning (directly, indirectly through foreign entities or constructively) 10% of more of the total voting power of AGL; to theextent this is the case this application of Code Section 1248 under the regular CFC rules should not apply to dispositions ofAGL's shares. It is possible, however, that the IRS could challenge the effectiveness of these provisions and that a court couldsustain such a challenge. A 10% U.S. Shareholder may in certain circumstances be required to report a disposition of shares ofa CFC by attaching IRS Form 5471 to the U.S. federal income tax or information return that it would normally file for thetaxable year in which the disposition occurs. In the event this is determined necessary, AGL will provide a completed IRSForm 5471 or the relevant information necessary to complete the Form. Code section 1248 in conjunction with the RPII rulesalso applies to the sale or exchange of shares in a foreign corporation if the foreign corporation would be treated as a CFC forRPII purposes regardless of whether the shareholder is a 10% U.S. Shareholder or whether the 20% Ownership Exception or20% Gross Income Exception applies. Existing proposed regulations do not address whether Code section 1248 would apply ifa foreign corporation is not a CFC but the foreign corporation has a subsidiary that is a CFC and that would be taxed as aninsurance company if it were a domestic corporation. The Company believes, however, that this application of Codesection 1248 under the RPII rules should not apply to dispositions of AGL's shares because AGL will not be directly engaged inthe insurance business. The Company cannot be certain, however, that the IRS will not interpret the proposed regulations in acontrary manner or that the Treasury Department will not amend the proposed regulations to provide that these rules will applyto dispositions of common shares. Prospective investors should consult their tax advisors regarding the effects of these rules ona disposition of common shares.
0345r4.indd 40 3/19/14 3:28 PM

39
U.S. shareholders of AGL will not be subject to any additional U.S. taxes, including withholding tax, as a result ofAGL becoming U.K. tax resident.
Passive Foreign Investment Companies. In general, a foreign corporation will be a PFIC during a given year if(i) 75% or more of its gross income constitutes "passive income" (the "75% test") or (ii) 50% or more of its assets producepassive income (the "50% test").
If AGL were characterized as a PFIC during a given year, each U.S. Person holding AGL's shares would be subject toa penalty tax at the time of the sale at a gain of, or receipt of an "excess distribution" with respect to, their shares, unless suchperson (i) is a 10% U.S. Shareholder and AGL is a CFC or (ii) made a "qualified electing fund election" or "mark-to-market"election. It is uncertain that AGL would be able to provide its shareholders with the information necessary for a U.S. Person tomake a qualified electing fund election. In addition, if AGL were considered a PFIC, upon the death of any U.S. individualowning common shares, such individual's heirs or estate would not be entitled to a "step-up" in the basis of the common sharesthat might otherwise be available under U.S. federal income tax laws. In general, a shareholder receives an "excessdistribution" if the amount of the distribution is more than 125% of the average distribution with respect to the common sharesduring the three preceding taxable years (or shorter period during which the taxpayer held common shares). In general, thepenalty tax is equivalent to an interest charge on taxes that are deemed due during the period the shareholder owned thecommon shares, computed by assuming that the excess distribution or gain (in the case of a sale) with respect to the commonshares was taken in equal portion at the highest applicable tax rate on ordinary income throughout the shareholder's period ofownership. The interest charge is equal to the applicable rate imposed on underpayments of U.S. federal income tax for suchperiod. In addition, a distribution paid by AGL to U.S. shareholders that is characterized as a dividend and is not characterizedas an excess distribution would not be eligible for reduced rates of tax as qualified dividend income.
For the above purposes, passive income generally includes interest, dividends, annuities and other investment income.The PFIC rules provide that income "derived in the active conduct of an insurance business by a corporation which ispredominantly engaged in an insurance business... is not treated as passive income." The PFIC provisions also contain a look-through rule under which a foreign corporation shall be treated as if it "received directly its proportionate share of theincome..." and as if it "held its proportionate share of the assets..." of any other corporation in which it owns at least 25% of thevalue of the stock.
The insurance income exception is intended to ensure that income derived by a bona fide insurance company is nottreated as passive income, except to the extent such income is attributable to financial reserves in excess of the reasonableneeds of the insurance business. The Company expects, for purposes of the PFIC rules, that each of AGL's insurancesubsidiaries will be predominantly engaged in an insurance business and is unlikely to have financial reserves in excess of thereasonable needs of its insurance business in each year of operations. Accordingly, none of the income or assets of AGL'sinsurance subsidiaries should be treated as passive. Additionally, the Company expects that in each year of operations thepassive income and assets of AGL's non-insurance subsidiaries will not exceed the 75% test or 50% test amounts in each yearof operations with respect to the overall income and assets of AGL and its subsidiaries. Under the look-through rule AGLshould be deemed to own its proportionate share of the assets and to have received its proportionate share of the income of itsdirect and indirect subsidiaries for purposes of the 75% test and the 50% test. As a result, the Company believes that AGL wasnot and should not be treated as a PFIC. The Company cannot be certain, however, as there are currently no regulationsregarding the application of the PFIC provisions to an insurance company and new regulations or pronouncements interpretingor clarifying these rules may be forthcoming, that the IRS will not successfully challenge this position. Prospective investorsshould consult their tax advisor as to the effects of the PFIC rules.
Foreign tax credit. If U.S. Persons own a majority of AGL's common shares, only a portion of the current incomeinclusions, if any, under the CFC, RPII and PFIC rules and of dividends paid by AGL (including any gain from the sale ofcommon shares that is treated as a dividend under section 1248 of the Code) will be treated as foreign source income forpurposes of computing a shareholder's U.S. foreign tax credit limitations. The Company will consider providing shareholderswith information regarding the portion of such amounts constituting foreign source income to the extent such information isreasonably available. It is also likely that substantially all of the "subpart F income," RPII and dividends that are foreign sourceincome will constitute either "passive" or "general" income. Thus, it may not be possible for most shareholders to utilize excessforeign tax credits to reduce U.S. tax on such income.
Information Reporting and Backup Withholding on Distributions and Disposition Proceeds. Information returns maybe filed with the IRS in connection with distributions on AGL's common shares and the proceeds from a sale or otherdisposition of AGL's common shares unless the holder of AGL's common shares establishes an exemption from the informationreporting rules. A holder of common shares that does not establish such an exemption may be subject to U.S. backupwithholding tax on these payments if the holder is not a corporation or non-U.S. Person or fails to provide its taxpayer
0345r4.indd 41 3/19/14 3:28 PM

40
identification number or otherwise comply with the backup withholding rules. The amount of any backup withholding from apayment to a U.S. Person will be allowed as a credit against the U.S. Person's U.S. federal income tax liability and may entitlethe U.S. Person to a refund, provided that the required information is furnished to the IRS.
Changes in U.S. Federal Income Tax Law Could Materially Adversely Affect AGL or AGL'sShareholders. Legislation has been introduced from time to time in the U.S. Congress intended to eliminate certain perceivedtax advantages of companies (including insurance companies) that have legal domiciles outside the U.S. but have certain U.S.connections. For example, legislation has been introduced in Congress to limit the deductibility of reinsurance premiums paidby U.S. companies to foreign affiliates. It is possible that this or similar legislation could be introduced in and enacted by thecurrent Congress or future Congresses that could have an adverse impact on AGL or AGL's shareholders.
Additionally, tax laws and interpretations regarding whether a company is engaged in a U.S. trade or business orwhether a company is a CFC or a PFIC or has RPII are subject to change, possibly on a retroactive basis. There are currently noregulations regarding the application of the PFIC rules to an insurance company. Additionally, the regulations regarding RPIIare still in proposed form. New regulations or pronouncements interpreting or clarifying such rules may be forthcoming. TheCompany cannot be certain if, when or in what form such regulations or pronouncements may be provided and whether suchguidance will have a retroactive effect.
United Kingdom
The following discussion is intended to be only a general guide to certain U.K. tax consequences of holding AGLcommon shares, under current law and the current practice of HMRC, either of which is subject to change at any time, possiblywith retrospective effect. Except where otherwise stated, this discussion applies only to shareholders who are not (and have notrecently been) resident or (in the case of individuals) domiciled for tax purposes in the U.K., who hold their AGL commonshares as an investment and who are the absolute beneficial owners of their common shares. This discussion may not apply tocertain shareholders, such as dealers in securities, life insurance companies, collective investment schemes, shareholders whoare exempt from tax and shareholders who have (or are deemed to have) acquired their shares by virtue of an office oremployment. Such shareholders may be subject to special rules.
The following statements do not purport to be a comprehensive description of all the U.K. considerations that may berelevant to any particular shareholder. Any person who is in any doubt as to their tax position should consult an appropriateprofessional tax adviser.
AGL's Tax Residency. AGL is not incorporated in the U.K., but effective November 6, 2013, the AGL Board ofDirectors currently intends to manage the affairs of AGL in such a way as to establish and maintain its status as a company thatis tax resident in the U.K.
Dividends. Under current U.K. tax law, AGL is not required to withhold tax at source from dividends paid to theholders of the AGL common shares.
Capital gains. U.K. tax is not normally charged on any capital gains realized by non-U.K. shareholders in AGL unless,in the case of a corporate shareholder, at or before the time the gain accrues, the shareholding is used in or for the purposes of atrade carried on by the non-resident shareholder through a permanent establishment in the U.K. or for the purposes of thatpermanent establishment. Similarly, an individual shareholder who carries on a trade, profession or vocation in the U.K.through a branch or agency may be liable for U.K. tax on the gain if such shareholder disposes of shares that are, or have been,used, held or acquired for the purposes of such trade, profession or vocation or for the purposes of such branch or agency. Thistreatment applies regardless of the U.K. tax residence status of AGL.
Stamp Taxes. On the basis that AGL does not currently intend to maintain a share register in the U.K., there should beno U.K. stamp duty reserve tax on a purchase of common shares in AGL. A conveyance or transfer on sale of common sharesin AGL will not be subject to U.K. stamp duty provided that the instrument of transfer is not executed in the U.K. and does notrelate to any property situate, or any matter or thing done, or to be done, in the U.K.
Description of Share Capital
The following summary of AGL's share capital is qualified in its entirety by the provisions of Bermuda law, AGL'smemorandum of association and its Bye-Laws, copies of which are incorporated by reference as exhibits to this Annual Reporton Form 10-K.
0345r4.indd 42 3/19/14 3:28 PM

41
AGL's authorized share capital of $5,000,000 is divided into 500,000,000 shares, par value U.S. $0.01 per share, ofwhich 182,306,886 common shares were issued and outstanding as of February 21, 2014. Except as described below, AGL'scommon shares have no pre-emptive rights or other rights to subscribe for additional common shares, no rights of redemption,conversion or exchange and no sinking fund rights. In the event of liquidation, dissolution or winding-up, the holders of AGL'scommon shares are entitled to share equally, in proportion to the number of common shares held by such holder, in AGL'sassets, if any remain after the payment of all AGL's debts and liabilities and the liquidation preference of any outstandingpreferred shares. Under certain circumstances, AGL has the right to purchase all or a portion of the shares held by ashareholder. See "—Acquisition of Common Shares by AGL" below.
Voting Rights and Adjustments
In general, and except as provided below, shareholders have one vote for each common share held by them and areentitled to vote with respect to their fully paid shares at all meetings of shareholders. However, if, and so long as, the commonshares (and other of AGL's shares) of a shareholder are treated as "controlled shares" (as determined pursuant to section 958 ofthe Code) of any U.S. Person and such controlled shares constitute 9.5% or more of the votes conferred by AGL's issued andoutstanding shares, the voting rights with respect to the controlled shares owned by such U.S. Person shall be limited, in theaggregate, to a voting power of less than 9.5% of the voting power of all issued and outstanding shares, under a formulaspecified in AGL's Bye-laws. The formula is applied repeatedly until there is no U.S. Person whose controlled shares constitute9.5% or more of the voting power of all issued and outstanding shares and who generally would be required to recognizeincome with respect to AGL under the Code if AGL were a controlled foreign corporation as defined in the Code and if theownership threshold under the Code were 9.5% (as defined in AGL's Bye-Laws as a "9.5% U.S. Shareholder"). In addition,AGL's Board of Directors may determine that shares held carry different voting rights when it deems it appropriate to do so to(i) avoid the existence of any 9.5% U.S. Shareholder; and (ii) avoid adverse tax, legal or regulatory consequences to AGL orany of its subsidiaries or any direct or indirect holder of shares or its affiliates. "Controlled shares" includes, among otherthings, all shares of AGL that such U.S. Person is deemed to own directly, indirectly or constructively (within the meaning ofsection 958 of the Code). Further, these provisions do not apply in the event one shareholder owns greater than 75% of thevoting power of all issued and outstanding shares.
Under these provisions, certain shareholders may have their voting rights limited to less than one vote per share, whileother shareholders may have voting rights in excess of one vote per share. Moreover, these provisions could have the effect ofreducing the votes of certain shareholders who would not otherwise be subject to the 9.5% limitation by virtue of their directshare ownership. AGL's Bye-laws provide that it will use its best efforts to notify shareholders of their voting interests prior toany vote to be taken by them.
AGL's Board of Directors is authorized to require any shareholder to provide information for purposes of determiningwhether any holder's voting rights are to be adjusted, which may be information on beneficial share ownership, the names ofpersons having beneficial ownership of the shareholder's shares, relationships with other shareholders or any other facts AGL'sBoard of Directors may deem relevant. If any holder fails to respond to this request or submits incomplete or inaccurateinformation, AGL's Board of Directors may eliminate the shareholder's voting rights. All information provided by theshareholder will be treated by AGL as confidential information and shall be used by AGL solely for the purpose of establishingwhether any 9.5% U.S. Shareholder exists and applying the adjustments to voting power (except as otherwise required byapplicable law or regulation).
Restrictions on Transfer of Common Shares
AGL's Board of Directors may decline to register a transfer of any common shares under certain circumstances,including if they have reason to believe that any adverse tax, regulatory or legal consequences to the Company, any of itssubsidiaries or any of its shareholders or indirect holders of shares or its Affiliates may occur as a result of such transfer (otherthan such as AGL's Board of Directors considers de minimis). Transfers must be by instrument unless otherwise permitted bythe Companies Act.
The restrictions on transfer and voting restrictions described above may have the effect of delaying, deferring orpreventing a change in control of Assured Guaranty.
Acquisition of Common Shares by AGL
Under AGL's Bye-Laws and subject to Bermuda law, if AGL's Board of Directors determines that any ownership ofAGL's shares may result in adverse tax, legal or regulatory consequences to AGL, any of AGL's subsidiaries or any of AGL'sshareholders or indirect holders of shares or its Affiliates (other than such as AGL's Board of Directors considers de minimis),
0345r4.indd 43 3/19/14 3:28 PM

42
AGL has the option, but not the obligation, to require such shareholder to sell to AGL or to a third party to whom AGL assignsthe repurchase right the minimum number of common shares necessary to avoid or cure any such adverse consequences at aprice determined in the discretion of the Board of Directors to represent the shares' fair market value (as defined in AGL's Bye-Laws).
Other Provisions of AGL's Bye-Laws
AGL's Board of Directors and Corporate Action
AGL's Bye-Laws provide that AGL's Board of Directors shall consist of not less than three and not more than 21directors, the exact number as determined by the Board of Directors. AGL's Board of Directors consists of eleven persons whoare elected for annual terms.
Shareholders may only remove a director for cause (as defined in AGL's Bye-Laws) at a general meeting, providedthat the notice of any such meeting convened for the purpose of removing a director shall contain a statement of the intention todo so and shall be provided to that director at least two weeks before the meeting. Vacancies on the Board of Directors can befilled by the Board of Directors if the vacancy occurs in those events set out in AGL's Bye-Laws as a result of death, disability,disqualification or resignation of a director, or from an increase in the size of the Board of Directors.
Generally under AGL's Bye-Laws, the affirmative votes of a majority of the votes cast at any meeting at which aquorum is present is required to authorize a resolution put to vote at a meeting of the Board of Directors, including one relatingto a merger, acquisition or business combination. Corporate action may also be taken by a unanimous written resolution of theBoard of Directors without a meeting. A quorum shall be at least one-half of directors then in office present in person orrepresented by a duly authorized representative, provided that at least two directors are present in person.
Shareholder Action
At the commencement of any general meeting, two or more persons present in person and representing, in person orby proxy, more than 50% of the issued and outstanding shares entitled to vote at the meeting shall constitute a quorum for thetransaction of business. In general, any questions proposed for the consideration of the shareholders at any general meetingshall be decided by the affirmative votes of a majority of the votes cast in accordance with the Bye-Laws.
The Bye-Laws contain advance notice requirements for shareholder proposals and nominations for directors, includingwhen proposals and nominations must be received and the information to be included.
Amendment
The Bye-Laws may be amended only by a resolution adopted by the Board of Directors and by resolution of theshareholders.
Voting of Non-U.S. Subsidiary Shares
If AGL is required or entitled to vote at a general meeting of any of AG Re, AGFOL or any other of its directly heldnon-U.S. subsidiaries, AGL's Board of Directors shall refer the subject matter of the vote to AGL's shareholders and seekdirection from such shareholders as to how they should vote on the resolution proposed by the non-U.S. subsidiary. AGL'sBoard of Directors in its discretion shall require substantially similar provisions are or will be contained in the bye-laws (orequivalent governing documents) of any direct or indirect non-U.S. subsidiaries other than U.K. and AGRO.
Employees
As of December 31, 2013, the Company had 326 employees. None of the Company's employees are subject tocollective bargaining agreements. The Company believes that employee relations are satisfactory.
0345r4.indd 44 3/19/14 3:28 PM

43
Available Information
The Company maintains an Internet web site at www.assuredguaranty.com. The Company makes available, free ofcharge, on its web site (under assuredguaranty.com/sec-filings) the Company's annual report on Form 10-K, quarterly reportson Form 10-Q, current reports on Form 8-K, and amendments to those reports filed or furnished pursuant to Section 13 (a) or15 (d) of the Exchange Act as soon as reasonably practicable after the Company files such material with, or furnishes it to, theSEC. The Company also makes available, free of charge, through its web site (under assuredguaranty.com/governance) links tothe Company's Corporate Governance Guidelines, its Code of Conduct, AGL's Bye-Laws and the charters for its Boardcommittees.
The Company routinely posts important information for investors on its web site (underassuredguaranty.com/company-statements and, more generally, under the Investor Information and Businesses pages). TheCompany uses this web site as a means of disclosing material information and for complying with its disclosure obligationsunder SEC Regulation FD (Fair Disclosure). Accordingly, investors should monitor the Company Statements, InvestorInformation and Businesses portions of the Company's web site, in addition to following the Company's press releases, SECfilings, public conference calls, presentations and webcasts.
The information contained on, or that may be accessed through, the Company's web site is not incorporated byreference into, and is not a part of, this report.
0345r4.indd 45 3/19/14 3:28 PM

44
ITEM 1A. RISK FACTORS
You should carefully consider the following information, together with the information contained in AGL's otherfilings with the SEC. The risks and uncertainties discussed below are not the only ones the Company faces. However, these arethe risks that the Company's management believes are material. The Company may face additional risks or uncertainties thatare not presently known to the Company or that management currently deems immaterial, and such risks or uncertainties alsomay impair its business or results of operations. The risks discussed below could result in a significant or material adverseeffect on the Company's financial condition, results of operations, liquidity or business prospects.
Risks Related to the Company's Expected Losses
Estimates of expected losses are subject to uncertainties and may not be adequate to cover potential paid claims.
The financial guaranties issued by the Company's insurance subsidiaries insure the credit performance of theguaranteed obligations over an extended period of time, in some cases over 30 years, and in most circumstances, the Companyhas no right to cancel such financial guaranties. As a result, the Company's estimate of ultimate losses on a policy is subject tosignificant uncertainty over the life of the insured transaction. Credit performance can be adversely affected by economic, fiscaland financial market variability over the long duration of most contracts. If the Company's actual losses exceed its currentestimate, this may result in adverse effects on the Company's financial condition, results of operations, liquidity, businessprospects, financial strength ratings and ability to raise additional capital.
In addition, if the Company is required to make claim payments, even if it is reimbursed in full over time and does notexperience ultimate loss on a particular policy, such claim payments would reduce the Company's invested assets and result inreduced liquidity and net investment income. If the amount of claim payments is significant, the Company's ability to makeother claim payments and its financial condition, financial strength ratings and business prospects could be adversely affected.
The Company has exposure to infrastructure transactions with refinancing risk as to which the Company may need tomake claim payments that it did not anticipate paying when the policies were issued. Although the Company may notexperience ultimate loss on a particular transaction, the aggregate amount of the claim payments may be substantial andreimbursement may not occur for an extended time, if at all. As of December 31, 2013, the Company's insured exposure to suchtransactions was approximately $3.0 billion. The transactions generally involve long-term infrastructure projects that werefinanced by bonds that mature prior to the expiration of the project concession. The Company expected the cash flows fromthese projects to be sufficient to repay all of the debt over the life of the project concession, but also expected the debt to berefinanced in the market at or prior to its maturity. Due to market conditions, the Company may have to pay a claim when thedebt matures, and then recover its payment from cash flows produced by the project in the future. The Company generallyprojects that in most scenarios it will be fully reimbursed for such payments. However, the recovery of the payments isuncertain and may take a long time, ranging from 10 to 35 years, depending on the transaction and the performance of theunderlying collateral. For the Company's two largest transactions with significant refinancing risk, assuming no refinancing, theCompany estimates, based on certain performance assumptions, that total claims could be $1.8 billion on a gross basis; suchclaims would be payable from 2017 through 2022.
The determination of expected loss is an inherently subjective process involving numerous estimates, assumptions andjudgments by management, using both internal and external data sources with regard to frequency, severity of loss, economicprojections and other factors that affect credit performance. The Company does not use traditional actuarial approaches todetermine its estimates of expected losses. Actual losses will ultimately depend on future events or transaction performance. Asa result, the Company's current estimates of probable and estimable losses may not reflect the Company's future ultimate claimspaid.
Certain sectors within the Company's insured portfolio have experienced losses far in excess of initial expectations.The Company's loss experience, particularly in respect of its insured RMBS transactions, demonstrated the limited value ofhistorical loss data in predicting future losses. The Company's expected loss models take into account current and expectedfuture trends in loss severities, which for RMBS transactions, contemplate the impact of current and probable foreclosureliquidation expectations, default rates, prepayment speeds, the impact of governmental economic and consumer stimulationprograms and other factors impacting the transactional cash flows and ultimately losses. These factors, which are integralelements of the Company's reserve estimation methodology, are updated on a quarterly basis based on current U.S. RMBSperformance data. The Company's net par outstanding as of December 31, 2013 and December 31, 2012 for U.S. RMBS was$13.7 billion and $17.0 billion, respectively, of which $7.7 billion and $9.8 billion, respectively, was rated below investmentgrade under the Company's rating methodology. For a discussion of the Company's review of its RMBS transactions, see
0345r4.indd 46 3/19/14 3:28 PM

45
"Item 7. Management's Discussion and Analysis of Financial Condition and Results of Operations—Results of Operations—Consolidated Results of Operations—Losses in the Insured Portfolio."
Risks Related to the Company's Financial Strength and Financial Enhancement Ratings
A downgrade of the financial strength or financial enhancement ratings of any of the Company's insurance andreinsurance subsidiaries would adversely affect its business and prospects and, consequently, its results of operations andfinancial condition.
The financial strength and financial enhancement ratings assigned by S&P, Moody's and Kroll to the Company'sinsurance and reinsurance subsidiaries represent the rating agencies' opinions of the insurer's financial strength and ability tomeet ongoing obligations to policyholders and cedants in accordance with the terms of the financial guaranties it has issued orthe reinsurance agreements it has executed. The ratings also reflect qualitative factors, such as the rating agencies' opinion of aninsurer's business strategy and franchise value, the anticipated future demand for its product, the composition of its insuredportfolio, and its capital adequacy, profitability and financial flexibility. Issuers, investors, underwriters, credit derivativecounterparties, ceding companies and others consider the Company's financial strength or financial enhancement ratings animportant factor when deciding whether or not to utilize a financial guaranty or purchase reinsurance from the Company'sinsurance or reinsurance subsidiaries. A downgrade by a rating agency of the financial strength or financial enhancementratings of one or more of the Company's subsidiaries could impair the Company's financial condition, results of operation,liquidity, business prospects or other aspects of the Company's business.
The ratings assigned by the rating agencies that publish financial strength or financial enhancement ratings on theCompany's insurance subsidiaries are subject to frequent review and may be lowered by a rating agency as a result of a numberof factors, including, but not limited to, the rating agency's revised stress loss estimates for the Company's insurance portfolio,adverse developments in the Company's or the subsidiaries' financial conditions or results of operations due to underwriting orinvestment losses or other factors, changes in the rating agency's outlook for the financial guaranty industry or in the markets inwhich the Company operates, or a revision in the rating agency's capital model or ratings methodology. Their reviews can occurat any time and without notice to the Company and could result in a decision to downgrade, revise or withdraw the financialstrength or financial enhancement ratings of AGL's insurance and reinsurance subsidiaries.
Since 2008, each of S&P and Moody's has reviewed and downgraded the financial strength ratings of AGL's insuranceand reinsurance subsidiaries, including AGC, AGM and AG Re. In addition, S&P and Moody's have from time to time changedthe ratings outlook for certain of the Company's subsidiaries to "negative" from "stable" or have placed such ratings on watchfor possible downgrade. For example, in March 2012, Moody's placed the ratings of AGL and its subsidiaries, including thefinancial strength ratings of AGL's insurance subsidiaries, on review for possible downgrade. Moody's did not complete itsreview until January 2013, when Moody's downgraded the financial strength ratings of AGM and AGC from Aa3 to A2 and A3,respectively, and that of AG Re from A1 to Baa1. In February 2014, Moody's affirmed the financial strength ratings andoutlooks of AGM and AGC, and affirmed AG Re's financial strength rating but changed AG Re's outlook to negative, citing itsvulnerability to adverse developments within its insured portfolio.
The Company believes that S&P and Moody's actions and proposals have reduced the Company's new businessopportunities and have also affected the value of the Company's product to issuers and investors. The insurance subsidiaries'financial strength ratings are an important competitive factor in the financial guaranty insurance and reinsurance markets. If thefinancial strength or financial enhancement ratings of one or more of the Company's insurance subsidiaries were reduced belowcurrent levels, the Company expects that would reduce the number of transactions that would benefit from the Company'sinsurance; consequently, a downgrade could harm the Company's new business production, results of operations and financialcondition.
In addition, a downgrade may have a negative impact on the Company in respect of transactions that it has insured orreinsurance that it has assumed. For example, a downgrade of one of the Company's insurance subsidiaries may result inincreased claims under financial guaranties such subsidiary has issued. Under variable rate demand obligations insured byAGM, further downgrades past rating levels specified in the transaction documents could result in the municipal obligor payinga higher rate of interest and in such obligations amortizing on a more accelerated basis than expected when the obligationsoriginally were issued; if the municipal obligor is unable to make such interest or principal payments, AGM may receive aclaim under its financial guaranty. Under interest rate swaps insured by AGM, further downgrades past specified rating levelscould entitle the municipal obligor's swap counterparty to terminate the swap; if the municipal obligor owed a terminationpayment as a result and were unable to make such payment, AGM may receive a claim if its financial guaranty guaranteed suchtermination payment. For more information about increased claim payments the Company may potentially make, see Note 7,
0345r4.indd 47 3/19/14 3:28 PM

46
Financial Guaranty Insurance Losses, of the Financial Statements and Supplementary Data, Ratings Impact on FinancialGuaranty Business. In certain other transactions, beneficiaries of financial guaranties issued by the Company's insurancesubsidiaries may have the right to cancel the credit protection offered by the Company, which would result in the loss of futurepremium earnings and the reversal of any fair value gains recorded by the Company. In addition, a downgrade of AG Re orAGC could result in certain ceding companies recapturing business that they had ceded to these reinsurers. See "Thedowngrade of the financial strength ratings of AG Re or of AGC gives certain reinsurance counterparties the right to recaptureceded business, which would lead to a reduction in the Company's unearned premium reserve and related earnings on suchreserve" below.
If AGC's financial strength or financial enhancement ratings were downgraded, the Company could be required to postadditional collateral under certain of its credit derivative contracts or certain of the Company's counterparties could have a rightto terminate such credit derivative contract. See "If AGC's financial strength or financial enhancement ratings weredowngraded, the Company could be required to make termination payments or post collateral under certain of its creditderivative contracts, which could impair its liquidity, results of operations and financial condition" below.
If AGM's financial strength or financial enhancement ratings were downgraded, AGM-insured GICs issued by theformer AGMH subsidiaries that conducted AGMH's Financial Products Business (the "Financial Products Companies") maycome due or may come due absent the provision of collateral by the GIC issuers. The Company relies on agreements pursuantto which Dexia has agreed to guarantee or lend certain amounts, or to post liquid collateral, in regards to AGMH's formerfinancial products business. See "Risks Related to the AGMH Acquisition—The Company has exposure to credit and liquidityrisks from Dexia."
Furthermore, if the financial strength ratings of AGE or AGUK were downgraded, AGM or AGC may be required tocontribute additional capital to their respective subsidiary pursuant to the terms of the support arrangements for suchsubsidiaries, including those described under "Material Contracts" in the "Regulation—United Kingdom" section of "Item 1.Business."
If AGC's financial strength or financial enhancement ratings were downgraded, the Company could be required to maketermination payments or post collateral under certain of its credit derivative contracts, which could impair its liquidity,results of operations and financial condition.
Within the Company’s insured CDS portfolio, the transaction documentation for approximately $1.7 billion in CDSgross par insured as of December 31, 2013 provides that a downgrade of AGC's financial strength rating below BBB- or Baa3would constitute a termination event that would allow the relevant CDS counterparty to terminate the affected transactions. Asof December 31, 2012, such amount was $2.0 billion. If the CDS counterparty elected to terminate the affected transactions,AGC could be required to make a termination payment (or may be entitled to receive a termination payment from the CDScounterparty). The Company does not believe that it can accurately estimate the termination payments AGC could be requiredto make if, as a result of any such downgrade, a CDS counterparty terminated the affected transactions. These payments couldhave a material adverse effect on the Company’s liquidity and financial condition.
The transaction documentation for approximately $10.3 billion in CDS gross par insured as of December 31, 2013requires certain of the Company's insurance subsidiaries to post eligible collateral to secure its obligations to make paymentsunder such contracts. Eligible collateral is generally cash or U.S. government or agency securities; eligible collateral other thancash is valued at a discount to the face amount. For approximately $9.9 billion of such contracts, AGC has negotiated caps suchthat the posting requirement cannot exceed a certain fixed amount, regardless of the mark-to-market valuation of the exposureor the financial strength ratings of AGC. For such contracts, AGC need not post on a cash basis more than $665 million,although the value of the collateral posted may exceed such fixed amount depending on the advance rate agreed with thecounterparty for the particular type of collateral posted. For the remaining approximately $347 million of such contracts, theCompany could be required from time to time to post additional collateral without such cap based on movements in the mark-to-market valuation of the underlying exposure. As of December 31, 2013, the Company was posting approximately $677million to secure obligations under its CDS exposure, of which approximately $62 million related to such $347 million ofnotional. As of December 31, 2012, the Company was posting approximately $728 million, of which approximately $68million related to $400 million of notional where AGC or AGRO could be required to post additional collateral based onmovements in the mark-to-market valuation of the underlying exposure.
0345r4.indd 48 3/19/14 3:28 PM

47
The downgrade of the financial strength ratings of AG Re or of AGC gives certain reinsurance counterparties the right torecapture ceded business, which would lead to a reduction in the Company's unearned premium reserve and relatedearnings on such reserve.
The downgrade of the financial strength ratings of AG Re or of AGC gives certain reinsurance counterparties the rightto recapture ceded business, which would lead to a reduction in the Company's unearned premium reserve and related earningson such reserve. With respect to a significant portion of the Company's in-force financial guaranty assumed business, based onAG Re's and AGC's current ratings and subject to the terms of each reinsurance agreement, the third party ceding company mayhave the right to recapture assumed business ceded to AG Re and/or AGC, and in connection therewith, to receive paymentfrom the assuming reinsurer of an amount equal to the reinsurer’s statutory unearned premium (net of ceding commissions) andstatutory loss reserves (if any) associated with that business, plus, in certain cases, an additional ceding commission. As ofDecember 31, 2013, if each third party company ceding business to AG Re and/or AGC had a right to recapture such business,and chose to exercise such right, the aggregate amounts that AG Re and AGC could be required to pay to all such companieswould be approximately $293 million and $61 million, respectively.
Actions taken by the rating agencies with respect to capital models and rating methodology of the Company's business orchanges in capital charges or downgrades of transactions within its insured portfolio may adversely affect its ratings,business prospects, results of operations and financial condition.
The rating agencies from time to time have evaluated the Company's capital adequacy under a variety of scenarios andassumptions. The rating agencies do not always supply clear guidance on their approach to assessing the Company's capitaladequacy and the Company may disagree with the rating agencies' approach and assumptions. For example, S&P and Moody'sassess each individual credit (including potential new credits) insured by the Company based on a variety of factors, includingthe nature of the credit, the nature of the support or credit enhancement for the credit, its tenor, and its expected and actualperformance. This assessment determines the amount of capital the Company is required to maintain against that credit tomaintain its financial strength ratings under the relevant rating agency's capital adequacy model. Factors influencing the ratingagencies are beyond management's control and not always known to the Company. In the event of an actual or perceiveddeterioration in creditworthiness, or a change in a rating agency's capital model or rating methodology, that rating agency mayrequire the Company to increase the amount of capital allocated to support the affected credits, regardless of whether lossesactually occur, or against potential new business. Significant reductions in the rating agencies' assessments of credits in theCompany's insured portfolio can produce significant increases in the amount of capital required for the Company to maintainits financial strength ratings under the rating agencies' capital adequacy models, which may require the Company to seekadditional capital. The amount of such capital required may be substantial, and may not be available to the Company onfavorable terms and conditions or at all. Accordingly, the Company cannot ensure that it will seek to, or be able to, raiseadditional capital. The failure to raise additional required capital could result in a downgrade of the Company's ratings and thushave an adverse impact on its business, results of operations and financial condition. See "Risks Related to the Company'sCapital and Liquidity Requirements—The Company may require additional capital from time to time, including from softcapital and liquidity credit facilities, which may not be available or may be available only on unfavorable terms."
Since 2009, Moody's and S&P have downgraded a number of structured finance securities and public finance bonds,including obligations that the Company insures. Additional obligations in the Company's insured portfolio may be reviewedand downgraded in the future. Downgrades of the Company's insured credits will result in higher capital requirements for theCompany under the relevant rating agency capital adequacy model. If the additional amount of capital required to support suchexposures is significant, the Company may need to undertake certain actions in order to maintain its ratings, including, but notlimited to, raising additional capital (which, if available, may not be available on terms and conditions that are favorable to theCompany); curtailing new business; or paying to transfer a portion of its in-force business to generate rating agency capital. Ifthe Company is unable to complete any of these capital initiatives, it could suffer ratings downgrades. These capital actions orratings downgrades could adversely affect the Company's results of operations, financial condition, ability to write newbusiness or competitive positioning.
Risks Related to the Financial, Credit and Financial Guaranty Markets
Improvement in the recent difficult conditions in the U.S. and world-wide financial markets has been gradual, and theCompany's business, liquidity, financial condition and stock price may continue to be adversely affected.
The Company's loss reserves, profitability, financial position, insured portfolio, investment portfolio, cash flow,statutory capital and stock price could be materially affected by the U.S. and global markets. Upheavals in the financial marketsaffect economic activity and employment and therefore can affect the Company's business. The global economic outlookremains uncertain, including the overall growth rate of the U.S. economy, the fragile economic recovery in Europe and the
0345r4.indd 49 3/19/14 3:28 PM

48
impact of the gradual tightening of global monetary conditions on emerging markets. These and other risks could materiallyand negatively affect the Company’s ability to access the capital markets, the cost of the Company's debt, the demand for itsproducts, the amount of losses incurred on transactions it guarantees, the value of its investment portfolio, its financial ratingsand the price of its common shares.
Some of the state and local governments and entities that issue obligations the Company insures are experiencingunprecedented budget deficits and revenue shortfalls that could result in increased credit losses or impairments and capitalcharges on those obligations.
State and local governments that issue some of the obligations the Company insures have experienced significantbudget deficits and revenue collection shortfalls that required them to significantly raise taxes and/or cut spending in order tosatisfy their obligations. While the U.S. government has provided some financial support and although overall state revenueshave increased in recent years, significant budgetary pressures remain, especially at the local government level. Certain localgovernments, including ones that have issued obligations insured by the Company, have sought protection from creditors underChapter 9 of the U.S. Bankruptcy Code as a means of restructuring their outstanding debt. If the issuers of the obligations in theCompany's public finance portfolio do not have sufficient funds to cover their expenses and are unable or unwilling to raisetaxes, decrease spending or receive federal assistance, the Company may experience increased levels of losses or impairmentson its public finance obligations, which could materially and adversely affect its business, financial condition and results ofoperations.
The Company's risk of loss on and capital charges for municipal credits could also be exacerbated by rating agencydowngrades of municipal credit ratings. A downgraded municipal issuer may be unable to refinance maturing obligations orissue new debt, which could reduce the municipality's ability to service its debt. Downgrades could also affect the interest ratethat the municipality must pay on its variable rate debt or for new debt issuance. Municipal credit downgrades, as with otherdowngrades, result in an increase in the capital charges the rating agencies assess when evaluating the Company's capitaladequacy in their rating models. Significant municipal downgrades could result in higher capital requirements for the Companyin order to maintain its financial strength ratings.
One governmental entity with significant economic challenges that the Company is closely following is theCommonwealth of Puerto Rico. Although recent announcements and actions by the current Governor and his administrationindicate officials of the Commonwealth are focused on measures that are intended to help Puerto Rico operate within itsfinancial resources and maintain its access to the capital markets, Puerto Rico faces high debt levels, a declining population andan economy that has been in recession since 2006. Puerto Rico has been operating with a structural budget deficit in recentyears, and its two largest pension funds are significantly underfunded. In February 2014, S&P, Moody's and Fitch Ratingsdowngraded much of the debt of Puerto Rico and its related authorities and public corporations to below investment grade,citing various factors including limited liquidity and market access risk. Although Puerto Rico has not defaulted on any of itsdebt payments and is presently current on debt service payments for the $5.4 billion net par insured by the Company, if theCompany were required to make claim payments on such insured exposure, such payments could have a negative effect on theCompany's liquidity and results of operations. Neither Puerto Rico nor its related authorities and public corporations areeligible debtors under Chapter 9 of the U.S. Bankruptcy Code.
In addition, obligations supported by specified revenue streams, such as revenue bonds issued by toll road authorities,municipal utilities or airport authorities, may be adversely affected by revenue declines resulting from reduced demand,changing demographics or other factors associated with an economy in which unemployment remains high, housing priceshave not yet stabilized and growth is slow. These obligations, which may not necessarily benefit from financial support fromother tax revenues or governmental authorities, may also experience increased losses if the revenue streams are insufficient topay scheduled interest and principal payments.
Changes in interest rate levels and credit spreads could adversely affect demand for financial guaranty insurance as well asthe Company's financial condition.
Demand for financial guaranty insurance generally fluctuates with changes in market credit spreads. Credit spreads,which are based on the difference between interest rates on high-quality or "risk free" securities versus those on lower-rated oruninsured securities, fluctuate due to a number of factors and are sensitive to the absolute level of interest rates, current creditexperience and investors' risk appetite. Within the last five years, interest rates in the U.S. had been at historically low levels.Although interest rates did rise somewhat in 2013, they are expected to remain low for the near future. When interest rates arelow, or when the market is relatively less risk averse, the credit spread between high-quality or insured obligations versuslower- rated or uninsured obligations typically narrows. As a result, financial guaranty insurance typically provides lowerinterest cost savings to issuers than it would during periods of relatively wider credit spreads. When issuers are less likely to
0345r4.indd 50 3/19/14 3:28 PM
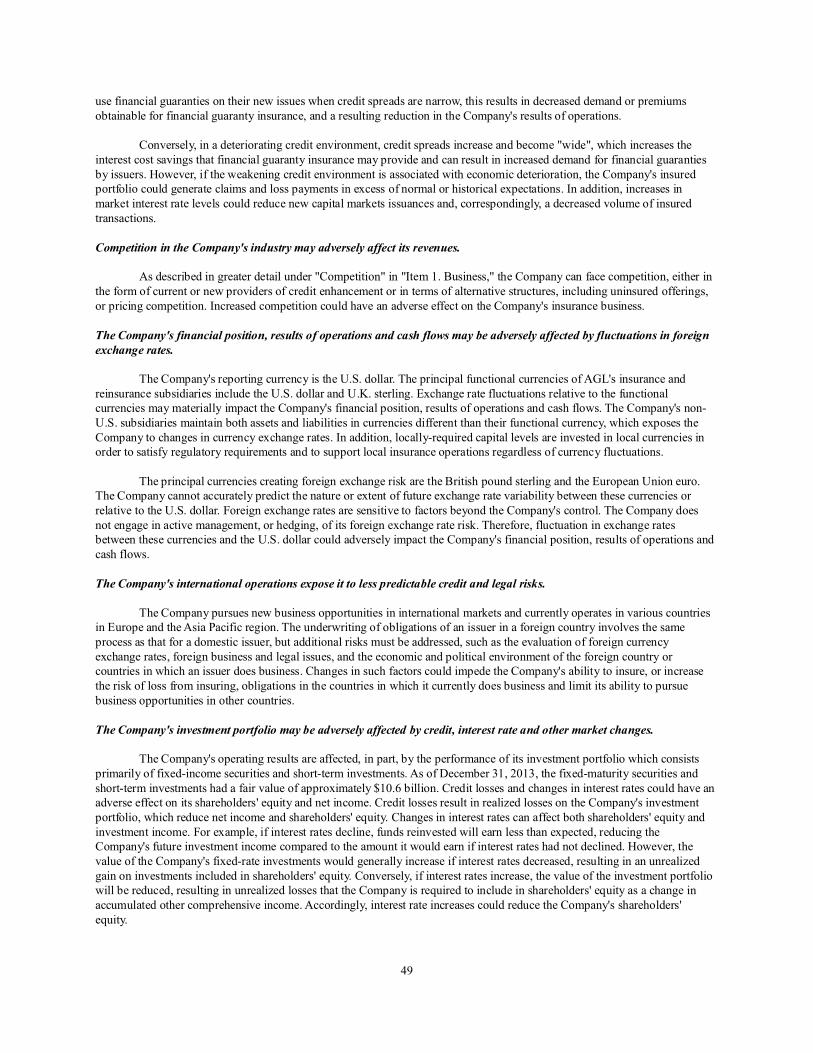
49
use financial guaranties on their new issues when credit spreads are narrow, this results in decreased demand or premiumsobtainable for financial guaranty insurance, and a resulting reduction in the Company's results of operations.
Conversely, in a deteriorating credit environment, credit spreads increase and become "wide", which increases theinterest cost savings that financial guaranty insurance may provide and can result in increased demand for financial guarantiesby issuers. However, if the weakening credit environment is associated with economic deterioration, the Company's insuredportfolio could generate claims and loss payments in excess of normal or historical expectations. In addition, increases inmarket interest rate levels could reduce new capital markets issuances and, correspondingly, a decreased volume of insuredtransactions.
Competition in the Company's industry may adversely affect its revenues.
As described in greater detail under "Competition" in "Item 1. Business," the Company can face competition, either inthe form of current or new providers of credit enhancement or in terms of alternative structures, including uninsured offerings,or pricing competition. Increased competition could have an adverse effect on the Company's insurance business.
The Company's financial position, results of operations and cash flows may be adversely affected by fluctuations in foreignexchange rates.
The Company's reporting currency is the U.S. dollar. The principal functional currencies of AGL's insurance andreinsurance subsidiaries include the U.S. dollar and U.K. sterling. Exchange rate fluctuations relative to the functionalcurrencies may materially impact the Company's financial position, results of operations and cash flows. The Company's non-U.S. subsidiaries maintain both assets and liabilities in currencies different than their functional currency, which exposes theCompany to changes in currency exchange rates. In addition, locally-required capital levels are invested in local currencies inorder to satisfy regulatory requirements and to support local insurance operations regardless of currency fluctuations.
The principal currencies creating foreign exchange risk are the British pound sterling and the European Union euro.The Company cannot accurately predict the nature or extent of future exchange rate variability between these currencies orrelative to the U.S. dollar. Foreign exchange rates are sensitive to factors beyond the Company's control. The Company doesnot engage in active management, or hedging, of its foreign exchange rate risk. Therefore, fluctuation in exchange ratesbetween these currencies and the U.S. dollar could adversely impact the Company's financial position, results of operations andcash flows.
The Company's international operations expose it to less predictable credit and legal risks.
The Company pursues new business opportunities in international markets and currently operates in various countriesin Europe and the Asia Pacific region. The underwriting of obligations of an issuer in a foreign country involves the sameprocess as that for a domestic issuer, but additional risks must be addressed, such as the evaluation of foreign currencyexchange rates, foreign business and legal issues, and the economic and political environment of the foreign country orcountries in which an issuer does business. Changes in such factors could impede the Company's ability to insure, or increasethe risk of loss from insuring, obligations in the countries in which it currently does business and limit its ability to pursuebusiness opportunities in other countries.
The Company's investment portfolio may be adversely affected by credit, interest rate and other market changes.
The Company's operating results are affected, in part, by the performance of its investment portfolio which consistsprimarily of fixed-income securities and short-term investments. As of December 31, 2013, the fixed-maturity securities andshort-term investments had a fair value of approximately $10.6 billion. Credit losses and changes in interest rates could have anadverse effect on its shareholders' equity and net income. Credit losses result in realized losses on the Company's investmentportfolio, which reduce net income and shareholders' equity. Changes in interest rates can affect both shareholders' equity andinvestment income. For example, if interest rates decline, funds reinvested will earn less than expected, reducing theCompany's future investment income compared to the amount it would earn if interest rates had not declined. However, thevalue of the Company's fixed-rate investments would generally increase if interest rates decreased, resulting in an unrealizedgain on investments included in shareholders' equity. Conversely, if interest rates increase, the value of the investment portfoliowill be reduced, resulting in unrealized losses that the Company is required to include in shareholders' equity as a change inaccumulated other comprehensive income. Accordingly, interest rate increases could reduce the Company's shareholders'equity.
0345r4.indd 51 3/19/14 3:28 PM

50
Interest rates are highly sensitive to many factors, including monetary policies, domestic and international economicand political conditions and other factors beyond the Company's control. The Company does not engage in active management,or hedging, of interest rate risk, and may not be able to mitigate interest rate sensitivity effectively.
The market value of the investment portfolio also may be adversely affected by general developments in the capitalmarkets, including decreased market liquidity for investment assets, market perception of increased credit risk with respect tothe types of securities held in the portfolio, downgrades of credit ratings of issuers of investment assets and/or foreign exchangemovements which impact investment assets. In addition, the Company invests in securities insured by other financialguarantors, the market value of which may be affected by the rating instability of the relevant financial guarantor.
Risks Related to the Company's Capital and Liquidity Requirements
The Company may require additional capital from time to time, including from soft capital and liquidity credit facilities,which may not be available or may be available only on unfavorable terms.
The Company's capital requirements depend on many factors, primarily related to its in-force book of business andrating agency capital requirements. The Company needs liquid assets to make claim payments on its insured portfolio and towrite new business. For example, as discussed in the Risk Factor captioned "Estimates of expected losses are subject touncertainties and may not be adequate to cover potential paid claims" under Risks Related to the Company's Expected Losses,the Company has substantial exposure to infrastructure transactions with refinancing risk as to which the Company may need tomake large claim payments that it did not anticipate paying when the policies were issued. Failure to raise additional capital asneeded may result in the Company being unable to write new business and may result in the ratings of the Company and itssubsidiaries being downgraded by one or more ratings agency. The Company's access to external sources of financing, as wellas the cost of such financing, is dependent on various factors, including the market supply of such financing, the Company'slong-term debt ratings and insurance financial strength ratings and the perceptions of its financial strength and the financialstrength of its insurance subsidiaries. The Company's debt ratings are in turn influenced by numerous factors, such as financialleverage, balance sheet strength, capital structure and earnings trends. If the Company's need for capital arises because ofsignificant losses, the occurrence of these losses may make it more difficult for the Company to raise the necessary capital.
Future capital raises for equity or equity-linked securities could also result in dilution to the Company's shareholders.In addition, some securities that the Company could issue, such as preferred stock or securities issued by the Company'soperating subsidiaries, may have rights, preferences and privileges that are senior to those of its common shares.
Financial guaranty insurers and reinsurers typically rely on providers of lines of credit, credit swap facilities andsimilar capital support mechanisms (often referred to as "soft capital") to supplement their existing capital base, or "hardcapital." The ratings of soft capital providers directly affect the level of capital credit which the rating agencies give theCompany when evaluating its financial strength. The Company currently maintains soft capital facilities with providers havingratings adequate to provide the Company's desired capital credit. For example, effective January 1, 2014, AGC, AGM andMAC entered into a $450 million aggregate excess of loss reinsurance facility that covers certain U.S. public finance creditsinsured or reinsured by those companies. However, no assurance can be given that the Company will be able to renew anyexisting soft capital facilities or that one or more of the rating agencies will not downgrade or withdraw the applicable ratingsof such providers in the future. In addition, the Company may not be able to replace a downgraded soft capital provider with anacceptable replacement provider for a variety of reasons, including if an acceptable replacement provider is willing to providethe Company with soft capital commitments or if any adequately-rated institutions are actively providing soft capital facilities.Furthermore, the rating agencies may in the future change their methodology and no longer give credit for soft capital, whichmay necessitate the Company having to raise additional capital in order to maintain its ratings.
An increase in the Company's subsidiaries' leverage ratio may prevent them from writing new insurance.
Insurance regulatory authorities impose capital requirements on the Company's insurance subsidiaries. These capitalrequirements, which include leverage ratios and surplus requirements, may limit the amount of insurance that the Company'ssubsidiaries may write. The Company's insurance subsidiaries have several alternatives available to control their leverageratios, including obtaining capital contributions from the Company, purchasing reinsurance or entering into other lossmitigation agreements, or reducing the amount of new business written. However, a material reduction in the statutory capitaland surplus of a subsidiary, whether resulting from underwriting or investment losses, a change in regulatory capitalrequirements or otherwise, or a disproportionate increase in the amount of risk in force, could increase a subsidiary's leverageratio. This in turn could require that subsidiary to obtain reinsurance for existing business (which may not be available, or maybe available on terms that the Company considers unfavorable), or add to its capital base to maintain its financial strengthratings. Failure to maintain regulatory capital levels could limit that subsidiary's ability to write new business.
0345r4.indd 52 3/19/14 3:28 PM

51
The Company's holding companies' ability to meet its obligations may be constrained.
Each of AGL, AGUS and AGMH is a holding company and, as such, has no direct operations of its own. None of theholding companies expects to have any significant operations or assets other than its ownership of the shares of its subsidiaries.
The insurance company subsidiaries’ ability to pay dividends and make other payments depends, among other things,upon their financial condition, results of operations, cash requirements, and compliance with rating agency requirements, and isalso subject to restrictions contained in the insurance laws and related regulations of their states of domicile. Restrictionsapplicable to AGC and AGM, and to AG Re and AGRO, are described under the "Regulation—United States—State DividendLimitations" and "Regulation—Bermuda—Restrictions on Dividends and Distributions" sections of “Item 1. Business.” Suchdividends and permitted payments are expected to be the primary source of funds for the holding companies to meet ongoingcash requirements, including operating expenses, any future debt service payments and other expenses, and to pay dividends totheir respective shareholders. Accordingly, if the insurance subsidiaries cannot pay sufficient dividends or make other permittedpayments at the times or in the amounts that are required, that would have an adverse effect on the ability of AGL, AGUS andAGMH to satisfy their ongoing cash requirements and on their ability to pay dividends to shareholders.
If AGL does not pay dividends, the only return on an investment in AGL's shares, if at all, would come from anyappreciation in the price of the common shares. Previously, dividends paid to AGL from a U.S. subsidiary would have beensubject to a 30% withholding tax. After AGL became tax resident in the United Kingdom, as described under “Tax Matters” in“Item 1. Business,” it became subject to the tax rules applicable to companies resident in the U.K., including the benefitsafforded by the U.K.’s tax treaties. The income tax treaty between the U.K. and the U.S. reduces or eliminates the U.S.withholding tax on certain U.S. sourced investment income (to 5% or 0%), including dividends from U.S. subsidiaries to U.K.resident persons entitled to the benefits of the treaty.
If AGRO were to pay dividends to its U.S. holding company parent and that U.S. holding company were to paydividends to its Bermudian parent AG Re, such dividends would be subject to U.S. withholding tax at a rate of 30%.
The ability of AGL and its subsidiaries to meet their liquidity needs may be limited.
Each of AGL, AGUS and AGMH requires liquidity, either in the form of cash or in the ability to easily sell investmentassets for cash, in order to meet its payment obligations, including, without limitation, its operating expenses, interest on debtand dividends on common shares, and to make capital investments in operating subsidiaries. The Company's operatingsubsidiaries require substantial liquidity in order to meet their respective payment and/or collateral posting obligations,including under financial guaranty insurance policies, CDS contracts or reinsurance agreements. They also require liquidity topay operating expenses, reinsurance premiums, dividends to AGUS or AGMH for debt service and dividends to the Company,as well as, where appropriate, to make capital investments in their own subsidiaries. The Company cannot give any assurancethat the liquidity of AGL and its subsidiaries will not be adversely affected by adverse market conditions, changes in insuranceregulatory law or changes in general economic conditions.
AGL anticipates that its liquidity needs will be met by the ability of its operating subsidiaries to pay dividends or tomake other payments; external financings; investment income from its invested assets; and current cash and short-terminvestments. The Company expects that its subsidiaries' need for liquidity will be met by the operating cash flows of suchsubsidiaries; external financings; investment income from their invested assets; and proceeds derived from the sale of itsinvestment portfolio, a significant portion of which is in the form of cash or short-term investments. All of these sources ofliquidity are subject to market, regulatory or other factors that may impact the Company's liquidity position at any time. Asdiscussed above, AGL's insurance subsidiaries are subject to regulatory and rating agency restrictions limiting their ability todeclare and to pay dividends and make other payments to AGL. As further noted above, external financing may or may not beavailable to AGL or its subsidiaries in the future on satisfactory terms.
In addition, investment income at AGL and its subsidiaries may fluctuate based on interest rates, defaults by theissuers of the securities AGL or its subsidiaries hold in their respective investment portfolios, or other factors that the Companydoes not control. Finally, the value of the Company's investments may be adversely affected by changes in interest rates, creditrisk and capital market conditions and therefore may adversely affect the Company's potential ability to sell investmentsquickly and the price which the Company might receive for those investments.
0345r4.indd 53 3/19/14 3:28 PM

52
Risks Related to the AGMH Acquisition
The Company has exposure to credit and liquidity risks from Dexia.
Dexia and the Company have entered into a number of agreements intended to protect the Company from having topay claims on AGMH's former Financial Products Business, which the Company did not acquire. Dexia has agreed toguarantee certain amounts, lend certain amounts or post liquid collateral for or in respect of AGMH's former Financial ProductsBusiness. Dexia SA and Dexia Crédit Local S.A. ("DCL"), jointly and severally, have also agreed to indemnify the Companyfor losses associated with AGMH's former Financial Products Business, including the ongoing Department of Justiceinvestigations of such business. Furthermore, DCL, acting through its New York Branch, is providing a liquidity facility inorder to make loans to AGM to finance the payment of claims under certain financial guaranty insurance policies issued byAGM or its affiliate that relate to the equity portion of leveraged lease transactions insured by AGM. The equity portion of theleveraged lease transactions is part of AGMH's financial guaranty business, which the Company did acquire. However, inconnection with the AGMH Acquisition, DCL agreed to provide AGM with a liquidity facility so that AGM could fund itspayment of claims made under financial guaranty policies issued in respect of this portion of the business, because the amountof such claims could be large and are generally payable within a short time after AGM receives them. On February 7, 2014,AGM reduced the size of the liquidity facility by $460 million to approximately $500 million, after taking into account itsexperience with its exposure to leveraged lease transactions to date. For a description of the agreements entered into with Dexiaand a further discussion of the risks that these agreements are intended to protect against, see "Item 7. Management'sDiscussion and Analysis of Financial Condition and Results of Operations—Liquidity and Capital Resources—LiquidityArrangements with respect to AGMH's former Financial Products Business."
Despite the execution of such documentation, the Company remains subject to the risk that Dexia may not makepayments or securities available (a) on a timely basis, which is referred to as "liquidity risk," or (b) at all, which is referred to as"credit risk," because of the risk of default. Even if Dexia has sufficient assets to pay, lend or post as collateral all amountswhen due, concerns regarding Dexia's financial condition or willingness to comply with its obligations could cause one or morerating agencies to view negatively the ability or willingness of Dexia to perform under its various agreements and couldnegatively affect the Company's ratings.
AGMH and its subsidiaries could be subject to non-monetary consequences arising out of litigation associated withAGMH's former financial products business, which the Company did not acquire.
As noted under "Item 3. Legal Proceedings—Proceedings Related to AGMH's Former Financial Products Business,"in November 2006, AGMH received a subpoena from the Antitrust Division of the Department of Justice issued in connectionwith an ongoing criminal investigation of bid rigging of awards of municipal GICs and other municipal derivatives. Althoughthe subpoena relates to AGMH's former Financial Products Business, which the Company did not acquire, it was issued toAGMH, which the Company did acquire. Furthermore, while Dexia SA and DCL, jointly and severally, have agreed toindemnify the Company against liability arising out of these proceedings, such indemnification might not be sufficient to fullyhold the Company harmless against any injunctive relief or civil or criminal sanction that is imposed against AGMH or itssubsidiaries.
Risks Related to the Company's Business
The Company's financial guaranty products may subject it to significant risks from individual or correlated credits.
The Company is exposed to the risk that issuers of debt that it insures or other counterparties may default in theirfinancial obligations, whether as a result of insolvency, lack of liquidity, operational failure or other reasons. Similarly, theCompany could be exposed to corporate credit risk if a corporation's securities are contained in a portfolio of collateralized debtobligations ("CDOs") it insures, or if the corporation or financial institution is the originator or servicer of loans, mortgages orother assets backing structured securities that the Company has insured.
In addition, because the Company insures or reinsures municipal bonds, it can have significant exposures to singlemunicipal risks (i.e, the Commonwealth of Puerto Rico). While the Company's risk of a complete loss, where it would have topay the entire principal amount of an issue of bonds and interest thereon with no recovery, is generally lower than for corporatecredits as most municipal bonds are backed by tax or other revenues, there can be no assurance that a single default by amunicipality would not have a material adverse effect on its results of operations or financial condition.
The Company's ultimate exposure to a single name may exceed its underwriting guidelines, and an event with respectto a single name may cause a significant loss. The Company seeks to reduce this risk by managing exposure to large single
0345r4.indd 54 3/19/14 3:28 PM

53
risks, as well as concentrations of correlated risks, through tracking its aggregate exposure to single names in its various linesof business, establishing underwriting criteria to manage risk aggregations. It has also in the past obtained third partyreinsurance for such exposure. The Company may insure and has insured individual public finance and asset-backed risks wellin excess of $1 billion. Should the Company's risk assessments prove inaccurate and should the applicable limits proveinadequate, the Company could be exposed to larger than anticipated losses, and could be required by the rating agencies tohold additional capital against insured exposures whether or not downgraded by the rating agencies.
The Company is exposed to correlation risk across the various assets the Company insures. During periods of strongmacroeconomic performance, stress in an individual transaction generally occurs in a single asset class or for idiosyncraticreasons. During a broad economic downturn, a wider range of the Company's insured portfolio could be exposed to stress at thesame time. This stress may manifest itself in ratings downgrades, which may require more capital, or in actual losses. Inaddition, while the Company has experienced catastrophic events in the past without material loss, unexpected catastrophicevents may have a material adverse effect upon the Company's insured portfolio and/or its investment portfolios.
Some of the Company's direct financial guaranty products may be riskier than traditional financial guaranty insurance.
As of December 31, 2013 and 2012, 13% and 15%, respectively, of the Company's financial guaranty direct exposureswere executed as credit derivatives. Traditional financial guaranty insurance provides an unconditional and irrevocableguaranty that protects the holder of a municipal finance or structured finance obligation against non-payment of principal andinterest, while credit derivatives provide protection from the occurrence of specified credit events, including non-payment ofprincipal and interest. In general, the Company structures credit derivative transactions such that circumstances giving rise toits obligation to make payments are similar to that for financial guaranty policies and generally occur when issuers fail to makepayments on the underlying reference obligations. The tenor of credit derivatives exposures, like exposure under financialguaranty insurance policies, is also generally for as long as the reference obligation remains outstanding.
Nonetheless, credit derivative transactions are governed by International Swaps and Derivatives Association, Inc.("ISDA") documentation and operate differently from financial guaranty insurance policies. For example, the Company'scontrol rights with respect to a reference obligation under a credit derivative may be more limited than when it issues afinancial guaranty insurance policy on a direct primary basis. In addition, a credit derivative may be terminated for a breach ofthe ISDA documentation or other specific events, unlike financial guaranty insurance policies. In some of the Company's creditderivative transactions with one counterparty, one such specified event is the failure of AGC to maintain specified financialstrength ratings. If the counterparty were to terminate the credit derivative transactions, the Company could be required tomake a termination payment as determined under the ISDA documentation. In addition, under a limited number of creditderivative contracts, the Company may be required to post eligible securities as collateral, generally cash or U.S. governmentor agency securities, under specified circumstances. The need to post collateral under many of these transactions is subject tocaps that the Company has negotiated with its counterparties, but there are some transactions as to which the Company couldbe required to post collateral without such a cap based on movements in the mark-to-market valuation of the underlyingexposure in excess of contractual thresholds. See "Risks Related to the Company's Financial Strength and FinancialEnhancement Ratings—If AGC's financial strength or financial enhancement ratings were downgraded, the Company could berequired to make termination payments or post collateral under certain of its credit derivative contracts, which could impair itsliquidity, results of operations and financial condition."
Further downgrades of one or more of the Company's reinsurers could reduce the Company's capital adequacy and returnon equity. The impairment of other financial institutions also could adversely affect the Company.
At December 31, 2013, the Company had ceded approximately 6% of its principal amount of insurance outstanding tothird party reinsurers. In evaluating the credits insured by the Company, securities rating agencies allow capital charge "credit"for reinsurance based on the reinsurers' ratings. In recent years, a number of the Company's reinsurers were downgraded by oneor more rating agencies, resulting in decreases in the credit allowed for reinsurance and in the financial benefits of usingreinsurance under existing rating agency capital adequacy models. Many of the Company's reinsurers have already beendowngraded to single-A or below by one or more rating agencies. The Company could be required to raise additional capital toreplace the lost reinsurance credit in order to satisfy rating agency and regulatory capital adequacy and single risk requirements.The rating agencies' reduction in credit for reinsurance could also ultimately reduce the Company's return on equity to theextent that ceding commissions paid to the Company by the reinsurers were not adequately increased to compensate for theeffect of any additional capital required. In addition, downgraded reinsurers may default on amounts due to the Company andsuch reinsurer obligations may not be adequately collateralized, resulting in additional losses to the Company and a reductionin its shareholders' equity and net income.
0345r4.indd 55 3/19/14 3:28 PM

54
The Company also has exposure to counterparties in various industries, including banks, hedge funds and otherinvestment vehicles in its insured transactions. Many of these transactions expose the Company to credit risk in the event itscounterparty fails to perform its obligations.
The Company is dependent on key executives and the loss of any of these executives, or its inability to retain other keypersonnel, could adversely affect its business.
The Company's success substantially depends upon its ability to attract and retain qualified employees and upon theability of its senior management and other key employees to implement its business strategy. The Company believes there areonly a limited number of available qualified executives in the business lines in which the Company competes. Although theCompany is not aware of any planned departures, the Company relies substantially upon the services of Dominic J. Frederico,President and Chief Executive Officer, and other executives. Although the Company has designed its executive compensationwith the goal of retaining and incentivizing its executive officers, the Company may not be successful in retaining theirservices. The loss of the services of any of these individuals or other key members of the Company's management team couldadversely affect the implementation of its business strategy.
Risks Related to GAAP and Applicable Law
Changes in the fair value of the Company's insured credit derivatives portfolio may subject net income to volatility.
The Company is required to mark-to-market certain derivatives that it insures, including CDS that are consideredderivatives under GAAP. Although there is no cash flow effect from this "marking-to-market," net changes in the fair value ofthe derivative are reported in the Company's consolidated statements of operations and therefore affect its reported earnings. Asa result of such treatment, and given the large principal balance of the Company's CDS portfolio, small changes in the marketpricing for insurance of CDS will generally result in the Company recognizing material gains or losses, with material marketprice increases generally resulting in large reported losses under GAAP. Accordingly, the Company's GAAP earnings will bemore volatile than would be suggested by the actual performance of its business operations and insured portfolio.
The fair value of a credit derivative will be affected by any event causing changes in the credit spread ( i.e., thedifference in interest rates between comparable securities having different credit risk) on an underlying security referenced inthe credit derivative. Common events that may cause credit spreads on an underlying municipal or corporate securityreferenced in a credit derivative to fluctuate include changes in the state of national or regional economic conditions, industrycyclicality, changes to a company's competitive position within an industry, management changes, changes in the ratings of theunderlying security, movements in interest rates, default or failure to pay interest, or any other factor leading investors to reviseexpectations about the issuer's ability to pay principal and interest on its debt obligations. Similarly, common events that maycause credit spreads on an underlying structured security referenced in a credit derivative to fluctuate may include theoccurrence and severity of collateral defaults, changes in demographic trends and their impact on the levels of creditenhancement, rating changes, changes in interest rates or prepayment speeds, or any other factor leading investors to reviseexpectations about the risk of the collateral or the ability of the servicer to collect payments on the underlying assets sufficientto pay principal and interest. The fair value of credit derivative contracts also reflects the change in the Company's own creditcost, based on the price to purchase credit protection on AGC and AGM. For discussion of the Company's fair valuemethodology for credit derivatives, see Note 8, Fair Value Measurement, of the Financial Statements and Supplementary Data.
If a credit derivative is held to maturity and no credit loss is incurred, any unrealized gains or losses previouslyreported would be offset as the transactions reach maturity. Due to the complexity of fair value accounting and the applicationof GAAP requirements, future amendments or interpretations of relevant accounting standards may cause the Company tomodify its accounting methodology in a manner which may have an adverse impact on its financial results.
Change in industry and other accounting practices could impair the Company's reported financial results and impede itsability to do business.
Changes in or the issuance of new accounting standards, as well as any changes in the interpretation of currentaccounting guidance, may have an adverse effect on the Company's reported financial results, including future revenues, andmay influence the types and/or volume of business that management may choose to pursue.
Changes in or inability to comply with applicable law could adversely affect the Company's ability to do business.
The Company’s businesses are subject to direct and indirect regulation under state insurance laws, federal securities,commodities and tax laws affecting public finance and asset backed obligations, and federal regulation of derivatives, as well as
0345r4.indd 56 3/19/14 3:28 PM

55
applicable laws in the other countries in which the Company operates. Future legislative, regulatory, judicial or other legalchanges in the jurisdictions in which the Company does business may adversely affect its ability to pursue its current mix ofbusiness, thereby materially impacting its financial results by, among other things, limiting the types of risks it may insure,lowering applicable single or aggregate risk limits, increasing required reserves or capital, increasing the level of supervision orregulation to which the Company’s operations may be subject, imposing restrictions that make the Company’s products lessattractive to potential buyers, lowering the profitability of the Company’s business activities, requiring the Company to changecertain of its business practices and exposing it to additional costs (including increased compliance costs).
In particular, regulations under the Dodd-Frank Act impose requirements on activities that AGL's subsidiaries mayengage in that involve “swaps,” as defined under that Act. Although final product rules published by the CFTC and SEC inAugust 2012 established an insurance safe-harbor that provides that AGM’s and AGC's financial guaranty insurance policiesare not generally deemed swaps under the Dodd-Frank Act and are therefore not subject to regulation under the Act as swaps,regulations under the Act could require certain of AGL's subsidiaries to register with the CFTC or the SEC as a “major swapparticipant” (“MSP”) or “major security-based swap participant” (“MSBSP”), respectively, as a result of either the legacyfinancial guaranty insurance policies and derivatives portfolios or new activities. MSPs or MSBSPs would need to satisfy theregulatory capital requirements of the applicable agency and would be subject to additional compliance requirements. TheCompany has analyzed the exposures created by its legacy financial guaranty insurance policies and derivatives portfolio anddetermined its subsidiaries do not need to register as an MSP with the CFTC at this time, based on the historical sizes of thoseexposures. However, in the event such swap exposure exceeds the triggers, then one or more of AGL's subsidiaries may berequired to register as an MSP with the CFTC. The SEC has not adopted final rules for MSBSP registration yet, but when suchrules are issued, one or more of AGL's subsidiaries may be required to register as an MSBSP with the SEC. In addition, certainof AGL's subsidiaries may need to post margin with respect to either future or legacy derivative transactions when rules relatingto margin take effect. While the CFTC and SEC have indicated that they do not intend to require margin for legacy derivativetransactions, when the CFTC and SEC adopt margin requirements, it is possible the CFTC and SEC will take the position thatamendments to existing swaps will cause the amended swaps to be treated as new swaps for purposes of these margin rules andcertain other new regulatory requirements. Such an expansion of the margin and other regulatory requirements to amendmentsof existing swaps may impede the Company's ability to amend insured derivative transactions in connection with lossmitigation efforts or municipal refunding transactions. The magnitude of capital and/or margin requirements could besubstantial and, as discussed in “Risks Related to the Company's Capital and Liquidity Requirements —The Company mayrequire additional capital from time to time, including from soft capital and liquidity credit facilities, which may not beavailable or may be available only on unfavorable terms,” there can be no assurance that the Company will be able to obtain, orobtain on favorable terms, such additional capital as may be required by the Dodd-Frank Act.
Furthermore, pursuant to the Dodd-Frank Act, the FSOC has been charged with identifying certain non-bank financialcompanies to be subject to supervision by the Board of Governors of the Federal Reserve System. In a parallel internationalprocess, the IAIS, which has been identifying GSIIs, published a proposed assessment methodology that deemed financialguaranty insurance to be an activity that poses increased systemic risk relative to more traditional insurance activities. TheCompany does not at this time expect to be designated as a SIFI by the FSOC or a GSII by the IAIS, but the Company's statuscould change pursuant to new criteria from the FSOC or the IAIS.
In addition, a Federal Insurance Office (“FIO”) has been established to develop federal policy relating to insurancematters. The FIO is conducting a study for submission to the U.S. Congress on how to modernize and improve insuranceregulation in the U.S. Moreover, various federal regulatory agencies have proposed and adopted additional regulations infurtherance of the Dodd-Frank Act provisions. To the extent these or other requirements ultimately apply to the Company, theycould require the Company to change how it conducts and manages its business, including subjecting it to higher capitalrequirements, and could adversely affect it.
The foregoing requirements, as well as others that could be applied to the Company as a result of the legislation, couldlimit the Company’s ability to conduct certain lines of business and/or subject the Company to enhanced business conductstandards and/or otherwise adversely affect its future results of operations. Because many provisions of the Dodd-Frank Act arebeing implemented through agency rulemaking processes, a number of which have not been completed, the Company'sassessment of the legislation’s impact on its business remains uncertain and is subject to change.
In addition, the decline in the financial strength of many financial guaranty insurers has caused government officials toexamine the suitability of some of the complex securities guaranteed by financial guaranty insurers. For example, the New YorkDepartment of Financial Services ("NY DFS") had announced that it would develop new rules and regulations for the financialguaranty industry. On September 22, 2008, the NY DFS issued Circular Letter No. 19 (2008) (the “Circular Letter”), whichestablished best practices guidelines for financial guaranty insurers effective January 1, 2009. Although the Company is not
0345r4.indd 57 3/19/14 3:28 PM

56
aware of any current efforts by the NY DFS to propose legislation to formalize these guidelines, any such legislation may limitthe amount of new structured finance business that AGC may write.
Furthermore, if the Company fails to comply with applicable insurance laws and regulations it could be exposed tofines, the loss of insurance licenses, limitations on the right to originate new business and restrictions on its ability to paydividends, all of which could have an adverse impact on its business results and prospects. If an insurance company’s surplusdeclines below minimum required levels, the insurance regulator could impose additional restrictions on the insurer or initiateinsolvency proceedings. AGC and AGM may increase surplus by various means, including obtaining capital contributions fromthe Company, purchasing reinsurance or entering into other loss mitigation arrangements, reducing the amount of new businesswritten or obtaining regulatory approval to release contingency reserves. From time to time, AGM and AGC have obtainedapproval from their regulators to release contingency reserves based on losses and, in the case of AGM, also based on theexpiration of its insured exposure.
From time to time, legislators have called for changes to the Internal Revenue Code in order to limit or eliminate theFederal income tax exclusion for municipal bond interest. Such a change is expected to increase the cost of borrowing for stateand local governments, and as a result, to cause a decrease in infrastructure spending by states and municipalities.Municipalities may issue a lower volume of bonds, and in particular may be less likely to refund existing debt, in which case,the amount of bonds that can benefit from insurance might also be reduced.
AGL's ability to pay dividends may be constrained by certain insurance regulatory requirements and restrictions.
AGL is subject to Bermuda regulatory requirements that affect its ability to pay dividends on common shares and tomake other payments. Under the Bermuda Companies Act 1981, as amended, AGL may declare or pay a dividend only if it hasreasonable grounds for believing that it is, and after the payment would be, able to pay its liabilities as they become due, and ifthe realizable value of its assets would not be less than its liabilities. While AGL currently intends to pay dividends on itscommon shares, investors who require dividend income should carefully consider these risks before investing in AGL. Inaddition, if, pursuant to the insurance laws and related regulations of Bermuda, Maryland and New York, AGL's insurancesubsidiaries cannot pay sufficient dividends to AGL at the times or in the amounts that it requires, it would have an adverseeffect on AGL's ability to pay dividends to shareholders. See "Risks Related to the Company's Capital and LiquidityRequirements—The ability of AGL and its subsidiaries to meet their liquidity needs may be limited."
Applicable insurance laws may make it difficult to effect a change of control of AGL.
Before a person can acquire control of a U.S. or U.K. insurance company, prior written approval must be obtainedfrom the insurance commissioner of the state or country where the insurer is domiciled. Because a person acquiring 10% ormore of AGL's common shares would indirectly control the same percentage of the stock of its U.S. insurance companysubsidiaries, the insurance change of control laws of Maryland, New York and the U.K. would likely apply to such atransaction. These laws may discourage potential acquisition proposals and may delay, deter or prevent a change of control ofAGL, including through transactions, and in particular unsolicited transactions, that some or all of its shareholders mightconsider to be desirable. While AGL's Bye-Laws limit the voting power of any shareholder to less than 10%, we cannot assureyou that the applicable regulatory body would agree that a shareholder who owned 10% or more of its common shares did notcontrol the applicable insurance company subsidiary, notwithstanding the limitation on the voting power of such shares.
Risks Related to Taxation
Changes in U.S. tax laws could reduce the demand or profitability of financial guaranty insurance, or negatively impact theCompany's investment portfolio.
Any material change in the U.S. tax treatment of municipal securities, the imposition of a national sales tax or a flattax in lieu of the current federal income tax structure in the U.S., or changes in the treatment of dividends, could adverselyaffect the market for municipal obligations and, consequently, reduce the demand for financial guaranty insurance andreinsurance of such obligations.
Changes in U.S. federal, state or local laws that materially adversely affect the tax treatment of municipal securities orthe market for those securities, or other changes negatively affecting the municipal securities market, also may adverselyimpact the Company's investment portfolio, a significant portion of which is invested in tax-exempt instruments. These adversechanges may adversely affect the value of the Company's tax-exempt portfolio, or its liquidity.
0345r4.indd 58 3/19/14 3:28 PM

57
Certain of the Company's foreign subsidiaries may be subject to U.S. tax.
The Company manages its business so that AGL and its foreign subsidiaries (other than AGRO and AGE) operate insuch a manner that none of them should be subject to U.S. federal tax (other than U.S. excise tax on insurance and reinsurancepremium income attributable to insuring or reinsuring U.S. risks, and U.S. withholding tax on certain U.S. source investmentincome). However, because there is considerable uncertainty as to the activities which constitute being engaged in a trade orbusiness within the U.S., the Company cannot be certain that the IRS will not contend successfully that AGL or any of itsforeign subsidiaries (other than AGRO and AGE) is/are engaged in a trade or business in the U.S. If AGL and its foreignsubsidiaries (other than AGRO and AGE) were considered to be engaged in a trade or business in the U.S., each such companycould be subject to U.S. corporate income and branch profits taxes on the portion of its earnings effectively connected to suchU.S. business.
AGL, AG Re and AGRO may become subject to taxes in Bermuda after March 2035, which may have a material adverseeffect on the Company's results of operations and on an investment in the Company.
The Bermuda Minister of Finance, under Bermuda's Exempted Undertakings Tax Protection Act 1966, as amended,has given AGL, AG Re and AGRO an assurance that if any legislation is enacted in Bermuda that would impose tax computedon profits or income, or computed on any capital asset, gain or appreciation, or any tax in the nature of estate duty orinheritance tax, then subject to certain limitations the imposition of any such tax will not be applicable to AGL, AG Re orAGRO, or any of AGL's or its subsidiaries' operations, shares, debentures or other obligations until March 31, 2035. Given thelimited duration of the Minister of Finance's assurance, the Company cannot be certain that it will not be subject to Bermudatax after March 31, 2035.
U.S. Persons who hold 10% or more of AGL's shares directly or through foreign entities may be subject to taxation underthe U.S. controlled foreign corporation rules.
Each 10% U.S. shareholder of a foreign corporation that is a controlled foreign corporation ("CFC") for anuninterrupted period of 30 days or more during a taxable year, and who owns shares in the foreign corporation directly orindirectly through foreign entities on the last day of the foreign corporation's taxable year on which it is a CFC, must include inits gross income for U.S. federal income tax purposes its pro rata share of the CFC's "subpart F income," even if the subpart Fincome is not distributed. In addition, upon a sale of shares of a CFC, 10% U.S. shareholders may be subject to U.S. federalincome tax on a portion of their gain at ordinary income rates.
The Company believes that because of the dispersion of the share ownership in AGL, provisions in AGL's Bye-Lawsthat limit voting power, contractual limits on voting power and other factors, no U.S. Person who owns AGL's shares directly orindirectly through foreign entities should be treated as a 10% U.S. shareholder of AGL or of any of its foreign subsidiaries. It ispossible, however, that the IRS could challenge the effectiveness of these provisions and that a court could sustain such achallenge, in which case such U.S. Person may be subject to taxation under U.S. tax rules.
U.S. Persons who hold shares may be subject to U.S. income taxation at ordinary income rates on their proportionate shareof the Company's related person insurance income.
If:
• the Company is 25% or more owned directly, indirectly through foreign entities or by attribution by U.S. Persons;
• the gross RPII of AG Re or any other AGL foreign subsidiary engaged in the insurance business that has not madean election under section 953(d) of the Code to be treated as a U.S. corporation for all U.S. tax purposes or areCFCs owned directly or indirectly by AGUS (each, with AG Re, a "Foreign Insurance Subsidiary") were to equalor exceed 20% of such Foreign Insurance Subsidiary's gross insurance income in any taxable year; and
• direct or indirect insureds (and persons related to such insureds) own (or are treated as owning directly orindirectly through entities) 20% or more of the voting power or value of the Company's shares,
then a U.S. Person who owns AGL's shares (directly or indirectly through foreign entities) on the last day of the taxable yearwould be required to include in its income for U.S. federal income tax purposes such person's pro rata share of such ForeignInsurance Subsidiary's RPII for the entire taxable year, determined as if such RPII were distributed proportionately only to U.S.Persons at that date, regardless of whether such income is distributed. In addition, any RPII that is includible in the income of aU.S. tax-exempt organization may be treated as unrelated business taxable income.
0345r4.indd 59 3/19/14 3:28 PM

58
The amount of RPII earned by a Foreign Insurance Subsidiary (generally, premium and related investment incomefrom the direct or indirect insurance or reinsurance of any direct or indirect U.S. holder of shares or any person related to suchholder) will depend on a number of factors, including the geographic distribution of a Foreign Insurance Subsidiary's businessand the identity of persons directly or indirectly insured or reinsured by a Foreign Insurance Subsidiary. The Company believesthat each of its Foreign Insurance Subsidiaries either should not in the foreseeable future have RPII income which equals orexceeds 20% of its gross insurance income or have direct or indirect insureds, as provided for by RPII rules, that directly orindirectly own 20% or more of either the voting power or value of AGL's shares. However, the Company cannot be certain thatthis will be the case because some of the factors which determine the extent of RPII may be beyond its control.
U.S. Persons who dispose of AGL's shares may be subject to U.S. income taxation at dividend tax rates on a portion of theirgain, if any.
The meaning of the RPII provisions and the application thereof to AGL and its Foreign Insurance Subsidiaries isuncertain. The RPII rules in conjunction with section 1248 of the Code provide that if a U.S. Person disposes of shares in aforeign insurance corporation in which U.S. Persons own (directly, indirectly, through foreign entities or by attribution) 25% ormore of the shares (even if the amount of gross RPII is less than 20% of the corporation's gross insurance income and theownership of its shares by direct or indirect insureds and related persons is less than the 20% threshold), any gain from thedisposition will generally be treated as dividend income to the extent of the holder's share of the corporation's undistributedearnings and profits that were accumulated during the period that the holder owned the shares. This provision applies whetheror not such earnings and profits are attributable to RPII. In addition, such a holder will be required to comply with certainreporting requirements, regardless of the amount of shares owned by the holder.
In the case of AGL's shares, these RPII rules should not apply to dispositions of shares because AGL is not itselfdirectly engaged in the insurance business. However, the RPII provisions have never been interpreted by the courts or the U.S.Treasury Department in final regulations, and regulations interpreting the RPII provisions of the Code exist only in proposedform. It is not certain whether these regulations will be adopted in their proposed form, what changes or clarifications mightultimately be made thereto, or whether any such changes, as well as any interpretation or application of the RPII rules by theIRS, the courts, or otherwise, might have retroactive effect. The U.S. Treasury Department has authority to impose, amongother things, additional reporting requirements with respect to RPII.
U.S. Persons who hold common shares will be subject to adverse tax consequences if AGL is considered to be a "passiveforeign investment company" for U.S. federal income tax purposes.
If AGL is considered a passive foreign investment company ("PFIC") for U.S. federal income tax purposes, a U.S.Person who owns any shares of AGL will be subject to adverse tax consequences that could materially adversely affect itsinvestment, including subjecting the investor to both a greater tax liability than might otherwise apply and an interest charge.The Company believes that AGL is not, and currently does not expect AGL to become, a PFIC for U.S. federal income taxpurposes; however, there can be no assurance that AGL will not be deemed a PFIC by the IRS.
There are currently no regulations regarding the application of the PFIC provisions to an insurance company. Newregulations or pronouncements interpreting or clarifying these rules may be forthcoming. The Company cannot predict whatimpact, if any, such guidance would have on an investor that is subject to U.S. federal income taxation.
Changes in U.S. federal income tax law could materially adversely affect an investment in AGL's common shares.
Legislation has been introduced in the U.S. Congress intended to eliminate certain perceived tax advantages ofcompanies (including insurance companies) that have legal domiciles outside the U.S. but have certain U.S. connections. Forexample, legislation has been introduced in Congress to limit the deductibility of reinsurance premiums paid by U.S. insurancecompanies to foreign affiliates and impose additional limits on deductibility of interest of foreign owned U.S. corporations.Another legislative proposal would treat a foreign corporation that is primarily managed and controlled in the U.S. as a U.S.corporation for U.S federal income tax purposes. Further, legislation has previously been introduced to override the reductionor elimination of the U.S. withholding tax on certain U.S. source investment income under a tax treaty in the case of adeductible related party payment made by a U.S. member of a foreign controlled group to a foreign member of the grouporganized in a tax treaty country to the extent that the ultimate foreign parent corporation would not enjoy the treaty benefitswith respect to such payments. It is possible that this or similar legislation could be introduced in and enacted by the currentCongress or future Congresses that could have an adverse impact on the Company or the Company's shareholders.
0345r4.indd 60 3/19/14 3:28 PM
59
U.S. federal income tax laws and interpretations regarding whether a company is engaged in a trade or business withinthe U.S. is a PFIC, or whether U.S. Persons would be required to include in their gross income the "subpart F income" of aCFC or RPII are subject to change, possibly on a retroactive basis. There currently are no regulations regarding the applicationof the PFIC rules to insurance companies, and the regulations regarding RPII are still in proposed form. New regulations orpronouncements interpreting or clarifying such rules may be forthcoming. The Company cannot be certain if, when, or in whatform such regulations or pronouncements may be implemented or made, or whether such guidance will have a retroactiveeffect.
Recharacterization by the Internal Revenue Service of the Company's U.S. federal tax treatment of losses on the Company'sCDS portfolio can adversely affect the Company's financial position.
As part of the Company's financial guaranty business, the Company has sold credit protection by insuring CDSentered into with various financial institutions. Assured Guaranty's CDS portfolio has experienced significant cumulative fairvalue losses which are only deductible for U.S. federal income tax purposes upon realization and, consequently, generate asignificant deferred tax asset based on the Company's intended treatment of such losses as ordinary insurance losses uponrealization. The U.S. federal income tax treatment of CDS is an unsettled area of the tax law. As such, it is possible that theInternal Revenue Service may decide that the losses generated by the Company's CDS business should be characterized ascapital rather than ordinary insurance losses, which could materially adversely affect the Company's financial condition.
An ownership change under Section 382 of the Code could have adverse U.S. federal tax consequences.
If AGL were to issue equity securities in the future, including in connection with any strategic transaction, or ifpreviously issued securities of AGL were to be sold by the current holders, AGL may experience an "ownership change" withinthe meaning of Section 382 of the Code. In general terms, an ownership change would result from transactions increasing theaggregate ownership of certain stockholders in AGL's stock by more than 50 percentage points over a testing period (generallythree years). If an ownership change occurred, the Company's ability to use certain tax attributes, including certain built-inlosses, credits, deductions or tax basis and/or the Company's ability to continue to reflect the associated tax benefits as assets onAGL's balance sheet, may be limited. The Company cannot give any assurance that AGL will not undergo an ownership changeat a time when these limitations could materially adversely affect the Company's financial condition.
AGMH likely experienced an ownership change under Section 382 of the Code.
In connection with the AGMH Acquisition, AGMH likely experienced an "ownership change" within the meaning ofSection 382 of the Code. The Company has concluded that the Section 382 limitations as discussed in "An ownership changeunder Section 382 of the Code could have adverse U.S. federal tax consequences" are unlikely to have any material tax oraccounting consequences. However, this conclusion is based on a variety of assumptions, including the Company's estimatesregarding the amount and timing of certain deductions and future earnings, any of which could be incorrect. Accordingly, therecan be no assurance that these limitations would not have an adverse effect on the Company's financial condition or that suchadverse effects would not be material.
A change in AGL’s U.K. tax residency status or its ability to otherwise qualify for the benefits of income tax treaties to whichthe U.K. is a party could adversely affect an investment in AGL’s common shares.
AGL is not incorporated in the U.K. and, accordingly, can only be resident in the U.K. for U.K. tax purposes if it is“centrally managed and controlled” in the U.K. Central management and control constitutes the highest level of control of acompany’s affairs. AGL believes that it will be entitled to take advantage of the benefits of income tax treaties to which theU.K. is a party on the basis that it is has established central management and control in the U.K. AGL has obtainedconfirmation that there is a low risk of challenge to its residency status from HMRC under the facts as they stand today. Theboard of directors intends to manage the affairs of AGL in such a way as to maintain its status as a company that is tax-residentin the U.K. for U.K. tax purposes and to qualify for the benefits of income tax treaties to which the U.K. is a party. However,the concept of central management and control is a case-law concept that is not comprehensively defined in U.K. statute. Inaddition, it is a question of fact. Moreover, tax treaties may be revised in a way that causes AGL to fail to qualify for benefitsthereunder. Accordingly, a change in relevant U.K. tax law or in tax treaties to which the U.K. is a party, or in AGL’s centralmanagement and control as a factual matter, or other events, could adversely affect the ability of Assured Guaranty to manageits capital in the efficient manner that it contemplated in establishing U.K. tax residence.
0345r4.indd 61 3/19/14 3:28 PM

60
Changes in U.K. tax law or in AGL’s ability to satisfy all the conditions for exemption from U.K. taxation on dividendincome or capital gains in respect of its direct subsidiaries could affect an investment in AGL’s common shares.
As a U.K. tax resident, AGL is subject to U.K. corporation tax in respect of its worldwide profits (both income andcapital gains), subject to applicable exemptions. The main rate of corporation tax is 23% currently.
• With respect to income, the dividends that AGL receives from its subsidiaries should be exempt from U.K.corporation tax under the exemption contained in section 931D of the Corporation Tax Act 2009.
• With respect to capital gains, if AGL were to dispose of shares in its direct subsidiaries or if it were deemed tohave done so, it may realize a chargeable gain for U.K. tax purposes. Any tax charge would be based on AGL’soriginal acquisition cost. It is anticipated that any such future gain should qualify for exemption under thesubstantial shareholding exemption in Schedule 7AC to the Taxation of Chargeable Gains Act 1992. However, theavailability of such exemption would depend on facts at the time of disposal, in particular the “trading” nature ofthe activities of the Assured Guaranty group and of the relevant subsidiary. There is no statutory definition ofwhat constitutes “trading” activities for this purpose and in practice reliance is placed on the published guidanceof HMRC.
A change in U.K. tax law or its interpretation by HMRC, or any failure to meet all the qualifying conditions for relevantexemptions from U.K. corporation tax, could affect Assured Guaranty’s financial results of operations or its ability to providereturns to shareholders.
The financial results of our operations may be affected by measures taken in response to the OECD BEPS project.
On July 19, 2013, the Organisation for Economic Co-operation and Development published its Action Plan on Base Erosionand Profit Shifting (the “BEPS Action Plan”), in an attempt to coordinate multilateral action on international tax rules. Therecommended actions include an examination of the definition of a “permanent establishment” and the rules for attributingprofit to a permanent establishment. Other recommended actions relate to the goal of ensuring that transfer pricing outcomesare in line with value creation, noting that the current rules may facilitate the transfer of risks or capital away from countrieswhere the economic activity takes place. Any changes in U.S. or U.K. tax law in response to the BEPS Action Plan couldadversely affect Assured Guaranty’s liability to tax.
An adverse adjustment under U.K. legislation governing the taxation of U.K. tax resident holding companies on the profitsof their foreign subsidiaries could adversely impact Assured Guaranty’s tax liability.
Under the U.K. “controlled foreign company” regime, the income profits of non-U.K. resident companies may, incertain circumstances, be attributed to controlling U.K. resident shareholders for U.K. corporation tax purposes. A new CFCregime was introduced with effect for CFC accounting periods beginning on or after January 1, 2013. The non-U.K. residentmembers of the Assured Guaranty group intend to operate and manage their levels of capital in such a manner that their profitswould not be taxed on AGL under the U.K. CFC regime. Assured Guaranty has obtained clearance from HMRC that none ofthe profits of the non-U.K. resident members of the Assured Guaranty group should be subject to U.K. tax as a result ofattribution under the CFC regime on the facts as they currently stand. However, a change in the way in which AssuredGuaranty operates or any further change in the CFC regime, resulting in an attribution to AGL of any of the income profits ofany of AGL’s non-U.K. resident subsidiaries for U.K. corporation tax purposes, could adversely affect Assured Guaranty’sfinancial results of operations.
Becoming resident in the U.K. for tax purposes may subject Assured Guaranty to additional regulatory requirements withwhich it may have difficulty complying or which may constrain or limit its ability to take certain actions.
In connection with AGL’s establishment of tax residence in the U.K., AGL has been discussing the regulation of AGLand its subsidiaries as a group with the Prudential Regulation Authority in the U.K. and with the NY DFS. The NY DFS hasindicated that it will assume responsibility for regulation of the Assured Guaranty group. Group supervision by the NY DFSwould result in additional regulatory oversight over Assured Guaranty, and may subject Assured Guaranty to new regulatoryrequirements and constraints. If the PRA determines that, notwithstanding the NY DFS becoming Assured Guaranty’s groupregulator, AGL’s head office is in the U.K. based upon it having a tax residence there, then AGL may be subject to additionalcapital and compliance requirements that it must satisfy. If Assured Guaranty is unable to satisfy these additional regulatoryrequirements, it may not be able to effectuate the efficient management of capital that it contemplated in establishing U.K. taxresidence.
0345r4.indd 62 3/19/14 3:28 PM

61
Risks Related to AGL's Common Shares
The market price of AGL's common shares may be volatile, which could cause the value of an investment in the Company todecline.
The market price of AGL's common shares has experienced, and may continue to experience, significant volatility.Numerous factors, including many over which the Company has no control, may have a significant impact on the market priceof its common shares. These risks include those described or referred to in this "Risk Factors" section as well as, among otherthings:
• investor perceptions of the Company, its prospects and that of the financial guaranty industry and the markets inwhich the Company operates;
• the Company's operating and financial performance;
• the Company's access to financial and capital markets to raise additional capital, refinance its debt or replaceexisting senior secured credit and receivables-backed facilities;
• the Company's ability to repay debt;
• the Company's dividend policy;
• future sales of equity or equity-related securities;
• changes in earnings estimates or buy/sell recommendations by analysts; and
• general financial, economic and other market conditions.
In addition, the stock market in recent years has experienced extreme price and trading volume fluctuations that oftenhave been unrelated or disproportionate to the operating performance of individual companies. These broad market fluctuationsmay adversely affect the price of AGL's common shares, regardless of its operating performance.
AGL's common shares are equity securities and are junior to existing and future indebtedness.
As equity interests, AGL's common shares rank junior to indebtedness and to other non-equity claims on AGL and itsassets available to satisfy claims on AGL, including claims in a bankruptcy or similar proceeding. For example, uponliquidation, holders of AGL debt securities and shares of preferred stock and creditors would receive distributions of AGL'savailable assets prior to the holders of AGL common shares. Similarly, creditors, including holders of debt securities, of AGL'ssubsidiaries, have priority on the assets of those subsidiaries. Future indebtedness may restrict payment of dividends on thecommon shares.
Additionally, unlike indebtedness, where principal and interest customarily are payable on specified due dates, in thecase of common shares, dividends are payable only when and if declared by AGL's board of directors or a duly authorizedcommittee of the board. Further, the common shares place no restrictions on its business or operations or on its ability to incurindebtedness or engage in any transactions, subject only to the voting rights available to stockholders generally.
There may be future sales or other dilution of AGL's equity, which may adversely affect the market price of its commonshares.
Future sales or other issuances of AGL's equity may adversely affect the market price of its common shares. Inaddition, based on a Schedule 13D/A filed by WL Ross Group, L.P. on June 4, 2013 reporting the amount of securitiesbeneficially owned as of May 31, 2013, the Company calculates that WL Ross Group, L.P. and its affiliates owned 8.2% ofAGL's common shares as of February 21, 2014. WL Ross Group, L.P. and its affiliates have registration rights with respect toAGL common shares. A sale of a significant portion of such holdings could adversely affect the market price of AGL's commonshares.
0345r4.indd 63 3/19/14 3:28 PM

62
Provisions in the Code and AGL's Bye-Laws may reduce or increase the voting rights of its common shares.
Under the Code, AGL's Bye-Laws and contractual arrangements, certain shareholders have their voting rights limitedto less than one vote per share, resulting in other shareholders having voting rights in excess of one vote per share. Moreover,the relevant provisions of the Code may have the effect of reducing the votes of certain shareholders who would not otherwisebe subject to the limitation by virtue of their direct share ownership.
More specifically, pursuant to the relevant provisions of the Code, if, and so long as, the common shares of ashareholder are treated as "controlled shares" (as determined under section 958 of the Code) of any U.S. Person (as definedbelow) and such controlled shares constitute 9.5% or more of the votes conferred by AGL's issued shares, the voting rights withrespect to the controlled shares of such U.S. Person (a "9.5% U.S. Shareholder") are limited, in the aggregate, to a voting powerof less than 9.5%, under a formula specified in AGL's Bye-Laws. The formula is applied repeatedly until the voting power ofall 9.5% U.S. Shareholders has been reduced to less than 9.5%. For these purposes, "controlled shares" include, among otherthings, all shares of AGL that such U.S. Person is deemed to own directly, indirectly or constructively (within the meaning ofsection 958 of the Code).
In addition, the Board of Directors may limit a shareholder's voting rights where it deems appropriate to do so to(1) avoid the existence of any 9.5% U.S. Shareholders, and (2) avoid certain material adverse tax, legal or regulatoryconsequences to the Company or any of the Company's subsidiaries or any shareholder or its affiliates. AGL's Bye-Lawsprovide that shareholders will be notified of their voting interests prior to any vote taken by them.
As a result of any such reallocation of votes, the voting rights of a holder of AGL common shares might increaseabove 5% of the aggregate voting power of the outstanding common shares, thereby possibly resulting in such holder becominga reporting person subject to Schedule 13D or 13G filing requirements under the Securities Exchange Act of 1934. In addition,the reallocation of votes could result in such holder becoming subject to the short swing profit recovery and filing requirementsunder Section 16 of the Exchange Act.
AGL also has the authority under its Bye-Laws to request information from any shareholder for the purpose ofdetermining whether a shareholder's voting rights are to be reallocated under the Bye-Laws. If a shareholder fails to respond toa request for information or submits incomplete or inaccurate information in response to a request, the Company may, in itssole discretion, eliminate such shareholder's voting rights.
Provisions in AGL's Bye-Laws may restrict the ability to transfer common shares, and may require shareholders to sell theircommon shares.
AGL's Board of Directors may decline to approve or register a transfer of any common shares (1) if it appears to theBoard of Directors, after taking into account the limitations on voting rights contained in AGL's Bye-Laws, that any adversetax, regulatory or legal consequences to AGL, any of its subsidiaries or any of its shareholders may occur as a result of suchtransfer (other than such as the Board of Directors considers to be de minimis), or (2) subject to any applicable requirements ofor commitments to the New York Stock Exchange ("NYSE"), if a written opinion from counsel supporting the legality of thetransaction under U.S. securities laws has not been provided or if any required governmental approvals have not been obtained.
AGL's Bye-Laws also provide that if the Board of Directors determines that share ownership by a person may result inadverse tax, legal or regulatory consequences to the Company, any of the subsidiaries or any of the shareholders (other thansuch as the Board of Directors considers to be de minimis), then AGL has the option, but not the obligation, to require thatshareholder to sell to AGL or to third parties to whom AGL assigns the repurchase right for fair market value the minimumnumber of common shares held by such person which is necessary to eliminate such adverse tax, legal or regulatoryconsequences.
Existing reinsurance agreement terms may make it difficult to effect a change of control of AGL.
Some of the Company's reinsurance agreements have change of control provisions that are triggered if a third partyacquires a designated percentage of AGL's shares. If a change of control provision is triggered, the ceding company mayrecapture some or all of the reinsurance business ceded to the Company in the past. Any such recapture could adversely affectthe Company's shareholders' equity, future income or financial strength or debt ratings. These provisions may discouragepotential acquisition proposals and may delay, deter or prevent a change of control of AGL, including through transactions thatsome or all of the shareholders might consider to be desirable.
0345r4.indd 64 3/19/14 3:28 PM

63
ITEM 1B. UNRESOLVED STAFF COMMENTS
None.
ITEM 2. PROPERTIES
The principal executive offices of AGL and AG Re consist of approximately 8,250 square feet of office space locatedin Hamilton, Bermuda; the lease for this space expires in April 2015 and is renewable at the option of the Company. Inaddition, the Company occupies approximately 110,000 square feet of office space in New York City; the lease for this officespace expires in April 2026. The Company also occupies another approximately 21,000 square feet of office space in Londonand Sydney, and two offices in San Francisco and Irvine, California. Management believes that the office space is adequate forits current and anticipated needs.
ITEM 3. LEGAL PROCEEDINGS
Lawsuits arise in the ordinary course of the Company's business. It is the opinion of the Company'smanagement, based upon the information available, that the expected outcome of litigation against the Company,individually or in the aggregate, will not have a material adverse effect on the Company's financial position or liquidity,although an adverse resolution of litigation against the Company in a fiscal quarter or year could have a materialadverse effect on the Company's results of operations in a particular quarter or year.
The Company establishes accruals for litigation and regulatory matters to the extent it is probable that a losshas been incurred and the amount of that loss can be reasonably estimated. For litigation and regulatory matters wherea loss may be reasonably possible, but not probable, or is probable but not reasonably estimable, no accrual isestablished, but if the matter is material, it is disclosed, including matters discussed below. The Company reviewsrelevant information with respect to its litigation and regulatory matters on a quarterly, and annual basis and updates itsaccruals, disclosures and estimates of reasonably possible loss based on such reviews.
In addition, in the ordinary course of their respective businesses, certain of the Company's subsidiaries assertclaims in legal proceedings against third parties to recover losses paid in prior periods. For example, as described in the"Recovery Litigation," section of Note 6, Expected Loss to be Paid, of the Financial Statements and SupplementaryData, as of the date of this filing, AGC and AGM have filed complaints against certain sponsors and underwriters ofRMBS securities that AGC or AGM had insured, alleging, among other claims, that such persons had breachedrepresentations and warranties ("R&W") in the transaction documents, failed to cure or repurchase defective loansand/or violated state securities laws. The amounts, if any, the Company will recover in proceedings to recover lossesare uncertain, and recoveries, or failure to obtain recoveries, in any one or more of these proceedings during anyquarter or year could be material to the Company's results of operations in that particular quarter or year.
Proceedings Relating to the Company's Financial Guaranty Business
The Company receives subpoenas duces tecum and interrogatories from regulators from time to time.
Beginning in July 2008, AGM and various other financial guarantors were named in complaints filed in theSuperior Court for the State of California, City and County of San Francisco by a number of plaintiffs. Subsequently,plaintiffs' counsel filed amended complaints against AGM and AGC and added additional plaintiffs. These complaintsalleged that the financial guaranty insurer defendants (i) participated in a conspiracy in violation of California'santitrust laws to maintain a dual credit rating scale that misstated the credit default risk of municipal bond issuers andcreated market demand for municipal bond insurance, (ii) participated in risky financial transactions in other lines ofbusiness that damaged each insurer's financial condition (thereby undermining the value of each of their guaranties),and (iii) failed to adequately disclose the impact of those transactions on their financial condition. In addition to theirantitrust claims, various plaintiffs asserted claims for breach of the covenant of good faith and fair dealing, fraud,unjust enrichment, negligence, and negligent misrepresentation. At hearings held in July and October 2011 relating toAGM, AGC and the other defendants' demurrer, the court overruled the demurrer on the following claims: breach ofcontract, violation of California's antitrust statute and of its unfair business practices law, and fraud. The remainingclaims were dismissed. On December 2, 2011, AGM, AGC and the other bond insurer defendants filed an anti-SLAPP("Strategic Lawsuit Against Public Participation") motion to strike the complaints under California's Code of CivilProcedure. On July 9, 2013, the court entered its order denying in part and granting in part the bond insurers' motion tostrike. As a result of the order, the causes of action that remain against AGM and AGC are: claims of breach ofcontract and fraud, brought by the City of San Jose, the City of Stockton, East Bay Municipal Utility District andSacramento Suburban Water District, relating to the failure to disclose the impact of risky financial transactions on
0345r4.indd 65 3/19/14 3:28 PM
their financial condition; and a claim of breach of the unfair business practices law brought by The Jewish CommunityCenter of San Francisco. On September 9, 2013, plaintiffs filed an appeal of the anti-SLAPP ruling on the Californiaantitrust statute. On September 30, 2013, AGC, AGM and the other bond insurer defendants filed a notice of cross-appeal. The complaints generally seek unspecified monetary damages, interest, attorneys' fees, costs and otherexpenses. The Company cannot reasonably estimate the possible loss or range of loss, if any, that may arise from theselawsuits.
On November 28, 2011, Lehman Brothers International (Europe) (in administration) ("LBIE") sued AGFinancial Products Inc. ("AGFP"), an affiliate of AGC which in the past had provided credit protection tocounterparties under credit default swaps. AGC acts as the credit support provider of AGFP under these credit defaultswaps. LBIE's complaint, which was filed in the Supreme Court of the State of New York, alleged that AGFPimproperly terminated nine credit derivative transactions between LBIE and AGFP and improperly calculated thetermination payment in connection with the termination of 28 other credit derivative transactions between LBIE andAGFP. With respect to the 28 credit derivative transactions, AGFP calculated that LBIE owes AGFP approximately$25 million, whereas LBIE asserted in the complaint that AGFP owes LBIE a termination payment of approximately$1.4 billion. LBIE is seeking unspecified damages. On February 3, 2012, AGFP filed a motion to dismiss certain of thecounts in the complaint, and on March 15, 2013, the court granted AGFP's motion to dismiss the count relating toimproper termination of the nine credit derivative transactions and denied AGFP's motion to dismiss the count relatingto the remaining transactions. The Company cannot reasonably estimate the possible loss, if any, that may arise fromthis lawsuit.
On November 19, 2012, Lehman Brothers Holdings Inc. (“LBHI”) and Lehman Brothers Special FinancingInc. (“LBSF") commenced an adversary complaint and claim objection in the United States Bankruptcy Court for theSouthern District of New York against Credit Protection Trust 283 (“CPT 283”), FSA Administrative Services, LLC, astrustee for CPT 283, and AGM, in connection with CPT 283's termination of a CDS between LBSF and CPT 283. CPT283 terminated the CDS as a consequence of LBSF failing to make a scheduled payment owed to CPT 283, whichtermination occurred after LBHI filed for bankruptcy but before LBSF filed for bankruptcy. The CDS provided thatCPT 283 was entitled to receive from LBSF a termination payment in that circumstance of approximately $43.8 million(representing the economic equivalent of the future fixed payments CPT 283 would have been entitled to receive fromLBSF had the CDS not been terminated), and CPT 283 filed proofs of claim against LBSF and LBHI (as LBSF's creditsupport provider) for such amount. LBHI and LBSF seek to disallow and expunge (as impermissible andunenforceable penalties) CPT 283's proofs of claim against LBHI and LBSF and recover approximately $67.3 million,which LBHI and LBSF allege was the mark-to-market value of the CDS to LBSF (less unpaid amounts) on the dayCPT 283 terminated the CDS, plus interest, attorney's fees, costs and other expenses. On the same day, LBHI andLBSF also commenced an adversary complaint and claim objection against Credit Protection Trust 207 (“CPT 207”),FSA Administrative Services, LLC, as trustee for CPT 207, and AGM, in connection with CPT 207's termination of aCDS between LBSF and CPT 207. Similarly, the CDS provided that CPT 207 was entitled to receive from LBSF atermination payment in that circumstance of $492,555. LBHI and LBSF seek to disallow and expunge CPT 207'sproofs of claim against LBHI and LBSF and recover approximately $1.5 million. AGM believes the terminations ofthe CDS and the calculation of the termination payment amounts were consistent with the terms of the ISDA masteragreements between the parties. The Company cannot reasonably estimate the possible loss, if any, that may arise fromthis lawsuit.
On September 25, 2013, Wells Fargo Bank, N.A., as trust administrator, filed an interpleader complaint in theU.S. District Court for the Southern District of New York against AGM, among others, relating to the right of AGM tobe reimbursed from certain cashflows for principal claims paid on insured certificates issued in the MASTR AdjustableRate Mortgages Trust 2007-3 securitization. The Company estimates that an adverse outcome to the interpleaderproceeding could increase losses on the transaction by approximately $10 - $20 million, net of expected settlementpayments and reinsurance in force.
Previously, AGM, together with other financial institutions and other parties, including bond insurers, hadbeen named as defendants in a civil action brought in the circuit court of Jefferson County, Alabama relating to theCounty's problems meeting its sewer debt obligations: Charles E. Wilson vs. JPMorgan Chase & Co et al (filed in theCircuit Court of Jefferson County, Alabama), Case No. 01-CV-2008-901907.00. The action was brought in August2008 on behalf of rate payers, tax payers and citizens residing in Jefferson County, and alleged conspiracy and fraud inconnection with the issuance of the County's debt. The complaint sought equitable relief, unspecified monetarydamages, interest, attorneys' fees and other costs. In January 2011, the circuit court issued an order denying a motionby the bond insurers and other defendants to dismiss the action. The defendants, including the bond insurers,
64
0345r4.indd 66 3/19/14 3:28 PM

petitioned the Alabama Supreme Court for a writ of mandamus to the circuit court vacating such order and directingthe dismissal with prejudice of plaintiffs' claims for lack of standing. While awaiting a ruling from the AlabamaSupreme Court, Jefferson County filed for bankruptcy and the Alabama Supreme Court entered a stay pending theresolution of the bankruptcy. In November 2013, the United States Bankruptcy Court approved a bankruptcy plan thatincluded dismissal of the pending claims in state court. On January 13, 2014, the circuit court entered an orderdismissing the claims against AGM and the other defendants and on January 17, 2014, the Supreme Court of Alabamaentered an order dismissing the petition for writ of mandamus.
Proceedings Related to AGMH's Former Financial Products Business
The following is a description of legal proceedings involving AGMH's former Financial Products Business.Although the Company did not acquire AGMH's former Financial Products Business, which included AGMH's formerGIC business, medium term notes business and portions of the leveraged lease businesses, certain legal proceedingsrelating to those businesses are against entities that the Company did acquire. While Dexia SA and DCL, jointly andseverally, have agreed to indemnify the Company against liability arising out of the proceedings described below in the"—Proceedings Related to AGMH's Former Financial Products Business" section, such indemnification might not besufficient to fully hold the Company harmless against any injunctive relief or civil or criminal sanction that is imposedagainst AGMH or its subsidiaries.
Governmental Investigations into Former Financial Products Business
AGMH and/or AGM have received subpoenas duces tecum and interrogatories or civil investigative demandsfrom the Attorneys General of the States of Connecticut, Florida, Illinois, Massachusetts, Missouri, New York, Texasand West Virginia relating to their investigations of alleged bid rigging of municipal GICs. AGMH is responding tosuch requests. AGMH may receive additional inquiries from these or other regulators and expects to provide additionalinformation to such regulators regarding their inquiries in the future. In addition:
• AGMH received a subpoena from the Antitrust Division of the Department of Justice in November 2006issued in connection with an ongoing criminal investigation of bid rigging of awards of municipal GICsand other municipal derivatives; and
• AGM received a subpoena from the SEC in November 2006 related to an ongoing industry-wideinvestigation concerning the bidding of municipal GICs and other municipal derivatives.
Pursuant to the subpoenas, AGMH has furnished to the Department of Justice and SEC records and other informationwith respect to AGMH's municipal GIC business. The ultimate loss that may arise from these investigations remainsuncertain.
In addition, AGMH had received a "Wells Notice" from the staff of the Philadelphia Regional Office of theSEC in February 2008 relating to the investigation concerning the bidding of municipal GICs and other municipalderivatives. The Wells Notice indicated that the SEC staff was considering recommending that the SEC authorize thestaff to bring a civil injunctive action and/or institute administrative proceedings against AGMH, alleging violations ofSection 10(b) of the Exchange Act and Rule 10b-5 thereunder and Section 17(a) of the Securities Act. On January 8,2014, the SEC issued a letter stating that it had concluded the investigation as to AGMH and, based on the informationit had as of such date, it did not intend to recommend an enforcement action by the SEC against AGMH.
In July 2010, a former employee of AGM who had been involved in AGMH's former Financial ProductsBusiness was indicted along with two other persons with whom he had worked at Financial Guaranty InsuranceCompany. Such former employee and the other two persons were convicted on fraud conspiracy counts. After appeal,their convictions were reversed by a three-judge panel of the U.S. Court of Appeals for the Second Circuit inNovember 2013. In January 2014, the Department of Justice petitioned the U.S. Court of Appeals for the SecondCircuit for a panel rehearing and a rehearing en banc of the appeal.
Lawsuits Relating to Former Financial Products Business
During 2008, nine putative class action lawsuits were filed in federal court alleging federal antitrust violationsin the municipal derivatives industry, seeking damages and alleging, among other things, a conspiracy to fix thepricing of, and manipulate bids for, municipal derivatives, including GICs. These cases have been coordinated andconsolidated for pretrial proceedings in the U.S. District Court for the Southern District of New York as MDL 1950, Inre Municipal Derivatives Antitrust Litigation, Case No. 1:08-cv-2516 ("MDL 1950").
65
0345r4.indd 67 3/19/14 3:28 PM

Five of these cases named both AGMH and AGM: (a) Hinds County, Mississippi v. Wachovia Bank, N.A. ;(b) Fairfax County, Virginia v. Wachovia Bank, N.A.; (c) Central Bucks School District, Pennsylvania v. WachoviaBank, N.A.; (d) Mayor and City Council of Baltimore, Maryland v. Wachovia Bank, N.A. ; and (e) Washington County,Tennessee v. Wachovia Bank, N.A. In April 2009, the MDL 1950 court granted the defendants' motion to dismiss on thefederal claims, but granted leave for the plaintiffs to file an amended complaint. The Corrected Third ConsolidatedAmended Class Action Complaint, filed on October 9, 2013, lists neither AGM nor AGMH as a named defendant or aco-conspirator. The complaints in these lawsuits generally seek unspecified monetary damages, interest, attorneys' feesand other costs. The Company cannot reasonably estimate the possible loss, if any, or range of loss that may arise fromthese lawsuits.
Four of the cases named AGMH (but not AGM) and also alleged that the defendants violated California stateantitrust law and common law by engaging in illegal bid-rigging and market allocation, thereby depriving the cities ormunicipalities of competition in the awarding of GICs and ultimately resulting in the cities paying higher fees for theseproducts: (f) City of Oakland, California v. AIG Financial Products Corp.; (g) County of Alameda, California v. AIGFinancial Products Corp.; (h) City of Fresno, California v. AIG Financial Products Corp.; and (i) Fresno CountyFinancing Authority v. AIG Financial Products Corp. When the four plaintiffs filed a consolidated complaint inSeptember 2009, the plaintiffs did not name AGMH as a defendant. However, the complaint does describe some ofAGMH's and AGM's activities. The consolidated complaint generally seeks unspecified monetary damages, interest,attorneys' fees and other costs. In April 2010, the MDL 1950 court granted in part and denied in part the nameddefendants' motions to dismiss this consolidated complaint.
In 2008, AGMH and AGM also were named in five non-class action lawsuits originally filed in the CaliforniaSuperior Courts alleging violations of California law related to the municipal derivatives industry: (a) City of LosAngeles, California v. Bank of America, N.A.; (b) City of Stockton, California v. Bank of America, N.A. ; (c) County ofSan Diego, California v. Bank of America, N.A.; (d) County of San Mateo, California v. Bank of America, N.A.; and(e) County of Contra Costa, California v. Bank of America, N.A. Amended complaints in these actions were filed inSeptember 2009, adding a federal antitrust claim and naming AGM (but not AGMH) and AGUS, among otherdefendants. These cases have been transferred to the Southern District of New York and consolidated with MDL 1950for pretrial proceedings.
In late 2009, AGM and AGUS, among other defendants, were named in six additional non-class action casesfiled in federal court, which also have been coordinated and consolidated for pretrial proceedings with MDL 1950:(f) City of Riverside, California v. Bank of America, N.A.; (g) Sacramento Municipal Utility District v. Bank ofAmerica, N.A.; (h) Los Angeles World Airports v. Bank of America, N.A. ; (i) Redevelopment Agency of the City ofStockton v. Bank of America, N.A.; (j) Sacramento Suburban Water District v. Bank of America, N.A.; and (k) County ofTulare, California v. Bank of America, N.A.
The MDL 1950 court denied AGM and AGUS's motions to dismiss these eleven complaints in April 2010.Amended complaints were filed in May 2010. On October 29, 2010, AGM and AGUS were voluntarily dismissed withprejudice from the Sacramento Municipal Utility District case only. The complaints in these lawsuits generally seek orsought unspecified monetary damages, interest, attorneys' fees, costs and other expenses. The Company cannotreasonably estimate the possible loss, if any, or range of loss that may arise from the remaining lawsuits.
In May 2010, AGM and AGUS, among other defendants, were named in five additional non-class action casesfiled in federal court in California: (a) City of Richmond, California v. Bank of America, N.A. (filed on May 18, 2010,N.D. California); (b) City of Redwood City, California v. Bank of America, N.A . (filed on May 18, 2010, N.D.California); (c) Redevelopment Agency of the City and County of San Francisco, California v. Bank of America, N.A.(filed on May 21, 2010, N.D. California); (d) East Bay Municipal Utility District, California v. Bank of America, N.A.(filed on May 18, 2010, N.D. California); and (e) City of San Jose and the San Jose Redevelopment Agency, Californiav. Bank of America, N.A (filed on May 18, 2010, N.D. California). These cases have also been transferred to theSouthern District of New York and consolidated with MDL 1950 for pretrial proceedings. In September 2010, AGMand AGUS, among other defendants, were named in a sixth additional non-class action filed in federal court in NewYork, but which alleges violation of New York's Donnelly Act in addition to federal antitrust law: Active RetirementCommunity, Inc. d/b/a Jefferson's Ferry v. Bank of America, N.A. (filed on September 21, 2010, E.D. New York), whichhas also been transferred to the Southern District of New York and consolidated with MDL 1950 for pretrialproceedings. In December 2010, AGM and AGUS, among other defendants, were named in a seventh additionalnon-class action filed in federal court in the Central District of California, Los Angeles Unified School District v. Bankof America, N.A., and in an eighth additional non-class action filed in federal court in the Southern
66
0345r4.indd 68 3/19/14 3:28 PM

District of New York, Kendal on Hudson, Inc. v. Bank of America, N.A. These cases also have been consolidated withMDL 1950 for pretrial proceedings. The complaints in these lawsuits generally seek unspecified monetary damages,interest, attorneys' fees, costs and other expenses. The Company cannot reasonably estimate the possible loss, if any, orrange of loss that may arise from these lawsuits.
In January 2011, AGM and AGUS, among other defendants, were named in an additional non-class actioncase filed in federal court in New York, which alleges violation of New York's Donnelly Act in addition to federalantitrust law: Peconic Landing at Southold, Inc. v. Bank of America, N.A. This case has been consolidated with MDL1950 for pretrial proceedings. The complaint in this lawsuit generally seeks unspecified monetary damages, interest,attorneys' fees, costs and other expenses. The Company cannot reasonably estimate the possible loss, if any, or range ofloss that may arise from this lawsuit.
In September 2009, the Attorney General of the State of West Virginia filed a lawsuit (Circuit Ct. MasonCounty, W. Va.) against Bank of America, N.A. alleging West Virginia state antitrust violations in the municipalderivatives industry, seeking damages and alleging, among other things, a conspiracy to fix the pricing of, andmanipulate bids for, municipal derivatives, including GICs. An amended complaint in this action was filed in June2010, adding a federal antitrust claim and naming AGM (but not AGMH) and AGUS, among other defendants. Thiscase has been removed to federal court as well as transferred to the S.D.N.Y. and consolidated with MDL 1950 forpretrial proceedings. AGM and AGUS answered West Virginia’s Second Amended Complaint on November 11, 2013.The complaint in this lawsuit generally seeks civil penalties, unspecified monetary damages, interest, attorneys' fees,costs and other expenses. The Company cannot reasonably estimate the possible loss, if any, or range of loss that mayarise from this lawsuit.
ITEM 4. MINE SAFETY DISCLOSURES
Not applicable.
Executive Officers of the Company
The table below sets forth the names, ages, positions and business experience of the executive officers of AssuredGuaranty Ltd.
Name Age Position(s)
Dominic J. Frederico 61 President and Chief Executive Officer; Deputy ChairmanJames M. Michener 61 General Counsel and SecretaryRobert B. Mills 64 Chief Operating OfficerRussell B. Brewer II 56 Chief Surveillance OfficerRobert A. Bailenson 47 Chief Financial OfficerBruce E. Stern 59 Executive OfficerHoward W. Albert 54 Chief Risk Officer
has been President and Chief Executive Officer of AGL since December 2003. Mr. Fredericoserved as Vice Chairman of ACE Limited from June 2003 until April 2004 and served as President and Chief Operating Officerof ACE Limited and Chairman of ACE INA Holdings, Inc. from November 1999 to June 2003. Mr. Frederico was a director ofACE Limited from 2001 until his retirement from that board in May 2005. Mr. Frederico has also served as Chairman,President and Chief Executive Officer of ACE INA Holdings, Inc. from May 1999 through November 1999. Mr. Fredericopreviously served as President of ACE Bermuda Insurance Ltd. from July 1997 to May 1999, Executive Vice President,Underwriting from December 1996 to July 1997, and as Executive Vice President, Financial Lines from January 1995 toDecember 1996. Prior to joining ACE Limited, Mr. Frederico spent 13 years working for various subsidiaries of AmericanInternational Group ("AIG"). Mr. Frederico completed his employment at AIG after serving as Senior Vice President and ChiefFinancial Officer of AIG Risk Management. Before that, Mr. Frederico was Executive Vice President and Chief FinancialOfficer of UNAT, a wholly owned subsidiary of AIG headquartered in Paris, France.
has been General Counsel and Secretary of AGL since February 2004. Prior to joining AssuredGuaranty, Mr. Michener was General Counsel and Secretary of Travelers Property Casualty Corp. from January 2002 toFebruary 2004. From April 2001 to January 2002, Mr. Michener served as general counsel of Citigroup's Emerging Markets
67
0345r4.indd 69 3/19/14 3:28 PM

68
business. Prior to joining Citigroup's Emerging Markets business, Mr. Michener was General Counsel of Travelers Insurancefrom April 2000 to April 2001 and General Counsel of Travelers Property Casualty Corp. from May 1996 to April 2000.
Robert B. Mills has been Chief Operating Officer of AGL since June 2011. Mr. Mills was Chief Financial Officer ofAGL from January 2004 until June 2011. Prior to joining Assured Guaranty, Mr. Mills was Managing Director and ChiefFinancial Officer—Americas of UBS AG and UBS Investment Bank from April 1994 to January 2004, where he was also amember of the Investment Bank Board of Directors. Previously, Mr. Mills was with KPMG from 1971 to 1994, where hisresponsibilities included being partner-in-charge of the Investment Banking and Capital Markets practice.
Russell B. Brewer II has been Chief Surveillance Officer of AGL since November 2009 and Chief SurveillanceOfficer of AGC and AGM since July 2009. Mr. Brewer has been with AGM since 1986. Mr. Brewer was Chief RiskManagement Officer of AGM from September 2003 until July 2009 and Chief Underwriting Officer of AGM from September1990 until September 2003. Mr. Brewer was also a member of the Executive Management Committee of AGM. He was aManaging Director of AGMH from May 1999 until July 2009. From March 1989 to August 1990, Mr. Brewer was ManagingDirector, Asset Finance Group, of AGM. Prior to joining AGM, Mr. Brewer was an Associate Director of Moody's InvestorsService, Inc.
Robert A. Bailenson has been Chief Financial Officer of AGL since June 2011. Mr. Bailenson has been with AssuredGuaranty and its predecessor companies since 1990. Mr. Bailenson became Chief Accounting Officer of AGM in July 2009 andhas been Chief Accounting Officer of AGL since May 2005 and Chief Accounting Officer of AGC since 2003. He was ChiefFinancial Officer and Treasurer of AG Re from 1999 until 2003 and was previously the Assistant Controller of Capital ReCorp., the Company's predecessor.
Bruce E. Stern has been Executive Officer of AGC and AGM since July 2009. Mr. Stern was General Counsel,Managing Director, Secretary and Executive Management Committee member of AGM from 1987 until July 2009. Prior tojoining AGM, Mr. Stern was an associate at the New York office of Cravath, Swaine & Moore. Mr. Stern has served asChairman of the Association of Financial Guaranty Insurers since April 2010.
Howard W. Albert has been Chief Risk Officer of AGL since May 2011. Prior to that, he was Chief Credit Officer ofAGL from 2004 to April 2011. Mr. Albert joined Assured Guaranty in September 1999 as Chief Underwriting Officer ofCapital Re Company, the predecessor to AGC. Before joining Assured Guaranty, he was a Senior Vice President withRothschild Inc. from February 1997 to August 1999. Prior to that, he spent eight years at Financial Guaranty InsuranceCompany from May 1989 to February 1997, where he was responsible for underwriting guaranties of asset-backed securitiesand international infrastructure transactions. Prior to that, he was employed by Prudential Capital, an investment arm of ThePrudential Insurance Company of America, from September 1984 to April 1989, where he underwrote investments in asset-backed securities, corporate loans and project financings.
0345r4.indd 70 3/19/14 3:28 PM

69
PART II
ITEM 5. MARKET FOR REGISTRANT'S COMMON EQUITY, RELATED STOCKHOLDER MATTERS ANDISSUER PURCHASES OF EQUITY SECURITIES
AGL's common shares are listed on the New York Stock Exchange under symbol "AGO." The table below sets forth,for the calendar quarters indicated, the reported high and low sales prices and amount of any cash dividends declared.
Common Stock Prices and Dividends
2013 2012 Sales Price Cash Sales Price Cash High Low Dividends High Low Dividends
First Quarter $ 21.30 $ 13.95 $ 0.10 $ 19.04 $ 13.20 $ 0.09Second Quarter 24.73 18.92 0.10 16.58 11.17 0.09Third Quarter 23.64 18.42 0.10 15.83 11.29 0.09Fourth Quarter 24.81 17.80 0.10 14.80 12.48 0.09
On February 21, 2013, the closing price for AGL's common shares on the NYSE was $23.08, and the approximatenumber of shareholders of record at the close of business on that date was 111.
AGL is a holding company whose principal source of income is dividends from its operating subsidiaries. The ability ofthe operating subsidiaries to pay dividends to AGL and AGL's ability to pay dividends to its shareholders are each subject tolegal and regulatory restrictions. The declaration and payment of future dividends will be at the discretion of AGL's Board ofDirectors and will be dependent upon the Company's profits and financial requirements and other factors, including legalrestrictions on the payment of dividends and such other factors as the Board of Directors deems relevant. For more informationconcerning AGL's dividends, please refer to Item 7. Management's Discussion and Analysis of Financial Condition and Resultsof Operations under the caption "Liquidity and Capital Resources" and Note 12, Insurance Company Regulatory Requirements,of the Financial Statements and Supplementary Data.
Recent Purchases
During 2013, under the Company’s prior $315 million share repurchase authorization, the Company had repurchased atotal of 12.5 million common shares for approximately $264 million at an average price of $21.12 per share. This included 5.0million common shares purchased on June 5, 2013 from funds associated with WL Ross & Co. LLC and its affiliates(collectively, the “WLR Funds”) and Wilbur L. Ross, Jr., a director of the Company, for $109.7 million. This share purchasereduced the WLR Funds’ and Mr. Ross’s ownership of AGL's common shares to approximately 14.9 million common shares, orto approximately 8.2% of its total common shares outstanding, from approximately 10.5% of such outstanding common shares.
On November 11, 2013, the Company's prior share repurchase authorization was replaced by a new share repurchaseauthorization of $400 million. The Company expects the repurchases to be made from time to time in the open market or inprivately negotiated transactions. The timing, form and amount of the share repurchases under the program are at the discretionof management and will depend on a variety of factors, including availability of funds at the holding companies, marketconditions, the Company's capital position, legal requirements and other factors. The repurchase program may be modified,extended or terminated by the Board of Directors at any time. It does not have an expiration date.
During the three months ended December 31, 2013, the Company did not repurchase any shares under its sharerepurchase program or in connection with the payment of employee withholding taxes due in connection with the vesting ofrestricted stock awards.
Performance Graph
Set forth below are a line graph and a table comparing the dollar change in the cumulative total shareholder return onAGL's common shares from December 31, 2008 through December 31, 2013 as compared to the cumulative total return of theStandard & Poor's 500 Stock Index and the cumulative total return of the Standard & Poor's 500 Financials Index. The chartand table depict the value on December 31, 2008, December 31, 2009, December 31, 2010, December 31, 2011, December 31,2012 and December 31, 2013 of a $100 investment made on December 31, 2008, with all dividends reinvested:
0345r4.indd 71 3/19/14 3:28 PM

70
Assured Guaranty S&P 500 IndexS&P 500
Financial Index
12/31/2008 $ 100.00 $ 100.00 $ 100.0012/31/2009 193.65 126.45 117.1512/31/2010 159.12 145.49 131.3612/31/2011 119.69 148.56 108.9512/31/2012 133.06 172.32 140.2612/31/2013 224.66 228.12 190.18
___________________Source: Bloomberg
0345r4.indd 72 3/19/14 3:28 PM

71
ITEM 6. SELECTED FINANCIAL DATA
The following selected financial data should be read together with the other information contained in this Form 10-K,including "Management's Discussion and Analysis of Financial Condition and Results of Operations" and the consolidatedfinancial statements and related notes included elsewhere in this Form 10-K. Results of operations of AGMH are included forperiods beginning July 1, 2009, which we refer to as the Acquisition Date. Certain prior year balances have been reclassified toconform to the current year's presentation.
Year Ended December 31,
2013 2012 2011 2010 2009 (dollars in millions, except per share amounts)
Statement of operations data:Revenues:
Net earned premiums(1) $ 752 $ 853 $ 920 $ 1,187 $ 930Net investment income(1) 393 404 396 361 262Net realized investment gains (losses)(1) 52 1 (18) (2) (33)Realized gains and other settlements on creditderivatives (42) (108) 6 153 164Net unrealized gains (losses) on credit derivatives 107 (477) 554 (155) (338)Fair value gains (losses) on committed capitalsecurities 10 (18) 35 9 (123)Fair value gains (losses) on financial guarantyvariable interest entities(1) 346 191 (146) (274) (1)Other income (loss) (10) 108 58 34 56Total revenues 1,608 954 1,805 1,313 917
Expenses:
Loss and loss adjustment expenses(1) 154 504 448 412 394Amortization of deferred acquisition costs(2) 12 14 17 22 44Assured Guaranty Municipal Holdings Inc.acquisition-related expenses — — — 7 92Interest expense 82 92 99 100 63Goodwill and settlement of pre-existingrelationship — — — — 23Other operating expenses(2) 218 212 212 238 192Total expenses 466 822 776 779 808
Income (loss) before (benefit) provision for incometaxes 1,142 132 1,029 534 109Provision (benefit) for income taxes 334 22 256 50 29Net income (loss) 808 110 773 484 80
Less: Noncontrolling interest of variable interestentities — — — — (2)
Net income (loss) attributable to AssuredGuaranty Ltd. $ 808 $ 110 $ 773 $ 484 $ 82Earnings (loss) per share:
Basic $ 4.32 $ 0.58 $ 4.21 $ 2.63 $ 0.64Diluted $ 4.30 $ 0.57 $ 4.16 $ 2.56 $ 0.63
Dividends per share $ 0.40 $ 0.36 $ 0.18 $ 0.18 $ 0.18
0345r4.indd 73 3/19/14 3:28 PM

72
As of December 31, 2013 2012 2011 2010 2009 (dollars in millions, except per share amounts)
Balance sheet data (end of period):Assets:
Investments and cash $ 10,969 $ 11,223 $ 11,314 $ 10,849 $ 11,013Premiums receivable, net of commissions payable 876 1,005 1,003 1,168 1,418Ceded unearned premium reserve 452 561 709 822 1,078Salvage and subrogation recoverable 174 456 368 1,032 395Credit derivative assets 94 141 153 185 217Total assets 16,287 17,242 17,709 19,370 16,449
Liabilities and shareholders' equity:Unearned premium reserve 4,595 5,207 5,963 6,973 8,381Loss and loss adjustment expense reserve 592 601 679 574 300Reinsurance balances payable, net 148 219 171 274 212Long-term debt 816 836 1,038 1,053 1,066Credit derivative liabilities 1,787 1,934 1,457 2,055 1,759Total liabilities 11,172 12,248 13,057 15,700 12,995Accumulated other comprehensive income 160 515 368 112 142Shareholders' equity attributable to AssuredGuaranty Ltd. 5,115 4,994 4,652 3,670 3,455Shareholders' equity 5,115 4,994 4,652 3,670 3,454Book value per share 28.07 25.74 25.52 19.97 18.76
Consolidated statutory financial information(3):Contingency reserve $ 2,934 $ 2,364 $ 2,571 $ 2,288 $ 1,879Policyholders' surplus 3,202 3,579 3,116 2,627 2,962Claims paying resources(4) 12,147 12,328 12,839 12,630 13,051
Outstanding Exposure:Net debt service outstanding $ 690,535 $ 780,356 $ 844,447 $ 926,698 $ 958,037Net par outstanding 459,107 518,772 556,830 616,686 640,194
___________________
(1) Accounting guidance for variable interest entities ("VIEs") changed effective January 1, 2010. As a result, amounts are notcomparable.
(2) Accounting guidance restricting the types and amounts of financial guaranty insurance contract acquisition costs that may bedeferred was adopted and retrospectively applied effective January 1, 2012.
(3) Prepared in accordance with accounting practices prescribed or permitted by U.S. insurance regulatory authorities, for all insurancesubsidiaries.
(4) Claims paying resources is calculated as the sum of statutory policyholders' surplus, statutory contingency reserve, statutoryunearned premium reserves, statutory loss and LAE reserves, present value of installment premium on financial guaranty and creditderivatives, discounted at 6%, and standby lines of credit/stop loss. Total claims paying resources is used by the Company toevaluate the adequacy of capital resources.
0345r4.indd 74 3/19/14 3:28 PM

73
ITEM 7. MANAGEMENT'S DISCUSSION AND ANALYSIS OF FINANCIAL CONDITION AND RESULTS OFOPERATIONS
The following discussion and analysis of the Company’s financial condition and results of operations should be read inconjunction with the Company’s consolidated financial statements and accompanying notes which appear elsewhere in thisForm 10-K. It contains forward looking statements that involve risks and uncertainties. Please see “Forward LookingStatements” for more information. The Company's actual results could differ materially from those anticipated in these forwardlooking statements as a result of various factors, including those discussed below and elsewhere in this Form 10-K, particularlyunder the headings “Risk Factors” and “Forward Looking Statements.”
Introduction
The Company provides credit protection products to the U.S. and international public finance (includinginfrastructure) and structured finance markets. The Company applies its credit underwriting judgment, risk management skillsand capital markets experience to offer financial guaranty insurance that protects holders of debt instruments and othermonetary obligations from defaults in scheduled payments. If an obligor defaults on a scheduled payment due on an obligation,including a scheduled principal or interest payment (“Debt Service”), the Company is required under its unconditional andirrevocable financial guaranty to pay the amount of the shortfall to the holder of the obligation. Obligations insured by theCompany include bonds issued by U.S. state or municipal governmental authorities; notes issued to finance internationalinfrastructure projects; and asset-backed securities issued by special purpose entities. The Company markets its financialguaranty insurance directly to issuers and underwriters of public finance and structured finance securities as well as to investorsin such obligations. The Company guarantees obligations issued principally in the U.S. and the U.K. The Company alsoguarantees obligations issued in other countries and regions, including Australia and Western Europe.
Executive Summary
This executive summary of management’s discussion and analysis highlights selected information and may not containall of the information that is important to readers of this Annual Report. For a more detailed description of events, trends anduncertainties, as well as the capital, liquidity, credit, operational and market risks and the critical accounting policies andestimates affecting the Company, this Annual Report should be read in its entirety.
Economic Environment
Business conditions have been difficult for the entire financial guaranty insurance industry since mid-2007, and theindustry continues to face challenges in maintaining its market penetration. After a number of years in which Assured Guarantywas essentially the only active financial guarantor, a second monoline guarantor insured a number of small and medium-sizeissuances in 2013. The Company believes that the presence of a new financial guaranty insurer led to marginally higher overallinsurance penetration of the U.S. municipal bond market while also displacing the Company in certain insured transactions.
The overall economic environment in the U.S. has consistently, albeit slowly, recovered over the last few years in avolatile market environment. Indicators such as lower mortgage delinquency rates and increasing housing prices reflectedgradual improvement in the housing market. Notably, the stock market rose to record levels during 2013. Still, unemploymentrates remained relatively high, leading the Federal Reserve to maintain its program of quantitative easing to keep interest rateslow and stimulate economic activity. Although the Federal Reserve began to taper its quantitative easing program in December2013, management expects the Federal Reserve to do so at a measured pace and to employ conventional methods to maintain alow interest environment until it considers the unemployment problem addressed. A persistently low interest rate environmentwould continue to present challenges for the financial guaranty industry but could help stabilize municipal issuance volumefollowing a 15% decline in new issuances in 2013.
Although few municipalities have fully rebuilt reserves to pre-recession levels, most have been taking steps to addressthe ongoing fiscal challenges they have experienced since the global credit crisis of 2008 and the ensuing recession. Thisincludes, in many cases, significant unfunded pension and retiree healthcare liabilities. Revenues at the state level have beenrebounding in general, and while the strength of the housing recovery varies from region to region, property tax and otherrevenues have stabilized for most local governments. Although municipal defaults remain rare, a small number of municipalcredits have sought, though not always obtained, bankruptcy protection.
0345r4.indd 75 3/19/14 3:28 PM

74
Municipal bankruptcy is an area of law that is relatively undeveloped due to the relatively low frequency of suchcases. The Company has been active in efforts to resolve municipal bankruptcy cases involving Jefferson County, Alabama andthe cities of Stockton, California, and Detroit, Michigan. It has also been closely monitoring legal proceedings in othermunicipal bankruptcy cases in various states. In the cases of Jefferson County and Stockton, as well as the receivership ofHarrisburg, Pennsylvania, final or preliminary settlements have been reached. The publicity surrounding high-profile defaultsand bankruptcy filings, especially those few where bond insurers are paying claims, provides evidence of the value of bondinsurance; the Company believes this may stimulate demand for its product, especially at the retail level.
The Company is also closely following developments in the Commonwealth of Puerto Rico, which has significanteconomic challenges. Although recent announcements and actions by the current Governor and his administration indicateofficials of the Commonwealth are focused on measures that are intended to help Puerto Rico operate within its financialresources and maintain its access to capital markets, Puerto Rico faces high debt levels, a declining population and an economythat has been in recession since 2006. For additional information on the Company's exposure to Puerto Rico, please refer to"Insured Portfolio– Exposure to Puerto Rico" below.
Although annual new-money issuance volume in the U.S. public finance market changed little from 2012 to 2013,total new issue volume decreased in 2013 because refunding volume decreased approximately 30%. Additionally, the politicalappetite for incurring new debt was constrained as municipal budgets are still in a recovery mode from the financial recession.Low interest rates tend to suppress demand for bond insurance as the potential savings for issuers are less compelling and someinvestors prefer to forgo insurance in favor of greater yield.
In the international arena, troubled Eurozone countries continue to be a source of stress in global equity and debtmarkets. Following the 2011 restructuring of the sovereign debt of Greece, debt costs in Portugal, Spain and Italy remainelevated, although they have declined substantially since the European Central Bank’s August 2, 2012 announcement that itwould undertake outright monetary transactions in support of Eurozone sovereign bonds. Fiscal austerity programs initiated toaddress the problems in those and other European Union (“EU”) countries have constrained economic growth, although anumber of countries are in the process of emerging from recession. The rating agencies have downgraded many Europeansovereign credits. The Company’s exposure to troubled Eurozone countries is described in “–Results of Operations–Consolidated Results of Operations–Losses in the Insured Portfolio” and “–Insured Portfolio–Selected European Exposures.”
The economic environment since 2008 has had a significant negative impact on the demand by investors for financialguaranty policies, and it is uncertain when or if demand for financial guaranties will return to their pre-economic crisis level. Inparticular, there was limited new issue activity and also limited demand for financial guaranties in 2013 and 2012 in both theglobal structured finance and international infrastructure finance markets. In the latter, however, the Company’s three U.K.public-private partnership transactions in the second half of 2013 may signal that demand for capital market infrastructurefinancings, which have typically required financial guarantees, may be returning. In general, the Company expects that globalstructured finance and international infrastructure opportunities will increase in the future as the global economy recovers,interest rates rise, more issuers return to the capital markets for financings and institutional investors again utilize financialguaranties.
In 2013 and 2012, the Company continued to be affected by a negative perception of financial guaranty insurersarising from the financial distress suffered by other companies in the industry during the financial crisis. In November 2011,S&P downgraded the financial strength ratings of AGM and AGC to AA- (Stable Outlook) under its revised criteria. In January2013, after a ten-month review, Moody's assigned the following lower financial strength ratings: A2 (Stable) for AGM, A3(Stable) for AGC, and Baa1 (Stable) for AG Re. In February 2014, Moody's affirmed the A2 (Stable) for AGM and the A3(Stable) for AGC, but changed the outlook on the Baa1 for AG Re from stable to negative. The Company believes that Moody’sreview for possible downgrade of the financial strength ratings of Assured Guaranty that lasted throughout most of 2012contributed to a reduction in the demand for the Company's insurance product during that year. In a sign that the impact of theMoody’s downgrade has been limited, AGC's and AGM's credit spreads were narrower at June 30, 2013 than at January 1, 2013by 49% and 32%, respectively. In the second half of 2013, other market factors affected AGC’s and AGM’s credit spreads,which were 32% and 2% tighter at December 31, 2013 than at January 1, 2013. The higher the Company's credit spread, thelower the perceived benefit of the Company’s guaranty is to certain investors. If investors view the Company as being onlymarginally less risky, or perhaps even as risky, as the uninsured security, they may require almost as much, or as much, yield ona security insured by the Company as on a comparable security offered without insurance by the same issuer. Accordingly,issuers may be unwilling to pay a premium for the Company to insure their securities if the insurance does not lower the costsof borrowing. Although high compared with their pre-2007 levels, both AGC's and AGM's credit spreads were 9% and 16%,respectively, of their March 2009 peaks as of December 31, 2013.
0345r4.indd 76 3/19/14 3:28 PM

75
Financial Performance of Assured Guaranty
Financial Results
Year Ended December 31,
2013 2012 Change(in millions, except per share amounts)
Selected income statement dataNet earned premiums $ 752 $ 853 $ (101)Net investment income 393 404 (11)Realized gains (losses) and other settlements on credit derivatives (42) (108) 66Net unrealized gains (losses) on credit derivatives 107 (477) 584Fair value gains (losses) on financial guaranty variable interest entities 346 191 155Loss and loss adjustment expenses (154) (504) 350Other operating expenses (218) (212) (6)Net income (loss) 808 110 698Diluted earnings per share $ 4.30 $ 0.57 $ 3.73Selected non-GAAP measures(1)Operating income $ 609 $ 535 $ 74Operating income per share $ 3.25 $ 2.81 $ 0.44Present value of new business production (“PVP”) $ 141 $ 210 $ (69)____________________(1) Please refer to “—Non-GAAP Financial Measures" for a definition of the financial measures that were not
promulgated in accordance with GAAP and a reconciliation of the non-GAAP financial measure and the most directlycomparable GAAP financial measure, if available.
Net Income (Loss)
There are several primary drivers of volatility in reported net income or loss that are not necessarily indicative ofcredit impairment or improvement, or ultimate economic gains or losses: changes in credit spreads of insured credit derivativeobligations and financial guaranty variable interest entities' ("FG VIEs") assets and liabilities, changes in the Company's owncredit spreads, and changes in risk-free rates used to discount expected losses. Changes in credit spreads have the mostsignificant effect on changes in fair value of credit derivatives and FG VIE assets and liabilities. In addition to these factors,changes in expected losses, the timing of refundings and terminations, realized gains and losses on the investment portfolio(including other-than-temporary impairments), the effects of large settlements or transactions, and the effects of the Company'svarious loss mitigation strategies, among other factors, may also have a significant effect on reported net income or loss in agiven reporting period.
Net income for 2013 increased to $808 million from $110 million in 2012 due primarily to unrealized gains on creditderivatives, compared to unrealized losses in 2012, lower loss and loss adjustment expenses and higher FG VIE gains. Theunrealized gains on credit derivatives for 2013 were due to the termination of two large policies, the run-off of par outstandingand underlying asset price appreciation, while in 2012, the unrealized losses were due to the decline in the credit spreads onAGC and AGM. In 2013, the FG VIE gains were the result of R&W benefits on several VIE assets as a result of settlementswith various counterparties during the year. The decline in loss and loss adjustment expenses is due to lower U.S. RMBS lossesand lower non-U.S. public finance losses (2012 included losses on European exposures), partially offset by U.S. public financelosses. Net earned premiums in 2013 declined compared to 2012 due to the scheduled amortization of the insured portfolio.
Operating Income and Adjusted Book Value
In 2013, operating income, a non-GAAP financial measure, was $609 million, compared with $535 million in 2012.The increase in operating income was primarily due to lower loss expense. As of December 31, 2013, adjusted book value andadjusted book value per share, both of which are non-GAAP financial measures, were $9.0 billion and $49.58, respectively,compared to $9.2 billion and $47.17 as of December 31, 2012. Share repurchases in 2013 reduced adjusted book value, butincreased adjusted book value per share by $1.84. See Note 19, Shareholders' Equity, of the Financial Statements and
0345r4.indd 77 3/19/14 3:28 PM

76
Supplementary Data for additional detail about the common shares that the Company has repurchased in 2013 and see "–Non-GAAP Financial Measures" below for a description of these non-GAAP financial measures.
Key Business Strategies
In 2013, the Company’s key business strategies were comprised of: loss mitigation; new business development; andthe development of a strategy to manage capital more efficiently within the Assured Guaranty group.
Loss Mitigation
The Company continued its risk remediation strategies in 2013, which lowered losses and improved its rating agencycapital position. The Company believes that it is often in a better position to manage the risks in its insured portfolio and tomitigate losses from troubled credits than a bondholder or security holder would be, due to its knowledge about the terms of theinsured transactions, its surveillance and workout resources and, in some instances, the remedies available to it as an insurer.
In an effort to recover losses the Company experienced in its insured U.S. RMBS portfolio, the Company pursuesR&W providers by enforcing R&W provisions in contracts, negotiating agreements with R&W providers relating to thoseprovisions and, where appropriate, initiating litigation against R&W providers. See Note 6, Expected Loss to be Paid, of theFinancial Statements and Supplementary Data, for a discussion of the R&W settlements the Company has entered into and thelitigation proceedings the Company has initiated against R&W providers and other parties. In 2013, the Company entered intoseveral RMBS settlements that contributed $289 million to the R&W development. The Company's loss mitigation efforts inrespect of its U.S. RMBS exposure over the past several years have resulted in R&W providers paying or agreeing to pay,pursuant to settlement agreements and/or following favorable court decisions, an aggregate of $3.6 billion (gross ofreinsurance) in respect of R&W. The Company believes these results are significant and will enable it to pursue moreeffectively R&W providers for U.S. RMBS transactions it has insured.
In addition, the Company has been focused on the quality of servicing of the mortgage loans underlying its insuredRMBS transactions. Servicing influences collateral performance and ultimately the amount (if any) of the Company's insuredlosses. The Company has established a group to mitigate RMBS losses by influencing mortgage servicing, including, ifpossible, causing the transfer of servicing or establishing special servicing arrangements. “Special servicing” is an industry termreferencing more intense servicing applied to delinquent loans aimed at mitigating losses; special servicing arrangementsprovide incentives to a servicer to achieve better performance on the mortgage loans it services. As of December 31, 2013, theCompany's net insured par of the transactions subject to a servicing transfer was $2.3 billion and the net insured par of thetransactions subject to a special servicing arrangement was $843 million.
In the public finance and infrastructure finance arena, the Company has been able to negotiate consensualrestructurings with various obligors. During 2013, the Company reached agreements with respect to its exposures toMashantucket Pequot Tribe; Jefferson County, Alabama; Stockton, California and Harrisburg, Pennsylvania. The agreementwith respect to Stockton, California is still subject to Bankruptcy Court approval. In connection with the Jefferson County andHarrisburg settlements, the Company insured new revenue bonds for both municipalities, and the premium it was paid wasincluded as part of the 2013 PVP below. See “Selected U.S. Public Finance Transactions” in Note 6, Expected Loss to be Paid,of the Financial Statements and Supplementary Data, for a discussion of the respective arrangements reached.
The Company is also continuing to purchase attractively priced BIG obligations that it has insured. These purchasesresulted in a reduction of net expected loss to be paid of $573 million as of December 31, 2013. As of December 31, 2013, thefair value of assets purchased for loss mitigation purposes (excluding the value of the Company's insurance) was $537 million,with a par of $1,652 million (including bonds related to FG VIEs of $98 million in fair value and $695 million in par).
New Business Development
In July 2013, the Company completed a series of transactions that enabled it to begin offering financial guarantyinsurance through MAC, an insurer that will only underwrite U.S. public finance risk, focusing on investment grade obligationsin select sectors of the municipal market. The Company increased the capitalization of MAC, which it had acquired in May2012, and ceded to it a portfolio of geographically diversified U.S. public finance exposure from AGM and AGC. TheCompany believes MAC enhances its overall competitive position because it was able to begin operations with capitalconsisting of $400 million in surplus, $300 million in surplus notes issued to its parent Municipal Assurance Holdings Inc.("MAC Holdings") and $100 million in surplus notes issued to AGM, and with a seasoned book of U.S. public finance businesstotaling $111 billion in assumed par; it has a future stream of investment income and premiums earnings; and it has nostructured finance exposure. MAC has obtained financial strength ratings of AA+ (stable outlook) from Kroll and AA- (stable
0345r4.indd 78 3/19/14 3:28 PM

77
outlook) from S&P. It has also obtained licenses to provide financial guaranty insurance and reinsurance in 47 U.S.jurisdictions, including the District of Columbia. MAC issued its first financial guaranty insurance policy in August 2013.Additional information about the transactions the Company effected to establish MAC is set out in Note 12, InsuranceCompany Regulatory Requirements, of the Financial Statements and Supplementary Data.
In 2013, the Company continued to focus on new business production. During the year, it issued financial guarantyinsurance policies and financial guarantees in all of its markets: U.S. public finance, structured finance, and internationalinfrastructure. The average internal rating of the gross par written by the Company in 2013 was A-.
New Business Production
Year Ended December 31,2013 2012 2011
(in millions)
PVP(1):Public Finance—U.S.
Assumed from Radian Asset Assurance Inc. $ — $ 22 $ —Direct 116 144 173
Public Finance—non-U.S. 18 1 3Structured Finance—U.S. 7 43 60Structured Finance—non-U.S. — — 7
Total PVP $ 141 $ 210 243Gross Par Written:
Public Finance—U.S.Assumed from Radian Asset Assurance Inc. $ — $ 1,797 $ —Direct 8,671 14,364 15,092
Public Finance—non-U.S. 392 35 127Structured Finance—U.S. 287 620 1,673Structured Finance—non-U.S. — — —
Total gross par written $ 9,350 $ 16,816 16,892____________________(1) PVP represents the present value of estimated future earnings primarily on new financial guaranty contracts written in
the period, before consideration of cessions to reinsurers. See “--Non-GAAP Financial Measures--PVP or PresentValue of New Business Production” for a definition of this non-GAAP financial measure.
In the Company’s U.S. public finance business, PVP and gross par written have declined over the past three years dueto the low interest rate environment in the U.S., which results in lower demand for financial guaranty insurance from issuers;the low volume of new issuance in the U.S. public finance market, which results in fewer insurable bonds; increasedcompetition from a new financial guaranty insurer; and uncertainty over the financial strength ratings of AGM and AGC.However, the Company believes there will be continued demand for its insurance in this market because for those exposuresthat the Company guarantees, it undertakes the tasks of credit selection, analysis, negotiation of terms, surveillance and, ifnecessary, loss mitigation. The Company believes that its insurance encourages retail investors, who typically have fewerresources than the Company for analyzing municipal bonds, to purchase such bonds; enables institutional investors to operatemore efficiently; and allows smaller, less well-known issuers to gain market access on a more cost-effective basis.
The following tables present summarized information about the U.S. municipal market's new debt issuance volumeand the Company's share of that market over the past three years.
0345r4.indd 79 3/19/14 3:28 PM

78
New municipal bonds issued $ 311.9 10,558 $ 366.7 12,544 $ 285.2 10,176Total insured 12.1 1,025 13.2 1,159 15.2 1,228Insured by AGC, AGM and MAC 7.5 488 13.2 1,157 15.2 1,228
Market penetration par 3.9% 3.6% 5.3%Market penetration based on number of issues 9.7 9.2 12.1% of single A par sold 11.0 11.9 15.8% of single A transactions sold 30.6 29.5 37.8% of under $25 million par sold 10.9 11.7 14.7% of under $25 million transactions sold 10.7 10.3 13.2
U.S. public finance PVP, which increased in 2013, included written business related to the Jefferson County, Alabamaand Harrisburg, Pennsylvania debt restructurings. Structured finance PVP decreased in 2013; in that market, AGC guaranteedtransactions related to equipment leases and state insurance premium tax credits. International infrastructure PVP increased to$18 million due to the guarantee of three U.K. infrastructure transactions, the first wrapped U.K. infrastructure bonds since2008.
The Company has entered into several commutation agreements over the past three years to reassume previouslyceded books of business resulting in an increase to net unearned premiums of $100 million and an increase in net par of $18.5billion.
The Company reviewed strategies for improving the efficiency of its management of capital within the AssuredGuaranty group and decided that AGL would become tax resident in the United Kingdom, while remaining a Bermuda-basedcompany and continuing to carry on its administrative and head office functions in Bermuda. As a U.K. tax resident company,AGL will be subject to the tax rules applicable to companies resident in the U.K. For more information about AGL becoming aU.K. tax resident, see the "Tax Matters" section of "Item 1. Business."
The Company has utilized its capital to repurchase its common shares. As of December 31, 2013, the Company'sshare repurchase authorization was $400 million. In 2013, the Company had repurchased a total of 12.5 million commonshares for approximately $264 million at an average price of $21.12 per share. The Company expects future share repurchases,if any, to be made from time to time in the open market or in privately negotiated transactions. The timing, form and amount ofthe share repurchases under the program are at the discretion of management and will depend on a variety of factors, includingavailability of funds at the holding companies, market conditions, the Company's capital position, legal requirements and otherfactors. The repurchase program may be modified, extended or terminated by the Board of Directors at any time. It does nothave an expiration date. See Note 19, Shareholders' Equity, of the Financial Statements and Supplementary Data, for additionalinformation about the Company's repurchases of its common shares.
In order to reduce leverage, and possibly rating agency capital charges, the Company has mutually agreed withbeneficiaries to terminate selected financial guaranty insurance and credit derivative contracts. In particular, the Company hastargeted investment grade securities for which claims are not expected but which carry a disproportionately large rating agency
0345r4.indd 80 3/19/14 3:28 PM

79
capital charge. The Company terminated $7.1 billion in net par in 2013, $4.1 billion in net par in 2012 and $12.8 billion in netpar in 2011.
Results of Operations
Estimates and Assumptions
The Company’s consolidated financial statements include amounts that are determined using estimates andassumptions. The actual amounts realized could ultimately be materially different from the amounts currently provided for inthe Company’s consolidated financial statements. Management believes the most significant items requiring inherentlysubjective and complex estimates are expected losses, including assumptions for breaches of R&W, fair value estimates, other-than-temporary impairment, deferred income taxes, and premium revenue recognition. The following discussion of the resultsof operations includes information regarding the estimates and assumptions used for these items and should be read inconjunction with the notes to the Company’s consolidated financial statements.
An understanding of the Company’s accounting policies is of critical importance to understanding its consolidatedfinancial statements. See Part II, Item 8. “Financial Statements and Supplementary Data” for significant accounting policies,fair value methodologies and significant assumptions.
The Company carries a portion of its assets and liabilities at fair value, the majority of which are measured at fairvalue on a recurring basis. Level 3 assets, consisting primarily of financial guaranty variable interest entities’ assets, creditderivative assets and investments, represented approximately 25% of total assets measured at fair value on a recurring basis asof December 31, 2013 and 2012. All of the Company's liabilities measured at fair value on a recurring basis as of December 31,2013 and 2012 are Level 3. See Note 8, Fair Value Measurement, of the Financial Statements and Supplementary Data foradditional information about assets and liabilities classified as Level 3.
0345r4.indd 81 3/19/14 3:28 PM

80
Consolidated Results of Operations
Consolidated Results of Operations
Year Ended December 31,
2013 2012 2011(in millions)
Revenues:Net earned premiums $ 752 $ 853 $ 920Net investment income 393 404 396Net realized investment gains (losses) 52 1 (18)Net change in fair value of credit derivatives:
Realized gains (losses) and other settlements (42) (108) 6Net unrealized gains (losses) 107 (477) 554
Net change in fair value of credit derivatives 65 (585) 560Fair value gains (losses) on committed capital securities ("CCS") 10 (18) 35Fair value gains (losses) on FG VIEs 346 191 (146)Other income (loss) (10) 108 58
Total revenues 1,608 954 1,805Expenses:Loss and LAE 154 504 448Amortization of deferred acquisition costs 12 14 17Interest expense 82 92 99Other operating expenses 218 212 212
Total expenses 466 822 776Income (loss) before provision for income taxes 1,142 132 1,029Provision (benefit) for income taxes 334 22 256
Net income (loss) $ 808 $ 110 $ 773
0345r4.indd 82 3/19/14 3:28 PM

81
Net Earned Premiums
Net earned premiums are recognized over the contractual lives, or in the case of homogeneous pools of insuredobligations, the remaining expected lives, of financial guaranty insurance contracts. The Company estimates remainingexpected lives of its insured obligations and makes prospective adjustments for such changes in expected lives.
Net Earned Premiums
Year Ended December 31,
2013 2012 2011(in millions)
Financial guaranty:Public finance
Scheduled net earned premiums and accretion $ 292 $ 339 $ 360Accelerations(1) 207 250 125
Total public finance 499 589 485Structured finance
Scheduled net earned premiums and accretion 195 263 433Accelerations(1) 56 — —
Total structured finance(2) 251 263 433Other 2 1 2Total net earned premiums $ 752 $ 853 $ 920____________________(1) Reflects the unscheduled refunding of an insured obligation or the termination of the insurance on an insured
obligation.
(2) Excludes $60 million, $153 million and $75 million for 2013, 2012 and 2011, respectively, related to consolidated FGVIEs.
2013 compared with 2012: Net earned premiums decreased compared with 2012 due primarily to the scheduledamortization of the insured portfolio offset in part by higher premium accelerations due to refundings and terminations. AtDecember 31, 2013, $4.2 billion of net deferred premium revenue remained to be earned over the life of the insurancecontracts. Scheduled net earned premiums are expected to decrease each year unless replaced by a higher amount of newbusiness or reassumptions of previously ceded business. See Note 4, Financial Guaranty Insurance Premiums, of the FinancialStatements and Supplementary Data, for the expected timing of future premium earnings.
2012 compared with 2011: Net earned premiums decreased compared with 2011 due primarily to the scheduledamortization of the structured finance insured portfolio, offset in part by an increase in premium accelerations due to refundingsand terminations. Refundings were higher due to the low interest rate environment, which encourages refinancings of relativelymore expensive debt obligations with lower cost debt obligations. At December 31, 2012, $4.8 billion of net deferred premiumrevenue remained to be earned over the life of the insurance contracts. Before considering the elimination of premiums relatedto consolidated FG VIEs, net earned premiums increased primarily due to the acceleration of $82 million in net earnedpremiums on two transactions that are accounted for as FG VIEs, for which the Company's financial guaranty insuranceobligation was terminated.
Net Investment Income
Net investment income is a function of the yield that the Company earns on invested assets and the size of theportfolio. The investment yield is a function of market interest rates at the time of investment as well as the type, credit qualityand maturity of the invested assets.
0345r4.indd 83 3/19/14 3:28 PM

82
Net Investment Income (1)
Year Ended December 31,2013 2012 2011
(in millions)
Income from fixed-maturity securities managed by third parties $ 322 $ 346 $ 359Income from internally managed securities:
Fixed maturities 74 60 39Other invested assets 5 6 6
Other 0 1 1Gross investment income 401 413 405
Investment expenses (8) (9) (9)Net investment income $ 393 $ 404 $ 396
____________________(1) Net investment income excludes $13 million for 2013 and 2012 and $8 million for 2011 related to consolidated FG
VIEs.
2013 compared with 2012: Net investment income decreased primarily due to lower reinvestment rates, partially offsetby higher income earned on loss mitigation bonds, which the Company generally purchased at a discount resulting in higheryields. The overall pre-tax book yield was 3.79% at December 31, 2013 and 3.85% at December 31, 2012, respectively.
2012 compared with 2011: Net investment income increased primarily due to higher income earned on loss mitigationbonds, which the Company generally purchased at a discount and which carry high investment yields. Income earned on theexternally managed portfolio declined due to a lower fixed maturity balance and lower reinvestment rates. The overall pre-taxbook yield was 3.85% at December 31, 2012 and 4.00% at December 31, 2011, respectively.
Net Realized Investment Gains (Losses)
The table below presents the components of net realized investment gains (losses). See Note 11, Investments andCash, of the Financial Statements and Supplementary Data.
Net Realized Investment Gains (Losses)
Year Ended December 31,2013 2012 2011
(in millions)
Gross realized gains on investment portfolio $ 113 $ 43 $ 37Gross realized losses on investment portfolio (19) (25) (10)Other-than-temporary impairment (1) (42) (17) (45)
Net realized investment gains (losses) $ 52 $ 1 $ (18)____________________(1) Net realized investment gains (losses) reported in accordance with GAAP exclude other-than-temporary impairment
related to consolidated FG VIEs of $2 million for 2013, $4 million for 2012 and $12 million for 2011.
The increase in gross realized gains on investment portfolio in 2013 when compared to 2012 was due to sales of assetsacquired as part of negotiated settlements, bonds purchased for loss mitigation purposes and other invested assets. Other-than-temporary impairment for all three years was primarily attributable to securities that were acquired for loss mitigation purposes.
Other Income
Other income is comprised of recurring items such as foreign exchange remeasurement gains and losses, ancillary feeson financial guaranty policies such as commitment, consent and processing fees, and other revenue items on financial guarantyinsurance and reinsurance contracts such as commutation gains on re-assumptions of previously ceded business.
0345r4.indd 84 3/19/14 3:28 PM
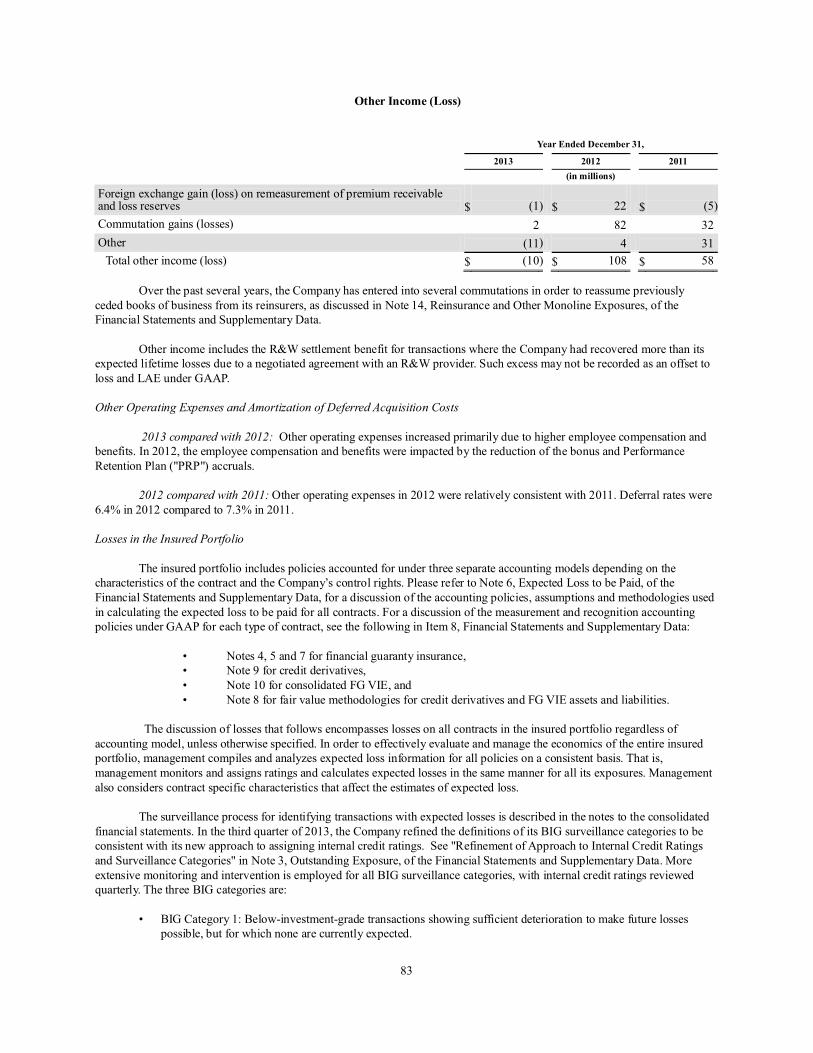
83
Other Income (Loss)
Year Ended December 31,
2013 2012 2011(in millions)
Foreign exchange gain (loss) on remeasurement of premium receivableand loss reserves $ (1) $ 22 $ (5)Commutation gains (losses) 2 82 32Other (11) 4 31
Total other income (loss) $ (10) $ 108 $ 58
Over the past several years, the Company has entered into several commutations in order to reassume previouslyceded books of business from its reinsurers, as discussed in Note 14, Reinsurance and Other Monoline Exposures, of theFinancial Statements and Supplementary Data.
Other income includes the R&W settlement benefit for transactions where the Company had recovered more than itsexpected lifetime losses due to a negotiated agreement with an R&W provider. Such excess may not be recorded as an offset toloss and LAE under GAAP.
Other Operating Expenses and Amortization of Deferred Acquisition Costs
2013 compared with 2012: Other operating expenses increased primarily due to higher employee compensation andbenefits. In 2012, the employee compensation and benefits were impacted by the reduction of the bonus and PerformanceRetention Plan ("PRP") accruals.
2012 compared with 2011: Other operating expenses in 2012 were relatively consistent with 2011. Deferral rates were6.4% in 2012 compared to 7.3% in 2011.
Losses in the Insured Portfolio
The insured portfolio includes policies accounted for under three separate accounting models depending on thecharacteristics of the contract and the Company’s control rights. Please refer to Note 6, Expected Loss to be Paid, of theFinancial Statements and Supplementary Data, for a discussion of the accounting policies, assumptions and methodologies usedin calculating the expected loss to be paid for all contracts. For a discussion of the measurement and recognition accountingpolicies under GAAP for each type of contract, see the following in Item 8, Financial Statements and Supplementary Data:
• Notes 4, 5 and 7 for financial guaranty insurance,• Note 9 for credit derivatives,• Note 10 for consolidated FG VIE, and• Note 8 for fair value methodologies for credit derivatives and FG VIE assets and liabilities.
The discussion of losses that follows encompasses losses on all contracts in the insured portfolio regardless ofaccounting model, unless otherwise specified. In order to effectively evaluate and manage the economics of the entire insuredportfolio, management compiles and analyzes expected loss information for all policies on a consistent basis. That is,management monitors and assigns ratings and calculates expected losses in the same manner for all its exposures. Managementalso considers contract specific characteristics that affect the estimates of expected loss.
The surveillance process for identifying transactions with expected losses is described in the notes to the consolidatedfinancial statements. In the third quarter of 2013, the Company refined the definitions of its BIG surveillance categories to beconsistent with its new approach to assigning internal credit ratings. See "Refinement of Approach to Internal Credit Ratingsand Surveillance Categories" in Note 3, Outstanding Exposure, of the Financial Statements and Supplementary Data. Moreextensive monitoring and intervention is employed for all BIG surveillance categories, with internal credit ratings reviewedquarterly. The three BIG categories are:
• BIG Category 1: Below-investment-grade transactions showing sufficient deterioration to make future lossespossible, but for which none are currently expected.
0345r4.indd 85 3/19/14 3:28 PM

84
• BIG Category 2: Below-investment-grade transactions for which future losses are expected but for which noclaims (other than liquidity claims which is a claim that the Company expects to be reimbursed within one year)have yet been paid.
• BIG Category 3: Below-investment-grade transactions for which future losses are expected and on which claims(other than liquidity claims) have been paid.
BIG Net Par Outstanding and Number of Risks
Net Par Outstandingas of December 31,
Number of Risks (1)as of December 31,
Description 2013 2012 2013 2012(dollars in millions)
BIG:Category 1 $ 14,751 $ 10,820 210 196Category 2 3,949 4,617 101 103Category 3 3,838 6,860 146 160
Total BIG $ 22,538 $ 22,297 457 459____________________(1) A risk represents the aggregate of the financial guaranty policies that share the same revenue source for purposes of
making debt service payments.
The increase in BIG net par outstanding was due primarily to the downgrade of most of the Company's insured PuertoRico credits from investment grade to the BIG 1 category, offset in part by the run off of BIG U.S. RMBS exposures.
Net Expected Loss
Net expected loss to be paid consists primarily of the present value of future: expected claim payments, expectedrecoveries of excess spread in the transaction structures, cessions to reinsurers, and expected recoveries for breaches of R&Wand the effects of other loss mitigation strategies. Current risk free rates are used to discount expected losses at the end of eachreporting period and therefore changes in such rates from period to period affect the expected loss estimates reported. Theeffect of changes in discount rates are included in net economic loss development, however, economic loss developmentattributable to changes in discount rates is not indicative of credit impairment or improvement. Assumptions used in thedetermination of the net expected loss to be paid such as delinquency, severity, and discount rates and expected timeframes torecovery in the mortgage market were consistent by sector regardless of the accounting model used. The primary drivers ofchanges in expected loss to be paid are discussed below.
The primary difference between net economic loss development and loss expense included in operating income relatesto the consideration of deferred premium revenue in the calculation of loss reserves and loss expense. For financial guarantyinsurance contracts, a loss is generally recorded only when expected losses exceed deferred premium revenue. Therefore, thetiming of loss recognition does not necessarily coincide with the timing of the actual credit impairment or improvementreported in net economic loss development. AGM's U.S. RMBS transactions generally have the largest deferred premiumrevenue balances because of the purchase accounting adjustments that were made in 2009 in connection with AssuredGuaranty's purchase of AGM, and therefore the largest differences between net economic loss development and loss expenserelate to AGM policies. See "–Losses Incurred" below.
0345r4.indd 86 3/19/14 3:28 PM

85
Economic Loss Development (1)
Year Ended December 31,
2013 2012 2011(in millions)
U.S. RMBS before benefit for recoveries for breaches of R&W $ 140 $ 367 $ 1,039Net benefit for recoveries for breaches of R&W (296) (179) (1,038)
U.S. RMBS after benefit for recoveries for breaches of R&W (156) 188 1Other structured finance (34) (28) 80Public finance 256 295 43Other (10) (17) —
Total $ 56 $ 438 $ 124____________________(1) Economic loss development includes the effects of changes in assumptions based on observed market trends, changes
in discount rates, accretion of discount and the economic effects of loss mitigation efforts.
Claims (Paid) Recovered (1)
Year Ended December 31,
2013 2012 2011(in millions)
U.S. RMBS before benefit for recoveries for breaches of R&W $ (587) $ (996) $ (1,051)Net benefit for recoveries for breaches of R&W 954 459 1,059
U.S. RMBS after benefit for recoveries for breaches of R&W 367 (537) 8Other structured finance (134) (39) (26)Public finance (2) 6 (303) (65)Other 10 12 —
Total $ 249 $ (867) $ (83)____________________(1) Includes cash paid and recovered, as well as non-cash settlement of claims such as those negotiated in restructurings
where the Company receives securities instead of cash.(2) The largest component of claims paid in 2012 was related to exposure to Greek sovereign debt which has been fully
settled.
Net Expected Loss to be Paid
As ofDecember 31, 2013
As ofDecember 31, 2012
(in millions)
U.S. RMBS before benefit for recoveries for breaches of R&W $ 1,205 $ 1,652Net benefit for recoveries for breaches of R&W (712) (1,370)
U.S. RMBS after benefit for recoveries for breaches of R&W 493 282Other structured finance 171 339Public finance 321 59Other (3) (3)
Total $ 982 $ 677
2013 Net Economic Loss Development
Total economic loss development was $56 million in 2013, primarily due to U.S. public finance losses related toDetroit, Puerto Rico and Harrisburg, partially offset by favorable development in U.S. RMBS due to the various settlements
0345r4.indd 87 3/19/14 3:28 PM

86
during the year. Excluding the settlements, U.S. RMBS loss development was primarily due to the change in assumptions forfirst liens. The risk-free rates used to discount expected losses ranged from 0.0% to 4.44% as of December 31, 2013 comparedwith 0.0% to 3.28% as of December 31, 2012.
U.S. Public Finance Economic Loss Development: The Company insures general obligation bonds of theCommonwealth of Puerto Rico and various obligations of its related authorities and public corporations aggregating $5.4billion net par. The Company rates $5.2 billion net par of that amount BIG. Although recent announcements and actions by thecurrent Governor and his administration indicate officials of the Commonwealth are focused on measures that are intended tohelp Puerto Rico operate within its financial resources and maintain its access to the capital markets, Puerto Rico facessignificant challenges, including high debt levels, a declining population and an economy that has been in recession since 2006.Puerto Rico has been operating with a structural budget deficit in recent years, and its two largest pension funds aresignificantly underfunded. In February 2014, S&P, Moody's and Fitch Ratings downgraded much of the debt of Puerto Ricoand its related authorities and public corporations to below investment grade, citing various factors including limited liquidityand market access risk. The Commonwealth has not defaulted on any of its debt. Neither Puerto Rico nor its related authoritiesand public corporations are eligible debtors under Chapter 9 of the U.S. Bankruptcy Code. Information regarding theCompany's exposure to general obligations of Commonwealth of Puerto Rico and various obligations of its related authoritiesand public corporations, please refer to "Insured Portfolio—Exposure to Puerto Rico" below.
Many U.S. municipalities and related entities continue to be under increased pressure, and a few have filed forprotection under the U.S. Bankruptcy Code, entered into state processes designed to help municipalities in fiscal distress orotherwise indicated they may consider not meeting their obligations to make timely payments on their debts. Given some ofthese developments, and the circumstances surrounding each instance, the ultimate outcome cannot be certain and may lead toan increase in defaults on some of the Company's insured public finance obligations. The Company will continue to analyzedevelopments in each of these matters closely. The municipalities whose obligations the Company has insured that have filedfor protection under Chapter 9 of the U.S Bankruptcy Code are: Detroit, Michigan; Jefferson County, Alabama; and Stockton,California. The City Council of Harrisburg, Pennsylvania had also filed a purported bankruptcy petition, which was laterdismissed by the bankruptcy court; a receiver for the City of Harrisburg was appointed by the Commonwealth Court ofPennsylvania on December 2, 2011. In 2013, the Company reached agreements with Jefferson County, Harrisburg andStockton. See “Selected U.S. Public Finance Transactions” in Note 6, Expected Loss to be Paid, of the Financial Statementsand Supplementary Data, for a discussion of respective arrangements reached.
The net par outstanding for these and all other BIG rated U.S. public finance obligations was $9.1 billion as ofDecember 31, 2013 and $4.6 billion as of December 31, 2012. The Company projects that its total future expected net lossacross its troubled U.S. public finance credits as of December 31, 2013 will be $264 million, up from $7 million as ofDecember 31, 2012.
U.S. RMBS Economic Loss Development: The Company projects losses on its insured U.S. RMBS on a transaction-by-transaction basis by projecting the performance of the underlying pool of mortgages over time and then applying thestructural features (i.e., payment priorities or tranching) of the RMBS to the projected performance of the collateral over time.The resulting projected claim payments or reimbursements are then discounted using risk-free rates. For transactions where theCompany projects it will receive recoveries from providers of R&W, it projects the amount of recoveries and either establishesa recovery for claims already paid or reduces its projected claim payments accordingly.
The Company's RMBS loss projection methodology assumes that the housing and mortgage markets will continueimproving. Each quarter the Company makes a judgment as to whether to change the assumptions it uses to make RMBS lossprojections based on its observation during the quarter of the performance of its insured transactions (including early stagedelinquencies, late stage delinquencies and, for first liens, loss severity) as well as the residential property market and economyin general, and, to the extent it observes changes, it makes a judgment as whether those changes are normal fluctuations or partof a trend. Based on such observations the Company chose to use the same general approach (with the refinements describedbelow) to project RMBS losses as of December 31, 2013 as it used as of December 31, 2012. The Company's use of the samegeneral methodology to project RMBS losses as of December 31, 2013 as it used as of December 31, 2012 was consistent withits view at December 31, 2013 that the housing and mortgage market recovery was occurring at a slower pace than itanticipated at December 31, 2012.
The Company refined its first lien RMBS loss projection methodology as of December 31, 2013 to model explicitlythe behavior of borrowers with loans that had been modified. The Company has observed that mortgage loan servicers weremodifying more mortgage loans (reducing or forbearing from collecting interest or principal or both due on mortgage loans) toreduce the borrowers’ monthly payments and so improve their payment performance than was the case before the mortgagecrisis. Borrowers who are current based on their new, reduced monthly payments are generally reported as current, but are more
0345r4.indd 88 3/19/14 3:28 PM

87
likely to default than borrowers who are current and whose loans have not been modified. The Company believes modifiedloans are most likely to default again during the first year after modification. The Company set its liquidation rate assumptionsas of December 31, 2012 based on observed roll rates and with modification activity in mind. As of December 31, 2013 theCompany made a number of refinements to its first lien RMBS loss projection assumptions to treat loan modificationsexplicitly. Specifically, in the base case approach, it:
• established a liquidation rate assumption for loans reported as current but that had been reported as modifiedin the previous 12 months,
• assumed that currently delinquent loans that did not roll to liquidation would behave like modified loans, andso applied the modified loan liquidation rate to them,
• increased from two to three years the period over which it calculates the initial conditional default rate("CDR") based on assumed liquidations of non-performing loans and modified loans, to account for thelonger period modified loans will take to default,
• increased the period it assumes the transactions will experience the initial loss severity assumption before itimproves and the period during which the transaction will experience low voluntary prepayment rates,
• established an assumption for servicers not to advance loan payments on all delinquent loans
The methodology and revised assumptions the Company uses to project first lien RMBS losses and the scenarios itemploys are described in more detail Note 6, Expected Loss to be Paid, of the Financial Statements and Supplementary Data.The refinement in assumptions described above resulted in a reduction of the initial CDRs but the application of the initialCDRs for a longer period, which generally resulted in a higher amount of loans being liquidated at the initial CDR under therefined assumptions than under the initial CDR under the previous assumptions. The Company estimated the impact of all ofthe refinements to its assumptions described above to be an increase of expected losses of approximately $8 million (beforeadjustments for settlements or loss mitigation purchases) by running on the first lien RMBS portfolio as of December 31, 2013base case assumptions similar to what it used as of December 31, 2012 and comparing those results to the results from therefined assumptions.
During 2013 the Company observed improvements in the performance of its second lien RMBS transactions that,when viewed in the context of their performance prior to 2013, suggested those transactions were beginning to respond to theimprovements in the residential property market and economy being widely reported by market observers. Based on suchobservations, in projecting losses for second lien RMBS the Company chose to decrease by two months in its base scenario andby three months in its optimistic scenario the period it assumed it would take the mortgage market to recover as compared toDecember 31, 2012. Also during 2013 the Company observed material improvements in the delinquency measures of certainsecond lien RMBS for which the servicing had been transferred, and made certain adjustments on just those transactions toreflect its view that much of this improvement was due to loan modifications and reinstatements made by the new servicer andthat such recently modified and reinstated loans may have a higher likelihood of defaulting again. The methodology andassumptions the Company uses to project second lien RMBS losses and the scenarios it employs are described in more detail inNote 6, Expected Loss to be Paid, of the Financial Statements and Supplementary Data.
The Company observed some improvement in delinquency trends in most of its RMBS transactions during 2013, withsome of that improvement in second liens driven by servicing transfers it effectuated. Such improvement is naturallytransmitted to its projections for each individual RMBS transaction, since the projections are based on the delinquencyperformance of the loans in that individual transaction.
Generally, when mortgage loans are transferred into a securitization, the loan originator(s) and/or sponsor(s) provideR&W that the loans meet certain characteristics, and a breach of such R&W often requires that the loan be repurchased fromthe securitization. In many of the transactions the Company insures, it is in a position to enforce these R&W provisions. Soonafter the Company observed the deterioration in the performance of its insured RMBS following the deterioration of theresidential mortgage and property markets, the Company began using internal resources as well as third party forensicunderwriting firms and legal firms to pursue breaches of R&W on a loan-by-loan basis. Where a provider of R&W refused tohonor its repurchase obligations, the Company sometimes chose to initiate litigation. See “Recovery Litigation—RMBSTransactions," section of Note 6, Expected Loss to be Paid, of the Financial Statements and Supplementary Data. TheCompany's success in pursuing these strategies permitted the Company to enter into agreements with R&W providers underwhich those providers made payments to the Company, agreed to make payments to the Company in the future, and / orrepurchased loans from the transactions, all in return for releases of related liability by the Company. Such agreements provide
0345r4.indd 89 3/19/14 3:28 PM

88
the Company with many of the benefits of pursuing the R&W claims on a loan by loan basis or through litigation, but withoutthe related expense and uncertainty. The Company continues to pursue these strategies against R&W providers with which itdoes not yet have agreements.
Using these strategies, through December 31, 2013 the Company has caused entities providing R&Ws to pay or agreeto pay approximately $3.6 billion (gross of reinsurance) in respect of their R&W liabilities for transactions in which theCompany has provided insurance.
(in millions)
Agreement amounts already received $ 2,608Agreement amounts projected to be received in the future 425Repurchase amounts paid into the relevant RMBS prior to settlement (1) 578
Total R&W payments, gross of reinsurance $ 3,611____________________(1) These amounts were paid into the relevant RMBS transactions (rather than to the Company as in most settlements) and
distributed in accordance with the priority of payments set out in the relevant transaction documents. Because theCompany may insure only a portion of the capital structure of a transaction, such payments will not necessarilydirectly benefit the Company dollar-for-dollar, especially in first lien transactions.
Based on this success, the Company has included in its net expected loss estimates as of December 31, 2013 anestimated net benefit related to breaches of R&W of $712 million, which includes $413 million from agreements with R&Wproviders and $299 million in transactions where the Company does not yet have such an agreement, all net of reinsurance.
Developments in the Company's R&W recovery efforts are included in economic loss development. The followingtable provides a breakdown of the development and accretion amount in the roll forward of estimated recoveries associatedwith alleged breaches of R&W.
Components of R&W Development
Year Ended December31, 2013
(in millions)
Inclusion (removal) of deals with breaches of R&W during period $ 6Change in recovery assumptions as the result of additional file review and recovery success (6)Estimated increase (decrease) in defaults that will result in additional (lower) breaches (8)Results of settlements 289Accretion of discount on balance 15
Total $ 296
Infrastructure: The Company has insured exposure of approximately $3.0 billion to infrastructure transactions withrefinancing risk as to which the Company may need to make claim payments that it did not anticipate paying when the policieswere issued. For more information about this risk, see the Risk Factor captioned "Estimates of expected losses are subject touncertainties and may not be adequate to cover potential paid claims" under Risks Related to the Company's Expected Lossesin "Item 1A. Risk Factors."
2012 Net Economic Loss Development
Total economic loss development in 2012 was $438 million, which was primarily driven by losses on its troubledEuropean exposures, particularly a $189 million loss in relation to the Company's Greek sovereign bond exposures and lossdevelopment on Spanish sub-sovereign exposures, higher U.S. RMBS and U.S. public finance losses, offset in part by positivedevelopments in the TruPS portfolio. Changes in discount rates did not have a significant effect on economic loss developmentin 2012 as the risk-free rates used to discount expected losses ranged from 0.0% to 3.28% as of December 31, 2012 comparedwith 0.0% to 3.27% as of December 31, 2011.
0345r4.indd 90 3/19/14 3:28 PM

89
Based on the Company’s observation during 2012 of the performance of its insured transactions (including early stagedelinquencies, late stage delinquencies and, for first liens, loss severity) as well as the residential property market and economyin general, the Company chose to use essentially the same assumptions and scenarios to project RMBS loss as of December 31,2012 as it used as of December 31, 2011, except that as compared to December 31, 2011:
• in its most optimistic scenario, it reduced by three months the period it assumed it would take the mortgagemarket to recover; and
• in its most pessimistic scenario, it increased by three months the period it assumed it would take the mortgagemarket to recover.
The Company's use of essentially the same assumptions and scenarios to project RMBS losses as of December 31,2012 and December 31, 2011 was consistent with its view at December 31, 2012 that the housing and mortgage marketrecovery was occurring at a slower pace than it anticipated at December 31, 2011. The Company's changes during 2012 to theperiod it would take the mortgage market to recover in its most optimistic scenario and its most pessimistic scenario allowed itto consider a wider range of possibilities for the speed of the recovery. Since the Company's projections for each RMBStransaction are based on the delinquency performance of the loans in that individual RMBS transaction, improvement ordeterioration in that aspect of a transaction's performance impacts the projections for that transaction. The methodology theCompany used to project RMBS losses and the scenarios it employs are described in more detail in Note 6, Expected Loss to bePaid, of the Financial Statements and Supplementary Data.
Developments in the Company's R&W recovery efforts are also included in economic loss development. Thefollowing table provides a breakdown of the development and accretion amount in the roll forward of estimated recoveriesassociated with alleged breaches of R&W.
Components of R&W Development
Year Ended December31, 2012
(in millions)
Inclusion (removal) of deals with breaches of R&W during period $ (3)Change in recovery assumptions as the result of additional file review and recovery success (10)Estimated increase (decrease) in defaults that will result in additional (lower) breaches 63Results of settlements and judgments 120Accretion of discount on balance 9
Total $ 179
The net par outstanding for BIG rated U.S. public finance obligations, including Jefferson County, Alabama andStockton, California, was $4.6 billion as of December 31, 2012 and $4.5 billion as of December 31, 2011. The Companyprojected that its total future expected net loss across its troubled U.S. public finance credits (after projected recoveries ofclaims already paid) was $7 million as of December 31, 2012, down from $16 million as of December 31, 2011.
2011 Net Economic Loss Development
Net economic loss development in 2011 was $124 million, which was driven primarily by non-U.S. RMBS structuredfinance and non U.S public finance obligations. In the non U.S. RMBS structured finance portfolio, economic loss developmentwas primarily driven by the decline in risk free rates used to discount expected losses. Loss development in life insurance andfilm securitizations also contributed to the net loss development, offset in part by positive development in the TruPS portfolio.Economic loss development in the non- U.S. public finance portfolio was comprised mainly of the probability weighted lossestimate on exposures to Greek sovereign debt based on information available at that time. In the U.S. RMBS portfolio, lossdevelopment was offset by positive developments in actual and expected recoveries for breaches of R&W. Changes in discountrates had a significant effect on the economic loss development in 2011 as the rates ranged from 0.0% to 3.27% as of December31, 2011 compared with 0.0% to 5.34% as of December 31, 2010.
During each quarter of 2011 also the Company made a judgment as to whether to change the assumptions it used tomake RMBS loss projections based on its observation during the quarter of the performance of its insured transactions
0345r4.indd 91 3/19/14 3:28 PM

90
(including early stage delinquencies, late stage delinquencies and, for first liens, loss severity) as well as the residential propertymarket and economy in general, and, to the extent it observed changes, it made a judgment as whether those changes werenormal fluctuations or part of a trend. Based on such observations, the Company chose to use essentially the same assumptionsand scenarios to project RMBS loss as of December 31, 2011 as it used as of December 31, 2010, except that as compared toDecember 31, 2010:
• based on its observation of the slow mortgage market recovery, the Company increased its base case expectedperiod for reaching the final conditional default rate in second lien transactions and adjusted the probabilityweightings it applied to second lien scenarios from year-end 2010 to reflect the changes to those scenarios;
• also based on its observation of the slow mortgage market recovery the Company added a more stressful first lienscenario at year-end 2011 reflecting an even slower potential recovery in the housing and mortgage markets,making what had prior to that been a stress scenario its base scenario;
• based on its observation of increased loss severity rates, the Company increased its projected loss severity rates invarious of its first lien scenarios; and
• based on its observation of liquidation rates, the Company decreased the liquidation rates it applied to non-performing loans.
The Company's use of essentially the same methodology and scenarios to project RMBS losses as of December 31,2011 and as at December 31, 2010 was consistent with its view at December 31, 2011 that the housing and mortgage marketrecovery was occurring at a slower pace than it anticipated at December 31, 2010. Since the Company's projections for eachRMBS transaction are based on the delinquency performance of the loans in that individual RMBS transaction, improvement ordeterioration in that aspect of a transaction's performance impacts the projections for that transaction.
Developments in the Company's R&W recovery efforts are also included in economic loss development. Thefollowing table provides a breakdown of the development and accretion amount in the roll forward of estimated recoveriesassociated with alleged breaches of R&W.
Components of R&W Development
Year Ended December31, 2011
(in millions)
Inclusion (removal) of deals with breaches of R&W during period $ 115Change in recovery assumptions as the result of additional file review and recovery success 218Estimated increase (decrease) in defaults that will result in additional (lower) breaches 17Results of settlements 668Accretion of discount on balance 20
Total $ 1,038
Losses Incurred
For transactions accounted for as financial guaranty insurance under GAAP, each transaction’s expected loss to beexpensed, net of estimated R&W recoveries, is compared with the deferred premium revenue of that transaction. Generally,when the expected loss to be expensed exceeds the deferred premium revenue, a loss is recognized in the income statement forthe amount of such excess.
When the Company measures operating income, a non-GAAP financial measure, it calculates the credit derivative andFG VIE losses incurred in a similar manner. Changes in fair value in excess of expected loss that are not indicative of economicdeterioration or improvement are not included in operating income.
Expected loss to be paid, as discussed above under "Losses in the Insured Portfolio", is an important liquidity measurein that it provides the present value of amounts that the Company expects to pay or recover in future periods. Expected loss tobe expensed is important because it presents the Company’s projection of incurred losses that will be recognized in future
0345r4.indd 92 3/19/14 3:28 PM

91
periods as deferred premium revenue amortizes into income on financial guaranty insurance policies. Expected loss to be paidfor FG VIEs pursuant to AGC’s and AGM’s financial guaranty policies is calculated in a manner consistent with financialguaranty insurance contracts, but eliminated in consolidation under GAAP.
The following tables present the loss and LAE recorded in the consolidated statements of operations by sector fornon-derivative contracts and the loss expense recorded under non-GAAP operating income respectively. Amounts presented arenet of reinsurance.
Loss and LAE Reportedon the Consolidated Statements of Operations
Year Ended December 31,2013 2012 2011
(in millions)
U.S. RMBS $ (4) $ 308 $ 389Other structured finance (35) (7) 118Public finance 214 285 48Other — (17) —
Total insurance contracts before FG VIE consolidation 175 569 555Effect of consolidating FG VIEs (21) (65) (107)
Total loss and LAE $ 154 $ 504 $ 448
Loss Expense Non-GAAP Operating
Year Ended December 31,
2013 2012 2011(in millions)
U.S. RMBS $ 8 $ 369 $ 365Other structured finance (36) (40) 99Public finance 212 284 29Other (10) (17) —
Total $ 174 $ 596 $ 493
Reconciliation of Loss and LAE to Non-GAAP Loss Expense
Year Ended December 31,
2013 2012 2011(in millions)
Loss and LAE $ 154 $ 504 $ 448Credit derivative loss expense (1) 28 (62)FG VIE loss expense 21 64 107
Loss expense included in operating income $ 174 $ 596 $ 493
In 2013, losses incurred were due primarily to U.S. public finance, including Detroit, Puerto Rico and Harrisburgpartially offset by positive developments in structured finance, primarily "XXX" life insurance transactions and U.S. RMBS.The positive developments in U.S. RMBS were primarily due to the settlement of several R&W claims. Changes in risk-freerates used to discount losses also affected loss expense for long-dated transactions, however this component of loss expensedoes not reflect actual credit impairment or improvement in the period.
0345r4.indd 93 3/19/14 3:28 PM

92
In 2012 and 2011, U.S. RMBS insured transactions generated the majority of the losses, partially offset by R&Wrecoveries and negotiated loss sharing agreements. The incurred loss in public finance in 2012 was primarily due to theCompany's Greek sovereign exposures.
For financial guaranty contracts accounted for as insurance, the amounts reported in the GAAP financial statementsmay only reflect a portion of the current period’s economic development and may also include a portion of prior-periodeconomic development. The difference between economic loss development on financial guaranty insurance contracts and lossand LAE recognized in GAAP income is essentially loss development and accretion for financial guaranty insurance contractsthat is, or was previously, absorbed in unearned premium reserve. Such amounts have not yet been recognized in income.
The table below presents the expected timing of loss recognition for insurance contracts on both a reported GAAP andnon-GAAP operating income basis.
Financial Guaranty InsuranceNet Expected Loss to be Expensed
As of December 31, 2013
In GAAPReportedIncome
In Non-GAAPOperating
Income(in millions)
2014 $ 42 $ 532015 41 522016 33 422017 30 392018 27 352014-2018 173 2212019-2023 99 1202024-2028 56 682029-2033 36 44After 2033 27 36
Net expected loss to be expensed (1) 391 489Discount 406 457
Total future value $ 797 $ 946____________________(1) Net expected loss to be expensed for GAAP reported income is different than non-GAAP operating income by the
amount related to consolidated FG VIEs.
Net Change in Fair Value of Credit Derivatives
Changes in the fair value of credit derivatives occur primarily because of changes in interest rates, credit spreads,notional amounts, credit ratings of the referenced entities, expected terms, realized gains (losses) and other settlements, and theissuing company's own credit rating and credit spreads, and other market factors. With considerable volatility continuing in themarket, unrealized gains (losses) on credit derivatives may fluctuate significantly in future periods.
Except for net estimated credit impairments (i.e., net expected payments), the unrealized gains and losses on creditderivatives are expected to reduce to zero as the exposure approaches its maturity date. Changes in the fair value of theCompany’s credit derivatives that do not reflect actual or expected claims or credit losses have no impact on the Company’sstatutory claims paying resources, rating agency capital or regulatory capital positions. Expected losses to be paid in respect ofcontracts accounted for as credit derivatives are included in the discussion above “—Losses in the Insured Portfolio.”
The impact of changes in credit spreads will vary based upon the volume, tenor, interest rates, and other marketconditions at the time these fair values are determined. In addition, since each transaction has unique collateral and structuralterms, the underlying change in fair value of each transaction may vary considerably. The fair value of credit derivativecontracts also reflects the change in the Company’s own credit cost based on the price to purchase credit protection on AGCand AGM. The Company determines its own credit risk based on quoted CDS prices traded on the Company at each balance
0345r4.indd 94 3/19/14 3:28 PM

93
sheet date. Generally, a widening of the CDS prices traded on AGC and AGM has an effect of offsetting unrealized losses thatresult from widening general market credit spreads, while a narrowing of the CDS prices traded on AGC and AGM has aneffect of offsetting unrealized gains that result from narrowing general market credit spreads.
There are typically no quoted prices for the Company's instruments or similar instruments as financial guarantycontracts do not typically trade in active markets. Observable inputs other than quoted market prices exist; however, theseinputs reflect contracts that do not contain terms and conditions similar to those in the credit derivatives issued by theCompany. Therefore, the valuation of the Company’s credit derivative contracts requires the use of models that containsignificant, unobservable inputs, and are classified as Level 3 in the fair value hierarchy. See Note 8, Fair Value Measurement,of the Financial Statements and Supplemental Data.
The fair value of the Company's credit derivative contracts represents the difference between the present value ofremaining net premiums the Company expects to receive or pay for the credit protection under the contract and the estimatedpresent value of premiums that a financial guarantor of comparable credit-worthiness would hypothetically charge or pay theCompany for the same protection. The fair value of the Company's credit derivatives depends on a number of factors includingnotional amount of the contract, expected term, credit spreads, interest rates, the credit ratings of referenced entities, theCompany’s own credit risk and remaining contractual cash flows.
The models used to determine fair value are primarily developed internally based on market conventions for similartransactions that the Company observed in the past. There has been very limited new issuance activity in this market over thepast three years and as of December 31, 2013, market prices for the Company’s credit derivative contracts were generally notavailable. Inputs to the estimate of fair value include various market indices, credit spreads, the Company’s own credit spread,and estimated contractual payments.
Management considers the non-standard terms of its credit derivative contracts in determining the fair value of thesecontracts. These terms differ from more standardized credit derivatives sold by companies outside of the financial guarantyindustry. The non-standard terms include the absence of collateral support agreements or immediate settlement provisions. Inaddition, the Company employs relatively high attachment points. Because of these terms and conditions, the fair value of theCompany’s credit derivatives may not reflect the same prices observed in an actively traded market of CDS that do not containterms and conditions similar to those observed in the financial guaranty market. The Company considers R&W claimrecoveries in determining the fair value of its CDS contracts.
Management considers factors such as current prices charged for similar agreements when available, performance ofunderlying assets, life of the instrument and the nature and extent of activity in the financial guaranty credit derivativemarketplace. The assumptions that management uses to determine the fair value may change in the future due to marketconditions. Due to the inherent uncertainties of the assumptions used in the valuation models to determine the fair value ofthese credit derivative products, actual experience may differ from the estimates reflected in the Company’s consolidatedfinancial statements and the differences may be material.
Net Change in Fair Value of Credit DerivativesGain (Loss)
Year Ended December 31,
2013 2012 2011(in millions)
Net credit derivative premiums received and receivable $ 119 $ 127 $ 185Net ceding commissions (paid and payable) received and receivable 2 1 3
Realized gains on credit derivatives 121 128 188Terminations 0 (1) (23)Net credit derivative losses (paid and payable) recovered and recoverable (163) (235) (159)Total realized gains (losses) and other settlements on credit derivatives (42) (108) 6Net change in unrealized gains (losses) on credit derivatives 107 (477) 554
Net change in fair value of credit derivatives $ 65 $ (585) $ 560
Net credit derivative premiums have declined in 2013 and 2012 due primarily to the decline in the net par outstandingto $54.5 billion at December 31, 2013 from $70.8 billion at December 31, 2012 and $85.0 billion at December 31, 2011.
0345r4.indd 95 3/19/14 3:28 PM

94
The table below sets out the net par amount of credit derivative contracts that the Company and its counterpartiesagreed to terminate on a consensual basis.
Net Par and Accelerations of Credit Derivative Revenuesfrom Terminations of CDS Contracts
Year Ended December 31,
2013 2012 2011(in millions)
Net par of terminated CDS contracts $ 4,054 $ 2,264 $ 11,543Accelerations of credit derivative revenues 21 3 25
In 2013, in addition to the agreements to terminate CDS transactions discussed above, in connection with lossmitigation efforts, the Company terminated a CDS transaction that referenced a film securitization after paying the counterparty$120 million which was recorded in realized gains (losses) and other settlements on credit derivatives, with a correspondingrelease of the unrealized loss recorded in unrealized gains (losses) on credit derivatives of $127 million for a net change in fairvalue of credit derivatives of $7 million.
Net Change in Unrealized Gains (Losses)on Credit Derivatives
By Sector
Year Ended December 31,Asset Type 2013 2012 2011
(in millions)Pooled corporate obligations $ (32) $ 59 $ 39U.S. RMBS (69) (551) 381CMBS 0 2 11Other (1) 208 13 123
Total $ 107 $ (477) $ 554____________________(1) “Other” includes all other U.S. and international asset classes, such as commercial receivables, international
infrastructure, international RMBS securities, and pooled infrastructure securities.
During 2013, unrealized fair value gains were generated in the “other” sector primarily as a result of the termination ofa film securitization transaction and a U.K. infrastructure transaction, as well as price improvement on a XXX lifesecuritization transaction. These unrealized gains were partially offset by unrealized fair value losses in the prime first lien, Alt-A, Option ARM and subprime RMBS sectors due to wider implied net spreads. The wider implied net spreads were primarily aresult of the decreased cost to buy protection in AGC’s name as the market cost of AGC’s credit protection decreased. Thesetransactions were pricing above their floor levels (or the minimum rate at which the Company would consider assuming theserisks based on historical experience); therefore when the cost of purchasing CDS protection on AGC, which management refersto as the CDS spread on AGC, decreased, the implied spreads that the Company would expect to receive on these transactionsincreased. The cost of AGM’s credit protection also decreased slightly during 2013, but did not lead to significant fair valuelosses, as the majority of AGM policies continue to price at floor levels.
During 2012, U.S. RMBS unrealized fair value losses were generated primarily in the prime first lien, Alt-A, OptionARM and subprime RMBS sectors primarily as a result of the decreased cost to buy protection in AGC's name as the marketcost of AGC's credit protection decreased. These transactions were pricing above their floor levels therefore when the cost ofpurchasing CDS protection on AGC decreased, the implied spreads that the Company would expect to receive on thesetransactions increased. The cost of AGM's credit protection also decreased during 2012, but did not lead to significant fair valuelosses, as the majority of AGM policies continue to price at floor levels. In addition, 2012 included an $85 million unrealizedgain relating to R&W benefits from the agreement with Deutsche Bank.
0345r4.indd 96 3/19/14 3:28 PM

95
In 2011, U.S. RMBS unrealized fair value gains were generated primarily in the Option ARM, Alt-A, prime first lienand subprime sectors primarily as a result of the increased cost to buy protection in AGC's name as the market cost of AGC'scredit protection increased. These transactions were pricing above their floor levels; therefore when the cost of purchasing CDSprotection on AGC increased, the implied spreads that the Company would expect to receive on these transactions decreased.The unrealized fair value gain in "other" primarily resulted from tighter implied net spreads on a XXX life securitizationtransaction and a film securitization, which also resulted from the increased cost to buy protection in AGC's name, referencedabove. The cost of AGM's credit protection also increased during the year, but did not lead to significant fair value gains, as themajority of AGM policies continue to price at floor levels.
Increases in AGC's credit spreads generally resulted in unrealized gains due to tighter implied net spreads, anddecreases in AGC's credit spreads generally resulted in unrealized losses due to wider implied net spreads. See the tables belowfor the 5 Year and 1 Year CDS spreads on AGC and AGM.
Five-Year CDS Spreadon AGC and AGM
Quoted price of CDS contract (in basis points)
As ofDecember 31, 2013
As ofDecember 31, 2012
As ofDecember 31, 2011
AGC 460 678 1,140AGM 525 536 778
One-Year CDS Spreadon AGC and AGM
Quoted price of CDS contract (in basis points)
As ofDecember 31, 2013
As ofDecember 31, 2012
As ofDecember 31, 2011
AGC 185 270 965AGM 220 257 538
Effect of Changes in the Company’s Credit Spread onUnrealized Gains (Losses) on Credit Derivatives
Year Ended December 31,
2013 2012 2011(in millions)
Change in unrealized gains (losses) of credit derivatives:Before considering implication of the Company’s credit spreads $ 1,374 $ 798 $ (68)Resulting from change in the Company’s credit spreads (1,267) (1,275) 622After considering implication of the Company’s credit spreads $ 107 $ (477) $ 554
Management believes that the trading level of AGC’s and AGM’s credit spreads is due to the correlation betweenAGC’s and AGM’s risk profile, the current risk profile of the broader financial markets, and to increased demand for creditprotection against AGC and AGM, relative to pre-financial crisis levels, as the result of its financial guaranty volume, as well asthe overall lack of liquidity in the CDS market. Offsetting the benefit attributable to AGC’s and AGM’s credit spread werehigher credit spreads in the fixed income security markets relative to pre-financial crisis levels. The higher credit spreads in thefixed income security market are due to the lack of liquidity in the high-yield CDO, trust preferred securities CDO ("TruPSCDOs"), and collateralized loan obligation ("CLO") markets as well as continuing market concerns over the 2005-2008vintages of RMBS.
0345r4.indd 97 3/19/14 3:28 PM

96
Interest Expense
For the years ended December 31, 2013 and December 31, 2012, interest expense decreased due to the retirement ofthe AGUS 8.5% Senior Notes on June 1, 2012 (see Note 17, Long-Term Debt and Credit Facilities, of the Financial Statementsand Supplementary Data). The following table presents the components of interest expense.
Interest Expense
Year Ended December 31,
2013 2012 2011(in millions)
Debt issued by AGUS $ 23 $ 31 $ 39Debt issued by AGMH 54 54 54Notes payable by AGM 5 7 6
Total $ 82 $ 92 $ 99
Provision for Income Tax
Deferred income tax assets and liabilities are established for the temporary differences between the financial statementcarrying amounts and tax bases of assets and liabilities using enacted rates in effect for the year in which the differences areexpected to reverse. Such temporary differences relate principally to unrealized gains and losses on investments and creditderivatives, FG VIE fair value adjustments, loss and LAE reserve, unearned premium reserve and tax attributes for netoperating losses, alternative minimum tax (“AMT”) credits and foreign tax credits. As of December 31, 2013 and December 31,2012, the Company had a net deferred income tax asset of $688 million and $721 million, respectively. As of December 31,2013, the Company has foreign tax credits carried forward of $37 million which expire in 2018 through 2021 and AMT creditsof $90 million which do not expire. Foreign tax credits of $22 million are from its acquisition of AGMH on July 1, 2009(“AGMH Acquisition”); the Internal Revenue Code limits the amount of credits the Company may utilize each year.
Provision for Income Taxes and Effective Tax Rates
Year Ended December 31,
2013 2012 2011(in millions)
Total provision (benefit) for income taxes $ 334 $ 22 $ 256Effective tax rate 29.2% 16.5% 24.9%
The Company’s effective tax rates reflect the proportion of income recognized by each of the Company’s operatingsubsidiaries, with U.S. subsidiaries taxed at the U.S. marginal corporate income tax rate of 35%, U.K. subsidiaries taxed at theU.K. blended marginal corporate tax rate of 23.25% unless subject to U.S. tax by election or as a U.S. controlled foreigncorporation, and no taxes for the Company's Bermuda subsidiaries unless subject to U.S tax by election or as a U.S. controlledforeign corporation. The Company’s overall corporate effective tax rate fluctuates based on the distribution of taxable incomeacross these jurisdictions. 2013 and 2012 had disproportionate losses and income across jurisdictions, offset by tax-exemptinterest, and are the primary reasons for the 29.2% and 16.5% effective tax rates, respectively.
Financial Guaranty Variable Interest Entities
As of December 31, 2013 and 2012, the Company consolidated, 40 and 33 VIEs, respectively. The table belowpresents the effects on reported GAAP income resulting from consolidating these FG VIEs and eliminating their relatedinsurance and investment accounting entries and, in total, represents a difference between GAAP reported net income and non-GAAP operating income attributable to FG VIEs. The consolidation of FG VIEs has a significant effect on net income andshareholders’ equity due to (1) changes in fair value gains (losses) on FG VIE assets and liabilities, (2) the eliminations ofpremiums and losses related to the AGC and AGM FG VIE liabilities with recourse and (3) the elimination of investmentbalances related to the Company’s purchase of AGC and AGM insured FG VIE debt. Upon consolidation of a FG VIE, therelated insurance and, if applicable, the related investment balances, are considered intercompany transactions and therefore
0345r4.indd 98 3/19/14 3:28 PM

97
eliminated. See “—Non-GAAP Financial Measures—Operating Income” below and Note 10, Consolidation of Variable InterestEntities, of the Financial Statements and Supplementary Data for more details.
Effect of Consolidating FG VIEs on Net Income (Loss)
Year Ended December 31,
2013 2012 2011(in millions)
Net earned premiums $ (60) $ (153) $ (75)Net investment income (13) (13) (8)Net realized investment gains (losses) 2 4 12Fair value gains (losses) on FG VIEs 346 191 (146)Loss and LAE 21 65 107
Total pretax effect on net income 296 94 (110)Less: tax provision (benefit) 103 32 (38)
Total effect on net income (loss) $ 193 $ 62 $ (72)
Fair value gains (losses) on FG VIEs represent the net change in fair value on the consolidated FG VIEs’ assets andliabilities. In 2013, the Company recorded a pre-tax net fair value gain of consolidated FG VIEs of $346 million. The gain wasprimarily driven by R&W benefits received on several VIE assets as a result of settlements with various counterpartiesthroughout the year. These R&W settlements resulted in a gain of approximately $265 million. The remainder of the gain wasdriven by price appreciation on the Company's FG VIE assets during the year resulting from improvements in the underlyingcollateral, as well as large principal paydowns made on the Company's FG VIEs.
In 2012, the Company recorded a pre-tax fair value gain on FG VIEs of $191 million. The majority of this gain,approximately $166 million, is a result of a R&W benefit received on several VIE assets as a result of a settlement withDeutsche Bank that closed in 2012. While prices continued to appreciate during the period on the Company's FG VIE assetsand liabilities, gains in the second half of the year were primarily driven by large principal paydowns made on the Company'sFG VIEs.
The 2011 pre-tax fair value losses on consolidated FG VIEs of $146 million were driven by the unrealized loss onconsolidation of eight new VIEs, as well as two existing transactions in which the fair value of the underlying collateraldepreciated, while the price of the wrapped senior bonds was largely unchanged from the prior year.
Expected losses to be paid (recovered) in respect of consolidated FG VIEs were $60 million of expected losses to bepaid as December 31, 2013, $96 million of expected losses to be recovered as of December 31, 2012, and $107 million ofexpected losses to be recovered as of December 31, 2011, are included in the discussion of “—Losses in the Insured Portfolio.”
Non-GAAP Financial Measures
To reflect the key financial measures management analyzes in evaluating the Company’s operations and progresstowards long-term goals, the Company discusses both measures promulgated in accordance with GAAP and measures notpromulgated in accordance with GAAP (“non-GAAP financial measures”). Although the financial measures identified as non-GAAP should not be considered substitutes for GAAP measures, management considers them key performance indicators andemploys them as well as other factors in determining compensation. Non-GAAP financial measures, therefore, provideinvestors with important information about the key financial measures management utilizes in measuring its business. Theprimary limitation of non-GAAP financial measures is the potential lack of comparability to those of other companies, whichmay define non-GAAP measures differently because there is limited literature with respect to such measures. Three of theprimary non-GAAP financial measures analyzed by the Company’s senior management are: operating income, adjusted bookvalue and PVP.
Management and the board of directors utilize non-GAAP financial measures in evaluating the Company’s financialperformance and as a basis for determining senior management incentive compensation. By providing these non-GAAPfinancial measures, investors, analysts and financial news reporters have access to the same information that managementreviews internally. In addition, Assured Guaranty’s presentation of non-GAAP financial measures is consistent with how
0345r4.indd 99 3/19/14 3:28 PM

98
analysts calculate their estimates of Assured Guaranty’s financial results in their research reports on Assured Guaranty and withhow investors, analysts and the financial news media evaluate Assured Guaranty’s financial results.
The following paragraphs define each non-GAAP financial measure and describe why it is useful. A reconciliation ofthe non-GAAP financial measure and the most directly comparable GAAP financial measure, if available, is also presentedbelow.
Reconciliation of Net Income (Loss)to Operating Income
Year Ended December 31,
2013 2012 2011
Net income (loss) $ 808 $ 110 $ 773Less after-tax adjustments:
Realized gains (losses) on investments 40 (4) (20)Non-credit impairment unrealized fair value gains (losses) on creditderivatives (40) (486) 244Fair value gains (losses) on CCS 7 (12) 23Foreign exchange gains (losses) on remeasurement of premiumsreceivable and loss and LAE reserves (1) 15 (3)Effect of consolidating FG VIEs 193 62 (72)
Operating income $ 609 $ 535 $ 601
Effective tax rate on operating income 26.7% 25.0% 24.4%
Operating income for 2013 increased due primarily to lower losses, offset in part by lower net earned premiums andcommutation gains in 2012.
Operating income for 2012 declined due primarily to higher losses, offset in part by higher gains on commutations ofpreviously ceded business and higher net earned premiums from accelerations which were due to negotiated terminations andrefundings. The primary driver of the increase in loss expense was the loss on Greek sovereign debt exposures, offset in part bylower losses in the TruPS portfolio.
Management believes that operating income is a useful measure because it clarifies the understanding of theunderwriting results of the Company’s financial guaranty business, and also includes financing costs and net investmentincome, and enables investors and analysts to evaluate the Company’s financial results as compared with the consensus analystestimates distributed publicly by financial databases. Operating income is defined as net income (loss) attributable to AGL, asreported under GAAP, adjusted for the following:
1) Elimination of the after-tax realized gains (losses) on the Company’s investments, except for gains and losseson securities classified as trading. The timing of realized gains and losses, which depends largely on marketcredit cycles, can vary considerably across periods. The timing of sales is largely subject to the Company’sdiscretion and influenced by market opportunities, as well as the Company’s tax and capital profile. Trends inthe underlying profitability of the Company’s business can be more clearly identified without the fluctuatingeffects of these transactions.
2) Elimination of the after-tax non-credit impairment unrealized fair value gains (losses) on credit derivatives,which is the amount in excess of the present value of the expected estimated economic credit losses, and non-economic payments. Such fair value adjustments are heavily affected by, and in part fluctuate with, changesin market interest rates, credit spreads and other market factors and are not expected to result in an economicgain or loss. Additionally, such adjustments present all financial guaranty contracts on a more consistent basisof accounting, whether or not they are subject to derivative accounting rules.
0345r4.indd 100 3/19/14 3:28 PM

99
3) Elimination of the after-tax fair value gains (losses) on the Company’s CCS. Such amounts are heavilyaffected by, and in part fluctuate with, changes in market interest rates, credit spreads and other marketfactors and are not expected to result in an economic gain or loss.
4) Elimination of the after-tax foreign exchange gains (losses) on remeasurement of net premium receivablesand loss and LAE reserves. Long-dated receivables constitute a significant portion of the net premiumreceivable balance and represent the present value of future contractual or expected collections. Therefore,the current period’s foreign exchange remeasurement gains (losses) are not necessarily indicative of the totalforeign exchange gains (losses) that the Company will ultimately recognize.
5) Elimination of the effects of consolidating FG VIEs in order to present all financial guaranty contracts on amore consistent basis of accounting, whether or not GAAP requires consolidation. GAAP requires theCompany to consolidate certain VIEs that have issued debt obligations insured by the Company even thoughthe Company does not own such VIEs.
Adjusted Book Value and Operating Shareholders’ Equity
Management also uses adjusted book value to measure the intrinsic value of the Company, excluding franchise value.Growth in adjusted book value is one of the key financial measures used in determining the amount of certain long termcompensation to management and employees and used by rating agencies and investors.
Reconciliation of Shareholders’ Equityto Adjusted Book Value
As of December 31, 2013 As of December 31, 2012
Total Per Share Total Per Share(dollars in millions, except
per share amounts)
Shareholders’ equity $ 5,115 $ 28.07 $ 4,994 $ 25.74Less after-tax adjustments:
Effect of consolidating FG VIEs (172) (0.95) (348) (1.79)Non-credit impairment unrealized fair value gains(losses) on credit derivatives (1,052) (5.77) (988) (5.09)Fair value gains (losses) on CCS 30 0.16 23 0.12Unrealized gain (loss) on investment portfolioexcluding foreign exchange effect 145 0.80 477 2.45
Operating shareholders’ equity 6,164 33.83 5,830 30.05After-tax adjustments:
Less: Deferred acquisition costs 161 0.88 165 0.85Plus: Net present value of estimated net future creditderivative revenue 146 0.80 220 1.14Plus: Net unearned premium reserve on financialguaranty contracts in excess of expected loss to beexpensed 2,884 15.83 3,266 16.83
Adjusted book value $ 9,033 $ 49.58 $ 9,151 $ 47.17
As of December 31, 2013, shareholders’ equity increased to $5.1 billion from $5.0 billion at December 31, 2012 dueto net income in 2013, partially offset by share repurchases, a decline in fair value on the available-for-sale portfolio anddividends. Operating shareholders' equity increased due primarily to positive operating income in 2013, which was partiallyoffset by the share repurchases and dividends. Adjusted book value decreased mainly due to share repurchases, dividends andeconomic loss development. Adjusted book value per share increased due to the repurchase of 12.5 million common shares asof December 31, 2013.
0345r4.indd 101 3/19/14 3:28 PM

100
Management believes that operating shareholders’ equity is a useful measure because it presents the equity of theCompany with all financial guaranty contracts accounted for on a more consistent basis and excludes fair value adjustmentsthat are not expected to result in economic loss. Many investors, analysts and financial news reporters use operatingshareholders’ equity as the principal financial measure for valuing AGL’s current share price or projected share price and alsoas the basis of their decision to recommend buying or selling AGL’s common shares. Many of the Company’s fixed incomeinvestors also use operating shareholders’ equity to evaluate the Company’s capital adequacy. Operating shareholders’ equity isthe basis of the calculation of adjusted book value (see below). Operating shareholders’ equity is defined as shareholders’equity attributable to Assured Guaranty Ltd., as reported under GAAP, adjusted for the following:
1) Elimination of the effects of consolidating FG VIEs in order to present all financial guaranty contracts on amore consistent basis of accounting, whether or not GAAP requires consolidation. GAAP requires theCompany to consolidate certain VIEs that have issued debt obligations insured by the Company even thoughthe Company does not own such VIEs.
2) Elimination of the after-tax non-credit impairment unrealized fair value gains (losses) on credit derivatives,which is the amount in excess of the present value of the expected estimated economic credit losses, and non-economic payments. Such fair value adjustments are heavily affected by, and in part fluctuate with, changesin market interest rates, credit spreads and other market factors and are not expected to result in an economicgain or loss.
3) Elimination of the after-tax fair value gains (losses) on the Company’s CCS. Such amounts are heavilyaffected by, and in part fluctuate with, changes in market interest rates, credit spreads and other marketfactors and are not expected to result in an economic gain or loss.
4) Elimination of the after-tax unrealized gains (losses) on the Company’s investments that are recorded as acomponent of accumulated other comprehensive income (“AOCI”) (excluding foreign exchangeremeasurement). The AOCI component of the fair value adjustment on the investment portfolio is not deemedeconomic because the Company generally holds these investments to maturity and therefore should notrecognize an economic gain or loss.
Management believes that adjusted book value is a useful measure because it enables an evaluation of the net presentvalue of the Company’s in-force premiums and revenues in addition to operating shareholders’ equity. The premiums andrevenues included in adjusted book value will be earned in future periods, but actual earnings may differ materially from theestimated amounts used in determining current adjusted book value due to changes in foreign exchange rates, prepaymentspeeds, terminations, credit defaults and other factors. Many investors, analysts and financial news reporters use adjusted bookvalue to evaluate AGL’s share price and as the basis of their decision to recommend, buy or sell the AGL common shares.Adjusted book value is operating shareholders’ equity, as defined above, further adjusted for the following:
1) Elimination of after-tax deferred acquisition costs, net. These amounts represent net deferred expenses thathave already been paid or accrued and will be expensed in future accounting periods.
2) Addition of the after-tax net present value of estimated net future credit derivative revenue. See below.
3) Addition of the after-tax value of the unearned premium reserve on financial guaranty contracts in excess ofexpected loss to be expensed, net of reinsurance. This amount represents the expected future net earnedpremiums, net of expected losses to be expensed, which are not reflected in GAAP equity.
Net Present Value of Estimated Net Future Credit Derivative Revenue
Management believes that this amount is a useful measure because it enables an evaluation of the value of futureestimated credit derivative revenue. There is no corresponding GAAP financial measure. This amount represents the presentvalue of estimated future revenue from the Company’s credit derivative in-force book of business, net of reinsurance, cedingcommissions and premium taxes, for contracts without expected economic losses, and is discounted at 6%. Estimated net futurecredit derivative revenue may change from period to period due to changes in foreign exchange rates, prepayment speeds,terminations, credit defaults or other factors that affect par outstanding or the ultimate maturity of an obligation.
0345r4.indd 102 3/19/14 3:28 PM

101
Total PVP $ 141 $ 210 $ 243Less: Financial guaranty installment premium PVP 26 45 69
Total: Financial guaranty upfront gross written premiums 115 165 174Plus: Financial guaranty installment gross written premiums and otherGAAP adjustments 8 88 (47)
Total gross written premiums $ 123 $ 253 $ 127
Management believes that PVP is a useful measure because it enables the evaluation of the value of new businessproduction for the Company by taking into account the value of estimated future installment premiums on all new contractsunderwritten in a reporting period as well as premium supplements and additional installment premium on existing contracts asto which the issuer has the right to call the insured obligation but has not exercised such right, whether in insurance or creditderivative contract form, which GAAP gross premiums written and the net credit derivative premiums received and receivableportion of net realized gains and other settlements on credit derivatives (“Credit Derivative Revenues”) do not adequatelymeasure. PVP in respect of financial guaranty contracts written in a specified period is defined as gross upfront and installmentpremiums received and the present value of gross estimated future installment premiums, in each case, discounted at 6%. Forpurposes of the PVP calculation, management discounts estimated future installment premiums on insurance contracts at 6%,while under GAAP, these amounts are discounted at a risk free rate. Additionally, under GAAP, management records futureinstallment premiums on financial guaranty insurance contracts covering non-homogeneous pools of assets based on thecontractual term of the transaction, whereas for PVP purposes, management records an estimate of the future installmentpremiums the Company expects to receive, which may be based upon a shorter period of time than the contractual term of thetransaction. Actual future net earned or written premiums and Credit Derivative Revenues may differ from PVP due to factorsincluding, but not limited to, changes in foreign exchange rates, prepayment speeds, terminations, credit defaults, or otherfactors that affect par outstanding or the ultimate maturity of an obligation.
The following tables present the insured portfolio by asset class net of cessions to reinsurers. It includes all financialguaranty contracts outstanding as of the dates presented, regardless of the form written (i.e. credit derivative form or traditionalfinancial guaranty insurance form) or the applicable accounting model (i.e. insurance, derivative or VIE consolidation).
0345r4.indd 103 3/19/14 3:28 PM

102
Net Par Outstanding and Average Internal Rating by Sector
As of December 31, 2013 As of December 31, 2012
Sector
Net ParOutstanding
(including lossmitigation
bonds)
LossMitigation
Bonds
Net ParOutstanding
(excluding lossmitigation
bonds)Avg.
Rating
Net ParOutstanding
(including lossmitigation
bonds)
LossMitigation
Bonds
Net ParOutstanding
(excluding lossmitigation
bonds)Avg.
Rating
Public finance:U.S.:
General obligation $ 155,277 $ — $ 155,277 A+ $ 169,985 $ — $ 169,985 A+Tax backed 66,856 32 66,824 A+ 73,787 38 73,749 A+Municipal utilities 56,324 — 56,324 A 62,116 — 62,116 ATransportation 30,830 — 30,830 A 33,799 — 33,799 AHealthcare 16,132 — 16,132 A 17,838 — 17,838 AHigher education 14,071 — 14,071 A 15,770 — 15,770 A+Infrastructure finance 4,114 — 4,114 BBB 4,210 — 4,210 BBBHousing 3,386 — 3,386 A+ 4,633 — 4,633 AA-Investor-owned utilities 991 — 991 A- 1,069 — 1,069 A-Other public finance—U.S. 4,232 — 4,232 A 4,760 — 4,760 A
Total public finance—U.S. 352,213 32 352,181 A 387,967 38 387,929 A
Non-U.S.:Infrastructure finance 14,703 — 14,703 BBB 15,812 — 15,812 BBBRegulated utilities 11,205 — 11,205 BBB+ 12,494 — 12,494 BBB+Pooled infrastructure 2,520 — 2,520 A 3,200 — 3,200 AA-Other public finance—non-U.S. 5,570 — 5,570 A 6,034 — 6,034 A
Total public finance—non-U.S. 33,998 — 33,998 BBB+ 37,540 — 37,540 BBB+
Total public finance 386,211 32 386,179 A 425,507 38 425,469 AStructured finance:
U.S.:Pooled corporate obligations 31,325 — 31,325 AAA 41,886 — 41,886 AAARMBS 14,559 838 13,721 BBB- 17,827 792 17,035 BB+CMBS and other commercialreal estate related exposures 3,952 — 3,952 AAA 4,247 — 4,247 AAAInsurance securitizations 3,360 325 3,035 A- 3,113 170 2,943 BBB+Financial products 2,709 — 2,709 AA- 3,653 — 3,653 AA-Consumer receivables 2,198 — 2,198 BBB+ 2,369 — 2,369 BBB+Commercial receivables 911 — 911 A- 1,025 — 1,025 BBB+Structured credit 69 — 69 BB 319 121 198 BOther structured finance—U.S. 987 — 987 A- 1,179 — 1,179 BBB+
Total structured finance—U.S. 60,070 1,163 58,907 AA- 75,618 1,083 74,535 AA-
Non-U.S.:Pooled corporate obligations 11,058 — 11,058 AAA 14,813 — 14,813 AAACommercial receivables 1,263 — 1,263 BBB+ 1,463 — 1,463 A-RMBS 1,146 — 1,146 AA- 1,424 — 1,424 AA-Structured credit 176 — 176 BBB 591 — 591 BBBCMBS and other commercialreal estate related exposures — — — — 100 — 100 AAAOther structured finance—non-U.S. 378 — 378 AAA 377 — 377 AAA
Total structured finance—non-U.S. 14,021 — 14,021 AA+ 18,768 — 18,768 AA+
Total structured finance 74,091 1,163 72,928 AA 94,386 1,083 93,303 AA-Total net par outstanding $ 460,302 $ 1,195 $ 459,107 A $ 519,893 $ 1,121 $ 518,772 A+
The December 31, 2013 and 2012 amounts above include $38.1 billion and $47.4 billion, respectively, of AGMstructured finance net par outstanding. AGM has not insured a mortgage-backed transaction since January 2008 and announcedits complete withdrawal from the structured finance market in August 2008. The structured finance transactions that remain inAGM’s insured portfolio are of double-A average underlying credit quality, according to the Company’s internal rating system.
0345r4.indd 104 3/19/14 3:28 PM

103
Management expects AGM’s structured finance portfolio to run-off rapidly: 29% by year-end 2014, 62% by year end 2016, and85% by year-end 2018.
The following tables set forth the Company’s net financial guaranty portfolio by internal rating.
Financial Guaranty Portfolio by Internal RatingAs of December 31, 2013
Public FinanceU.S.
Public FinanceNon-U.S.
Structured FinanceU.S
Structured FinanceNon-U.S Total
RatingCategory (1)
Net ParOutstanding %
Net ParOutstanding %
Net ParOutstanding %
Net ParOutstanding %
Net ParOutstanding %
(dollars in millions)
AAA $ 4,998 1.4% $ 1,016 3.0% $ 32,317 54.9% $ 9,684 69.1% $ 48,015 10.5%
AA 107,503 30.5 422 1.2 9,431 16.0 577 4.1 117,933 25.7
A 192,841 54.8 9,453 27.9 2,580 4.4 742 5.3 205,616 44.8BBB 37,745 10.7 21,499 63.2 3,815 6.4 1,946 13.9 65,005 14.1
BIG 9,094 2.6 1,608 4.7 10,764 18.3 1,072 7.6 22,538 4.9Total net paroutstanding(excluding lossmitigation bonds) $ 352,181 100.0% $ 33,998 100.0% $ 58,907 100.0% $ 14,021 100.0% $ 459,107 100.0%
Loss MitigationBonds 32 — 1,163 — 1,195
Total net paroutstanding(including lossmitigation bonds) $ 352,213 $ 33,998 $ 60,070 $ 14,021 $ 460,302
Financial Guaranty Portfolio by Internal RatingAs of December 31, 2012
Public FinanceU.S.
Public FinanceNon-U.S.
Structured FinanceU.S
Structured FinanceNon-U.S Total
RatingCategory (1)
Net ParOutstanding %
Net ParOutstanding %
Net ParOutstanding %
Net ParOutstanding %
Net ParOutstanding %
(dollars in millions)
AAA $ 4,502 1.2% $ 1,706 4.5% $ 42,187 56.6% $ 13,169 70.2% $ 61,564 11.9%AA 124,525 32.1 875 2.3 9,543 12.8 722 3.9 135,665 26.1
A 210,124 54.1 9,781 26.1 4,670 6.3 1,409 7.5 225,984 43.6BBB 44,213 11.4 22,885 61.0 3,737 5.0 2,427 12.9 73,262 14.1
BIG 4,565 1.2 2,293 6.1 14,398 19.3 1,041 5.5 22,297 4.3
Total net paroutstanding(excluding lossmitigation bonds) $ 387,929 100.0% $ 37,540 100.0% $ 74,535 100.0% $ 18,768 100.0% $ 518,772 100.0%
Loss MitigationBonds 38 — 1,083 — 1,121
Total net paroutstanding(including lossmitigation bonds) $ 387,967 $ 37,540 $ 75,618 $ 18,768 $ 519,893
____________________(1) In the third quarter of 2013, the Company adjusted its approach to assigning internal ratings. See "Refinement of
Approach to Internal Credit Ratings and Surveillance Categories" in Note 3, Outstanding Exposure, of the FinancialStatements and Supplementary Data. This approach is reflected in the "Financial Guaranty Portfolio by InternalRating" tables as of both December 31, 2013 and December 31, 2012.
Previously, the Company had included securities purchased for loss mitigation purposes in its invested assets portfolioand its financial guaranty insured portfolio. Beginning in the third quarter of 2013, the Company began excluding such loss
0345r4.indd 105 3/19/14 3:28 PM

104
mitigation securities from its disclosure about its financial guaranty insured portfolio (unless otherwise indicated); it has takenthis approach as of both December 31, 2013 and December 31, 2012. In addition, under the terms of certain credit derivativecontracts, the referenced obligations in such contracts have been delivered to the Company and they therefore are included inthe investment portfolio. Such amounts are still included in the financial guaranty insured portfolio and totaled $195 millionand $220 million in gross par outstanding as of December 31, 2013 and 2012, respectively.
The tables below show the Company's ten largest U.S. public finance, U.S. structured finance and non-U.S. exposuresby revenue source, excluding related related authorities and public corporations, as of December 31, 2013:
Ten Largest U.S. Public Finance Exposuresby Revenue Source
As of December 31, 2013
Net ParOutstanding
Percent of TotalU.S. Public
Finance Net ParOutstanding Rating
(dollars in millions)
New Jersey (State of) $ 3,980 1.1% A+California (State of) 3,356 0.9% A-New York (City of) New York 3,064 0.9% AA-Chicago (City of) Illinois 2,681 0.8% A-Massachusetts (Commonwealth of) 2,521 0.7% AANew York (State of) 2,408 0.7% A+Miami-Dade County Florida Aviation Authority - Miami InternationalAirport 2,146 0.6% APuerto Rico General Obligation, Appropriations and Guarantees of theCommonwealth 2,119 0.6% BBPort Authority of New York and New Jersey 2,034 0.6% AA-Illinois (State of) 1,987 0.6% A-
Total of top ten U.S. public finance exposures $ 26,296 7.5%
Ten Largest U.S. Structured Finance ExposuresAs of December 31, 2013
Net ParOutstanding
Percent of TotalU.S. StructuredFinance Net Par
Outstanding Rating(dollars in millions)
Fortress Credit Opportunities I, LP. $ 1,328 2.2% AASynthetic Investment Grade Pooled Corporate CDO 1,188 2.0% AAAStone Tower Credit Funding 994 1.7% AAASynthetic High Yield Pooled Corporate CDO 978 1.7% AAASynthetic Investment Grade Pooled Corporate CDO 767 1.3% AAASynthetic Investment Grade Pooled Corporate CDO 763 1.3% AAASynthetic Investment Grade Pooled Corporate CDO 756 1.3% AAASynthetic Investment Grade Pooled Corporate CDO 745 1.3% AAASynthetic High Yield Pooled Corporate CDO 734 1.2% AAASynthetic Investment Grade Pooled Corporate CDO 655 1.1% AAA
Total of top ten U.S. structured finance exposures $ 8,908 15.1%
0345r4.indd 106 3/19/14 3:28 PM

105
Ten Largest Non-U.S. ExposuresAs of December 31, 2013
Net ParOutstanding
Percent of TotalNon-U.S. Net Par
Outstanding Rating(dollars in millions)
Province of Quebec $ 2,386 5.0% A+Thames Water Utilities Finance Plc 1,499 3.1% A-Sydney Airport Finance Company Pty Limited 1,309 2.7% BBBChannel Link Enterprises Finance PLC 978 2.0% BBBSouthern Gas Networks PLC 893 1.9% BBBSociete des Autoroutes du Nord et de l'Est de la France 858 1.8% BBB+Capital Hospitals 814 1.7% BBB-Campania Region 752 1.6% BBB-Artesian Finance II Plc (Southern) 727 1.5% A-International Infrastructure Pool 700 1.4% A-
Total of top ten non-U.S. exposures $ 10,916 22.7%
0345r4.indd 107 3/19/14 3:28 PM

106
Financial Guaranty Portfolio by Geographic Area
The following table sets forth the geographic distribution of the Company's financial guaranty portfolio.
Geographic Distributionof Financial Guaranty Portfolio
As of December 31, 2013
Number of RisksNet Par
Outstanding
Percent of TotalNet Par
Outstanding(dollars in millions)
U.S.:U.S. Public Finance:
California 1,492 $ 52,704 11.5%New York 1,035 28,582 6.2Pennsylvania 1,059 28,475 6.2Texas 1,269 27,249 5.9Illinois 881 24,138 5.3Florida 422 21,773 4.7New Jersey 656 14,462 3.2Michigan 713 14,250 3.1Georgia 204 9,364 2.0Ohio 554 8,763 1.9Other states and U.S. territories 4,517 122,421 26.7
Total U.S. public finance 12,802 352,181 76.7U.S. Structured finance (multiple states) 963 58,907 12.8
Total U.S. 13,765 411,088 89.5Non-U.S.:
United Kingdom 115 21,405 4.7Australia 29 5,598 1.2Canada 10 3,851 0.8France 21 3,614 0.8Italy 10 1,808 0.4Other 100 11,743 2.6
Total non-U.S. 285 48,019 10.5Total 14,050 $ 459,107 100.0%
Selected European Exposure
Several European countries have experienced significant economic, fiscal and / or political strains such that thelikelihood of default on obligations with a nexus to those countries may be higher than the Company anticipated when suchfactors did not exist. The Company has identified those European countries where it has exposure and where it believesheightened uncertainties exist to be: Greece, Hungary, Ireland, Italy, Portugal and Spain (the “Selected European Countries”).The Company selected these European countries based on its view that their credit fundamentals have weakened as a result ofthe global financial crisis, as well as on published reports identifying countries that may be experiencing reduced demand fortheir sovereign debt in the current environment. See “—Selected European Countries” below for an explanation of thecircumstances in each country leading the Company to select that country for further discussion.
0345r4.indd 108 3/19/14 3:28 PM

107
Direct Economic Exposure to the Selected European Countries
The Company’s direct economic exposure to the Selected European Countries (based on par for financial guarantycontracts and notional amount for financial guaranty contracts accounted for as derivatives) is shown in the following tables,both gross and net of ceded reinsurance:
Gross Direct Economic Exposureto Selected European Countries(1)
As of December 31, 2013
Hungary Ireland Italy Portugal Spain Total(in millions)
Sovereign and sub-sovereign exposure:Non-infrastructure public finance $ — $ — $ 1,372 $ 114 $ 441 $ 1,927Infrastructure finance 411 — 19 12 159 601
Sub-total 411 — 1,391 126 600 2,528Non-sovereign exposure:
Regulated utilities — — 254 — — 254RMBS 234 144 379 — — 757
Sub-total 234 144 633 — — 1,011Total $ 645 $ 144 $ 2,024 $ 126 $ 600 $ 3,539Total BIG $ 645 $ — $ — $ 126 $ 600 $ 1,371
Net Direct Economic Exposureto Selected European Countries(1)
As of December 31, 2013
Hungary Ireland Italy Portugal Spain Total(in millions)
Sovereign and sub-sovereign exposure:Non-infrastructure public finance $ — $ — $ 1,024 $ 98 $ 275 $ 1,397Infrastructure finance 384 — 18 12 155 569
Sub-total 384 — 1,042 110 430 1,966Non-sovereign exposure:
Regulated utilities — — 234 — — 234RMBS 224 144 315 — — 683
Sub-total 224 144 549 — — 917Total $ 608 $ 144 $ 1,591 $ 110 $ 430 $ 2,883
Total BIG $ 608 $ — $ — $ 110 $ 430 $ 1,148____________________(1) While the Company’s exposures are shown in U.S. dollars, the obligations the Company insures are in various
currencies, including U.S. dollars, Euros and British pounds sterling. Included in both tables above is $144 million ofreinsurance assumed on a 2004 - 2006 pool of Irish residential mortgages that is part of the Company’s remaininglegacy mortgage reinsurance business. One of the residential mortgage-backed securities included in the table aboveincludes residential mortgages in both Italy and Germany, and only the portion of the transaction equal to the portionof the original mortgage pool in Italian mortgages is shown in the tables.
As of December 31, 2013, the Company does not guarantee any sovereign bonds of the Selected European Countries,although the payments for many of the non-infrastructure and infrastructure finance credits originate with sovereigns or sub-sovereigns. The exposure shown in the “Non-infrastructure public finance” category is from transactions backed by receivablepayments from sub-sovereigns in Italy, Spain and Portugal.
0345r4.indd 109 3/19/14 3:28 PM

108
The tables above include the par amount of financial guaranty contracts accounted for as derivatives of $145 millionwith a fair value of $6 million, net of reinsurance. The Company’s credit derivative transactions are governed by ISDAdocumentation, and the Company is required to make a loss payment on them only upon the occurrence of one or more definedcredit events with respect to the referenced securities or loans.
The Company purchases reinsurance in the ordinary course to cover both its financial guaranty insurance and creditderivative exposures. Aside from this type of coverage the Company does not purchase credit default protection to manage therisk in its financial guaranty business. Rather, the Company has reduced its risks by ceding a portion of its business (includingits financial guaranty contracts accounted for as derivatives) to third-party reinsurers that are generally required to pay theirproportionate share of claims paid by the Company, and the net amounts shown above are net of such third-party reinsurance(reinsurance of financial guaranty contracts accounted for as derivatives is accounted for as a purchased derivative). SeeNote 14, Reinsurance and Other Monoline Exposures, of the Financial Statements and Supplementary Data.
Indirect Exposure to Selected European Countries
The Company has excluded in the exposure tables above its indirect economic exposure to the Selected EuropeanCountries through insurance it provides on (a) pooled corporate and (b) commercial receivables transactions. The Companyconsiders economic exposure to a Selected European Country to be indirect when that exposure relates to only a small portionof an insured transaction that otherwise is not related to that Selected European Country.
The Company’s pooled corporate obligations are highly diversified in terms of obligors and, except in the case ofTruPS CDOs or transactions backed by perpetual preferred securities, highly diversified in terms of industry. Most pooledcorporate obligations are structured to limit exposure to any given obligor and any given non-U.S. country or region. Theinsured pooled corporate transactions generally benefit from embedded credit enhancement which allows a transaction a certainlevel of losses in the underlying collateral without causing the Company to pay a claim. Some pooled corporate obligationsinclude investments in companies with a nexus to the Selected European Countries.
The Company’s commercial receivable transactions excluded in the exposure tables above are rail car leasetransactions and aircraft lease transactions where some of the lessees have a nexus with the Selected European Countries. Likethe pooled corporate transactions, the commercial receivable transactions generally benefit from embedded credit enhancementwhich allows a transaction a certain level of losses in the underlying collateral without causing the Company to pay a claim.
The following table shows the Company’s indirect economic exposure to the Selected European Countries in pooledcorporate obligations and commercial receivable transactions. The amount shown in the table is calculated by multiplying theamount insured by the Company (based on par for financial guaranty contracts and notional amount for financial guarantycontracts accounted for as derivatives) times the percent of the relevant collateral pool reported as having a nexus to theSelected European Countries:
Indirect Exposure to Selected European CountriesAs of December 31, 2013
Greece Ireland Italy Portugal Spain Total(dollars in millions)
Pooled corporateGross par ($ in millions) $ 17 $ 112 $ 181 $ 15 $ 542 $ 867Net par ($ in millions) $ 17 $ 96 $ 165 $ 15 $ 488 $ 781Average proportion 2.2% 1.6% 2.7% 1.0% 4.9% 3.2%
Commercial receivablesGross par ($ in millions) $ — $ 20 $ 54 $ 14 $ 2 $ 90Net par ($ in millions) $ — $ 19 $ 52 $ 13 $ 2 $ 86Average proportion —% 4.2% 8.9% 2.4% 1.8% 5.1%
The table above includes, in the pooled corporate category, exposure from primarily non-U.S. pooled corporatetransactions insured by the Company. Many primarily U.S. pooled corporate obligations permit investments of up to 10% or15% (or occasionally 20%) of the pool in non-U.S. (or non-U.S. or -Canadian) collateral. Given the relatively low level of
0345r4.indd 110 3/19/14 3:28 PM

109
permitted international investments in these transactions and their generally high current credit quality, they are excluded fromthe table above.
Selected European Countries
The Company follows and analyzes public information regarding developments in countries to which the Companyhas exposure, including the Selected European Countries, and utilizes this information to evaluate risks in its financial guarantyportfolio. Because the Company guarantees payments under its financial guaranty contracts, its analysis is focused primarily onthe risk of payment defaults by these countries or obligors in these countries. However, material developments having aneconomic impact with respect to the Selected European Countries would also impact the fair value of insurance contractsaccounted for as derivatives and with a nexus to those countries.
The Republic of Hungary is rated “BB” and “Ba1” by S&P and Moody’s, respectively. The country continues to facesignificant economic and political challenges. The Company’s sovereign and sub-sovereign exposure to Hungarian creditsincludes an infrastructure financing dependent on payments by government agencies. The Company rates this exposure ($384million net par) below investment grade. The Company is closely monitoring developments with respect to the ability andwillingness of these entities to meet their payment obligations. The Company’s non-sovereign exposure to Hungary comprisesprimarily covered mortgage bonds issued by Hungarian banks. The Company rates the covered bonds ($224 million net par)below investment grade.
The Kingdom of Spain is rated “BBB-” by S&P and was upgraded to “Baa2” on February 21, 2014 by Moody’s.While its recession was longer and deeper than most other European countries, there are recent signs that the economicenvironment in Spain is stabilizing. The Company’s sovereign and sub-sovereign exposure to Spanish credits includesinfrastructure financings dependent on payments by sub-sovereigns and government agencies, financings dependent on leaseand other payments by sub-sovereigns and government agencies, and an issuance by a regulated utility. The Company ratesmost ($430 million aggregate net par) of its exposure to sovereign and sub-sovereign credits in Spain below investment grade.The Company is closely monitoring developments with respect to the ability and willingness of these entities to meet theirpayment obligations.
The Republic of Portugal is rated “BB” and “Ba3” by S&P and Moody's, respectively. The country continues to facedifficulties regarding its fiscal imbalances, high indebtedness and the difficult macroeconomic situation but has made progressin terms of fiscal consolidation and structural reforms. The Company’s exposure to sovereign and sub-sovereign Portuguesecredits includes financings dependent on lease payments by sub-sovereigns and government agencies and infrastructurefinancings dependent on payments by sub-sovereigns and government agencies. The Company rates four of these transactions($110 million aggregate net par) below investment grade. The Company is closely monitoring developments with respect to theability and willingness of these entities to meet their payment obligations.
The Republic of Ireland is currently rated “BBB+” and “Baa3” by S&P and Moody’s, respectively. Moody’s upgradedits rating from “Ba1” in January 2014, the two main drivers for the upgrade being: (1) the growth potential of the Irisheconomy, which together with ongoing fiscal consolidation is expected to bring government debt ratios down from their recentpeak; and (2) the Irish government's exit from its EU International Monetary Fund support program on schedule, with improvedsolvency and restored market access. The Company’s exposure to Irish credits includes exposure in a pool of infrastructurefinancings dependent on payments by a sub-sovereign and mortgage reinsurance on a pool of Irish residential mortgagesoriginated in 2004-2006 left from its legacy mortgage reinsurance business. Only $7 million of the Company’s exposure toIreland is below investment grade, and it is indirect in non-sovereign pooled corporate transactions.
The Republic of Italy is rated “BBB” and “Baa2” by S&P and Moody’s, respectively. Even though its recession haseased somewhat in recent months, the country continues to face significant economic and political challenges. The Company’ssovereign and sub-sovereign exposure to Italy depends on payments by Italian governmental entities in connection withinfrastructure financings or for services already rendered. The Company’s non-sovereign Italian exposure is comprisedprimarily of securities backed by Italian residential mortgages or in one case a government-sponsored water utility. TheCompany is closely monitoring the ability and willingness of these obligors to make timely payments on their obligations.
The Hellenic Republic of Greece is rated “B-” and “Caa3” by S&P and Moody’s, respectively. In November, 2013,Moody’s upgraded its rating from “C” reflecting a combination of the significant fiscal consolidation that has taken place underGreece’s structural adjustment program, the improvement in Greece’s medium-term economic outlook, and the significantreduction of the government’s interest burden following previous restructuring. As of December 31, 2013 the Company nolonger had any direct economic exposure to Greece, although it does still have small, indirect exposures as described aboveunder "Indirect Exposure to Selected European Countries".
0345r4.indd 111 3/19/14 3:28 PM

110
Identifying Exposure to Selected European Countries
When the Company directly insures an obligation, it assigns the obligation to a geographic location or locations basedon its view of the geographic location of the risk. For most exposures this can be a relatively straight-forward determination as,for example, a debt issue supported by availability payments for a toll road in a particular country. The Company may alsoassign portions of a risk to more than one geographic location as it has, for example, in a residential mortgage backed securitybacked by residential mortgage loans in both Germany and Italy. The Company may also have exposures to the SelectedEuropean Countries in business assumed from other monoline insurance companies. See Note 14, Reinsurance and OtherMonoline Exposure, of the Financial Statements and Supplementary Data. In the case of assumed business, the Companydepends upon geographic information provided by the primary insurer.
The Company also has indirect exposure to the Selected European Countries through structured finance transactionsbacked by pools of corporate obligations or receivables, such as lease payments, with a nexus to such countries. In mostinstances, the trustees and/or servicers for such transactions provide reports that identify the domicile of the underlying obligorsin the pool (and the Company relies on such reports), although occasionally such information is not available to the Company.The Company has reviewed transactions through which it believes it may have indirect exposure to the Selected EuropeanCountries that is material to the transaction and included in the tables above the proportion of the insured par equal to theproportion of obligors so identified as being domiciled in a Selected European Country. The Company may also have indirectexposures to Selected European Countries in business assumed from other monoline insurance companies. However, in the caseof assumed business, the primary insurer generally does not provide information to the Company permitting it togeographically allocate the exposure proportionally to the domicile of the underlying obligors.
Exposure to Puerto Rico
The Company insures general obligation bonds of the Commonwealth of Puerto Rico and various obligations of itsrelated authorities and public corporations aggregating $5.4 billion net par and $6.8 billion of gross par. The Company rates$5.2 billion net par and $6.5 billion of gross par of that amount BIG. The following table shows the Company’s exposure togeneral obligation bonds of Puerto Rico and various obligations of its related authorities and public corporations as ofDecember 31, 2013.
Net Exposure to Puerto RicoAs of December 31, 2013
Net ParOutstanding Internal Rating(in millions)
Commonwealth of Puerto Rico - General Obligation Bonds $ 1,885 BBPuerto Rico Highways and Transportation Authority (Transportation revenue) 869 BB-Puerto Rico Electric Power Authority 860 BB-Puerto Rico Municipal Finance Authority 450 BB-Puerto Rico Aqueduct and Sewer Authority 384 BB-Puerto Rico Highways and Transportation Authority (Highway revenue) 302 BBPuerto Rico Sales Tax Financing Corporation 268 A-Puerto Rico Convention Center District Authority 185 BB-Puerto Rico Public Buildings Authority 139 BBPuerto Rico Public Finance Corporation 44 BGovernment Development Bank for Puerto Rico 33 BBPuerto Rico Infrastructure Financing Authority 18 BB-University of Puerto Rico 1 BB-
Total $ 5,438 BB
0345r4.indd 112 3/19/14 3:28 PM

111
The following table shows the net par and estimated amortization of the general obligation bonds of Puerto Rico andvarious obligations of its related authorities and public corporations insured and rated BIG by the Company. The Companyguarantees payments of interest and principal when those amounts are scheduled to be paid and cannot be required to pay on anaccelerated basis. The column labeled “Estimated BIG Net Debt Service Amortization” shows the total amount of principal andinterest due in the period indicated and represents the maximum net amount the Company would be required to pay on BIGPuerto Rico exposures in a given period assuming the obligors paid nothing on all of those obligations in that period. Thecolumn labeled “Estimated BIG Ending Net Debt Service Outstanding” is simply the arithmetic total of all of the principal andinterest payments remaining for the remaining life of such obligations, and represents the maximum amount the Companywould be required to pay if none of the obligors ever paid anything for the remaining life of the obligations.
BIG Net Par Outstandingand BIG Net Debt Service Outstanding of Puerto Rico
Amortization ScheduleAs of December 31, 2013
Estimated BIG NetPar Amortization
Estimated BIGEnding Net Par
Outstanding
Estimated BIG NetDebt ServiceAmortization
Estimated BIGEnding Net Debt
Service Outstanding(in millions)
2013 (as of December 31) $ 5,171 $ 8,5472014 (January 1 – March 31) $ — 5,171 $ 66 8,4812014 (April 1 – June 30) — 5,171 66 8,4152014 (July 1 – September 30) 242 4,929 306 8,1092014 (October 1 – December 31) — 4,929 63 8,0462015 364 4,565 608 7,4382016 289 4,276 515 6,9232017 208 4,068 421 6,5022018 160 3,908 363 6,139
2014-2018 1,263 3,908 2,408 6,1392019-2023 921 2,987 1,780 4,3592024-2028 979 2,008 1,622 2,7372029-2033 706 1,302 1,141 1,596After 2033 1,302 — 1,596 —
Total $ 5,171 $ 8,547
Recent announcements and actions by the Governor and his administration indicate officials of the Commonwealth arefocused on measures to help Puerto Rico operate within its financial resources and maintain its access to the capital markets.All Puerto Rico credits insured by the Company are current on their debt service payments, and we expect them to continue tomake their debt service payments. Neither Puerto Rico nor its related authorities and public corporations are eligible debtorsunder Chapter 9 of the U.S. Bankruptcy Code. However, Puerto Rico faces high debt levels, a declining population and aneconomy that has been in recession since 2006. Puerto Rico has been operating with a structural budget deficit in recent years,and its two largest pension funds are significantly underfunded.
In January 2014 the Company downgraded most of its insured Puerto Rico credits to BIG, reflecting the economic andfinancial challenges facing the Commonwealth and due to concerns that the rating agencies would downgrade Puerto Rico andlimit its access to credit. Subsequently, in February 2014, S&P, Moody's and Fitch Ratings downgraded much of the debt ofPuerto Rico and its related authorities and public corporations to BIG, citing various factors including limited liquidity andmarket access risk. Under the Company's loss estimation process it established an expected loss for its BIG Puerto Ricoexposures taking into account estimates of the probability and severity of default of each issuer.
Following their downgrade of Puerto Rico, Moody's formally affirmed their ratings for AGM (A2, stable outlook) andAGC (A3, stable outlook). Moody's also affirmed their ratings for AG Re (Baa1) but changed their outlook for the rating tonegative. Similarly, S&P published an analysis of Assured Guaranty's Puerto Rico exposure, which concluded that, following
0345r4.indd 113 3/19/14 3:28 PM

112
S&P's downgrade of the Commonwealth, Assured Guaranty's stress case capital charge would increase by approximately $65million and that Assured Guaranty continued to have substantial excess capital.
Financial Guaranty Portfolio by Issue Size
The Company seeks broad coverage of the market by insuring and reinsuring small and large issues alike. Thefollowing table sets forth the distribution of the Company's portfolio by original size of the Company's exposure.
Public Finance Portfolio by Issue SizeAs of December 31, 2013
Original Par Amount Per IssueNumber of
IssuesNet Par
Outstanding
% of PublicFinanceNet Par
Outstanding(dollars in millions)
Less than $10 million 17,802 $ 50,930 13.2%$10 through $50 million 6,640 115,492 29.9%$50 through $100 million 1,263 69,035 17.9%$100 million to $200 million 546 61,053 15.8%$200 million or greater 324 89,669 23.2%
Total 26,575 $ 386,179 100.0%
Structured Finance Portfolio by Issue SizeAs of December 31, 2013
Original Par Amount Per IssueNumber of
IssuesNet Par
Outstanding
% of StructuredFinanceNet Par
Outstanding(dollars in millions)
Less than $10 million 267 $ 123 0.2%$10 through $50 million 482 6,499 8.9%$50 through $100 million 154 5,824 8.0%$100 million to $200 million 216 15,032 20.6%$200 million or greater 225 45,450 62.3%
Total 1,344 $ 72,928 100.0%
Exposures by Reinsurer
Ceded par outstanding represents the portion of insured risk ceded to other reinsurers. Under these relationships, theCompany cedes a portion of its insured risk in exchange for a premium paid to the reinsurer. The Company remains primarilyliable for all risks it directly underwrites and is required to pay all gross claims. It then seeks reimbursement from the reinsurerfor its proportionate share of claims. The Company may be exposed to risk for this exposure if it were required to pay the grossclaims and not be able to collect ceded claims from an assuming company experiencing financial distress. A number of thefinancial guaranty insurers to which the Company has ceded par have experienced financial distress and as a result beendowngraded by the rating agencies. In addition, state insurance regulators have intervened with respect to some of theseinsurers.
Assumed par outstanding represents the amount of par assumed by the Company from other monolines. Under theserelationships, the Company assumes a portion of the ceding company’s insured risk in exchange for a premium. The Companymay be exposed to risk in this portfolio in that the Company may be required to pay losses without a corresponding premium incircumstances where the ceding company is experiencing financial distress and is unable to pay premiums.
In addition to assumed and ceded reinsurance arrangements, the Company may also have exposure to some financialguaranty reinsurers (i.e. monolines) in other areas. Second-to-pay insured par outstanding represents transactions the Company
0345r4.indd 114 3/19/14 3:28 PM

113
has insured that were previously insured by other monolines. The Company underwrites such transactions based on theunderlying insured obligation without regard to the primary insurer. See Note 14, Reinsurance and Other Monoline Exposures,of the Financial Statements and Supplementary Data.
Exposure by Reinsurer
Ratings at Par Outstanding
February 24, 2014 As of December 31, 2013
Reinsurer
Moody’sReinsurer
Rating
S&PReinsurer
Rating
CededPar
Outstanding(1)
Second-to-Pay
Insured ParOutstanding
AssumedPar
Outstanding(dollars in millions)
American Overseas Reinsurance CompanyLimited (f/k/a Ram Re) WR (2) WR $ 8,331 $ — $ 30Tokio Marine & Nichido FireInsurance Co., Ltd. Aa3 (3) AA- (3) 7,279 — —Radian Asset Assurance Inc. Ba1 B+ 4,709 38 1,082Syncora Guarantee Inc. WR WR 4,201 1,771 162Mitsui Sumitomo Insurance Co. Ltd. A1 A+ (3) 2,144 — —ACA Financial Guaranty Corp. NR (5) WR 809 5 9Swiss Reinsurance Co. Aa3 AA- 346 — —Ambac Assurance Corporation (4) WR WR 85 6,118 17,859CIFG Assurance North America Inc. WR WR 2 178 5,048MBIA Inc. (4) (4) — 10,292 7,386Financial Guaranty Insurance Co. WR WR — 2,329 1,315Other Various Various 882 2,099 46
Total $ 28,788 $ 22,830 $ 32,937 ____________________(1) Includes $3,172 million in ceded par outstanding related to insured credit derivatives.
(2) Represents “Withdrawn Rating.”
(3) The Company has structural collateral agreements satisfying the triple-A credit requirement of S&P and/or Moody’s.
(4) MBIA Inc. includes various subsidiaries which are rated A and B by S&P and Baa1, B1 and B3 by Moody’s. AmbacAssurance Corporation includes policies in their general and segregated account.
(5) Represents “Not Rated.”
In accordance with U.S. statutory accounting requirements and U.S. insurance laws and regulations, in order for theCompany to receive credit for liabilities ceded to reinsurers domiciled outside of the U.S., such reinsurers must secure theirliabilities to the Company. All of the unauthorized reinsurers in the table above post collateral for the benefit of the Company inan amount at least equal to the sum of their ceded unearned premium reserve, loss reserves and contingency reserves allcalculated on a statutory basis of accounting. In addition, certain authorized reinsurers in the table above post collateral onterms negotiated with the Company. Collateral may be in the form of letters of credit or trust accounts. The total collateralposted by all non-affiliated reinsurers as of December 31, 2013 is approximately $658 million.
Exposure to Residential Mortgage-Backed Securities
The tables below provide information on the risk ratings and certain other risk characteristics of the Company’sfinancial guaranty insurance and credit derivative RMBS exposures as of December 31, 2013. U.S. RMBS exposures represent3% of the total net par outstanding and BIG U.S. RMBS represent 34% of total BIG net par outstanding. The tables presentedprovide information with respect to the underlying performance indicators of this book of business. See Note 6, Expected Loss
0345r4.indd 115 3/19/14 3:28 PM

114
to be Paid, of the Financial Statements and Supplementary Data, for a discussion of expected losses to be paid on U.S. RMBSexposures.
Net par outstanding in the following tables is based on values as of December 31, 2013. Previously, the Company hadincluded securities purchased for loss mitigation purposes in its invested assets portfolio and its financial guaranty insuredportfolio. Beginning in the third quarter of 2013, the Company excludes such loss mitigation securities from its disclosureabout its financial guaranty insured portfolio (unless otherwise indicated); it has taken this approach as of both December 31,2013 and December 31, 2012. In addition, under the terms of certain credit derivative contracts, the referenced obligations insuch contracts have been delivered to the Company and they therefore are included in the investment portfolio. Such amountsare still included in the financial guaranty insured portfolio and totaled $195 million and $220 million in gross par outstandingas of December 31, 2013 and 2012, respectively. All performance information such as pool factor, subordination, cumulativelosses and delinquency is based on December 31, 2013 information obtained from third parties and/or provided by the trusteeand may be subject to revision as updated or additional information is obtained.
Pool factor in the following tables is the percentage of the current collateral balance divided by the original collateralbalance of the transactions at inception.
Subordination in the following tables represents the sum of subordinate tranches and overcollateralization, expressedas a percentage of total transaction size and does not include any benefit from excess spread collections that may be used toabsorb losses. Many of the closed-end-second lien RMBS transactions insured by the Company have unique structures wherebythe collateral may be written down for losses without a corresponding write-down of the obligations insured by the Company.Many of these transactions are currently undercollateralized, with the principal amount of collateral being less than theprincipal amount of the obligation insured by the Company. The Company is not required to pay principal shortfalls until legalmaturity (rather than making timely principal payments), and takes the undercollateralization into account when estimatingexpected losses for these transactions.
Cumulative losses in the following tables are defined as net charge-offs on the underlying loan collateral divided bythe original collateral balance.
60+ day delinquencies in the following tables are defined as loans that are greater than 60 days delinquent and allloans that are in foreclosure, bankruptcy or real estate owned divided by current collateral balance.
U.S. Prime First Lien in the tables below includes primarily prime first lien plus an insignificant amount of othermiscellaneous RMBS transactions.
Distribution of U.S. RMBS by Internal Rating and Type of Exposure as of December 31, 2013
Ratings (1):
PrimeFirstLien
ClosedEnd
SecondLien HELOC
Alt-AFirst Lien
OptionARM
SubprimeFirstLien
Total NetPar
Outstanding(in millions)
AAA $ 1 $ 0 $ 20 $ 218 $ 4 $ 2,210 $ 2,453AA 98 98 99 407 290 1,675 2,668A 1 0 9 12 21 146 189BBB 38 — 254 224 23 155 694BIG 402 146 1,897 2,728 598 1,945 7,717
Total exposures $ 541 $ 244 $ 2,279 $ 3,590 $ 937 $ 6,130 $ 13,721____________________(1) In the third quarter of 2013, the Company adjusted its approach to assigning internal ratings. See "Refinement of
Approach to Internal Credit Ratings and Surveillance Categories" in Note 3, Outstanding Exposure, of the FinancialStatements and Supplementary Data.
0345r4.indd 116 3/19/14 3:28 PM

115
Distribution of U.S. RMBS by Year Insured and Type of Exposure as of December 31, 2013
Yearinsured:
PrimeFirstLien
ClosedEnd
SecondLien HELOC
Alt-AFirst Lien
OptionARM
SubprimeFirstLien
Total NetPar
Outstanding(in millions)
2004 and prior $ 22 $ 1 $ 191 $ 76 $ 25 $ 1,213 $ 1,5272005 162 — 556 528 43 200 1,4902006 92 52 692 317 76 2,486 3,7152007 264 192 839 1,663 737 2,157 5,8522008 — — — 1,005 56 73 1,135
Total exposures $ 541 $ 244 $ 2,279 $ 3,590 $ 937 $ 6,130 $ 13,721
Distribution of U.S. RMBS by Internal Rating (1) and Year Insured as of December 31, 2013
Yearinsured:
AAARated
AARated
ARated
BBBRated
BIGRated Total
(dollars in millions)
2004 and prior $ 978 $ 124 $ 41 $ 69 $ 315 $ 1,5272005 103 177 2 90 1,118 1,4902006 1,292 1,211 80 110 1,022 3,7152007 9 1,099 66 425 4,254 5,8522008 71 56 — — 1,008 1,135
Total exposures $ 2,453 $ 2,668 $ 189 $ 694 $ 7,717 $ 13,721% of total 17.9% 19.4% 1.4% 5.1% 56.2% 100.0%
____________________(1) In the third quarter of 2013, the Company adjusted its approach to assigning internal ratings. See "Refinement of
Approach to Internal Credit Ratings and Surveillance Categories" in Note 3, Outstanding Exposure, of the FinancialStatements and Supplementary Data.
Distribution of Financial Guaranty Direct U.S. RMBSInsured January 1, 2005 or Later by Exposure Type, Average Pool Factor, Subordination,
Cumulative Losses and 60+ Day Delinquencies as of December 31, 2013
U.S. Prime First Lien
Yearinsured:
Net ParOutstanding
PoolFactor Subordination
CumulativeLosses
60+ DayDelinquencies
Number ofTransactions
(dollars in millions)
2005 $ 159 22.4 % 5.4 % 2.6 % 12.2 % 62006 92 45.9 % 8.3 % 0.9 % 18.8 % 12007 264 32.6 % 2.3 % 6.8 % 18.2 % 12008 — — % — % — % — % —
Total $ 516 31.8% 4.3% 4.5% 16.5% 8
0345r4.indd 117 3/19/14 3:28 PM

116
U.S. Closed End Second Lien
Yearinsured:
Net ParOutstanding
PoolFactor Subordination
CumulativeLosses
60+ DayDelinquencies
Number ofTransactions
(dollars in millions)
2005 $ — — % — % — % — % —2006 43 10.3 % — % 60.8 % 4.6 % 12007 192 12.0 % — % 70.3 % 6.0 % 82008 — — % — % — % — % —
Total $ 235 11.7% —% 68.6% 5.7% 9
U.S. HELOC
Yearinsured:
Net ParOutstanding
PoolFactor Subordination
CumulativeLosses
60+ DayDelinquencies
Number ofTransactions
(dollars in millions)
2005 $ 518 11.0 % 3.3 % 18.8 % 4.9 % 52006 677 19.6 % 4.3 % 38.8 % 3.9 % 72007 839 24.3 % 1.9 % 40.4 % 3.4 % 82008 — — % — % — % — % —
Total $ 2,034 19.4% 3.0% 34.4% 3.9% 20
U.S. Alt-A First Lien
Yearinsured:
Net ParOutstanding
PoolFactor Subordination
CumulativeLosses
60+ DayDelinquencies
Number ofTransactions
(dollars in millions)
2005 $ 526 23.4 % 8.8 % 7.7 % 17.0 % 202006 317 29.0 % 0.0 % 22.7 % 37.0 % 72007 1,663 36.8 % 0.6 % 18.5 % 28.2 % 112008 1,005 34.9 % 13.1 % 17.2 % 25.7 % 5
Total $ 3,512 33.6% 5.3% 16.9% 26.6% 43
U.S. Option ARMs
Yearinsured:
Net ParOutstanding
PoolFactor Subordination
CumulativeLosses
60+ DayDelinquencies
Number ofTransactions
(dollars in millions)
2005 $ 38 15.2 % 11.8 % 10.4 % 16.2 % 22006 71 26.6 % — % 19.4 % 30.8 % 52007 737 36.1 % 0.9 % 23.0 % 29.4 % 112008 56 37.9 % 49.7 % 17.8 % 23.0 % 1
Total $ 902 34.6% 4.3% 21.8% 28.5% 19
0345r4.indd 118 3/19/14 3:28 PM
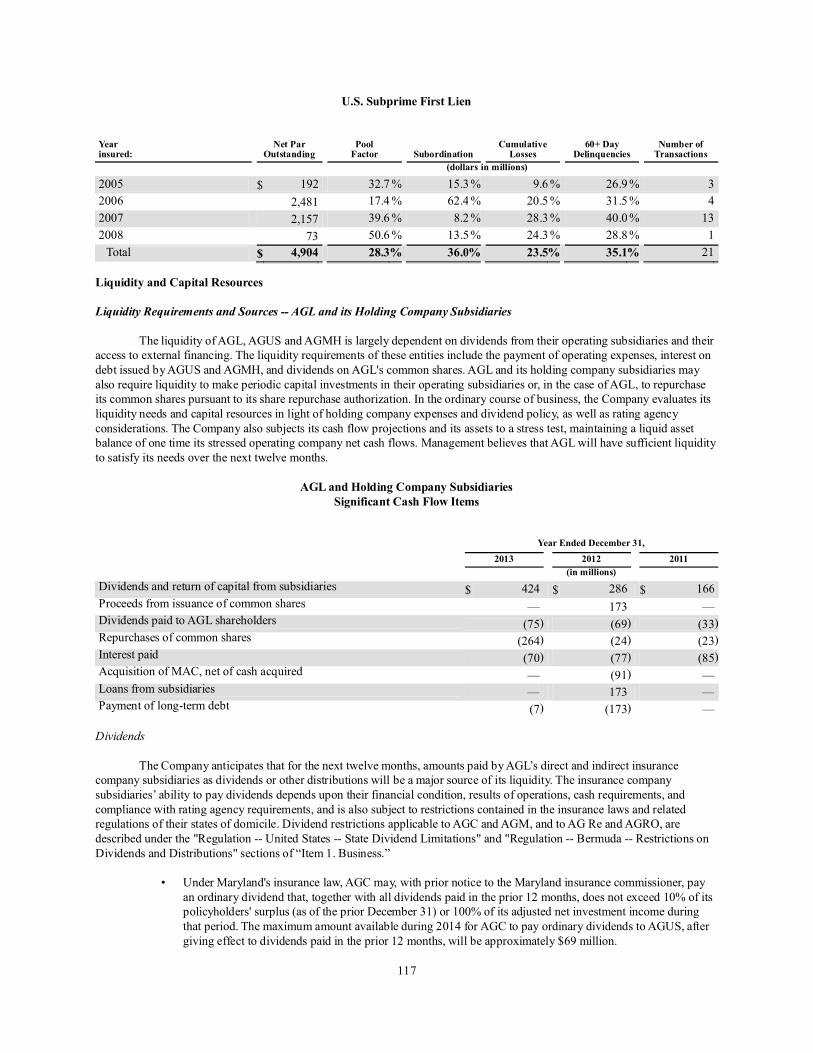
117
U.S. Subprime First Lien
Yearinsured:
Net ParOutstanding
PoolFactor Subordination
CumulativeLosses
60+ DayDelinquencies
Number ofTransactions
(dollars in millions)
2005 $ 192 32.7 % 15.3 % 9.6 % 26.9 % 32006 2,481 17.4 % 62.4 % 20.5 % 31.5 % 42007 2,157 39.6 % 8.2 % 28.3 % 40.0 % 132008 73 50.6 % 13.5 % 24.3 % 28.8 % 1
Total $ 4,904 28.3% 36.0% 23.5% 35.1% 21
Liquidity and Capital Resources
Liquidity Requirements and Sources -- AGL and its Holding Company Subsidiaries
The liquidity of AGL, AGUS and AGMH is largely dependent on dividends from their operating subsidiaries and theiraccess to external financing. The liquidity requirements of these entities include the payment of operating expenses, interest ondebt issued by AGUS and AGMH, and dividends on AGL's common shares. AGL and its holding company subsidiaries mayalso require liquidity to make periodic capital investments in their operating subsidiaries or, in the case of AGL, to repurchaseits common shares pursuant to its share repurchase authorization. In the ordinary course of business, the Company evaluates itsliquidity needs and capital resources in light of holding company expenses and dividend policy, as well as rating agencyconsiderations. The Company also subjects its cash flow projections and its assets to a stress test, maintaining a liquid assetbalance of one time its stressed operating company net cash flows. Management believes that AGL will have sufficient liquidityto satisfy its needs over the next twelve months.
AGL and Holding Company SubsidiariesSignificant Cash Flow Items
Year Ended December 31,2013 2012 2011
(in millions)Dividends and return of capital from subsidiaries $ 424 $ 286 $ 166Proceeds from issuance of common shares — 173 —Dividends paid to AGL shareholders (75) (69) (33)Repurchases of common shares (264) (24) (23)Interest paid (70) (77) (85)Acquisition of MAC, net of cash acquired — (91) —Loans from subsidiaries — 173 —Payment of long-term debt (7) (173) —
Dividends
The Company anticipates that for the next twelve months, amounts paid by AGL’s direct and indirect insurancecompany subsidiaries as dividends or other distributions will be a major source of its liquidity. The insurance companysubsidiaries’ ability to pay dividends depends upon their financial condition, results of operations, cash requirements, andcompliance with rating agency requirements, and is also subject to restrictions contained in the insurance laws and relatedregulations of their states of domicile. Dividend restrictions applicable to AGC and AGM, and to AG Re and AGRO, aredescribed under the "Regulation -- United States -- State Dividend Limitations" and "Regulation -- Bermuda -- Restrictions onDividends and Distributions" sections of “Item 1. Business.”
• Under Maryland's insurance law, AGC may, with prior notice to the Maryland insurance commissioner, payan ordinary dividend that, together with all dividends paid in the prior 12 months, does not exceed 10% of itspolicyholders' surplus (as of the prior December 31) or 100% of its adjusted net investment income duringthat period. The maximum amount available during 2014 for AGC to pay ordinary dividends to AGUS, aftergiving effect to dividends paid in the prior 12 months, will be approximately $69 million.
0345r4.indd 119 3/19/14 3:28 PM

118
• Under New York's insurance law, AGM may only pay dividends out of "earned surplus" and may paydividends without the prior approval of the New York Superintendent that, together with all dividends paid inthe prior 12 months, does not exceed 10% of its policyholders' surplus (as of its last annual or quarterlystatement filed with the New York Superintendent) or 100% of its adjusted net investment income during thatperiod. The maximum amount available during 2014 for AGM to pay dividends to AGMH without regulatoryapproval, after giving effect to dividends paid in the prior 12 months, will be approximately $173 million.
• AG Re, based on regulatory capital requirements, has $600 million in excess capital and surplus. However,dividends are paid out of an insurer's statutory surplus and cannot exceed that surplus; AG Re's outstandingstatutory surplus is $278 million. In addition, annual dividends cannot exceed 25% of total statutory capitaland surplus, which is $281 million, without AG Re certifying to the Bermuda Monetary Authority that it willcontinue to meet required margins. As of December 31, 2013, AG Re had unencumbered assets ofapproximately $238 million. Such amount will fluctuate during the quarter based upon factors including themarket value of previously posted assets and additional ceded reserves, if any.
Generally, dividends paid by a U.S. company to a Bermuda holding company are subject to a 30% withholding tax.After AGL became tax resident in the United Kingdom, as described in the "Tax Matters" section of "Item 1 Business," itbecame subject to the tax rules applicable to companies resident in the U.K., including the benefits afforded by the U.K.’s taxtreaties. The income tax treaty between the U.K. and the U.S. reduces or eliminates the U.S. withholding tax on certain U.S.sourced investment income (to 5% or 0%), including dividends from U.S. subsidiaries to U.K. resident persons entitled to thebenefits of the treaty.
Dividends and Surplus NotesBy Principal Insurance Company Subsidiaries
Year Ended December 31,2013 2012 2011
(in millions)
Dividends paid by AGC to AGUS $ 67 $ 55 $ 30Dividends paid by AGM to AGMH 163 30 —Dividends paid by AG Re to AGL 144 151 86Repayment of surplus note by AGM to AGMH 50 50 50Issuance of surplus notes by MAC to AGM and MAC Holdings (400) — —
External Financing
From time to time, AGL and its subsidiaries have sought external debt or equity financing in order to meet theirobligations. External sources of financing may or may not be available to the Company, and if available, the cost of suchfinancing may not be acceptable to the Company.
Intercompany Loans
From time to time, AGL and its subsidiaries have entered into intercompany loan facilities. For example, on October25, 2013, AGL, as borrower, and AGUS, as lender, entered into a revolving credit facility pursuant to which AGL may, fromtime to time, borrow up to $225 million in the aggregate from AGUS for general corporate purposes. Such commitmentterminates on October 25, 2018 (the “loan termination date”). The unpaid principal amount of each loan will bear interest at afixed rate equal to 100% of the then applicable Federal short-term or mid-term interest rate, as the case may be, as determinedunder Internal Revenue Code Sec. 1274(d), and interest on all loans will be computed for the actual number of days elapsed onthe basis of a year consisting of 360 days. Accrued interest on all loans will be paid on the last day of each June and December,beginning on December 31, 2013, and at maturity. AGL must repay the then unpaid principal amounts of the loans by the thirdanniversary of the loan termination date. No amounts are currently outstanding under the credit facility.
In addition, in connection with the acquisition of MAC, AGUS entered into a loan agreement with its affiliate AGROin 2012 to borrow $90 million in order to fund the purchase price. That loan remained outstanding as of December 31, 2013.Furthermore, AGUS obtained the following funds from its subsidiaries in 2012 to complete the remarketing of the $172.5million principal amount of 8.50% Senior Notes due 2012 that it had issued in 2009 in connection with the acquisition of
0345r4.indd 120 3/19/14 3:28 PM

119
AGHM: (1) $82.5 million loaned from its affiliate AGBM, (2) $50 million in dividends from AGMH, and (3) $40 million individends from AGC. The $82.5 million loan was repaid in full in July 2013 with a combination of the outstanding commonstock of MAC and cash.
Available Cash and Short-Term Investments
As of December 31, 2013, AGL had $33 million in cash and short-term investments with a weighted average durationof 0.1 years. AGUS and AGMH had a total of $113 million in cash, short-term investments and common stock and $115million in fixed-maturity securities with weighted average duration of 1.5 years.
Liquidity Requirements and Sources -- Insurance Company Subsidiaries
Liquidity of the insurance company subsidiaries is primarily used to pay for:
• operating expenses,• claims on the insured portfolio,• posting of collateral in connection with credit derivatives and reinsurance transactions,• reinsurance premiums,• dividends to AGL, AGUS and/or AGMH, as applicable,• principal paydown on surplus notes issued, and• capital investments in their own subsidiaries, where appropriate.
Management believes that its subsidiaries’ liquidity needs for the next twelve months can be met from current cash,short-term investments and operating cash flow, including premium collections and coupon payments as well as scheduledmaturities and paydowns from their respective investment portfolios. The Company targets a balance of its most liquid assetsincluding cash and short-term securities, Treasuries, agency RMBS and pre-refunded municipal bonds equal to 1.5 times itsprojected operating company cash flow needs over the next four quarters. The Company intends to hold and has the ability tohold temporarily impaired debt securities until the date of anticipated recovery.
Beyond the next twelve months, the ability of the operating subsidiaries to declare and pay dividends may beinfluenced by a variety of factors, including market conditions, insurance regulations and rating agency capital requirementsand general economic conditions.
Insurance policies issued provide, in general, that payments of principal, interest and other amounts insured may notbe accelerated by the holder of the obligation. Amounts paid by the Company therefore are typically in accordance with theobligation’s original payment schedule, unless the Company accelerates such payment schedule, at its sole option. CDS mayprovide for acceleration of amounts due upon the occurrence of certain credit events, subject to single-risk limits specified inthe insurance laws of the State of New York. These constraints prohibit or limit acceleration of certain claims according toArticle 69 of the New York Insurance Law and serve to reduce the Company’s liquidity requirements.
Payments made in settlement of the Company’s obligations arising from its insured portfolio may, and often do, varysignificantly from year-to-year, depending primarily on the frequency and severity of payment defaults and whether theCompany chooses to accelerate its payment obligations in order to mitigate future losses.
Claims Paid (Recovered)
Year Ended December 31,2013 2012 2011
Claims paid before R&W recoveries, net of reinsurance $ 705 $ 1,326 $ 1,142R&W recoveries (954) (459) (1,059)Claims paid (recovered), net of reinsurance(1) $ (249) $ 867 $ 83
____________________(1) Includes amounts paid and recovered on consolidated FG VIEs as follows: $189 million in recoveries in 2013, $38
million in recoveries in 2012, and $200 million in payments for 2011. Claims recovered include invested assetsreceived as part of a restructuring. See Note 6, Expected Loss to be Paid, of the Financial Statements andSupplementary Data.
0345r4.indd 121 3/19/14 3:28 PM

120
The Company has exposure to infrastructure transactions with refinancing risk as to which the Company may need tomake claim payments that it did not anticipate paying when the policies were issued. Although the Company may notexperience ultimate loss on a particular transaction, the aggregate amount of the claim payments may be substantial andreimbursement may not occur for an extended time, if at all. As of December 31, 2013, the Company's insured exposure to suchtransactions was approximately $3.0 billion. The Company generally projects that in most scenarios it will be fully reimbursedfor claim payments it makes on such exposure. However, the recovery of the payments is uncertain and may take a long time,ranging from 10 to 35 years, depending on the transaction and the performance of the underlying collateral. For the Company'stwo largest transactions with significant refinancing risk, assuming no refinancing of the insured obligations, the Companyestimates, based on certain performance assumptions, that total claims could be $1.8 billion on a gross basis; such claims wouldbe payable from 2017 through 2022.
In addition, the Company has net par exposure of $5.4 billion to the Commonwealth of Puerto Rico, of which $5.2billion net par is rated BIG by the Company. Although the Commonwealth has not defaulted on any of its debt, it facessignificant challenges, including high debt levels, a declining population and an economy that has been in recession since 2006.In February 2014, S&P, Moody's and Fitch Ratings downgraded much of the debt of Puerto Rico and its related authorities andpublic corporations to below investment grade, citing various factors including limited liquidity and market access risk.Information regarding the Company's exposure to the Commonwealth of Puerto Rico and its related authorities and publiccorporations is set forth in "Insured Portfolio-Exposure to Puerto Rico" above.
The terms of the Company’s CDS contracts generally are modified from standard CDS contract forms approved byISDA in order to provide for payments on a scheduled basis and to replicate the terms of a traditional financial guarantyinsurance policy. Some contracts the Company entered into as the credit protection seller, however, utilize standard ISDAsettlement mechanics of cash settlement (i.e., a process to value the loss of market value of a reference obligation) or physicalsettlement (i.e., delivery of the reference obligation against payment of principal by the protection seller) in the event of a“credit event,” as defined in the relevant contract. Cash settlement or physical settlement generally requires the payment of alarger amount, prior to the maturity of the reference obligation, than would settlement on a “pay-as-you-go” basis, under whichthe Company would be required to pay scheduled interest shortfalls during the term of the reference obligation and scheduledprincipal shortfall only at the final maturity of the reference obligation. The Company’s CDS contracts also generally providethat if events of default or termination events specified in the CDS documentation were to occur, the non-defaulting or the non-affected party, which may be either the Company or the counterparty, depending upon the circumstances, may decide toterminate the CDS contract prior to maturity. The Company may be required to make a termination payment to its swapcounterparty upon such termination. In addition, under certain of the Company's CDS, the Company may be obligated tocollateralize its obligations under the CDS if it does not maintain financial strength ratings above the negotiated rating levelspecified in the CDS documentation.
Consolidated Cash Flows
Consolidated Cash Flow Summary
Year Ended December 31,2013 2012 2011
Net cash flows provided by (used in) operating activities $ 244 $ (165) $ 676Net cash flows provided by (used in) investing activities 681 943 561Net cash flows provided by (used in) financing activities (878) (856) (1,132)Effect of exchange rate changes (1) 1 2Cash at beginning of period 138 215 108
Total cash at the end of the period $ 184 $ 138 $ 215
Claims paid on consolidated FG VIEs are presented in the consolidated cash flow statements as a component ofpaydowns on FG VIE liabilities in financing activities as opposed to operating activities. Excluding consolidated FG VIEs,cash inflows from operating activities in 2013 compared to cash outflows for 2012 were mainly due to lower claim payments(net of R&W recoveries), partially offset by lower premiums due to lower business production and higher taxes in 2013.Excluding consolidated FG VIEs, cash outflows from operating activities for 2012 compared to cash inflows for 2011 weremainly due higher net claim payments in 2012, offset in part by cash received on two commutations of $190 million. Losses
0345r4.indd 122 3/19/14 3:28 PM

121
paid in 2012 include claims related to Greek sovereign exposures. Cash inflows from operating activities in 2011 were duemainly to cash proceeds received from the Company's settlement agreement with Bank of America.
Investing activities were primarily net sales (purchases) of fixed-maturity and short-term investment securities.Investing cash flows in 2013, 2012 and 2011 include inflows of $663 million, $545 million and $760 million for FG VIEs,respectively. The 2013 amount also include proceeds from sales of third party surplus notes and other invested assets. In 2012the Company paid $91 million to acquire MAC and received $56 million from a payment of a note receivable.
Financing activities consisted primarily of paydowns of FG VIE liabilities. Financing cash flows in 2013, 2012 and2011 include outflows of $511 million, $724 million and $1,053 million for FG VIEs, respectively.
In 2013, the Company paid $264 million to repurchase 12.5 million common shares; in 2012, the Company paid $24million to repurchase 2.1 million common shares; and in 2011, the Company paid $23 million to repurchase 2.0 millioncommon shares. As of December 31, 2013, the Company is authorized to repurchase $400 million common shares. For moreinformation about the Company's share repurchase authorization and the amounts it repurchased in 2013, see Note 19,Shareholders' Equity, of the Financial Statements and Supplementary Data.
Commitments and Contingencies
Leases
AGL and its subsidiaries are party to various lease agreements. The principal executive offices of AGL and AG Reconsist of approximately 8,250 square feet of office space located in Hamilton, Bermuda; the lease for this space expires inApril 2015. The principal place of business of AGM, AGC, MAC and the Company's other U.S. based subsidiaries is located inNew York City, where the Company leases approximately 110,000 square feet of office space under an agreement that expiresin April 2026. In addition, the Company occupies another approximately 21,000 square feet of office space in London andSydney, and two offices in San Francisco and Irvine, California; those leases expire at various dates through 2016. See “–Contractual Obligations” for lease payments due by period. Rent expense was $9.9 million in 2013, $10.0 million in 2012 and$10.7 million in 2011.
0345r4.indd 123 3/19/14 3:28 PM

122
Long-Term Debt Obligations
The principal outstanding and interest paid on long-term debt issued by AGUS and AGMH were as follows:
Principal Outstandingand Interest Paid on Long-Term Debt
Principal Amount Interest PaidAs of December 31, Year Ended December 31,
2013 2012 2013 2012 2011(in millions)
AGUS:7.0% Senior Notes $ 200 $ 200 $ 14 $ 14 $ 148.50% Senior Notes(1) — — — 7 15Series A Enhanced Junior Subordinated Debentures 150 150 10 10 10
Total AGUS 350 350 24 31 39AGMH(1):
67/8% QUIBS 100 100 7 7 76.25% Notes 230 230 14 14 145.60% Notes 100 100 6 6 6Junior Subordinated Debentures 300 300 19 19 19
Total AGMH 730 730 46 46 46AGM(2):
Notes Payable 34 61 6 8 7Total AGM 34 61 6 8 7
Total $ 1,114 $ 1,141 $ 76 $ 85 $ 92 ____________________(1) On June 1, 2012, AGUS retired all of the 8.5% Senior Notes. See Note 17, Long-Term Debt and Credit Facilities, of
the Financial Statements and Supplementary Data.
(2) Principal amounts vary from carrying amounts due primarily to acquisition method fair value adjustments at theAcquisition Date, which are accreted or amortized into interest expense over the remaining terms of these obligations.
AGL fully and unconditionally guarantees the following obligations:
• 7.0% Senior Notes issued by AGUS• 6 7/8% Quarterly Income Bonds Securities (“QUIBS”) issued by AGMH• 6.25% Notes issued by AGMH• 5.60% Notes issued by AGMH
In addition, AGL guarantees, on a junior subordinated basis, AGUS’s Series A, Enhanced Junior SubordinatedDebentures and AGMH’s outstanding Junior Subordinated Debentures.
7.0% Senior Notes issued by AGUS. On May 18, 2004, AGUS issued $200 million of 7.0% senior notes due 2034(“7.0% Senior Notes”) for net proceeds of $197 million. Although the coupon on the Senior Notes is 7.0%%, the effective rateis approximately 6.4%%, taking into account the effect of a cash flow hedge.
Series A Enhanced Junior Subordinated Debentures issued by AGUS. On December 20, 2006, AGUS issued $150million of the Debentures due 2066. The Debentures pay a fixed 6.4% rate of interest until December 15, 2016, and thereafterpay a floating rate of interest, reset quarterly, at a rate equal to three month London Interbank Offered Rate ("LIBOR") plus amargin equal to 2.38%. AGUS may select at one or more times to defer payment of interest for one or more consecutive periodsfor up to ten years. Any unpaid interest bears interest at the then applicable rate. AGUS may not defer interest past the maturitydate.
0345r4.indd 124 3/19/14 3:28 PM

123
6 7/8% QUIBS issued by AGMH. On December 19, 2001, AGMH issued $100 million face amount of 6 7/8%QUIBS due December 15, 2101, which are callable without premium or penalty.
6.25% Notes issued by AGMH. On November 26, 2002, AGMH issued $230 million face amount of 6.25% Notesdue November 1, 2102, which are callable without premium or penalty in whole or in part.
5.60% Notes issued by AGMH. On July 31, 2003, AGMH issued $100 million face amount of 5.60% Notes dueJuly 15, 2103, which are callable without premium or penalty in whole or in part.
Junior Subordinated Debentures issued by AGMH. On November 22, 2006, AGMH issued $300 million faceamount of Junior Subordinated Debentures with a scheduled maturity date of December 15, 2036 and a final repayment date ofDecember 15, 2066. The final repayment date of December 15, 2066 may be automatically extended up to four times in five-year increments provided certain conditions are met. The debentures are redeemable, in whole or in part, at any time prior toDecember 15, 2036 at their principal amount plus accrued and unpaid interest to the date of redemption or, if greater, the make-whole redemption price. Interest on the debentures will accrue from November 22, 2006 to December 15, 2036 at the annualrate of 6.40%. If any amount of the debentures remains outstanding after December 15, 2036, then the principal amount of theoutstanding debentures will bear interest at a floating interest rate equal to one-month LIBOR plus 2.215% until repaid. AGMHmay elect at one or more times to defer payment of interest on the debentures for one or more consecutive interest periods thatdo not exceed ten years. In connection with the completion of this offering, AGMH entered into a replacement capital covenantfor the benefit of persons that buy, hold or sell a specified series of AGMH long-term indebtedness ranking senior to thedebentures. Under the covenant, the debentures will not be repaid, redeemed, repurchased or defeased by AGMH or any of itssubsidiaries on or before the date that is twenty years prior to the final repayment date, except to the extent that AGMH hasreceived proceeds from the sale of replacement capital securities. The proceeds from this offering were used to pay a dividendto the shareholders of AGMH.
Notes Payable issued by AGM. In order to mitigate certain financial guaranty insurance losses, special purposeentities that AGM consolidates ("refinancing vehicles") borrowed funds from the former AGMH subsidiaries that conductedAGMH’s Financial Products Business (the “Financial Products Companies”). The Company refers to such debt as the "NotesPayable." The Financial Products Companies issued guaranteed investment contracts that AGM insured, and loaned theproceeds to the refinancing vehicles. The refinancing vehicles used the proceeds from the Notes Payable to purchase certainobligations insured by AGM or collateral underlying such obligations and reimbursed AGM for its claim payments, inexchange for AGM assigning to the refinancing vehicles certain of its rights against the trusts in the applicable transactions.
Recourse Credit Facility
In connection with the AGMH Acquisition, AGM agreed to retain the risks relating to the debt and strip policyportions of the leveraged lease business. The liquidity risk to AGM related to the strip policy portion of the leveraged leasebusiness is mitigated by the strip coverage facility described below.
In a leveraged lease transaction, a tax-exempt entity (such as a transit agency) transfers tax benefits to a tax-payingentity by transferring ownership of a depreciable asset, such as subway cars. The tax-exempt entity then leases the asset backfrom its new owner.
If the lease is terminated early, the tax-exempt entity must make an early termination payment to the lessor. A portionof this early termination payment is funded from monies that were pre-funded and invested at the closing of the leveraged leasetransaction (along with earnings on those invested funds). The tax-exempt entity is obligated to pay the remaining, unfundedportion of this early termination payment (known as the “strip coverage”) from its own sources. AGM issued financial guarantyinsurance policies (known as “strip policies”) that guaranteed the payment of these unfunded strip coverage amounts to thelessor, in the event that a tax-exempt entity defaulted on its obligation to pay this portion of its early termination payment.AGM can then seek reimbursement of its strip policy payments from the tax-exempt entity, and can also sell the transferreddepreciable asset and reimburse itself from the sale proceeds.
Currently, all the leveraged lease transactions in which AGM acts as strip coverage provider are breaching a ratingtrigger related to AGM and are subject to early termination. However, early termination of a lease does not result in a draw onthe AGM policy if the tax-exempt entity makes the required termination payment.If all the leases were to terminate early andthe tax-exempt entities do not make the required early termination payments, then AGM would be exposed to possible liquidityclaims on gross exposure of approximately $1.5 billion as of December 31, 2013. To date, none of the leveraged leasetransactions that involve AGM has experienced an early termination due to a lease default and a claim on the AGM policy. It isdifficult to determine the probability that AGM will have to pay strip provider claims or the likely aggregate amount of such
0345r4.indd 125 3/19/14 3:28 PM

124
claims. At December 31, 2013, approximately $1.2 billion of cumulative strip par exposure had been terminated since 2008 ona consensual basis. The consensual terminations have resulted in no claims on AGM.
On July 1, 2009, AGM and Dexia Crédit Local S.A. (“DCL”), acting through its New York Branch (“Dexia CréditLocal (NY)”), entered into a credit facility (the “Strip Coverage Facility”). Under the Strip Coverage Facility, Dexia CréditLocal (NY) agreed to make loans to AGM to finance all draws made by lessors on AGM strip policies that were outstanding asof November 13, 2008, up to the commitment amount. The commitment amount of the Strip Coverage Facility was $1 billionat closing of the AGMH Acquisition but is scheduled to amortize over time. As of December 31, 2013, the maximumcommitment amount of the Strip Coverage Facility had amortized to approximately $968 million and as of February 1, 2014,such maximum commitment amount had amortized further to approximately $960 million. On February 7, 2014, AGM reducedthe maximum commitment amount by $460 million to approximately $500 million, after taking into account its experiencewith its exposure to leveraged lease transactions to date.
Fundings under this facility are subject to certain conditions precedent, and their repayment is collateralized by asecurity interest that AGM granted to Dexia Crédit Local (NY) in amounts that AGM recovers – from the tax-exempt entity, or from asset sale proceeds – following its payment of strip policy claims. The Strip Coverage Facility willterminate upon the earliest to occur of an AGM change of control, the reduction of the commitment amount to $0, andJanuary 31, 2042.
The Strip Coverage Facility’s financial covenants require that AGM and its subsidiaries maintain a maximum debt-to-capital ratio of 30% and maintain a minimum net worth of 75% of consolidated net worth as of July 1, 2009, plus, startingJuly 1, 2014, (i) 25% of the aggregate consolidated net income (or loss) for the period beginning July 1, 2009 and ending onJune 30, 2014 or, (2) zero, if the commitment amount has been reduced to $750 million as described above. The Company is incompliance with all financial covenants as of December 31, 2013.
The Strip Coverage Facility contains restrictions on AGM, including, among other things, in respect of its ability toincur debt, permit liens, pay dividends or make distributions, dissolve or become party to a merger or consolidation. Most ofthese restrictions are subject to exceptions. The Strip Coverage Facility has customary events of default, including (subject tocertain materiality thresholds and grace periods) payment default, bankruptcy or insolvency proceedings and cross-default toother debt agreements.
As of December 31, 2013, no amounts were outstanding under this facility, nor have there been any borrowings duringthe life of this facility.
Committed Capital Securities
Each of AGC and AGM have issued $200 million of committed capital securities pursuant to transactions in whichAGC CCS or AGM’s Committed Preferred Trust Securities (the “AGM CPS”), as applicable, were issued by custodial trustscreated for the primary purpose of issuing such securities, investing the proceeds in high-quality assets and providing putoptions to AGC or AGM, as applicable. The put options allow AGC and AGM to issue non-cumulative redeemable perpetualpreferred securities to the trusts in exchange for cash. For both AGC and AGM, four initial trusts were created, each with aninitial aggregate face amount of $50 million. The Company does not consider itself to be the primary beneficiary of the trustsfor either the AGC or AGM committed capital securities and the trusts are not consolidated in Assured Guaranty's financialstatements.
The trusts provide AGC and AGM access to new capital at their respective sole discretion through the exercise of theput options. Upon AGC's or AGM's exercise of its put option, the relevant trust will liquidate its portfolio of eligible assets anduse the proceeds to purchase the AGC or AGM preferred stock, as applicable. AGC or AGM may use the proceeds from suchsale of its preferred stock to the trusts for any purpose, including the payment of claims. The put agreements have no scheduledtermination date or maturity. However, each put agreement will terminate if (subject to certain grace periods) in the eventspecified events occur.
AGC Committed Capital Securities. AGC entered into separate put agreements with four custodial trusts with respectto its committed capital securities in April 2005. The AGC put options have not been exercised through the date of this filing.Initially, all of AGC committed capital securities were issued to a special purpose pass-through trust (the “Pass-ThroughTrust”). The Pass-Through Trust was dissolved in April 2008 and the AGC committed capital securities were distributed to theholders of the Pass-Through Trust's securities. Neither the Pass-Through Trust nor the custodial trusts are consolidated in theCompany's financial statements. Income distributions on the Pass-Through Trust securities and committed capital securitieswere equal to an annualized rate of one-month LIBOR plus 110 basis points for all periods ending on or prior to April 8, 2008.
0345r4.indd 126 3/19/14 3:28 PM

125
Following dissolution of the Pass-Through Trust, distributions on the AGC committed capital securities are determinedpursuant to an auction process. On April 7, 2008 this auction process failed, thereby increasing the annualized rate on the AGCcommitted capital securities to one-month LIBOR plus 250 basis points. Distributions on the AGC preferred stock will bedetermined pursuant to the same process. AGC continues to have the ability to exercise its put option and cause the relatedtrusts to purchase AGC Preferred Stock.
AGM Committed Capital Securities. AGM entered into separate put agreements with four custodial trusts withrespect to its committed capital securities in June 2003. The AGM put options have not been exercised through the date of thisfiling. AGM pays a floating put premium to the trusts, which represents the difference between the commercial paper yield andthe winning auction rate (plus all fees and expenses of the trust). If an auction does not attract sufficient clearing bids, however,the auction rate is subject to a maximum rate of one-month LIBOR plus 200 basis points for the next succeeding distributionperiod. Beginning in August 2007, the AGM committed capital securities required the maximum rate for each of the relevanttrusts. AGM continues to have the ability to exercise its put option and cause the related trusts to purchase AGM PreferredStock.
Contractual Obligations
The following table summarizes the Company's obligations under its contracts, including debt and lease obligations,and also includes estimated claim payments, based on its loss estimation process, under financial guaranty policies it hasissued.
As of December 31, 2013Less Than
1 Year1-3
Years3-5
YearsAfter
5 Years Total(in millions)
Long-term debt:7.0% Senior Notes $ 14 $ 28 $ 28 $ 415 $ 485Series A Enhanced Junior SubordinatedDebentures 10 19 19 610 65867/8% QUIBS 7 14 14 670 7056.25% Notes 14 29 29 1,436 1,5085.60% Notes 6 11 11 573 601Junior Subordinated Debentures 19 38 38 1,223 1,318Notes Payable 13 15 11 0 39
Operating lease obligations(1) 8 16 15 59 98Other compensation plans(3) 17 1 — — 18Estimated financial guaranty claim payments(2) 389 703 159 1,913 3,164Total $ 497 $ 874 $ 324 $ 6,899 $ 8,594
____________________(1) Operating lease obligations exclude escalations in building operating costs and real estate taxes.
(2) Financial guaranty claim payments represent estimated undiscounted expected cash outflows under direct andassumed financial guaranty contracts, whether accounted for as insurance or credit derivatives, including claimpayments under contracts in consolidated FG VIEs. The amounts presented are not reduced for cessions underreinsurance contracts. Amounts include any benefit anticipated from excess spreads within the contracts but do notreflect any benefit for recoveries under breaches of R&W.
(3) Amount excludes approximately $47 million of liabilities under various supplemental retirement plans, which are fairvalued and payable at the time of termination of employment by either employer or employee. Amount also excludesapproximately $38 million of liabilities under AGL 2004 long term incentive plan, which are fair valued and payableat the time of termination of employment by either employer or employee with change of control. Given the nature ofthese awards, we are unable to determine the year in which they will be paid.
0345r4.indd 127 3/19/14 3:28 PM

126
Investment Portfolio
The Company’s principal objectives in managing its investment portfolio are to preserve the highest possible ratingsfor each operating company; to manage investment risk within the context of the underlying portfolio of insurance risk; tomaintain sufficient liquidity to cover unexpected stress in the insurance portfolio; and to maximize after-tax net investmentincome.
Fixed-Maturity Securities and Short-Term Investments
The Company’s fixed-maturity securities and short-term investments had a duration of 4.9 years as of December 31,2013 and 4.3 years as of December 31, 2012. Generally, the Company’s fixed-maturity securities are designated as available-for-sale. For more information about the Investment Portfolio and a detailed description of the Company’s valuation ofinvestments see Note 11, Investments and Cash, of the Financial Statements and Supplementary Data.
Fixed-Maturity Securities and Short-Term Investmentsby Security Type
As of December 31, 2013 As of December 31, 2012
AmortizedCost
EstimatedFair Value
AmortizedCost
EstimatedFair Value
(in millions)Fixed-maturity securities:
Obligations of state and political subdivisions $ 4,899 $ 5,079 $ 5,153 $ 5,631U.S. government and agencies 674 700 732 794Corporate securities 1,314 1,340 930 1,010Mortgage-backed securities(1):
RMBS 1,160 1,122 1,281 1,266CMBS 536 549 482 520
Asset-backed securities 605 608 482 531Foreign government securities 300 313 286 304
Total fixed-maturity securities 9,488 9,711 9,346 10,056Short-term investments 904 904 817 817
Total fixed-maturity and short-term investments $ 10,392 $ 10,615 $ 10,163 $ 10,873 ____________________(1) Government-agency obligations were approximately 50% of mortgage backed securities as of December 31, 2013 and
61% as of December 31, 2012, based on fair value.
0345r4.indd 128 3/19/14 3:28 PM

127
The following tables summarize, for all fixed-maturity securities in an unrealized loss position as of December 31,2013 and December 31, 2012, the aggregate fair value and gross unrealized loss by length of time the amounts havecontinuously been in an unrealized loss position.
Fixed-Maturity SecuritiesGross Unrealized Loss by Length of Time
As of December 31, 2013
Less than 12 months 12 months or more TotalFair
ValueUnrealized
LossFair
ValueUnrealized
LossFair
ValueUnrealized
Loss(dollars in millions)
Obligations of state and politicalsubdivisions $ 781 $ (39) $ 5 $ 0 $ 786 $ (39)U.S. government and agencies 173 (6) — — 173 (6)Corporate securities 401 (18) 3 0 404 (18)Mortgage-backed securities:
RMBS 414 (21) 186 (51) 600 (72)CMBS 121 (4) — — 121 (4)
Asset-backed securities 196 (2) 42 (5) 238 (7)Foreign government securities 54 (1) 1 0 55 (1)
Total $ 2,140 $ (91) $ 237 $ (56) $ 2,377 $ (147)Number of securities 425 33 458Number of securities with OTTI 13 11 24
Fixed-Maturity SecuritiesGross Unrealized Loss by Length of Time
As of December 31, 2012
Less than 12 months 12 months or more TotalFair
ValueUnrealized
LossFair
ValueUnrealized
LossFair
ValueUnrealized
Loss(dollars in millions)
Obligations of state and politicalsubdivisions $ 79 $ (11) $ — $ — $ 79 $ (11)U.S. government and agencies 62 0 — — 62 0Corporate securities 25 0 — — 25 0Mortgage-backed securities:
— —
RMBS 108 (19) 121 (58) 229 (77)CMBS 5 0 — — 5 0
Asset-backed securities 16 0 35 (10) 51 (10)Foreign government securities 8 0 — — 8 0
Total $ 303 $ (30) $ 156 $ (68) $ 459 $ (98)Number of securities 58 16 74Number of securities with OTTI 5 6 11
Of the securities in an unrealized loss position for 12 months or more as of December 31, 2013, eleven securities hadan unrealized loss greater than 10% of book value. The total unrealized loss for these securities as of December 31, 2013 was$52 million. The Company has determined that the unrealized losses recorded as of December 31, 2013 are yield related andnot the result of other-than-temporary impairment.
0345r4.indd 129 3/19/14 3:28 PM

128
Changes in interest rates affect the value of the Company’s fixed maturity portfolio. As interest rates fall, the fair valueof fixed-maturity securities increases and as interest rates rise, the fair value of fixed-maturity securities decreases. TheCompany’s portfolio of fixed-maturity securities consists primarily of high-quality, liquid instruments.
The amortized cost and estimated fair value of the Company’s available-for-sale fixed-maturity securities, bycontractual maturity, are shown below. Expected maturities will differ from contractual maturities because borrowers may havethe right to call or prepay obligations with or without call or prepayment penalties.
Distribution of Fixed-Maturity Securitiesby Contractual MaturityAs of December 31, 2013
AmortizedCost
EstimatedFair Value
(in millions)
Due within one year $ 272 $ 275Due after one year through five years 1,662 1,734Due after five years through 10 years 2,420 2,505Due after 10 years 3,438 3,526Mortgage-backed securities:
RMBS 1,160 1,122CMBS 536 549
Total $ 9,488 $ 9,711
The following table summarizes the ratings distributions of the Company’s investment portfolio as of December 31,2013 and December 31, 2012. Ratings reflect the lower of the Moody’s and S&P classifications, except for bonds purchased forloss mitigation or risk management strategies, which use Assured Guaranty’s internal ratings classifications.
Distribution ofFixed-Maturity Securities by Rating
RatingAs of
December 31, 2013As of
December 31, 2012AAA 16.5% 18.5%AA 57.5 61.3A 17.6 14.3BBB 0.9 0.4BIG(1) 7.5 5.5
Total 100.0% 100.0%____________________(1) Comprised primarily of loss mitigation and other risk management assets. See Note 11, Investments and Cash, of the
Financial Statements and Supplementary Data.
0345r4.indd 130 3/19/14 3:28 PM

129
The following table presents the fair value of securities with third-party guaranties.
Summary of Investments withThird-Party Guaranties (1)
at Fair Value
GuarantorAs of
December 31, 2013(in millions)
National Public Finance Guarantee Corporation $ 461Ambac Assurance Corporation 455CIFG Assurance North America Inc. 19Berkshire Hathaway Assurance Corporation 5Syncora Guarantee Inc. 3
Total $ 943___________________(1) 99.2% of these securities had investment grade ratings based on the lower of Moody’s and S&P.
Under agreements with its cedants and in accordance with statutory requirements, the Company maintains fixed-maturity securities and cash in trust accounts for the benefit of reinsured companies, which amounted to $377 million and $368million as of December 31, 2013 and December 31, 2012, respectively, based on fair value. In addition, to fulfill state licensingrequirements, the Company has placed on deposit eligible securities of $19 million and $27 million as of December 31, 2013and December 31, 2012, respectively.
Under certain derivative contracts, the Company is required to post eligible securities as collateral. The need to postcollateral under these transactions is generally based on mark-to-market valuations in excess of contractual thresholds. The fairmarket value of the Company’s pledged securities totaled $677 million and $660 million as of December 31, 2013 andDecember 31, 2012, respectively.
Liquidity Arrangements with respect to AGMH’s former Financial Products Business
AGMH’s former financial products segment had been in the business of borrowing funds through the issuance of GICsand medium term notes and reinvesting the proceeds in investments that met AGMH’s investment criteria. The financialproducts business also included the equity payment undertaking agreement portion of the leveraged lease business, as describedfurther below in “—Leveraged Lease Business.”
The GIC Business
Until November 2008, AGMH, through its financial products business, offered GICs to municipalities and othermarket participants. The GICs were issued through AGMH’s non-insurance subsidiaries (the “GIC Issuers”) FSA CapitalManagement Services LLC, FSA Capital Markets Services LLC and FSA Capital Markets Services (Caymans) Ltd. In returnfor an initial payment, each GIC entitles its holder to receive the return of the holder’s invested principal plus interest at aspecified rate, and to withdraw principal from the GIC as permitted by its terms. AGM insures the GIC Issuer’s paymentobligations on all GICs issued by the applicable GIC Issuer.
The proceeds of GICs issued by the GIC Issuers were loaned to AGMH’s former subsidiary FSA Asset ManagementLLC ("FSAM"). FSAM in turn invested these funds in fixed-income obligations (primarily residential mortgage-backedsecurities, but also short-term investments, securities issued or guaranteed by U.S. government sponsored agencies, taxablemunicipal bonds, securities issued by utilities, infrastructure-related securities, collateralized debt obligations, other asset-backed securities and foreign currency denominated securities) (the “FSAM assets”).
Prior to the completion of the AGMH Acquisition, AGMH sold its ownership interest in the GIC Issuers and FSAM toDexia Holdings. Even though AGMH no longer owns the GIC Issuers or FSAM, AGM’s guarantees of the GICs remain inplace, and must remain in place until each GIC is terminated.
0345r4.indd 131 3/19/14 3:28 PM

130
In June 2009, in connection with the AGMH Acquisition, Dexia SA, Dexia Holdings’ ultimate parent, and certain ofits affiliates, entered into a number of agreements intended to mitigate the credit, interest rate and liquidity risks associated withthe GIC business and the related AGM guarantees. Some of those agreements have since terminated or expired, or beenmodified. In addition to the surviving agreements described below, AGM benefits from a guaranty jointly and severally issuedby Dexia SA and DCL to AGM that guarantees the payment obligations of AGM under its policies related to the GIC business,and an indemnification agreement between AGM, Dexia SA and DCL that protects AGM from other losses arising out of or asa result of the GIC business.
To support the payment obligations of FSAM and the GIC Issuers, each of Dexia SA and DCL are party to an ISDAMaster Agreement, including an associated schedule, confirmation and credit support annex (the “Non-Guaranteed PutContract”), the economic effect of which is that Dexia SA and DCL jointly and severally guarantee (i) the scheduled paymentsof interest and principal in relation to a specified portfolio of FSAM assets, (ii) Dexia’s obligation to provide liquidity or liquidcollateral under the committed liquidity lending facilities provided by Dexia affiliates, and (iii) to make certain payments in theevent of an insolvency of Dexia S.A. Pursuant to the Non-Guaranteed Put Contract, FSAM may put an amount of FSAM assetsto Dexia SA and DCL in exchange for funds. The amount that could be put varies depending on the type of trigger event inquestion. In an asset default scenario, the amount payable generally covers at least the amount of the losses on the FSAM assets(by non-payment, writedown or realized loss). For other trigger events, the amount payable generally is at least the amount dueand unpaid under the committed liquidity facilities, the principal amount of the FSAM assets, and the outstanding principalbalance of the GICs. Dexia S.A. and DCL also benefit from certain grace periods and procedural rights under the Non-Guaranteed Put Contract. To secure the Non-Guaranteed Put Contract, Dexia SA and DCL will, pursuant to the credit supportannex thereto, post eligible highly liquid collateral having an aggregate value (subject to agreed reductions) equal to at least theexcess of (i) the aggregate principal amount of all outstanding GICs over (ii) the aggregate mark-to-market value of FSAM’sassets. The agreed-to advance rates applicable to the value of FSAM assets range from 98% to 82% percent for obligationsbacked by the full faith and credit of the United States, sovereign obligations of the United Kingdom, Germany, theNetherlands, France or Belgium, obligations guaranteed by the Federal Deposit Insurance Corporation (FDIC) and formortgage securities issued or guaranteed by U.S. sponsored agencies, and range from 75% to 0% for the other FSAM assets. Asof December 31, 2013, approximately 30% of the FSAM Assets (measured by aggregate principal balance) was in cash or wereobligations backed by the full faith and credit of the United States.
As of December 31, 2013, the aggregate accreted GIC balance was approximately $2.7 billion. As of the same dateand with respect to the FSAM assets that are covered by the primary put contract, the aggregate accreted principal wasapproximately $4.0 billion, the aggregate market value was approximately $3.8 billion and the aggregate market value afteragreed reductions was approximately $2.7 billion. Cash and net derivative value constituted another $0.6 billion of assets.Accordingly, as of December 31, 2013, the aggregate fair value (after agreed reductions) of the assets supporting the GICbusiness exceeded the aggregate principal amount of all outstanding GICs and certain other business and hedging costs of theGIC business. Therefore, no posting of collateral was required under the credit support annex applicable to the primary putcontract. Under the terms of that credit support annex, the collateral posting is recalculated on a weekly basis according to theformula set forth in the credit support annex, and a collateral posting is required whenever the collateralization levels tested bythe formula are not satisfied, subject to a threshold of $5 million.
To provide additional support, Dexia affiliates provide liquidity commitments to lend against the FSAM assets,generally until the GICs have been paid in full. The liquidity commitments comprise:
• an amended and restated revolving credit agreement (the “Liquidity Facility”) pursuant to which DCL commits toprovide funds to FSAM. As a result of agreed reductions and GIC amortization as of December 31, 2013 thecommitments totaled $3.8 billion of (which approximately $1.3 billion was drawn), and
• a master repurchase agreement (the “Repurchase Facility Agreement” and, together with the Liquidity Facility,the “Guaranteed Liquidity Facilities”) pursuant to which DCL will provide up to $3.5 billion of funds in exchangefor the transfer by FSAM to DCL of FSAM securities that are not eligible to satisfy collateralization obligationsof the GIC Issuers under the GICs. As of December 31, 2013, no amounts were outstanding under the RepurchaseFacility Agreement.
Despite the execution of the Non-Guaranteed Put Contract and the Guaranteed Liquidity Facilities, and the significantportion of FSAM assets comprised of highly liquid securities backed by the full faith and credit of the United States, AGMremains subject to the risk that Dexia may not make payments or securities available (i) on a timely basis, which is referred toas “liquidity risk,” or (ii) at all, which is referred to as “credit risk,” because of the risk of default. Even if Dexia has sufficientassets to pay all amounts when due, concerns regarding Dexia’s financial condition or willingness to comply with their
0345r4.indd 132 3/19/14 3:28 PM

131
obligations could cause one or more rating agencies to view negatively the ability or willingness of Dexia and its affiliates toperform under their various agreements and could negatively affect AGM’s ratings.
If Dexia or its affiliates do not fulfill the contractual obligations, the GIC issuers may not have the financial ability topay upon the withdrawal of GIC funds or post collateral or make other payments in respect of the GICs, thereby resulting inclaims upon the AGM financial guaranty insurance policies. If AGM is required to pay a claim due to a failure of the GICissuers to pay amounts in respect of the GICs, AGM is subject to the risk that the GICs will not be paid from funds receivedfrom Dexia before it is required to make payment under its financial guaranty policies or that it will not receive the guarantypayment at all.
One situation in which AGM may be required to pay claims in respect of AGMH's former financial products businessif Dexia SA and its affiliates do not comply with their obligations is following a downgrade of the financial strength rating ofAGM. Most of the GICs insured by AGM allow for the withdrawal of GIC funds in the event of a downgrade of AGM, unlessthe relevant GIC issuer posts collateral or otherwise enhances its credit. Most GICs insured by AGM allow for the terminationof the GIC contract and a withdrawal of GIC funds at the option of the GIC holder in the event of a downgrade of AGM belowa specified threshold, generally below A- by S&P or A3 by Moody's, with no right of the GIC issuer to avoid such withdrawalby posting collateral or otherwise enhancing its credit. Each GIC contract stipulates the thresholds below which the GIC issuermust post eligible collateral, along with the types of securities eligible for posting and the collateralization percentageapplicable to each security type. These collateralization percentages range from 100% of the GIC balance for cash posted ascollateral to, typically, 108% for asset-backed securities. There are expected to be sufficient eligible and liquid assets within theGIC business to satisfy any withdrawal and collateral posting obligations that would be expected to arise as a result of potentialfuture rating action affecting AGM.
The Medium Term Notes Business
In connection with the AGMH Acquisition, DCL agreed to fund, on behalf of AGM and AGBM, 100% of all policyclaims made under financial guaranty insurance policies issued by AGM and AGBM in relation to the medium term notesissuance program of FSA Global Funding Limited. Such agreement is set out in a Separation Agreement, dated as of July 1,2009, between DCL, AGM, AGBM, FSA Global Funding and Premier International Funding Co., and in a funding guarantyand a reimbursement guaranty that DCL issued for the benefit of AGM and AGBM. Under the funding guaranty, DCLguarantees to pay to or on behalf of AGM or AGBM amounts equal to the payments required to be made under policies issuedby AGM or AGBM relating to the medium term notes business. Under the reimbursement guaranty, DCL guarantees to payreimbursement amounts to AGM or AGBM for payments they make following a claim for payment under an obligation insuredby a policy they have issued. Notwithstanding DCL’s obligation to fund 100% of all policy claims under those policies, AGMand AGBM have a separate obligation to remit to DCL a certain percentage (ranging from 0% to 25%) of those policy claims.AGM, the Company and related parties are also protected against losses arising out of or as a result of the medium term notebusiness through an indemnification agreement with DCL. As of December 31, 2013, FSA Global Funding Limited hadapproximately $1.5 billion of notes outstanding.
Leveraged Lease Business
Under the Strip Coverage Facility entered into in connection with the AGMH Acquisition, Dexia Credit Local (NY)agreed to make loans to AGM to finance all draws made by lessors on certain AGM strip policies issued in connection with theleveraged lease business. AGM may request advances under the Strip Coverage Facility without any explicit limit on thenumber of loan requests, provided that the aggregate principal amount of loans outstanding as of any date may not initiallyexceed the commitment amount. The leveraged lease business, the AGM strip policies and the Strip Coverage Facility aredescribed further under “Commitments and Contingencies—Recourse Credit Facility” above.
ITEM 7A. QUANTITATIVE AND QUALITATIVE DISCLOSURES ABOUT MARKET RISK
Market risk is the risk of adverse changes in earnings, cash flow or fair value as a result of changes in the value offinancial instruments. The Company's primary market risk exposures include interest rate risk, foreign currency exchange raterisk and credit spread risk. The Company's primary exposure to market risk is summarized below:
• The fair value of credit derivatives within the financial guaranty portfolio of insured obligations which fluctuatebased on changes in credit spreads of the underlying obligations and the Company's own credit spreads.
• The Investment Portfolio's fair value is primarily driven by changes in interest rates and also affected by changesin credit spreads.
0345r4.indd 133 3/19/14 3:28 PM

132
• The Investment Portfolio also contains foreign denominated securities whose value fluctuates based on changes inforeign exchange rates.
• Premiums receivable include foreign denominated receivables whose carrying value fluctuates based on changesin foreign exchange rates.
• The fair value of the assets and liabilities of consolidated FG VIE's may fluctuate based on changes in prepaymentspreads, default rates, interest rates, and house price depreciation/appreciation.
Sensitivity of Credit Derivatives to Credit Risk
Unrealized gains and losses on credit derivatives are a function of changes in the estimated fair value of theCompany's credit derivative contracts. If credit spreads of the underlying obligations change, the fair value of the related creditderivative changes. Market liquidity could also impact valuations of the underlying obligations. As such, Assured Guarantyexperiences mark-to-market gains or losses. The Company considers the impact of its own credit risk, together with creditspreads on the risk that it assumes through CDS contracts, in determining their fair value. The Company determines its owncredit risk based on quoted CDS prices traded on the Company at each balance sheet date. The quoted price of CDS contractstraded on AGC at December 31, 2013 and December 31, 2012 was 460 bps and 678 bps, respectively. The quoted price of CDScontracts traded on AGM at December 31, 2013 and December 31, 2012 was 525 bps and 536 bps, respectively. Historically,the price of CDS traded on AGC and AGM moves directionally the same as general market spreads, although this may notalways be the case. An overall narrowing of spreads generally results in an unrealized gain on credit derivatives for theCompany, and an overall widening of spreads generally results in an unrealized loss for the Company. In certain circumstances,due to the fact that spread movements are not perfectly correlated, the narrowing or widening of the price of CDS traded onAGC and AGM can have a more significant financial statement impact than the changes in underlying collateral prices.
The impact of changes in credit spreads will vary based upon the volume, tenor, interest rates, and other marketconditions at the time these fair values are determined. In addition, since each transaction has unique collateral and structureterms, the underlying change in fair value of each transaction may vary considerably. The fair value of credit derivativecontracts also reflects the change in the Company's own credit cost, based on the price to purchase credit protection on AGCand AGM.
The Company generally holds these credit derivative contracts to maturity. The unrealized gains and losses onderivative financial instruments will reduce to zero as the exposure approaches its maturity date, unless there is a paymentdefault on the exposure or early termination. Given these facts, the Company does not actively hedge these exposures.
The following table summarizes the estimated change in fair values on the net balance of the Company's CDSpositions assuming immediate parallel shifts in credit spreads on AGC and AGM and on the risks that they both assume:
As of December 31, 2013
Credit Spreads(1)Estimated Net
Fair Value (Pre-Tax)
EstimatedChange in
Gain/(Loss)(Pre-Tax)(in millions)
100% widening in spreads $ (3,499) $ (1,806)50% widening in spreads (2,596) (903)25% widening in spreads (2,145) (452)10% widening in spreads (1,874) (181)Base Scenario (1,693) —10% narrowing in spreads (1,527) 16625% narrowing in spreads (1,276) 41750% narrowing in spreads (860) 833
0345r4.indd 134 3/19/14 3:28 PM

133
As of December 31, 2012
Credit Spreads(1)Estimated Net
Fair Value (Pre-Tax)
EstimatedChange in
Gain/(Loss)(Pre-Tax)(in millions)
100% widening in spreads $ (3,765) $ (1,972)50% widening in spreads (2,777) (984)25% widening in spreads (2,283) (490)10% widening in spreads (1,987) (194)Base Scenario (1,793) —10% narrowing in spreads (1,634) 15925% narrowing in spreads (1,402) 39150% narrowing in spreads (1,028) 765
____________________(1) Includes the effects of spreads on both the underlying asset classes and the Company's own credit spread.
Sensitivity of Investment Portfolio to Interest Rate Risk
Interest rate risk is the risk that financial instruments' values will change due to changes in the level of interest rates, inthe spread between two rates, in the shape of the yield curve or in any other interest rate relationship. The Company is exposedto interest rate risk primarily in its investment portfolio. As interest rates rise for an available-for-sale investment portfolio, thefair value of fixed�income securities decreases. The Company's policy is generally to hold assets in the investment portfolio tomaturity. Therefore, barring credit deterioration, interest rate movements do not result in realized gains or losses unless assetsare sold prior to maturity. The Company does not hedge interest rate risk, however, interest rate fluctuation risk is managedthrough the investment guidelines which limit duration and prevent investment in high volatility sectors.
Interest rate sensitivity in the investment portfolio can be estimated by projecting a hypothetical instantaneous increaseor decrease in interest rates. The following table presents the estimated pre-tax change in fair value of the Company's fixed-maturity securities and short-term investments from instantaneous parallel shifts in interest rates.
Sensitivity to Change in Interest Rates on the Investment PortfolioAs of December 31, 2013
Change in Interest Rates300 Basis
PointDecrease
200 BasisPoint
Decrease
100 BasisPoint
Decrease
100 BasisPoint
Increase
200 BasisPoint
Increase
300 BasisPoint
Increase(in millions)
Estimated change in fair value $ 953 $ 768 $ 446 $ (499) $ (984) $ (1,434)
As of December 31, 2012
Change in Interest Rates300 Basis
PointDecrease
200 BasisPoint
Decrease
100 BasisPoint
Decrease
100 BasisPoint
Increase
200 BasisPoint
Increase
300 BasisPoint
Increase(in millions)
Estimated change in fair value $ 576 $ 532 $ 382 $ (478) $ (970) $ (1,456)
Sensitivity of Other Areas to Interest Rate Risk
Fluctuation in interest rates also affects the demand for the Company's product. When interest rates are lower or whenthe market is otherwise relatively less risk averse, the spread between insured and uninsured obligations typically narrows and,as a result, financial guaranty insurance typically provides lower cost savings to issuers than it would during periods of
0345r4.indd 135 3/19/14 3:28 PM

134
relatively wider spreads. These lower cost savings generally lead to a corresponding decrease in demand and premiumsobtainable for financial guaranty insurance. Changes in interest rates also impact the amount of our losses and could impact theamount of infrastructure exposures that can be refinanced in the future. In addition, increases in prevailing interest rate levelscan lead to a decreased volume of capital markets activity and, correspondingly, a decreased volume of insured transactions.
Sensitivity of Investment Portfolio to Foreign Exchange Rate Risk
Foreign exchange risk is the risk that a financial instrument's value will change due to a change in the foreign currencyexchange rates. The Company has foreign denominated securities in its investment portfolio. Securities denominated incurrencies other than U.S. Dollar were 4.0% and 3.7% of the fixed-maturity securities and short-term investments as ofDecember 31, 2013 and 2012, respectively. The Company's material exposure is to changes in the dollar/pound sterlingexchange rate. Changes in fair value of available-for-sale investments attributable to changes in foreign exchange rates arerecorded in other comprehensive income.
Sensitivity to Change in Foreign Exchange Rates on the Investment PortfolioAs of December 31, 2013
Change in Foreign Exchange Rates30%
Decrease20%
Decrease10%
Decrease10%
Increase20%
Increase30%
Increase(in millions)
Estimated change in fair value $ (131) $ (87) $ (44) $ 44 $ 87 $ 131
As of December 31, 2012
Change in Foreign Exchange Rates
30%Decrease
20%Decrease
10%Decrease
10%Increase
20%Increase
30%Increase
(in millions)
Estimated change in fair value $ (119) $ (79) $ (40) $ 40 $ 79 $ 119
Sensitivity of Premiums Receivable to Foreign Exchange Rate Risk
The Company has foreign denominated premium receivables. The Company's material exposure is to changes indollar/Pound Sterling and dollar/Euro exchange rates.
Sensitivity to Change in Foreign Exchange Rateson Premium Receivable, Net of Reinsurance
As of December 31, 2013
Change in Foreign Exchange Rates30%
Decrease20%
Decrease10%
Decrease10%
Increase20%
Increase30%
Increase(in millions)
Estimated change in carrying value $ (108) $ (72) $ (36) $ 36 $ 72 $ 108
As of December 31, 2012
Change in Foreign Exchange Rates30%
Decrease20%
Decrease10%
Decrease10%
Increase20%
Increase30%
Increase(in millions)
Estimated change in carrying value $ (116) $ (77) $ (39) $ 39 $ 77 $ 116
0345r4.indd 136 3/19/14 3:28 PM

135
Sensitivity of FG VIE Assets and Liabilities to Market Risk
The fair value of the Company's FG VIE assets is sensitive to changes relating to estimated prepayment speeds;estimated default rates (determined on the basis of an analysis of collateral attributes such as: historical collateral performance,borrower profiles and other features relevant to the evaluation of collateral credit quality); recoveries from excess spread,discount rates implied by market prices for similar securities; and house price depreciation/appreciation rates based onmacroeconomic forecasts. Significant changes to any of these inputs could materially change the market value of the FG VIE'sassets and the implied collateral losses within the transaction. In general the fair value of the FG VIE assets is most sensitive tochanges in the projected collateral losses, where an increase in collateral losses typically leads to a decrease in the fair value ofthe Company's FG VIE assets, while a decrease in collateral losses typically leads to an increase in the fair value of theCompany's FG VIE assets. These factors also directly impact the fair value of the Company's FG VIE liabilities.
The fair value of the Company's FG VIE liabilities is also sensitive to changes relating to estimated prepaymentspeeds; market values of the assets that collateralize the securities; estimated default rates (determined on the basis of ananalysis of collateral attributes such as: historical collateral performance, borrower profiles and other features relevant to theevaluation of collateral credit quality); recoveries from excess spread, discount rates implied by market prices for similarsecurities; and house price depreciation/appreciation rates based on macroeconomic forecasts. In addition, the Company's FGVIE liabilities with recourse are also sensitive to changes to the Company's implied credit worthiness. Significant changes toany of these inputs could materially change the timing of expected losses within the insured transaction which is a significantfactor in determining the implied benefit from the Company's insurance policy guaranteeing the timely payment of principaland interest for the FG VIE tranches insured by the Company. In general, when the timing of expected loss payments by theCompany is extended into the future, this typically leads to a decrease in the value of the Company's insurance and a decreasein the fair value of the Company's FG VIE liabilities with recourse, while a shortening of the timing of expected loss paymentsby the Company typically leads to an increase in the value of the Company's insurance and an increase in the fair value of theCompany's FG VIE liabilities with recourse.
0345r4.indd 137 3/19/14 3:28 PM

136
Item 8. FINANCIAL STATEMENTS AND SUPPLEMENTARY DATAReport of Independent Registered Public Accounting Firm 137Consolidated Balance Sheets as of December 31, 2013 and 2012 138Consolidated Statements of Operations for the years ended December 31, 2013, 2012 and 2011 139Consolidated Statements of Comprehensive Income for the years ended December 31, 2013, 2012 and 2011 140Consolidated Statements of Shareholders' Equity for the years ended December 31, 2013, 2012 and 2011 141Consolidated Statements of Cash Flows for the years ended December 31, 2013, 2012 and 2011 142Notes to Consolidated Financial Statements 143
0345r4.indd 138 3/19/14 3:28 PM

137
Report of Independent Registered Public Accounting Firm
To the Board of Directors and Shareholders of Assured Guaranty Ltd.:
In our opinion, the accompanying consolidated balance sheets and the related consolidated statements of operations, ofcomprehensive income, of shareholders’ equity and of cash flows present fairly, in all material respects, the financial positionof Assured Guaranty Ltd. and its subsidiaries at December 31, 2013 and December 31, 2012, and the results of their operationsand their cash flows for each of the three years in the period ended December 31, 2013 in conformity with accountingprinciples generally accepted in the United States of America. Also in our opinion, the Company maintained, in all materialrespects, effective internal control over financial reporting as of December 31, 2013, based on criteria established in the 1992Internal Control - Integrated Framework issued by the Committee of Sponsoring Organizations of the Treadway Commission(COSO). The Company's management is responsible for these financial statements, for maintaining effective internal controlover financial reporting and for its assessment of the effectiveness of internal control over financial reporting, included in theaccompanying Management's Report on Internal Control over Financial Reporting. Our responsibility is to express opinions onthese financial statements and on the Company's internal control over financial reporting based on our integrated audits. Weconducted our audits in accordance with the standards of the Public Company Accounting Oversight Board (United States).Those standards require that we plan and perform the audits to obtain reasonable assurance about whether the financialstatements are free of material misstatement and whether effective internal control over financial reporting was maintained inall material respects. Our audits of the financial statements included examining, on a test basis, evidence supporting theamounts and disclosures in the financial statements, assessing the accounting principles used and significant estimates made bymanagement, and evaluating the overall financial statement presentation. Our audit of internal control over financial reportingincluded obtaining an understanding of internal control over financial reporting, assessing the risk that a material weaknessexists, and testing and evaluating the design and operating effectiveness of internal control based on the assessed risk. Ouraudits also included performing such other procedures as we considered necessary in the circumstances. We believe that ouraudits provide a reasonable basis for our opinions.
A company’s internal control over financial reporting is a process designed to provide reasonable assurance regardingthe reliability of financial reporting and the preparation of financial statements for external purposes in accordance withgenerally accepted accounting principles. A company’s internal control over financial reporting includes those policies andprocedures that (i) pertain to the maintenance of records that, in reasonable detail, accurately and fairly reflect the transactionsand dispositions of the assets of the company; (ii) provide reasonable assurance that transactions are recorded as necessary topermit preparation of financial statements in accordance with generally accepted accounting principles, and that receipts andexpenditures of the company are being made only in accordance with authorizations of management and directors of thecompany; and (iii) provide reasonable assurance regarding prevention or timely detection of unauthorized acquisition, use, ordisposition of the company’s assets that could have a material effect on the financial statements.
Because of its inherent limitations, internal control over financial reporting may not prevent or detect misstatements.Also, projections of any evaluation of effectiveness to future periods are subject to the risk that controls may becomeinadequate because of changes in conditions, or that the degree of compliance with the policies or procedures may deteriorate.
/s/ PricewaterhouseCoopers LLP
New York, New YorkFebruary 28, 2014
0345r4.indd 139 3/19/14 3:28 PM

138
Assured Guaranty Ltd.
Consolidated Balance Sheets
(dollars in millions except per share and share amounts)
As ofDecember 31, 2013
As ofDecember 31, 2012
AssetsInvestment portfolio:
Fixed-maturity securities, available-for-sale, at fair value (amortized cost of $9,488and $9,346) $ 9,711 $ 10,056Short-term investments, at fair value 904 817Other invested assets 170 212
Total investment portfolio 10,785 11,085Cash 184 138Premiums receivable, net of commissions payable 876 1,005Ceded unearned premium reserve 452 561Deferred acquisition costs 124 116Reinsurance recoverable on unpaid losses 36 58Salvage and subrogation recoverable 174 456Credit derivative assets 94 141Deferred tax asset, net 688 721Financial guaranty variable interest entities’ assets, at fair value 2,565 2,688Other assets 309 273
Total assets $ 16,287 $ 17,242Liabilities and shareholders’ equityUnearned premium reserve $ 4,595 $ 5,207Loss and loss adjustment expense reserve 592 601Reinsurance balances payable, net 148 219Long-term debt 816 836Credit derivative liabilities 1,787 1,934Current income tax payable 44 —Financial guaranty variable interest entities’ liabilities with recourse, at fair value 1,790 2,090Financial guaranty variable interest entities’ liabilities without recourse, at fair value 1,081 1,051Other liabilities 319 310
Total liabilities 11,172 12,248Commitments and contingencies (See Note 16)Common stock ($0.01 par value, 500,000,000 shares authorized; 182,177,866 and194,003,297 shares issued and outstanding) 2 2Additional paid-in capital 2,466 2,724Retained earnings 2,482 1,749Accumulated other comprehensive income, net of tax of $71 and $198 160 515Deferred equity compensation (320,193 and 320,193 shares) 5 4
Total shareholders’ equity 5,115 4,994Total liabilities and shareholders’ equity $ 16,287 $ 17,242
The accompanying notes are an integral part of these consolidated financial statements.
0345r4.indd 140 3/19/14 3:28 PM

139
Assured Guaranty Ltd.
Consolidated Statements of Operations
(dollars in millions except per share amounts)
Year Ended December 31,
2013 2012 2011Revenues
Net earned premiums $ 752 $ 853 $ 920Net investment income 393 404 396Net realized investment gains (losses):
Other-than-temporary impairment losses (32) (58) (84)Less: portion of other-than-temporary impairment loss recognized inother comprehensive income 10 (41) (39)Other net realized investment gains (losses) 94 18 27
Net realized investment gains (losses) 52 1 (18)Net change in fair value of credit derivatives:
Realized gains (losses) and other settlements (42) (108) 6Net unrealized gains (losses) 107 (477) 554
Net change in fair value of credit derivatives 65 (585) 560Fair value gains (losses) on committed capital securities 10 (18) 35Fair value gains (losses) on financial guaranty variable interest entities 346 191 (146)Other income (loss) (10) 108 58
Total revenues 1,608 954 1,805Expenses
Loss and loss adjustment expenses 154 504 448Amortization of deferred acquisition costs 12 14 17Interest expense 82 92 99Other operating expenses 218 212 212
Total expenses 466 822 776Income (loss) before income taxes 1,142 132 1,029Provision (benefit) for income taxes
Current 157 57 (127)Deferred 177 (35) 383
Total provision (benefit) for income taxes 334 22 256Net income (loss) $ 808 $ 110 $ 773
Earnings per share:Basic $ 4.32 $ 0.58 $ 4.21Diluted $ 4.30 $ 0.57 $ 4.16
Dividends per share $ 0.40 $ 0.36 $ 0.18
The accompanying notes are an integral part of these consolidated financial statements.
0345r4.indd 141 3/19/14 3:28 PM

140
Assured Guaranty Ltd.
Consolidated Statements of Comprehensive Income
(in millions)
Year Ended December 31,
2013 2012 2011
Net income (loss) $ 808 $ 110 $ 773Unrealized holding gains (losses) arising during the period on:
Investments with no other-than-temporary impairment, net of taxprovision (benefit) of $(106), $56 and $105 (309) 148 234Investments with other-than-temporary impairment, net of tax provision(benefit) of $(17), $(2) and $5 (35) (7) 9
Unrealized holding gains (losses) arising during the period, net of tax (344) 141 243Less: reclassification adjustment for gains (losses) included in net income(loss), net of tax provision (benefit) of $5, $(7) and $(7) 14 (4) (14)Change in net unrealized gains on investments (358) 145 257Other, net of tax provision 3 2 (1)Other comprehensive income (loss) $ (355) $ 147 $ 256Comprehensive income (loss) $ 453 $ 257 $ 1,029
The accompanying notes are an integral part of these consolidated financial statements.
0345r4.indd 142 3/19/14 3:28 PM

141
Assured Guaranty Ltd.
Consolidated Statements of Shareholders’ Equity
Years Ended December 31, 2013, 2012 and 2011
(dollars in millions, except share data)
Common SharesOutstanding
CommonStock Par
Value
AdditionalPaid-inCapital
RetainedEarnings
AccumulatedOther
ComprehensiveIncome
DeferredEquity
Compensation
TotalShareholders’
Equity
Balance at December 31,2010 183,744,655 $ 2 $ 2,586 $ 968 $ 112 $ 2 $ 3,670Net income — — — 773 — — 773Dividends ($0.18 per share) — — — (33) — — (33)Common stock repurchases (2,000,000) — (23) — — — (23)Share-based compensationand other 491,143 — 7 — — 2 9Other comprehensive income — — — — 256 — 256Balance at December 31,2011 182,235,798 2 2,570 1,708 368 4 4,652Net income — — — 110 — — 110Dividends ($0.36 per share) — — — (69) — — (69)Common stock issuance, net 13,428,770 — 173 — — — 173Common stock repurchases (2,066,759) — (24) — — — (24)Share-based compensationand other 405,488 — 5 — — — 5Other comprehensive income — — — — 147 — 147Balance at December 31,2012 194,003,297 2 2,724 1,749 515 4 4,994Net income — — — 808 — — 808Dividends ($0.40 per share) — — — (75) — — (75)Common stock repurchases (12,512,759) — (264) — — — (264)Share-based compensationand other 687,328 — 6 — — 1 7Other comprehensive loss — — — — (355) — (355)Balance at December 31,2013 182,177,866 $ 2 $ 2,466 $ 2,482 $ 160 $ 5 $ 5,115
The accompanying notes are an integral part of these consolidated financial statements.
0345r4.indd 143 3/19/14 3:28 PM

142
Assured Guaranty Ltd.Consolidated Statements of Cash Flows
(in millions)
Year Ended December 31,2013 2012 2011
Operating Activities:Net Income $ 808 $ 110 $ 773Adjustments to reconcile net income to net cash flows provided by operating activities:
Non-cash interest and operating expenses 19 18 20Net amortization of premium (discount) on investments (8) 8 23Provision (benefit) for deferred income taxes 177 (35) 383Net realized investment losses (gains) (52) (1) 18Net unrealized losses (gains) on credit derivatives (107) 477 (554)Fair value loss (gains) on committed capital securities (10) 18 (35)Change in deferred acquisition costs (8) 18 18Change in premiums receivable, net of commissions payable 86 48 138Change in ceded unearned premium reserve 109 141 102Change in unearned premium reserve (612) (749) (998)Change in loss and loss adjustment expense reserve, net 136 (258) 636Change in current income tax 30 129 (182)Change in financial guaranty variable interest entities' assets and liabilities, net (295) (7) 352(Purchases) sales of trading securities, net (16) (59) (6)Other (13) (23) (12)
Net cash flows provided by (used in) operating activities 244 (165) 676Investing activities
Fixed-maturity securities:Purchases (1,886) (1,649) (2,308)Sales 1,029 912 1,107Maturities 883 1,105 663
Net sales (purchases) of short-term investments (87) 29 320Net proceeds from paydowns on financial guaranty variable interest entities’ assets 663 545 760Acquisition of MAC, net of cash acquired — (91) —Other 79 92 19
Net cash flows provided by (used in) investing activities 681 943 561Financing activities
Proceeds from issuances of common stock — 173 —Dividends paid (75) (69) (33)Repurchases of common stock (264) (24) (23)Share activity under option and incentive plans (1) (3) (1)Net paydowns of financial guaranty variable interest entities’ liabilities (511) (724) (1,053)Repayment of long-term debt (27) (209) (22)
Net cash flows provided by (used in) financing activities (878) (856) (1,132)Effect of exchange rate changes (1) 1 2Increase (decrease) in cash 46 (77) 107Cash at beginning of period 138 215 108Cash at end of period $ 184 $ 138 $ 215Supplemental cash flow informationCash paid (received) during the period for:
Income taxes $ 110 $ (24) $ 34Interest $ 76 $ 85 $ 92
The accompanying notes are an integral part of these consolidated financial statements.
0345r4.indd 144 3/19/14 3:28 PM

143
Assured Guaranty Ltd.
Notes to Consolidated Financial Statements
December 31, 2013, 2012 and 2011
1. Business and Basis of Presentation
Business
Assured Guaranty Ltd. (“AGL” and, together with its subsidiaries, “Assured Guaranty” or the “Company”) is aBermuda-based holding company that provides, through its operating subsidiaries, credit protection products to the UnitedStates (“U.S.”) and international public finance (including infrastructure) and structured finance markets. The Company appliesits credit underwriting judgment, risk management skills and capital markets experience to offer financial guaranty insurancethat protects holders of debt instruments and other monetary obligations from defaults in scheduled payments. If an obligordefaults on a scheduled payment due on an obligation, including a scheduled principal or interest payment (“Debt Service”),the Company is required under its unconditional and irrevocable financial guaranty to pay the amount of the shortfall to theholder of the obligation. Obligations insured by the Company include bonds issued by U.S. state or municipal governmentalauthorities; notes issued to finance international infrastructure projects; and asset-backed securities issued by special purposeentities. The Company markets its financial guaranty insurance directly to issuers and underwriters of public finance andstructured finance securities as well as to investors in such obligations. The Company guarantees obligations issued principallyin the U.S. and the United Kingdom ("U.K"). The Company also guarantees obligations issued in other countries and regions,including Australia and Western Europe.
In the past, the Company had sold credit protection by issuing policies that guaranteed payment obligations undercredit derivatives, primarily credit default swaps ("CDS"). Financial guaranty contracts accounted for as credit derivatives aregenerally structured such that the circumstances giving rise to the Company’s obligation to make loss payments are similar tothose for financial guaranty insurance contracts. The Company’s credit derivative transactions are governed by InternationalSwaps and Derivative Association, Inc. (“ISDA”) documentation. The Company has not entered into any new CDS in order tosell credit protection since the beginning of 2009, when regulatory guidelines were issued that limited the terms under whichsuch protection could be sold. The capital and margin requirements applicable under the Dodd-Frank Wall Street Reform andConsumer Protection Act (the “Dodd-Frank Act”) also contributed the Company not entering into such new CDS since 2009.The Company actively pursues opportunities to terminate existing CDS, which have the effect of reducing future fair valuevolatility in income and/or reducing rating agency capital charges.
Basis of Presentation
The consolidated financial statements have been prepared in conformity with accounting principles generally acceptedin the United States of America (“GAAP”) and, in the opinion of management, reflect all adjustments that are of a normalrecurring nature, necessary for a fair statement of the financial condition, results of operations and cash flows of the Companyand its consolidated financial guaranty variable interest entities (“FG VIEs”) for the periods presented. The preparation offinancial statements in conformity with GAAP requires management to make estimates and assumptions that affect the reportedamounts of assets and liabilities and disclosure of contingent assets and liabilities as of the date of the financial statements andthe reported amounts of revenues and expenses during the reporting period. Actual results could differ from those estimates.
The consolidated financial statements include the accounts of AGL, its direct and indirect subsidiaries, (collectively,the “Subsidiaries”), and its consolidated FG VIEs. Intercompany accounts and transactions between and among all consolidatedentities have been eliminated. Certain prior year balances have been reclassified to conform to the current year's presentation.
The Company's principal insurance company subsidiaries are:
• Assured Guaranty Municipal Corp. ("AGM"), domiciled in New York;• Municipal Assurance Corp. ("MAC"), domiciled in New York;• Assured Guaranty Corp. ("AGC"), domiciled in Maryland;• Assured Guaranty (Europe) Ltd., organized in the United Kingdom; and• Assured Guaranty Re Ltd. (“AG Re”), domiciled in Bermuda.
MAC was purchased from Radian Asset Assurance Inc. ("Radian") in 2012 for $91 million in cash. Upon acquisition,the Company recorded $16 million in indefinite lived intangible assets, which represented the value of MAC's insurance
0345r4.indd 145 3/19/14 3:28 PM

144
licenses. MAC commenced underwriting U.S. public finance business in August 2013. MAC is indirectly owned by AGM andAGC. See Note 12, Insurance Company Regulatory Requirements.
The Company’s organizational structure includes various holdings companies, two of which—Assured Guaranty USHoldings Inc. (“AGUS”) and Assured Guaranty Municipal Holdings Inc. (“AGMH”) – have public debt outstanding. SeeNote 17, Long-Term Debt and Credit Facilities.
Significant Accounting Policies
The Company revalues assets, liabilities, revenue and expenses denominated in non-U.S. currencies into U.S. dollarsusing applicable exchange rates. Gains and losses relating to translating foreign functional currency financial statements forU.S. GAAP reporting are recorded in other comprehensive income (loss) ("OCI") within shareholders' equity. Gains and lossesrelating to transactions in foreign denominations in subsidiaries where the functional currency is the U.S. dollar, are reported inthe consolidated statement of operations.
The chief operating decision maker manages the operations of the Company at a consolidated level. Therefore, allresults of operations are reported as one segment.
Other significant accounting policies are included in the following notes.
Significant Accounting Policies
Premium revenue recognition Note 4Policy acquisition cost Note 5Expected loss to be paid (Insurance, Credit Derivatives and FG VIE contracts) Note 6Loss and loss adjustment expense (Insurance Contracts) Note 7Fair value measurement Note 8Credit derivatives (at Fair Value) Note 9Variable interest entities (at Fair Value) Note 10Investments and Cash Note 11Income Taxes Note 13Earnings per share Note 18Stock based compensation Note 20
2. Business Changes and Developments
Market Conditions
Since the financial crisis began six years ago, there have been significant challenges for the U.S. and globaleconomies, which have affected the Company.
• Historically low interest rates reduced the demand for financial guaranty insurance as well as the average reinvestmentrate in the investment portfolio.
• Rating agency downgrades of the Company’s insurance company subsidiaries reduced the available market forfinancial guaranty insurance.
• U.S. municipal budget deficits, and in rare cases bankruptcies, resulted in claims on our policies and reduced newmarket issuance.
• The weak European economy resulted in claims and lower new issuance compared to pre-financial crisis levels.
• Residential real estate and other structured products resulted in significant losses and the market for new structuredproducts has not returned to pre-financial crisis levels.
0345r4.indd 146 3/19/14 3:28 PM

145
Rating Actions
When a rating agency assigns a public rating to a financial obligation guaranteed by one of AGL’s insurance companysubsidiaries, it generally awards that obligation the same rating it has assigned to the financial strength of the AGL subsidiarythat provides the guaranty. Investors in products insured by AGL’s insurance company subsidiaries frequently rely on ratingspublished by nationally recognized statistical rating organizations (“NRSROs”) because such ratings influence the trading valueof securities and form the basis for many institutions’ investment guidelines as well as individuals’ bond purchase decisions.Therefore, the Company manages its business with the goal of achieving high financial strength ratings. Currently, the financialstrength ratings of the Company's principal insurance company subsidiaries are:
S&P Moody’s Kroll Bond AgencyAGM AA- (stable outlook) A2 (stable outlook) —AGC AA- (stable outlook) A3 (stable outlook) —MAC AA- (stable outlook) — AA+ (stable outlook)Assured Guaranty (Europe) Ltd. AA- (stable outlook) A2 (stable outlook) —AG Re AA- (stable outlook) Baa1 (negative outlook) —
If the financial strength ratings of one (or more) of the Company’s insurance subsidiaries were reduced below currentlevels, the Company expects it could have adverse effects on the impacted subsidiary's future business opportunities as well asthe premiums the impacted subsidiary could charge for its insurance policies and consequently, a further downgrade could harmthe Company’s new business production and results of operations in a material respect. However, the methodologies andmodels used by NRSROs differ, presenting conflicting goals that may make it inefficient or impractical to reach the highestrating level. The methodologies and models are not fully transparent, contain subjective elements and data (such asassumptions about future market demand for the Company’s products) and change frequently. Ratings reflect only the views ofthe respective NRSROs and are subject to continuous review and revision or withdrawal at any time.
In the last several years, Standard & Poor’s Ratings Services (“S&P”) and Moody’s Investors Service, Inc.(“Moody’s”) have downgraded the financial strength ratings of the Company's insurance subsidiaries that they rated at the timeof such downgrades. The latest downgrade took place on January 17, 2013, when Moody’s downgraded the financial strengthratings of the Company's insurance subsidiaries. In the same rating action, Moody's also downgraded the senior unsecured debtratings of AGUS and AGMH to Baa2 from A3. On February 3, 2014, Moody's affirmed its ratings on the Company and thesubsidiaries it rates, but revised the outlook on AG Re to negative. While the outlook for the ratings from S&P and Moody's isnow stable for all the ratings of the Company and its rated subsidiaries except AG Re, there can be no assurance that S&P andMoody's will not take further action on the Company’s ratings or that Kroll will not take action on MAC's ratings. For adiscussion of the effect of rating actions on the Company, see the following:
• Note 6, Expected Loss to be Paid• Note 9, Financial Guaranty Contracts Accounted for as Credit Derivatives• Note 14, Reinsurance and Other Monoline Exposures• Note 17, Long-Term Debt and Credit Facilities (regarding the impact on the Company's insured leveraged lease
transactions)
Business Developments
• Representation and Warranty Settlements: There have been several settlements of representation and warrantyclaims over the past three years. See Note 6, Expected Loss to be Paid.
• Repurchase of Common Shares: The Company has repurchased 12,512,759 common shares in 2013, 2,066,759 in2012, and 2,000,000 in 2011. See Note 19, Shareholders' Equity.
• Issuance of Common Shares: On June 1, 2012, AGL issued common shares to holders of each Equity Unit, for anaggregate of 13,428,770 common shares. See Note 17, Long-Term Debt and Credit Facilities.
• Reinsurance: The Company has entered into several agreements with reinsurers, including assumption and re-assumption agreements and an excess of loss reinsurance facility. See Note 14, Reinsurance and Other MonolineExposures.
0345r4.indd 147 3/19/14 3:28 PM

146
3. Outstanding Exposure
The Company’s financial guaranty contracts are written in either insurance or credit derivative form, but collectivelyare considered financial guaranty contracts. The Company seeks to limit its exposure to losses by underwriting obligations thatare investment grade at inception, diversifying its insured portfolio and maintaining rigorous subordination or collateralizationrequirements on structured finance obligations. The Company also has utilized reinsurance by ceding business to third-partyreinsurers. The Company provides financial guaranties with respect to debt obligations of special purpose entities, includingvariable interest entities ("VIEs"). Some of these VIEs are consolidated as described in Note 10, Consolidation of VariableInterest Entities. The outstanding par and Debt Service amounts presented below include outstanding exposures on VIEswhether or not they are consolidated.
The Company has issued financial guaranty insurance policies on public finance obligations and structured financeobligations. Public finance obligations insured by the Company consist primarily of general obligation bonds supported by thetaxing powers of U.S. state or municipal governmental authorities, as well as tax-supported bonds, revenue bonds and otherobligations supported by covenants from state or municipal governmental authorities or other municipal obligors to impose andcollect fees and charges for public services or specific infrastructure projects. The Company also includes within public financeobligations those obligations backed by the cash flow from leases or other revenues from projects serving substantial publicpurposes, including utilities, toll roads, health care facilities and government office buildings. Structured finance obligationsinsured by the Company are generally issued by special purpose entities and backed by pools of assets having an ascertainablecash flow or market value or other specialized financial obligations.
Significant Risk Management Activities
The Portfolio Risk Management Committee, which includes members of senior management and senior credit andsurveillance officers, sets specific risk policies and limits and is responsible for enterprise risk management, establishing theCompany's risk appetite, credit underwriting of new business, surveillance and work-out.
Surveillance personnel are responsible for monitoring and reporting on all transactions in the insured portfolio. Theprimary objective of the surveillance process is to monitor trends and changes in transaction credit quality, detect anydeterioration in credit quality, and recommend to management such remedial actions as may be necessary or appropriate. Alltransactions in the insured portfolio are assigned internal credit ratings, and surveillance personnel are responsible forrecommending adjustments to those ratings to reflect changes in transaction credit quality.
Work-out personnel are responsible for managing work-out and loss mitigation situations, working with surveillanceand legal personnel (as well as outside vendors) as appropriate. They develop strategies for the Company to enforce itscontractual rights and remedies and to mitigate its losses, engage in negotiation discussions with transaction participants and,when necessary, manage (along with legal personnel) the Company's litigation proceedings.
During the third quarter of 2013, the Company changed the manner in which it presents par outstanding and DebtService in two ways. First, the Company had included securities purchased for loss mitigation purposes both in its investedassets portfolio and its financial guaranty insured portfolio. Beginning with the third quarter of 2013, the Company excludedsuch loss mitigation securities from its disclosure about its financial guaranty insured portfolio (unless otherwise indicated)because it manages such securities as investments and not insurance exposure. Second, the Company refined its approach to itsinternal credit ratings and surveillance categories. Please refer to "Refinement of Approach to Internal Credit Ratings andSurveillance Categories" below for additional information.
Surveillance Categories
The Company segregates its insured portfolio into investment grade and below-investment-grade ("BIG") surveillancecategories to facilitate the appropriate allocation of resources to monitoring and loss mitigation efforts and to aid in establishingthe appropriate cycle for periodic review for each exposure. BIG exposures include all exposures with internal credit ratingsbelow BBB-. The Company’s internal credit ratings are based on internal assessments of the likelihood of default and lossseverity in the event of default. Internal credit ratings are expressed on a ratings scale similar to that used by the rating agenciesand are generally reflective of an approach similar to that employed by the rating agencies, except that, beginning third quarter,the Company's internal credit ratings focus on future performance, rather than lifetime performance. See "Refinement ofApproach to Internal Credit Ratings and Surveillance Categories" below.
0345r4.indd 148 3/19/14 3:28 PM

147
The Company monitors its investment grade credits to determine whether any new credits need to be internallydowngraded to BIG. The Company refreshes its internal credit ratings on individual credits in quarterly, semi-annual or annualcycles based on the Company’s view of the credit’s quality, loss potential, volatility and sector. Ratings on credits in sectorsidentified as under the most stress or with the most potential volatility are reviewed every quarter. The Company’s insuredcredit ratings on assumed credits are based on the Company’s reviews of low-rated credits or credits in volatile sectors, unlesssuch information is not available, in which case, the ceding company’s credit rating of the transactions are used. The Companymodels the performance of many of its structured finance transactions as part of its periodic internal credit rating review ofthem. The Company models most assumed residential mortgage-backed security ("RMBS") credits with par above $1 million,as well as certain RMBS credits below that amount.
Credits identified as BIG are subjected to further review to determine the probability of a loss (see Note 6, ExpectedLoss to be Paid). Surveillance personnel then assign each BIG transaction to the appropriate BIG surveillance category basedupon whether a future loss is expected and whether a claim has been paid. The Company expects “future losses” on atransaction when the Company believes there is at least a 50% chance that, on a present value basis, it will pay more claimsover the future of that transaction than it will have reimbursed. For surveillance purposes, the Company calculates present valueusing a constant discount rate of 5%. (A risk-free rate is used for calculating the expected loss for financial statement purposes.)
More extensive monitoring and intervention is employed for all BIG surveillance categories, with internal creditratings reviewed quarterly. In 2013, the Company refined the definitions of its BIG surveillance categories to be consistent withits new approach to assigning internal credit ratings. See "Refinement of Approach to Internal Credit Ratings and SurveillanceCategories". The three BIG categories are:
• BIG Category 1: Below-investment-grade transactions showing sufficient deterioration to make future lossespossible, but for which none are currently expected.
• BIG Category 2: Below-investment-grade transactions for which future losses are expected but for which noclaims (other than liquidity claims which is a claim that the Company expects to be reimbursed within one year)have yet been paid.
• BIG Category 3: Below-investment-grade transactions for which future losses are expected and on which claims(other than liquidity claims) have been paid.
Refinement of Approach to Internal Credit Ratings and Surveillance Categories
Typically, when an issuer of a debt security has defaulted on a payment and has not made up that missed payment, thedebt security is considered by the rating agencies to be below-investment-grade regardless of its current credit condition.Similarly, the Company had previously considered those securities on which it has made an insurance claim payment that hadnot been reimbursed to be BIG regardless of their current credit condition.
Structured finance transactions often include mechanisms for reimbursing the Company for its insurance claimpayments from assets underlying the transactions to the extent permitted by asset performance. With improvements beginningto occur in the performance of the assets underlying some of the structured finance securities the Company has insured, theCompany is receiving reimbursements on some transactions on which it had paid claims in the past. As a result of theseimprovements, it now projects receiving reimbursements (rather than making claims) in the future on some of thosetransactions. Under the old approach, a transaction with a projected lifetime loss, no matter how strong on a prospective basis,was required to be rated BIG. During the third quarter of 2013, the Company revised its approach to internal credit ratings.Under its revised approach, a transaction may be rated investment grade if it (a) has turned generally cash-flow positive and (b)is projected to have net future reimbursements with sufficient cushion to warrant an investment grade rating, even if it isprojected to have ending lifetime unreimbursed insurance claim payments. The new approach resulted in the upgrade toinvestment grade of one RMBS transaction with a net par of $25 million at December 31, 2012.
The Company also applied its change in approach to internal credit ratings to the Surveillance BIG Categorydefinitions. Previously the BIG Category definitions were based in large part on whether lifetime losses were projected. Underthe new approach, the BIG Category definitions are based on whether future losses are projected. In addition to the upgrade outof BIG described above, the change in approach resulted in the migration of a number of risks within BIG Categories.
0345r4.indd 149 3/19/14 3:28 PM
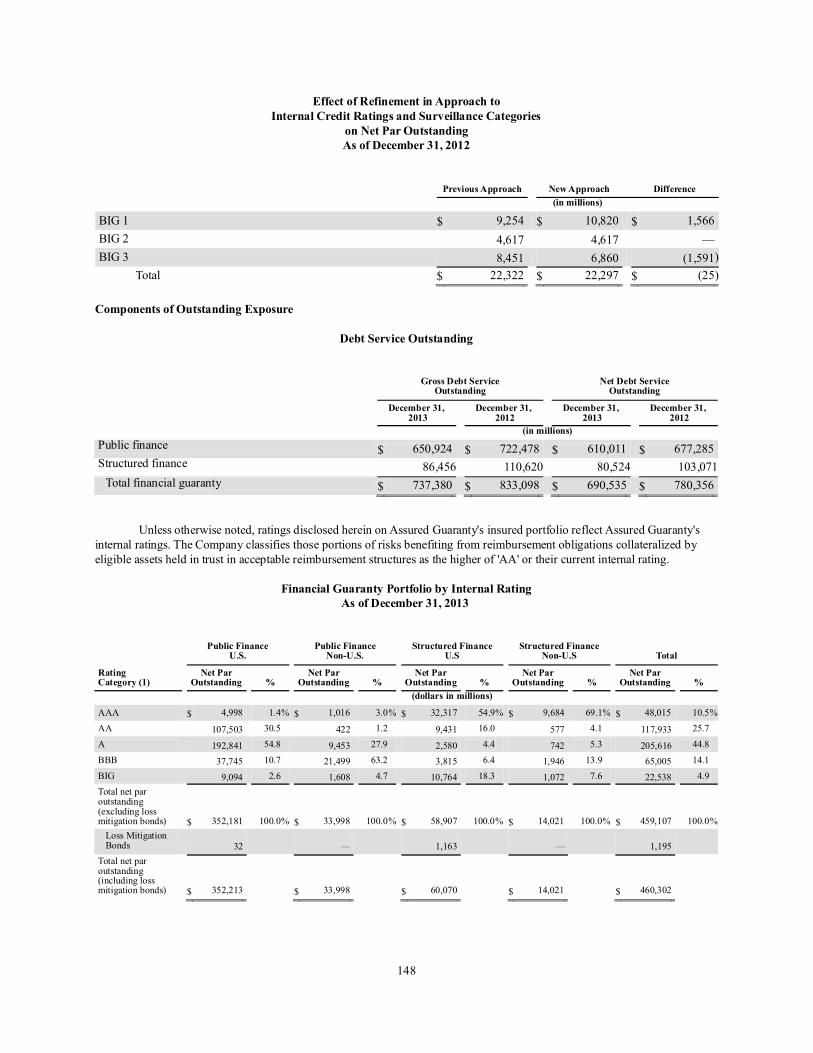
148
Effect of Refinement in Approach toInternal Credit Ratings and Surveillance Categories
on Net Par OutstandingAs of December 31, 2012
Previous Approach New Approach Difference(in millions)
BIG 1 $ 9,254 $ 10,820 $ 1,566BIG 2 4,617 4,617 —BIG 3 8,451 6,860 (1,591)
Total $ 22,322 $ 22,297 $ (25)
Components of Outstanding Exposure
Debt Service Outstanding
Gross Debt ServiceOutstanding
Net Debt ServiceOutstanding
December 31, 2013
December 31, 2012
December 31, 2013
December 31, 2012
(in millions)Public finance $ 650,924 $ 722,478 $ 610,011 $ 677,285Structured finance 86,456 110,620 80,524 103,071
Total financial guaranty $ 737,380 $ 833,098 $ 690,535 $ 780,356
Unless otherwise noted, ratings disclosed herein on Assured Guaranty's insured portfolio reflect Assured Guaranty'sinternal ratings. The Company classifies those portions of risks benefiting from reimbursement obligations collateralized byeligible assets held in trust in acceptable reimbursement structures as the higher of 'AA' or their current internal rating.
Financial Guaranty Portfolio by Internal RatingAs of December 31, 2013
Public FinanceU.S.
Public FinanceNon-U.S.
Structured FinanceU.S
Structured FinanceNon-U.S Total
RatingCategory (1)
Net ParOutstanding %
Net ParOutstanding %
Net ParOutstanding %
Net ParOutstanding %
Net ParOutstanding %
(dollars in millions)
AAA $ 4,998 1.4% $ 1,016 3.0% $ 32,317 54.9% $ 9,684 69.1% $ 48,015 10.5%AA 107,503 30.5 422 1.2 9,431 16.0 577 4.1 117,933 25.7
A 192,841 54.8 9,453 27.9 2,580 4.4 742 5.3 205,616 44.8
BBB 37,745 10.7 21,499 63.2 3,815 6.4 1,946 13.9 65,005 14.1
BIG 9,094 2.6 1,608 4.7 10,764 18.3 1,072 7.6 22,538 4.9Total net paroutstanding(excluding lossmitigation bonds) $ 352,181 100.0% $ 33,998 100.0% $ 58,907 100.0% $ 14,021 100.0% $ 459,107 100.0%
Loss MitigationBonds 32 — 1,163 — 1,195
Total net paroutstanding(including lossmitigation bonds) $ 352,213 $ 33,998 $ 60,070 $ 14,021 $ 460,302
0345r4.indd 150 3/19/14 3:28 PM

149
Financial Guaranty Portfolio by Internal RatingAs of December 31, 2012
Public FinanceU.S.
Public FinanceNon-U.S.
Structured FinanceU.S
Structured FinanceNon-U.S Total
RatingCategory (1)
Net ParOutstanding %
Net ParOutstanding %
Net ParOutstanding %
Net ParOutstanding %
Net ParOutstanding %
(dollars in millions)
AAA $ 4,502 1.2% $ 1,706 4.5% $ 42,187 56.6% $ 13,169 70.2% $ 61,564 11.9%
AA 124,525 32.1 875 2.3 9,543 12.8 722 3.9 135,665 26.1A 210,124 54.1 9,781 26.1 4,670 6.3 1,409 7.5 225,984 43.6
BBB 44,213 11.4 22,885 61.0 3,737 5.0 2,427 12.9 73,262 14.1BIG 4,565 1.2 2,293 6.1 14,398 19.3 1,041 5.5 22,297 4.3
Total net paroutstanding(excluding lossmitigation bonds) $ 387,929 100.0% $ 37,540 100.0% $ 74,535 100.0% $ 18,768 100.0% $ 518,772 100.0%
Loss MitigationBonds 38 — 1,083 — 1,121
Total net paroutstanding(including lossmitigation bonds) $ 387,967 $ 37,540 $ 75,618 $ 18,768 $ 519,893
____________________(1) In the third quarter of 2013, the Company adjusted its approach to assigning internal ratings. See "Refinement of
Approach to Internal Credit Ratings and Surveillance Categories" above. This approach is reflected in the "FinancialGuaranty Portfolio by Internal Rating" tables as of both December 31, 2013 and December 31, 2012.
0345r4.indd 151 3/19/14 3:28 PM

150
Financial Guaranty Portfolioby Sector
Gross Par Outstanding Ceded Par Outstanding Net Par Outstanding
Sector
As ofDecember 31,
2013
As ofDecember 31,
2012
As ofDecember 31,
2013
As ofDecember 31,
2012
As ofDecember 31,
2013
As ofDecember 31,
2012(dollars in millions)
Public finance:U.S.:
General obligation $ 160,751 $ 175,932 $ 5,474 $ 5,947 $ 155,277 $ 169,985Tax backed 70,552 77,894 3,728 4,145 66,824 73,749Municipal utilities 57,893 63,933 1,569 1,817 56,324 62,116Transportation 32,514 35,624 1,684 1,825 30,830 33,799Healthcare 17,663 19,507 1,531 1,669 16,132 17,838Higher education 14,470 16,244 399 474 14,071 15,770Infrastructure finance 5,014 5,100 900 890 4,114 4,210Housing 3,518 4,792 132 159 3,386 4,633Investor-owned utilities 992 1,070 1 1 991 1,069Other public finance—U.S. 4,249 4,784 17 24 4,232 4,760
Total public finance—U.S. 367,616 404,880 15,435 16,951 352,181 387,929Non-U.S.:
Infrastructure finance 17,373 18,716 2,670 2,904 14,703 15,812Regulated utilities 15,502 16,861 4,297 4,367 11,205 12,494Pooled infrastructure 2,754 3,430 234 230 2,520 3,200Other public finance—non-U.S. 6,645 7,297 1,075 1,263 5,570 6,034
Total public finance—non-U.S. 42,274 46,304 8,276 8,764 33,998 37,540Total public finance 409,890 451,184 23,711 25,715 386,179 425,469Structured finance:U.S.:
Pooled corporate obligations 32,955 44,120 1,630 2,234 31,325 41,886RMBS 14,542 18,114 821 1,079 13,721 17,035Commercial mortgage-backed securities("CMBS") and other commercial real estaterelated exposures 3,990 4,293 38 46 3,952 4,247Insurance securitizations 3,082 2,991 47 48 3,035 2,943Financial product 2,709 3,653 — — 2,709 3,653Consumer receivables 2,257 2,429 59 60 2,198 2,369Commercial receivables 918 1,033 7 8 911 1,025Structured credit 71 249 2 51 69 198Other structured finance—U.S. 2,067 2,307 1,080 1,128 987 1,179
Total structured finance—U.S. 62,591 79,189 3,684 4,654 58,907 74,535Non-U.S.:
Pooled corporate obligations 12,232 16,288 1,174 1,475 11,058 14,813Commercial receivables 1,286 1,489 23 26 1,263 1,463RMBS 1,296 1,586 150 162 1,146 1,424Structured credit 197 669 21 78 176 591CMBS and other commercial real estaterelated exposures — 100 — — — 100Other structured finance—non-U.S. 403 402 25 25 378 377
Total structured finance—non-U.S. 15,414 20,534 1,393 1,766 14,021 18,768Total structured finance 78,005 99,723 5,077 6,420 72,928 93,303Total net par outstanding $ 487,895 $ 550,907 $ 28,788 $ 32,135 $ 459,107 $ 518,772
In addition to the amounts shown in the table above, the Company’s net mortgage guaranty insurance in force wasapproximately $152 million as of December 31, 2013. The net mortgage guaranty insurance in force is assumed excess of lossbusiness and comprises $144 million covering loans originated in Ireland and $8 million covering loans originated in the U.K.
0345r4.indd 152 3/19/14 3:28 PM

151
In accordance with the terms of certain credit derivative contracts, the referenced obligations in such contracts havebeen delivered to the Company, and they therefore are included in the investment portfolio. Such amounts are still included inthe financial guaranty insured portfolio, and totaled $195 million and $220 million in gross par outstanding as ofDecember 31, 2013 and December 31, 2012, respectively.
Actual maturities of insured obligations could differ from contractual maturities because borrowers have the right tocall or prepay certain obligations with or without call or prepayment penalties. The expected maturities of structured financeobligations are, in general, considerably shorter than the contractual maturities for such obligations.
Expected Amortization ofNet Par Outstanding
As of December 31, 2013
Public FinanceStructured
Finance Total(in millions)
0 to 5 years $ 104,223 $ 56,783 $ 161,0065 to 10 years 81,176 7,261 88,43710 to 15 years 74,775 2,965 77,74015 to 20 years 56,734 2,017 58,75120 years and above 69,271 3,902 73,173
Total net par outstanding $ 386,179 $ 72,928 $ 459,107
In addition to amounts shown in the tables above, the Company had outstanding commitments to provide guaranties of$419 million for structured finance and $355 million for public finance obligations at December 31, 2013. The structuredfinance commitments include the unfunded component of pooled corporate and other transactions. Public finance commitmentstypically relate to primary and secondary public finance debt issuances. The expiration dates for the public financecommitments range between January 1, 2014 and February 25, 2017, with $231 million expiring prior to December 31, 2014.The commitments are contingent on the satisfaction of all conditions set forth in them and may expire unused or be canceled atthe counterparty’s request. Therefore, the total commitment amount does not necessarily reflect actual future guaranteedamounts.
0345r4.indd 153 3/19/14 3:28 PM

152
Components of BIG Portfolio
Components of BIG Net Par Outstanding(Insurance and Credit Derivative Form)
As of December 31, 2013
BIG Net Par Outstanding Net ParBIG Net Par as
a % of Total Net ParBIG 1 BIG 2 BIG 3 Total BIG Outstanding Outstanding
(in millions)
First lien U.S. RMBS:Prime first lien $ 52 $ 321 $ 30 $ 403 $ 541 0.1%Alt-A first lien 656 1,137 935 2,728 3,590 0.6Option ARM 71 60 467 598 937 0.1Subprime 297 908 740 1,945 6,130 0.4
Second lien U.S. RMBS:Closed end second lien 8 20 118 146 244 0.0Home equity lines of credit(“HELOCs”) 1,499 20 378 1,897 2,279 0.4
Total U.S. RMBS 2,583 2,466 2,668 7,717 13,721 1.6Trust preferred securities(“TruPS”) 1,587 135 — 1,722 4,970 0.4Other structured finance 1,367 309 721 2,397 54,237 0.5U.S. public finance 8,205 440 449 9,094 352,181 2.0Non-U.S. public finance 1,009 599 — 1,608 33,998 0.4
Total $ 14,751 $ 3,949 $ 3,838 $ 22,538 $ 459,107 4.9%
Components of BIG Net Par Outstanding(Insurance and Credit Derivative Form)
As of December 31, 2012
BIG Net Par Outstanding Net ParBIG Net Par as
a % of Total Net ParBIG 1 BIG 2 BIG 3 Total BIG Outstanding Outstanding
(in millions)
First lien U.S. RMBS:Prime first lien $ 28 $ 436 $ 11 $ 475 $ 641 0.1%Alt-A first lien 753 1,962 739 3,454 4,469 0.7Option ARM 333 392 317 1,042 1,450 0.2Subprime (including net interestmargin securities) 152 988 921 2,061 7,048 0.4
Second lien U.S. RMBS:Closed end second lien 97 76 58 231 348 0.0HELOCs 644 — 1,932 2,576 3,079 0.5
Total U.S. RMBS 2,007 3,854 3,978 9,839 17,035 1.9TruPS 1,920 — 953 2,873 5,694 0.6Other structured finance 1,310 263 1,154 2,727 70,574 0.5U.S. public finance 3,290 500 775 4,565 387,929 0.9Non-U.S. public finance 2,293 — — 2,293 37,540 0.4
Total $ 10,820 $ 4,617 $ 6,860 $ 22,297 $ 518,772 4.3%
0345r4.indd 154 3/19/14 3:28 PM

153
BIG Net Par Outstandingand Number of Risks
As of December 31, 2013
Net Par Outstanding Number of Risks(2)
Description
FinancialGuaranty
Insurance(1)Credit
Derivative Total
FinancialGuaranty
Insurance(1)Credit
Derivative Total(dollars in millions)
BIG:Category 1 $ 12,391 $ 2,360 $ 14,751 185 25 210Category 2 2,323 1,626 3,949 80 21 101Category 3 3,031 807 3,838 119 27 146
Total BIG $ 17,745 $ 4,793 $ 22,538 384 73 457
BIG Net Par Outstandingand Number of Risks
As of December 31, 2012
Net Par Outstanding Number of Risks(2)
Description
FinancialGuaranty
Insurance(1)Credit
Derivative Total
FinancialGuaranty
Insurance(1)Credit
Derivative Total(dollars in millions)
BIG:Category 1 $ 7,929 $ 2,891 $ 10,820 163 33 196Category 2 2,116 2,501 4,617 76 27 103Category 3 5,543 1,317 6,860 131 29 160
Total BIG $ 15,588 $ 6,709 $ 22,297 370 89 459_____________________(1) Includes net par outstanding for FG VIEs.
(2) A risk represents the aggregate of the financial guaranty policies that share the same revenue source for purposes ofmaking Debt Service payments.
0345r4.indd 155 3/19/14 3:28 PM

154
Geographic Distribution of Net Par Outstanding
The Company seeks to maintain a diversified portfolio of insured obligations designed to spread its risk across anumber of geographic areas.
Geographic Distribution ofNet Par Outstanding
As of December 31, 2013
Number of RisksNet Par
Outstanding
Percent of TotalNet Par
Outstanding(dollars in millions)
U.S.:U.S. Public Finance:
California 1,492 $ 52,704 11.5%New York 1,035 28,582 6.2Pennsylvania 1,059 28,475 6.2Texas 1,269 27,249 5.9Illinois 881 24,138 5.3Florida 422 21,773 4.7New Jersey 656 14,462 3.2Michigan 713 14,250 3.1Georgia 204 9,364 2.0Ohio 554 8,763 1.9Other states and U.S. territories 4,517 122,421 26.7
Total U.S. public finance 12,802 352,181 76.7U.S. Structured finance (multiple states) 963 58,907 12.8
Total U.S. 13,765 411,088 89.5Non-U.S.:
United Kingdom 115 21,405 4.7Australia 29 5,598 1.2Canada 10 3,851 0.8France 21 3,614 0.8Italy 10 1,808 0.4Other 100 11,743 2.6
Total non-U.S. 285 48,019 10.5Total 14,050 $ 459,107 100.0%
Direct Economic Exposure to the Selected European Countries
Several European countries continue to experience significant economic, fiscal and/or political strains such that thelikelihood of default on obligations with a nexus to those countries may be higher than the Company anticipated when suchfactors did not exist. The European countries where it believes heightened uncertainties exist are: Hungary, Ireland, Italy,Portugal and Spain (the “Selected European Countries”). The Company is closely monitoring its exposures in SelectedEuropean Countries where it believes heightened uncertainties exist. Published reports have identified countries that may beexperiencing reduced demand for their sovereign debt in the current environment. The Company selected these Europeancountries based on these reports and its view that their credit fundamentals are deteriorating. The Company’s economicexposure to the Selected European Countries (based on par for financial guaranty contracts and notional amount for financialguaranty contracts accounted for as derivatives) is shown in the following table, net of ceded reinsurance.
0345r4.indd 156 3/19/14 3:28 PM

155
Net Direct Economic Exposure to Selected European Countries(1)As of December 31, 2013
Hungary (2) Ireland Italy Portugal (2) Spain (2) Total(in millions)
Sovereign and sub-sovereign exposure:Non-infrastructure public finance $ — $ — $ 1,024 $ 98 $ 275 $ 1,397Infrastructure finance 384 — 18 12 155 569
Sub-total 384 — 1,042 110 430 1,966Non-sovereign exposure:
Regulated utilities — — 234 — — 234RMBS 224 144 315 — — 683
Sub-total 224 144 549 — — 917Total $ 608 $ 144 $ 1,591 $ 110 $ 430 $ 2,883Total BIG $ 608 $ — $ — $ 110 $ 430 $ 1,148 ____________________(1) While the Company’s exposures are shown in U.S. dollars, the obligations the Company insures are in various
currencies, including U.S. dollars, Euros and British pounds sterling. Included in the table above is $144 million ofreinsurance assumed on a 2004 - 2006 pool of Irish residential mortgages that is part of the Company’s remaininglegacy mortgage reinsurance business. One of the residential mortgage-backed securities included in the table aboveincludes residential mortgages in both Italy and Germany, and only the portion of the transaction equal to the portionof the original mortgage pool in Italian mortgages is shown in the table.
(2) See Note 6, Expected Loss to be Paid.
When the Company directly insures an obligation, it assigns the obligation to a geographic location or locations basedon its view of the geographic location of the risk. For direct exposure this can be a relatively straight-forward determination as,for example, a debt issue supported by availability payments for a toll road in a particular country. The Company may alsoassign portions of a risk to more than one geographic location. The Company may also have direct exposures to the SelectedEuropean Countries in business assumed from unaffiliated monoline insurance companies. In the case of assumed business fordirect exposures, the Company depends upon geographic information provided by the primary insurer.
The Company has excluded in the exposure tables above its indirect economic exposure to the Selected EuropeanCountries through policies it provides on (a) pooled corporate and (b) commercial receivables transactions. The Companyconsiders economic exposure to a selected European Country to be indirect when the exposure relates to only a small portion ofan insured transaction that otherwise is not related to a Selected European Country. The Company has reviewed transactionsthrough which it believes it may have indirect exposure to the Selected European Countries that is material to the transactionand calculated total net indirect exposure to Selected European Counties in non-sovereign pooled corporate and non-sovereigncommercial receivables to be $781 million and $86 million, respectively, based on the proportion of the insured par equal to theproportion of obligors identified as being domiciled in a Selected European Country.
The Company no longer guarantees any sovereign bonds of the Selected European Countries. The exposure shown inthe “Non-infrastructure public finance” category is from transactions backed by receivable payments from sub-sovereigns inItaly, Spain and Portugal. Sub-sovereign debt is debt issued by a governmental entity or government backed entity, or supportedby such an entity, that is other than direct sovereign debt of the ultimate governing body of the country. In 2012, the Companypaid claims under its guarantees of €218 million in net exposure to the sovereign debt of Greece, paying off in full its liabilitieswith respect to the Greek sovereign bonds.
Exposure to Puerto Rico
The Company insures general obligation bonds of the Commonwealth of Puerto Rico and various obligations of itsrelated authorities and public corporations aggregating $5.4 billion net par. The Company rates $5.2 billion net par of thatamount BIG.
0345r4.indd 157 3/19/14 3:28 PM

156
The following table shows estimated amortization of the general obligation bonds of Puerto Rico and variousobligations of its related authorities and public corporations insured and rated BIG by the Company. The Company guaranteespayments of interest and principal when those amounts are scheduled to be paid and cannot be required to pay on an acceleratedbasis. The column labeled “Estimated BIG Net Debt Service Amortization” shows the total amount of principal and interest duein the period indicated and represents the maximum net amount the Company would be required to pay on BIG Puerto Ricoexposures in a given period assuming the obligors paid nothing on all of those obligations in that period.
Amortization Schedule of BIG Net Par Outstandingand BIG Net Debt Service Outstanding of Puerto Rico
As of December 31, 2013
Estimated BIG NetPar Amortization
Estimated BIG NetDebt ServiceAmortization
(in millions)
2014 $ 242 $ 5012015 364 6082016 289 5152017 208 4212018 160 3632019-2023 921 1,7802024-2028 979 1,6222029-2033 706 1,141After 2033 1,302 1,596
Total $ 5,171 $ 8,547
Recent announcements and actions by the Governor and his administration indicate officials of the Commonwealth arefocused on measures to help Puerto Rico operate within its financial resources and maintain its access to the capital markets.All Puerto Rico credits insured by the Company are current on their debt service payments, and we expect them to continue tomake their debt service payments. Neither Puerto Rico nor its related authorities and public corporations are eligible debtorsunder Chapter 9 of the U.S. Bankruptcy Code. However, Puerto Rico faces high debt levels, a declining population and aneconomy that has been in recession since 2006. Puerto Rico has been operating with a structural budget deficit in recent years,and its two largest pension funds are significantly underfunded.
In January 2014 the Company downgraded most of its insured Puerto Rico credits to BIG, reflecting the economic andfinancial challenges facing the Commonwealth and due to concerns that the rating agencies would downgrade Puerto Rico andlimit its access to credit. Subsequently, in February 2014, S&P, Moody's and Fitch Ratings downgraded much of the debt ofPuerto Rico and its related authorities and public corporations to BIG, citing various factors including limited liquidity andmarket access risk.
4. Financial Guaranty Insurance Premiums
The portfolio of outstanding exposures discussed in Note 3, Outstanding Exposure, includes financial guarantycontracts that meet the definition of insurance contracts as well as those that meet the definition of a derivative under GAAP.Amounts presented in this note relate only to financial guaranty insurance contracts. See Note 9, Financial Guaranty ContractsAccounted for as Credit Derivatives.
Accounting Policies
Accounting for financial guaranty contracts that meet the scope exception under derivative accounting guidance aresubject to industry specific guidance for financial guaranty insurance. The accounting for contracts that fall under the financialguaranty insurance definition are consistent whether the contract was written on a direct basis, assumed from another financialguarantor under a reinsurance treaty, ceded to another insurer under a reinsurance treaty, or acquired in a business combination.
0345r4.indd 158 3/19/14 3:28 PM

157
Unearned premium reserve represents deferred premium revenue, net of paid claims that have not yet been expensed(“contra-paid”). The following discussion relates to the deferred premium revenue component of the unearned premiumreserve, while the contra-paid is discussed in Note 7, Financial Guaranty Insurance Losses.
The amount of deferred premium revenue at contract inception is determined as follows:
• For premiums received upfront on financial guaranty insurance contracts that were originally underwritten by theCompany, deferred premium revenue is equal to the amount of cash received. Upfront premiums typically relateto public finance transactions.
• For premiums received in installments on financial guaranty insurance contracts that were originally underwrittenby the Company, deferred premium revenue is the present value of either (1) contractual premiums due or (2) incases where the underlying collateral is comprised of homogeneous pools of assets, the expected premiums to becollected over the life of the contract. To be considered a homogeneous pool of assets, prepayments must becontractually prepayable, the amount of prepayments must be probable, and the timing and amount ofprepayments must be reasonably estimable. When the Company adjusts prepayment assumptions or expectedpremium collections, an adjustment is recorded to the deferred premium revenue, with a correspondingadjustment to the premium receivable, and prospective changes are recognized in premium revenues. Premiumsreceivable are discounted at the risk-free rate at inception and such discount rate is updated only when changes toprepayment assumptions are made that change the expected date of final maturity. Installment premiums typicallyrelate to structured finance transactions, where the insurance premium rate is determined at the inception of thecontract but the insured par is subject to prepayment throughout the life of the transaction.
• For financial guaranty insurance contracts acquired in a business combination, deferred premium revenue is equalto the fair value of the insurance contract at the date of acquisition based on what a hypothetical similarly ratedfinancial guaranty insurer would have charged for the contract at that date and not the actual cash flows under theinsurance contract. The amount of deferred premium revenue may differ significantly from cash collections dueprimarily to fair value adjustments recorded in connection with a business combination.
The Company recognizes deferred premium revenue as earned premium over the contractual period or expectedperiod of the contract in proportion to the amount of insurance protection provided. As premium revenue is recognized, acorresponding decrease to the deferred premium revenue is recorded. The amount of insurance protection provided is a functionof the insured principal amount outstanding. Accordingly, the proportionate share of premium revenue recognized in a givenreporting period is a constant rate calculated based on the relationship between the insured principal amounts outstanding in thereporting period compared with the sum of each of the insured principal amounts outstanding for all periods. When an insuredfinancial obligation is retired before its maturity, the financial guaranty insurance contract is extinguished. Any nonrefundabledeferred premium revenue related to that contract is accelerated and recognized as premium revenue. When a premiumreceivable balance is deemed uncollectible, it is written off to bad debt expense.
For reinsurance assumed contracts, earned premiums reported in the Company's consolidated statements of operationsare calculated based upon data received from ceding companies, however, some ceding companies report premium databetween 30 and 90 days after the end of the reporting period. The Company estimates earned premiums for the lag period.Differences between such estimates and actual amounts are recorded in the period in which the actual amounts are determined.When installment premiums are related to reinsurance assumed contracts, the Company assesses the credit quality and liquidityof the ceding companies and the impact of any potential regulatory constraints to determine the collectability of such amounts.
0345r4.indd 159 3/19/14 3:28 PM

158
Deferred premium revenue ceded to reinsurers (ceded unearned premium reserve) is recorded as an asset. Direct,assumed and ceded earned premium revenue are presented together as net earned premiums in the statement of operations. Netearned premiums comprise the following:
Net Earned Premiums
Year Ended December 31,
2013 2012 2011(in millions)
Scheduled net earned premiums $ 470 $ 581 $ 765Acceleration of net earned premiums 263 249 125Accretion of discount on net premiums receivable 17 22 28 Financial guaranty insurance net earned premiums 750 852 918Other 2 1 2 Net earned premiums(1) $ 752 $ 853 $ 920
___________________(1) Excludes $60 million, $153 million and $75 million for the year ended December 31, 2013, 2012 and 2011,
respectively, related to consolidated FG VIEs.
Components ofUnearned Premium Reserve
As of December 31, 2013 As of December 31, 2012Gross Ceded Net(1) Gross Ceded Net(1)
(in millions)Deferred premium revenue: Financial guaranty insurance $ 4,647 $ 470 $ 4,177 $ 5,349 $ 586 $ 4,763 Other 5 — 5 7 — 7Deferred premium revenue $ 4,652 $ 470 $ 4,182 $ 5,356 $ 586 $ 4,770Contra-paid (57) (18) (39) (149) (25) (124)
Unearned premium reserve $ 4,595 $ 452 $ 4,143 $ 5,207 $ 561 $ 4,646 ____________________(1) Excludes $187 million and $262 million deferred premium revenue and $55 million and $98 million contra-paid
related to FG VIEs as of December 31, 2013 and December 31, 2012, respectively.
0345r4.indd 160 3/19/14 3:28 PM

159
Gross Premium Receivable,Net of Commissions on Assumed Business
Roll Forward
Year Ended December 31,
2013 2012 2011(in millions)
Beginning of period, December 31 $ 1,005 $ 1,003 $ 1,168Gross premium written, net of commissions on assumed business 145 211 245Gross premiums received, net of commissions on assumed business (259) (294) (318)Adjustments:
Changes in the expected term (28) 44 (104)Accretion of discount, net of commissions on assumed business 20 36 32Foreign exchange translation (1) 13 (5)Consolidation of FG VIEs — (5) (10)Other adjustments (6) (3) (5)
End of period, December 31 (1) $ 876 $ 1,005 $ 1,003____________________(1) Excludes $21 million, $29 million and $28 million as of December 31, 2013 , 2012 and 2011, respectively, related to
consolidated FG VIEs.
Gains or losses due to foreign exchange rate changes relate to installment premium receivables denominated incurrencies other than the U.S. dollar. Approximately 48% and 47% of installment premiums at December 31, 2013 and 2012,respectively, are denominated in currencies other than the U.S. dollar, primarily the Euro and British Pound Sterling.
The timing and cumulative amount of actual collections may differ from expected collections in the tables below dueto factors such as foreign exchange rate fluctuations, counterparty collectability issues, accelerations, commutations andchanges in expected lives.
Expected Collections ofGross Premiums Receivable,
Net of Commissions on Assumed Business(Undiscounted)
As of December 31, 2013(in millions)
2014 (January 1 – March 31) $ 472014 (April 1 – June 30) 332014 (July 1 – September 30) 232014 (October 1 – December 31) 252015 912016 852017 782018 702019-2023 2792024-2028 1732029-2033 121After 2033 129
Total(1) $ 1,154 ____________________(1) Excludes expected cash collections on FG VIEs of $27 million.
0345r4.indd 161 3/19/14 3:28 PM

160
Scheduled Net Earned Premiums
As of December 31, 2013(in millions)
2014 (January 1 – March 31) $ 1082014 (April 1 – June 30) 1072014 (July 1 – September 30) 1052014 (October 1 – December 31) 102
Subtotal 2014 4222015 3722016 3282017 2942018 2692019-2023 1,0492024-2028 6682029-2033 405After 2033 370
Total present value basis(1) 4,177Discount 240
Total future value $ 4,417 ____________________(1) Excludes scheduled net earned premiums on consolidated FG VIEs of $187 million.
Selected Information forPolicies Paid in Installments
As ofDecember 31, 2013
As ofDecember 31, 2012
(dollars in millions)
Premiums receivable, net of ceding commission payable $ 876 $ 1,005Gross deferred premium revenue 1,576 1,908Weighted-average risk-free rate used to discount premiums 3.4% 3.5%Weighted-average period of premiums receivable (in years) 9.4 9.6
5. Financial Guaranty Insurance Acquisition Costs
Accounting Policy
Policy acquisition costs that are directly related and essential to successful insurance contract acquisition are deferredfor contracts accounted for as insurance. Amortization of deferred policy acquisition costs includes the accretion of discount onceding commission income and expense. Acquisition costs associated with derivative contracts are not deferred.
Direct costs related to the acquisition of new and renewal contracts that result directly from and are essential to thecontract transaction are capitalized. These costs include expenses such as ceding commissions and the cost of underwritingpersonnel. Ceding commission expense on assumed reinsurance contracts and ceding commission income on ceded reinsurancecontracts that are associated with premiums received in installments are calculated at their contractually defined rates andincluded in deferred acquisition costs ("DAC"), with a corresponding offset to net premiums receivable or reinsurance balancespayable. Management uses its judgment in determining the type and amount of costs to be deferred. The Company conducts anannual study to determine which operating costs qualify for deferral. Costs incurred by the insurer for soliciting potentialcustomers, market research, training, administration, unsuccessful acquisition efforts, and product development as well as all
0345r4.indd 162 3/19/14 3:28 PM

161
overhead type costs are charged to expense as incurred. DAC are amortized in proportion to net earned premiums. When aninsured obligation is retired early, the remaining related DAC is expensed at that time.
Expected losses, which include loss adjustment expenses (“LAE”), investment income, and the remaining costs ofservicing the insured or reinsured business, are considered in determining the recoverability of DAC.
Rollforward ofDeferred Acquisition Costs
Year Ended December 31,2013 2012 2011
(in millions)
Beginning of period $ 116 $ 132 $ 146Costs deferred during the period:
Commissions on assumed and ceded business 9 (13) (13)Premium taxes 4 4 7Compensation and other acquisition costs 8 10 9
Total 21 1 3Costs amortized during the period (13) (17) (17)Foreign exchange translation 0 0 0End of period $ 124 $ 116 $ 132
6. Expected Loss to be Paid
Accounting Policy
The insured portfolio includes policies accounted for under three separate accounting models depending on thecharacteristics of the contract and the Company's control rights. The Company has paid and expects to pay future losses onpolicies which fall under each of the three accounting models. The following provides a summarized description of the threeaccounting models, with references to additional information provided throughout this report. The three models are insurance,derivative and VIE consolidation.
In order to effectively evaluate and manage the economics and liquidity of the entire insured portfolio, managementcompiles and analyzes loss information for all policies on a consistent basis. The Company monitors and assigns ratings andcalculates expected losses in the same manner for all its exposures regardless of form or differing accounting models.
The discussion of expected loss to be paid within this note encompasses all policies in the insured portfolio. Netexpected loss to be paid in the tables below consists of the present value of future: expected claim and LAE payments,expected recoveries of excess spread in the transaction structures, cessions to reinsurers, and expected recoveries for breachesof representations and warranties ("R&W") and other loss mitigation strategies.
Accounting Models:
The following is a summary of each of the accounting models prescribed by GAAP with a reference to the notes thatdescribe the accounting policies and required disclosures. This note provides information regarding expected claim paymentsto be made under all insured contracts.
Insurance Accounting
For contracts accounted for as financial guaranty insurance, loss and LAE reserve is recorded only to the extent andfor the amount that expected losses to be paid exceed unearned premium reserve. As a result, the Company has expected lossto be paid that have not yet been expensed. Such amounts will be expensed in future periods as deferred premium revenueamortizes into income. Expected loss to be paid is important from a liquidity perspective in that it represents the present valueof amounts that the Company expects to pay or recover in future periods. Expected loss to be expensed is important because it
0345r4.indd 163 3/19/14 3:28 PM

162
presents the Company's projection of incurred losses that will be recognized in future periods (excluding accretion ofdiscount). See Note 7, Financial Guaranty Insurance Losses.
Derivative Accounting, at Fair Value
For contracts that do not meet the financial guaranty scope exception in the derivative accounting guidance(primarily due to the fact that the insured is not required to be exposed to the insured risk throughout the life of the contract),the Company records such credit derivative contracts at fair value on the consolidated balance sheet with changes in fair valuerecorded in the consolidated statement of operations. Expected loss to be paid is an important measure used by management toanalyze the net economic loss on credit derivatives. The fair value recorded on the balance sheet represents an exit price in ahypothetical market because the Company does not trade its credit derivative contracts. The fair value is determined usingsignificant Level 3 inputs in an internally developed model while the expected loss to be paid (which represents the netpresent value of expected cash outflows) uses methodologies and assumptions consistent with financial guaranty insuranceexpected losses to be paid. See Note 8, Fair Value Measurement and Note 9, Financial Guaranty Contracts Accounted for asCredit Derivatives.
VIE Consolidation, at Fair Value
For financial guaranty insurance contracts issued on the debt of variable interest entities over which the Company isdeemed to be the primary beneficiary due to its control rights, as defined in accounting literature, the Company consolidatesthe FG VIE. The Company carries the assets and liabilities of the FG VIEs at fair value under the fair value option election.Management assesses the losses on the insured debt of the consolidated FG VIEs in the same manner as other financialguaranty insurance and credit derivative contracts. Expected loss to be paid for FG VIEs pursuant to AGC's and AGM'sfinancial guaranty insurance policies is calculated in a manner consistent with the Company's other financial guarantyinsurance contracts. See Note 10, Consolidation of Variable Interest Entities.
Expected Loss to be Paid
The expected loss to be paid is equal to the present value of expected future cash outflows for claim and LAEpayments, net of inflows for expected salvage and subrogation (i.e. excess spread on the underlying collateral, and estimatedand contractual recoveries for breaches of representations and warranties), using current risk-free rates. When the Companybecomes entitled to the cash flow from the underlying collateral of an insured credit under salvage and subrogation rights as aresult of a claim payment or estimated future claim payment, it reduces the expected loss to be paid on the contract. Netexpected loss to be paid is defined as expected loss to be paid, net of amounts ceded to reinsurers.
The current risk-free rate is based on the remaining period of the contract used in the premium revenue recognitioncalculation (i.e., the contractual or expected period, as applicable). The Company updates the discount rate each quarter andrecords the effect of such changes in economic loss development. Expected cash outflows and inflows are probabilityweighted cash flows that reflect the likelihood of all possible outcomes. The Company estimates the expected cash outflowsand inflows using management's assumptions about the likelihood of all possible outcomes based on all information availableto it. Those assumptions consider the relevant facts and circumstances and are consistent with the information tracked andmonitored through the Company's risk-management activities.
Economic Loss Development
Economic loss development represents the change in net expected loss to be paid attributable to the effects ofchanges in assumptions based on observed market trends, changes in discount rates, accretion of discount and the economiceffects of loss mitigation efforts.
Expected loss to be paid and economic loss development include the effects of loss mitigation strategies such asnegotiated and estimated recoveries for breaches of representations and warranties, and purchases of insured debt obligations.Additionally, in certain cases, issuers of insured obligations elected, or the Company and an issuer mutually agreed as part of anegotiation, to deliver the underlying collateral or insured obligation to the Company.
In circumstances where the Company has acquired its own insured obligations that have expected losses, either aspart of loss mitigation strategy or via delivery of underlying collateral, expected loss to be paid is reduced by the proportionateshare of the insured obligation that is held in the investment portfolio. The difference between the purchase price of theobligation and the fair value excluding the value of the Company's insurance, is treated as a paid loss for both purchasedbonds and delivered collateral or insured obligations. Assets that are purchased or put to the Company are recorded in the
0345r4.indd 164 3/19/14 3:28 PM

163
investment portfolio, at fair value, excluding the value of the Company's insurance. See Note 11, Investments and Cash andNote 8, Fair Value Measurement.
Loss Estimation Process
The Company’s loss reserve committees estimate expected loss to be paid for all contracts. Surveillance personnelpresent analyses related to potential losses to the Company’s loss reserve committees for consideration in estimating theexpected loss to be paid. Such analyses include the consideration of various scenarios with potential probabilities assigned tothem. Depending upon the nature of the risk, the Company’s view of the potential size of any loss and the informationavailable to the Company, that analysis may be based upon individually developed cash flow models, internal credit ratingassessments and sector-driven loss severity assumptions or judgmental assessments. In the case of its assumed business, theCompany may conduct its own analysis as just described or, depending on the Company’s view of the potential size of anyloss and the information available to the Company, the Company may use loss estimates provided by ceding insurers. TheCompany’s loss reserve committees review and refresh the estimate of expected loss to be paid each quarter. The Company’sestimate of ultimate loss on a policy is subject to significant uncertainty over the life of the insured transaction due to thepotential for significant variability in credit performance as a result of economic, fiscal and financial market variability overthe long duration of most contracts. The determination of expected loss to be paid is an inherently subjective processinvolving numerous estimates, assumptions and judgments by management.
The following table presents a roll forward of the present value of net expected loss to be paid for all contracts,whether accounted for as insurance, credit derivatives or FG VIEs, by sector, after the benefit for net expected recoveries forcontractual breaches of R&W. The Company used weighted average risk-free rates for U.S. dollar denominated obligations,which ranged from 0.0% to 4.44% as of December 31, 2013 and 0.0% to 3.28% as of December 31, 2012.
Net Expected Loss to be PaidBefore Recoveries for Breaches of R&W
Roll Forward by SectorYear Ended December 31, 2013
Net ExpectedLoss to bePaid as of
December 31, 2012(2)Economic LossDevelopment
(Paid)RecoveredLosses(1)
Net ExpectedLoss to be Paid as of
December 31, 2013(2)(in millions)
U.S. RMBS:First lien:
Prime first lien $ 10 $ 16 $ (1) $ 25Alt-A first lien 693 (40) (75) 578Option ARM 460 63 (359) 164Subprime 351 101 (30) 422
Total first lien 1,514 140 (465) 1,189Second lien:
Closed-end second lien 99 (3) (9) 87HELOCs 39 3 (113) (71)
Total second lien 138 0 (122) 16Total U.S. RMBS 1,652 140 (587) 1,205TruPS 27 7 17 51Other structured finance 312 (41) (151) 120U.S. public finance 7 239 18 264Non-U.S public finance 52 17 (12) 57Other insurance (3) (10) 10 (3)
Total $ 2,047 $ 352 $ (705) $ 1,694
0345r4.indd 165 3/19/14 3:28 PM

164
Net Expected Loss to be PaidBefore Recoveries for Breaches of R&W
Roll Forward by SectorYear Ended December 31, 2012
Net ExpectedLoss to bePaid as of
December 31, 2011Economic LossDevelopment
(Paid)RecoveredLosses(1)
ExpectedLoss to be Paid as ofDecember 31, 2012
(in millions)
U.S. RMBS:First lien:
Prime first lien $ 5 $ 5 $ — $ 10Alt-A first lien 702 102 (111) 693Option ARM 935 128 (603) 460Subprime 342 57 (48) 351
Total first lien 1,984 292 (762) 1,514Second lien:
Closed-end second lien 138 (5) (34) 99HELOCs 159 80 (200) 39
Total second lien 297 75 (234) 138Total U.S. RMBS 2,281 367 (996) 1,652TruPS 64 (30) (7) 27Other structured finance 342 2 (32) 312U.S. public finance 16 74 (83) 7Non-U.S public finance 51 221 (220) 52Other insurance 2 (17) 12 (3)
Total $ 2,756 $ 617 $ (1,326) $ 2,047____________________(1) Net of ceded paid losses, whether or not such amounts have been settled with reinsurers. Ceded paid losses are
typically settled 45 days after the end of the reporting period. Such amounts are recorded in reinsurance recoverableon paid losses included in other assets.
(2) Includes expected LAE to be paid for mitigating claim liabilities of $34 million as of December 31, 2013 and $39million as of December 31, 2012. The Company paid $54 million and $47 million in LAE for the years endedDecember 31, 2013 and 2012, respectively.
0345r4.indd 166 3/19/14 3:28 PM

165
Net Expected Recoveries fromBreaches of R&W RollforwardYear Ended December 31, 2013
Future NetR&W Benefit as ofDecember 31, 2012
R&W Developmentand Accretion of
DiscountDuring 2013
R&W RecoveredDuring 2013(1)
Future NetR&W Benefit as of
December 31, 2013(2)(in millions)
U.S. RMBS:First lien:Prime first lien $ 4 $ — $ — $ 4Alt-A first lien 378 41 (145) 274Option ARM 591 161 (579) 173Subprime 109 9 — 118
Total first lien 1,082 211 (724) 569Second lien:
Closed end second lien 138 (9) (31) 98HELOC 150 94 (199) 45
Total second lien 288 85 (230) 143Total $ 1,370 $ 296 $ (954) $ 712
Net Expected Recoveries fromBreaches of R&W RollforwardYear Ended December 31, 2012
Future NetR&W Benefit as ofDecember 31, 2011
R&W Developmentand Accretion of
DiscountDuring 2012
R&W RecoveredDuring 2012(1)
Future NetR&W Benefit as ofDecember 31, 2012
(in millions)
U.S. RMBS:First lien:Prime first lien $ 3 $ 1 $ — $ 4Alt-A first lien 407 40 (69) 378Option ARM 725 89 (223) 591Subprime 101 8 — 109Total first lien 1,236 138 (292) 1,082
Second lien:Closed end second lien 224 5 (91) 138HELOC 190 36 (76) 150Total second lien 414 41 (167) 288
Total $ 1,650 $ 179 $ (459) $ 1,370____________________(1) Gross amounts recovered were $986 million and $485 million for years ended December 31, 2013 and 2012,
respectively.(2) Includes excess spread that the Company will receive as salvage as a result of a settlement agreement with a R&W
provider.
0345r4.indd 167 3/19/14 3:28 PM

166
Net Expected Loss to be PaidAfter Net Expected Recoveries for Breaches of R&W
Roll ForwardYear Ended December 31, 2013
Net ExpectedLoss to bePaid as of
December 31, 2012Economic LossDevelopment
(Paid)RecoveredLosses(1)
Net ExpectedLoss to be Paid as ofDecember 31, 2013
(in millions)
U.S. RMBS:First lien:
Prime first lien $ 6 $ 16 $ (1) $ 21Alt-A first lien 315 (81) 70 304Option ARM (131) (98) 220 (9)Subprime 242 92 (30) 304
Total first lien 432 (71) 259 620Second lien:
Closed-end second lien (39) 6 22 (11)HELOCs (111) (91) 86 (116)
Total second lien (150) (85) 108 (127)Total U.S. RMBS 282 (156) 367 493TruPS 27 7 17 51Other structured finance 312 (41) (151) 120U.S. public finance 7 239 18 264Non-U.S public finance 52 17 (12) 57
Other (3) (10) 10 (3)Total $ 677 $ 56 $ 249 $ 982
0345r4.indd 168 3/19/14 3:28 PM

167
Net Expected Loss to be PaidAfter Net Expected Recoveries for Breaches of R&W
Roll ForwardYear Ended December 31, 2012
Net ExpectedLoss to bePaid as of
December 31, 2011Economic LossDevelopment
(Paid)RecoveredLosses(1)
ExpectedLoss to be Paid as ofDecember 31, 2012
(in millions)
U.S. RMBS:First lien:
Prime first lien $ 2 $ 4 $ — $ 6Alt-A first lien 295 62 (42) 315Option ARM 210 39 (380) (131)Subprime 241 49 (48) 242
Total first lien 748 154 (470) 432Second lien:
Closed-end second lien (86) (10) 57 (39)HELOCs (31) 44 (124) (111)
Total second lien (117) 34 (67) (150)Total U.S. RMBS 631 188 (537) 282TruPS 64 (30) (7) 27Other structured finance 342 2 (32) 312U.S. public finance 16 74 (83) 7Non-U.S public finance 51 221 (220) 52
Other 2 (17) 12 (3)Total $ 1,106 $ 438 $ (867) $ 677
____________________(1) Net of ceded paid losses, whether or not such amounts have been settled with reinsurers. Ceded paid losses are
typically settled 45 days after the end of the reporting period. Such amounts are recorded in reinsurance recoverableon paid losses included in other assets.
0345r4.indd 169 3/19/14 3:28 PM

168
The following tables present the present value of net expected loss to be paid for all contracts by accounting model,by sector and after the benefit for estimated and contractual recoveries for breaches of R&W.
Net Expected Loss to be PaidBy Accounting Model
As of December 31, 2013
FinancialGuarantyInsurance FG VIEs(1)
CreditDerivatives Total
(in millions)US RMBS:
First lien:Prime first lien $ 3 $ — $ 18 $ 21Alt-A first lien 199 31 74 304Option ARM (18) (2) 11 (9)Subprime 149 81 74 304
Total first lien 333 110 177 620Second Lien:
Closed-end second lien (34) 25 (2) (11)HELOCs (41) (75) — (116)
Total second lien (75) (50) (2) (127)Total U.S. RMBS 258 60 175 493TruPS 3 — 48 51Other structured finance 161 — (41) 120U.S. public finance 264 — — 264Non-U.S. public finance 55 — 2 57Subtotal $ 741 $ 60 $ 184 985Other (3)Total $ 982
0345r4.indd 170 3/19/14 3:28 PM

169
Net Expected Loss to be PaidBy Accounting Model
As of December 31, 2012
FinancialGuarantyInsurance FG VIEs(1)
CreditDerivatives Total
(in millions)US RMBS:
First lien:Prime first lien $ 4 $ — $ 2 $ 6Alt-A first lien 164 27 124 315Option ARM (114) (37) 20 (131)Subprime 118 50 74 242
Total first lien 172 40 220 432Second Lien:
Closed-end second lien (60) 31 (10) (39)HELOCs 56 (167) — (111)
Total second lien (4) (136) (10) (150)Total U.S. RMBS 168 (96) 210 282TruPS 1 — 26 27Other structured finance 224 — 88 312U.S. public finance 7 — — 7Non-U.S. public finance 51 — 1 52Subtotal $ 451 $ (96) $ 325 680Other (3)Total $ 677
___________________(1) Refer to Note 10, Consolidation of Variable Interest Entities.
0345r4.indd 171 3/19/14 3:28 PM

170
The following tables present the net economic loss development for all contracts by accounting model, by sector and after thebenefit for estimated and contractual recoveries for breaches of R&W.
Net Economic Loss DevelopmentBy Accounting Model
Year Ended December 31, 2013
FinancialGuarantyInsurance FG VIEs(1)
CreditDerivatives(2) Total
(in millions)US RMBS:
First lien:Prime first lien $ (1) $ — $ 17 $ 16Alt-A first lien (54) 5 (32) (81)Option ARM (62) (36) — (98)Subprime 48 32 12 92
Total first lien (69) 1 (3) (71)Second Lien:
Closed-end second lien 30 (34) 10 6HELOCs (91) (1) 1 (91)
Total second lien (61) (35) 11 (85)Total U.S. RMBS (130) (34) 8 (156)TruPS — — 7 7Other structured finance (36) — (5) (41)U.S. public finance 239 — — 239Non-U.S. public finance 16 — 1 17Subtotal $ 89 $ (34) $ 11 66Other (10)Total $ 56
0345r4.indd 172 3/19/14 3:28 PM

171
Net Economic Loss DevelopmentBy Accounting Model
Year Ended December 31, 2012
FinancialGuarantyInsurance FG VIEs(1)
CreditDerivatives(2) Total
(in millions)US RMBS:
First lien:Prime first lien $ 2 $ — $ 2 $ 4Alt-A first lien 38 (10) 34 62Option ARM 37 (8) 10 39Subprime 31 7 11 49
Total first lien 108 (11) 57 154Second Lien:
Closed-end second lien 13 (23) — (10)HELOCs 37 7 — 44
Total second lien 50 (16) — 34Total U.S. RMBS 158 (27) 57 188TruPS (11) — (19) (30)Other structured finance 15 — (13) 2U.S. public finance 75 — (1) 74Non-U.S. public finance 222 — (1) 221Subtotal $ 459 $ (27) $ 23 455Other (17)Total $ 438
___________________(1) Refer to Note 10, Consolidation of Variable Interest Entities.
(2) Refer to Note 9, Financial Guaranty Contracts Accounted for as Credit Derivatives.
Approach to Projecting Losses in U.S. RMBS
The Company projects losses on its insured U.S. RMBS on a transaction-by-transaction basis by projecting theperformance of the underlying pool of mortgages over time and then applying the structural features (i.e., payment prioritiesand tranching) of the RMBS to the projected performance of the collateral over time. The resulting projected claim paymentsor reimbursements are then discounted using risk-free rates. For transactions where the Company projects it will receiverecoveries from providers of R&W, it projects the amount of recoveries and either establishes a recovery for claims alreadypaid or reduces its projected claim payments accordingly.
The further behind a mortgage borrower falls in making payments, the more likely it is that he or she will default.The rate at which borrowers from a particular delinquency category (number of monthly payments behind) eventually defaultis referred to as the “liquidation rate.” The Company derives its liquidation rate assumptions from observed roll rates, whichare the rates at which loans progress from one delinquency category to the next and eventually to default and liquidation. TheCompany applies liquidation rates to the mortgage loan collateral in each delinquency category and makes certain timingassumptions to project near-term mortgage collateral defaults from loans that are currently delinquent.
Mortgage borrowers that are not more than one payment behind (generally considered performing borrowers) havedemonstrated an ability and willingness to pay throughout the recession and mortgage crisis, and as a result are viewed as lesslikely to default than delinquent borrowers. Performing borrowers that eventually default will also need to progress throughdelinquency categories before any defaults occur. The Company projects how many of the currently performing loans will
0345r4.indd 173 3/19/14 3:28 PM

172
default and when they will default, by first converting the projected near term defaults of delinquent borrowers derived fromliquidation rates into a vector of conditional default rates ("CDR"), then projecting how the conditional default rates willdevelop over time. Loans that are defaulted pursuant to the conditional default rate after the near-term liquidation of currentlydelinquent loans represent defaults of currently performing loans and projected re-performing loans. A conditional default rateis the outstanding principal amount of defaulted loans liquidated in the current month divided by the remaining outstandingamount of the whole pool of loans (or “collateral pool balance”). The collateral pool balance decreases over time as a result ofscheduled principal payments, partial and whole principal prepayments, and defaults.
In order to derive collateral pool losses from the collateral pool defaults it has projected, the Company applies a lossseverity. The loss severity is the amount of loss the transaction experiences on a defaulted loan after the application of netproceeds from the disposal of the underlying property. The Company projects loss severities by sector based on its experienceto date. Further detail regarding the assumptions and variables the Company used to project collateral losses in its U.S. RMBSportfolio may be found below in the sections “U.S. First Lien RMBS Loss Projections: Alt-A First Lien, Option ARM,Subprime and Prime” and “U.S. Second Lien RMBS Loss Projections: HELOCs and Closed-End Second Lien”
The Company is in the process of enforcing claims for breaches of R&W regarding the characteristics of the loansincluded in the collateral pools. The Company calculates a credit from the RMBS issuer for such recoveries where the R&Wwere provided by an entity the Company believes to be financially viable and where the Company already has access orbelieves it will attain access to the underlying mortgage loan files. Where the Company has an agreement with an R&Wprovider (e.g., the Bank of America Agreement, the Deutsche Bank Agreement or the UBS Agreement) or where it is inadvanced discussions on a potential agreement, that credit is based on the agreement or potential agreement. Where theCompany does not have an agreement with the R&W provider but the Company believes the R&W provider to beeconomically viable, the Company estimates what portion of its past and projected future claims it believes will be reimbursedby that provider. Further detail regarding how the Company calculates these credits may be found under “Breaches ofRepresentations and Warranties” below.
The Company projects the overall future cash flow from a collateral pool by adjusting the payment stream from theprincipal and interest contractually due on the underlying mortgages for (a) the collateral losses it projects as described above,(b) assumed voluntary prepayments and (c) servicer advances. The Company then applies an individual model of the structureof the transaction to the projected future cash flow from that transaction’s collateral pool to project the Company’s futureclaims and claim reimbursements for that individual transaction. Finally, the projected claims and reimbursements arediscounted using risk-free rates. As noted above, the Company runs several sets of assumptions regarding mortgage collateralperformance, or scenarios, and probability weights them.
The ultimate performance of the Company’s RMBS transactions remains highly uncertain, may differ from theCompany's projections and may be subject to considerable volatility due to the influence of many factors, including the leveland timing of loan defaults, changes in housing prices, results from the Company’s loss mitigation activities and othervariables. The Company will continue to monitor the performance of its RMBS exposures and will adjust its RMBS lossprojection assumptions and scenarios based on actual performance and management’s view of future performance.
Year-End 2013 Compared to Year-End 2012 U.S. RMBS Loss Projections
The Company's RMBS loss projection methodology assumes that the housing and mortgage markets will continueimproving. Each quarter the Company makes a judgment as to whether to change the assumptions it uses to make RMBS lossprojections based on its observation during the quarter of the performance of its insured transactions (including early stagedelinquencies, late stage delinquencies and, for first liens, loss severity) as well as the residential property market andeconomy in general, and, to the extent it observes changes, it makes a judgment as whether those changes are normalfluctuations or part of a trend. Based on such observations the Company chose to use the same general methodology (with therefinements described below) to project RMBS losses as of December 31, 2013 as it used as of December 31, 2012. TheCompany's use of the same general approach to project RMBS losses as of December 31, 2013 as it used as of December 31,2012 was consistent with its view at December 31, 2013 that the housing and mortgage market recovery was occurring at aslower pace than it anticipated at December 31, 2012.
The Company refined its first lien RMBS loss projection methodology as of December 31, 2013 to model explicitlythe behavior of borrowers with loans that had been modified. The Company has observed that mortgage loan servicers weremodifying more mortgage loans (reducing or forbearing from collecting interest or principal or both due on mortgage loans)to reduce the borrowers’ monthly payments and so improve their payment performance than was the case before the mortgagecrisis. Borrowers who are current based on their new, reduced monthly payments are generally reported as current, but are
0345r4.indd 174 3/19/14 3:28 PM

173
more likely to default than borrowers who are current and whose loans have not been modified. The Company believesmodified loans are most likely to default again during the first year after modification. The Company set its liquidation rateassumptions as of December 31, 2012 based on observed roll rates and with modification activity in mind. As of December31, 2013 the Company made a number of refinements to its first lien RMBS loss projection assumptions to treat loanmodifications explicitly. Specifically, in the base case approach, it:
• established a liquidation rate assumption for loans reported as current but that had been reported as modifiedin the previous 12 months,
• assumed that currently delinquent loans that did not roll to liquidation would behave like modified loans,and so applied the modified loan liquidation rate to them,
• increased from two to three years the period over which it calculates the initial CDR based on assumedliquidations of non-performing loans and modified loans, to account for the longer period modified loanswill take to default,
• increased the period it assumes the transactions will experience the initial loss severity assumption before itimproves and the period during which the transaction will experience low voluntary prepayment rates,
• established an assumption for servicers not to advance loan payments on all delinquent loans
The methodology and revised assumptions the Company uses to project first lien RMBS losses and the scenarios itemploys are described in more detail below under " - U.S. First Lien RMBS Loss Projections: Alt A First Lien, Option ARM,Subprime and Prime". The refinement in assumptions described above resulted in a reduction of the initial CDRs but theapplication of the initial CDRs for a longer period, which generally resulted in a higher amount of loans being liquidated atthe initial CDR under the refined assumptions than under the initial CDR under the previous assumptions. The Companyestimated the impact of all of the refinements to its assumptions described above to be an increase of expected losses ofapproximately $8 million (before adjustments for settlements or loss mitigation purchases) by running on the first lien RMBSportfolio as of December 31, 2013 base case assumptions similar to what it used as of December 31, 2012 and comparingthose results to those results from the refined assumptions.
During 2013 the Company observed improvements in the performance of its second lien RMBS transactions that,when viewed in the context of their performance prior to 2013, suggested those transactions were beginning to respond to theimprovements in the residential property market and economy being widely reported by market observers. Based on suchobservations, in projecting losses for second lien RMBS the Company chose to decrease by two months in its base scenarioand by three months in its optimistic scenario the period it assumed it would take the mortgage market to recover as comparedto December 31, 2012. Also during 2013 the Company observed material improvements in the delinquency measures ofcertain second lien RMBS for which the servicing had been transferred, and made certain adjustments on just thosetransactions to reflect its view that much of this improvement was due to loan modifications and reinstatements made by thenew servicer and that such recently modified and reinstated loans may have a higher likelihood of defaulting again. Themethodology and assumptions the Company uses to project second lien RMBS losses and the scenarios it employs aredescribed in more detail below under " - U.S. Second Lien RMBS Loss Projections: HELOCs and Closed-End Second Lien".
The Company observed some improvement in delinquency trends in most of its RMBS transactions during 2013,with some of that improvement in second liens driven by servicing transfers it effectuated. Such improvement is naturallytransmitted to its projections for each individual RMBS transaction, since the projections are based on the delinquencyperformance of the loans in that individual transaction.
Year-End 2012 Compared to Year-End 2011 U.S. RMBS Loss Projections
Based on the Company’s observation during 2012 of the performance of its insured transactions (including earlystage delinquencies, late stage delinquencies and, for first liens, loss severity) as well as the residential property market andeconomy in general, the Company chose to use essentially the same assumptions and scenarios to project RMBS loss as ofDecember 31, 2012 as it used as of December 31, 2011, except that as compared to December 31, 2011:
• in its most optimistic scenario, it reduced by three months the period it assumed it would take the mortgagemarket to recover; and
0345r4.indd 175 3/19/14 3:28 PM

174
• in its most pessimistic scenario, it increased by three months the period it assumed it would take the mortgagemarket to recover.
The Company's use of essentially the same assumptions and scenarios to project RMBS losses as of December 31,2012 as at December 31, 2011 was consistent with its view at December 31, 2012 that the housing and mortgage marketrecovery was occurring at a slower pace than it anticipated at December 31, 2011. The Company's changes during 2012 to theperiod it would take the mortgage market to recover in its most optimistic scenario and its most pessimistic scenario allowed itto consider a wider range of possibilities for the speed of the recovery. Since the Company's projections for each RMBStransaction are based on the delinquency performance of the loans in that individual RMBS transaction, improvement ordeterioration in that aspect of a transaction's performance impacts the projections for that transaction. The methodology andassumptions the Company uses to project RMBS losses and the scenarios it employs are described in more detail below under" – U.S. First Lien RMBS Loss Projections: Alt A First Lien, Option ARM, Subprime and Prime" and "– U.S. Second LienRMBS Loss Projections: HELOCs and Closed-End Second Lien."
U.S. First Lien RMBS Loss Projections: Alt-A First Lien, Option ARM, Subprime and Prime
The majority of projected losses in first lien RMBS transactions are expected to come from non-performing mortgageloans (those that have been modified in the previous 12 months or are delinquent or in foreclosure or that have beenforeclosed and so the RMBS issuer owns the underlying real estate). Changes in the amount of non-performing loans from theamount projected in the previous period are one of the primary drivers of loss development in this portfolio. In order todetermine the number of defaults resulting from these delinquent and foreclosed loans, the Company applies a liquidation rateassumption to loans in each of various non-performing categories. The liquidation rate is a standard industry measure that isused to estimate the number of loans in a given non-performing category that will default within a specified time period. TheCompany arrived at its liquidation rates based on data purchased from a third party provider and assumptions about howdelays in the foreclosure process and loan modifications may ultimately affect the rate at which loans are liquidated. Asdescribed above under “ - Year-End 2013 Compared to Year-End 2012 U.S. RMBS Loss Projections”, the Company refinedits methodology as of December 31, 2013 to establishing liquidation rates to explicitly consider loans modifications andrevised the period over which it projects these liquidations to occur from two to three years. Based on its review of that data,the Company made the changes described in the following table as of December 31, 2013 and maintained the same liquidationassumptions at December 31, 2012 and December 31, 2011. The following table shows liquidation assumptions for variousnon-performing categories.
0345r4.indd 176 3/19/14 3:28 PM

175
First Lien Liquidation Rates
December 31,2013
December 31,2012
December 31,2011
Current Loans Modified in Previous 12 MonthsAlt A and Prime 35% N/A N/AOption ARM 35 N/A N/ASubprime 35 N/A N/A
30 – 59 Days DelinquentAlt A and Prime 50 35% 35%Option ARM 50 50 50Subprime 45 30 30
60 – 89 Days DelinquentAlt A and Prime 60 55 55Option ARM 65 65 65Subprime 50 45 45
90+ Days DelinquentAlt A and Prime 75 65 65Option ARM 70 75 75Subprime 60 60 60
BankruptcyAlt A and Prime 60 55 55Option ARM 60 70 70Subprime 55 50 50
ForeclosureAlt A and Prime 85 85 85Option ARM 80 85 85Subprime 70 80 80
Real Estate OwnedAll 100 100 100
While the Company uses liquidation rates as described above to project defaults of non-performing loans, it projectsdefaults on presently current loans by applying a CDR trend. The start of that CDR trend is based on the defaults theCompany projects will emerge from currently nonperforming loans. The total amount of expected defaults from the non-performing loans is translated into a constant CDR (i.e., the CDR plateau), which, if applied for each of the next 36 months(up from 24 months as of December 31, 2012), would be sufficient to produce approximately the amount of defaults that werecalculated to emerge from the various delinquency categories. The CDR thus calculated individually on the delinquentcollateral pool for each RMBS is then used as the starting point for the CDR curve used to project defaults of the presentlyperforming loans. The refinement in assumptions described above under “ - Year-End 2013 Compared to Year-End 2012 U.S.RMBS Loss Projections” resulted in a reduction of the initial CDRs but the application of the initial CDRs for a longer periodgenerally resulted in a higher amount of loans being liquidated at the initial CDR under the December 31, 2013 assumptionsthan under the initial CDR under the December 31, 2012 assumptions.
In the base case, after the initial 36-month CDR plateau period, each transaction’s CDR is projected to improve over12 months to an intermediate CDR (calculated as 20% of its CDR plateau); that intermediate CDR is held constant for36 months and then trails off in steps to a final CDR of 5% of the CDR plateau. Under the Company’s methodology, defaultsprojected to occur in the first 36 months represent defaults that can be attributed to loans that are currently delinquent or inforeclosure, while the defaults projected to occur using the projected CDR trend after the first 36 month period representdefaults attributable to borrowers that are currently performing.
Another important driver of loss projections is loss severity, which is the amount of loss the transaction incurs on aloan after the application of net proceeds from the disposal of the underlying property. Loss severities experienced in first lientransactions have reached historic high levels, and the Company is assuming in the base case that these high levels generallywill continue for another 18 months (up from a twelve months as of December 31, 2012), except that in the case of subprimeloans, the Company assumes the unprecedented 90% loss severity rate will continue for another nine months (up from six
0345r4.indd 177 3/19/14 3:28 PM

176
months as of December 31, 2012) then drop to 80% for nine more months (up from six months as of December 31, 2012), ineach case before following the ramp described below. The Company determines its initial loss severity based on actual recentexperience. The Company’s initial loss severity assumptions for December 31, 2013 were the same as it used forDecember 31, 2012 and December 31, 2011. The Company then assumes that loss severities begin returning to levelsconsistent with underwriting assumptions beginning after the initial 18 month period, declining to 40% in the base case over2.5 years (up from two years as of December 31, 2012).
The following table shows the range of key assumptions used in the calculation of expected loss to be paid forindividual transactions for direct vintage 2004 - 2008 first lien U.S. RMBS.
Key Assumptions in Base Case Expected Loss EstimatesFirst Lien RMBS(1)
As ofDecember 31, 2013
As ofDecember 31, 2012
As ofDecember 31, 2011
Alt-A First LienPlateau CDR 2.8% – 18.4% 3.8% – 23.2% 2.8% – 41.3%Intermediate CDR 0.6% – 3.7% 0.8% – 4.6% 0.6% – 8.3%Period until intermediate CDR 48 months 36 months 36 monthsFinal CDR 0.1% – 0.9% 0.2% – 1.2% 0.1% – 2.1%Initial loss severity 65% 65% 65%Initial conditional prepaymentrate ("CPR") 0.0% – 34.2% 0.0% – 39.4% 0.0% – 37.5%Final CPR 15% 15% 15%
Option ARMPlateau CDR 4.9% – 16.8% 7.0% – 26.1% 9.6% – 31.5%Intermediate CDR 1.0% – 3.4% 1.4% – 5.2% 1.9% – 6.3%Period until intermediate CDR 48 months 36 months 36 monthsFinal CDR 0.2% – 0.8% 0.4% – 1.3% 0.5% – 1.6%Initial loss severity 65% 65% 65%Initial CPR 0.4% – 13.1% 0.0% – 10.7% 0.0% – 29.1%Final CPR 15% 15% 15%
SubprimePlateau CDR 5.6% – 16.2% 7.3% – 26.2% 8.3% – 29.9%Intermediate CDR 1.1% – 3.2% 1.5% – 5.2% 1.7% – 6%Period until intermediate CDR 48 months 36 months 36 monthsFinal CDR 0.3% – 0.8% 0.4% – 1.3% 0.4% – 1.5%Initial loss severity 90% 90% 90%Initial CPR 0.0% – 15.7% 0.0% – 17.6% 0.0% – 16.3%Final CPR 15% 15% 15%
____________________(1) Represents variables for most heavily weighted scenario (the “base case”).
The rate at which the principal amount of loans is voluntarily prepaid may impact both the amount of lossesprojected (since that amount is a function of the conditional default rate, the loss severity and the loan balance over time) aswell as the amount of excess spread (the amount by which the interest paid by the borrowers on the underlying loan exceedsthe amount of interest owed on the insured obligations). The assumption for the voluntary CPR follows a similar pattern tothat of the conditional default rate. The current level of voluntary prepayments is assumed to continue for the plateau periodbefore gradually increasing over 12 months to the final CPR, which is assumed to be 15% in the base case. For transactionswhere the initial CPR is higher than the final CPR, the initial CPR is held constant. These assumptions are the same as thosethe Company used for December 31, 2012 and December 31, 2011 except that, as of December 31, 2013 the period of initialCDRs were assumed to last 12 months longer than they were assumed to last as of December 31, 2012 and 2011, so the initialCPR is also held constant 12 months longer as of December 31, 2013 than it was as of December 31, 2012 or 2011.
0345r4.indd 178 3/19/14 3:28 PM

177
In estimating expected losses, the Company modeled and probability weighted sensitivities for first lien transactionsby varying its assumptions of how fast a recovery is expected to occur. One of the variables used to model sensitivities washow quickly the conditional default rate returned to its modeled equilibrium, which was defined as 5% of the initialconditional default rate. The Company also stressed CPR and the speed of recovery of loss severity rates. The Companyprobability weighted a total of five scenarios (including its base case) as of December 31, 2013, using the same number ofscenarios and weightings as it used as of December 31, 2012 and 2011. The Company used a similar approach to establish itspessimistic and optimistic scenarios as of December 31, 2013 as it used as of December 31, 2012 and 2011, increasing anddecreasing the periods of stress from those used in the base case, except that all of the stress periods were longer as ofDecember 31, 2013 than they were as of December 31, 2012 and 2011. In a somewhat more stressful environment than that ofthe base case, where the conditional default rate plateau was extended six months (to be 42 months long) before the samemore gradual conditional default rate recovery and loss severities were assumed to recover over 4.5 rather than 2.5 years (andsubprime loss severities were assumed to recover only to 60%), expected loss to be paid would increase from currentprojections by approximately $41 million for Alt-A first liens, $12 million for Option ARM, $93 million for subprime and $4million for prime transactions. In an even more stressful scenario where loss severities were assumed to rise and then recoverover nine years and the initial ramp-down of the conditional default rate was assumed to occur over 15 months and otherassumptions were the same as the other stress scenario, expected loss to be paid would increase from current projections byapproximately $111 million for Alt-A first liens, $30 million for Option ARM, $136 million for subprime and $12 million forprime transactions. The Company also considered two scenarios where the recovery was faster than in its base case. In ascenario with a somewhat less stressful environment than the base case, where conditional default rate recovery wassomewhat less gradual and the initial subprime loss severity rate was assumed to be 80% for 18 months and was assumed torecover to 40% over 2.5 years, expected loss to be paid would increase from current projections by approximately $1 millionfor Alt-A first lien and would decrease by $11 million for Option ARM, $24 million for subprime and $1 million for primetransactions. In an even less stressful scenario where the conditional default rate plateau was six months shorter (30 months,effectively assuming that liquidation rates would improve) and the conditional default rate recovery was more pronounced,(including an initial ramp-down of the conditional default rate over nine months rather than 12 months), expected loss to bepaid would decrease from current projections by approximately $38 million for Alt-A first lien, $29 million for Option ARM,$77 million for subprime and $4 million for prime transactions.
U.S. Second Lien RMBS Loss Projections: HELOCs and Closed-End Second Lien
The Company believes the primary variable affecting its expected losses in second lien RMBS transactions is theamount and timing of future losses in the collateral pool supporting the transactions. Expected losses are also a function of thestructure of the transaction; the voluntary prepayment rate (typically also referred to as CPR of the collateral); the interest rateenvironment; and assumptions about the draw rate and loss severity. These variables are interrelated, difficult to predict andsubject to considerable volatility. If actual experience differs from the Company’s assumptions, the losses incurred could bematerially different from the estimate. The Company continues to update its evaluation of these exposures as new informationbecomes available.
The following table shows the range of key assumptions for the calculation of expected loss to be paid for individualtransactions for direct vintage 2004 - 2008 second lien U.S. RMBS.
Key Assumptions in Base Case Expected Loss EstimatesSecond Lien RMBS(1)
HELOC key assumptionsAs of
December 31, 2013As of
December 31, 2012As of
December 31, 2011
Plateau CDR 2.3% – 7.7% 3.8% – 15.9% 4.0% – 27.4%Final CDR trended down to 0.4% – 3.2% 0.4% – 3.2% 0.4% – 3.2%Period until final CDR 34 months 36 months 36 monthsInitial CPR 2.7% – 21.5% 2.9% – 15.4% 1.4% – 25.8%Final CPR 10% 10% 10%Loss severity 98% 98% 98%
0345r4.indd 179 3/19/14 3:28 PM

178
Closed-end second lien key assumptionsAs of
December 31, 2013As of
December 31, 2012As of
December 31, 2011
Plateau CDR 7.3% – 15.1% 7.3% – 20.7% 6.9% – 29.5%Final CDR trended down to 3.5% – 9.1% 3.5% – 9.1% 3.5% – 9.1%Period until final CDR 34 months 36 months 36 monthsInitial CPR 3.1% – 12.0% 1.9% – 12.5% 0.9% – 14.7%Final CPR 10% 10% 10%Loss severity 98% 98% 98%
____________________(1) Represents variables for most heavily weighted scenario (the “base case”).
In second lien transactions the projection of near-term defaults from currently delinquent loans is relativelystraightforward because loans in second lien transactions are generally “charged off” (treated as defaulted) by thesecuritization’s servicer once the loan is 180 days past due. Most second lien transactions report the amount of loans in fivemonthly delinquency categories (i.e., 30-59 days past due, 60-89 days past due, 90-119 days past due, 120-149 days past dueand 150-179 days past due). The Company estimates the amount of loans that will default over the next five months bycalculating current representative liquidation rates (the percent of loans in a given delinquency status that are assumed toultimately default) from selected representative transactions and then applying an average of the preceding twelve months’liquidation rates to the amount of loans in the delinquency categories. The amount of loans projected to default in the firstthrough fifth months is expressed as a CDR. The first four months’ CDR is calculated by applying the liquidation rates to thecurrent period past due balances (i.e., the 150-179 day balance is liquidated in the first projected month, the 120-149 daybalance is liquidated in the second projected month, the 90-119 day balance is liquidated in the third projected month and the60-89 day balance is liquidated in the fourth projected month). For the fifth month the CDR is calculated using the average30-59 day past due balances for the prior three months, adjusted as necessary to reflect one time service events. The fifthmonth CDR is then used as the basis for the plateau period that follows the embedded five months of losses. During 2013 theCompany observed material improvements in the delinquency measures of certain second lien RMBS for which the servicinghad been transferred, and determined that much of this improvement was due to loan modifications and reinstatements madeby the new servicer. To reflect the possibility that such recently modified and reinstated loans may have a higher likelihood ofdefaulting again, for such transactions the Company treated as severely delinquent a portion of the loans that are current orless than 150 days delinquent and that it identified as having been recently modified or reinstated. Even with that adjustment,the improvement in delinquency measures for those transactions resulted in a lower initial CDR for those transactions than theinitial CDR calculated as of December 31, 2012.
As of December 31, 2013, for the base case scenario, the CDR (the “plateau CDR”) was held constant for one month.Once the plateau period has ended, the CDR is assumed to gradually trend down in uniform increments to its final long-termsteady state CDR. The long-term steady state CDR is calculated as the constant CDR that would have yielded the amount oflosses originally expected at underwriting. In the base case scenario, the time over which the CDR trends down to its finalCDR is 28 months. Therefore, the total stress period for second lien transactions is 34 months, comprising five months ofdelinquent data, a one month plateau period and 28 months of decrease to the steady state CDR. This is two months shorterthan used for December 31, 2012 and 2011. When a second lien loan defaults, there is generally a very low recovery. Based oncurrent expectations of future performance, the Company assumes that it will only recover 2% of the collateral, the same asDecember 31, 2012 and December 31, 2011.
The rate at which the principal amount of loans is prepaid may impact both the amount of losses projected as well asthe amount of excess spread. In the base case, the current CPR (based on experience of the most recent three quarters) isassumed to continue until the end of the plateau before gradually increasing to the final CPR over the same period the CDRdecreases. For transactions where the initial CPR is higher than the final CPR, the initial CPR is held constant. The final CPRis assumed to be 10% for both HELOC and closed-end second lien transactions. This level is much higher than current ratesfor most transactions, but lower than the historical average, which reflects the Company’s continued uncertainty about theprojected performance of the borrowers in these transactions. This pattern is consistent with how the Company modeled theCPR at December 31, 2012 and December 31, 2011. To the extent that prepayments differ from projected levels it couldmaterially change the Company’s projected excess spread and losses.
The Company uses a number of other variables in its second lien loss projections, including the spread betweenrelevant interest rate indices, the loss severity, and HELOC draw rates (the amount of new advances provided on existingHELOCs expressed as a percentage of current outstanding advances). These variables have been relatively stable over the pastseveral quarters and in the relevant ranges have less impact on the projection results than the variables discussed above.
0345r4.indd 180 3/19/14 3:28 PM

179
In estimating expected losses, the Company modeled and probability weighted three possible CDR curves applicableto the period preceding the return to the long-term steady state CDR. The Company believes that the level of the elevatedCDR and the length of time it will persist is the primary driver behind the likely amount of losses the collateral will suffer(before considering the effects of repurchases of ineligible loans). The Company continues to evaluate the assumptionsaffecting its modeling results.
As of December 31, 2013, the Company’s base case assumed a one month CDR plateau and a 28 month ramp-down(for a total stress period of 34 months). The Company also modeled a scenario with a longer period of elevated defaults andanother with a shorter period of elevated defaults and weighted them the same as of December 31, 2012 and 2011. Increasingthe CDR plateau to four months and increasing the ramp-down by five months to 33-months (for a total stress period of42 months) would increase the expected loss by approximately $26 million for HELOC transactions and $2 million forclosed-end second lien transactions. On the other hand, keeping the CDR plateau at one month but decreasing the length ofthe CDR ramp-down to 18 months (for a total stress period of 24 months) would decrease the expected loss by approximately$24 million for HELOC transactions and $2 million for closed-end second lien transactions.
Breaches of Representations and Warranties
Generally, when mortgage loans are transferred into a securitization, the loan originator(s) and/or sponsor(s) provideR&W that the loans meet certain characteristics, and a breach of such R&W often requires that the loan be repurchased fromthe securitization. In many of the transactions the Company insures, it is in a position to enforce these R&W provisions. Soonafter the Company observed the deterioration in the performance of its insured RMBS following the deterioration of theresidential mortgage and property markets, the Company began using internal resources as well as third party forensicunderwriting firms and legal firms to pursue breaches of R&W on a loan-by-loan basis. Where a provider of R&W refused tohonor its repurchase obligations, the Company sometimes chose to initiate litigation. See “Recovery Litigation” below. TheCompany's success in pursuing these strategies permitted the Company to enter into agreements with R&W providers underwhich those providers made payments to the Company, agreed to make payments to the Company in the future, and / orrepurchased loans from the transactions, all in return for releases of related liability by the Company. Such agreements providethe Company with many of the benefits of pursuing the R&W claims on a loan by loan basis or through litigation, but withoutthe related expense and uncertainty. The Company continues to pursue these strategies against R&W providers with which itdoes not yet have agreements.
Using these strategies, through December 31, 2013 the Company has caused entities providing R&Ws to pay oragree to pay approximately $3.6 billion (gross of reinsurance) in respect of their R&W liabilities for transactions in which theCompany has provided insurance.
(in millions)
Agreement amounts already received $ 2,608Agreement amounts projected to be received in the future 425Repurchase amounts paid into the relevant RMBS prior to settlement (1) 578
Total R&W payments, gross of reinsurance $ 3,611____________________(1) These amounts were paid into the relevant RMBS transactions (rather than to the Company as in most settlements)
and distributed in accordance with the priority of payments set out in the relevant transaction documents. Because theCompany may insure only a portion of the capital structure of a transaction, such payments will not necessarilydirectly benefit the Company dollar-for-dollar, especially in first lien transactions.
Based on this success, the Company has included in its net expected loss estimates as of December 31, 2013 anestimated net benefit related to breaches of R&W of $712 million, which includes $413 million from agreements with R&Wproviders and $299 million in transactions where the Company does not yet have such an agreement, all net of reinsurance.
0345r4.indd 181 3/19/14 3:28 PM

180
Representations and Warranties Agreements (1)
Agreement DateCurrent Net Par
Covered
Receipts toDecember 31, 2013
(net ofreinsurance)
Estimated FutureReceipts (net of
reinsurance)
Eligible AssetsHeld in Trust
(gross ofreinsurance)
(in millions)
Bank of America - First Lien April 2011 $ 1,059 $ 474 $ 201 $ 593Bank of America - Second Lien April 2011 1,387 968 NA NADeutsche Bank May 2012 1,711 179 107 151UBS May 2013 807 394 59 174Others Various 994 385 46 NA
Total $ 5,958 $ 2,400 $ 413 $ 918____________________(1) This table relates to past and projected future recoveries under R&W and related agreements. Excluded is the $299
million of future net recoveries the Company projects receiving from R&W counterparties in transactions with$1,617 million of net par outstanding as of December 31, 2013 not covered by current agreements and $806 millionof net par partially covered by agreements but for which the Company projects receiving additional amounts.
The Company's agreements with the counterparties specifically named in the table above required an initial paymentto the Company to reimburse it for past claims as well as an obligation to reimburse it for a portion of future claims. Thenamed counterparties placed eligible assets in trust to collateralize their future reimbursement obligations, and the amount ofcollateral they are required to post may be increased or decreased from time to time as determined by rating agencyrequirements. Reimbursement payments under these agreements are made either monthly or quarterly and have been madetimely. With respect to the reimbursement for future claims:
• Bank of America. Under the Company's agreement with Bank of America Corporation and certain of its subsidiaries(“Bank of America”), Bank of America agreed to reimburse the Company for 80% of claims on the first lientransactions covered by the agreement that the Company pays in the future, until the aggregate lifetime collaterallosses (not insurance losses or claims) on those transactions reach $6.6 billion. As of December 31, 2013 aggregatelifetime collateral losses on those transactions was $3.7 billion, and the Company was projecting in its base case thatsuch collateral losses would eventually reach $5.1 billion.
• Deutsche Bank. Under the Company's May 2012 agreement with Deutsche Bank AG and certain of its affiliates(collectively, “Deutsche Bank”), Deutsche Bank agreed to reimburse the Company for certain claims it pays in thefuture on eight first and second lien transactions, including 80% of claims it pays on those transactions until theaggregate lifetime claims (before reimbursement) reach $319 million. As of December 31, 2013, the Company wasprojecting in its base case that such aggregate lifetime claims would remain below $319 million. In the eventaggregate lifetime claims paid exceed $389 million, Deutsche Bank must reimburse Assured Guaranty for 85% ofsuch claims paid (in excess of $389 million) until such claims paid reach $600 million.
The agreement also requires Deutsche Bank to reimburse AGC for future claims it pays on certain RMBS re-securitizations. The amount available for reimbursement of claim payments is based on a percentage of the lossesthat occur in certain uninsured tranches (“Uninsured Tranches”) within the eight transactions described above: 60%of losses on the Uninsured Tranches (up to $141 million of losses), 60% of such losses (for losses between $161million and $185 million), and 100% of such losses (for losses from $185 million to $248 million). Losses on theUninsured Tranches from $141 million to $161 million and above $248 million are not included in the calculation ofAGC's reimbursement amount for re-securitization claim payments. As of December 31, 2013, the Company wasprojecting in its base case that losses on the Uninsured Tranches would be $150 million. Pursuant to the CDStermination on October 10, 2013 described below, a portion of Deutsche Bank's reimbursement obligation wasapplied to the terminated CDS. After giving effect to application of the portion of the reimbursement obligation to theterminated CDS, as well as to reimbursements related to other covered RMBS re-securitizations, and based on theCompany's base case projections for losses on the Uninsured Tranches, the Company expects that $30 million will beavailable to reimburse AGC for re-securitization claim payments on the remaining re-securitizations. Except for thereimbursement obligation based on losses occurring on the Uninsured Tranches and the termination agreed todescribed below, the agreement with Deutsche Bank does not cover transactions where the Company has providedprotection to Deutsche Bank on RMBS transactions in CDS form.
0345r4.indd 182 3/19/14 3:28 PM

181
On October 10, 2013, the Company and Deutsche Bank terminated one below investment grade transaction underwhich the Company had provided credit protection to Deutsche Bank through a CDS. The transaction had a net paroutstanding of $294 million at the time of termination. In connection with the termination, Assured Guaranty agreedto release to Deutsche Bank $60 million of assets held in trust that was in excess of the amount of assets required tobe held in trust for regulatory and rating agency capital relief.
• UBS. On May 6, 2013, the Company entered into an agreement with UBS Real Estate Securities Inc. and affiliates("UBS") and a third party resolving the Company’s claims and liabilities related to specified RMBS transactions thatwere issued, underwritten or sponsored by UBS and insured by AGM or AGC under financial guaranty insurancepolicies. Under the agreement, UBS agreed to reimburse the Company for 85% of future losses on three first lienRMBS transactions.
• Flagstar. On June 21, 2013, AGM entered into a settlement agreement with Flagstar Bank in connection with itslitigation for breach of contract against Flagstar on the Flagstar Home Equity Loan Trust, Series 2005-1 and Series2006-2 second lien transactions. The agreement followed judgments by the court in February and April 2013 in favorof AGM, which Flagstar had planned to appeal. As part of the settlement, AGM received a cash payment of $105million and Flagstar withdrew its appeal. Flagstar also will reimburse AGM in full for all future claims on AGM’sfinancial guaranty insurance policies for such transactions. This settlement resolved all RMBS claims that AGM hadasserted against Flagstar and each party agreed to release the other from any and all other future RMBS-relatedclaims between them.
The Company calculated an expected recovery of $299 million from breaches of R&W in transactions not coveredby agreements with $1,617 million of net par outstanding as of December 31, 2013 and $806 million of net par partiallycovered by agreements but for which the Company projects receiving additional amounts. The Company did not incorporateany gain contingencies from potential litigation in its estimated repurchases. The amount the Company will ultimately recoverrelated to such contractual R&W is uncertain and subject to a number of factors including the counterparty's ability to pay, thenumber and loss amount of loans determined to have breached R&W and, potentially, negotiated settlements or litigationrecoveries. As such, the Company's estimate of recoveries is uncertain and actual amounts realized may differ significantlyfrom these estimates. In arriving at the expected recovery from breaches of R&W not already covered by agreements, theCompany considered the creditworthiness of the provider of the R&W, the number of breaches found on defaulted loans, thesuccess rate in resolving these breaches across those transactions where material repurchases have been made and thepotential amount of time until the recovery is realized. The calculation of expected recovery from breaches of such contractualR&W involved a variety of scenarios which ranged from the Company recovering substantially all of the losses it incurreddue to violations of R&W to the Company realizing limited recoveries. These scenarios were probability weighted in order todetermine the recovery incorporated into the Company's estimate of expected losses. This approach was used for both loansthat had already defaulted and those assumed to default in the future. The Company adjusts the calculation of its expectedrecovery from breaches of R&W based on changing facts and circumstances with respect to each counterparty and transaction.
The Company uses the same RMBS projection scenarios and weightings to project its future R&W benefit as it usesto project RMBS losses on its portfolio. To the extent the Company increases its loss projections, the R&W benefit (whetherpursuant to an R&W agreement or not) generally will also increase, subject to the agreement limits and thresholds describedabove. Similarly, to the extent the Company decreases its loss projections, the R&W benefit (whether pursuant to an R&Wagreement or not) generally will also decrease, subject to the agreement limits and thresholds described above.
The Company accounts for the loss sharing obligations under the R&W agreements on financial guaranty insurancecontracts as subrogation, offsetting the losses it projects by an R&W benefit from the relevant party for the applicable portionof the projected loss amount. Proceeds projected to be reimbursed to the Company on transactions where the Company hasalready paid claims are viewed as a recovery on paid losses. For transactions where the Company has not already paid claims,projected recoveries reduce projected loss estimates. In either case, projected recoveries have no effect on the amount of theCompany's exposure. See Notes 8, Fair Value Measurement and 9, Consolidation of Variable Interest Entities.
0345r4.indd 183 3/19/14 3:28 PM

182
U.S. RMBS Risks with R&W Benefit
Number of Risks (1) as of Debt Service as of
December 31, 2013 December 31, 2012 December 31, 2013 December 31, 2012(dollars in millions)
Prime first lien 1 1 $ 38 $ 44Alt-A first lien 19 26 2,856 4,173Option ARM 9 10 641 1,183Subprime 5 5 998 989Closed-end second lien 4 4 158 260HELOC 4 7 320 549
Total 42 53 $ 5,011 $ 7,198____________________(1) A risk represents the aggregate of the financial guaranty policies that share the same revenue source for purposes of
making Debt Service payments.This table shows the full future Debt Service (not just the amount of Debt Serviceexpected to be reimbursed) for risks with projected future R&W benefit, whether pursuant to an agreement or not.
The following table provides a breakdown of the development and accretion amount in the roll forward of estimatedrecoveries associated with alleged breaches of R&W.
Components of R&W Development
Year Ended December 31,2013 2012
(in millions)
Inclusion (removal) of deals with breaches of R&W during period $ 6 $ (3)Change in recovery assumptions as the result of additional file review and recoverysuccess (6) (10)Estimated increase (decrease) in defaults that will result in additional (lower) breaches (8) 63Results of settlements 289 120Accretion of discount on balance 15 9
Total $ 296 $ 179
“XXX” Life Insurance Transactions
The Company’s $2.7 billion net par of XXX life insurance transactions as of December 31, 2013 include $598million rated BIG. The BIG “XXX” life insurance reserve securitizations are based on discrete blocks of individual lifeinsurance business. In each such transaction the monies raised by the sale of the bonds insured by the Company were used tocapitalize a special purpose vehicle that provides reinsurance to a life insurer or reinsurer. The monies are invested atinception in accounts managed by third-party investment managers.
The BIG “XXX” life insurance transactions consist of two transactions: Ballantyne Re p.l.c and Orkney Re II p.l.c.These transactions had material amounts of their assets invested in U.S. RMBS transactions. Based on its analysis of theinformation currently available, including estimates of future investment performance, and projected credit impairments onthe invested assets and performance of the blocks of life insurance business at December 31, 2013, the Company’s projectednet expected loss to be paid is $73 million. The overall decrease of approximately $66 million in expected loss to be paidduring 2013 is due primarily to the purchase of insured notes during the year.
0345r4.indd 184 3/19/14 3:28 PM

183
Student Loan Transactions
The Company has insured or reinsured $2.8 billion net par of student loan securitizations, of which $1.9 billion wasissued by private issuers and classified as asset-backed and $0.9 billion was issued by public authorities and classified aspublic finance. Of these amounts, $206 million and $253 million, respectively, are rated BIG. The Company is projectingapproximately $64 million of net expected loss to be paid in these portfolios. In general, the losses are due to: (i) the poorcredit performance of private student loan collateral and high loss severities, or (ii) high interest rates on auction ratesecurities with respect to which the auctions have failed. The largest of these losses was approximately $26 million and relatedto a transaction backed by a pool of private student loans assumed by AG Re from another monoline insurer. The guaranteedbonds were issued as auction rate securities that now bear a high rate of interest due to the downgrade of the primary insurer’sfinancial strength rating. Further, the underlying loan collateral has performed below expectations. The overall increase of $10million in net expected loss during 2013 was primarily due to worse than expected collateral performance.
Trust Preferred Securities Collateralized Debt Obligations
The Company has insured or reinsured $5.0 billion of net par (72% of which is in CDS form) of collateralized debtobligations (“CDOs”) backed by TruPS and similar debt instruments, or “TruPS CDOs.” Of the $5.0 billion, $1.7 billion israted BIG. The underlying collateral in the TruPS CDOs consists of subordinated debt instruments such as TruPS issued bybank holding companies and similar instruments issued by insurance companies, real estate investment trusts (“REITs”) andother real estate related issuers.
The Company projects losses for TruPS CDOs by projecting the performance of the asset pools across severalscenarios (which it weights) and applying the CDO structures to the resulting cash flows. At December 31, 2013, theCompany has projected expected losses to be paid for TruPS CDOs of $51 million. The increase of approximately $24 millionin 2013 was due primarily to additional defaults and deferrals in the underlying collateral as well as the receipt during the yearof $9 million in reimbursements for claims previously paid.
Selected U.S. Public Finance Transactions
The Company insures general obligation bonds of the Commonwealth of Puerto Rico and various obligations of itsrelated authorities and public corporations aggregating $5.4 billion net par. The Company rates $5.2 billion net par of thatamount BIG. Although recent announcements and actions by the current Governor and his administration indicate officials ofthe Commonwealth are focused on measures that are intended to help Puerto Rico operate within its financial resources andmaintain its access to the capital markets, Puerto Rico faces significant challenges, including high debt levels, a decliningpopulation and an economy that has been in recession since 2006. Puerto Rico has been operating with a structural budgetdeficit in recent years, and its two largest pension funds are significantly underfunded. In February 2014, S&P, Moody's andFitch Ratings downgraded much of the debt of Puerto Rico and its related authorities and public corporations to belowinvestment grade, citing various factors including limited liquidity and market access risk. The Commonwealth has notdefaulted on any of its debt. Neither Puerto Rico nor its related authorities and public corporations are eligible debtors underChapter 9 of the U.S. Bankruptcy Code. Information regarding the Company's exposure general obligations ofCommonwealth of Puerto Rico and various obligations of its related authorities and public corporations, please refer "PuertoRico Exposure" in Note 3, Outstanding Exposure.
Many U.S. municipalities and related entities continue to be under increased pressure, and a few have filed forprotection under the U.S. Bankruptcy Code, entered into state processes designed to help municipalities in fiscal distress orotherwise indicated they may consider not meeting their obligations to make timely payments on their debts. Given some ofthese developments, and the circumstances surrounding each instance, the ultimate outcome cannot be certain and may lead toan increase in defaults on some of the Company's insured public finance obligations. The Company will continue to analyzedevelopments in each of these matters closely. The municipalities whose obligations the Company has insured that have filedfor protection under Chapter 9 of the U.S Bankruptcy Code are: Detroit, Michigan; Jefferson County, Alabama; and Stockton,California. The City Council of Harrisburg, Pennsylvania had also filed a purported bankruptcy petition, which was laterdismissed by the bankruptcy court; a receiver for the City of Harrisburg was appointed by the Commonwealth Court ofPennsylvania on December 2, 2011.
The Company has net par exposure to the City of Detroit, Michigan of $2.1 billion as of December 31, 2013. On July18, 2013, the City of Detroit filed for bankruptcy under Chapter 9 of the U.S. Bankruptcy Code. Most of the Company's netpar exposure relates to $1.0 billion of sewer revenue bonds and $784 million of water revenue bonds, both of which theCompany rates BBB. Both the sewer and water systems provide services to areas that extend beyond the city limits, and thebonds are secured by a lien on "special revenues." The Company also has net par exposure of $146 million to the City's
0345r4.indd 185 3/19/14 3:28 PM

184
general obligation bonds (which are secured by a pledge of the unlimited tax, full faith, credit and resources of the City andthe specific ad valorem taxes approved by the voters solely to pay debt service on the general obligation bonds) and $175million of the City's Certificates of Participation (which are unsecured unconditional contractual obligations of the City), bothof which the Company rates below investment grade. AGM has filed a complaint in the U.S. Bankruptcy Court for the EasternDistrict of Michigan against the City seeking a declaratory judgment with respect to the City’s unlawful treatment of itsUnlimited Tax General Obligation Bonds. Detail about the lawsuit is set forth under "Recovery Litigation -- Public FinanceTransactions" below. On December 3, 2013, the Bankruptcy Court ruled that the City is eligible for protection under Chapter9. On February 21, 2014, the City filed a proposed plan of adjustment and disclosure statement with the Bankruptcy Court.
During 2013 the Company has resolved, or is in the process of resolving, several of the credits that filed or attemptedto file for protection under Chapter 9 of the U.S. Bankruptcy Code:
• Stockton. On June 28, 2012, the City of Stockton, California filed for bankruptcy protection under Chapter 9 of theU.S. Bankruptcy Code. The Company's net exposure to the City's general fund is $119 million, consisting of pensionobligation bonds. The Company also had exposure to lease obligation bonds; as of December 31, 2013, the Companyowned all of such bonds and held them in its investment portfolio. As of December 31, 2013, the Company had paid$26 million in net claims. On October 3, 2013, the Company reached a tentative settlement with the City regardingthe treatment of the bonds insured by the Company in the City's proposed plan of adjustment. Under the terms of thesettlement, the Company received title to an office building, the ground lease of which secures the lease revenuebonds, and will also be entitled to certain fixed payments and certain variable payments contingent on the City'srevenue growth. The settlement is subject to a number of conditions, including a sales tax increase (which wasapproved by voters on November 5, 2013), confirmation of a plan of adjustment that implements the terms of thesettlement and definitive documentation. Pursuant to an order of the Bankruptcy Court, the City held a vote of itscreditors on its proposed plan of adjustment; all but one of the classes polled voted to accept the plan. The courtproceeding to determine whether to confirm the plan of adjustment is expected to begin in May 2014. The Companyexpects the plan to be confirmed and implemented during 2014.
• Jefferson County. On November 9, 2011, Jefferson County filed for bankruptcy protection under Chapter 9 of theU.S. Bankruptcy Code. After several years of negotiations and litigation with various parties, Jefferson County'srevised plan of adjustment was approved by the bankruptcy court and in December 2013 became effective. In orderfor Jefferson County to refund and retire the sewer warrants that it had previously issued, and to make otherpayments under the plan of adjustment, Jefferson County issued approximately $1,785 million of new sewer warrantson December 3, 2013. In that issuance, AGM insured approximately $600 million in initial aggregate principalamount of the senior lien sewer warrants, which AGM internally rates investment grade. The sewer system emergedfrom bankruptcy with a significantly lower debt burden and a rate structure that is approved through the life of thenew sewer warrants.
• Mashantucket Pequot Foxwoods Casino. During 2013 and as part of a negotiated restructuring, the Company paidoff the insured bonds secured by the excess free cash flow of the Foxwoods Casino run by the Mashantucket PequotTribe. The Company made cumulative claims payments of $116 million (net of reinsurance) on the insured bonds. Inreturn for participating in the restructuring, the Company received new notes with a principal amount of $145 millionwith the same seniority as the bonds the Company had insured. The new notes are held as an investment andaccounted for as such.
• Harrisburg. In December 2011, the Commonwealth Court of Pennsylvania appointed a receiver for the City . TheCompany had insured bonds for a resource recovery facility sponsored by the City. In December 2013 the defaultedrecourse recovery facility bonds were paid in full with funds from the sale of the resource recovery facility, the saleof parking system revenue bonds issued by the Pennsylvania Economic Development Financing Authority(“PEDFA”) and claim payments made by the Company. AGM insured $189 million of the parking facility revenuebonds issued by PEDFA and is entitled to receive reimbursements for claims it paid from residual cash flow on theparking system after the payment of debt service on the PEDFA bonds.
The Company has $336 million of net par exposure to the Louisville Arena Authority. The bond proceeds were usedto construct the KFC Yum Center, home to the University of Louisville men's and women's basketball teams. Actual revenuesavailable for Debt Service are well below original projections, and under the Company's internal rating scale, the transactionis BIG.
The Company projects that its total future expected net loss across its troubled U.S. public finance credits as ofDecember 31, 2013 will be $264 million. As of December 31, 2012 the Company was projecting a net expected loss of $7
0345r4.indd 186 3/19/14 3:28 PM

185
million across it troubled U.S. public finance credits. The net increase of $257 million in expected loss was primarilyattributable to deterioration in the credit of Puerto Rico and its related related authorities and public corporations, thebankruptcy filing by the City of Detroit, and a final resolution in Harrisburg that was somewhat worse for the Company than itprojected as of December 31, 2012, offset in part primarily by the final resolution of the Company's Jefferson Countyexposure.
Certain Selected European Country Transactions
The Company insures and reinsures credits with sub-sovereign exposure to various Spanish and Portuguese issuerswhere a Spanish and Portuguese sovereign default may cause the regions also to default. The Company's gross exposure tothese Spanish and Portuguese credits is €437 million and €92 million, respectively and exposure net of reinsurance forSpanish and Portuguese credits is €313 million and €80 million, respectively. The Company rates most of these issuers in theBB category due to the financial condition of Spain and Portugal and their dependence on the sovereign. The Company'sHungary exposure is to infrastructure bonds dependent on payments from Hungarian governmental entities and coveredmortgage bonds issued by Hungarian banks. The Company's gross exposure to these Hungarian credits is $645 million and itsexposure net of reinsurance is $608 million of which all is rated BIG. The Company estimated net expected losses of $51million related to these Spanish, Portuguese and Hungarian credits, up from $41 million as of December 31, 2012 largely dueto minor movements in exchange rates, interest rates and timing of potential defaults, and the general deterioration of theCompany's view of its Hungarian exposure during the year. Information regarding the Company's exposure to other SelectedEuropean Countries may be found under "Direct Economic Exposure to the Selected European Countries" in Note 3,Outstanding Exposure.
Manufactured Housing
The Company insures or reinsures a total of $257 million net par of securities backed by manufactured housingloans, of which $180 million is rated BIG. The Company has expected loss to be paid of $26 million as of December 31,2013, down from $33 million as of December 31, 2012, due primarily to the higher risk free rates used to discount losses andadditional amortization on certain transactions.
Infrastructure Finance
The Company has insured exposure of approximately $3.0 billion to infrastructure transactions with refinancing riskas to which the Company may need to make claim payments that it did not anticipate paying when the policies were issued.Although the Company may not experience ultimate loss on a particular transaction, the aggregate amount of the claimpayments may be substantial and reimbursement may not occur for an extended time, if at all. These transactions generallyinvolve long-term infrastructure projects that were financed by bonds that mature prior to the expiration of the projectconcession. The Company expected the cash flows from these projects to be sufficient to repay all of the debt over the life ofthe project concession, but also expected the debt to be refinanced in the market at or prior to its maturity. Due to marketconditions, the Company may have to pay a claim when the debt matures, and then recover its payment from cash flowsproduced by the project in the future. The Company generally projects that in most scenarios it will be fully reimbursed forsuch payments. However, the recovery of the payments is uncertain and may take a long time, ranging from 10 to 35 years,depending on the transaction and the performance of the underlying collateral. The Company’s exposure to infrastructuretransactions with refinancing risk was reduced during 2013 by the termination of its insurance on A$413 million ofinfrastructure securities having maturities commencing in 2014. The Company estimates total claims for the remaining twolargest transactions with significant refinancing risk, assuming no refinancing and based on certain performance assumptions,could be $1.8 billion on a gross basis; such claims would be payable from 2017 through 2022.
Recovery Litigation
RMBS Transactions
As of the date of this filing, AGM and AGC have lawsuits pending against a number of providers of representationsand warranties in U.S. RMBS transactions insured by them, seeking damages. In all the lawsuits, AGM and AGC have allegedbreaches of R&W in respect of the underlying loans in the transactions, and failure to cure or repurchase defective loansidentified by AGM and AGC to such persons.
• Deutsche Bank: AGM has sued Deutsche Bank AG affiliates DB Structured Products, Inc. and ACESecurities Corp. in the Supreme Court of the State of New York on the ACE Securities Corp. Home EquityLoan Trust, Series 2006-GP1 second lien transaction.
0345r4.indd 187 3/19/14 3:28 PM

186
• Credit Suisse: AGM and AGC have sued DLJ Mortgage Capital, Inc. (“DLJ”) and Credit Suisse Securities(USA) LLC (“Credit Suisse”) on first lien U.S. RMBS transactions insured by them. The ones insured byAGM are: CSAB Mortgage-Backed Pass Through Certificates, Series 2006-2; CSAB Mortgage-Backed PassThrough Certificates, Series 2006-3; CSAB Mortgage-Backed Pass Through Certificates, Series 2006-4; andCMSC Mortgage-Backed Pass Through Certificates, Series 2007-3. The ones insured by AGC are: CSABMortgage-Backed Pass Through Certificates, Series 2007-1 and TBW Mortgage-Backed Pass ThroughCertificates, Series 2007-2. Although DLJ and Credit Suisse successfully dismissed certain causes of actionand claims for relief asserted in the complaint, the primary causes of action against DLJ for breach of R&Wand breach of its repurchase obligations remained. On February 27, 2014 the Appellate Division, FirstDepartment unanimously reversed certain aspects of the partial dismissal by the Supreme Court of the State ofNew York of certain claims for relief by holding as a matter of law that AGM’s and AGC’s remedies forbreach of R&W are not limited to the repurchase remedy. On October 21, 2013, AGM and AGC filed anamended complaint against DLJ and Credit Suisse (and added Credit Suisse First Boston Mortgage SecuritiesCorp. as a defendant), asserting claims of fraud and material misrepresentation in the inducement of aninsurance contract, in addition to their existing breach of contract claims. The defendants have filed a motionto dismiss certain aspects of the fraud claim against Credit Suisse First Boston Mortgage Securities Corp., andAGM's and AGC's claims for compensatory damages in the form of all claims paid and to be paid by AGMand AGC. The motion to dismiss is currently pending.
On March 26, 2013, AGM filed a lawsuit against RBS Securities Inc., RBS Financial Products Inc. and FinancialAsset Securities Corp. (collectively, “RBS”) in the United States District Court for the Southern District of New York on theSoundview Home Loan Trust 2007-WMC1 transaction. The complaint alleges that RBS made fraudulent misrepresentationsto AGM regarding the quality of the underlying mortgage loans in the transaction and that RBS's misrepresentations inducedAGM into issuing a financial guaranty insurance policy in respect of the Class II-A-1 certificates issued in the transaction. OnJuly 19, 2013, AGM amended its complaint to add a claim under Section 3105 of the New York Insurance Law. RBS has filedmotions to dismiss AGM's complaint.
In May 2012, AGM sued GMAC Mortgage, LLC (formerly GMAC Mortgage Corporation; Residential AssetMortgage Products, Inc.; Ally Bank (formerly GMAC Bank); Residential Funding Company, LLC (formerly ResidentialFunding Corporation); Residential Capital, LLC (formerly Residential Capital Corporation, "ResCap"); Ally Financial(formerly GMAC, LLC); and Residential Funding Mortgage Securities II, Inc. on the GMAC RFC Home Equity Loan-Backed Notes, Series 2006-HSA3 and GMAC Home Equity Loan-Backed Notes, Series 2004-HE3 second lien transactions.On May 14, 2012, ResCap and several of its affiliates filed for Chapter 11 protection with the U.S. Bankruptcy Court. Thedebtors' Joint Chapter 11 Plan became effective in December 2013 and AGM received a settlement amount. Accordingly,AGM dismissed its lawsuit at year-end 2013.
“XXX” Life Insurance Transactions
In December 2008, Assured Guaranty (UK) Ltd. (“AGUK”) filed an action against J.P. Morgan InvestmentManagement Inc. (“JPMIM”), the investment manager in the Orkney Re II transaction, in the Supreme Court of the State ofNew York alleging that JPMIM engaged in breaches of fiduciary duty, gross negligence and breaches of contract based uponits handling of the investments of Orkney Re II. After AGUK’s claims were dismissed with prejudice in January 2010, AGUKwas successful in its subsequent motions and appeals and, as of December 2011, all of AGUK’s claims for breaches offiduciary duty, gross negligence and contract were reinstated in full. Separately, at the trial court level, discovery is ongoing.
Public Finance Transactions
On December 23, 2013, AGM filed an amended complaint in the U.S. Bankruptcy Court for the Eastern District ofMichigan against the City seeking a declaratory judgment with respect to the City’s unlawful treatment of its Unlimited TaxGeneral Obligation Bonds (the “Unlimited Tax Bonds”). The complaint seeks a declaratory judgment and court orderestablishing, among other things, that, under Michigan law, the proceeds of ad valorem taxes levied and collected by the Cityfor the sole purpose of repaying the Unlimited Tax Bonds are “restricted funds” which must be segregated and not comingledwith other funds of the City, that the City is prohibited from using the restricted funds for any purposes other than repayingholders of the Unlimited Tax Bonds, and that holders of the Unlimited Tax Bonds and AGM, as subrogee of the holders, havea statutory lien on the restricted funds which constitutes a lien on special revenues within the meaning of Chapter 9 of the U.S.Bankruptcy Code. A hearing was held on this matter on February 19, 2014.
In June 2010, AGM had sued JPMorgan Chase Bank, N.A. and JPMorgan Securities, Inc. (together, “JPMorgan”),the underwriter of debt issued by Jefferson County, in the Supreme Court of the State of New York alleging that JPMorgan
0345r4.indd 188 3/19/14 3:28 PM

187
induced AGM to issue its insurance policies in respect of such debt through material and fraudulent misrepresentations andomissions, including concealing that it had secured its position as underwriter and swap provider through bribes to JeffersonCounty commissioners and others. AGM dismissed the litigation after Jefferson County's Chapter 9 plan of adjustmentbecame effective in December 2013.
In September 2010, AGM, together with TD Bank, National Association and Manufacturers and Traders TrustCompany, as trustees, filed a complaint in the Court of Common Pleas of Dauphin County, Pennsylvania against TheHarrisburg Authority, The City of Harrisburg, Pennsylvania, and the Treasurer of the City in connection with certain ResourceRecovery Facility bonds and notes issued by The Harrisburg Authority, alleging, among other claims, breach of contract byboth The Harrisburg Authority and The City of Harrisburg, and seeking remedies including an order of mandamus compellingthe City to satisfy its obligations on the defaulted bonds and notes and the appointment of a receiver for The HarrisburgAuthority. In connection with the consummation of Harrisburg's fiscal recovery plan in December 2013, AGM dismissed suchlitigation.
7. Financial Guaranty Insurance Losses
Accounting Policies
Loss and LAE Reserve
Loss and LAE reserve reported on the balance sheet relates only to direct and assumed reinsurance contracts that areaccounted for as insurance, substantially all of which are financial guaranty insurance contracts. The corresponding reserveceded to reinsurers is reported as reinsurance recoverable on unpaid losses. As discussed in Note 8, Fair Value Measurement,contracts that meet the definition of a derivative, as well as consolidated FG VIE assets and liabilities, are recorded separatelyat fair value. Any expected losses related to consolidated FG VIEs are eliminated upon consolidation. Any expected losses oncredit derivatives are not recorded as loss and LAE reserve on the consolidated balance sheet.
Under financial guaranty insurance accounting, the sum of unearned premium reserve (deferred premium revenue, lessclaim payments that have not yet been expensed or "contra-paid"), and loss and LAE reserve represents the Company'sstand�ready obligation. At contract inception, the entire stand-ready obligation is represented by unearned premium reserve. Aloss and LAE reserve for an insurance contract is only recorded when the expected loss to be paid plus contra-paid (“totallosses”) exceed the deferred premium revenue, on a contract by contract basis.
When a claim payment is made on a contract, it first reduces any recorded loss and LAE reserve. To the extent there isno loss and LAE reserve on a contract, which occurs when total losses are less than deferred premium revenue, or to the extentloss and LAE reserve is not sufficient to cover a claim payment, then such claim payment is recorded as “contra-paid,” whichreduces the unearned premium reserve. The contra-paid is recognized in the line item “loss and LAE” in the consolidatedstatement of operations when and for the amount that total losses exceed the remaining deferred premium revenue on theinsurance contract. Loss and LAE in the consolidated statement of operations is presented net of cessions to reinsurers.
Salvage and Subrogation Recoverable
When the Company becomes entitled to the cash flow from the underlying collateral of an insured credit under salvageand subrogation rights as a result of a claim payment or estimated future claim payment, it reduces the expected loss to be paidon the contract. Such reduction in expected loss to be paid can result in one of the following:
• a reduction in the corresponding loss and LAE reserve with a benefit to the income statement,
• no entry recorded, if “total loss” is not in excess of deferred premium revenue, or
• the recording of a salvage asset with a benefit to the income statement if the transaction is in a net recoveryposition at the reporting date.
The Company recognizes the expected recovery of claim payments (including recoveries from settlement with R&Wproviders) made by an acquired subsidiary prior to the date of acquisition, consistent with its policy for recognizing recoverieson all financial guaranty insurance contracts. To the extent that the estimated amount of recoveries increases or decreases, dueto changes in facts and circumstances, including the examination of additional loan files and our experience in recovering loans
0345r4.indd 189 3/19/14 3:28 PM

188
put back to the originator, the Company would recognize a benefit or expense consistent with how changes in the expectedrecovery of all other claim payments are recorded. The ceded component of salvage and subrogation recoverable is recorded inthe line item reinsurance balances payable.
Expected Loss to be Expensed
Expected loss to be expensed represents past or expected future net claim payments that have not yet been expensed.Such amounts will be expensed in future periods as deferred premium revenue amortizes into income on financial guarantyinsurance policies. Expected loss to be expensed is the Company's projection of incurred losses that will be recognized in futureperiods, excluding accretion of discount.
Insurance Contracts' Loss Information
The following table provides balance sheet information on loss and LAE reserves and salvage and subrogationrecoverable, net of reinsurance.
Loss and LAE Reserve and Salvage and Subrogation RecoverableNet of Reinsurance
Insurance Contracts
As of December 31, 2013 As of December 31, 2012
Loss andLAE
Reserve, net
Salvage andSubrogation
Recoverable, netNet Reserve
(Recoverable)
Loss andLAE
Reserve, net
Salvage andSubrogation
Recoverable, netNet Reserve
(Recoverable)(in millions)
U.S. RMBS:First lien:
Prime first lien $ 3 $ — $ 3 $ 3 $ — $ 3Alt-A first lien 108 — 108 93 — 93Option ARM 22 47 (25) 52 216 (164)Subprime 143 2 141 82 0 82
First lien 276 49 227 230 216 14Second lien:
Closed-end second lien 5 45 (40) 5 72 (67)HELOC 5 127 (122) 37 196 (159)
Second lien 10 172 (162) 42 268 (226)Total U.S. RMBS 286 221 65 272 484 (212)TruPS 2 — 2 1 — 1Other structured finance 145 6 139 197 4 193U.S. public finance 189 8 181 104 134 (30)Non-U.S. public finance 35 — 35 31 — 31Financial guaranty 657 235 422 605 622 (17)Other 2 5 (3) 2 5 (3)
Subtotal 659 240 419 607 627 (20)Effect of consolidating FGVIEs (103) (85) (18) (64) (217) 153
Total (1) $ 556 $ 155 $ 401 $ 543 $ 410 $ 133____________________(1) See “Components of Net Reserves (Salvage)” table for loss and LAE reserve and salvage and subrogation recoverable
components.
0345r4.indd 190 3/19/14 3:28 PM

189
The following table reconciles the reported gross and ceded reserve and salvage and subrogation amounts to thefinancial guaranty net reserves (salvage) in the financial guaranty BIG transaction loss summary tables.
Components of Net Reserves (Salvage)Insurance Contracts
As ofDecember 31, 2013
As ofDecember 31, 2012
(in millions)
Loss and LAE reserve $ 592 $ 601Reinsurance recoverable on unpaid losses (36) (58)
Loss and LAE reserve, net 556 543Salvage and subrogation recoverable (174) (456)Salvage and subrogation payable(1) 19 46
Salvage and subrogation recoverable, net (155) (410)Other recoverables(2) (15) (30)
Net reserves (salvage) 386 103Less: other (non-financial guaranty business) (3) (3)
Net reserves (salvage) $ 389 $ 106____________________(1) Recorded as a component of reinsurance balances payable.
(2) R&W recoverables recorded in other assets on the consolidated balance sheet.
Balance Sheet Classification ofNet Expected Recoveries for Breaches of R&W
Insurance Contracts
As of December 31, 2013 As of December 31, 2012
For allFinancialGuarantyInsuranceContracts
Effect ofConsolidating
FG VIEsReported on
Balance Sheet(1)
For allFinancialGuarantyInsuranceContracts
Effect ofConsolidating
FG VIEsReported on
Balance Sheet(1)(in millions)
Salvage and subrogationrecoverable, net $ 122 $ (49) $ 73 $ 449 $ (169) $ 280Loss and LAE reserve, net 363 (24) 339 571 (33) 538
____________________(1) The remaining benefit for R&W is either recorded at fair value in FG VIE assets, or not recorded on the balance sheet
until the total loss, net of R&W, exceeds unearned premium reserve.
The table below provides a reconciliation of net expected loss to be paid to net expected loss to be expensed. Expectedloss to be paid differs from expected loss to be expensed due to: (1) the contra-paid which represent the payments that havebeen made but have not yet been expensed, (2) salvage and subrogation recoverable for transactions that are in a net recoveryposition where the Company has not yet received recoveries on claims previously paid (having the effect of reducing netexpected loss to be paid by the amount of the previously paid claim and the expected recovery), but will have no future incomeeffect (because the previously paid claims and the corresponding recovery of those claims will offset in income in futureperiods), and (3) loss reserves that have already been established (and therefore expensed but not yet paid).
0345r4.indd 191 3/19/14 3:28 PM

190
Reconciliation of Net Expected Loss to be Paid andNet Expected Loss to be Expensed
Financial Guaranty Insurance Contracts
As of December 31,2013
(in millions)Net expected loss to be paid $ 801Less: net expected loss to be paid for FG VIEs 60
Total 741Contra-paid, net 39Salvage and subrogation recoverable, net of reinsurance 150Loss and LAE reserve, net of reinsurance (554)Other recoveries (1) 15
Net expected loss to be expensed (2) $ 391____________________(1) R&W recoverables recorded in other assets on the consolidated balance sheet.
(2) Excludes $98 million as of December 31, 2013 related to consolidated FG VIEs.
The following table provides a schedule of the expected timing of net expected losses to be expensed. The amount andtiming of actual loss and LAE may differ from the estimates shown below due to factors such as refundings, accelerations,commutations, changes in expected lives and updates to loss estimates. This table excludes amounts related to consolidated FGVIEs, which are eliminated in consolidation.
Net Expected Loss to be ExpensedInsurance Contracts
As of December 31, 2013
(in millions)
2014 (January 1 - March 31) $ 112014 (April 1 - June 30) 112014 (July 1 - September 30) 102014 (October 1–December 31) 10
Subtotal 2014 422015 412016 332017 302018 272019 - 2023 992024 - 2028 562029 - 2033 36After 2033 27
Net expected loss to be expensed(1) 391Discount 406
Total future value $ 797
____________________(1) Consolidation of FG VIEs resulted in reductions of $98 million in net expected loss to be expensed which is on a
present value basis.
0345r4.indd 192 3/19/14 3:28 PM

191
The following table presents the loss and LAE recorded in the consolidated statements of operations by sector forinsurance contracts. Amounts presented are net of reinsurance.
Loss and LAEReported on the
Consolidated Statements of Operations
Year Ended December 31,2013 2012 2011
(in millions)
Structured Finance:U.S. RMBS:
First lien:Prime first lien $ 1 $ 2 $ —Alt-A first lien (2) 51 53Option ARM (48) 137 203Subprime 80 38 (39)
First lien 31 228 217Second lien:
Closed end second lien 18 31 1HELOC (53) 49 171
Second lien (35) 80 172Total U.S. RMBS (4) 308 389TruPS (1) (10) 11Other structured finance (34) 3 107
Structured finance (35) (7) 118Public Finance:
U.S. public finance 198 51 15Non-U.S. public finance 16 234 33
Public finance 214 285 48Subtotal 175 586 555
Other — (17) —Loss and LAE insurance contracts before FG VIE consolidation 175 569 555
Effect of consolidating FG VIEs (21) (65) (107)Loss and LAE $ 154 $ 504 $ 448
The following table provides information on financial guaranty insurance contracts categorized as BIG. Previously,the Company had included securities purchased for loss mitigation purposes in its descriptions of its invested assets and itsfinancial guaranty insured portfolio. Beginning with third quarter 2013, the Company excludes such loss mitigation securitiesfrom its disclosure about its financial guaranty insured portfolio (unless otherwise indicated); it has taken this approach as ofboth December 31, 2013 and December 31, 2012.
0345r4.indd 193 3/19/14 3:28 PM

192
Financial Guaranty InsuranceBIG Transaction Loss Summary
As of December 31, 2013
BIG Categories (1)
BIG 1 BIG 2 BIG 3 TotalBIG, Net
Effect ofConsolidating
FG VIEs TotalGross Ceded Gross Ceded Gross Ceded(dollars in millions)
Number of risks(2) 185 (72) 80 (24) 119 (34) 384 — 384Remaining weighted-average contract period(in years) 10.5 8.1 8.3 5.9 9.8 7.2 10.5 — 10.5Outstanding exposure:
Principal $ 15,132 $ (2,741) $ 2,483 $ (160) $ 3,189 $ (158) $ 17,745 $ — $ 17,745Interest 8,114 (1,144) 1,181 (53) 1,244 (52) 9,290 — 9,290
Total(3) $ 23,246 $ (3,885) $ 3,664 $ (213) $ 4,433 $ (210) $ 27,035 $ — $ 27,035
Expected cash outflows(inflows) $ 1,853 $ (528) $ 1,038 $ (40) $ 1,681 $ (62) $ 3,942 $ (690) $ 3,252Potential recoveries(4) (1,879) 514 (671) 27 (707) 32 (2,684) 579 (2,105)
Subtotal (26) (14) 367 (13) 974 (30) 1,258 (111) 1,147Discount 13 — (126) 3 (352) 5 (457) 51 (406)
Present value of expectedcash flows $ (13) $ (14) $ 241 $ (10) $ 622 $ (25) $ 801 $ (60) $ 741
Deferred premiumrevenue $ 517 $ (90) $ 163 $ (7) $ 303 $ (27) $ 859 $ (178) $ 681Reserves (salvage)(5) $ (114) $ 1 $ 117 $ (4) $ 420 $ (13) $ 407 $ (18) $ 389
Financial Guaranty InsuranceBIG Transaction Loss Summary
As of December 31, 2012
BIG Categories (1)
BIG 1 BIG 2 BIG 3Total
BIG, Net
Effect ofConsolidating
FG VIEs TotalGross Ceded Gross Ceded Gross Ceded(dollars in millions)
Number of risks(2) 163 (66) 76 (22) 131 (41) 370 — 370Remaining weighted-average contractperiod (in years) 10.2 9.2 10.6 15.1 9.0 6.0 10.0 — 10.0
Outstanding exposure:
Principal $ 9,462 $ (1,533) $ 2,248 $ (132) $ 6,024 $ (481) $ 15,588 $ — $ 15,588Interest 4,475 (591) 1,357 (127) 1,881 (117) 6,878 — 6,878
Total(3) $ 13,937 $ (2,124) $ 3,605 $ (259) $ 7,905 $ (598) $ 22,466 $ — $ 22,466Expected cash outflows(inflows) $ 1,914 $ (687) $ 863 $ (58) $ 2,720 $ (146) $ 4,606 $ (738) $ 3,868
Potential recoveries(4) (2,356) 677 (509) 18 (1,911) 117 (3,964) 798 (3,166)Subtotal (442) (10) 354 (40) 809 (29) 642 60 702Discount 12 8 (107) 14 (216) 2 (287) 36 (251)
Present value of expectedcash flows $ (430) $ (2) $ 247 $ (26) $ 593 $ (27) $ 355 $ 96 $ 451Deferred premiumrevenue $ 265 $ (32) $ 227 $ (15) $ 604 $ (83) $ 966 $ (251) $ 715
Reserves (salvage)(5) $ (485) $ 10 $ 102 $ (18) $ 347 $ (3) $ (47) $ 153 $ 106
0345r4.indd 194 3/19/14 3:28 PM

193
____________________
(1) In third quarter 2013, the Company adjusted its approach to assigning internal ratings. See "Refinement of Approachto Internal Credit Ratings and Surveillance Categories" in Note 3, Outstanding Exposure. This approach is reflected inthe "Financial Guaranty Insurance BIG Transaction Loss Summary" tables as of both December 31, 2013 andDecember 31, 2012.
(2) A risk represents the aggregate of the financial guaranty policies that share the same revenue source for purposes ofmaking Debt Service payments. The ceded number of risks represents the number of risks for which the Companyceded a portion of its exposure.
(3) Includes BIG amounts related to FG VIEs.
(4) Includes estimated future recoveries for breaches of R&W as well as excess spread, and draws on HELOCs.
(5) See table “Components of net reserves (salvage).”
Ratings Impact on Financial Guaranty Business
A downgrade of one of the Company’s insurance subsidiaries may result in increased claims under financial guarantiesissued by the Company, if the insured obligors were unable to pay.
For example, AGM has issued financial guaranty insurance policies in respect of the obligations of municipal obligorsunder interest rate swaps. Under the swaps, AGM insures periodic payments owed by the municipal obligors to the bankcounterparties. Under certain of the swaps, AGM also insures termination payments that may be owed by the municipalobligors to the bank counterparties. If (i) AGM has been downgraded below the rating trigger set forth in a swap under which ithas insured the termination payment, which rating trigger varies on a transaction by transaction basis; (ii) the municipal obligorhas the right to cure by, but has failed in, posting collateral, replacing AGM or otherwise curing the downgrade of AGM; (iii)the transaction documents include as a condition that an event of default or termination event with respect to the municipalobligor has occurred, such as the rating of the municipal obligor being downgraded past a specified level, and such conditionhas been met; (iv) the bank counterparty has elected to terminate the swap; (v) a termination payment is payable by themunicipal obligor; and (vi) the municipal obligor has failed to make the termination payment payable by it, then AGM wouldbe required to pay the termination payment due by the municipal obligor, in an amount not to exceed the policy limit set forthin the financial guaranty insurance policy. At AGM's current financial strength ratings, if the conditions giving rise to theobligation of AGM to make a termination payment under the swap termination policies were all satisfied, then AGM could payclaims in an amount not exceeding approximately $84 million in respect of such termination payments. Taking intoconsideration whether the rating of the municipal obligor is below any applicable specified trigger, if the financial strengthratings of AGM were further downgraded below "A" by S&P or below "A2" by Moody's, and the conditions giving rise to theobligation of AGM to make a payment under the swap policies were all satisfied, then AGM could pay claims in an additionalamount not exceeding approximately $261 million in respect of such termination payments.
As another example, with respect to variable rate demand obligations ("VRDOs") for which a bank has agreed toprovide a liquidity facility, a downgrade of AGM or AGC may provide the bank with the right to give notice to bondholdersthat the bank will terminate the liquidity facility, causing the bondholders to tender their bonds to the bank. Bonds held by thebank accrue interest at a “bank bond rate” that is higher than the rate otherwise borne by the bond (typically the prime rate plus2.00% — 3.00%, and capped at the lesser of 25% and the maximum legal limit). In the event the bank holds such bonds forlonger than a specified period of time, usually 90-180 days, the bank has the right to demand accelerated repayment of bondprincipal, usually through payment of equal installments over a period of not less than five years. In the event that a municipalobligor is unable to pay interest accruing at the bank bond rate or to pay principal during the shortened amortization period, aclaim could be submitted to AGM or AGC under its financial guaranty policy. As of December 31, 2013, AGM and AGC hadinsured approximately $5.9 billion net par of VRDOs, of which approximately $0.4 billion of net par constituted VRDOsissued by municipal obligors rated BBB- or lower pursuant to the Company’s internal rating. The specific terms relating to therating levels that trigger the bank’s termination right, and whether it is triggered by a downgrade by one rating agency or adowngrade by all rating agencies then rating the insurer, vary depending on the transaction.
In addition, AGM may be required to pay claims in respect of AGMH’s former financial products business if DexiaSA and its affiliates do not comply with their obligations following a downgrade of the financial strength rating of AGM. Mostof the guaranteed investment contracts ("GICs") insured by AGM allow for the withdrawal of GIC funds in the event of a
0345r4.indd 195 3/19/14 3:28 PM

194
downgrade of AGM, unless the relevant GIC issuer posts collateral or otherwise enhances its credit. Most GICs insured byAGM allow for the termination of the GIC contract and a withdrawal of GIC funds at the option of the GIC holder in the eventof a downgrade of AGM below a specified threshold, generally below A- by S&P or A3 by Moody’s, with no right of the GICissuer to avoid such withdrawal by posting collateral or otherwise enhancing its credit. Each GIC contract stipulates thethresholds below which the GIC issuer must post eligible collateral, along with the types of securities eligible for posting andthe collateralization percentage applicable to each security type. These collateralization percentages range from 100% of theGIC balance for cash posted as collateral to, typically, 108% for asset-backed securities. If the entire aggregate accreted GICbalance of approximately $2.7 billion as of December 31, 2013 were terminated, the assets of the GIC issuers (which had anaggregate accreted principal of approximately $4.0 billion and an aggregate market value of approximately $3.8 billion) wouldbe sufficient to fund the withdrawal of the GIC funds.
8. Fair Value Measurement
The Company carries a significant portion of its assets and liabilities at fair value. Fair value is defined as the price thatwould be received to sell an asset or paid to transfer a liability in an orderly transaction between market participants at themeasurement date (i.e., exit price). The price represents the price available in the principal market for the asset or liability. If thereis no principal market, then the price is based on a hypothetical market that maximizes the value received for an asset orminimizes the amount paid for a liability (i.e., the most advantageous market).
Fair value is based on quoted market prices, where available. If listed prices or quotes are not available, fair value isbased on either internally developed models that primarily use, as inputs, market-based or independently sourced marketparameters, including but not limited to yield curves, interest rates and debt prices or with the assistance of an independent third-party using a discounted cash flow approach and the third party’s proprietary pricing models. In addition to market information,models also incorporate transaction details, such as maturity of the instrument and contractual features designed to reduce theCompany’s credit exposure, such as collateral rights as applicable.
Valuation adjustments may be made to ensure that financial instruments are recorded at fair value. These adjustmentsinclude amounts to reflect counterparty credit quality, the Company’s creditworthiness and constraints on liquidity. As marketsand products develop and the pricing for certain products becomes more or less transparent, the Company may refine itsmethodologies and assumptions. During 2013, no changes were made to the Company’s valuation models that had or areexpected to have, a material impact on the Company’s consolidated balance sheets or statements of operations and comprehensiveincome.
The Company’s methods for calculating fair value produce a fair value calculation that may not be indicative of netrealizable value or reflective of future fair values. The use of different methodologies or assumptions to determine fair value ofcertain financial instruments could result in a different estimate of fair value at the reporting date.
The fair value hierarchy is determined based on whether the inputs to valuation techniques used to measure fair value areobservable or unobservable. Observable inputs reflect market data obtained from independent sources, while unobservable inputsreflect Company estimates of market assumptions. The fair value hierarchy prioritizes model inputs into three broad levels asfollows, with Level 1 being the highest and Level 3 the lowest. An asset or liability’s categorization within the fair valuehierarchy is based on the lowest level of significant input to its valuation.
Level 1—Quoted prices for identical instruments in active markets. The Company generally defines an active market asa market in which trading occurs at significant volumes. Active markets generally are more liquid and have a lower bid-askspread than an inactive market.
Level 2—Quoted prices for similar instruments in active markets; quoted prices for identical or similar instruments inmarkets that are not active; and observable inputs other than quoted prices, such as interest rates or yield curves and other inputsderived from or corroborated by observable market inputs.
Level 3—Model derived valuations in which one or more significant inputs or significant value drivers areunobservable. Financial instruments are considered Level 3 when their values are determined using pricing models, discountedcash flow methodologies or similar techniques and at least one significant model assumption or input is unobservable. Level 3financial instruments also include those for which the determination of fair value requires significant management judgment orestimation.
0345r4.indd 196 3/19/14 3:28 PM

195
Transfers between Levels 1, 2 and 3 are recognized at the end of the period when the transfer occurs. The Companyreviews the classification between Levels 1, 2 and 3 quarterly to determine whether a transfer is necessary. During the periodspresented, there were no transfers between Level 1, 2 and 3.
Measured and Carried at Fair Value
Fixed-Maturity Securities and Short-term Investments
The fair value of bonds in the investment portfolio is generally based on prices received from third party pricing servicesor alternative pricing sources with reasonable levels of price transparency. The pricing services prepare estimates of fair valuemeasurements using their pricing models, which include available relevant market information, benchmark curves, benchmarkingof like securities, sector groupings, and matrix pricing. Additional valuation factors that can be taken into account are nominalspreads and liquidity adjustments. The pricing services evaluate each asset class based on relevant market and credit information,perceived market movements, and sector news. The market inputs used in the pricing evaluation, listed in the approximate orderof priority include: benchmark yields, reported trades, broker/dealer quotes, issuer spreads, two-sided markets, benchmarksecurities, bids, offers, reference data and industry and economic events. Benchmark yields have in many cases taken priorityover reported trades for securities that trade less frequently or those that are distressed trades, and therefore may not be indicativeof the market. The extent of the use of each input is dependent on the asset class and the market conditions. Given the asset class,the priority of the use of inputs may change or some market inputs may not be relevant. Additionally, the valuation of fixedmaturity investments is more subjective when markets are less liquid due to the lack of market based inputs, which may increasethe potential that the estimated fair value of an investment is not reflective of the price at which an actual transaction would occur.
Short-term investments, that are traded in active markets, are classified within Level 1 in the fair value hierarchy and arebased on quoted market prices. Securities such as discount notes are classified within Level 2 because these securities aretypically not actively traded due to their approaching maturity and, as such, their cost approximates fair value.
Prices determined based on models where at least one significant model assumption or input is unobservable, areconsidered to be Level 3 in the fair value hierarchy. At December 31, 2013, the Company used models to price 36 fixed-maturitysecurities, which was 6.9% or $730 million of the Company’s fixed-maturity securities and short-term investments at fair value.Certain level 3 securities were priced with the assistance of an independent third-party. The pricing is based on a discounted cashflow approach using the third-party’s proprietary pricing models. The models use inputs such as projected prepayment speeds;severity assumptions; recovery lag assumptions; estimated default rates (determined on the basis of an analysis of collateralattributes, historical collateral performance, borrower profiles and other features relevant to the evaluation of collateral creditquality); home price depreciation/appreciation rates based on macroeconomic forecasts and recent trading activity. The yield usedto discount the projected cash flows is determined by reviewing various attributes of the bond including collateral type, weightedaverage life, sensitivity to losses, vintage, and convexity, in conjunction with market data on comparable securities. Significantchanges to any of these inputs could materially change the expected timing of cash flows within these securities which is asignificant factor in determining the fair value of the securities.
Other Invested Assets
Other invested assets includes investments carried and measured at fair value on a recurring basis of $121 million andnon-recurring basis of $6 million. Assets carried on a recurring basis primarily comprise certain short-term investments and fixed-maturity securities classified as trading and are Level 2 in the fair value hierarchy.
Other Assets
Committed Capital Securities
The fair value of committed capital securities ("CCS"), which is recorded in “other assets” on the consolidated balancesheets, represents the difference between the present value of remaining expected put option premium payments under AGC’sCCS (the “AGC CCS”) and AGM’s Committed Preferred Trust Securities (the “AGM CPS”) agreements, and the estimatedpresent value that the Company would hypothetically have to pay currently for a comparable security (see Note 17, Long-TermDebt and Credit Facilities). The AGC CCS and AGM CPS are carried at fair value with changes in fair value recorded on theconsolidated statement of operations. The estimated current cost of the Company’s CCS is based on several factors, includingbroker-dealer quotes for the outstanding securities, the U.S. dollar forward swap curve, London Interbank Offered Rate("LIBOR") curve projections and the term the securities are estimated to remain outstanding.
0345r4.indd 197 3/19/14 3:28 PM

196
Supplemental Executive Retirement Plans
The Company classifies the fair value measurement of the assets of the Company's various supplemental executiveretirement plans as either Level 1 or Level 2. The fair value of these assets is valued based on the observable published dailyvalues of the underlying mutual fund included in the aforementioned plans (Level 1) or based upon the net asset value of thefunds if a published daily value is not available (Level 2).
Financial Guaranty Contracts Accounted for as Credit Derivatives
The Company’s credit derivatives consist primarily of insured CDS contracts, and also include interest rate swaps thatfall under derivative accounting standards requiring fair value accounting through the statement of operations. The Company doesnot enter into CDS with the intent to trade these contracts and the Company may not unilaterally terminate a CDS contract absentan event of default or termination event that entitles the Company to terminate (except for certain rare circumstances); however,the Company has mutually agreed with various counterparties to terminate certain CDS transactions. Such terminations generallyare completed for an amount that approximates the present value of future premiums, not at fair value.
The terms of the Company’s CDS contracts differ from more standardized credit derivative contracts sold by companiesoutside the financial guaranty industry. The non-standard terms include the absence of collateral support agreements or immediatesettlement provisions. In addition, the Company employs relatively high attachment points and does not exit derivatives it sells orpurchases for credit protection purposes, except under specific circumstances such as mutual agreements with counterparties toterminate certain CDS contracts. Management considers the non-standard terms of its credit derivative contracts in determiningthe fair value of these contracts.
Due to the lack of quoted prices and other observable inputs for its instruments or for similar instruments, the Companydetermines the fair value of its credit derivative contracts primarily through internally developed, proprietary modeling that usesboth observable and unobservable market data inputs to derive an estimate of the fair value of the Company's contracts inprincipal markets (see "Assumptions and Inputs"). There is no established market where financial guaranty insured creditderivatives are actively traded, therefore, management has determined that the exit market for the Company’s credit derivatives isa hypothetical one based on its entry market. Management has tracked the historical pricing of the Company’s deals to establishhistorical price points in the hypothetical market that are used in the fair value calculation. These contracts are classified asLevel 3 in the fair value hierarchy since there is reliance on at least one unobservable input deemed significant to the valuationmodel, most importantly the Company’s estimate of the value of the non-standard terms and conditions of its credit derivativecontracts and of the Company’s current credit standing.
The Company’s models and the related assumptions are continuously reevaluated by management and enhanced, asappropriate, based upon improvements in modeling techniques and availability of more timely and relevant market information.
The fair value of the Company’s credit derivative contracts represents the difference between the present value ofremaining premiums the Company expects to receive or pay and the estimated present value of premiums that a financialguarantor of comparable credit-worthiness would hypothetically charge or pay for the same protection. The fair value of theCompany’s credit derivatives depends on a number of factors, including notional amount of the contract, expected term, creditspreads, changes in interest rates, the credit ratings of referenced entities, the Company’s own credit risk and remainingcontractual cash flows. The expected remaining contractual premium cash flows are the most readily observable inputs since theyare based on the CDS contractual terms. Credit spreads capture the effect of recovery rates and performance of underlying assetsof these contracts, among other factors. Consistent with the previous several years, market conditions at December 31, 2013 weresuch that market prices of the Company’s CDS contracts were not available.
Management considers factors such as current prices charged for similar agreements, when available, performance ofunderlying assets, life of the instrument, and the nature and extent of activity in the financial guaranty credit derivativemarketplace. The assumptions that management uses to determine the fair value may change in the future due to marketconditions. Due to the inherent uncertainties of the assumptions used in the valuation models, actual experience may differ fromthe estimates reflected in the Company’s consolidated financial statements and the differences may be material.
Assumptions and Inputs
Listed below are various inputs and assumptions that are key to the establishment of the Company’s fair value for CDScontracts.
· Gross spread.
0345r4.indd 198 3/19/14 3:28 PM

197
· The allocation of gross spread among:
• the profit the originator, usually an investment bank, realizes for putting the deal together and funding thetransaction (“bank profit”);
• premiums paid to the Company for the Company’s credit protection provided (“net spread”); and
• the cost of CDS protection purchased by the originator to hedge their counterparty credit risk exposure tothe Company (“hedge cost”).
· The weighted average life which is based on future expected premium cash flows and Debt Service schedules.
· The rates used to discount future expected premium cash flows which ranged from 0.21% to 3.88% at December 31,2013 and 0.21% to 2.81% at December 31, 2012.
The Company obtains gross spreads on its outstanding contracts from market data sources published by third parties(e.g. dealer spread tables for the collateral similar to assets within the Company’s transactions), as well as collateral-specificspreads provided by trustees or obtained from market sources. If observable market credit spreads are not available or reliable forthe underlying reference obligations, then market indices are used that most closely resemble the underlying referenceobligations, considering asset class, credit quality rating and maturity of the underlying reference obligations. These indices areadjusted to reflect the non-standard terms of the Company’s CDS contracts. Market sources determine credit spreads byreviewing new issuance pricing for specific asset classes and receiving price quotes from their trading desks for the specific assetin question. Management validates these quotes by cross-referencing quotes received from one market source against quotesreceived from another market source to ensure reasonableness. In addition, the Company compares the relative change in pricequotes received from one quarter to another, with the relative change experienced by published market indices for a specific assetclass. Collateral specific spreads obtained from third-party, independent market sources are un-published spread quotes frommarket participants or market traders who are not trustees. Management obtains this information as the result of directcommunication with these sources as part of the valuation process.
With respect to CDS transactions for which there is an expected claim payment within the next twelve months, theallocation of gross spread reflects a higher allocation to the cost of credit rather than the bank profit component. In the currentmarket, it is assumed that a bank would be willing to accept a lower profit on distressed transactions in order to remove thesetransactions from its financial statements.
The following spread hierarchy is utilized in determining which source of gross spread to use, with the rule being to useCDS spreads where available. If not available, CDS spreads are either interpolated or extrapolated based on similar transactionsor market indices.
· Actual collateral specific credit spreads (if up-to-date and reliable market-based spreads are available).
· Deals priced or closed during a specific quarter within a specific asset class and specific rating.
· Credit spreads interpolated based upon market indices.
· Credit spreads provided by the counterparty of the CDS.
· Credit spreads extrapolated based upon transactions of similar asset classes, similar ratings, and similar time tomaturity.
0345r4.indd 199 3/19/14 3:28 PM

198
Information by Credit Spread Type (1)
As ofDecember 31, 2013
As ofDecember 31, 2012
Based on actual collateral specific spreads 6% 6%Based on market indices 88% 88%Provided by the CDS counterparty 6% 6%
Total 100% 100% ____________________(1) Based on par.
Over time the data inputs can change as new sources become available or existing sources are discontinued or are nolonger considered to be the most appropriate. It is the Company’s objective to move to higher levels on the hierarchy wheneverpossible, but it is sometimes necessary to move to lower priority inputs because of discontinued data sources or management’sassessment that the higher priority inputs are no longer considered to be representative of market spreads for a given type ofcollateral. This can happen, for example, if transaction volume changes such that a previously used spread index is no longerviewed as being reflective of current market levels.
The Company interpolates a curve based on the historical relationship between the premium the Company receives whena credit derivative is closed to the daily closing price of the market index related to the specific asset class and rating of the deal.This curve indicates expected credit spreads at each indicative level on the related market index. For transactions with uniqueterms or characteristics where no price quotes are available, management extrapolates credit spreads based on an alternativetransaction for which the Company has received a spread quote from one of the first three sources within the Company’s spreadhierarchy. This alternative transaction will be within the same asset class, have similar underlying assets, similar credit ratings,and similar time to maturity. The Company then calculates the percentage of relative spread change quarter over quarter for thealternative transaction. This percentage change is then applied to the historical credit spread of the transaction for which no pricequote was received in order to calculate the transactions’ current spread. Counterparties determine credit spreads by reviewingnew issuance pricing for specific asset classes and receiving price quotes from their trading desks for the specific asset inquestion. These quotes are validated by cross-referencing quotes received from one market source with those quotes receivedfrom another market source to ensure reasonableness.
The premium the Company receives is referred to as the “net spread.” The Company’s pricing model takes into accountnot only how credit spreads on risks that it assumes affect pricing, but also how the Company’s own credit spread affects thepricing of its deals. The Company’s own credit risk is factored into the determination of net spread based on the impact ofchanges in the quoted market price for credit protection bought on the Company, as reflected by quoted market prices on CDSreferencing AGC or AGM. For credit spreads on the Company’s name the Company obtains the quoted price of CDS contractstraded on AGC and AGM from market data sources published by third parties. The cost to acquire CDS protection referencingAGC or AGM affects the amount of spread on CDS deals that the Company retains and, hence, their fair value. As the cost toacquire CDS protection referencing AGC or AGM increases, the amount of premium the Company retains on a deal generallydecreases. As the cost to acquire CDS protection referencing AGC or AGM decreases, the amount of premium the Companyretains on a deal generally increases. In the Company’s valuation model, the premium the Company captures is not permitted togo below the minimum rate that the Company would currently charge to assume similar risks. This assumption can have theeffect of mitigating the amount of unrealized gains that are recognized on certain CDS contracts. Given the current marketconditions and the Company’s own credit spreads, approximately 61% and 71% based on number of deals of the Company'sCDS contracts are fair valued using this minimum premium as of as of December 31, 2013 and December 31, 2012, respectively.The Company corroborates the assumptions in its fair value model, including the portion of exposure to AGC and AGM hedgedby its counterparties, with independent third parties each reporting period. The current level of AGC’s and AGM’s own creditspread has resulted in the bank or deal originator hedging a significant portion of its exposure to AGC and AGM. This reduces theamount of contractual cash flows AGC and AGM can capture as premium for selling its protection.
The amount of premium a financial guaranty insurance market participant can demand is inversely related to the cost ofcredit protection on the insurance company as measured by market credit spreads assuming all other assumptions remainconstant. This is because the buyers of credit protection typically hedge a portion of their risk to the financial guarantor, due to thefact that the contractual terms of the Company's contracts typically do not require the posting of collateral by the guarantor. Theextent of the hedge depends on the types of instruments insured and the current market conditions.
0345r4.indd 200 3/19/14 3:28 PM

199
A fair value resulting in a credit derivative asset on protection sold is the result of contractual cash inflows on in-forcedeals in excess of what a hypothetical financial guarantor could receive if it sold protection on the same risk as of the reportingdate. If the Company were able to freely exchange these contracts (i.e., assuming its contracts did not contain proscriptions ontransfer and there was a viable exchange market), it would be able to realize a gain representing the difference between the highercontractual premiums to which it is entitled and the current market premiums for a similar contract. The Company determines thefair value of its CDS contracts by applying the difference between the current net spread and the contractual net spread for theremaining duration of each contract to the notional value of its CDS contracts.
Example
Following is an example of how changes in gross spreads, the Company’s own credit spread and the cost to buyprotection on the Company affect the amount of premium the Company can demand for its credit protection. The assumptionsused in these examples are hypothetical amounts. Scenario 1 represents the market conditions in effect on the transaction date andScenario 2 represents market conditions at a subsequent reporting date.
Scenario 1 Scenario 2bps % of Total bps % of Total
Original gross spread/cash bond price (in bps) 185 500Bank profit (in bps) 115 62% 50 10%Hedge cost (in bps) 30 16% 440 88%The Company premium received per annum (in bps) 40 22% 10 2%
In Scenario 1, the gross spread is 185 basis points. The bank or deal originator captures 115 basis points of the originalgross spread and hedges 10% of its exposure to AGC, when the CDS spread on AGC was 300 basis points (300 basis points× 10% = 30 basis points). Under this scenario the Company received premium of 40 basis points, or 22% of the gross spread.
In Scenario 2, the gross spread is 500 basis points. The bank or deal originator captures 50 basis points of the originalgross spread and hedges 25% of its exposure to AGC, when the CDS spread on AGC was 1,760 basis points (1,760 basis points× 25% = 440 basis points). Under this scenario the Company would receive premium of 10 basis points, or 2% of the grossspread. Due to the increased cost to hedge AGC’s name, the amount of profit the bank would expect to receive, and the premiumthe Company would expect to receive decline significantly.
In this example, the contractual cash flows (the Company premium received per annum above) exceed the amount amarket participant would require the Company to pay in today’s market to accept its obligations under the CDS contract, thusresulting in an asset. This credit derivative asset is equal to the difference in premium rates discounted at the correspondingLIBOR over the weighted average remaining life of the contract.
Strengths and Weaknesses of Model
The Company’s credit derivative valuation model, like any financial model, has certain strengths and weaknesses.
The primary strengths of the Company’s CDS modeling techniques are:
· The model takes into account the transaction structure and the key drivers of market value. The transaction structureincludes par insured, weighted average life, level of subordination and composition of collateral.
· The model maximizes the use of market-driven inputs whenever they are available. The key inputs to the model aremarket-based spreads for the collateral, and the credit rating of referenced entities. These are viewed by theCompany to be the key parameters that affect fair value of the transaction.
· The model is a consistent approach to valuing positions. The Company has developed a hierarchy for market-basedspread inputs that helps mitigate the degree of subjectivity during periods of high illiquidity.
The primary weaknesses of the Company’s CDS modeling techniques are:
· There is no exit market or actual exit transactions. Therefore the Company’s exit market is a hypothetical one basedon the Company’s entry market.
0345r4.indd 201 3/19/14 3:28 PM

200
· There is a very limited market in which to validate the reasonableness of the fair values developed by theCompany’s model.
· At December 31, 2013 and 2012, the markets for the inputs to the model were highly illiquid, which impacts theirreliability.
· Due to the non-standard terms under which the Company enters into derivative contracts, the fair value of its creditderivatives may not reflect the same prices observed in an actively traded market of credit derivatives that do notcontain terms and conditions similar to those observed in the financial guaranty market.
These contracts were classified as Level 3 in the fair value hierarchy because there is a reliance on at least oneunobservable input deemed significant to the valuation model, most significantly the Company's estimate of the value of non-standard terms and conditions of its credit derivative contracts and amount of protection purchased on AGC or AGM's name.
Fair Value Option on FG VIEs’ Assets and Liabilities
The Company elected the fair value option for all the FG VIEs’ assets and liabilities. See Note 10, Consolidation ofVariable Interest Entities.
The FG VIEs that are consolidated by the Company issued securities collateralized by HELOCs, first lien and secondlien RMBS, subprime automobile loans, and other loans and receivables. The lowest level input that is significant to the fair valuemeasurement of these assets and liabilities was a Level 3 input (i.e. unobservable), therefore management classified them asLevel 3 in the fair value hierarchy. Prices were generally determined with the assistance of an independent third-party. Thepricing is based on a discounted cash flow approach and the third-party’s proprietary pricing models. The models to price the FGVIEs’ liabilities used, where appropriate, inputs such as estimated prepayment speeds; market values of the assets thatcollateralize the securities; estimated default rates (determined on the basis of an analysis of collateral attributes, historicalcollateral performance, borrower profiles and other features relevant to the evaluation of collateral credit quality); yields impliedby market prices for similar securities; house price depreciation/appreciation rates based on macroeconomic forecasts and, forthose liabilities insured by the Company, the benefit from the Company’s insurance policy guaranteeing the timely payment ofprincipal and interest for the FG VIE tranches insured by the Company, taking into account the timing of the potential default andthe Company’s own credit rating. The third-party also utilizes an internal model to determine an appropriate yield at which todiscount the cash flows of the security, by factoring in collateral types, weighted-average lives, and other structural attributesspecific to the security being priced. The expected yield is further calibrated by utilizing algorithm’s designed to aggregate marketcolor, received by the third-party, on comparable bonds.
The fair value of the Company’s FG VIE assets is sensitive to changes related to estimated prepayment speeds; estimateddefault rates (determined on the basis of an analysis of collateral attributes such as: historical collateral performance, borrowerprofiles and other features relevant to the evaluation of collateral credit quality); discount rates implied by market prices forsimilar securities; and house price depreciation/appreciation rates based on macroeconomic forecasts. Significant changes tosome of these inputs could materially change the market value of the FG VIE’s assets and the implied collateral losses within thetransaction. In general, the fair value of the FG VIE asset is most sensitive to changes in the projected collateral losses, where anincrease in collateral losses typically leads to a decrease in the fair value of FG VIE assets, while a decrease in collateral lossestypically leads to an increase in the fair value of FG VIE assets. These factors also directly impact the fair value of the Company’sFG VIE liabilities.
The fair value of the Company’s FG VIE liabilities is also sensitive to changes relating to estimated prepayment speeds;market values of the underlying assets; estimated default rates (determined on the basis of an analysis of collateral attributes suchas: historical collateral performance, borrower profiles and other features relevant to the evaluation of collateral credit quality);discount rates implied by market prices for similar securities; and house price depreciation/appreciation rates based onmacroeconomic forecasts. In addition, the Company’s FG VIE liabilities with recourse are also sensitive to changes in theCompany’s implied credit worthiness. Significant changes to any of these inputs could materially change the timing of expectedlosses within the insured transaction which is a significant factor in determining the implied benefit from the Company’sinsurance policy guaranteeing the timely payment of principal and interest for the tranches of debt issued by the FG VIE that isinsured by the Company. In general, extending the timing of expected loss payments by the Company into the future typicallyleads to a decrease in the value of the Company’s insurance and a decrease in the fair value of the Company’s FG VIE liabilitieswith recourse, while a shortening of the timing of expected loss payments by the Company typically leads to an increase in thevalue of the Company’s insurance and an increase in the fair value of the Company’s FG VIE liabilities with recourse.
0345r4.indd 202 3/19/14 3:28 PM

201
Not Carried at Fair Value
Financial Guaranty Insurance Contracts
The fair value of the Company’s financial guaranty contracts accounted for as insurance was based on management’sestimate of what a similarly rated financial guaranty insurance company would demand to acquire the Company’s in-force bookof financial guaranty insurance business. This amount was based on the pricing assumptions management has observed forportfolio transfers that have occurred in the financial guaranty market and included adjustments to the carrying value of unearnedpremium reserve for stressed losses, ceding commissions and return on capital. The significant inputs were not readilyobservable. The Company accordingly classified this fair value measurement as Level 3.
Long-Term Debt
The Company’s long-term debt, excluding notes payable, is valued by broker-dealers using third party independentpricing sources and standard market conventions. The market conventions utilize market quotations, market transactions for theCompany’s comparable instruments, and to a lesser extent, similar instruments in the broader insurance industry. The fair valuemeasurement was classified as Level 2 in the fair value hierarchy.
The fair value of the notes payable that are recorded within long-term debt was determined by calculating the presentvalue of the expected cash flows. The Company determines discounted future cash flows using market driven discount rates and avariety of assumptions, including LIBOR curve projections, prepayment and default assumptions, and AGM CDS spreads. Thefair value measurement was classified as Level 3 in the fair value hierarchy because there is a reliance on significantunobservable inputs to the valuation model, including the discount rates, prepayment and default assumptions, loss severity andrecovery on delinquent loans.
Other Invested Assets
The fair value of the other invested assets, which primarily consist of assets acquired in refinancing transactions, wasdetermined by calculating the present value of the expected cash flows. The Company uses a market approach to determinediscounted future cash flows using market driven discount rates and a variety of assumptions, including LIBOR curve projectionsand prepayment and default assumptions. The fair value measurement was classified as Level 3 in the fair value hierarchybecause there is a reliance on significant unobservable inputs to the valuation model, including the discount rates, prepayment anddefault assumptions, loss severity and recovery on delinquent loans.
Other Assets and Other Liabilities
The Company’s other assets and other liabilities consist predominantly of accrued interest, receivables for securities soldand payables for securities purchased, the carrying values of which approximate fair value.
0345r4.indd 203 3/19/14 3:28 PM

202
Financial Instruments Carried at Fair Value
Amounts recorded at fair value in the Company’s financial statements are included in the tables below.
Fair Value Hierarchy of Financial Instruments Carried at Fair ValueAs of December 31, 2013
Fair Value HierarchyFair Value Level 1 Level 2 Level 3
(in millions)
Assets:Investment portfolio, available-for-sale:
Fixed-maturity securitiesObligations of state and political subdivisions $ 5,079 $ — $ 5,043 $ 36U.S. government and agencies 700 — 700 —Corporate securities 1,340 — 1,204 136Mortgage-backed securities:
RMBS 1,122 — 832 290CMBS 549 — 549 —
Asset-backed securities 608 — 340 268Foreign government securities 313 — 313 —
Total fixed-maturity securities 9,711 — 8,981 730Short-term investments 904 506 398 —Other invested assets(1) 127 — 119 8Credit derivative assets 94 — — 94FG VIEs’ assets, at fair value 2,565 — — 2,565Other assets(2) 84 27 11 46
Total assets carried at fair value $ 13,485 $ 533 $ 9,509 $ 3,443Liabilities:
Credit derivative liabilities $ 1,787 $ — $ — $ 1,787FG VIEs’ liabilities with recourse, at fair value 1,790 — — 1,790FG VIEs’ liabilities without recourse, at fair value 1,081 — — 1,081
Total liabilities carried at fair value $ 4,658 $ — $ — $ 4,658
0345r4.indd 204 3/19/14 3:29 PM

203
Fair Value Hierarchy of Financial Instruments Carried at Fair ValueAs of December 31, 2012
Fair Value HierarchyFair Value Level 1 Level 2 Level 3
(in millions)
Assets:Investment portfolio, available-for-sale:
Fixed-maturity securitiesObligations of state and political subdivisions $ 5,631 $ — $ 5,596 $ 35U.S. government and agencies 794 — 794 —Corporate securities 1,010 — 1,010 —Mortgage-backed securities:
RMBS 1,266 — 1,047 219CMBS 520 — 520 —
Asset-backed securities 531 — 225 306Foreign government securities 304 — 304 —
Total fixed-maturity securities 10,056 — 9,496 560Short-term investments 817 446 371 —Other invested assets(1) 120 — 112 8Credit derivative assets 141 — — 141FG VIEs’ assets, at fair value 2,688 — — 2,688Other assets(2) 65 24 5 36
Total assets carried at fair value $ 13,887 $ 470 $ 9,984 $ 3,433Liabilities:
Credit derivative liabilities $ 1,934 $ — $ — $ 1,934FG VIEs’ liabilities with recourse, at fair value 2,090 — — 2,090FG VIEs’ liabilities without recourse, at fair value 1,051 — — 1,051
Total liabilities carried at fair value $ 5,075 $ — $ — $ 5,075 ____________________(1) Includes mortgage loans that are recorded at fair value on a non-recurring basis. At December 31, 2013 and
December 31, 2012, such investments were carried at their fair value of $6 million and $7 million, respectively.
(2) Includes fair value of CCS and supplemental executive retirement plan assets.
0345r4.indd 205 3/19/14 3:29 PM

204
Changes in Level 3 Fair Value Measurements
The table below presents a roll forward of the Company’s Level 3 financial instruments carried at fair value on arecurring basis during the years ended December 31, 2013 and 2012.
Fair Value Level 3 RollforwardRecurring Basis
Year Ended December 31, 2013
Fixed-Maturity Securities
Obligationsof State and
PoliticalSubdivisions
CorporateSecurities RMBS
Asset-Backed
Securities
OtherInvestedAssets
FG VIEs’Assets at
Fair ValueOtherAssets
CreditDerivative
Asset(Liability),
net(5)
FG VIEs'Liabilities
withRecourse,
at FairValue
FG VIEs’Liabilitieswithout
Recourse,at FairValue
(in millions)
Fair value as ofDecember 31, 2012 $ 35 $ — $ 219 $ 306 $ 1 $ 2,688 $ 36 $ (1,793) $ (2,090) $ (1,051)
Total pretax realizedand unrealizedgains/(losses)recorded in:(1)
Net income (loss) (8) (2) 4 (2) 13 (2) 67 (2) (1) (7) 686 (3) 10 (4) 65 (6) (166) (3) (225) (3)
Othercomprehensiveincome (loss) 13 5 26 (43) 2 — — — — —
Purchases — 130 (8) 86 80 2 (8) — — — — —Settlements (4) (3) (54) (142) (2) (663) — 35 343 168FG VIEconsolidations — — — — — 48 — — (12) (37)
FG VIEdeconsolidations — — — — — (194) — — 135 64Fair value as ofDecember 31, 2013 $ 36 $ 136 $ 290 $ 268 $ 2 $ 2,565 $ 46 $ (1,693) $ (1,790) $ (1,081)Change in unrealizedgains/(losses) relatedto financialinstruments held asof December 31,2013 $ 14 $ 5 $ 27 $ (20) $ 2 $ 623 $ 10 $ (139) $ (169) $ (326)
0345r4.indd 206 3/19/14 3:29 PM

205
Fair Value Level 3 RollforwardRecurring Basis
Year Ended December 31, 2012
Fixed-Maturity Securities
Obligations ofstate andpolitical
subdivisions RMBS
AssetBacked
Securities
OtherInvestedAssets
FG VIEs’Assets at
Fair ValueOtherAssets
CreditDerivative
Asset(Liability),
net(5)
FG VIEs’Liabilities
withRecourse,
at Fair Value
FG VIEs’Liabilities
withoutRecourse,
at FairValue
(in millions)
Fair value as ofDecember 31, 2011 $ 10 $ 134 $ 235 $ 2 $ 2,819 $ 54 $ (1,304) $ (2,397) (1,061)
Total pretax realized andunrealized gains/(losses)recorded in:(1)
Net income (loss) 1 (2) 11 (2) 29 (2) 0 (7) 399 (3) (18) (4) (585) (6) (276) (3) (195) (3)
Other comprehensiveincome (loss) (10) 16 30 (1) — — — — —
Purchases 34 108 40 — — — — — —Settlements — (50) (28) — (545) — 96 519 205
FG VIE consolidations — — — — 15 — — (18) —
FG VIE elimination — — — — — — — 82 —
Fair value as ofDecember 31, 2012 $ 35 $ 219 $ 306 $ 1 $ 2,688 $ 36 $ (1,793) $ (2,090) (1,051)
Change in unrealizedgains/(losses) relatedto financial instrumentsheld as of December 31,2012 $ (10) $ 11 $ 33 $ (1) $ 674 $ (18) $ (480) $ (608) 50
___________________(1) Realized and unrealized gains (losses) from changes in values of Level 3 financial instruments represent gains (losses)
from changes in values of those financial instruments only for the periods in which the instruments were classified asLevel 3.
(2) Included in net realized investment gains (losses) and net investment income.
(3) Included in fair value gains (losses) on FG VIEs.
(4) Recorded in fair value gains (losses) on CCS.
(5) Represents net position of credit derivatives. The consolidated balance sheet presents gross assets and liabilities based onnet counterparty exposure.
(6) Reported in net change in fair value of credit derivatives.
(7) Reported in other income.
(8) Non cash transaction.
0345r4.indd 207 3/19/14 3:29 PM

206
Level 3 Fair Value Disclosures
Quantitative Information About Level 3 Fair Value InputsAt December 31, 2013
Financial Instrument Description
Fair Value atDecember 31,
2013(in millions)ValuationTechnique
Significant UnobservableInputs Range
Assets:
Fixed-maturity securities:Obligations of state andpolitical subdivisions
$ 36 Discounted Rate of inflation 1.0% - 3.0%cash flow Cash flow receipts 0.5% - 60.9%
Discount rates 4.6% 9.0%Collateral recovery
period 1 month - 10 years
Corporate securities 136 Discounted Yield 8.3%cash flow
RMBS 290 Discounted CPR 1.0% - 15.8%cash flow CDR 5.0% - 25.8%
Severity 48.1% - 102.5%Yield 2.5% - 9.4%
Asset-backed securities:Investor owned utility 141 Discounted
cash flowLiquidation value (in
millions) $195 - $245Years to liquidation 0 years - 3 yearsCollateral recovery
period 12 months 6 yearsDiscount factor 15.3%
XXX life insurancetransactions
127 Discounted Yield 12.5%cash flow
Other invested assets 8 Discountedcash flow
Discount for lack ofliquidity 10.0% - 20.0%
Recovery ondelinquent loans 20.0% - 60.0%
Default rates 1.0% - 10.0%Loss severity 40.0% - 90.0%
Prepayment speeds 6.0% - 15.0%
FG VIEs’ assets, at fair value 2,565 Discounted CPR 0.3% - 11.8%cash flow CDR 3.0% - 25.8%
Loss severity 37.5% - 102.0%Yield 3.5% - 10.2%
0345r4.indd 208 3/19/14 3:29 PM

207
Financial Instrument Description
Fair Value atDecember 31, 2013
(in millions)ValuationTechnique
Significant Unobservable Inputs Range
Other assets 46 Discountedcash flow
Quotes from thirdparty pricing $47 - $53Term (years) 5 years
Liabilities:Credit derivative liabilities, net (1,693) Discounted Year 1 loss estimates 0.0% - 48.0%
cash flow Hedge cost (in bps) 46.3 - 525.0Bank profit (in bps) 1.0 - 1,418.5
Internal floor (in bps) 7.0 - 100.0Internal credit rating AAA - BIG
FG VIEs’ liabilities, at fair value (2,871) Discounted CPR 0.3% - 11.8%cash flow CDR 3.0% - 25.8%
Loss severity 37.5% - 102.0%Yield 3.5% - 10.2%
0345r4.indd 209 3/19/14 3:29 PM

208
Quantitative Information About Level 3 Fair Value InputsAt December 31, 2012
Financial Instrument Description
Fair Value atDecember 31,
2012(in millions)ValuationTechnique
Significant UnobservableInputs Range
Assets:
Fixed-maturity securities:Obligations of state andpolitical subdivisions
$ 35 Discounted Rate of inflation 1.0% - 3.0%cash flow Cash flow receipts 4.9% - 85.8%
Discount rates 4.3% 9.0%Collateral recovery
period 1 month - 43 years
RMBS 219 Discounted CPR 0.8% - 7.5%cash flow CDR 4.4% - 28.6%
Severity 48.1% - 102.8%Yield 3.5% - 12.8%
Asset-backed securities:Whole businesssecuritization
63 Discountedcash flow
Annual gross revenueprojections (in
millions) $54 - $96Value of primaryfinancial guaranty
policy 43.8%Liquidity discount 5.0% - 20.0%
Investor owned utility 186 Discountedcash flow
Liquidation value (inmillions) $212 - $242
Years to liquidation 0 years - 3 yearsDiscount factor 15.3%
XXX life insurancetransactions
57 Discounted Yield 12.5%cash flow
Other invested assets 8 Discountedcash flow
Discount for lack ofliquidity 10.0% - 20.0%
Recovery ondelinquent loans 20.0% - 60.0%
Default rates 1.0% - 12.0%Loss severity 40.0% - 90.0%
Prepayment speeds 6.0% - 15.0%
FG VIEs’ assets, at fair value 2,688 Discounted CPR 0.5% - 10.9%cash flow CDR 3.0% - 28.6%
Loss severity 37.5% - 103.8%Yield 4.5% - 20.0%
0345r4.indd 210 3/19/14 3:29 PM

209
Financial Instrument Description
Fair Value atDecember 31, 2012
(in millions)ValuationTechnique
Significant Unobservable Inputs Range
Other assets 36 Discountedcash flow
Quotes from thirdparty pricing $38 - $51Term (years) 3 years
Liabilities:Credit derivative liabilities, net (1,793) Discounted Year 1 loss estimates 0.0% - 58.7%
cash flow Hedge cost (in bps) 64.2 - 678.4Bank profit (in bps) 1.0 - 1,312.9
Internal floor (in bps) 7.0 - 60.0Internal credit rating AAA - BIG
FG VIEs’ liabilities, at fair value (3,141) Discounted CPR 0.5% - 10.9%cash flow CDR 3.0% - 28.6%
Loss severity 37.5% - 103.8%Yield 4.5% - 20.0%
The carrying amount and estimated fair value of the Company’s financial instruments are presented in the followingtable.
Fair Value of Financial Instruments
As ofDecember 31, 2013
As ofDecember 31, 2012
CarryingAmount
EstimatedFair Value
CarryingAmount
EstimatedFair Value
(in millions)Assets:
Fixed-maturity securities $ 9,711 $ 9,711 $ 10,056 $ 10,056Short-term investments 904 904 817 817Other invested assets 147 155 177 182Credit derivative assets 94 94 141 141FG VIEs’ assets, at fair value 2,565 2,565 2,688 2,688Other assets 179 179 166 166
Liabilities:Financial guaranty insurance contracts(1) 3,783 5,128 3,918 6,537Long-term debt 816 970 836 1,091Credit derivative liabilities 1,787 1,787 1,934 1,934FG VIEs’ liabilities with recourse, at fair value 1,790 1,790 2,090 2,090FG VIEs’ liabilities without recourse, at fair value 1,081 1,081 1,051 1,051Other liabilities 36 36 47 47
____________________(1) Carrying amount includes the assets and liabilities related to financial guaranty insurance contract premiums, losses, and
salvage and subrogation and other recoverables net of reinsurance.
0345r4.indd 211 3/19/14 3:29 PM

210
9. Financial Guaranty Contracts Accounted for as Credit Derivatives
Accounting Policy
Credit derivatives are recorded at fair value. Changes in fair value are recorded in “net change in fair value of creditderivatives” on the consolidated statement of operations. Realized gains and other settlements on credit derivatives includecredit derivative premiums received and receivable for credit protection the Company has sold under its insured CDS contracts,premiums paid and payable for credit protection the Company has purchased, contractual claims paid and payable and receivedand receivable related to insured credit events under these contracts, ceding commissions expense or income and realized gainsor losses related to their early termination. Net unrealized gains and losses on credit derivatives represent the adjustments forchanges in fair value in excess of realized gains and other settlements. Fair value of credit derivatives is reflected as either netassets or net liabilities determined on a contract by contract basis in the Company's consolidated balance sheets. See Note 8,Fair Value Measurement, for a discussion on the fair value methodology for credit derivatives.
Credit Derivatives
The Company has a portfolio of financial guaranty contracts that meet the definition of a derivative in accordance withGAAP (primarily CDS). Until the Company ceased selling credit protection through credit derivative contracts in the beginningof 2009, following the issuance of regulatory guidelines that limited the terms under which the credit protection could be sold,management considered these agreements to be a normal part of its financial guaranty business. The potential capital or marginrequirements that may apply under the Dodd-Frank Act contributed to the decision of the Company not to sell new creditprotection through CDS in the foreseeable future.
Credit derivative transactions are governed by ISDA documentation and have different characteristics from financialguaranty insurance contracts. For example, the Company’s control rights with respect to a reference obligation under a creditderivative may be more limited than when the Company issues a financial guaranty insurance contract. In addition, while theCompany’s exposure under credit derivatives, like the Company’s exposure under financial guaranty insurance contracts, hasbeen generally for as long as the reference obligation remains outstanding, unlike financial guaranty contracts, a creditderivative may be terminated for a breach of the ISDA documentation or other specific events. A loss payment is made onlyupon the occurrence of one or more defined credit events with respect to the referenced securities or loans. A credit event maybe a non-payment event such as a failure to pay, bankruptcy or restructuring, as negotiated by the parties to the credit derivativetransactions. If events of default or termination events specified in the credit derivative documentation were to occur, the non-defaulting or the non-affected party, which may be either the Company or the counterparty, depending upon the circumstances,may decide to terminate a credit derivative prior to maturity. The Company may be required to make a termination payment toits swap counterparty upon such termination. The Company may not unilaterally terminate a CDS contract; however, theCompany on occasion has mutually agreed with various counterparties to terminate certain CDS transactions.
Credit Derivative Net Par Outstanding by Sector
The estimated remaining weighted average life of credit derivatives was 4.1 years at December 31, 2013 and 3.7 yearsat December 31, 2012. The components of the Company’s credit derivative net par outstanding are presented below.
0345r4.indd 212 3/19/14 3:29 PM

211
Credit DerivativesSubordination and Ratings
As of December 31, 2013 As of December 31, 2012
Asset TypeNet Par
OutstandingOriginal
Subordination(1)Current
Subordination(1)
WeightedAverageCreditRating
Net ParOutstanding
OriginalSubordination(1)
CurrentSubordination(1)
WeightedAverageCreditRating
(dollars in millions)
Pooled corporateobligations:
Collateralized loanobligation/collateral bond obligations $ 19,323 32.4% 34.0% AAA $ 29,142 32.8% 33.3% AAA
Synthetic investmentgrade pooledcorporate 9,754 21.6 20.0 AAA 9,658 21.6 19.7 AAASynthetic high yieldpooled corporate 2,690 47.2 41.1 AAA 3,626 35.0 30.3 AAA
TruPS CDOs 3,554 45.5 32.9 BB+ 4,099 46.5 32.7 BB
Market value CDOsof corporateobligations 2,000 24.4 30.5 AAA 3,595 30.1 32.0 AAA
Total pooled corporateobligations 37,321 31.5 30.6 AAA 50,120 31.7 30.4 AAA
U.S. RMBS:
Option ARM and Alt-A first lien 2,609 19.2 8.6 BB- 3,381 20.2 10.4 B+Subprime first lien 2,930 30.5 51.9 AA- 3,494 29.8 52.6 A+
Prime first lien 264 10.9 3.2 CCC 333 10.9 5.2 BClosed end secondlien and HELOCs 23 — — B+ 49 — — B-
Total U.S. RMBS 5,826 24.4 30.1 BBB 7,257 24.2 30.4 BBB
CMBS 3,744 33.5 42.5 AAA 4,094 33.3 41.8 AAAOther 7,591 — — A- 9,310 — — A
Total $ 54,482 AA+ $ 70,781 AA+
____________________(1) Represents the sum of subordinate tranches and over-collateralization and does not include any benefit from excess
interest collections that may be used to absorb losses.
Except for TruPS CDOs, the Company’s exposure to pooled corporate obligations is highly diversified in terms ofobligors and industries. Most pooled corporate transactions are structured to limit exposure to any given obligor and industry.The majority of the Company’s pooled corporate exposure consists of collateralized loan obligation (“CLO”) or syntheticpooled corporate obligations. Most of these CLOs have an average obligor size of less than 1% of the total transaction andtypically restrict the maximum exposure to any one industry to approximately 10%. The Company’s exposure also benefitsfrom embedded credit enhancement in the transactions which allows a transaction to sustain a certain level of losses in theunderlying collateral, further insulating the Company from industry specific concentrations of credit risk on these deals.
The Company’s TruPS CDO asset pools are generally less diversified by obligors and industries than the typical CLOasset pool. Also, the underlying collateral in TruPS CDOs consists primarily of subordinated debt instruments such as TruPSissued by bank holding companies and similar instruments issued by insurance companies, REITs and other real estate relatedissuers while CLOs typically contain primarily senior secured obligations. However, to mitigate these risks TruPS CDOs weretypically structured with higher levels of embedded credit enhancement than typical CLOs.
The Company’s exposure to “Other” CDS contracts is also highly diversified. It includes $2.5 billion of exposure totwo pooled infrastructure transactions comprising diversified pools of international infrastructure project transactions and loansto regulated utilities. These pools were all structured with underlying credit enhancement sufficient for the Company to attachat AAA levels at origination. The remaining $5.1 billion of exposure in “Other” CDS contracts comprises numerous dealsacross various asset classes, such as commercial receivables, international RMBS, infrastructure, regulated utilities andconsumer receivables. Of the total net par outstanding in the "Other" sector, $0.5 billion is rated BIG.
0345r4.indd 213 3/19/14 3:29 PM

212
Distribution of Credit Derivative Net Par Outstanding by Internal Rating
As of December 31, 2013 As of December 31, 2012
RatingsNet Par
Outstanding % of TotalNet Par
Outstanding % of Total(dollars in millions)
AAA $ 38,244 70.2% $ 50,918 71.9%AA 3,648 6.7 3,083 4.4A 3,636 6.7 5,487 7.8BBB 4,161 7.6 4,584 6.4BIG 4,793 8.8 6,709 9.5
Credit derivative net par outstanding $ 54,482 100.0% $ 70,781 100.0%
Net Change in Fair Value of Credit Derivatives Gain (Loss)
Year Ended December 31,
2013 2012 2011(in millions)
Net credit derivative premiums received and receivable $ 119 $ 127 $ 185Net ceding commissions (paid and payable) received and receivable 2 1 3
Realized gains on credit derivatives 121 128 188Terminations 0 (1) (23)Net credit derivative losses (paid and payable) recovered and recoverable (163) (235) (159)
Realized gains (losses) and other settlements on credit derivatives (42) (108) 6Net change in unrealized gains (losses) on credit derivatives(1) 107 (477) 554
Net change in fair value of credit derivatives $ 65 $ (585) $ 560 ____________________(1) Except for net estimated credit impairments (i.e., net expected loss to be paid as discussed in Note 6), the unrealized
gains and losses on credit derivatives are expected to reduce to zero as the exposure approaches its maturity date. Withconsiderable volatility continuing in the market, unrealized gains (losses) on credit derivatives may fluctuatesignificantly in future periods.
The table below sets out the net par amount of credit derivative contracts that the Company and its counterpartiesagreed to terminate on a consensual basis.
Net Par and Accelerations of Credit Derivative Revenuesfrom Terminations of CDS Contracts
Year Ended December 31,
2013 2012 2011(in millions)
Net par of terminated CDS contracts $ 4,054 $ 2,264 $ 11,543Accelerations of credit derivative revenues 21 3 25
In 2013, in addition to the agreements to terminate CDS transactions discussed above, in connection with lossmitigation efforts, the Company terminated a CDS transaction that referenced a film securitization after paying the counterparty$120 million which was recorded in realized gains (losses) and other settlements on credit derivatives, with a correspondingrelease of the unrealized loss recorded in unrealized gains (losses) on credit derivatives of $127 million for a net change in fairvalue of credit derivatives of $7 million.
0345r4.indd 214 3/19/14 3:29 PM

213
Net Change in Unrealized Gains (Losses)on Credit Derivatives
By Sector
Year Ended December 31,Asset Type 2013 2012 2011
(in millions)Pooled corporate obligations $ (32) $ 59 $ 39U.S. RMBS (69) (551) 381CMBS 0 2 11Other (1) 208 13 123
Total $ 107 $ (477) $ 554 ____________________(1) “Other” includes all other U.S. and international asset classes, such as commercial receivables, international
infrastructure, international RMBS securities, and pooled infrastructure securities.
During 2013, unrealized fair value gains were generated in the “other” sector primarily as a result of the termination ofa film securitization transaction and a U.K. infrastructure transaction, as well as price improvement on a XXX lifesecuritization transaction. These unrealized gains were partially offset by unrealized fair value losses in the prime first lien, Alt-A, Option ARM and subprime RMBS sectors due to wider implied net spreads. The wider implied net spreads were primarily aresult of the decreased cost to buy protection in AGC’s name as the market cost of AGC’s credit protection decreased. Thesetransactions were pricing above their floor levels (or the minimum rate at which the Company would consider assuming theserisks based on historical experience); therefore when the cost of purchasing CDS protection on AGC, which management refersto as the CDS spread on AGC, decreased the implied spreads that the Company would expect to receive on these transactionsincreased. The cost of AGM’s credit protection also decreased slightly during 2013, but did not lead to significant fair valuelosses, as the majority of AGM policies continue to price at floor levels.
During 2012, U.S. RMBS unrealized fair value losses were generated primarily in the prime first lien, Alt-A, OptionARM and subprime RMBS sectors primarily as a result of the decreased cost to buy protection in AGC's name as the marketcost of AGC's credit protection decreased. These transactions were pricing above their floor levels therefore when the cost ofpurchasing CDS protection on AGC decreased, the implied spreads that the Company would expect to receive on thesetransactions increased. The cost of AGM's credit protection also decreased during 2012, but did not lead to significant fair valuelosses, as the majority of AGM policies continue to price at floor levels. In addition, 2012 included an $85 million unrealizedgain relating to R&W benefits from the agreement with Deutsche Bank.
In 2011, U.S. RMBS unrealized fair value gains were generated primarily in the Option ARM, Alt-A, prime first lienand subprime sectors primarily as a result of the increased cost to buy protection in AGC's name as the market cost of AGC'scredit protection increased. These transactions were pricing above their floor levels; therefore when the cost of purchasing CDSprotection on AGC increased, the implied spreads that the Company would expect to receive on these transactions decreased.The unrealized fair value gain in "other" primarily resulted from tighter implied net spreads on a XXX life securitizationtransaction and a film securitization, which also resulted from the increased cost to buy protection in AGC's name, referencedabove. The cost of AGM's credit protection also increased during the year, but did not lead to significant fair value gains, as themajority of AGM policies continue to price at floor levels.
The impact of changes in credit spreads will vary based upon the volume, tenor, interest rates, and other marketconditions at the time these fair values are determined. In addition, since each transaction has unique collateral and structuralterms, the underlying change in fair value of each transaction may vary considerably. The fair value of credit derivativecontracts also reflects the change in the Company’s own credit cost based on the price to purchase credit protection on AGCand AGM. The Company determines its own credit risk based on quoted CDS prices traded on the Company at each balancesheet date. Generally, a widening of the CDS prices traded on AGC and AGM has an effect of offsetting unrealized losses thatresult from widening general market credit spreads, while a narrowing of the CDS prices traded on AGC and AGM has aneffect of offsetting unrealized gains that result from narrowing general market credit spreads.
0345r4.indd 215 3/19/14 3:29 PM
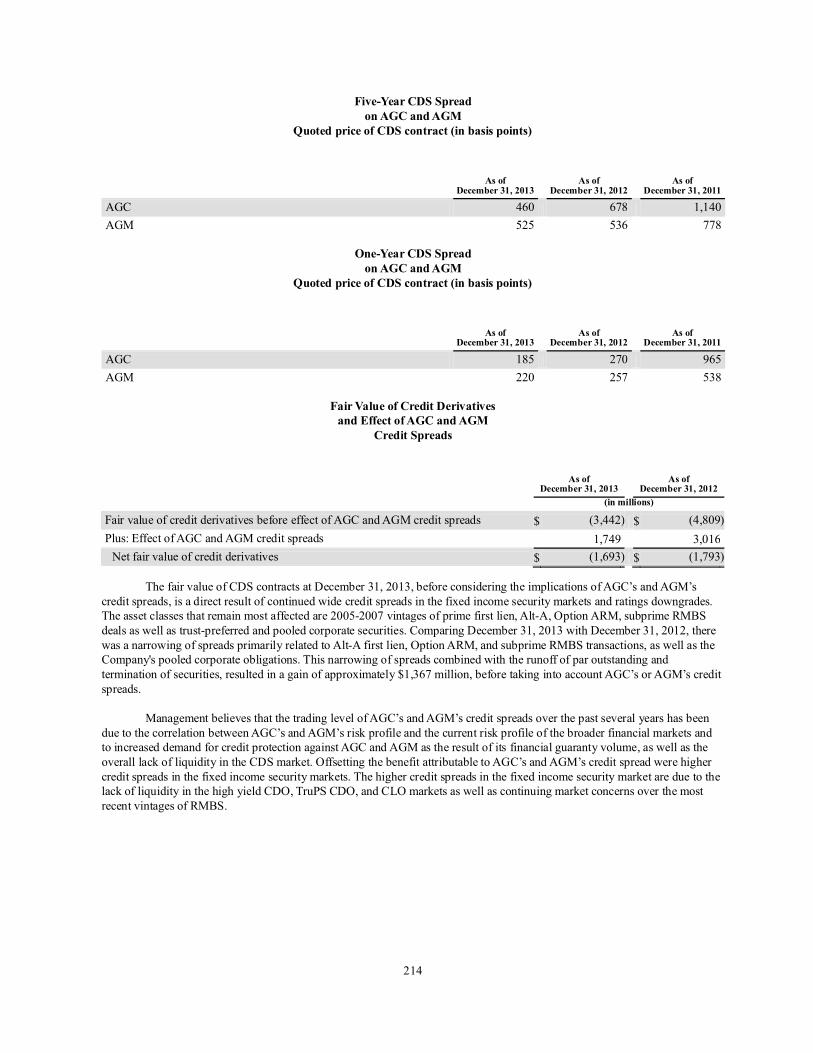
214
Five-Year CDS Spreadon AGC and AGM
Quoted price of CDS contract (in basis points)
As ofDecember 31, 2013
As ofDecember 31, 2012
As ofDecember 31, 2011
AGC 460 678 1,140AGM 525 536 778
One-Year CDS Spreadon AGC and AGM
Quoted price of CDS contract (in basis points)
As ofDecember 31, 2013
As ofDecember 31, 2012
As ofDecember 31, 2011
AGC 185 270 965AGM 220 257 538
Fair Value of Credit Derivativesand Effect of AGC and AGM
Credit Spreads
As ofDecember 31, 2013
As ofDecember 31, 2012
(in millions)
Fair value of credit derivatives before effect of AGC and AGM credit spreads $ (3,442) $ (4,809)Plus: Effect of AGC and AGM credit spreads 1,749 3,016
Net fair value of credit derivatives $ (1,693) $ (1,793)
The fair value of CDS contracts at December 31, 2013, before considering the implications of AGC’s and AGM’scredit spreads, is a direct result of continued wide credit spreads in the fixed income security markets and ratings downgrades.The asset classes that remain most affected are 2005-2007 vintages of prime first lien, Alt-A, Option ARM, subprime RMBSdeals as well as trust-preferred and pooled corporate securities. Comparing December 31, 2013 with December 31, 2012, therewas a narrowing of spreads primarily related to Alt-A first lien, Option ARM, and subprime RMBS transactions, as well as theCompany's pooled corporate obligations. This narrowing of spreads combined with the runoff of par outstanding andtermination of securities, resulted in a gain of approximately $1,367 million, before taking into account AGC’s or AGM’s creditspreads.
Management believes that the trading level of AGC’s and AGM’s credit spreads over the past several years has beendue to the correlation between AGC’s and AGM’s risk profile and the current risk profile of the broader financial markets andto increased demand for credit protection against AGC and AGM as the result of its financial guaranty volume, as well as theoverall lack of liquidity in the CDS market. Offsetting the benefit attributable to AGC’s and AGM’s credit spread were highercredit spreads in the fixed income security markets. The higher credit spreads in the fixed income security market are due to thelack of liquidity in the high yield CDO, TruPS CDO, and CLO markets as well as continuing market concerns over the mostrecent vintages of RMBS.
0345r4.indd 216 3/19/14 3:29 PM

215
The following table presents the fair value and the present value of expected claim payments or recoveries (i.e. netexpected loss to be paid as described in Note 6) for contracts accounted for as derivatives.
Net Fair Value and ExpectedLosses of Credit Derivatives
by Sector
Fair Value of Credit DerivativeAsset (Liability), net
Present Value of Expected Claim(Payments) Recoveries(1)
Asset TypeAs of
December 31, 2013As of
December 31, 2012As of
December 31, 2013As of
December 31, 2012(in millions)
Pooled corporate obligations $ (30) $ 6 $ (35) $ (16)U.S. RMBS (1,308) (1,237) (147) (181)CMBS (2) (2) — —Other (353) (560) 43 (85)
Total $ (1,693) $ (1,793) $ (139) $ (282) ____________________(1) Represents the expected claim payments (recoveries) in excess of the present value of future installment fees to be
received of $45 million as of December 31, 2013 and $43 million as of December 31, 2012. Includes R&W benefit of$180 million as of December 31, 2013 and $237 million as of December 31, 2012.
Ratings Sensitivities of Credit Derivative Contracts
Within the Company’s insured CDS portfolio, the transaction documentation for approximately $1.7 billion in CDSgross par insured as of December 31, 2013 provides that a downgrade of AGC's financial strength rating below BBB- or Baa3would constitute a termination event that would allow the relevant CDS counterparty to terminate the affected transactions. Asof December 31, 2012, such amount was $2.0 billion. If the CDS counterparty elected to terminate the affected transactions,AGC could be required to make a termination payment (or may be entitled to receive a termination payment from the CDScounterparty). The Company does not believe that it can accurately estimate the termination payments AGC could be requiredto make if, as a result of any such downgrade, a CDS counterparty terminated the affected transactions. These payments couldhave a material adverse effect on the Company’s liquidity and financial condition.
The transaction documentation for approximately $10.3 billion in CDS gross par insured as of December 31, 2013requires AGC and Assured Guaranty Re Overseas Ltd. ("AGRO") to post eligible collateral to secure its obligations to makepayments under such contracts. Eligible collateral is generally cash or U.S. government or agency securities; eligible collateralother than cash is valued at a discount to the face amount. For approximately $9.9 billion of such contracts, AGC hasnegotiated caps such that the posting requirement cannot exceed a certain fixed amount, regardless of the mark-to-marketvaluation of the exposure or the financial strength ratings of AGC. For such contracts, AGC need not post on a cash basis morethan $665 million, although the value of the collateral posted may exceed such fixed amount depending on the advance rateagreed with the counterparty for the particular type of collateral posted. For the remaining approximately $347 million of suchcontracts, AGC or AGRO could be required from time to time to post additional collateral without such cap based onmovements in the mark-to-market valuation of the underlying exposure. As of December 31, 2013, the Company was postingapproximately $677 million to secure obligations under its CDS exposure, of which approximately $62 million related to such$347 million of notional. As of December 31, 2012, the Company was posting approximately $728 million, of whichapproximately $68 million related to $400 million of notional where AGC or AGRO could be required to post additionalcollateral based on movements in the mark-to-market valuation of the underlying exposure.
0345r4.indd 217 3/19/14 3:29 PM

216
Sensitivity to Changes in Credit Spread
The following table summarizes the estimated change in fair values on the net balance of the Company’s creditderivative positions assuming immediate parallel shifts in credit spreads on AGC and AGM and on the risks that they bothassume.
Effect of Changes in Credit SpreadAs of December 31, 2013
Credit Spreads(1)
Estimated NetFair Value(Pre-Tax)
Estimated Changein Gain/(Loss)
(Pre-Tax)(in millions)
100% widening in spreads $ (3,499) $ (1,806)50% widening in spreads (2,596) (903)25% widening in spreads (2,145) (452)10% widening in spreads (1,874) (181)Base Scenario (1,693) —10% narrowing in spreads (1,527) 16625% narrowing in spreads (1,276) 41750% narrowing in spreads (860) 833
____________________(1) Includes the effects of spreads on both the underlying asset classes and the Company’s own credit spread.
10. Consolidation of Variable Interest Entities
The Company provides financial guaranties with respect to debt obligations of special purpose entities, includingVIEs. AGC and AGM do not sponsor any VIEs when underwriting third party financial guaranty insurance or credit derivativetransactions, nor has either of them acted as the servicer or collateral manager for any VIE obligations that it insures. Thetransaction structure generally provides certain financial protections to the Company. This financial protection can take severalforms, the most common of which are overcollateralization, first loss protection (or subordination) and excess spread. In thecase of overcollateralization (i.e., the principal amount of the securitized assets exceeds the principal amount of the structuredfinance obligations guaranteed by the Company), the structure allows defaults of the securitized assets before a default isexperienced on the structured finance obligation guaranteed by the Company. In the case of first loss, the financial guarantyinsurance policy only covers a senior layer of losses experienced by multiple obligations issued by special purpose entities,including VIEs. The first loss exposure with respect to the assets is either retained by the seller or sold off in the form of equityor mezzanine debt to other investors. In the case of excess spread, the financial assets contributed to special purpose entities,including VIEs, generate cash flows that are in excess of the interest payments on the debt issued by the special purpose entity.Such excess spread is typically distributed through the transaction’s cash flow waterfall and may be used to create additionalcredit enhancement, applied to redeem debt issued by the special purpose entities, including VIEs (thereby, creating additionalovercollateralization), or distributed to equity or other investors in the transaction.
AGC and AGM are not primarily liable for the debt obligations issued by the VIEs they insure and would only berequired to make payments on these debt obligations in the event that the issuer of such debt obligations defaults on anyprincipal or interest due. AGL’s and its Subsidiaries’ creditors do not have any rights with regard to the collateral supporting thedebt issued by the FG VIEs. Proceeds from sales, maturities, prepayments and interest from such underlying collateral mayonly be used to pay Debt Service on VIE liabilities. Net fair value gains and losses on FG VIEs are expected to reverse to zeroat maturity of the VIE debt, except for net premiums received and net claims paid by AGC or AGM under the financialguaranty insurance contract. The Company’s estimate of expected loss to be paid for FG VIEs is included in Note 6, ExpectedLoss to be Paid.
Accounting Policy
For all years presented, the Company has evaluated whether it was the primary beneficiary of its VIEs. If theCompany concludes that it is the primary beneficiary it is required to consolidate the entire VIE in the Company's financialstatements and eliminate the effects of the financial guaranty insurance contracts issued by AGM and AGC on the consolidatedFG VIEs debt obligations.
0345r4.indd 218 3/19/14 3:29 PM

217
The primary beneficiary of a VIE is the enterprise that has both 1) the power to direct the activities of a VIE that mostsignificantly impact the entity's economic performance; and 2) the obligation to absorb losses of the entity that couldpotentially be significant to the VIE or the right to receive benefits from the entity that could potentially be significant to theVIE. The Company reassesses whether the Company is the primary beneficiary of a VIE on a quarterly basis.
As part of the terms of its financial guaranty contracts, the Company obtains certain protective rights with respect tothe VIE that are triggered by the occurrence of certain events, such as failure to be in compliance with a covenant due to poordeal performance or a deterioration in a servicer or collateral manager's financial condition. At deal inception, the Companytypically is not deemed to control a VIE; however, once a trigger event occurs, the Company's control of the VIE typicallyincreases. The Company continuously evaluates its power to direct the activities that most significantly impact the economicperformance of VIEs that have debt obligations insured by the Company and, accordingly, where the Company is obligated toabsorb VIE losses or receive benefits that could potentially be significant to the VIE. The Company obtains protective rightsunder its insurance contracts that give the Company additional controls over a VIE if there is either deterioration of dealperformance or in the financial health of the deal servicer. The Company is deemed to be the control party under GAAP,typically when its protective rights give it the power to both terminate and replace the deal servicer, which are characteristicsspecific to the Company's financial guaranty contracts. If the protective rights that could make the Company the control partyhave not been triggered, then the VIE is not consolidated. As of December 31, 2013, the Company had issued financialguaranty contracts for approximately 1,000 VIEs that it did not consolidate.
The FG VIEs' liabilities that are insured by the Company are considered to be with recourse, because the Companyguarantees the payment of principal and interest regardless of the performance of the related FG VIEs' assets. FG VIEs'liabilities that are not insured by the Company are considered to be without recourse, because the payment of principal andinterest of these liabilities is wholly dependent on the performance of the FG VIEs' assets.
The Company has limited contractual rights to obtain the financial records of its consolidated FG VIEs. The FG VIEsdo not prepare separate GAAP financial statements; therefore, the Company compiles GAAP financial information for thembased on trustee reports prepared by and received from third parties. Such trustee reports are not available to the Company untilapproximately 30 days after the end of any given period. The time required to perform adequate reconciliations and analyses ofthe information in these trustee reports results in a one quarter lag in reporting the FG VIEs' activities. The Company recordsthe fair value of FG VIE assets and liabilities based on modeled prices. The Company updates the model assumptions eachreporting period for the most recent available information, which incorporates the impact of material events that may haveoccurred since the quarter lag date. Interest income and interest expense are derived from the trustee reports and included in“fair value gains (losses) on FG VIEs” in the consolidated statement of operations. The Company has elected the fair valueoption for assets and liabilities classified as FG VIEs' assets and liabilities because the carrying amount transition method wasnot practical.
The cash flows generated by the FG VIE assets, including R&W recoveries, are classified as cash flows frominvesting activities. Paydowns of FG liabilities are supported by the cash flows generated by FG VIE assets, and for liabilitieswith recourse, possibly claim payments made by AGM or AGC under its financial guaranty insurance contracts. Paydowns ofFG liabilities both with and without recourse are classified as cash flows used in financing activities by the Company. Interestincome, interest expense and other expenses of the FG VIE assets and liabilities are classified as operating cash flows. Claimpayments made by AGC and AGM under the financial guaranty contracts issued to the FG VIEs are eliminated uponconsolidation and therefore such claim payments are treated as paydowns of FG VIE liabilities as a financing activity asopposed to an operating activity of AGM and AGC.
0345r4.indd 219 3/19/14 3:29 PM

218
Consolidated FG VIEs
Number of FG VIE's Consolidated
Year Ended December 31,2013 2012 2011
Beginning of the year 33 33 29Consolidated(1) 11 2 8Deconsolidated(1) (3) — —Matured (1) (2) (4)End of the year 40 33 33
____________________(1) Net loss on consolidation and deconsolidation was $7 million in 2013, $6 million in 2012 and $95 million in 2011,
respectively, and recorded in “fair value gains (losses) on FG VIEs” in the consolidated statement of operations.
The total unpaid principal balance for the FG VIEs’ assets that were over 90 days or more past due was approximately$750 million at December 31, 2013 and $893 million at December 31, 2012. The aggregate unpaid principal of the FG VIEs’assets was approximately $1,940 million greater than the aggregate fair value at December 31, 2013, excluding the effect ofR&W settlements. The aggregate unpaid principal of the FG VIEs’ assets was approximately $2,631 million greater than theaggregate fair value at December 31, 2012, excluding the effect of R&W settlements. The change in the instrument-specificcredit risk of the FG VIEs’ assets for 2013 were gains of $340 million. The change in the instrument-specific credit risk of theFG VIEs’ assets for 2012 were gains of $413 million.
The unpaid principal for FG VIE liabilities with recourse was $2,316 million and $2,808 million as of December 31,2013 and December 31, 2012, respectively. FG VIE liabilities with recourse will mature at various dates ranging from 2025 to2047. The aggregate unpaid principal balance was approximately $1,611 million greater than the aggregate fair value of the FGVIEs’ liabilities as of December 31, 2013.
The table below shows the carrying value of the consolidated FG VIEs’ assets and liabilities in the consolidatedfinancial statements, segregated by the types of assets that collateralize their respective debt obligations.
Consolidated FG VIEsBy Type of Collateral
As of December 31, 2013 As of December 31, 2012
Number ofFG VIEs Assets Liabilities
Number ofFG VIEs Assets Liabilities
(dollars in millions)
With recourse:First lien 25 $ 630 $ 791 14 $ 618 $ 825Second lien 14 460 640 16 633 915Other 1 359 359 3 350 350
Total with recourse 40 1,449 1,790 33 1,601 2,090Without recourse — 1,116 1,081 — 1,087 1,051
Total 40 $ 2,565 $ 2,871 33 $ 2,688 $ 3,141
The consolidation of FG VIEs has a significant effect on net income and shareholder’s equity due to (1) changes in fairvalue gains (losses) on FG VIE assets and liabilities, (2) the elimination of premiums and losses related to the AGC and AGMFG VIE liabilities with recourse and (3) the elimination of investment balances related to the Company’s purchase of AGC andAGM insured FG VIE debt. Upon consolidation of a FG VIE, the related insurance and, if applicable, the related investmentbalances, are considered intercompany transactions and therefore eliminated. Such eliminations are included in the table belowto present the full effect of consolidating FG VIEs.
0345r4.indd 220 3/19/14 3:29 PM

219
Effect of Consolidating FG VIEs on Net Income,Cash Flows From Operating Activities and Shareholders’ Equity
Year Ended December 31,2013 2012 2011
(in millions)Net earned premiums $ (60) $ (153) $ (75)Net investment income (13) (13) (8)Net realized investment gains (losses) 2 4 12Fair value gains (losses) on FG VIEs 346 191 (146)Loss and LAE 21 65 107
Total pretax effect on net income 296 94 (110)Less: tax provision (benefit) 103 32 (38)
Total effect on net income (loss) $ 193 $ 62 $ (72)
Effect of consolidating VIEs on cash flows from operating activities $ (136) $ 166 $ 319
As ofDecember 31, 2013
As ofDecember 31, 2012
(in millions)Effect on shareholders’ equity (decrease) increase $ (172) $ (348)
Fair value gains (losses) on FG VIEs represent the net change in fair value on the consolidated FG VIEs’ assets andliabilities. In 2013, the Company recorded a pre-tax net fair value gain of consolidated FG VIEs of $346 million. The gain wasprimarily driven by R&W benefits received on several VIE assets as a result of settlements with various counterpartiesthroughout the year. These R&W settlements resulted in a gain of approximately $265 million. The remainder of the gain wasdriven by price appreciation on the Company's FG VIE assets during the year resulting from improvements in the underlyingcollateral, as well as large principal paydowns made on the Company's FG VIEs.
In 2012, the Company recorded a pre-tax fair value gain on FG VIEs of $191 million. The majority of this gain,approximately $166 million, is a result of a R&W benefit received on several VIE assets as a result of a settlement withDeutsche Bank that closed in 2012. While prices continued to appreciate during the period on the Company's FG VIE assetsand liabilities, gains in the second half of the year were primarily driven by large principal paydowns made on the Company'sFG VIEs. The 2011 pre-tax fair value losses on consolidated FG VIEs of $146 million were driven by the unrealized loss onconsolidation of eight new VIEs, as well as two existing transactions in which the fair value of the underlying collateraldepreciated, while the price of the wrapped senior bonds was largely unchanged from the prior year.
Non-Consolidated VIEs
To date, the Company’s analyses have indicated that it does not have a controlling financial interest in any other VIEsand, as a result, they are not consolidated in the consolidated financial statements. The Company’s exposure provided throughits financial guaranties with respect to debt obligations of special purpose entities is included within net par outstanding inNote 3, Outstanding Exposure.
11. Investments and Cash
Accounting Policy
The vast majority of the Company's investment portfolio is composed of fixed maturity and short-term investments,classified as available-for-sale at the time of purchase (approximately 98% based on fair value at December 31, 2013), andtherefore carried at fair value. Changes in fair value for other-than-temporarily-impaired ("OTTI") securities are bifurcatedbetween credit losses and non-credit changes in fair value. Credit losses on OTTI securities are recorded in the statement ofoperations and the non-credit component of OTTI securities are recorded in OCI. For securities where the Company has the
0345r4.indd 221 3/19/14 3:29 PM

220
intent to sell or it is more-likely-than-not that it will be required to sell the security before recovery, declines in fair value arerecorded in the consolidated statements of operations.
Credit losses reduce the amortized cost of impaired securities. The amortized cost basis is adjusted for accretion andamortization (using the effective interest method) with a corresponding entry recorded in net investment income.
Realized gains and losses on sales of investments are determined using the specific identification method. Realizedloss includes amounts recorded for other-than-temporary impairments on debt securities and the declines in fair value ofsecurities for which the Company has the intent to sell the security or inability to hold until recovery of amortized cost.
For mortgage�backed securities, and any other holdings for which there is prepayment risk, prepayment assumptionsare evaluated and revised as necessary. Any necessary adjustments due to changes in effective yields and maturities arerecognized in net investment income.
The Company purchases securities that it has insured, and for which it has expected losses to be paid, in order tomitigate the economic effect of insured losses ("loss mitigation bonds"). These securities were purchased at a discount and areaccounted for excluding the effects of the Company’s insurance.
Short-term investments, which are those investments with a maturity of less than one year at time of purchase, arecarried at fair value and include amounts deposited in money market funds.
Other invested assets primarily includes:
• assets acquired in refinancing transactions which are primarily comprised of franchise loans that areevaluated for impairment by assessing the probability of collecting expected cash flows with any impairmentrecorded in realized gain (loss) on investments and any subsequent increases in expected cash flows recordedas an increase in yield over the remaining life,
• trading securities, which are carried at fair value with unrealized gains and losses recorded in net income,
• a 50% equity investment acquired in a restructuring of an insured CDS carried at its proportionate share ofthe underlying entity's U.S. GAAP equity value.
Cash consists of cash on hand and demand deposits. As a result of the lag in reporting FG VIEs, cash and short-terminvestments do not reflect cash outflow to the holders of the debt issued by the FG VIEs for claim payments made by theCompany's insurance subsidiaries to the consolidated FG VIEs until the subsequent reporting period.
Assessment for Other-Than Temporary Impairments
The amount of other-than-temporary-impairment recognized in earnings depends on whether (1) an entity intends tosell the security or (2) it is more-likely-than-not that the entity will be required to sell the security before recovery of itsamortized cost basis. If the Company intends to sell the security, or it is more-likely-than-not that the Company will be requiredto sell the security before recovery of its amortized cost basis, the entire difference between the investment's amortized costbasis and its fair value at the balance sheet date is recorded as a realized loss.
If an entity does not intend to sell the security and it is not more-likely-than-not that the Company will be required tosell the security before recovery of its amortized cost basis, the other-than-temporary-impairment is separated into (1) theamount representing the credit loss and (2) the amount related to all other factors.
The Company has a formal review process to determine other-than-temporary-impairment for securities in itsinvestment portfolio where there is no intent to sell and it is not more-likely-than-not that it will be required to sell the securitybefore recovery. Factors considered when assessing impairment include:
• a decline in the market value of a security by 20% or more below amortized cost for a continuous period of atleast six months;
• a decline in the market value of a security for a continuous period of 12 months;
0345r4.indd 222 3/19/14 3:29 PM

221
• recent credit downgrades of the applicable security or the issuer by rating agencies;
• the financial condition of the applicable issuer;
• whether loss of investment principal is anticipated;
• the impact of foreign exchange rates;
• whether scheduled interest payments are past due; and
• whether the Company has the intent to sell the security prior to its recovery in fair value.
The Company assesses the ability to recover the amortized cost by comparing the net present value of projected futurecash flows with the amortized cost of the security. If the net present value is less than the amortized cost of the investment, another-than-temporary impairment is recorded. The net present value is calculated by discounting the Company's best estimateof projected future cash flows at the effective interest rate implicit in the debt security prior to impairment. The Company'sestimates of projected future cash flows are driven by assumptions regarding probability of default and estimates regardingtiming and amount of recoveries associated with a default. The Company develops these estimates using information based onhistorical experience, credit analysis and market observable data, such as industry analyst reports and forecasts, sector creditratings and other relevant data. For mortgage-backed and asset backed securities, cash flow estimates also include prepaymentand other assumptions regarding the underlying collateral including default rates, recoveries and changes in value. Theassumptions used in these projections requires the use of significant management judgment.
The Company's assessment of a decline in value included management's current assessment of the factors noted above.The Company also seeks advice from its outside investment managers. If that assessment changes in the future, the Companymay ultimately record a loss after having originally concluded that the decline in value was temporary.
Net investment income is a function of the yield that the Company earns on invested assets and the size of theportfolio. The investment yield is a function of market interest rates at the time of investment as well as the type, credit qualityand maturity of the invested assets. Income earned on the investment portfolio managed by third parties declined due to lowerreinvestment rates. Accrued investment income on fixed maturity securities, short-term investments and assets acquired inrefinancing transactions was $93 million and $97 million as of December 31, 2013 and December 31, 2012, respectively.
Income from fixed maturity securities managed by third parties $ 322 $ 346 $ 359Income from internally managed securities:
Fixed maturities 74 60 39Other invested assets 5 6 6
Other 0 1 1Gross investment income 401 413 405
Investment expenses (8) (9) (9)Net investment income $ 393 $ 404 $ 396
0345r4.indd 223 3/19/14 3:29 PM

222
Gross realized gains on available-for-sale securities $ 73 $ 29 $ 29Gross realized gains on other assets in investment portfolio 40 14 8Gross realized losses on available-for-sale securities (12) (23) (6)Gross realized losses on other assets in investment portfolio (7) (2) (4)Other-than-temporary impairment (42) (17) (45)
Net realized investment gains (losses) $ 52 $ 1 $ (18)
The following table presents the roll-forward of the credit losses of fixed maturity securities for which the Companyhas recognized an other-than-temporary-impairment and where the portion of the fair value adjustment related to other factorswas recognized in OCI.
Balance, beginning of period $ 64 $ 47 $ 27Additions for credit losses on securities for which an other-than-temporary-impairment was not previously recognized 18 14 27Eliminations of securities issued by FG VIEs — — (14)Reductions for securities sold during the period (21) — (6)Additions for credit losses on securities for which an other-than-temporary-impairment was previously recognized 19 3 13
Balance, end of period $ 80 $ 64 $ 47
0345r4.indd 224 3/19/14 3:29 PM

223
Fixed Maturity Securities and Short-Term Investmentsby Security Type
As of December 31, 2013
Investment Category
Percentof
Total(1)Amortized
Cost
GrossUnrealized
Gains
GrossUnrealized
Losses
EstimatedFair
Value
AOCI(2)Gain
(Loss) onSecurities
withOTTI
WeightedAverageCreditQuality
(3)(dollars in millions)
Fixed maturity securities:Obligations of state andpolitical subdivisions 47% $ 4,899 $ 219 $ (39) $ 5,079 $ 4 AAU.S. government and agencies 7 674 32 (6) 700 — AA+Corporate securities 13 1,314 44 (18) 1,340 0 AMortgage-backedsecurities(4):
0
RMBS 11 1,160 34 (72) 1,122 (43) ACMBS 5 536 17 (4) 549 — AAA
Asset-backed securities 6 605 10 (7) 608 2 BBB+Foreign government securities 3 300 14 (1) 313 — AA+
Total fixed maturitysecurities 91 9,488 370 (147) 9,711 (37) AA-
Short-term investments 9 904 0 0 904 — AAATotal investment portfolio 100% $ 10,392 $ 370 $ (147) $ 10,615 $ (37) AA-
Fixed Maturity Securities and Short-Term Investmentsby Security Type
As of December 31, 2012
Investment Category
Percentof
Total(1)Amortized
Cost
GrossUnrealized
Gains
GrossUnrealized
Losses
EstimatedFair
Value
AOCIGain
(Loss) onSecurities
withOTTI
WeightedAverageCreditQuality
(3)(dollars in millions)
Fixed maturity securities:Obligations of state andpolitical subdivisions 51% $ 5,153 $ 489 $ (11) $ 5,631 $ 9 AAU.S. government and agencies 7 732 62 0 794 — AA+Corporate securities 9 930 80 0 1,010 0 AA-Mortgage-backedsecurities(4):
RMBS 13 1,281 62 (77) 1,266 (59) A+CMBS 5 482 38 0 520 — AAA
Asset-backed securities 5 482 59 (10) 531 43 BIGForeign government securities 2 286 18 0 304 0 AAA
Total fixed maturitysecurities 92 9,346 808 (98) 10,056 (7) AA-
Short-term investments 8 817 0 0 817 — AAATotal investment portfolio 100% $ 10,163 $ 808 $ (98) $ 10,873 $ (7) AA-
0345r4.indd 225 3/19/14 3:29 PM

224
____________________(1) Based on amortized cost.
(2) Accumulated OCI ("AOCI"). See also Note 21, Other Comprehensive Income.
(3) Ratings in the tables above represent the lower of the Moody’s and S&P classifications except for bonds purchased forloss mitigation or risk management strategies, which use internal ratings classifications. The Company’s portfolioconsists primarily of high-quality, liquid instruments.
(4) Government-agency obligations were approximately 50% of mortgage backed securities as of December 31, 2013 and61% as of December 31, 2012 based on fair value.
The Company’s investment portfolio in tax-exempt and taxable municipal securities includes issuances by a widenumber of municipal authorities across the U.S. and its territories. Securities rated lower than A-/A3 by S&P or Moody’s arenot eligible to be purchased for the Company’s portfolio unless acquired for loss mitigation or risk management strategies.
The following tables present the fair value of the Company’s available-for-sale portfolio of obligations of state andpolitical subdivisions as of December 31, 2013 and December 31, 2012 by state.
Fair Value of Available-for-Sale Portfolio ofObligations of State and Political Subdivisions
As of December 31, 2013 (1)
State
StateGeneral
Obligation
LocalGeneral
Obligation Revenue BondsFair
ValueAmortized
Cost
AverageCreditRating
(in millions)Texas $ 77 $ 299 $ 277 $ 653 $ 629 AANew York 12 58 519 589 575 AACalifornia 32 86 354 472 452 A+Florida 33 59 242 334 318 AA-Illinois 14 70 156 240 234 A+Massachusetts 44 16 147 207 200 AAWashington 31 19 153 203 199 AAArizona — 7 166 173 170 AAMichigan — 28 102 130 125 AA-Georgia 13 18 97 128 128 A+All others 254 228 943 1,425 1,381 AA-
Total $ 510 $ 888 $ 3,156 $ 4,554 $ 4,411 AA-
0345r4.indd 226 3/19/14 3:29 PM

225
Fair Value of Available-for-Sale Portfolio ofObligations of State and Political Subdivisions
As of December 31, 2012 (1)
State
StateGeneral
Obligation
LocalGeneral
Obligation Revenue BondsFair
ValueAmortized
Cost
AverageCreditRating
(in millions)
Texas $ 88 $ 345 $ 342 $ 775 $ 708 AANew York 22 58 593 673 620 AACalifornia 23 77 359 459 425 A+Florida 47 50 259 356 319 AA-Illinois 15 84 188 287 260 A+Massachusetts 42 18 165 225 199 AAWashington 33 40 145 218 200 AAArizona — 8 180 188 171 AAGeorgia 14 20 108 142 132 A+Pennsylvania 68 32 40 140 129 AA-All others 229 248 1,195 1,672 1,533 AA
Total $ 581 $ 980 $ 3,574 $ 5,135 $ 4,696 AA-____________________(1) Excludes $525 million and $496 million as of December 31, 2013 and 2012, respectively, of pre-refunded bonds. The
credit ratings are based on the underlying ratings and do not include any benefit from bond insurance.
The revenue bond portfolio is comprised primarily of essential service revenue bonds issued by transportationauthorities and other utilities, water and sewer authorities, universities and healthcare providers.
Revenue BondsSources of Funds
As of December 31, 2013 As of December 31, 2012
TypeFair
ValueAmortized
CostFair
ValueAmortized
Cost(in millions)
Tax backed $ 708 $ 686 $ 720 $ 656Transportation 642 615 717 646Municipal utilities 500 482 567 519Water and sewer 459 453 567 520Higher education 358 353 430 389Healthcare 289 281 323 296All others 200 192 250 247
Total $ 3,156 $ 3,062 $ 3,574 $ 3,273
The majority of the investment portfolio is managed by four outside managers. The Company has established detailedguidelines regarding credit quality, exposure to a particular sector and exposure to a particular obligor within a sector. Each ofthe portfolio managers perform independent analysis on every municipal security they purchase for the Company’s portfolio.The Company meets with each of its portfolio managers quarterly and reviews all investments with a change in credit rating aswell as any investments on the manager’s watch list of securities with the potential for downgrade.
0345r4.indd 227 3/19/14 3:29 PM

226
The following tables summarize, for all securities in an unrealized loss position, the aggregate fair value and grossunrealized loss by length of time the amounts have continuously been in an unrealized loss position.
Fixed Maturity SecuritiesGross Unrealized Loss by Length of Time
As of December 31, 2013
Less than 12 months 12 months or more Total
Fairvalue
Unrealizedloss
Fairvalue
Unrealizedloss
Fairvalue
Unrealizedloss
(dollars in millions)
Obligations of state andpolitical subdivisions $ 781 $ (39) $ 5 $ 0 $ 786 $ (39)U.S. government and agencies 173 (6) — — 173 (6)Corporate securities 401 (18) 3 0 404 (18)Mortgage-backed securities:
RMBS 414 (21) 186 (51) 600 (72)CMBS 121 (4) — — 121 (4)
Asset-backed securities 196 (2) 42 (5) 238 (7)Foreign government securities 54 (1) 1 0 55 (1)
Total $ 2,140 $ (91) $ 237 $ (56) $ 2,377 $ (147)Number of securities 425 33 458Number of securities withOTTI 13 11 24
Fixed Maturity SecuritiesGross Unrealized Loss by Length of Time
As of December 31, 2012
Less than 12 months 12 months or more Total
Fairvalue
Unrealizedloss
Fairvalue
Unrealizedloss
Fairvalue
Unrealizedloss
(dollars in millions)
Obligations of state andpolitical subdivisions $ 79 $ (11) $ — $ — $ 79 $ (11)U.S. government and agencies 62 0 — — 62 0Corporate securities 25 0 — — 25 0Mortgage-backed securities:
RMBS 108 (19) 121 (58) 229 (77)CMBS 5 0 — — 5 0
Asset-backed securities 16 0 35 (10) 51 (10)Foreign government securities 8 0 — — 8 0
Total $ 303 $ (30) $ 156 $ (68) $ 459 $ (98)Number of securities 58 16 74Number of securities withOTTI 5 6 11
Of the securities in an unrealized loss position for 12 months or more as of December 31, 2013, eleven securities hadunrealized losses greater than 10% of book value. The total unrealized loss for these securities as of December 31, 2013 was$52 million. The Company has determined that the unrealized losses recorded as of December 31, 2013 are yield related andnot the result of other-than-temporary-impairment.
0345r4.indd 228 3/19/14 3:29 PM

227
The amortized cost and estimated fair value of available-for-sale fixed maturity securities by contractual maturity as ofDecember 31, 2013 are shown below. Expected maturities will differ from contractual maturities because borrowers may havethe right to call or prepay obligations with or without call or prepayment penalties.
Distribution of Fixed-Maturity Securitiesby Contractual MaturityAs of December 31, 2013
AmortizedCost
EstimatedFair Value
(in millions)Due within one year $ 272 $ 275Due after one year through five years 1,662 1,734Due after five years through 10 years 2,420 2,505Due after 10 years 3,438 3,526Mortgage-backed securities:
RMBS 1,160 1,122CMBS 536 549
Total $ 9,488 $ 9,711
Under agreements with its cedants and in accordance with statutory requirements, the Company maintains fixedmaturity securities and cash in trust accounts for the benefit of reinsured companies, which amounted to $377 million and $368million as of December 31, 2013 and December 31, 2012, respectively, based on fair value. In addition, to fulfill state licensingrequirements, the Company has placed on deposit eligible securities of $19 million and $27 million as of December 31, 2013and December 31, 2012, respectively, based on fair value.
The fair value of the Company’s pledged securities under credit derivative contracts totaled $677 million and $660million as of December 31, 2013 and December 31, 2012, respectively.
No material investments of the Company were non-income producing for years ended December 31, 2013 and 2012.
Internally Managed Portfolio
The investment portfolio tables shown above include both assets managed externally and internally. In the tablebelow, more detailed information is provided for the component of the total investment portfolio that is internally managed(excluding short term investments). The internally managed portfolio, as defined below, represents approximately 9% of theinvestment portfolio, on a fair value basis as of December 31, 2013. The internally managed portfolio consists primarily of theCompany's investments in securities for (i) loss mitigation purposes, (ii) other risk management purposes and (iii) where theCompany believes a particular security presents an attractive investment opportunity.
One of the Company's strategies for mitigating losses has been to purchase securities it has insured that have expectedlosses, at discounted prices (assets purchased for loss mitigation purposes). In addition, the Company holds other investedassets that were obtained or purchased as part of negotiated settlements with insured counterparties or under the terms of ourfinancial guaranties (other risk management assets).
The Company also purchases obligations and assets that it believes constitute good investment opportunities (the"trading portfolio"). During 2013, the Company purchased $630 million par amount outstanding of such obligations and soldan amount of par equal to $619 million. During 2012, the Company had purchased $782 million par amount outstanding ofsuch obligations and sold $728 million. As of December 31, 2013 and 2012, the Company held $76 million and $65 millionpar amount outstanding of such obligations, respectively.
Additional detail about the types and amounts of securities acquired by the Company for loss mitigation, other riskmanagement and in the trading portfolio is set forth in the table below.
0345r4.indd 229 3/19/14 3:29 PM

228
Internally Managed PortfolioCarrying Value
As of December 31,
2013 2012(in millions)
Assets purchased for loss mitigation purposes:Fixed maturity securities:
Obligations of state and political subdivisions $ 28 $ 23RMBS 284 213Asset-backed securities 127 120
Other invested assets 47 72Other risk management assets:
Fixed maturity securities:Obligations of state and political subdivisions 8 12Corporate Securities 136 —RMBS 37 6Asset-backed securities 141 186
Other 35 49Trading portfolio (other invested assets) 88 91Total $ 931 $ 772
12. Insurance Company Regulatory Requirements
Each of the Company's insurance companies' ability to pay dividends depends, among other things, upon theirfinancial condition, results of operations, cash requirements, compliance with rating agency requirements, and is also subject torestrictions contained in the insurance laws and related regulations of their state of domicile and other states. Financialstatements prepared in accordance with accounting practices prescribed or permitted by local insurance regulatory authoritiesdiffer in certain respects from GAAP.
The Company's U.S. domiciled insurance companies prepare statutory financial statements in accordance withaccounting practices prescribed or permitted by the National Association of Insurance Commissioners (“NAIC”) and theirrespective insurance departments. Prescribed statutory accounting practices are set forth in the NAIC Accounting Practices andProcedures Manual. The Company has no permitted accounting practices on a statutory basis.
AG Re, a Bermuda regulated Class 3B insurer, prepares its statutory financial statements in conformity with theaccounting principles set forth in the Insurance Act 1978, amendments thereto and related regulations.GAAP differs in certainsignificant respects from statutory accounting practices prescribed or permitted by Bermuda insurance regulatory authorities.The principal differences result from the following statutory accounting practices:
• acquisition costs on upfront premiums are charged to operations as incurred rather than over the period thatrelated premiums are earned;
• certain assets designated as “non-admitted assets” are charged directly to statutory surplus but are reflected asassets under GAAP;
• insured CDS are accounted for as insurance contracts rather than as derivative contracts recorded at fair value;
• loss and loss adjustment expenses include those relating to credit default swaps, which are treated as insurancecontracts. Loss reserves on non derivative contracts are net of unearned premium, which is offset by deferredacquisition costs, rather than only unearned premium. Loss reserves on insured CDS are not net of unearnedpremium. Additionally loss reserves include a statutory reserve which includes a discount safety margin andstatutory catastrophe reserve.
0345r4.indd 230 3/19/14 3:29 PM

229
GAAP differs in certain significant respects from U.S. insurance companies' statutory accounting practices prescribedor permitted by insurance regulatory authorities. The principal differences result from the following statutory accountingpractices:
• upfront premiums are earned when related principal and interest have expired rather than earned over theexpected period of coverage;
• acquisition costs are charged to expense as incurred rather than over the period that related premiums are earned;
• a contingency reserve is computed based on statutory requirements;
• certain assets designated as “non-admitted assets” are charged directly to statutory surplus but are reflected asassets under GAAP;
• investments in subsidiaries are carried on the balance sheet on the equity basis, to the extent admissible, ratherthan consolidated with the parent;
• the amount of deferred tax assets that may be admitted is subject to an adjusted surplus threshold and is generallylimited to the lesser of those assets the Company expects to realize within three years of the balance sheet date orfifteen percent of the Company's adjusted surplus. This realization period and surplus percentage is subject tochange based on the amount of adjusted surplus;
• insured CDS are accounted for as insurance contracts rather than as derivative contracts recorded at fair value;
• bonds are generally carried at amortized cost rather than fair value;
• VIEs and refinancing vehicles are not consolidated;
• surplus notes are recognized as surplus rather than as a liability and each payment of principal and interest isrecorded only upon approval of the insurance regulator;
• push-down acquisition accounting is not applicable under statutory accounting practices;
• present value of expected losses are discounted at 5%, recorded when the loss is deemed probable and recordedwithout consideration of the deferred premium revenue as opposed to discounted at the risk free rate at the end ofeach reporting period and only to the extent they exceed deferred premium revenue;
• present value of installment premiums and commissions are not recorded on the balance sheets.
Insurance Regulatory Amounts Reported
As of December 31, Year Ended December 31,2013 2012 2013 2012 2011
(in millions)
U.S. statutory companies:MAC $ 514 $ 77 $ 26 $ 1 $ 0AGC 693 905 211 31 230AGM:
AGM stand-alone 1,733 1,780 340 203 399Assured Guaranty Municipal InsuranceCompany — 791 — 58 197AGM consolidated(1) 1,746 1,785 405 256 632
Bermuda statutory company:AG Re 1,122 1,283 107 117 133
____________________(1) Represents the consolidated amounts of AGM and all of its U.S. and foreign subsidiaries.
0345r4.indd 231 3/19/14 3:29 PM

230
On July 16, 2013, the Company completed a series of transactions that increased the capitalization of MAC to $800million on a statutory basis. The Company does not currently anticipate that MAC will distribute any dividends.
AGM and its subsidiaries Assured Guaranty Municipal Insurance Company ("AGMIC") and Assured Guaranty(Bermuda) Ltd. ("AGBM") terminated the reinsurance pooling agreement pursuant to which AGMIC and AGBM had assumeda quota share percentage of the financial guaranty insurance policies issued by AGM, and AGM reassumed such cededbusiness. Subsequently, AGMIC was merged into AGM, with AGM as the surviving company.
AGBM, which had made a loan of $82.5 million to AGUS, an indirect parent holding company of AGM, received allof the outstanding shares of MAC held by AGUS and cash, in full satisfaction of the principal of and interest on such loan.After AGBM distributed substantially all of its assets, including the MAC shares, to AGM as a dividend, AGM sold AGBM toits affiliate AG Re. Subsequently, AGBM and AG Re merged, with AG Re as the surviving company. The sale of AGBM to,and subsequent merger with, AG Re were each effective as of July 17, 2013.
A new company, MAC Holdings, was formed to own 100% of the outstanding stock of MAC. AGM and its affiliateAGC subscribed for approximately 61% and 39% of the outstanding MAC Holdings common stock, respectively, for whichAGM paid $425 million and AGC paid $275 million, as consideration. The consideration consisted of all of MAC'soutstanding common stock (in the case of AGM), cash and marketable securities.
MAC Holdings then contributed cash and marketable securities having a fair market value sufficient to increaseMAC's policyholders' surplus to approximately $400 million, and purchased a surplus note issued by MAC in the principalamount of $300 million. In addition, AGM purchased a surplus note issued by MAC in the principal amount of $100 million.
Following the increase in MAC's capitalization, AGM ceded par exposure of approximately $87 billion and unearnedpremiums of approximately $468 million to MAC, and AGC ceded par exposure of approximately $24 billion and unearnedpremiums of approximately $249 million to MAC.
In addition, on July 15, 2013, AGM and its wholly-owned subsidiary, Assured Guaranty (Europe) Ltd. (together, the"AGM Group") were notified that the New York State Department of Financial Services ("NYSDFS") does not object to theAGM Group reassuming contingency reserves that they had ceded to AG Re and electing to cease ceding future contingencyreserves to AG Re under the following circumstances:
• The AGM Group may reassume 33% of a contingency reserve base of approximately $250 million (the “NYContingency Reserve Base”) in 2013, after July 16, 2013, the date on which the transactions for the capitalization ofMAC were completed (the “Closing Date”).
• The AGM Group may reassume 50% of the NY Contingency Reserve Base in 2014, no earlier than the one yearanniversary of the Closing Date, with the prior approval of the NYSDFS.
• The AGM Group may reassume the remaining 17% of the NY Contingency Reserve Base in 2015, no earlier than thetwo year anniversary of the Closing Date, with the prior approval of the NYSDFS.
At the same time, AGC was notified that the Maryland Insurance Administration does not object to AGC reassumingcontingency reserves that it had ceded to AG Re and electing to cease ceding future contingency reserves to AG Re under thefollowing circumstances:
• AGC may reassume 33% of a contingency reserve base of approximately $267 million (the “MD ContingencyReserve Base”) in 2013, after the Closing Date.
• AGC may reassume 50% of the MD Contingency Reserve Base in 2014, no earlier than the one year anniversaryof the Closing Date, with the prior approval of the Maryland Insurance Administration (the "MIA") and the NYDFS.
• AGC may reassume the remaining 17% of the MD Contingency Reserve Base in 2015, no earlier than the twoyear anniversary of the Closing Date, with the prior approval of the MIA and the NYSDFS.
0345r4.indd 232 3/19/14 3:29 PM

231
The reassumption of the contingency reserves by the AGM Group and AGC have the effect of increasing contingencyreserves by the amount reassumed and decreasing their policyholders' surpluses by the same amount; there would be no impacton the statutory or rating agency capital of the AGM Group or AGC. The reassumption of contingency reserves by the AGMGroup or AGC permit the release of amounts from the AG Re trust accounts securing AG Re's reinsurance of the AGM Groupand AGC.
In accordance with the above approvals, in the third quarter of 2013, AGM and AGC reassumed 33% of theirrespective contingency reserve bases as discussed above. These reassumptions together permitted the release of assets from theAG Re trust accounts securing AG Re's reinsurance of AGM and AGC by approximately $130 million, after adjusting forincreases in the amounts required to be held in such accounts due to changes in asset values, thereby increasing the Company’sliquidity.
Dividend Restrictions and Capital Requirements
AGM is a New York domiciled insurance company. Under New York insurance law, AGM may pay dividends out of"earned surplus", which is the portion of a company's surplus that represents the net earnings, gains or profits (after deductionof all losses) that have not been distributed to shareholders as dividends or transferred to stated capital or capital surplus, orapplied to other purposes permitted by law, but does not include unrealized appreciation of assets. AGM may pay an ordinarydividend that, together with all dividends paid in the prior 12 months, does not exceed the lesser of 10% of its policyholders'surplus (as of the last annual or quarterly statement filed) or 100% of its adjusted net investment income during that period. Asof December 31, 2013, approximately $10 million was available for distribution of dividends in the first quarter of 2014, aftergiving effect to dividends paid in the prior 12 months. The maximum amount available during 2014 for AGM to pay dividendsto AGMH without regulatory approval, after giving effect to dividends paid in the prior 12 months, will be approximately $173million. AGM did not declare or pay any dividends in 2011 because in connection with the Company's acquisition of AGMH in2009, it had committed to the NY DFS that AGM would not pay any dividends for a period of two years without the priorapproval of the New York Superintendent. This constraint has expired.
AGC is a Maryland domiciled insurance company. Under Maryland's insurance law, AGC may, with prior notice to theMaryland Insurance Commissioner, pay an ordinary dividend that, together with all dividends paid in the prior 12 months, doesnot exceed 10% of its policyholders' surplus (as of the prior December 31) or 100% of its adjusted net investment incomeduring that period. As of December 31, 2013, approximately $2 million was available for distribution of dividends in the firstquarter of 2014, after giving effect to dividends paid in the prior 12 months. The maximum amount available during 2014 forAGC to pay ordinary dividends to AGUS, after giving effect to dividends paid in the prior 12 months, will be approximately$69 million.
As of December 31, 2013, AG Re had unencumbered assets of $238 million. AG Re maintains unencumbered assetsfor general corporate purposes, including the payment of dividends and for placing assets in trust for the benefit of cedants toreflect declines in the market value of previously posted assets or additional ceded reserves. Accordingly, the amount ofunencumbered assets will fluctuate during a given quarter based upon factors including the market value of previously postedassets and additional ceded reserves, if any. AG Re is an insurance company registered and licensed under the Insurance Act1978 of Bermuda, amendments thereto and related regulations. Based on regulatory capital requirements, AG Re currently has$600 million in excess capital and surplus. As a Class 3B insurer, AG Re is restricted from paying dividends or distributingcapital by the following regulatory requirements:
• Dividends shall not exceed outstanding statutory surplus, which is $278 million.
• Dividends on an annual basis shall not exceed 25% of its total statutory capital and statutory surplus (as set out in itsprevious year's financial statements), which is $281 million, unless it files (at least seven days before payment of suchdividends) with the Bermuda Monetary Authority an affidavit stating that it will continue to meet the requiredmargins.
• Capital distributions on an annual basis shall not exceed 15% of its total statutory capital (as set out in its previousyear's financial statements), which is $126 million, unless approval is granted by the Bermuda Monetary Authority.
• Dividends are limited by requirements that the subject company must at all times (i) maintain the minimum solvencymargin and the Company's applicable enhanced capital requirements required under the Insurance Act of 1978 and(ii) have relevant assets in an amount at least equal to 75% of relevant liabilities, both as defined under the InsuranceAct of 1978.
0345r4.indd 233 3/19/14 3:29 PM
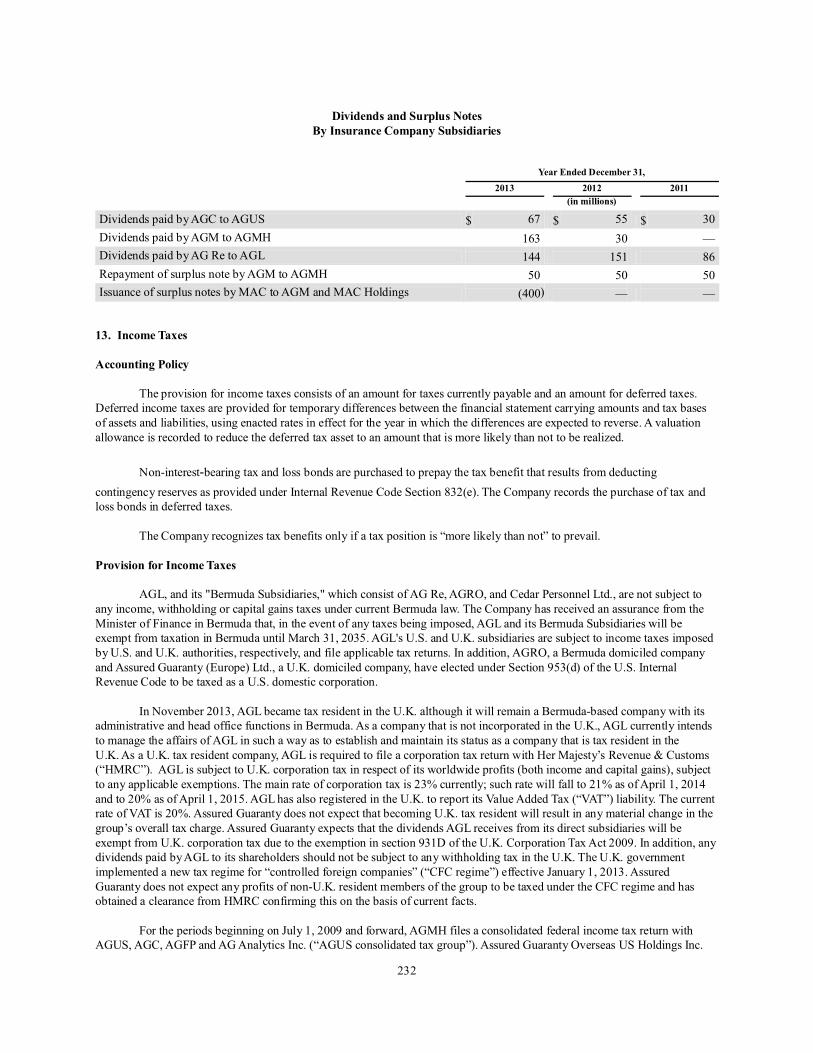
232
Dividends and Surplus NotesBy Insurance Company Subsidiaries
Year Ended December 31,2013 2012 2011
(in millions)
Dividends paid by AGC to AGUS $ 67 $ 55 $ 30Dividends paid by AGM to AGMH 163 30 —Dividends paid by AG Re to AGL 144 151 86Repayment of surplus note by AGM to AGMH 50 50 50Issuance of surplus notes by MAC to AGM and MAC Holdings (400) — —
13. Income Taxes
Accounting Policy
The provision for income taxes consists of an amount for taxes currently payable and an amount for deferred taxes.Deferred income taxes are provided for temporary differences between the financial statement carrying amounts and tax basesof assets and liabilities, using enacted rates in effect for the year in which the differences are expected to reverse. A valuationallowance is recorded to reduce the deferred tax asset to an amount that is more likely than not to be realized.
Non-interest�bearing tax and loss bonds are purchased to prepay the tax benefit that results from deductingcontingency reserves as provided under Internal Revenue Code Section 832(e). The Company records the purchase of tax andloss bonds in deferred taxes.
The Company recognizes tax benefits only if a tax position is “more likely than not” to prevail.
Provision for Income Taxes
AGL, and its "Bermuda Subsidiaries," which consist of AG Re, AGRO, and Cedar Personnel Ltd., are not subject toany income, withholding or capital gains taxes under current Bermuda law. The Company has received an assurance from theMinister of Finance in Bermuda that, in the event of any taxes being imposed, AGL and its Bermuda Subsidiaries will beexempt from taxation in Bermuda until March 31, 2035. AGL's U.S. and U.K. subsidiaries are subject to income taxes imposedby U.S. and U.K. authorities, respectively, and file applicable tax returns. In addition, AGRO, a Bermuda domiciled companyand Assured Guaranty (Europe) Ltd., a U.K. domiciled company, have elected under Section 953(d) of the U.S. InternalRevenue Code to be taxed as a U.S. domestic corporation.
In November 2013, AGL became tax resident in the U.K. although it will remain a Bermuda-based company with itsadministrative and head office functions in Bermuda. As a company that is not incorporated in the U.K., AGL currently intendsto manage the affairs of AGL in such a way as to establish and maintain its status as a company that is tax resident in theU.K. As a U.K. tax resident company, AGL is required to file a corporation tax return with Her Majesty’s Revenue & Customs(“HMRC”). AGL is subject to U.K. corporation tax in respect of its worldwide profits (both income and capital gains), subjectto any applicable exemptions. The main rate of corporation tax is 23% currently; such rate will fall to 21% as of April 1, 2014and to 20% as of April 1, 2015. AGL has also registered in the U.K. to report its Value Added Tax (“VAT”) liability. The currentrate of VAT is 20%. Assured Guaranty does not expect that becoming U.K. tax resident will result in any material change in thegroup’s overall tax charge. Assured Guaranty expects that the dividends AGL receives from its direct subsidiaries will beexempt from U.K. corporation tax due to the exemption in section 931D of the U.K. Corporation Tax Act 2009. In addition, anydividends paid by AGL to its shareholders should not be subject to any withholding tax in the U.K. The U.K. governmentimplemented a new tax regime for “controlled foreign companies” (“CFC regime”) effective January 1, 2013. AssuredGuaranty does not expect any profits of non-U.K. resident members of the group to be taxed under the CFC regime and hasobtained a clearance from HMRC confirming this on the basis of current facts.
For the periods beginning on July 1, 2009 and forward, AGMH files a consolidated federal income tax return withAGUS, AGC, AGFP and AG Analytics Inc. (“AGUS consolidated tax group”). Assured Guaranty Overseas US Holdings Inc.
0345r4.indd 234 3/19/14 3:29 PM

233
and its subsidiaries AGRO, Assured Guaranty Mortgage Insurance Company and AG Intermediary Inc., have historically filedtheir own consolidated federal income tax return. In conjunction with the acquisition of MAC (formerly Municipal andInfrastructure Assurance Corporation) on May 31, 2012, MAC has joined the consolidated federal tax group.
The effective tax rates reflect the proportion of income recognized by each of the Company’s operating subsidiaries,with U.S. subsidiaries taxed at the U.S. marginal corporate income tax rate of 35%, U.K. subsidiaries taxed at the U.K. blendedmarginal corporate tax rate of 23.25% unless subject to U.S. tax by election or as a U.S. controlled foreign corporation, and notaxes for the Company’s Bermuda subsidiaries unless subject to U.S. tax by election or as a U.S. controlled foreign corporation.For periods subsequent to April 1, 2013, the U.K. corporation tax rate has been reduced to 23%, for the period April 1, 2012 toApril 1, 2013 the U.K. corporation tax rate was 24% resulting in a blended tax rate of 23.25% in 2013, prior to April 1, 2012,the U.K. corporation tax rate was 26% resulting in a blended tax rate of 24.5% in 2012 and prior to April 1, 2011, the U.K.corporation rate was 28% resulting in a blended tax rate of 26.5% in 2011. The Company’s overall corporate effective tax ratefluctuates based on the distribution of income across jurisdictions.
A reconciliation of the difference between the provision for income taxes and the expected tax provision at statutoryrates in taxable jurisdictions is presented below.
Effective Tax Rate Reconciliation
Year Ended December 31,
2013 2012 2011(in millions)
Expected tax provision (benefit) at statutory rates in taxable jurisdictions $ 390 $ 76 $ 313Tax-exempt interest (57) (61) (62)Change in liability for uncertain tax positions (2) 2 2Other 3 5 3
Total provision (benefit) for income taxes $ 334 $ 22 $ 256Effective tax rate 29.2% 16.5% 24.9%
The expected tax provision at statutory rates in taxable jurisdictions is calculated as the sum of pretax income in eachjurisdiction multiplied by the statutory tax rate of the jurisdiction by which it will be taxed. Pretax income of the Company’ssubsidiaries which are not U.S. domiciled but are subject to U.S. tax by election or as controlled foreign corporations areincluded at the U.S. statutory tax rate. Where there is a pretax loss in one jurisdiction and pretax income in another, the totalcombined expected tax rate may be higher or lower than any of the individual statutory rates.
The following table presents pretax income and revenue by jurisdiction.
Pretax Income (Loss) by Tax Jurisdiction
Year Ended December 31,2013 2012 2011
(in millions)
United States $ 1,118 $ 218 $ 896Bermuda 27 (86) 133U.K. (3) 0 0
Total $ 1,142 $ 132 $ 1,029
0345r4.indd 235 3/19/14 3:29 PM

234
Revenue by Tax Jurisdiction
Year Ended December 31,2013 2012 2011
(in millions)
United States $ 1,389 $ 875 $ 1,504Bermuda 219 79 301U.K. 0 0 0
Total $ 1,608 $ 954 $ 1,805
Pretax income by jurisdiction may be disproportionate to revenue by jurisdiction to the extent that insurance lossesincurred are disproportionate.
Components of Net Deferred Tax Assets
As of December 31,2013 2012
(in millions)Deferred tax assets:
Unrealized losses on credit derivative financial instruments, net $ 402 $ 425Unearned premium reserves, net 63 109Loss and LAE reserve 134 90Tax and loss bonds 33 15Net operating loss ("NOL") carry forward 5 7Alternative minimum tax credit 90 58Tax basis step-up 5 5Foreign tax credit 37 30FG VIEs 29 179DAC 40 59Investment basis difference 73 82Other 64 48
Total deferred income tax assets 975 1,107Deferred tax liabilities:
Contingency reserves 47 15Public debt 98 100Unrealized appreciation on investments 68 198Unrealized gains on CCS 16 12Market discount 24 42Other 34 19
Total deferred income tax liabilities 287 386Net deferred income tax asset $ 688 $ 721
As of December 31, 2013, the Company had foreign tax credits carried forward of $37 million which expire in 2018through 2021 and had alternative minimum tax credits of $90 million which do not expire. Foreign tax credits of $22 millionare from its acquisition of AGMH, the Internal Revenue Code limits the amount of foreign tax credits available that theCompany may utilize each year. Management believes sufficient future taxable income exists to realize the full benefit of thesetax credits.
As of December 31, 2013, AGRO had a stand-alone NOL of $13 million, compared with $20 million as ofDecember 31, 2012, which is available through 2023 to offset its future U.S. taxable income. AGRO's stand alone NOL maynot offset the income of any other members of AGRO's consolidated group with very limited exceptions and the InternalRevenue Code limits the amounts of NOL that AGRO may utilize each year.
0345r4.indd 236 3/19/14 3:29 PM

235
Valuation Allowance
The Company came to the conclusion that it is more likely than not that its net deferred tax asset will be fully realizedafter weighing all positive and negative evidence available as required under GAAP. The positive evidence that was consideredincluded the cumulative operating income the Company has earned over the last three years, and the significant unearnedpremium income to be included in taxable income. The positive evidence outweighs any negative evidence that exists. As such,the Company believes that no valuation allowance is necessary in connection with this deferred tax asset. The Company willcontinue to analyze the need for a valuation allowance on a quarterly basis.
Audits
AGUS has open tax years with the U.S. Internal Revenue Service (“IRS”) for 2009 forward and is currently underaudit for the 2009-2011 tax years. The IRS concluded its field work with respect to tax years 2006 through 2008 withoutadjustment. On February 20, 2013 the IRS notified AGUS that the Joint Committee on Taxation completed its review of the2006 through 2008 tax years and has accepted the results of the IRS examination without exception. Assured GuarantyOversees US Holdings Inc. has open tax years of 2009 forward. AGMH and subsidiaries have separate open tax years with theIRS of January 1, 2009 through the July 1, 2009 when they joined the AGUS consolidated group. The IRS concluded its fieldwork with respect to tax year 2008 for AGMH and subsidiaries while members of the Dexia Holdings Inc. consolidated taxgroup without adjustment. The Company is indemnified by Dexia for any potential liability associated with this audit of anyperiods prior to the AGMH Acquisition. The Company's U.K. subsidiaries are not currently under examination and have opentax years of 2011 forward.
Uncertain Tax Positions
The following table provides a reconciliation of the beginning and ending balances of the total liability forunrecognized tax benefits. The Company does not believe it is reasonably possible that this amount will change significantly inthe next twelve months.
2013 2012 2011(in millions)
Balance as of January 1, $ 22 $ 20 $ 18True-up from tax return filings 4 — —Increase in unrecognized tax benefits as a result of position taken duringthe current period 3 2 2Decrease due to closing of IRS audit (9) — —Balance as of December 31, $ 20 $ 22 $ 20
The Company's policy is to recognize interest and penalties related to uncertain tax positions in income tax expenseand has accrued $1 million per year from 2011 to 2013. As of December 31, 2013 and December 31, 2012, the Company hasaccrued $3 million and $3 million of interest, respectively.
The total amount of unrecognized tax benefits at December 31, 2013, that would affect the effective tax rate, ifrecognized, is $20 million.
Liability For Tax Basis Step-Up Adjustment
In connection with the Company's initial public offering, the Company and ACE Financial Services Inc. (“AFS”), asubsidiary of ACE Limited, entered into a tax allocation agreement, whereby the Company and AFS made a “Section 338(h)(10)” election that has the effect of increasing the tax basis of certain affected subsidiaries' tangible and intangible assets tofair value. Future tax benefits that the Company derives from the election will be payable to AFS when realized by theCompany.
As a result of the election, the Company has adjusted its net deferred tax liability, to reflect the new tax basis of theCompany's affected assets. The additional basis is expected to result in increased future income tax deductions and,accordingly, may reduce income taxes otherwise payable by the Company. Any tax benefit realized by the Company will bepaid to AFS. Such tax benefits will generally be calculated by comparing the Company's affected subsidiaries' actual taxes to
0345r4.indd 237 3/19/14 3:29 PM

236
the taxes that would have been owed by those subsidiaries had the increase in basis not occurred. After a 15 year period whichends in 2019, to the extent there remains an unrealized tax benefit, the Company and AFS will negotiate a settlement of theunrealized benefit based on the expected realization at that time.
As of December 31, 2013 and December 31, 2012, the liability for tax basis step-up adjustment, which is included inthe Company's balance sheets in “Other liabilities,” was $5 million and $6 million, respectively. The Company has paid ACELimited and correspondingly reduced its liability by $1 million in 2013.
Tax Treatment of CDS
The Company treats the guaranty it provides on CDS as an insurance contract for tax purposes and as such a taxableloss does not occur until the Company expects to make a loss payment to the buyer of credit protection based upon theoccurrence of one or more specified credit events with respect to the contractually referenced obligation or entity. TheCompany holds its CDS to maturity, at which time any unrealized fair value loss in excess of credit-related losses would revertto zero. The tax treatment of CDS is an unsettled area of the law. The uncertainty relates to the IRS determination of the incomeor potential loss associated with CDS as either subject to capital gain (loss) or ordinary income (loss) treatment. In treatingCDS as insurance contracts the Company treats both the receipt of premium and payment of losses as ordinary income andbelieves it is more likely than not that any CDS credit related losses will be treated as ordinary by the IRS. To the extent theIRS takes the view that the losses are capital losses in the future and the Company incurred actual losses associated with theCDS, the Company would need sufficient taxable income of the same character within the carryback and carryforward periodavailable under the tax law.
14. Reinsurance and Other Monoline Exposures
The Company assumes exposure on insured obligations (“Assumed Business”) and cedes portions of its exposure onobligations it has insured (“Ceded Business”) in exchange for premiums, net of ceding commissions. The Company hashistorically entered into ceded reinsurance contracts in order to obtain greater business diversification and reduce the netpotential loss from large risks.
Accounting Policy
For business assumed and ceded, the accounting model of the underlying direct financial guaranty contract dictates theaccounting model used for the reinsurance contract (except for those eliminated as FG VIEs). For any assumed or cededfinancial guaranty insurance premiums, the accounting model described in Note 4 is followed, for assumed and ceded financialguaranty insurance losses, the accounting model in Note 7 is followed. For any assumed or ceded credit derivative contracts,the accounting model in Note 9 is followed.
Assumed and Ceded Business
The Company assumes business from other monoline financial guaranty companies. Under these relationships, theCompany assumes a portion of the ceding company’s insured risk in exchange for a premium. The Company may be exposedto risk in this portfolio in that the Company may be required to pay losses without a corresponding premium in circumstanceswhere the ceding company is experiencing financial distress and is unable to pay premiums. The Company’s facultative andtreaty agreements are generally subject to termination at the option of the ceding company:
• if the Company fails to meet certain financial and regulatory criteria and to maintain a specified minimumfinancial strength rating, or
• upon certain changes of control of the Company.
Upon termination under these conditions, the Company may be required (under some of its reinsurance agreements) toreturn to the ceding company unearned premiums (net of ceding commissions) and loss reserves calculated on a statutory basisof accounting, attributable to reinsurance assumed pursuant to such agreements after which the Company would be releasedfrom liability with respect to the Assumed Business.
Upon the occurrence of the conditions set forth in the first bullet above, whether or not an agreement is terminated, theCompany may be required to obtain a letter of credit or alternative form of security to collateralize its obligation to performunder such agreement or it may be obligated to increase the level of ceding commission paid.
0345r4.indd 238 3/19/14 3:29 PM

237
The downgrade of the financial strength ratings of AG Re or of AGC gives certain reinsurance counterparties the rightto recapture ceded business, which would lead to a reduction in the Company's unearned premium reserve and related earningson such reserve. With respect to a significant portion of the Company's in-force financial guaranty assumed business, based onAG Re's and AGC's current ratings and subject to the terms of each reinsurance agreement, the third party ceding company mayhave the right to recapture assumed business ceded to AG Re and/or AGC, and in connection therewith, to receive paymentfrom the assuming reinsurer of an amount equal to the reinsurer’s statutory unearned premium (net of ceding commissions) andstatutory loss reserves (if any) associated with that business, plus, in certain cases, an additional ceding commission. As ofDecember 31, 2013, if each third party company ceding business to AG Re and/or AGC had a right to recapture such business,and chose to exercise such right, the aggregate amounts that AG Re and AGC could be required to pay to all such companieswould be approximately $293 million and $61 million, respectively.
The Company has Ceded Business to non-affiliated companies to limit its exposure to risk. Under these relationships,the Company cedes a portion of its insured risk in exchange for a premium paid to the reinsurer. The Company remainsprimarily liable for all risks it directly underwrites and is required to pay all gross claims. It then seeks reimbursement from thereinsurer for its proportionate share of claims. The Company may be exposed to risk for this exposure if it were required to paythe gross claims and not be able to collect ceded claims from an assuming company experiencing financial distress. A numberof the financial guaranty insurers to which the Company has ceded par have experienced financial distress and beendowngraded by the rating agencies as a result. In addition, state insurance regulators have intervened with respect to some ofthese insurers. The Company’s ceded contracts generally allow the Company to recapture Ceded Business after certaintriggering events, such as reinsurer downgrades.
Over the past several years, the Company has entered into several commutations in order to reassume previouslyceded books of business from its reinsurers. The Company has also canceled assumed reinsurance contracts. Thesecommutations of Ceded Business and cancellations of Assumed Business resulted in gains of $2 million, $82 million and $32million for the years ended December 31, 2013, 2012 and 2011, respectively, which were recorded in other income.
Net Effect of Commutations of Ceded andCancellations of Assumed Reinsurance Contracts
Year Ended December 31,2013 2012 2011
(in millions)
Increase (decrease) in net unearned premium reserve $ 11 $ 109 $ (20)Increase (decrease) in net par outstanding 151 19,173 (780)
The following table presents the components of premiums and losses reported in the consolidated statement ofoperations and the contribution of the Company's Assumed and Ceded Businesses.
0345r4.indd 239 3/19/14 3:29 PM

238
Effect of Reinsurance on Statement of Operations
Year Ended December 31,2013 2012 2011
(in millions)
Premiums Written:Direct $ 106 $ 244 190Assumed(1) 17 9 (63)Ceded(2) 2 51 4Net $ 125 $ 304 131
Premiums Earned:Direct $ 819 $ 936 997Assumed 40 50 46Ceded (107) (133) (123)Net $ 752 $ 853 920
Loss and LAE:Direct $ 110 $ 636 564Assumed 73 (4) 4Ceded (29) (128) (120)Net $ 154 $ 504 448
____________________(1) Negative assumed premiums written were due to cancellations and changes in expected Debt Service schedules.
(2) Positive ceded premiums written were due to commutations and changes in expected Debt Service schedules.
Reinsurer Exposure
In addition to assumed and ceded reinsurance arrangements, the Company may also have exposure to some financialguaranty reinsurers (i.e., monolines) in other areas. Second-to-pay insured par outstanding represents transactions the Companyhas insured that were previously insured by other monolines. The Company underwrites such transactions based on theunderlying insured obligation without regard to the primary insurer. Another area of exposure is in the investment portfoliowhere the Company holds fixed-maturity securities that are wrapped by monolines and whose value may decline based on therating of the monoline. As of December 31, 2013, based on fair value, the Company had $461 million of fixed-maturitysecurities in its investment portfolio wrapped by National Public Finance Guarantee Corporation, $455 million by AmbacAssurance Corporation ("Ambac") and $27 million by other guarantors.
0345r4.indd 240 3/19/14 3:29 PM

239
Exposure by Reinsurer
Ratings at Par OutstandingFebruary 24, 2014 As of December 31, 2013
Reinsurer
Moody’sReinsurer
Rating
S&PReinsurer
RatingCeded Par
Outstanding(1)
Second-to-Pay Insured
ParOutstanding
Assumed ParOutstanding
(dollars in millions)
American Overseas Reinsurance CompanyLimited (f/k/a Ram Re) WR (2) WR $ 8,331 $ — $ 30Tokio Marine & Nichido FireInsurance Co., Ltd. (“Tokio”) Aa3 (3) AA- (3) 7,279 — —Radian Ba1 B+ 4,709 38 1,082Syncora Guarantee Inc. WR WR 4,201 1,771 162Mitsui Sumitomo Insurance Co. Ltd. A1 A+ (3) 2,144 — —ACA Financial Guaranty Corp. NR (5) WR 809 5 9Swiss Reinsurance Co. Aa3 AA- 346 — —Ambac (4) WR WR 85 6,118 17,859CIFG Assurance North America Inc.("CIFG") WR WR 2 178 5,048MBIA Inc. (4) (4) — 10,292 7,386Financial Guaranty Insurance Co. WR WR — 2,329 1,315Other Various Various 882 2,099 46
Total $ 28,788 $ 22,830 $ 32,937____________________(1) Includes $3,172 million in ceded par outstanding related to insured credit derivatives.
(2) Represents “Withdrawn Rating.”
(3) The Company has structural collateral agreements satisfying the triple-A credit requirement of S&P and/or Moody’s.
(4) MBIA Inc. includes various subsidiaries which are rated A and B by S&P and Baa1, B1 and B3 by Moody’s. Ambacincludes policies in their general and segregated account.
(5) Represents “Not Rated.”
0345r4.indd 241 3/19/14 3:29 PM

240
Ceded Par Outstanding by Reinsurer and Credit RatingAs of December 31, 2013
Internal Credit Rating
Reinsurer AAA AA A BBB BIG Total(in millions)
American Overseas Reinsurance CompanyLimited (f/k/a Ram Re) $ 967 $ 2,871 $ 2,605 $ 1,327 $ 561 $ 8,331Tokio 1,127 1,122 2,291 1,793 946 7,279Radian 235 296 2,365 1,241 572 4,709Syncora Guarantee Inc. — 223 764 2,334 880 4,201Mitsui Sumitomo Insurance Co. Ltd. 146 692 868 232 206 2,144ACA Financial Guaranty Corp — 465 324 20 — 809Swiss Reinsurance Co. — 2 241 27 76 346Ambac — — 85 — — 85CIFG — — — 2 — 2Other — 93 751 38 — 882
Total $ 2,475 $ 5,764 $ 10,294 $ 7,014 $ 3,241 $ 28,788
In accordance with U.S. statutory accounting requirements and U.S. insurance laws and regulations, in order for theCompany to receive credit for liabilities ceded to reinsurers domiciled outside of the U.S., such reinsurers must secure theirliabilities to the Company. All of the unauthorized reinsurers in the table above post collateral for the benefit of the Company inan amount at least equal to the sum of their ceded unearned premium reserve, loss reserves and contingency reserves allcalculated on a statutory basis of accounting. In addition, certain authorized reinsurers in the table above post collateral onterms negotiated with the Company. Collateral may be in the form of letters of credit or trust accounts. The total collateralposted by all non-affiliated reinsurers as of December 31, 2013 is approximately $658 million.
Second-to-PayInsured Par Outstanding by Internal Rating
As of December 31, 2013(1)
Public Finance Structured Finance
AAA AA A BBB BIG AAA AA A BBB BIG Total(in millions)
Radian $ — $ — $ 13 $ 17 $ 8 $ — $ — $ — $ — $ — $ 38
Syncora Guarantee Inc. — 25 369 771 301 77 56 — — 172 1,771ACA Financial GuarantyCorp. — 3 — 2 — — — — — — 5Ambac 30 1,366 3,157 1,020 81 2 43 71 209 139 6,118CIFG — 11 69 22 76 — — — — — 178MBIA Inc. 225 2,346 4,250 1,425 — — 1,589 24 199 234 10,292Financial GuarantyInsurance Co. — 77 990 296 328 518 — 73 — 47 2,329Other — — 2,099 — — — — — — — 2,099
Total $ 255 $ 3,828 $ 10,947 $ 3,553 $ 794 $ 597 $ 1,688 $ 168 $ 408 $ 592 $ 22,830
____________________(1) Assured Guaranty’s internal rating.
0345r4.indd 242 3/19/14 3:29 PM

241
Amounts Due (To) From ReinsurersAs of December 31, 2013
AssumedPremium, net
of Commissions
CededPremium, net
of Commissions
AssumedExpected
Loss and LAE
CededExpected
Loss and LAE(in millions)
American Overseas Reinsurance Company Limited (f/k/aRam Re) $ — $ (9) $ — $ 9Tokio — (19) — 20Radian — (17) — 16Syncora Guarantee Inc. — (40) — 1Mitsui Sumitomo Insurance Co. Ltd. — — — 2Swiss Reinsurance Co. — — — 1Ambac 67 — (79) —CIFG — — (6) 2MBIA Inc. 13 — (11) —Financial Guaranty Insurance Co. 7 — (103) —Other — (43) — —
Total $ 87 $ (128) $ (199) $ 51
Excess of Loss Reinsurance Facility
AGC, AGM and MAC entered into an aggregate excess of loss reinsurance facility with a number of reinsurers,effective as of January 1, 2014. The facility covers losses occurring either from January 1, 2014 through December 31, 2021, orJanuary 1, 2015 through December 31, 2022, at the option of AGC, AGM and MAC. It terminates on January 1, 2016, unlessAGC, AGM and MAC choose to extend it. The facility covers certain U.S. public finance credits insured or reinsured by AGC,AGM and MAC as of September 30, 2013, excluding credits that were rated non-investment grade as of December 31, 2013 byMoody’s or S&P or internally by AGC, AGM or MAC and is subject to certain per credit limits. Among the credits excludedare those associated with the Commonwealth of Puerto Rico and its related authorities and public corporations. The facilityattaches when AGC’s, AGM’s and MAC’s net losses (net of AGC’s and AGM's reinsurance (including from affiliates) and netof recoveries) exceed $1.5 billion in the aggregate. The facility covers a portion of the next $500 million of losses, with thereinsurers assuming pro rata in the aggregate $450 million of the $500 million of losses and AGC, AGM and MAC jointlyretaining the remaining $50 million of losses. The reinsurers are required to be rated at least AA- or to post collateral sufficientto provide AGM, AGC and MAC with the same reinsurance credit as reinsurers rated AA-. AGM, AGC and MAC are obligatedto pay the reinsurers their share of recoveries relating to losses during the coverage period in the covered portfolio. AGC, AGMand MAC have paid approximately $19 million of premiums during 2014 for the term January 1, 2014 through December 31,2014 and deposited approximately $19 million of securities into trust accounts for the benefit of the reinsurers to be used to paythe premium for January 1, 2015 through December 31, 2015. This facility replaces the $435 million aggregate excess of lossreinsurance facility that AGC and AGM had entered into on January 22, 2012.
Re-Assumption and Reinsurance Agreements with Radian Asset Assurance Inc.
On January 24, 2012, AGM reassumed $12.9 billion of par it had previously ceded to Radian and AGC reinsuredapproximately $1.8 billion of U.S. public finance par from Radian. The Company received a payment of $86 million fromRadian for the re-assumption, which consisted 96% of public finance exposure and 4% of structured finance credits. Inconnection with the reinsurance assumption, the Company received a payment of $22 million. Both the reassumed andreinsured portfolios were composed entirely of selected credits that met the Company’s underwriting standards.
Tokio Marine & Nichido Fire Insurance Co., Ltd. Agreement
Effective as of March 1, 2012, AGM and Tokio entered into a Commutation, Reassumption and Release Agreementfor a portfolio consisting of approximately $6.2 billion in par of U.S. public finance exposures outstanding as of February 29,2012. Tokio paid AGM the statutory unearned premium outstanding as of February 29, 2012 plus a commutation premium.
0345r4.indd 243 3/19/14 3:29 PM

242
15. Related Party Transactions
The Company was party to transactions with entities that are affiliated with Wilbur L. Ross, Jr., a director of theCompany, and funds under his control, which in the aggregate owned approximately 8.2% of the common shares of AGL as ofDecember 31, 2013, 10.2% as of December 31, 2012 and 10.9% as of December 31, 2011. In addition, the Company retainsWellington Management Company, LLP, as investment manager for a portion of the Company's investment portfolio.Wellington Company LLP owned approximately 6.6% of the common shares of AGL as of December 31, 2013, 8.6% as ofDecember 31, 2012 and 9.6% as of December 31, 2011. The net expenses from transactions with these related parties wereapproximately $2.5 million in 2013, with no individual related party expense item exceeding $1.9 million, $3.4 million in2012, with no individual related party expense item exceeding $2.0 million, and $2.6 million in 2011, with no related partyexpense item exceeding $1.9 million. As of December 31, 2013, 2012 and 2011 there were no significant amounts payable to oramounts receivable from related parties. In addition, please refer to Note 19, Shareholders' Equity, for a description of thetransaction under which the Company purchased common shares from funds associated with WL Ross & Co. LLC and itsaffiliates and from Mr. Ross.
16. Commitments and Contingencies
LeasesAGL and its subsidiaries are party to various lease agreements accounted for as operating leases. The Company leases
and occupies space in New York City through April 2026. In addition, AGL and its subsidiaries lease additional office space invarious locations under non-cancelable operating leases which expire at various dates through 2016. Rent expense was $9.9million in 2013, $10.0 million in 2012 and $10.7 million in 2011.
Future Minimum Rental Payments
Year (in millions)2014 $ 82015 82016 82017 72018 8Thereafter 59
Total $ 98
Legal Proceedings
Litigation
Lawsuits arise in the ordinary course of the Company’s business. It is the opinion of the Company’s management,based upon the information available, that the expected outcome of litigation against the Company, individually or in theaggregate, will not have a material adverse effect on the Company’s financial position or liquidity, although an adverseresolution of litigation against the Company in a fiscal quarter or year could have a material adverse effect on the Company’sresults of operations in a particular quarter or year.
The Company establishes accruals for litigation and regulatory matters to the extent it is probable that a loss has beenincurred and the amount of that loss can be reasonably estimated. For litigation and regulatory matters where a loss may bereasonably possible, but not probable, or is probable but not reasonably estimable, no accrual is established, but if the matter ismaterial, it is disclosed, including matters discussed below. The Company reviews relevant information with respect to itslitigation and regulatory matters on a quarterly, and annual basis and updates its accruals, disclosures and estimates ofreasonably possible loss based on such reviews.
In addition, in the ordinary course of their respective businesses, certain of the Company’s subsidiaries assert claims inlegal proceedings against third parties to recover losses paid in prior periods. For example, as described in the "RecoveryLitigation" section of Note 6, Expected Loss to be Paid, as of the date of this filing, AGC and AGM have filed complaintsagainst certain sponsors and underwriters of RMBS securities that AGC or AGM had insured, alleging, among other claims,that such persons had breached R&W in the transaction documents, failed to cure or repurchase defective loans and/or violated
0345r4.indd 244 3/19/14 3:29 PM

243
state securities laws. The amounts, if any, the Company will recover in proceedings to recover losses are uncertain, andrecoveries, or failure to obtain recoveries, in any one or more of these proceedings during any quarter or year could be materialto the Company’s results of operations in that particular quarter or year.
Proceedings Relating to the Company’s Financial Guaranty Business
The Company receives subpoenas duces tecum and interrogatories from regulators from time to time.
Beginning in July 2008, AGM and various other financial guarantors were named in complaints filed in the SuperiorCourt for the State of California, City and County of San Francisco by a number of plaintiffs. Subsequently, plaintiffs' counselfiled amended complaints against AGM and AGC and added additional plaintiffs. These complaints alleged that the financialguaranty insurer defendants (i) participated in a conspiracy in violation of California's antitrust laws to maintain a dual creditrating scale that misstated the credit default risk of municipal bond issuers and created market demand for municipal bondinsurance, (ii) participated in risky financial transactions in other lines of business that damaged each insurer's financialcondition (thereby undermining the value of each of their guaranties), and (iii) failed to adequately disclose the impact of thosetransactions on their financial condition. In addition to their antitrust claims, various plaintiffs asserted claims for breach of thecovenant of good faith and fair dealing, fraud, unjust enrichment, negligence, and negligent misrepresentation. At hearings heldin July and October 2011 relating to AGM, AGC and the other defendants' demurrer, the court overruled the demurrer on thefollowing claims: breach of contract, violation of California's antitrust statute and of its unfair business practices law, and fraud.The remaining claims were dismissed. On December 2, 2011, AGM, AGC and the other bond insurer defendants filed an anti-SLAPP ("Strategic Lawsuit Against Public Participation") motion to strike the complaints under California's Code of CivilProcedure. On July 9, 2013, the court entered its order denying in part and granting in part the bond insurers' motion to strike.As a result of the order, the causes of action that remain against AGM and AGC are: claims of breach of contract and fraud,brought by the City of San Jose, the City of Stockton, East Bay Municipal Utility District and Sacramento Suburban WaterDistrict, relating to the failure to disclose the impact of risky financial transactions on their financial condition; and a claim ofbreach of the unfair business practices law brought by The Jewish Community Center of San Francisco. On September 9, 2013,plaintiffs filed an appeal of the anti-SLAPP ruling on the California antitrust statute. On September 30, 2013, AGC, AGM andthe other bond insurer defendants filed a notice of cross-appeal. The complaints generally seek unspecified monetary damages,interest, attorneys' fees, costs and other expenses. The Company cannot reasonably estimate the possible loss or range of loss, ifany, that may arise from these lawsuits.
On November 28, 2011, Lehman Brothers International (Europe) (in administration) (“LBIE”) sued AGFP, an affiliateof AGC which in the past had provided credit protection to counterparties under credit default swaps. AGC acts as the creditsupport provider of AGFP under these credit default swaps. LBIE’s complaint, which was filed in the Supreme Court of theState of New York, alleged that AGFP improperly terminated nine credit derivative transactions between LBIE and AGFP andimproperly calculated the termination payment in connection with the termination of 28 other credit derivative transactionsbetween LBIE and AGFP. With respect to the 28 credit derivative transactions, AGFP calculated that LBIE owes AGFPapproximately $25 million, whereas LBIE asserted in the complaint that AGFP owes LBIE a termination payment ofapproximately $1.4 billion. LBIE is seeking unspecified damages. On February 3, 2012, AGFP filed a motion to dismiss certainof the counts in the complaint, and on March 15, 2013, the court granted AGFP's motion to dismiss the count relating toimproper termination of the nine credit derivative transactions and denied AGFP's motion to dismiss the count relating to theremaining transactions. The Company cannot reasonably estimate the possible loss, if any, that may arise from this lawsuit.
On November 19, 2012, Lehman Brothers Holdings Inc. (“LBHI”) and Lehman Brothers Special Financing Inc.(“LBSF") commenced an adversary complaint and claim objection in the United States Bankruptcy Court for the SouthernDistrict of New York against Credit Protection Trust 283 (“CPT 283”), FSA Administrative Services, LLC, as trustee for CPT283, and AGM, in connection with CPT 283's termination of a CDS between LBSF and CPT 283. CPT 283 terminated theCDS as a consequence of LBSF failing to make a scheduled payment owed to CPT 283, which termination occurred afterLBHI filed for bankruptcy but before LBSF filed for bankruptcy. The CDS provided that CPT 283 was entitled to receive fromLBSF a termination payment in that circumstance of approximately $43.8 million (representing the economic equivalent of thefuture fixed payments CPT 283 would have been entitled to receive from LBSF had the CDS not been terminated), and CPT283 filed proofs of claim against LBSF and LBHI (as LBSF's credit support provider) for such amount. LBHI and LBSF seekto disallow and expunge (as impermissible and unenforceable penalties) CPT 283's proofs of claim against LBHI and LBSFand recover approximately $67.3 million, which LBHI and LBSF allege was the mark-to-market value of the CDS to LBSF(less unpaid amounts) on the day CPT 283 terminated the CDS, plus interest, attorney's fees, costs and other expenses. On thesame day, LBHI and LBSF also commenced an adversary complaint and claim objection against Credit Protection Trust 207(“CPT 207”), FSA Administrative Services, LLC, as trustee for CPT 207, and AGM, in connection with CPT 207's terminationof a CDS between LBSF and CPT 207. Similarly, the CDS provided that CPT 207 was entitled to receive from LBSF atermination payment in that circumstance of $492,555. LBHI and LBSF seek to disallow and expunge CPT 207's proofs of
0345r4.indd 245 3/19/14 3:29 PM

244
claim against LBHI and LBSF and recover approximately $1.5 million. AGM believes the terminations of the CDS and thecalculation of the termination payment amounts were consistent with the terms of the ISDA master agreements between theparties. The Company cannot reasonably estimate the possible loss, if any, that may arise from this lawsuit.
On September 25, 2013, Wells Fargo Bank, N.A., as trust administrator, filed an interpleader complaint in the U.S.District Court for the Southern District of New York against AGM, among others, relating to the right of AGM to bereimbursed from certain cashflows for principal claims paid on insured certificates issued in the MASTR Adjustable RateMortgages Trust 2007-3 securitization. The Company estimates that an adverse outcome to the interpleader proceeding couldincrease losses on the transaction by approximately $10 - $20 million, net of expected settlement payments and reinsurance inforce.
Previously, AGM, together with other financial institutions and other parties, including bond insurers, had been namedas defendants in a civil action brought in the circuit court of Jefferson County, Alabama relating to the County's problemsmeeting its sewer debt obligations: Charles E. Wilson vs. JPMorgan Chase & Co et al (filed in the Circuit Court of JeffersonCounty, Alabama), Case No. 01-CV-2008-901907.00. The action was brought in August 2008 on behalf of rate payers, taxpayers and citizens residing in Jefferson County, and alleged conspiracy and fraud in connection with the issuance of theCounty's debt. The complaint sought equitable relief, unspecified monetary damages, interest, attorneys' fees and other costs. InJanuary 2011, the circuit court issued an order denying a motion by the bond insurers and other defendants to dismiss theaction. The defendants, including the bond insurers, petitioned the Alabama Supreme Court for a writ of mandamus to thecircuit court vacating such order and directing the dismissal with prejudice of plaintiffs' claims for lack of standing. Whileawaiting a ruling from the Alabama Supreme Court, Jefferson County filed for bankruptcy and the Alabama Supreme Courtentered a stay pending the resolution of the bankruptcy. In November 2013, the United States Bankruptcy Court approved abankruptcy plan that included dismissal of the pending claims in state court. On January 13, 2014, the circuit court entered anorder dismissing the claims against AGM and the other defendants and on January 17, 2014, the Supreme Court of Alabamaentered an order dismissing the petition for writ of mandamus.
Proceedings Related to AGMH’s Former Financial Products Business
The following is a description of legal proceedings involving AGMH’s former Financial Products Business. Althoughthe Company did not acquire AGMH’s former Financial Products Business, which included AGMH’s former GIC business,medium term notes business and portions of the leveraged lease businesses, certain legal proceedings relating to thosebusinesses are against entities that the Company did acquire. While Dexia SA and Dexia Crédit Local S.A. (“DCL”), jointlyand severally, have agreed to indemnify the Company against liability arising out of the proceedings described below in the “—Proceedings Related to AGMH’s Former Financial Products Business” section, such indemnification might not be sufficient tofully hold the Company harmless against any injunctive relief or civil or criminal sanction that is imposed against AGMH or itssubsidiaries.
Governmental Investigations into Former Financial Products Business
AGMH and/or AGM have received subpoenas duces tecum and interrogatories or civil investigative demands from theAttorneys General of the States of Connecticut, Florida, Illinois, Massachusetts, Missouri, New York, Texas and West Virginiarelating to their investigations of alleged bid rigging of municipal GICs. AGMH is responding to such requests. AGMH mayreceive additional inquiries from these or other regulators and expects to provide additional information to such regulatorsregarding their inquiries in the future. In addition,
• AGMH received a subpoena from the Antitrust Division of the Department of Justice in November 2006 issued inconnection with an ongoing criminal investigation of bid rigging of awards of municipal GICs and othermunicipal derivatives; and
• AGM received a subpoena from the SEC in November 2006 related to an ongoing industry-wide investigationconcerning the bidding of municipal GICs and other municipal derivatives.
Pursuant to the subpoenas, AGMH has furnished to the Department of Justice and SEC records and other information withrespect to AGMH’s municipal GIC business. The ultimate loss that may arise from these investigations remains uncertain.
In addition AGMH had received a “Wells Notice” from the staff of the Philadelphia Regional Office of the SEC inFebruary 2008 relating to the investigation concerning the bidding of municipal GICs and other municipal derivatives. TheWells Notice indicated that the SEC staff was considering recommending that the SEC authorize the staff to bring a civilinjunctive action and/or institute administrative proceedings against AGMH, alleging violations of Section 10(b) of the
0345r4.indd 246 3/19/14 3:29 PM

245
Exchange Act and Rule 10b-5 thereunder and Section 17(a) of the Securities Act. On January 8, 2014, the SEC issued a letterstating that it had concluded the investigation as to AGMH and, based on the information it had as of such date, it did notintend to recommend an enforcement action by the SEC against AGMH.
In July 2010, a former employee of AGM who had been involved in AGMH's former Financial Products Business wasindicted along with two other persons with whom he had worked at Financial Guaranty Insurance Company. Such formeremployee and the other two persons were convicted on fraud conspiracy counts. After appeal, their convictions were reversedby a three-judge panel of the U.S. Court of Appeals for the Second Circuit in November 2013. In January 2014, theDepartment of Justice petitioned the U.S. Court of Appeals for the Second Circuit for a panel rehearing and a rehearing en bancof the appeal.
Lawsuits Relating to Former Financial Products Business
During 2008, nine putative class action lawsuits were filed in federal court alleging federal antitrust violations in themunicipal derivatives industry, seeking damages and alleging, among other things, a conspiracy to fix the pricing of, andmanipulate bids for, municipal derivatives, including GICs. These cases have been coordinated and consolidated for pretrialproceedings in the U.S. District Court for the Southern District of New York as MDL 1950, In re Municipal DerivativesAntitrust Litigation, Case No. 1:08-cv-2516 (“MDL 1950”).
Five of these cases named both AGMH and AGM: (a) Hinds County, Mississippi v. Wachovia Bank, N.A. ; (b) FairfaxCounty, Virginia v. Wachovia Bank, N.A.; (c) Central Bucks School District, Pennsylvania v. Wachovia Bank, N.A. ; (d) Mayorand City Council of Baltimore, Maryland v. Wachovia Bank, N.A.; and (e) Washington County, Tennessee v. Wachovia Bank,N.A. In April 2009, the MDL 1950 court granted the defendants’ motion to dismiss on the federal claims, but granted leave forthe plaintiffs to file an amended complaint. The Corrected Third Consolidated Amended Class Action Complaint, filed onOctober 9, 2013, lists neither AGM nor AGMH as a named defendant or a co-conspirator. The complaints in these lawsuitsgenerally seek unspecified monetary damages, interest, attorneys’ fees and other costs. The Company cannot reasonablyestimate the possible loss, if any, or range of loss that may arise from these lawsuits.
Four of the cases named AGMH (but not AGM) and also alleged that the defendants violated California state antitrustlaw and common law by engaging in illegal bid-rigging and market allocation, thereby depriving the cities or municipalities ofcompetition in the awarding of GICs and ultimately resulting in the cities paying higher fees for these products: (f) City ofOakland, California v. AIG Financial Products Corp.; (g) County of Alameda, California v. AIG Financial Products Corp.;(h) City of Fresno, California v. AIG Financial Products Corp.; and (i) Fresno County Financing Authority v. AIG FinancialProducts Corp. When the four plaintiffs filed a consolidated complaint in September 2009, the plaintiffs did not name AGMHas a defendant. However, the complaint does describe some of AGMH’s and AGM’s activities. The consolidated complaintgenerally seeks unspecified monetary damages, interest, attorneys’ fees and other costs. In April 2010, the MDL 1950 courtgranted in part and denied in part the named defendants’ motions to dismiss this consolidated complaint.
In 2008, AGMH and AGM also were named in five non-class action lawsuits originally filed in the California SuperiorCourts alleging violations of California law related to the municipal derivatives industry: (a) City of Los Angeles, California v.Bank of America, N.A.; (b) City of Stockton, California v. Bank of America, N.A. ; (c) County of San Diego, California v. Bank ofAmerica, N.A.; (d) County of San Mateo, California v. Bank of America, N.A.; and (e) County of Contra Costa, California v.Bank of America, N.A. Amended complaints in these actions were filed in September 2009, adding a federal antitrust claim andnaming AGM (but not AGMH) and AGUS, among other defendants. These cases have been transferred to the Southern Districtof New York and consolidated with MDL 1950 for pretrial proceedings.
In late 2009, AGM and AGUS, among other defendants, were named in six additional non-class action cases filed infederal court, which also have been coordinated and consolidated for pretrial proceedings with MDL 1950: (f) City ofRiverside, California v. Bank of America, N.A. ; (g) Sacramento Municipal Utility District v. Bank of America, N.A. ; (h) LosAngeles World Airports v. Bank of America, N.A. ; (i) Redevelopment Agency of the City of Stockton v. Bank of America, N.A. ;(j) Sacramento Suburban Water District v. Bank of America, N.A.; and (k) County of Tulare, California v. Bank of America,N.A.
The MDL 1950 court denied AGM and AGUS’s motions to dismiss these eleven complaints in April 2010. Amendedcomplaints were filed in May 2010. On October 29, 2010, AGM and AGUS were voluntarily dismissed with prejudice from theSacramento Municipal Utility District case only. The complaints in these lawsuits generally seek or sought unspecifiedmonetary damages, interest, attorneys’ fees, costs and other expenses. The Company cannot reasonably estimate the possibleloss, if any, or range of loss that may arise from the remaining lawsuits.
0345r4.indd 247 3/19/14 3:29 PM

246
In May 2010, AGM and AGUS, among other defendants, were named in five additional non-class action cases filed infederal court in California: (a) City of Richmond, California v. Bank of America, N.A. (filed on May 18, 2010, N.D. California);(b) City of Redwood City, California v. Bank of America, N.A . (filed on May 18, 2010, N.D. California); (c) RedevelopmentAgency of the City and County of San Francisco, California v. Bank of America, N.A. (filed on May 21, 2010, N.D. California);(d) East Bay Municipal Utility District, California v. Bank of America, N.A. (filed on May 18, 2010, N.D. California); and(e) City of San Jose and the San Jose Redevelopment Agency, California v. Bank of America, N.A (filed on May 18, 2010, N.D.California). These cases have also been transferred to the Southern District of New York and consolidated with MDL 1950 forpretrial proceedings. In September 2010, AGM and AGUS, among other defendants, were named in a sixth additional non-classaction filed in federal court in New York, but which alleges violation of New York’s Donnelly Act in addition to federalantitrust law: Active Retirement Community, Inc. d/b/a Jefferson’s Ferry v. Bank of America, N.A. (filed on September 21, 2010,E.D. New York), which has also been transferred to the Southern District of New York and consolidated with MDL 1950 forpretrial proceedings. In December 2010, AGM and AGUS, among other defendants, were named in a seventh additional non-class action filed in federal court in the Central District of California, Los Angeles Unified School District v. Bank of America,N.A., and in an eighth additional non-class action filed in federal court in the Southern District of New York, Kendal onHudson, Inc. v. Bank of America, N.A. These cases also have been consolidated with MDL 1950 for pretrial proceedings. Thecomplaints in these lawsuits generally seek unspecified monetary damages, interest, attorneys’ fees, costs and other expenses.The Company cannot reasonably estimate the possible loss, if any, or range of loss that may arise from these lawsuits.
In January 2011, AGM and AGUS, among other defendants, were named in an additional non-class action case filed infederal court in New York, which alleges violation of New York’s Donnelly Act in addition to federal antitrust law: PeconicLanding at Southold, Inc. v. Bank of America, N.A. This case has been consolidated with MDL 1950 for pretrial proceedings.The complaint in this lawsuit generally seeks unspecified monetary damages, interest, attorneys’ fees, costs and other expenses.The Company cannot reasonably estimate the possible loss, if any, or range of loss that may arise from this lawsuit.
In September 2009, the Attorney General of the State of West Virginia filed a lawsuit (Circuit Ct. Mason County, W.Va.) against Bank of America, N.A. alleging West Virginia state antitrust violations in the municipal derivatives industry,seeking damages and alleging, among other things, a conspiracy to fix the pricing of, and manipulate bids for, municipalderivatives, including GICs. An amended complaint in this action was filed in June 2010, adding a federal antitrust claim andnaming AGM (but not AGMH) and AGUS, among other defendants. This case has been removed to federal court as well astransferred to the S.D.N.Y. and consolidated with MDL 1950 for pretrial proceedings. AGM and AGUS answered WestVirginia's Second Amended Complaint on November 11, 2013. The complaint in this lawsuit generally seeks civil penalties,unspecified monetary damages, interest, attorneys’ fees, costs and other expenses. The Company cannot reasonably estimate thepossible loss, if any, or range of loss that may arise from this lawsuit.
17. Long-Term Debt and Credit Facilities
The Company has outstanding long-term debt issued by AGUS and AGMH. AGUS has issued 7.0% Senior Notes andSeries A, Enhanced Junior Subordinated Debentures. AGMH has issued 6 7/8% Quarterly Income Bonds Securities(“QUIBS”), 6.25% Notes and 5.60% Notes, as well $300 million Junior Subordinated Debentures. All of such debt is fully andunconditionally guaranteed by AGL.
In addition, refinancing vehicles consolidated by AGM issued notes payable to the Financial Products Companies nowowned by Dexia; the refinancing vehicles borrowed the funds in order to purchase assets underlying obligations insured byAGM. See Note 11, Investments and Cash.
Accounting Policy
Long-term debt is recorded at principal amounts net of any unamortized original issue discount or premium andunamortized fair value adjustment for AGMH debt. Discount is accreted into interest expense over the life of the applicabledebt.
0345r4.indd 248 3/19/14 3:29 PM

247
Debt Issued by AGUS
7.0% Senior Notes. On May 18, 2004, AGUS issued $200 million of 7.0% senior notes due 2034 (“7.0% SeniorNotes”) for net proceeds of $197 million. Although the coupon on the Senior Notes is 7.0%, the effective rate is approximately6.4%, taking into account the effect of a cash flow hedge executed by the Company in March 2004.
8.5% Senior Notes. On June 24, 2009, AGL issued 3,450,000 equity units for net proceeds of approximately $167million in a registered public offering. The net proceeds of the offering were used to pay a portion of the consideration for theAGMH Acquisition. Each equity unit consisted of (i) a 5.0% undivided beneficial ownership interest in $1,000 principalamount of 8.5% senior notes due 2014 issued by AGUS and (ii) a forward purchase contract obligating the holders to purchase$50 of AGL common shares in June 2012. On June 1, 2012, the Company completed the remarketing of the $173 millionaggregate principal amount of 8.5% Senior Notes; AGUS purchased all of the Senior Notes in the remarketing at a price of100% of the principal amount thereof, and retired all of such notes on June 1, 2012. The proceeds from the remarketing wereused to satisfy the obligations of the holders of the Equity Units to purchase AGL common shares pursuant to the forwardpurchase contract. Accordingly, on June 1, 2012, AGL issued 3.8924 common shares to holders of each Equity Unit, whichrepresented a settlement rate of 3.8685 common shares plus certain anti-dilution adjustments, or an aggregate of 13,428,770common shares at approximately $12.85 per share. The Equity Units ceased to exist when the forward purchase contracts weresettled on June 1, 2012.
Series A Enhanced Junior Subordinated Debentures. On December 20, 2006, AGUS issued $150 million of theDebentures due 2066. The Debentures pay a fixed 6.40% rate of interest until December 15, 2016, and thereafter pay a floatingrate of interest, reset quarterly, at a rate equal to three month LIBOR plus a margin equal to 2.38%. AGUS may select at one ormore times to defer payment of interest for one or more consecutive periods for up to ten years. Any unpaid interest bearsinterest at the then applicable rate. AGUS may not defer interest past the maturity date.
Debt Issued by AGMH
6 7/8% QUIBS. On December 19, 2001, AGMH issued $100 million face amount of 6 7/8% QUIBS dueDecember 15, 2101, which are callable without premium or penalty.
6.25% Notes. On November 26, 2002, AGMH issued $230 million face amount of 6.25% Notes due November 1,2102, which are callable without premium or penalty in whole or in part.
5.60% Notes. On July 31, 2003, AGMH issued $100 million face amount of 5.60% Notes due July 15, 2103, whichare callable without premium or penalty in whole or in part.
Junior Subordinated Debentures. On November 22, 2006, AGMH issued $300 million face amount of JuniorSubordinated Debentures with a scheduled maturity date of December 15, 2036 and a final repayment date of December 15,2066. The final repayment date of December 15, 2066 may be automatically extended up to four times in five-year incrementsprovided certain conditions are met. The debentures are redeemable, in whole or in part, at any time prior to December 15,2036 at their principal amount plus accrued and unpaid interest to the date of redemption or, if greater, the make-wholeredemption price. Interest on the debentures will accrue from November 22, 2006 to December 15, 2036 at the annual rate of6.40%. If any amount of the debentures remains outstanding after December 15, 2036, then the principal amount of theoutstanding debentures will bear interest at a floating interest rate equal to one-month LIBOR plus 2.215%% until repaid.AGMH may elect at one or more times to defer payment of interest on the debentures for one or more consecutive interestperiods that do not exceed ten years. In connection with the completion of this offering, AGMH entered into a replacementcapital covenant for the benefit of persons that buy, hold or sell a specified series of AGMH long-term indebtedness rankingsenior to the debentures. Under the covenant, the debentures will not be repaid, redeemed, repurchased or defeased by AGMHor any of its subsidiaries on or before the date that is 20 years prior to the final repayment date, except to the extent that AGMHhas received proceeds from the sale of replacement capital securities. The proceeds from this offering were used to pay adividend to the shareholders of AGMH.
0345r4.indd 249 3/19/14 3:29 PM

248
Debt Issued by AGM
In order to mitigate certain financial guaranty insurance losses, special purpose entities that AGM consolidates("refinancing vehicles") borrowed funds from the former AGMH subsidiaries that conducted AGMH’s Financial ProductsBusiness (the “Financial Products Companies”). The Company refers to such debt as the "Notes Payable." The FinancialProducts Companies issued GICs that AGM insured, and loaned the proceeds to the refinancing vehicles. The refinancingvehicles used the proceeds from the Notes Payable to purchase certain obligations insured by AGM or collateral underlyingsuch obligations and reimbursed AGM for its claim payments, in exchange for AGM assigning to the refinancing vehiclescertain of its rights against the trusts in the applicable transactions.
The principal and carrying values of the Company’s long-term debt are presented in the table below.
Principal and Carrying Amounts of Debt
As of December 31, 2013 As of December 31, 2012
PrincipalCarrying
Value PrincipalCarrying
Value(in millions)
AGUS:7.0% Senior Notes $ 200 $ 198 $ 200 $ 1978.50% Senior Notes — — — —Series A Enhanced Junior Subordinated Debentures 150 150 150 150
Total AGUS 350 348 350 347AGMH:
67/8% QUIBS 100 68 100 686.25% Notes 230 138 230 1375.60% Notes 100 55 100 54Junior Subordinated Debentures 300 169 300 164
Total AGMH 730 430 730 423AGM:
Notes Payable 34 38 61 66Total AGM 34 38 61 66
Total $ 1,114 $ 816 $ 1,141 $ 836
Principal payments due under the long-term debt are as follows:
Expected Maturity Schedule of Debt
Expected Withdrawal Date AGUS AGMH AGM Total(in millions)
2014 $ — $ — $ 10 $ 102015 — — 9 92016 — — 4 42017 — — 10 102018 — — 1 12019-2038 200 — 0 2002039-2058 — — — —2059-2078 150 300 — 450Thereafter — 430 — 430
Total $ 350 $ 730 $ 34 $ 1,114
0345r4.indd 250 3/19/14 3:29 PM

249
Interest Expense
Year Ended December 31,
2013 2012 2011(in millions)
AGUS:7.0% Senior Notes $ 13 $ 13 $ 138.50% Senior Notes — 8 16Series A Enhanced Junior Subordinated Debentures 10 10 10
Total AGUS 23 31 39AGMH:
67/8% QUIBS 7 7 76.25% Notes 16 16 165.60% Notes 6 6 6Junior Subordinated Debentures 25 25 25
Total AGMH 54 54 54AGM:
Notes Payable 5 7 6Total AGM 5 7 6
Total $ 82 $ 92 $ 99
Recourse Credit Facilities
2009 Strip Coverage Facility
In connection with the AGMH Acquisition, AGM agreed to retain the risks relating to the debt and strip policyportions of the leveraged lease business. The liquidity risk to AGM related to the strip policy portion of the leveraged leasebusiness is mitigated by the strip coverage facility described below.
In a leveraged lease transaction, a tax-exempt entity (such as a transit agency) transfers tax benefits to a tax-payingentity by transferring ownership of a depreciable asset, such as subway cars. The tax-exempt entity then leases the asset backfrom its new owner.
If the lease is terminated early, the tax-exempt entity must make an early termination payment to the lessor. A portionof this early termination payment is funded from monies that were pre-funded and invested at the closing of the leveraged leasetransaction (along with earnings on those invested funds). The tax-exempt entity is obligated to pay the remaining, unfundedportion of this early termination payment (known as the “strip coverage”) from its own sources. AGM issued financial guarantyinsurance policies (known as “strip policies”) that guaranteed the payment of these unfunded strip coverage amounts to thelessor, in the event that a tax-exempt entity defaulted on its obligation to pay this portion of its early termination payment.AGM can then seek reimbursement of its strip policy payments from the tax-exempt entity, and can also sell the transferreddepreciable asset and reimburse itself from the sale proceeds.
Currently, all the leveraged lease transactions in which AGM acts as strip coverage provider are breaching a ratingtrigger related to AGM and are subject to early termination. However, early termination of a lease does not result in a draw onthe AGM policy if the tax-exempt entity makes the required termination payment. If all the leases were to terminate early andthe tax-exempt entities do not make the required early termination payments, then AGM would be exposed to possible liquidityclaims on gross exposure of approximately $1.5 billion as of December 31, 2013. To date, none of the leveraged leasetransactions that involve AGM has experienced an early termination due to a lease default and a claim on the AGM policy. It isdifficult to determine the probability that AGM will have to pay strip provider claims or the likely aggregate amount of suchclaims. At December 31, 2013, approximately $1.2 billion of cumulative strip par exposure had been terminated since 2008 ona consensual basis. The consensual terminations have resulted in no claims on AGM.
On July 1, 2009, AGM and DCL, acting through its New York Branch (“Dexia Crédit Local (NY)”), entered into acredit facility (the “Strip Coverage Facility”). Under the Strip Coverage Facility, Dexia Crédit Local (NY) agreed to make loansto AGM to finance all draws made by lessors on AGM strip policies that were outstanding as of November 13, 2008, up to the
0345r4.indd 251 3/19/14 3:29 PM

250
commitment amount. The commitment amount of the Strip Coverage Facility was $1 billion at closing of the AGMHAcquisition but is scheduled to amortize over time. The maximum commitment amount of the Strip Coverage Facility hadamortized to approximately $968 million as of December 31, 2013 and to approximately $960 million as of February 1, 2014.On February 7, 2014, AGM reduced the maximum commitment amount by $460 million to approximately $500 million, aftertaking into account its experience with its exposure to leveraged lease transactions to date.
Fundings under this facility are subject to certain conditions precedent, and their repayment is collateralized by asecurity interest that AGM granted to Dexia Crédit Local (NY) in amounts that AGM recovers—from the tax-exempt entity, orfrom asset sale proceeds—following its payment of strip policy claims. The Strip Coverage Facility will terminate upon theearliest to occur of an AGM change of control, the reduction of the commitment amount to $0, and January 31, 2042.
The Strip Coverage Facility’s financial covenants require that AGM and its subsidiaries maintain a maximum debt-to-capital ratio of 30% and maintain a minimum net worth of 75% of consolidated net worth as of July 1, 2009, plus, startingJuly 1, 2014, (i) 25% of the aggregate consolidated net income (or loss) for the period beginning July 1, 2009 and ending onJune 30, 2014 or, (2) zero, if the commitment amount has been reduced to $750 million as described above. The Company is incompliance with all financial covenants as of December 31, 2013.
The Strip Coverage Facility contains restrictions on AGM, including, among other things, in respect of its ability toincur debt, permit liens, pay dividends or make distributions, dissolve or become party to a merger or consolidation. Most ofthese restrictions are subject to exceptions. The Strip Coverage Facility has customary events of default, including (subject tocertain materiality thresholds and grace periods) payment default, bankruptcy or insolvency proceedings and cross-default toother debt agreements.
As of December 31, 2013, no amounts were outstanding under this facility, nor have there been any borrowings duringthe life of this facility.
Intercompany Credit Facility
On October 25, 2013, AGL, as borrower, and AGUS, as lender, entered into a revolving credit facility pursuant towhich AGL may, from time to time, borrow for general corporate purposes. Under the credit facility, AGUS committed to lenda principal amount not exceeding $225 million in the aggregate. Such commitment terminates on October 25, 2018 (the “loantermination date”). The unpaid principal amount of each loan will bear interest at a fixed rate equal to 100% of the thenapplicable Federal short-term or mid-term interest rate, as the case may be, as determined under Internal Revenue Code Sec.1274(d), and interest on all loans will be computed for the actual number of days elapsed on the basis of a year consisting of360 days. Accrued interest on all loans will be paid on the last day of each June and December, beginning on December 31,2013, and at maturity. AGL must repay the then unpaid principal amounts of the loans by the third anniversary of the loantermination date. No amounts are currently outstanding under the credit facility.
Limited Recourse Credit Facilities
AG Re Credit Facility
AG Re had a $200 million limited recourse credit facility for the payment of losses in respect of cumulative municipallosses (net of any recoveries) in excess of the greater of $260 million or the average annual Debt Service of the coveredportfolio multiplied by 4.5%. The obligation to repay loans under this agreement is a limited recourse obligation payable solelyfrom, and collateralized by, a pledge of recoveries realized on defaulted insured obligations in the covered portfolio, includingcertain installment premiums and other collateral. AG Re terminated this credit facility effective March 3, 2013.
Committed Capital Securities
On April 8, 2005, AGC entered into separate agreements (the “Put Agreements”) with four custodial trusts (each, a“Custodial Trust”) pursuant to which AGC may, at its option, cause each of the Custodial Trusts to purchase up to $50 millionof perpetual preferred stock of AGC (the “AGC Preferred Stock”). The custodial trusts were created as a vehicle for providingcapital support to AGC by allowing AGC to obtain immediate access to new capital at its sole discretion at any time throughthe exercise of the put option. If the put options were exercised, AGC would receive $200 million in return for the issuance ofits own perpetual preferred stock, the proceeds of which may be used for any purpose, including the payment of claims. The putoptions have not been exercised through the date of this filing.
0345r4.indd 252 3/19/14 3:29 PM

251
Distributions on the AGC CCS are determined pursuant to an auction process. On April 7, 2008 this auction processfailed, thereby increasing the annualized rate on the AGC CCS to one-month LIBOR plus 250 basis points. Distributions on theAGC preferred stock will be determined pursuant to the same process.
In June 2003, $200 million of “AGM CPS”, money market preferred trust securities, were issued by trusts created forthe primary purpose of issuing the AGM CPS, investing the proceeds in high-quality commercial paper and selling put optionsto AGM, allowing AGM to issue the trusts non-cumulative redeemable perpetual preferred stock (the “AGM Preferred Stock”)of AGM in exchange for cash. There are four trusts, each with an initial aggregate face amount of $50 million. These trusts holdauctions every 28 days, at which time investors submit bid orders to purchase AGM CPS. If AGM were to exercise a putoption, the applicable trust would transfer the portion of the proceeds attributable to principal received upon maturity of itsassets, net of expenses, to AGM in exchange for AGM Preferred Stock. AGM pays a floating put premium to the trusts, whichrepresents the difference between the commercial paper yield and the winning auction rate (plus all fees and expenses of thetrust). If an auction does not attract sufficient clearing bids, however, the auction rate is subject to a maximum rate of one-month LIBOR plus 200 basis points for the next succeeding distribution period. Beginning in August 2007, the AGM CPSrequired the maximum rate for each of the relevant trusts. AGM continues to have the ability to exercise its put option andcause the related trusts to purchase AGM Preferred Stock. The trusts provide AGM access to new capital at its sole discretionthrough the exercise of the put options. As of December 31, 2013 the put option had not been exercised. The Company does notconsider itself to be the primary beneficiary of the trusts. See Note 8, Fair Value Measurement, –Other Assets–CommittedCapital Securities, for a fair value measurement discussion.
18. Earnings Per Share
Accounting Policy
The Company computes earnings per share ("EPS") using a two-class method by including participating securitieswhich entitle their holders to receive nonforfeitable dividends or dividend equivalents before vesting. Restricted stock awardsand share units under the AGC supplemental employee retirement plan ("SERP") plan are considered participating securities asthey received non-forfeitable rights to dividends at the same rate as common stock.
The two-class method of computing EPS is an earnings allocation formula that determines EPS for each class ofcommon stock and participating security according to dividends declared (or accumulated) and participation rights inundistributed earnings. Basic EPS is then calculated by dividing net (loss) income available to common shareholders ofAssured Guaranty by the weighted�average number of common shares outstanding during the period. Diluted EPS adjusts basicEPS for the effects of restricted stock, stock options, equity units and other potentially dilutive financial instruments (“dilutivesecurities”), only in the periods in which such effect is dilutive. The effect of the dilutive securities is reflected in diluted EPSby application of the more dilutive of (1) the treasury stock method or (2) the two-class method assuming nonvested shares arenot converted into common shares. With respect to the equity units, which were settled on June 1, 2012 (see Note 17, Long-Term Debt and Credit Facilities), the Company used the treasury stock method in computing diluted EPS. Equity forwardswere included in the calculation of basic EPS when such forward contracts were satisfied and the holders thereof becamecommon stock holders. The Company has a single class of common stock.
0345r4.indd 253 3/19/14 3:29 PM

252
Net income (loss) attributable to AGL $ 808 $ 110 773Less: Distributed and undistributed income (loss) available to nonvestedshareholders 1 0 1Distributed and undistributed income (loss) available to commonshareholders of AGL and subsidiaries, basic $ 807 $ 110 772Basic shares 186.6 189.2 183.4
Distributed and undistributed income (loss) available to commonshareholders of AGL and subsidiaries, basic $ 807 $ 110 $ 772Plus: Re-allocation of undistributed income (loss) available to nonvestedshareholders of AGL and subsidiaries 0 0 0Distributed and undistributed income (loss) available to commonshareholders of AGL and subsidiaries, diluted $ 807 $ 110 $ 772
Basic shares 186.6 189.2 183.4Effect of dilutive securities:
Options and restricted stock awards 1.0 0.8 0.9Equity units — 0.7 1.2
Diluted shares 187.6 190.7 185.5
Potentially dilutive securities excluded from computation of EPS becauseof antidilutive effect 2.7 9.9 7.2
AGL has authorized share capital of $5 million divided into 500,000,000 shares, par value $0.01 per share. Except asdescribed below, AGL's common shares have no preemptive rights or other rights to subscribe for additional common shares,no rights of redemption, conversion or exchange and no sinking fund rights. In the event of liquidation, dissolution or winding-up, the holders of AGL's common shares are entitled to share equally, in proportion to the number of common shares held bysuch holder, in AGL's assets, if any remain after the payment of all its liabilities and the liquidation preference of anyoutstanding preferred shares. Under certain circumstances, AGL has the right to purchase all or a portion of the shares held by ashareholder at fair market value. All of the common shares are fully paid and non assessable. Holders of AGL's common sharesare entitled to receive dividends as lawfully may be declared from time to time by AGL's Board of Directors.
In general, and except as provided below, shareholders have one vote for each common share held by them and areentitled to vote with respect to their fully paid shares at all meetings of shareholders. However, if, and so long as, the commonshares (and other of AGL's shares) of a shareholder are treated as "controlled shares" (as determined pursuant to section 958 ofthe Code) of any U.S. Person and such controlled shares constitute 9.5% or more of the votes conferred by AGL's issued andoutstanding shares, the voting rights with respect to the controlled shares owned by such U.S. Person shall be limited, in theaggregate, to a voting power of less than 9.5% of the voting power of all issued and outstanding shares, under a formulaspecified in AGL's Bye-laws. The formula is applied repeatedly until there is no U.S. Person whose controlled shares constitute9.5% or more of the voting power of all issued and outstanding shares and who generally would be required to recognizeincome with respect to AGL under the Code if AGL were a controlled foreign corporation as defined in the Code and if theownership threshold under the Code were 9.5% (as defined in AGL's Bye-Laws as a "9.5% U.S. Shareholder").
0345r4.indd 254 3/19/14 3:29 PM

253
Subject to AGL's Bye-Laws and Bermuda law, AGL's Board of Directors has the power to issue any of AGL'sunissued shares as it determines, including the issuance of any shares or class of shares with preferred, deferred or other specialrights.
Issuance of Shares
Number ofShares
Price perShare Proceeds
NetProceeds
(in millions, except share and per share amounts)
June 1, 2012(1) 13,428,770 $ 12.85 $ 173 $ 173 ____________________(1) Relates to the settlement of forward purchase contracts. See Note 17, Long-Term Debt and Credit Facilities.
Under AGL's Bye-Laws and subject to Bermuda law, if AGL's Board of Directors determines that any ownership ofAGL's shares may result in adverse tax, legal or regulatory consequences to the Company, any of the Company's subsidiaries orany of its shareholders or indirect holders of shares or its Affiliates (other than such as AGL's Board of Directors considers deminimis), the Company has the option, but not the obligation, to require such shareholder to sell to AGL or to a third party towhom AGL assigns the repurchase right the minimum number of common shares necessary to avoid or cure any such adverseconsequences at a price determined in the discretion of the Board of Directors to represent the shares' fair market value (asdefined in AGL's Bye-Laws). In addition, AGL's Board of Directors may determine that shares held carry different votingrights when it deems it appropriate to do so to (i) avoid the existence of any 9.5% U.S. Shareholder; and (ii) avoid adverse tax,legal or regulatory consequences to AGL or any of its subsidiaries or any direct or indirect holder of shares or its affiliates."Controlled shares" includes, among other things, all shares of AGL that such U.S. Person is deemed to own directly, indirectlyor constructively (within the meaning of section 958 of the Code). Further, these provisions do not apply in the event oneshareholder owns greater than 75% of the voting power of all issued and outstanding shares.
Under these provisions, certain shareholders may have their voting rights limited to less than one vote per share, whileother shareholders may have voting rights in excess of one vote per share. Moreover, these provisions could have the effect ofreducing the votes of certain shareholders who would not otherwise be subject to the 9.5% limitation by virtue of their directshare ownership. AGL's Bye-laws provide that it will use its best efforts to notify shareholders of their voting interests prior toany vote to be taken by them.
Share Repurchases
As of December 31, 2013, the Company's share repurchase authorization was $400 million. The Company expects therepurchases to be made from time to time in the open market or in privately negotiated transactions. The timing, form andamount of the share repurchases under the program are at the discretion of management and will depend on a variety of factors,including availability of funds at the holding companies, market conditions, the Company's capital position, legal requirementsand other factors. The repurchase program may be modified, extended or terminated by the Board of Directors at any time. Itdoes not have an expiration date. In 2013, the Company had repurchased a total of 12.5 million common shares forapproximately $264 million at an average price of $21.12 per share. This included 5.0 million common shares purchased onJune 5, 2013 from funds associated with WL Ross & Co. LLC and its affiliates (collectively, the “WLR Funds”) and Wilbur L.Ross, Jr., a director of the Company, for $109.7 million. Such share purchase reduced the WLR Funds’ and Mr. Ross’sownership of AGL's common shares to approximately 14.9 million common shares, or to approximately 8% of its totalcommon shares outstanding, from approximately 10.5% of such outstanding common shares.
Share Repurchases
YearNumber of Shares
Repurchased Total Payments
(in millions)
2013 12,512,759 $ 2642012 2,066,759 242011 2,000,000 23
0345r4.indd 255 3/19/14 3:29 PM

254
Deferred Compensation
Each of the Chief Executive Officer and the General Counsel of the Company has elected to invest a portion of hisCompany SERP account in the employer stock fund within the SERP. Each unit in the employer stock fund represents the rightto receive one AGL common share upon a distribution from the SERP. Each unit equals the number of AGL common shareswhich could have been purchased with the value of the account deemed invested in the employer stock fund as of the date ofsuch election. The election to invest in the employer stock fund is irrevocable (i.e., any portion of a SERP account allocated tothe employer stock fund and invested in units shall remain allocated to the employer stock fund until the participant receives adistribution from SERP). At the same time such investment elections were made, the Company purchased AGL common sharesand placed such shares in trust to be distributed to the Chief Executive Officer and the General Counsel upon a distributionfrom the SERP in settlement of their units invested in the employer stock fund. As of December 31, 2013 and 2012, theCompany had 320,193 and 320,193 shares, respectively, in the trust. The Company recorded the purchase of such shares in“deferred equity compensation” in the consolidated balance sheet.
Certain executives of the Company elected to invest a portion of their Assured Guaranty Corp. supplemental employeeretirement plan (“AGC SERP”) accounts in the employer stock fund in the AGC SERP. Each unit in the employer stock fundrepresents the right to receive one AGL common share upon a distribution from the AGC SERP. Each unit equals the number ofAGL common shares which could have been purchased with the value of the account deemed invested in the employer stockfund as of the date of such election. As of December 31, 2013 and 2012, there were 74,309 and 68,181 units, respectively, inthe AGC SERP. See Note 20, Employee Benefit Plans.
Dividends
Any determination to pay cash dividends is at the discretion of the Company's Board of Directors, and depends uponthe Company's results of operations and operating cash flows, its financial position and capital requirements, general businessconditions, legal, tax, regulatory, rating agency and contractual restrictions on the payment of dividends, and any other factorsthe Company's Board of Directors deems relevant. For more information concerning regulatory constraints that affect theCompany's ability to pay dividends, see Note 12, Insurance Company Regulatory Requirements.
On February 5, 2014, the Company declared a quarterly dividend of $0.11 per common share, an increase of 10%from a quarterly dividend of $0.10 per common share paid in 2013. On February 7, 2013, the Company declared a quarterlydividend of $0.10 per common share, an increase of 11% from a quarterly dividend of $0.09 per common share paid in 2012.On February 9, 2012, the Company declared a quarterly dividend of $0.09 per common share, an increase of 100% from aquarterly dividend of $0.045 per common share paid in 2011 and 2010.
20. Employee Benefit Plans
Accounting Policy
The expense for Performance Retention Plan awards is recognized straight-line over the requisite service period, withthe exception of retirement eligible employees. For retirement eligible employees, the expense is recognized immediately.
Share-based compensation expense is based on the grant date fair value using grant date closing price, the lattice,Monte Carlo or Black-Scholes pricing models. The Company amortizes the fair value of share-based awards on a straight-linebasis over the requisite service periods of the awards, which are generally the vesting periods, with the exception ofretirement�eligible employees. For retirement-eligible employees, certain awards contain retirement provisions and thereforeare amortized over the period through the date the employee first becomes eligible to retire and is no longer required to provideservice to earn part or all of the award.
The fair value of each award under the Assured Guaranty Ltd. Employee Stock Purchase Plan (the “Stock PurchasePlan”) is estimated at the beginning of each offering period using the Black-Scholes option valuation model.
Assured Guaranty Ltd. 2004 Long-Term Incentive Plan
Under the Assured Guaranty Ltd. 2004 Long-Term Incentive Plan, as amended (the “Incentive Plan”), the number ofAGL common shares that may be delivered under the Incentive Plan may not exceed 10,970,000. In the event of certaintransactions affecting AGL's common shares, the number or type of shares subject to the Incentive Plan, the number and type of
0345r4.indd 256 3/19/14 3:29 PM

255
shares subject to outstanding awards under the Incentive Plan, and the exercise price of awards under the Incentive Plan, maybe adjusted.
The Incentive Plan authorizes the grant of incentive stock options, non-qualified stock options, stock appreciationrights, and full value awards that are based on AGL's common shares. The grant of full value awards may be in return for aparticipant's previously performed services, or in return for the participant surrendering other compensation that may be due, ormay be contingent on the achievement of performance or other objectives during a specified period, or may be subject to a riskof forfeiture or other restrictions that will lapse upon the achievement of one or more goals relating to completion of service bythe participant, or achievement of performance or other objectives. Awards under the Incentive Plan may accelerate and becomevested upon a change in control of AGL.
The Incentive Plan is administered by a committee of the Board of Directors. The Compensation Committee of theBoard serves as this committee except as otherwise determined by the Board. The Board may amend or terminate the IncentivePlan. As of December 31, 2013, 3,189,396 common shares were available for grant under the Incentive Plan.
Time Vested Stock Options
Nonqualified or incentive stock options may be granted to employees and directors of the Company. Stock options aregenerally granted once a year with exercise prices equal to the closing price on the date of grant. To date, the Company has onlyissued nonqualified stock options. All stock options, except for performance stock options, granted to employees vest in equalannual installments over a three-year period and expire seven years or ten years from the date of grant. Stock options granted todirectors vest over one year and expire in seven years or ten years from grant date. None of the Company's options, except forperformance stock options, have a performance or market condition.
Time Vested Stock Options
Options forCommon Shares
WeightedAverage
Exercise Price
WeightedAverage GrantDate Fair Value
Per Share
Number ofExercisable
OptionsYear of
ExpirationBalance as of December 31, 2012 4,229,555 $ 20.10 4,047,374Options granted 102,355 19.36 $ 8.94 2020Options exercised (1,199,339) 17.75Options forfeited/expired (3,320) 24.21Balance as of December 31, 2013 3,129,251 $ 20.97 2,987,088
As of December 31, 2013, the aggregate intrinsic value and weighted average remaining contractual term of stockoptions outstanding were $11 million and 3.5 years, respectively. As of December 31, 2013, the aggregate intrinsic value andweighted average remaining contractual term of exercisable stock options were $10 million and 3.4 years, respectively.
As of December 31, 2013 the total unrecognized compensation expense related to outstanding nonvested stock optionswas $1 million, which will be adjusted in the future for the difference between estimated and actual forfeitures. The Companyexpects to recognize that expense over the weighted average remaining service period of 1.4 years.
0345r4.indd 257 3/19/14 3:29 PM

256
Lattice Option PricingWeighted Average Assumptions(1)
2013 2012
Dividend yield 2.07% 2.06%Expected volatility 53.41% 58.89%Risk free interest rate 1.35% 1.45%Expected life 6.6 years 6.6 yearsForfeiture rate 4.5% 4.5%Weighted average grant date fair value $ 8.94 8.62
____________________(1) No options were granted in 2011.
The expected dividend yield is based on the current expected annual dividend and share price on the grant date. Theexpected volatility is estimated at the date of grant based on an average of the 7-year historical share price volatility andimplied volatilities of certain at-the-money actively traded call options in the Company. The risk-free interest rate is the implied7-year yield currently available on U.S. Treasury zero-coupon issues at the date of grant. The forfeiture rate is based on thehistorical employee termination information.
The total intrinsic value of stock options exercised during the years ended December 31, 2013, 2012 and 2011 was$7.5 million, $0.1 million and $0.3 million, respectively. During the years ended December 31, 2013, 2012 and 2011, $2.6million, $44 thousand and $0.6 million, respectively, was received from the exercise of stock options. In order to satisfy stockoption exercises, the Company issues new shares.
Performance Stock Options
In 2012 and 2013, the Company granted performance stock options under the Incentive Plan. These awards are non-qualified stock options with exercise prices equal to the closing price an AGL common share on the applicable date of grant.These awards vest 35%, 50% or 100%, if the price of AGL's common shares using the highest 40-day average share priceduring the relevant performance period reaches certain hurdles. If the share price is between the specified levels, the vestinglevel will be interpolated accordingly. These awards expire seven years from the date of grant.
Performance Stock Options
Options forCommon Shares
WeightedAverage
Exercise Price
WeightedAverage GrantDate Fair Value
Per Share
Number ofExercisable
OptionsYear of
ExpirationBalance as of December 31, 2012 293,077 $ 17.44 0Options granted 72,640 19.24 $ 8.17 2020Options exercised — —Options forfeited/expired — —Balance as of December 31, 2013 365,717 $ 17.80 0
In order to satisfy stock option exercises, the Company issues new shares.
As of December 31, 2013, the aggregate intrinsic value and weighted average remaining contractual term ofperformance stock options outstanding were $2 million and 5.3 years, respectively. As of December 31, 2013, no performanceoptions were exercisable.
As of December 31, 2013 the total unrecognized compensation expense related to outstanding nonvested performancestock options was $1 million, which will be adjusted in the future for the difference between estimated and actual forfeitures.The Company expects to recognize that expense over the weighted average remaining service period of 1.4 years.
0345r4.indd 258 3/19/14 3:29 PM

257
Monte Carlo and Lattice Option PricingWeighted Average Assumptions
2013 2012Dividend yield 2.07% 2.06%Expected volatility 53.5% 58.89%Risk free interest rate 1.36% 1.45%Expected life 6.3 years 6.3 yearsForfeiture rate 4.5% 4.5%Weighted average grant date fair value $ 8.17 $ 7.84
The expected dividend yield is based on the current expected annual dividend and share price on the grant date. Theexpected volatility is estimated at the date of grant based on an average of the 7-year historical share price volatility andimplied volatilities of certain at-the-money actively traded call options in the Company. The risk-free interest rate is the implied7-year yield currently available on U.S. Treasury zero-coupon issues at the date of grant. The forfeiture rate is based on thehistorical employee termination information.
Restricted Stock Awards
Restricted stock awards to employees generally vest in equal annual installments over a four-year period and restrictedstock awards to outside directors vest in full in one year. Restricted stock awards are amortized on a straight-line basis over therequisite service periods of the awards, and restricted stock awards to outside directors are amortized over one year, which aregenerally the vesting periods, with the exception of retirement-eligible employees, discussed above.
Restricted Stock Award Activity
Nonvested SharesNumber of
Shares
WeightedAverage GrantDate Fair Value
Per ShareNonvested at December 31, 2012 88,549 $ 12.93Granted 48,273 23.20Vested (88,549) 12.93Forfeited — —Nonvested at December 31, 2013 48,273 $ 23.20
As of December 31, 2013 the total unrecognized compensation cost related to outstanding nonvested restricted stockawards was $0.4 million, which the Company expects to recognize over the weighted-average remaining service period of 0.4years. The total fair value of shares vested during the years ended December 31, 2013, 2012 and 2011 was $1 million, $1million and $4 million, respectively.
Restricted Stock Units
Restricted stock units are valued based on the closing price of the underlying shares at the date of grant. Restrictedstock units awarded to employees have vesting terms similar to those of the restricted stock awards and are delivered on thevesting date. The Company has granted restricted stock units to directors of the Company. Restricted stock units awarded todirectors vest over a one-year period and are delivered after directors terminate from the board of directors.
0345r4.indd 259 3/19/14 3:29 PM

258
Restricted Stock Unit Activity(Excluding Dividend Equivalents)
Nonvested Stock UnitsNumber ofStock Units
WeightedAverage GrantDate Fair Value
Per Share
Nonvested at December 31, 2012 1,006,411 $ 16.78Granted 93,580 19.29Delivered (361,157) 15.04Forfeited (2,425) 17.85Nonvested at December 31, 2013 736,409 $ 17.63
As of December 31, 2013, the total unrecognized compensation cost related to outstanding nonvested restricted stockunits was $4 million, which the Company expects to recognize over the weighted-average remaining service period of 1.5years. The total fair value of restricted stock units delivered during the years ended December 31, 2013, 2012 and 2011 was $5million, $6 million and $5 million, respectively.
Performance Restricted Stock Units
Beginning in 2012, the Company has granted performance restricted stock units under the Incentive Plan. Theseawards vest 35%, 100%, or 200%, if the price of AGL's common shares using the highest 40-day average share price during therelevant performance period reaches certain hurdles. If the share price is between the specified levels, the vesting level will beinterpolated accordingly.
Performance Restricted Stock Unit Activity
Performance Restricted Stock Units
Number ofPerformanceShare Units
WeightedAverage GrantDate Fair Value
Per Share
Nonvested at December 31, 2012 178,970 $ 27.35Granted 44,440 29.54Delivered — —Forfeited — —Nonvested at December 31, 2013 223,410 $ 27.79
As of December 31, 2013, the total unrecognized compensation cost related to outstanding nonvested performanceshare units was $3 million, which the Company expects to recognize over the weighted-average remaining service period of 1.4years.
Employee Stock Purchase Plan
The Company established the AGL Employee Stock Purchase Plan ("Stock Purchase Plan") in accordance withInternal Revenue Code Section 423, and participation is available to all eligible employees. Maximum annual purchases byparticipants are limited to the number of whole shares that can be purchased by an amount equal to 10% of the participant'scompensation or, if less, shares having a value of $25,000. Participants may purchase shares at a purchase price equal to 85% ofthe lesser of the fair market value of the stock on the first day or the last day of the subscription period. The Company hasreserved for issuance and purchases under the Stock Purchase Plan 600,000 Assured Guaranty Ltd. common shares.
The fair value of each award under the Stock Purchase Plan is estimated at the beginning of each offering period usingthe Black-Scholes option-pricing model and the following assumptions: a) the expected dividend yield is based on the currentexpected annual dividend and share price on the grant date; b) the expected volatility is estimated at the date of grant based onthe historical share price volatility, calculated on a daily basis; c) the risk-free rate for periods within the contractual life of theoption is based on the U.S. Treasury yield curve in effect at the time of grant; and d) the expected life is based on the term ofthe offering period.
0345r4.indd 260 3/19/14 3:29 PM

259
Stock Purchase Plan
Year Ended December 31,2013 2012 2011
(dollars in millions)
Proceeds from purchase of shares by employees $ 0.9 $ 0.6 $ 0.7Number of shares issued by the Company 57,980 54,612 50,523Recorded in share-based compensation, after the effects of DAC $ 0.3 $ 0.2 $ 0.2
Share�Based Compensation Expense
The following table presents stock based compensation costs by type of award and the effect of deferring such costs aspolicy acquisition costs, pre-tax. Amortization of previously deferred stock compensation costs is not shown in the table below.
Share�Based Compensation Expense Summary
Year Ended December 31,2013 2012 2011
(in millions)
Share�Based Employee Cost:Recurring amortization $ 7 $ 6 $ 5Accelerated amortization for retirement eligible employees — 1 5
Subtotal 7 7 10ESPP — — —Total Share�Based Employee Cost 7 7 10Total Share�Based Directors Cost 1 1 1Total Share�Based Cost 8 8 11Less: Share�based compensation capitalized as DAC — 1 3Share�based compensation expense $ 8 $ 7 $ 8
Income tax benefit $ 2 $ 2 $ 2
Defined Contribution Plan
The Company maintains a savings incentive plan, which is qualified under Section 401(a) of the Internal RevenueCode for U.S. employees. The savings incentive plan is available to eligible full-time employees upon hire. Eligibleparticipants could contribute a percentage of their salary subject to a maximum of $17,500 for 2013. Contributions are matchedby the Company at a rate of 100% up to 6% of participant's compensation, subject to IRS limitations. Any amounts over theIRS limits are contributed to and matched by the Company into a nonqualified supplemental executive retirement plan foremployees eligible to participate in such nonqualified plan. The Company also makes a core contribution of 6% of theparticipant's compensation to the qualified plan, subject to IRS limitations, and the nonqualified supplemental executiveretirement plan for eligible employees, regardless of whether the employee contributes to the plan(s). Employees become fullyvested in Company contributions after one year of service, as defined in the plan. Plan eligibility is immediate upon hire. TheCompany also maintains similar non-qualified plans for non-U.S. employees.
The Company recognized defined contribution expenses of $10 million, $9 million and $10 million for the yearsended December 31, 2013, 2012 and 2011, respectively.
0345r4.indd 261 3/19/14 3:29 PM

260
Cash-Based Compensation
Performance Retention Plan
The Company has established the Assured Guaranty Ltd. Performance Retention Plan (“PRP”) which permits thegrant of cash based awards to selected employees. PRP awards may be treated as nonqualified deferred compensation subject tothe rules of Internal Revenue Code Section 409A. The PRP is a sub-plan under the Company's Long-Term Incentive Plan(enabling awards under the plan to be performance based compensation exempt from the $1 million limit on tax deductiblecompensation).
Generally, each PRP award is divided into three installments, with 25% of the award allocated to a performance periodthat includes the year of the award and the next year, 25% of the award allocated to a performance period that includes the yearof the award and the next two years, and 50% of the award allocated to a performance period that includes the year of theaward and the next three years. Each installment of an award vests if the participant remains employed through the end of theperformance period for that installment. Awards may vest upon the occurrence of other events as set forth in the plandocuments. Payment for each performance period is made at the end of that performance period. One half of each installment isincreased or decreased in proportion to the increase or decrease of per share adjusted book value during the performanceperiod, and one half of each installment is increased or decreased in proportion to the operating return on equity during theperformance period. Operating return on equity and adjusted book value are defined in each PRP award agreement.
A payment otherwise subject to the $1 million limit on tax deductible compensation, will not be made unlessperformance satisfies a minimum threshold.
As described above, the performance measures used to determine the amounts distributable under the PRP are basedon the Company's operating return on equity and growth in per share adjusted book value, as defined. Adjustments may bemade by the AGL Compensation Committee at any time before distribution, except that, for certain senior executive officers,any adjustment made after the grant of the award may decrease but may not increase the amount of the distribution.
In the event of a corporate transaction involving the Company, including, without limitation, any share dividend, sharesplit, extraordinary cash dividend, recapitalization, reorganization, merger, amalgamation, consolidation, split-up, spin-off, saleof assets or subsidiaries, combination or exchange of shares, the Compensation Committee may adjust the calculation of theCompany's adjusted book value and operating return on equity as the Compensation Committee deems necessary or desirablein order to preserve the benefits or potential benefits of PRP awards.
The Company recognized performance retention plan expenses of $17 million, $13 million and $8 million for theyears ended December 31, 2013, 2012 and 2011, respectively.
0345r4.indd 262 3/19/14 3:29 PM

261
21. Other Comprehensive Income
The following tables present the changes in the balances of each component of accumulated other comprehensiveincome and the effect of significant reclassifications out of AOCI on the respective line items in net income.
Changes in Accumulated Other Comprehensive Income by ComponentYear Ended December 31, 2013
Net UnrealizedGains (Losses) on
Investments with noOTTI
Net UnrealizedGains (Losses) onInvestments with
OTTI
CumulativeTranslationAdjustment Cash Flow Hedge
Total AccumulatedOther
ComprehensiveIncome
(in millions)
Balance, December 31, 2012 $ 517 $ (5) $ (6) $ 9 $ 515Other comprehensive income (loss)before reclassified (309) (35) 3 — (341)Amounts reclassified from AOCIto:
Other net realized investmentgain (losses) (43) 24 — — (19)Interest expense — — — (1) (1)
Total before tax (43) 24 — (1) (20)Tax (provision) benefit $ 13 $ (8) $ — $ 1 6
Total amount reclassified fromAOCI, net of tax (30) 16 — 0 (14)Net current period othercomprehensive income (loss) (339) (19) 3 0 (355)Balance, December 31, 2013 $ 178 $ (24) $ (3) $ 9 $ 160
Year Ended December 31, 2012
Net UnrealizedGains (Losses) on
Investments with noOTTI
Net UnrealizedGains (Losses) onInvestments with
OTTI
CumulativeTranslationAdjustment Cash Flow Hedge
Total AccumulatedOther
ComprehensiveIncome
(in millions)
Balance, December 31, 2011 $ 365 $ 2 $ (8) $ 9 $ 368Other comprehensive income (loss) 152 (7) 2 0 147Balance, December 31, 2012 $ 517 $ (5) $ (6) $ 9 $ 515
Year Ended December 31, 2011
Net UnrealizedGains (Losses) on
Investments with noOTTI
Net UnrealizedGains (Losses) onInvestments with
OTTI
CumulativeTranslationAdjustment Cash Flow Hedge
Total AccumulatedOther
ComprehensiveIncome
(in millions)
Balance, December 31, 2010 $ 116 $ (6) $ (8) $ 10 $ 112Other comprehensive income (loss) 249 8 0 (1) 256Balance, December 31, 2011 $ 365 $ 2 $ (8) $ 9 $ 368
0345r4.indd 263 3/19/14 3:29 PM

262
22. Subsidiary Information
The following tables present the condensed consolidating financial information for AGUS and AGMH, wholly-ownedsubsidiaries of AGL, which have issued publicly traded debt securities (see Note 17, Long-Term Debt and Credit Facilities, forthe full description of AGUS and AGMH debt and the related AGL guarantees for such debt) as of December 31, 2013 andDecember 31, 2012 and for the years ended December 31, 2013, 2012 and 2011. The information for AGUS and AGMHpresents its subsidiaries on the equity method of accounting.
0345r4.indd 264 3/19/14 3:29 PM

263
CONDENSED CONSOLIDATING BALANCE SHEETAS OF DECEMBER 31, 2013
(in millions)
AssuredGuaranty Ltd.
(Parent)AGUS(Issuer)
AGMH(Issuer)
OtherEntities
ConsolidatingAdjustments
AssuredGuaranty Ltd.(Consolidated)
ASSETSTotal investment portfolio andcash $ 33 $ 186 $ 42 $ 11,008 $ (300) $ 10,969Investment in subsidiaries 5,066 4,191 3,574 289 (13,120) —Premiums receivable, net ofcommissions payable — — — 1,025 (149) 876Ceded unearned premium reserve — — — 1,598 (1,146) 452Deferred acquisition costs — — — 198 (74) 124Reinsurance recoverable onunpaid losses — — — 170 (134) 36Credit derivative assets — — — 482 (388) 94Deferred tax asset, net — 97 — 681 (90) 688Intercompany receivable — — — 90 (90) —Financial guaranty variableinterest entities’ assets, at fairvalue — — — 2,565 — 2,565Other 23 17 31 638 (226) 483
TOTAL ASSETS $ 5,122 $ 4,491 $ 3,647 $ 18,744 $ (15,717) $ 16,287LIABILITIES ANDSHAREHOLDERS’ EQUITYUnearned premium reserves $ — $ — $ — $ 5,720 $ (1,125) $ 4,595Loss and LAE reserve — — — 733 (141) 592Long-term debt — 348 430 38 — 816Intercompany payable — 90 — 300 (390) —Credit derivative liabilities — — — 2,175 (388) 1,787Deferred tax liabilities, net — — 95 — (95) —Financial guaranty variableinterest entities’ liabilities, at fairvalue — — — 2,871 — 2,871Other 7 7 16 853 (372) 511
TOTAL LIABILITIES 7 445 541 12,690 (2,511) 11,172TOTAL SHAREHOLDERS’EQUITY ATTRIBUTABLE TOASSURED GUARANTY LTD. 5,115 4,046 3,106 5,765 (12,917) 5,115Noncontrolling interest — — — 289 (289) —TOTAL SHAREHOLDERS’EQUITY 5,115 4,046 3,106 6,054 (13,206) 5,115
TOTAL LIABILITIES ANDSHAREHOLDERS’ EQUITY $ 5,122 $ 4,491 $ 3,647 $ 18,744 $ (15,717) $ 16,287
0345r4.indd 265 3/19/14 3:29 PM

264
CONDENSED CONSOLIDATING BALANCE SHEETAS OF DECEMBER 31, 2012
(in millions)
AssuredGuaranty Ltd.
(Parent)AGUS(Issuer)
AGMH(Issuer)
OtherEntities
ConsolidatingAdjustments
AssuredGuaranty Ltd.(Consolidated)
ASSETSTotal investment portfolio andcash $ 245 $ 15 $ 30 $ 11,233 $ (300) $ 11,223Investment in subsidiaries 4,734 3,958 3,225 3,524 (15,441) —Premiums receivable, net ofcommissions payable — — — 1,147 (142) 1,005Ceded unearned premium reserve — — — 1,550 (989) 561Deferred acquisition costs — — — 190 (74) 116Reinsurance recoverable onunpaid losses — — — 223 (165) 58Credit derivative assets — — — 553 (412) 141Deferred tax asset, net — 48 (94) 789 (22) 721Intercompany receivable — — — 173 (173) —Financial guaranty variableinterest entities’ assets, at fairvalue — — — 2,688 — 2,688Other 23 29 26 816 (165) 729
TOTAL ASSETS $ 5,002 $ 4,050 $ 3,187 $ 22,886 $ (17,883) $ 17,242LIABILITIES ANDSHAREHOLDERS’ EQUITYUnearned premium reserves $ — $ — $ — $ 6,168 $ (961) $ 5,207Loss and LAE reserve — — — 778 (177) 601Long-term debt — 347 423 66 — 836Intercompany payable — 173 — 300 (473) —Credit derivative liabilities — 0 — 2,346 (412) 1,934Financial guaranty variableinterest entities’ liabilities, at fairvalue — — — 3,141 — 3,141Other 8 6 15 803 (303) 529
TOTAL LIABILITIES 8 526 438 13,602 (2,326) 12,248TOTAL SHAREHOLDERS’EQUITY 4,994 3,524 2,749 9,284 (15,557) 4,994
TOTAL LIABILITIES ANDSHAREHOLDERS’ EQUITY $ 5,002 $ 4,050 $ 3,187 $ 22,886 $ (17,883) $ 17,242
0345r4.indd 266 3/19/14 3:29 PM

265
CONDENSED CONSOLIDATING STATEMENT OF OPERATIONSAND COMPREHENSIVE INCOME
FOR THE YEAR ENDED DECEMBER 31, 2013(in millions)
AssuredGuaranty Ltd.
(Parent)AGUS(Issuer)
AGMH(Issuer)
OtherEntities
ConsolidatingAdjustments
AssuredGuaranty Ltd.(Consolidated)
REVENUESNet earned premiums $ — $ — $ — $ 740 $ 12 $ 752Net investment income 0 0 1 408 (16) 393Net realized investment gains(losses) 0 0 0 87 (35) 52Net change in fair value of creditderivatives:
Realized gains (losses) and othersettlements — — — (42) — (42)Net unrealized gains (losses) — — — 107 — 107
Net change in fair value ofcredit derivatives — — — 65 — 65
Other — — — 348 (2) 346TOTAL REVENUES 0 0 1 1,648 (41) 1,608
EXPENSESLoss and LAE — — — 144 10 154Amortization of deferredacquisition costs — — — 12 0 12Interest expense — 28 54 20 (20) 82Other operating expenses 22 1 1 199 (5) 218
TOTAL EXPENSES 22 29 55 375 (15) 466INCOME (LOSS) BEFOREINCOME TAXES AND EQUITYIN NET EARNINGS OFSUBSIDIARIES (22) (29) (54) 1,273 (26) 1,142Total (provision) benefit forincome taxes — 9 17 (387) 27 (334)Equity in earnings of subsidiaries $ 830 $ 768 $ 701 $ 19 $ (2,318) —NET INCOME (LOSS) 808 748 664 905 (2,317) 808Less: noncontrolling interest — — — 19 (19) —NET INCOME (LOSS)ATTRIBUTABLE TOASSURED GUARANTY LTD. $ 808 $ 748 $ 664 $ 886 $ (2,298) $ 808
COMPREHENSIVE INCOME(LOSS) $ 453 $ 522 $ 515 $ 309 $ (1,346) $ 453
0345r4.indd 267 3/19/14 3:29 PM

266
CONDENSED CONSOLIDATING STATEMENT OF OPERATIONSAND COMPREHENSIVE INCOME
FOR THE YEAR ENDED DECEMBER 31, 2012(in millions)
AssuredGuaranty Ltd.
(Parent)AGUS(Issuer)
AGMH(Issuer)
OtherEntities
ConsolidatingAdjustments
AssuredGuaranty Ltd.(Consolidated)
REVENUESNet earned premiums $ — $ — $ — $ 833 $ 20 $ 853Net investment income 0 — 1 422 (19) 404Net realized investment gains(losses) — — — 1 — 1Net change in fair value of creditderivatives:
Realized gains (losses) and othersettlements — — — (108) — (108)Net unrealized gains (losses) — — — (477) — (477)
Net change in fair value ofcredit derivatives — — — (585) — (585)
Other — — — 284 (3) 281TOTAL REVENUES 0 — 1 955 (2) 954
EXPENSESLoss and LAE — — — 509 (5) 504Amortization of deferredacquisition costs — — — 28 (14) 14Interest expense — 35 54 22 (19) 92Other operating expenses 21 2 1 194 (6) 212
TOTAL EXPENSES 21 37 55 753 (44) 822INCOME (LOSS) BEFOREINCOME TAXES AND EQUITYIN NET EARNINGS OFSUBSIDIARIES (21) (37) (54) 202 42 132Total (provision) benefit forincome taxes — 13 19 (38) (16) (22)Equity in earnings of subsidiaries 131 177 424 153 (885) —NET INCOME (LOSS) $ 110 $ 153 $ 389 $ 317 $ (859) $ 110
COMPREHENSIVE INCOME(LOSS) $ 257 $ 266 $ 465 $ 577 $ (1,308) $ 257
0345r4.indd 268 3/19/14 3:29 PM

267
CONDENSED CONSOLIDATING STATEMENT OF OPERATIONSAND COMPREHENSIVE INCOME
FOR THE YEAR ENDED DECEMBER 31, 2011(in millions)
AssuredGuaranty Ltd.
(Parent)AGUS(Issuer)
AGMH(Issuer)
OtherEntities
ConsolidatingAdjustments
AssuredGuaranty Ltd.(Consolidated)
REVENUESNet earned premiums $ — $ — $ — $ 904 $ 16 $ 920Net investment income — — 1 410 (15) 396Net realized investment gains(losses) — — — (18) — (18)Net change in fair value of creditderivatives:
Realized gains (losses) and othersettlements — — — 6 — 6Net unrealized gains (losses) — — — 554 — 554
Net change in fair value ofcredit derivatives — — — 560 — 560
Other — — — (48) (5) (53)TOTAL REVENUES — — 1 1,808 (4) 1,805
EXPENSESLoss and LAE — — — 440 8 448Amortization of deferredacquisition costs — — — 37 (20) 17Interest expense — 39 54 21 (15) 99Other operating expenses 25 1 1 194 (9) 212
TOTAL EXPENSES 25 40 55 692 (36) 776INCOME (LOSS) BEFOREINCOME TAXES AND EQUITYIN NET EARNINGS OFSUBSIDIARIES (25) (40) (54) 1,116 32 1,029Total (provision) benefit forincome taxes — 14 19 (277) (12) (256)Equity in earnings of subsidiaries 798 640 398 614 (2,450) —NET INCOME (LOSS) $ 773 $ 614 $ 363 $ 1,453 $ (2,430) $ 773
COMPREHENSIVE INCOME(LOSS) $ 1,029 $ 824 $ 507 $ 1,918 $ (3,249) $ 1,029
0345r4.indd 269 3/19/14 3:29 PM

268
CONDENSED CONSOLIDATING STATEMENT OF CASH FLOWSFOR THE YEAR ENDED DECEMBER 31, 2013
(in millions)
AssuredGuaranty Ltd.
(Parent)AGUS(Issuer)
AGMH(Issuer)
OtherEntities
ConsolidatingAdjustments
AssuredGuaranty Ltd.(Consolidated)
Net cash flows provided by(used in) operating activities $ 128 $ 178 $ 133 $ 347 $ (542) $ 244Cash flows from investingactivitiesFixed-maturity securities:
Purchases — (93) (26) (1,832) 65 (1,886)Sales 176 1 25 892 (65) 1,029Maturities 29 3 2 849 — 883
Sales (purchases) of short-terminvestments, net 7 (28) (15) (51) — (87)Net proceeds from financialguaranty variable entities’ assets — — — 663 — 663Intercompany debt — — — 7 (7) —Investment in subsidiary — 0 49 — (49) —Other — — — 79 — 79Net cash flows provided by(used in) investing activities 212 (117) 35 607 (56) 681Cash flows from financingactivitiesReturn of capital — — — (50) 50 —Capital contribution from parent — — — 1 (1) —Dividends paid (75) — (168) (374) 542 (75)Repurchases of common stock (264) — — — — (264)Share activity under option andincentive plans (1) — — — — (1)Net paydowns of financialguaranty variable entities’liabilities — — — (511) — (511)Payment of long-term debt — — — (27) — (27)Intercompany debt — (7) — — 7 —Net cash flows provided by(used in) financing activities (340) (7) (168) (961) 598 (878)Effect of exchange rate changes — — — (1) — (1)Increase (decrease) in cash 0 54 — (8) — 46Cash at beginning of period — 13 0 125 — 138Cash at end of period $ 0 $ 67 $ 0 $ 117 $ — $ 184
0345r4.indd 270 3/19/14 3:29 PM

269
CONDENSED CONSOLIDATING STATEMENT OF CASH FLOWSFOR THE YEAR ENDED DECEMBER 31, 2012
(in millions)
AssuredGuaranty Ltd.
(Parent)AGUS(Issuer)
AGMH(Issuer)
OtherEntities
ConsolidatingAdjustments
AssuredGuaranty Ltd.(Consolidated)
Net cash flows provided by(used in) operating activities $ 138 $ 6 $ 20 $ 5 $ (334) $ (165)Cash flows from investingactivitiesFixed-maturity securities:
Purchases (211) (1) (13) (1,424) — (1,649)Sales — — 13 899 — 912Maturities 3 — 6 1,096 — 1,105
Sales (purchases) of short-terminvestments, net (7) 27 26 (17) — 29Net proceeds from financialguaranty variable entities’ assets — — — 545 — 545Acquisition of MAC — (91) — — — (91)Intercompany debt — — — (173) 173 —Investment in subsidiary — — 46 — (46) —Other — — — 92 — 92Net cash flows provided by(used in) investing activities (215) (65) 78 1,018 127 943Cash flows from financingactivities
—
Issuance of common stock 173 — — — — 173
Return of capital — — — (50) 50 —
Capital contribution from parent — — — 4 (4) —Dividends paid (69) — (98) (236) 334 (69)
Repurchases of common stock (24) — — — — (24)Share activity under option andincentive plans (3) — — — — (3)Net paydowns of financialguaranty variable entities’liabilities — — — (724) — (724)Payment of long-term debt — (173) — (36) — (209)Intercompany debt — 173 — — (173) —Net cash flows provided by(used in) financing activities 77 — (98) (1,042) 207 (856)Effect of exchange rate changes — — — 1 — 1Increase (decrease) in cash — (59) — (18) — (77)Cash at beginning of period — 72 0 143 — 215Cash at end of period $ — $ 13 $ — $ 125 $ — $ 138
0345r4.indd 271 3/19/14 3:29 PM

270
CONDENSED CONSOLIDATING STATEMENT OF CASH FLOWSFOR THE YEAR ENDED DECEMBER 31, 2011
(in millions)
AssuredGuaranty Ltd.
(Parent)AGUS(Issuer)
AGMH(Issuer)
OtherEntities
ConsolidatingAdjustments
AssuredGuaranty Ltd.(Consolidated)
Net cash flows provided by(used in) operating activities $ 68 $ 84 $ (36) $ 676 $ (116) $ 676Cash flows from investingactivitiesFixed-maturity securities:
Purchases — — (14) (2,294) — (2,308)Sales — — — 1,107 — 1,107Maturities — — 1 662 — 663
Sales (purchases) of short-terminvestments, net (11) (25) (1) 357 — 320Net proceeds from financialguaranty variable entities’ assets — — — 760 — 760Investment in subsidiary — — 50 — (50) —Other — — — 19 — 19Net cash flows provided by(used in) investing activities (11) (25) 36 611 (50) 561Cash flows from financingactivitiesReturn of capital — — — (50) 50 —Dividends paid (33) — — (116) 116 (33)Repurchases of common stock (23) — — — — (23)Share activity under option andincentive plans (1) — — — — (1)Net paydowns of financialguaranty variable entities’liabilities — — — (1,053) — (1,053)Payment of long-term debt — — — (22) — (22)Net cash flows provided by(used in) financing activities (57) — — (1,241) 166 (1,132)Effect of exchange rate changes — — — 2 — 2Increase (decrease) in cash — 59 — 48 — 107Cash at beginning of period — 13 — 95 — 108Cash at end of period $ — $ 72 $ — $ 143 $ — $ 215
0345r4.indd 272 3/19/14 3:29 PM

271
23. Quarterly Financial Information (Unaudited)
A summary of selected quarterly information follows:
2013First
QuarterSecondQuarter
ThirdQuarter
FourthQuarter
FullYear
(dollars in millions, except per share data)
Revenues Net earned premiums $ 248 $ 163 $ 159 $ 182 $ 752 Net investment income 94 93 99 107 393 Net realized investment gains (losses) 28 2 (7) 29 52 Net change in fair value of credit derivatives (592) 74 354 229 65 Fair value gains (losses) on CCS (10) (3) 9 14 10 Fair value gains (losses) on FG VIEs 70 143 40 93 346 Other income (loss) (14) (7) 16 (5) (10)Expenses Loss and LAE (48) 62 55 85 154 Amortization of DAC 3 1 4 4 12 Interest expense 21 21 21 19 82 Other operating expenses 60 52 54 52 218Income (loss) before provision for income taxes (212) 329 536 489 1,142Provision (benefit) for income taxes (68) 110 152 140 334Net income (loss) (144) 219 384 349 808Earnings (loss) per share(1): Basic $ (0.74) $ 1.17 $ 2.10 $ 1.91 $ 4.32 Diluted $ (0.74) $ 1.16 $ 2.09 $ 1.90 $ 4.30 Dividends per share $ 0.10 $ 0.10 $ 0.10 $ 0.10 $ 0.40
0345r4.indd 273 3/19/14 3:29 PM

272
2012First
QuarterSecondQuarter
ThirdQuarter
FourthQuarter
FullYear
(dollars in millions, except per share data)
Revenues Net earned premiums $ 194 $ 219 $ 222 $ 218 $ 853 Net investment income 98 101 102 103 404 Net realized investment gains (losses) 1 (3) 2 1 1
Net change in fairl f dit d i ti
(691) 261 (36) (119) (585) Fair value gains (losses) on CCS (14) 4 (2) (6) (18) Fair value gains (losses) on FG VIEs (41) 168 34 30 191 Other income (loss) 91 5 16 (4) 108Expenses Loss and LAE 242 118 86 58 504 Amortization of DAC 5 5 4 0 14 Interest expense 25 25 21 21 92 Other operating expenses 62 53 48 49 212Income (loss) before provision for incometaxes (696) 554 179 95 132Provision (benefit) for income taxes (213) 177 37 21 22Net income (loss) (483) 377 142 74 110Earnings (loss) per share(1): Basic $ (2.65) $ 2.02 $ 0.73 $ 0.38 $ 0.58 Diluted $ (2.65) $ 2.01 $ 0.73 $ 0.38 $ 0.57 Dividends per share $ 0.09 $ 0.09 $ 0.09 $ 0.09 $ 0.36
____________________(1) Per share amounts for the quarters and the full years have each been calculated separately. Accordingly, quarterly
amounts may not sum up to the annual amounts because of differences in the average common shares outstandingduring each period and, with regard to diluted per share amounts only, because of the inclusion of the effect ofpotentially dilutive securities only in the periods in which such effect would have been dilutive.
ITEM 9. CHANGES IN AND DISAGREEMENTS WITH ACCOUNTANTS ON ACCOUNTING AND FINANCIALDISCLOSURE
None.
ITEM 9A. CONTROLS AND PROCEDURES
Disclosure Controls and Procedures
Assured Guaranty's management, with the participation of Assured Guaranty Ltd.'s President and Chief ExecutiveOfficer and Chief Financial Officer, has evaluated the effectiveness of Assured Guaranty Ltd.'s disclosure controls andprocedures (as such term is defined in Rules 13a 15(e) and 15d 15(e) under the Securities Exchange Act of 1934, as amended(the “Exchange Act”)) as of the end of the period covered by this report. Based on this evaluation, Assured Guaranty Ltd.'sPresident and Chief Executive Officer and Chief Financial Officer have concluded that, as of the end of such period, AssuredGuaranty Ltd.'s disclosure controls and procedures are effective in recording, processing, summarizing and reporting, on atimely basis, information required to be disclosed by Assured Guaranty Ltd. (including its consolidated subsidiaries) in thereports that it files or submits under the Exchange Act.
There has been no change in the Company's internal controls over financial reporting during the Company's quarterended December 31, 2013, that has materially affected, or is reasonably likely to materially affect, the Company's internalcontrols over financial reporting.
0345r4.indd 274 3/19/14 3:29 PM

273
Management's Report on Internal Control over Financial Reporting
The management of Assured Guaranty Ltd. is responsible for establishing and maintaining adequate internal control overfinancial reporting, as such term is defined in Exchange Act Rule 13a-15(f). Internal control over financial reporting is aprocess designed by, or under the supervision of the Company's President and Chief Executive Officer and Chief FinancialOfficer to provide reasonable assurance regarding the reliability of financial reporting and the preparation of the Company'sconsolidated financial statements for external purposes in accordance with accounting principles generally accepted in theUnited States of America.
Because of inherent limitations, internal control over financial reporting may not prevent or detect misstatements.Projections of any evaluation of effectiveness to future periods are subject to the risks that controls may become inadequatebecause of changes in conditions, or that the degree of compliance with the policies or procedures may deteriorate.
Management of the Company has assessed the effectiveness of the Company's internal control over financial reportingas of December 31, 2013 using the criteria set forth by the Committee of Sponsoring Organizations of the TreadwayCommission (COSO) in the 1992 Internal Control-Integrated Framework. Based on this evaluation, management concludedthat the Company's internal control over financial reporting was effective as of December 31, 2013 based on criteria in the 1992Internal Control- Integrated Framework issued by the COSO.
The effectiveness of the Company's internal control over financial reporting as of December 31, 2013 has been audited byPricewaterhouseCoopers LLP, an independent registered public accounting firm, as stated in their "Report of IndependentRegistered Public Accounting Firm" included in Item 8. Financial Statements and Supplementary Data.
ITEM 9B. OTHER INFORMATION
None.
0345r4.indd 275 3/19/14 3:29 PM

274
PART IIIITEM 10. DIRECTORS, EXECUTIVE OFFICERS AND CORPORATE GOVERNANCE
Information pertaining to this item is incorporated by reference to the sections entitled “Proposal No. 1: Election ofDirectors”, “Corporate Governance—Did our insiders comply with Section 16(a) beneficial ownership reporting in 2013”,“Corporate Governance—How are directors nominated?” and “Corporate Governance—The committees of the Board—TheAudit Committee” of the definitive proxy statement for the Annual General Meeting of Shareholders, which involves theelection of directors and will be filed with the SEC not later than 120 days after the close of the fiscal year pursuant toregulation 14A.
Information about the executive officers of AGL is set forth at the end of Part I of this Form 10-K and is herebyincorporated by reference.
Code of Conduct
The Company has adopted a Code of Conduct, which sets forth standards by which all employees, officers anddirectors of the Company must abide as they work for the Company. The Code of Conduct is available atwww.assuredguaranty.com/governance. The Company intends to disclose on its internet site any amendments to, or waiversfrom, its Code of Conduct that are required to be publicly disclosed pursuant to the rules of the SEC or the New York StockExchange.
ITEM 11. EXECUTIVE COMPENSATION
This item is incorporated by reference to the section entitled “Executive Compensation”, “Corporate Governance—Compensation Committee interlocking and insider participation” and “Corporate Governance—How are the directorscompensated?” of the definitive proxy statement for the Annual General Meeting of Shareholders, which will be filed with theSEC not later than 120 days after the close of the fiscal year pursuant to regulation 14A.
ITEM 12. SECURITY OWNERSHIP OF CERTAIN BENEFICIAL OWNERS AND MANAGEMENT ANDRELATED STOCKHOLDER MATTERS
This item is incorporated by reference to the sections entitled "Information about our Common Share Ownership" and"Equity Compensation Plans Information" of the definitive proxy statement for the Annual General Meeting of Shareholders,which will be filed with the SEC not later than 120 days after the close of the fiscal year pursuant to regulation 14A.
ITEM 13. CERTAIN RELATIONSHIPS AND RELATED TRANSACTIONS, AND DIRECTOR INDEPENDENCE
This item is incorporated by reference to the sections entitled “Corporate Governance—What is our related persontransactions approval policy and what procedures do we use to implement it?”, “Corporate Governance—What related persontransactions do we have?” and “Corporate Governance—Director independence” of the definitive proxy statement for theAnnual General Meeting of Shareholders, which will be filed with the SEC not later than 120 days after the close of the fiscalyear pursuant to regulation 14A.
ITEM 14. PRINCIPAL ACCOUNTING FEES AND SERVICES
This item is incorporated by reference to the section entitled “Proposal No. 4: Ratification of Appointment ofIndependent Auditors—Independent Auditor Fee Information” and “Proposal No. 4: Ratification of Appointment ofIndependent Auditors—Pre-Approval Policy of Audit and Non-Audit Services” of the definitive proxy statement for the AnnualGeneral Meeting of Shareholders, which will be filed with the SEC not later than 120 days after the close of the fiscal yearpursuant to regulation 14A.
0345r4.indd 276 3/19/14 3:29 PM

275
PART IV
ITEM 15. EXHIBITS, FINANCIAL STATEMENT SCHEDULES
(a) Financial Statements, Financial Statement Schedules and Exhibits
1. Financial Statements
The following financial statements of Assured Guaranty Ltd. have been included in Item 8 hereof:
Report of Independent Registered Public Accounting Firm 137Consolidated Balance Sheets as of December 31, 2013 and 2012 138Consolidated Statements of Operations for the years ended December 31, 2013, 2012 and 2011 139Consolidated Statements of Comprehensive Income for the years ended December 31, 2013, 2012 and 2011 140Consolidated Statements of Shareholders' Equity for the years ended December 31, 2013, 2012 and 2011 141Consolidated Statements of Cash Flows for the years ended December 31, 2013, 2012 and 2011 142Notes to Consolidated Financial Statements 143
2. Financial Statement Schedules
The financial statement schedules are omitted because they are not applicable or the required information is shown inthe consolidated financial statements or notes thereto.
3. Exhibits*
ExhibitNumber Description of Document
3.1 Certificate of Incorporation and Memorandum of Association of the Registrant, as amended by Certificate ofIncorporation on Change of Name dated March 30, 2004 and Certificate of Deposit of Memorandum of Increaseof Capital dated April 21, 2004 (Incorporated by reference to Exhibit 3.1 to Form 10-K for the year endedDecember 31, 2009)
3.2 First Amended and Restated Bye-laws of the Registrant, as amended (Incorporated by reference to Exhibit 3.1 toForm 8-K filed on May 10, 2011)
4.1 Specimen Common Share Certificate (Incorporated by reference to Exhibit 4.1 to Form S-1 (#333-111491))4.2 Certificate of Incorporation and Memorandum of Association of the Registrant, as amended by Certificate of
Incorporation on Change of Name dated March 30, 2004 and Certificate of Deposit of Memorandum of Increaseof Capital dated April 21, 2004 (See Exhibit 3.1)
4.3 Bye-laws of the Registrant (See Exhibit 3.2)4.4 Indenture, dated as of May 1, 2004, among the Company, Assured Guaranty U.S. Holdings Inc. and The Bank of
New York, as trustee (Incorporated by reference to Exhibit 4.1 to Form 10-Q for the quarter ended March 31,2004)
4.5 Indenture, dated as of December 1, 2006, entered into among Assured Guaranty Ltd., Assured Guaranty U.S.Holdings Inc. and The Bank of New York, as trustee (Incorporated by reference to Exhibit 4.1 to Form 8-K filedon December 20, 2006)
4.6 First Supplemental Subordinated Indenture, dated as of December 20, 2006, entered into among AssuredGuaranty Ltd., Assured Guaranty U.S. Holdings Inc. and The Bank of New York, as trustee (Incorporated byreference to Exhibit 4.2 to Form 8-K filed on December 20, 2006)
4.7 Replacement Capital Covenant, dated as of December 20, 2006, between Assured Guaranty U.S. Holdings Inc.and Assured Guaranty Ltd., in favor of and for the benefit of each Covered Debtholder (as defined therein)(Incorporated by reference to Exhibit 4.1 to Form 8-K filed on December 20, 2006)
4.8 Amended and Restated Trust Indenture dated as of February 24, 1999 between Financial Security AssuranceHoldings Ltd. and the Senior Debt Trustee (Incorporated by reference to Exhibit 4.1 to Financial SecurityAssurance Holdings Ltd.'s Registration Statement to Form S-3 (#333-74165))
0345r4.indd 277 3/19/14 3:29 PM

276
4.9 Form of Assured Guaranty Municipal Holdings Inc., formerly known as Financial Security AssuranceHoldings Ltd. 67/8% Quarterly Interest Bond Securities due 2101 (Incorporated by reference to Exhibit 4.1 toForm 10-Q for the quarter ended March 31, 2010)
4.10 Form of Assured Guaranty Municipal Holdings Inc., formerly known as Financial Security AssuranceHoldings Ltd. 6.25% Notes due November 1, 2102 (Incorporated by reference to Exhibit 4.2 to Form 10-Q forthe quarter ended March 31, 2010)
4.11 Form of Assured Guaranty Municipal Holdings Inc., formerly known as Financial Security AssuranceHoldings Ltd. 5.60% Notes due July 15, 2103 (Incorporated by reference to Exhibit 4.3 to Form 10-Q for thequarter ended March 31, 2010)
4.12 Supplemental indenture, dated as of August 26, 2009, between Assured Guaranty Ltd., Financial SecurityAssurance Holdings Ltd. and U.S. Bank National Association, as trustee (Incorporated by reference toExhibit 99.1 to Form 8-K filed on September 1, 2009)
4.13 Indenture, dated as of November 22, 2006, between Financial Security Assurance Holdings Ltd. and The Bank ofNew York, as Trustee (Incorporated by reference to Exhibit 4.1 to Financial Security Assurance Holdings Ltd.'sForm 8-K filed on November 28, 2006)
4.14 Form of Financial Security Assurance Holdings Ltd. Junior Subordinated Debenture, Series 2006-1(Incorporated by reference to Exhibit 10.3 to Financial Security Assurance Holdings Ltd.'s Form 8-K filed onNovember 25, 2002)
4.15 Supplemental indenture, dated as of August 26, 2009, between Assured Guaranty Ltd., Financial SecurityAssurance Holdings Ltd. and The Bank of New York Mellon, as trustee (Incorporated by reference toExhibit 99.2 to Form 8-K filed on September 1, 2009)
4.16 First Supplemental Indenture, to be dated as of June 24, 2009, between Assured Guaranty US Holdings Inc.,Assured Guaranty Ltd. and The Bank of New York Mellon, as trustee (including the form of 8.50% Senior Notedue 2014 of Assured Guaranty US Holdings Inc.) (Incorporated by reference to Exhibit 4.1 to Form 8-K filed onJune 23, 2009)
10.1 Guaranty by Assured Guaranty Re International Ltd. in favor of Assured Guaranty Re Overseas Ltd.(Incorporated by reference to Exhibit 10.31 to Form S-1 (#333-111491))
10.2 Put Agreement between Assured Guaranty Corp. and Woodbourne Capital Trust [I][II][III][IV] (Incorporated byreference to Exhibit 10.6 to Form 10-Q for the quarter ended March 31, 2005)
10.3 Custodial Trust Expense Reimbursement Agreement (Incorporated by reference to Exhibit 10.7 to Form 10-Q forthe quarter ended March 31, 2005)
10.4 Assured Guaranty Corp. Articles Supplementary Classifying and Designating Series of Preferred Stock asSeries A Perpetual Preferred Stock, Series B Perpetual Preferred Stock, Series C Perpetual Preferred Stock,Series D Perpetual Preferred Stock (Incorporated by reference to Exhibit 10.8 to Form 10-Q for the quarterended March 31, 2005)
10.5 Investment Agreement dated as of February 28, 2008 between Assured Guaranty Ltd. and WLR Recovery FundIV, L.P. (Incorporated by reference to Exhibit 10.68 to Form 10-K for the year ended December 31, 2007)
10.6 Approval dated September 16, 2008 pursuant to Investment Agreement dated as of February 28, 2008 with WLRRecovery Fund IV, L.P. Pursuant to the Investment Agreement, WLR Recovery Fund IV, L.P. and other fundsaffiliated with WL Ross & Co. LLC (Incorporated by reference to Exhibit 10.1 to Form 8-K filed onSeptember 19, 2008)
10.7 Share Purchase Agreement, dated May 31, 2013, among Assured Guaranty Ltd., WLR Recovery Fund IV, L.P.,WLR Recovery Funds III, L.P., WLR AGO Co-Invest, L.P., WLR/GS Master Co-Investments, L.P., WLR IVParallel ESC, L.P and Wilbur L. Ross, Jr. (Incorporated by reference to Exhibit 10.1 to Form 8-K filed on June 3,2013)
10.8 Purchase Agreement among Dexia Holdings Inc., Dexia Credit Local S.A. and the Company dated as ofNovember 14, 2008 (Incorporated by reference to Exhibit 99.1 to Form 8-K filed on November 17, 2008)
10.9 Amendment to Investment Agreement dated as of November 13, 2008 between the Company and WLRRecovery Fund IV, L.P. (Incorporated by reference to Exhibit 99.2 to Form 8-K filed on November 17, 2008)
10.10 Amended and Restated Revolving Credit Agreement dated as of June 30, 2009 among FSA AssetManagement LLC, Dexia Crédit Local S.A. and Dexia Bank Belgium S.A. (Incorporated by reference toExhibit 10.1 to Form 8-K filed on July 8, 2009)
10.11 First Amendment to Amended and Restated Revolving Credit Agreement dated as of September 20, 2010 amongFSA Asset Management LLC, Dexia Crédit Local S.A. and Dexia Bank Belgium S.A.
10.12 Second Amendment to Amended and Restated Revolving Credit Agreement dated as of May 16, 2012 amongFSA Asset Management LLC, Dexia Crédit Local S.A. and Dexia Bank Belgium S.A.
10.13 Assignment Pursuant to the Amended and Restated Revolving Credit Agreement, as amended, dated as ofDecember 12, 2013 between Belfius Bank SA/NV and Dexia Crédit Local S.A.
0345r4.indd 278 3/19/14 3:29 PM

277
10.14 Master Repurchase Agreement (September 1996 Version) dated as of June 30, 2009 between Dexia CréditLocal S.A. and FSA Asset Management LLC (Incorporated by reference to Exhibit 10.2.1 to Form 8-K filed onJuly 8, 2009)
10.15 Annex I-Committed Term Repurchase Agreement Annex dated as of June 30, 2009 between Dexia CréditLocal S.A. and FSA Asset Management LLC (Incorporated by reference to Exhibit 10.2.2 to Form 8-K filed onJuly 8, 2009)
10.16 ISDA Master Agreement (Multicurrency-Cross Border) dated as of June 30, 2009 among Dexia SA, DexiaCrédit Local S.A. and FSA Asset Management LLC (Incorporated by reference to Exhibit 10.3.1 to Form 8-Kfiled on July 8, 2009)
10.17 Schedule to the 1992 Master Agreement, Guaranteed Put Contract, dated as of June 30, 2009 among DexiaCrédit Local S.A., Dexia SA and FSA Asset Management LLC (Incorporated by reference to Exhibit 10.3.2 toForm 8-K filed on July 8, 2009)
10.18 Put Option Confirmation, Guaranteed Put Contract, dated June 30, 2009 to FSA Asset Management LLC fromDexia SA and Dexia Crédit Local S.A. (Incorporated by reference to Exhibit 10.3.3 to Form 8-K filed on July 8,2009)
10.19 ISDA Credit Support Annex (New York Law) to the Schedule to the ISDA Master Agreement, Guaranteed PutContract, dated as of June 30, 2009 between Dexia Crédit Local S.A. and Dexia SA and FSA AssetManagement LLC (Incorporated by reference to Exhibit 10.3.4 to Form 8-K filed on July 8, 2009)
10.20 ISDA Master Agreement (Multicurrency-Cross Border) dated as of June 30, 2009 among Dexia SA, DexiaCrédit Local S.A. and FSA Asset Management LLC (Incorporated by reference to Exhibit 10.4.1 to Form 8-Kfiled on July 8, 2009)
10.21 Schedule to the 1992 Master Agreement, Non-Guaranteed Put Contract, dated as of June 30, 2009 among DexiaCrédit Local S.A., Dexia SA and FSA Asset Management LLC (Incorporated by reference to Exhibit 10.4.2 toForm 8-K filed on July 8, 2009)
10.22 Put Option Confirmation, Non-Guaranteed Put Contract, dated June 30, 2009 to FSA Asset Management LLCfrom Dexia SA and Dexia Crédit Local S.A. (Incorporated by reference to Exhibit 10.4.3 to Form 8-K filed onJuly 8, 2009)
10.23 ISDA Credit Support Annex (New York Law) to the Schedule to the ISDA Master Agreement, Non-GuaranteedPut Contract, dated as of June 30, 2009 between Dexia Crédit Local S.A. and Dexia SA and FSA AssetManagement LLC (Incorporated by reference to Exhibit 10.4.4 to Form 8-K filed on July 8, 2009)
10.24 First Demand Guarantee Relating to the “Financial Products” Portfolio of FSA Asset Management LLC issuedby the Belgian State and the French State and executed as of June 30, 2009 (Incorporated by reference toExhibit 10.5 to Form 8-K filed on July 8, 2009)
10.25 Guaranty, dated as of June 30, 2009, made jointly and severally by Dexia SA and Dexia Crédit Local S.A., infavor of Financial Security Assurance Inc. (Incorporated by reference to Exhibit 10.6 to Form 8-K filed onJuly 8, 2009)
10.26 Indemnification Agreement (GIC Business) dated as of June 30, 2009 by and among Financial SecurityAssurance Inc., Dexia Crédit Local S.A. and Dexia SA (Incorporated by reference to Exhibit 10.7 to Form 8-Kfiled on July 8, 2009)
10.27 Pledge and Administration Agreement, dated as of June 30, 2009, among Dexia SA, Dexia Crédit Local S.A.,Dexia Bank Belgium SA, Dexia FP Holdings Inc., Financial Security Assurance Inc., FSA AssetManagement LLC, FSA Portfolio Asset Limited, FSA Capital Markets Services LLC, FSA Capital MarketsServices (Caymans) Ltd., FSA Capital Management Services LLC and The Bank of New York Mellon TrustCompany, National Association (Incorporated by reference to Exhibit 10.8 to Form 8-K filed on July 8, 2009)
10.28 Separation Agreement, dated as of July 1, 2009, among Dexia Crédit Local S.A., Financial SecurityAssurance Inc., Financial Security Assurance International, Ltd., FSA Global Funding Limited and PremierInternational Funding Co. (Incorporated by reference to Exhibit 10.9 to Form 8-K filed on July 8, 2009)
10.29 Funding Guaranty, dated as of July 1, 2009, made by Dexia Crédit Local S.A. in favor of Financial SecurityAssurance Inc. and Financial Security Assurance International, Ltd. (Incorporated by reference to Exhibit 10.10to Form 8-K filed on July 8, 2009)
10.30 Reimbursement Guaranty, dated as of July 1, 2009, made by Dexia Crédit Local S.A. in favor of FinancialSecurity Assurance Inc. and Financial Security Assurance International, Ltd. (Incorporated by reference toExhibit 10.11 to Form 8-K filed on July 8, 2009)
10.31 Amended and Restated Strip Coverage Liquidity and Security Agreement, dated as of July 1, 2009, betweenAssured Guaranty Municipal Corp. and Dexia Crédit Local S.A.
10.32 Indemnification Agreement (FSA Global Business), dated as of July 1, 2009, by and between Financial SecurityAssurance Inc., Assured Guaranty Ltd. and Dexia Crédit Local S.A. (Incorporated by reference to Exhibit 10.13to Form 8-K filed on July 8, 2009)
0345r4.indd 279 3/19/14 3:29 PM

278
10.33 Pledge and Administration Annex Amendment Agreement dated as of July 1, 2009 among Dexia SA, DexiaCrédit Local S.A., Dexia Bank Belgium SA, Dexia FP Holdings Inc., Financial Security Assurance Inc., FSAAsset Management LLC, FSA Portfolio Asset Limited, FSA Capital Markets Services LLC, FSA CapitalMarkets Services (Caymans) Ltd., FSA Capital Management Services LLC and The Bank of New York MellonTrust Company, National Association (Incorporated by reference to Exhibit 10.14 to Form 8-K filed on July 8,2009)
10.34 Put Confirmation Annex Amendment Agreement dated as of July 1, 2009 among Dexia SA and Dexia CréditLocal S.A. and FSA Asset Management LLC and Financial Security Assurance Inc. (Incorporated by reference toExhibit 10.15 to Form 8-K filed on July 8, 2009)
10.35 Master Repurchase Agreement between FSA Capital Management Services LLC and FSA Capital MarketsServices LLC (Incorporated by reference to Exhibit 10.20 to Form 10-Q for the quarter ended June 30, 2009)
10.36 Confirmation to Master Repurchase Agreement (Incorporated by reference to Exhibit 10.21 to Form 10-Q for thequarter ended June 30, 2009)
10.37 Master Repurchase Agreement Annex I (Incorporated by reference to Exhibit 10.22 to Form 10-Q for the quarterended June 30, 2009)
10.38 Pledge and Intercreditor Agreement, among Dexia Crédit Local, Dexia Bank Belgium S.A., Financial SecurityAssurance Inc. and FSA Asset Management LLC, dated November 13, 2008 (Incorporated by reference toExhibit 10.3 to Financial Security Assurance Holdings Ltd.'s Form 10-Q for the quarter ended September 30,2008)
10.39 Amended and Restated Pledge and Intercreditor Agreement, dated as of February 20, 2009, between DexiaCrédit Local, Dexia Bank Belgium S.A., Financial Security Assurance Inc., FSA Asset Management LLC, FSACapital Markets Services LLC and FSA Capital Management Services LLC (Incorporated by reference toExhibit 10.19 to Financial Security Assurance Holdings Ltd.'s Form 10-K for the year ended December 31,2008)
10.40 Put Option Agreement, dated as of June 23, 2003 by and between FSA and Sutton Capital Trust I (Incorporatedby reference to Exhibit 99.5 to Financial Security Assurance Holdings Ltd.'s Form 10-Q for the quarter endedJune 30, 2003)
10.41 Put Option Agreement, dated as of June 23, 2003 by and between FSA and Sutton Capital Trust II (Incorporatedby reference to Exhibit 99.6 to Financial Security Assurance Holdings Ltd.'s Form 10-Q for the quarter endedJune 30, 2003)
10.42 Put Option Agreement, dated as of June 23, 2003 by and between FSA and Sutton Capital Trust III (Incorporatedby reference to Exhibit 99.7 to Financial Security Assurance Holdings Ltd.'s Form 10-Q for the quarter endedJune 30, 2003)
10.43 Put Option Agreement, dated as of June 23, 2003 by and between FSA and Sutton Capital Trust IV (Incorporatedby reference to Exhibit 99.8 to Financial Security Assurance Holdings Ltd.'s Form 10-Q for the quarter endedJune 30, 2003)
10.44 Contribution Agreement, dated as of November 22, 2006, between Dexia S.A. and Financial Security AssuranceHoldings Ltd. (Incorporated by reference to Exhibit 10.4 to Financial Security Assurance Holdings Ltd.'sForm 8-K filed on November 28, 2006)
10.45 Replacement Capital Covenant, dated as of November 22, 2006, by Financial Security Assurance Holdings Ltd.(Incorporated by reference to Exhibit 10.5 to Financial Security Assurance Holdings Ltd.'s Form 8-K filed onNovember 28, 2006)
10.46 Agreement and Amendment between Dexia Holdings Inc., Dexia Credit Local S.A. and the Company dated as ofJune 9, 2009 (Incorporated by reference to Exhibit 10.1 to Form 8-K filed on June 12, 2009)
10.47 Second Amendment to Investment Agreement dated as June 10, 2009 between the Company and WLR RecoveryFund IV, L.P. (Incorporated by reference to Exhibit 10.2 to Form 8-K filed on June 12, 2009)
10.48 Summary of Annual Compensation*
10.49 Director Compensation Summary (Incorporated by reference to Exhibit 10.1 to Form 10-Q for the quarter endedSeptember 30, 2013)*
10.50 Assured Guaranty Ltd. 2004 Long-Term Incentive Plan, as amended and restated as of May 7, 2009 and asamended by the First Amendment (Incorporated by reference to Exhibit 10.2 to Form 10-Q for the quarter endedSeptember 30, 2012)*
10.51 Non-Qualified Stock Option Agreement under Assured Guaranty Ltd. 2004 Long-Term Incentive Plan to be usedwith employment agreement (Incorporated by reference to Exhibit 10.34 to Form 10-K for the year endedDecember 31, 2005)*
10.52 Non-Qualified Stock Option Agreement under Assured Guaranty Ltd. 2004 Long-Term Incentive Plan(Incorporated by reference to Exhibit 10.35 to Form 10-K for the year ended December 31, 2005)*
0345r4.indd 280 3/19/14 3:29 PM

279
10.53 Non-Qualified Stock Option Agreement under Assured Guaranty Ltd. 2004 Long-Term Incentive Plan to be usedwith employment agreement (Incorporated by reference to Exhibit 10.66 to Form 10-K for the year endedDecember 31, 2007)*
10.54 Non-Qualified Stock Option Agreement under Assured Guaranty Ltd. 2004 Long-Term Incentive Plan(Incorporated by reference to Exhibit 10.67 to Form 10-K for the year ended December 31, 2007)*
10.55 Non-Qualified Stock Option Agreement under Assured Guaranty Ltd. 2004 Long-Term Incentive Plan to be usedwith employment agreement (Incorporated by reference to Exhibit 10.71 to Form 10-K for the year endedDecember 31, 2008)*
10.56 Non-Qualified Stock Option Agreement for Outside Directors under Assured Guaranty Ltd. 2004 Long-TermIncentive Plan (Incorporated by reference to Exhibit 10.19 to Form 10-Q for the quarter ended June 30, 2009)*
10.57 2010 Form of Non-Qualified Stock Option Agreement under Assured Guaranty Ltd. 2004 Long-Term IncentivePlan to be used with employment agreement (Incorporated by reference to Exhibit 10.3 to Form 10-Q for thequarter ended March 31, 2010)*
10.58 2010 Form of Non-Qualified Stock Option Agreement under Assured Guaranty Ltd. 2004 Long-Term IncentivePlan for use without employment agreement (Incorporated by reference to Exhibit 10.4 to Form 10-Q for thequarter ended March 31, 2010)*
10.59 2012 Form of Executive Non-Qualified Stock Option Agreement under Assured Guaranty Ltd. 2004 Long-TermIncentive Plan (Incorporated by reference to Exhibit 10.7 to Form 10-Q for the quarter ended March 31, 2012)*
10.60 2013 Form of Executive Non-Qualified Stock Option Agreement under Assured Guaranty Ltd. 2004 Long -TermIncentive Plan (Incorporated by reference to Exhibit 10.1 to Form 10-Q for the quarter ended March 31, 2013)*
10.61 Restricted Stock Unit Agreement for Outside Directors under Assured Guaranty Ltd. 2004 Long Term IncentivePlan (Incorporated by reference to Exhibit 10.37 to Form 10-K for the year ended December 31, 2005)*
10.62 Restricted Stock Unit Agreement for Outside Directors under Assured Guaranty Ltd. 2004 Long-Term IncentivePlan (Incorporated by reference to Exhibit 10.1 to Form 10-Q for the quarter ended June 30, 2007)*
10.63 Restricted Stock Unit Agreement for Outside Directors under Assured Guaranty Ltd. 2004 Long-Term IncentivePlan (Incorporated by reference to Exhibit 10.1 to Form 10-Q for the quarter ended June 30, 2008)*
10.64 Form of amendment to Restricted Stock Unit Awards for Outside Directors (Incorporated by reference toExhibit 10.3 to Form 10-Q for the quarter ended June 30, 2008)*
10.65 Restricted Stock Agreement for Outside Directors under Assured Guaranty Ltd. 2004 Long-Term Incentive Plan(Incorporated by reference to Exhibit 10.2 to Form 10-Q for the quarter ended June 30, 2008)*
10.66 2010 Form of Restricted Stock Unit Agreement under Assured Guaranty Ltd. 2004 Long-Term Incentive Plan tobe used with employment agreement (Incorporated by reference to Exhibit 10.1 to Form 10-Q for the quarterended March 31, 2010)*
10.67 2010 Form of Restricted Stock Unit Agreement under Assured Guaranty Ltd. 2004 Long-Term Incentive Plan tobe used without employment agreement (Incorporated by reference to Exhibit 10.2 to Form 10-Q for the quarterended March 31, 2010)*
10.68 Form of Restricted Stock Unit Agreement under Assured Guaranty Ltd. 2004 Long-Term Incentive Plan to beused with employment agreement (Incorporated by reference to Exhibit 10.6 to Form 10-Q for the quarter endedMarch 31, 2011)*
10.69 Form of Restricted Stock Unit Agreement under Assured Guaranty Ltd. 2004 Long-Term Incentive Plan to beused without employment agreement (Incorporated by reference to Exhibit 10.7 to the Form 10-Q for the quarterended March 31, 2011)*
10.70 2012 Form of Executive Restricted Stock Unit Agreement under Assured Guaranty Ltd. 2004 Long -TermIncentive Plan (Incorporated by reference to Exhibit 10.8 to Form 10-Q for the quarter ended March 31, 2012)*
10.71 2013 Form of Executive Restricted Stock Unit Agreement under Assured Guaranty Ltd. 2004 Long -TermIncentive Plan (Incorporated by reference to Exhibit 10.2 to Form 10-Q for the quarter ended March 31, 2013)*
10.72 2012 Form of Executive Performance-Based Restricted Stock Unit Agreement under Assured Guaranty Ltd.2004 Long-Term Incentive Plan (Incorporated by reference to Exhibit 10.9 to Form 10-Q for the quarter endedMarch 31, 2012)*
10.73 2013 Form of Executive Performance-Based Restricted Stock Unit Agreement under Assured Guaranty Ltd.2004 Long-Term Incentive Plan (Incorporated by reference to Exhibit 10.3 to Form 10-Q for the quarter endedMarch 31, 2013)*
10.74 First Amendment to the Restricted Stock Unit Agreement for Outside Directors (Incorporated by reference toExhibit 10.106 to Form 10-K for the year ended December 31, 2012)*
10.75 Assured Guaranty Ltd. Employee Stock Purchase Plan, as amended through the second amendment(Incorporated by reference to Exhibit 10.5 to Form 10-Q for the quarter ended March 31, 2013)*
0345r4.indd 281 3/19/14 3:29 PM

280
10.76 Assured Guaranty Ltd. Performance Retention Plan (As Amended and Restated as of February 14, 2008 forAwards Granted during 2007) (Incorporated by reference to Exhibit 10.50 to Form 10-K for the year endedDecember 31, 2007)*
10.77 Assured Guaranty Ltd. Performance Retention Plan (As Amended and Restated as of February 14, 2008)(Incorporated by reference to Exhibit 10.58 to Form 10-K for the year ended December 31, 2007)*
10.78 Terms of Performance Retention Award, Four Year Installment Vesting Granted on February 25, 2010 forparticipants subject to $1 million limit (Incorporated by reference to Exhibit 10.5 to Form 10-Q for the quarterended March 31, 2010)*
10.79 Terms of Performance Retention Award, Four Year Installment Vesting Granted on February 9, 2011 forparticipants subject to $1 million limit (Incorporated by reference to Exhibit 10.5 to Form 10-Q for the quarterended March 31, 2011)*
10.80 Terms of Performance Retention Award Four Year Installment Vesting Granted on February 9, 2012 forparticipants Subject to $1 million Limit (Incorporated by reference to Exhibit 10.10 to Form 10-Q for the quarterended March 31, 2012)*
10.81 Terms of Performance Retention Award Four Year Installment Vesting Granted on February 7, 2013 forParticipants Subject to $1 million Limit (Incorporated by reference to Exhibit 10.4 to Form 10-Q for the quarterended March 31, 2013)*
10.82 Assured Guaranty Ltd. Executive Severance Plan (Incorporated by reference to Exhibit 10.5 to Form 10-Q forthe quarter ended March 31, 2012)*
10.83 Form of Acknowledgement Letter for Participants in Assured Guaranty Ltd. Executive Severance Plan(Incorporated by reference to Exhibit 10.11 to Form 10-Q for the quarter ended March 31, 2012)*
10.84 Assured Guaranty Ltd. Perquisite Policy (Incorporated by reference to Exhibit 10.6 to Form 10 -Q for the quarterended March 31, 2012)*
10.85 Form of Indemnification Agreement between the Company and its executive officers and directors (Incorporatedby reference to Exhibit 10.42 to Form 10-K for the year ended December 31, 2005)*
10.86 Assured Guaranty Ltd. Executive Officer Recoupment Policy (Incorporated by reference to Exhibit 10.69 toForm 10-K for the year ended December 31, 2008)*
10.87 Form of Acknowledgement of Assured Guaranty Ltd. Executive Officer Recoupment Policy (Incorporated byreference to Exhibit 10.70 to Form 10-K for the year ended December 31, 2008)*
10.88 Assured Guaranty Ltd. Supplemental Employee Retirement Plan, as amended and restated effective January 1,2009 and as amended by the First, Second, Third, Fourth and Fifth Amendments (Incorporated by reference toExhibit 10.1 to Form 10-Q for the quarter ended September 30, 2012)*
10.89 Assured Guaranty Corp. Supplemental Executive Retirement Plan as amended through the Third Amendmentthereto (Incorporated by reference to Exhibit 4.5 to Form S-8 (#333-178625))*
10.90 Financial Security Assurance Holdings Ltd. 1989 Supplemental Executive Retirement Plan (amended andrestated as of December 17, 2004) (Incorporated by reference to Exhibit 10.4 to Financial Security AssuranceHoldings Ltd.'s Form 8-K filed on December 17, 2004)*
10.91 Amendment to the Financial Security Assurance Holdings Ltd. 1989 Supplemental Employee Retirement Plan(Incorporated by reference to Exhibit 10.29 to Form 10-Q for the quarter ended June 30, 2009)*
10.92 Financial Security Assurance Holdings Ltd. 2004 Supplemental Executive Retirement Plan, as amended onFebruary 14, 2008 (Incorporated by reference to Exhibit 10.3 to Financial Security Assurance Holdings Ltd.'sForm 8-K filed on February 15, 2008)*
12.1 Computation of Ratio of Earnings to Fixed Charges21.1 Subsidiaries of the registrant23.1 Accountants Consent31.1 Certification of CEO Pursuant to Exchange Act Rules 13A-14 and 15D-14, as Adopted Pursuant to Section 302
of the Sarbanes�Oxley Act of 200231.2 Certification of CFO Pursuant to Exchange Act Rules 13A-14 and 15D-14, as Adopted Pursuant to Section 302
of the Sarbanes�Oxley Act of 200232.1 Certification of CEO Pursuant to 18 U.S.C. Section 1350, as Adopted Pursuant to Section 906 of the Sarbanes�
Oxley Act of 200232.2 Certification of CFO Pursuant to 18 U.S.C. Section 1350, as Adopted Pursuant to Section 906 of the Sarbanes�
Oxley Act of 2002
0345r4.indd 282 3/19/14 3:29 PM

281
101.1 The following financial information from Registrant's Annual Report on Form 10-K for the year endedDecember 31, 2013 formatted in XBRL (eXtensible Business Reporting Language) interactive data files pursuantto Rule 405 of Regulation S-T: (i) Consolidated Balance Sheets at December 31, 2013 and 2012;(ii) Consolidated Statements of Operations for the years ended December 31, 2013, 2012 and 2011;(iii) Consolidated Statements of Comprehensive Income for the years ended December 31, 2013, 2012 and 2011;(iv) Consolidated Statements of Shareholders' Equity for the years ended December 31, 2013, 2012 and 2011;(v) Consolidated Statements of Cash Flows for the years ended December 31, 2013, 2012 and 2011; and(vi) Notes to Consolidated Financial Statements.
* Management contract or compensatory plan
0345r4.indd 283 3/19/14 3:29 PM

282
SIGNATURES
Pursuant to the requirements of Section 13 or 15(d) of the Securities Exchange Act of 1934, the Registrant has causedthis report to be signed on its behalf by the undersigned, thereunto duly authorized.
Assured Guaranty Ltd.
By: /s/ Dominic J. FredericoName: Dominic J. FredericoTitle: President and Chief Executive Officer
Date: February 28, 2014
Pursuant to the requirements of the Securities Exchange Act of 1934, this report has been signed below by thefollowing persons on behalf of the Registrant and in the capacities and on the dates indicated.
Name Position Date
/s/ Robin Monro�DaviesRobin Monro�Davies Chairman of the Board; Director February 28, 2014
/s/ Dominic J. FredericoDominic J. Frederico
President and Chief Executive Officer;Director February 28, 2014
/s/ Robert A. BailensonRobert A. Bailenson
Chief Financial Officer (PrincipalFinancial and Accounting Officer andDuly Authorized Officer)
February 28, 2014
/s/ Neil BaronNeil Baron Director February 28, 2014
/s/ Francisco L. BorgesFrancisco L. Borges Director February 28, 2014
/s/ G. Lawrence BuhlG. Lawrence Buhl Director February 28, 2014
/s/ Stephen A. CozenStephen A. Cozen Director February 28, 2014
/s/ Bonnie L. HowardBonnie L. Howard Director February 28, 2014
/s/ Patrick W. KennyPatrick W. Kenny Director February 28, 2014
/s/ Simon W. LeathesSimon W. Leathes Director February 28, 2014
/s/ Michael T. O'KaneMichael T. O'Kane Director February 28, 2014
/s/ Wilbur L. Ross, Jr.Wilbur L. Ross, Jr. Director February 28, 2014
0345r4.indd 284 3/19/14 3:29 PM