The political economy of environmental technological change ...
395
The political economy of environmental technological change with a case study of the power sector in Vietnam John Sawdon Submitted for PhD in Development Studies School of International Development, University of East Anglia February 2014
-
Upload
khangminh22 -
Category
Documents
-
view
0 -
download
0
Transcript of The political economy of environmental technological change ...
The political economy of environmental technological change with a case study of
the power sector in Vietnam
John Sawdon
Submitted for PhD in Development Studies
School of International Development, University of East Anglia
February 2014

ii
This copy of the dissertation has been supplied on condition that anyone who consults it is understood to recognise that its copyright rests with the author and that use of any information derived there-from must be in accordance with current UK Copyright Law. In addition, any quotation or extract must include full attribution.
Word count: 102,080
iii
Abstract
The escalating imperative of climate change mitigation implies a substantial change in the
technologies of electricity generation and supply in industrialised and industrialising
countries alike. Understanding how to effect this technological change is therefore
imperative if the challenge of climate change is to be addressed. The literature is replete
with technology and policy studies investigating technologies, policy instruments and
processes of technological change, however, surprisingly little research has addressed the
broader political economy context within which any technological change will need to be
realised. This research investigates linkages between the sort of systematic
environmental technological change implied by the imperative of climate change
mitigation and the broader political economy context.
Firstly, considering evolutionary economics approaches to understanding technological
change, we argue that evolutionary micro-foundations lend themselves to an analysis of
political economy processes. Moreover, it is a direct consequence of evolutionary micro-
foundations that technological change, and particularly that linked with structural change
in an economy, is likely to have important political economy implications. Secondly, we
show how heterodox approaches to understanding structural change and development in
economic systems are consistent with evolutionary micro-foundations and allow the
development of an analytical framework based upon an understanding of the process of
economic rent creation and preservation. Thirdly, we apply these insights to a critical
reconstruction of the evidence on the development of the electricity services industry
(ESI), illustrating the importance of political economy considerations in understanding
technological and institutional change in that sector. Finally, we apply these insights to a
detailed case study of the ESI in Vietnam, investigating the ways in which political
economy factors have influenced the broader development of the sector, and examining
how the choice of specific technologies is likely to be affected by political economy of
the sector.
iv
Table of contents
1. Introduction 1
1.1 Climate change GHG emissions and environmental technological change 1
1.2 Identifying the research gap 2
1.3 Overview of the argument 3
2. Getting the micro-foundations right: A critical reconstruction of the
literature on technological change 6
2.1 Introduction 6
2.2 Evolutionary economics approaches to technological change 8
2.2.1 Bounded rationality and its implications 9
2.2.2 Hierachical complexity 12
2.2.3 Implications of the evolutionary account 13
2.2.4 Co-evolution of institutions 20
2.2.5 The multi-level sustainability transitions perspective 23
2.2.6 Implications for policy 27
2.3 Are the micro-foundations right? Criticisms of evolutionary approaches 28
2.4 Distribution, vested interests and politics 33
2.4.1 Theorising politics in the process of technological change 33
2.4.2 The emergence of political economy 37
2.4.3 Two important criticisms and two responses 41
2.4.4 Political economy and technological change in economic history 43
2.5 Conclusion 44
3. Catch-up, industrial policy, institutions and political economy 47
3.1 Introduction 47
3.2 The ‘institutional turn’ and the (re)emergence of political economy 49
3.2.1 From institutions to good governance 51
3.2.2 A critical review of the empirical evidence 55
3.2.3 Embracing the political economy 60
3.3 A conceptual framework for understanding political economy of economic
growth and technological change 62
3.3.1 Technology and political economy 63
3.3.2 Drawing on the experience of developmental states 69
3.4 Conclusion: political economy, technology and environment 75

v
4. Political economy and technological change in the electricity supply
industry 79
4.1 Introduction 79
4.2 Understanding the dynamics of power sector development 84
4.2.1 Electrical utilities and the emergence of a techno-economic paradigm 84
4.2.2 Co-evolution of institutions: ownership and control of power systems 96
4.2.3 Politics and the coevolution of institutions 102
4.2.4 Development of the ESI in developing countries 106
4.2.5 A universal techno-economic paradigm? 108
4.2.6 Dynamics of ESI liberalization in the industrialized world 110
4.2.7 Dynamics of ESI liberalization in developing countries 121
4.2.8 Distilling the implications for technological change 132
4.3 Conclusion: Political settlements, holding power, rents and the ESI 134
5. Introducing the Vietnam case study 141
5.1 Introduction 141
5.2 Vietnam as a case study 142
5.3 Vietnam’s evolving political economy context 142
5.3.1 Characterising the political economy of the reform period 144
5.3.2 Understanding Vietnam as a developmental state 147
5.3.3 Competitive clientism and the weak state 149
5.4 Conclusions: Implications for the ESI 156
6. The political economy of the power sector in Vietnam 158
6.1 Introduction 158
6.2 The development of the ESI in Vietnam 160
6.2.1 Post-war reconstruction and central planning 1976 – 1986 160
6.2.2 Building socialism, building a techno-economic paradigm 163
6.2.3 Rapid growth of the ESI in the reform period 1986 – 2010 166
6.3 Institutional development and reform 173
6.3.1 Institutional arrangements prior to Doi Moi 174
6.3.2 The material drivers of ESI reform 175
6.3.3 The first wave of reform: formation of EVN and the energy parastatals 180
6.3.4 The faltering entry of FDI 186
6.3.5 Continuing pressure to reform 196
vi
6.3.6 The second wave of reforms 201
6.3.7 The search for capital 209
6.3.8 EVN threatens the whole show 224
6.4 The tariff rises 229
6.5 Conclusion 232
7. Analysis and conclusions. The political economy of technology choice in
Vietnam’s power sector 237
7.1 Introduction 237
7.2 The political economy of technology choice in Vietnam’s ESI 238
7.2.2 Ownership profile and technologies 239
7.2.3 Hydropower 243
7.2.4 Coal 246
7.2.5 Natural Gas 249
7.2.6 Renewables 252
7.2.7 Nuclear 253
7.3 Conclusions on the political economy of technology choice in Vietnam 255
7.4 Holding power, political settlements and rents in the Vietnamese power sector
256
7.5 Implications for climate change mitigation in Vietnam 259
7.6 Caveats and limitations 260
7.7 Recommendations for future study 261
Bibliography 263
Annexes 311
A2 Annexes to Chapter 2 311
A2.1 Linear accounts of technological change from ‘supply-push’ to ‘demand-pull’ 311
A2.2 Review of empirical evidence on induced innovation 317
A2.2.1 The empirical evidence on induced innovation 318
A2.2.2 Empirical evidence on induced innovation and environmental technological change 319
A3 Annexes to Chapter 3 326
A3.1 Technological catch-up: ‘Hard-slog’ or ‘Leap-frog’? 326
A3.1.1 Neoclassical growth theory 330
A3.1.2 A heterodox approach to development: National Innovation Systems 338
A3.1.3 What does all this tell us about technological catch-up? 342
A4 Annexes to Chapter 4 345
vii
A4.1 Emerging political imperatives, emerging energy imperatives? 348
A5 Annexes to Chapter 5 355
A5.1 Case study methodology 355
A5.2 Sources of empirical evidence 356
A5.3 Vietnam’s economic context and the prelude to reform 358
A5.3.1 Recent economic performance and perceptions of future prospects 358
A5.3.2 The context for economic reform 360
A5.4 Vietnam’s energy resources and prospects 363
A5.4.1 Energy sector development 363
A5.4.2 Energy resources 366
A6 Annexes to Chapter 6 372
A6.1 Early development of the ESI in Vietnam 1892 – 1975 372
A6.2 Images of electrification in state propaganda 375
A6.3 Additional data 377
Tables
3.1. Rents and the rights sustaining them 74
4.1. Capital output ratios for selected utilities and manufacturing industry in the USA
1900 – 1937 98
4.2. “Standard textbook model” for electricity reform 120
4.3. Developing countries taking key reform steps in the ESI 1998 124
4.4. Main economic rents associated with the ESI, technologies and groups 140
5.1. Key social and economic indicators for Vietnam 1990 and 2010 144
6.2. Foreign private investment in captive generation in Vietnam 1990 – 2005 188
6.3. Foreign BOT power projects being developed in Vietnam December 2001 189
6.4. EVN IPOs 2005 – 2010 213
6.5. Power plants developed by TKV, PVN and Song Da 2000 – 2012 217
6.6. Foreign generation project pipeline in June 2013 223
6.7. Main economic rents associated with the ESI in Vietnam, technologies and
groups 234
7.1. Installed capacity by ownership and type December 2011 241
A2.1. Kondratiev long waves and techno-economic paradigms 325
viii
A3.1. Early examples of catch-up (proportion of GDP per capita of world leader) 326
A3.2. Later instances of catch-up in East Asia (proportion GDP per capita of world
leader) 327
A3.3. Catch-up in selected countries since 1820 329
A4.2. Foreign ownership of electric utilities for selected countries: percent of a
country’s capacity, output or assets of electric utilities owned and controlled by foreign
firms 1913 – 1972 345
A4.2. Developing countries by ESI structure in 2006 346
A4.3. ESI corporations in the top 100 TNCs by foreign assets 1997, 2003 and 2011 347
A5.1. Vietnam’s energy resources 366
A5.2. Projected overall energy balance for Vietnam 2005 – 2030 368
A6.1. Emergence of the parastatals: State corporations formed under Decision 91 in
1994 376
A6.2. A6.4. Small hydropower IPPs reaching financial closure between 2005 and
2012 377
A6.5. Actual commercial operations date v’s planned PDP VI 379
A6.6. Additional information 381
Figures
1.1. Global CO2 emissions from fossil fuel combustion by country income group
1990 – 2010 1
2.1. The scope of increasing returns 16
2.2. Multi-level perspective on transitions 24
3.1. Governance characteristics of growth economies 59
3.2. A simplified political economy relationship 62
3.3. Linking politics and the techno-economic paradigm 68
3.4. The interdependence of power and institutions 72
4.1. Annual change in global electricity production and real GDP 1972 – 2010 79
4.2. Global carbon dioxide emissions by source 2009 80
4.3. Energy related CO2 abatement from the electricity sector of major economies
81
ix
4.4. Key technological developments and the expansion of electrical power use in US
industry 1870 – 1930 86
4.5. Thermal efficiency and power plant size over time (left) and for gas turbines
(right) 88
4.6. Construction cost declines, capacity (load) factor increases for coal generation in
the US 1882 – 2006 90
4.7. Share of electricity production from hydroelectric sources by country income
group 1960 – 2010 93
4.8. Systematic techno-economic advantages of electrical utilities and their increasing
scale in the early stages of power sector development 93
4.9. Global nuclear power fleet cumulative installed capacity and proportion of global
electricity consumption (left), and annual change in capacity (right) 1950 – 2013 105
4.10. Share of global electricity production by fuel (%) 1960 – 2010 112
4.11. Price of residential electricity in the USA 1892 – 2006 113
4.12. Electricity consumption growth in OECD countries 1960 – 2010 114
4.13. Optimal plant size per MW cost curves 1930 – 1990 116
4.14. CCGT cumulative installed capacity and proportion of gas fired generation in
high-income OECD countries 1960-2010 118
4.15. Private sector involvement in electricity infrastructure in low and middle-income
countries 1990 – 2011 (left) and cumulative (right) 125
4.16. Private sector involvement in electricity infrastructure by sub-sector 1990 – 2011
127
5.1. Overview of key macro-economic and policy developments in Vietnam 1985 –
2011 144
6.1. Transmission and distribution losses selected Asian countries 1971 – 2010 163
6.2. Evolution of electricity consumption by sector (left) 1976 – 2010 and annual
electricity consumption growth by sector (right) 1977 – 2010 in Vietnam 166
6.3. Electricity consumption per capita selected Asian countries 1971 – 2010 (left )
and Rural household electrification rate in Vietnam 1976 – 2009 (right) 168
6.4. Evolution of the electricity generation mix in absolute terms (left) and as a
proportion of production (right) 1971 – 2010 in Vietnam 169
6.5. Regional characteristics of Vietnam’s power system 171
6.6. Transmission line expansion in Vietnam 1975 – 2008 172
6.7. Vietnam’s external debt 1989 – 2011 176

x
6.8. The structure of EVN in 1995 182
6.9. Organisational chart EVN in 1995 184
6.10. Structure of Phu My 2.2 project 195
6.11. Roadmap for developing the Vietnam electricity market 202
6.12. EVN estimated average annual capital investment needs PDP V, PDP VI and
PDP VII 210
6.13. Increased generation from non-EVN sources 2000 – 2011 (left) generation share
by ownership 2011 (right) 219
6.14. PDP VI - capacity additions commissioned and delayed 2006 – 2010 220
6.15. EVN key financial indicators 1996 – 2009 227
6.16. Average electricity tariffs, LRMC and tariff targets 1990 – 2013 230
7.1. Cumulative planned capacity expansion in Vietnam’s PDP VII by technology
(left) and ownership (right) 2011 – 2030 242
7.2. Hydropower electricity production as a proportion of national electricity
production (left) and in absolute terms (right) 1971 – 2010 243
7.3. Coal fired thermal electricity production as a proportion of national electricity
production (left) and in absolute terms (right) 1971 – 2010 247
7.3. Natural gas thermal electricity production as a proportion of national electricity
production (left) and in absolute terms (right) 1971 – 2010 250
7.4 Linking politics and the techno-economic paradigm in Vietnam’s ESI 258
A2.1. Simple linear model of technological change 312
A3.1. Technology transfer in National Innovation Systems 340
A4.1. Global energy and consumer price indices 1980 – 2013 350
A5.1. Vietnam total primary energy supply (left) and total final energy consumption
(right) 1971 – 2010 (Mtoe) 365
A5.2. Vietnam share of final energy consumption by fuel 1971 – 2010 365
A5.3. Vietnam’s energy intensity in comparison with selected countries, per capita 1971
– 2010 (left) and per unit value added 1980 – 2010 (right) 367
A5.4. Vietnam’s net energy exports (proportion of total energy use) 1971 – 2010 369
A5.5. Vietnam’s main fossil fuel trade in coal 1971 – 2011 (left), and crude oil and oil
products 1985 - 2010(right) 369
A6.1. Propaganda posters illustrating ideological the importance of the ESI 374
A6.2. Reverse side of 5,000 Dong note in circulation since 1993 375

xi

xii
Acronyms AC Alternating Current ADB Asian Development Bank AFD Agence Française de Développement AfDB African Development Bank AGM Annual General Meeting APEC Asia Pacific Economic Cooperation ASEAN Association of South-east Asian Nations BIDV Joint Stock Commercial Bank for Investment and Development of Vietnam BOO Build-own-operate BOT Build-own-transfer BT Build-transfer BTA Bilateral Trade Agreement BTO Build-transfer-own CCGT Combined Cycle Gas Turbine CCS Carbon Capture and Storage CDM Clean Development Mechanisms CEMA Council for Mutual Economic Assistance CFC Chlorofluorocarbon CHP Combined Heat and Power CIC China Investment Corporation CIEM Central Institute of Economic Management CO2e Carbon dioxide equivalent COD Commercial operations date CP Communist Party CPC Communist Party Congress CSG China Southern Grid DC Direct Current DSM Demand Side Management ECA Export credit agency EDF Électricité de France EGAT Electricity Generating Authority of Thailand EIA US Energy Information Administration EOP End of Pipe EPC Engineering, Procurement Construction EPTC Electricity Power Trading Company ERAV Electricity Regulatory Authority of Vietnam ESI Electricity Services Industry ESMAP Energy Sector Management Assistance Programme EVN Electricity Vietnam FC Financial close/closure FDI Foreign Direct Investment GDP Gross Domestic Product GHG Greenhouse Gas GSO General Statistical Office HCMC Ho Chi Minh City
xiii
HVDC Hifh voltage direct current IAEA International Atomic Energy Agency ICT Information and Communication Technologies IDA International Development Association IEA International Energy Agency IFI International Financial Institution IMF International Monetary Fund IPCC Intergovernmental Panel on Climate Change IPO Initial Public Offering IPP Independent power provider IPR Intellectual Property Rights IPS Integrated Power Sector IRS Increasing Returns to Scale ISO Independent System Operator JBIC Japan Bank for International Cooperation JETRO Japan External Trade Organisation JICA Japanese International Cooperation Agency JSC Joint Stock Company JV Joint venture Km Kilometre kV Kilovolt kVA Kilovolt ampere kWh Kilo-watt hour LRMC Long run marginal cost M&A Mergers and acquisitions MIGA Multilateral Investment Guarantee Agency MNE Multinational Enterprises MoE Ministry of Energy MoI Ministry of Industry MOIT Ministry of Industry and Trade MPI Ministry of Planning and Investment MRC Mekong River Commission MW Mega-watt MWh Mega-watt hour NDLC National Dispatch and Load Centre NGO Non-governmental Organisation NIC Newly Industrialised Country NIE New Institutional Economics NIS National Innovation Systems NOx Nitrogen Oxides NPTC National Power Transmission Company OCGT Open cycle gas turbine ODA Overseas Development Assistance OECD Organisation for Economic Cooperation and Development OECF Overseas Economic Cooperation Fund (Japan) PACE Pollution Abatement Capital Expenditures
xiv
PDP Power Development Plan PM Prime Minister PPA Power Purchase Agreement ppmv Parts per million volume PRG Partial Risk Guarantee PURPA Public Utility Regulatory Policies Act PVN Petrovietnam R&D Research and development RD&D Research, development and demonstration ROT Renovate-own-transfer SBV State Bank of Vietnam SCIC State Capital Investment Corporation SEG State Economic Group SOCB State owned commercial banks SOE State Owned Enterprise Solar PV Solar Photovoltaic SOx Sulphur Oxides SPV Special purpose vehicle SRMC Short-run marginal cost T&D Transmission and distribution TEPCO Tokyo Electric Power Company TFP Total Factor Productivity TKV Vinacoal/Vinacoalmin TNC Transnational Companies TPES Total primary energy supply TVA Tennessee Valley Authority TWh Terawatt hour UK United Kingdom UNCTAD United Nations Conference on Trade and Development UNDP United Nations Development Programme US United States US$ United States Dollar USA United States of America USSR Union of Soviet Socialist Republics VND Vietnam Dong VSH Vinh-Son Song Hinh Hydroelectric JSC WCD World Commission on Dams WNA World Nuclear Association WTO World Trade Organisation

1
Chapter 1: Introduction 1.1 Climate change, GHG emissions and environmental technological change
There is a general scientific consensus that anthropogenic climate change poses a serious
threat to the development prospects of many countries in the medium to long term.
Recent projections discussed by the Inter-governmental Panel on Climate Change
(IPCC) suggest that to stabilize the concentration of greenhouse gases (GHG) at a level
below 490ppmv CO2e1 global GHG emissions would need to be cut by at least 50%
from 2000 levels by 2050 and peak before 2015. This is likely to limit global warming to
1.4-3.6°C above pre-industrial levels depending on climate sensitivity (Metz et al 2007).
Even temperature rises of this order are likely to pose a substantial threat to the climate
system, temperature rises of above 2°C risk serious damage to ecosystems through
exceeding key tipping points beyond which change is expected to increase rapidly (Metz
et al 2007; Stern 2007).
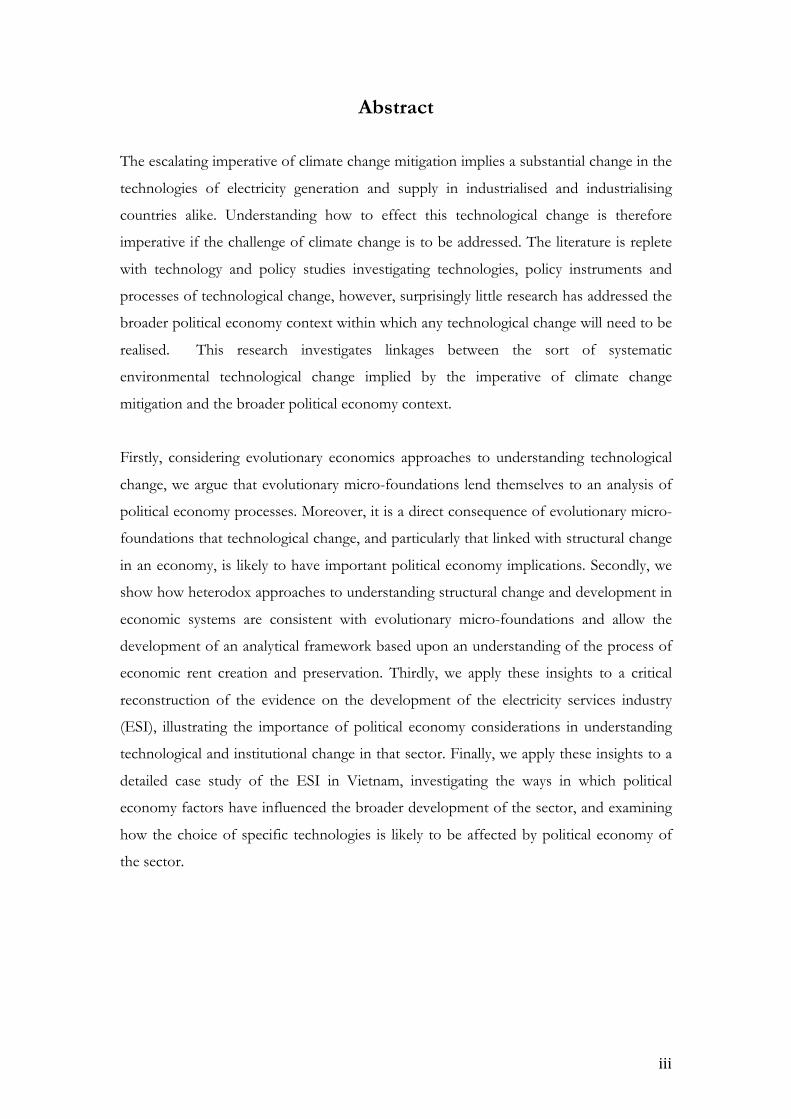
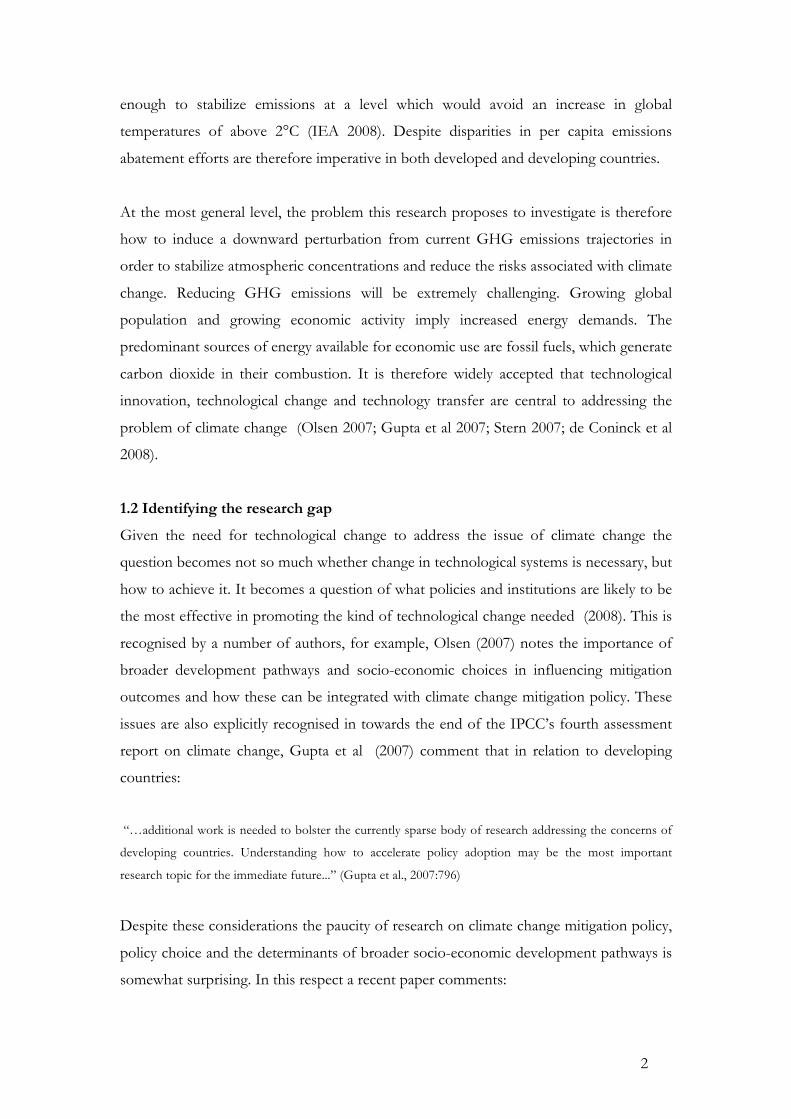
Figure 1.1. Global CO2 emissions from fossil fuel combustion by country income group 1990 - 2010
Source: World Bank 2013 Given the rapid growth in global GHG emissions over recent decades, and accelerating
growth in emissions in middle income ‘emerging’ economies (Figure 1.1), there is an
escalating imperative for countries to decrease the speed of emissions growth in the near
term and reduce absolute levels of emissions in the longer term. Recent projections from
the IEA suggest that even if OECD and other high income countries reduced their
emissions to zero, without abatement effort in developing countries this would not be
1 The notation indicates: ppmv – parts per million volume; and, CO2e - carbon dioxide equivalent, this includes other greenhouse gases such as Nitrous Oxide, Methane and CFCs weighted by their global warming potential.
0"
5"
10"
15"
20"
25"
30"
35"
1990" 1995" 2000" 2005" 2010"
CO2"em
ission
s"(Gt)"
Low$income$
Lower$middle$income$
Upper$middle$income$
High$income$
90"
110"
130"
150"
170"
190"
210"
230"
250"
1990" 1995" 2000" 2005" 2010"
CO2"em
ission
s"(inde
x"1990"="100)"
World$
Upper$middle$income$
Lower$middle$income$
Low$income$
High$income$
2
enough to stabilize emissions at a level which would avoid an increase in global
temperatures of above 2°C (IEA 2008). Despite disparities in per capita emissions
abatement efforts are therefore imperative in both developed and developing countries.
At the most general level, the problem this research proposes to investigate is therefore
how to induce a downward perturbation from current GHG emissions trajectories in
order to stabilize atmospheric concentrations and reduce the risks associated with climate
change. Reducing GHG emissions will be extremely challenging. Growing global
population and growing economic activity imply increased energy demands. The
predominant sources of energy available for economic use are fossil fuels, which generate
carbon dioxide in their combustion. It is therefore widely accepted that technological
innovation, technological change and technology transfer are central to addressing the
problem of climate change (Olsen 2007; Gupta et al 2007; Stern 2007; de Coninck et al
2008).
1.2 Identifying the research gap
Given the need for technological change to address the issue of climate change the
question becomes not so much whether change in technological systems is necessary, but
how to achieve it. It becomes a question of what policies and institutions are likely to be
the most effective in promoting the kind of technological change needed (2008). This is
recognised by a number of authors, for example, Olsen (2007) notes the importance of
broader development pathways and socio-economic choices in influencing mitigation
outcomes and how these can be integrated with climate change mitigation policy. These
issues are also explicitly recognised in towards the end of the IPCC’s fourth assessment
report on climate change, Gupta et al (2007) comment that in relation to developing
countries:
“…additional work is needed to bolster the currently sparse body of research addressing the concerns of
developing countries. Understanding how to accelerate policy adoption may be the most important
research topic for the immediate future...” (Gupta et al., 2007:796)
Despite these considerations the paucity of research on climate change mitigation policy,
policy choice and the determinants of broader socio-economic development pathways is
somewhat surprising. In this respect a recent paper comments:
3
“The plethora of low-carbon scenarios, road maps and pathways developed in recent years by academia,
businesses, governmental agencies and NGOs do not have a remote chance of becoming reality without
conducive political and institutional conditions…[…]…future studies must go beyond studying technical-
economic possibilities and consequences and put more emphasis on how these futures can be
attained…future studies will then benefit from integrating underlying political drivers and the complex institutional and
social context through which policies are conceived, filtered and interpreted before they have an effect.” [emphasis added]
(Nilsson et al 2011:1127)
While the literature on climate change is replete with work on the micro and macro-
economics of climate changed modelled using a variety of methods from a variety of
methodological and theoretical standpoints, there are two important gaps in the literature
that this research attempts to address. The first relates to the extent to which the political
economy is addressed in the literature on technological change (Geels 2011). The micro
foundations of evolutionary economics and other research conducted in broadly this
tradition fail to satisfactorily address the implications of their approach for the
relationship between technological change and political economy. Similarly, while a
number of writers have gone some way to investigating the relationships between
technological change, economic development and political economy, work on the
implications this may have for climate change mitigation is largely absent (Mokyr 1992,
1997; Moe 2009, 2010). The second gap in the literature relates to the paucity of
empirical research relating processes of environmental technological change to political
economy considerations. There are growing bodies of research on the political economy
of technological systems (and energy systems in particular) and institutional change, but
these have generally failed to address considerations relating to the mitigation
implications of technology choice in general and in developing countries in particular.
Formalising the focus of this thesis, in addressing these two gaps in the literature the
question we first seek to answer is: To what extent is the possibility for systematic environmental
technological change affected by political economy. What are the linkages between technological change and
political economy processes and how should we understand them? In addressing the second gap in
the literature, we seek to answer the question: To what extent have political economy factors
influenced the choice of technology in the electricity services industry of Vietnam?
1.3 Overview of the argument
In order to answer these two questions our argument is developed in two main parts, the
first concentrating on the theoretical and analytical basis (Chapter 2 and 3) and the
4
second elaborating the application of the theoretical work to a particular sector (the
electricity services industry (ESI)) (Chapter 4) and the case study country of Vietnam
(Chapters 5, 6 and 7). The jumping off point in Chapter 2 is an overview of the literature
on evolutionary approaches to technological change. We argue that the explanation of
technological change calls for more realistic causal micro-foundations than those offered
by the neo-classical economic cannon. The approach offered by evolutionary economics
is found to offer realistic micro-foundations, which enable a more accurate description of
empirical phenomena and a fruitful way of understanding the dynamic processes driving
technological change. At the same time we find that the implications of evolutionary
accounts as regards the role of the political economy have not been fully taken on board
by the literature on technological change, and this is an important gap in the evolutionary
literature on technological change. From this argument we conclude that when
considering the possibility of environmental technological change, the political economy
context is likely to be closely related to the technological context, and there is a strong
prima facie argument for the examination of the political economy of technological change
when seeking to address climate change mitigation.
Chapter 3 makes the same argument from the top down, through a review of the
literature on institutional development and political economy in the process of economic
development. This traces the implications of this literature for the understanding of
technological change, with a particular emphasis on the process of economic
development. In common with the bottom-up argument, from the top-down this
account takes issue with broadly neo-classical explanations of the process of
technological change in the wider development process. We find that attention needs to
be paid to the structural aspects of technological change in the process of economic
development and industrialisation, and in particular institutional and political economy
factors. Again, we find close connections between the process of technological change
and political economy. These institutionally mediated connections are likely to be an
important factor in determining the possibility of technological change. We complete this
chapter by sketching an analytical framework, which uses the notion of economic rents
as a means to understanding political economy processes in developing countries.
Chapter 4 takes up the theory developed in Chapters 2 and 3, and develops a case study
of the electrical services industry. This chapter uses secondary accounts in a critical

5
reconstruction of the research on the sector to establish in greater detail the linkages
between technological systems and the political economy. This review presents evidence
to support the contention that technological choices made in the electrical services
industry have often been subordinated to political economy processes. Based on the
evidence presented in the chapter, Chapter 4 ends with an elaboration of the analytical
framework developed in Chapter 3 with respect to the ESI.
Following on from this analysis Chapters 5 and 6 develop an empirical case study of the
power sector in Vietnam examining in greater detail the coevolution of the electricity
services industry and the political economy. Chapter 5 explains the rationale for the
selection of Vietnam as a case study and presents background information on the
political economy context in Vietnam to allow the development of the ESI case study in
Chapter 6. Chapter 6 gives a history of the development of the ESI in Vietnam, with a
particular focus on the development of the sector in the period between 1990 – 2010. In
so doing it seeks to illustrate how the fundamental technological and economic attributes
of the ESI have developed in Vietnam’s institutional and political economy context. In
particular, it seeks to draw out key linkages between the political settlement in Vietnam,
the role of elites, and the development of the ESI.
The final chapter of this thesis concludes through drawing on the evidence presented in
Chapters 4, 5 and 6 to illustrate more specifically how political economy factors have
influenced technology choice. The chapter also looks at what this may imply for climate
change mitigation in Vietnam and concludes with recommendations for further study.

6
Chapter 2: Getting the micro-foundations right - a critical reconstruction of the literature on technological change “The current dialogue regarding policy toward innovation rests on two premises. The first is that
technological advance has been a powerful instrument of human progress in the past. The second is that
we have the knowledge to guide that instrument toward high priority objectives in the future. The first
premise is unquestionable: the latter may be presumptuous.” (Nelson & Winter 1977:38)
2.1 Introduction
Economists have long realised the importance of technological and institutional change
as key causal factors in generating economic growth and development (Smith 1776;
Marx 1867). In more recently, early growth accounting exercises found that technological
change accounted for the largest proportion of productivity growth (Solow 1956;
Denison 1962).2 But, as the quotation from Nelson & Winter (1977) above suggests,
while there has been a general agreement on the importance of technological change
there still remains a deep disagreement as to the causal factors that drive technological
change.
Initial characterisations of technological change explained it as a, more-or-less, linear
process, either effectively driven by investment in research and development activities, or
induced in firms through market price signals (Ruttan 2001). More recently, this ‘induced
innovation’ account has been augmented by the suggestion that the process of
technological change is subject to chronic market failures due to various externalities and
knowledge asymmetries (Jaffe et al 2002; Jaffe et al 2005). Despite the continuing
influence of the induced innovation account in the formation of technology (and
environmental) policy, the empirical evidence is equivocal, and the account itself has
been subject to considerable criticism on conceptual grounds (e.g. Mowery & Rosenberg
1979). Indeed, opponents have suggested that precisely in the explanation of the
phenomena of technological change that the induced innovation account, and the neo-
classical economic foundations upon which it rests, have been at their weakest (Nelson
1995; Nelson & Winter 2002; Dosi 2011).
Here we focus on alternative accounts of technological change that have rejected the
primary causal role given to demand in determining technological change.3 Drawing on
2 These are discussed in greater detail in Annex A3. 3 For a critical review of the induced innovation account and realted empirical work see Annex A2.
7
Schumpeter (1934; 1939) and Simon (1955), evolutionary and path-dependency
approaches have developed theories of technological change, which stress the role of
uncertainty, technological inertia and path-dependency in technological change (Dosi
1982; Nelson & Winter 1982; David 1985; Arthur 1989). These accounts also emphasise
the role and co-development of institutions in understanding technological change. In so
doing, evolutionary and path-dependency accounts represent a departure from neo-
classical micro-economics and present a challenge to the dominant paradigm (e.g. Dosi
2011).
A large case study literature from economic history and innovation systems stressing the
role of the national institutions in realising technological change has been an important
source of empirical evidence for the evolutionary approach (Lall 1994; Freeman 1995;
Kim & Nelson 2000). More recently, focusing on the development of individual
technologies or technological regimes, in respect of technological transitions towards
greater environmental sustainability, developments in theorising technological change
have drawn heavily on the insights of evolutionary economics, path-dependency,
technological lock-in and new institutional economics (much of which is seen as broadly
compatible with evolutionary micro-foundations). The sustainability transitions literature
has yielded valuable insights into the way in which technological change is articulated in
social systems (Rip & Kemp 1998; Unruh 2000; Geels 2005b; Geels & Schot 2007). Both
the transitions literature and the evolutionary tradition in general have been productive
of a great deal of detailed empirical research in support of the theory.
Evolutionary approaches have also been extended to the description of political
processes. The application of evolutionary concepts to political analysis seems
particularly promising (Pierson 2000; Pierson 2004). The implications of this research
program have yet to be fully worked out or taken on board by other writers on
technological change in the evolutionary tradition, with a few notable exceptions (e.g.
Mokyr 1997; Moe 2010). By contrast, the treatment of politics in the sustainability
transitions literature remains a largely ahistorical account of the technical difficulties with
governing technology transitions (Smith et al 2005; Smith & Stirling 2010; Meadowcroft
2011). Given the amenability of political processes to an analysis through evolutionary
micro-foundations the absence of a more descriptive evolutionary account of the
8
relationship between the causal processes involved in technological, economic and
institutional change, and the causal processes involved in political change is puzzling.
The main argument of this chapter is that there are good reasons to believe that an
evolutionary account of technological change is correct. The implications of this for
understanding the process of technological change and appropriate technology policy are
significant and well developed in the literature. The focus of the argument here, however,
is that a direct consequence of evolutionary micro-foundations is that political processes are also subject to
evolutionary dynamics. The way in which these micro-foundations are likely to be articulated
in political processes will lead to the co-determination of political and techno-economic
processes, or to put it another way, the emergence of a determinate political economy. In
effect, the implication is that a technological regime is a regime of political economy with
implications for the distribution of wealth and power. These vested interests are likely to
be a significant source of technological inertia.
In developing this argument this chapter serves both to present a brief review of the
theoretical literature on evolutionary approaches to technological change, and to place
the political economy analysis that will form the basis of following chapters on clear
micro-foundations.4 The chapter also extends the theory relating to technological change
(particularly as relates to radical or disruptive technological change), though showing
how evolutionary micro-foundations could lead to the emergence of a political economy
process, and so constitutes a novel addition to the literature.
Section 2.2 introduces evolutionary and path-dependency approaches to technological
change and elaborates their implications. Section 2.3 addresses some of the main
criticisms of the evolutionary approach. Section 2.4 takes up a key criticism relating to
the failure to treat political processes adequately within the evolutionary tradition, and
shows how political economy processes might emerge from evolutionary micro-
foundations, and section 2.5 concludes.
2.2 Evolutionary economics approaches to technological change
4 While this often seems to be regarded as an unnecessary step, there are important epistemological reasons relating to the identification of causal patterns in social systems (i.e. open systems which cannot effectively be closed), which point to the importance of realistic causal micro-foundations.
9
The main theoretical alternatives to the induced innovation approach are path-
dependency and evolutionary economics approaches. 5 Both approaches represent a
significant departure from the micro-foundations of neo-classical economics through the
development of an account of causal mechanisms able to explain the empirical
phenomena of technological change. The strategy of neo-classical economics has been to
attempt to show how empirical evidence on innovation can be made to accord with the
established axioms and the deductive superstructure of the discipline. By contrast, these
alternative approaches, put the dynamics of technical change at the heart of their
understanding for economic processes. This is enabled by the adoption of what they see
as more realistic micro-foundations.
2.2.1 Bounded rationality and its implications
The starting point for evolutionary approaches is the rejection of the perfectly rational
economic actor, which lies at the heart of neo-classical theory:
“The central presumption in neo-classical theory is that the observed configuration of economic variables
can be explained as the result of rational actors…[…]…having made choices that maximize their utility,
given the constraints they face, and that they have made no systemic mistakes about
that…[…]…systematic mistakes associated with ignorance, or wrongheaded understanding, of the basic
features of the situation are not admitted. The theory “works” by presuming the actors have a basically
correct understanding of there actual choices and their consequences, as the theorist models that choice
context….” (Dosi & Nelson 1994: 157)
The economic assumption of individual rationality is replaced by the notion of ‘bounded
rationality’, that is the observation that economic agents (individuals, firms, other
organizations) are more realistically characterised as being rational only within the limits
of their cognitive capacities and access to information (Simon 1955; Simon 1959). 6
Simon suggests that there are potentially significant costs associated with information
gathering and working out the consequences of an action (notwithstanding actual limits
to computational ability and available information). This implies a trade-off between
additional advantage gained by investing in information gathering activities and the cost
5 See Annex A2. 6 A similar rejection of rational choice theory is made in the influential behavoiral economics literature, “…the deviations of actual behavior from the normative model are too widespread to be ignored, too systematic to be dismissed as random error, and too fundamental to be accommodated by relaxing the normative system.” (Tversky & Kahneman 1986: 253)
10
of engaging in these activities. On this account, agents do not seek optimal courses of
action, rather within the constraints defined by their computational ability and their
access to information, they seek a ‘satisfactory’ course of action with respect to an
aspiration level, to use the term coined by Simon, they ‘satisfice’:
“…economic man is a satisficing animal whose problem solving is based on search activity to meet certain
aspiration levels rather than a maximizing animal whose problem solving involves finding the best
alternatives in terms of specified criteria.” (Simon 1959: 278)
The level of aspiration, which defines the conditions for the satisfaction of a desire is
based upon past experience and can move up or down in response to this (Simon 1959).
In this way, the notion of bounded rationality, suggests a second-order rationalisation of
satisficing behaviour – as procedural - to replace the first order, substantive rationality of
neo-classical economics (Simon 1986). This approach opens up the possibility that actors
may be wrong about the world, and that the social influences which form agents’
perception of, and expectations about the world are central to understanding the decision
making process (Foxon 2006).7
Simon (1959) suggests that firms (and organisations) also tend to act as satisficers rather
than maximisers. That is, they seek to satisfy an attainable objective such as an acceptable
market share or level of profit. The evolutionary theory of Nelson & Winter (1982) built
on this notion in the development of their concept of ‘routines’. Routines are patterns or
satisficing rules of thumb adopted by firms that persist over time, act as guides in
decision-making and together with environmental conditions determine firm behaviour.
For example, in the context of the innovation process, Dosi makes the following
observation relating to R&D expenditures:
“…firms tend to work with relatively general and event-independent routines (with rules of the kind . . .
‘spend x% of sales on R&D,’ ‘distribute your research activity between basic research, risky projects,
incremental innovations according to some routine shares . . .’ and sometimes meta rules of the kind ‘with
high interest rates or low profits cut basic research,’ etc.).” (Dosi 1988: 1134)8
7 It should be noted that this picture of decision-making is largely supported by, and consistent with empirical evidence from behavioural economics (Tversky & Kahnemann 1986). 8 This stands in marked contrast to the account related earlier given by Jaffe et al (2005) where R&D decisions are just the same as any other profit maximising decision made by the firm.

11
For Nelson & Winter (1982) routines form the basic building blocks of firm behaviour,
playing a role analogous to that played by genes in evolutionary biology.9 Routines are
‘heritable’, tend to show inertia and persist overtime. There are a number of reasons
given for this, firstly, because learning alternative routines can be costly (as the account
of bounded rationality suggests). Secondly, because firms are made up of individuals with
differing goals, routines have almost always evolved as - amongst other things - ways of
coping with conflict between different interest groups and individuals within the firm.
Because any change in routine can open up sources of conflict there is a tendancy
towards inertia. Thirdly, routines can also persist overtime as an irrational response to
change (Nelson & Winter 1982, 2002).10 11 Given this persistence, routines are retained,
and are passed on overtime from one generation to the next.
The economic system evolves through a process akin to natural selection. In a
competitive market environment, successful routines are selected both as a result of
negative feedback, as unsuccessful firms go out of business and their routines cease to
exist, and through positive feedback as firms develop new successful routines in
response to changes in firm objectives or external conditions. The evolutionary
metaphor, in this case, implies both Darwinian and Lamarckian processes. Therefore, to
paraphrase Nelson & Winter (2002), the acquisition of ‘individual skills, organisational
routines, advanced technologies and modern institutions’ comes about through a process
of ‘trial-and-error cumulative learning.’
The process of selection also assumes variation between firms and their fitness in a
particular context. This variation is a consequence of a complex changing environment
and the satisficing behaviour of firms, meaning that a single optimal solution is unlikely
to be obtained (Foxon 2006). The process is therefore one of constant change and the
system highly dynamic:
“…the selection process is always in a transient phase, groping toward its temporary target. In that case, we
should expect to find firm behaviour always maladapted to its current environment and in characteristic
ways—for example, out of date because of learning and adjustment lags, or “unstable” because of on-
going experimentation and trial-and-error learning … in reality, the broader currents of historical change in
9 At the level of the individual the analogous analytical category is that of ‘skill’. 10 Of course, if we may already espy a third order rationality here, in that individuals, as a rule of thumb have internalized the rule as regards routine of the sort, ‘if it ain’t broke don’t fix it.’
12
the socioeconomic system are forever imposing exogenous change on the economic subsystem, posing
new and unfamiliar problems to firms. To capture the phenomena characteristic of this reality requires a
fully dynamic analysis.” (Nelson & Winter 2002: 26)
Schumpeter’s conception of capitalist economies as dynamic systems prone to crisis
driven by technological change has been an important influence in the development of
the evolutionary approach, and as with Schumpeter the treatment of innovation and
technological change is central to the theory. Innovation is largely endogenous to the
system (although open to exogenous influence), firms search for better techniques and
technologies and as with other routines, the competitive market selects more successful
technologies for the particular market conditions. In this case, both demand-pull and
supply-push are clearly important.
2.2.2 Hierarchical complexity
Foxon (2006) has also suggested that Simon’s notion of hierarchical complexity relating
to complex systems can also help understand key characteristics of an evolutionary
system. Simon (1962) argued that in a complex system structural hierarchies consisting of
subsystems are likely to be more successful than systems with no hierarchies. He
suggested that in a complex evolutionary system made up of a large number of parts with
complex interactions, a structural hierarchy is likely to evolve as it can respond faster to
change. Simon drew an analogy with watchmakers creating their wares. When a
watchmaker attempts to build a whole watch at one go, if they are disrupted they need to
start the process again from scratch. If the watchmaker, however, builds a watch as a
series of sub-assemblies, then if they are interrupted in the process they loose much less
work. For sufficiently complex mechanisms consisting of many parts processes which
employ sub-systems are much more robust to environmental shocks (Simon 1962). This
implies that
“….[the] principle of faster evolution of a complex structure consisting of relatively stable sub-structures
will apply to any biological or social system and so such hierarchic systems are likely to be much more
common than non-hierarchic complex systems. For example, a problem-solving process, such as safe
cracking, consisting of selective trial and error, in which partially successful approaches are retained, will
find a solution much more rapidly than a completely random trial and error process.” (Foxon 2006: 263)
In the case of economic systems - where economic agents are self-aware, and though
bounded in their rationality, are satisficing – there is also room for positive feedback.
13
The productivity-enhancing division of labour in Adam Smith’s (1776) apocryphal pin-
factory, would seem to have been the result of just such a process of positive feedback.12
Another feature of hierarchical complexity is that systems are frequently ‘nearly
decomposable’ into their subsystems. That is to say that the links between subsystems are
much weaker relative to those within subsystems. As a result, analytically, the short-run
behaviour of a sub-system can be regarded as approximately independent of the short
run behaviour of other sub-systems. Similarly, the long-run behaviour of the sub-system
depends only on the approximate aggregate behaviour of other sub-systems (Foxon
2006).
Therefore, hierarchical complexity is likely to be common in evolutionary systems. It also
presents a more tractable way of understanding how a system is constructed, in terms of
system processes, functions and dynamics, rather than an understanding based upon a
description of their configuration at a point in time (Foxon 2006). This not only has
implications for the ontological categories admitted by evolutionary accounts (as
opposed to neo-classical accounts), but also their method. In the rest of this section we
examine the broader implications of these evolutionary micro-foundations in thinking
about technological change.
2.2.3 Implications of the evolutionary account
The evolutionary account places technological change at the heart of understanding
economic dynamics. It paints a picture of economic systems as open and dynamic, not
necessarily operating at an equilibrium, and prone to both periods of inertia and periods
of rapid change. Economic agents in these systems are heterogeneous, limited in their
abilities to gather knowledge and accurately assess the implications of their behaviour.
Instead, in the presence of bounded rationality, rational procedures guide decision-making,
which are learnt and adapted overtime in a cumulative process as a response to various
feedback mechanisms (Foxon 2010). This picture has important implications for typical
patterns of system behaviour. These emerge at the micro level, in terms of technological
change and at the macro-level in terms of economic growth and development. Here we
concentrate on the micro-level implications for technological change. The macro-level
12 Although we must tread with care, a certain degree of hubris means we are often want to attribute a degree of tractability and agency to a complex and uncertain world where these may frequently be epiphenomenal.
14
implications for economic growth and development are discussed in Chapter 3 and
Annex A3.
A number of important patterns and higher-level processes appear from the micro-
foundations of the evolutionary account, which have important implications for the
process of technological change. These include path-dependency (and the related
concepts of dominant design and technological lock-in), co-evolution of technologies
and institutions and the notion of a technological regime or paradigm.
Path-dependency on the evolutionary account is a consequence of cumulative learning
and the rejection of optimisation, there are three main ways in which path dependency
can emerge (Dosi 1997). Firstly, as a result of cumulative learning about technologies by
individuals; secondly, in behavioural routines or rules; and, thirdly, it may be a
consequence of cumulative growth, the development of production processes, factor
intensities etc. over time. In the evolutionary account, an important source of dynamic
increasing returns and thus path-dependency and lock-in is cumulative learning (Dosi &
Nelson 1994).
Running in parallel to evolutionary theory, path-dependency accounts of technological
change focus specifically on the process of adoption of new technologies and the
dynamics of their wider diffusion. The basic idea is that there are positive feedbacks
from the adoption of a technology, which generate path-dependencies over time. The
causal mechanisms by which these processes take place are those of dynamic increasing
returns to adoption. Arthur (1989) showed in a simple model of two competing
technologies, in the presence of positive feedback to adoption from unlimited dynamic
increasing returns, the initial choice of one or other of the technologies will lead
eventually to that technology absolutely dominating the market with a probability of one.
Arthur (1989, 1994) suggested four main types of dynamic increasing returns. Firstly,
scale economies, which are present when unit costs decline with increasing output. These
are typical of industrial and manufacturing processes, where the specialised division of
labour and large fixed, sunk costs mean that higher productivity and lower costs are
achieved at larger scales. However, these increasing returns are likely to be limited and at
some point are likely turn constant or decline (Arthur 1996). Secondly, learning effects
15
such as ‘learning-by-doing’ and ‘learning-by-using’ (see Annex A2, section A2.1). These
effects are empirically well established in the literature on learning curves.13 Thirdly,
adaptive expectations, which occur as a result of increasing the general knowledge stock
relating to a technology, thus decreasing uncertainty relating to the performance of the
technology and therefore acting to increase adoption relative to other competing
technologies. Finally, network and system effects. Network effects occur when the more
a technology is utilised the greater its usefulness becomes, such as with telephones or the
internet. System effects are similar, but are associated with groups of complimentary
technologies. For example, power generation, transmission and distribution technology,
which co-developed with end use technologies such as the electric light bulb and the
rotary electric motor (Hughes 1983; Katz & Shapiro 1994). Some of these dynamic
increasing returns will be more important in some industries and product classes than
others (Nelson 1995). Returns to scale are likely to be particularly prominent in
manufacturing industries as are learning effects, whereas, network effects are of
particular importance in the software industry, for example in social media.
The implication of this process is that initial conditions, historical contingencies or
otherwise random events, through increasing returns, “...can cause the economy
gradually to lock itself in to an outcome not necessarily superior to alternatives, not easily
altered, and not entirely predictable in advance.” (Arthur 1989b: 128) A number of
historical case studies support the main contentions of path dependency theory, where
historical contingencies and dynamic increasing returns have led to the lock-in of inferior
technologies. For example, David’s study on the dominance of the QWERTY keyboard
(David 1985), the so-called ‘battle of the currents,’ between AC and DC electricity supply
technologies (David & Bunn 1988), and Cowan (1990) on the adoption of light water
nuclear reactors.
Similarities with evolutionary accounts are immediately clear, as both learning effects and
adaptive expectations fit comfortably under the description of cumulative learning of
evolutionary theory. Indeed, Arthur’s following description of the economic system
bears more than a passing similarity that of Nelson & Winter (2002: 26):
13 For example, see Rubin et al (2004), Soderholm and Sundqvist (2007), and Jamasb (2007) for recent treatments of learning curves in renewable energy technologies.
16
“…in the increasing-returns world…[…]…re-everything has become necessary because every time the
quest changes the company needs to change. It needs to reinvent its purpose, its goals, its way of doing
things. In short, it needs to adapt. And adaptation never stops. In fact, in the increasing-returns
environment …standard optimization makes little sense. You cannot optimize in the casino of increasing-returns
games. You can be smart. You can be cunning. You can position. You can observe. But when the games
themselves are not even fully defined, you cannot optimize. What you can do is adapt. [emphasis added](Arthur 1996:
5)
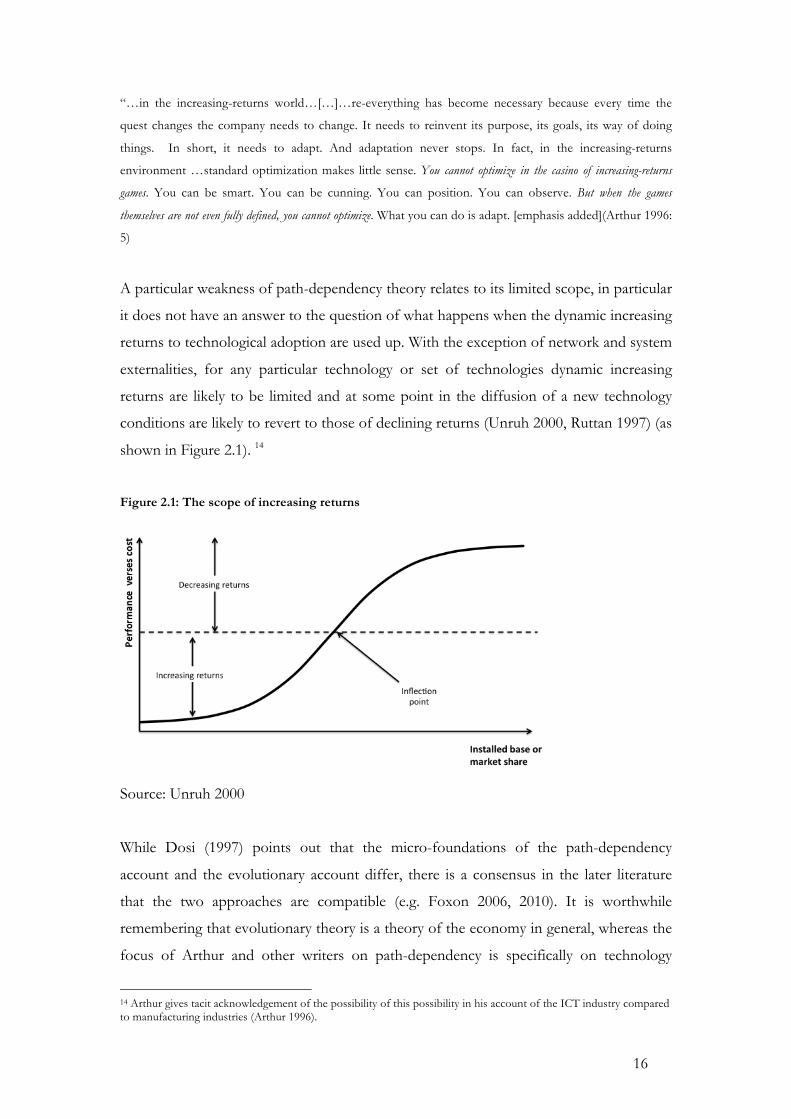
A particular weakness of path-dependency theory relates to its limited scope, in particular
it does not have an answer to the question of what happens when the dynamic increasing
returns to technological adoption are used up. With the exception of network and system
externalities, for any particular technology or set of technologies dynamic increasing
returns are likely to be limited and at some point in the diffusion of a new technology
conditions are likely to revert to those of declining returns (Unruh 2000, Ruttan 1997) (as
shown in Figure 2.1). 14
Figure 2.1: The scope of increasing returns
Source: Unruh 2000
While Dosi (1997) points out that the micro-foundations of the path-dependency
account and the evolutionary account differ, there is a consensus in the later literature
that the two approaches are compatible (e.g. Foxon 2006, 2010). It is worthwhile
remembering that evolutionary theory is a theory of the economy in general, whereas the
focus of Arthur and other writers on path-dependency is specifically on technology
14 Arthur gives tacit acknowledgement of the possibility of this possibility in his account of the ICT industry compared to manufacturing industries (Arthur 1996).
17
adoption. Nevertheless, it has proved to be a powerful argument in explaining the
phenomena of technological change and the tendency for convergence on dominant
designs and broader lock-in to particular technological systems.
The consequences of evolutionary micro-foundations go beyond path-dependency, and
are manifest in the notions of ‘dominant design,’ ‘technological lock-in’ and the co-
evolution of institutions. These are best illustrated by considering the dynamics of
technological change at the firm, although these processes will have their analogues in
other kinds of activity.
In the early stages of technological development there are typically a number of
variations of a technology all meeting an expected market demand in some way. These
technological alternatives compete in terms of market share and for cost reductions. At
some point, one technology reaches a dominant position in terms of market share and
becomes the de facto standard technology for meeting that particular demand, that is, it
becomes the ‘dominant design’ (Nelson 1995; Suárez & Utterback 1995). Once a
dominant design emerges from the innovation process, the risk of backing a white
elephant technology is diminished and firms tend to invest heavily in refining the design
and manufacturing processes, thus reducing costs. Therefore there is a shift away from
product innovation to process innovation and incremental improvements to the
dominant design (Unruh 2000).15
This in turn leads to specialisation in a firm’s routines as they become adapted to the
production of a particular technology. As many writers have pointed out, production and
the organisational capabilities of firms, centred on the dominant design, frequently
become part of firms’ core competencies and the foundation of their competitive
advantage (Chandler 1992; Leonard-Barton 1992; Prahalad 1993; Chandler et al 1999;
Christensen 1999). Therefore, a dominant design can entail a broader technological
trajectory, which will not only be composed of concrete technologies and the tacit
knowledge associated with their production, but also the very organisation and
management of the firm.
15 Nemet (2009) finds just this pattern in his study of patent data for wind turbines in the US.
18
More generally, drawing on Khun’s notion of scientific paradigms and revolutions, Dosi
(1982) suggests an analogous process in the development of technology he terms a
‘technological trajectory’. He makes a distinction between normal incremental problem
solving within a technological regime and non-normal problem solving associated with
radical technological change. Technological lock-in may result from ‘mutual
reinforcement’ between an incumbent technology, the process of learning surrounding it
and patterns of investment in innovative activity, which have been fruitful previously. A
concrete example of this comes from Christensen’s (1997) observation that large firms
that are the successful producers of dominant technologies, tend to invest in R&D
concentrating on incremental improvements of incumbent technologies.16 Smaller firms
which are not heavily invested in the current technological trajectory, and who are unable
to compete with incumbents in established technologies, are more likely to be
innovators, investing in riskier new technologies, provided they are able to obtain the
necessary resources.
Typically, how firms respond to technological change will depend upon the extent to
which a firm’s competitive advantage, core competencies, capabilities or assets are
perceived as being compatible with the new technology (Pinkse & Kolk 2010). In the
case where a new technology is perceived as not being compatible firms may act to
intentionally supress it.17 Therefore, it is important to stress, the positive feedbacks of
evolutionary dynamics18 are not confined to embodied technologies and low-level firm
routines, as evolutionary economics sometimes seems to suggest, but can encompass
strategic and political decisions. We will consider in greater detail the role of vested
interests in technological change later on in this section.
Considerations of the different possible types of technological change are extremely
important in determining the likely characteristics and barriers to change that can
emerge. Empirical work has added to the understanding of different ways in which
technological change can be elaborated within the framework above. Freeman & Perez
(2000) suggested a four level taxonomy of technological change, distinguishing between,
incremental innovation, radical innovation, new technological systems and changes in
16 Dosi (1982) also notes how concentration on incremental and process innovation centring on a dominant design may effectively suppress investment in R&D for new, innovative technologies. 17 See Sovacool (2008) on the use of IPRs to suppress environmentally friendly technologies. 18 Lamarkian evolutionary dynamics (characterized by positive feedbacks) as opposed to Darwinian evolutionary dynamics (characterized by negative feedbacks).
19
techno-economic paradigms. Incremental innovations are those that take place almost
continuously; these processes are the same as learning processes in the manufacture and
use of technologies (i.e. learning-by doing and learning-by-using).19 These processes are
extremely important in determining productivity improvements, but they are not the
result of formal R&D activity.
Radical innovations are typically the result of R&D activity in firms or other institutions.
They are radical in the sense that they are a departure from incumbent technologies and
processes in a way which would preclude their development from within them. For
example, nuclear technology could not have evolved within the fossil fuel fired thermal
industry. Such innovations tend to be unevenly distributed between sectors and over
time. They also frequently entail a combination of product, process and organisational
innovation. Such technologies are associated with the development and expansion of
new markets and concomitant surges in investment. However, in general their individual
economic impact is limited, in aggregate they can bring structural change overtime or
when part of a nexus of related radical innovations they can lead to the rise of new
sectors of production.
Changes of ‘technology system’ are wide ranging technological changes affecting a
number of economic sectors and creating new sectors. These technological changes
affect a number of firms and are based upon a cluster of both incremental and radical
innovations that are economically and technically related. They are usually associated
with managerial and organisational change affecting a number of firms.
Finally, changes in ‘techno-economic paradigm’ these are changes that have pervasive
system-wide implications for the behaviour of an economy. They go beyond ‘engineering
trajectories’ for particular processes to affect the cost structure, mode of production and
distribution throughout the economy. These paradigms, once established, become the
main influences on incumbents (engineers, designers, managers) for decades. These
changes imply a painful and disruptive adjustment process for the economy, and
importantly, its characteristic institutional framework. Freeman & Perez (2000) argue that
19 See Annex A2.
20
these changes in techno-economic paradigm are associated with long- term economic
cycles (Annex A2, Table A2.1).20
This taxonomy serves to highlight how different types of technological change are likely
to differ substantially in their characteristics and implications. Importantly, the causes of
technological change differ in each case. For example, incremental technological change
might be more responsive to market demands, whereas radical technological change
might be more closely associated with R&D spending. Similarly, effects are likely to
differ. In the case of incremental change processes, organisations and institutions are
likely to be unaffected. Radical change is likely to have a localised impact on a wider
range of managerial and organisation arrangements. And shifts in the techno-economic
paradigm are likely to have far reaching implications for all kinds of production,
consumption - and importantly - institutional arrangements.
2.2.4 Co-evolution of institutions
Another aspect of technological change discussed in detail by evolutionary theorists has
been the co-evolution of technologies with institutions.21 On an evolutionary account,
institutional arrangements and their development can be generated by similar micro-
foundations as those used in the analysis of technological change (i.e. bounded rationality
and uncertainty). Institutions (like firms) are satisficing, not optimising (North 1990a).22
This implies that the characteristics of evolutionary development will also apply to
institutions, variation, selection and persistence of institutions or institutional
characteristics carried by satisficing routines, which encapsulate a knowledge gained
through a cumulative learning process, whether it be tacit or explicit, formal or informal.
The development of institutional arrangements overtime is therefore likely to be
characterised by non-linear change, path-dependency and lock-in (North 1990a; Pierson
2000; Nelson & Nelson 2002; Foxon 2010).
North (1990b; 1990a; 1994) draws heavily on Simon’s notions of bounded rationality,
and Arthur’s account of path-dependency in his analysis of long- run growth. He argues
institutions imply very high set-up costs, significant cumulative (more or less
incremental) learning effects can occur within an institutional framework. Network-like 20 Kondratiev long-waves. 21 Here we follow Foxon (2010) in defining institutions broadly as ‘ways of structuring human interactions’ (21) 22 This contrasts with writers such as Williamson (1998) who see institutions as efficient ways of structuring interactions developed in response to, amongst other things, transaction costs.
21
effects occur in virtue of the co-ordination function institutions play, for example in
ensuring contracts will be honoured. Adaptive expectations play a role in this as
institutional norms define broad trajectories, which are expected to persist overtime. This
not only encompasses formal, explicit institutional rules, but also a range of informal
norms, which tend to be resistant to change:
“It is the admixture of formal rules, informal norms, and enforcement characteristics that shapes economic
performance. While the rules may be changed over-night, the informal norms usually change only
gradually. Since it is the norms that provide ‘legitimacy’ to a set of rules, revolutionary change is never as
revolutionary as its supporters desire, and performance will be different than anticipated.” (North 1994:
366)
Once a particular path has been taken in institutional development, these positive
feedbacks serve to lock-in institutional arrangements potentially, for the very long term.
It should also be noted that, these positive feedbacks will be largest, not at the level of
the individual firm or institution, but at a macro-level where many institutions interact in
complementary ways, North (1990a) argues “…the interdependent web of an institutional
matrix produces massive increasing returns” [emphasis added](95).
Williamson (2000) echoes this observation in his frequently cited analysis developing a
four level taxonomy of institutions. This analysis identified different types of institutions
in terms of their relative stability over time, in respect of the type of institution and the
decision principles characterising the behaviour of individuals within these institutions.
Some types of institutional arrangements, such as cultural values, social norms, customs,
tradition and religion, have a tendency to persist for very long periods of time, over
centuries or millennia. Although even in these cases change can be rapid, if one thinks of
the Reformation in the sixteenth century or the rapid spread of Islam in the seventh
century. Other types of institutional arrangements are changing almost constantly, such
as transactions within markets. The characteristics of individual behaviour within these
different institutions also tend to differ, within the realm of cultural norms deliberative
decisions are atypical, whereas within the market direct deliberations are the norm.23
23If Williamson is correct and most decision making within these kinds of institutions is not deliberative, then we could expect to see less room for a process of positive feedback in these kinds of institutions. Although, it is not out of the question, as arguably the example of the Reformation illustrates.
22
Institutions can be described as developing through similar processes to technologies and
productive capacities. it becomes clearer how technologies and institutions can co-
evolve. On one hand, the institutional context will, to a considerable extent, determine
the extent and success (or otherwise) of technological innovation and change by
providing not only resources, but also more general incentives and opportunities that can
facilitate technological innovation and change. For example, certain cultural norms
arguably persisting since the Enlightenment have been present and played an important
role in the technological change in the modern eara. The particular form of property
rights and onweship patterns that developed in North-Western Europe, and the United
Kingdom in particular, in the seventeenth and eighteenth centuries lent themselves to a
particular type of production and the co-development of associated technologies (Myrdal
1990; Wood 2002). In this case, the form of institutions that developed provided
incentives for increasing economic productivity from the application and development of
new technologies (North 1990a).24
Private and social institutions that tend to co-develop with technological systems and are
often an important source of technological inertia. For example, institutions, which
develop with technological systems include schools of specialist study, professions, new
academic disciplines, and unions. The interests of these institutions are often aligned with
the technological system of production and consumption, which developed with them
(Unruh 2000). Hughes writing on electrification at the beginning of the twentieth century
describes this process:
“The momentum initially came mostly from an aggregate of manufacturers who invested heavily in
resources, labor, and manufacturing plants in order to produce the machinery, devices, and apparatus
required by the new system; later, educational institutions taught the science and practice of the new
technology; then research institutions were founded to solve its crucial problems; and all the while a
growing number of engineers, skilled laborers, appliers of science, managers, and other persons invested
their experience and competence in the new...system” (Hughes 1983)
A similar story is found in Freeman’s (1995) historical account of national innovation
systems. Freeman stresses the role of the nation state in promoting technological change
and innovation. Taking the example of German catch up to Britain in the nineteenth
century, Freeman suggests that in order to catch up the Prussian (and later German)
24 This is a point to which we return in the review of literature on economic catch-up in Chapter 3 of this thesis.
23
state, amongst other things, developed technical training programmes and institutes,
oversaw the acquisition and reverse engineering of British technology, waived duties on
imports of industrial equipment, oversaw the distribution of technology to
manufacturers, organised the employment of British craftsmen in Prussia to allow the
transfer of tacit knowledge and sent officials abroad for ‘tours of inspection’. Freeman
also points out how the right sort of institutions can promote innovation, citing again the
example of the development of in-house R&D in the German chemical industry in the
1870s, an innovation that was subsequently copied in other industries and in other
sectors. The National Innovation Systems (NIS) literature is important in the discussion
of catch-up in latecomer countries this is taken up in greater detail in Annex A3 and
Chapter 3.
2.2.5 The multi-level sustainability transitions perspective
The multi-level perspective is an influential and recent approach to understanding
technological change, emerging from research into policy design for managing system-
wide technological change to promote environmental sustainability in the Netherlands.
There is a large literature on the multi-level perspective, our purpose here is the purely
instrumental one of interrogating the theory to unearth its micro-foundations.
In general the systems-wide approach of the multi-level perspective draws heavily (and
often implicitly) upon evolutionary economics notions of bounded rationality,
statisficing, path-dependency, dominant design, the co-evolution of institutions.
Exposition of the role played by contextual contingencies in the development and
diffusion of new technologies plays a central role in this approach to the analysis of
technological change (Rip & Kemp 1998; Geels 2004; Geels & Schot 2007). However,
the level of analysis in the literature concentrates upon the operation of social and (more
latterly) governance structures, with little reference to the more fundamental casual
mechanisms that determine the material distribution of resources, upon which these
social structures must necessarily supervene.25 Nevertheless, this level of analysis has
enabled the transitions literature to emphasise the importance of higher-level structures
at different scales of analysis, and attempt a more systematic account of the role they play
in technological change. There are also close parallels between this work and that of
Freeman & Perez’s (2000) and their taxonomy of technological change, NIE accounts of 25 Indeed, a fundamental criticism of the transitions account is that is pays too little attention to economic factors, and in particular costs as a determinant of technological change.
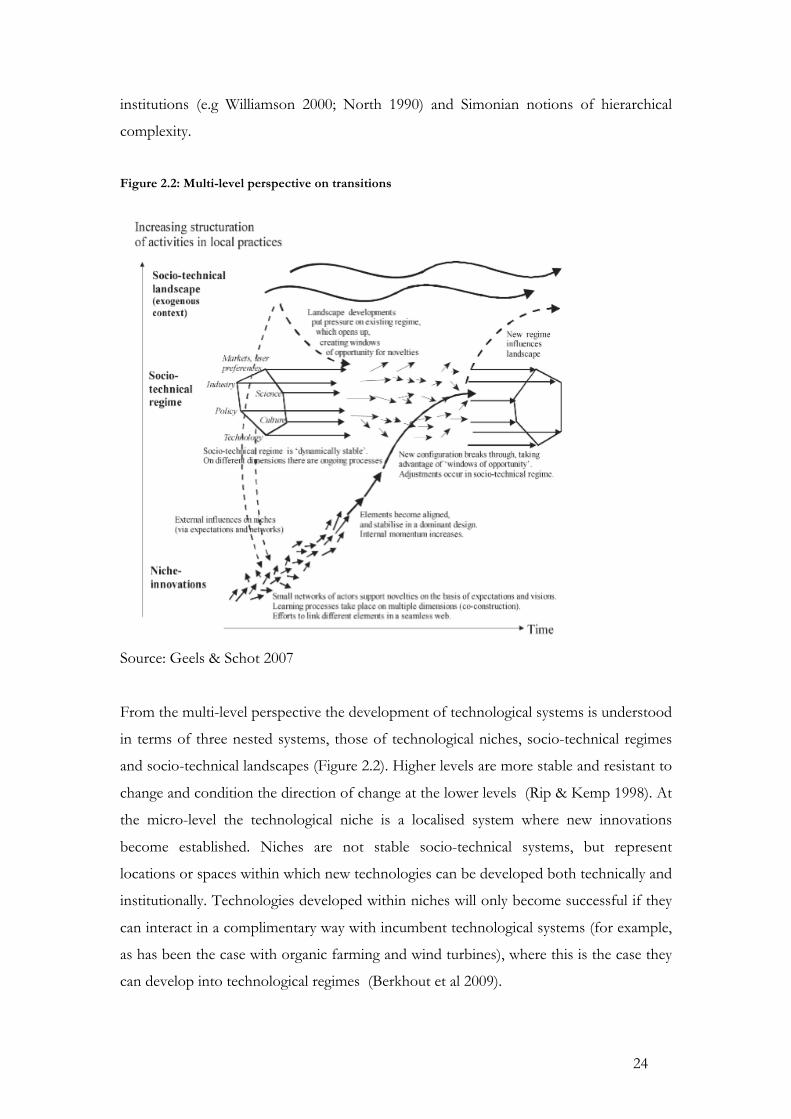
24
institutions (e.g Williamson 2000; North 1990) and Simonian notions of hierarchical
complexity.
Figure 2.2: Multi-level perspective on transitions
Source: Geels & Schot 2007
From the multi-level perspective the development of technological systems is understood
in terms of three nested systems, those of technological niches, socio-technical regimes
and socio-technical landscapes (Figure 2.2). Higher levels are more stable and resistant to
change and condition the direction of change at the lower levels (Rip & Kemp 1998). At
the micro-level the technological niche is a localised system where new innovations
become established. Niches are not stable socio-technical systems, but represent
locations or spaces within which new technologies can be developed both technically and
institutionally. Technologies developed within niches will only become successful if they
can interact in a complimentary way with incumbent technological systems (for example,
as has been the case with organic farming and wind turbines), where this is the case they
can develop into technological regimes (Berkhout et al 2009).
25
Socio-technical regimes are thought of as an extended version of Nelson & Winter’s
(1982) notion of a technological regime or Dosi’s (1988c) techno-economic paradigm
(Geels & Schot 2007). Rip & Kemp (1998) describe regimes as follows:
“A technological regime is the rule-set or grammar embedded in a complex of engineering practices,
production process technologies, product characteristics, skills and procedures, ways of handling relevant
artifacts and persons, ways of defining problems - all of them embedded in institutions and infrastructures.
Regimes are intermediaries between specific innovations as these are conceived, developed, and
introduced, and overall sociotechnical landscapes.” (Rip & Kemp 1998:338)
A technological regime is defined by a shared pattern of routines within which engineers
and firms generally work, but extended beyond the supply-side pre-occupations of much
evolutionary economics theory to include societal influences including interest groups,
consumers and policy makers. Thus the satisficing routines, which define the institutional
environment within which societal influences function take an important role in
determining behaviour and influence technological change. Regimes can exist at multiple
scales and are frequently nested, as in the example of various large-scale power
generation technologies, which represent individual regimes nested in the boarder
national power generation and transmission regime (Berkhout et al 2009). This notion of
regime may seem to add little substantively to theory elaborated in the analysis of writers
such North (1990, 1994) and Freeman (1995), save by making the function and
importance of different forms of institutions more explicit. However, another factor
which re-emerges as a result of this more detailed understanding is the importance of the
demand-side. This is not demand manifest as an undifferentiated demand-pull, but as a
distinctly complex social phenomenon which itself co-evolves with technology.26
At the broadest level, socio-technical landscapes are usually described as the contextual
influences on the socio-technical regime or the selection environment for a regime
(Berkhout et al 2009). These include, for example, trends in demography, culture, politics
and other social trends, the bio-physical environment, resource price and income levels.
In early iterations of transitions perspective the landscape is considered largely
exogenous to the socio-technical regime (Geels & Schot 2007):
26 In a way this represents a reprise for a more Veblenian understanding of demand and the socially constructed role of consumption.
26
“…background variables such as the material infrastructure, political culture and coalitions, social values,
worldviews and paradigms, the macro economy, demography and the natural environment which channel
transition processes and change themselves slowly in an autonomous way.” (Kemp & Rotmans 2001: 7)
More recently, in a paper addressing criticisms of this notion of the landscape, Geels
(2011) has proposed a more nuanced account of landscape trends. Firstly, landscape
trends can be more or less dynamic. Bio-physical systems, for example, tend to change
only slowly, other influences may be volatile and change rapidly (e.g. oil and other
commodity prices) and still others can display trends over time (such as demographics).
Second, landscapes can act both to stabilise and destabilise incumbent regimes. For
example, high oil price could destabilise the current personal transportation regime, but
on the other hand landscape elements such as higher incomes, increased globalisation
and world trade could act to stabilise the regime. And, thirdly, landscapes could be
treated as endogenous, rather than just a source of exogenous shocks or stabilisations. In
this context, Geels (2011) suggests the notion of landscapes could be linked with that of
Kondratiev long waves. Alternatively, Geels (2011) also suggests that macro-economic
growth and development could be analysed as:
“…the emergence of new socio-technical systems, replacing or radically altering traditional and early-
modern systems in key sectors, including energy, transport, agriculture and food, water and urban
development. These new systems emerge through the interplay between new knowledge and practices on
the one hand, and the prevailing institutional and social contexts on the other.” (Berkhout et al 2009: 225)
Geels (2011) comments that there is scope to link transition studies to broader research
on development in general. We return to linkages between economic development and
technological change in Chapter 3.
The transitions literature is a fruitful elaboration of the evolutionary account,
representing a broader and more systematic treatment of the interplay of societal
influences on the process of technological development. This is warranted particularly in
response to the challenge posed by the development of a sustainable techno-economic
paradigm, which has far reaching implications beyond considerations of firm, regional or
national economic performance. Nevertheless, its weakness also lies in an over-emphasis
on societal factors, and a failure to give adequate weight to the material determinants of
technological change. These appear in two ways, i) in terms of the costs of technology;
27
and, ii) in a rather less straight-forward way, in terms of the political economy which to a
large extent is likely to be determined by the surplus (profits, rents) associated with a
particular techno-economic paradigm.
Technology costs are something which re-emerge clearly in Chapter 4 with the
consideration of the ways in which technological change is elaborated in the power
sector. Linked to this, the importance of the political economy, however, emerges from
the micro-foundation of evolutionary theory. This is discussed in greater detail in section
2.4.
2.2.6 Implications for policy
We have attempted to briefly present a large and rapidly growing theoretical literature
that can broadly be described as belonging to the evolutionary canon. We have done this,
not in order to give a comprehensive review, but to uncover the causal micro-
foundations, which are elaborated through the process of technological change. What
emerges is a substantially different world to that of neo-classical economics, economies
emerge as dynamic open systems with no tendency to anything other than temporary,
local equilibriums; economic agents are heterogeneous, only boundedly rational, with
imperfect foresight and knowledge of the world, but with the ability to learn and adapt
over time; agents interact not only through markets but through a variety of different
structures; higher-level structures emerge from the operations of micro-level behaviour
upon which they supervene; and, the evolutionary processes involved create new patterns
and structures, which develop in order and complexity over time (Foxon 2011).
This account has important implications for policy to promote technological change.
The conventional, induced innovation perspective would suggest that the policy
imperative is to ensure that the prices are correct. In the case of environmental
technologies this means through internalising external environmental costs to generate
demand and correcting market failures associated with technological innovation and
adoption, i.e. knowledge spill-overs to innovation and diffusion, network externalities,
and financial market failures both in funding R&D and in funding the adoption of new
technologies. Correcting the market failures internal to the process of technology change
and environmental externalities generated by incumbent technologies would allow

28
optimising firms to respond to the price signals and engage in the development and
adoption of new environmental technologies.
We may agree with Ruttan’s (2001) intuition, in common with the neo-classical inducted
innovation account, that demand plays a role in conditioning the direction of
technological change. We may also allow that in certain circumstances for certain types
of technological change that demand may indeed be the primary driver for technological
change. For example for certain sorts of non-disruptive, incremental technological
change within a particular technological trajectory, such as that which Pavitt (1984)
identified within production intensive firms. But, comntrary to the induced innovation
account, the important policy implication of the evolutionary account, supported by
much of the evidence, is that demand–side policies are unlikely to be enough, even when
supplemented with additional instruments to correct market failures.27 This is likely to be
especially the case where radical technological change is concerned, and it is just this sort
of change we have in mind when considering the technological response to climate
change.
Unlike the neo-classical account, the policy implications of the evolutionary account do
not flow directly from the micro-foundations but are dependent upon how particular
technological systems are manifest on the ground. It is suffice to note at this point that
the policy implications are likely to be much more hands on, imply significant industrial
policy interventions and technology management to overcome path-dependencies and
lock-in. As we shall see in section 2.4, it is likely that, in some cases, the co-determination
of the political economy and the techno-economic paradigm will mean that the very
possibility of technological change and policies to promote technological change is an
outcome of the particular technological-economic-institutional arrangements that are in
place.
Before going on to look at the issue of politics and political economy in greater detail in
the following section we first look at the main criticisms of the evolutionary approach to
technological change.
27 See Annex A2 for a discussion of key empirical evidence on technological change.
29
2.3 Are the micro-foundations right? Criticisms of evolutionary approaches
Evolutionary approaches have been criticised on a number of grounds, here we address
the four main criticisms; i) the evolutionary account has limited empirical support; ii)
even if the evolutionary account is a better representation of the causal processes at
work, the competitive fitness context in which firms operate means that we can threat
them ‘as if’ neo-classical precepts held; iii) the theory is too heavily dependent upon
dynamic increasing returns; and, iv) evolutionary theory does not treat the role of politics
and power and its role in technological change adequately. As we will see there are close
links between the response to ii), iii) and iv).
First, Ruttan (1997) argues that the evolutionary approach has relied too heavily on
simulation models of the economy, which can produce plausible results based on stylised
facts relating to the firm, sector and aggregate economic growth. An overreliance on
simulation models, he argues, has led to the evolutionary approach not being productive
of empirical research – it therefore “must be regarded as ‘a point of view’ rather than as a
theory” (Ruttan 1997:1522).
Whereas a reliance purely on simulation modelling would indeed be a cause for concern,
the contention that there is limited supporting empirical evidence is simply not an
accurate reflection of the literature.28 There is a wealth of empirical evidence with
findings that either broadly support an evolutionary approach or are consistent with it,
from economic history (North 1990a; Chandler 1992; Mokyr 1992; Mokyr 1998;
Chandler et al 1999; von Tunzelmann 2003; Mokyr 2005; Mokyr 2006; Moe 2010), the
history of technology (Hughes 1983; David 1985; David & Bunn 1988; Brown &
Mobarak 2009; Wrigley 2011), an extensive case study literature including case studies
and quantitative empirical work broadly based in the innovation systems tradition
(Nelson & Langlois 1983; Lundvall 1992; OECD 1992; Nelson 1993; Edquist 2000; Dosi
2007; Marerba & Nelson 2010), including work on newly industrialising and developing
countries (Johnson 1982; Amsden 1992; Kim & Nelson 2000; Kim 2001; Lundvall et al
2002; Wade 2004; 2007; Dosi et al 2009), and finally, many detailed case studies of
individual technologies from the Dutch research on the multi-level perspective (Geels &
Smit 2000; Geels 2002; Elzen et al 2004; Geels 2005a; Geels & Raven 2006; Geels 2006a;
Geels 2006b; Geels & Raven 2007; Verbong & Geels 2007; Geels 2007; Geels et al 2007; 28 Granted that increasing amounts of empirical work have been conducted in intervening years since Ruttan was writing.
30
Schot & Geels 2008; Geels 2009; Raven & Geels 2010; Berkers & Geels 2011). In recent
reviews of the empirical literature on environmental technological change Kemp and
Pontoglio (2011) and Gonzalez (2009) also find general support for the evolutionary
account. Moreover, as mentioned above empirical research in behavioural economics is
largely supportive of evolutionary micro-foundations (Simon 1986).29 Like all theory, and
especially theory in the social sciences, these accounts are necessarily underdetermined by
the evidence, but the same can be said of explanations using neo-classical micro-
foundations. The contention that there is no good evidence for evolutionary theory and
it is over-reliant upon simulation models, if it was once true it is certainly no longer the
case.
Second, some have argued that evolutionary theory is not substantively different from
neo-classical economics. Competition between firms will ensure that only firms that are
profit maximizers will be selected, thus even if the evolutionary micro-foundations do
describe the causal processes more accurately, this does not matter as in virtue of a
competitive environment, firms will behave ‘as if’ they operate on the basis of neo-
classical micro-foundations (perfectly rational, utility maximises etc.)(Friedman 1953;
Nelson 1995). However, Nelson counters this argument, suggesting:
“Any ‘optimizing’ characteristics of what exists therefore must be understood as local and myopic,
associated with the particular equilibrium that happens to obtain. The heart of any explanation …[…]… must
be evolutionary analysis of how the particular equilibrium, and not a different one, came to be. Further, often there is
good reason to suspect that evolution presently is going on at a relatively rapid rate, and thus equilibrium
of any kind is not an appropriate concept for analysis. [Therefore]...to say that actors behave “as if” they
were maximizing does not tell us much about why they are doing what they are, and provides only a start
on any prediction of what they will end up doing if conditions change.” [emphasis added] (Nelson 1995:
51)
Thus the contention is that this similarity produced by a competitive ‘fitness’
environment to the extent is approximates neo-classical equilibrium is a special case,
limited in its scope and through time. Moreover, from an ontological and epistemological
29 Simon forcefully puts it in a later work, “…I would recommend that we stop debating whether a theory of substantive rationality and the assumptions of utility maximization provide a sufficient base for explaining and predicting economic behaviour. The evidence is overwhelming that they do not.” (Simon 1986: 223)
31
perspective there are good reasons to reject this instrumentalist argument and opt for
more realistic micro-foundations.30
A third criticism, relating more directly to the path-dependency account of technological
change (and by implication the reliance of evolutionary theory on path-dependency) was
elaborated by Ruttan (1997). Ruttan accepts that technological change must display path-
dependency in that it builds upon earlier technological developments, but suggests that in
evolutionary theory:
“There is little discussion, for example, of how firms or industries escape from lock in. What happens
when the scale economies resulting from an earlier change in technology have been exhausted and the
industry enters a constant or decreasing returns stage? At this point in time it seems apparent that changes
in relative factor prices would, with some lag, have the effect of bending or biasing the path of technical
change along the lines suggested by the theory of induced technical change.” (Ruttan 1997: 1523)
Interestingly, both Unruh (2000) and Arthur (1996) recognise that decreasing returns
may kick in at some point (Figure 2.1). While Unruh does not explicitly elaborate what
happens at this point, it seems to be that path-dependency switches from being a
dynamic process, to a static one of lock-in, due to the installed base effect (in fixed,
human capital and institutional capital etc.). Similarly, Arthur contrasts knowledge
intensive sectors (such as computing, biotech, etc.) with those of more traditional
manufacturing industries. Arguing that the kind of dynamic processes of path-
dependency and non-linear change are more applicable to the ‘knowledge’ intensive
sectors.
“…we can usefully think of two economic regimes or worlds: a bulk-production world yielding products
that essentially are congealed resources with a little knowledge and operating according to Marshall’s
principles of diminishing returns, and a knowledge-based part of the economy yielding products that
essentially are congealed knowledge with a little resources and operating under increasing returns…[…]…
Because bulk processing is repetitive, it allows constant improvement, constant optimization. And so,
Marshall’s world tends to be one that favours hierarchy, planning, controls. Above all, it is a world of
optimization.” (Arthur 1996: 3-4)
30 A more detailed discussion of this is beyond the scope of this thesis. However, the contention is broadly that realistic micro-foundations are likely to be a more reliable way of finding out about causal processes in complex open systems.
32
Arthur recognises that these worlds are not totally distinct, as for example, computers
have to be manufactured, nevertheless, he contends that important differences do exist.
Pavitt (1984), in his survey of technological change in the UK, also found evidence to
support a similar contention, distinguishing between the kind of technological change
found in supplier dominated, production intensive and science based firms. Pavitt (1984)
notes that technological change in each of these firm types seems to be characterised by
processes as described in the vintage model (Salter & Reddaway 1966), induced
innovation and evolutionary accounts respectively. This may entail a considerable
curtailing of the explanatory usefulness of the evolutionary account.
The evolutionary account, however, can accommodate both the possibility that
technological change can be characterised by local equilibriums and the observation that
dynamic-increasing returns can start to decrease at some point. First, dynamic increasing
returns are important in explaining the notion of path dependency. Once these run out
and declining returns set in other effects are likely to predominate to maintain lock-in.
These include factors such as certain aspects of the physical capital, such as the life–span
of installed capital (the ‘installed base effect’), capital intensity etc.; network effects;
cumulative learning; institutional arrangements; and, as we shall argue political economy
considerations (section 2.4). Arthur’s description of ‘old’ manufacturing industry seems
to be of a fairly stable local equilibrium in a technological system dominated by just these
effects. In this context, innovation is likely to be non-disruptive and incremental in
nature, bound to a particular technological trajectory and concentrated on cost reduction
and productivity enhancement.
Similarly, Pavitt’s taxonomy can be explained from an evolutionary perspective as
different sectors each of which, as a consequence of their particular characteristics, have
differing levels of stability over time. This means within a given time period, the
particular dynamics of evolutionary change in that sector may not have opportunity to
show themselves.31 So, the chronological scale of heavy industry may be different from
that of the ICT sector. The taxonomy of different types of technological change
developed in Freeman & Perez’s (2000) analysis also serves as a reminder that for the
more profound types of technological change (i.e. a shift in techno-economic paradigm)
maybe infrequent and not always amenable to study within a short time frame. 31 Indeed it maybe misleading to think of competition between incumbent and new technologies as frequently the latter can comprise a totally new sector in themselves and compete only indirectly with incumbent technologies.

33
The last criticism we address here is that the evolutionary approach takes insufficient
account of the role played by politics and power in the process of technological change.
A number of writers both from within the evolutionary perspective and from outside it
have called for a more satisfactory treatment of politics (Nelson 1995; Meadowcroft
2009; Hall et al 2011; Meadowcroft 2011). In the following section, we take up the issue
of political aspects of technological change, arguing not only that political arrangements
are amenable to analysis using evolutionary micro-foundations, but that there is likely to
be a close relationship between political economy influences and the process of
technological change is a direct consequence of evolutionary micro-foundations. And
therefore, from the perspective of the evolutionary micro-foundations, there is a prima
facie case for a more detailed examination of the role of political economy in
technological change, and in particular as regards systemic changes in the energy system.
These contentions are illustrated using work by economic historians on the political
economy of the industrial revolution.
2.4 Distribution, vested interests and politics
Much of the literature on technological change seems at pains to avoid the explicit
treatment of politics and the political process. It may explicitly address questions of
policy, but lies silent on the role political processes may play in technological
development. In most of the literature politics is regarded as exogenous to the process of
technological change. The treatment of economic catch-up in the USSR presented by
Unruh (2000) is typical. He argues that while the ‘techno-institutional complex’ was able
to orchestrate a process of rapid ‘catch-up’, from a largely feudal economy to an
industrialised economy, it was ultimately unable to keep pace with productivity growth in
the West as the techno-institutional regime was unable to generate the dynamic
incentives for innovative activity provided by competition between firms. The issue of
politics is not broached. The USSR’s failure to keep pace on this account was one
mediated by technology, as a result of institutional failures, which presumably emerged out
of an evolutionary and historical process. Here political processes are relegated to the
status of a ‘historical contingency,’ rather than as a broader consequence of the operation
of the system itself.

34
2.4.1 Theorising politics in the processes of technological change
Similarly, writers in the broadly evolutionary economics tradition tend to steer clear of
the mention of politics, other than as part of the exogenously given ‘fitness environment’
within which firms operate:
“In many cases the evolutionary processes at work seem to involve a blend of market, professional, and
political processes, and it is likely an enormous task to sort these out and get an accurate assessment of
operative “fitness” criteria and selection mechanisms.” (Nelson 1995: 82)
This absence is somewhat surprising given the observation that the process of politics is
very closely connected to the development and operations of institutions, and that there
is a general consensus amongst writers on technological change in the evolutionary
tradition that technologies co-evolve with institutions (North 1990a, 1994; Unruh 2000;
Foxon 2006, 2011). Indeed, institutional variables are critical to the notion of lock-in in a
number of influential accounts:
“In general, the limits on technological change lie not with science and technology, which tend to evolve
much faster than governing institutions, but rather with the organizational, social and institutional changes
that allow the diffusion of new technological solutions.” (Unruh 2002: 318)
While criticized for their limited treatment of power and politics, it is perhaps the
transitions accounts that have gone furthest in developing a systematic approach to the
political issues raised by technological change. There has been increasing interest in the
discussion of, getting the institutions ‘right’.32 Where politics has been considered it has
frequently been conceived of, rather narrowly, as a problem related to governance, of
putting the right institutions and strategies in place (Smith et al 2005; Scrase & Smith
2009). The question of policy and of governance therefore becomes a technical one.
Smith et al (2005) present the question of governance in just this kind of way. Power is
considered important within a socio-technological system, the process of governance
stands somehow outside it and independent of it:
“The legitimate authority to push change through, or the resources available to build consent, to raise
informed dissent, or even to block change, will depend on power relations across the networks of actors
involved in a regime. Governance processes can be seen as acting as an independent influence to ‘manage’ or modulate
regime transformation for sustainable development.” [emphasis added](Smith et al 2005: 1508)
32 Williamson’s (2000) ‘third-order’ economizing.
35
The conception of the political process is one where politics is somehow divorced from
the forces to which the rest of a system is subject. Torvanger & Meadowcroft (2011) go
some way to bringing in political economy considerations, but this is limited to a more
nuanced recognition of the constraints the political process is subject to. In this case,
recognizing binding technological and economic constraints, and advising that policy
should follow the path of ‘least resistance’ by promoting technologies in line with local
interests and incumbent industries (Torvanger & Meadowcroft 2011). In a recent paper
Meadowcroft (2011) also comments on the importance of ‘getting the politics right,’
rather than just the policies:
“So far sustainability researchers have focused largely on policy: what it is and what it could/should
be…[…]… much less attention is devoted to the political circumstances that make the adoption of such
policies likely. But behind policy there is always politics, and getting the politics right appears to be a prerequisite to
getting the policies right.” [emphasis added] (Meadowcroft 2011: 73)
This account goes a long way to recognizing the likely constraints on the policy process
and the limited space to make policy decisions this implies. More recent papers by Smith
& Stirling (2007; 2010) have also sought to better address issues of political power and
agency, including the recognition that the political process may not be external to the
particular technological system in place, and that therefore the room for the exercise of
‘governance’ maybe constrained:
“It cannot be assumed that existing institutions and infrastructures will afford the requisite space and
resources for the kinds of continual adaptations and social learning necessary for effective transition
governance…[…]...Structural change in something as pervasive as a socio-technical regime entails both
losers and winners. In considering what a transition to sustainability actually means, the stakes are typically
very high.” (Smith & Stirling 2010: 19)
This position comes close to a recognition that politics in many cases should be treated,
in the first instance as an endogenous part of technological change, but there is a deep-
seated reluctance to grasp the nettle:
“The argument is not that conceptual distancing between socio-technical governance subjects and objects
is always necessarily unhelpful or wrong…[…]… there needs to be greater appreciation of the internal loci
of governance processes within the socio-technical systems themselves…[…]…In contrast to governance
conceptualized outside the system, positioning governance inside the negotiation of socio-technical change
36
requires processes for opening up debate and revealing technology’s inherently political nature. In short,
we need to move from a view of ‘steering as management’ to an understanding of ‘steering as politics.’” [emphasis
added] (Smith & Stirling 2007: 369)
The strategy is one not of endogenising politics but in the creation of ever-increasing orders
of meta-theorizing, from the techno-economic aspects of technological change, to
institutional, to policy, to governance, to politics. On these accounts feedbacks
proliferate between technology, the economy and institutions, politics may not sit
entirely outside this as it is linked through budget constraints, and the process in virtue of
which power to make decisions is vested in the political process. Nevertheless, the
conception seems to be one of politics as somehow insulated from the workings of the
technological system as broadly conceived.
We can perhaps agree with Smith & Stirling (2007) that, ‘distancing between socio-
technical governance subjects and objects’ can be a helpful approximation. Where in
Simonian terms, they may be considered ‘approximately independent subsystems’. In the
case where we are considering largely distributionally neutral or otherwise incremental
shifts in technology, such as shifts characterized by technological change within a
particular techno-economic paradigm. It is surely not the case when we are considering
disruptive technological change. Nor would it be the case where institutional
arrangements link techno-economic systems more closely to the accrual and articulation
of political power. Moreover, while running the risk of being accused of pedantry - from
a theoretical perspective it is always wrong, and this would seem to be a necessary
implication of evolutionary micro-foundations.
The omission of a satisfactory treatment of politics on the part of the evolutionary
economists is probably a result of the focus on firm level technological change in a
relatively competitive environment.33 It is perhaps a less forgivable omission on the part
of governance and institutional theorists, as well as those writing specifically on
governance issues related to technological change (Smith & Stirling 2007, 2010;
Meadowcroft 2011). There is a failure to anticipate the possible extent of political capture
(Lawhon & Murphy 2011). We can conjecture that this may be a result of a
preoccupation with technological change in the context of relatively liberal democracies
33 Indeed, a good proportion of the literature on latecomer catch-up; i.e. on the process of technological change outside a competitive firm level environment, does deal more of less explicitly with politics.
37
where government has made concrete commitments to technological change and as such
at least appears to be relatively independent of vested economic influences.34 This might
just be a failure in neglecting to delimit the application of the theory – to the rather small
set of industrialized Western liberal democracies.
More seriously, it is probably a sin of commission on behalf of the transitions account.
The transitions literature is normative. It is concerned with the promotion of
technological sustainability. For their normative project to the feasible, there must be
space for political agency to act to seriously promote a transition to sustainable
technologies. This is recognized by Meadowcroft:
“Ultimately, the most potent of the sceptical arguments is the one that focuses on the economic imperative
confronting states. There is no doubt that the stability of modern societies…[…]… has depended upon
the maintenance of steady economic growth. But the indictment of the state to which this points really
rests on a specific claim about the modern (capitalist) economy - that economic advance can only be
purchased at the expense of the environment. And there are grounds for doubting the validity of this contention.”
[emphasis added] (Meadowcroft 2005: 495)
Where we may not be as sanguine regarding the economic implications of switching
away from cheap energy sources, the transitions approach requires the technological,
economic and political feasibility of a transition to sustainable technologies. It creates
this space thus by a rejection of technology skepticism, underplaying cost and the
political economy context within which technology is embedded. There maybe room for
a more nuanced rendering of the political economy, which may mean there is space for
transitions to more sustainable technologies – but whether this space exists or not in a
particular context is a condition of the political economy and should be shown rather than assumed.
Leaving this criticism to one side, it seems to be that this lack of interest in the political
process is a significant theoretical problem. It is not only that political processes are
amenable to the micro-foundations of evolutionary theory, but the implications of an
evolutionary approach which conceives of technological change as embedded in
institutions is likely to entail the emergence of political economy processes.
34 For example, as in Michell’s (2010) characterization of the ‘regulatory state’ in the UK.
38
2.4.2 The emergence of political economy
The absence of politics in evolutionary economics is surprising because the evolutionary
account lends itself to an endogenisation of the political process, or more properly
speaking, the political economy. There are two main reasons for believing this. 35 First,
because political processes have been shown to be amenable to the same sort of
evolutionary analysis as technological and institutional processes (Pierson 2000). This
should not be surprising given that the evolutionary account of technological change is
based upon a purportedly realistic account of human behaviour. Second, given the
observation that technological change, and especially radical or paradigmatic
technological change, is likely to have implications for institutional and political
arrangements, and as a consequence the distribution of wealth, resources and power,
there are prima facie reasons to believe that politics is likely to be an important part of the
process of technological change. That is to say, there are good substantive reasons to
believe that political, institutional and technological systems co-evolve. This contention is
supported by historical research on technological development.
Firstly, considering the micro-foundations of political processes, and drawing on Arthur
(1984) and North (1990a), Pierson (2000) explains how the micro-foundations of path-
dependency theory (and to this extent evolutionary theory) can extend to an
understanding of the causal processes involved in politics. He suggests that political
processes have four characteristics, which mean that feedback effects and path-
dependency are likely to be particularly strong. These are, i) the central role of collective
action in politics; ii) the ‘high density’ of institutions; iii) the use political influence to
extend unequal distributions of power; and, iv) the inherent complexity and lack of
transparency of political processes (Pierson 2004; Pierson 2000).
In a political context, the impact of individual actions is highly dependent upon the
actions of others. As a result, and analogous to North’s (1990) account of institutions
more generally, political institutions have very high start-up costs. Adaptive expectations
are also important, as the perceived efficacy of a political action is highly dependent upon
the actions of others. Similarly, political institutions are numerous, broad in scope and
complex. They placing significant (and frequently binding) constraints on behaviour, and
are frequently characterised by cumulative learning, network effects and adaptive 35 In contrast to earlier broadly evolutionary work – in which the political process was central such as in Marx and Veblen.
39
expectations. Thirdly, asymmetrical power relations can be subject to positive feedback
as those in political power may use their influence or authority to make (formal or
informal) institutional changes that reinforce their position of power (incumbent
gerrymandering of electoral constituency boundaries is perhaps the paradigm example of
this type of feedback). To put it another way, those in a position of power may seek to
recreate the distribution of power. Finally, in contrast to the activities of a firm in a
competitive environment, where there are likely to be clear negative feedbacks in terms
of changes to competitiveness through which a selection process can operate, the
outcomes of political processes are frequently diffuse and ambiguous, which makes
mistakes difficult to identify and rectify (Pierson 2000; Pierson 2004).
As a consequence political process and the institutions that result from them are apt to
show high levels of path-dependency and lock-in. This in turn means that in
understanding political processes – as with technological and institutional change -
timing and sequence matter; there are multiple possible outcomes, large changes may
result from small initial events; some processes are irreversible and there are pivotal
moments which can shape irrevocably the course of events. Pierson (2000) also suggests
that a number of additional characteristics are likely to make feedbacks even stronger.
“…the absence or weakness of efficiency-enhancing mechanisms of competition and learning; the shorter
time horizons of political actors; and the strong status quo bias generally built into political institutions.
Each of these features makes increasing returns processes in politics particularly intense.” (Pierson 2000: 257)
On this account political arrangements are therefore subject to the same dynamic
processes that result in path-dependency and lock-in in technological and institutional
contexts. This is entailed by similar micro-foundations of bounded rationality, satisficing
heritable routines, variation, the importance of environment and selection through a
process of competition and feedback. Indeed a number of writers have recognised the
role bounded rationality is likely to play in the political process (Forester 1984; Hafner-
Burton et al 2011). In a sense, on Pierson’s (2000) account, political arrangements are a
special case of institutional arrangements. This is already a prima facie reason to believe
that political arrangements are endogenous to the evolutionary development of the
system, just as other institutional and technological processes are. It should be noted that
although the micro-foundations and fundamental processes giving rise to political
40
phenomena are similar at some level, how these processes are articulated given different
historical contingencies, scales and causal mechanisms involved will differ dramatically.
Secondly, given these micro-foundations political dynamics that can be best described as
political economy processes are likely to emerge. This is a consequence of the processes
which lead to path-dependency in the political system as described by Pierson (2000) and
the co-evolution of political processes and techno-economic paradigms.
Distributional outcomes and judgements relating to the significance of these outcomes
are relegated to the realm of politics in most economic (neo-classical and evolutionary)
theorising. However, inequality is a common feature of evolutionary models, and a direct
result of the dynamics of evolutionary economics (van den Bergh 2007). Intuitively,
increasing returns and path-dependency mean that some routines will be more successful
than others. ‘Satisficing’ behaviour and the need for economic agents (firms,
organisations, institutions, individuals) to search for routines suggests that optimal
routines are typically not available. Some level of inequality is likely to result as some
agents will be better suited to conditions than others. Therefore, it is not difficult to see
on an evolutionary account how inequality could emerge.
In the account we have given of path-dependency in political processes, inequality in
political power could emerge through increasing returns to political power as power is
exercised by agents to change the fitness environment to benefit themselves. The
strength of positive feedback to political power contrasts with the weakness of negative
feedback caused by the difficulty of understanding the implications of political decisions.
Relative to evolutionary processes experienced by firms in a competitive environment,
these lead to much stronger processes of path-dependency and lock-in. Therefore, we
could also expect to see larger inequalities in the distribution of political power in the
political sphere than in the sphere of the firm.
If there is no clear distinction between access to resources afforded by (evolutionary)
success in the techno-economic sphere and access to resources mediated by the political
process, then economic agents would presumably seek to influence the economic fitness
environment to favour themselves. This may happen as firms seek to bribe or lobby
politicians, or make political donations in order to influence policy-making. More

41
fundamentally, such processes may extend to the techno-economic paradigm and
technology choice itself. The potential for positive feedbacks to this process is large,
leading to concentrations of economic and political power. Particularly where economic
agents are able to capture large profits or economic rents. That is, where the benefits of
an activity greatly exceed costs. This is likely to occur precisely where there are
paradigmatic shifts in techno-economic systems that allow agents engaged with the new
technology to reap considerable profits, and in the case of natural resources where the
cost of resource extraction is much less than its worth. When these contingencies have
come together, the results have been a significant change not only in techno-economic
paradigms, but broader institutional and political arrangements. This is therefore not just
an explanation of how political processes are important, but how the political economy process is
endogenous to the techno-economic paradigm.
We define the political economy very simply, first with the observation that resources are
unlikely to be distributed evenly in an economy. Second, with the observation that
control over resource distribution will tend to be a function of the distribution of
resources. Third, that relatively resource rich agents will seek within their ability to
reinforce or recreate their distributional advantage over time. Political economy
processes are therefore processes by which this uneven allocation of resources is
recreated. For theses reasons the distribution of resources, and the power which this
implies, as well as the processes, which act to reconstitute the distribution of power over
time, are likely to be particularly stable and resist change (North 1990; Pierson 2000).
As we have shown above based on the micro-foundations of evolutionary theory, there
are good prima facie reasons to believe that political economy is not only amenable to an
evolutionary approach but that political economy processes emerge as a consequence of
evolutionary micro-foundations. These contentions say very little about the shape the
political economy might take, its technology, sustainability or other welfare implications.
At this stage it is suffice to note that given an evolutionary account, and on the basis of
the micro-foundations it implies, we have good theoretical reasons to believe that
political economy dynamics will play a central role in the functioning of a techno-
economic system. How this is articulated in any particular context will differ and this is
something we will explore with respect to economic and institutional development in the
rest of this thesis.
42
2.4.3 Two important criticisms and two responses
In consideration of an evolutionary account of the emergence of the political economy,
two fundamental criticisms emerge, i) the account is over deterministic and leaves little
room for agency; and, ii) the account implies a similar functionalism or instrumentalism
to that implied by neo-classical economics.
First, addressing the criticism of the approach being over-deterministic. It is certainly
true that the evolutionary account of the political economy is deterministic in that it
closes down the space for exercising meaningful decisions about technology and the
allocation of resources more generally. This is analogous to similar criticisms levelled at
the transitions approach (see Geels 2011). Leaving aside the normative implications of
the criticism, the first part of the response to this points to the observation that there is
already room for positive feedback, though the search and selection of satisficing
routines by the firm, organisation, group or individual. It is true that on some level the
processes are deterministic but they can also give rise to systems, which create space for
agency. In fact, the place where direct determination of outcomes through evolutionary
processes has been superseded is precisely the place where negative feedback effects are
expected to be weakest, and positive feedbacks and path-dependency strongest, i.e.in the
political process. This is not to say that political arrangements either tend towards social
optimality or some other particular form. But that precisely because of weak negative
feedbacks and strong positive feedbacks to political economy outcomes (as described
above), this is the realm in which dividends to intermediation in the evolutionary process
(though the development of political institutions that allow stronger feedback to
performance and delimit feedbacks which reinforce the uneven distribution of power),
are likely to be the most significant.
Moving on to the second, related objection, that the evolutionary account is
fundamentally instrumentalist. In a sense this represents the opposite argument, we have
moved from the contention that the evolutionary account is over-deterministic, to the
contention that it is empty, and that the Panglossian ‘black-box’ functionalism of neo-
classical theory has been replaced by a slightly more elaborate ‘black-box’ of evolutionary
theory.
43
The response to this criticism relies upon the observation that behaviour characterised by
bounded rationality and satisficing routines that tend to persist overtime leaves room for
individuals, groups, firms, organizations, countries, whole epochs to be significantly and
systematically wrong about the world. Leaving space for different interpretations of the
world to emerge. As we are realists about the world and the constraints this implies, we
would expect negative feedbacks to kick-in at some point to reign in representations of
the world (and the broader techno-economic paradigms in which they are embedded)
that are particularly divorced from reality. That is to say, even though we are realists
about the micro-foundations upon which techno-economic, institutional and political
processes rest and the constraints of the bio-physical world, within these constraints
there is space for a multitude of different human arrangements to emerge. The
evolutionary approach implies very little about the content of these processes and
arrangements, and the precise way in which they are elaborated over time, but it does
give a framework for understanding the general dynamics involved. In this way it also
relies very heavily upon empirical evidence to flesh out its account.
A case in point is the economic history literature on the political economy processes as it
relates to technological change. In the following section we briefly look at some explicitly
evolutionary accounts of the political economy of technological change before turning
our attention to the implications of the evolutionary account for technological change in
developing countries.
2.4.4 Political economy and technological change in economic history
The economic historian Joel Mokyr (1992, 1997) in his writing on the Industrial
Revolution has emphasised the importance of political resistance to technological
change. He suggests that the extent to which political forces can act to resist
technological change depends upon three main factors. Firstly, the strength of the
incentive to oppose the technological change, for example, if an incumbent experiences a
large loss in welfare due to the development of a new technology. Secondly, the extent to
which costs and benefits of the technological change are concentrated amongst winners
and losers, the more concentrated the gains or losses the easier it would be to mobilise
and organise political action on either side. Finally, the position of the political
authorities as regards the technological change. Mokyr argues that if the political
44
authorities have a vested interest in the incumbent technology then they are likely to
favour the status quo.
It should be noted that Mokyr’s account while consistent with the evolutionary micro-
foundations, looks simply at political resistance to technological change. It does not
examine the particular outcomes of that resistance. Although it would seem to support
the contention that technological change is likely to be bound up with the creation and
perpetuation of inequality, in that where all three conditions are met for political
opposition (or promotion) – significant incentives, concentration of costs/benefits and
the role of state power – technological change would be unlikely (likely).
Moe (2009, 2010) picks-up more explicitly on this notion, finding evidence from a
number of historical case studies that success in managing structural economic change
(i.e. technological change) occurred when either vested interests in incumbent economic
arrangements were too weak to seriously retard the process of technological change, or
states were effectively able to prevent vested interests from blocking technological
change. Reflecting on these historical lessons Moe suggests:
“…in describing structural change and long-term growth and development, technology and economics
cannot by themselves provide sufficient explanatory leverage. For that, politics - or the political economy,
with its focus on actors and decision-makers, on institutions and regulations, and on past and present
interactions - must be included. And thus, technology, economics, and politics constitute a triangle, with
all sides of the triangle capable of preventing structural change from occurring.”(Moe 2010: 1731)
2.5 Conclusion
This chapter has argued that evolutionary theory has not gone far enough in developing
the implications of an uneven distribution of resources. It is highly unlikely that radical
technological change – let alone changes in techno-economic paradigms – will have
neutral implications for the distribution of resources in an economy. If there are likely to
be winners and losers from technological change, then we can expect to see incumbent
vested interests actively seek to protect their position - through Lamarckian processes of
positive feedback – to seek to prevent or retard prospective technological change. Their
status as incumbents is likely to mean they have greater ability to influence the process,
as heirs to the benefits associated with a successful technology. Just in the same way as
technological trajectories become locked-in as investment in incumbent technologies
45
close down the possibilies for technological alternatives, so incumbent vested interests
are likely to try and close down, by investment in political means, the emergence of new
technologies. Technological change will also imply a process of negative feedback, as
technologies are replaced and the power of their associated vested interests eroded.
Ownership of technological assets can be quite liquid and investment fungible across a
range of technologies, to the extent that technological change does not dramatically
affect the behaviour of an economy, vested interests, in this case capital, may not
necessarily oppose the development of new technology. Just as large land-owners were
able to shift their accumulated capital into new manufacturing enterprises in the
nineteenth century, so equity investors can shift investment between different sorts of
technologies. In this way, relatively liquid, ‘deep’ capital markets can act to spread risk.
Although, it has to be said, this will be of little impact in a structural crisis of adjustment
driven by technological change. The question is, what kind of technological change is the
change necessitated by the climate crisis?
This question leads to another under-theorised relationship, which is also of potential
importance here, that of the interrelationship between natural resources, technology and
the political economy. In the schema sketched above the possible interrelationships
between technology and the political economy are fairly clear. When we examine the
possible candidates for techno-economic paradigms the importance of natural resources
also becomes clear. In the five ‘long-waves’ identified by Freeman & Perez (2000) (see
Table A2.1, Annex A2), each techno-economic paradigm is associated with a particular
energy carrier. The association of fossil fuels with the Industrial Revolution is of
particular concern when considering the issue of cliamte change.
Fossil fuels, with a high energy density and high ratio of energy returned over energy
invested, have been an essential element in the facilitation of the process of industrial
development and the gradual rise in labour productivity. The combination of these
energy sources and new technologies has allowed the generation of extremely large
resource rents (Wrigley 2011). These rents, are not evenly distributed, by sector,
nationally or globally. Geographical contingencies are important. Perhaps of greater
importance have been the techno-economic paradigms and the institutional structures
within which they reside (firms, nation states, etc.), which have mediated generation of
46
consumables from these resources. The interests vested in fossil fuels are inextricably
linked to the techno-economic paradigm. Not only this, the rents generated through this
process are very large, meaning both in technological terms and political terms, the
inertia demonstrated by this configuration is likely to be extremely large. Its stability
equally is likely to be dependent upon adequate cheap fossil fuel resources. Economic
power expressed through the political, production and consumptive processes is likely to
be extremely hard to displace. Particularly when the benefits, which accrue to the
alternatives are generally less concentrated or when many of the benefits are in the future
and are therefore difficult - if not impossible - to appropriate through the political
economy process. Meaning that the dynamic increasing returns to the political power
generated through the ownership of an emerging technology (and especially one that can
generate significant natural resource rents) are not likely to be available in the case of
fossil fuel alternatives.
In the following chapter we go on to look at how the insights of evolutionary economics
have influenced accounts of technological change and catch-up historically and in
emerging economies, with a particular focus on the role of the political economy.

47
Chapter 3: Catch-up, institutions and political economy
3.1 Introduction
Neo-classical economics is ambivalent regarding the role of the state, with a tendency to
regard it as essentially parasitic on an otherwise efficient allocation of resources realised
through the operation of markets. This comes as no surprise, there is a strong normative
current in neo-classical economics which, to paraphrase Veblen (1900), uncritically
assumes a ‘meliorative trend’ in the course of events, expressed autonomously of the
‘conscious ends’ of economic actors. If the central tenets of the orthodox economic
canon are correct then properly functioning markets deliver the best possible outcome,
realising ‘the greatest amount of good for the greatest number’. According to the
orthodox account, extra-market institutions have - at best - a limited role where markets
are not functioning correctly. At worst, they actively distort market allocations and
reduce the greater good. And the risk of ‘government failure’ is almost always thought to
be much larger than the risk of ‘market failure’ (Rodrik 2008; Helm 2010).36
The account of technology policy to address climate change given by orthodox
economists continues to reflect these preoccupations (see Annex A2). According to static
partial equilibrium analysis, market based policy to address the environmental externality
is always best. Positive externalities associated with technological innovation and
adoption may warrant additional interventions, such as subsidies for R&D or
underwriting some portion of technology risk for early adopters. In spite of equivocal
empirical evidence for both the orthodox account of technological change and the
primacy of market based environmental policies, the policy prescriptions have remained
indissolubly wed to the static analysis, and therefore substantially the same. Recent World
Bank papers on the possibility for ‘green growth’ in developing countries point to similar
policy implications, involving an overwhelming (if not exclusive) emphasis on ‘getting
the prices right’ (Popp 2011b; Dutz & Sharma 2012).37
36 While neo-classical economics recognizes market failures, problems relating to uncertainty, collective action, externalities etc., which may necessitate government intervention, these are introduced to explain deviations from an ideal. 37 Popp’s (2011b) paper is typical in its narrow focus on market failures, there is no mention of industrial policy, or recognition of a large and complex literature on technology transfer which clearly presents itself as highly relevant in the case of environmental technological change. We should also note that it is perhaps unfair to pigeonhole the perspective of the World Bank, it is home to a wide divergence of opinion. Official policy pronouncements are highly constrained by political interests, and as such show a significant status quo bias. Despite what Rodrik (2006) dubs the “Washington Confusion”, conceptually and institutionally the Bank is still wedded to the orthodox canon and privileges scholarship within this canon over other approaches.
48
The prescribed technology policy approaches for climate change in developing countries
stand in a marked contrast to more nuanced approaches to technological change
emerging from the literature on economic development. Influenced by New Institutional
Economics (NIE) and historical developments which have served to highlight the
importance of institutional factors in economic change and development, the research on
economic development has taken a distinct ‘institutional turn’ placing much greater
emphasis on the role of institutions. And, as a direct consequence of this, an increased
interest in the political economy context (Rodrik et al 2002; Acemoglu et al 2005; Evans
2006).38 Theoretical disagreements aside, in their substantive implications at least, these
approaches go a long way towards embracing a more nuanced account of economic
development and the process of technological change. This represents a move away from
a neo-liberal ‘market fundamentalism’ and the universalism this implies, and towards an
understanding of development processes as contingent and particular (Rodrik 2010a).39
And a reprise for what Krugman (1997) rather disparagingly described as ‘high
development theory’ - or at least - for something very like it.40 More substantively, the
literature on technological change and catch-up in developing countries implies an
important role for more intrusive policy, institutions, and explicit analysis of the political
economy context in understanding the conditions for technological change.41
Notwithstanding the revealing insights of the emerging institutional and political
economy literature, it is still hobbled by theoretical roots in neo-classical economics and
what are essentially rational choice frameworks. The piecemeal analysis of ‘market failure’
and ‘government failure’ - that characterises much of the literature - fails to articulate a
convincing account of the dynamic processes involved in technological change and
economic development (Nelson 2008; Dosi 2011). As a consequence the treatment of
political economy remains somewhat shallow, frequently presupposing the causal
primacy of institutional arrangements (such as property rights and markets) and by
implication the political economy arrangements that enable them in explanations of
economic development and technological change (Khan & Blankenburg 2009). An 38 This literature is broadly consistent with the argument presented in Chapter 2. 39 The growth diagnostics literature has already been taken up by the OECD, although in a rather crude form, in assessing barriers to Green Growth (see OECD 2011) 40 For example see Levy & Fukuyama (2010), Khan (2010), Robinson (2011), Acemoglu et al (2005), and perhaps most influentially, North (1990a, 2005). 41 Even the World Bank now recognises the need for an analysis of political economy analysis in addressing issues of growth and ‘green growth’ (e.g. World Bank 2012). However, as we argue below the approach taken is highly constrained, shallow and is essentially an elaboration of the notion of government failure.
49
inability to take history, contingency, path-dependence and lock-in seriously in much of
this analysis leads to an account that is theoretically unable to appreciate the systemic
causal processes that lie behind technological change and economic development, and
that constitute the context within which climate change mitigation efforts will need to
bear fruit.
In this chapter we argue that technology policy should attend more carefully to the
historical experience of structural technological change in developing countries
(Berkhout et al 2009; Rodrik 2010b). This involves a fuller engagement with institutional
explanations, and by implication, the political economy. We find that political economy
processes emerge as crucially important in making the process of technological change,
in this case in the form of economic catch-up, understandable. Based on insights from
economic history and recent scholarship on the political economy of economic catch-up,
we develop a framework to allow the analysis of the political economy of technological
change.
In the following section we look in greater detail at the ‘institutional turn’ in development
economics. Following the arguments made in Chapter 2, we argue that current
mainstream thinking on institutions is constrained by its reliance on neo-classical micro-
foundations leading to the emergence of an unwarranted unilinear causal narrative and
limiting its ability to place adequate emphasis on the political economy process. Although
recent scholarship in development economics has again propelled political economy
considerations into serious contention, we argue that the understanding of the process is
still stymied by a narrow focus on market enabling institutions. Section 3.3 presents an
alternative framework based upon an evolutionary understanding of the political
economy emphasising the close association between the processes of production and the
distribution of power. Based on these observations we describe and develop our
analytical approach for understanding how political economy considerations can
influence environmental technological change. Section 3.4 concludes.
3.2 The ‘institutional turn’ and the (re)emergence of political economy
Much of the understanding of institutional arrangements in the debates surrounding the
economics of catch-up (see Annex A3) have been influenced by New Institutional
Economics (NIE). Research in NIE has placed a stress upon the institutional and
50
political conditions for the development of markets, and shown a greater appreciation of
their historical genesis and the likelihood of market failures. Importantly NIE
approaches typically emphasise that effectively functioning markets neither emerged
automatically, nor, where recognisable markets did emerge, did they necessarily function
particularly well.42 This theory has been supported by an expanding body of empirical
evidence and an emerging consensus on the importance of institutions for development
(Rodrik et al 2002; Acemoglu et al 2005; Evans 2006):
“...perhaps only one broad conclusion emerging from the wealth of growth regression results commands
universal support. This is that ‘institutions matter’ for growth and development and that they matter decisively
…[…]…The implication is that to understand the historical and spatial patterns of growth and
development it is necessary to understand the role and functioning of the ‘deep’ determinants of
development, those institutional or political factors that ultimately shape the proximate determinants of growth: factor
accumulation, technology adoption, and policy choices.” [emphasis added] (Adam & Dercon 2009: 174)
The ‘institutional turn’ thus identified institutional and political arrangements as the
fundamental determinants of economic development and by implication (and
importantly for our argument) technology adoption. While the ‘right’ sort of institutional
arrangements were perhaps not sufficient for development, they are certainly regarded as
necessary (Khan & Blankenburg 2009). There remains, nevertheless, a great deal of
debate on the precise role of government, the state, and the implications for political
economy. At one end of the spectrum sits the paradigm notion is of a minimalist
regulatory state working to ensure the effective functioning of markets through ensuring,
amongst other things, third party contract enforcement and property rights (e.g.
Kaufmann et al 2007; Kaufmann et al 2009; Savoia et al 2010). Towards the other end of
our notional spectrum are the statist explanations, which stress the potential efficacy of
the state in guiding technological change and development, property rights are deemed
instrumentally useful, but not sacrosanct, and there is no unilinear path to development,
a view typical of the literature on the developmental state (Chang 1994; Leftwich 1995;
Khan & Jomo 2000; Haggard 2004; Leftwich 2005).
This distinction also relates to the causal role institutional arrangements are deemed to
take in the process of economic development. Paldam & Gundlach (2008) distinguish
between advocates of a minimalist ‘good governance’ approach to the state who tend to
42 A foundational assumption of much neo-classical and neo-liberal scholarship see Annex A3.
51
treat institutional arrangements as exogenous and the fundamental cause of economic
development (North 1990a; Acemoglu et al 2000, 2005), and proponents of a more
activist state which tend to view institutions as endogenous to what is a political
economy of development (Myrdal 1968; Evans 2006; Andrews 2008; Khan 2010; Chang
2011; Khan 2012). In the following sections we look at the debate surrounding the role
of the state and the political economy of development in greater detail to enable the
development of an adequate framework to allow us to start understanding the
relationships between the process of technological change and the political economy.
3.2.1 From institutions to good governance
The theoretical roots of the ‘institutions first’ perspective are in NIE including the work
of writers such as North (1990a, 1990b), Olson (1997), and Acemoglu et al (2005),
amongst others.43 This approach, based on an analysis of the historical experience of
industrial development in Europe (and Britain in particular). It suggests that efficient
market institutions may not spontaneously emerge as much of the neo-classical theory
seems to assume (Nabli & Nugent 1989; Khan 2012). The failure of catch-up economic
growth and the attendant technological change to emerge is not in general related to the
market failures characterised as intrinsic to the process of technological change (Chapter
2 and Annex A2), which are associated, to a greater or lesser extent, with technological
change in developing countries and developed countries alike.44 The market failures
implicated in the failure of economic development to emerge are existential. That is to say,
they are related to the fundamental conditions for efficient markets emerging in the first
place, i.e. property rights and contract enforcement. On this account, the problem of
development is the second-order condition of the institutional arrangements necessary
for the functioning of markets. The notion is that without a third party actor effectively
enforcing property rights and contracts, market transactions cannot take place and
markets cannot exist.
Importantly, in putting the institutions for markets in place there is a role for the state,
although one that is circumscribed with stress placed upon just those factors that are 43 Although this also draws on earlier institutional economist such as Veblen (1998) and Commons (1931). 44 The possible exception to this is the case of intellectual property rights that in principle incentivize innovation by creating formal right to technology rents. But in the case of developing countries the role of IPRs is unclear. As developing countries are frequently relying upon foreign IPRs, an effective IPR regime may indeed retard development. Poor IPR may act as a disincentive to invest for foreign companies but this is not necessarily the case. For example, it has not really acted as a disincentive for investment in China where the loss propriety technology to weak de facto enforcement of international property rights is seen as an inevitable cost of investing there (e.g. see Sawdon 2011).
52
deemed important for productive investment and a market allocation of resources to
take place:
“….the key challenge for most developing countries is to create the basic legal and institutional
infrastructures that protect property rights, enforce private contracts and allow individuals to freely take
advantage of market opportunities. In principle there are many more things that governments could and
should do: provide public goods, correct market failures, reduce inequalities in income and opportunities,
stabilize excessive economic fluctuations. But these other government activities are not what make the difference
between success and failure in economic development. The real difference is made by the basic institutional and legal
infrastructures that protect property rights, enforce the rule of law and prevent abuse by governments.” [emphasis added]
(Tabellini 2005: 283)
It is not so much that the state could not be active elsewhere, but the essential cause of
economic development is a state that acts to enable the market, and given the essential
economic institutions which undergird the operation of the market, otherwise refrains
from interference in the economy (Tabellini 2005; Savoia et al 2010). The message is
twofold, that institutions are the fundamental cause of development, and that a
minimalist state can do the job. The logic of this stress on economic institutions in
promoting economic growth and development is clear, property rights and contract
enforcement are essential for the conduct of transactions and the development of
effective markets. In the case of technology, the particular institution of IPRs plays an
important role, in line with the conventional neo-classical story (see Annex A2):
“…the rate of technological change depended on the inventor's ability to capture a larger share of the
benefits of his invention. Only the patent system created a set of systematic incentives that raised the
private rate of return closer to the social rate.” (Mokyr 2009: 349)
But once we have taken the crucial step away from the Wunderursprung of markets and
introduce, instead, key institutions that are the cause of economic development, we have
also necessarily introduced a role for extra-market players. That is to say we have
introduced a polity. But, there is nothing in the polity of itself to ensure that it will not
seek to influence the operations of economic processes to favour its members. The state
can be as much a threat to property rights as it can be a guarantor. Indeed, all other
things being equal, given the fundamental assumptions of economics relating to the
utility maximising behaviour of individuals, we would expect to see rent-seeking behaviour
53
emerge from the state, which will in turn retard investment. As Weingast (1997)
observes:
“The more likely it is that the sovereign will alter property rights for his or her own benefit, the lower the
expected returns from investment and the lower in turn the incentive to invest. For economic growth to
occur the sovereign or government must not merely establish the relevant set of rights, but must make a
credible commitment to them.” (Weingast 1997 cited Haggard et al 2008: 213)
Therefore, the theory suggests, there is need for another level of institutional
arrangements, which ensure that the state does not use its power over otherwise efficient
market allocations in rent-seeking behaviour. For example, concerns relating to state
predation on private property, mean that protection from the state is one of the key
functions of the legal institutions, explaining the stress often placed upon ‘the rule of law’
(Haggard & Tiede 2011).
It is interesting to note that the essential logic of the position developed from NIE - that
property rights and contract enforcement are important in ensuring markets can function
properly - is transformed from an assertion of the positive role the state could play in
promoting economic growth (and indeed the acknowledgement that the state could do a
lot more), to the predominantly negative caricature of the predatory state, and the role of
a set of additional institutions in curtailing what is seen as an inevitable consequence of
administrative fiat.
The ‘institutions first’ account has attracted a significant amount of criticism. Critics
point to the partial reading of history, which has placed the development of property
rights at its centre (Ogilvie 2007; McCloskey 2009; Khalil 2012; Khan 2012). In North’s
canonical formulation, property rights (including the development of IPRs) and
supporting institutions were something that uniquely emerged on the eve of the
Industrial Revolution and played the causal role in its emergence in the 17th and early 18th
centuries, as North & Thomas put it:
“Efficient economic organization is the key to growth; the development of an efficient economic
organization in Western Europe accounts for the rise of the West. Efficient organization entails the
establishment of institutional arrangements and property rights that create an incentive to channel
individual economic effort into activities that bring the private rate of return close to the social rate of
54
return…If a society does not grow it is because no incentives are provided for economic initiative.”
(North & Thomas 1973: 2-3)
Critics argue that the historical record does not support this assertion. Well-developed
property rights, contracts and markets existed in many places at many times in history
prior to the industrial revolution that did not lead to the same sustained economic
growth, McCloskey (2009) writes:
“The long perspective is why North’s is an exceptionally poor argument for explaining the Industrial
Revolution or the modern world. The choice to escape from growth-killing investing in swords or in
influence at Court rather than investing in good textile machinery to make good woolen cloth, and in good
organizations to administer the good machinery, has happened repeatedly in history - in China for whole
centuries at a time, in Rome in the second century C.E., in much of Europe after the eleventh century.
Something was radically different about the case of eighteenth-century Britain. But the difference was not the
rearrangement of incentives beloved of economists, those rules of the game. The incentives had already been rearranged, long
before, and in many places.” [emphasis added] (McCloskey 2009: 20-21)
Other critics such as Khan (2012) and Ogilvie (2007) concur. The picture of economic
development that emerges from the NIE account is one in which economic
development - and technological change - takes-off as a more-or-less automatic
consequence of the emergence of efficient markets, once the barriers created by
feudalism and inefficient institutions are removed.45 But in common with McCloskey
(2009), these writers point to the emergence of a much broader range of specific
conditions, which lead to the emergence of modern capitalism in Britain. A new
structure of property rights and institutions associated with new modes of production, as
Khan & Blankenburg (2009) put it, ‘forced productivity growth’, in ways that did not
happen elsewhere (Wood 2002; Adam & Dercon 2009; Khalil 2012). This points to a
more complex understanding of the process of industrialisation, one in which requires
both a better understanding of the role of political, and technological conditions, and
perhaps as Mokyr & Nye (2007), McCloskey (2009), Hickey (2012) and Evans (2006)
argue an understanding of human motivations that goes beyond the reductive
assumption of utility maximisation:
45 It should be noted that this reading of North, while correct in its criticism of the substantive and empirical aspects of his work tends to obscure the elements of his method, which sit uneasily with this reading. In particular, North’s commitment to bounded rationality and path-dependency, the centrality of beliefs in determining human behaviour and his criticisms of the neo-classical canon more generally. Nevertheless, the criticisms of North’s earlier work (pre 1990) and of North how he appears in the subsequent mainstream economics literature is probably accurate.
55
“An institutional analysis that takes goals and interests for granted would be intellectually impoverished.
The better part of human needs and desires are culturally constructed. Enabling people to construct and
reconstruct their aims is a basic task of institutions as enabling people to satisfy the needs and desires that
have been constructed. Just because this complicates linear explanatory logics does not give us an excuse
for ignoring it.” (Evans 2006: 41)
Turning back to the criticisms of the ‘institutions first’ perspective, even if we were in
agreement with North’s account of the genesis of modern capitalism resting on the
creation of a stable property rights regime, it does not follow that, in the case of
contemporary development we can necessarily expect this pattern to be repeated. The
world is changed, it remains an open question whether or not in the contemporary
context a reliance on a stable property rights regime alone would lead to sustained
economic growth.46
3.2.2 A critical review of the empirical evidence
A large empirical literature has developed seeking to test which institutions are important
in promoting economic growth. The empirical method of choice is that of cross-country
econometric analysis, which attempts to test the correlation between economic
performance and variables standing as proxies for various institutional arrangements, in
order to establish a causal relationship running from the latter to the former. It is a large
literature, here we review a few influential studies to illustrate the difficulties the work
faces.
On the issue of property rights there is little dissent concerning their importance in
realising long run economic growth. For example, Knack and Keefer (1995) found a
significant association between property rights institutions and economic growth, not
only in terms of encouraging aggregate levels of investment but by enhancing the
efficiency with which those investments have been made. Other studies have found
similar evidence of the association of long run growth with the strength of property
rights in the cross-country data (e.g. Porta et al 1996; Mahoney 2001; Keefer & Knack
2002; Keefer 2007; Asoni 2008) and in micro-level studies (e.g. Kaufmann 2004; Bazzi,
& Clemens 2009; Malesky & Taussig 2010).
46 Indeed the discussion of the Gerschenkronian account of latecomer catch-up suggests otherwise, see Annex A3.
56
Studies linking more general conceptions of good governance or broader policy with
economic growth have been more equivocal in their findings. In extremis, broader
governance institutions ensuring freedom from the threat of violence are important. As
Haggard et al (2008) point out security of the person clearly has priority over security of
property rights or contract enforcement. This observation is reinforced by Collier et al
(2003) who clearly illustrate the disastrous economic consequences of armed conflict.
Leaving these considerations aside to focus on the larger set of more stable developing
countries, and particularly emerging economies, the empirical question of the extent to
which the right kind of institutions are associated with - let alone are the identifiable
cause of - economic growth remains an open one. The originators of the World Bank’s
World Governance Indicators, Kaufmann, Kraay & Mastruzzi (2004, 2009) argue
strongly for the relevance of their composite indices, and the causal role played by
institutions in enhancing growth outcomes.47 Aidt (2009), however is more equivocal, in
a review of the literature, noting, for example, that while there are good reasons to think
corruption is growth retarding there is little robust empirical evidence to indicate that the
rate of GDP growth is significantly affected by corruption. Flachaire et al (2011) find
that political institutions do matter for growth, but not decisively as in some
circumstances regimes which are relatively authoritarian, or perform badly in terms of
institutional or governance indicators have shown high levels of growth. This finding is
supported by a diverse range of writers such as Przeworski & Limongi (1993), Khan
(2005; 2007a), Rodrik (2007a) and Gerring et al (2012).
Notwithstanding, the equivocal evidence on political institutions and growth outcomes,
which itself points to the need for a better understanding of the linkages between
political arrangements and economic outcomes, the general policy prescriptions which
continue to be taken away from this debate are not only that institutional arrangements
are important for growth, but that a specific set of institutional arrangements that
characterises the small set of modern capitalist liberal democracies is generally the best
for promoting growth. Hence, the overwhelming emphasis on the normative grab-bag of
‘good governance’ reforms that continue to be emphasised by donor agencies (Andrews
2008; Gisselquist 2012).
47 Even arguing that there is a negative feedback from income levels to governance measures (Kaufmann & Kraay 2002).
57
This large body of empirical literature has come in for extensive criticism, with the
empirical support for ‘good governance’ particularly contested. Criticisms centre on both
methodological issues48, and the veracity of the empirical claims.
Criticisms of method centre on the use of proxy variables for institutional arrangements,
the ontological implications of universalism this entails, and issues of endogeneity and
establishing the direction of causality. Firstly, the widespread use of proxy indicators to
represent complex institutional arrangements is criticised. The notion that nebulous, ill-
defined proxies can somehow aggregate and capture a range of varied institutional
structures is questioned. It is not clear what institutional arrangements are signified by
the composite proxy measures used in the cross-country analysis, for example in the
World Bank Global Governance indicators or Political Risk indicators compiled by
ratings agencies. But these proxy indicators, available for a range of countries over an
extended period of time, are essential for the very possibility of the empirical analysis.
Evans (2006) questions the plausibility of arranging property rights, which are dependent
upon specific historical context, and reflect a complex of institution and political
arrangements, on a ‘simple ordinal scale’:
“Any initial allocation of rights to different kinds of property…[…]…is disputable and somewhat arbitrary.
Enforcement of rights once they have been allocated is equally so. Sending the National Guard to evict
peasants growing crop’s on a landlord’s unused land is enforcing property rights. So is shutting down a
factory whose pollution is making the surrounding neighbourhood unliveable. Development almost
certainly depends on how property rights are allocated and what kind of property rights are enforced for
what segments of the population. Exactly how these complex patterns of allocation and enforcement are
related, positively or negatively, to development can hardly be taken for granted.” (Evans 2006: 37)49
Andrews (2008) makes a similar point, asking what the proxy indicators actually
represent. Countries with high governance scores have in common are strong
governance outcomes and high levels of economic development.50 But the underlying
governance structures are quite different. Moreover, contemporary governance structures
did not emerge in their current form in some common linear fashion, the paths to better
48 Addressed in greater detail in the discussion of the problems facing cross-country growth regressions in Annex A3. 49 Mokyr makes a similar point: “Indeed, one could argue that to some extent the reverse was needed for rapid technological change: some property rights had to be extinguishable when they got in the way. This was true not just for such concrete matters of eminent domain used the expropriate land…but also to extinguish a host of monopolies and other rent-generating exclusions and privileges that had been regarded as assets in an earlier age but were effectively used to block technological progress” (Mokyr 2009: 349) 50 As he notes with no little irony, “…like Denmark or Sweden on a good day, perhaps.”
58
institutional and economic outcomes were extremely varied, effective governance
structures in successful countries when they started out on their path to development did
not resemble the institutional arrangements we find today. Indeed, given the high costs
of effective governance, it is difficult to see, materially, how this could be possible
(Khan 2012).
Secondly, the empirical claims that right kind of institutional arrangements cause growth
is not well founded. Indeed causation could quite easily run the other way. As we noted
earlier, the presence of complex, contingent causal conditions in open-systems means
that causation is extremely difficult to pin down (see annex A3). In the case where we are
seeking to link two variables, one of which is extremely ill defined, with events that are
not contiguous in space or time, but linked by a complex series of interactions, the
possibilities for confounding variables are dizzying. Absent the respectability offered by
the historical account, the argument begs the question. The argument that good
institutional arrangements are associated with good economic outcomes, therefore good
institutional arrangements are necessary for good economic outcomes, only makes sense
if we assume that good institutional arrangements are necessary in the first place
(McCloskey 2009).
These two criticisms are related to a third, that of the assumption of an epistemic
universalism (Kenny & Williams 2001). That is, the assumption that the experience of
economic development, and the role institutions play in it can be reduced to a notional
relationship between two aggregate indicators which captures the essential causal
dynamics of the relationship between institutional and economic change seems far
fetched. Nevertheless, the ahistorical normative implication of this logic has been
extremely influential in policy fields.51
Khan (2007b) has made related criticisms of the veracity of the empirical evidence.
Firstly, he argues that the relationship between the indicators of good governance and
economic performance is generally weak anyway. Without the high-income countries,
the statistical relationship between good governance and good economic performance
disappears. Secondly, unpicking the empirical analysis, he points out that there is little
difference in the governance scores, even related to core economic governance indicators
51 Again, discussed in greater detail in Annex A3.
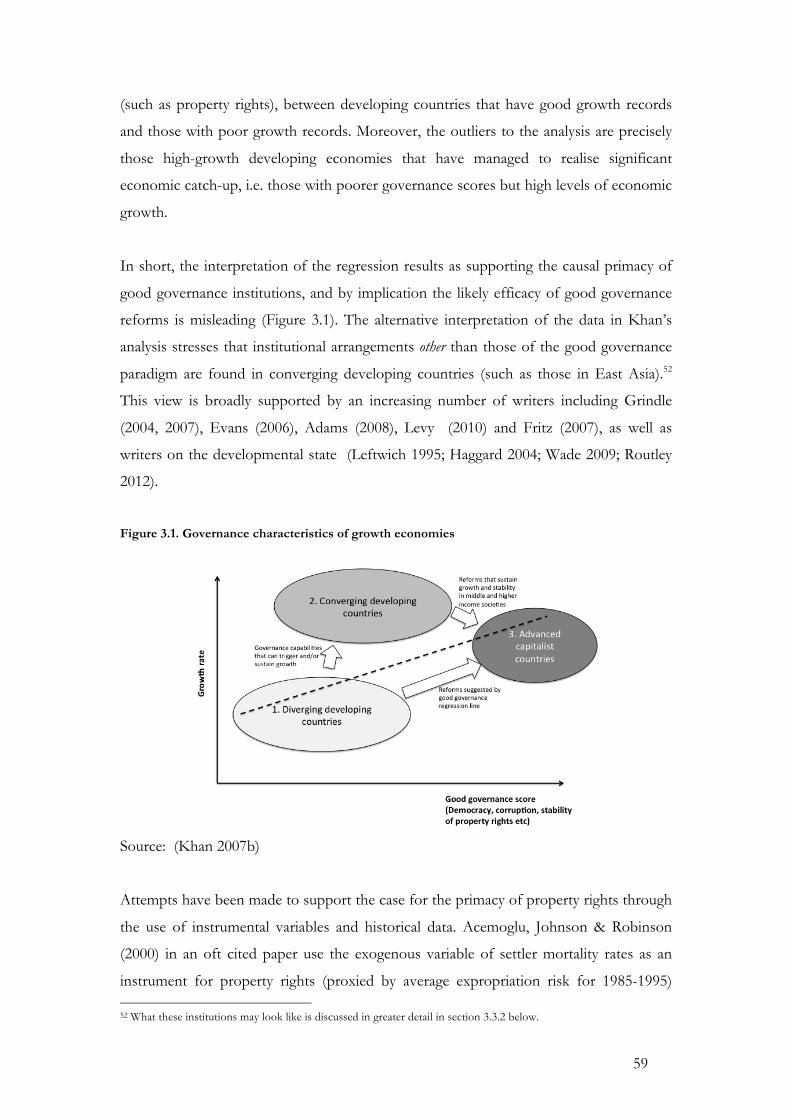
59
(such as property rights), between developing countries that have good growth records
and those with poor growth records. Moreover, the outliers to the analysis are precisely
those high-growth developing economies that have managed to realise significant
economic catch-up, i.e. those with poorer governance scores but high levels of economic
growth.
In short, the interpretation of the regression results as supporting the causal primacy of
good governance institutions, and by implication the likely efficacy of good governance
reforms is misleading (Figure 3.1). The alternative interpretation of the data in Khan’s
analysis stresses that institutional arrangements other than those of the good governance
paradigm are found in converging developing countries (such as those in East Asia).52
This view is broadly supported by an increasing number of writers including Grindle
(2004, 2007), Evans (2006), Adams (2008), Levy (2010) and Fritz (2007), as well as
writers on the developmental state (Leftwich 1995; Haggard 2004; Wade 2009; Routley
2012).
Figure 3.1. Governance characteristics of growth economies
Source: (Khan 2007b)
Attempts have been made to support the case for the primacy of property rights through
the use of instrumental variables and historical data. Acemoglu, Johnson & Robinson
(2000) in an oft cited paper use the exogenous variable of settler mortality rates as an
instrument for property rights (proxied by average expropriation risk for 1985-1995) 52 What these institutions may look like is discussed in greater detail in section 3.3.2 below.
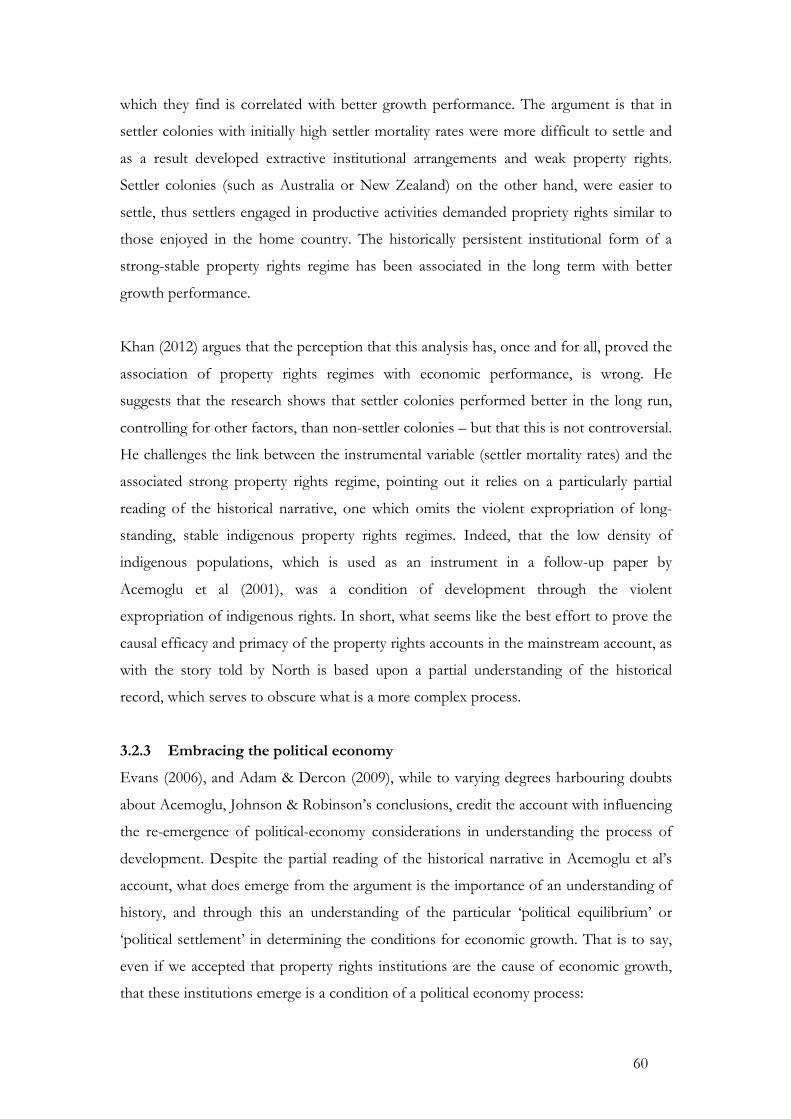
60
which they find is correlated with better growth performance. The argument is that in
settler colonies with initially high settler mortality rates were more difficult to settle and
as a result developed extractive institutional arrangements and weak property rights.
Settler colonies (such as Australia or New Zealand) on the other hand, were easier to
settle, thus settlers engaged in productive activities demanded propriety rights similar to
those enjoyed in the home country. The historically persistent institutional form of a
strong-stable property rights regime has been associated in the long term with better
growth performance.
Khan (2012) argues that the perception that this analysis has, once and for all, proved the
association of property rights regimes with economic performance, is wrong. He
suggests that the research shows that settler colonies performed better in the long run,
controlling for other factors, than non-settler colonies – but that this is not controversial.
He challenges the link between the instrumental variable (settler mortality rates) and the
associated strong property rights regime, pointing out it relies on a particularly partial
reading of the historical narrative, one which omits the violent expropriation of long-
standing, stable indigenous property rights regimes. Indeed, that the low density of
indigenous populations, which is used as an instrument in a follow-up paper by
Acemoglu et al (2001), was a condition of development through the violent
expropriation of indigenous rights. In short, what seems like the best effort to prove the
causal efficacy and primacy of the property rights accounts in the mainstream account, as
with the story told by North is based upon a partial understanding of the historical
record, which serves to obscure what is a more complex process.
3.2.3 Embracing the political economy
Evans (2006), and Adam & Dercon (2009), while to varying degrees harbouring doubts
about Acemoglu, Johnson & Robinson’s conclusions, credit the account with influencing
the re-emergence of political-economy considerations in understanding the process of
development. Despite the partial reading of the historical narrative in Acemoglu et al’s
account, what does emerge from the argument is the importance of an understanding of
history, and through this an understanding of the particular ‘political equilibrium’ or
‘political settlement’ in determining the conditions for economic growth. That is to say,
even if we accepted that property rights institutions are the cause of economic growth,
that these institutions emerge is a condition of a political economy process:

61
“…property rights and the integrity of contract are not simply the result of “getting the law right” in any
narrow sense. Rather, property rights come out of a complex causal chain that includes a variety of
complementary institutions and political bargains - with respect to security, appropriate checks on private
capture of the state, institutional checks on state power, and the more discrete features of the judicial and
legal system. In simplest form: Property rights and contracting rest upon institutions, but these in turn rest
upon deep coalitions of consenting interests.” [emphasis added] (Haggard et al 2008: 221)
Drawing on their empirical work Acemoglu et al. develop a pared down conceptual
framework illustrating the dependence of institutions on essentially exogenous political
and distributional factors (Figure 3.2). In this framework economic institutions
determine both economic performance in the present and the future distribution of
resources. Economic institutions themselves are chosen based upon political power. De
jure political power is that held and exercised by formal political institutions, and de facto
political power is political power exercised outside formal institutions. Essentially the
definition of political power in this framework is the capacity to decide upon institutional
arrangements (both political and economic). Political power in the current period is
determined by incumbent political institutions and the current distribution of resources.
These are the two ‘state variables’, which change slowly overtime and determine the state
of the rest of the system. The upshot of this model is that those who possess political
power will seek to choose economic and political institutional arrangements, which will
recreate this distribution of resources and power. Political institutions and the
distribution of resources in the initial period are effectively exogenous and determine
economic outcomes, crucially through the choice of economic institutions. While this
elaboration of the theory is helpful in stressing the importance of the political economy
and the distribution of resources, by suggesting that political conditions are effectively
exogenous, the critical policy variable remains economic institutions.
Conceptually, the account developed by Acemoglu et al moves the mainstream position
closer to an account whereby the process of economic development and technological
catch-up is understood as a political economy process. Substantively, the account
remains one wed to a belief in the efficacy of markets, although now the account is
mediated through a long causal chain - markets require suitable institutional
arrangements, which in turn require suitable political arrangements. It is this substantive
account that we have rejected. It relies either on a partial and misleading interpretation of
62
the historical record (which in any case may be of limited relevance to the contemporary
context), or on shaky cross-country evidence.
Figure 3.2. A simplified political economy relationship
Source: (reproduced from Acemoglu et al 2005) Note: Subscript ‘t’ denotes the current
period, and ‘t+1’ the future period.
On the other hand, the suggestion that the political economy context is likely to be an
important determinant of economic growth and technological change, is one with which
we agree. The question remains if, as we contend (along with writers such as North
(2005) and Nelson (2008)), the mainstream framework is inadequate for this task, how
can we understand this relationship? The micro-foundations developed in Chapter 2
provide only a basic ontology within which our processes must be framed. It is this
question we turn to in the next section.
3.3 A conceptual framework for understanding political economy of economic
growth and technological change
This section draws upon the analytical work done on the political economy of economic
development and seeks to articulate an analytical framework explicitly linking political
economy processes to technological change in the process of economic catch-up. This
framework will serve as a basis for understanding the political economy context for
environmental technology choice.
Managing the transfer, acquisition and diffusion of technology and the organisational and
institutional arrangements within which they are embedded is at the heart of the problem
of economic development. A general consensus amongst practitioners and academics has
developed over the last 15 years that a ‘hands-off’ regulatory state is not likely to be
sufficient to do the job (e.g. see Commission on Growth and Development 2008).
63
Important ‘externalities’ mean that government (or other extra-market players) are likely
to have to use systematic intervention through various sorts of policy to support the
acquisition and diffusion of new technology (i.e. the governance capabilities to trigger
and sustain growth in Figure 3.1). The point we wish to stress here, drawing on the
arguments made in Chapter 2, is the importance of the links between technology and the
political economy. A point which is not articulated particularly well either in the
emerging literature on the political economy of development, or indeed the evolutionary
account of technological change. The analysis of Mokyr (1992, 1997), and Moe (2009,
2010) of the relationship between technological change and the political economy in the
context of the Industrial Revolution discussed in Chapter 2 suggests a useful conceptual
starting point.
3.3.1 Technology and political economy
Both Mokyr (1997) and Moe (2010) stress that vested interests have been an important
determinant of the pace and direction of economic and technological change. They point
out that the history of technological change is one in which the interrelationships
between the political economy and technology have been extremely important.
Technological change not only changes aggregate economic performance, it changes the
distribution of material benefits, particularly so in the case of technological and economic
changes that precipitate wide-scale structural or disruptive technological change. Mokyr
(1997) points out, technological change can elicit significant political resistance, as the
beneficiaries of incumbent technologies (be they artisanal craftsmen, industrial workers
or oil companies) seek to preserve and further the benefits they enjoy, or reap new
benefits. An individual or group’s ability to mobilise and articulate political power will be
dependent upon a number of factors including the difficulty or otherwise of mobilising
collective action, the extent to which interests are aligned with those of politically
powerful groups, the extent of the perceived change in welfare, and above all their own
political power in the first place.
It would be a mistake to think that historically, the links between technology and power
have only, or predominantly, been exercised through economic means, coercive power
and ideological power have also been extremely important in this interplay between
technology, economics and politics (Galbraith 1983). For example, throughout history
the pursuit of political power through military means has been a key driving force behind
64
technological acquisition and advancement, technological advancements (in material
technologies as well as tactics), in the pursuit of ancient bronze-age warfare through to
the development of nuclear weapons in the twentieth century (Lipsey 2009). Similarly,
the pursuit of political power through ideological means has also been articulated in
technological development as in the ‘Space Race’ in the 1960s and 1970s, or as we will
argue in Chapters 4, 5 and 6 in the ideology surrounding electrification and the
construction of hydropower dams (Ruttan 2001; Williams & Dubash 2004). Similarly,
while we may harbour some fundamental doubts about North’s story, we can certainly
agree that important institutional arrangements have themselves been both cause and
effect of military, ideological and economic changes, just as in other cases they are
constitutive of inertia (North et al 2009).
What is important then about the emergence of a capitalist mode of production, is not as
on the NIE account stable property rights per se, but the particular form of institutions
that emerged in the Industrial Revolution, and importantly their relation to the means-of-
production, and of interest to us here, the technology of production. 53 Khan &
Blankenburg (2009) and Wood (2002) are correct to point out that the particular
institutional forms were instrumental in the emergence of capitalism and the Industrial
Revolution:
“Rapid productivity growth in England was associated with the emergence of a new system of property
rights (a ‘mode of production’) that required the imposition of a new structure of rights and institutions
that forced productivity growth in England in a way that did not happen elsewhere.” (Khan &
Blankenburg 2009: 340-341)
However, the technologies that were an intrinsic part of this change do not get a
mention. Khan & Blankenburg’s account of technological change while broadly
consistent with evolutionary economics, largely overlooks the implications of the
technological changes taking place during the Industrial Revolution. The supposition
seems to be that it was the form of property rights that emerged that spurred
entrepreneurship and innovation. But we contend that the story is more complex than
this. Incentives for innovation were in part a condition of institutional and political
53 It should be pointed out that there is no inevitability about this process. The historical antecedents for these institutional forms came about as much through the capricious vicissitudes of history as they did through the beliefs and actions of individuals and groups.
65
arrangements, but were also a condition of the type of technological advance that was
taking place.
As we argued in Chapter 2, technologies and institutions co-evolve, institutional change
and technological change are different facets of the same process. A key feature of the
Industrial Revolution, compared to other technological changes in the past was the
massive increase in labour productivity, enabled by technology that allowed cheap energy
to be applied to the process of production (Smil 2010; Wrigley 2011). This in turn
generated hitherto unseen increasing returns to scale (Lipsey 2009). The point to take
away from this is, while cheap energy resources were available elsewhere in the world, the
availability of the requisite technology was a necessary condition for the industrial
revolution.
Our contention is supported by Mokyr’s (2009) analysis that shows that the alternative
notion, that the development of property rights institutions for intellectual property
spurred invention and technological change (essentially an induced innovation account),
is not supported by the evidence. The IPR regime during the Industrial Revolution was
weak and often ineffective, and to reduce the incentives of inventors to simple benefit
seeking does not accord with the historical record, in common with McClosky (2009),
Evans (2006), Ogilvie (2009) Mokyr (2009), and Mokyr & Nye (2007) see this as
misleading. Other motivations such as honour and even altruism were important
incentives.54 Moreover, as Allen (2012) points out much innovation took place informally
as part of a collective learning process – part and parcel of those positive externalities to
technological innovation and diffusion.
Our position on the importance of technological change in the industrial revolution, and
in general for sustained economic growth approaches that of Lipsey (2009), who suggests
that the Western Scientific method was a critical condition for technological advance.55
This in turn may have been the result of historical contingencies, but it provided for the
systematic development of knowledge about the world, which enabled industrialisation
to take place. This is in accord with writers in the evolutionary economics tradition,
54 Keynes’ General Theory and the later works of Douglass North also place some emphasis upon the role of ideology and beliefs in explaining human action. 55 To cite Lipsey (2009) “A necessary condition for the Industrial Revolutions was Western science whose roots lie as far back as the scholastic philosophers and the medieval universities. Its absence elsewhere is a sufficient reason why no other place developed its own indigenous industrial revolution.”(259)
66
which repeatedly stress the importance of the means of invention and innovation, in
terms of funding for education, basic and applied research, and the development of
institutions such as R&D labs within firms and university systems (Freeman 1995; Lall
2000; Nelson 2004; Mowery et al 2009).
The important thing to come out of this story is not so much how the Industrial
Revolution was put in motion. Although this too is important both in a rebuttal of the
accepted wisdom of NIE, and an illustration of how intricate the articulation of these
processes is in complex, open systems. Rather, our interest is in how we can understand
the processes that emerged in this colossal structural change in the social order. We
suggest it is precisely at this period in history that because of the dynamic increasing
returns to the application of capital to productive processes, this is where power
articulated through economic means comes to predominate, where the technology rents
are used to enable further transition:56
“The success of the British experiment was the result of the emergence of a progressive oligarchic regime
that divided the surpluses generated by the new economy between the large landholders and the newly
rising businessmen, and that tied both groups to a centralized government structure that promoted
uniform rules and regulations at the expense of inefficient relics of an economic ancient regime. Wealth -
inherited or earned - remained the source of political power, but as its base broadened, its political
objectives shifted.” (Mokyr & Nye 2007)
There are two important elements to the dynamic we wish to highlight here. First, the
massive increasing returns to scale allowed by the new technologies. Second, the way in
which this means that power shifted from being articulated primarily through physical
coercion or ideology, to power generated and articulated primarily, if not exclusively,
through economic means. This is not to suggest other forms of power are not important,
or indeed to afford any causal primacy to economic power (Marx 1867; Heffer 2011).
Ideology and coercive power have been and remain extremely important both in their
own right and in the articulation of economic power. But, we maintain that the change in
the social order that emerged as the Industrial Revolution is uniquely characterised by the
scale of generation of economic power articulated through the political processes, and
that this was enabled by technology.
56 Or at least technology-enabled rents, such as those associated with new energy realted technologies.
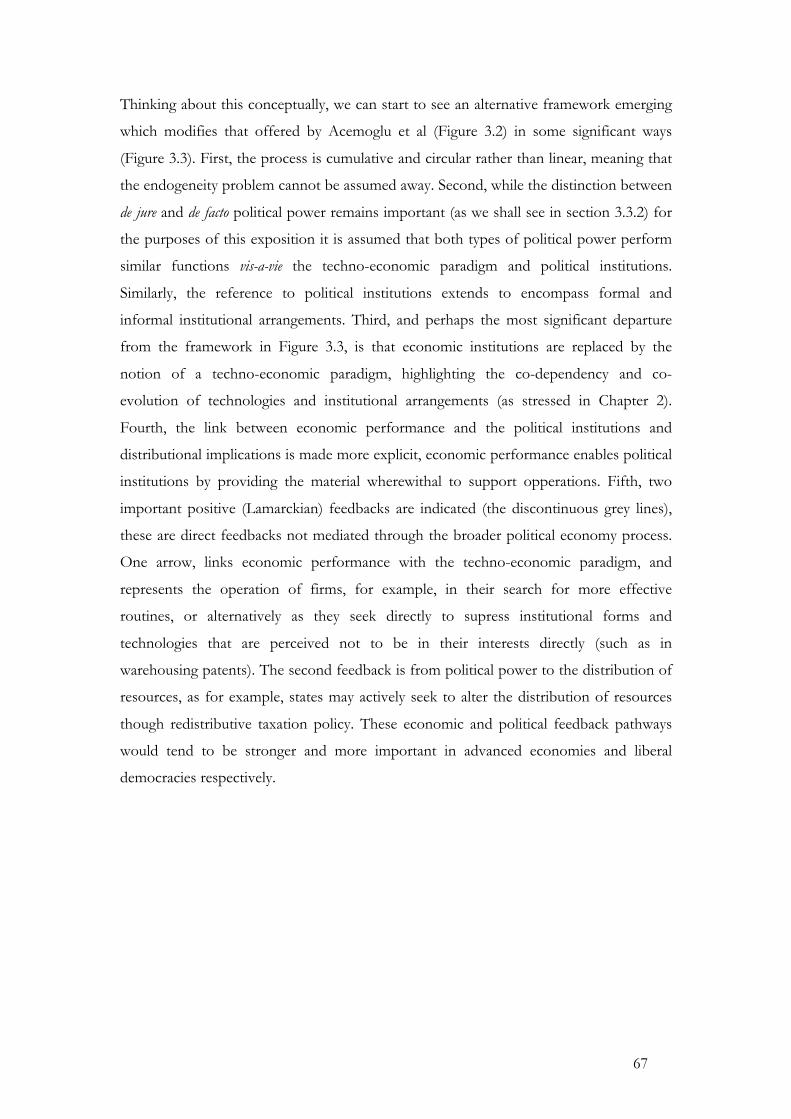
67
Thinking about this conceptually, we can start to see an alternative framework emerging
which modifies that offered by Acemoglu et al (Figure 3.2) in some significant ways
(Figure 3.3). First, the process is cumulative and circular rather than linear, meaning that
the endogeneity problem cannot be assumed away. Second, while the distinction between
de jure and de facto political power remains important (as we shall see in section 3.3.2) for
the purposes of this exposition it is assumed that both types of political power perform
similar functions vis-a-vie the techno-economic paradigm and political institutions.
Similarly, the reference to political institutions extends to encompass formal and
informal institutional arrangements. Third, and perhaps the most significant departure
from the framework in Figure 3.3, is that economic institutions are replaced by the
notion of a techno-economic paradigm, highlighting the co-dependency and co-
evolution of technologies and institutional arrangements (as stressed in Chapter 2).
Fourth, the link between economic performance and the political institutions and
distributional implications is made more explicit, economic performance enables political
institutions by providing the material wherewithal to support opperations. Fifth, two
important positive (Lamarckian) feedbacks are indicated (the discontinuous grey lines),
these are direct feedbacks not mediated through the broader political economy process.
One arrow, links economic performance with the techno-economic paradigm, and
represents the operation of firms, for example, in their search for more effective
routines, or alternatively as they seek directly to supress institutional forms and
technologies that are perceived not to be in their interests directly (such as in
warehousing patents). The second feedback is from political power to the distribution of
resources, as for example, states may actively seek to alter the distribution of resources
though redistributive taxation policy. These economic and political feedback pathways
would tend to be stronger and more important in advanced economies and liberal
democracies respectively.
68
Figure 3.3: Linking politics and the techno-economic paradigm
In common with Acemoglu et al’s framework, the main point of this framework is to
illustrate how the particular configuration of economic institutions, and in our
framework the techno-economic paradigm, is closely related to the particular
configuration of political power. For Acemoglu et al institutions need to be feasible
from the perspective of the particular configuration of political power. This is true in the
case of this framework too, although, in this case the relationship between political
power and the techno-economic paradigm is one best characterised as co-evolutionary.
Moreover, as with Acemoglu et al’s framework, this framework is suggestive of inertia as
a particular distribution of economic power is created through this process.
Nevertheless, the similarity is superficial. Whereas Acemoglu et al see the particular
political settlement as an equilibrium, suggesting static inertia, in our case we see a
political settlement emerging from a dynamic process and one that is constantly evolving.
Dynamic increasing returns would serve to quickly reinforce an emergent distribution of
power, this settlement is not a precarious balancing act between competing interests, but
a system where inertia, lock-in and increasing inequality in the distribution of power are
intrinsic characteristics. 57 At the same time, the system is intrinsically unstable.
57 It is interesting to note that for all the reliance of the Acemoglu et al/NIE account of institutional development on North, his ontological commitments to significant dynamic increasing returns leading to institutional inertia, sits uncomfortably with the notion of an equilibrium, something which his neo-classical acolytes seem to be oblivious. We
distribu(on++of+resources!
poli(cal++ins(tu(ons+
techno3economic++paradigm+
economic+performance! poli(cal+power+
(de+jure+and+de+facto)+
69
Exogenous shocks are as likely to be important here as in Acemoglu et al’s framework.
But incompete understanding and uncertainty about outcomes means the system will
never be in equilibrium and always prone to unforeseen contingencies. This too gives
greater play to other expressions of power not incorporated here such as ideological and
coercive power.
This framework serves to emphasise the broad conceptual direction in which we are
going, and our contention that the techno-economic paradigm is part of a broader
political economy process, but it is not adequate to explain or examine how the political
economy of technological change is articulated in a particular context, and in particular in
the context of economic catch-up. To understand this we need to turn to the analysis of
the political economy of technological change in latecomer catch-up, and the work on
developmental states in particular.
3.3.2 Drawing on the experience of developmental states
In common with our argument, an influential and comprehensive review of the
institutional literature on East Asian economic development by Haggard (2004), stresses
the role of an understanding of the political context in an explanation of institutional and
economic outcomes. Haggard argues that a variety of institutional forms were able to
perform important developmental functions such as ensuring requisite property rights,
making credible and effective policy commitments, formulating effective policy and
constraining rent-seeking behaviour. In common with other writers including Acemoglu
et al (2005), Khan & Blankenburg (2009), Chang (1996) and Leftwich (1995, 2008),
emphasis is placed upon the understanding of functional outcomes not as an inevitable
consequence of some uniquely optimal institutional form, but as a consequence of the
motivations of those in positions of power, that is, as a consequence of politics. What
emerges as important from the analysis of East Asian development, is not that the
institutions played the function they did, other institutions may have performed equally
well or better, but how they were acatually able to do it:
“… to the extent that dictatorial regimes faced credible commitment problems, representative institutions
did not appear to be a necessary condition for solving them. Authoritarian governments established their
credentials with private actors through other commitment technologies: industrial policies, subsidies, rents,
may note, in support of North, that institutions are frequently shot through with anachronisms, frozen hard fast into the structure of our social arrangements.

70
corruption, particularistic ties, and simple ‘repeat play.’ Through non-predatory behaviour and restraint,
sustained over time, governments signalled that the property rights of favoured groups were assured.
Institutions were not necessarily important, and to the extent that they were, they rested on more fundamental political
coalitions and exchange relationships.”[emphasis added] (Haggard 2004: 62-63)
Leftwich (1995) offers a more detailed political account of the role of East Asian states in
the process of economic catch-up in his discussion of developmental states. In
developing an ‘ideal-type’ of developmental state Leftwich highlights key characteristics
of the political context in these states that allowed them to play an effective
developmental role. First, the presence of a narrow political elite committed to national
economic development, typically with close links to the military and administrative
organs of government. Second, these states were able to achieve relative autonomy from
competing special interests. Historically, this has been a consequence of the state’s ability
to consolidate its power without the interference of other interests. The paradigm
contrast is between states in East Asia and ostensibly similar states in South Asia, Latin
America and the Philippines. In the former, the political power of the Ancien Régime was
weakened by violent conflict and colonization allowing the emergence of a politically
autonomous developmental elite, in the latter, long standing economic and class interests
were able to capture the political process and effectively ensure that the state served their
interests, thus retarding development (Khan & Blankenburg 2009). Autonomy has also
been a consequence of the broader geo-political context, providing both the external
threat, which necessitated development, and external material (money and know-how)
from politically allied states (Stubbs 2008). Third, Leftwich notes the autonomy,
competence, and power the economic bureaucracy in developmental states enjoyed,
which in particular enabled them to effectively implement important policies. Fourth, the
relative political weakness and subordination of civil society. And, fifth, as a result of a
combination of the preceding factors, the ability of the state to effectively manage non-
state economic interests. State power was consolidated in such a way that it was able to
avoid capture by the interests of capital. On one hand, the closeness and denseness of
formal and informal linkages between state and the emerging industrial sector played an
instrumental role in the relative success of industrial policy (importantly through
reducing knowledge asymmetries between policy makers and firms). On the other hand
the state was able to maintain its autonomy to effectively implement and monitor
industrial policy, a characteristic often referred to as ‘embedded autonomy’ (Chang 1994;
Evans 1998; Khan & Jomo 2000).
71
Importantly, this points to a broader political settlement, which enabled the emergence
of states that were actively able to pursue economic catch-up. These regimes depended
on the subordination of other interests to the goal of national economic development.
This entailed the suppression of possible competing interests, enabled by the relatively
high degree of legitimacy these states enjoyed. This was, in turn, a function of their actual
performance, in terms of the delivery of developmental goods, such as jobs and rising
income levels as a consequence of economic growth, but also the delivery of services and
essential infrastructure (Leftwich 1995). The suggestion is that developmental states
represent a particular type of implicit political trade-off between the suppression of
popular political power and developmental performance (Fritz & Menocal 2007; Levy
2010; Levy & Fukuyama 2010).
Similarly, Khan & Blankenburg (2009), in their comparative study of the political
economy of industrial policy in South Korea, Thailand, Malaysia, India, Bangladesh,
Pakistan, Brazil, Colombia and Peru contrast the relative success of industrial policies for
technological catch-up in South East Asia, and the relative failure of industrial strategies
in South Asia and Latin America. They explain this based upon the incompatibility of the
particular political economy configuration with the successful implementation of
technology policy, and in particular the management of resource flows or rents.
It is not our purpose to understand the details of the process of economic catch-up in
developmental states, rather we are interested in explaining the importance of political-
economy processes to allow an understanding of technological change, and potential for
environmental technological change in particular. More specifically, drawing on the
experience of both successful and failed political settlements, the question is, how can we
articulate the political economy process in a conceptual framework that is at a sufficiently
general level to allow of application in this research? In order to enable us to do this we
turn to recent work by Khan (2010, 2012) Levy (2010), and North, Wallis & Weingast
(2009) and their work on political settlements.
Khan (2010) suggests that at the most general level a political settlement is one in which
the distribution of net benefits in a system is consistent with the distribution of what he
calls ‘holding power’, defined as:
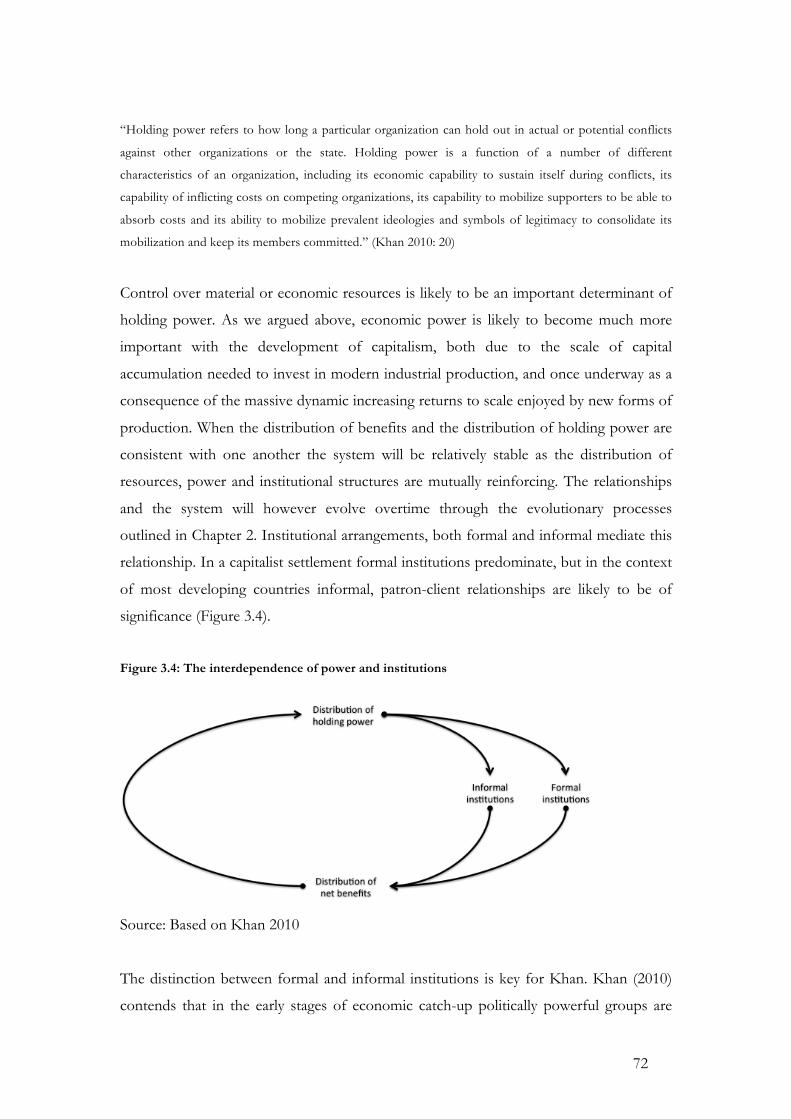
72
“Holding power refers to how long a particular organization can hold out in actual or potential conflicts
against other organizations or the state. Holding power is a function of a number of different
characteristics of an organization, including its economic capability to sustain itself during conflicts, its
capability of inflicting costs on competing organizations, its capability to mobilize supporters to be able to
absorb costs and its ability to mobilize prevalent ideologies and symbols of legitimacy to consolidate its
mobilization and keep its members committed.” (Khan 2010: 20)
Control over material or economic resources is likely to be an important determinant of
holding power. As we argued above, economic power is likely to become much more
important with the development of capitalism, both due to the scale of capital
accumulation needed to invest in modern industrial production, and once underway as a
consequence of the massive dynamic increasing returns to scale enjoyed by new forms of
production. When the distribution of benefits and the distribution of holding power are
consistent with one another the system will be relatively stable as the distribution of
resources, power and institutional structures are mutually reinforcing. The relationships
and the system will however evolve overtime through the evolutionary processes
outlined in Chapter 2. Institutional arrangements, both formal and informal mediate this
relationship. In a capitalist settlement formal institutions predominate, but in the context
of most developing countries informal, patron-client relationships are likely to be of
significance (Figure 3.4).
Figure 3.4: The interdependence of power and institutions
Source: Based on Khan 2010
The distinction between formal and informal institutions is key for Khan. Khan (2010)
contends that in the early stages of economic catch-up politically powerful groups are

73
unlikely to be able to capture benefits through formal capitalist institutions of property
rights and the rule of law, or indeed have the technological wherewithal to enable them
to effectively exploit the new techno-economic paradigm. And even when they do, the
capabilities needed to succeed in competitive markets are unlikely to be present from the
get go. Therefore, informal institutions can play a role in ensuring benefits are aligned
with holding power in a way that formal institutions could not. That is to say, if there is
to be institutional stability the mismatch between the structure of power and the
structure of formal emerging capitalist institutions needs to be met by informal
institutions, and in particular patron-client networks. The economic and technological
outcome of these resource flows are ambiguous and depend on how the process of
economic development is articulated vis-a-vie the particular political economy context, but
in all cases, resource flows mediated through both informal and formal institutions have
an important role to play in maintaining political stability through the process of
transition (Khan 2000; North et al 2009; Levy 2010). This argument is broadly in line
with the evolutionary approach we adopted in Chapter 2, and illustrates how this is likely
to play out in the context of a developing country.
Importantly for our purposes, the political settlement and the distribution of holding
power is likely to be related closely to the possibility of promoting structural change in
techno-economic systems. Conversely, inertia in the political economy settlement could
in some important cases be associated with inertia in techno-economic systems. The
extent to which technological change is either resisted or promoted by powerful groups
will depend upon the perception of the implications of the technological change for
those groups. Again, it is worth stressing that uncertainty and exogenous factors are
likely to play important roles meaning that particular settlements maybe more or less
stable over time.
The final component of Khan’s account that is utilized in this analysis is the notion of
rents. Here the term rent is used in a similar way to the notion of classical economic
surplus. That is the income accruing to the owners of property after the direct costs of
production have been paid for (Khan 2000a). The main types of rents and the
institutional structures sustaining them are identified in Table 3.1. Khan (2000a) takes
care to distinguish these rents from both classical economic surplus and in terms of neo-
classical economic theory. As opposed to the Khan’s (2000a) more ontological concerns,
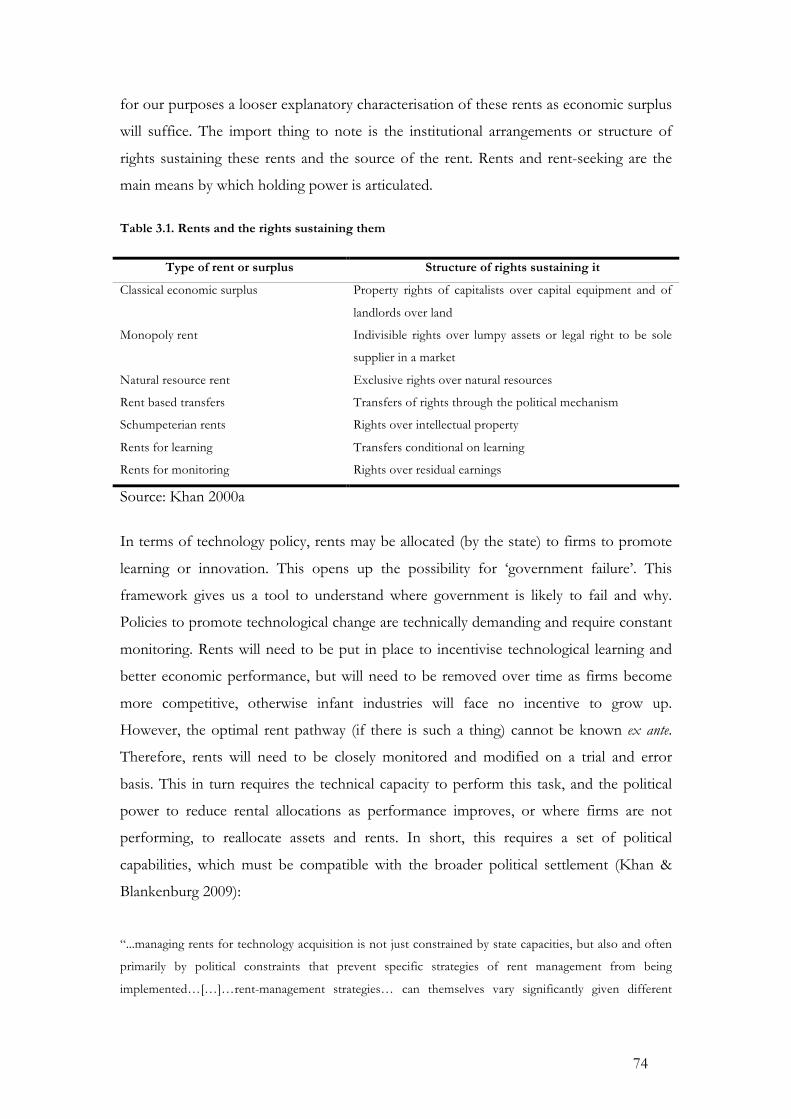
74
for our purposes a looser explanatory characterisation of these rents as economic surplus
will suffice. The import thing to note is the institutional arrangements or structure of
rights sustaining these rents and the source of the rent. Rents and rent-seeking are the
main means by which holding power is articulated.
Table 3.1. Rents and the rights sustaining them
Type of rent or surplus Structure of rights sustaining it
Classical economic surplus Property rights of capitalists over capital equipment and of
landlords over land
Monopoly rent Indivisible rights over lumpy assets or legal right to be sole
supplier in a market
Natural resource rent Exclusive rights over natural resources
Rent based transfers Transfers of rights through the political mechanism
Schumpeterian rents Rights over intellectual property
Rents for learning Transfers conditional on learning
Rents for monitoring Rights over residual earnings
Source: Khan 2000a
In terms of technology policy, rents may be allocated (by the state) to firms to promote
learning or innovation. This opens up the possibility for ‘government failure’. This
framework gives us a tool to understand where government is likely to fail and why.
Policies to promote technological change are technically demanding and require constant
monitoring. Rents will need to be put in place to incentivise technological learning and
better economic performance, but will need to be removed over time as firms become
more competitive, otherwise infant industries will face no incentive to grow up.
However, the optimal rent pathway (if there is such a thing) cannot be known ex ante.
Therefore, rents will need to be closely monitored and modified on a trial and error
basis. This in turn requires the technical capacity to perform this task, and the political
power to reduce rental allocations as performance improves, or where firms are not
performing, to reallocate assets and rents. In short, this requires a set of political
capabilities, which must be compatible with the broader political settlement (Khan &
Blankenburg 2009):
“...managing rents for technology acquisition is not just constrained by state capacities, but also and often
primarily by political constraints that prevent specific strategies of rent management from being
implemented…[…]…rent-management strategies… can themselves vary significantly given different

75
internal political configurations of power, and their relative success depends on the ‘compatibility’ of these
institutions with these pre-existing distributions of power” (Khan & Blankenburg, 2009: 348-349)
Similar arguments are applicable to natural resources, and in particular fossil fuel
exploitation (Khan 2000; Kolstad & Wiig 2009). Given the features of a political
settlement discussed above, it becomes clearer to see how lock-in can emerge where large
rents are available. In the case of fossil fuel exploitation, the returns from investment can
be significant - as we have argued elsewhere this is a key characteristic of modern
capitalism which is frequently overlooked. It is likely that most of the rents associated
with these resources are dispersed throughout the productive and consumptive sectors
(including not just extractive industries, but processing and transformation, distribution
and with end users). This distribution of resource rents will be mediated by both formal
and informal institutional relationships. These rents, in turn, create vested interests with
the material and economic wherewithal and holding power to influence the development
of formal institutional structures.
Effective policy for climate change mitigation in the energy sector is likely to be subject
to just these types of political economy constraints. Just how constraints are articulated
in any given context will depend upon the distribution of holding power, the distribution
of material resources and the formal and informal institutions that mediate this
relationship. This in turn will depend on the more concrete considerations of resource
availability, the structure and relative power of energy sector firms and institutions on the
supply-side, the political power of the demand side, and the evolving national political
settlement within which this dynamic creation and recreation of the political economy
takes place.
3.5 Conclusion: political economy and technology for ‘green growth’
We started out this chapter with the observation that broadly neo-classical economic
thinking continues to predominate in questions of climate change mitigation policy in the
context of advanced industrial economies, but also and perhaps more explicitly in the
policy prescriptions doled out to developing countries. The simple answer is get the
prices right. At first glance this stands in some contrast to the substantively more
nuanced explanations of technological change and economic development which now
predominate in thinking on development.
76
On closer analysis of the theory, however, we find the repeated retrenchment of the neo-
classical paradigm in the face of conflicting empirical evidence. Far from falsification,
neo-classical theory has ironically extended its reach from prices, to institutions, to
governance, to politics. And produced policy prescriptions to match. If it is not the
prices, then it is getting the institutions right, if not the institutions then the governance,
if not the governance then the politics. And what are the ‘right’ institutional, governance
and political arrangements? Precisely those which will allow us to get the prices right, and
this goes for environmental governance as much as it does economic governance.
Recent research performed under the auspices of the World Bank, focuses on, in order
of merit, considerations of internalizing knowledge and environmental externalities
(preferably through market based mechanisms such as the CDM), trade liberalization and
FDI, addressing financial market failures, and developing absorptive capacity in recipient
countries (Popp 2011b; Dutz & Sharma 2012). Even political economy and behavioral
issues get a mention, although there remains a strong aversion to the bête noir of selective
industrial policy (e.g. World Bank 2012). On closer analysis, the account of both
behavior and political economy is very narrow. Political economy emerges as a
consideration only due to government induced market distortions such as fuel subsidies,
not as a more fundamental condition of the system. Behaviour is also characterized in
terms of individual motivations, broader social structures are not considered.
As regards our concerns here, the treatment of the political economy of climate
mitigation is inadequate if not wholly absent. Political economy considerations are likely
to be critical for understanding the context for the implementation of mitigation
strategies, from the perspective of institutional arrangements to foster environmental
technology adoption and development, the implications for natural resource rents, and
from the more general perspective of capital accumulation and redistribution.
The process of industrialisation or economic catch-up is a process of structural change
that is unlikely to be distributionally neutral. This itself is likely to mean that changes may
be destabilising and face political inertia. This may be overcome through the
redistribution of political power managed through economic rents or other means, and
the formal and informal institutions that mediate this process. Moreover, the creation of
rents is likely to be central to the possibility of technological change in the shape of rents
77
for learning. Both redistributional rents and rents for learning may coincide, but they may
not. Whether they do or not depends upon the political economy context. It is not only
that in the board sense that there will need to be some concordance between economic
and political power. But at the micro-level the configuration of political power will need
to be such that it can foster technological catch-up through the effective management of
rents, and address the vested interests emerging from incumbent sectors.
When considering the possibility of environmental technological change, the implications
for rents (whether they be technology rents, natural resource rents or something else),
and the extent to which the scale and distribution of rents is likely to change will be
important. Indeed, considering the scale of fossil fuel rents and the dramatic change in
the distribution of rents a more sustainable techno-economic paradigm may imply,
considerations of rents, their distribution and the political economy context, which
determines this is likely to be central to the possibility of this type of change occurring. It
maybe that in some contexts there is greater political space for environmental
technologies than others, but as we suggested in Chapter 2, this needs to be shown it
cannot be assumed.
We are now in a position to start to answer the first research question raised at the end
of Chapter 1. Our question asked to what extent systematic environmental technological
change was likely to be affected by the political economy, and what were the best ways of
understanding this relationship. In response to this Chapters 2 and 3 (and supporting
annexes) agrued that there are strong grounds for adopting an evolutionary approach to
understanding processes of technological change and economic development. This
seems to be the case for both an understanding of the micro-foundations for
technological change (Chapter 2), and an understanding of the broader process of
economic development (Chapter 3). We have also agrued that a direct implication of this
is that we can expect political economy processes to be directly implicated in structurally
significant technological change. Further, that the scope for structural technological
change to take place will be dependant upon the political economy context. An analytical
framework for elaborating this process (Figures 3.3 and 3.4) which stressed the
interlinkages between the disposition of holding power, the techno-economic paradigm,
economic performance, and distributional and institutional outcomes.

78
The development of this framework also represents a step towards answering the
second, empirical research question, namely “To what extent have political economy factors
influenced the choice of technology in the electricity services industry of Vietnam? ” This question both
serves to test the utility of the analytical framework we have developed and generate
substantive understanding of a particular country context. Before testing the research
questions through the development of the Vietnam case study (Chapters 6 and 7), we
first need to understand how the techno-economic constraints fced by a particular
technological system interacts with the political economy. The next chapter looks at how
the political economy is likely to be elaborated in the context of the electricity sector
though an examination of the technological, economic and political aspects of the sector.
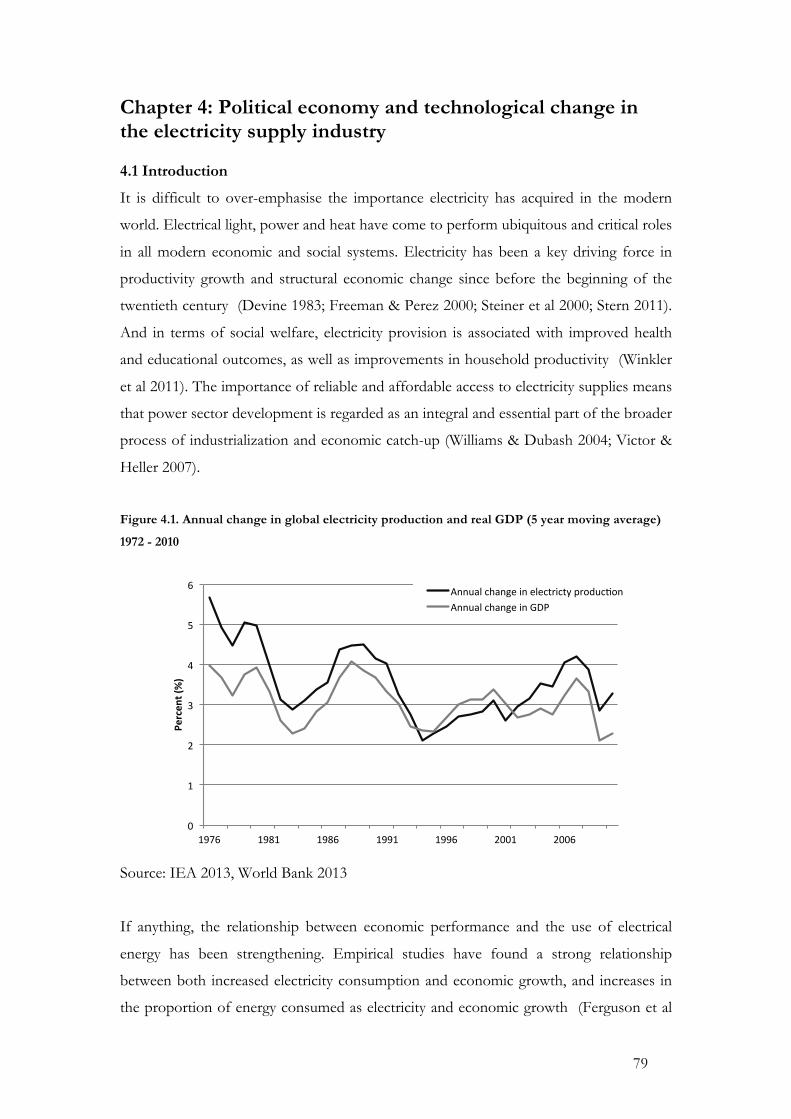
79
Chapter 4: Political economy and technological change in the electricity supply industry 4.1 Introduction
It is difficult to over-emphasise the importance electricity has acquired in the modern
world. Electrical light, power and heat have come to perform ubiquitous and critical roles
in all modern economic and social systems. Electricity has been a key driving force in
productivity growth and structural economic change since before the beginning of the
twentieth century (Devine 1983; Freeman & Perez 2000; Steiner et al 2000; Stern 2011).
And in terms of social welfare, electricity provision is associated with improved health
and educational outcomes, as well as improvements in household productivity (Winkler
et al 2011). The importance of reliable and affordable access to electricity supplies means
that power sector development is regarded as an integral and essential part of the broader
process of industrialization and economic catch-up (Williams & Dubash 2004; Victor &
Heller 2007).
Figure 4.1. Annual change in global electricity production and real GDP (5 year moving average)
1972 - 2010
Source: IEA 2013, World Bank 2013
If anything, the relationship between economic performance and the use of electrical
energy has been strengthening. Empirical studies have found a strong relationship
between both increased electricity consumption and economic growth, and increases in
the proportion of energy consumed as electricity and economic growth (Ferguson et al
0"
1"
2"
3"
4"
5"
6"
1976" 1981" 1986" 1991" 1996" 2001" 2006"
Percen
t'(%)'
Annual"change"in"electricty"produc<on"Annual"change"in"GDP"
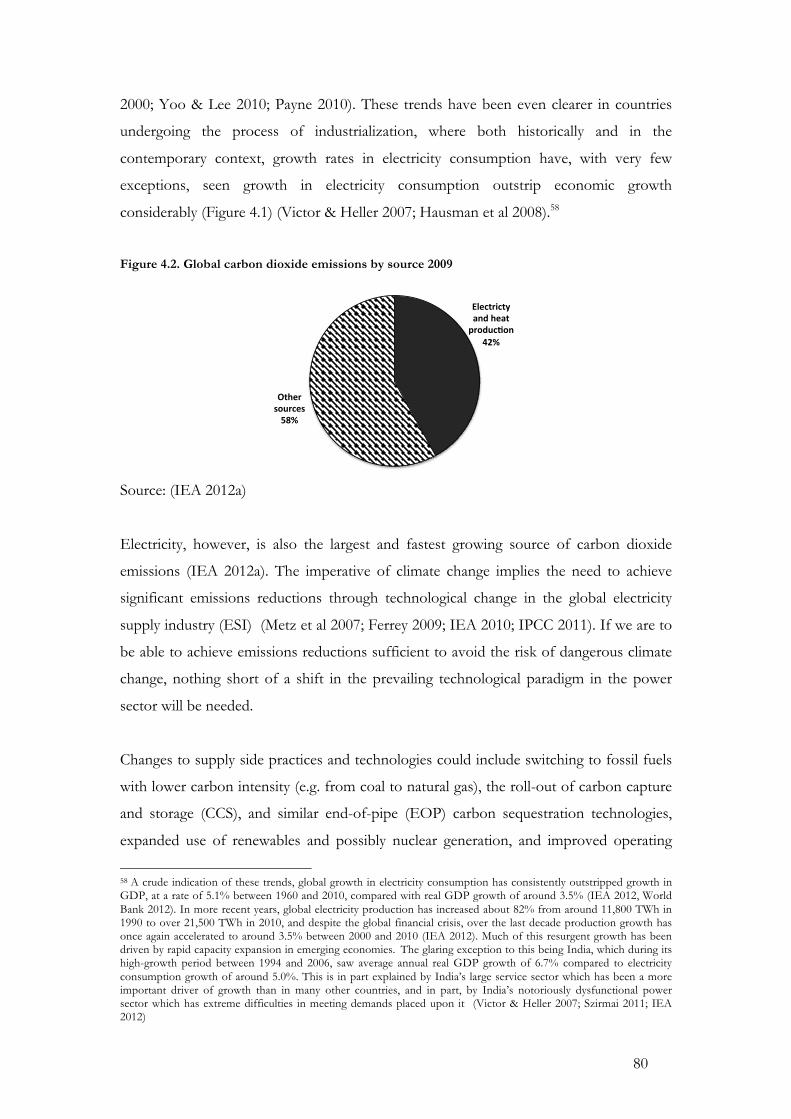
80
2000; Yoo & Lee 2010; Payne 2010). These trends have been even clearer in countries
undergoing the process of industrialization, where both historically and in the
contemporary context, growth rates in electricity consumption have, with very few
exceptions, seen growth in electricity consumption outstrip economic growth
considerably (Figure 4.1) (Victor & Heller 2007; Hausman et al 2008).58
Figure 4.2. Global carbon dioxide emissions by source 2009
Source: (IEA 2012a)
Electricity, however, is also the largest and fastest growing source of carbon dioxide
emissions (IEA 2012a). The imperative of climate change implies the need to achieve
significant emissions reductions through technological change in the global electricity
supply industry (ESI) (Metz et al 2007; Ferrey 2009; IEA 2010; IPCC 2011). If we are to
be able to achieve emissions reductions sufficient to avoid the risk of dangerous climate
change, nothing short of a shift in the prevailing technological paradigm in the power
sector will be needed.
Changes to supply side practices and technologies could include switching to fossil fuels
with lower carbon intensity (e.g. from coal to natural gas), the roll-out of carbon capture
and storage (CCS), and similar end-of-pipe (EOP) carbon sequestration technologies,
expanded use of renewables and possibly nuclear generation, and improved operating
58 A crude indication of these trends, global growth in electricity consumption has consistently outstripped growth in GDP, at a rate of 5.1% between 1960 and 2010, compared with real GDP growth of around 3.5% (IEA 2012, World Bank 2012). In more recent years, global electricity production has increased about 82% from around 11,800 TWh in 1990 to over 21,500 TWh in 2010, and despite the global financial crisis, over the last decade production growth has once again accelerated to around 3.5% between 2000 and 2010 (IEA 2012). Much of this resurgent growth has been driven by rapid capacity expansion in emerging economies. The glaring exception to this being India, which during its high-growth period between 1994 and 2006, saw average annual real GDP growth of 6.7% compared to electricity consumption growth of around 5.0%. This is in part explained by India’s large service sector which has been a more important driver of growth than in many other countries, and in part, by India’s notoriously dysfunctional power sector which has extreme difficulties in meeting demands placed upon it (Victor & Heller 2007; Szirmai 2011; IEA 2012)
Electricty)and)heat)produc1on)
42%)
Other)sources)58%)
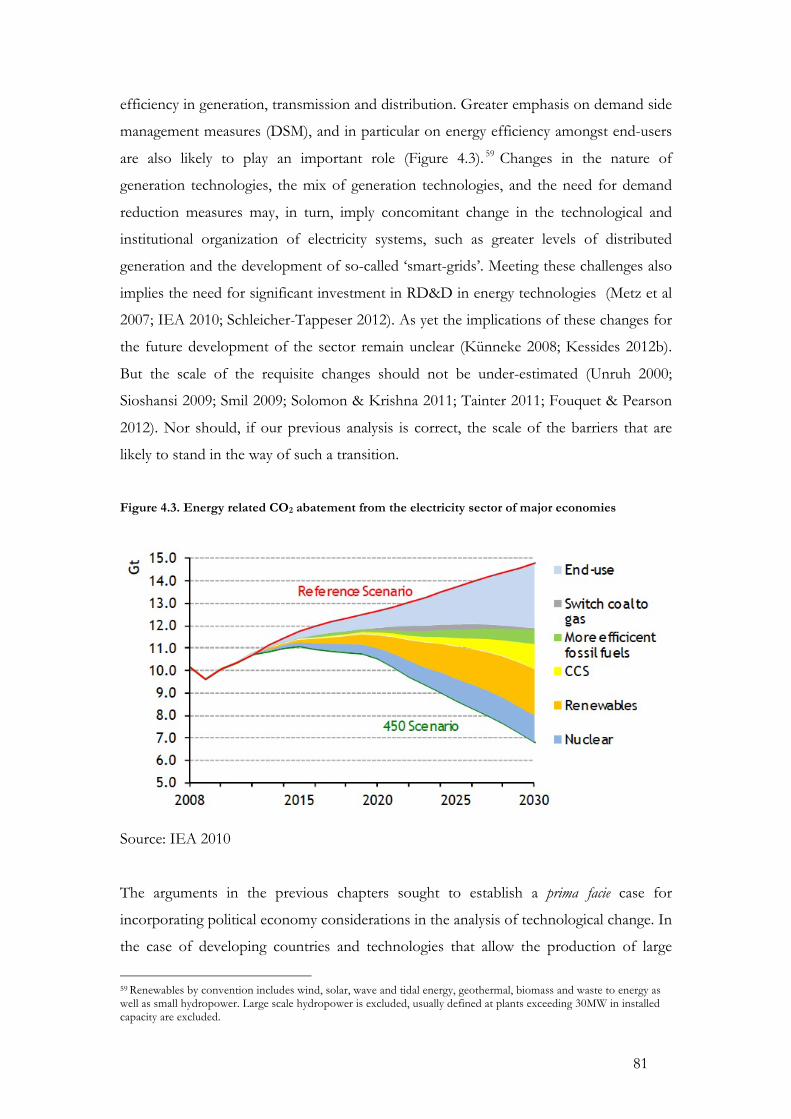
81
efficiency in generation, transmission and distribution. Greater emphasis on demand side
management measures (DSM), and in particular on energy efficiency amongst end-users
are also likely to play an important role (Figure 4.3). 59 Changes in the nature of
generation technologies, the mix of generation technologies, and the need for demand
reduction measures may, in turn, imply concomitant change in the technological and
institutional organization of electricity systems, such as greater levels of distributed
generation and the development of so-called ‘smart-grids’. Meeting these challenges also
implies the need for significant investment in RD&D in energy technologies (Metz et al
2007; IEA 2010; Schleicher-Tappeser 2012). As yet the implications of these changes for
the future development of the sector remain unclear (Künneke 2008; Kessides 2012b).
But the scale of the requisite changes should not be under-estimated (Unruh 2000;
Sioshansi 2009; Smil 2009; Solomon & Krishna 2011; Tainter 2011; Fouquet & Pearson
2012). Nor should, if our previous analysis is correct, the scale of the barriers that are
likely to stand in the way of such a transition.
Figure 4.3. Energy related CO2 abatement from the electricity sector of major economies
Source: IEA 2010
The arguments in the previous chapters sought to establish a prima facie case for
incorporating political economy considerations in the analysis of technological change. In
the case of developing countries and technologies that allow the production of large
59 Renewables by convention includes wind, solar, wave and tidal energy, geothermal, biomass and waste to energy as well as small hydropower. Large scale hydropower is excluded, usually defined at plants exceeding 30MW in installed capacity are excluded.
82
economic rents, distributional outcomes and therefore political economy considerations
are likely to be significant. In this chapter we argue that based upon a critical review of
the history of the sector and in the case of the technological changes needed to promote
low carbon development in the ESI, there is similarly a strong case to expect political
economy considerations to be important.
That the political economy is, in some sense, ‘important’ for outcomes in the power
sector, is uncontroversial and commonplace (e.g. Williams & Dubash 2004; Besant-Jones
2006; Victor & Heller 2007). The treatment of the political economy, and how it emerges
as important, however, differs considerably between writers. Advocates of power system
liberalisation and market-based reform, in common with the proponents of the neo-
liberal view of governance, have tended to treat political economy considerations as
potential sources of interference in otherwise rational techno-economic decision-making
processes, and as an exogenous barrier to otherwise desirable reforms (Bacon & Besant-
Jones 2001; Besant-Jones 2006; Jamasb 2006). Similarly, as noted in Chapter 2, and in
contrast to the more historical bent of the long-term energy transition studies, much of
the recent writing on technological change in the sector seeks to abstract from the
political economy context, placing a stress on individual behaviour, non-cost barriers or
market failures (Lewis 2007; Sovacool 2009; Smits & Bush 2010; Solomon & Krishna
2011; Wüstenhagen & Menichetti 2012; Negro et al 2012; Schleicher-Tappeser 2012;
Sovacool 2012).60 This literature tends to downplay the importance of real material costs
associated with low carbon technological change, which in turn means that the
implications for the change in the distribution of material wealth, and thus political
economy considerations are not taken seriously enough.
By contrast, historical treatments of ESI development and reform have tended to focus
upon the interaction between technological, economic, institutional and political
economy aspects of the sector (Hughes 1983; Hirsh 1999; Hirsh 2003; Williams &
Dubash 2004; Williams & Ghanadan 2006; Hirsh 2007; Victor & Heller 2007; Hausman
et al 2008; Clifton et al 2011; Hausman & Neufeld 2011; Millward 2011a; Millward
2011b). In these accounts, political economy processes emerge, not as some adjunct to 60 One common approach is not to mention increased costs at all. For example, a recent paper by Schleisher-Tappeser (2012) much is made of immanent grid parity of solar PV with other sources of electricity in Germany. It forgets to mention that cost parity is only achieve thanks to a subsidy to solar PV. Another approach is to calculate costs including externalities or insist that costs are otherwise lower than fossil fuels (Sovacool 2008). Unfortunately, these are profoundly optimistic estimations of cost. Such advocacy is misplaced in the academic literature, and may have unforeseen negative consequences for the roll out of renewables, for example see Mints (2012).

83
the functioning of a techno-economic system, but as an intrinsic part of the system.
Drawing on this work, and in a similar vein to Moe (2010), Mokyr (1997, 2006) and
Lipsey (2009), it is our contention that in common with the energy sector more generally,
a more systematic understanding of the importance of political economy dynamics will
be central to identifying the potential for technological change in the ESI, and that an
approach based upon Khan’s (2000a) notion of rents can serve to elaborate this process.
The task in this chapter is broadly three-fold; to investigate the key factors driving
change and development (technological, economic and institutional) in the power sector;
to understand how political economy dynamics have entered into and influenced these
changes; and, to elaborate what implications political economy considerations may have
for technological change in the ESI.
To achieve these objectives we first draw on the history of the ESI. In a discussion of the
early development of the sector we investigate the motive forces behind the emergence
of the relatively stable techno-economic paradigm in the ESI during the 1930s, around a
dominant system design of large scale centralized electricity grids. We move on to look at
the development of institutional arrangements in the ESI (namely vertically integrated
monopolistic state owned or controlled regional grids) and how these arrangements
emerged through interactions between the incumbent techno-economic paradigm and
the broader social, political and economic context. Lastly, we move to more recent
developments and look at the post 1980 period of ESI liberalization. Appealing to this
evidence we go on to develop an analysis of political economy dynamics within the ESI
and characterize them as a fundamental response to the presence of significant economic
rents (or opportunities to generate rent-like transfers). Finally, we examine what the
presence of these rents (appropriable though the exercise of political power) is likely to
mean for different technologies and develop a taxonomy of rents associated with the
sector.
In what follows, section 4.2 starts with a discussion of the history of the ESI. Section 4.3,
looks at the emerging pressures facing the sector, while section 4.4 draws on this analysis
by elaborating rents likely to be associated with different technological options, and
section 4.5 concludes.
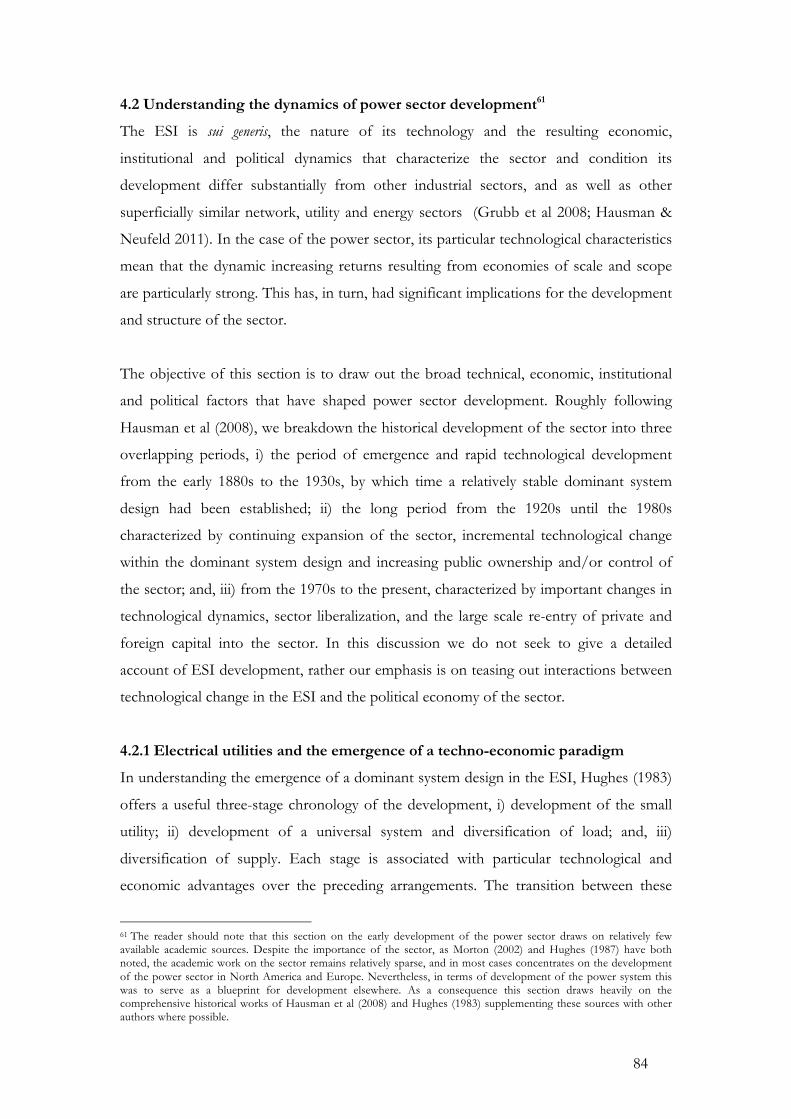
84
4.2 Understanding the dynamics of power sector development61
The ESI is sui generis, the nature of its technology and the resulting economic,
institutional and political dynamics that characterize the sector and condition its
development differ substantially from other industrial sectors, and as well as other
superficially similar network, utility and energy sectors (Grubb et al 2008; Hausman &
Neufeld 2011). In the case of the power sector, its particular technological characteristics
mean that the dynamic increasing returns resulting from economies of scale and scope
are particularly strong. This has, in turn, had significant implications for the development
and structure of the sector.
The objective of this section is to draw out the broad technical, economic, institutional
and political factors that have shaped power sector development. Roughly following
Hausman et al (2008), we breakdown the historical development of the sector into three
overlapping periods, i) the period of emergence and rapid technological development
from the early 1880s to the 1930s, by which time a relatively stable dominant system
design had been established; ii) the long period from the 1920s until the 1980s
characterized by continuing expansion of the sector, incremental technological change
within the dominant system design and increasing public ownership and/or control of
the sector; and, iii) from the 1970s to the present, characterized by important changes in
technological dynamics, sector liberalization, and the large scale re-entry of private and
foreign capital into the sector. In this discussion we do not seek to give a detailed
account of ESI development, rather our emphasis is on teasing out interactions between
technological change in the ESI and the political economy of the sector.
4.2.1 Electrical utilities and the emergence of a techno-economic paradigm
In understanding the emergence of a dominant system design in the ESI, Hughes (1983)
offers a useful three-stage chronology of the development, i) development of the small
utility; ii) development of a universal system and diversification of load; and, iii)
diversification of supply. Each stage is associated with particular technological and
economic advantages over the preceding arrangements. The transition between these
61 The reader should note that this section on the early development of the power sector draws on relatively few available academic sources. Despite the importance of the sector, as Morton (2002) and Hughes (1987) have both noted, the academic work on the sector remains relatively sparse, and in most cases concentrates on the development of the power sector in North America and Europe. Nevertheless, in terms of development of the power system this was to serve as a blueprint for development elsewhere. As a consequence this section draws heavily on the comprehensive historical works of Hausman et al (2008) and Hughes (1983) supplementing these sources with other authors where possible.
85
stages overlapped and was not always smooth (see section 4.2.2), the advantages of these
developments proved influential and resulted in the gradual emergence of ESI utilities
and regional or national electricity grids that now dominate the ESI (Hughes 1983b;
Hausman et al 2008; Hausman & Neufeld 2011). By and large, these advantages also
represent fundamental technical and economic characteristics of power generation and
supply which have continued to influence the shape of electricity provision to the
present day (Morton 2002).
Electricity has been used for commercial purposes since the beginning of the nineteenth
century. In its earliest commercial applications electricity was supplied from isolated
sources, initially chemical batteries and later in the nineteenth century, with the
development of electro-mechanical generation technologies, steam powered generators
rapidly became the dominant form of electricity supply. Electricity supply was typically
owned and operated by consumers in the form of isolated generation plants built on site
to meet on site consumption needs, usually for lighting or industrial purposes (Hughes
1983; Hausman et al 2008).
Initially, the largest potential market for electricity was deemed to be for lighting. In the
late nineteenth century, this market was largely served by gas companies operated on a
utility basis, owning both supply infrastructure and distribution networks through which
they supplied gas lighting to customers. Electricity entrepreneurs, most famously
Thomas Edison, saw an opportunity for electrical lighting utilities to compete with gas
using a similar model (Hughes 1983).62 But it was not until the 1870s, with the invention
of the incandescent light bulb, that the prospect of a competitive electricity supply utility
became technically feasible.6364 The first electricity utility with centralized generation,
distributing electricity over a geographically dispersed area to household and business
customers started operations in 1882 in New York (Hughes 1983; Hausman et al 2008).
62 Gas for street and domestic lighting provided from centralized plants through a distribution network to customers over a geographical area were the first example of utilities, and presented the largest competitor to electricity utilities (Hausman et al 2008, Hughes 1983). Neufeld (1987) comments, “Electric power companies historically faced stiff competition from substitutes for centrally generated electricity. For example, the market for artificial lighting was originally served by gas companies, and Edision’s initial pricing policies were based non on his production costs but on the cost to his potential customers of gas lighting.” (693) 63 In contrast to the previously available arc lighting, incandescent bulbs could be connected in parallel to a high-voltage network allowing both individual customer control of the lighting and the provision of a level of light that was suitable for domestic use. 64 Themselves a consequence of the development of more effective technologies for creating vacuums.
86
Figure 4.4. Key technological developments and the expansion of electrical power use in US
industry 1870 – 1930
Source: Devine 1983, Hughes 1983, Hausman et al 2008
In the years after development of the first utilities, a series of inventions made electricity
cheaper, more reliable and easier to distribute at scale (Figure 4.4). At the same time,
innovations in end-use technology meant that wider-use of electricity could be made by
consumers in manufacturing industry, the commercial sector and amongst households
(Devine 1983; Hughes 1983a; Hausman et al 2008). Exmaples include, the development
of the steam turbine greatly increased the overall efficiency and efficient scale of
electricity production over reciprocating generators. Improved transmission and
distribution technologies allowed larger grids to be developed and allowed access to
more distant generation sources, such as hydropower and coal-fired thermal plants at
mine-mouths. The development of relatively cheap, reliable electric motors to drive
machinery offered unprecedented flexibility to manufacturers, which were able to
capture significant productivity gains as a result. Household devices such as washing
machines, refrigerators and air conditioners also added to the increasing demand for
0" 10" 20" 30" 40" 50" 60" 70" 80"
1870"
1880"
1890"
1900"
1910"
1920"
1930"
D.C$Electric$generator$(hand3driven)$
Motor$driven$by$a$generator$
Steam$powered$and$hydropower$genera=on$$Prac=cal$incandescent$lights$
First$u=li=es/electricity$marketed$as$a$commodity$Motors$used$in$manufacturing$
Steam$turbine$developed$A.C.$for$ligh=ng$introduced$
A.C.$Motor$
A.C.$power$transmission$for$industrial$use$A.C.$Polyphase$induc=on$motor$A.C.$genera=on$at$Niagara$Falls;$$
11kV$transmission$line$
Central$sta=on$steam$turbine$and$A.C.$generator$
Share&of&power&for&mechanical&drive&(%)&
Refrigerator$150kV$transmission;$Air$condi=oning$
Washing$machine,$vacuum$cleaner$
0"
10"
20"
30"
40"
50"
60"
70"
80"
90"
1870" 1880" 1890" 1900" 1910" 1920" 1930"
Share&of&pow
er&fo
r&mecha
nical&driv
e&(%
)&
Water"
Steam"
Electricty"
Primary$motors$dominate;$$Capacity$at$u=li=es$exceeds$isolated$plants$
Key&technological&developments&
0"
10"
20"
30"
40"
50"
60"
70"
80"
90"
1870" 1880" 1890" 1900" 1910" 1920" 1930"
Share&of&pow
er&fo
r&mecha
nical&driv
e&(%
)&
Water"
Steam"
Electricty"
60kV$transmission$
240kV$transmission$
87
electrical power (Devine 1983; Hughes 1983).
These technological changes enabled the rapid expansion of the power sector globally, in
cities, industrial and suburban areas and in more isolated locations such as plantations
and mines, gradually towns and rural users were incorporated into networks. The
geographical spread of electrical energy use was rapid, and by the turn of the century, in
urban areas it was already becoming ubiquitous. Hausman et al (2008) comment on the
dynamics of these developments:
“While the story in each country had unique aspects, the process of electrification followed certain
patterns. Globally, urban areas became electrified before rural ones. There was a strong preexisting
demand for light, power, and transportation. Over time, new devices to connect to the system were
invented or adapted, including products such as electric irons, fans, heaters, ranges, vacuum cleaners,
shavers, toasters, hot plates, and refrigerators. Every city and town in the world wanted electricity service.
By the turn of the century, or shortly thereafter, with the exception of the least developed areas of the
world, nearly every city and most of the larger towns had electricity service of some type…” (Hausman et
al 2008: 18)
Small electrical utilities spread quickly aided by technological change, which rapidly
enhanced their viability. However, up until 1917 in the USA and considerably later in
Great Britain, most electricity generation capacity was still installed in the form of
isolated generation units at industrial plants (Devine 1983; Hughes 1983; Hausman et al
2008). Initially, isolated plants had key cost advantages over utilities. They did not need
to develop an expensive distribution network over an extended geographical area to
supply customers as power was consumed in situ, nor did they have the administrative or
billing costs of utilities, and if steam were produced as part of the industrial process or
for heating, electricity could be generated as a by product (Neufeld 1987). Nevertheless,
the utility model enjoyed a number of important technological advantages that lead to
increasing economic returns to scope and scale, and resulted in the eventual emergence
of the utility as a core element in the design of electricity systems.
The first advantage that utilities enjoyed over isolated generation plants was their ability
to separate decisions about the citing of generation plants from considerations of
customer location. The first utilities had rather small distribution networks, and were
constrained by available transmission technologies. But with the development of
technologies that allowed the relatively long-distance transmission of electricity at higher
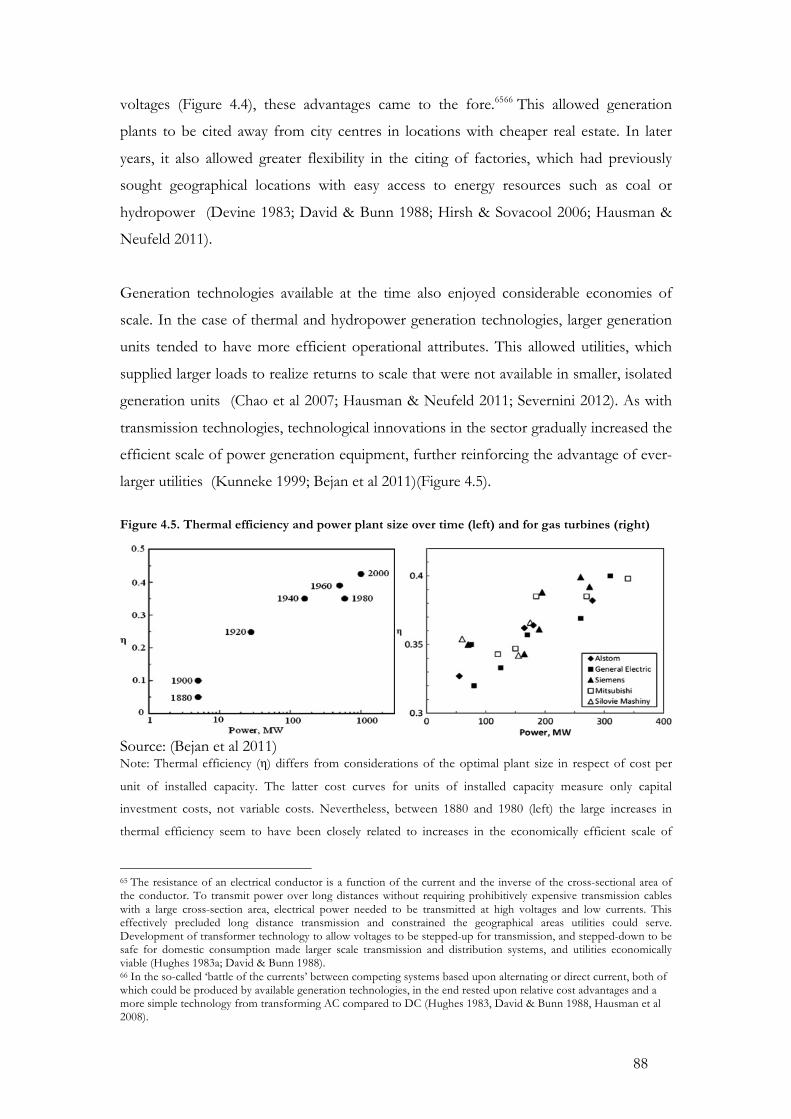
88
voltages (Figure 4.4), these advantages came to the fore.6566 This allowed generation
plants to be cited away from city centres in locations with cheaper real estate. In later
years, it also allowed greater flexibility in the citing of factories, which had previously
sought geographical locations with easy access to energy resources such as coal or
hydropower (Devine 1983; David & Bunn 1988; Hirsh & Sovacool 2006; Hausman &
Neufeld 2011).
Generation technologies available at the time also enjoyed considerable economies of
scale. In the case of thermal and hydropower generation technologies, larger generation
units tended to have more efficient operational attributes. This allowed utilities, which
supplied larger loads to realize returns to scale that were not available in smaller, isolated
generation units (Chao et al 2007; Hausman & Neufeld 2011; Severnini 2012). As with
transmission technologies, technological innovations in the sector gradually increased the
efficient scale of power generation equipment, further reinforcing the advantage of ever-
larger utilities (Kunneke 1999; Bejan et al 2011)(Figure 4.5).
Figure 4.5. Thermal efficiency and power plant size over time (left) and for gas turbines (right)
Source: (Bejan et al 2011) Note: Thermal efficiency (η) differs from considerations of the optimal plant size in respect of cost per
unit of installed capacity. The latter cost curves for units of installed capacity measure only capital
investment costs, not variable costs. Nevertheless, between 1880 and 1980 (left) the large increases in
thermal efficiency seem to have been closely related to increases in the economically efficient scale of
65 The resistance of an electrical conductor is a function of the current and the inverse of the cross-sectional area of the conductor. To transmit power over long distances without requiring prohibitively expensive transmission cables with a large cross-section area, electrical power needed to be transmitted at high voltages and low currents. This effectively precluded long distance transmission and constrained the geographical areas utilities could serve. Development of transformer technology to allow voltages to be stepped-up for transmission, and stepped-down to be safe for domestic consumption made larger scale transmission and distribution systems, and utilities economically viable (Hughes 1983a; David & Bunn 1988). 66 In the so-called ‘battle of the currents’ between competing systems based upon alternating or direct current, both of which could be produced by available generation technologies, in the end rested upon relative cost advantages and a more simple technology from transforming AC compared to DC (Hughes 1983, David & Bunn 1988, Hausman et al 2008).
89
power plants.
Third, electricity is not easily storable and requires that demand and supply be matched
in real time to ensure the stability and reliability of the network. As a consequence, the
generation capacity67 requirements of a power system are not determined by average, but
peak level demand (similar considerations apply to other network industries such as ICT
and transport) (Kunneke 1999; Grubb et al 2008).68 For a plant that supplies a diversified
consumer base, whose individual peak demands differ over time, there is significant
opportunity to achieve higher utilization rates of generation capacity and, as a result,
much better returns on generation investment (Neufeld 1987; Chao et al 2007; Hausman
et al 2008; Hausman & Neufeld 2011).69 What is more, larger networks with a diversified
consumption base tended to require lower reserve margins and enjoy higher load factors,
and hence were able to earn a better return from their assets.70 While these returns to
scope were not unlimited, in the early stages of system expansion they proved to be
significant. Expansion in demand was also being promoted through innovation in end-
use technologies for household, industrial and public use. The expansion in scope and
variety of demand allowed dramatic improvements in load factors and consequently
returns to investment for larger utilities (Hughes 1983, 1987).
Fourth, a larger supply and distribution network allows a greater number of generation
units in the network. Given that generation equipment periodically requires maintenance
and may sometimes breakdown, to ensure supply at these times back-up generation
capacity needs to be available. Spreading this back-up capacity over a larger network
effectively lowers the proportion of capital costs that need to be invested and increases
the average load factor for generation assets (Hausman et al 2008).71
67 Peak loads will also be determinate of the size of transmission and distribution equipment. However, the actual capacity needs for T&D will depend on the portion of the load flowing through that section of the grid which depends upon the particular way in which the grid is configured. 68 For example, intuitively, for an isolated plant serving a factory, demand may be intermittent, demanding a peak capacity of 20 MW for 5 hours a day (in other words demanding 100MWh of electricity), potentially the plant operating at full capacity could produce 480MWh per day, so the plant would be running at approximately only 21% of its capacity. 69 The rate of utilization of generation equipment is known as the load or capacity factor. This is measured in terms of the proportion of which its rated capacity is used over a given period of time. 70 The reserve margin is usually defined as the total available capacity divided by peak capacity demand, load factors reflect the proportion of the time overall capacity is used. For example, a load factor of 80% means that 80% of generation capacity is fully used. 71 Intuitively an isolated plant would require 100% back up capacity in case of breakdown or when regular maintenance is required, a network with two plants, if each were likely to be out of action 10% of the time, would require a back up of only 50%, for 4 equivalently sized plants 25% and so on – up to the point where we may expect 100% of the back-up plant’s capacity to be used.
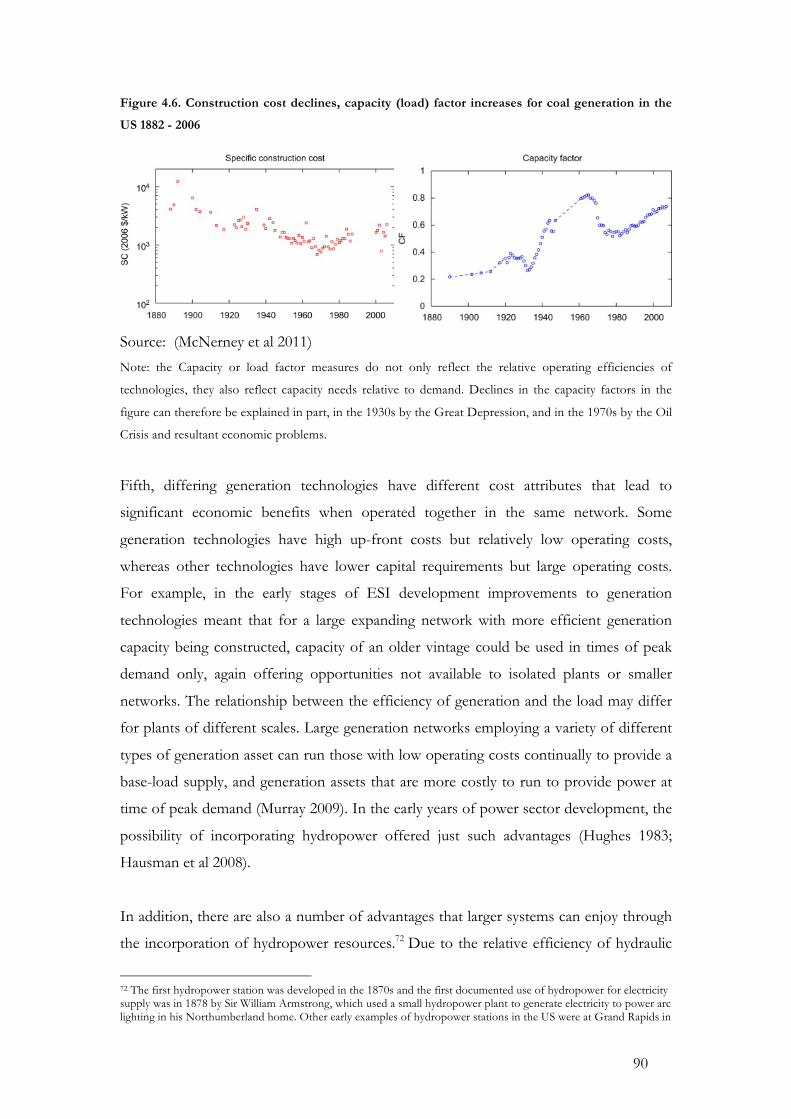
90
Figure 4.6. Construction cost declines, capacity (load) factor increases for coal generation in the
US 1882 - 2006
Source: (McNerney et al 2011)
Note: the Capacity or load factor measures do not only reflect the relative operating efficiencies of
technologies, they also reflect capacity needs relative to demand. Declines in the capacity factors in the
figure can therefore be explained in part, in the 1930s by the Great Depression, and in the 1970s by the Oil
Crisis and resultant economic problems.
Fifth, differing generation technologies have different cost attributes that lead to
significant economic benefits when operated together in the same network. Some
generation technologies have high up-front costs but relatively low operating costs,
whereas other technologies have lower capital requirements but large operating costs.
For example, in the early stages of ESI development improvements to generation
technologies meant that for a large expanding network with more efficient generation
capacity being constructed, capacity of an older vintage could be used in times of peak
demand only, again offering opportunities not available to isolated plants or smaller
networks. The relationship between the efficiency of generation and the load may differ
for plants of different scales. Large generation networks employing a variety of different
types of generation asset can run those with low operating costs continually to provide a
base-load supply, and generation assets that are more costly to run to provide power at
time of peak demand (Murray 2009). In the early years of power sector development, the
possibility of incorporating hydropower offered just such advantages (Hughes 1983;
Hausman et al 2008).
In addition, there are also a number of advantages that larger systems can enjoy through
the incorporation of hydropower resources.72 Due to the relative efficiency of hydraulic
72 The first hydropower station was developed in the 1870s and the first documented use of hydropower for electricity supply was in 1878 by Sir William Armstrong, which used a small hydropower plant to generate electricity to power arc lighting in his Northumberland home. Other early examples of hydropower stations in the US were at Grand Rapids in
91
turbines and the availability of cost-free energy, hydropower is generally cheap relative to
thermal power (WCD 2001; Kumar et al 2011; Severnini 2012).73 Hydropower was also
generally more reliable than thermal plants in the early days of the ESI when emerging
thermal plant technologies were prone to breakdown. These cost advantages meant that
in the early years of ESI development wherever there were adequate water resources and
a demand for electricity, hydropower plants proliferated (Electricity Today 2006).
Most, but by no means all, the early hydropower plants were small by modern standards
with small storage reservoirs relative to their capacity, meaning they were particularly
vulnerable to seasonal variations in water availability. This seasonal intermittency in
hydropower availability meant it was much more valuable when part of a diversified
portfolio of generation assets including coal fired generation which was available year
round. Coordination of several hydropower plants operated as a cascade (i.e. a series of
hydropower plants on the same river system where the discharge of one plant becomes
the inflow to another) could also be optimized to maximize the value of electricity
output. The ability of larger utility networks to integrate and effectively utilize relatively
low cost hydropower therefore also represented a significant advantage (Hausman &
Neufeld 2011).74
Hydropower offers a number of additional ancillary benefits that can improve system
stability when operated as part of a varied generation portfolio (Kumar et al 2011). With
the exception of run-of river plants, most hydropower plants have the capacity to store
water in an impoundment area behind a dam.75 Notwithstanding seasonal variability, this
means hydropower plants can effectively store power and to be used at peak times. What
is more, from a purely technical perspective, hydropower is particularly well suited to this
role as is can be brought on-line and off-line relatively quickly, plants can vary their
Michigan which was used to power arc lights for store fronts and a theatre in 1880 and at Niagara Falls which was used to power machinery at a flour mill as well as street lighting in 1881, and later as part of a long distance AC transmission line to supply load in Buffalo. 73 Severnini (2012) also claims that hydro’s cost advantage was maintained in the US until around 1950, when improvements in transmission technology and the thermal efficiency of coal fired plants lead meant it lost its advantage. It should be added, that each hydropower plant differs, it is also likely that the best, most accessible, cheapest hydropower sites had been used up by the 1950s. 74 The importance of long distance transmission technology for enabling the effective utilization of hydropower (which is frequently in remote locations away from load centres) is illustrated by the observation that in 1914 of the 25 highest voltage transmission lines outside the US 23 were servicing hydropower plants (Hausman et al 2008). It seems the potential benefits of hydropower were both an important factor in influencing the development of long distance transmission technology and also had influence on the development of regional grid systems. 75 The size of the reservoir impoundment and ‘live storage’ capacity varies considerably with the design of the dam. Run-of river hydropower plants typically have no impoundment, or very little live storage, whereas very large dams can have a storage capacity which represents a large proportion of annual in-flows.
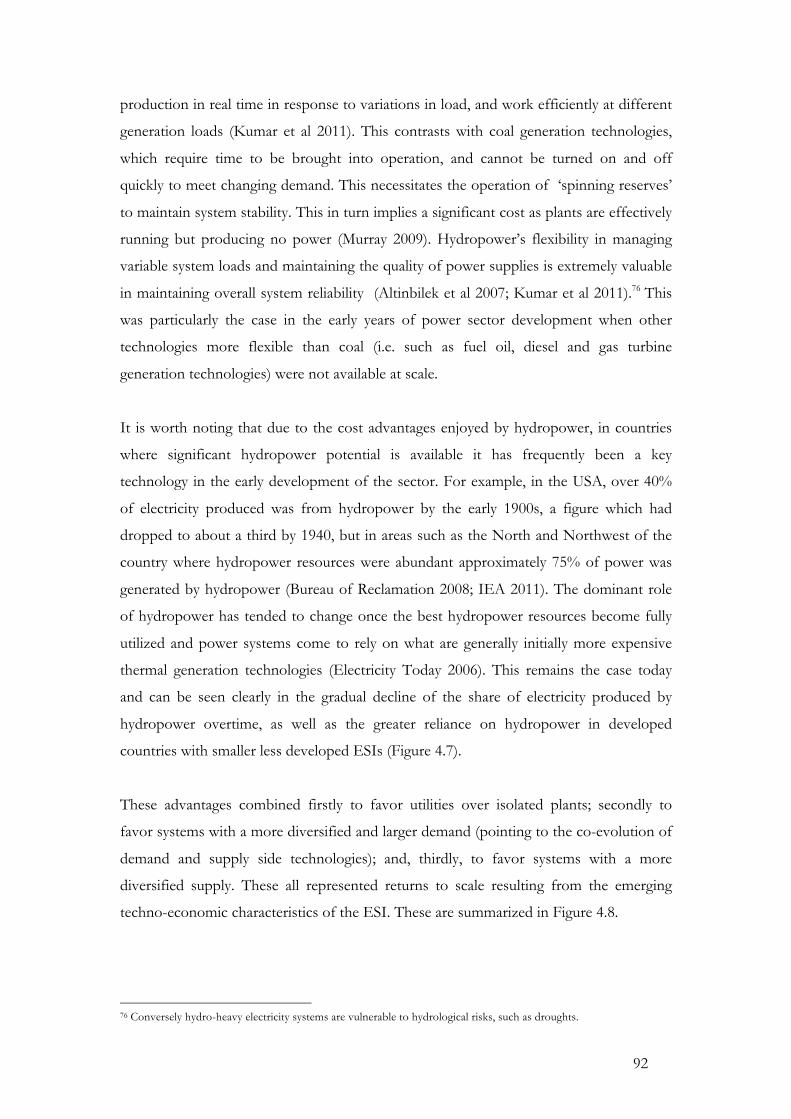
92
production in real time in response to variations in load, and work efficiently at different
generation loads (Kumar et al 2011). This contrasts with coal generation technologies,
which require time to be brought into operation, and cannot be turned on and off
quickly to meet changing demand. This necessitates the operation of ‘spinning reserves’
to maintain system stability. This in turn implies a significant cost as plants are effectively
running but producing no power (Murray 2009). Hydropower’s flexibility in managing
variable system loads and maintaining the quality of power supplies is extremely valuable
in maintaining overall system reliability (Altinbilek et al 2007; Kumar et al 2011).76 This
was particularly the case in the early years of power sector development when other
technologies more flexible than coal (i.e. such as fuel oil, diesel and gas turbine
generation technologies) were not available at scale.
It is worth noting that due to the cost advantages enjoyed by hydropower, in countries
where significant hydropower potential is available it has frequently been a key
technology in the early development of the sector. For example, in the USA, over 40%
of electricity produced was from hydropower by the early 1900s, a figure which had
dropped to about a third by 1940, but in areas such as the North and Northwest of the
country where hydropower resources were abundant approximately 75% of power was
generated by hydropower (Bureau of Reclamation 2008; IEA 2011). The dominant role
of hydropower has tended to change once the best hydropower resources become fully
utilized and power systems come to rely on what are generally initially more expensive
thermal generation technologies (Electricity Today 2006). This remains the case today
and can be seen clearly in the gradual decline of the share of electricity produced by
hydropower overtime, as well as the greater reliance on hydropower in developed
countries with smaller less developed ESIs (Figure 4.7).
These advantages combined firstly to favor utilities over isolated plants; secondly to
favor systems with a more diversified and larger demand (pointing to the co-evolution of
demand and supply side technologies); and, thirdly, to favor systems with a more
diversified supply. These all represented returns to scale resulting from the emerging
techno-economic characteristics of the ESI. These are summarized in Figure 4.8.
76 Conversely hydro-heavy electricity systems are vulnerable to hydrological risks, such as droughts.
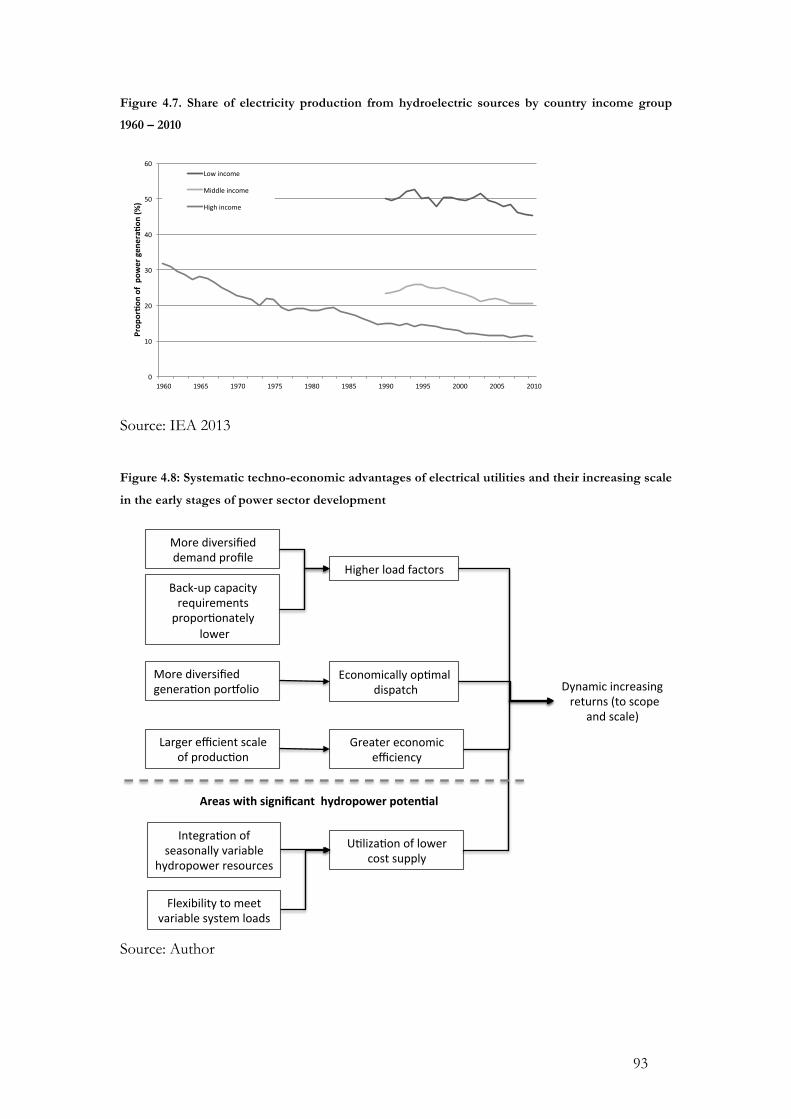
93
Figure 4.7. Share of electricity production from hydroelectric sources by country income group
1960 – 2010
Source: IEA 2013
Figure 4.8: Systematic techno-economic advantages of electrical utilities and their increasing scale
in the early stages of power sector development
Source: Author
0"
10"
20"
30"
40"
50"
60"
1960" 1965" 1970" 1975" 1980" 1985" 1990" 1995" 2000" 2005" 2010"
Prop
or%o
n'of''pow
er'gen
era%
on'(%
)'
Low"income"
Middle"income"
High"income"
Higher'load'factors'Back2up'capacity'requirements'propor9onately'
'lower'
More'diversified''demand'profile'
More'diversified''genera9on'por>olio'
Economically'op9mal''dispatch' Dynamic'increasing'
'returns'(to'scope''and'scale)'
Larger'efficient'scale'of'produc9on'
Greater'economic'efficiency'
Integra9on'of'seasonally'variable'
hydropower'resources'
U9liza9on'of'lower'cost'supply''
Areas&with&significant&&hydropower&poten3al&
Flexibility'to'meet'variable'system'loads'
94
The strength of increasing returns to the scope and scale of networks meant that systems
relatively rapidly converged towards what can be considered a dominant system design
(Chapter 2, section 2.2.3), which has since seen little fundamental change. 77 Until
relatively recently, significant technological changes in the ESI that have taken place
since the 1930s such as ever-larger coal-fired thermal and hydropower plants, higher-
capacity long-distance transmission technology, improvements in the management of
scheduling, dispatch and capacity expansion in large networks, and, in the 1950s, the
development of commercial nuclear power, have been technological changes along the
same technological trajectory and have continued to enhance these returns to scale and
as a consequence lock-in a dominant system design in the ESI.
Despite the dominance of techno-economic factors in determining the emergence of this
technological paradigm, as pointed out in Chapter 2, we should be cautious about
arriving at to overly reductive conclusions relating to the emergence of the paradigm.
Learning effects leading to improved technologies and falling costs also played a role in
the expansion of the system (Grubler 2004; Wilson 2012). As the historical scholarship
indicates evolving behavioral routines, in terms of emerging socio-cultural influences
added to the momentum of the developing techno-economic paradigm. This is illustrated
by the focus of R&D efforts, as well as the broader engineering approaches to the ESI.
As suggested by Dosi (1982) and Unruh (2000), this pattern of technological
development has likely been influenced by feedbacks between the technological
trajectory set in motion by these economies of scale and the process of defining the
research agenda.78 Hughes (1983) comments on the emergence of the technological form
of the large-scale regional utility towards the end of this period of intense innovation and
technological change:
“In the 1920s, however, engineers, managers and financiers realized that a technical form – the regional
system – had fulfilled inherent implications and could be considered conceptually mature. This realization
was manifested in engineers’ and managers’ conceptualization of underlying technical and economic
relationships; their deft identification of critical problems and efficacious solutions; and their introduction
of institutional forms that were suited to expansion; and their development of organized knowledge
77 Although as Kunneke (2008) notes we may now be on the verge of a significant change in these arrangements, discussed below. 78 Using Freeman and Perez’s (2000) taxonomy and from the point of view of incumbent fossil fuel and hydro based generation technologies, the development of nuclear technology may be regarded as a ‘radical technological change’, but from the point of view of the power system in general it represents only a incremental innovation. See the discussion of individual technologies below.
95
(science of technology) about regional power systems.” (Hughes 1983: 363)
Evidence suggests that other influences such as national security and fuel availability also
influenced R&D choices and consequent technological trajectories (e.g. on nuclear
technology see Cowan 1990; and on energy efficiency see Reddy 1991). These efforts did
not seek to fundamentally change the techno-economic paradigm, but essentially
concentrated on solutions within it. The technological trajectory and associated R&D
activity that took place within the power sector, is best understood using Dosi’s (1982)
characterization as ‘normal incremental problem solving’ within a technological regime, a
process from which non-disruptive technologies tend to emerge. As such, these
technological changes have acted to further consolidate the dominant design and, in
most cases, its organizational attributes.79
A further consideration is the co-development of a particular engineering ideology also
associated with the system design. Hughes (1976, 1983, 1987), Morton (2002), and
Hausman et al (2008) note that the emergence of an engineering ‘ideal’ acted to further
entrench the focus on achieving scale economies:
“…owing in part to the economies of scale made possible by building large power plants and transmitting
the resulting electricity over increasingly longer distances. Soon municipalities were linked into single
systems, then regions and states…[…]…the engineers who were making it possible were simultaneously
establishing a technological ideal of great importance - the goal of a single, unified system covering a huge region,
an entire nation, or perhaps someday a whole continent (or, indeed, the entire world). The obsession with
increasing scale dominated both the engineering effort and the publics’ debate over its results for the next
half century.”[emphasis added] (Morton 2002: 60)
These examples serve to illustrate the role non-technological, non-economic factors
likely played in adding to the momentum of the dominant system design, and the global
diffusion of the ESI. Indeed, engineering visions of large-scale electricity grids may
occasionally have outpaced the technological capacity to realize them, as seems to have
been the case with the Heinemann-Oliven project announced at the Second World
Power Conference in 1930. This proposed a regional high voltage grid in Europe,
stretching from Oslo in the north to Rome in the south, and from Lisbon in the west,
through Bucharest to Rostov in the east (Hausman et al 2008).
79 While nuclear power from an energy technology perspective could be classed as a radical technology, from the perspective of the ESI it did not affect the dominant design of the sector see Markard & Truffer (2006)
96
This techno-economic paradigm was not confined to the relatively developed parts of
the world, but was quickly spread globally through the transfer of technologies and
engineering know-how. Western engineering institutions trained cadres of engineers
from all over the world, leading to the rapid global propagation of these ideas (Hughes
1983; Coopersmith 1993). The dominant system design has been (and in many cases
continues to be) influential in the development of the power sector throughout the
world, with significant influence on the development of the sector in the former USSR,
Latin America, Asia and parts of Africa (Singer 1988; Coopersmith 1993; Williams, &
Dubash 2004; Yeh & Lewis 2004; Williams & Ghanadan 2006; Victor & Heller 2007;
Tafunell 2011). While economic growth and the associated expansion of the ESI was
slower to get going in these regions, the technological objective and the techno-
economic rationale guiding the development of the sector has been essentially the same.
4.2.2 Co-evolution of institutions: ownership and control of power systems
At the same time as the gradual emergence of the dominant system design, the
institutional arrangements of the ESI were evolving. The institutional corollary to the
technological ideal of the centralized regional grid was that of a state owned, or at least
very tightly regulated, vertically integrated monopoly. This was based upon
considerations relating to the likely depredations of monopolistic electricity suppliers,
issues relating to raising finance for the sector and the role of ESI in the provision of
public goods. These all represented considerations stemming from the basic
technological and economic characteristics of the sector. The rational response to these
issues was deemed to be one of state activism through direct ownership and tight
regulation of the ESI (e.g. see Jaccard 1995). A review of the historical development of
these institutional arrangements, however, shows them not to be a product of rational
design, but the outcome of complex historical processes in which political economy
considerations played an important role.
In the early years of ESI development in the USA and Europe, power utilities tended to
be privately owned and operated by relatively small companies operating in discrete
command areas, usually centered on an urban municipality or location of industrial
activity (e.g. a plantation, mine or close to a hydropower source). In much of the early
global expansion of the power sector through late nineteenth century and the early
decades of the twentieth century, this pattern was repeated, private companies and their

97
financial backers were the prime movers, electricity systems were often fragmented, with
separate utility networks of limited scope based close to large load centres (e.g. see Yeh
& Lewis 2004; Victor & Heller 2007; Clifton et al 2011; Hausman & Neufeld 2011;
Millward 2011a; Tafunell 2011).
At the same time more extensive regional transmission and distribution grids using ever-
larger generation technologies were emerging. These started to answer the technological
and economic imperatives of the increasingly dominant engineering paradigm. By the
1930s in Germany’s Ruhr valley, North Eastern USA, the USSR and Great Britain to
name a few, large scale grids were being developed interconnecting varied loads with a
range of generation sources over large areas (Hughes 1983a; Coopersmith 1993;
Hausman et al 2008). While the private sector still dominated electricity production, the
substantial capital requirements of the ESI (Table 4.1), especially in the early years of
expansion and transmission system development required the mobilization of financing
from a range of different sources.
The capital requirements of a rapidly expanding ESI necessitated a means of financial
intermediation that could act to pool and mobilise the kind of investment capital
needed.80 Specialist banking institutions and holding companies developed that were able
to draw on broad financial networks. These institutions were able to spread risks that
could be involved in providing finance to individual utilities, and their understanding of
the sector better placed them to assess investment risk in what were technically complex
undertakings. They were also better able to access capital markets than smaller
companies. In addition, they enjoyed advantages related to access to accumulated
technical expertise and management know-how, upon which smaller firms were unable
to draw (Chandler 1992; Chandler et al 1999; Hausman et al 2008). Public investment
was also important in some locations with municipalities, regional and national
governments engaged in ESI investment. This was particularly the case with the
development of transmission grids and large-scale power plants (such as the Tennessee
Valley Authority (TVA)) (Hausman et al 2008; Hausman & Neufeld 2011). Generally, the
pattern of ownership and control in the global ESI was extremely complex:
“Electric and gas utilities in the various countries have developed in a variety of ways. In some countries
80 Similar to the processes involved in latecomer catch-up suggested by Gerschenkron (1962) (see Annex A3).
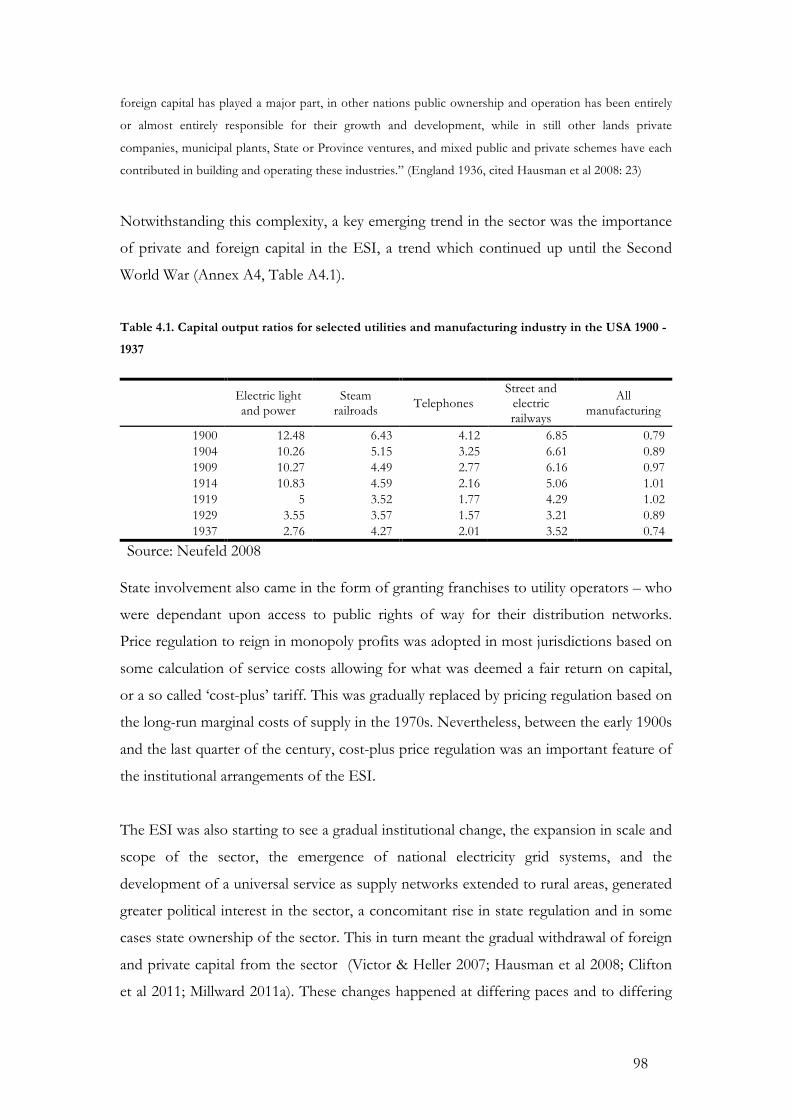
98
foreign capital has played a major part, in other nations public ownership and operation has been entirely
or almost entirely responsible for their growth and development, while in still other lands private
companies, municipal plants, State or Province ventures, and mixed public and private schemes have each
contributed in building and operating these industries.” (England 1936, cited Hausman et al 2008: 23)
Notwithstanding this complexity, a key emerging trend in the sector was the importance
of private and foreign capital in the ESI, a trend which continued up until the Second
World War (Annex A4, Table A4.1).
Table 4.1. Capital output ratios for selected utilities and manufacturing industry in the USA 1900 -
1937
Electric light and power
Steam railroads Telephones
Street and electric railways
All manufacturing
1900 12.48 6.43 4.12 6.85 0.79 1904 10.26 5.15 3.25 6.61 0.89 1909 10.27 4.49 2.77 6.16 0.97 1914 10.83 4.59 2.16 5.06 1.01 1919 5 3.52 1.77 4.29 1.02 1929 3.55 3.57 1.57 3.21 0.89 1937 2.76 4.27 2.01 3.52 0.74
Source: Neufeld 2008
State involvement also came in the form of granting franchises to utility operators – who
were dependant upon access to public rights of way for their distribution networks.
Price regulation to reign in monopoly profits was adopted in most jurisdictions based on
some calculation of service costs allowing for what was deemed a fair return on capital,
or a so called ‘cost-plus’ tariff. This was gradually replaced by pricing regulation based on
the long-run marginal costs of supply in the 1970s. Nevertheless, between the early 1900s
and the last quarter of the century, cost-plus price regulation was an important feature of
the institutional arrangements of the ESI.
The ESI was also starting to see a gradual institutional change, the expansion in scale and
scope of the sector, the emergence of national electricity grid systems, and the
development of a universal service as supply networks extended to rural areas, generated
greater political interest in the sector, a concomitant rise in state regulation and in some
cases state ownership of the sector. This in turn meant the gradual withdrawal of foreign
and private capital from the sector (Victor & Heller 2007; Hausman et al 2008; Clifton
et al 2011; Millward 2011a). These changes happened at differing paces and to differing
99
extents in different parts of the world, with public ownership of the ESI in continental
Europe taking off in the interwar years, and globally in the post war period. This
coincided with the view of an increased role for the state in mobilizing capital to enable
the realization of the ‘big-push’ externalities particularly associated with investment in
public infrastructure. By the 1970s, in practically all countries’ power sectors were
publicly owned monopolies, with the major exceptions of West Germany, Japan and the
USA – although even in these countries the sector was heavily regulated (Bacon 1995;
Gratwick & Eberhard 2008). In countries with sufficiently developed power sectors,
vertically integrated regional or national grids were the norm. In general, the role of
international finance had diminished and power sectors were domestically owned and
controlled (Annex A4, Table A4.1).
This shift in organization, ownership and control, while taking place in highly
idiosyncratic ways in different locations over the period, are typically explained in the
economics literature as a response to three salient techno-economic features of the
sector, i) its status as a natural monopoly; ii) the presence of significant transaction costs
associated with large sunk costs and slow turnover of capital stock in the sector; and, iii)
the provision of important public goods associated with managing a grid system and
operating power generation technologies (Jaccard 1995; Chao et al 2007).81
First, the power sector was generally regarded as a natural monopoly (Gratwick &
Eberhard 2008). As costs tended to decrease with the scale of production, it was cheaper
for one firm to supply electricity than two or more competing firms. Intuitively, duplicate
distribution networks and larger efficient scales of power generation (discussed in section
4.2.2 above) are lower cost than multiple distribution networks in one area and smaller
competing generators (Bacon 1995; Chao et al 2007). Complete control of the market
would in the first instance allow the generation of monopoly profits. Additionally,
because monopolistic firms do not face a competitive market for their goods, they are
potentially able to generate supranormal profits. The ability to engage in price
discrimination by charging higher rates to consumers with greater demand inelasticity,
allows monopolistic electricity providers to capture a greater share of consumer surplus
81 Jaccard (1995) mentions a range of other potential public goods (provision of employment, up-stream and down-stream linkages). These have not been included here as these are not directly associated with the essential technical and economic characteristics of the ESI, rather they are contingent, and frequently used as political and ideological arguments for state ownership and control. These ‘public goods’ are discussed below in greater detail, but as elaborations of political economy processes.

100
and generate greater profits. For example, monopolistic firms may supply electricity at
much higher tariffs to households than energy intensive firms. Households tend to
display low price elasticity of demand, where as energy intensive industries tend to be
sensitive to changes in the price of what is a key input.82 The justification for government
intervention in the sector in terms of ownership or regulatory control, is given by the
potential for electrical utilities to generate high levels of monopoly profits (or monopoly
rents) (Neufeld 1987; Jaccard 1995; Neufeld 2008).
Second, the cost structure facing an electricity utility means that it is particularly
vulnerable to transactional risks (Neufeld 2008; Hausman & Neufeld 2011). The
electricity sector is particularly capital intensive and capital in the electricity sector is
relatively long-lived.83 Because much of the capital is invested in transaction-specific
stock, for which there are limited alternative uses, there is a large difference between the
value of the stock realized as a consequence of use for its design purpose, and the next
most valuable use (Williamson 1985). Indeed, in many cases, the next best use for capital
stock in the power sector is as scrap metal. To guard against the risk of not being able to
sell their electricity, investors enter into long-term supply contracts. But, there is always
the possibility that the other contracting party may renege on the contract. Alternatively,
as the contact cannot possibly cover every eventuality, contractual arrangements are
likely to require periodic renegotiation, at this point the electricity purchaser is in a
stronger bargaining position and may seek more favorable terms. In both cases, the high
level of sunk costs means that once invested the owner of the capital stock stands at a
clear disadvantage in negotiations. The high level of capital intensity and the long-lived
nature of the capital stock compound this risk (Chao et al 2007; Hausman & Neufeld
2011).84 As a result the investor may be reluctant to undertake the investment in the first
place. Vertical integration of utilities can act to mitigate some of these risks as all
transactions within the sector would take place within a single firm. State ownership or
control of the sector could also effectively internalize these risks (Besant-Jones 2006).
Third, the power sector provides a number public goods, which would be difficult to
internalize into the costs of a privately owned and controlled firm, therefore justifying
82 For large scale industrial users it may also be feasible to switch energy supply away from electricity to other energy sources (e.g. in steel production). 83 According to recent EIA (2010) estimates between 25 – 80 years for generation assets. 84 This is closely related to the notion of the ‘obsolescing bargain’ discussed below.

101
public ownership and control (Jaccard 1995; Gratwick & Eberhard 2008).85 The narrow
public goods provided by the sector include the coordination of planning and ensuring
capacity requirements are met, maintenance of a plant mix by fuel and type reducing
energy security risks, and the need to fix responsibility for maintaining the security of the
system (Murray 2009). To this we may also a unified operational control of the systems
to ensure grid reliability and prevent cascading failures (Chao et al 2007).86
Jaccard (1995) points out that the public good rationale covers a broader range of
different arguments that have been deployed covering different characteristics of the
sector which have been important in different times and different places. Broader ‘public
goods’ include provision of employment in the ESI itself, employment in fuel and
equipment input providers, employment in sectors which receive subsidized electricity,
cross-subsidization of strategic or otherwise favored sectors, and cross-subsidization of
supply to rural locations and poor households.
These arguments offer a first-order rationale for, what was by the 1970s, almost
ubiquitous state ownership and control of the ESI globally.87 However, to portray the
ostensibly stable institutional arrangements that had emerged, as a rational response to
the considerations of monopoly, transaction costs or public goods is misleading. A
review of the historical literature on the development of the ESI shows that these
changes were not only, or even primarily, a prudential response of rational states, but the
outcome of often-complex political processes (Williams & Dubash 2004; Hausman et al
2008; Neufeld 2008; Hausman & Neufeld 2011; Millward 2011a; Millward 2011b).
Instead notions of efficiency and public good appear along-side the play of vested
interests, and geo-strategic considerations. Often they appeared as part of a justification
for government action, sometimes as window-dressing, sometimes as genuine ideological
commitment. Notions of public good were extremely broad and open to interpretation,
reflecting commitments to objectives such as employment generation, universal service,
energy security, modernization and economic growth. The gradual development of
monopolistic national utilities was uneven and contested, and illustrates the importance
of political economy dynamics in understanding the development of the sector. 85 Although these may not be ‘pure’ public goods in the textbook sense of goods, which are non-excludable and non-rivalrous, they do have public good attributes. 86 For example, in maintaining synchronized frequencies in different parts of the grid. 87 We look at how this rationale may have been succeeded by that of sector liberalization in section 4.2.5
102
4.2.3 Politics and the coevolution of institutions
In spite of the available returns to scale enjoyed by large networks, writers such as
Hughes (1976, 1983) and Hausman & Neufeld (2011) point out that the development of
large scale grids and interconnection of municipal utilities in the 1920s was often resisted
in the USA, Great Britain and Germany as they threatened vested political and economic
interests. For example, in the case of the proposed Giant Power project in Pennsylvania,
long distance transmission lines from mine-mouth plants threatened a range of interests.
These included municipal governments who would no longer be able to exercise the
degree of control they enjoyed over generator revenues and rail firms that were
threatened by the potential loss of custom from the transportation of coal from mines to
power generation plants (Hughes 1976). Another example is the ‘Superpower’ project
proposed in 1921 to develop an integrated system transmission grid system between
Boston and Washington. This promised a 40% reduction in total costs, but also
floundered in the face of opposition from utilities operating in the area who could not be
convinced that the benefits to them would outweigh their loss of control (Holland &
Neufeld 2009). In these cases, inertia emerging from the political economy context
slowed the realization of the engineering ideal and the formation of institutional
arrangements to facilitate that.
In 1930s Britain and the USA, state involvement in the power sector and the promotion
of larger regional grids was in part as a response to the exigencies of the Great
Depression (Hughes 1983; Hausman & Neufeld 2011). In the case of federal
government investment in hydropower in the USA such as the TVA and associated
developments, the ability of government to mobilize finance to cover the high upfront
costs of the generation plants and associated transmission lines, the public ownership of
land where these projects would be cited, and the significant public good of cheaper
electricity, rural electrification and industrial development in an economically depressed
region of the US provided significant justification for state intervention (Hughes 1983).
Even with this significant technical and economic advantages, public good rationale, and
federal backing, the development of these hydropower projects encountered significant
resistance from private utilities and parts of government hostile to federal government
103
involvement. Similarly, in Great Britain, the development of the National Grid despite its
technical and economic advantages also faced opposition from private ESI utilities and
was only enabled by the prevailing political climate during the depression (Hughes 1983).
Notwithstanding increased public investment in the ESI in the USA and Great Britain in
the interwar period, private sector generation utilities continued to dominate. This was in
contrast to the situation in continental Europe, where public ownership developed earlier
(Millward 2011). Again, the evidence points to the predominance of political concerns
related in this case to national security. Millward (2011; 2011a) suggests the actual
reasons for public ownership of utility industries in continental Europe up to 1939, were
related primarily to geo-strategic considerations of territorial integrity and industrial-
military capabilities amongst competing, geographically contiguous states:88
“….public ownership was not the prime instrument for dealing with natural monopolies and related
dimensions of market failure (for which arms’ length regulation was the most common instrument); nor
can its occurrence be found in government policies to avoid worker exploitation…[…]…public enterprise
was often an instrument for promoting social and political unification, securing national defense and
related strategic considerations, in some instances for promoting economic growth, with regulatory failures
and socialist pressures playing a more subsidiary and/or occasional role.” (Millward 2011b: 377)
Techno-economic and public good considerations did seem to get greater purchase when
the political environment was favorable. Such as in times of national security or
economic crises, or when in the interests of the nation state, private sector vested
interests could be more easily overridden. The paradigm example is perhaps the radical
upheavals caused by the Russian Revolution in October 1917 and subsequent civil war
which led to the opportunity for wholesale reform of the sector:
“Where Russia differed was the collapse of the old regime and its replacement by a new government
whose leadership viewed science and technology as essential components in their quest for a socialist
society. Only in revolutionary Russia, when the old tsarist power structure and techno structure had been
discredited and a revolutionary government explicitly desired to transform society, did the goals of large-
scale electrification and of the new political elites successfully converge” (Coopersmith 1993:14)
88 In contrast, as Yergin and Stanislaw (1998) point out, British military power was perceived as being dependent upon sea power, which motivated the public acquisition of a controlling stake British Petroleum, as oil was the energy resource seen as essential to maintain military supremacy.
104
In the case of the USSR, Coopersmith notes that the electrification plan was out of synch
with conventional economic logic, which may have favored a more incremental approach
to improving on existing supply arrangements and a greater concentration on large urban
load centres. But the engineering ideal of a large-scale centralized system, was aligned
with the new structure of political power. The New Economic Plan (adopted in 1921)
and subsequently the First Five Year Plan (1928 – 1932), with the objective of promoting
rapid industrialization had electrification at its heart (Dobb 1949; Coopersmith 1993).
The technocratic bent of socialism, the ideology of common ownership and
modernization, the strategic vision of industrialization and perceived need to bolster
military power, propelled wholesale reform of the ESI’s technological, economic and
institutional arrangements. Within the Soviet sphere of influence, this pattern of ESI
development was to have a lasting effect on the structure of the industry (Williams &
Dubash 2004).
Faith in the private sector as a means of achieving social well being had been shaken by
the Great Depression. The post war period (1945 – 1970s) was marked by an increased
state intervation and public ownership, and the withdrawal of private capital from the
ESI. The perception was that state control of the strategic ‘commanding heights of the
economy’ was justified by practical and ideological considerations. Yergin & Stanislaw’s
(1998) account of the rationale for nationalization of industries in the case of post war
Britain is illustrative:
“…that as private businesses, these industries had underinvested, been inefficient, and lacked scale. As
nationalized firms, they would mobilize resources and adapt new technologies, they would be far more
efficient, and they would ensure the achievement of the national objectives of economic development and
growth, full employment, and justice and equality. They would be the engine of the overall economy,
drawing it toward modernization and greater redistribution of income.” (Yergin & Stanislaw 1998:26)
Appeals were thus to technical considerations of efficiency and resource mobilization,
but also to the broader public goods of economic growth and modernization, and
considerations of social equity. Arguments relating to private monopolies seemed to play
a less important role. Again in this case, the dislocation of the political settlement caused
by the war and its aftermath, shifted the balance of political and economic power,
allowing institutional change in the ESI to take place. In other cases, despite the
disruption of war, ESI institutions remained relatively intact, and private regional utilities
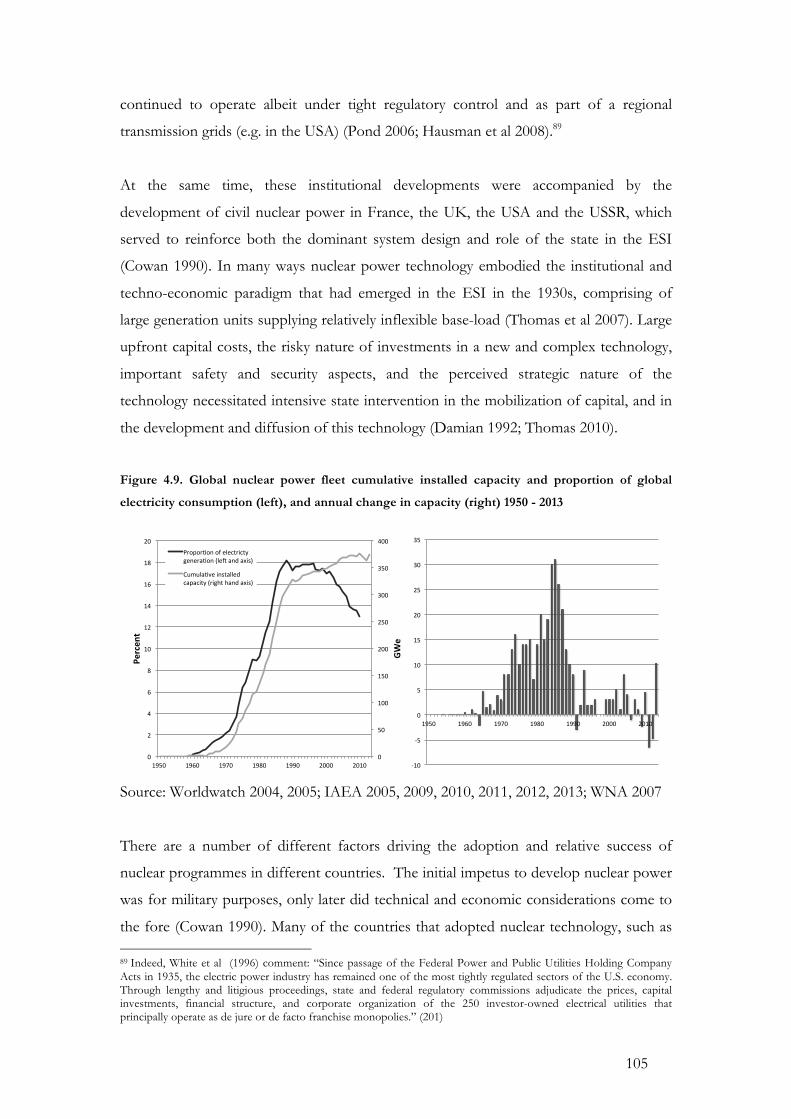
105
continued to operate albeit under tight regulatory control and as part of a regional
transmission grids (e.g. in the USA) (Pond 2006; Hausman et al 2008).89
At the same time, these institutional developments were accompanied by the
development of civil nuclear power in France, the UK, the USA and the USSR, which
served to reinforce both the dominant system design and role of the state in the ESI
(Cowan 1990). In many ways nuclear power technology embodied the institutional and
techno-economic paradigm that had emerged in the ESI in the 1930s, comprising of
large generation units supplying relatively inflexible base-load (Thomas et al 2007). Large
upfront capital costs, the risky nature of investments in a new and complex technology,
important safety and security aspects, and the perceived strategic nature of the
technology necessitated intensive state intervention in the mobilization of capital, and in
the development and diffusion of this technology (Damian 1992; Thomas 2010).
Figure 4.9. Global nuclear power fleet cumulative installed capacity and proportion of global
electricity consumption (left), and annual change in capacity (right) 1950 - 2013
Source: Worldwatch 2004, 2005; IAEA 2005, 2009, 2010, 2011, 2012, 2013; WNA 2007
There are a number of different factors driving the adoption and relative success of
nuclear programmes in different countries. The initial impetus to develop nuclear power
was for military purposes, only later did technical and economic considerations come to
the fore (Cowan 1990). Many of the countries that adopted nuclear technology, such as 89 Indeed, White et al (1996) comment: “Since passage of the Federal Power and Public Utilities Holding Company Acts in 1935, the electric power industry has remained one of the most tightly regulated sectors of the U.S. economy. Through lengthy and litigious proceedings, state and federal regulatory commissions adjudicate the prices, capital investments, financial structure, and corporate organization of the 250 investor-owned electrical utilities that principally operate as de jure or de facto franchise monopolies.” (201)
0"
50"
100"
150"
200"
250"
300"
350"
400"
0"
2"
4"
6"
8"
10"
12"
14"
16"
18"
20"
1950" 1960" 1970" 1980" 1990" 2000" 2010"
GWe$
Percen
t$
Propor0on"of"electricty"genera0on"(le<"and"axis)"
Cumula0ve"installed"capacity"(right"hand"axis)"
F10"
F5"
0"
5"
10"
15"
20"
25"
30"
35"
1950" 1960" 1970" 1980" 1990" 2000" 2010"
106
France, Korea and Japan had relatively limited domestic energy reserves and did so in
response to energy crisis of the 1970s (Kessides 2009). But the literature also points to
important socio-cultural and political differences in determining the degree to which this
technology was deployed in different countries. In France, a more fundamental belief in
the role of the state, close collaboration between government and the ESI, was influential
in determining the relative success of the nuclear program there. Similar points have
been made about Korea, Japan and latterly China. (Jasper 1992; Hadjilambrinos 2000;
Grubler 2010; Valentine & Sovacool 2010). In states with a less powerful central
government and poorer coordination between the ESI, technical experts and
government such as in Sweden, the UK and the US the nuclear industry fared less well
(Cowan 1990; Jasper 1992; Hadjilambrinos 2000; Thomas et al 2007).90
4.2.4 Development of the ESI in developing countries
It was only in the post war period that electricity demand growth really took-off in many
developing countries (Williams & Ghanadan 2006). This period in the developing world
saw state lead development of the ESI become the norm, this accompanied the process
of decolonization and the nationalization of strategic industries (Williams & Dubash
2004; Victor & Heller 2007). At the beginning of the period ESIs in many former
colonies were wholly or partly foreign owned (Annex A4, Table A4.1).91 Independence
brought a range of pressures on foreign owned and private utilities, which lead to their
withdrawal over a number of years. Although the details of each case were different, the
literature identifies a number of general trends that commonly characterized the process.
The arguments for state ownership in developing countries, like those proffered in the
industrialized world, drew on the rationale that the sector was a natural monopoly,
suffered from important investment risks that necessitated vertical integration and had a
number of important public good attributes. However, in the developing world these
considerations were articulated through different political processes than had been the
case in the development of public utilities in industrialized countries.
90 It should be added that the USA and UK probably suffered from being early adopters of nuclear technologies. By the time France started pursuing nuclear generation at scale reliability had improved significantly with capacity factors up from around 60% in the 1960s to 80-85% in the 1970s (Grubler 2010). 91 Although as Nellis & Kikera (1989) point out colonial administrations tended to be more ‘economically intrusive’ than they were at home, meaning that in many cases a president was already set for state involvement.
107
Firstly, there was a public perception that monopolistic electrical utilities had the
opportunity to generate a high level of profits from what was regarded as an essential
public service. Where these profits were generated for foreign shareholders this was
especially unpopular. This perception was also fueled by the lack of understanding of
ESI costs. A focus on operational costs, rather than the capital costs that utilities needed
to recoup, also lent to a sense that utility operators enjoyed excess profits (Hausman et al
2008; Victor & Heller 2007; Williams & Dubash 2004; Nellis 1989).
Secondly, state control of the sector, allowed the politicization of decisions, and the
channeling of resources to politically important groups. There was a realization of the
political benefits the provision of ‘public goods’ could afford, including subsidized
electricity supplies to favored sectors and the generation of employment from large
construction projects such as dams (Nellis & Kikeri 1989; Victor & Heller 2007). Thus
State control over the ESI had the potential to allow a politically expedient allocation of
resources.
Thirdly, political allocations aside, in general the strategic role of the ESI deemed was
important in promoting modernization and nation building, as described by Williams &
Dubash (2004):
“[The power sector] played an important role in national ideology, symbolizing a new type of social
compact between state and citizen. For post-colonial developing countries, electricity represented the good
life - well-illuminated homes and workplaces, modern factories and transportation, escape from the
drudgery of manual labour - that had been denied the majority of people in the first half of the twentieth
century. In propaganda and popular consciousness alike, images of a society with universal and affordable
electricity became important tropes for state-led development.” (Williams & Dubash 2004: 413)
From the perspective of investors the withdrawal of private and foreign capital had its
own particular dynamic. Private and foreign investment faced an increasingly hostile
environment. Alternative sources of capital became available for governments. The Cold
War fueled competition between Western and Soviet powers for influence in newly
independent states. Concessional loans and technical assistance were granted, frequently
for large ESI projects as a means to garner influence. At the same time, the belief at the
time in the efficacy of lending to address capital shortages to fund public utilities

108
influenced lending policy at donor institutions.92 The increasing unpopularity of foreign
and private sector ownership and increasing reluctance of foreign owned firms to invest,
coincided with declining requirements for foreign capital (Williams & Dubash 2004;
Hausman et al 2008). With adequate access to capital, governments did not perceive
foreign owned ESI utilities to be adding any value, and felt they had adequate trained
staff and technological know-how to manage the sector domestically. They thus came to
see private sector investments in terms of an obsolescing bargain. Without the perceived
need for foreign know-how, or technology transfer, the sunk capital costs of the ESI
meant that the bargaining power of foreign private investors was diminished
(Woodhouse 2006; Victor & Heller 2007).
In the face of tightening electricity price controls foreign firms were also forced to bear
exchange rate risks. The gaps between long-run and short-run marginal costs left a short-
term opportunity for the host government to appropriate these funds though price
controls, taxation or other means. In the long term, this led to declining service standards
as firms were reluctant or unable to replace worn out capital stock or expand generation
capacity to meet needs. Declines in service provision, for which utilities were blamed,
further added to political pressure upon them. Gradually increasing pressure made
foreign investment in ESIs unattractive. This was part of a wider process as nationalist
and socialist governments came to dominate in the developing world making conditions
unattractive for foreign investment (Nellis & Kikeri 1989). More attractive investment
opportunities existed elsewhere. Over a period of approximately one turnover of the
capital stock, foreign private sector investment had all but disappeared from developing
country ESIs (Harris 2003; Victor, & Heller 2007; Hausman et al 2008; Annex A4, Table
A4.1).
4.2.5 A universal techno-economic paradigm?
At this point it is worth noting three points salient to our more general argument. First,
techno-economic and (de jure) institutional outcomes are marked by a considerable degree
of uniformity. By the 1930s, the dominant system design of large-scale grids reaping
increasing returns to scale was becoming almost universal. Large positive feedbacks from
scale and scope efficiencies, learning externalities in terms of both manufacture of ESI
technologies and their operation in complex systems, their institutionalization, though
92 Influenced by the success of the Marshall Plan and influential writers such as Rostow.
109
bodies of scientific, engineering and managerial practice, and propagation through
schools of study and the development of specialist firms (electrical equipment
manufactures, utilities, holding companies and specialist banks). By contrast, the
relatively weak feedbacks and strong lock-in effects that characterize institutional and
political arrangements meant that a partial convergence on institutional arrangements for
the ESI was not reached until the 1960s and 1970s. Convergence was typically achieved
not as a result of rational policy choices but through external disruption of incumbent
institutional and political arrangements.93
Second, that convergence did take place is indicative of the fundamental technological and
economic characteristics of the ESI, which gave rise to significant returns to scope and scale,
these in turn lead to positive feedbacks to the dominant system design, and the
consequent emergence of the techno-economic paradigm. Conversely, the IRS also can
serve to explain the inertia facing the political and institutional arrangements in the
system. It is not only that feedbacks to political and institutional performance tend to be
weak, and especially so if performance is deemed adequate.94 But, that given large IRS
and resulting appropriable benefit streams, the political power accruing to a particular set
of institutional arrangements is likely to show inertia as the beneficiaries of those
arrangements seek to preserve their position using the wherewithal the appropriable
benefit streams entail. Thus inertia is likely to be large and convergence on institutional
forms that are better able to serve their purpose has been slow.
Thirdly, the purpose of the techno-economic paradigm is frequently subordinated to
political ends through the development of particular institutional arrangements. Positive
feedbacks to technological and economic performance may result in the emergence of
technological arrangements that are optimal. Similarly, the interests of those in a position
of power to ensure their position (which in most cases is maintained in virtue of public
consent), will in a large part depend upon the effective delivery (or the perception of
capacity to do such) of ‘public goods’. Given the central importance of the ESI in the
provision of these goods, it has generally been in the interests of those in power to
ensure adequate technical performance of the sector. The subordination of the sector to
93 For a discussion of the theory behind the notions of learning externalities, feedbacks and lock-in as regards technological, institutional and political systems see chapter 2. 94 In this regard the reader will recall we rejected the notion that people are optimizers, and instead adopted a characterization of them as only boundedly rational satisficers, see Chapter 2.
110
political ends therefore may also tend towards the adoption of performance enhancing
technologies and institutional arrangements in the longer term.
On the other hand, the political control of the sector could result in outcomes that are
dysfunctional from a welfare perspective, such as the favoring of particular interest
groups or technologies that served broader political purpose. The size and capital
intensity of the ESI gave ample room for machinations of just this sort – particularly in
developing countries where feedback in the form of rents or other benefits to those in
positions of power tended to be highly concentrated, and feedback to the performance
of those in power tended to be weaker. In section 4.2.6 we look at how political and
consequent macro-economic failings featured in the movement to reform the ESI in
developing countries.
Finally, the IRS enjoyed by the sector meant that negative feedbacks to sector performance
tended to be weak. Poor performance, in terms of the efficient use of resources and
delivery of least-cost service could be effectively hidden. The reduction in long-run
marginal costs in virtue of technological improvements and IRS swamped signals about
the efficiency of the ESI, which would otherwise have been passed on in consumer
prices or failures in service provision. Negative feedback would only be visible if the IRS
and technological improvements ran out, and performance underwent a marked
deterioration in terms of cost or service. Only then would political pressure for
performance improvement be likely to emerge. This is essentially what happened in
industrialized countries during the 1970s, and to which we turn next.
4.2.6 Dynamics of ESI liberalization in the industrialized world
By the middle of the 1970s, a number of important trends were starting to undermine
established institutional arrangements in the ESI’s of industrialized countries. These
included supply-side pressures, changes in generation technology, and perceived
shortcomings in institutional arrangements, as well as broader macro-economic and
political considerations. All this was underpinned by the emergence of a strong neo-
liberal ideological current, which endorsed a greater role for private ownership and
market allocation mechanisms throughout the economy and a concomitant withdrawal
of the state (e.g. see Önis & Senses 2005). These pressures lead to significant global
institutional change in the ESI led by reforms in the USA during the 1970s, Chile in the
111
1980s, and the UK in the 1990s. These changes in many ways set the global reform
agenda for the next 20 years as they were subsequently taken up by many developing
countries at the behest of the IMF, World Bank, and other multi-lateral and bi-lateral
donor institutions.
As with the emergence of the techno-economic and institutional paradigms that came to
dominate the ESI in the post war period, the dramatic changes in the ESI in the last
quarter of the twentieth century had important (if not entirely determinate) technological
precursors. The fundamental and systematic technological characteristics of the ESI and
their economic consequences had not really changed between the 1930s and the 1970s.
For the most part, the dominant system design driven by IRS of large centralized
generation plants, and regional or national transmission and distribution grids persisted.
Coal and hydropower generation technologies were still the predominant technologies,
with oil-fired generation important in some countries (Figure 4.10). ESI utilities were
publicly owned or tightly regulated regional monopolies operating on a cost-plus basis.
However, the technological and economic dynamics that had characterized the ESI were
changing. Stagnation in performance of scale technologies, the development and
deployment of nuclear power generation from the 1950s onward and the economic
implications of this, the emergence of smaller-scale efficient generation technologies, a
growing of awareness of environmental problems related to electricity generation
technologies and increasingly acute energy supply constraints, all served to undermine
the incumbent techno-economic paradigm, and lead eventually to profound institutional
change in the sector (Hausman & Neufeld 2011; Hirsch 1999, 2007; Williams & Dubash
2004; Jaccard 1995).95
95 The CCGT combines a gas turbine generating electricity, the exhaust gasses from which are used to heat water and drive a steam turbine which generates additional electrical power, hence a combined (gas and steam) cycle turbine, as opposed to an open cycle gas turbine (OCGT) which does not incorporate a steam cycle.
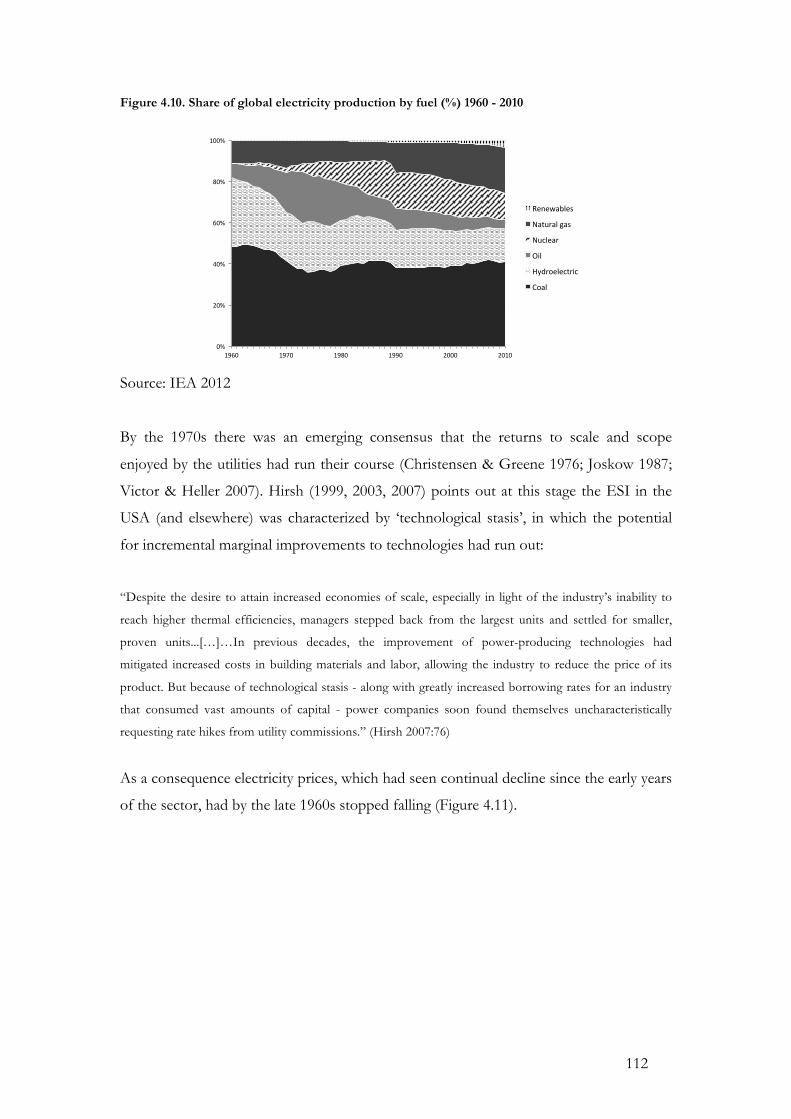
112
Figure 4.10. Share of global electricity production by fuel (%) 1960 - 2010
Source: IEA 2012
By the 1970s there was an emerging consensus that the returns to scale and scope
enjoyed by the utilities had run their course (Christensen & Greene 1976; Joskow 1987;
Victor & Heller 2007). Hirsh (1999, 2003, 2007) points out at this stage the ESI in the
USA (and elsewhere) was characterized by ‘technological stasis’, in which the potential
for incremental marginal improvements to technologies had run out:
“Despite the desire to attain increased economies of scale, especially in light of the industry’s inability to
reach higher thermal efficiencies, managers stepped back from the largest units and settled for smaller,
proven units...[…]…In previous decades, the improvement of power-producing technologies had
mitigated increased costs in building materials and labor, allowing the industry to reduce the price of its
product. But because of technological stasis - along with greatly increased borrowing rates for an industry
that consumed vast amounts of capital - power companies soon found themselves uncharacteristically
requesting rate hikes from utility commissions.” (Hirsh 2007:76)
As a consequence electricity prices, which had seen continual decline since the early years
of the sector, had by the late 1960s stopped falling (Figure 4.11).
0%#
20%#
40%#
60%#
80%#
100%#
1960# 1970# 1980# 1990# 2000# 2010#
Renewables#
Natural#gas#
Nuclear#
Oil#
Hydroelectric#
Coal#
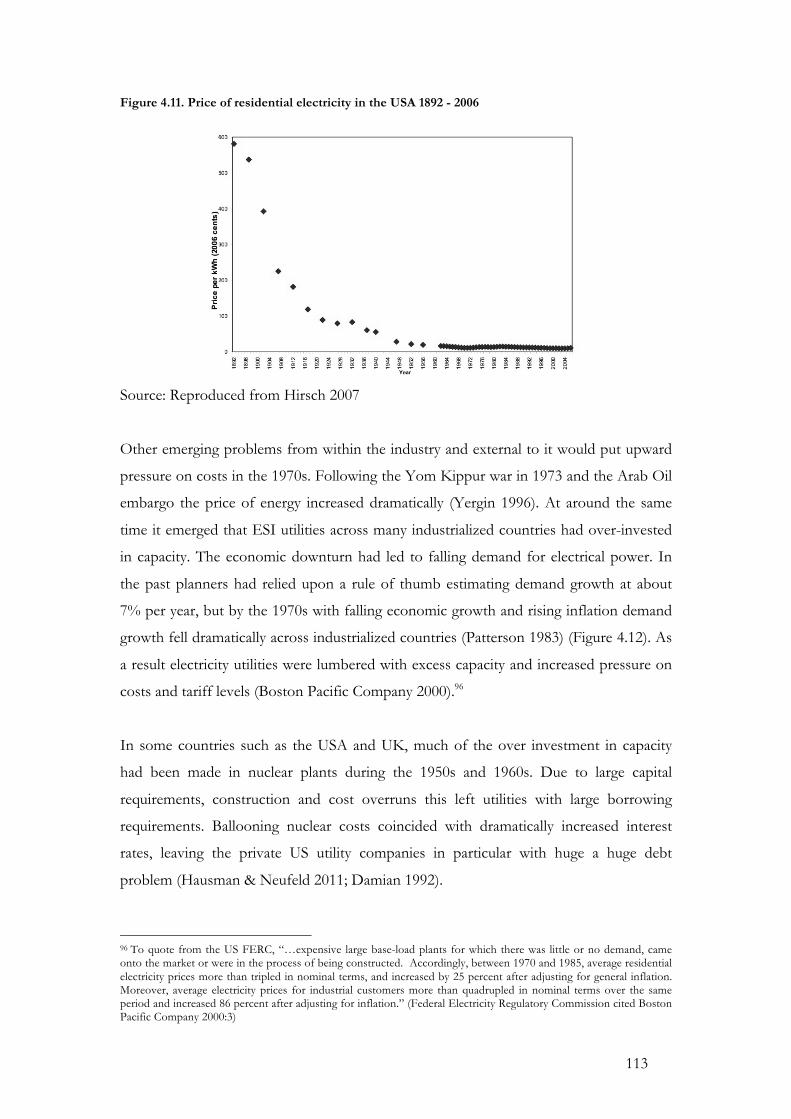
113
Figure 4.11. Price of residential electricity in the USA 1892 - 2006
Source: Reproduced from Hirsch 2007
Other emerging problems from within the industry and external to it would put upward
pressure on costs in the 1970s. Following the Yom Kippur war in 1973 and the Arab Oil
embargo the price of energy increased dramatically (Yergin 1996). At around the same
time it emerged that ESI utilities across many industrialized countries had over-invested
in capacity. The economic downturn had led to falling demand for electrical power. In
the past planners had relied upon a rule of thumb estimating demand growth at about
7% per year, but by the 1970s with falling economic growth and rising inflation demand
growth fell dramatically across industrialized countries (Patterson 1983) (Figure 4.12). As
a result electricity utilities were lumbered with excess capacity and increased pressure on
costs and tariff levels (Boston Pacific Company 2000).96
In some countries such as the USA and UK, much of the over investment in capacity
had been made in nuclear plants during the 1950s and 1960s. Due to large capital
requirements, construction and cost overruns this left utilities with large borrowing
requirements. Ballooning nuclear costs coincided with dramatically increased interest
rates, leaving the private US utility companies in particular with huge a huge debt
problem (Hausman & Neufeld 2011; Damian 1992).
96 To quote from the US FERC, “…expensive large base-load plants for which there was little or no demand, came onto the market or were in the process of being constructed. Accordingly, between 1970 and 1985, average residential electricity prices more than tripled in nominal terms, and increased by 25 percent after adjusting for general inflation. Moreover, average electricity prices for industrial customers more than quadrupled in nominal terms over the same period and increased 86 percent after adjusting for inflation.” (Federal Electricity Regulatory Commission cited Boston Pacific Company 2000:3)

114
Addtionally, during the 1960s and 1970s there was a rising awareness of the potential
environmental consequences of power generation. These included air pollution from
fossil fuel combustion at thermal plants, the risks associated with the uncontrolled
release of radioactive substances and the disposal of radioactive waste at nuclear plants,
and environmental costs associated with hydropower development, particularly to
fisheries (Jaccard 1995). Increasingly stringent environmental regulations for generators
meant greater capital and operational costs for environmental protection activities
(MacKerron 1992; WCD 2000; McNerney et al 2011).97
Finally, the oil embargo and energy crises of the 1970s focused policy-makers’ attention
on energy security concerns. The response to the energy crisis differed from country to
country with, for example, the pursuit of nuclear power in France, Japan and Korea, and
wind power in Denmark (Hadjilambrinos 2000; Kessides 2009; Valentine & Sovacool
2010). Energy efficiency also emerged as a key policy response, focus moved from least-
cost electricity provision, which had guided ESI policy, to least cost energy service
provision. This could also serve to undermine the dynamic of cost reductions through
expansion under-written by a guaranteed cost-plus tariff (Jaccard 1995).
Figure 4.12. Electricity consumption growth in OECD countries 1960 - 2010
Source: IEA 2012
Thus the technologies and consequent economic logic, which drove the expansion of the
ESI was confronted by technological limits to scale and significant cost pressures. There
97 While these technologies were probably marked by IRS in terms of efficiency and declining unit costs at larger scales, this was probably off-set to some extent by lower pollution control requirements for smaller generation plants.
!4#
!2#
0#
2#
4#
6#
8#
10#
1961# 1966# 1971# 1976# 1981# 1986# 1991# 1996# 2001# 2006#
Grow
th'(%
)'
Annual#consump5on#growth#
5#per.#Mov.#Avg.#(Annual#consump5on#growth)#
115
was the perception that the sector was underperforming. The cost-plus regulatory model
that had been in place since the 1930s was under threat. While it may have served the
sector well when IRS could yield both the expansion of supply and falling consumer
tariffs. Once IRS had been exhausted and demand growth slowed, institutional
arrangements had promoted over-investment in capacity (so-called ‘gold-plating’), and
investment in risky nuclear technologies. Cost-plus regulation and state ownership
essentially meant that the consumer would have to under-write these risks and pick up
the tab.98
At the same time technological advancements were leading to a decrease in the efficient
and economic scale of generation, meaning that other ways of organizing production in
the sector were becoming viable. In particular, the development of Combined Cycle Gas
Turbines (CCGTs) would prove influential in driving change in the sector, and further
destabilize the incumbent institutional arrangements. Through the 1970s and 1980s gas
fired electricity generation technologies, and in particular, CCGTs started to compete
with traditional coal-fired generation technologies (Islas 1997; Winskel 2002; Watson
2004). By the 1990s, with improvements in the technology, bringing increased reliability
and larger-scale generation units, the technology became able to compete with coal.
CCGT plants had a number of important advantages over other generation technologies
these included much higher thermal efficiencies (approximately 50% greater than other
fossil fuel plants), lower unit capital costs and limited civil works for projects which
meant the risk of construction (and cost) overruns was much lower, lower pollution
emissions than coal or other fossil fuels.99 CCGTs were more compact and could be
placed closer to load centres, and construction times were much shorter. CCGTs had a
smaller efficient size in terms of thermal performance, the optimal plant size in terms of
cost per unit-installed capacity was significantly lower than coal (Figure 4.13).100 After the
mid 1980s falling gas prices also made CCGT much more attractive, as did the
availability of North Sea gas in Europe and the prospect of Russian supplies of gas
98 It should be noted that by the 1970s marginal cost pricing was being used to some extent within publicly owned utilities in France and the UK. 99 CCGTs also have the advantage of being a technology that is relatively clean compared to other fossil fuels, coal producing practically no SOx and limited amounts of NOx, emissions of particulates and volatile organic compounds are similarly limited. CO2 emissions are also lower per Kwh than other fossil fuels, although at the time this was not an important consideration. 100 It should be noted that the development of CCGT benefited from R&D in the jet propulsion turbines for aircraft, existing use in the oil and gas industry for driving pipeline pumps, and the discovery of gas reserves both in the USA and Europe (notably the North Sea) (Islas 1997; Winskel 2002; Watson 2004).
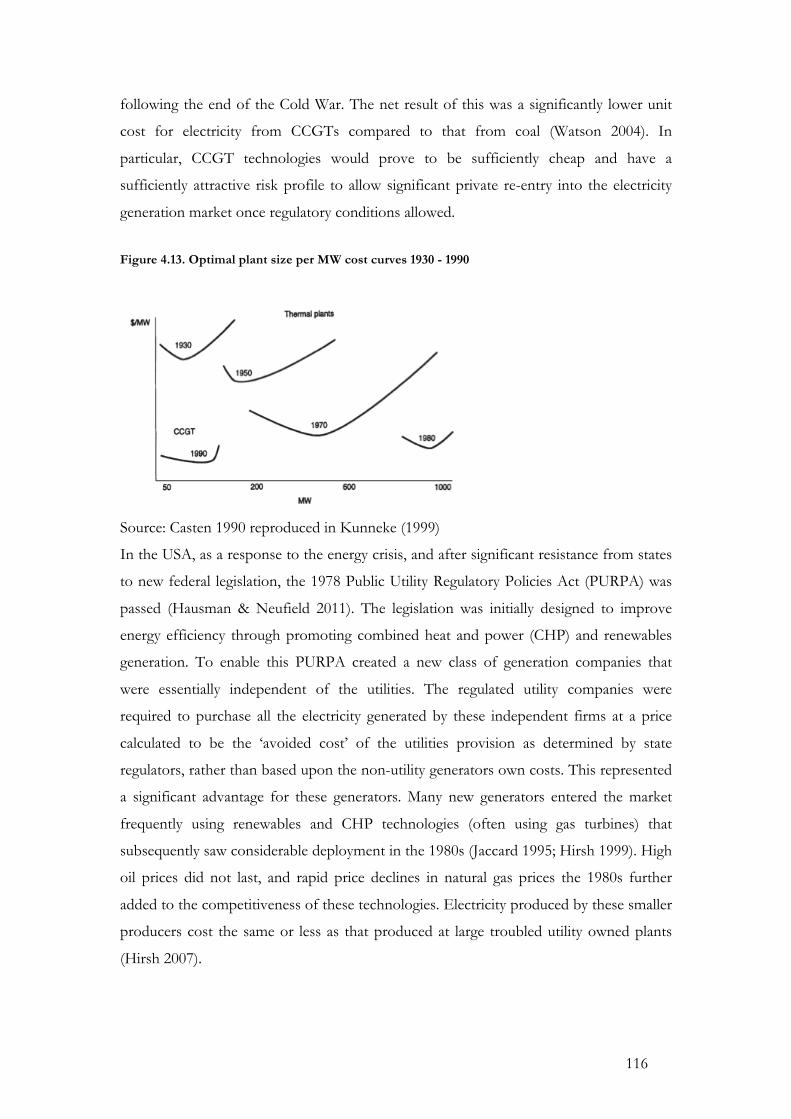
116
following the end of the Cold War. The net result of this was a significantly lower unit
cost for electricity from CCGTs compared to that from coal (Watson 2004). In
particular, CCGT technologies would prove to be sufficiently cheap and have a
sufficiently attractive risk profile to allow significant private re-entry into the electricity
generation market once regulatory conditions allowed.
Figure 4.13. Optimal plant size per MW cost curves 1930 - 1990
Source: Casten 1990 reproduced in Kunneke (1999)
In the USA, as a response to the energy crisis, and after significant resistance from states
to new federal legislation, the 1978 Public Utility Regulatory Policies Act (PURPA) was
passed (Hausman & Neufield 2011). The legislation was initially designed to improve
energy efficiency through promoting combined heat and power (CHP) and renewables
generation. To enable this PURPA created a new class of generation companies that
were essentially independent of the utilities. The regulated utility companies were
required to purchase all the electricity generated by these independent firms at a price
calculated to be the ‘avoided cost’ of the utilities provision as determined by state
regulators, rather than based upon the non-utility generators own costs. This represented
a significant advantage for these generators. Many new generators entered the market
frequently using renewables and CHP technologies (often using gas turbines) that
subsequently saw considerable deployment in the 1980s (Jaccard 1995; Hirsh 1999). High
oil prices did not last, and rapid price declines in natural gas prices the 1980s further
added to the competitiveness of these technologies. Electricity produced by these smaller
producers cost the same or less as that produced at large troubled utility owned plants
(Hirsh 2007).
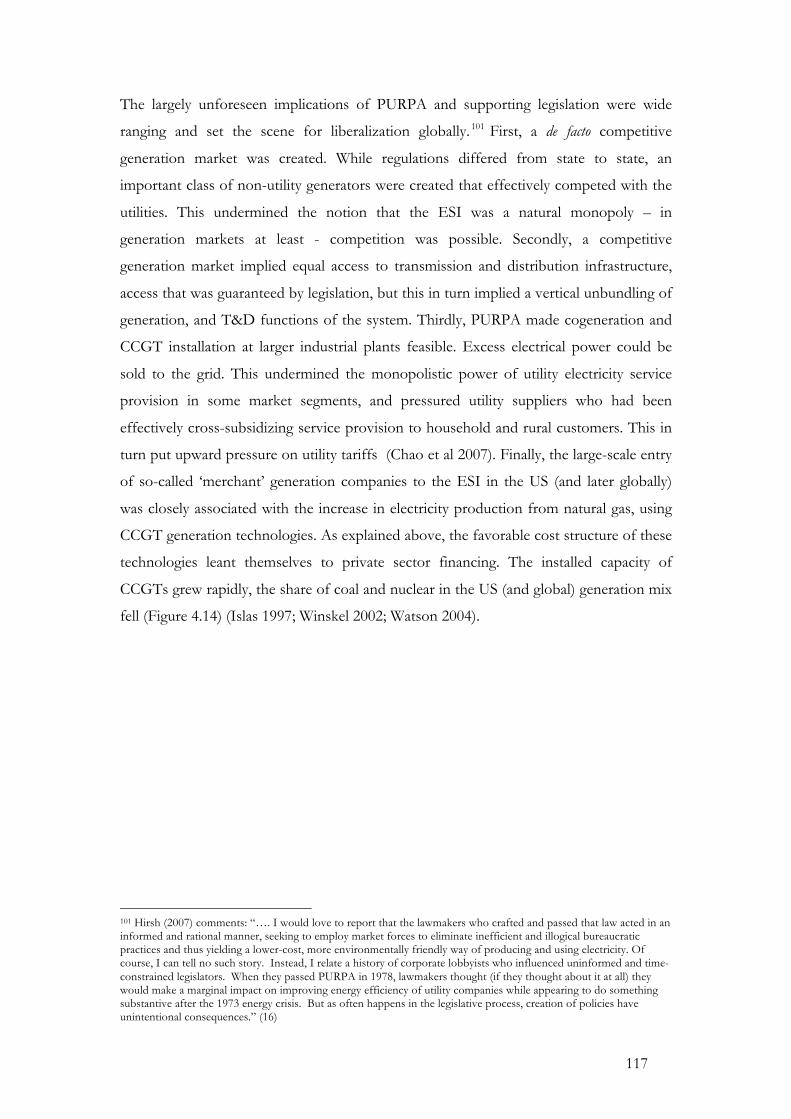
117
The largely unforeseen implications of PURPA and supporting legislation were wide
ranging and set the scene for liberalization globally. 101 First, a de facto competitive
generation market was created. While regulations differed from state to state, an
important class of non-utility generators were created that effectively competed with the
utilities. This undermined the notion that the ESI was a natural monopoly – in
generation markets at least - competition was possible. Secondly, a competitive
generation market implied equal access to transmission and distribution infrastructure,
access that was guaranteed by legislation, but this in turn implied a vertical unbundling of
generation, and T&D functions of the system. Thirdly, PURPA made cogeneration and
CCGT installation at larger industrial plants feasible. Excess electrical power could be
sold to the grid. This undermined the monopolistic power of utility electricity service
provision in some market segments, and pressured utility suppliers who had been
effectively cross-subsidizing service provision to household and rural customers. This in
turn put upward pressure on utility tariffs (Chao et al 2007). Finally, the large-scale entry
of so-called ‘merchant’ generation companies to the ESI in the US (and later globally)
was closely associated with the increase in electricity production from natural gas, using
CCGT generation technologies. As explained above, the favorable cost structure of these
technologies leant themselves to private sector financing. The installed capacity of
CCGTs grew rapidly, the share of coal and nuclear in the US (and global) generation mix
fell (Figure 4.14) (Islas 1997; Winskel 2002; Watson 2004).
101 Hirsh (2007) comments: “…. I would love to report that the lawmakers who crafted and passed that law acted in an informed and rational manner, seeking to employ market forces to eliminate inefficient and illogical bureaucratic practices and thus yielding a lower-cost, more environmentally friendly way of producing and using electricity. Of course, I can tell no such story. Instead, I relate a history of corporate lobbyists who influenced uninformed and time-constrained legislators. When they passed PURPA in 1978, lawmakers thought (if they thought about it at all) they would make a marginal impact on improving energy efficiency of utility companies while appearing to do something substantive after the 1973 energy crisis. But as often happens in the legislative process, creation of policies have unintentional consequences.” (16)
118
Figure 4.14. CCGT cumulative installed capacity and proportion of gas fired generation high-
income OECD countries102 1960-2010
Source: IEA 2012
Similar pressures were being felt throughout the industrialized world. The combination
of technological stasis, energy price increases and over investment in expensive
generation technologies placed the techno-economic paradigm and the institutional
structures it supported under pressure for reform. In some quarters, this also fed into
growing doubts about the broader role of the state in society in both industrialized and
developing countries.103
It was the radical restructuring of the ESI in the UK in the early 1990s that in many ways
set the global reform agenda. During the late 1970s and 1980s the sector showed many
of the problems that had come to be deemed typical of publicly owned ESI utilities,
according to Newbery & Pollitt (1997):
“The experience of this period [of public ownership from 1948 – 1990]…[…]…can be briefly summarised
as a classic example of a cost-of-service regulated public utility, with excessive capital costs, overdependence on high-
cost indigenous coal and nuclear power, a low rate of productivity growth, a low rate of return on assets, in
turn reflecting the inefficient balancing of interests of the coal miners, the industry itself, domestic voting
consumers, large industrial consumers, the Department of Energy, and the Treasury.” [emphasis added]
(Newbery & Pollitt 1997:275)
102 OECD countries excluding Mexico and Turkey. 103 See chapter 3.
0"
50"
100"
150"
200"
250"
300"
350"
400"
450"
0"
10"
20"
30"
40"
50"
60"
1960" 1965" 1970" 1975" 1980" 1985" 1990" 1995" 2000" 2005" 2010"
GWe$
Percen
t$$CCGT"cumula4ve"installed"capacity"(rightBhand"axis)"Genera4on"from"coal"(leGBhand"axis)"Genera4on"from"gas"(leGBhand"axis)"Genera4on"from"nuclear"(right"hand"axis)"
119
In the UK the pressure for institutional reform came from a perception of poor
performance. To this we can add that there was a real belief that privatization and
competition could reduce costs to the consumer by providing better incentives for more
efficient management and investment. Technology choice would not be decided in
response to broader public policy goals, but by the market. Privatization would also
provide significant receipts to the sate budget and cut the amount of subsidies paid by
government to the sector – generating greater fiscal space for politically popular tax
reductions. Finally, there was a perception that the ESI had been effectively subsidizing
the UK’s large coal industry through favorable long-term contracts. A privately owned
ESI would not be compelled to renew contracts on such favorable terms, and the power
of the coal mining unions would be reduced (Bacon 1995; Turnheim & Geels 2012).
The rationale and ideology of private ownership and liberalization of the sector
dovetailed neatly with political concerns to enhance electoral prospects through tax
reductions, and longer-term concerns with shifting the structure of power within the
national polity, in particular, in shifting power away from the powerful mining unions.
The reforms of the ESI in the USA, and at around the same time the wholesale reform
of the ESI in Chile during the late 1970s and 1980s were important in the formation of a
new institutional paradigm for the ESI. This was followed by reforms in the 1990s by
England and Wales, Norway, Australia, and elsewhere (Besant-Jones 2006). Putting the
broader ideological and political goals to one side, the stated economic goal of
restructuring the ESI in industrialized countries was to realize sufficient competition to
ensure the efficient allocation of resources in the sector given binding constraints relating
to system reliability, energy security, universal service provision and environmental
requirements (Murray 2009).
Reform typically involved a number of discrete steps, starting with privatization of the
sector and then the incrementally introduction of competition to different parts of the
sector. Typically the reform steps proceeded as follows, i) corporatization of the utility
and creation of an independent regulator (if one was not already in existence); ii)
unbundling the different parts of the electricity supply chain (generation, transmission,
distribution and retail) into functionally separate units; iii) splitting up generation into
competing blocks and allowing entry by other providers; and, iv) creation of an
independent system operator (Gratwick & Eberhard 2008; Murray 2009). These steps
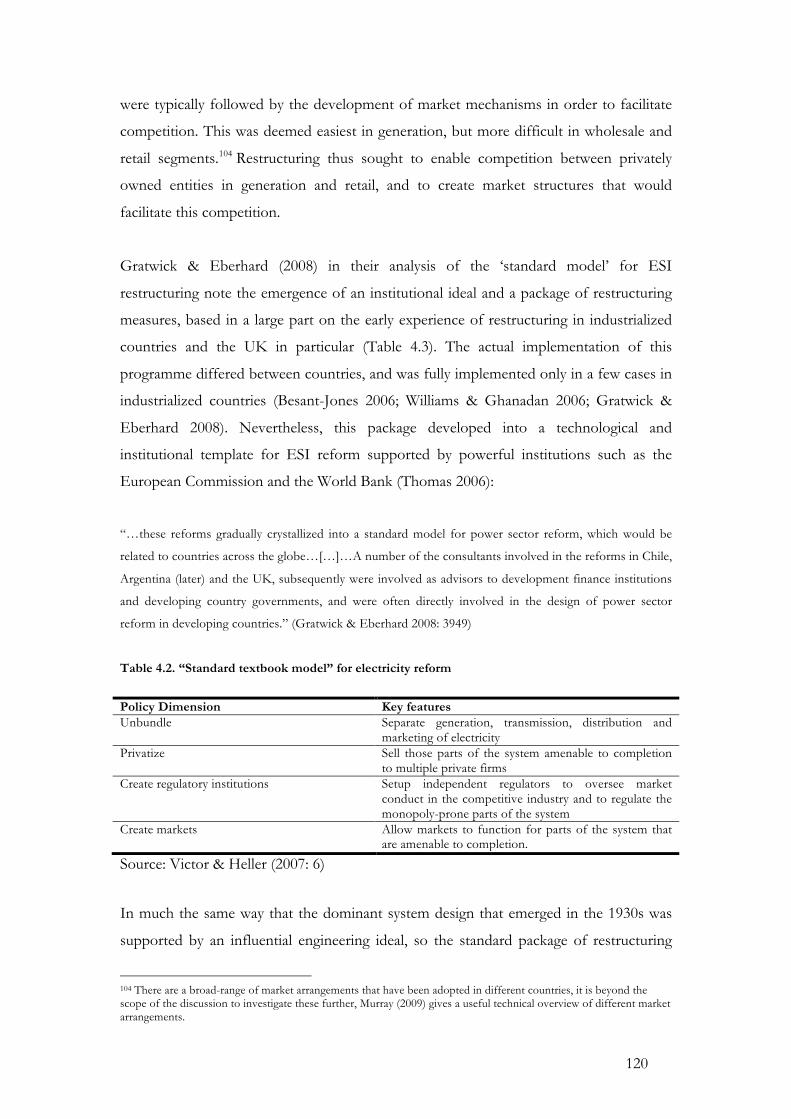
120
were typically followed by the development of market mechanisms in order to facilitate
competition. This was deemed easiest in generation, but more difficult in wholesale and
retail segments.104 Restructuring thus sought to enable competition between privately
owned entities in generation and retail, and to create market structures that would
facilitate this competition.
Gratwick & Eberhard (2008) in their analysis of the ‘standard model’ for ESI
restructuring note the emergence of an institutional ideal and a package of restructuring
measures, based in a large part on the early experience of restructuring in industrialized
countries and the UK in particular (Table 4.3). The actual implementation of this
programme differed between countries, and was fully implemented only in a few cases in
industrialized countries (Besant-Jones 2006; Williams & Ghanadan 2006; Gratwick &
Eberhard 2008). Nevertheless, this package developed into a technological and
institutional template for ESI reform supported by powerful institutions such as the
European Commission and the World Bank (Thomas 2006):
“…these reforms gradually crystallized into a standard model for power sector reform, which would be
related to countries across the globe…[…]…A number of the consultants involved in the reforms in Chile,
Argentina (later) and the UK, subsequently were involved as advisors to development finance institutions
and developing country governments, and were often directly involved in the design of power sector
reform in developing countries.” (Gratwick & Eberhard 2008: 3949)
Table 4.2. “Standard textbook model” for electricity reform
Policy Dimension Key features Unbundle Separate generation, transmission, distribution and
marketing of electricity Privatize Sell those parts of the system amenable to completion
to multiple private firms Create regulatory institutions Setup independent regulators to oversee market
conduct in the competitive industry and to regulate the monopoly-prone parts of the system
Create markets Allow markets to function for parts of the system that are amenable to completion.
Source: Victor & Heller (2007: 6)
In much the same way that the dominant system design that emerged in the 1930s was
supported by an influential engineering ideal, so the standard package of restructuring
104 There are a broad-range of market arrangements that have been adopted in different countries, it is beyond the scope of the discussion to investigate these further, Murray (2009) gives a useful technical overview of different market arrangements.
121
reforms and its technological implications that emerged in the 1990s has been promoted
and underwritten by an important body of economic and institutional theory - supported
by groups of specialized practitioners – as well as its relationship to the broader neo-
liberal program of economic reforms that dominated policy making at the time (Williams
& Dubash 2004; Thomas 2006).
4.2.7 Dynamics of ESI liberalization in developing countries
Institutional changes happening in the industrialized world had far reaching implications
for the development of the global industry. The standard model of institutional reform
was promoted in response to the emergence of increasingly acute problems with the ESI
in developing countries coupled with more general macro-economic problems. By the
end of the 1980s it was widely recognized that the ESIs in developing countries faced a
number of increasingly acute problems (Williams & Ghanadan 2006; Victor & Heller
2007; Gratwick & Eberhard 2008; Tan 2011):
“Notwithstanding the alleged advantages of the pre-reform structures, from the early 1990s [developing]
countries have been experiencing power shortages and frequent interruptions. Their power generating
plants emit toxic pollutants, their power utilities are bankrupt, their power tariffs do not cover costs
(particularly for residential users), electricity is widely stolen by customers (frequently with the active
support of existing employees), many citizens - especially those in rural areas - lack access to electricity
supply, and the power sector drains the government’s fiscal resources.” (Besant-Jones 2006:10)
Many ESIs were caught in a downward spiral of falling revenues and under-investment
leading to poor technical performance, which again put pressure on revenues (Jhirad
1990). Gratwick & Eberhard (2008) catalogue a long list of performance failings typical
of developing country ESIs at the time, including high transmission and distribution
(T&D) losses, low average load factors, very low self-financing ratios, low and falling
rates of return, low worker productivity (and over employment), and low levels of
electricity access and consumption. Kessides (2005) stresses the problems faced by ESI
monopolies in developing countries were a result of underinvestment caused by failure to
set tariffs at levels which reflected costs, particularly during periods of high inflation.
During the 1980s tariff increases failed to keep pace with cost increases leading to severe
capital shortages at ESI utilities (Dunkerley 1995). The capital requirements for the
expanding ESI were large. Jhirad (1990) estimated that during the 1990s more than one
trillion 1990 US dollars would be needed for ESI investment. Loans for ESI investment
122
during the 1980s accounted for around 25% of public sector foreign debt in developing
countries, and as high as 50% of debt in some (Jhirad 1990). The exact problems of the
sector varied from country to country, but there was a perception that reforms to
improve the performance of the sector were needed.
From the perspective of IFIs, their involvement in developing country ESIs was also
problematic. The experience of the World Bank in particular in lending for the power
sector during the 1970s and 1980s was poor, projects often under performed, financial
and environmental performance were particular areas of concern (Wamukonya 2003).
These performance concerns were compounded from the 1980s onwards, by the
awareness that IFI resources would not be sufficient to cover the large investment needs
in developing countries for rapidly expanding ESIs.
As is often the case, the opportunity for reform emerged out of a destabilizing macro-
economic crisis. Global macro-economic conditions had deteriorated as a result of the
energy crises and ensuing economic stagnation of the 1970s. By the 1980s many
countries were mired in unsustainable foreign debt, budget deficits and high inflation.
Developing countries were encouraged to engage in programmes of structural
adjustment, opening capital accounts to encourage foreign investment and fiscal austerity
reducing government spending (Önis & Senses 2005; Adam & Dercon 2009; Booth
2011). A second round of reforms in the 1990s sponsored by the World Bank and the
IMF, promoted neoliberal Washington Consensus economic policies. In need of capital
and offering potential for commercialization and revenue generation the ESI was seen as
a prime candidate for institutional reform based upon what was regarded as the
successful experience of ESI reforms in Chile and the UK (Williams & Ghanadan 2006).
By the early 1990s the World Bank made funding to the power sector contingent upon
government commitment to ESI reform, including the introduction of competition and
enabling private sector participation. Other IFIs followed, including the IMF, ADB and
AfDB, which also promoted liberalisation (Williams & Ghanadan 2006; Gratwick &
Eberhard 2008).
While IFIs and the World Bank in particular were instrumental in promoting and
designing reforms (Wamukonya 2003), it is inaccurate to suggest that developing
countries were simply in thrall to the IFIs as some writers seem to suggest (e.g. Thomas
123
2006). In fact, developing country governments were often keen to comply. Reform of
the sector offered the opportunity to attract inward investment into a strategic and
politically important sector and remove a significant burden from state budgets (Williams
& Ghanadan 2006; Gratwick & Eberhard 2008). The poor performance of the ESI and
the perception of high levels of corruption were also a source of widespread political
dissatisfaction (Wamukonya 2003). Williams & Dubash (2004) also note that in a number
of countries ESI reform was part of a political process as military leaders were replaced
by a more democratic polity, the emerging business elites saw reform as a way of
breaking-down their political power and the networks of patronage upon which it was
based (such as in Argentina, Korea, Thailand and Taiwan) (see also Chapter 3, section
3.2.3). There was also the argument that investment by foreign firms would be a key
conduit for technology transfer, bringing up-to-date technologies know-how,
management practices and financial skills thereby improving the performance of the
sector (Besant-Jones 2006; Hausman et al 2008).
Finally, it should be added that many industrialized countries had a vested interest in
promoting reforms. They saw an opportunity for their newly independent and aquisative
ESI companies in pursuing investment opportunities in emerging markets. Liberalisation
in developing countries could also provide opportunities for a coterie of international
consultants, lawyers and project financiers, to generate valuable business (Williams &
Dubash 2004; Nepal & Jamasb 2011).
Reform of developing country ESIs took-off relatively rapidly in the 1990s, and by 1998
figures show that a large proportion of developing countries had undertaken a number of
steps derived from the ‘standard model’ (Table 4.4). Reviews of ESI reforms conduced
by Estache & Goicoechea (2005) and Besant-Jones (2006), also illustrate the continuing
implementation of reforms (see Table A4.1 in data annex). The geographical distribution
of reforms was uneven, with Latin America and the Caribbean seeing highest number of
countries undertaking the most wide ranging reform efforts and with Sub-Saharan Africa
seeing the lowest level of reform.105 Many countries underwent at least some reforms,
with the corporatization of utilities and the entry of independent power producers
(IPPs), being particularly common. On the other hand, Besant-Jones (2006) notes that by
2006 only 20 countries had introduced wholesale competition (i.e. for distributors and 105 Gratwick & Eberhard (2008) note that in some countries low income countries with small power sectors are generally constrained in their ability to adopt reforms.
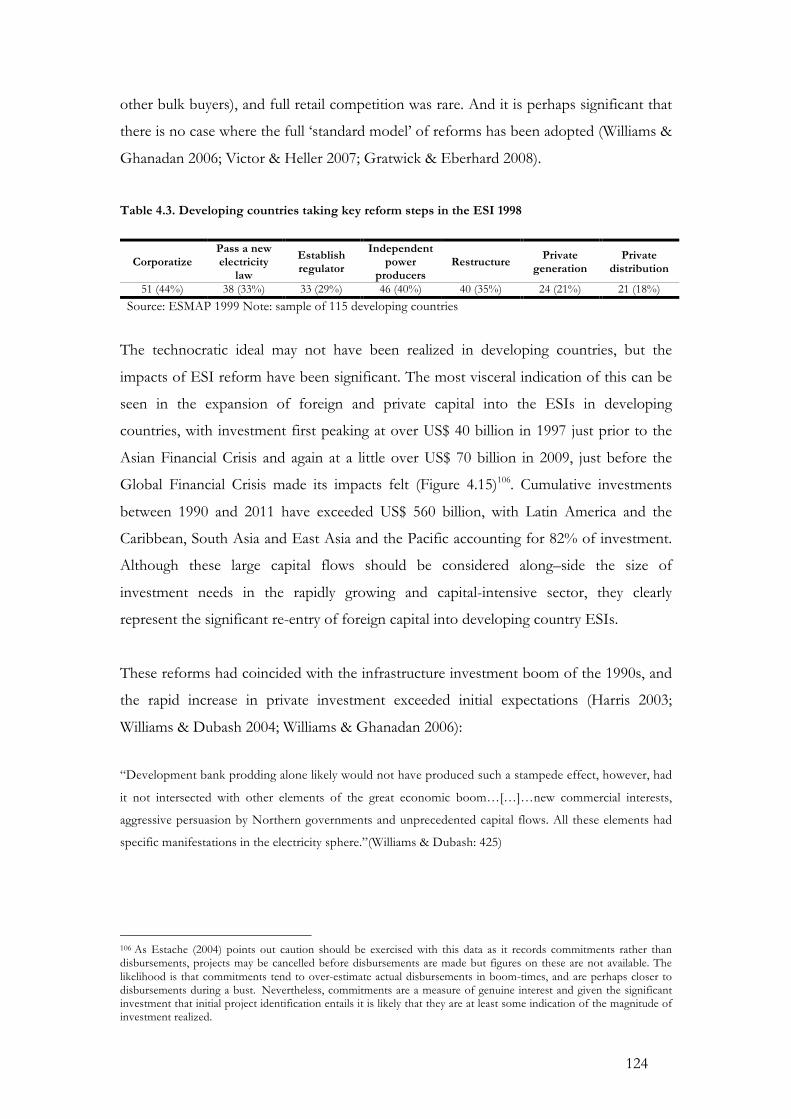
124
other bulk buyers), and full retail competition was rare. And it is perhaps significant that
there is no case where the full ‘standard model’ of reforms has been adopted (Williams &
Ghanadan 2006; Victor & Heller 2007; Gratwick & Eberhard 2008).
Table 4.3. Developing countries taking key reform steps in the ESI 1998
Corporatize Pass a new electricity
law
Establish regulator
Independent power
producers Restructure Private
generation Private
distribution
51 (44%) 38 (33%) 33 (29%) 46 (40%) 40 (35%) 24 (21%) 21 (18%)
Source: ESMAP 1999 Note: sample of 115 developing countries
The technocratic ideal may not have been realized in developing countries, but the
impacts of ESI reform have been significant. The most visceral indication of this can be
seen in the expansion of foreign and private capital into the ESIs in developing
countries, with investment first peaking at over US$ 40 billion in 1997 just prior to the
Asian Financial Crisis and again at a little over US$ 70 billion in 2009, just before the
Global Financial Crisis made its impacts felt (Figure 4.15)106. Cumulative investments
between 1990 and 2011 have exceeded US$ 560 billion, with Latin America and the
Caribbean, South Asia and East Asia and the Pacific accounting for 82% of investment.
Although these large capital flows should be considered along–side the size of
investment needs in the rapidly growing and capital-intensive sector, they clearly
represent the significant re-entry of foreign capital into developing country ESIs.
These reforms had coincided with the infrastructure investment boom of the 1990s, and
the rapid increase in private investment exceeded initial expectations (Harris 2003;
Williams & Dubash 2004; Williams & Ghanadan 2006):
“Development bank prodding alone likely would not have produced such a stampede effect, however, had
it not intersected with other elements of the great economic boom…[…]…new commercial interests,
aggressive persuasion by Northern governments and unprecedented capital flows. All these elements had
specific manifestations in the electricity sphere.”(Williams & Dubash: 425)
106 As Estache (2004) points out caution should be exercised with this data as it records commitments rather than disbursements, projects may be cancelled before disbursements are made but figures on these are not available. The likelihood is that commitments tend to over-estimate actual disbursements in boom-times, and are perhaps closer to disbursements during a bust. Nevertheless, commitments are a measure of genuine interest and given the significant investment that initial project identification entails it is likely that they are at least some indication of the magnitude of investment realized.

125
Similar to the first round of global electrification at the beginning of the twentieth
century, freer international capital flows, coupled with an opportunity to invest - enabled
by (albeit) partial ESI reforms – allowed the capital needs of expanding ESIs to forcefully
reassert themselves. With this private transnational corporations (TNCs) active in the
ESI have re-emerged as important players (Annex A4, Table A4.3).107 The emergence of
large TNCs specializing in electricity supply technologies and utilities as a result of
liberalization of the ESIs in their home markets, particularly in Europe stands out
(Hausman et al 2008; UNCTAD 2008; Kolk et al 2013).108 The net result of this, Estache
(2004) estimates, was that by about 2000, private sector investment had replaced the
traditionally dominant ODA as the main source of infrastructure funding in developing
countries.
Figure 4.15. Private sector involvement in electricity infrastructure in low and middle-income
countries 1990 – 2011 (left) and cumulative (right)
Source: World Bank & PPIAF 2013 Note: SSA – Sub-Saharan Africa; MENA – Middle-East and North
Africa; ECA – Europe and Central Asia; SA – South Asia; LAC – Latin America and the Caribbean; EAP
– East Asia and Pacific.
The structural implications of the influx of private capital and foreign TNCs to the sector
varied between countries and regions. Much of the private sector involvement in Latin
America and Eastern Europe was driven by divestiture of assets as Argentina and later
Brazil privatized their relatively well-developed ESIs. In South and East Asia greenfield
investment to meet rapidly expanding demand was more common. Most of this
investment has been in generation, through independent power producers, with relatively
little investment in the politically more sensitive and financially less rewarding areas of 107 While most of this investment has been through M&A activity in industrialized countries, these firms have also have significant investments in developing country ESIs. 108 Although companies from the USA, Japan and Hong Kong have also been important.
0"
10"
20"
30"
40"
50"
60"
70"
80"
1990" 1995" 2000" 2005" 2010"
Billion
&USD
&(nom
inal)&
SSA" SA"MENA" LAC"ECA" EAP" 22%&
14%&
35%&
2%&
25%&
2%&
126
transmission or distribution (Figure 4.16) (Williams & Ghanadan 2006; Victor & Heller
2007).
Reform in developing countries, while falling well short of the ideal of the ‘standard
model,’ has resulted in large-scale re-entry of private capital into the sector, mainly in the
form of independent power producers (IPPs) in the generation market. But reforms have
not really achieved their initial intentions of introducing the rigors of competition-
induced market-discipline to investment choice and utility operations (Thomas 2006;
Williams & Ghanadan 2006; Victor & Heller 2007):
“It is now evident that implementing sustainable market-oriented electricity reforms is more complex than
initially anticipated. Even reforms in developed countries, have led to some unanticipated problems and
unintended consequences. Developing countries have had to reform technically and financially less
efficient systems with less developed private sectors, weaker economic and political institutions, and less
regulatory experience and skilled human resources.” ( Jamasb 2006: 25)
By the mid 2000s reform in developing countries was perceived as having stalled.
Investment had dropped dramatically from a peak before the Asian Financial Crisis
(Figure 4.16) TNCs withdrew from a slew of overseas investments. Most famously, AES
which withdrew from large investments in the UK after taking heavy losses, as well as
investments in India (Orissa), Georgia (Tiblisi), Brazil, Khazakstan and the Bujugalie dam
in Uganda (Hall 2005; Thomas 2006; Victor & Heller 2007; Hausman et al 2007;
Woodhouse 2006). The French utility GDF Suez announced a reduction in investment
in developing countries by one third in 2003. In general, it was felt that the ESI in
developing countries had not lived up to its promise of high returns on investment, with
a 2003 World Bank survey finding that interest in developing country power sectors had
declined dramatically. Reasons given by investors for this reversal included inadequate
tariff levels, poor payment enforcement, weak legal foundations for contracts and
regulatory frameworks, and political interference (Williams & Ghanadan 2006).
The failure of the ‘standard model’ to take root in developing countries is generally
regarded by the proponents of liberalization as a failure of the process to take adequate
account of the broader institutional and related political context for reform. The
fundamental problems facing the ESI in developing countries were deemed to rest on
the same failings regarded as intrinsic to publicly owned utilities, i.e. they lacked adequate
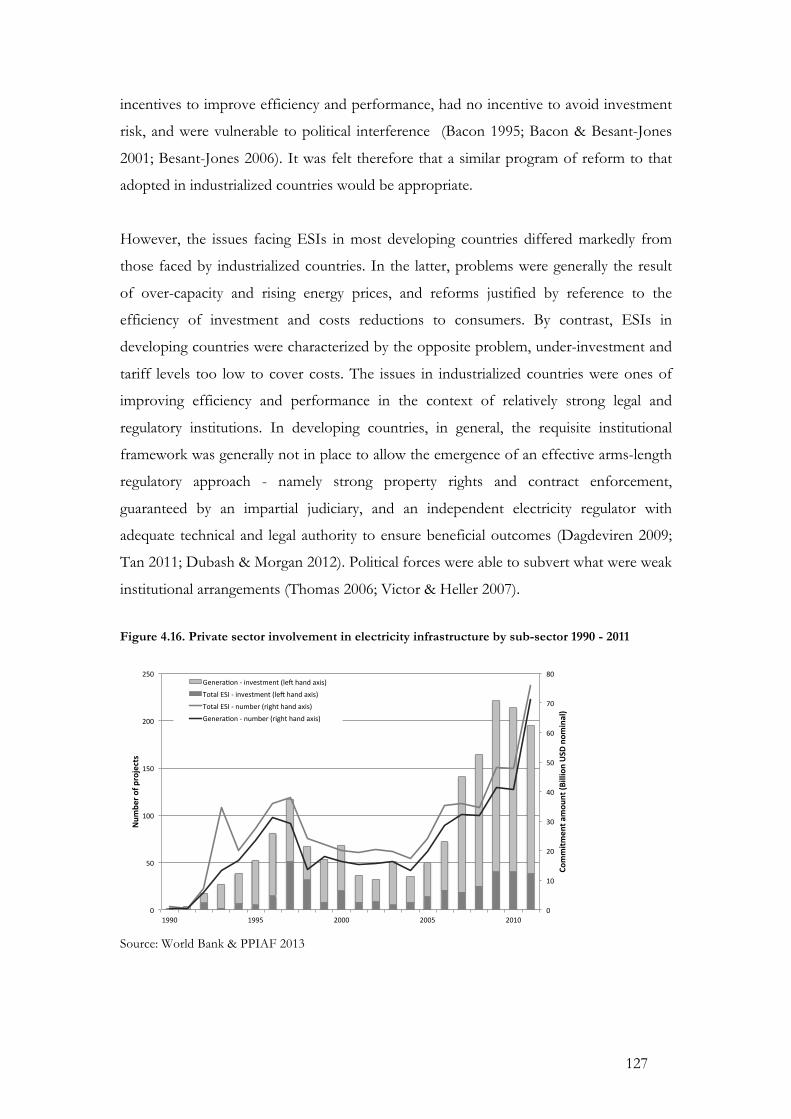
127
incentives to improve efficiency and performance, had no incentive to avoid investment
risk, and were vulnerable to political interference (Bacon 1995; Bacon & Besant-Jones
2001; Besant-Jones 2006). It was felt therefore that a similar program of reform to that
adopted in industrialized countries would be appropriate.
However, the issues facing ESIs in most developing countries differed markedly from
those faced by industrialized countries. In the latter, problems were generally the result
of over-capacity and rising energy prices, and reforms justified by reference to the
efficiency of investment and costs reductions to consumers. By contrast, ESIs in
developing countries were characterized by the opposite problem, under-investment and
tariff levels too low to cover costs. The issues in industrialized countries were ones of
improving efficiency and performance in the context of relatively strong legal and
regulatory institutions. In developing countries, in general, the requisite institutional
framework was generally not in place to allow the emergence of an effective arms-length
regulatory approach - namely strong property rights and contract enforcement,
guaranteed by an impartial judiciary, and an independent electricity regulator with
adequate technical and legal authority to ensure beneficial outcomes (Dagdeviren 2009;
Tan 2011; Dubash & Morgan 2012). Political forces were able to subvert what were weak
institutional arrangements (Thomas 2006; Victor & Heller 2007).
Figure 4.16. Private sector involvement in electricity infrastructure by sub-sector 1990 - 2011
Source: World Bank & PPIAF 2013
0"
10"
20"
30"
40"
50"
60"
70"
80"
0"
50"
100"
150"
200"
250"
1990" 1995" 2000" 2005" 2010"
Commitm
ent(a
mou
nt((B
illion(USD
(nom
inal)(
Num
ber(o
f(projects(
Genera1on"3"investment"(le;"hand"axis)"Total"ESI"3"investment"(le;"hand"axis)"Total"ESI"3"number"(right"hand"axis)"Genera1on"3"number"(right"hand"axis)"
128
The reform of institutional arrangements had implications for the distribution of benefits
and was therefore a politicized process:
“If reform were only a matter of economics, power systems would not have been experiencing the problems experienced in so
many countries. Political factors cover both the importance of politics and many vested interests, and they
include the willingness or opposition of politicians to support a political consensus in favor of power
market reform. This consensus is needed because reform entails a redistribution of property rights (to
remove politics from the management of public service providers) and formulation of new ground rules
(introduction of competition and market-oriented incentives) through changes in laws and regulations.
Governments must generate public acceptance and stakeholder consensus for these programs”[emphasis
added] (Besant-Jones 2006: 14)
In a process somewhat familiar from the NIE accounts of economic development
(Chapter 3, section 3.2), the diagnosis therefore shifted, from failures related to the
micro-economics of the sector, to those related to the formation of institutions, to those
related to the political process. In this context, the political process was seen as an
external constraint to achieving otherwise technically (and socially) desirable reforms.
The task of government then was to mange reform effectively through building a
consensus for reform.109 But there emerges from this a tension that is not resolved. The
government’s role is to build a consensus for performance enhancing reforms. If, as in
the case of Latin America, reform has been unpopular, this is deemed not the fault of the
reform package, but the fault of government for not managing the reform properly
(Kessides 2005; Hall et al 2005). It is precisely this narrow conception of governance that
we criticized in Chapters 2 and 3. Rather, it is through a consideration of the historical
evidence of the reform process that we are able to achieve a more satisfactory account of
what is fundamentally a political economy process.
The reasons why the ‘standard model’ was not fully adopted, are complex and differ
from country to country, but in general relate both to perceptions of the technical
performance of reforms, and fundamental political economy processes. Doubts about
the technical and economic performance of the model became increasingly apparent
during the late 1990s and early 2000s. The Californian electricity crisis in 2000, whatever
the actual reasons, was perceived as a failure of the liberalization reforms (Williams &
Ghanadan 2006; Gratwick & Eberhard 2008). Secondly, the Asian Financial Crisis
109 To do otherwise is a governance failure because it leads to ‘sub-optimal’ outcomes.
129
exposed some governments, most notably the Philippines to problems with long term
‘take-or-pay’ agreements made with IPPs.110 The economic downturn in the late 1990s
led to a fall in electricity demand and utility revenues. Under these long-term power
purchase agreements (PPAs) the utility was required to pay for electricity that was not
generated. In addition, payments usually needed to be made in dollars, the devaluation of
domestic currencies as a result of the crisis made servicing these obligations more
difficult. In the end, public utilities ended up carrying the investment (supply) risk and
exchange rate risk for these projects at great expense (Wyatt 2002; Williams & Dubash
2004).
Privatization was also unpopular in many countries due to the perception that it lead to
increased tariffs, people being cut-off when they were unable to afford supplies, and the
loss of jobs - particularly amongst unionized workforces (Thomas 2006). Similar to the
situation in the post war period in developing countries (section 4.2.3), privatization was
seen as serving the interests of elites and foreign capital by generating profits that did not
benefit the country nationally. Whereas the costs of reforms were obvious in the shape
of immediate increases in consumer tariffs, any benefits only emerged incrementally over
a realtively long period of time (Hall et al 2005).
Despite the surge of literature diagnosing the failures of the standard model in realizing
market based reform in developing countries in the mid-2000s (much of it referred to
here), since the late 2000s private sector investment in developing country ESIs has seen
a resurgence (Figure 4.15 and 4.16). Developing country ESIs have not seen either a
return of public ownership, or any reversal of the reform steps that have been
undertaken (Gratwick & Eberhard 2008). On the other hand, reforms have slowed to a
snails pace or stalled in many countries. The characterization of the sector by Victor &
Heller (2007) from their research in five major developing countries gives a useful
exposition of the current situation, one in which political economy considerations play
an important role.
Victor & Heller (2007) argue that while reforms have stalled, the situation can be seen as
having reached a new partial equilibrium in which the private sector and large publicly
owned and controlled monopolistic electricity utilities exist side-by-side. They argue that 110 This type of agreement was developed as a means of mitigating some of the investment risks discussed in section 4.2.2. .
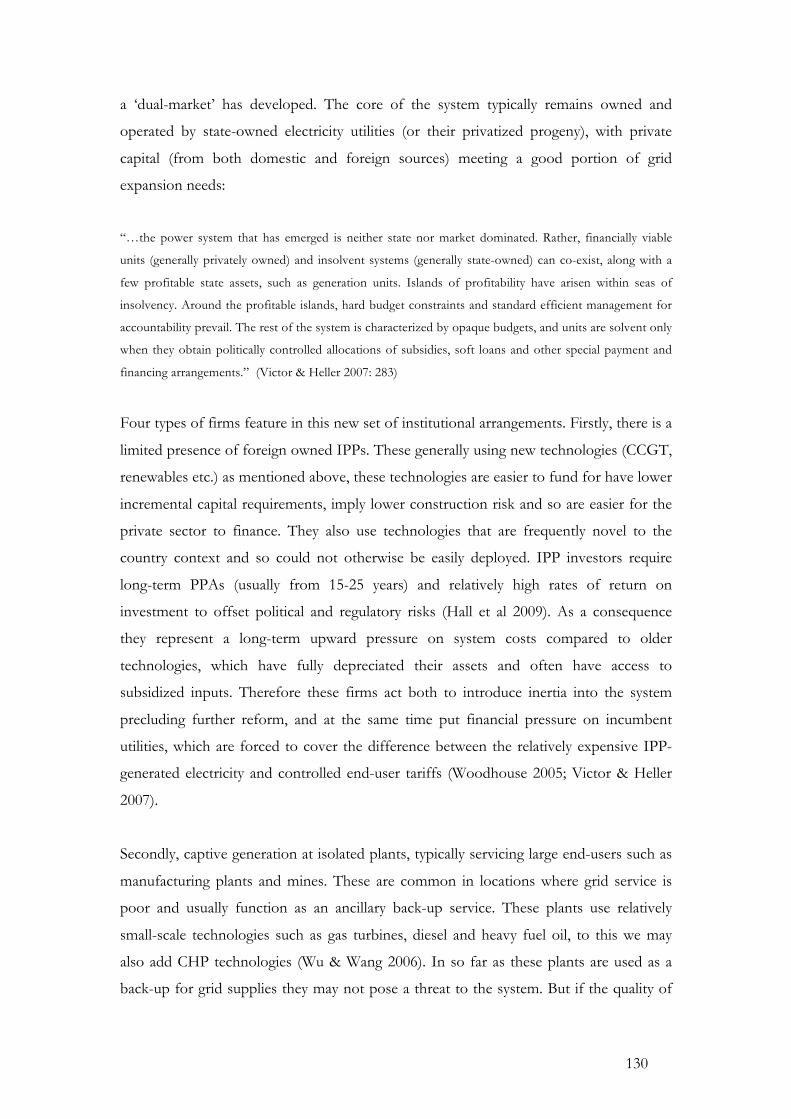
130
a ‘dual-market’ has developed. The core of the system typically remains owned and
operated by state-owned electricity utilities (or their privatized progeny), with private
capital (from both domestic and foreign sources) meeting a good portion of grid
expansion needs:
“…the power system that has emerged is neither state nor market dominated. Rather, financially viable
units (generally privately owned) and insolvent systems (generally state-owned) can co-exist, along with a
few profitable state assets, such as generation units. Islands of profitability have arisen within seas of
insolvency. Around the profitable islands, hard budget constraints and standard efficient management for
accountability prevail. The rest of the system is characterized by opaque budgets, and units are solvent only
when they obtain politically controlled allocations of subsidies, soft loans and other special payment and
financing arrangements.” (Victor & Heller 2007: 283)
Four types of firms feature in this new set of institutional arrangements. Firstly, there is a
limited presence of foreign owned IPPs. These generally using new technologies (CCGT,
renewables etc.) as mentioned above, these technologies are easier to fund for have lower
incremental capital requirements, imply lower construction risk and so are easier for the
private sector to finance. They also use technologies that are frequently novel to the
country context and so could not otherwise be easily deployed. IPP investors require
long-term PPAs (usually from 15-25 years) and relatively high rates of return on
investment to offset political and regulatory risks (Hall et al 2009). As a consequence
they represent a long-term upward pressure on system costs compared to older
technologies, which have fully depreciated their assets and often have access to
subsidized inputs. Therefore these firms act both to introduce inertia into the system
precluding further reform, and at the same time put financial pressure on incumbent
utilities, which are forced to cover the difference between the relatively expensive IPP-
generated electricity and controlled end-user tariffs (Woodhouse 2005; Victor & Heller
2007).
Secondly, captive generation at isolated plants, typically servicing large end-users such as
manufacturing plants and mines. These are common in locations where grid service is
poor and usually function as an ancillary back-up service. These plants use relatively
small-scale technologies such as gas turbines, diesel and heavy fuel oil, to this we may
also add CHP technologies (Wu & Wang 2006). In so far as these plants are used as a
back-up for grid supplies they may not pose a threat to the system. But if the quality of
131
service provided by the grid declines markedly, the prices charged to these consumers
increases, or the costs of power from increasingly efficient isolated plants declines then
there is the possibility that these large users will exit the grid. In this case, grid based
suppliers will lose valuable customers whose use often cross-subsidizes that of poor and
rural users (Victor & Heller 2007).
Thirdly, state-owned elements of the ESI utility. This is typically composed of the
insolvent rump of a partially reformed power sector, including transmission, distribution
and retail and some generation assets and is typically marked by heavy levels of subsidies.
Generators will have inherited old technologies usually including some mix of
hydropower and coal, however assets are fully depreciated, inputs are subsidized and
electricity can be generated cheaply. The degree of solvency or otherwise of these firms is
determined by the extent to which ‘asset sorting’ has taken place. This is a process by
which the better performing solvent parts of the system are sorted out and hived off
from the insolvent rump. In some countries this may have progressed substantially, in
others not at all (Victor & Heller 2007).
Finally, firms which have aspects of both private and public sector entities, what Victor
& Heller (2007) call ‘dual-firms’. These may be owned privately or operated as state
owned corporations. They benefit both from better organization and operating practices
associated with private firms, but also enjoy close political connections with government
that makes investment of large sunk costs in a weak institutional climate possible.
Importantly, this combination of commercial orientation and political connections makes
them better able to mobilize the level of financing needed to meet growing demands
than the other types of firm. These firms are composed of both dedicated utilities but
may also be companies with broader interests in electrical and engineering manufactures,
or fossil fuel extraction. They are also typically the vehicles for large capital investment
projects such as nuclear and large hydropower dams. This includes examples from
OECD countries such as EDF (France), Iberdorola (Spain), and E.ON (Germany),
TEPCO and Mitsubishi (Japan), but also from developing countries such as EGAT
(Thailand), ESKOM (South Africa), Tata and Reliance (India), China Power Investment
Corporation and China Huaneng Group, as well those from smaller economies such as
Kazakhyms (Khazakstan) and Petrovietnam (Vietnam). These firms have the flexibility to
manage the unstable environment presented by operations in emerging economies by
132
tapping government support through their political networks. (Victor & Heller 2007;
Williams & Ghanadan 2006).
Not all these types will be present in all systems, but this typology does illustrate the
pressures partially reformed ESIs in developing countries face. Victor & Heller (2007)
note that while there are forces exerting inertia on the system such as fully depreciated
assets and long-term PPA agreements, other factors such as cost pressures, capital needs
to meet expanding demand, and the need to control politically unpopular tariff increases
may lead to instability. This model also serves to emphasize the importance of political
economy considerations, which they warn should not be considered as:
“…simply “barriers” that can be cleared with enough political will. Economists and investors must
consider the likelihood that fragmented and transitory systems are reasonably stable political economic
orders.” (Victor & Heller 2007: 305)
This is particularly the case in weak institutional contexts, and in the case of many
developing countries one in which there may be a significant gap between the interests of
those in power and the rest of society, a gap which is narrowed, perhaps only a little by
mechanisms ensuring better state accountability.
4.2.8 Distilling the implications for technological change
The emergence of what we have called the dominant system design in the 1930s, and the
dominant institutional form of state-owned (or controlled) monopolistic provision of
electricity services by the 1970s was marked by a degree of convergence. The
fundamental technological and economic characteristics of the ESI and associated
performance benefits to the techno-economic paradigm, conferred positive performance
and political benefits which could be better appropriated and controlled through public
ownership. By contrast, the period of reform since the 1980s represents a divergence in
institutional outcomes across countries. Nevertheless, within the wider range of
heterogeneous outcomes patterns emerge that serve to re-emphasize the fundamental
characteristics of the ESI and the importance of political economy processes.
Firstly, physical constraints in terms of technology and energy resource availability have
been fundamental to enabling institutional change in the sector. Pressure on incumbent
institutional arrangements came from the failings of the energy supply system in the
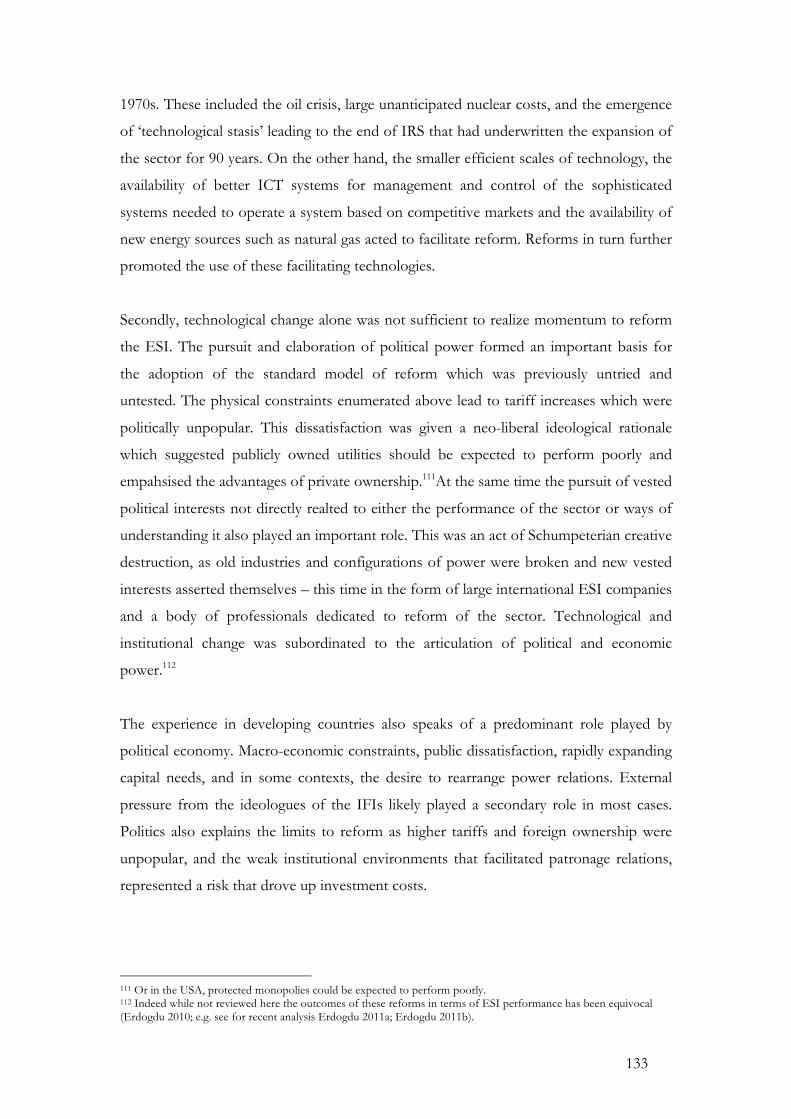
133
1970s. These included the oil crisis, large unanticipated nuclear costs, and the emergence
of ‘technological stasis’ leading to the end of IRS that had underwritten the expansion of
the sector for 90 years. On the other hand, the smaller efficient scales of technology, the
availability of better ICT systems for management and control of the sophisticated
systems needed to operate a system based on competitive markets and the availability of
new energy sources such as natural gas acted to facilitate reform. Reforms in turn further
promoted the use of these facilitating technologies.
Secondly, technological change alone was not sufficient to realize momentum to reform
the ESI. The pursuit and elaboration of political power formed an important basis for
the adoption of the standard model of reform which was previously untried and
untested. The physical constraints enumerated above lead to tariff increases which were
politically unpopular. This dissatisfaction was given a neo-liberal ideological rationale
which suggested publicly owned utilities should be expected to perform poorly and
empahsised the advantages of private ownership.111At the same time the pursuit of vested
political interests not directly realted to either the performance of the sector or ways of
understanding it also played an important role. This was an act of Schumpeterian creative
destruction, as old industries and configurations of power were broken and new vested
interests asserted themselves – this time in the form of large international ESI companies
and a body of professionals dedicated to reform of the sector. Technological and
institutional change was subordinated to the articulation of political and economic
power.112
The experience in developing countries also speaks of a predominant role played by
political economy. Macro-economic constraints, public dissatisfaction, rapidly expanding
capital needs, and in some contexts, the desire to rearrange power relations. External
pressure from the ideologues of the IFIs likely played a secondary role in most cases.
Politics also explains the limits to reform as higher tariffs and foreign ownership were
unpopular, and the weak institutional environments that facilitated patronage relations,
represented a risk that drove up investment costs.
111 Or in the USA, protected monopolies could be expected to perform poorly. 112 Indeed while not reviewed here the outcomes of these reforms in terms of ESI performance has been equivocal (Erdogdu 2010; e.g. see for recent analysis Erdogdu 2011a; Erdogdu 2011b).
134
Finally, liberalization reforms were based upon an economic and institutional ideal that
did not fit well with the fundamental characteristics of the sector. Since the 1990s these
characteristics have largely reasserted themselves as private sector investors seek a
guaranteed return on their investment, and monopolistic power abounds in most
markets, which in turn need to be tightly regulated. In developing countries, where ESIs
are dominated by capital needs and constrained by the exercise of political power and
patronage, institutional arrangements remain in flux. Indeed, in the case of both
developing and developed countries there are indications that changing ESI technologies
and imperatives are likely to have profound implications for the future development of
the sector.
4.3 Conclusion: Political settlements, holding power, rents and the ESI
We are now in a position to understand the implications of the historical record and
draw some initial conclusions relating to the development of the ESI. Exactly how policy
pressures are likely to be elaborated depends upon the political economy context. We
should recall that, from a political economy perspective the role the ESI plays is not best
understood as the delivery of a public service, and the best means of managing the ESI is
not best regarded as a means of realising socially optimal solutions. Rather to understand
the choices made about the management and operations of the ESI, the institutional
arrangements, and the flows of resources associated with them, it should be regarded as a
political economy process. That is to say it should be looked at with a view to uncovering
the way in which the ESI functions to create and reinforce patterns of power. This is not
to say considerations of technical performance or societal outcome are unimportant.
Quite the opposite, the provision of this essential good may be central to maintaining a
particular distribution of power, but it is to say that if they are important they are likely to be
mediated through the political economy processes.
The key benefit to flow from the sector is the provision of an electricity service, which
can be put to all sorts of productive and consumptive uses. The sector also has the
potential to produce a number of general public goods including direct and indirect
employment, strategic targeting of resources (e.g. to heavy industry), to promote equality
and poverty reduction (though the cross-subsidisation of prices), and environmental
135
protection (i.e. reduction in environmental harm) (Jaccard 1995).113 Additionally, it is the
source of less widely disbursed benefit streams accruing to power sector financiers,
technology and fuel suppliers, project developers, utility owners and the government, to
name but a few. All these groups stand to benefit from the sector. The pattern of
benefits accruing to each of these groups depends upon the institutional arrangements of
the sector. As argued in section 4.2, institutional arrangements in the ESI in turn depend
upon the interaction between the nature of the technology and the economic
implications of this, and the broader disposition of power in a particular context.
Changes in technologies or institutional (formal and informal) arrangements that may
alter the distribution of benefits are likely to be opposed (promoted) by those who stand
to lose (gain).114 Changes in the disposition of power in the groups that are able to
appropriate these benefits is likely to lead to changes in technological or institutional
factors that determine the distribution of those benefit flows. For example, according to
Hughes, in the USA the opposition and subsequent failure of the Giant Power project in
1925 was explained as a result of incumbent utilities protecting the economic benefits
that accrued to them through existing arrangements, and resisting the formation of new
technical, economic and institutional arrangements (Hughes 1976). And Coopersmith’s
(1993) example of the Russian Revolution, is a good example of the latter case.
This is not to say that actors are not often highly constrained, or that they had a perfect
insight into the prevailing conditions or the implications of their actions, far from it.
Essentially random changes in resource endowments or access can have destabilizing
impacts such as the implication for the coal-mining sector in the UK of the discovery of
North Sea oil and gas (Turnheim & Geels 2012). Technological advances are notoriously
unpredictable, the importance of civilian nuclear power did not inform the US research
program, nor later were its significant costs foreseen (Cowan 1990; Grubler 2010).
Patterns of institutional reform in the 1980s and 1990s also had unexpected effects, such
as the impact of PURPA on the adoption of CCGTs and gas consumption more
generally, the implications of sector liberalisation for the nuclear technologies, the 113 There are some very specific public goods associated with the sector which are not included here, but from hydropower could include flood protection and water supply for irrigation, and possibly from fast-breeder nuclear reactors, plutonium for armament manufacture and the provision of national security. 114 Changes are unlikely to start with institutional arrangements as we have argued they are generally the result of interactions between technology and the disposition of political power. Unless they are enforced from outside the system. Arguably this has been the case with liberalization reforms in the sector, and especially in the case of developing countries, the essential techno-economic characteristics of the sector and associated power relations have reasserted themselves.
136
Californian Energy Crisis or the need for the renegotiation of IPPs in Latin America and
Asia (Williams & Dubash 2004; Williams & Ghanadan 2006; Hirsh 2007; Hausman &
Neufeld 2011). The private sector has also seen its share of imperfect foresight. To wit,
the billions lost by AES in India, Uganda and the UK stand testament. But this is not to
say that human agency is inconsequential, nor history ‘just one damn thing after another,’
as Hirsh & Sovacool (2006) note in their review of technological change in the US ESI:
“…stakeholders play important roles in channeling momentum. Though they may not always realize the
consequences of their actions - contributing to forces that alter momentum in unanticipated ways - people
remain at the core of technological systems because of their concern for political control, influence,
money, and power…” (Hirsh & Sovacool 2006).115
The problem is to identify the systematic elements, the regularities that characterise
behaviour in the sector. We have illustrated a number of fundamental technological and
economic characteristics of the ESI that recurrently influence investment decisions in the
sector, i) large sunk costs and capital intensity; ii) the monopolistic nature of electricity
service provision; iii) the wide range of public and private goods generated by the sector
(employment, pollution abatement, upstream and down stream linkages). To this we can
add, equally important but contingent, iv) natural resource endowments. These in turn
give rise to appropriable benefit streams or economic rents (described in Chapter 3,
section 3.3.2).
The distribution of these rents is determined by the both formal and informal
institutional arrangements that characterise the ESI. That is property rights, levels of
taxation and subsidy, government policy, and informal patronage networks. It should be
noted that rents are not guaranteed but are have risks associated with them. The
expected rent will be some function of the available appropriable rent and an assessment
of risk. Risk perceptions will be extremely important in determining investment and
policy choices relating to the sector, given sunk costs, capital intensity, the political
importance of the sector, increasingly acute sectoral pressures (highlighted in section
4.3), and on-going institutional and technological change.
115 The author fully endorses this view of history, a view shared by Heffer: “All major ‘historical’ events have been motivated either by the preservation of the degree of privilege that comes with sovereignty in all its forms (including spiritual), or the desire to expand it. The pursuit of power through history has largely been a manifestation of the aggressive and competitive nature of men (and almost always men): that is clear from Thucydides onwards.” (Heffer 2011: 7)
137
The institutions which determine the allocation of rents are in turn a function of holding
power.116 As noted in Chapter 3, the stability of the political settlement is dependant on
the distribution of rents being consistent with the disposition of holding power. Where it
is not there will be pressures for reform, and where there is consistency between the two
there will be, ceritus paribus, a tendency for inertia. Any equilibrium between holding
power, institutional arrangements and benefit flows is likely to be temporary, as external
factors are likely to influence the system. Moreover, as both North et al (2009) and Khan
(2010, 2012) argue, some social orders are likely to be more stable than others.
Our contention here is that for a particular set of institutionally intermediated patterns of
rent distribution, and the associated distribution of holding power to be stable, it must be
concordant with the patterns and magnitude of rents generated by a techno-economic
paradigm. In this case, it must in some sense be consistent with the technological and
economic characteristics of the ESI. If a technology is perceived as a threat to a
particular settlement it may well face barriers to its wider use. If it enhances existing
distributional patterns, it may benefit from political momentum. Conversely, changes in
the structure of societal power may influence technological choice.
Thus the maintenance and pursuit of these rents and associated patterns of power is a
dynamic process. The ability of a group to mobilize power and influence these processes
can be thought of as depending on three broad characteristics, identified by Mokyr
(1992, 1997) and Moe (2009, 2010) (see Chapter 2, section 2.2.4 and Chapter 3, section
3.3), we are now in a position to articulate how this it likely to be experiences in the ESI.
Firstly, the strength of the incentive to oppose (promote) technological change, for
example in the strong opposition from municipalities to interconnection (and state
regulation) in the US due to prospective loss of politically important quasi-rents, or the
opposition of utilities to Giant Power and Super Power in the US, and the development
of the National Grid in the UK (Hughes 1976, 1983).
116 See section 3.3.2 in chapter 3. It should be noted that holding power in Khan’s conception is predominantly articulated in terms of economic power, but it should also be through of as including ideological power and coercive power. It can also be thought of as roughly equivalent to political power. Articulations of power can be complex, and in many cases closely interact with scientific or technological vested interests. A technological vested interest often provides a fig-leaf for more fundamental articulation of power. For example, arguably the arguments of economists relating to the privatisation of the ESI in the UK were a fig-leaf for a more fundamental power struggle between the miners unions and the Conservative party during the 1980s.
138
Secondly, the extent to which costs and benefits are concentrated amongst winners and
losers. The paradigm example of this may be resistance to hydropower projects by
surrounding communities. We may add to this that the perception of a loss may be
opposed more effectively by cohesive groups such as miners or nuclear industry workers.
Business or technical experts whose competitive advantage is bound up with particular
technologies may be particularly obstructive. The technological complexity and
specialised skill sets required by the ESI means that the sector is replete with these
groups, including hydropower, nuclear and systems engineers, which tend to favour
technologies associated with their skill set (Hughes 1983b; Unruh 2000; Greacen &
Palettu 2007). The groups of economic consultants, lawyers and project financiers
involved in the liberalisation process since the 1990s would also seem to fall into this
category (Thomas 2006; Gratwick & Eberhard 2008).
Third, the position of those in power as regards the technological change. The interests
of this group are likely to be bound up with the performance of the sector in delivering
goods to wider society, but also with narrower self-interests realised through patronage
networks, particularly where formal institutional arrangements are weak. Although there
may be a tendency to inertia in a stable political settlement, there also will be periods of
rapid change in response to pressures internal and external to the sector. Examples
include, the promotion of nuclear generation technologies in France, Korea, Japan and
China, or PURPA in the US in response to long-term energy security concerns; the
promotion of large hydropower projects in East and South East Asia; and, the
development of wind power industries in Denmark, India and China (Hadjilambrinos
2000; Lewis 2007; Urban et al 2012; Walz & Delgado 2012; Silva & Klagge 2013).
To be sure, there are complex interactions and feedbacks between each of these
elements. For example, politicians pursuing their own vested interest use the ‘objective’
and ‘scientific’ advice of technical experts pursing theirs, and close-knit groups who
stand to lose everything such as mine workers, are better able to mobilise than dispersed
groups who stand to benefit marginally. In this regard environmental and climate change
considerations stand out as problematic, the incentive is small as immediate losses are
relatively small and are dispersed amongst different groups. Conversely, addressing these
issues would imply disrupting large rents, which are concentrated in powerful groups.
139
It is worth stressing again that this cannot necessarily be reduced to a narrow material
self-interest. The role of ideology has occurred as important in many cases, socialism,
nationalism and environmental concerns have all been important to a greater or lesser
extent. Similarly, physical coercion (whether it be a physical conflict at picket lines, or the
forcible resettlement of households to make way for a hydropower project), has also
played an important role in some circumstances. But it remains the contention of this
thesis that above all else material or economic power and the wherewithal to appropriate
this has been the most important way in which power has been articulated in the sector
and this is reflected by the focus on rents.
It is extremely difficult to generalise about institutional and political economy factors.
They differ considerably within different contexts, and it is to the elaboration of a
particular political economy case study, and its relationship to technology choice in the
ESI that we turn in Chapters 6 and 7. As regards technologies, however, there are some
determinate generalisations we can make about the particular rents associated with
different technologies, which will be important in understanding how the political
economy is likely to be related to technologies. These have been outlined in Table 4.7.
Finally, it should be noted that the existence of rents in the conception we use here is
dependant not just upon a changing structure of rights, but upon changes independent
of those structures. For example, fossil fuel rents will only last as long as fossil fuel
supplies, demand for some resources or technologies may wax or wane, or technological
innovation may create some rents and destroy others.
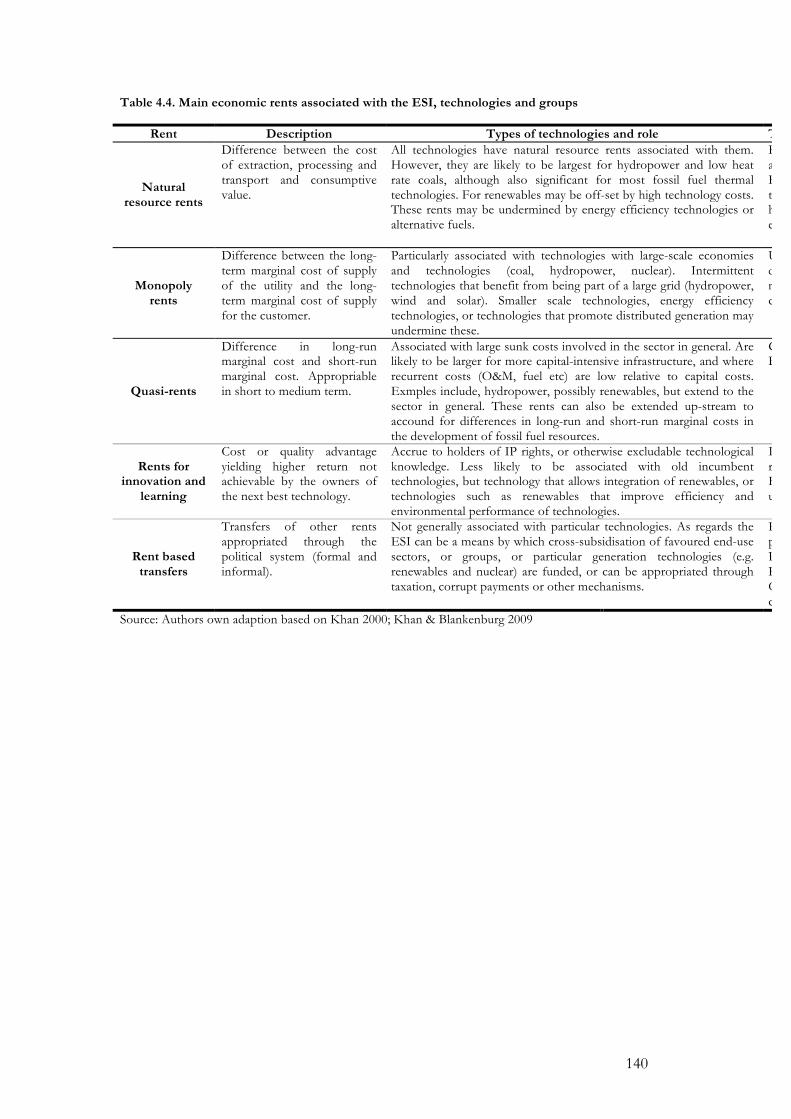
140
Table 4.4. Main economic rents associated with the ESI, technologies and groups
Rent Description Types of technologies and role Typically accrue to which groups?
Natural resource rents
Difference between the cost of extraction, processing and transport and consumptive value.
All technologies have natural resource rents associated with them. However, they are likely to be largest for hydropower and low heat rate coals, although also significant for most fossil fuel thermal technologies. For renewables may be off-set by high technology costs. These rents may be undermined by energy efficiency technologies or alternative fuels.
Extractive industries, but also accrue to different groups all the way down the value chain to the end consumer. ESI sector can potentially capture a large proportion of these rents – particularly in the case of hydropower, low heat rate coals (which cannot be transported economically) and, potentially, renewables.
Monopoly rents
Difference between the long- term marginal cost of supply of the utility and the long- term marginal cost of supply for the customer.
Particularly associated with technologies with large-scale economies and technologies (coal, hydropower, nuclear). Intermittent technologies that benefit from being part of a large grid (hydropower, wind and solar). Smaller scale technologies, energy efficiency technologies, or technologies that promote distributed generation may undermine these.
Utilities, in unbundled competitive market can be distributed between different market segments, lower market power can drive them down and increase consumer surplus. Can be appropriated through taxation.
Quasi-rents
Difference in long-run marginal cost and short-run marginal cost. Appropriable in short to medium term.
Associated with large sunk costs involved in the sector in general. Are likely to be larger for more capital-intensive infrastructure, and where recurrent costs (O&M, fuel etc) are low relative to capital costs. Exmples include, hydropower, possibly renewables, but extend to the sector in general. These rents can also be extended up-stream to accound for differences in long-run and short-run marginal costs in the development of fossil fuel resources.
Grantor of concession or francize. Buyer of power from IPPs in non-competitive market.
Rents for innovation and
learning
Cost or quality advantage yielding higher return not achievable by the owners of the next best technology.
Accrue to holders of IP rights, or otherwise excludable technological knowledge. Less likely to be associated with old incumbent technologies, but technology that allows integration of renewables, or technologies such as renewables that improve efficiency and environmental performance of technologies.
IP rights seek to allocate a significant portion of these rents to innovators thus incentivising innovation. In the ESI usually appropriated by technology providers, and utility companies to a lesser extent.
Rent based transfers
Transfers of other rents appropriated through the political system (formal and informal).
Not generally associated with particular technologies. As regards the ESI can be a means by which cross-subsidisation of favoured end-use sectors, or groups, or particular generation technologies (e.g. renewables and nuclear) are funded, or can be appropriated through taxation, corrupt payments or other mechanisms.
Energy intensive or otherwise strategic sectors (e.g. metal production, manufacturing sector). Poor households and rural households. Renewables and nuclear generation asset owners. Often important for capital accumulation in developing countries.
Source: Authors own adaption based on Khan 2000; Khan & Blankenburg 2009

141
Chapter 5: Introducing the Vietnam case study 5.1 Introduction
In Chapters 2, 3 and 4 we have started to describe a possible approach to understanding
the relationships between political economy and technological systems with a particular
focus on electricity systems. In Chapter 4 we noted that the ESI has important
technological and economic characteristics, which through economies of scale and scope
have been important in determining a dominant system design. These factors are more
or less dependant upon available technologies and as such exert similar influence on the
ESI the world over.
The institutional arrangements surrounding the sector to a large degree have answered
these same technological and economic needs. Change in institutional arrangements,
however, has tended to be slower, and institutional outcomes have tended to be more
heterogeneous.117 We contend that the primary reason for this is the crucial role (formal
and informal) institutional arrangements play in intermediating the resource flows
generated by the technological system such that they are consistent with the distribution
of holding power. We have illustrated the role of holding power and political economy in
the ESI in Chapter 4 by showing how in some cases vested interests have slowed
institutional convergence in the ESI, just as in other cases political crises have provided
opportunities for change.
The relationship between technological change and the political economy is complex. We
have argued (Chapter 3, section 3.2 and Chapter 4, section 4.4) that a useful way of
approaching this is through understanding the flows of rents associated with different
technologies (Table 4.7).118 Identifying the sources of rent generation and the groups that
are able to appropriate those rents helps illustrate both where inertia and resistance to
change is likely to emerge and where possibilities for technological change may emerge.
However, the analysis so far has only allowed the identification of general types of rent
likely to be associated with the ESI and groups to whom they typically accrue.
Institutional and political economy arrangements differ greatly between countries and are
117 As described in Chapter 2, section 2.6, this is a consequence also of the particular micro-foundational dynamics of institutional and political arrangements, i.e. weak negative feedbacks and strong positive feedbacks to political power. 118 Mokyr’s typology of political resistance to technological change is also useful in illustrating factors other than rents alone are important in determining the extent to which change is obstructed, emphasizing the perceptions, the ease of collective action and the role of the state.
142
highly contingent, dependent upon, inter alia, natural resource availability, climate,
geography, demographics and history. Therefore, to arrive at an adequate understanding
of how technological change and the political economy are related in any particular case
will require the development of a country case study. In this this Chapter we introduce
the case study methodology and give background for the chosen case study country,
Vietnam.
This short chapter has two main functions, the following section gives a brief rationale
for the choice of Vietnam as a case study and section 5.3 gives an overview of the
literature on the political economy of Vietnam with a view to setting the scene for a
more detailed discussion of the political economy of Vietnam’s ESI in Chapter 6.119
5.2 Vietnam as a case study
The choice of Vietnam as a case study country is primarily pragmatic, based on the
researcher’s experience of the country and access to data. Nevertheless, there are a
number of compelling reasons to consider Vietnam (section 5.4 and annex 6A for greater
detail). Since the beginning of the 1990s, and following the start of the gradual institution
of economic liberalization policies Vietnam has had one of the most rapid economic
growth rates in the world, with an average real annual GDP growth in excess of 7%
between 1990 and 2010. Along side this growth Vietnam has seen dramatically increasing
electricity demand running at approximately double economic growth rates between
1990 and 2010. This rapid growth is expected to continue with electricity demand
expected to increase from around 100 TWh in 2010 to 400 TWh by 2030 (MOIT 2011).
Vietnam’s status as a rapidly growing economy, and the concomitant rapid structural and
institutional change the country is undergoing make it an interesting case study. The
rapid growth of the ESI over the last two decades and expected rapid future growth,
particularly in fossil fuel thermal generation capacity mean that it is of interest in
exploring the barriers significant to GHG abatement in the ESI. Finally, as there is no
political economy research on the ESI in Vietnam this means that a case study of
Vietnam’s ESI is a novel contribution to the literature.
5.3 Vietnam’s evolving political economy context
Vietnam is generally perceived as a development success story (Commission on
Development and Growth 2008; Cling et al 2009). Vietnam’s ‘liberalisation’ process – 119 Methodological and epistemic considerations relating to the case study are discussed briefly in Annex 5A.
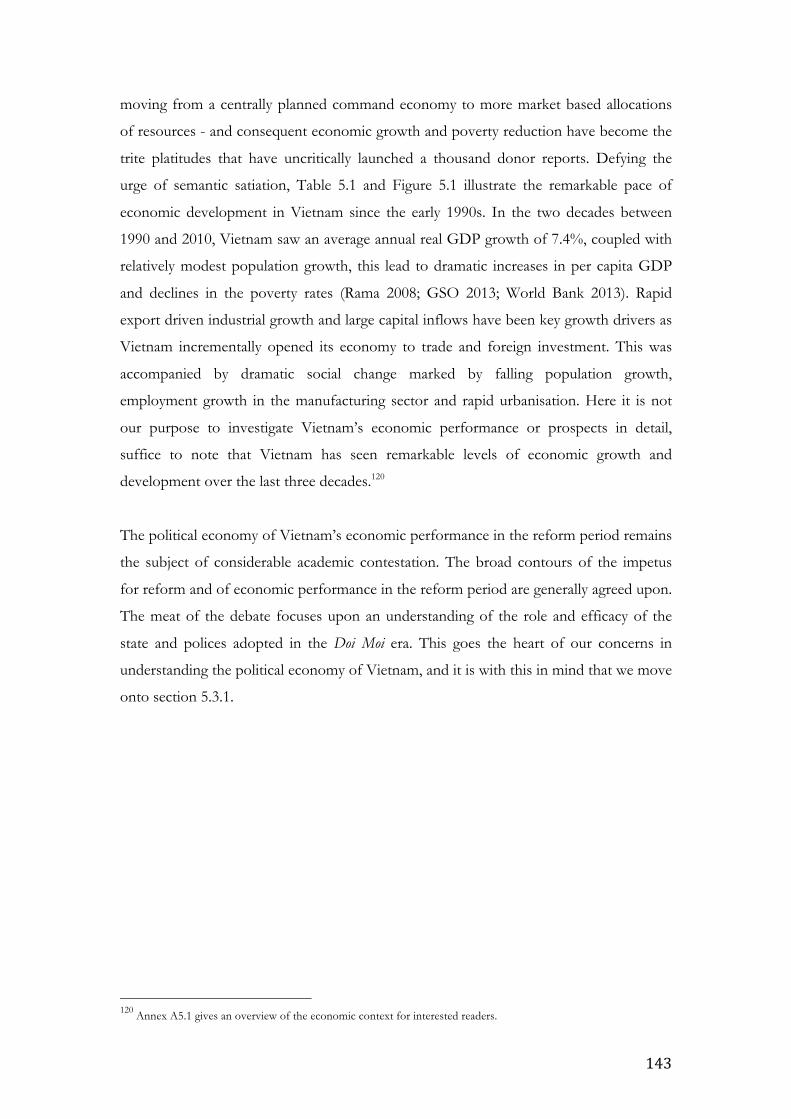
143
moving from a centrally planned command economy to more market based allocations
of resources - and consequent economic growth and poverty reduction have become the
trite platitudes that have uncritically launched a thousand donor reports. Defying the
urge of semantic satiation, Table 5.1 and Figure 5.1 illustrate the remarkable pace of
economic development in Vietnam since the early 1990s. In the two decades between
1990 and 2010, Vietnam saw an average annual real GDP growth of 7.4%, coupled with
relatively modest population growth, this lead to dramatic increases in per capita GDP
and declines in the poverty rates (Rama 2008; GSO 2013; World Bank 2013). Rapid
export driven industrial growth and large capital inflows have been key growth drivers as
Vietnam incrementally opened its economy to trade and foreign investment. This was
accompanied by dramatic social change marked by falling population growth,
employment growth in the manufacturing sector and rapid urbanisation. Here it is not
our purpose to investigate Vietnam’s economic performance or prospects in detail,
suffice to note that Vietnam has seen remarkable levels of economic growth and
development over the last three decades.120
The political economy of Vietnam’s economic performance in the reform period remains
the subject of considerable academic contestation. The broad contours of the impetus
for reform and of economic performance in the reform period are generally agreed upon.
The meat of the debate focuses upon an understanding of the role and efficacy of the
state and polices adopted in the Doi Moi era. This goes the heart of our concerns in
understanding the political economy of Vietnam, and it is with this in mind that we move
onto section 5.3.1.
120 Annex A5.1 gives an overview of the economic context for interested readers.
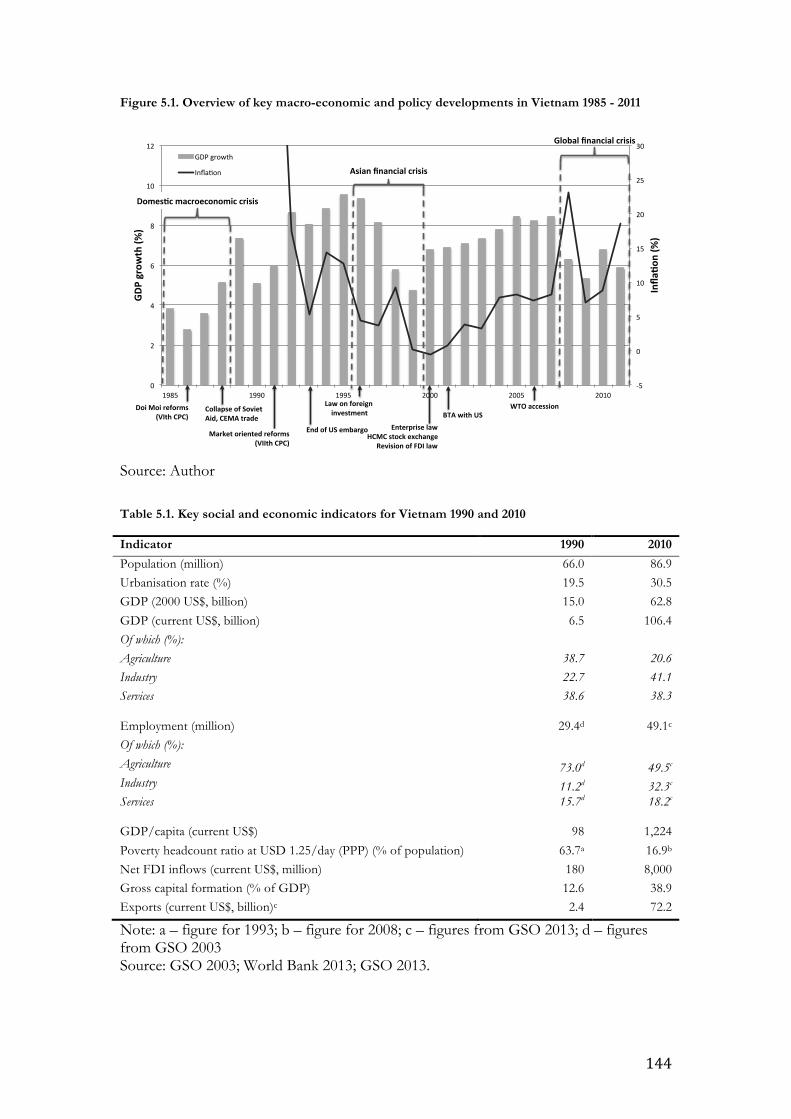
144
Figure 5.1. Overview of key macro-economic and policy developments in Vietnam 1985 - 2011
Source: Author
Table 5.1. Key social and economic indicators for Vietnam 1990 and 2010
Indicator 1990 2010
Population (million) 66.0 86.9 Urbanisation rate (%) 19.5 30.5 GDP (2000 US$, billion) 15.0 62.8 GDP (current US$, billion) 6.5 106.4 Of which (%): Agriculture 38.7 20.6 Industry 22.7 41.1 Services
38.6 38.3
Employment (million) 29.4d 49.1c
Of which (%): Agriculture 73.0d 49.5c
Industry 11.2d 32.3c
Services
15.7d 18.2c
GDP/capita (current US$) 98 1,224 Poverty headcount ratio at USD 1.25/day (PPP) (% of population) 63.7a 16.9b
Net FDI inflows (current US$, million) 180 8,000 Gross capital formation (% of GDP) 12.6 38.9 Exports (current US$, billion)c 2.4 72.2
Note: a – figure for 1993; b – figure for 2008; c – figures from GSO 2013; d – figures from GSO 2003 Source: GSO 2003; World Bank 2013; GSO 2013.
!5#
0#
5#
10#
15#
20#
25#
30#
0#
2#
4#
6#
8#
10#
12#
1985# 1990# 1995# 2000# 2005# 2010#
Infla
%on'(%
)'
GDP
'growth'(%
)'
GDP#growth#
Infla9on#
Domes%c'macroeconomic'crisis'
Asian'financial'crisis'
Global'financial'crisis'
Doi'Moi'reforms''(VIth'CPC)'
Market'oriented'reforms'(VIIth'CPC)'
BTA'with'US'WTO'accession''Law'on'foreign'
'investment'
End'of'US'embargo' Enterprise'law'HCMC'stock'exchange'
Revision'of'FDI'law'
Collapse'of'Soviet'Aid,'CEMA'trade'
145
5.3.1 Characterising the political economy of the reform period
We argued at length in Chapter 3 that the process of economic development is one that
can only be properly understood through an analysis of the underlying political economy
(Chapter 3, section 3.1). For development to be sustainable in the long run, patterns of
wealth created by economic activities need to, in some sense, comport with the
disposition of political power. A dynamic and dislocating economic transition of the sort
Vietnam has been experiencing implies a large change in the scale and type of economic
activity, the mechanisms of wealth generation and rents associated with this. It typically
entails concomitant changes in distributional processes and outcomes to maintain the
stability of the political settlement, in much the way Beresford (2008) has in mind in her
writing on the legacy of Doi Moi:
“All states in modern societies share two common functions: they need to facilitate sustainable capital
accumulation as well as maintain legitimacy of the regime. These two do not occur in isolation from each
other, although that may happen in the short to medium term. Successful late industrialisers appear, with
ups and downs, to have achieved both. Often beginning with authoritarian regimes, they have succeeded
not only in promoting high rates of accumulation and growth, but in spreading the benefits in a way that
blunts and isolates opposition…[…]…Politics and economics are thus inextricably intertwined, although
the essentially political nature of alliances is not always clearly visible” (Beresford 2008: 223 - 224)121
Vietnam is no exception to these political-economy dynamics. Since reunification in
1976, as a single party socialist state the Vietnamese Communist Party (CP) has been able
to maintain a monopoly on decision-making within the formal political institutions of
state, ostensive ownership and control over key economic sectors, and the considerable
societal power associated with this. But, it has only been able to do this through
spreading the benefits of economic growth to maintain popular consent and popular
legitimacy (Thayer 1992; Van Arkadie & Mallon 2003; Masina 2004; Kerkvliet 2005;
Fforde 2007; Penrose et al 2007; Thayer 2009; Thayer 2010; Vuving 2010; Beeson &
Pham 2012).122
Unpacking the components of this ‘popular consent’ Carlyle Thayer (2009, 2010)
identifies three main sources of the CP’s political legitimacy since reunification, namely i)
121 Indeed, as noted in Chapter 3 a very similar case is made by the report of the Commission on Growth and Development (2008) and increasing numbers of scholars, although as we have endeavored to argue in that section, the understanding of political economy is still hobbled by the implicit teleology of the neo-classical canon. 122 As Kerkvliet (2005) puts it: “The Communist Party government’s base of support remains in the peasantry. Were it to lose that backing, its days would be numbered.”(242)
146
nationalism; ii) ensuring political and social stability; and, iii) delivering economic and
social development. Firstly, nationalism has been closely associated with developmental
states as a key source of state legitimacy (Beresford 2008). In Vietnam this had a
particular resonance following thirty years of nationalist struggles against the French
(1946 – 54), the US (1958 – 75), China (1979) and the Khmer Rouge (1978 – 89), and the
ongoing threat posed by China (Vuving 2010; Thayer 2010). Secondly, Thayer (2010)
argues that given the long experience of armed conflict, the CP’s role as a guarantor of
political and social stability should also deemed a key element in maintaining the CP’s
legitimacy. Finally, the delivery of the widespread benefits of economic and social
development – either through a realization of socialist modernization, or in the Doi Moi
era, as market based economic growth and poverty reduction:123
“The legitimacy of Vietnam’s one-party state since 1986 has largely rested on performance legitimacy, that
is, success in delivering economic growth, and the maintenance of political stability for society at large. In
this respect the regime has been very successful as measured by high GDP growth rates accompanied by a
marked decline in the national incidence of poverty. ” (Thayer 2010: 440)
In this way, the source of party and state legitimacy has evolved over time. As war
veterans die, and the memory of the years of conflict lift,124 the sources of legitimacy
have shifted. From the CP as victor and champion of successful nationalist struggles in
the twentieth century, to the CP as guarantor of post-conflict social stability, to the
present day and the increasing importance of ensuring the benefits of economic growth
and development are shared widely enough amongst the general population. Thus
ensuring good economic performance and continuing poverty reduction is regarded as
essential to the long-term maintenance of CP authority and power. The need for popular
consent is amply illustrated by the adoption of Doi Moi reforms, the economic crisis
posed a severe crisis of legitimacy for the CP, deeply held socialist tenants were dropped
in favour of maintaining CP power.125 In the context of our concerns here, the provision
of basic goods and services has been an important part of this performance. Since 1975,
Vietnam has seen significant improvements in provision of basic health, education and
infrastructure services (UNDP 2006; World Bank 2006a; World Bank 2011b). 126 127
123 Thayer (2010) divides this source of legitimacy into two, i) socialist modernization; and, ii) market based economic reform, growth and poverty reduction. However, here we regard both these sources as essentially in the same in that 124 Over 60% of the population in Vietnam was born after 1975 (GSO 2013). 125 See annex A5.3 for more background on Vietnam’s recent economic history. 126 For example, electrification has increased from 2.5% of households in 1976 to 96% of households in 2009 (World Bank 2011b).
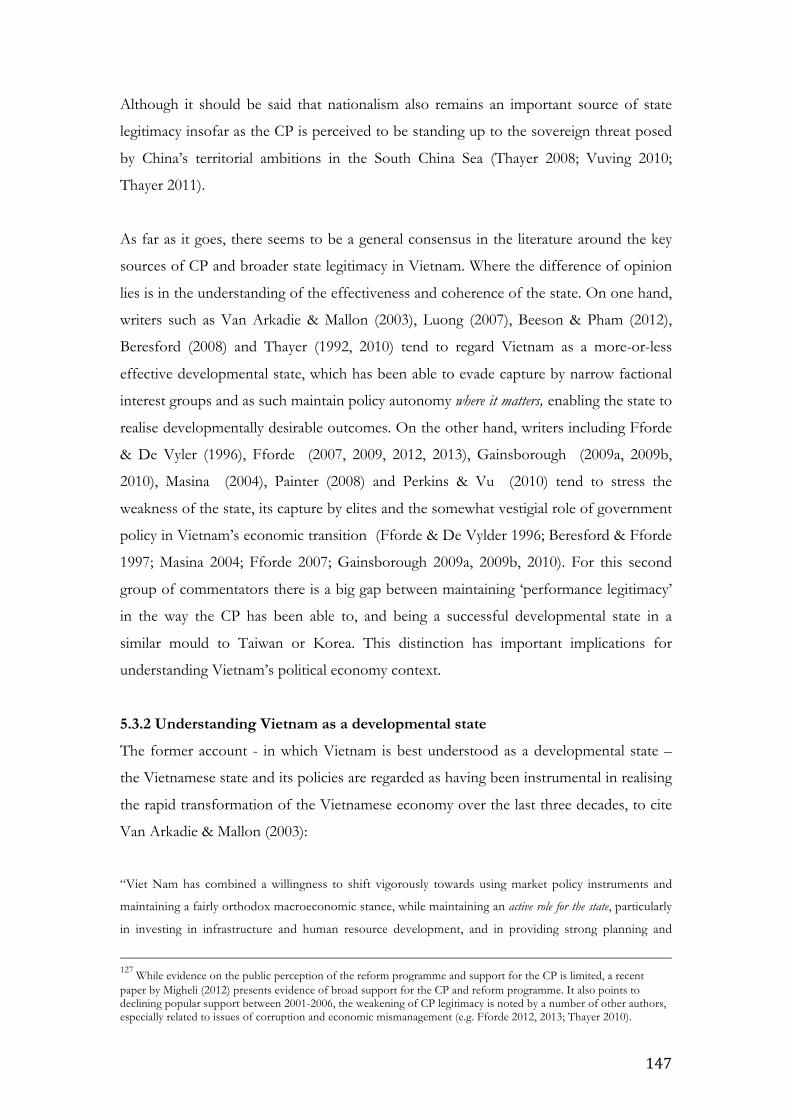
147
Although it should be said that nationalism also remains an important source of state
legitimacy insofar as the CP is perceived to be standing up to the sovereign threat posed
by China’s territorial ambitions in the South China Sea (Thayer 2008; Vuving 2010;
Thayer 2011).
As far as it goes, there seems to be a general consensus in the literature around the key
sources of CP and broader state legitimacy in Vietnam. Where the difference of opinion
lies is in the understanding of the effectiveness and coherence of the state. On one hand,
writers such as Van Arkadie & Mallon (2003), Luong (2007), Beeson & Pham (2012),
Beresford (2008) and Thayer (1992, 2010) tend to regard Vietnam as a more-or-less
effective developmental state, which has been able to evade capture by narrow factional
interest groups and as such maintain policy autonomy where it matters, enabling the state to
realise developmentally desirable outcomes. On the other hand, writers including Fforde
& De Vyler (1996), Fforde (2007, 2009, 2012, 2013), Gainsborough (2009a, 2009b,
2010), Masina (2004), Painter (2008) and Perkins & Vu (2010) tend to stress the
weakness of the state, its capture by elites and the somewhat vestigial role of government
policy in Vietnam’s economic transition (Fforde & De Vylder 1996; Beresford & Fforde
1997; Masina 2004; Fforde 2007; Gainsborough 2009a, 2009b, 2010). For this second
group of commentators there is a big gap between maintaining ‘performance legitimacy’
in the way the CP has been able to, and being a successful developmental state in a
similar mould to Taiwan or Korea. This distinction has important implications for
understanding Vietnam’s political economy context.
5.3.2 Understanding Vietnam as a developmental state
The former account - in which Vietnam is best understood as a developmental state –
the Vietnamese state and its policies are regarded as having been instrumental in realising
the rapid transformation of the Vietnamese economy over the last three decades, to cite
Van Arkadie & Mallon (2003):
“Viet Nam has combined a willingness to shift vigorously towards using market policy instruments and
maintaining a fairly orthodox macroeconomic stance, while maintaining an active role for the state, particularly
in investing in infrastructure and human resource development, and in providing strong planning and
127 While evidence on the public perception of the reform programme and support for the CP is limited, a recent paper by Migheli (2012) presents evidence of broad support for the CP and reform programme. It also points to declining popular support between 2001-2006, the weakening of CP legitimacy is noted by a number of other authors, especially related to issues of corruption and economic mismanagement (e.g. Fforde 2012, 2013; Thayer 2010).
148
policy guidance regarding medium-tem growth and equity goals…[…]…in a broad sense, Viet Nam can be seen
as yet another variation in the East Asian model of the developmental state. The approach has been both flexible in
the use of market instruments and pragmatic about the requirements for active state intervention to
develop infrastructure and market institutions and influence the allocation of resources to realize national
and social development goals” [emphasis added] (Van Arkadie & Mallon 2003: 253)
Van Arkadie & Mallon (2003) stress the continuity and stability of political institutions,
allowing decisive macroeconomic policy when called for, a gradualist approach to
reforms adopted through a consensus building process which lead to real ‘ownership’ of
reforms ‘facilitating profound institutional change.’128 Despite recognition of the impact
that decentralization has had on the power of the central state and the importance of
informal institutional arrangements, the state is viewed by-and-large as effective in
realizing developmental goals. Close connections between the organs of the state,
industry and agriculture have been efficacious in the formation of economic policy,
either through the active solicitation of feedback or, in some cases, lobbying for policy
change (Van Arkadie & Mallon 2003; Kerkvliet 2005).129 Part of this process has been the
formal institutionalization of informal (and if not illegal then frequently in contravention
of policy) practices followed at the local level (so-called “fence-breaking” activities),
which has also turned out to be an effective method of policy formation. This pragmatic
openness to feedback on policy is deemed to be an important element of state strength:
“The differences in [policy] interpretation partly reflect the gap that often exists between the definition of
objectives and policies at the national level and the pragmatic accommodation of the decentralized
decisions of individual actors in the economy, even when in apparent conflict with stated policies…[…]…
this pragmatic willingness to accept change resulting from decentralized initiatives is indicative of the strength of the
state.”[emphasis added] (Van Arkadie & Mallon 2003: 253)
On this account, the Vietnamese context is regarded as some variant of ‘alliance
capitalism’ (Wade 2004; Beresford 2008).130 Beeson & Pham (2012) adopt a similarly
statist line, suggesting that the Vietnamese government has been able to effectively
control ‘strategically significant parts of the economy’. They argue the state’s direction of
128 In this account there is an implied and sometimes explicit account for the big bang reforms of Eastern Europe and the Russian Federation, at the time Van Arkadie & Mallon (2003) were writing in the wake of the Asian Financial crisis a defense of the developmental state by drawing this contrast with the perceived problems of other former communist countries seemed a pressing task. 129 In this context Evans’ (1998) metaphor of ‘embedded autonomy’ is relevant see Chapter 3, section 3.2 for a fuller discussion of the term. 130 Alliance capitalism described the situtution where the state works in close alliance with the private sector to realize mutually beneficial developmental and economic outcomes. The paradigm example of this is perhaps post-war Japan.
149
the overall course of economic development, and the retention of its capacity to do so
despite pressures from the international integration of the economy, point to the
continuing usefulness of the notion of the developmental state, of which Vietnam is an
example:
“…we acknowledge that Vietnam has serious economic problems to confront and there are concerns
about the durability, transparency and efficacy of some aspects of governance in that country, nevertheless,
it has made remarkable progress in a short period of time from inauspicious beginnings, and the state has been
a central actor in this process.” [emphasis added] (Beeson & Pham 2012: 553)
In short, while these writers are well aware of the weaknesses of policy implementation,
and issues with inefficiency, lack of capacity and corruption, they understand the role of
government as being effective in realizing change where it mattered. This includes areas
such as the reform of state owned enterprises (SOEs), macro-economic management,
land rights and administration, international integration and trade, developing an
environment that in general gave encouragement to both domestic private sector and
foreign investors, and in ensuring the provision of essential infrastructure goods and
services.
5.3.3 Competitive clientism and the weak state
Although there is a considerable amount written about horse-trading over policy issues
within statist accounts, this is seen frequently in terms of disputes over ideology (e.g.
regime modernisers v’s regime conservatives), or issues relating to maintaining party
power and legitimacy within formal state institutional arrangements (Thayer 1992, 2009,
2010; Gainsborough 2010). A key weakness of the statist account of Vietnam’s transition
is its failure to address the political economy of reform in a satisfactory manner. Statist
accounts are marked by an over-emphasis of the distinction between state and society, a
superficial acceptance of policy at face value (assuming more-or-less effective policy),
and insufficient attention to informal institutional arrangements such as patronage
networks (Gainsborough 2009; Fforde 2010). There is a reluctance to grub below the
surface appearance of official policy and formal institutions to reveal the mechanisms by
which power is actually articulated.
The alternative account suggests a more nuanced, less monolithic and altogether more
heterogeneous understanding of the state and its interests. In this vein, Vuving’s (2010)

150
analysis of Vietnamese politics recognises a number of analytic groupings, regime
‘modernisers’ and ‘conservatives’, and the important geopolitical role played by the
presence of China. He also recognises a forth group, the ‘rent-seekers’ whose primary
motivation is characterised as pursing their rather narrow material self interest. The
increasing influence of ‘rent-seekers’ in the political system is attributed to the expansion
of markets in a weak institutional context. Indeed, Vuving (2010) argues that during the
Doi Moi period the interest of ‘rent-seekers’ and regime conservatives have coincided.
The desire of the conservatives to preserve administrative fiat and state control over key
productive sectors has provided ample opportunities for rent generation by the ‘rent-
seekers’. 131 As a result the ‘rent-seekers’ have been able to capture most of the
‘commanding heights’ of the economy. Painter (2008b) reaches similar conclusions about
the growth in the importance such rent-seeking behaviour over the reform period:
“Public officials, acting at first from within the state, have occupied new economic and political roles
beyond the state as they participated in and benefited from the dispersal of the state’s resources into the
market economy. Informal and illegal uses of state power and resources to facilitate economic
accumulation have taken advantage of official programs of state restructuring. State capacity in regulating
society and the market has been weakened at exactly the same time as administrative reforms sought to
strengthen it.” (Painter 2008b: 14)
Penrose et al (2007) also point to the heterogeneity of Vietnam’s political elite and
attribute the stability of the political settlement in Vietnam during the Doi Moi period to
the broad distribution of benefits between different elite factions.132 Fforde (2009, 2012b)
takes a similar tack, highlighting both the fragmented nature of the state, wide-spread
rent-seeking behaviour, and as a result an intense competition for rents. He agrees that
the CP has been able to maintain a ‘dynamic balance of political interests’ during the
1990s and 2000s (Fforde 2013). The upshot of this has been a political economy context
characterised by a ‘competitive clientism’ (Fforde 2009):
“The political economy, one may conclude, showed again that it was highly antipathetic to rent-creation,
not because individual politicians and their clients disliked it, but because behaviour comparable to
131 Gillespie (2008) notes a similar pattern, commenting “Never far below the surface was the political concern that regulatory agencies need broad licensing powers to ensure that entrepreneurs do not accumulate levels of wealth that pose a threat to party power.” (Gillespie 2008: 693) 132 It is interesting to note that Abrhami et al (2008) argue that the formal political institutions of the Vietnamese state actually place more constraints on the leadership and represent a broader distribution of power amongst party insiders. They argue that this in turn explains why Vietnam spends a large portion of its revenues in transfers, which are needed to maintain support amongst a boarder range of interest groups. This is contrasted with China, which has more concentrated political power and does not face the same pressure for redistribution as Vietnam.
151
‘competitive clientelism’ meant that, in the absence of political agreement, political competition made it
impossible to maintain the selective targeting of rents upon particular client groups. The political culture,
thus, could not cope with the concentrations of power, and the implications for the political order,
required for managing such strategies. And this has important implications for the viability of proposals for
major state interventions to alter the basic parameters of Vietnam’s growth process.” (Fforde 2009:84)133
Thus the alternative view of Vietnamese state that emerges is as one that is weaker and
more dysfunctional than the statist account would have us believe. The state is
fragmented by competition between factional interests, such as between different sectors
(i.e. ministries or productive sectors), and between different locations (i.e. provinces).134
This is also indicative of a fragmentation of power, the result of which is the inability of
the state to direct a coherent development strategy (Fforde 2012, 2011; Perkins & Vu
2010).
At the heart of the alternative account of Vietnam’s political economy lies a critique of
both the statist state-society dichotomy and the willingness to take policy and formal
institutional arrangements at face value. Gainsborough (2009, 2010) articulates the
central problem with the statist tendency to regard the ‘unitary state’ as standing separate
from an ‘undifferentiated society’:
“In much writing on the state, including on Vietnam, a blurring between public and private is depicted as
an aberration and not something which occurs in ‘developed’ Western states…[…]…it is also depicted as
something that can be put right (through ‘reform’). However, this is a distortion: public and private are
blurred in all states by definition because…[…]…the state is a conceptual abstraction (i.e. there is not a
real boundary between state and society or between public and private). That it appears otherwise is
testament to the state’s unique character as a historically contingent form of rule, and indeed this blurring,
and the policing of the boundary by those who inhabit the state, is central to how power is exercised.”
(Gainsborough 2010: 181)
Whereas statist writers tend to regard the Vietnamese polity as some kind of rational
Weberian state, maintaining its popular legitimacy through the provision of public goods
(economic development, public services, national defence etc.), from the perspective of 133 Other writers on Vietnamese industrial policy essentially subscribe to this view, for example Perkins and Vu (2010) comment: “The major problem, in our view however, is that the government’s industrial policies appear to be raising barriers to competition rather than establishing an environment where competition among industrial firms flourishes. It is not much of an overstatement to say that the relevant ministries see the main task of industrial policy as one of protecting and promoting the state owned sector.”[emphasis added] (5) 134 The relative decentralisation of the Vietnamese state and productive forces in the economy was in part a result of wartime exigencies requiring localised self-sufficiency (the district as fortress), and received opprobrium from Soviet planners in the period following reunification.
152
Fforde, Gainsborough and others this is mistaken. In fact, as Gainborough (2009)
persuasively suggests the notion of a benign developmental state can serve to obscure
and legitimise the exercise of political power. In the case of polities like Vietnam, as
Gainsborough puts it, “…politics is much more about patronage and much less about
delivering ‘public goods’ ” (Gainsborough 2009: 1326). Gainsborough (2002, 2005, 2007)
and Painter (2005, 2008a) argue convincingly there is no easy distinction to be drawn
between the public and private sectors.
The positive characterization of Vietnam’s political-economy which emerges from this
criticism of the statist position is of a polity understood largely in terms of the self-
interested pursuit of power and influence by individual actors and groups. Gainsborough
offers a telling description of the fundamental incentives facing political actors in
Vietnam:
“As old routes or opportunities for advancement are closed down, new ones need to be found. People’s
stars dim. Patrons grow old and die. Certain business interests survive, perhaps by diversifying into new
areas. Others go to the wall. Of course, some people are better operators than others, and through a
combination of luck or the fortune of their birth have more going for them. But success is never
guaranteed. In the face of interventions - what are often referred to as ‘reforms’ – which seek to upset
what people are doing, the system constantly reinvents itself to ensure that its underlying money-making
and prestige-seeking functions are not upset. However, for the reasons just outlined, the system never
entirely stays the same.” (Gainsborough 2010: 179-180)135
Typically, questions of policy, reform and long-term developmental goals simply do not
feature in the day-to-day decision making upon which constitutes the political-economy,
and upon which those dynamic processes supervene:
“For most actors, debates about reform or policy choices, or the consequences of World Trade
Organisation membership and such like, are not their day-to-day concern. Instead, surviving, getting things
done, using one’s connections, and paying people off, all in the system are key, whether it be through
135 An important point to note, of relevance to the more ontological concerns of this thesis, is that what Gainsborough describes here seems to be tantamount to an evolutionary understanding of the political economy, Fforde is much more explicit in his advocacy for an evolutionary understanding of Vietnam’s political economy: “…since the empirics support an evolutionary and endogenous view of change in Vietnam, leading to a stress on process rather than on comparative statics, I will argue that neo-classical approaches have only limited value. In my view, processes of change are best viewed as evolutionary, with economic logics interacting with others, and the Vietnam case study provides evidence to support this. But how does the support arise? For me, the key entry point to understanding the literature is the treatment of policy, and the role given to it in explanations of systemic change.” (Fforde 2010: 128)
153
doing business, exploiting a regulatory position, or milking the international donor community. This is the
day-to-day stuff of politics.” (Gainsborough 2010: 180)
Expanding on this understanding of the Vietnamese polity, there are three factors salient
to our concerns, i) the role of uncertainty; ii) the fragmentation of the state; and, iii) the
ambiguous role of policy. Firstly, on the role of uncertainty in the political economy,
Gainsborough (2010) points out that the institutional and regulatory environment is one
characterised by uncertainty. Laws, policies and regulations are frequently ambiguous,
contradictory and unenforced, effectively supplanted by, or in conflict with informal
institutional norms. Gillespie (1994) notes a similar and illustrative confusion relating to
the profusion of legal documentation:
“While the prime minister may issue decrees and instructions, ministers may issue decrees and resolutions.
In practice these instruments are often treated as if they possess a similar legislative authority. People's
Committees add to the confusion by enacting subordinate legislation that duplicates, and at times
contradicts, provisions passed at the national level. Additional confusion arises from the power of the
National Assembly to abrogate instruments passed by the Standing Committee, the prime minister, or the
ministries, while the prime minister may abrogate instruments passed by ministers and People's
Committees.” (Gillespie 1994: 4)
This uncertainty functions as a means of control. A direct result of this uncertainty is that
people are always vulnerable and therefore dependent upon patronage networks for
protection (Gainsborough 2010). Of course, the level of uncertainty may be greater in
some areas that others. For example, the perception is that there have been significant
efforts to reduce uncertainty for foreign investors where this does not conflict with the
interests of existing elites. But, for politicians, administrators and businessmen the high
level of uncertainty means that cultivating their links to powerful political players is much
more important than knowing the law.
Secondly, the fragmentary nature of the state with power dispersed widely between
different groups such as provinces, ministries and SOEs (see for example Jandl 2012)
results in the inability of state agencies to coordinate their activities. The existence of
overlapping, duplicate or contradictory legislation is indicative of this fragmentation. Of
equal interest is the inability of ministries or SOEs to coordinate their planning or
investment activities. Agencies frequently do not share information, even where close
connections exist ostensibly public owned information is treated as a commodity to be
154
bought and sold. Investment planning and investment fund allocation are similarly
subject to “competitive clientism”, meaning that investment projects are not developed
on a purely rational basis and determined by where the (public) need is greatest, but on
the basis of patronage and maintaining consensus. Pincus & Vu (2008) describe this
tendency:
“Vietnamese institutions are characterized by ambiguous lines of authority and consensus decision-making.
On the plus side, Vietnamese politics has been marked by stability. But consensus-based decision-making
has also reinforced a tendency to distribute rents widely across the system. This problem is evident in the
allocation of public investment. Vietnamese politicians approve 10 projects when one will do, and spread
them across the landscape. For example, Vietnam is building a string of deep sea ports in central Vietnam
despite the fact that port infrastructure in the southern provinces of Ho Chi Minh City, Dong Nai, Binh
Duong and Ba Ria Vung Tau-which together comprise more than 50% of Vietnam's job growth and
nonoil budget revenues-is stretched to the breaking point.” (Pincus & Vu 2008: 31)
The structure of state institutions compounds the fragmentary and uncertain nature of
the Vietnamese state. State institutions are characterized by duplicated and overlapping
remits, reporting lines and authorities. For example, provincial line agencies
(Departments) at the provincial level are answerable to both the Provincial People’s
Committee (PPC) (the administrative arm of government at the provincial level) and
their associated line ministry. A Department of Construction at the provincial level will
report to both the Ministry of Construction and the Provincial People’s Committee. This
is further complicated by overlapping responsibilities to the provincial CP and (nominally
at least) the Provincial People’s Councils. Moreover, the dual role of ministries mean they
effectively ‘own’ and control key SOEs136 while also making legislation, which affects
SOE operations. The picture is complex, but serves to emphasize the degree of
uncertainty in navigating what is at the best of times a byzantine state bureaucracy.137
Thirdly, and closely related to the first two points is the ambiguity of policy. Given the
uncertainty surrounding implementation, policy consistency and the contravention of
established informal institutional norms implied by policy, it is frequently difficult to
know how to interpret formal policies. Fforde (2010) makes the case that the
136 Many ministires and provinces own or maintain a controlling interest in large SOEs related to their ministerial and provincial remits. For example, MoC in construction and cement production. 137 Sharma and Minh Do note that the energy sector is also plagued by poor coordination by different ministries and other agencies (2011).
155
developmental activities of the Vietnamese state cannot be considered as consisting of
‘insulated policy making and implementation’ (Fforde 2010: 128). Fforde dubs what he
deems the over-emphasis on formal institutions and policy making found in some
accounts (particularly those of the donors) a ‘policy fetishism’. A number of other writers
agree, arguing that policy is frequently not effectively implemented (e.g. see Thayer
2013a, 2013b on the implementation of anti-corruption policy). Nevertheless, it would be
wrong to think of policy as purely epiphenomenal, while in many cases it may well be it
also potentially serves a number of purposes. Sometimes policy does signal a commitment
to a particular intervention, elsewhere policy serves to legitimise the role of the CP and
state, and in still other circumstances policy is entirely serious. Sometimes policy is
implemented sometimes it isn’t, and the reasons are an admixture of capacity and
inclination. The lack of policy certainty, coordination and the (closely related) pursuit of
the vested interests of a fragmented polity also act to condition policy outcomes.
Despite the weakness of the Vietnamese state in some respects, it is important to bear in
mind that, one way or another, the Vietnamese state has actually been relatively
successful in the provision of basic public goods. Whatever the motivation for the
allocation of resources to better infrastructure or poverty reduction programs, and
irrespective of the efficiency of this investment, the evidence of improvement in the
provision of broad public goods is pretty incontrovertible. Even if we accept that at the
macro-economic level the story of the reform period is better understood as good luck
rather than good management (Fforde 2009), and even if politics is more about
patronage than a rational provision of public goods (Gainsborough 2010), this does not
preclude the effective design and implementation of rational policy interventions.
Moreover, if the provision of public goods is an intrinsic part of Vietnam’s particular
political settlement, then where the provision of these goods requires the application of
technical skills – then rational policy decisions, which are more-or-less realized in
concrete outcomes must be part of the process. If there is broad agreement about the
performance based legitimacy of the state, and if the public goods delivered to earn this
legitimacy are dependent upon the effective formation and implementation of rational
policies – then we cannot dismiss policy or the role of technical knowledge in its
formation. And this point has been central to the arguments presented in Chapters 2, 3
and 4, it must be an intrinsic part of the way in which incumbents have been able to
156
create and recreate a particular disposition of power. When seeking to understand the
causal processes behind particular outcomes, the question then becomes, not so much a
case of dismissing rational policy formation and effective implementation, but one of
better understanding how the activities of elites are constrained and circumscribed by
material conditions, and how technical knowledge and policy choice relate to this.
5.4 Conclusions: Implications for the ESI
This last point is particularly germaine to our understanding the political economy of the
ESI. The technical complexity and material wherewithal required for the provision of
electricity services is substantial (Chapter 4). The central importance of the ESI in the
generation of a broad range of goods in a modern economy - public and private, licit and
illicit results in a particular political sensitivity to certain aspects of the ESIs technical
performance (in terms of ensuring the quantity and quality, and price of electricity) in
virtue of the public goods it provides. Whatever else the ESI can provide (tax revenues,
investment opportunities, natural resource rents, kick-backs etc.), at bottom, an
important component of CP legitimacy rests upon the technical performance of the ESI.
Ensuring adequate technical performance in the ESI implies the complex mobilisation,
allocation and management of resources. This requires informed and effective decision
making and a coordinated coherent organization. The provision of electrical energy may
be the paradigm example of this. In short, it requires state capacity for the sector to
function in a satisfactory manner.
On the other hand, certain aspects of the ESI lend themselves to the exercise of
discretionary power in the pursuit and preservation of rents and quasi-rents, which
abound in the sector (Chapter 4, Table 4.4). 138 It is in these spaces, where the
contestation of rents and quasi-rents is feasible (i.e. without threatening the ‘whole
show’),139 that the play of political power is likely to be important. Given the argument
presented above, we do not expect to find rational Weberian bureaucratic structures
engaged in rent management for the provision of developmental goods operating in
these spaces, rather, we expect to find vested interests engaged in a version of
competitive clientism.
138 i.e. in the slack afforded by weak feedback mechanisms. 139 We borrow this from Gainsborough (2010) that is without upsetting the political settlement or equilibrium.
157
The task of the analysis of Vietnam’s ESI is therefore to start understanding where the
shifting boundary between the material, technical and financial constraints and the
exercise of power itself occurs. To do this, we need to understand the material
conditions of the ESI, the techno-economic paradigm, which determines the perceptions
of material possibilities within the sector, the institutional arrangements, which
intermediate the generation and distribution of benefits in the sector, and how this seems
to relate to the articulation of holding power in the ESI. It is this to which we move in
Chapter 6.
158
Chapter 6: The political economy of the power sector in Vietnam 6.1 Introduction
The arguments presented in Chapters 2 and 3 suggested that when considering the
process of technological change, either from the perspective of technological innovation
and diffusion, or from the perspective of economic catch-up, the political economy is
likely to be an important factor. In both cases, we have argued that technological change
is often not distributionally neutral. This is especially likely to be the case when we are
considering radical technological change such as a transition to ‘low carbon’ energy
systems, or the process of industrialisation and economic development. This is because
these types of technological change imply a significant change in the types and magnitude
of rents that are generated by the application of technologies in the process of
production, and thus changes the way rents are distributed.
Rents are the material wherewithal through which societal power (following Khan (2010)
what we have characterised as ‘holding power’), is generated. The preservation and
dynamic recreation of holding power depends upon the maintenance of rents. To the
extent that technological change creates new streams of rents or disrupts established
rental streams they also have the potential to disrupt the distribution of holding power.
Thus we have argued technological change can have important political economy
implications. It can change the distribution of rents and as a consequence holding power.
Conversely, the political economy context is likely to influence the potential for
technological change. If technological change threatens established rent streams and the
disposition of holding power then it is likely to be resisted. Thus, very generally speaking,
the political economy is seen as both a consequence of technological systems and also a
condition for technological change.
While rents are generated through the process of production, their distribution is
intermediated by (formal and informal) institutional arrangements. As we have argued in
Chapters 2 and 3, institutional arrangements typically co-develop with technological
systems. At the same time as they enable technologies they also determine the
distribution of rents. For example, rights to fossil fuel extraction allow right holders to
appropriate associated natural resource rents, and at the same time enable the
159
exploitation of those resources. Similarly, IPRs allow their holders to appropriate rents
for innovation and patron-client relationships may entitle the patron to kickbacks.
Chapters 2 and 3 outlined the analytical contours of our account, but the broad concepts
they sought to elucidate said very little about how those concepts were instantiated in
particular technological systems or political economy contexts. A consequence of the
evolutionary micro-foundations (adopted in Chapter 2) is that we would expect historical
contingency to affect the dynamics of particular technological systems and institutions
and lead to divergent outcomes. In seeking to apply this approach to an empirical case it
therefore becomes important to elaborate how particular technological and political
economy processes developed.
Chapter 4 sought to concentrate on the ESI, representing as it does a set of similar
general-purpose technologies that are found the world over. The objective was to help
sort out on one hand, typical systematic elements of the system attributable to its
fundamental technological and economic characteristics, and on the other hand, the
aspects of the system which might be thought of as more properly attributable to
institutional and political-economy factors.
More substantively, in respect to the ESI, Chapter 4 found that technical and economic
efficiencies of scope and scale, and the need for centralised management and control of
electricity systems mean that electricity supply systems have typically been monopolies.
The concentration of market power in the hands of monopolistic firms, as might be
expected, was from the get-go politically fraught. Moreover, both the strategic
importance of the sector in terms of ensuring productivity and economic
competitiveness, and the ubiquity of electricity, which quickly came to be regarded as an
essential public service, served to reinforce the sector’s political significance. The sheer
scale of resources sunk in electricity generation and distribution has necessitated political
intervention in one form or another in facilitating investment in the sector. Finally, the
ESI has been an important source of rents (from various sources), as a result it is an
important locus for the creation and recreation of societal power. In short, the ESI
seems to be a sector where the political economy plays an important role.
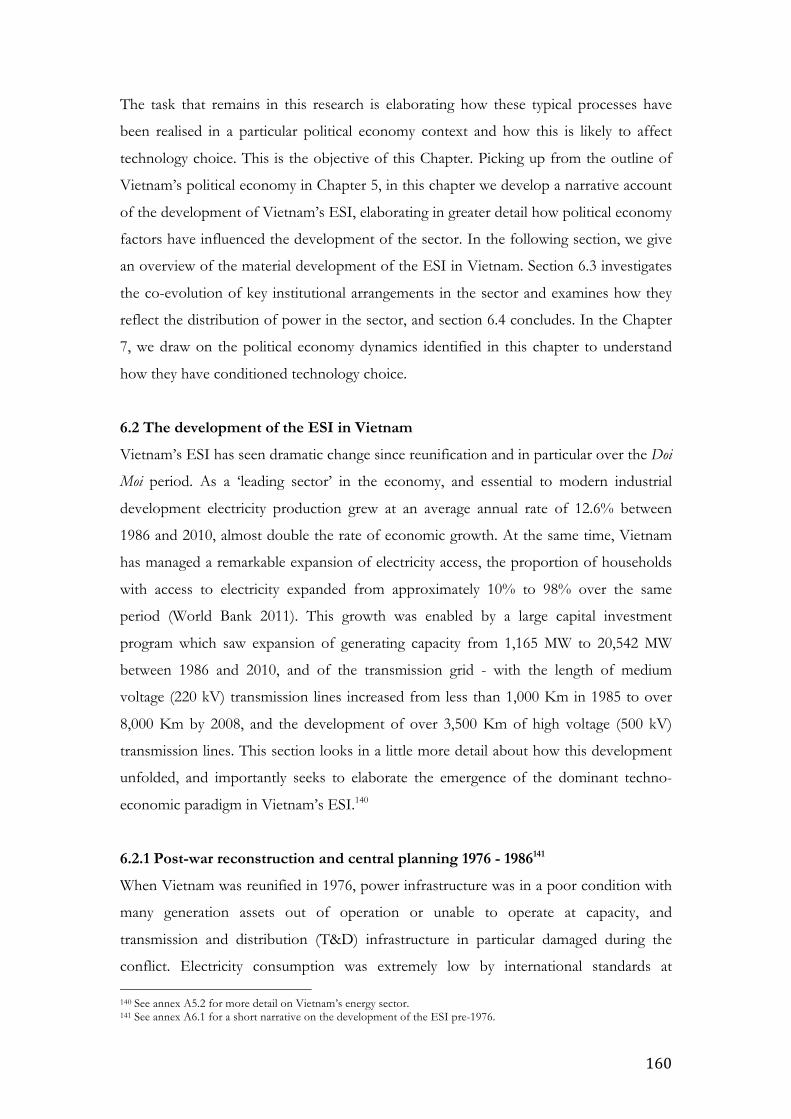
160
The task that remains in this research is elaborating how these typical processes have
been realised in a particular political economy context and how this is likely to affect
technology choice. This is the objective of this Chapter. Picking up from the outline of
Vietnam’s political economy in Chapter 5, in this chapter we develop a narrative account
of the development of Vietnam’s ESI, elaborating in greater detail how political economy
factors have influenced the development of the sector. In the following section, we give
an overview of the material development of the ESI in Vietnam. Section 6.3 investigates
the co-evolution of key institutional arrangements in the sector and examines how they
reflect the distribution of power in the sector, and section 6.4 concludes. In the Chapter
7, we draw on the political economy dynamics identified in this chapter to understand
how they have conditioned technology choice.
6.2 The development of the ESI in Vietnam
Vietnam’s ESI has seen dramatic change since reunification and in particular over the Doi
Moi period. As a ‘leading sector’ in the economy, and essential to modern industrial
development electricity production grew at an average annual rate of 12.6% between
1986 and 2010, almost double the rate of economic growth. At the same time, Vietnam
has managed a remarkable expansion of electricity access, the proportion of households
with access to electricity expanded from approximately 10% to 98% over the same
period (World Bank 2011). This growth was enabled by a large capital investment
program which saw expansion of generating capacity from 1,165 MW to 20,542 MW
between 1986 and 2010, and of the transmission grid - with the length of medium
voltage (220 kV) transmission lines increased from less than 1,000 Km in 1985 to over
8,000 Km by 2008, and the development of over 3,500 Km of high voltage (500 kV)
transmission lines. This section looks in a little more detail about how this development
unfolded, and importantly seeks to elaborate the emergence of the dominant techno-
economic paradigm in Vietnam’s ESI.140
6.2.1 Post-war reconstruction and central planning 1976 - 1986141
When Vietnam was reunified in 1976, power infrastructure was in a poor condition with
many generation assets out of operation or unable to operate at capacity, and
transmission and distribution (T&D) infrastructure in particular damaged during the
conflict. Electricity consumption was extremely low by international standards at 140 See annex A5.2 for more detail on Vietnam’s energy sector. 141 See annex A6.1 for a short narrative on the development of the ESI pre-1976.
161
approximately 47 kWh/capita. Only around 2.5% of the rural population had grid access.
The years immediately after the end of the war were marked by the rehabilitation of the
ESI. By 1978 much of the available capacity was back in use and electricity production
had increased to 3.8 TWh, a 60% increase from 1976 (World Bank 2011b; World Bank
2013).
The period up to 1985 was marked by three separate infrastructure development trends
in the sector. The first and the most significant was the large expansion of generation
capacity that got underway with the construction of a number of large coal fired thermal
and hydropower plants. In the north, coal-fired plants at Ninh Binh (100 MW) and an
extension at Uong Bi (bringing the installed capacity to 105 MW) were commissioned in
1976. Work also started on the large 1,900 MW Hao Binh hydropower project in 1979, in
1980 on the 440 MW coal fired thermal plant in Pha Lai, Hai Duong province and in
1986 on the 400 MW An Tri hydropower plant in Dong Nai province (Cosslette & Shaw
1987; World Bank 2011a).142 All these large plants (mostly situated in the northern part of
Vietnam) were built with Soviet technical and financial assistance.143
Secondly, at the same time, in the more remote and mountainous areas of the country
there was significant expansion of small and very small hydropower generation units
linked to local or mini-grids. Small hydropower projects were typically developed by
cooperatives, local communities and military units, often with financial support from the
provincial authorities. It is also estimated that in the region of 150,000 pico-hydropower
units were installed during this period (Meier 2013).
Thirdly, there was also considerable extension of the medium voltage network, with 220
kV lines being expanded from 257 Km in 1975 to 904 Km in 1985 (EVN 2009a). The
expansion of the grid network at this time did imply some increase in the proportion of
on-grid households, but the priority – guided by the precepts of central planning – was
productive sectors, with rural electrification efforts focused on the provision of power to
irrigation pumps in important rice growing areas (World Bank 2011).
142 Hao Binh remains the largest hydropower plant in SE Asia. 143 As Wyatt notes Soviet financial and technical assistance remained important even after the collapse of the USSR for environmentally damaging hydropower projects that IFIs shunned such as Se San 3 and Son La (Wyatt 2002).
162
Despite developments of the physical infrastructure, as with much else in the command
economy in the years between reunification and the adoption of Doi Moi policies, the ESI
was not functioning particularly well. The sector suffered from shortages of fuel and
spare parts, there had been limited capacity expansion, there were continuing significant
transmission and distribution losses (estimated to be around 20% Figure 6.1), power cuts
were common and production grew only slowly. On the eve of the extensive economic
reforms heralded by Doi Moi in 1986, Vietnam’s annual power consumption was
approximately 4.4 TWh, with only 1,165 MW of installed capacity (England & Kammen
1993; World Bank 2011). Per capita power consumption was at a level of just 73 kWh -
one of the lowest levels of energy and electrical power consumption in the world at the
time, ranked 104th out of 114 countries (World Bank 2011b). Little in-road had been
made in the development of a national grid, southern and northern Vietnam had separate
power systems, and the central region was still served by a number of small-disconnected
local grids. The stagnation of the sector impeeded industrial productivity forcing many
industrial facilities to operate at less than 50 % capacity (Cosslette & Shaw 1987;
England & Kammen 1993; EVN HCMC 2012). Due to the poor supply situation many
industries and essential services relied on isolated (i.e. off-grid) generation facilities
(England & Kammen 1993). Similarly, while progress had been made in improving
access to electricity, only around 10% of rural households had grid access by 1986
(Figure 6.3).
Notwithstanding this poor performance, it is a point often made by writers on Vietnam
that the roots of the rapid economic growth seen in the period following Doi Moi lay in
the post-war period. When commenting on economic reforms the importance of this
period lies in the emphasis placed upon the inability of the center to exert adequate
control on the disparate parts of the economy, and the creeping commercialization of
many enterprises that was able to flourish in these conditions (e.g. see Ffrode 2007). By
contrast, the rapid expansion of the ESI and the development of a centralized national
grid in the three decades following Doi Moi was an important prerequisite for industrial
growth. This was underwritten by the implementation of large state lead heavy
engineering projects, which were in many ways central to the Stalinist, state-led
development paradigm. The massive expansion of capacity and electricity production
that the large Soviet funded projects entailed set the scene for the dramatic
transformation of the ESI in Vietnam, enabling the development and expansion of a
163
national grid, and provided critical inputs to Vietnam’s rapid industrial growth in
subsequent years.
Figure 6.1. Transmission and distribution losses selected Asian countries 1971 - 2010
Source: IEA 2013
6.2.2 Building socialism, building a techno-economic paradigm
The development of the ESI in Vietnam in the post war period was only influenced by
the availability of Soviet technology and capital. The overall system design, institutional
arrangements, culture and ideology of the power sector, under the tutelage of Soviet
engineers and planners was heavily influenced by a broader ideological approaches linked
to socialist notions of development. Coopersmith (1993) noted the dominant techno-
economic paradigm in the ESI of a centralised, large scale national electricity grid run by
vertically integrated, state owned utilities had a particular resonance with the Soviet
economic development policies. Electrification and the development of the ESI stood at
the heart of Soviet-style development (Williams & Dubash 2004). The role of the ESI in
a command economy was as a leading sector in modernisation and development, and
essential for the forced industrialisation that was at the core of the central planning ideal
(Chapter 4, section 4.2.2-3). The emphasis on large power plants, particularly
hydropower and a faith in engineering solutions were important elements of the techno-
economic ideal.
Thus large scale Soviet assistance in the post war years was not only a question of
transferring material technologies to Vietnam, but of also the transfer of technological
know-how, of ways of addressing problems and of understanding the ESI (section 4.2.1).
This body of knowledge was transmitted by cadres of Soviet planners and engineers
0"
5"
10"
15"
20"
25"
30"
35"
1971" 1976" 1981" 1986" 1991" 1996" 2001" 2006"
%"of"o
utpu
t"
China&
India&
Japan&
Philippines&
Thailand&
Vietnam&
164
involved in building Vietnam’s ESI, through the technical training offered to the large
number of Vietnamese professionals who passed through higher education institutes in
the USSR and other Eastern European countries, and through the development of many
of the higher education and technical institutes in Vietnam (Mazyrin & Moscow 2010).
This represented not only the transfer of financial capital, physical resources and
embodied technologies but the transfer of a whole techno-economic paradigm, its
institutions and the know-how that went with it. This established an approach to the
development and operation of the ESI in Vietnam amongst the cadres of power
engineers and planners that continues to this day in many ways to dominate thinking
about the ESI.
Quinn (1998) in a critical review of Vietnam’s power sector notes this tendency in
Vietnam, in common with other transitional economies:144
“In most transition economies, power systems were designed by engineers, not economists. The
fascination with proving the success of the [centrally planned] economic system through the work of its
engineers was a key ingredient of centrally planned systems. When capital has no value, projects tend to
favour massive technically complicated investments over smaller proven technologies. This was certainly
the case in Vietnam where large resources were (are being) spent on the development of large hydroelectric
facilities, which now make up the majority of Vietnams’ power resources. The most important issue on
the supply side for transition economies is assigning value to capital and having that value guide investment
decisions rather than other factors.” (Quinn 1998: 2)
Quinn over-states his case. Large hydropower was attractive at the time for a number of
other reasons. Firstly, hydropower was a mature and well-understood technology at the
time. Secondly, the capital, technology and engineering wherewithal were made available
on very favourable terms to Vietnam from the USSR (see below). And thirdly, it is far
from clear that hydropower represented a more expensive alternative to thermal
generation, i.e. hydropower may have been cheaper.145
Nevertheless, Coopersmith (1993) observed that the Soviet style development of the ESI
was out of synch with conventional economic logic in terms of promoting least cost,
incremental capacity expansion based upon urban load centres. Vietnam also opted for
the mega-project in Hoa Binh and the national transmission grid to match, rather than an 144 i.e. former communist countries. 145 It is certainly now the case that the best hydropower projects in the region tend to be cheaper than alternative technologies (see for example MRC 2009).

165
incremental expansion based on existing capacity. The short term impact of Hoa Binh
was that in the early 1990s coal plants in the north of the country were running at around
25% of capacity and the coal industry at about 50% of capacity (World Bank 1993). A
more long-term impact of an over emphasis on hydropower has been the vulnerability of
the ESI to hydrological risks which would plague in later years. The observation that
there was an inherent bias towards engineering solutions in a centrally planned economy
and has been amply reflected in the techno-economic paradigm prevailing in Vietnam’s
ESI is undoubtedly true. Moreover, this emphasis on hydropower and the development
of an influential group of hydropower engineers with a clear vested interest in developing
this technology, would continue to have influence at the ESI utility and affiliated energy
planning intuitions that would shape the industry of years for years to come.
A second strand to the development of the ESI and its techno-economic paradigm was
the importance of the ESI ideologically. Thayer (2010) has noted (section 5.4.1) in the
immediate post war period the legitimacy of the CP was closely tied to both nationalism
and nation building, but also performance in terms of building socialism and delivering
the material goods associated with this. In this context, the development of the ESI was
emblematic of the reach, legitimacy and benevolence of the CP. Hydropower plants in
particular, claimed to offer the multiple benefits of electrification, irrigation, flood
control, Thai’s (2000) gushing account marking 10 years of electricity production at the
Hoa Binh dam serves to illustrate:
“Start-up of the first [generation] set was celebrated by the entire Vietnamese nation. The many thousands
of Vietnamese and Soviet hydraulic builders, who had labored unselfishly in constructing the hydroproject
for nine years, celebrated an inordinate victory on this date. Since that time, the Hoa Binh hydroproject has
actively proceeded to make a major contribution to the solution of four critical national-economic
problems…[…]…the most acute deficit of electric power, which had put the country's national economy
to the test at that time, was mitigated. The risk of catastrophic flooding in the Red River Delta, where 15
million people reside and the capital of the Socialist Republic of Vietnam - Hanoi - is located, has been
significantly reduced as a result of flood-flow regulation by the reservoir. The shortage of water for
irrigation over an area of more than one million ha has been compensated during the low-water period of
the year. Navigation on the Da-Red River system has been appreciably improved.” (Thai 2000: 130)
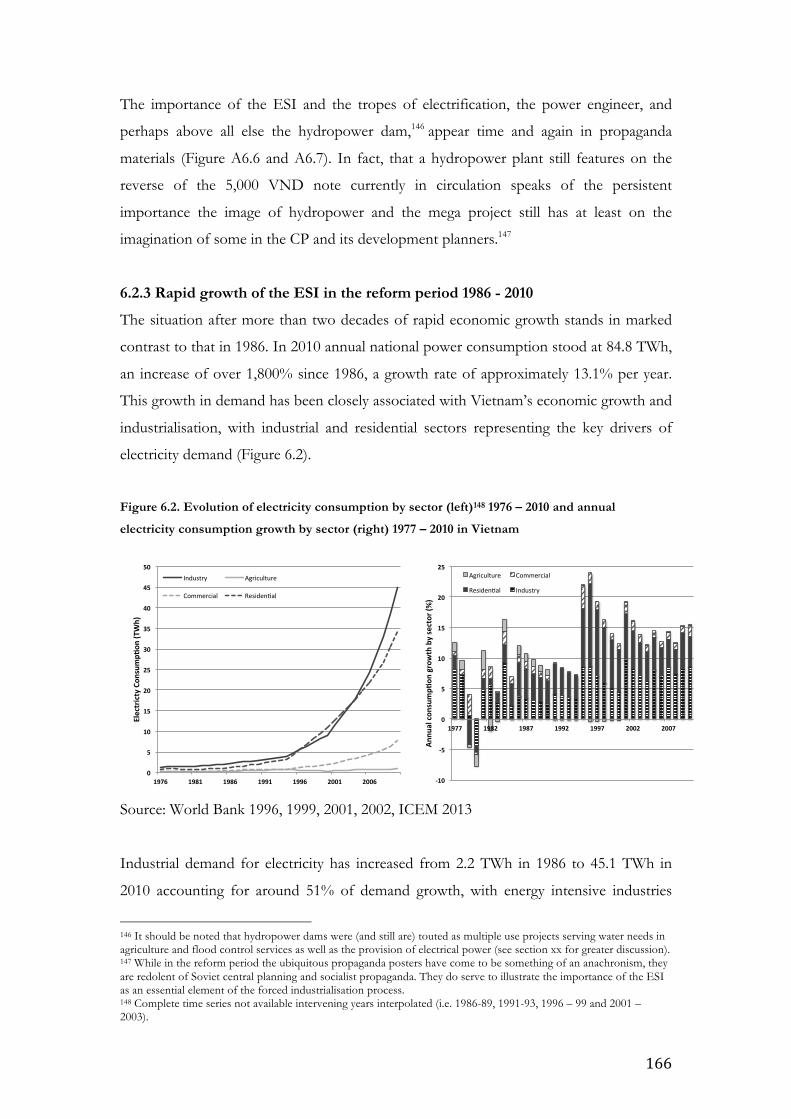
166
The importance of the ESI and the tropes of electrification, the power engineer, and
perhaps above all else the hydropower dam,146 appear time and again in propaganda
materials (Figure A6.6 and A6.7). In fact, that a hydropower plant still features on the
reverse of the 5,000 VND note currently in circulation speaks of the persistent
importance the image of hydropower and the mega project still has at least on the
imagination of some in the CP and its development planners.147
6.2.3 Rapid growth of the ESI in the reform period 1986 - 2010
The situation after more than two decades of rapid economic growth stands in marked
contrast to that in 1986. In 2010 annual national power consumption stood at 84.8 TWh,
an increase of over 1,800% since 1986, a growth rate of approximately 13.1% per year.
This growth in demand has been closely associated with Vietnam’s economic growth and
industrialisation, with industrial and residential sectors representing the key drivers of
electricity demand (Figure 6.2).
Figure 6.2. Evolution of electricity consumption by sector (left)148 1976 – 2010 and annual
electricity consumption growth by sector (right) 1977 – 2010 in Vietnam
Source: World Bank 1996, 1999, 2001, 2002, ICEM 2013
Industrial demand for electricity has increased from 2.2 TWh in 1986 to 45.1 TWh in
2010 accounting for around 51% of demand growth, with energy intensive industries
146 It should be noted that hydropower dams were (and still are) touted as multiple use projects serving water needs in agriculture and flood control services as well as the provision of electrical power (see section xx for greater discussion). 147 While in the reform period the ubiquitous propaganda posters have come to be something of an anachronism, they are redolent of Soviet central planning and socialist propaganda. They do serve to illustrate the importance of the ESI as an essential element of the forced industrialisation process. 148 Complete time series not available intervening years interpolated (i.e. 1986-89, 1991-93, 1996 – 99 and 2001 – 2003).
0"
5"
10"
15"
20"
25"
30"
35"
40"
45"
50"
1976" 1981" 1986" 1991" 1996" 2001" 2006"
Electricty"Con
sump;
on"(T
Wh)"
Industry) Agriculture)
Commercial) Residen5al)
A10"
A5"
0"
5"
10"
15"
20"
25"
1977" 1982" 1987" 1992" 1997" 2002" 2007"
Annu
al"con
sump;
on"growth"by"sector"(%
)"
Agriculture) Commercial)
Residen5al) Industry)
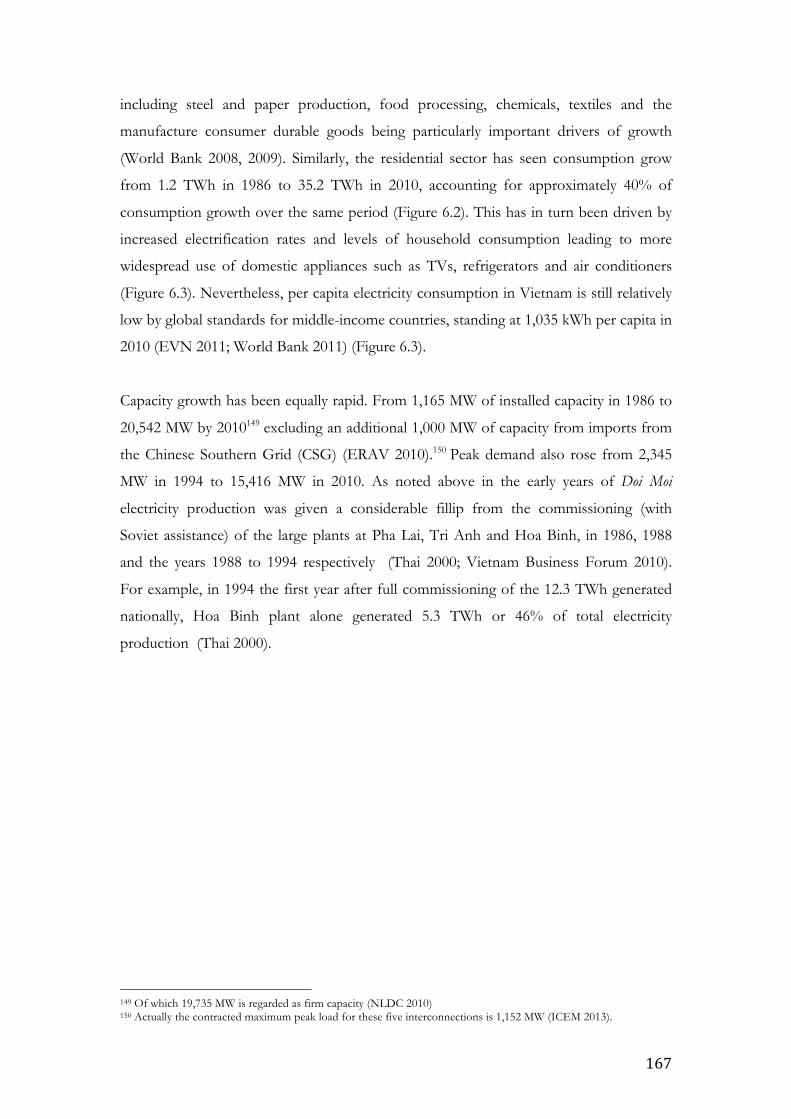
167
including steel and paper production, food processing, chemicals, textiles and the
manufacture consumer durable goods being particularly important drivers of growth
(World Bank 2008, 2009). Similarly, the residential sector has seen consumption grow
from 1.2 TWh in 1986 to 35.2 TWh in 2010, accounting for approximately 40% of
consumption growth over the same period (Figure 6.2). This has in turn been driven by
increased electrification rates and levels of household consumption leading to more
widespread use of domestic appliances such as TVs, refrigerators and air conditioners
(Figure 6.3). Nevertheless, per capita electricity consumption in Vietnam is still relatively
low by global standards for middle-income countries, standing at 1,035 kWh per capita in
2010 (EVN 2011; World Bank 2011) (Figure 6.3).
Capacity growth has been equally rapid. From 1,165 MW of installed capacity in 1986 to
20,542 MW by 2010149 excluding an additional 1,000 MW of capacity from imports from
the Chinese Southern Grid (CSG) (ERAV 2010).150 Peak demand also rose from 2,345
MW in 1994 to 15,416 MW in 2010. As noted above in the early years of Doi Moi
electricity production was given a considerable fillip from the commissioning (with
Soviet assistance) of the large plants at Pha Lai, Tri Anh and Hoa Binh, in 1986, 1988
and the years 1988 to 1994 respectively (Thai 2000; Vietnam Business Forum 2010).
For example, in 1994 the first year after full commissioning of the 12.3 TWh generated
nationally, Hoa Binh plant alone generated 5.3 TWh or 46% of total electricity
production (Thai 2000).
149 Of which 19,735 MW is regarded as firm capacity (NLDC 2010) 150 Actually the contracted maximum peak load for these five interconnections is 1,152 MW (ICEM 2013).
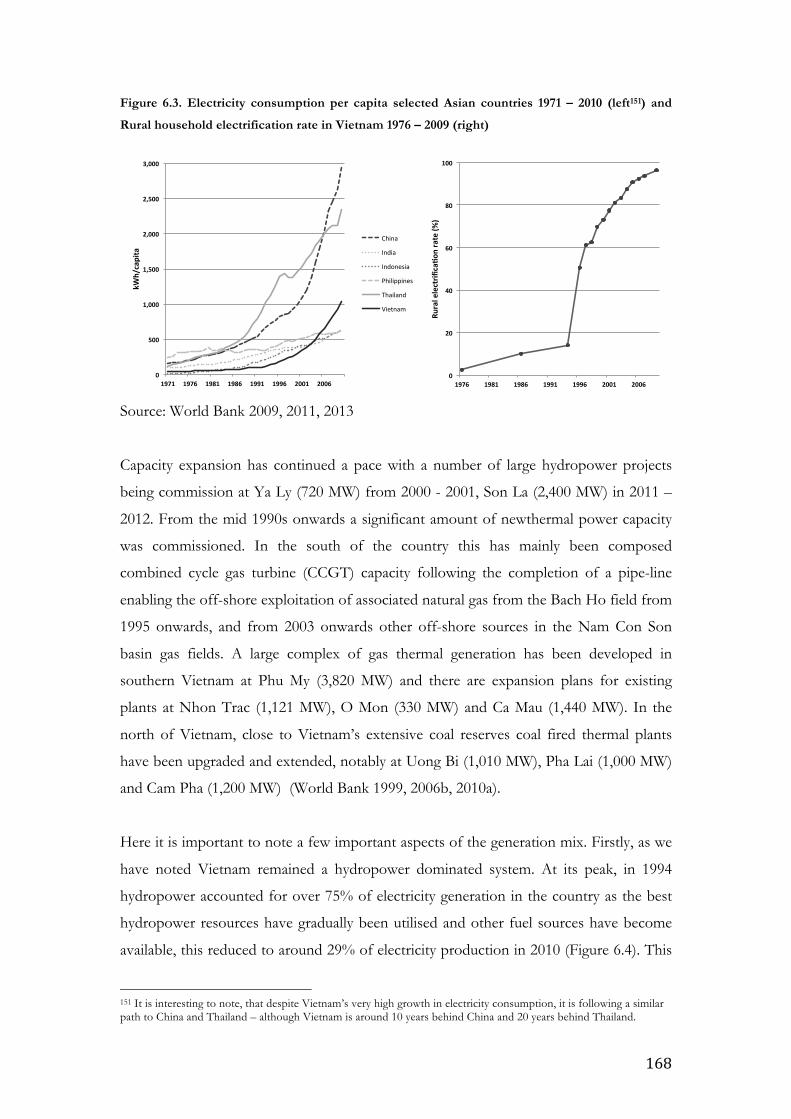
168
Figure 6.3. Electricity consumption per capita selected Asian countries 1971 – 2010 (left151) and
Rural household electrification rate in Vietnam 1976 – 2009 (right)
Source: World Bank 2009, 2011, 2013
Capacity expansion has continued a pace with a number of large hydropower projects
being commission at Ya Ly (720 MW) from 2000 - 2001, Son La (2,400 MW) in 2011 –
2012. From the mid 1990s onwards a significant amount of newthermal power capacity
was commissioned. In the south of the country this has mainly been composed
combined cycle gas turbine (CCGT) capacity following the completion of a pipe-line
enabling the off-shore exploitation of associated natural gas from the Bach Ho field from
1995 onwards, and from 2003 onwards other off-shore sources in the Nam Con Son
basin gas fields. A large complex of gas thermal generation has been developed in
southern Vietnam at Phu My (3,820 MW) and there are expansion plans for existing
plants at Nhon Trac (1,121 MW), O Mon (330 MW) and Ca Mau (1,440 MW). In the
north of Vietnam, close to Vietnam’s extensive coal reserves coal fired thermal plants
have been upgraded and extended, notably at Uong Bi (1,010 MW), Pha Lai (1,000 MW)
and Cam Pha (1,200 MW) (World Bank 1999, 2006b, 2010a).
Here it is important to note a few important aspects of the generation mix. Firstly, as we
have noted Vietnam remained a hydropower dominated system. At its peak, in 1994
hydropower accounted for over 75% of electricity generation in the country as the best
hydropower resources have gradually been utilised and other fuel sources have become
available, this reduced to around 29% of electricity production in 2010 (Figure 6.4). This
151 It is interesting to note, that despite Vietnam’s very high growth in electricity consumption, it is following a similar path to China and Thailand – although Vietnam is around 10 years behind China and 20 years behind Thailand.
0"
20"
40"
60"
80"
100"
1976" 1981" 1986" 1991" 1996" 2001" 2006"
Rural"electrifi
ca4o
n"rate"(%
)"
0"
500"
1,000"
1,500"
2,000"
2,500"
3,000"
1971" 1976" 1981" 1986" 1991" 1996" 2001" 2006"
kWh/capita"
China&
India&
Indonesia&
Philippines&
Thailand&
Vietnam&

169
dominance has been a mixed blessing. The system has benefitted from cheap, relatively
clean electricity from hydropower but this has meant the system is vulnerable to power
shortages in the dry season which continue to plague the sector (England & Kammen
1993; Wyatt 2002; Nguyen 2005; Phong 2013; Daiss 2012). Secondly, both gas and coal
fired generation technologies have become much more important, the availability of
these resources - coal in the north and gas in the south – has lead the national ESI to
have distinctly regional characteristics (Figure 6.5; World Bank 1999, 2006). Finally, due
to the continuing need for load shedding (particularly at times when hydropower is not
available) off-grid isolated generation from diesel or heavy fuel oil is in all likelihood
considerably more important in some sectors than the figures suggest.
Figure 6.4. Evolution of the electricity generation mix in absolute terms (left) and as a proportion
of production (right) 1971 – 2010 in Vietnam152
Source: IEA 2013
The extensive capacity additions and especially the large hydropower plants played an
important role in the development and expansion of the national grid in Vietnam.
Following capacity additions in the late 1980s, there had been considerable acceleration
in the expansion of medium voltage (220 kV) and low voltage (110 kV) systems, which
also enabled the expansion of rural electrification (Figure 6.8; World Bank 2011). These
developments were dependent upon capacity expansion in the three separate power
systems in the north, centre and south of the country. It was not until 1992 that the
development of a unified national electricity grid got underway spurred by the
152 This excludes imports from China which were 5.6 TWh in 2010, or approximately 5.6% of electricity supply.
0"
10"
20"
30"
40"
50"
60"
70"
80"
90"
100"
1971" 1976" 1981" 1986" 1991" 1996" 2001" 2006"
TWh"
Renewables)Oil)Natural)Gas)Hydro)Coal)
0%"
10%"
20%"
30%"
40%"
50%"
60%"
70%"
80%"
90%"
100%"
1971" 1976" 1981" 1986" 1991" 1996" 2001" 2006"
Prop
or4o
n"of"produ
c4on
"
170
commissioning of the first turbines at Hoa Binh hydropower plant. The 1,500 Km long
500 kV transmission line from Hao Binh hydropower plant in the north of the country
to Ho Chi Minh City (HCMC) in the southeast was completed in 1994 and formed the
‘backbone’ of the Vietnamese national grid linking the three isolated power systems. This
was subsequently upgraded with a second circuit (improving reliability and effective
power) completed in 2005.153 These developments are continuing with the expansion of
the high voltage transmission grid from large generators to load centres, linking large
hydropower projects in the central highlands (largest amongst them the hydropower
plant at Ya Ly) to load centres in the north and south (World Bank 2006c).154
The development of a single integrated power system enabled the ESI to generate
significant benefits from both increasing returns to scope and scale (see also Chapter 4,
section 4.2.1), a donor document spelt out the familiar rationale:
“The commissioning in 1994 of the 500kV line, connecting the northern, central, and southern systems,
has for the first time given Viet Nam a single integrated power system (IPS). The IPS will provide
emergency support and sharing of reserve capacity and take advantage of demand and hydrological
diversity. This project has already begun to repay the large financial investment by eliminating the
operation of high-cost (diesel/thermal) generating plant and reducing the frequent load shedding in the
south. Additional benefits will be realised through the coordinated operation and management of the
transmission system as a single business unit.” (ESMAP 1995: 25)
The development of an integrated national system offered improved reliability of supply
and the transmission of surplus power from the north to the south. It also enabled the
expansion of the grid to rural areas of the south and centre of the country as substations
placed frequently along the length of the transmission line facilitated the connection of
nearby population centres (World Bank 2011).
153 According to EVN NPTC the north-south transmission line can serve an effective load of 3,000 MW. 154 At initial commissioning the north-south line had an effective capacity of around 500 MW, today that figure is around 3,000 MW.

171
Figure 6.5. Regional characteristics of Vietnam’s power system
Source: World Bank 1999
The initial impetus to develop the north-south transmission line was the anticipation of a
power surplus and overcapacity in the north of the country following the incremental
commissioning of Hao Binh’s eight turbines. By contrast, the industrial heartland of the
south suffered chronic power shortages, with many factories were running at a fraction
of their capacity (England & Kammen 1993; World Bank 1995, 1996). Other options
such as power sales to China via a 500 kV cross-border interconnection were mooted,
but energy security and other political considerations ruled this option out at the time
(World Bank 2006b, 2011b). Baruya (2010) points out in a recent paper that the regional
generation characteristics of Vietnam’s grid and the reliance on a single transmission line
has left the system vulnerable to outages at times of year when hydropower is not
available, should the north-south connection be disrupted. For example, in a recent
incident accidental disruption of the transmission line caused by collision with a crane led
to power outages in 22 provinces in the central and southeastern region of the country
(Tuoi Tre 2013).
The development of Vietnam’s power system has been rapid, but in many ways typical.
Firstly, like in so many other countries with abundant hydropower resources,
hydropower has been closely related to the development of long-distance, high-voltage
transmission lines, and as a consequence the national grid. If anything, hydropower has
played a more important role than elsewhere due to the large hydropower resource
available in Vietnam and the institutional emphasis on hydropower development due in
no small part of Soviet influence. As the best hydropower resources have been fully
utilised, and as the country has sought to diversify its generation mix, Vietnam has
Hydro& Coal&
Hydro& Gas&
Hydro&
North&
Centre&
South&
500&kVA&line&&
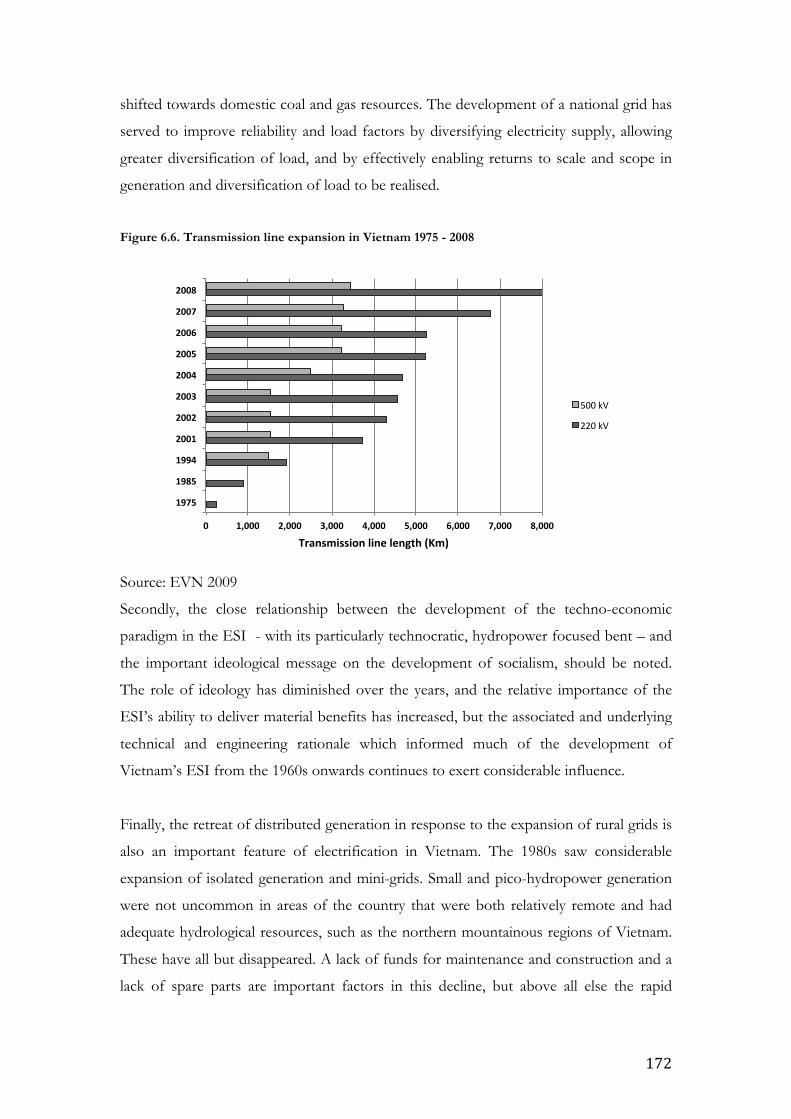
172
shifted towards domestic coal and gas resources. The development of a national grid has
served to improve reliability and load factors by diversifying electricity supply, allowing
greater diversification of load, and by effectively enabling returns to scale and scope in
generation and diversification of load to be realised.
Figure 6.6. Transmission line expansion in Vietnam 1975 - 2008
Source: EVN 2009
Secondly, the close relationship between the development of the techno-economic
paradigm in the ESI - with its particularly technocratic, hydropower focused bent – and
the important ideological message on the development of socialism, should be noted.
The role of ideology has diminished over the years, and the relative importance of the
ESI’s ability to deliver material benefits has increased, but the associated and underlying
technical and engineering rationale which informed much of the development of
Vietnam’s ESI from the 1960s onwards continues to exert considerable influence.
Finally, the retreat of distributed generation in response to the expansion of rural grids is
also an important feature of electrification in Vietnam. The 1980s saw considerable
expansion of isolated generation and mini-grids. Small and pico-hydropower generation
were not uncommon in areas of the country that were both relatively remote and had
adequate hydrological resources, such as the northern mountainous regions of Vietnam.
These have all but disappeared. A lack of funds for maintenance and construction and a
lack of spare parts are important factors in this decline, but above all else the rapid
0" 1,000" 2,000" 3,000" 4,000" 5,000" 6,000" 7,000" 8,000"
1975"
1985"
1994"
2001"
2002"
2003"
2004"
2005"
2006"
2007"
2008"
Transmission"line"length"(Km)"
500#kV#
220#kV#
173
expansion of the electricity grid has displaced these technologies (World Bank 2009,
2013; Meier 2013).
6.3 Institutional development and reform
The co-evolution of institutional arrangements in Vietnam’s ESI plots a course familiar
from the history of the ESI presented in Chapter 4. Private foreign ownership mixed
with municipal ownership during the colonial period was displaced by state ownership
following independence. At the same time power systems were slowly developing into
vertically integrated state owned utilities. This development was disrupted by violent
conflict and a lack of resources. The immediate post-war period saw state lead
development of the sector and the emergence of a national grid and national electricity
utility. The mid-1990s onwards was marked by the faltering re-entry of private and
foreign ownership of generators in the ESI as the large capital needs of the rapidly
expanding sector started to assert themselves. Here we argue that the developing
situation in the Vietnamese power sector can be understood as representing a case
analogous to that described by Victor & Heller (2007), Gratwick & Eberhard (2008),
and Williams & Ghanadan (2006) (Chapter 4, section 4.2.7). That is, the Vietnamese ESI
institutionally is in the half-way house between liberalisation and continued state
ownership.
In many ways Vietnam and enterprises operating in the Vietnamese ESI are typical of the
conditions in developing market countries, as they respond to similar technical and
economic pressures emerging from the techno-economic paradigm which dominates the
ESI. Here we argue that the differences between the situation in Vietnam and those in
other countries do so not so much as a consequence of differences in resource
endowments – although these are important – but do so as a result of Vietnam’s political
economy regime. In particular, the analysis of the ESI goes a long way to support the
notion that the political economy is best described as one of competitive clientism driven
primarily by domestic political considerations, as opposed to either an understanding of
Vietnam as a developmental state, or as in thrall to neo-liberal conditionality.
6.3.1 Institutional arrangements prior to Doi Moi
The picture of institutional development that emerges from the available evidence is in
some ways typical. Starting with private sector dominated ownership of generation
174
capacity and distribution networks in the colonial period, with a mix of municipal power
utilities and isolated generation units for industrial users.155 While it is likely that the ESI
was predominantly owned by the foreign private sector, it is also clear that at least by
1945 there was some public sector involvement in the sector. With the independence of
the north under a communist regime in 1954 came state ownership of the ESI. What the
situation was in the south is less clear, although given that public ownership was the
default ownership pattern at the time, it is likely that in the Republic of Vietnam the
southern ESI also fell into public hands. Our focus here is on the north, as the victors in
the war, institutional and ownership patterns in the ESI were subsequently imposed
nationwide. Of course, in the ESI this would not necessarily have implied much change
as at the time the world over ESIs were state run and controlled. In the period between
1976 and 1986 there was little institutional change within the ESI. The sector remained
organised as three separate vertically integrated companies (North, South and Centre)
operating under the electricity department of the Ministry of Energy (EVN 2009a).
From 1954 in the DRV, there were a number of largely cosmetic changes to the
organisation of the ESI. Responsibility for the sector was moved between ministries as
part of wider administrative changes, from the Ministry of Industry and Trade in 1955 to
the Ministry of Water Resources and Electric Power in 1961, to the Ministry of Heavy
Industry in 1962, the Ministry of Electricity and Coal in 1969 and the Ministry of Energy
in 1981 where it remained until 1995. Throughout all these administrative changes the
ownership of the ESI remained essentially the same. It is worth stressing the emphasis
that was placed on the ESI as a leading sector in the economy and central to the neo-
Stalinist development policies of the government. As part of the central planning system
the ESI was given preferential access to available resources, and electricity was allocated
in turn to favored sectors – typically heavy industry. Structural changes that did occur
were necessitated by the incorporation of the central and southern power systems under
a single national administration following reunification in 1976, the expansion of the
sector, which necessitated the formation of new organizational units, and some largely
cosmetic and changes in the attempted formation of ‘Enterprise Unions’ in 1978 and
again in 1989 (Van Arkadie & Mallon 2003; Cheshier & Penrose 2007; EVN 2009b).
155 The available information on this is sparse, the extensive data on foreign ownership given by Hausman et al (2008), and partially reproduced in Chapter 4 (Table 2), does not include French Indochina or its constituent parts. The information that is available on French colonies and Francophone countries in their data (Algeria, Morocco and Haiti) suggest that in the pre-war period foreign ownership in the French sphere of influence was common. It is likely that similar ownership conditions were in place in colonial Indochina.
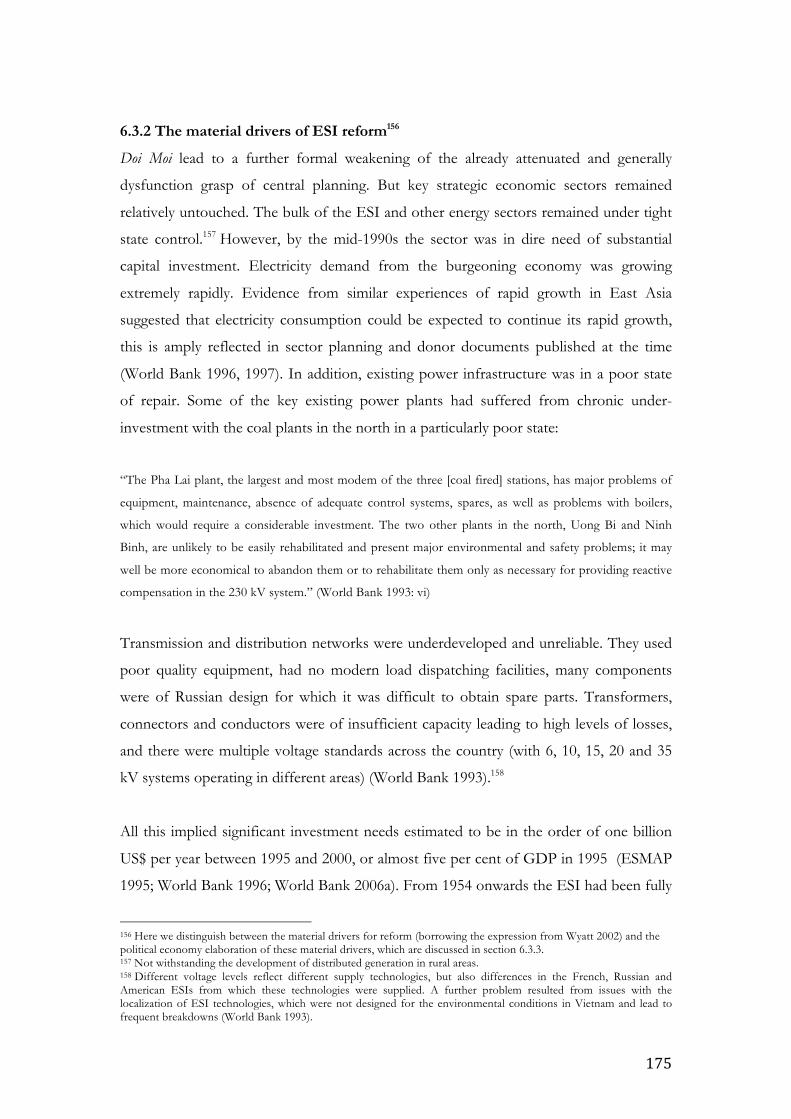
175
6.3.2 The material drivers of ESI reform156
Doi Moi lead to a further formal weakening of the already attenuated and generally
dysfunction grasp of central planning. But key strategic economic sectors remained
relatively untouched. The bulk of the ESI and other energy sectors remained under tight
state control.157 However, by the mid-1990s the sector was in dire need of substantial
capital investment. Electricity demand from the burgeoning economy was growing
extremely rapidly. Evidence from similar experiences of rapid growth in East Asia
suggested that electricity consumption could be expected to continue its rapid growth,
this is amply reflected in sector planning and donor documents published at the time
(World Bank 1996, 1997). In addition, existing power infrastructure was in a poor state
of repair. Some of the key existing power plants had suffered from chronic under-
investment with the coal plants in the north in a particularly poor state:
“The Pha Lai plant, the largest and most modem of the three [coal fired] stations, has major problems of
equipment, maintenance, absence of adequate control systems, spares, as well as problems with boilers,
which would require a considerable investment. The two other plants in the north, Uong Bi and Ninh
Binh, are unlikely to be easily rehabilitated and present major environmental and safety problems; it may
well be more economical to abandon them or to rehabilitate them only as necessary for providing reactive
compensation in the 230 kV system.” (World Bank 1993: vi)
Transmission and distribution networks were underdeveloped and unreliable. They used
poor quality equipment, had no modern load dispatching facilities, many components
were of Russian design for which it was difficult to obtain spare parts. Transformers,
connectors and conductors were of insufficient capacity leading to high levels of losses,
and there were multiple voltage standards across the country (with 6, 10, 15, 20 and 35
kV systems operating in different areas) (World Bank 1993).158
All this implied significant investment needs estimated to be in the order of one billion
US$ per year between 1995 and 2000, or almost five per cent of GDP in 1995 (ESMAP
1995; World Bank 1996; World Bank 2006a). From 1954 onwards the ESI had been fully
156 Here we distinguish between the material drivers for reform (borrowing the expression from Wyatt 2002) and the political economy elaboration of these material drivers, which are discussed in section 6.3.3. 157 Not withstanding the development of distributed generation in rural areas. 158 Different voltage levels reflect different supply technologies, but also differences in the French, Russian and American ESIs from which these technologies were supplied. A further problem resulted from issues with the localization of ESI technologies, which were not designed for the environmental conditions in Vietnam and lead to frequent breakdowns (World Bank 1993).
176
funded through the state budget, asset values and depreciation were not reflected in
accounts and revenues barely covered operating costs. In 1990 the ESI’s operating losses
were around US$ 8 million, quite small relative to the sector turnover, but well short of
the level needed to be financially sustainable (World Bank 1993).159 Soviet aid had
supplied the bulk of financing for capacity expansion but with the collapse of the Soviet
Union, which had provided around 40% of the state budget (Probert & Young 1995),
Vietnam would be forced to look elsewhere for investment funds.
Figure 6.7. Vietnam’s external debt 1989 - 2011160
Source: World Bank 2013
Options were limited. Although Vietnam had been running a fiscal deficit of on average
less than three per cent in the 1990s and 2000s, regarded as sustainable by international
standards, it had a significant external debt burden (World Bank 1999, 2008; Adams
2012; Figure 6.9).161 Given the investment needs of the sector and the need to maintain
debt sustainability, other sources of finance needed to be identified. In addition, a
number of powerful ministries in Vietnam, notably the Ministry of Finance (MoF) and
the Ministry of Planning and Investment (MPI) along with most international donors
argued that the ESI represented a relatively good opportunity for commercialisation, and
public funds could be more productively used elsewhere in sectors that may be less
amenable to operation on commercial principles (World Bank 2006a, Wyatt 2002,
ESMAP 1995). The ESI would therefore need to rely on sources of investment other
159 Typically, electricity utility companies are deemed to require a self-financing ratio of around 30% (World Bank 1993; Krishnaswamy & Stuggins 2007) 160 This excludes around a debt of around nine and a half billion transferrable rubles that was being renegotiated with Russia in the early 1990s (Wyatt 2002). 161 Given issues with accounting for sub-national debt, government bond issues and contingent sovereign obligations the fiscal deficit may actually be larger than official figures suggest (Adams 2012).
0"
10"
20"
30"
40"
50"
60"
70"
0"
50"
100"
150"
200"
250"
300"
350"
400"
450"
1989" 1993" 1997" 2001" 2005" 2009"
Billion
"USD
"(nom
inal)"
%"of"G
NI"
Percent'of'GNI'(right'hand'axis)'
USD'Total'(le;'hand'axis)'
177
than the state budget and Soviet aid. Potential sources of funding included retained
earnings, domestic capital markets and banks, concessional lending from IFIs and
international investment. In the short term, the perceived opacity and inadequacy of
sector management meant that any capital raised from external sources would require a
sovereign guarantee (be it explicit or implicit). Such contingent liabilities could, in turn,
also have implications for perception of long-term national debt sustainability (ESMAP
1995).
Fundamentally, and from the perspective of prospective investors, the bankability of
Vietnam’s ESI would depend on the strength of the balance sheet of the utility. This in
turn increased the urgency of performance enhancing institutional reform to the sector.
For the ESI to be financially self-sustaining, revenues would need to not only cover
operational costs but adequately account for the depreciation of assets and allow the ESI
to achieve a sustainable level of investment. That is to say, the long run marginal cost
(LRMC) of supply needed to be reflected in the level of electricity tariffs. Average tariff
levels following price reforms in 1992, however, were only at about 70% of the estimated
LRMC (World Bank 1993). Tariff levels have proved to be both a key element of sector
reform but also a source of conflict between the ESI, other state energy enterprises, line
ministries, IFIs and the general public. We discuss this in greater detail in section 6.3.9
below, but here it is suffice to note the central importance attached both to achieving
cost reflective tariff and to the contested nature of tariff increases.
Enhancing the performance of the sector implied significant technical and operational
changes. Staffing levels were high, staff lacked training in modern managerial and
operating procedures, transmission and distribution (T&D) losses were in excess of 20%
(Figure 6.1), and these were likely underestimates as T&D losses were not measured
downstream of power company metering points where an estimated additional 10-15%
of electricity was lost (World Bank 1993). Levels of internal electricity use were around
three per cent (higher than comparable countries), capacity expansion was inefficient,
and the investment planning and approval processes were cumbersome and bureaucratic
(World Bank 1996). What is more, companies constituting the ESI contained business
units involved in a number of non-core activities (such as hotels and construction), there
was a perception that these distracted from the operations of the ESI and should be sold
off (World Bank 1993). In sum, there was a strong perception amongst donors, sector
178
experts and in the Vietnamese government itself of the need to adopt reforms to the
sector that would enhance performance (and expectations about performance) and better
enable the ESI to raise the finance it needed to invest in capacity expansion (Quinn
1998).162163
Institutional considerations aside, at around the same time, the country was facing an
electricity supply crisis. The dominance of hydropower in the generation mix (Figure 6.4)
together with drought conditions in 1996 – 1998 exposed the vulnerability of the system
to hydrological risk. Water levels at the massive Hoa Binh reservoir were at dead-levels
with the turbine water intakes fully exposed and the plant was producing only about 11%
of rated capacity. This lead to unpopular and economically damaging load shedding and
power cuts, especially in the north of the country that had greater dependence on
hydropower (Wyatt 2002). This added the additional rationale of diversification of the
generation mix to the already pressing capacity needs.
An additional consideration was the need to develop and effectively utilise Vietnam’s
significant off-shore gas reserves, which were situated off the coast of South Eastern
Vietnam in the Nam Con Son and Bac Ho fields.164 Without the large demand for gas
represented by power generation and long-term supply agreements with generators it
would not be possible for the government to raise the funds needed to develop this
valuable resource (World Bank 2010a). CCGT technology and the upstream
development of a gas pipeline network represented a particularly attractive solution, all
the more so as gas fired generation would be situated in the south east of the country,
where the demand for electricity was greatest. This seemed to present an opportunity in
which foreign investment in IPPs could be both feasible and particularly advantageous.
Feasible, as considerable up-stream activity by foreign firms in off-shore exploration and
drilling that was already in place could act to mitigate perceptions of investment risk.
And advantageous because foreign investment represented not only a source of capital,
162 It should be noted that the sector experts employed by the donors seem to have been, almost uniformly, from countries which had undergone significant power sector liberalization with experts from New Zeland and 163 Source 19, Annex A6.4. 164 Nam Con Son is a gas field, whereas the gas produced from the Bach Ho was associated with oil reserves. Up until a pipeline to bring the gas from Bach Ho on-shore came into operation in 1995, the gas was flared as an unwanted by-product.
179
but as gas turbine technology was relatively unfamiliar in Vietnam, FDI could bring with
it state of the art kit and valuable technological know-how.165
The IFIs and bilateral donors presented additional incentives for reform of the ESI.
Substantial concessional lending and grants were tied to a commitment to reform the
power sector along the lines of the ‘standard model’ (Chapter 4, sections 4.2.6). The
recommendations in the first World Bank review of the sector were relatively tame, with
the suggestion that there was a need to rationalise the ESI shedding non-core staff,
facilities and units, that cost-reflective tariffs should be adopted, and that the
responsibilities of the ESI and the MoE should be more clearly delineated, with the latter
stepping back from planning and operational issues and focusing on policy. While it was
noted that the private sector could potentially play a role in the ESI, the only concrete
recommendation for private sector involvement at this point was for a joint venture to
enable the development of CCGT generation facilities to exploit associated gas reserves
from the Bach Ho field (World Bank 1993).
By contrast, the World Bank’s following project appraisal documents, coming with
substantial commitment to investment (US$ 165 million committed in 1995 and US$ 180
million committed in 1996), were more strident and the loan agreements required
considerable commitment to sector reform on the part og the Government. These
included undertakings to review tariff levels, accounting practices and the organisation of
the ESI, and to achieve sustainable levels of financial performance (World Bank 1995).
Thus, pressure was building from the World Bank, and IFIs in general to undertake
reforms in the power sector. While the suggestions for reforms remained modest, the
intentions were at this stage clear. The World Bank project appraisal document notes:
“The policies and programs pursued by the Government in the power sector are in compliance with IDA's
policies and guidelines for commitment to efficiency improvement…[…]…sector reform and
restructuring, moving towards commercialization and corporatization, and encouraging private
participation.” (World Bank 1995: 19)
165 A knock-on implication of this shift in generation technology, was the greater proportion of capital cost which would find its way abroad. In contrast to hydropower, for which heavy engineering goods (turbines etc.) typically account for around one third of capital costs with the rest being spent domestically on civil works, for other technologies including CCGT most of the capital costs would consist of capital goods purchased overseas.
180
To be sure, these reforms were relatively minor relative to liberalisation programs
adopted in other countries. But they represented a staring point, and from the
perspective of the Bank, one consistent with its broader commitment to power sector
reform, a commitment which would be pushed with greater vigour over the coming
years.
6.3.3 The first wave of reform: formation of EVN and the energy parastatals
Despite increasing IFI pressure, institutional changes in the sector seemed to have been
instigated as a result of domestic concerns. Change started in earnest with the first round
of restructuring in 1994 and 1995, which took place in the context of wider SOE
reforms. The three energy parastatals Electricity of Vietnam (EVN), Petrovietnam
(PVN) and Vinacoal (TKV)166 along with 15 other State Corporations (as defined in the
State Enterprise Law (1995)) were formed by the implementation of Decision 91 in 1994
(Annex A6.3, Table A6.1). The stated policy objectives of these reforms were to
consolidate the SOEs, rationalise state supervision, and effectively reduce ministerial
influence in everyday operations. An additional - and often implicit - reform objective
was to create large-scale business groups or enterprises along the lines of Korean chaebol
that would be able in the longer-term to build productive capabilities, generate dynamic
comparative advantages and compete internationally (Quinn 1998; Van Arkadie &
Mallon 2003; Perkins & Vu 2010).167168
EVN itself was established as a state corporation in January 1995 by Decree 14 – CP. At
the same time, with the separation of the energy parastatals, the Ministry of Energy
(MoE) was slimmed down, rationalised and eventually absorbed (along with the
ministries for light and heavy industry) within the Ministry of Industry (MoI) in October
1995 (World Bank 1996). 169 Operational responsibilities and the exercise of the
‘ownership function’ fell to the newly formed energy parastatals (EVN, PVN and TKV),
while MoI maintained overall oversight and responsibility for the formation of policy and
planning in the sector.170
166 Later Vinacomin 167 See also Chapter 3. 168 Source 8, 9, 17 Annex A6.4. 169 MoI was subsequently merged with the Ministry of Trade in 2008 to form the Ministry of Industry and Trade (MOIT). 170 Quinn (1998) maintains that the Ministry of Planning and Investment (MPI) and MOI were responsible for ESI planning. This was not the case, while plans have to be endorsed by MoI, MPI and the Prime Minister the planning exercise itself is conduced by the Institute of Energy, which at the time was a department of EVN.
181
EVN was reorganised as 34 different business units, all of which reported to EVN’s
Director General. Of these 16 were dependant accounting units – cost centres without
revenue these costs were consolidated in EVN accounts - including 12 large power
plants, four transmission units and the national load and dispatch centre (NLDC). There
were 17 independent accounting units, which had their own consolidated expenditures
and revenues, of these five were regional distribution companies the remaining 12
enterprises were involved in the provision of services to the sector including finance,
design, construction and planning (ESMAP 1995; World Bank 1996; Figure 6.8, 6.9).
The corporatisation of EVN represented the first step in the restructuring of Vietnam’s
ESI. The structural division of the different functions (generation, dispatch, transmission
and distribution) and non-core activities was seen by many (and especially from the
perspective of the IFIs, international financiers and project developers) as a further step
in rationalising the structure of the industry in preparation for further reform along the
lines of the ‘standard model’ (Chapter 4, section 4.2.6). The MoI (1997) power sector
policy statement developed in close consultation with donors lists six policy objectives as
follows:
“i) Provide electricity access to the national economy and the entire population of Vietnam.
ii) Increase the operating/technical efficiency of the electricity sector to optimise the use of
scarce investor resources.
iii) Ensure reliable electricity supply of good quality.
iv) Resolve the mismatch between market-based production costs and State administered prices.
v) Clearly delineate and separate State management functions and business management
functions.
vi) Enable Vietnam to raise the necessary financing for power sector expansion to meet
economic growth targets.” (MoI 1997)171
The document also reflects a focus on further commercialisation and institutional reform
of the sector. This included i) the further unbundling of the functional components of
the ESI into independent business units operating on commercial principles; ii) the
development of an Electricity Law, which would lay the legal foundations for a
regulatory agency, and provide a consistent basis for service and tariff regulation, the
licencing of activities in the sector, and importantly a grid code defining interconnection
and operating standards for generators and transmission companies; iii) revisions to tariff
171 An earlier version of this includes and additional objective of “Redefine and clarify ownership responsibilities to allow for asset preservation, asset development, and commercial management” (ESMAP 1995: 3)

182
structures and levels; and, iv) diversification of participation in the sector including the
encouragement of projects through limited recourse (project) financing (MoI 1997).
Figure 6.8. The structure of EVN in 1995
Source: Based on ESMAP 1995 and Wyatt 2002
Thus there was an (ostensive) undertaking by EVN and MoI to reform the sector along
commercial lines and ensure cost recovery though cost-reflective tariff levels.
Importantly, the development of a grid code and the explicit undertaking to encourage
private sector participation in the sector through project financing paved the way for the
entry of non-EVN IPP generators, and in particular those of foreign origin. This built on
the revised Law on Foreign Investment (1992) and Decree 87 – CP (1993) which
introduced a framework for Build-own-transfer (BOT) type projects for infrastructure
development. This was also closely linked to the development of the proposed Phu My 3
and Phu My 2.2 CCGT projects, which were in the pipeline at the time.172
The reforms however fell well short of the international ‘best practice’ as defined by the
standard model. Firstly, the treatment of generation and transmission business units of
EVN as dependant accounting units allowed transfer pricing and cross-subsidisation to
continue, as a consequence these units did not need to operate on a cost recovery basis
(Wyatt 2002). Secondly, with the formation of EVN the government undertook to make
no further direct equity investment in the enterprise (apart for socially oriented projects)
and to ensure it operated with “…no notable explicit subsidy from the government”
172 Source 3, 17, 21 Annex A6.4.
Genera&on(Business(Unit(!(12!Power!Plants)!
Transmission(Business(Unit!(Na1onal!Load!Dispatch!Centre!and!
4!Transmission!companies)!
Hanoi(Distribu&on(Company!
Power(Company(No.(1!
HCMC(Distribu&on(Company(
Power(Company(No.(2!
Power(Company(No.(3!
Consumers!
Independent!!accoun1ng!units!
Dependent!accoun1ng!units!
183
(World Bank 2006b; Krishnaswamy & Stuggins 2007: 130).173 But effective subsidies
remained significant, in terms of input price controls on fuels (notably coal), preferential
access to financial resources, in the allocation of hydropower resources, and through
favourable taxation treatment (Tran & Jones 2011). To be sure, this was offset by price
controls on end-user tariffs, but it also added to the opacity of sector operations,
softening budget constraints and generating uncertainty. Thirdly, the ministry maintained
the right to appoint board members (with prime ministerial approval) and voting rights at
the AGMs.
What is more the reforms had done little to clear up the institutional and legislative
uncertainty that characterised Vietnam’s institutional environment more generally:174
“These [energy] corporations have been slow to adjust to an increasingly market oriented environment.
Reforms have given them more commercial focus, but old-style controls remain in place…[…]…this [new]
corporate governance structure has failed to minimise interference from supervising ministries.
Government policy oversight has not been separated from commercial management because there is no
clear definition of state management functions and no clarity on procedures. Clear operating relationships
have not developed because ownership and other functions are diffused among government agencies and
ministries.” (World Bank 1999: 9)
This candid observation is of particular interest to our argument. It echoes comments by
Gainsborough (2010), Gillespie (1995) and others relating to the level of uncertainty that
surrounds institutional arrangements in the Vietnamese polity. Whereas institutional
uncertainty presents fertile ground for patronage networks, it is not conducive to
attracting foreign investors, adding to investment risks. Which brings us to our final
point, there was little appetite for IPPs or the introduction of competitive power
markets. Competition - it would seem - was to be limited to the bidding process for the
selection of the concessionaire for IFI supported BOT projects. IPPs were only really
tolerated where they were regarded as absolutely necessary (i.e. in the provison of CCGT
technologies).175
173 A somewhat over optimistic gloss to exaggerate the influence of World Bank sponsored reforms. 174 Source 17 Annex A6.4. 175 Source 22, Annex A6.4.
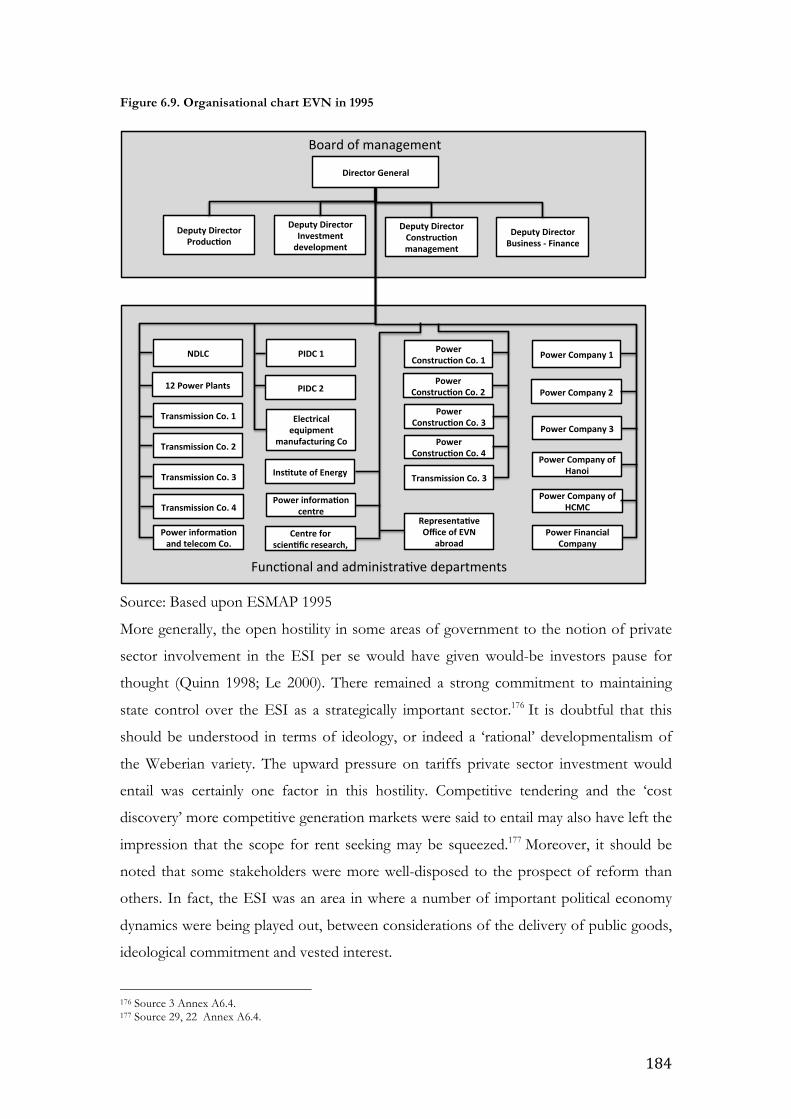
184
Figure 6.9. Organisational chart EVN in 1995
Source: Based upon ESMAP 1995
More generally, the open hostility in some areas of government to the notion of private
sector involvement in the ESI per se would have given would-be investors pause for
thought (Quinn 1998; Le 2000). There remained a strong commitment to maintaining
state control over the ESI as a strategically important sector.176 It is doubtful that this
should be understood in terms of ideology, or indeed a ‘rational’ developmentalism of
the Weberian variety. The upward pressure on tariffs private sector investment would
entail was certainly one factor in this hostility. Competitive tendering and the ‘cost
discovery’ more competitive generation markets were said to entail may also have left the
impression that the scope for rent seeking may be squeezed.177 Moreover, it should be
noted that some stakeholders were more well-disposed to the prospect of reform than
others. In fact, the ESI was an area in where a number of important political economy
dynamics were being played out, between considerations of the delivery of public goods,
ideological commitment and vested interest.
176 Source 3 Annex A6.4. 177 Source 29, 22 Annex A6.4.
Director(General!
Deputy(Director(Produc2on!
Deputy(Director((Investment(development!
Deputy(Director((Construc2on(management!
Deputy(Director((Business(:(Finance!
Board!of!management!
12(Power(Plants!
Transmission(Co.(1!
Transmission(Co.(2!
Transmission(Co.(3!
Transmission(Co.(4!
NDLC!
Power(informa2on(and(telecom(Co.!
PIDC(2!
Electrical(equipment(
manufacturing(Co!
Ins2tute(of(Energy!
Power(informa2on(centre!
Centre(for(scien2fic(research,(!
PIDC(1!
Power(Construc2on(Co.(2!
Power(Construc2on(Co.(3!
Power(Construc2on(Co.(4!
Transmission(Co.(3!
Representa2ve(Office(of(EVN(
abroad!
Power(Construc2on(Co.(1!
Power(Company(2!
Power(Company(3!
Power(Company(of(Hanoi!
Power(Company(of(HCMC!
Power(Financial(Company(!
Power(Company(1!
Func0onal!and!administra0ve!departments!
185
To be sure, the development of the energy parastatals, and EVN in particular
represented a significant change in the sector that was to have material impacts on the
shape of its development. The material constraints facing the sector forced the
government to make tentative steps towards the reorganisation, which would ensure the
delivery of the public goods associated with electricity supply. At one level, the actions of
the government in moving to improve performance and ensure the financial
sustainability of the sector, answer the fundamental political logic of maintaining
performance legitimacy.178 But what is also clear is that state agencies were suspicious of
private sector and foreign investment in the sector. From the donor perspective, this was
only the first step on a long road to the reform of the sector. If there was some cause for
concern due to the modest nature of reforms this was tempered by an understanding of
the scale of the task ahead in reforming not only the ESI, but upstream and downstream
industries, as well as the broader institutional environment for investment. The
reluctance of EVN to undertake serious reform and its growing influence in the
Vietnamese polity was at this stage largely unforeseen.
6.3.4 The faltering entry of FDI
In the period from the early 1990s to the second round of ESI restructuring in the mid-
2000s, Vietnam’s ESI saw the first significant private sector investments in electricity
generation. These projects were enabled by the amended Foreign Investment Law (1992)
which specifically encouraged foreign investment in infrastructure, and the BOT law
(1993) already in the pipeline by the time the first round of power sector reforms took
place. By 1996 a number of relatively small-scale foreign funded projects focussing on
electricity supply to industrial zones and export processing zones had reached financial
closure (Table 6.2). The plants at Hiep Phuoc in HCMC, Nomura Hai Phong Industrial
Zone and Amarta Bien Hoa had permission from EVN to generate power
independently. They were able to sell excess production to EVN on the basis of short-
term power purchase agreements (PPAs). Similarly, the investment case for plants at the
Bourbon sugar Mill in Tay Ninh province and later at the Formosa plant at the a textile
factory and the Vedan food processing plant in Dong Nai were built upon a captive need
for reliable power supplies, with excess power sold on to EVN. These independent
178 Wyatt (2002) argues that the reluctance of the government to rely more heavily on foreign denominated debt rested on the reluctance of the state to give up its hard won sovereignty and become dependant upon foreign debt. However, this seems unlikely. As project finance is, if anything, more intrusive that foreign debt.
186
power producers (IPPs) met a need for reliable electricity supply in what remained a
context of chronic power shortages and frequent blackouts, especially in the south.
However, in terms of meeting the wider investment or capacity needs of the ESI these
investments were not particularly significant.179
At around the same time a number of altogether larger BOT projects designed to address
EVNs capacity needs were being developed (Table 6.4). This was part of the global trend
fed by the excess petro-dollars, financial deregulation and the liberalisation of ESIs in the
developed world (Chapter 4, section 4.2.6 - 7). In Vietnam as elsewhere, bilateral donors
had the interests of their own domestic ESI utilities, engineering companies, financiers,
project developers and lawyers in mind (Wyatt 2002). A JBIC press release on Vietnam at
the time commented:
“Japanese power utilities have been vigorously expanding their overseas operations by finding business
opportunities primarily for independent power producers (IPPs) in developing countries. At present,
however, the private financial sector can hardly take risks on loans extended to Vietnam. Therefore, JBIC
has collaborated with ADB and other official agencies in providing overseas investment loans on a project
finance basis, with JBIC taking political risk. This enables private-sector financial institutions to structure a
considerably large co-financing deal in support of Japanese power utilities engaging in overseas business
operations.” (JBIC 2003)
JBIC and Proparco (the private sector lending arm of AFD), for example leant funds of
US$150 million and US$40 million respectively for Phu My 2.2, which was wholly owned
by a consortium of French and Japanese companies. Japanese and French firms also
supplied most of the engineering services and some capital equipment (Figure 6.12).
Similarly, JBIC extended a loan facility of US$99 million for Phu My 3, which reached
financial closure in 2003, one third of which was held by Nissho-Iwai Corporation and
Kyushu Electric Power.180 Additional JBIC support for the Phu My complex included a
concessional loan of US$ 122 million made in 2000 to EVN for the development of a
high voltage (500 kV) transmission line from the complex to HCMC (JBIC 2008).
More generally, the whole ESI restructuring programme of which these projects were
part, held the potential to generate considerable business for lawyers and consultants
who specialised in ESI liberalisation and project finance. In this regard Australian, British
179 Source 2,3,22 Annex A6.4. 180 The remaining two thirds were split evenly between BP and Sembcorp.
187
and US firms were (and remain) prominent.181 From the perspective of the IFIs, project
finance was seen as a way to generate investment, and import best managerial practice
and modern technologies to the sector, it also represented a step towards putting the
power sector on a more sustainable financial footing, forcing EVN to adopt a more cost
reflective tariff.182
Despite donor and TNC aspirations, the progress of BOT projects in the sector was
proving to be painfully slow. BOT projects rely on complex contractual and financial
agreements designed to protect investors and counterparties from risks associated with
sinking large amounts of investment capital in projects with long cost recovery periods
(Woodhouse 2006). This involves the distribution of risks between different
counterparties to the project and the host government, ideally arriving at an efficient
allocation of risk by allocating risks to those best equipped to deal with them (see
Chapter 4, section 4.2.2 and Woodhouse 2006; Victor & Heller 2007; Delmon 2009).183
Typically, the project developer will bear the majority of risk related to the financing,
construction and technical performance of the project. This leaves a number of
important risks relating to the ability of the counterparties to fulfill their obligations,
including fuel supply agreements, power off-take agreements (which will cover both the
quantity and unit cost), guaranteeing the availability of foreign exchange (i.e. that
revenues earned in domestic currency will be convertible on demand to hard currency
and transferrable overseas) and guarantees relating to natural force majeure affecting
counterparties, and political force majeure including changes to the law, and expropriation
risk (World Bank 2002; UNCTAD 2008; Delmon 2009). Risk were regarded as high in
Vietnam because formal institutions were deemed weak, and corporate governance
standards at the key counterparties to prospective BOT deals (i.e. EVN and the fuel
suppliers PVN and TKV) left a lot to be desired. The perception of high-risks were also
compounded by the lack of a credible BOT projects in Vietnam at the time.
181 That high ranking staff from the UK’s newly privatised National Grid Company and National Power, were the only representatives of private utility companies in attendance at the final workshop which laid out the strategy for ESI restructuring held in 1995 is indicative of the influence of the ‘standard model’ at the early stage of reforms (ESMAP 1995). 182 Source 4, Annex A6.4. 183 There is a considerable literature on the ‘efficient’ allocation of project risks, which is beyond the scope of this research. However, it is interesting to note Delmon’s candid take on the textbook notion of efficient risk, “Risk management based on efficiency is, of course, an ideal, a goal. In practice, risks tend to be allocated on the basis of commercial and negotiating strength. The stronger party will allocate risk that it does not want to bear to the weaker party. This scenario does not necessarily imply the most effective and efficient risk management.” (Delmon 2009: 155).
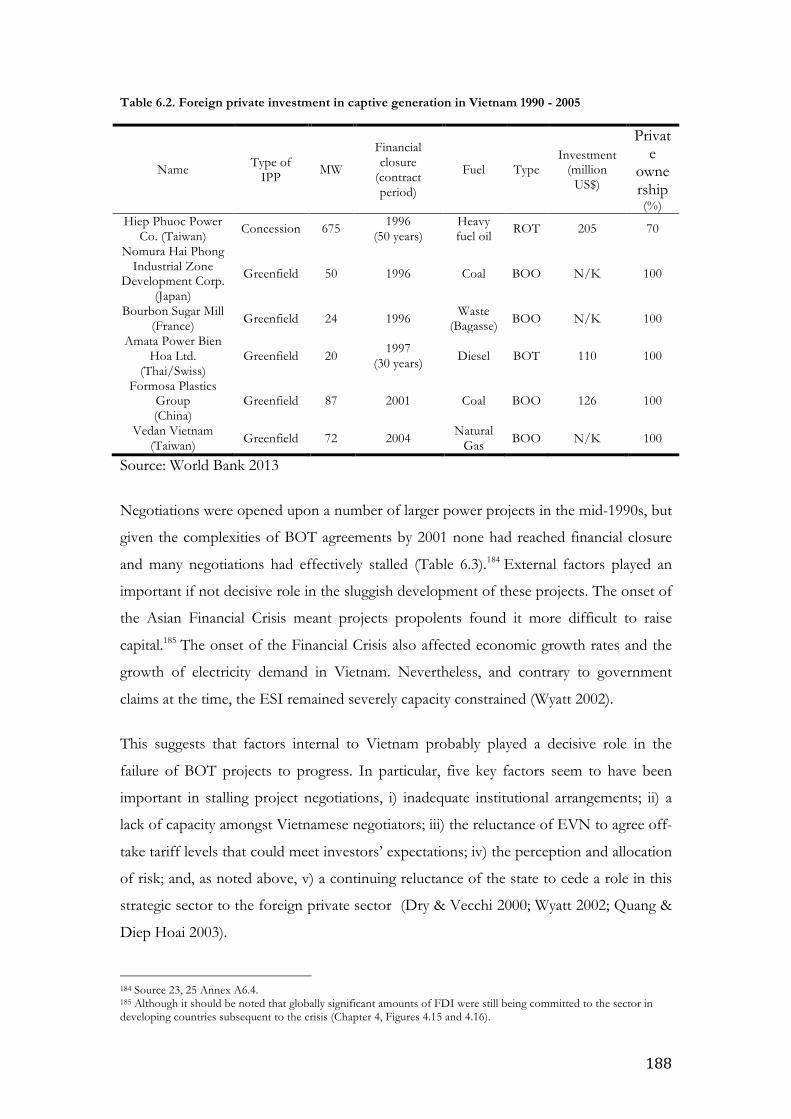
188
Table 6.2. Foreign private investment in captive generation in Vietnam 1990 - 2005
Name Type of IPP MW
Financial closure
(contract period)
Fuel Type Investment
(million US$)
Private
ownership (%)
Hiep Phuoc Power Co. (Taiwan) Concession 675 1996
(50 years) Heavy fuel oil ROT 205 70
Nomura Hai Phong Industrial Zone
Development Corp. (Japan)
Greenfield 50 1996 Coal BOO N/K 100
Bourbon Sugar Mill (France) Greenfield 24 1996 Waste
(Bagasse) BOO N/K 100
Amata Power Bien Hoa Ltd.
(Thai/Swiss) Greenfield 20 1997
(30 years) Diesel BOT 110 100
Formosa Plastics Group (China)
Greenfield 87 2001 Coal BOO 126 100
Vedan Vietnam (Taiwan) Greenfield 72 2004 Natural
Gas BOO N/K 100
Source: World Bank 2013
Negotiations were opened upon a number of larger power projects in the mid-1990s, but
given the complexities of BOT agreements by 2001 none had reached financial closure
and many negotiations had effectively stalled (Table 6.3).184 External factors played an
important if not decisive role in the sluggish development of these projects. The onset of
the Asian Financial Crisis meant projects propolents found it more difficult to raise
capital.185 The onset of the Financial Crisis also affected economic growth rates and the
growth of electricity demand in Vietnam. Nevertheless, and contrary to government
claims at the time, the ESI remained severely capacity constrained (Wyatt 2002).
This suggests that factors internal to Vietnam probably played a decisive role in the
failure of BOT projects to progress. In particular, five key factors seem to have been
important in stalling project negotiations, i) inadequate institutional arrangements; ii) a
lack of capacity amongst Vietnamese negotiators; iii) the reluctance of EVN to agree off-
take tariff levels that could meet investors’ expectations; iv) the perception and allocation
of risk; and, as noted above, v) a continuing reluctance of the state to cede a role in this
strategic sector to the foreign private sector (Dry & Vecchi 2000; Wyatt 2002; Quang &
Diep Hoai 2003).
184 Source 23, 25 Annex A6.4. 185 Although it should be noted that globally significant amounts of FDI were still being committed to the sector in developing countries subsequent to the crisis (Chapter 4, Figures 4.15 and 4.16).
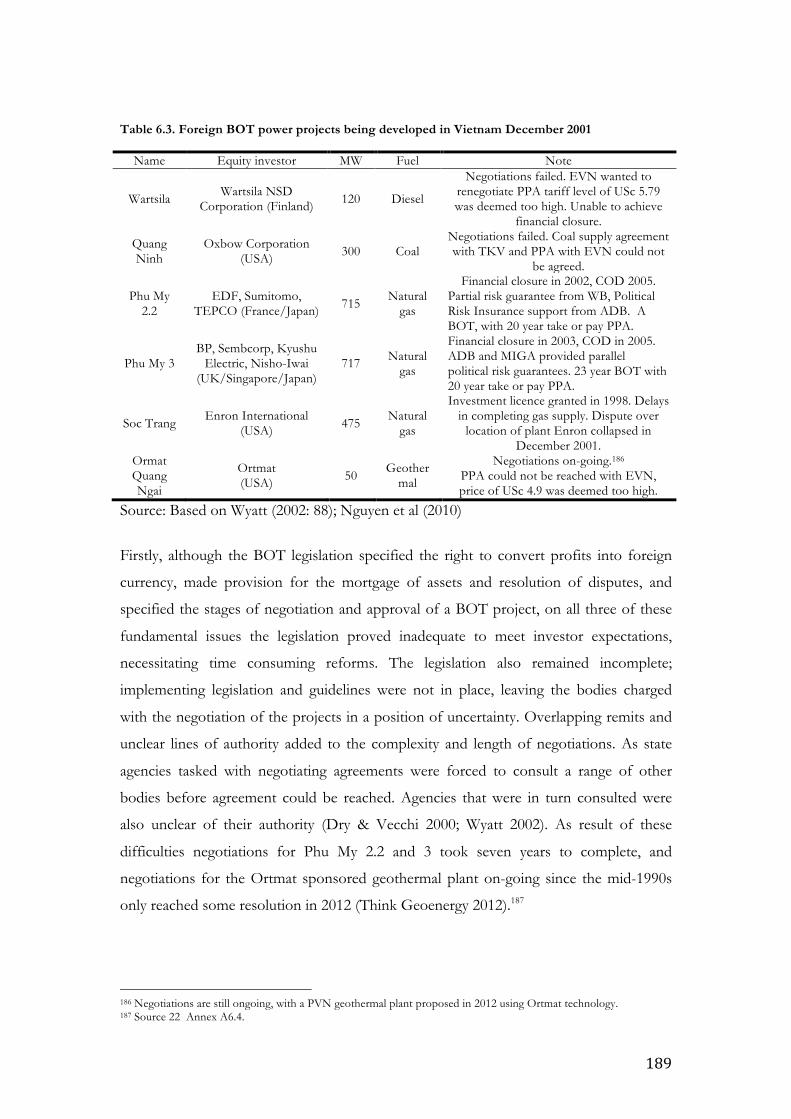
189
Table 6.3. Foreign BOT power projects being developed in Vietnam December 2001
Name Equity investor MW Fuel Note
Wartsila Wartsila NSD Corporation (Finland) 120 Diesel
Negotiations failed. EVN wanted to renegotiate PPA tariff level of USc 5.79 was deemed too high. Unable to achieve
financial closure.
Quang Ninh
Oxbow Corporation (USA) 300 Coal
Negotiations failed. Coal supply agreement with TKV and PPA with EVN could not
be agreed.
Phu My 2.2
EDF, Sumitomo, TEPCO (France/Japan) 715 Natural
gas
Financial closure in 2002, COD 2005. Partial risk guarantee from WB, Political Risk Insurance support from ADB. A BOT, with 20 year take or pay PPA.
Phu My 3 BP, Sembcorp, Kyushu
Electric, Nisho-Iwai (UK/Singapore/Japan)
717 Natural gas
Financial closure in 2003, COD in 2005. ADB and MIGA provided parallel political risk guarantees. 23 year BOT with 20 year take or pay PPA.
Soc Trang Enron International (USA) 475 Natural
gas
Investment licence granted in 1998. Delays in completing gas supply. Dispute over
location of plant Enron collapsed in December 2001.
Ormat Quang Ngai
Ortmat (USA) 50 Geother
mal
Negotiations on-going.186 PPA could not be reached with EVN, price of USc 4.9 was deemed too high.
Source: Based on Wyatt (2002: 88); Nguyen et al (2010)
Firstly, although the BOT legislation specified the right to convert profits into foreign
currency, made provision for the mortgage of assets and resolution of disputes, and
specified the stages of negotiation and approval of a BOT project, on all three of these
fundamental issues the legislation proved inadequate to meet investor expectations,
necessitating time consuming reforms. The legislation also remained incomplete;
implementing legislation and guidelines were not in place, leaving the bodies charged
with the negotiation of the projects in a position of uncertainty. Overlapping remits and
unclear lines of authority added to the complexity and length of negotiations. As state
agencies tasked with negotiating agreements were forced to consult a range of other
bodies before agreement could be reached. Agencies that were in turn consulted were
also unclear of their authority (Dry & Vecchi 2000; Wyatt 2002). As result of these
difficulties negotiations for Phu My 2.2 and 3 took seven years to complete, and
negotiations for the Ortmat sponsored geothermal plant on-going since the mid-1990s
only reached some resolution in 2012 (Think Geoenergy 2012).187
186 Negotiations are still ongoing, with a PVN geothermal plant proposed in 2012 using Ortmat technology. 187 Source 22 Annex A6.4.
190
A second, closely related factor was the lack of capacity of Vietnamese negotiators to
fully calculate the implications of what were technically complex agreements. In
particular, the broader implications of risk allocations and any contingent liabilities the
government was likely to incur as a result (Wyatt 2002). Overall, the negotiation process
was marked by a developing and uncertain institutional environment, in this regard Dry
& Vecchi’s (2000) remarks, echo the warnings of Fforde (2010) against policy fetishism:
“Therefore, although steps in the negotiation process are clearly set forth [in legislation], the problems
which have arisen relate to the realities of the decision-making process and business practices in Vietnam. There are
also practical problems arising from the government's perception that the Vietnamese people may be
unable to pay a tariff or toll which that will permit the BOT Enterprise says is necessary to receive obtain
an adequate return on its investment.”[emphasis added] (Dry & Vecchi 2000: 3)
This leads us to the third and perhaps most important point, aside from these
institutional weaknesses, the largest obstacle facing these deals was the reluctance of
EVN to guarantee an off-take tariff that would meet the returns demanded by project
investors. EVN’s retail tariff levels still only accounted for about 70% of the LRMC of
supply. Investors typically eyeing an overall return in the order of 15% on this type of
project, this implied off-take tariffs that were often higher than EVN’s average retail
tariff (e.g. see Gómez-Ibáñez 2007).188 While efforts had been afoot to raise retail tariffs
for a number of years these met with opposition from electricity intensive sectors and
the general public (section 6.3.9). The inability to negotiate an adequate off-take tariff
was the main cause of deal failure. In the failure of the Wartsila, Quang Ninh, Soc Trang
and Ortmat projects, the inability of the parties to reach an agreement that would offer
adequate (risk weighted) returns to investors lead to their failure (Dry & Vecchi 2000;
Wyatt 2002). Indeed, numerous documents reflecting the interests of private sector
investors and donors continue to note the fundamental issue of achieving a PPA which
offers them an adequate return on investment (Krishnaswamy & Stuggins 2007; Asian
Power 2009; American Chamber of Commerce Vietnam 2009; Conaty 2010; ADB &
AFD 2012).
188 For example, the estimated internal rates of return on PVNs project list range from 9% - 12% and this is for a provider with access to concessional lending and which does not face a lot of the risks associated with foreign developers. Gomez-Ibanez cites estimates of 15% for low-income countries, 11% for low-middle income countries and 10% for middle income countries (Gómez-Ibáñez 2007)
191
The level of return investors required also reflected their risk perception, this depended
upon the perception of the institutional, political and economic setting. In Vietnam the
uncertain and shifting regulatory environment, the poor quality of institutions, the low
creditworthiness of project counterparties (and EVN in particular) and the lack of
experience with successful projects lead to a heightened perception of project risk
(Quang & Diep Hoai 2003). As a consequence investors required sovereign guarantees
covering the performance and obligations of the Vietnamese counterparties, undertaken
by MPI on behalf of the government (Babbar 2003). On one hand, there remained both
a great deal of uncertainty relating to the legislative status of these government
guarantees, with ‘letters of comfort’ deemed unenforceable by much of the international
project development fraternity, and from the prespective of the government concerns
about the level of risk they were being required to undertake (Dry & Vecchi 2000; Wyatt
2002; Quang & Diep Hoai 2003; UNCTAD 2008; ADB & AFD 2012)189.
Finally, it is worth recalling that all this was taking place within a context where there was
ambivalence in many government agencies about the entry of the foreign private sector.
Press reports at the time were fulsome in their praise of a series of completed investment
projects undertaken by EVN. This contrasted with considerable criticism of the delays
and costs involved in foreign investment in the sector.190 Indeed, Wyatt (2002) notes that
at the World Bank there was a growing concern that the Vietnamese government
remained unconvinced of the advantages of BOT projects.
In this context, the project pipeline was slow to develop. Prior to 2010 the projects that
managed to proceed farthest were able to do so due the fact that they offered more
attractive risk profiles to developers. In the case of Wartsilia, as the capital goods would
largely be obtained from the parent company, even if the project failed to become
financially viable, the parent company stood to benefit from the sale of equipment. The
limited recourse financing would mean that creditors claims would be limited to the
special project vehicle (SPV) designed to carry out the project, and not the parent
company. Although in the end the project did not proceed, the ability of the proponents
to limit their risk exposure in this way was an important element in allowing the project
to get as far as it did (Wyatt 2002).
189 Source 12, Annex A6.4. 190 Source 1, 22 Annex A6.4.
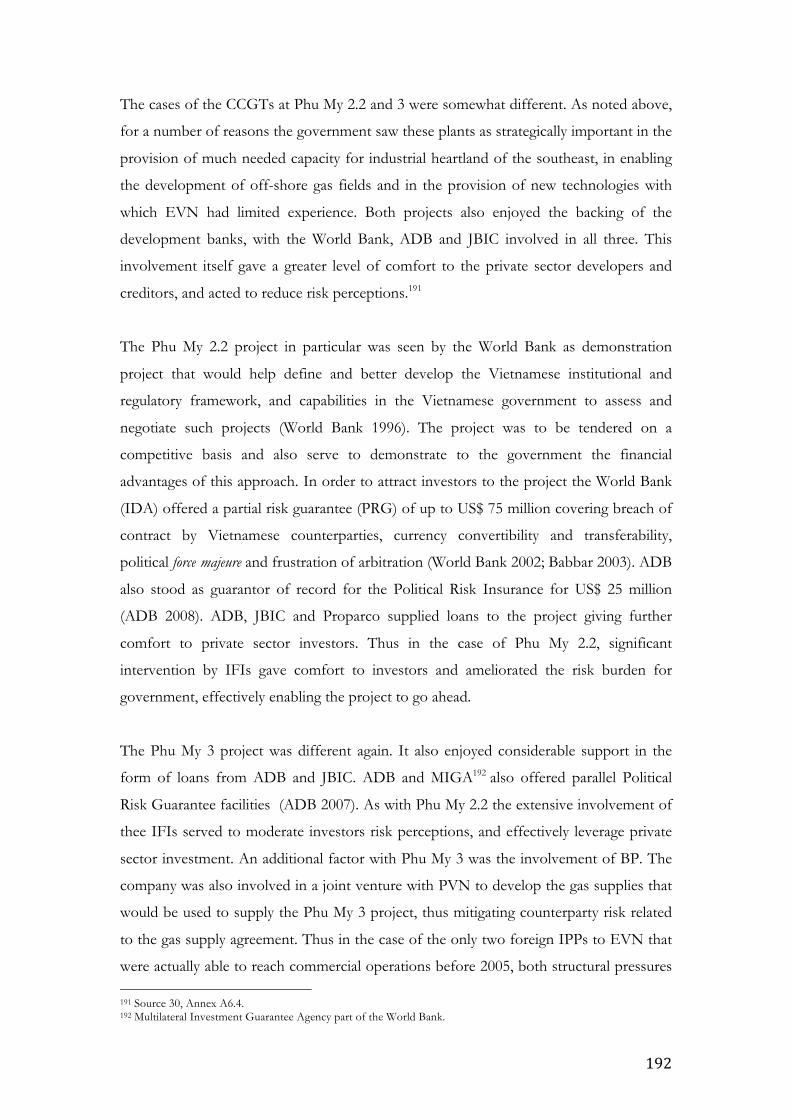
192
The cases of the CCGTs at Phu My 2.2 and 3 were somewhat different. As noted above,
for a number of reasons the government saw these plants as strategically important in the
provision of much needed capacity for industrial heartland of the southeast, in enabling
the development of off-shore gas fields and in the provision of new technologies with
which EVN had limited experience. Both projects also enjoyed the backing of the
development banks, with the World Bank, ADB and JBIC involved in all three. This
involvement itself gave a greater level of comfort to the private sector developers and
creditors, and acted to reduce risk perceptions.191
The Phu My 2.2 project in particular was seen by the World Bank as demonstration
project that would help define and better develop the Vietnamese institutional and
regulatory framework, and capabilities in the Vietnamese government to assess and
negotiate such projects (World Bank 1996). The project was to be tendered on a
competitive basis and also serve to demonstrate to the government the financial
advantages of this approach. In order to attract investors to the project the World Bank
(IDA) offered a partial risk guarantee (PRG) of up to US$ 75 million covering breach of
contract by Vietnamese counterparties, currency convertibility and transferability,
political force majeure and frustration of arbitration (World Bank 2002; Babbar 2003). ADB
also stood as guarantor of record for the Political Risk Insurance for US$ 25 million
(ADB 2008). ADB, JBIC and Proparco supplied loans to the project giving further
comfort to private sector investors. Thus in the case of Phu My 2.2, significant
intervention by IFIs gave comfort to investors and ameliorated the risk burden for
government, effectively enabling the project to go ahead.
The Phu My 3 project was different again. It also enjoyed considerable support in the
form of loans from ADB and JBIC. ADB and MIGA192 also offered parallel Political
Risk Guarantee facilities (ADB 2007). As with Phu My 2.2 the extensive involvement of
thee IFIs served to moderate investors risk perceptions, and effectively leverage private
sector investment. An additional factor with Phu My 3 was the involvement of BP. The
company was also involved in a joint venture with PVN to develop the gas supplies that
would be used to supply the Phu My 3 project, thus mitigating counterparty risk related
to the gas supply agreement. Thus in the case of the only two foreign IPPs to EVN that
were actually able to reach commercial operations before 2005, both structural pressures 191 Source 30, Annex A6.4. 192 Multilateral Investment Guarantee Agency part of the World Bank.
193
on the ESI, and the extensive involvement of international donors were instrumental in
enabling agreements to be reached (Quang & Diep Hoai 2003).
Up until around 2010 although many foreign IPPs were discussed none reached
development save the Xiaozhong River Hydropower Station and Ba Ria Vung Tau wind
farm. Both these projects, however, represented much lower levels of risk for the
investor than would typically be the case. Xiaozhong River Hydropower Station (22
MW) is located in Lao Cai province close to the Chinese border. It has a total investment
of around US$ 28 million and reached financial closure in 2007. The developer is the
state owned China Southern Grid Corporation (CSG), which supplies electricity to
China’s five southern provinces as well as imports to Vietnam’s grid in the northwest of
the country. In this case, the clout of the company and the dependence of northwestern
Vietnam on CSG for its electricity supplies probably served to reduce the perception of
investment risk.193 The second project, Ba Ria Vung Tau wind farm (7.5 MW) is a 100%
Swiss owned US$ 20 million BOT project, which reached financial closure in 2009. It
uses a combination of wind turbines and diesel generators to supply the isolated Con
Dao islands 180 Km off the Vietnamese coast. Due to the remote off-grid location the
project was able to reach an off-take tariff of USc 20/kWh, reflecting the alternative cost
of supply in the remote location (Saigon Times 2008). Thus the only other two FDI
projects in the ESI to go ahead from the completion of the Phu My projects to the end
of the decade were these small atypical projects, which were effectively off-grid and
serving remote locations.
It had been hoped that the development of the two Phu My projects would herald much
more significant foreign private sector investment in the ESI. This failed to emerge.
Issues with the quality of legislation and institutions, low tariff levels and the willingness
of government to take on contingent liabilities all served to frustrate the process. Despite
substantial rewrites of the relevant legislation in the amended Law on Investment in
2005, Decree 108 on BOT, BTO and BT investment in 2009 and in 2010 Decision 71
(Regulation on pilot investment using Public-Private Partnership model) and a constant
tinkering with supporting legislation, the legislative and institutional framework still
appeared weak, a fact attested to by numerous donor reports (ADB 2007; ADB 2008;
ADB & AFD 2012):
193 Source 26, Annex A6.4.

194
“For an economy the size of Viet Nam and with its increasing openness to private sector participation,
private investment in infrastructure and PPPs have been very limited. Government approvals and support
have been uncertain. Competitive bidding processes have not been the norm…[…]…There is currently a
lack of a credible PPP project pipeline. The private sector sees the government as “stop and go” when it
comes to PPP policies and actions, and it views PPP bidding and negotiation processes as unpredictable
and lengthy. Nor is the private sector entirely confident the government can carry out credible
(pre)feasibility studies for PPP.” (ADB & AFD 2012: 21)
And private sector commentators (Harris et al 2009; Asian Power 2009; BMI 2010;
Conaty 2010; Vietnam Investment Review 2013):
“…the Vietnam Government's approval process appears to some international industry leaders to be
designed to ‘tease’ private power developers/investors without any guarantee of agreeing on an acceptable
‘financeable’ tariff or PPA, until such time as a PPA is actually executed. Project developers are therefore
confronted with having to start PPA negotiations after 2-3 years of high-risk development work resulting
in additional millions of dollars in out-of-pocket expenses. All of this expensive ‘negotiation’ limbo is
played out against an atmosphere of uncertainty and unnecessary risk until the other shoe is finally
dropped with an execution of the PPA.” (Asian Power 2009:10)
The failure to catalyse the development of FDI in power projects might not be surprising
considering the dissatisfaction expressed by government sources relating to some aspects
of the Phu My projects (ADB & AFD 2012). In particular, the issue of EVNs failure to
pay take-or-pay invoices for gas at Phu My 2.2 was only resolved once MoI was forced to
intervene, and illustrated the extent of the contingent liabilities the government had
incurred (ADB 2008). Government dissatisfaction with both Phu My 2.2 and Phu My 3
was compounded by repeated breakdowns in 2006 due to issues with the localisation of
CCGT technologies, leading to system-wide power shortages (Viet Nam News 2006a;
Viet Nam News 2006b; ADB 2008). Following Phu My 3, the government was reluctant
to undertake such extensive guarantees for IPPs, and no significant majority foreign
owned projects were licenced by MoI between 2003 and 2010 (Harris et al 2009)194.
Finally, in the late 1990s and early 2000s according to industry sources, from EVN’s
point of view it was also time consuming and expensive to undertake complex IPP
negotiations. It was felt that EVN could meet investment needs through funding offered
194 In 2008 the roles of the Ministry of Industry (MoI) and those of the Ministry of Trade (MoT) were combined in the newly formed Ministry of Industry and Trade (MoIT).
195
by export credit agencies (ECAs) with MoF guarantees, or domestic financing deals.195 It
was only in 2008 when EVN was forced to withdraw from the development of 13
thermal power projects that the government had expected it to undertake due to lack of
funding that the BOT route seemed viable again (VietNamNet Bridge 2012).196
Figure 6.10. Structure of Phu My 2.2 project
Note: EPC – engineering, procurement and construction agreement; OE – Operational engineering
agreement; LTSA – long-term service agreement; TSA – Technical services agreement; BOT - Build own
transfer project agreement; PPA – power purchase agreement; GSA – gas supply agreement.
Source: Based on Mekong Energy 2013
Issues with FDI in the power sector point to more fundamental institutional and political
economy dynamics during this period. Firstly, the uncertainty caused by complex,
overlapping and ever changing formal institutional structures. Secondly, and linked to
this, the lack of coherent government, as different agencies with different agendas
competed with and obstructed one another, even if it is in the interests of MPI and MoI
195 Source 26, Annex A6.4. 196 Source 26, Annex A6.4.
EDF$
TEPCO$
GE$
EDF,$TEPCO$ PVN$(gas)&
EVN$(client)&
MOI$(concession)&
ADB,$JBIC,$Proparco$$
Commercial$Banks$World$Bank$
Mekong$Energy$Co.$
EDF$ Sumitomo$TEPCO$
TEPCI$ EDFI$ Summit$Global$
Loans&&75%&
Equity&&25%&
16%& 56%& 28%&
BOT&
PPA&
GSA&
EPC&
OE&&
LTSA&
TSA&
196
for a project to go ahead, it may not be in the interests of the State Bank of Vietnam
(SBV) to provide for currency convertibility, or the Ministry of Justice (MoJ) of the
Ministry of Natural Resources and the Environment (MoNRE) to allow the mortgage of
foreign held land use rights.197 Third, both these observations also reflect the limits to an
analysis focussed on formal institutional arrangements. Although formal institutional
arrangements in the ESI were constantly shifting the informal institutional arrangements
and the political economy processes that belied them changed much more slowly.
Change in the ESI seems to be more responsive to changes in the underlying patterns of
power rather than changes in formal institutional arrangements. In some cases these may
be in harmony but this cannot be taken for granted – as the case of BOT regulation
illustrates.
6.3.5 Continuing pressure to reform
Vietnam emerged from the Asian Financial Crisis relatively unscathed, at its low point in
1999 GDP growth dropped below five per cent, but rebounded strongly in 2000, this
was followed by something of an economic boom. The three years immediately prior to
the Global Financial Crisis (2006-2008) saw growth in excess of eight per cent. This was
accompanied by an asset price bubble, in 2007 the HCMC stock exchange index had
risen 140% compared to the previous year, real estate prices had in some sectors risen to
more than 200% of their pre-2007 levels (VietNamNet Bridge 2008; Pincus & Vu 2008;
East Asia Forum 2009; Jehan & Luong 2010). Exports reached almost US$ 70 billion
(78% of GDP) and net FDI inflows reached US$ 9.6 billion (10.5% of GDP) in 2008
(World Bank 2013). External factors including the global commodity price boom and
Vietnam’s accession to the WTO in January 2007 played an important part in this rapid
growth. Howeer, this boom presaged greater economic volatility and bust in the years
that followed.
For the ESI, this period was marked by continuing pressure to keep pace with rapid
electricity demand growth, which between 2000 and 2010 was running at around 13.6%
(IEA 2013). Despite significant capacity additions (over 6,500 MW between 1995 and
2005), improvements in the quality and reliability of service (World Bank 2001, 2008,
2009) and the remarkable expansion of rural electrification (Figure 6.4), the sector faced
197 Source 22, 26, 2, 3 Annex A6.4.
197
mounting challenges. 198 Technical performance at EVN remained an issue, with
significant transmission and distribution losses and considerable inefficient plant still in
operation. But above all else, EVN was failing to meet higher expectations about the
reliability of electricity supply, from both the business community and the public at large
(e.g. see Nguyen 2005).
Difficulties with ensuring supply stemmed from both the rapid expansion in demand and
the hydro-dominated generation mix. The fifth power development plan, developed at
the end of the 1990s in the midst of the Asian Financial Crisis, and the rapid rebound in
demand growth was not foreseen. As a result capacity expansion plans fell short of actual
demand (World Bank 2006b; IE 2007). EVN was also meeting increasing problems in
fulfilling capacity and network expansion plans, due to a combination of technical
difficulties and limited financial resources. By 2006 approximately 1,700 MW of capacity
was behind schedule (IE 2007). What is more, in dry years limitations on the supply of
electricity from hydropower plants continued to necessitate extensive load shedding, for
example in 2005, 2007, 2008 and 2010 (World Bank 2006b, 2008; Forbes 2010; The
Diplomat 2010). EVN’s large hydropower portfolio meant that load shedding and the
lost sales this implied affected its financial performance, instead of selling cheap
hydropower generated electricity for a profit, it would need to buy expensive electric
from non-EVN suppliers and sell this on at a loss (Viet Nam News 2006).199
The net result of all this was that insufficient reserve ratios and a lack of grid capacity
lead to frequent outages and voltage drops (World Bank 2009).200 Power outages were
frequently cited as a major constraint in doing business in investment climate surveys,
with a survey in 2006 finding that 19% of manufacturing enterprises rated the quality and
reliability of grid-based power supplies as a significant constraint to their business (World
Bank 2009). Public expectations of cheap and reliable power supplies had increased with
increasing affluence, rising residential demand in rural and urban areas lead to higher
levels of discontent with power provision as perennial dry season power shortages
198 For example, between 1995 and 2000, staffing ratios at EVN had improved from 72 customers/employee, to 94 customers/employee, and 385 MWh/employee to 630 MWh/employee (World Bank 2001). 2005 T&D losses had declined from 22% to 14%, rural electrification had increased from a little over 10% to 73%. 199 That is CCGT plants at Phu My and imports from CSG. 200 The World Bank (2009) notes that in the absence of systematic monitoring mechanisms it is difficult to be more exact about reliability issues. We are similarly forced to rely on anecdotal evidence.
198
persisted (Viet Nam News 2005a, 2005b, 2005c, 2006a, 2006b, 2007a, 2007b, 2007c,
2008a, 2008b, 2009, 2010; Saigon Daily 2010).201
Almost as frequently reported in the press was a simmering consternation about
increased electricity tariffs. Both the public and energy intensive industries reacted
strongly to proposed increases in electricity tariffs (Lao Dong 2005; Viet Nam News
2005d, 2006d). The Government fretted about inflationary impact of tariff increases, but
was also conscious of their unpopularity – for which they were directly responsible
(Nguyen 2008).202 On the other hand, EVN, the IFIs and prospective private sector
investors were dismayed by their failure to persuade government to move towards a
more cost reflective tariff (discussed in greater detail in section 6.3.9).203
In these respects, from the perspective of the government, the corporatisation of EVN
in 1995 had proved propitious. Despite continuing close links between EVN and
government (both formal an informal), ostensibly at least EVN was an independent
enterprise and at arms length from the state. The government and CP were thus
somewhat insulated from public dissatisfaction with perceived performance failings at
EVN and unpopular price rises.204 Press reports reflect the executive (typically the PM
and deputy PMs) positioning itself as an arbiter between EVN and electricity consumers.
The truth may have been rather different, with close links between EVN (and other large
SOEs) and the higher levels of government and the CP.205 And in terms of provisioning
essential public goods, the government maintained an obvious interest in improving the
performance of the ESI and its long-term financial sustainability. Nevertheless, public
expressions of discontent from Prime Minister and Deputy Prime Ministers with EVN’s
performance were reported with increasing frequency in the (state controlled) media.
EVN became subject to more frequent criticism in the press, with various commentators
blaming its monopoly on electricity provision for what was perceived as its poor
performance (Inter Press Service 2005).
Rapid demand growth meant investment needs had increased precipitously. Estimates
suggested capital investment needs in the ESI of between US$ 4 - 4.5 billion a year 201 Source 1,7,15 Annex A6.4. 202 Recommendations for price increases were sent through EVN and MoI to the State Pricing Commission. Their recommendation would be authorized by the PM. 203 Source 3,4 Annex A6.4. 204 Source 24, Annex A6.4 205 Source 24, Annex A6.4
199
between 2006 and 2010, and this relative to EVN revenues of US$ 2.7 billion in 2006
(World Bank 2008; MoI 2007; Nguyen 2008). Hitherto, capacity expansions - with the
exception of the two Phu My plants - had been largely financed through domestic bond
issues, borrowing from domestic banks and ODA. This large expansion of debt is
reflected by EVN’s changing financial position. Between 1996 and 2004 its debt to equity
ratio had increased from 11:89 to 55:45, and its debt service coverage ratio had declined
from 13 to 3.7 over the same period (Krishnaswamy & Stuggins 2007).206 These levels of
debt were not unsustainable, but with large investment needs, and without substantial
improvements in performance and higher tariffs the trend was not (ADB 2003; World
Bank 2006b; Krishnaswamy & Stuggins 2007). With the government unable to find
financial resources to fund capacity expansion, and unwilling to underwrite credit risks
EVN would have to look elsewhere for investment capital (World Bank 2006b, 2009).207
Finally, strategically it was clear that in the medium term prices would need to be raised.
The cheapest sources of hydropower and coal had been exploited. The levislized costs of
incremental capacity expansions were bound to be higher.208 And by 2014 - 2015
Vietnam was expected to become a net energy importer (Table A6.2). This would mean
that the power sector would need to increasingly turn to international markets and pay
market rates for the fuel used at many of its new thermal plants. The control of prices for
this critical input had, in effect, allowed the natural resource rents associated with
Vietnam’s fossil fuel reserves to be distributed to key sectors, the general population and
perhaps into the back pockets of powerful patrons, but these rents would not be avialble
for imported fuels priced in international markets. Of course the imperative to raise tariff
levels was there anyway (i.e. to ensure that fuel and power suppiers could achieve a level
of long-term financial sustainability), but the prospective reliance on more expensive
sources of power represented a much more tangible and immediate reason to lift prices.
From the perspective of the IFIs, despite improved technical performance in the ESI,
institutional reforms still left a lot to be desired. Firstly, a condition of ADB and World
Bank lending to the sector was a government undertaking to raise tariff levels. However,
average end-user tariff levels reached less than 5 USc/kWh in 2001, well below the target
206 The debt service coverage ratio is the ratio of net operating income to debt repayments. 207 Source 4 Annex A6.4. 208 i.e. the average cost of generation of a particular type. Calculated based on investment costs depreciated over a fixed
period, plus operational costs divided by electricity output, figure typically given in USc/kWh or US$/MWh.
200
tariff of 7 USc/kWh agreed with the banks. This lead to power sector loan programmes
at both bnkas receieving unsatisfactory perofmance evaluations. Secondly, the promised
Electricity Law that would set out an ambitious program for sector reform was slow to
emerge to the evident chagrin of both banks. The law had been through an extremely
long and time-consuming period of development. In 1997 the law was expected in 1998
with formal adoption later that year or early 1999, in 2001 a World Bank project
completion report commented hopefully that, “…Government's commitment to sector
reform remains high and the Electricity Law and secondary regulation are expected to be
approved in 2001.” (World Bank 2001: 12). The law had reached its 14th draft in 2001
according to ADB (ADB 2001; World Bank 2001). The law was eventually passed by the
National Assembly in 2004 and came into force in 2005.
By the mid-2000s, a decade after the first round of reforms, the pressures for reform in
the sector, to improve performance, expand capacity and achieve financial sustainability
remained the same. If anything, larger debt burdens at EVN and ever increasing
incremental capacity demands meant the pressures were more acute. Considerations of
long-term energy security had also emerged as an increasingly important factor in sector
strategy.
The political pressure for better performance in the ESI was mounting to boot, as
expectations about the quality and reliability of supply, and electricity demand amongst
both businesses and the general population grew. Again it is worth stressing the limited
traction that IFI badgering seemed to have had. There were always reasons for delays in
lifting the power price (the Asian Financial Crisis and the expected economic impacts of
the 9/11 attacks), and foot-dragging on the adoption of the Electricity Law (the
legislative burden facing the National Assembly) (World Bank 2001). Although donors
were undoubtedly listened to, and the notions neo-liberal reform they purveyed were
increasingly influential in some circles, their ability to effect the sort of institutional
change that they recommended was limited. In the end it would be the combination of
economic imperatives and political interests which drove the second round of reforms.209
209 Source 4,20 Annex A6.4.
201
6.3.6 The second wave of reforms
Between 2004 and 2006 a second round of reform in the ESI got underway, with the
adoption of the Electricity Law in 2004. This was the first law governing activities in the
ESI in Vietnam. It covered planning, the development of an electricity market, tariff
levels, and licencing and regulation of the sector. Importantly, the law provided the
legislative basis for the creation of a system regulator (the Electricity Regulation Agency
of Vietnam (ERAV)) and the development of competitive electricity markets. A ‘road
map’ for the development of competitive markets was published in 2005 by MoI, this
envisaged the gradual unbundling of the ESI along the lines of the standard model
(Chapter 4, section 4.2.6-7). Initially competition would be restricted to generation, then
wholesale competition would be introduced for bulk supply (including large consumers),
the final stage reached after 2024 would be that of full retail competition (Freshfields
Bruckhaus Deringer 2005)(Figure 6.11).
The law, in principle, signalled the government’s long-term intention to embrace the
standard model of ESI liberalisation. The stated objectives of the reforms were to
improve the efficiency of the sector’s performance, and raise prices to a level where they
could reflect costs, attract investment, and discourage inefficient use of electricity.
Another key element implied by the reforms was a gradual removal of the cross-
subsidisation of residential by industrial tariffs.210 The standard model would be the
means of achieving these goals, with market competition would incentivising
performance improvements. Cost reflective tariffs determined by the market, while
inevitably leading to higher tariff levels than the subsidised rates that were in place,
would incentivise more efficient use of electricity and attract much needed investment to
the sector (and upstream energy sectors).
The state monopoly would be restricted to transmission and load dispatch. State
ownership of power plants would be limited to those that were deemed strategically
important, i.e. very large hydropower plants and planned nuclear plants. Hydropower
plants were deemed strategic as they also had important flood control and irrigation
functions that needed to be balanced against power generation needs. Thus the plant at
Ya Ly and the Da river cascade (Hoa Binh, Son La and presumably Lai Chau which is yet
210 Source 10, 13 Annex A6.4.

202
to be constructed) would remain under state ownership and control. 211 Similarly,
proposed nuclear plants would be exempt from privatisation, reflecting the strategic
nature of the technology – and perhaps the likelihood that a new and costly technology
would struggle to complete in the market (National Assembly 2005; World Bank 2006b;
Nguyen 2012).212
Figure 6.11. Roadmap for developing the Vietnam electricity market
Source: MoI 2005
The road map for the electricity market adopted a cautious timetable, with the Minister
of Industry, Hoang Trung Hai, predicting that it could take up to 30 years to reach full
retail competition given the technical and institutional complexity of the task (Viet Nam
News 2006e). As such the immediate practical implications of the legislative changes
were, at the time, limited. A regulator was formed, but this remained under the authority
of MoI, which also remained in charge of EVN. Price levels were still effectively set by
the Price Management Commission at the MoF, on representations from EVN and
ERAV, and approved by the PM. EVN remained owned and controlled by MoI, and
with 76% of the generation capacity (excepting the Phu My plants 88% of capacity), a
monopoly on transmission, distribution and retail, EVN remained a vertically integrated
electricity utility.
211 Operators at Hoa Binh, for example, are unable to optimise water use for power generation as the reservoir needs to be drawn down prior to the wet season to provide enough storage to allow the dam to act as a buffer against floods. Thus offering some protection to the capital city Hanoi from flooding during wet season. 212 These exceptions to the principles of equitization were further defined in a Prime Ministerial Decision in 2007.
2005$ 2009$ 2014$ 2016$ 2022$ 2024$
Genera&on(of(compe&&ve(single(market((Single(buyer)(
Wholesale(compe&&ve(market(
Retail(market(
Preparing(for(single(buyer(market(
Preparing(for(wholesale(market( Preparing(for(retail(market(
Internal$market$(single$buyer)$
Genera;on$compe;;ve$market$
–$Single$buyer$
Pilot$wholesale$market$
Wholesale$compe;;ve$market$
Pilot$retail$market$
Retail$Compe;;ve$$
market$
203
Arguably the most significant change that took place in the wake of the Electricity Law
was the further restructuring of EVN as a holding company, the development of
generation and distribution units under EVN as independent legal entities, and their
subsequent equitization.213 Under Decision 147 of the Prime Minister adopted in June
2006, Vietnam Electricity Group was formed (PM 2006). Similar to the corporatisastion
reform in 1995, this was part of a wider move to restructure the large SOEs in strategic
sectors, but this time as ‘State Economic Groups’ (SEGs). As with the first restructuring
that took place at EVN, ostensibly at least, this also reflected the continuing desire to
emulate the success of the Korean Chaebol and Japanese Keiretsu (Kim et al 2010). This
was essentially a continuation of the CP’s stated policy since the early 1990s, which
entailed the formation of the state corporations. The immediate prospect of membership
of the WTO was an important factor spurring the creation of these groups. It was hoped
that privileged access to inputs and increased autonomy would enable them to compete
effectively with international firms (World Bank 2011b).214215
In 2006 and 2007 eight economic groups were formed including EVN (and the other
energy parastatals Vinacomin (TKV) and Petrovietnam (PVN)). These reforms were
supposed to tighten corporate governance and place economic groups under the direct
authority of the PM.216 This represented a further extension and consolidation of the
corporatisation that took place in 1995 (Kim et al 2010). In the case of EVN, former
business units were either subsumed in the mother company (including National Load
Dispatch Center, National Power Trading Company and a number of power plants,
including multipurpose hydropower plants), or transformed into legally independent
subsidiary companies (in which EVN held equity of more then 50%), affiliated
companies (in which EVN held less than 50% of the equity) and other administrative
entities (including a number of training establishments and the Institute of Energy).217
213 The importance of rhetoric again, avoiding the term “privatization”, in Vietnam it is termed “equitization”. 214 It should also be noted that along with the objectives of increasing international competitiveness, EVN still had a mandate to provide important public goods including access to households in remote areas, technological upgrading, and the government maintained the option of using EVN’s large economic footprint as a macro-economic leaver. 215 Source 18 Annex A6.4. 216 This was with the notable exception of the exception of Bao Viet insurance company which was under the authority of the MoF. 217 At the time of its creation Vietnam Electricity Group (as distinct from the holding company EVN) comprised of 50 member companies, 21 in which it held 100% of the equity, nine of which it held greater than 50% of the equity and a further 20 in which it held less than 50% of the equity (Kim et al 2010).

204
From the perspective of the standard model, this reform was an additional step towards
the unbundling of the sector. The creation of legally independent enterprises prepared
the way for equitization (in fact three generation companies had already had IPOs in
2005 (see following section)), and the conversion of business units to independent
entities formally separated the different functions of the vertically integrated utility
(generation, distribution, and load dispatch and transmission). Thus, from the point of
view of sector reform it represented another important phase in the introduction of
competitive markets to the ESI.
Parallel to the gradual development of standard model reforms, there was already an
altogether different process going on at EVN.218 One of the key donor recommendations
in the first wave of sectoral reforms was that EVN concentrated on its core interests, and
divest itself of units involved in activities not central to its function as an electricity
utility. These units included construction companies (often but not always involved in
the construction of power infrastructure), power consulting companies, mechanical
engineering companies (again involved in supplying engineering equipment to the power
sector), training companies and a number of hotels. This divestment had not taken place.
On the contrary, EVN, along with a many of the other large SOEs, was increasingly
diversifying into other sectors (at the same time a number of large SOEs involved in
construction, engineering and energy supply were moving into the power sector (see
following section)) (Pincus & Vu 2008). EVN’s first annual report as an economic group,
published in 2006 makes clear its intention not only to maintain its none core activities
but to diversify out of the electricity industry, listing amongst its objectives:
“…Enhance investment business in public telecommunication and internet services with objectives of
providing telecommunication services with the lowest prices and best quality…[…]…strive for the target
of having 2 million customers by 2007 and 10 million by 2010. Focus on studying and developing banking,
financing, insurance and security services; gradually makes these activities become core operations[s]
aiming to mobilize investment capital and increase revenue and income for EVN…” (EVN 2006)
EVN took a 30% stake in Anh Binh Bank in 2005. It also made ambitious expansion
plans in the telecommunications sector, with investments of US$ 200 million in EVN
218 The government was also keen to ensure that it retained sufficient control over these companies that they could be used as tools to achieve macro economic policies should needs be (World Bank 2011c).
205
Telecom in 2005 alone (Viet Nam News 2005e, 2005f, 2006f, 2007d)219. In the following
years EVN also moved into securities, insurance, and real estate investment (Viet Nam
News 2006g, 2006h; VietNamNet Bridge 2008; Nguyen 2010). Nor was EVN alone in
this, as the other SEGs (including the energy parastatals TKV and PVN) also moved to
diversify their business activities.
There were mixed views on the wisdom of this diversification. Whereas some
commentators saw the move of the SEGs into other fields simply as a means to generate
profits in what were booming sectors (Viet Nam News 2007d), others were altogether
more cautious. They pointed out that in contrast to the Korean or Japanese models, by
and large, these companies did not compete in export markets, but relied upon industrial
policy and preferential access to inputs and markets to engage in import substituting
industrialisation, thus seeking to dominate the domestic market over which they had
privileged access (Kim et al 2010; Perkins & Vu 2010; World Bank 2011a):220
“The idea was that larger firms would realize economies of scale and scope, which would enable them to
compete internationally. The gap in the logic was that most of the conglomerates…[…]…earned their
money from mineral rents or preferential access to the domestic market. Rather than wade into the
treacherous waters of international competition, most preferred to build on their market power in Vietnam
to move into lucrative domestic ventures in the property market, financial services, telecommunications
and tourism…. The conglomerates did not turn into world beaters, but they did learn how to trade on their
political influence at home.”[emphasis added] (Pincus & Vu 2008: 31-32)
Government was eventually forced to start reining-in the trend towards diversification at
the SEGs. By the late 2000s there seems to have been the realisation that SEGs were not
performing particularly well. By 2007 they were accounting for around 70% of foreign
debt and 60% of loans from the SOCBs, but only 40% of GDP (Pincus & Vu 2008;
World Bank 2011a). Pincus and Vu (2008) report that in April 2008 the PM ordered state
general corporations and conglomerates to ensure that a minimum of 70% of their
capital investment was in core businesses. At around the same time, expressions of doubt
emerged from a number of authors as regards the possibility of effective state control of 219 Two chairs on the board came with this investment, that of Vice Chairman went to the EVN Chairman Dao Van Hung and a seat on the board for EVN’s Deputy Director General, Duong Quang Thanh (An Binh Bank 2007). 220 Perkins and Vu (2010) for example are highly critical “EVN’s expansion into telecommunications, financial services, and real estate development cannot help but divert its limited human and financial resources from its core responsibility…[…]…A regulated monopoly such as EVN should work best not if it is large and complicated with many side businesses, but if it focuses on its main task and does it effectively and profitably at a reasonable cost.” (Perkins & Vu 2010: 36)
206
these enterprises (Pincus & Vu 2008; Fforde 2009). But divestment of non-core
investments did not really get underway until the situation become critical (section 6.3.7).
EVN differed from many large SOEs in that evidence of its performance was clear every
time customers received a bill or suffered a power cut. In the years that followed this
second rounf of restructuring, EVN’s performance and management would come under
increasing scrutiny.
On one hand, Vietnam had adopted a neo-liberal model of power sector reform, with
the notional target of full retail completion sitting on the distant horizon. On the other
hand, even as the institutional changes that would enable these reforms were being put
slowly into place, EVN - in common with the other SEG behemoths - was leveraging its
political and economic influence in pursuit of a set of interests that were not necessarily
in accord with either the objective of the efficient operation of the ESI, or indeed with
the broader public good.
A further illustration of this point was EVN’s proposal for the creation of a single buyer
market in 2007. This was the first step in the process of developing a competitive
generation market. The function of the single-buyer was to buy electricity in a
competitive wholesale generation market and sell it on at regulated prices to distribution
companies and large consumers (Nguyen 2012). To act as the single-buyer EVN
proposed the creation of a power buying joint stock company (JSC) the ‘Electricity
Purchasing and Trading Company’ (EPTC). EVN would have a controlling stake in the
new company of 51%, with the remaining shares held by a number of other large SOEs
(PVN, TKV, Song Da, Liliama, the national steel and cement corporations and VNPT).
The company’s chartered capital was to be US$62 million, and according to Dao Van
Hung Chairman of EVN at the time, it was expected to make a profit of between US$
3.1 - 6.2 million per year (Viet Nam News 2007e).
This proposal was met with dismay by the World Bank. Martin Rama, the acting director
of the World Bank in Vietnam at the time, took the unusual step of writing an open
letter to MoI expressing his concerns about the proposed single buyer model (Viet Nam
News 2007f). Two main concerns were raised about EVN’s proposal. First, that the
ownership of the single-buyer by EVN would represent a conflict of interest becaue
EVN also owned a large proportion of generation capacity. There would therefore be a

207
strong incentive for EVN to give preferential treatment to its own power generators.
This in turn would discourage prospective investors and force them to require long-term
PPAs, effectively side-stepping the market mechanism and damaging the prospect of the
development of a fully competitive generation market. Secondly, there was concern
expressed relating to the creation of a stand-alone single buyer operating for profit. This
was because the operation of the single-buyer may imply duplication of dispatch
functions in the existing NLDC unnecessarily increasing costs. Morover, it was suggested
that the incentive to maximise profits at the single-buyer may also lead to higher than
envisaged profits and higher consumer costs (Viet Nam News 2007f). The preferred
solution was to create an entity combining the monopolistic functions of load dispatch,
transmission and single-buyer, that was independent of the generators (Nguyen 2010).
EVN attempted to publicly rebut the World Bank’s arguments, suggesting i) that the
creation of an independent single buyer, transmission and load dispatch entity was
prohibitively expensive; ii) that user tariffs were controlled by the Price Control
Committee anyway so the proposed model could not lead to inflated prices; iii) that a
conflict of interest would not emerge because stakeholders in the EPTC would agree to
‘step aside’ and not partake in power price negotiation; and, iv) perhaps most
disingenuously, that collusion in bidding for new power supplies would not take place as
“it was illegal and that member companies would be State-owned and therefore would
follow Government regulations strictly and provide fair prices to Vietnamese consumers
as promised” (Viet Nam News 2007e).
The unpopularity of the move forced the PM to order ERAV to investigate EVNs
proposal, which was in the end rejected. As of 2008 a single buyer did start pilot
operations but it was wholly owned by EVN, a dependant accounting entity and did not
operate for profit – addressing some of the concerns raised by the bank (ERAV 2008;
Nguyen 2010). Nevertheless, this meant that EVN retained effective control over power
purchase and dispatch, which would lead to an abuse of its market power in just the ways
envisaged by the bank (following section). More broadly, this was also indicative of
EVNs reluctance to undertake reforms that may affect its position.221
221 Source 25,26,30 Annex A6.4.

208
What emerges from a discussion of the second round of sector reforms are two main
trends. Firstly, the need ensure that essential public goods were delivered remained
paramount,222 this is analogous to Fforde’s (2009) observation (in relation to the public
good of macro-economic stability) that Vietnam’s political economy for all its
dysfunction was marked by an ability to do what it takes to ensure the delivery of critical
goods. In the case of the power sector, this was represented by need to improve the
performance of the sector and ensure adequate capacity expansion. This must also speak
of the influence in some quarters of technical experts and consultants schooled in the
neo-liberal economic theory, which advocated the standard model of reform as the best
way to deliver these public goods.223 In key government institutions neo-liberal thinking
has become influential, including for example the Office of Government, some sections
in MPI, the Central Institute of Economic Management (CIEM) and ERAV, this echoes
Gillespie’s experience of legal reform in Vietnam:
“There are small but influential cliques within the lawmaking elite in sympathy with neoliberalism. They
cluster around the collaborative structures that bind foreign donors/lawyers, Vietnamese consultants, and
state officials working on law reform projects. These communities inculcate neoliberal regulatory ideas by
bringing foreign advisors into a close working relationship with local legal consultants and state officials.”
(Gillespie 2008: 692)
Sector reform could also imply potential political benefits. While it is unlikely that the
Vietnamese public take the reforms at face value, it is also likely that the formal
independence of EVN from the administrative arm of the state has continued to prove
politically expedient for the CP. The locus of blame for unpopular power cuts, tariff rises
and environmental damage is shifted from the state and the CP somewhat. Further
reforms which would allow prices to be determined by market mechanisms, rather than
by administrative fiat would act to depoliticise the power price decisions by putting it in
the hands of the market. But for this to be effective the monopoly that EVN enjoyed
would need to be dismantled. And there would need to be confidence in the market
mechanism.224 Both of these conditions seemed a long way off.
222 Source 5 Annex A6.4 223 Source 4,6,22 Annex A6.4 224 It should be noted that even in the UK market, within which the regulatory paradigm was developed, there remains little public faith in the operations of the power market. Even here power price and the suspicion of excessive profits at power companies remains a politically fraught issue.
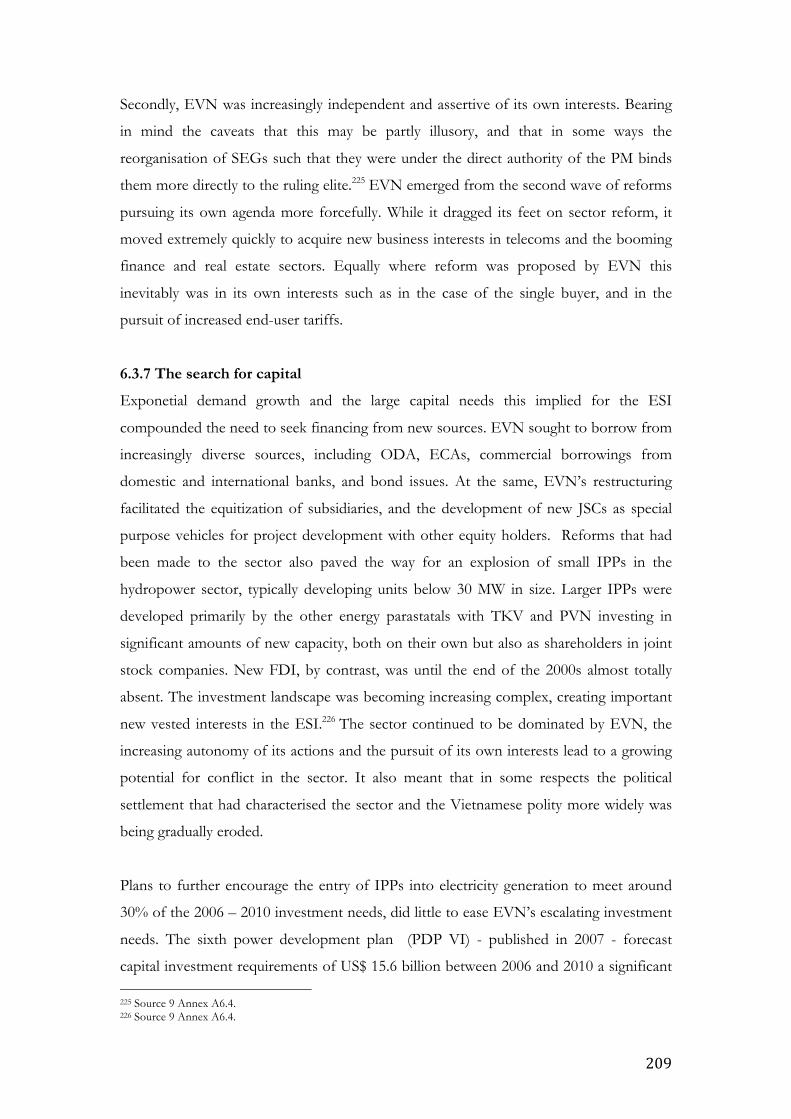
209
Secondly, EVN was increasingly independent and assertive of its own interests. Bearing
in mind the caveats that this may be partly illusory, and that in some ways the
reorganisation of SEGs such that they were under the direct authority of the PM binds
them more directly to the ruling elite.225 EVN emerged from the second wave of reforms
pursuing its own agenda more forcefully. While it dragged its feet on sector reform, it
moved extremely quickly to acquire new business interests in telecoms and the booming
finance and real estate sectors. Equally where reform was proposed by EVN this
inevitably was in its own interests such as in the case of the single buyer, and in the
pursuit of increased end-user tariffs.
6.3.7 The search for capital
Exponetial demand growth and the large capital needs this implied for the ESI
compounded the need to seek financing from new sources. EVN sought to borrow from
increasingly diverse sources, including ODA, ECAs, commercial borrowings from
domestic and international banks, and bond issues. At the same, EVN’s restructuring
facilitated the equitization of subsidiaries, and the development of new JSCs as special
purpose vehicles for project development with other equity holders. Reforms that had
been made to the sector also paved the way for an explosion of small IPPs in the
hydropower sector, typically developing units below 30 MW in size. Larger IPPs were
developed primarily by the other energy parastatals with TKV and PVN investing in
significant amounts of new capacity, both on their own but also as shareholders in joint
stock companies. New FDI, by contrast, was until the end of the 2000s almost totally
absent. The investment landscape was becoming increasing complex, creating important
new vested interests in the ESI.226 The sector continued to be dominated by EVN, the
increasing autonomy of its actions and the pursuit of its own interests lead to a growing
potential for conflict in the sector. It also meant that in some respects the political
settlement that had characterised the sector and the Vietnamese polity more widely was
being gradually eroded.
Plans to further encourage the entry of IPPs into electricity generation to meet around
30% of the 2006 – 2010 investment needs, did little to ease EVN’s escalating investment
needs. The sixth power development plan (PDP VI) - published in 2007 - forecast
capital investment requirements of US$ 15.6 billion between 2006 and 2010 a significant 225 Source 9 Annex A6.4. 226 Source 9 Annex A6.4.
210
increase on the former plan which forecast requirements of US$ 11.9 billion over the
period (World Bank 2006, IE 2005) (Figure 6.13). The sharp increase in investment
needs left EVN with an estimated capital shortfall of US$ 3 billion by 2005 (Viet Nam
News 2005g). Up until the mid-2000s EVN had been able to maintain relatively sound
financial position despite low tariff levels, meeting capital investment requirements
through self-financing and moderate levels of borrowing from ECAs, ODA and
domestic sources (World Bank 2006a; World Bank 2006b).227 Bourgeoning capital
investment needs however, forced EVN to increase borrowing and seek alternative
sources of funding.
Figure 6.12. EVN estimated average annual capital investment needs PDP V, PDP VI and PDP
VII
Source: IE 2007, World Bank 2006, Kadono & Au Minh 2012
EVN has relied on bond issues to fund capital investment projects since the early 1990s,
with approximately US$ 67.6 million was raised for ESI investment through three
domestic bond issues in the 12 years between 1992 and 2004.228 Bond issueance saw a
dramatic increase in subsequent years, with US$ 685.3 million raised through 13
domestic bond issues in the six years between 2005 and 2010 EVN (Vuong & Tran
2010).
227 Indeed as mentioned above it was the ability to fund projects with ECA backing more cheaply than BOTs that lead the government to prefer this option. 228 Including two tranches by EVN and one by Ya Ly hydropower company a 100% owned subsidiary of EVN.
!"!!!! !1,000!! !2,000!! !3,000!! !4,000!! !5,000!! !6,000!!
2004!"!2010!
2006!"!2010!
2011!"!2015!
2011"2020!
PDP!V!
PDP!VI!
PDP!VII!
US$!Million!
Genera&on(
Transmission(and(distribu&on(
211
EVN was also able to raise a significant amount of capital in borrowings from domestic
banks. Between 2001 and 2005 EVN had reportedly borrowed approximately US$ 625
million from domestic commercial banks. As with bond issues this borrowing accelerated
rapidly in the late 2000s. For example, in 2006 EVN reached an agreement to borrow up
to US$ 2.7 billion on preferential terms between 2006 and 2010 from a consortium of
SOCBs including Vietnam Industrial and Commercial Bank (Incombank), the Bank for
Foreign Trade of Vietnam (Vietcombank), the Bank for Investment and Development of
Vietnam at preferential (BIDV), and the Bank for Agriculture and Rural Development
(Agribank) (Viet Nam News 2006i). However, prior to 2006 prudential regulation had
limited bank lending to a single borrower to 15% of bank equity, apparently in a move to
enable EVN borrowing from SOCBs the PM intervied to raise the lending limit with
respect to EVN (Viet Nam News 2006j, 2007g).229 EVN was also able to reach loan deals
with international investors, such as in the agreement with AB Bank (in which it held a
30% stake), PVN Finance, Deutsche Bank and Vinacapital230 for a loan of US$ 460
million in 2006 (Viet Nam News 2006k).
ECAs and bilateral ODA also provided significant amounts of credit often on
concessional terms to EVN.231 Japan, Korea and China were particularly active in
providing finance for power sector projects. For example, from the early 2000s onwards
China Export-Import bank along with other Chinese financial institutions acted to lend
capital and in some cases offer partial risk cover for an increasing number of power
plants in Vietnam. This was typically related to the procurement of EPC services and
Chinese capital goods for the construction of new hydropower and coal-fired thermal
power plants (such as the Quang Ninh I coal fired power plant) (BMI 2007, 2010; Tien
Phong 2010). Japanese ODA had been an important source of loans EVN’s power
projects since the early 1990s, with concessional lending amounting to about US$ 2.9
billion between 1993 and 2004. Japanese ODA continued to be the single largest source
of capital for EVN making an additional US$ 2.1 billion in loans between 2005 and 2013
(JBIC 2008; Vietnam Investment Review 2013). This lending has also typically been
linked to the procurement of capital goods and services from Japanese firms. EVN also
received a considerable amount of funding from World Bank and ADB. Up to 2005 the 229 The SBV also made a similar concession to Petrolimex the gasoline importer and distributor, and the other of Vietnam’s heavily subsidised energy companies in the same year, but in Petrolimex the provision only applied for Vietcombank (Viet Nam News2006). 230 An AIM listed investment fund. 231 Funds from ECAs are tied to the procurement of engineering services and capital goods (which typically constitute 80-90% of costs) purchased from these countries.

212
World Bank had leant a total of US$ 1,339 million to EVN and ADB US$ 650 million.
However, these loans came with their own conditions, and as Vietnam reached ‘middle-
income’ status it would not longer be eligible for concessional loans with the lowsest
rates of interest (EVN 2006; World Bank 2008; Kadono & Au Minh 2012).
Borrowing had its limitations. Debts would need to be repaid and debt service would
place increasing strains on EVN’s budget, further limiting its ability to finance much
needed capital investments. Moreover, most loans from foreign sources had strings
attached, whether they were the need for government guarantee racking up contingent
liabilities, procurement requirements as with much ECA and bilateral ODA lending, or
the conditionality imposed by IFIs. EVN did not face such stringent conditions in the
domestic market, where it was able to trade on its political importance and close
connections with government, banks and other large SOEs to obtain preferential bank
loans from SOCBs in particular.232 Indeed, one of the reasons EVN claimed it bought
AB Bank was to enable it to obtain loans from the bank when it was having difficulty
raising funds elsewhere (Nguyen 2010).233 Close relationships with domestic financial
instititions and political power were also key to enabling EVN’s series of successful bond
issues, as Vuong & Tran (2010) note:
“The only way to secure the funding from bond issues for an issuer is to build close relationships with
financial powerhouses that could help prearrange the required finance prior to the actual announcement of
bond issues; and we clearly cannot regard this act as arm’s-length transaction, since the opportunity is not
equal among enterprises and does not depend on the only basis of financial viability of issuers.” (Vuong &
Tran 2010: 15)
By contrast the one international bond issue EVN attempted in 2007 targeting between
US$ 300 – 500 million failed (Vuong & Tran 2010).
Thus EVN was still a long way from being able to raise financing for the sector on the
basis of its balance sheet alone. Debt that was raised either came with government
guarantees, was effectively policy lending (from SOCB and ODA sources), relied on
close patronage relationships between EVN and the lender, or in the case of ECA
232 Source 9,22,30 Annex A6.4. 233 The Minister of Industry told the National Assembly in 2007 that “EVN invested in An Binh Bank but only in order to borrow from the bank while other banks turn down EVN’s requests” (Nguyen 2010).
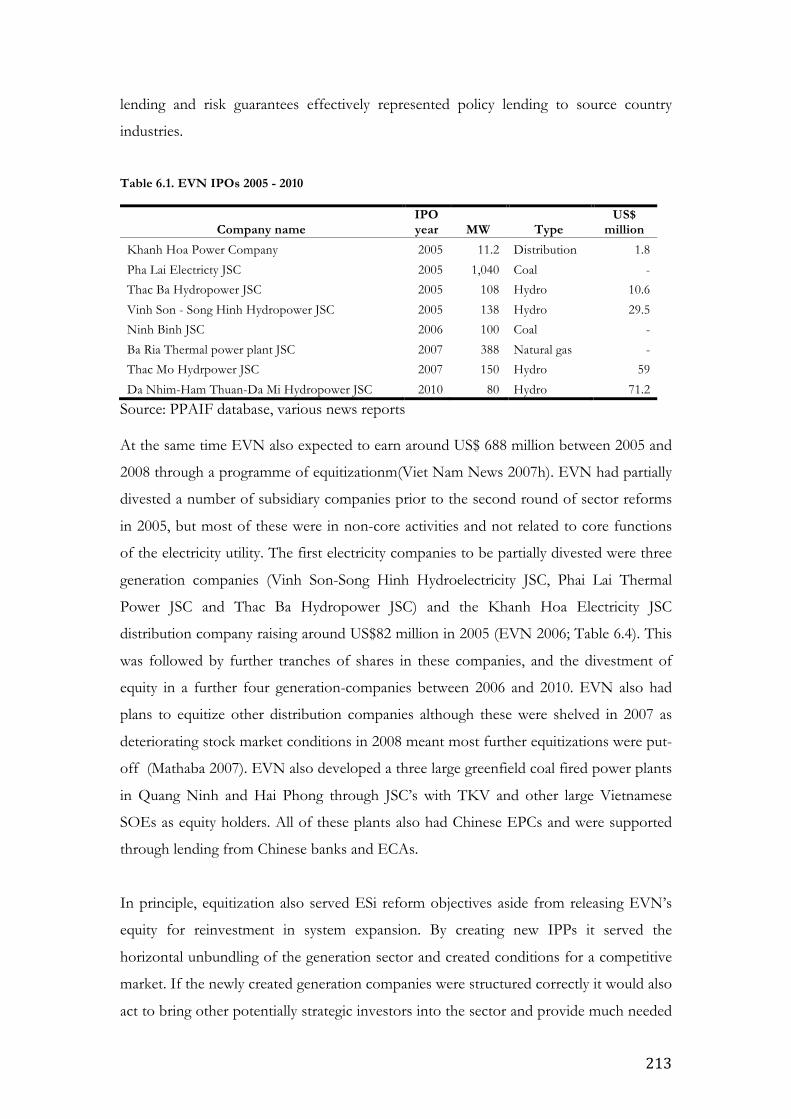
213
lending and risk guarantees effectively represented policy lending to source country
industries.
Table 6.1. EVN IPOs 2005 - 2010
Company name IPO year MW Type
US$ million
Khanh Hoa Power Company 2005 11.2 Distribution 1.8
Pha Lai Electricty JSC 2005 1,040 Coal -
Thac Ba Hydropower JSC 2005 108 Hydro 10.6
Vinh Son - Song Hinh Hydropower JSC 2005 138 Hydro 29.5
Ninh Binh JSC 2006 100 Coal -
Ba Ria Thermal power plant JSC 2007 388 Natural gas -
Thac Mo Hydrpower JSC 2007 150 Hydro 59
Da Nhim-Ham Thuan-Da Mi Hydropower JSC 2010 80 Hydro 71.2
Source: PPAIF database, various news reports At the same time EVN also expected to earn around US$ 688 million between 2005 and
2008 through a programme of equitizationm(Viet Nam News 2007h). EVN had partially
divested a number of subsidiary companies prior to the second round of sector reforms
in 2005, but most of these were in non-core activities and not related to core functions
of the electricity utility. The first electricity companies to be partially divested were three
generation companies (Vinh Son-Song Hinh Hydroelectricity JSC, Phai Lai Thermal
Power JSC and Thac Ba Hydropower JSC) and the Khanh Hoa Electricity JSC
distribution company raising around US$82 million in 2005 (EVN 2006; Table 6.4). This
was followed by further tranches of shares in these companies, and the divestment of
equity in a further four generation-companies between 2006 and 2010. EVN also had
plans to equitize other distribution companies although these were shelved in 2007 as
deteriorating stock market conditions in 2008 meant most further equitizations were put-
off (Mathaba 2007). EVN also developed a three large greenfield coal fired power plants
in Quang Ninh and Hai Phong through JSC’s with TKV and other large Vietnamese
SOEs as equity holders. All of these plants also had Chinese EPCs and were supported
through lending from Chinese banks and ECAs.
In principle, equitization also served ESi reform objectives aside from releasing EVN’s
equity for reinvestment in system expansion. By creating new IPPs it served the
horizontal unbundling of the generation sector and created conditions for a competitive
market. If the newly created generation companies were structured correctly it would also
act to bring other potentially strategic investors into the sector and provide much needed
214
additional investment capital.234 In the case of Vietnam, this meant investment by the
large SOEs and SEGs, and potentially other entities such as the State Capital Investment
Corporation (SCIC).235
In practice, equitization in electricity utility assets was only partial. As per government
requirements the state retained a 51% stake in all generation JSCs, therefore retaining
effective control the companies (World Bank 2009). In most cases this stake remained
with EVN. However, in 2008 EVN divested equity in three power JSCs to the SCIC.236
Typically EVN had agreed only relatively short term PPAs with these companies. For
example, the PPAs of Pha Lai Thermal Power JSC and Ba Ria Thermal Power JSC’s
PPAs both expired in 2010 and that of Vinh-Son Song-Hinh Hydroelectric JSC expired
in 2009 (Mekong Securities 2008; Nguyen 2009; Le et al 2012; Vietnam Investment
Review 2013). Given EVN’s dominant position in the electricity market as sole buyer
and with ownership of large generation assets there was the obvious opportunity for it to
abuse its market power and screw down off-take tariffs below the LRMC of production.
This had the disadvantage of leaving the newly formed JSCs without the financial
wherewithal to play the role of long-term ‘strategic investors’ and would leave them
unable to expand generation capacity. Such activity was further incentivised by
continuing controls on tariff levels, which remained below EVN’s LRMC of supply
(Figure 6.17)237.
The case of the Vinh-Son Song Hinh Hydroelectric JSC (VSH), one of the first to be
equitized is illuminating. VSH’s PPA ran out in 2009 and it was unable to reach
agreement with EVN over an off-take tariff. From EVN’s perspective VSH had already
paid down any debt and fully amortised its investment, and could stand a lower off-take
tariff. The generation company however required a higher price to enable it to raise
capital to fund the construction of the Thuong Kon Tum hydropower project expected
to cost around US$ 280 million. In 2012, after three years of negotiations EVN and VSH
were still unable to reach an agreement (Le et al 2012; Deloitte 2013). In contrast, Pha
Lai Thermal Power JSC reported it was able to reach agreement with EVN over a four-
year PPA, in this case 52% of the JSC shares are held by EVN and 12% by EVN
234 Source 7,17 Annex A6.4. 235 Vietnam’s nascent sovereign wealth fund. 236 These were Vinh Son – Song Hinh Hydropower JSC, Thac Ba Hydropower JSC and Hai Phong Thermal Power JSC. 237 Source 24, 27 Annex A6.4.

215
Finance, compared to VSH in which SCIC held the majority of equity since 2008
(Vietnam Business News 2011; Eng 2012).238
Aside from the increasingly diverse sources of financing for EVN’s investments over the
course of the 2000s, encouraged by government, domestic IPPs became increasingly
common (Viet Nam News 2007i). The vast majority of these IPP projects were small-
scale hydropower projects (2-30 MW). Available data suggests that between 2005 and
2012 34 of these projects reached financial closure with total installed capacity of around
590 MW. Investors were quite diverse including construction companies (both provincial
and national, such as Song Da and EVN itself) and specially formed JSCs. Equity in
these JSCs was frequently held by a number of companies, often-large corporations such
as the state owned Vietnam Rubber Group or private owned corporations such as Hong
Anh Gai Lai Group and Mai Linh Corporation.239 Small hydropower projects were
attractive to investors because they required a lower initial capital investment than larger
projects, they could utilize relatively cheap Chinese turbines and generators. From a
political perspective, the developers were likely to have close relationships with the
provincial authorities, which were in turn typically responsible for authorising smaller
projects. Off-take agreements were negotiated ad hoc with EVN until the introduction of
the standard ‘avoided cost’ tariff in 2009. While this did not significantly raise the average
off-take tariff level for these plants, it did seem to have facilitated the negotiation of
projects with a significant increase in the number reaching financial close since the
regulations were adopted (Meier 2013; World Bank 2013). Despite the large number of
these projects, given their small size, they contributed a relatively small amount of
additional capacity to the system.
Over the same period, more significant capacity investments were being made by large
SOEs, and in particular TKV, PVN and Song Da Corporation240 – all SOEs with close
links to the power sector (Table 6.6) (Viet Nam News 2007i, 2007j). Some of these were
developed as projects in which these parastatals held 100% of the equity, such as Nhon
Trac 1 developed by PV Power (a subsidiary of PVN) and Son Dong owned by TKV.
Others have been developed as JSCs, such as Cam Pha and Nong Son coal plants in
238 Source 19 Annex A6.4. 239 See table A6.1 in annex for a full list of projects. 240 Song Da corporation is a large construction company under the Ministry of Construction (MoC), a number of other hydropower developers are also under MoC including LICOGI, Construction Corporation No. 1 and IDICO.
216
which TKV held a controlling stake, and Nhon Trac 2 and Dak Drinh in which PVN
holds 63% and 93% of the equity respectively (PVN 2012).
In all three cases the immediate inclination of these firms was to invest in generation
technologies with which they held a competitive advantage. All three companies invested
in hydropower projects, but the construction company Song Da with a long experience
of hydro-projects was by far the most involved in this technology (BMI 2007, 2010).
Similarly, most power sector investments by TKV were in mine-mouth coal thermal
plants, typically using Chinese EPCs, capital goods and loans from Chinese ECAs (Thao
2004).241 PVN initially developed large CCGT complexes at Nhon Trac and Ca Mau
linked to its off-shore gas development activities. But better access to capital seems to
have enabled PVN to expand more aggressively into the sector, more recently
developing 6,000 MW of large coal fired thermal projects that will use both coal sourced
from TKV but also imports (PVN 2012).
Needless to say, these investments were endorsed by a government well aware that EVN
was unable to meet the investment needs of the sector. These large SOEs enjoyed
apparent advantages over EVN in raising capital. PVN and TKV, in particular, with
access to significant mineral resources represented less of a risk to lenders. PVN and
TKV also offered a more attractive risk profile to investors when compared to other
potential project developers. This was because in many cases they enjoyed control over
fuel supplies to their projects, which served to lessen risk perceptions. Like EVN, PVN,
TKV and Song Da Corporation also enjoyed close connections to powerful players in
government, in particular TKV and PVN which, as SEGs, were directly under the
authority of the PM. All three therefore enjoyed preferential access to financial resources,
but also good political connections, which they were also able to leverage to mitigate
investment risk.242
Despite the significant advantages these firms possessed in terms of political leverage,
they faced difficulties similar to other investors in developing power sector projects, and
above all else they faced problems negotiating PPAs or other off-take agreements with
EVN. A slew of power plants that were commissioned by PVN and TKV in the late
2000s had great difficulty concluding PPA negotiations with EVN. For example, in the 241 Source 10,14 Annex A6.4. 242 Source 21, 25, 26 Annex A6.4.
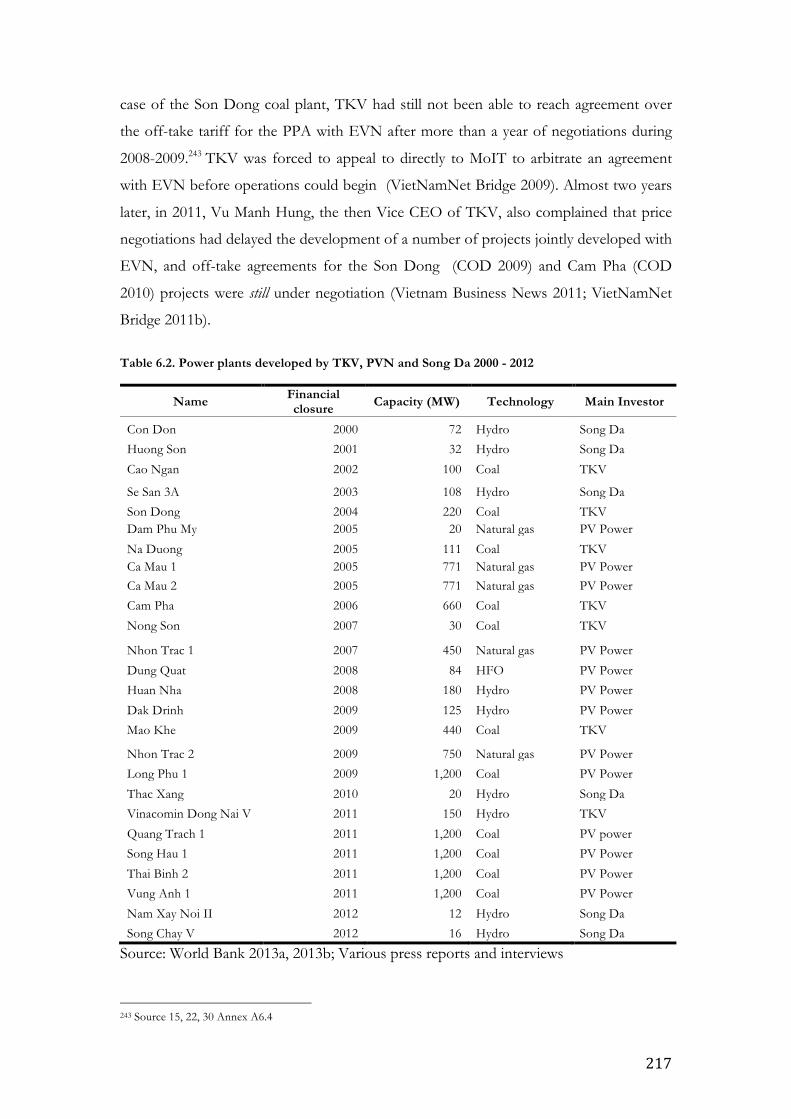
217
case of the Son Dong coal plant, TKV had still not been able to reach agreement over
the off-take tariff for the PPA with EVN after more than a year of negotiations during
2008-2009.243 TKV was forced to appeal to directly to MoIT to arbitrate an agreement
with EVN before operations could begin (VietNamNet Bridge 2009). Almost two years
later, in 2011, Vu Manh Hung, the then Vice CEO of TKV, also complained that price
negotiations had delayed the development of a number of projects jointly developed with
EVN, and off-take agreements for the Son Dong (COD 2009) and Cam Pha (COD
2010) projects were still under negotiation (Vietnam Business News 2011; VietNamNet
Bridge 2011b).
Table 6.2. Power plants developed by TKV, PVN and Song Da 2000 - 2012
Name Financial closure Capacity (MW) Technology Main Investor
Con Don 2000 72 Hydro Song Da
Huong Son 2001 32 Hydro Song Da
Cao Ngan 2002 100 Coal TKV
Se San 3A 2003 108 Hydro Song Da
Son Dong 2004 220 Coal TKV Dam Phu My 2005 20 Natural gas PV Power
Na Duong 2005 111 Coal TKV Ca Mau 1 2005 771 Natural gas PV Power Ca Mau 2 2005 771 Natural gas PV Power
Cam Pha 2006 660 Coal TKV
Nong Son 2007 30 Coal TKV
Nhon Trac 1 2007 450 Natural gas PV Power
Dung Quat 2008 84 HFO PV Power
Huan Nha 2008 180 Hydro PV Power
Dak Drinh 2009 125 Hydro PV Power
Mao Khe 2009 440 Coal TKV
Nhon Trac 2 2009 750 Natural gas PV Power
Long Phu 1 2009 1,200 Coal PV Power
Thac Xang 2010 20 Hydro Song Da
Vinacomin Dong Nai V 2011 150 Hydro TKV
Quang Trach 1 2011 1,200 Coal PV power
Song Hau 1 2011 1,200 Coal PV Power
Thai Binh 2 2011 1,200 Coal PV Power
Vung Anh 1 2011 1,200 Coal PV Power
Nam Xay Noi II 2012 12 Hydro Song Da
Song Chay V 2012 16 Hydro Song Da
Source: World Bank 2013a, 2013b; Various press reports and interviews
243 Source 15, 22, 30 Annex A6.4

218
PVN faced similar problems. Off-take prices at its large Nhon Trac and Ca Mau CCGT
plants were relatively high and it proved difficult to reach an agreement with EVN
(Vinacomin 2012). For a number of plants temporary agreements were reached in lieu of
a longer term PPAs, for example Nhon Trac 2 which came into operation in 2011 but
still had not finalised a PPA with EVN by the middle of 2013 (Ha Noi Moi 2013). Worse
still, reports from PVN suggested that EVN would rather engage in load shedding than
dispatch expensive electricity from its plants. In 2009, it complained that despite power
shortages nationally EVN had chosen not to dispatch available capacity at Nhon Trac 1
(VietNamNet Bridge 2009).244 The same report also mentioned that EVN’s official
dispatch planning for the second quarter of the year, which suggested 2.1 TWh would be
dispatched from the Nhon Trac plant were different from the agreement made between
PVN and EVN to dispatch only 0.9 TWh over the same period. Suggesting, that EVN
was reluctant to dispatch electricity from this source.
Even the very large energy parastatals were facing something of an obsolescing bargain.
Price controls on end-use tariffs meant EVN stood to lose revenue when it purchased
expensive power from these sources. In extemis, it seemed that EVN was even prepared
to see blackouts and brownouts rather than take losses on expensively purchased power.
Fines of around US$ 2,100 a time for power cuts in 2010 represented very small beer
indeed besides the losses EVN would make on unfavourable PPAs (Financial Times
2010). The knock-on implication was that IPPs deals were difficult to reach and fraught
price negotiations delayed the implementation of projects further exasperating capacity
shortfalls (VietNamNet Bridge 2009; VietNamNet Bridge 2011a). The situation also
speaks of the inability of MoIT, the PM or government more widely to co-ordinate the
operations of the SEGs in the energy sector, the continuing dominance of the ESI by
EVN, and its increasing willingness to put its balance sheet before the delivery of a
public good.245
Notwithstanding the problems faced by IPPs in investing in the Vietnamese ESI, the
ownership situation in the sector between 2000 and 2011 had changed dramatically
(Figure 6.14). EVN still accounted for around half the power generated in 2011,
including the JSCs over which it had control that moved up to around 65%. Other state
owned groups accounted for about 16% of generation, whereas FDI invested projects 244 Source 15 Annex A6.4 245 Source 11, 18, 22, 26, 30 Annex A6.4
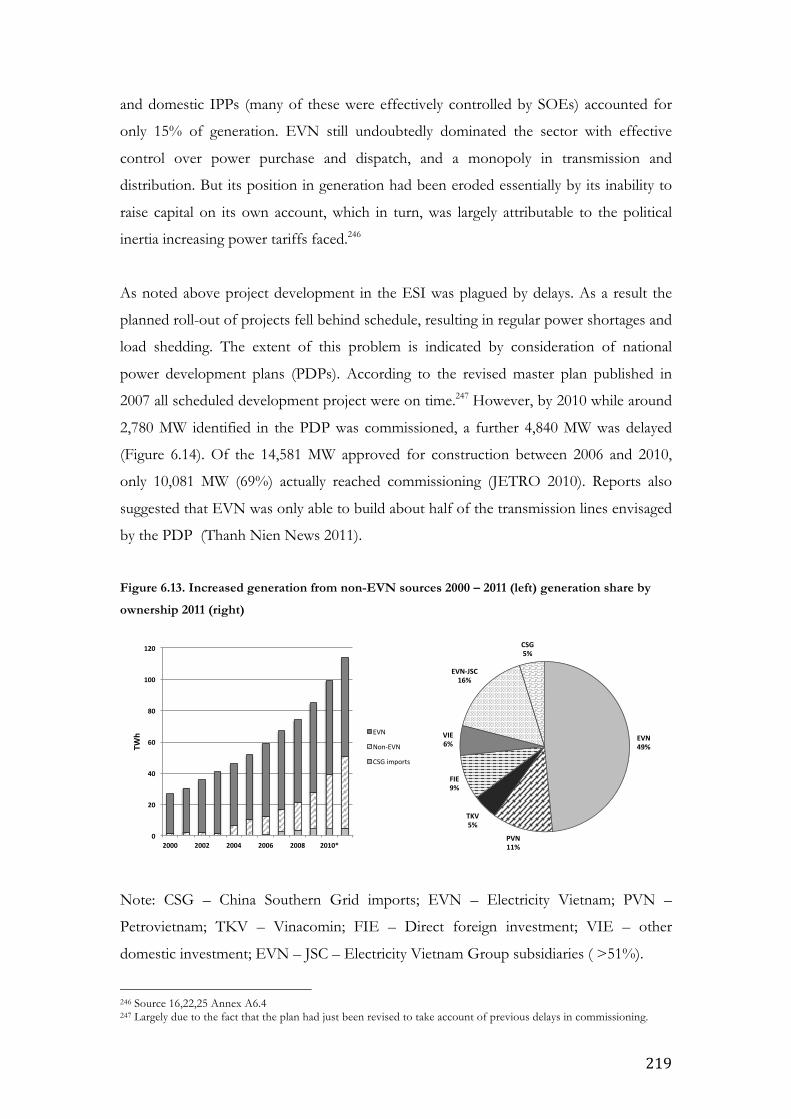
219
and domestic IPPs (many of these were effectively controlled by SOEs) accounted for
only 15% of generation. EVN still undoubtedly dominated the sector with effective
control over power purchase and dispatch, and a monopoly in transmission and
distribution. But its position in generation had been eroded essentially by its inability to
raise capital on its own account, which in turn, was largely attributable to the political
inertia increasing power tariffs faced.246
As noted above project development in the ESI was plagued by delays. As a result the
planned roll-out of projects fell behind schedule, resulting in regular power shortages and
load shedding. The extent of this problem is indicated by consideration of national
power development plans (PDPs). According to the revised master plan published in
2007 all scheduled development project were on time.247 However, by 2010 while around
2,780 MW identified in the PDP was commissioned, a further 4,840 MW was delayed
(Figure 6.14). Of the 14,581 MW approved for construction between 2006 and 2010,
only 10,081 MW (69%) actually reached commissioning (JETRO 2010). Reports also
suggested that EVN was only able to build about half of the transmission lines envisaged
by the PDP (Thanh Nien News 2011).
Figure 6.13. Increased generation from non-EVN sources 2000 – 2011 (left) generation share by
ownership 2011 (right)
Note: CSG – China Southern Grid imports; EVN – Electricity Vietnam; PVN –
Petrovietnam; TKV – Vinacomin; FIE – Direct foreign investment; VIE – other
domestic investment; EVN – JSC – Electricity Vietnam Group subsidiaries ( >51%).
246 Source 16,22,25 Annex A6.4 247 Largely due to the fact that the plan had just been revised to take account of previous delays in commissioning.
EVN$49%$
PVN$11%$
TKV$5%$
FIE$9%$
VIE$6%$
EVN0JSC$16%$
CSG$5%$
0$
20$
40$
60$
80$
100$
120$
2000$ 2002$ 2004$ 2006$ 2008$ 2010*$
TWh$ EVN$
Non'EVN$
CSG$imports$

220
Source: EVN 2011 (* figures for 2010 interpolated)
Figure 6.14. PDP VI - capacity additions commissioned and delayed 2006 - 2010
Source: Table A6.3, Annex A6.3
A number of reasons were mooted for delays in project development. These included the
competency of EPC contractors, with a number of opinion pieces and reports blaming
the slow progress at some plants on the use of ‘cheap Chinese contractors’ (Tien Phong
2010; Tuoi Tre 2012).248 Land clearance and compensation issues were also cited, as were
issues with the provision of supporting infrastructure such as railway lines, gas pipelines
and transmission lines, and the application of new technologies (Asia Times 2012).
Nevertheless, these factors were relatively minor when compared to the chronic
structural issues faced by the ESI in general, and in which EVN was closely implicated.
Foremost amongst these had been the difficulty IPPs had with negotiating PPAs with
EVN. Trouble with PPAs, and the continuing perception of significant risks in the sector
also meant that for both IPPs and EVN there were difficulties in achieving the financial
closure of projects.249
EVN’s problems with raising finance for projects came to a head in August 2008 it was
forced to withdraw from the development of 13 coal thermal plants representing about
13,800 MW of new capacity that it had been expected to develop (Thanh Nien News 248 These reports should be taken with a large pinch of salt. There is considerable animosity towards China in the press reflecting continuing territorial disputes but also the role played by China in Vietnam’s recent history. This is reflected in press reports. It is difficult to believe that such reports are even handed. Barely a week goes by when reports of faulty or sub-standard Chinese goods is not reported in the press, indeed Vietnam compared unfavorably to China in the time needed to construct coal plants, with plants in the former taking on average 5 years and in the latter around 18 months (Asia Times 2012). 249 Source 22, 26 Annex A6.4
0" 1,000" 2,000" 3,000" 4,000" 5,000" 6,000"
2006"
2007"
2008"
2009"
2010"
MW"
Commissioned)
Delayed)

221
2011). EVN withdrew from these projects as it was unable to raise the financing
required, which in turn it blamed on the low average tariff levels it faced. In the end,
eleven projects were taken up by other developers including PVN, which continued to
aggressively expand into the generation sector, other domestic SOEs (TKV and Lilama),
and, more significantly, a number of other consortia including both regional foreign
investors and Vietnamese SOEs (Vietnam Investment Review 2008).
This represented something of a watershed and forced the government to reconsider its
reluctance to offer guarantees to foreign investment projects in the sector. The structural
pressures on the ESI and the desire of foreign financiers and ESI TNCs to invest in
Vietnam’s rapidly growing power sector had remained pretty much constant. The
persistent stream of commentary from foreign business interests and the expansion of
the number of international law firms based in Hanoi and Ho Chi Minh City specialising
in project development indicated a continuing interest in ESI investment - if conditions
were right. The massive prospective expansion of the ESI and the need for foreign
capital continued to be perceived as presenting an attractive opportunity to many
international investors (Power Engineering International 2013). Foreign firms continued
to be involved in the sector through engineering and procurement contracts, often
supported by ECAs, but as noted earlier, between 2005 and 2010 there had been
practically no significant FDI financed projects.
After the large Phu My plants, as we have seen, there was very limited appetite in
government or EVN for FDI in the ESI, or at least not on the terms that were on offer.
The failure of EVN to generate the capital needed for the expansion of the ESI was
critical, and it became immediately apparent that other sources of funding would need to
be found. The surge of FDI projects that have progressed in Vietnam in more recent
years suggests that conditions have become much more favourable since 2008 (Table
6.7).
While there had been gradual improvements in the legislative and institutional
environment surrounding BOT projects, what seems to be crucial in attracting investors
to the sector was a renewed willingness of the government to offer guarantees to projects
222
and increasingly serious commitments to raise the power price.250 This was all the more
necessary as a number of these projects (Nghi Son 2, Mong Duong and Hai Duong) will
rely partly on imported coal, requiring rock-solid foreign exchange and counterparty
guarantees (Gibson et al 2013).251 In 2010 the PM also instructed EVN to offer a ‘fair
return’ on investment in new power plants (Asia Times 2012). At the same time, in the
aftermath of the Global Financial Crisis, the very low interest rates and lax monetary
policy in the US meant that a significant amount of foreign capital was flowing into
emerging economies.
An increasingly common project development strategy that emerged alongside the
renewed interest of foreign investors in the ESI, was the development of project
partnerships between foreign firms seeking to mitigate political and counterparty risks
and Vietnamese firms (Asian Power 2009). Vietnamese firms, and especially the large
SOEs, have significant political leverage and are familiar with navigating the opaque
patronage networks that characterise Vietnam’s institutional environment.252 Thus these
partnerships could act to substantially reduce risk perceptions. Examples include Vinh
Tan 1 developed by CSG and China Power in which TKV has a 5% equity stake, Vinh
Tan 3 in which EVN has a minority stake, and Vung Anh 2 which is being developed by
companies from the UK, Hong Kong and the Vietnamese REE corporation (Table 6.7).
Although the recently completed Mong Duong 2 is completely foreign owned, during
development TKV held a minority stake but withdrew partway through negotiations, the
plant is now owned by the American AES, South Korea’s Posco Power and China
Investment Corporation (CIC) (Press Release 2011).
Another notable characteristic of the new wave of FDI investment was the extent to
which regional investors were involved, including companies from China, Malaysia,
Korea, Hong Kong, Singapore and, of course, Japan. In particular, the extent of Chinese
investment to the ESI has increased substantially. With direct investment by powerful
Chinese parastatals such as China Power and CSG, as well as the Chinese sovereign
wealth fund (CIC). In addition, Chinese lending to the sector has also increased, with
250 The concession framework relating to BOT, BOO, BTO and other similarly structured projects and the more recent PPP framework have been in more or less constant flux since the early 2000s. 251 Source 26, 27 Annex A6.4 252 As Laykin puts it, “The typical approach for foreign investors is to mitigate risk of bad faith while navigating Vietnam's development mine-fields by partnering with an SOE.” (Asian Power 2009: 10)

223
Chinese EPCs and ECAs playing an increasingly important role (Vietnam Investment
Review 2013; Power Insider 2013).253
Table 6.7. Foreign generation project pipeline in June 2013
Project Pipeline stage
Capacity (MW)
Type Developer (country) Investment (US$ million)
Mong Duong II COD (2013) 1,200 Coal AES/Posco Power/CIC
(USA/China/Korea) 1,600
Soc Trang Wind Farm FC (2012) 30 Wind EAB New Energy GmbH
(Germany) 45
Phuoc Nam Wind & Solar Plant FC (2012) 125 Wind Enfinity (Belgium) 248
Dung Quat BOT 1,200 Coal Sembcorp (Singapore) 2,000
Duyen Hai 2 BOT 1,200 Coal Janakuasa Sdn Bhd. (Malaysia) 2,000
Hai Duong BOT 1,200 Coal JAKS Resources /Wuhan
Kaidi Electric Power (Malaysia/PRC)
2,250
Quang Tri BOT 1,200 Coal EGATI (Thailand) 2,260
Vung Anh 2 BOT 1,200 Coal Mitsubishi/One
Energy/REE (Japan/Hong Kong/Vietnam)
1,600
Van Phong 1 BOT 1,320 Coal Sumitomo (Japan) 2,000
Song Hau 2 BOT 2,000 Coal Toyo ink (Malaysia) 3.5
Vinh Tan 3 BOT 2,000 Coal
VTEC, CLP Holdings Mitsubishi Corp, EVN,
Pacific Corporation (Vietnam/Hong
Kong/Japan)
N/K
Vinh Tan 1 BOT 1,200 Coal CSG/China Power/ TKV (China/Vietnam) 1,650
Nghi Son 2 BOT 1,200 Coal Marubeni/KEPCO (Japan/Korea) 2,300
Nam Dinh MOU 2,400 Coal Teakwang Group (Korea) 4,500
Source: Various press sources cited in text, interviews Note: FC – Financial closure; COD – commercial operations date; BOT – BOT agreement signed; MOU – memorandum of understanding signed.
What is striking about the evolving patterns of investment in Vietnam’s ESI is the
apparent weakness of government in developing a coordinated strategy and reigning in
the powerful vested interest presented by EVN. The indications are that other investors,
be they small hydropower producers, other powerful SOEs or even minority
shareholders in EVN subsidiaries, face an obsolescing bargain. The capital is sunk and
EVN has seemingly systematically used its position as the single buyer to drive down
prices (or indeed in many cases has failed to pay at all (see following section)). Even
253 Despite the renaissance in FDI projects problems with delays in project negotiations persist, Mong Duong 2 - like the Phu My plants before it - reportedly took 8 years to finalise.
224
more egregiously, there is a strong suspicion that EVN has preferred power cuts
purchasing expensive power from new capacity. The incentives for doing this are very
clear. Power prices are too low. EVN operates at a loss. Only in extremis when the
boarder public good, and hence the government’s and the CP’s legitimacy has been
substantially threatened has the government been forced to take more drastic action,
such seems to have been the case with EVN’s failure to raise financing in 2008. As we
shall see in the following section, the reluctant and reactive role the government has
taken also seems to be the case with the serious restructuring of EVN and the sector.
6.3.8 EVN threatens the whole show
In the last years of the decade, the economic boom that Vietnam enjoyed started to
come unstuck. The economic over-heating caused by an influx foreign capital forced the
government to raise interest rates in 2008 to address high inflation. By 2009 the Global
Financial Crisis had forced significant government intervention again, this time to spur
investment in the face of falling demand for manufactures and commodity exports
(Pincus 2009). This second round of stimulus again lead to sharply rising inflation in
2010 and 2011, which necessitated a further round of tightening. As noted already, SOEs
had been using privileged access to credit at domestic banks to invest in non-core, often-
speculative business activities. When higher interest rate came, many of these speculative
ventures in the booming sectors came unstuck, this in turn left the banks with mounting
bad debts and left economy at risk of a fully-fledged banking crisis (New York Times
2012; East Asia Forum 2013; Fforde 2013).
The evolving macro-economic crisis was closely linked to what was an emerging political
crisis. Indeed, as Vuving (2010) and others pointed out the ‘rent-seekers’ in government
were increasingly in the ascendant. Press reports in 2011 point to the blatant cronyism of
the PM in the political appointment of his son to the position of Vice Minister, and the
support of the his daughter’s investment firm by state owned banks as it moved into the
banking sector (Financial Times 2011). It was commonly believed that PM had
supported the emergence of an oligarchic elite with extensive interests in real estate and
finance, but also closely linked to the SEGs (Fforde 2011). In the face of widespread
economic mismanagement, a vote to officially censure the PM in late 2012 was almost
passed.
225
The disequilibrium that had developed between the dynamics of the political settlement
and the sustained functioning of the economic system seemed to be reaching a head. The
SEGs, including EVN were at the heart of the problem. The most high profile case
involved state owned ship builder Vinashin, which ran up over US$ 4 billion in debt.
Vinashin eventually defaulted on repayments to a US$ 600 million loan to Credit Suisse,
resulting in Vietnam’s sovereign debt being downgraded by rating agencies. Later
investigations found mismanagement and corruption that lead to criminal proceedings
against a number of former executives. Reports of poor investment choices,
mismanagement, financial losses and large-scale corruption at large state owned banks
and other enterprises were increasingly common. A number of SEGs including PVN and
Song Da were involved in high-level corruption scandals (Financial Times 2012; Viet
Nam News 2012a; SaigonTimes 2012). With continuing macro economic problems, and
daily news on mismanagement and corruption at state owned businesses, it comes as
little surprise that a World Bank sponsored survey in 2011 most people stated a
preference for private as opposed to state ownership (World Bank 2011b). These were
the more obvious symptoms of a wider political malaise and what Fforde (2013)
described as the collapse of coherent government:
“From around 2007…the VCP has increasingly been unable to meet its systemic political responsibilities.
With the rise of powerful national commercial interests, macroeconomic stability was lost in 2007 when
large state-owned enterprises (SOEs) ignored State Bank orders on liquidity. In general, local provincial
and sub-provincial establishments have suffered: through 2011 and 2012, small and medium firms (SMEs)
have been starved of bank credit, many have gone under, and perhaps a million jobs have been lost. It has
been increasingly obvious that the VCP has been unable to deal with major political questions: corruption, SOE and bank
restructuring, and reforms to public health and education. Nagging fears of Chinese penetration persist. The collapse of
authority is clear from a wide range of sources.” [emphasis added] (Fforde 2013: 102-103)
EVN was probably more unpopular than the other large SOEs.254 Its performance
failures were apparent for everyone to see in the shape of the reliability of the electricity
supply and the size of their electricity bill. The failure to mobilise sufficient investment
continued to lead to insufficient reserve capacity and power shortages and under-
investment in the T&D infrastructure led to continuing system reliability problems
(Dung & Tuan 2011; VietNamNet Bridge 2012a). On the other hand, price increases
from an average tariff of around 870 VND/kWh in 2008 to over 1,500 VND/kWh in
254 Source 9 Annex A6.4

226
2013 were highly unpopular, both amongst the public and in energy intensive industries.
Many commentators questioned tariff levels and argued that they did not reflect costs,
referring to the average costs of supply EVN typically faced. In general there was a high
level of suspicion about EVN’s pricing rationale and monopoly, even while EVN and
other ESI players pushed for higher prices (VietNamNet Bridge 2009; Viet Nam News
2012b; Thanh Nien 2012; Indochina Energy 2013).
To add fuel to fire, EVN’s investment in real estate, financial services, and telecoms had
been disastrous. EVN Telecom had failed to make much headway and by 2010 was
making a loss of around US$ 57 million a year (Viet Nam News 2012c). EVN’s
investments in real estate and securities had proved no more profitable. Adding to the
public opprobrium, EVN was also accused of - amongst other things - overpaying staff (
even when it was loss making), failing to pay debts to fuel suppliers and other generation
companies, using its market power to drive down electricity purchase prices and last but
not least, running up huge debts (Dan Tri 2011; Tuoi Tre 2011; Viet Nam News 2012c).
Its prestigious new twin towers built in the heart of Hanoi caught fire before they were
completed and stood derelict, a potent symbol of what many saw as at best the hubris of
the state giant and at worst the systematic mismanagement and corruption that lay at the
heart of EVN (Bloomberg News 2012). While the media reports should be taken with a
pinch of salt, it remains clear that EVN was increasingly unpopular amongst the general
public.
EVN was also becoming the focus for more vocal complaints from other industry
players stemming from its monopoly in the sector. EVN had run up large debts to other
parastatals. In 2011 it owed the other two large utilities PVN and TKV around US$ 680
and US$ 98 million respectively. Many of these debts were cleared in 2012 following a
bumper year for hydropower, only for them to emerge again in July 2013 when PVN
reported that EVN owed it US$ 440 million (Saigon Times 2013). These circular SOE
debts had hitherto been consistently paid off by EVN, but it says something that these
large influential parastatals have had to turn to the media to attempt to influence EVN.
Other generators were not so lucky, with the first foreign invested IPP at Hiep Phuoc
forced out of business in 2012 with a US$ 40 million invoice to EVN still outstanding
(VietNamNet Bridge 2012b). In another example, small hydropower producers faced
with rising interest costs complained that they had been unable to reach an agreement on
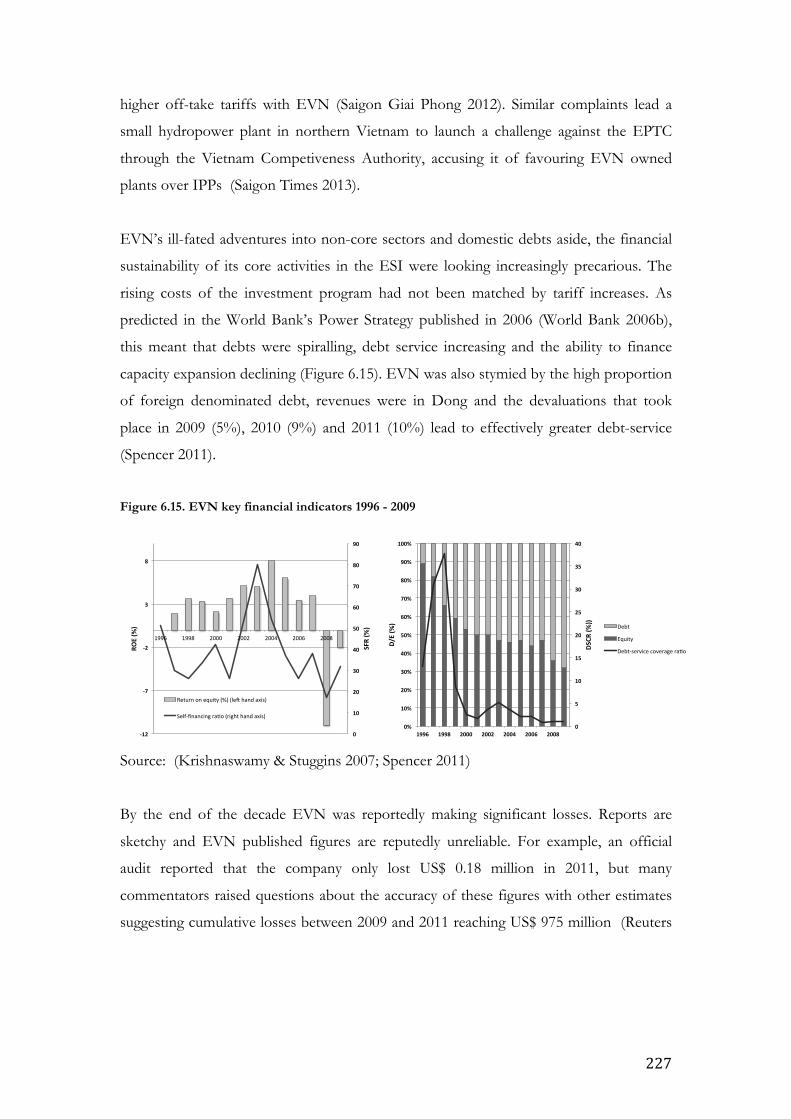
227
higher off-take tariffs with EVN (Saigon Giai Phong 2012). Similar complaints lead a
small hydropower plant in northern Vietnam to launch a challenge against the EPTC
through the Vietnam Competiveness Authority, accusing it of favouring EVN owned
plants over IPPs (Saigon Times 2013).
EVN’s ill-fated adventures into non-core sectors and domestic debts aside, the financial
sustainability of its core activities in the ESI were looking increasingly precarious. The
rising costs of the investment program had not been matched by tariff increases. As
predicted in the World Bank’s Power Strategy published in 2006 (World Bank 2006b),
this meant that debts were spiralling, debt service increasing and the ability to finance
capacity expansion declining (Figure 6.15). EVN was also stymied by the high proportion
of foreign denominated debt, revenues were in Dong and the devaluations that took
place in 2009 (5%), 2010 (9%) and 2011 (10%) lead to effectively greater debt-service
(Spencer 2011).
Figure 6.15. EVN key financial indicators 1996 - 2009
Source: (Krishnaswamy & Stuggins 2007; Spencer 2011)
By the end of the decade EVN was reportedly making significant losses. Reports are
sketchy and EVN published figures are reputedly unreliable. For example, an official
audit reported that the company only lost US$ 0.18 million in 2011, but many
commentators raised questions about the accuracy of these figures with other estimates
suggesting cumulative losses between 2009 and 2011 reaching US$ 975 million (Reuters
0"
10"
20"
30"
40"
50"
60"
70"
80"
90"
,12"
,7"
,2"
3"
8"
1996$ 1998$ 2000$ 2002$ 2004$ 2006$ 2008$
SFR"(%
)"
ROE"(%
)"
Return$on$equity$(%)$(le7$hand$axis)$
Self?financing$raCo$(right$hand$axis)$
0"
5"
10"
15"
20"
25"
30"
35"
40"
0%"
10%"
20%"
30%"
40%"
50%"
60%"
70%"
80%"
90%"
100%"
1996" 1998" 2000" 2002" 2004" 2006" 2008"
DSCR
"(%))"
D/E"(%
)" Debt$
Equity$
Debt?service$coverage$raCo$
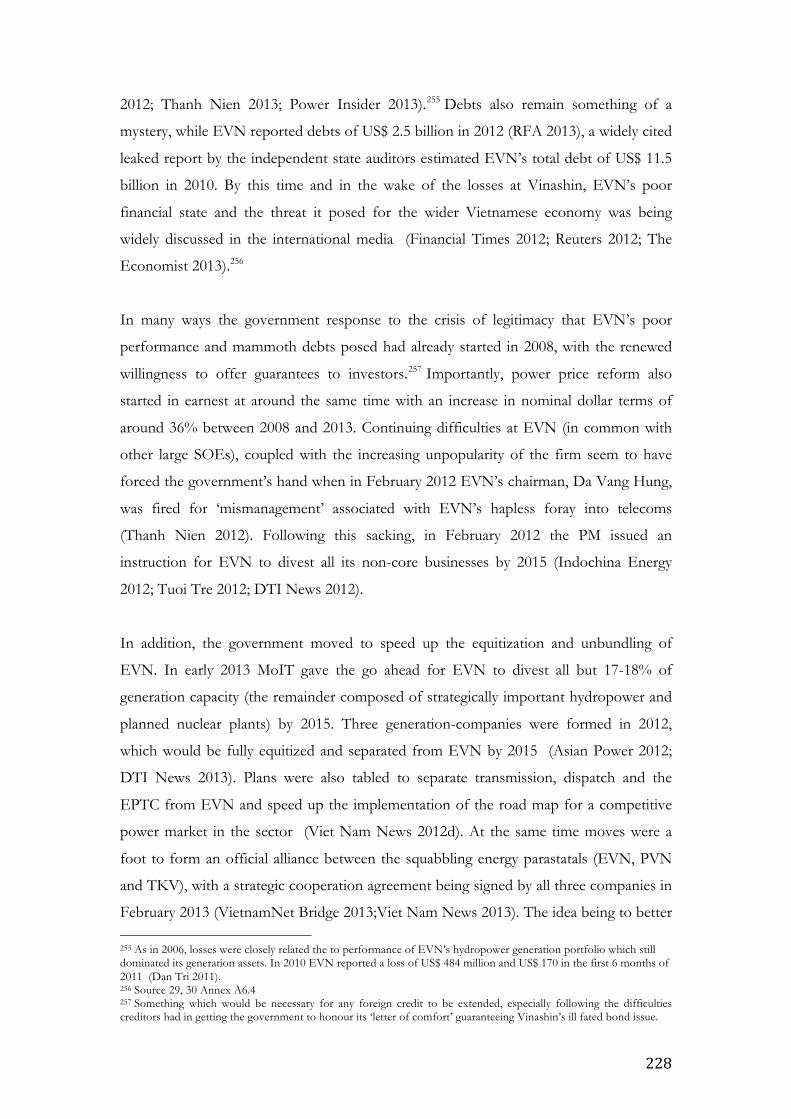
228
2012; Thanh Nien 2013; Power Insider 2013).255 Debts also remain something of a
mystery, while EVN reported debts of US$ 2.5 billion in 2012 (RFA 2013), a widely cited
leaked report by the independent state auditors estimated EVN’s total debt of US$ 11.5
billion in 2010. By this time and in the wake of the losses at Vinashin, EVN’s poor
financial state and the threat it posed for the wider Vietnamese economy was being
widely discussed in the international media (Financial Times 2012; Reuters 2012; The
Economist 2013).256
In many ways the government response to the crisis of legitimacy that EVN’s poor
performance and mammoth debts posed had already started in 2008, with the renewed
willingness to offer guarantees to investors.257 Importantly, power price reform also
started in earnest at around the same time with an increase in nominal dollar terms of
around 36% between 2008 and 2013. Continuing difficulties at EVN (in common with
other large SOEs), coupled with the increasing unpopularity of the firm seem to have
forced the government’s hand when in February 2012 EVN’s chairman, Da Vang Hung,
was fired for ‘mismanagement’ associated with EVN’s hapless foray into telecoms
(Thanh Nien 2012). Following this sacking, in February 2012 the PM issued an
instruction for EVN to divest all its non-core businesses by 2015 (Indochina Energy
2012; Tuoi Tre 2012; DTI News 2012).
In addition, the government moved to speed up the equitization and unbundling of
EVN. In early 2013 MoIT gave the go ahead for EVN to divest all but 17-18% of
generation capacity (the remainder composed of strategically important hydropower and
planned nuclear plants) by 2015. Three generation-companies were formed in 2012,
which would be fully equitized and separated from EVN by 2015 (Asian Power 2012;
DTI News 2013). Plans were also tabled to separate transmission, dispatch and the
EPTC from EVN and speed up the implementation of the road map for a competitive
power market in the sector (Viet Nam News 2012d). At the same time moves were a
foot to form an official alliance between the squabbling energy parastatals (EVN, PVN
and TKV), with a strategic cooperation agreement being signed by all three companies in
February 2013 (VietnamNet Bridge 2013;Viet Nam News 2013). The idea being to better 255 As in 2006, losses were closely related the to performance of EVN’s hydropower generation portfolio which still dominated its generation assets. In 2010 EVN reported a loss of US$ 484 million and US$ 170 in the first 6 months of 2011 (Dan Tri 2011). 256 Source 29, 30 Annex A6.4 257 Something which would be necessary for any foreign credit to be extended, especially following the difficulties creditors had in getting the government to honour its ‘letter of comfort’ guaranteeing Vinashin’s ill fated bond issue.
229
coordinate the development of energy resources in order to ensure that electricity
generation and distribution needs could be met.
As always it is difficult to interpret Vietnam’s de jure policy proclamations. With
commitment to divestment and unbundling, but at the same time the creation of a
potentially even more potent energy cartel amongst the energy parastatals. The
development of a cooperation agreement has not resolved on-going disputes between
the three parastatals surrounding EVN’s unpaid debts, fuel price and EVN’s reluctance
to agree PPAs with the other two. It is difficult to avoid the conclusion that the political
economy remains unable to meet the growing needs of the ESI.
6.4 The tariff rises
IFIs had encouraged cost-reflective price levels right from their earliest engagement with
Vietnam in the 1990s, and by the mid-1990s the achievement of cost-reflective tariff
targets were a condition of IFI loans extended to the EVN (World Bank 1993, 1995,
1997). However, tariff levels repeatedly fell short of these targets and the LRMC of
supply (Figure 6.17). This lead to less than satisfactory project evaluations by both the
World Bank and ADB (World Bank 2002; ADB 2008a, 2008b). But it did not seem to
have lead to any reluctance to engage with the sector on the part of the IFIs. Tariff
reform remains a target for the IFIs, but more recent project documents are more
circumspect, shying away from hard targets, talking more generally about tariff reform
and relying on altogether less direct metrics (World Bank 2009, 2012). Again this is
indicative of the relative impotence of the IFIs in Vietnam in their attempts to influence
policy where that stands in opposition to important vested interests and broader
considerations of political legitimacy.
Aside from the policy pressures exherted by IFIs, more recent years have seen increased
autonomy at EVN and the entry of important IPPs to the generation sector (including
powerful SOEs and a vocal international investment community). This has ratcheted up
the pressure to allow tariffs to rise and enable investment in the ESI. PVN and TKV as
up-stream energy producers, while less vocal than EVN in their demands have also been
keen to see a higher power price. The current situation where coal is sold to EVN at
230
controlled prices which do not reflect the steadily increasing costs of production258 - let
alone international prices - does not serve the industry well, hobbling TKV’s ambitions
to invest more in the development of Vietnam’s extensive coal resources (Baruya 2010;
Tran & Jones 2011). Similarly, in order to sufficiently incentivise the risky business of
off-shore gas exploration and field development PVN requires a stable market for gas at
a price that can serve to incentivise up-stream resource development activities (World
Bank 2010a).
Figure 6.17. Average electricity tariffs, LRMC and tariff targets 1990 - 2013
Source: World Bank 1993, 1997, 2002, 2003, 2012a; England & Kammen 1993; ADB
2003; Nguyen 2008; Nguyen 2012; Indochina Energy 2013
Nevertheless, tariff hikes have in the past been successfully obstructed by a number of
important groups, forcing proposed tariff rises to be reduced or shelved altogether on a
regular basis (Wyatt 2002; Lao Dong 2005;Vov 2010; Viet Nam News 2011a, 2011b).
Tariff levels are controlled by MoF, whose remit includes maintaining macro-economic
stability. Destabilising inflation plagued the Vietnamese economy in the late 1980s, early
1990s, and more recently in 2008 and 2010-2011. This seriously threatened the CPs grip
on power and has remained a perennial cause for concern in government.259 When
setting price levels for electricity, MoF’s overriding concerns seem to have been macro-
economic, to control price inflation, rather than to enable EVN to operate on a
sustainable financial basis. Indeed control over EVN (and other large SOEs) and price 258 This reflects the need to develop coal resources using shaft mines which are much more expensive than open-cast mining techniques. 259 Source 9,18, 22 Annex A6.4
0.0#
1.0#
2.0#
3.0#
4.0#
5.0#
6.0#
7.0#
8.0#
9.0#
10.0#
0#
200#
400#
600#
800#
1,000#
1,200#
1,400#
1,600#
1990# 1995# 2000# 2005# 2010#
USc#
VND#
VND/kWh(
USc/kWh(
LRMC((USc/kWh)(
Target(tariff((USc/kWh)(
Target'agreed'with'IFIs'1995''
Target'agreed'with'IFIs'1999''
SBV'Target'agreed'with'IFIs'2002'' MoIT'target'
tariff'2012'
231
level remains a fundamental means by which the state seeks to exercise macro-economic
control.
Energy intensive industries, including the steel and cement sectors were also highly
sensitive to increases in energy prices, and reflect important interest groups. Steel
producers in particular have opposed electricity price rises while increasing their
consumption of electricity over time (Tran & Jones 2011). However, above all the
residential sector constituted the single largest barrier to power price increases. The
reasons for public distaste for power price increases were not simply a matter of not
wanting to pay more, although this too was an important factor. The perception was that
EVN was exploiting its monopoly, was deeply corrupt, provided a poor service and had
been mismanaged.260 As such tariff increases have been deeply unpopular and met with
intense suspicion by the general public (Indochina Energy 2013; Thanh Nien 2013;
Power Insider 2013)
The moves to raise the average tariff decisively in real terms from around 2008 onwards
despite high inflation and despite objections from the public and energy intensive
industries, in one sense reflects the belated realisation of material realities, and that the
financial position of EVN was not sustainable. It also reflects the effective contraction of
the ‘fiscal space’ control over ample natural resource rents had allowed. It becomes clear
that the redistribution of natural resource rents had been an important part of the
political settlement. The undermining of this threatened the whole settlement. Making
noises about disciplining the SEGs is a price that needs to be paid for tariff increases and
reflects an attempt by the elites to rebalance the political settlement. On the other hand,
the glacial pace of the reaction speaks of the inertia of a ruling elite that is fractured, with
power fragmented amongst various factional interests.261
6.5 Conclusion
In this chapter we have sought to elaborate the broad political economy dynamics of the
ESI in Vietnam though an analysis of available empirical evidence. In many ways the
dynamics of the ESI in Vietnam are typical and closely reflect the position that emerged
from Chapter 4. Firstly, at the most general level we have stressed, that in the post- 260 Source 9, 13, 17, 21, 27 Annex A6.4 261 In this context recent reports from the IEA’s Southeast Asia Energy outlook that there are concrete plans to reduce subsidy levels in Vietnam and the government “Plans to introduce a roadmap for the phase-out of fossil-fuel subsidies,” that is the government plans to plan energy subsidy reduction is unintentionally humorous (IEA 2013).
232
colonial context the ideology of nation building, and the need for economic
modernisation and development leant authority and legitimacy to the emerging nation
states, and an important impetus to the development of the ESI in East Asian countries
(Williams & Dubash 2004 see also section 4.2.2). This is a reflexive relationship, the
other side to maintaining the authority and legitimacy of those in power was the actual
provision of developmental public goods. In terms of the ESI this implied affordable
access to electrical power for the general population, and indirectly, the promotion of
industrial development through the provision of relatively cheap electrical power to
industrial production. This is understood in the literature as a (largely tacit) bargain, a
social contract or compact (Jaccard 1995; Williams & Dubash 2004; Victor & Heller
2007).262 In short, the promise of modernity and development empowered the political
elites, but they had to deliver. Vietnam has been a typical case of this kind dynamic until
relatively recently when the material needs of the ESI came into conflict with the social
contract.
Secondly, the characteristic political economy dynamics that emerge from the sector are
dominated by the opaque costs structures of the ESI and pressures unique to rapidly
expanding ESI’s. EVN has been squeezed between public expectations of low power
prices, which are often anchored by references to SRMCs or average costs, and the
LRMC of supply. In Vietnam’s context the gap between the two is especially large as it
benefited from cheap domesticly available hydropower and coal resources. At the same
time EVN has suffered from the perception of poor technical and economic
performance in its core utility businesses. The primary cause of this has been inadequate
capacity expansion in terms of generation and T&D assets, and the historical legacy of an
over reliance on hydropower, leading to frequent power cuts and system instability. This
has placed EVN under greater political pressure. This is typical of the vicious cycle of
public suspicion of utilities, the political difficulties in raising prices, the resultant failure
to invest and declining performance identified by Hausman et al (2008) and Victor &
Heller (2007). The major difference in this case is that the utility is owned by the state
and not the private sector.
Thirdly, we can also see the development of what Victor & Heller (2007) term a dual-
market, with state owned and private sector firms. FDI has been concentrated in new 262 Chapter 4, a similar and analogous ‘social contract’ is also posited in the descriptions of developmental states, see Chapter 3.

233
technologies. By 2015, if the restructuring plans go ahead there will be a state owned
rump of the sector under EVN, along with three new ESI parastatals in the form of the
new generation companies, and large generation assets held by TKV and PVN.
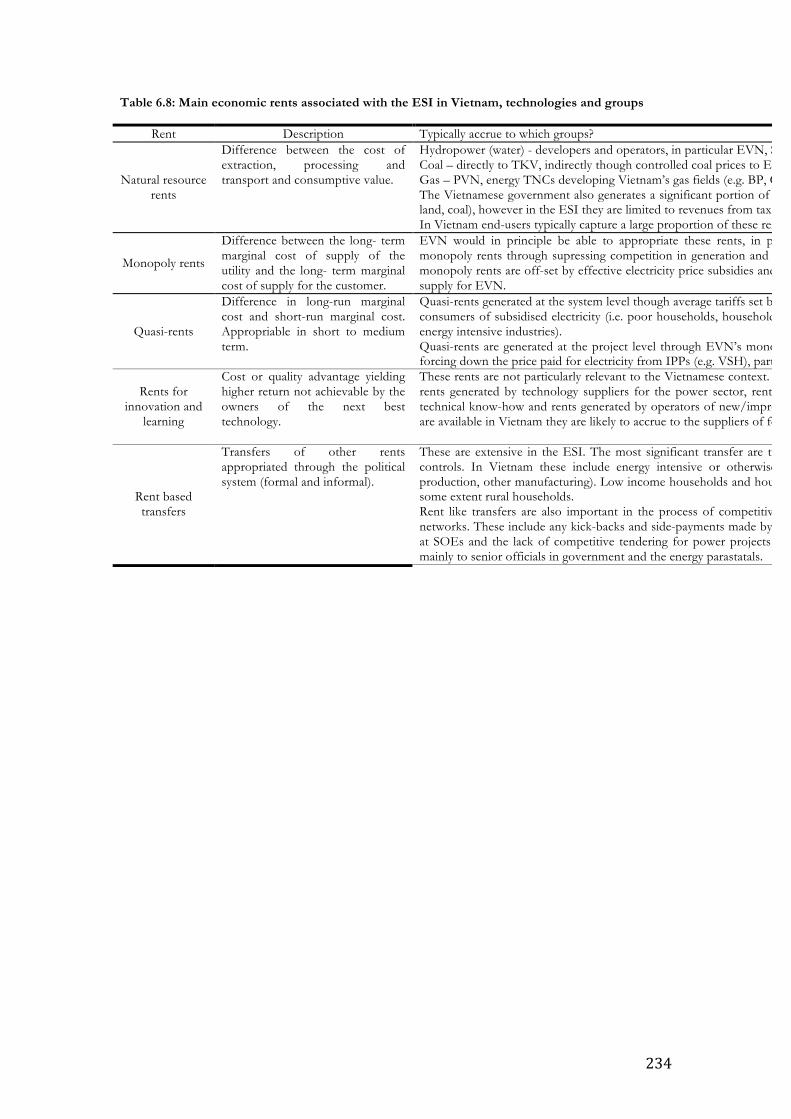
234
Table 6.8: Main economic rents associated with the ESI in Vietnam, technologies and groups
Rent Description Typically accrue to which groups?
Natural resource rents
Difference between the cost of extraction, processing and transport and consumptive value.
Hydropower (water) - developers and operators, in particular EVN, Song Da. Coal – directly to TKV, indirectly though controlled coal prices to EVN. Gas – PVN, energy TNCs developing Vietnam’s gas fields (e.g. BP, Chevron etc.) The Vietnamese government also generates a significant portion of its revenues though control over these rents (oil, land, coal), however in the ESI they are limited to revenues from taxation on energy parastatals and resource use fees. In Vietnam end-users typically capture a large proportion of these rents though controlled price levels.
Monopoly rents
Difference between the long- term marginal cost of supply of the utility and the long- term marginal cost of supply for the customer.
EVN would in principle be able to appropriate these rents, in practice while EVN can possibly generate some monopoly rents through supressing competition in generation and consumer price discrimination. However, in fact monopoly rents are off-set by effective electricity price subsidies and a LRMC for the consumer below the LRMC of supply for EVN.
Quasi-rents
Difference in long-run marginal cost and short-run marginal cost. Appropriable in short to medium term.
Quasi-rents generated at the system level though average tariffs set below LRMC of supply. These are captured by the consumers of subsidised electricity (i.e. poor households, households with low levels of electricity consumption and energy intensive industries). Quasi-rents are generated at the project level through EVN’s monopoly on electricity transmission and distribution forcing down the price paid for electricity from IPPs (e.g. VSH), particularly when capital costs fully amortised.
Rents for innovation and
learning
Cost or quality advantage yielding higher return not achievable by the owners of the next best technology.
These rents are not particularly relevant to the Vietnamese context. However, they are arguably applicable to the any rents generated by technology suppliers for the power sector, rents generated by contractors due to their superior technical know-how and rents generated by operators of new/improved technologies. To the extent that these rents are available in Vietnam they are likely to accrue to the suppliers of foreign technology and know-how.
Rent based transfers
Transfers of other rents appropriated through the political system (formal and informal).
These are extensive in the ESI. The most significant transfer are those made to end-users through electricity price controls. In Vietnam these include energy intensive or otherwise strategic sectors (e.g. steel production, paper production, other manufacturing). Low income households and households with low electricity consumption, and to some extent rural households. Rent like transfers are also important in the process of competitive clientism and appropriated through patronage networks. These include any kick-backs and side-payments made by contractors. Poor, opaque corporate governance at SOEs and the lack of competitive tendering for power projects create space for these kinds of transfer. Accrue mainly to senior officials in government and the energy parastatals.
235
Moreover, a significant proportion of investment will take the form of joint ventures
between Vietnamese SOEs and foreign investors seeking to mitigate risks.
Fourthly, interest groups that emerge within the sector that are closely linked to
particular techno-economic paradigms. At EVN, Soviet trained engineers, with a
preference for hydropower. And at MPI, MoF, ERAV and CIEM the growing influence
of western-trained economists and lawyers with close connections to IFIs and
international consultants steeped in the standard model of ESI reform.
There are also a number of characteristics of the political economy of the Vietnamese
ESI which remain highly idiosyncratic, and related to the wider political economy, these
are the weakness of policy, the fragmentary nature of the political elites and the
dominance of the polity by powerful vested interests. Firstly, policy commitments mean
very little. Even at the national level policy in the ESI is often incomplete and
unimplemented. As the experience of both foreign and domestic IPPs show, policy is
frequently unclear, incomplete and unworkable and wherever possible trumped by the
exercise of political and economic power.
Secondly, the tussles over IPPs, power price and institutional reform are indicative of a
fragmented, rather than monolithic polity. While the central government retains the
ability to act decisively in extreme situations, generally it appears as weak and unable to
discipline factional interests. This is the case even in the ESI, perhaps the one sector
where due to its strategic importance, the centralised nature of its technology and the
reliance on the state for inputs (natural resources, capital etc.) one might believe
government authority could be effectively exercised. Thirdly, related to the previous
point, the political and economic power of large corporations and the important
patronage links to the political elite. If anything institutional changes in the wider
economy and the ESI in particular have further enabled the exercise of power by these
groups, as Fforde notes:
“These groups, with … typically hazy formal powers (apart from key and important rights, such as to
move capital between their constituent SOEs), followed a quite different logic, where economic power is
sited, not within state bodies, as such, but within large commercial units. In the world economy of the late
1990s and early 2000s, it was perhaps clear that such bodies could hope to free themselves from local state
control, to an important degree, through direct access to foreign capital, technology and markets through
236
various mechanisms such as a stock market. They therefore offered a potential basis for political power
independent from the state apparatus. This is, of course, the stuff of high politics.”(Fforde 2007: 219)
What we see playing out in Vietnam’s ESI are general trends reminiscent of the political
economy of ESI reform in other countries, which in turn reflects the fundamental nature
of the technology and its place in modern society. But also a more particularistic political
economy, which reflects the idiosyncratic disposition of power within a particular
country. The dynamic outcomes of the interaction of these different factors determine
outcomes in the sector. These are neither determined purely by the political nor purely
by techno-economic factors, but some combination of the two. In the final Chapter of
this thesis we elaborate how these emerging dynamics have played out to influence
technology choice.
237
Chapter 7: Analysis and conclusions. The political economy of technology choice in Vietnam’s power sector 7.1 Introduction
Climate change is perhaps the most pressing problem facing policy makers in the energy
sector. Reducing GHG emissions from the sector will require significant change from
incumbent technologies and technological systems. While there has been a great deal of
research conducted on technological change looking at various technological, economic,
social and cultural aspects of that change, we have argued that there has been a failure to
adequately address the role of political economy in technology choice. To address this
issue and investigate the role of political economy considerations in the process of
technological change we have developed an approach that places the political economy at
the centre of considerations of technological change.
Firstly, in Chapter 2, we argued that evolutionary economics approaches offer a
productive and realistic way of approaching issues related to technological change.
Evolutionary economics offers particularly strong causal analysis of the process of
technological change. In particular, evolutionary economics approaches emphasise the
emergence of barriers to technological change that cannot necessarility be reduced to
neo-classical notions of ‘market-failures’ and ‘externalities’. The emphasis of evolutionary
economics dynamics, the role of institutions and their co-development with
technological systems offers a nuanced account that accords well with the empirical
record on technological change. Importantly, Chapter 2 showed that despite good prima
facie theoretical reasons for expecting political economy considerations to be important in
the process of technological change, evolutionary theory fails to adequately address these
issues.
Secondly, Chapter 3 argued that from the perspective of economic development and
industrialisation there is a consensus that political economy variables are fundamental (if
not determinate) in creating a context in which technological change can take place.
Third, Chapter 4 built on the arguments presented in Chapters 2 and 3, examining the
role of political economy considerations in the development of the ESI, with a particular
emphasis on co-development of technologies and institutions. Finally, Chapters 5 and 6
presented a detailed empirical case study of the political economy of ESI development in
Vietnam.
238
The strategy has thus been to move from the most general theoretical level, and ‘drill-
down’ in the application of the argument first in terms of considerations of economic
development, then the ESI, then in the case of a specific country case study. This final
chapter seeks to reverse this process, by moving back up, from the specific case study to
more general considerations. Firstly, in section 7.2 we elaborate the linkages between
technology choice and the political economy that emerged from the case study of
Vietnam’s ESI and looks at what these political economy considerations may mean for
technological change in Vietnam, particularly relating to the potential scope for serious
climate change mitigation activities in Vietnam’s ESI. Section 7.3 moves on to draw
more general conclusions relating political economy considerations to technological
change in the ESI. Section 7.4 makes observations as regards more general theoretical
approaches to the political economy of technology change, the final section, 7.5 makes
recommendations for future research.
7.2 The political economy of technology choice in Vietnam’s ESI
In the previous chapter we examined the development of Vietnam’s ESI, its technologies
and institutions and set out how the development of the ESI related to the wider political
economy. We found that in many ways the development of the ESI had been typical of
that in rapidly industrialising countries, dominated by fundamental technical and
economic issues relating to capital investment needs, costs, and the security and reliability
of supply. These issues have, in turn, been related to the perennial political economy
problems associated with the ESI identified in Chapter 4, the opacity of costs, the
obsolescing bargain faced by investors in capital-intensive infrastructure and issues
relating to the legitimacy of the utility in the provision of essential public goods.
Different types of technologies will have different rents accruing to them, the ability of
the owners of those technologies to appropriate these rents will, fundamentally, be
dependant upon the structure of rights or institutions (formal and informal) in a
particular context. This section seeks to investigate in more detail the vested interests and
rents associated with ESI technologies in Vietnam. Seeking to elaborate rents associated
with particular technologies, how are they appropriated, and assess the extent to which
this is likely to affect technology choice.
239
To enable us to do this in the following four sections (7.2.1 – 8) we investigate the
particular political economy dynamics, and importantly rents associated with different
technologies and institutional arrangements and comment on how they seem to have
influenced technological change.
7.2.1 Rents, institutions and political economy in Vietnam’s ESI
At the most general level we have seen that the development of Vietnam’s ESI is subject
to important influences emerging out of political economy arrangements. We have seen
how, in a context of competitive clientism, vested interests in the ESI have been given
considerable latitude to pursue their own interests (Chapter 6). In part, this is an issue of
a lack institutional capacity amongst formal institutions leading to poor corporate
governance and corruption (Chapter 6, section 6.3.8). More fundamentally, it is a
reflection of the particular informal institutional arrangements in Vietnam. In particular,
the operation of patron-client relationships, resulting in a fragmented state in which elites
compete against one another for rents. We have sought to stress that the sheer amount
of resources and large benefit streams associated with the ESI means there is a lot at
stake, and that it should not be surprising that Vietnam’s ESI (in common with the
sector elsewhere in the world) is an important locus of rent contestation.
To be sure, rent appropriation happens through official channels, as for example,
property rights are granted over natural resources, supply and off-take agreements are
signed, electricity connections are established and end-users pay their bills. These rents
are contested though formal political processes, as higher tariff levels are resisted or
compensation for involuntary resettlement negotiated. However, given the importance
client-patron relationships in Vietnam we should also expect to see ESI related rents
appropriated through informal institutional arrangements.
Chapter 6 illustrated the importance of rent-based transfers in the ESI at a general level.
First, the transfer of natural resource rents generated by the ESI, largely appropriated by
the state and other groups with effective ownership rights over them. A large proportion
of these rents are distributed to end users through subsidised electricity prices. Second,
quasi-rents are also important at the system level, this time rents are available as the
result of differentials between SRMC and LRMC. Again the most visible of these quasi-
rents have been transferred to end-users through tariffs set at levels below the LRMC of
240
supply (although arguably EVN has also been able to capture some portion of these
rents). Third, monopoly rents generated by EVN and illustrated through its behaviour in
negotiating off-take tariffs with generators.
These rents are important at the general level and are dependant upon the overall
institutional make up of the ESI. As mentioned in Chapter 2 and Chapter 3, to some
extent they may be fungible with respect to the productive processes upon which they
supervene. Nevertheless, in some cases they are likely to be closely linked to the
technologies from which they are produced. In the following section we briefly discuss
important rents associated with the main technologies in Vietnam’s ESI and discuss the
rents and institutional dynamics likely to be associated with them.
7.2.2 Ownership profile and technologies
Turning first to the technology-ownership profile of installed capacity in 2011 (Table
7.2), this reflects the discussion in Chapter 6. A distinct pattern has emerged in the type
of technology predominating in the different ownership sectors. EVNs installed capacity
is still dominated by hydropower, with coal and gas contributing approximately equal
shares. Non-EVN capacity, by contrast is dominated by natural gas owned by PVN and
other IPPs, although TKV owned coal plants are also important. This distribution of
technologies by ownership reflects in part the respective technological competencies of
the different plant owners (e.g. EVN in hydropower and coal, foreign investors in
CCGTs), but also access to fuel supplies (e.g. PVN’s access to gas and TKV’s access to
coal) which serves to mitigate potential contractual and coordination issues.
This ownership profile will change with the development of new capacity much of which
is likely to be owned by generation companies independent of EVN. If and when EVN
is forced to divest its generation assets this will also have a significant impact on the
ownership profile. The only assets expected to remain under EVN control in the long-
term are those deemed to raise broader strategic considerations such as large multiple use
hydropower plants (Hoa Binh, Son La, Ya Ly and in the future Lai Chau) and the
planned nuclear plants. Nevertheless, as we shall see access to key rents from different
generation resources seems to have been important in shaping technology choice.
Table 7.2. Installed capacity by ownership and type December 2011
Ownership Type Capacity Proportion (%)
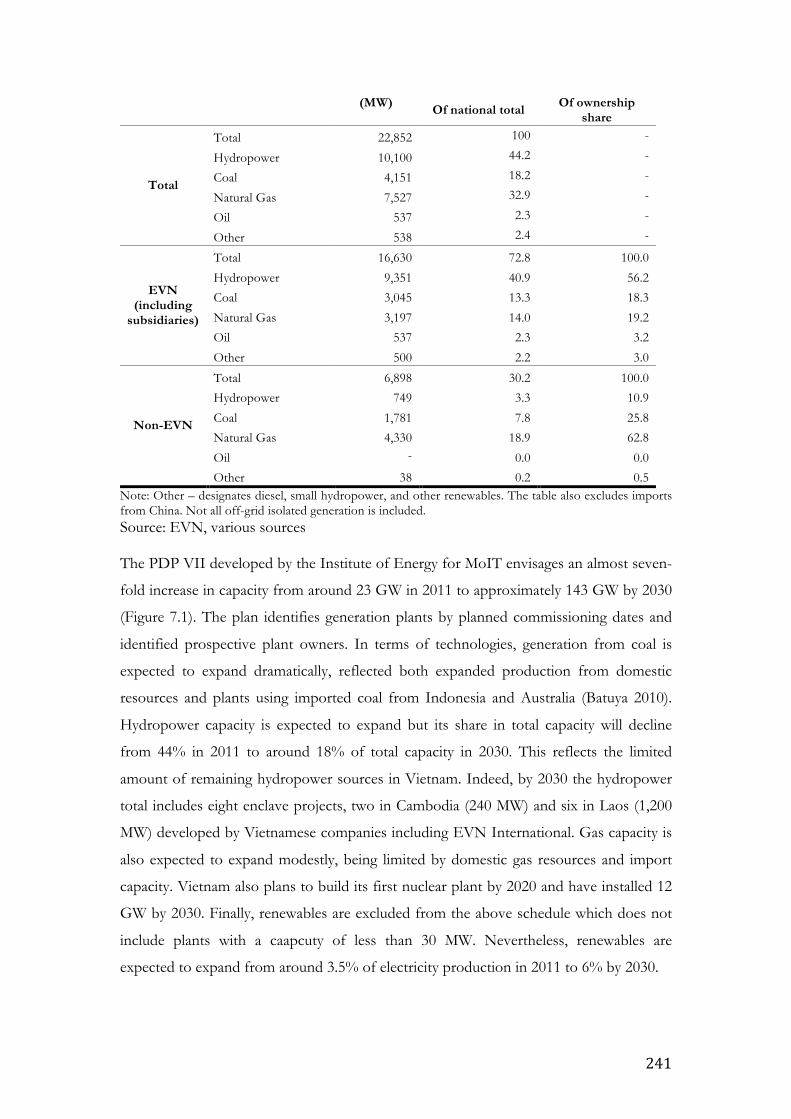
241
(MW) Of national total Of ownership share
Total
Total 22,852 100 -
Hydropower 10,100 44.2 -
Coal 4,151 18.2 -
Natural Gas 7,527 32.9 -
Oil 537 2.3 -
Other 538 2.4 -
EVN (including
subsidiaries)
Total 16,630 72.8 100.0
Hydropower 9,351 40.9 56.2
Coal 3,045 13.3 18.3
Natural Gas 3,197 14.0 19.2
Oil 537 2.3 3.2
Other 500 2.2 3.0
Non-EVN
Total 6,898 30.2 100.0
Hydropower 749 3.3 10.9
Coal 1,781 7.8 25.8
Natural Gas 4,330 18.9 62.8
Oil - 0.0 0.0
Other 38 0.2 0.5 Note: Other – designates diesel, small hydropower, and other renewables. The table also excludes imports from China. Not all off-grid isolated generation is included. Source: EVN, various sources The PDP VII developed by the Institute of Energy for MoIT envisages an almost seven-
fold increase in capacity from around 23 GW in 2011 to approximately 143 GW by 2030
(Figure 7.1). The plan identifies generation plants by planned commissioning dates and
identified prospective plant owners. In terms of technologies, generation from coal is
expected to expand dramatically, reflected both expanded production from domestic
resources and plants using imported coal from Indonesia and Australia (Batuya 2010).
Hydropower capacity is expected to expand but its share in total capacity will decline
from 44% in 2011 to around 18% of total capacity in 2030. This reflects the limited
amount of remaining hydropower sources in Vietnam. Indeed, by 2030 the hydropower
total includes eight enclave projects, two in Cambodia (240 MW) and six in Laos (1,200
MW) developed by Vietnamese companies including EVN International. Gas capacity is
also expected to expand modestly, being limited by domestic gas resources and import
capacity. Vietnam also plans to build its first nuclear plant by 2020 and have installed 12
GW by 2030. Finally, renewables are excluded from the above schedule which does not
include plants with a caapcuty of less than 30 MW. Nevertheless, renewables are
expected to expand from around 3.5% of electricity production in 2011 to 6% by 2030.
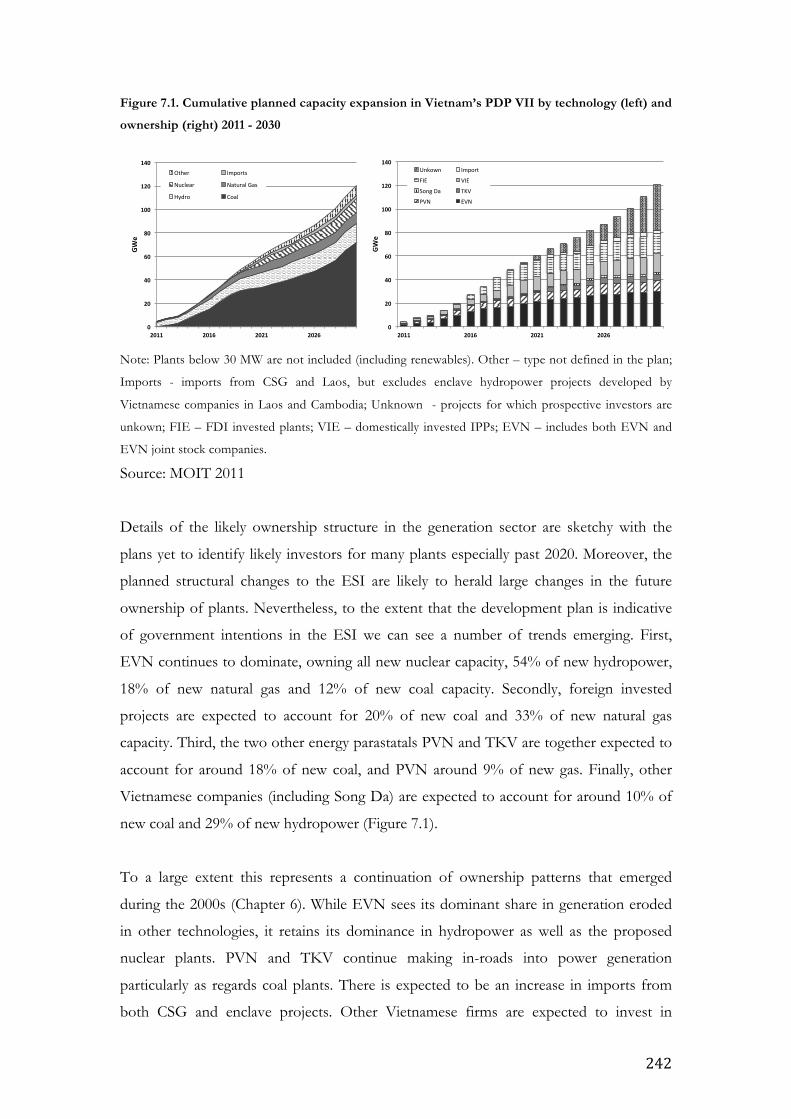
242
Figure 7.1. Cumulative planned capacity expansion in Vietnam’s PDP VII by technology (left) and
ownership (right) 2011 - 2030
Note: Plants below 30 MW are not included (including renewables). Other – type not defined in the plan;
Imports - imports from CSG and Laos, but excludes enclave hydropower projects developed by
Vietnamese companies in Laos and Cambodia; Unknown - projects for which prospective investors are
unkown; FIE – FDI invested plants; VIE – domestically invested IPPs; EVN – includes both EVN and
EVN joint stock companies.
Source: MOIT 2011
Details of the likely ownership structure in the generation sector are sketchy with the
plans yet to identify likely investors for many plants especially past 2020. Moreover, the
planned structural changes to the ESI are likely to herald large changes in the future
ownership of plants. Nevertheless, to the extent that the development plan is indicative
of government intentions in the ESI we can see a number of trends emerging. First,
EVN continues to dominate, owning all new nuclear capacity, 54% of new hydropower,
18% of new natural gas and 12% of new coal capacity. Secondly, foreign invested
projects are expected to account for 20% of new coal and 33% of new natural gas
capacity. Third, the two other energy parastatals PVN and TKV are together expected to
account for around 18% of new coal, and PVN around 9% of new gas. Finally, other
Vietnamese companies (including Song Da) are expected to account for around 10% of
new coal and 29% of new hydropower (Figure 7.1).
To a large extent this represents a continuation of ownership patterns that emerged
during the 2000s (Chapter 6). While EVN sees its dominant share in generation eroded
in other technologies, it retains its dominance in hydropower as well as the proposed
nuclear plants. PVN and TKV continue making in-roads into power generation
particularly as regards coal plants. There is expected to be an increase in imports from
both CSG and enclave projects. Other Vietnamese firms are expected to invest in
0"
20"
40"
60"
80"
100"
120"
140"
2011" 2016" 2021" 2026"
GWe"
Other& Imports&
Nuclear& Natural&Gas&
Hydro& Coal&
0"
20"
40"
60"
80"
100"
120"
140"
2011" 2016" 2021" 2026"
GWe"
Unkown& Import&
FIE& VIE&
Song&Da& TKV&
PVN& EVN&
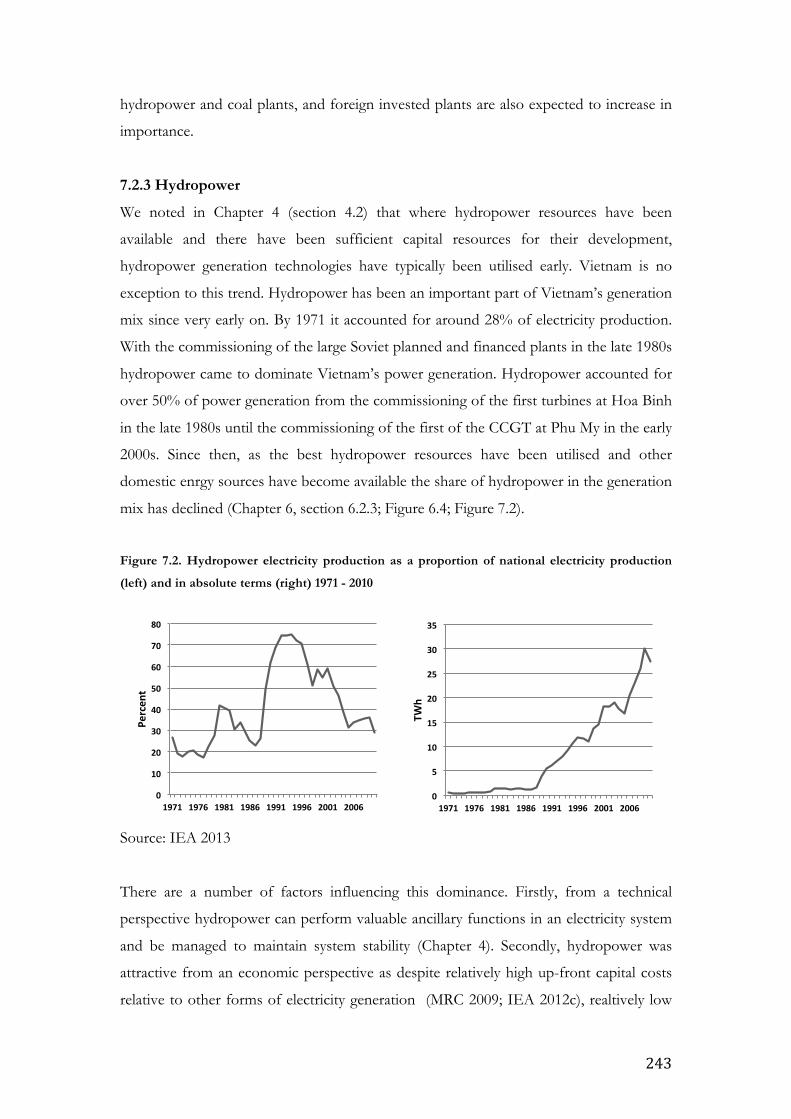
243
hydropower and coal plants, and foreign invested plants are also expected to increase in
importance.
7.2.3 Hydropower
We noted in Chapter 4 (section 4.2) that where hydropower resources have been
available and there have been sufficient capital resources for their development,
hydropower generation technologies have typically been utilised early. Vietnam is no
exception to this trend. Hydropower has been an important part of Vietnam’s generation
mix since very early on. By 1971 it accounted for around 28% of electricity production.
With the commissioning of the large Soviet planned and financed plants in the late 1980s
hydropower came to dominate Vietnam’s power generation. Hydropower accounted for
over 50% of power generation from the commissioning of the first turbines at Hoa Binh
in the late 1980s until the commissioning of the first of the CCGT at Phu My in the early
2000s. Since then, as the best hydropower resources have been utilised and other
domestic enrgy sources have become available the share of hydropower in the generation
mix has declined (Chapter 6, section 6.2.3; Figure 6.4; Figure 7.2).
Figure 7.2. Hydropower electricity production as a proportion of national electricity production
(left) and in absolute terms (right) 1971 - 2010
Source: IEA 2013
There are a number of factors influencing this dominance. Firstly, from a technical
perspective hydropower can perform valuable ancillary functions in an electricity system
and be managed to maintain system stability (Chapter 4). Secondly, hydropower was
attractive from an economic perspective as despite relatively high up-front capital costs
relative to other forms of electricity generation (MRC 2009; IEA 2012c), realtively low
0"
10"
20"
30"
40"
50"
60"
70"
80"
1971" 1976" 1981" 1986" 1991" 1996" 2001" 2006"
Percen
t"
0"
5"
10"
15"
20"
25"
30"
35"
1971" 1976" 1981" 1986" 1991" 1996" 2001" 2006"
TWh"
244
operations and maintenance costs, and zero fuel costs meant that the best hydropower
was frequently cheaper than alternative technologies. Thirdly, hydropower also offered
potential benefits to multiple sectors in terms of flood control, improved water supply
for irrigation and better navigability of water-ways in some circumstances (Thai 2000;
WCD 2000). Finally, the large civil works component of hydropower could generate a
large amount of domestic employment and domestic input use relative to the
construction of other types of generation capacity.
These benefits aside, as Quinn (1998) and others have pointed out, there are indications
that the ESI had overbuilt hydropower making the electricity supply vulnerable to
hydrological risks in the dry season (Chapter 6, section 6.2.4, 6.3.4; England & Kammen
1993). This suggests that considerations other than those of technological and economic
benefits were influencing the choice of hydropower generation capacity. Indeed, by the
1990s there are a number of reasons to believe that there was an institutional bias
towards hydropower development.
Prior to 1990, ESI development plans were created under the guidance of Soviet
planners the material resources for which were provided by the USSR and countries in its
sphere of influence (World bank 1993). As emphasised in Chapter 4 (section 4.2.3) and
Chapter 6 (section 6.2.3) large hydropower projects had important ideological functions,
having a long association with socialist central planning and nation building in post-
colonial states. At the same time, the emphasis of Soviet planners on hydropower
development in Vietnam and the construction of several large plants, generated
significant domestic capabilities in hydropower design, construction and operations.
Both EVN and the Institute of Energy have influential hydropower departments, whose
senior staff are often Soviet trained hydropower engineers (Chapter 6, section 6.2.3). The
technical capabilities developed around hydropower thus meant that there was an
institutional bias toward the promotion of hydropower in development plans (Quinn
1998).
The development of technical capabilities also extended to firms active in hydropower
construction. The core capabilities of a number of important construction companies
were bound-up with the construction of hydropower plants. For example, by far the
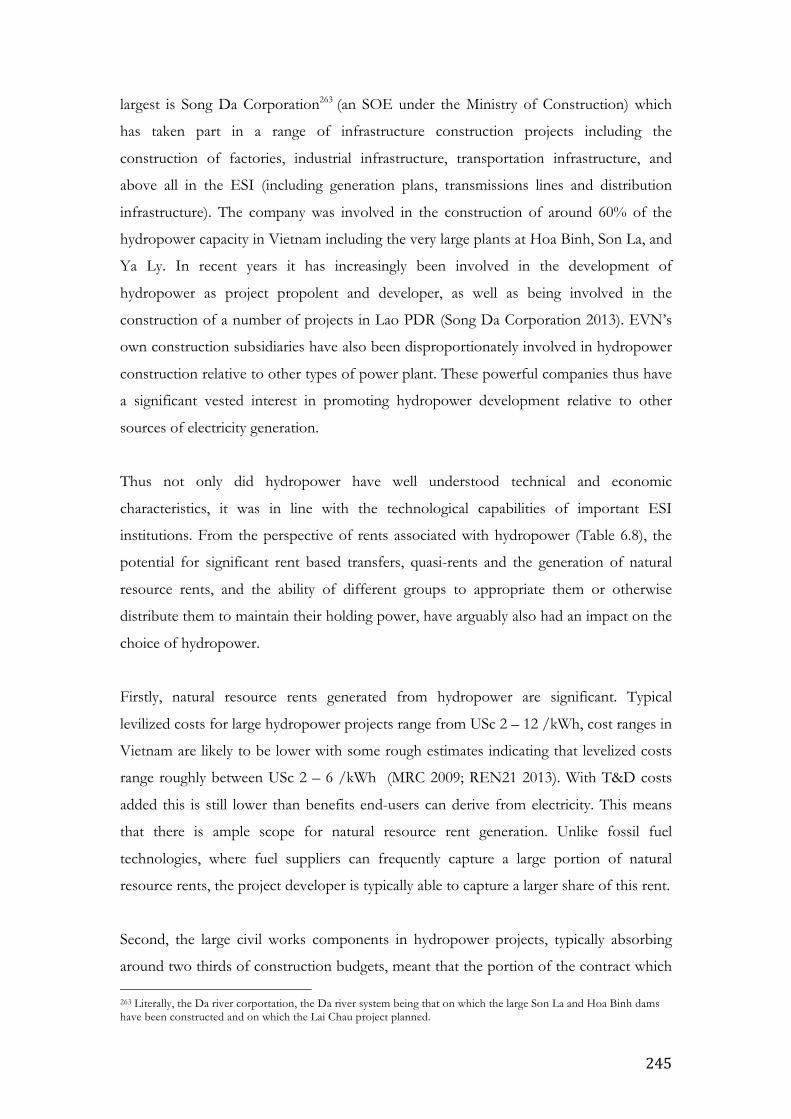
245
largest is Song Da Corporation263 (an SOE under the Ministry of Construction) which
has taken part in a range of infrastructure construction projects including the
construction of factories, industrial infrastructure, transportation infrastructure, and
above all in the ESI (including generation plans, transmissions lines and distribution
infrastructure). The company was involved in the construction of around 60% of the
hydropower capacity in Vietnam including the very large plants at Hoa Binh, Son La, and
Ya Ly. In recent years it has increasingly been involved in the development of
hydropower as project propolent and developer, as well as being involved in the
construction of a number of projects in Lao PDR (Song Da Corporation 2013). EVN’s
own construction subsidiaries have also been disproportionately involved in hydropower
construction relative to other types of power plant. These powerful companies thus have
a significant vested interest in promoting hydropower development relative to other
sources of electricity generation.
Thus not only did hydropower have well understood technical and economic
characteristics, it was in line with the technological capabilities of important ESI
institutions. From the perspective of rents associated with hydropower (Table 6.8), the
potential for significant rent based transfers, quasi-rents and the generation of natural
resource rents, and the ability of different groups to appropriate them or otherwise
distribute them to maintain their holding power, have arguably also had an impact on the
choice of hydropower.
Firstly, natural resource rents generated from hydropower are significant. Typical
levilized costs for large hydropower projects range from USc 2 – 12 /kWh, cost ranges in
Vietnam are likely to be lower with some rough estimates indicating that levelized costs
range roughly between USc 2 – 6 /kWh (MRC 2009; REN21 2013). With T&D costs
added this is still lower than benefits end-users can derive from electricity. This means
that there is ample scope for natural resource rent generation. Unlike fossil fuel
technologies, where fuel suppliers can frequently capture a large portion of natural
resource rents, the project developer is typically able to capture a larger share of this rent.
Second, the large civil works components in hydropower projects, typically absorbing
around two thirds of construction budgets, meant that the portion of the contract which 263 Literally, the Da river corportation, the Da river system being that on which the large Son La and Hoa Binh dams have been constructed and on which the Lai Chau project planned.
246
could be captured by large construction companies is much larger for hydropower
projects that for other types of generation capacity (ICEM 2008; Pauschert 2009; ICEM
2010). In the case of Vietnam’s large hydropower construction companies (owned by
EVN and Song Da), this adds an additional incentive to promote the development of
hydropower. It should also be borne in mind that the large civil works components, and
the difficulty in monitoring the costs of these, gives greater scope for the generation of
informal transfers and corruption.
Third, there is a significant potential for the generation of what we have termed quasi-
rents in the hydropower sector. That is to say, the difference between LRMC (i.e. the
costs of constructing new capacity) and SRMC (the operational costs) is large, with
almost all hydropower’s costs being in the initial capital investments. This large
difference means there is significant potential for the generation of quasi-rents, or short-
term rents by driving down the tariff levels to the SRMC of production, which for hydro
is very small.
Thus political economy considerations seem to have played an important part both in the
adoption of hydropower technology in the first place, and in the dominance of
hydropower in the ESI until relatively recently. In general, it is difficult to get away from
the impression that hydropower has been given priority in the ESI, even to the detriment
of system operations. And that political economy, alongside other factors has played an
important role in this. Hydropower’s relative importance in the future will almost
certainly decline as economically attractive hydropower resources are fully utilised.
Nevertheless, PDP VII indicates the intention to pursue the continued development of
hydropower where possible. PDP VII also contains more details than for other
technologies as regards which plants are allocated to which developers. EVN and Song
Da continue to dominate the provision of large hydropower (Figure 7.1), including a
number of enclave projects in Cambodia and Lao PDR. This suggests that for these
potentially lucrative projects rents are being divied-up between important vested
interests. The priority given to these developers is indicative of their continuing political
influence, and a preference for hydropower linked to this.
7.2.4 Coal
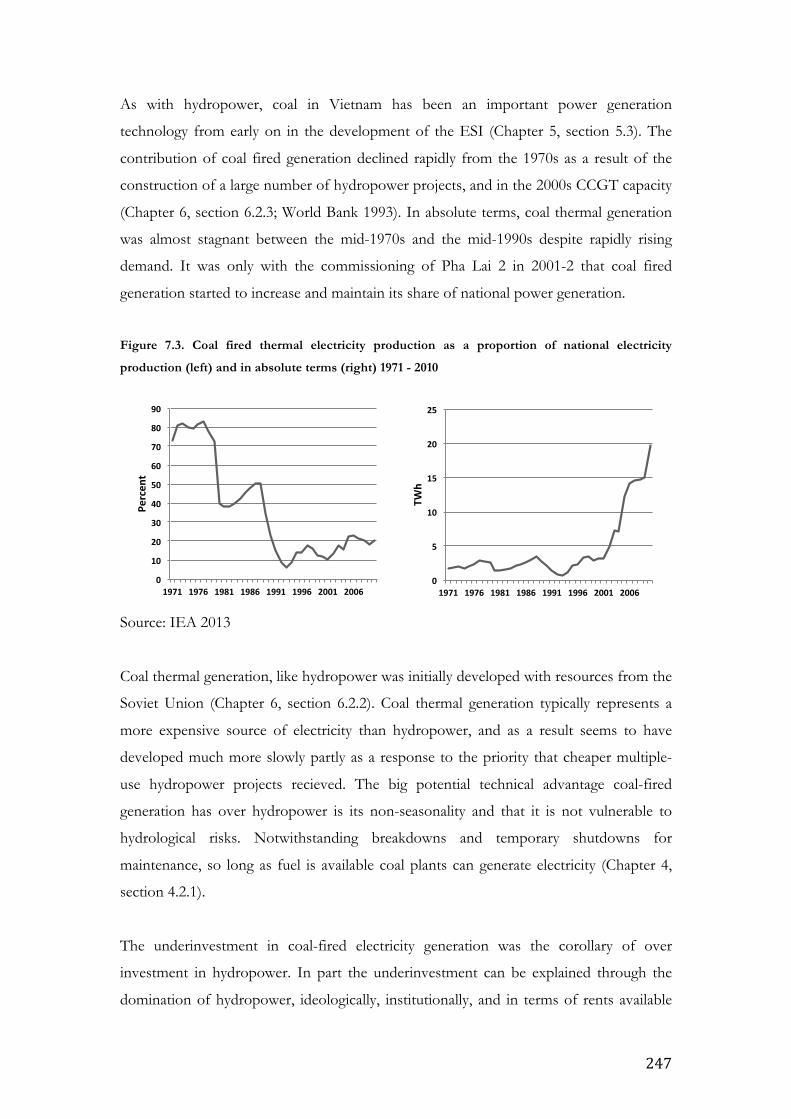
247
As with hydropower, coal in Vietnam has been an important power generation
technology from early on in the development of the ESI (Chapter 5, section 5.3). The
contribution of coal fired generation declined rapidly from the 1970s as a result of the
construction of a large number of hydropower projects, and in the 2000s CCGT capacity
(Chapter 6, section 6.2.3; World Bank 1993). In absolute terms, coal thermal generation
was almost stagnant between the mid-1970s and the mid-1990s despite rapidly rising
demand. It was only with the commissioning of Pha Lai 2 in 2001-2 that coal fired
generation started to increase and maintain its share of national power generation.
Figure 7.3. Coal fired thermal electricity production as a proportion of national electricity
production (left) and in absolute terms (right) 1971 - 2010
Source: IEA 2013
Coal thermal generation, like hydropower was initially developed with resources from the
Soviet Union (Chapter 6, section 6.2.2). Coal thermal generation typically represents a
more expensive source of electricity than hydropower, and as a result seems to have
developed much more slowly partly as a response to the priority that cheaper multiple-
use hydropower projects recieved. The big potential technical advantage coal-fired
generation has over hydropower is its non-seasonality and that it is not vulnerable to
hydrological risks. Notwithstanding breakdowns and temporary shutdowns for
maintenance, so long as fuel is available coal plants can generate electricity (Chapter 4,
section 4.2.1).
The underinvestment in coal-fired electricity generation was the corollary of over
investment in hydropower. In part the underinvestment can be explained through the
domination of hydropower, ideologically, institutionally, and in terms of rents available
0"
10"
20"
30"
40"
50"
60"
70"
80"
90"
1971" 1976" 1981" 1986" 1991" 1996" 2001" 2006"
Percen
t"
0"
5"
10"
15"
20"
25"
1971" 1976" 1981" 1986" 1991" 1996" 2001" 2006"
TWh"
248
to EVN and project developers. By contrast the control of rents associated with coal
were spread more widely and not concentrated with project developers as with
hydropower. Firstly, natural resource rents did not in general accrue to TKV (which
accounts for 95% of domestic coal production). The price at which domestic coal was
supplied to generators was controlled, and actually below the cost of supply (MoIT 2011;
Tran and Jones 2011; Baruya 2010). As a result, wherever possible TKV has preferred to
supply coal to the Chinese market, predominantly for thermal power generation in
Guangxi and Guangdong. This market grew to about 18 Mt a year by 2008 (Baruya
2010). Most Vietnamese coal is produced in Quang Ninh province which borders on
Guangxi. Baruya (2010) notes this close proximity coupled with the price differentials
between domestic and export prices for coal resulted in wholesale smuggling, some of it
reputedly involving TKV staff. Nevertheless, in the case of the formal transfer of the
natural resource rents associated with coal fired power generation, these where wholly
passed to and controlled by the ESI. Indeed, given the losses incurred due to coal price
levels for domestic electricity generation held below the cost of production, coal supplies
to the ESI were effectively cross-subsidised by coal exports. In the end, much of this
rent would have been transferred to end users by means of controlled electricity tariffs.
Secondly, the potential for generating short-term rents accruing to domestic construction
companies seem to have been lower compared to hydropower, which as pointed out
above had been able to make extensive use of domestic inputs. This is in part a
consequence of the lower share of civil works in coal construction costs,264 imported
heavy engineering goods forming a larger portion of the capital expenditure on coal
plants. At the same time, capital costs tend to be lower than those for hydropower
meaning that there is less scope for generating rents from plant construction. Foreign
construction firms and engineering contractors have been more widely involved in coal
plant construction than has been in case for hydropower. Much of the new coal capacity
has been funded using capital from foreign ECAs, this has frequently been tied to the
purchase of capital goods or construction services (particularly from China and Japan),
again limiting the role for domestic Vietnamese firms (Chapter 6, section 6.3.7, 6.3.8).
However, the recent influx of FDI into the ESI has largely been concentrated on coal
plants – which will again diminish the involvement of Vietnamese companies in plant
264 According to Pauschert (2009) around 5% of total costs for comparable plants in India.

249
construction. This contrasts with the hydropower sector, which remains dominated by
Vietnamese firms and EVN in particular.
Finally, it should be noted that the ability of the government to transfer coal rents
though cheaper prices is being squeezed as domestic coal production is forced to rely
more heavily on coal that is more expensive to obtain (i.e. though shaft mining as
opposed to open-cast), and as the country becomes a net importer of coal – effectively
undermining the cross subsidy between generation supply and exports (Annex A5.1;
Baruya 2010).
Coal technologies do not seem to have been associated to the same extent as
hydropower with domestic vested interests in the ESI. In contrast, the division of
control over the supply-chain in coal thermal power generation between TKV and
(predominantly) EVN has lead to competition for coal rents between these two SEGs.
The contestation of coal rents will continue for as long as a differential exists between
international market-based coal prices and the controlled prices at which generators are
supplied. Nevertheless, the bulk of these rents essentially continue to be passed on to
electricity consumers.
Considering the choice of coal in the future, PDP VII envisages a dramatic increase in
coal thermal capacity, reflecting the need to supply power as cost effectively as possible,
and to this extent the political imperative for effective provision of low cost electricity as
a public good. Domestic political economy considerations are perhaps less influential in
the choice of this technology, although they are likely to play out in the allocation of
projects to preferred developers, the choice of EPC contractors and technology
suppliers. Although in many cases, given the increasing role ECAs seem to be playing,
political economy considerations of importance are likely encompass that of industrial
policy in countries that supply funds for these projects, including Japan, China and
Korea in particular.
7.2.5 Natural Gas
Natural gas has only relatively recently become an important source of electricity
generation in Vietnam, with the development of large complexes at pipeline terminals in
Phu My, Nhon Trac, O Mon and Ca Mau (Figure 7.3). As with hydropower and coal,
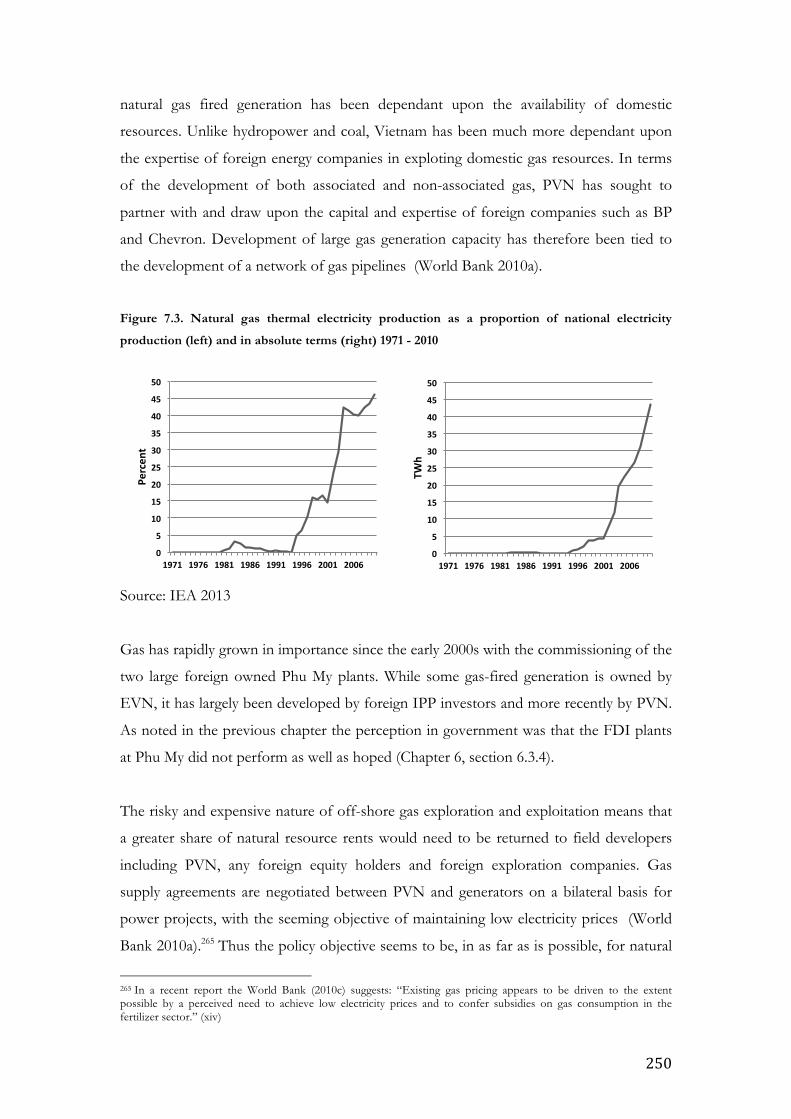
250
natural gas fired generation has been dependant upon the availability of domestic
resources. Unlike hydropower and coal, Vietnam has been much more dependant upon
the expertise of foreign energy companies in exploting domestic gas resources. In terms
of the development of both associated and non-associated gas, PVN has sought to
partner with and draw upon the capital and expertise of foreign companies such as BP
and Chevron. Development of large gas generation capacity has therefore been tied to
the development of a network of gas pipelines (World Bank 2010a).
Figure 7.3. Natural gas thermal electricity production as a proportion of national electricity
production (left) and in absolute terms (right) 1971 - 2010
Source: IEA 2013
Gas has rapidly grown in importance since the early 2000s with the commissioning of the
two large foreign owned Phu My plants. While some gas-fired generation is owned by
EVN, it has largely been developed by foreign IPP investors and more recently by PVN.
As noted in the previous chapter the perception in government was that the FDI plants
at Phu My did not perform as well as hoped (Chapter 6, section 6.3.4).
The risky and expensive nature of off-shore gas exploration and exploitation means that
a greater share of natural resource rents would need to be returned to field developers
including PVN, any foreign equity holders and foreign exploration companies. Gas
supply agreements are negotiated between PVN and generators on a bilateral basis for
power projects, with the seeming objective of maintaining low electricity prices (World
Bank 2010a).265 Thus the policy objective seems to be, in as far as is possible, for natural
265 In a recent report the World Bank (2010c) suggests: “Existing gas pricing appears to be driven to the extent possible by a perceived need to achieve low electricity prices and to confer subsidies on gas consumption in the fertilizer sector.” (xiv)
0"
5"
10"
15"
20"
25"
30"
35"
40"
45"
50"
1971" 1976" 1981" 1986" 1991" 1996" 2001" 2006"
Percen
t"
0"
5"
10"
15"
20"
25"
30"
35"
40"
45"
50"
1971" 1976" 1981" 1986" 1991" 1996" 2001" 2006"
TWh"
251
resource rents to be transferred to end-users as with hydropower and coal. Nevertheless,
gas represents a more expensive alternative to either hydropower or coal generation.
Moreover, as in the coal sector, there is some evidence of quasi-rents, as lower gas prices
have stymied investment in the development of the sector. Again this represents a
politically motivated trade-off between short-term cost considerations against those of
long-term development (World Bank 2010c).
For CCGT plants civil works tend to compose an even smaller portion of capital costs.
Indeed, one of the main advantages of CCGT technologies is that the technology has a
smaller efficient economic scale and is modular in nature. As a result most of the capital
costs are composed of engineering costs. This means that a greater proportion of capital
costs would go to technology providers - as a technology rent - and there is less potential
for the capture of rents or rent-based transfers by domestic companies (Pauschert 2009).
At the same time, these cost attributes made this technology attractive for IPPs (Chapter
4, section 4.2.6). In addition, the relatively high fuel costs and relatively low capital costs
mean that CCGT generators have higher SRMCs relative to LRMCs, leaving less scope
for the creation of quasi-rents. This too represents a somewhat reduced risk for investors
relative to projects which have greater up-front capital costs.
Political economy has been less important in determining the diffusion of CCGTs in
Vietnam than other technologies. Where diffusion of this technology became viable was
where investors were afforded protection from the risks posed by counterparties in their
pursuit of rents, particularly in Vietnam’s lax regularory environment. Initially the
resistance to these technologies related more to resistance to IPPs (and the associated
protection of EVN rents), and foreign IPPs in particular. Foreign CCGT IPP’s seemed
to be effectively protected from EVN’s use of its monopolistic power. However, those
owned by PVN did not seem to enjoy the same protection, with issues emerging relating
to the payment of fuel bills and the willingness of EVN to dispatch (expensive) electricity
from these plants (Chapter 6, section 6.3.8). As with coal, most political economy issues
relate to natural resource rents generated up-stream and the distribution of these rents
between key players, in this case PVN’s foreign partners, PVN and EVN.
252
According to PDP VII, CCGT capacity is expected to increase by 8 GW by 2030, with
ownership of these new plants spread between EVN, foreign investors, PVN and some
as yet to be identified developers.
7.2.6 Renewables
Renewables have not been widely adopted in Vietnam with around 714 MW installed by
2010, around 85% of which has been small hydropower (<30 MW), 12% biomass and
biogas, 4% wind and less than 1% solar PV both off-grid and on-grid (Nguyen 2013).
Small hydropower has been far the most important source of renewable power
generation. As explained in section 6.3.7, small hydropower is a relatively cheap and well-
understood technology. Vietnamese developers, construction firms and provincial
authorities saw significant potential to capture both natural resource rents, and in all
likely-hood transfers. The small hydropower boom in the 2000s saw a varied range of
investors become involved in the development of small hydropower capacity as IPPs.
These developments were also popular with provincial authorities, with whom the right
to grant concessions rested, which thus opened up the possibility of generating licit
(natural resource taxes and payments land use rights) and illicit (kick-backs and bribes for
concession grants) rent based transfers. Local (as well as national) construction
companies with provincial connections also stood to benefit from providing the
substantial civil works associated with these projects at the provincial level, in much the
same way that EVN and Song Da were able to at the national level. Finally, the boom
consisted of opportunistic investment by a variety of investors enjoying cheap, privileged
access to capital (typically from domestic banks) or privileged access to concessions.
From the perspective of EVN, additional cheap capacity was welcomed to the extent
that low off-take tariffs allowed EVN to capture a good proportion of the natural
resource rents, which could help cross subsidise end-user tariffs. As with other IPPs
EVN was able to generate quasi-rents by driving off-take tariffs down towards the
SRMC of production. As noted above, this acted as an important brake on the further
development of ‘strategic investors’ in the ESI with the compunction and financial
wherewithal to invest in additional capacity, which would require off-take tariffs closer to
the LRMC of production (Chapter 6, section 6.3.7; section 7.2.3; Table A6.3). Overall,
253
the low off-take tariffs relative to other available technologies made small hydropower
attractive to EVN.
However, small hydropower plants with smaller water storage capacity are more
vulnerable to hydrological risks, compounding the dry seasons risks already experienced
by the hydropower dominated ESI. Moreover, small hydropower plants faced less
stringent environmental and social safeguards than larger plants. They have also been
frequently built by less experienced contractors and with limited operational oversight
(Meier 2013). From around 2010 onwards these plants were increasingly criticised by the
press for thier social and environmental impacts, including instances of shoddy
construction, and poor uncoordinated operations leading allegations of exasperating
downstream flooding during periods of heavy rainfall (Thanh Nien News 2012; Thanh
Nien Daily 2012; Saigon Daily 2013). As early as 2010, MoIT was advising provinces to
pay more attention to the negative environmental impacts of these small hydropower
plants (DTI News 2010).
Other renewables developments have been very limited, but where developments have
taken place they have also been developed by IPPs. As noted in Chapter 6, for off-grid
applications renewables have made some in-roads, for example in the combustion of
biomass (e.g. Bourbon sugar Mill in Tay Ninh province Chapter 6, section 6.3.4) and in
remote locations the development of wind power (e.g. Ba Ria Vung Tau wind farm,
Chapter 6, section 6.3.4). However, on-grid development has been extremely slow to
emerge. The development of suitable grid codes, ensuring priority dispatch, net metering
and a subsidised off-take tariff (by way of a feed-in-tariff (FiTs)) all imply greater costs
for EVN, which has lead to significant reluctance on the part of EVN to agree the
development of these projects. With a few exceptions, FiTs that have been agreed for
these renewables have generally not been sufficient to attract investment. Even where
agreements have been reached - the difficulty IPPs have faced with enforcing PPAs have
added further disincentives.
Thus, while PDP VII has relatively ambitious targets for the expansion of renewables (an
additional 3 GW by 2020 and 6.7 GW by 2030 (Nguyen 2013)), technical issues, and the
policy and political economy environment mean that without significant and effective
254
changes in the regulatory environment and the political will to achieve these this target is
unlikely to be achieved.
7.2.7 Nuclear
While Vietnam currently has no nuclear generation installed, plans for nuclear generation
have been afoot since at least 1996 (Le 2012). PDP VII envisages an extremely ambitious
programme of nuclear expansion, with a total of around 12 GW installed by 2030 and
the first 1 GW nuclear plant scheduled for commissioning by 2020 (Figure 7.1). This first
plant will use Russian technology supplied by Rosatom, a Russian EPC and will be
largely bankrolled using concessional Russian lending to the tune of US$ 8-9 billion for
the first plant. A second plant is to be provided by Japan, again tied to ECA loans to the
tune of US$ 8-9 billion using Japanese technologies and contractors. A possible third
plant using Korean technology has also been mooted (Hechtr 2010; The New York
Times 2012; Asian Power 2012). Other countries such as Canada, China, France and the
US have also been involved in nuclear agreements and negotiations on civilian
applications with Vietnam (Le 2012).
The choice of nuclear power is interesting as it is likely to be considerably more
expensive than the alternatives (with the possible expection of some renewables). The
technical requirements for the construction and safe operations of nuclear technologies
are also significant (Kessides 2012a; Vujic et al 2012). Form a technical and economic
perspective this choice seems to be driven by concerns relating to future energy security
in Vietnam given its rapidly expanding electricity needs, but also by the availability of
technologies and finance from other countries seeking markets for their domestic nuclear
power industries (Hechtr 2010; The New York Times 2012). As we noted in Chapter 4,
in the case of the development of nuclear power elsewhere, nuclear power probably also
represents a good fit in terms of Vietnam’s centralised development model (section
4.2.3).
Rents in the short term are largely likely to be technology rents or rents for learning,
accruing to technology providers and EPCs. Nuclear power (like hydropower) also has a
significant civil works component, meaning that large specialist construction companies
may be well placed to appropriate rents derived from the large capital expenditures
associated with these plants. It is unclear to what extent Vietnamese companies would
255
have the specialist skills available to allow them to appropriate a share of these rents.
Indeed, it is likely that these plants would need to be effectively cross-subsidised by other
generation plants in the ESI, given EVN’s (post divestment rump) likely future portfolio
including a number of fully depreciated large hydropower plants, this may be possible
within the company itself.
Possibly the most important implication of the development of nuclear power in
Vietnam relates to the implications for the ownership structure of the ESI as a whole.
Given that large proposed nuclear capacity remaining under the management and
ownership of EVN it is likely to mean that EVN remains in a dominant position in the
Vietnamese ESI. Thus the choice of nuclear power is also understandable as a means of
maintaining EVNs dominance in the ESI. The ostensive justification in what is envisaged
as an otherwise liberalised ESI would be the ‘strategic’ nature of the technology.
7.3 Conclusions on the political economy of technology choice in Vietnam
In a recent consultancy report for the World Bank, Pereira (2008) notes that given
rapidly growing electricity demand, Vietnam has limited choices when considering future
electricity generation technologies:
“…generation planning in Vietnam does not have many degrees of freedom. The basic options (in
increasing order of attractiveness) are hydro imports (defined by MoUs between governments); local hydro
(not a large potential); local coal (not high quality, located in the North region); natural gas (fields in the
South region, in the process of being developed) and imported coal. Given the above constraints, planning
becomes more a question of defining the entrance dates of the (few) available projects, rather than an
economic choice from a very large number of options.” (Pereira 2008: 6)
Greater choice was arguably available to Vietnam in the course of the development of
the ESI, such as that between hydropower and coal in the 1980s and 1990s. However,
once we consider the institutional and political economy context we see the technological
options are narrowed. In the course of the 1980s technology choice was largely the result
of Soviet plans, technologies and resources, leaving little latitude for the exercise of
domestic political economy dynamics. With the liberalisation of the 1990s, the scope for
technology choice in the sector opened up, as did the scope for the exercise of political
economy factors. In particular, the balance between the contestation of various rents
between elite interest groups, and the broader political need to ensure the public good of
256
cheap electricity and reliable supply against the background of changing resource
constraints and costs.
The availability of various rents and quasi-rents to various groups in the ESI has arguably
influenced technology choice and the ownership of technologies. Firstly, at the most
general level, the need to maintain low end-user tariffs, both as a tool to promote
industrial development and as a social policy tool has been a key concern. This reflects
both rational public policy, but also the need to maintain state legitimacy through the
provision of a public good. This has been reflected in the choice of hydropower in the
past, and in the future the planned development of coal fired generation. Secondly, the
dual role of EVN, which is both the institutional means by which the important public
good of cheap, reliable electricity is delivered, but also functions as an important locus
for the generation of rents for key elites. Indeed the evidence suggests that EVN has
often put the goal of short-term rent generation above that of its public good role. For
example, in seeking to maintain streams of rents and quasi-rents by squeezing existing
IPPs, frustrating the development of the IPP sector, in giving preference to its own
project development (and other favoured developers) and dispatch, and thought utilising
privileged access to funding to engage in speculative, non-core investments (Chapter 6,
section 6.3 – 6.4). This affected technology choice indirectly through the imperative
EVN faced to maintain low off-take costs meaning it was reluctant to develop more
expensive generation technologies, and directly through promotion of technologies
which it could maintain control (large hydropower and nuclear), that offered it greater
control over natural resource rents (hydropower and coal) and which created significant
opportunities for other kinds of rent and rent-based transfers (hydropower)(sections
7.2.3 – 7).
Thirdly, the other energy parastatals have been able to leverage their effective control
over fossil fuel resources to enter generation and through the development of associated
technologies (coal and CCGT). The weakness of central control and competitive
clientism has allowed EVN to obstruct and contest the entry of PVN and TKV.
Through its monopoly position in the power sector EVN has been able to control a
portion of coal and gas resource rents. Thus, to this extent the diffusion of technologies
associated with these fuels (CCGT and sub-critical coal) have been stymied. Finally, more
generally technologies with higher costs and in which EVN did not enjoy core
257
competencies (CCGT and renewables) have been typically provided by IPPs. These
potentially threatened EVN’s control over the sector and higher off-take tariffs also
threatened EVN’s financial position. Again the obstruction of technological diffusion is
as much about obstructing IPPs as about the particular technology in question.
7.4 Holding power, political settlements and rents in the Vietnamese power sector
We are now in a position to realte the case study to the more general analytical
framework we developed in sections 3.3.1 and 3.3.2. The Vietnam case study clearly
illustrates the importance of the distribution of holding power in the Vietnamese political
economy in understanding broader outcomes in the ESI. The concentration of holding
power at EVN can be inferred through its ability to delay the formal adoption of reforms
in the sector, to influence the direction of reform (such as the controversy over the
design of a single buyer, and the shape of divertment and sector restructuring), and to
subvert some aspects of the reform process (such as through non-payment of bills, foot-
dragging in PPA negotiation and grid interconnection, failure to dispatch non-EVN
generation capacity and large-scale investment in non-core activities). These actions seem
to have been undertaken to protect EVN’s rents in the sector. Moreover, other
important vested interests have seemingly been able to draw on their influence and
informal patronage networks to enable the continuing capture of various rents. We can
infer that this is the case through consideration of allocation of potentially lucrative
projects to important vested interests (such as hydropower projects to Song Da
Corporation and EVN amongst others).266
At the same time, the case study illustrates the limits to the holding power of EVN (and
the other energy parastatals). Their luckless pursuit of increased power tariffs serves to
emphasise the continuing importance other vested interests, importantly the need for the
CP to maintain legitimacy and thus its position of power (and the rents that go with it).
As argued above, this has been managed through the provision of pubic goods such as
266 What is more, the relative impotence of the IFIs also stands out, their ability to force the pace of reform and
direction of policy has been limited. Vietnam has relied on ODA for a considerable portion of capital investment in
the ESI, it has been able to aquire donor commitments without needing to make to many concessions in terms of
actual reform. Changes to policy have largely been driven by domestic pressures and more recently the need to
encourage foreign investment in the ESI.

258
cheap electricity and macro-econmic stability. The current situation developed over a
period when the ample domestic resource base (the abundance of hydropower in
particular) and foreign capital made available on concessional terms (from the USSR and
latterly ODA) made a high level of trasfers to end users feasible. This exemplifies the
way in which dispositions of holding power are both enabled and constrained by a
techno-economic system.
Turning to the broader political economy framework (elaborated in Figure 7.4 below),
the elites in EVN and the large parastatals through ownership and control of the ESI
(and associated technology, resources and capital) have by and large controlled political
institutions and policy formation to ensure the maintainence of their privelidged position
in the ESI. They have been able to accomplish this through close patronage networks
with the CP and the administrative arms of state (Ministries, Peoples Committees etc).
The interests of EVN have been closely realted to the techno-economic paradigm, in
that a vertically integrated, monopolistic, expansionary and hydro-centric model of ESI
development has enabled the generation of significant rents. The provision of cheap
capital for system expansion (from policy lending, ODA and before that the USSR) and
the large gap between LRMC and SRMC in the sector (particulalrly in the case of
hydropower). Thus in as far as has been possible EVN has sought to promote its
preferred technology (hydropower) and its preferred economic institutions (vertically
integrated monopoly). This has also implied the suppression of IPPs, unbundling and
other reforms. At the same time, by and large, EVN has fulfilled its developmental
function with the expansion of the grid, increased electricity supply and imporved quality
of service. Thereby legitimising (to some extent) the institutional set up of the ESI and
more broadly the role of the CP in the economy.
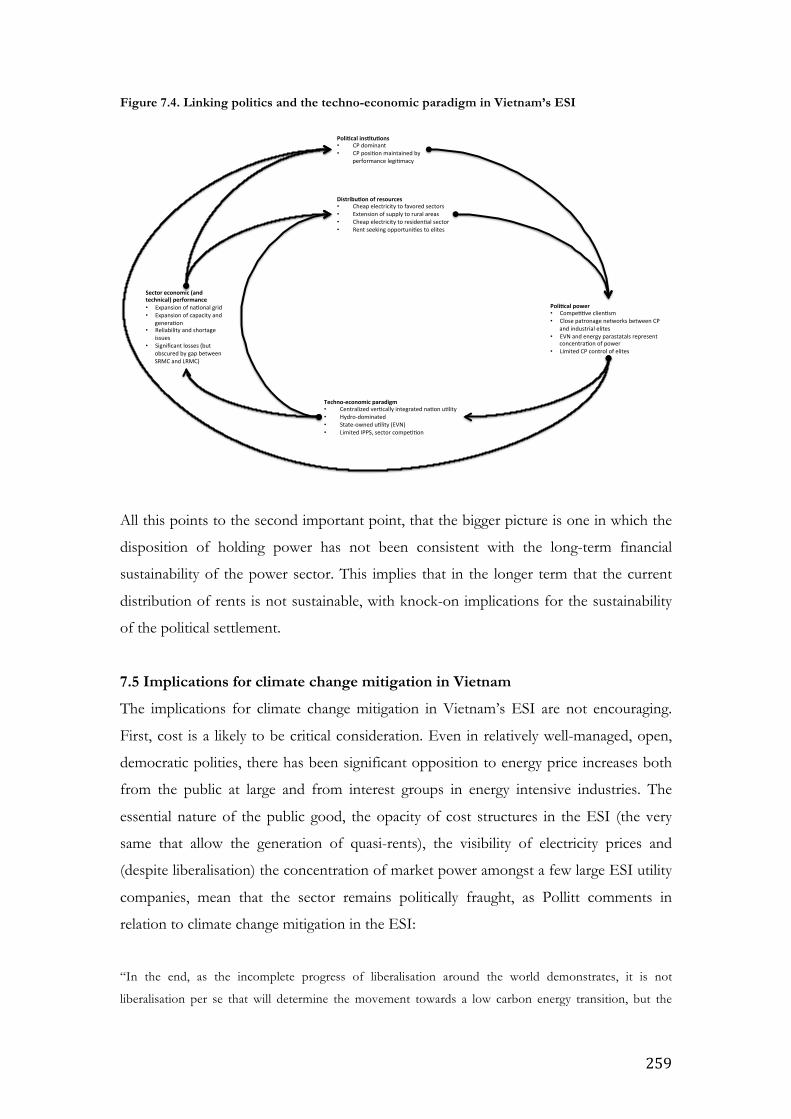
259
Figure 7.4. Linking politics and the techno-economic paradigm in Vietnam’s ESI
All this points to the second important point, that the bigger picture is one in which the
disposition of holding power has not been consistent with the long-term financial
sustainability of the power sector. This implies that in the longer term that the current
distribution of rents is not sustainable, with knock-on implications for the sustainability
of the political settlement.
7.5 Implications for climate change mitigation in Vietnam
The implications for climate change mitigation in Vietnam’s ESI are not encouraging.
First, cost is a likely to be critical consideration. Even in relatively well-managed, open,
democratic polities, there has been significant opposition to energy price increases both
from the public at large and from interest groups in energy intensive industries. The
essential nature of the public good, the opacity of cost structures in the ESI (the very
same that allow the generation of quasi-rents), the visibility of electricity prices and
(despite liberalisation) the concentration of market power amongst a few large ESI utility
companies, mean that the sector remains politically fraught, as Pollitt comments in
relation to climate change mitigation in the ESI:
“In the end, as the incomplete progress of liberalisation around the world demonstrates, it is not
liberalisation per se that will determine the movement towards a low carbon energy transition, but the
Distribu(on+of+resources+• Cheap&electricity&to&favored§ors&• Extension&of&supply&to&rural&areas&• Cheap&electricity&to&residen6al§or&• Rent&seeking&opportuni6es&to&elites&
Poli(cal+ins(tu(ons+• CP&dominant&&• CP&posi6on&maintained&by&
performance&legi6macy&
Techno4economic+paradigm+• Centralized&ver6cally&integrated&na6on&u6lity&• Hydro?dominated&&• State?owned&u6lity&(EVN)&• Limited&IPPS,§or&compe66on&
Sector+economic+(and+technical)+performance+• Expansion&of&na6onal&grid&• Expansion&of&capacity&and&
genera6on&• Reliability&and&shortage&
issues&• Significant&losses&(but&
obscured&by&gap&between&SRMC&and&LRMC)&
Poli(cal+power+• Compe66ve&clien6sm&• Close&patronage&networks&between&CP&
and&industrial&elites&• EVN&and&energy¶statals&represent&
concentra6on&of&power&• Limited&CP&control&of&elites&

260
willingness of societies to bear the cost, which will be significant no matter what the extent of
liberalisation.” (Pollitt 2012: 8)
All the more so in Vietnam, where oversight is lacking, public trust in state institutions
limited and corruption reputedly commonplace. Notwithstanding some low-hanging fruit
(such as more efficient power plant operations, reducing T&D losses and end-user
energy efficiency), climate change mitigation will not be cheap, and in the long term
energy users will need to pay for it. To the extent that mitigation is likely to imply higher
short-term costs in Vietnam, it is likely to be untenable unless external funding sources
(such as carbon finance and clean technology funding) are made available to off-set the
cost increases implied by mitigation efforts.
Nevertheless, there may be scope for more aggressive climate change mitigation in the
ESI to the extent it is in line with existing vested interests. In the case of the nuclear
option EVN has a clear interest in promoting this technology despite its higher cost. If
other low-carbon technologies could find similar incumbent constituencies which enjoy
political influence, and whose influence they could serve to enhance (e.g. domestic
technology suppliers), or if such interest groups could be created through the creation of
rental streams associated with climate change mitigation then mitigation may be possible,
even with raised end-user tariffs. However, as with industrial policy, such rents for
climate change mitigation would require significant government capability to effectively
monitor these rents. Given current conditions in Vietnam this would not seem to be a
feasible approach. In the future, with stronger central institutions and the power of the
parastatals in particular curbed such an approach may be feasible, at the moment this
seems a distant prospect.
7.6 Caveats and limitations
Political economy processes are notoriously complex and difficult processes to study.
Identifying the implied causal role played by implied concentrations of power means
direct evidence is rarely available, and any account we are able to construct is bound to
be significantly underdetermined by the available evidence. In the political context of
Vietnam, formal institutions and processes are opaque, ostensively public information is
generally not publicly available and stakeholders feel unable to speak freely relating to
political issues. Moreover, the scope and importance of informal processes and the
political economy artefacts associated with them such as patronage networks and the
261
flow of rents, by their nature are not available to the researcher. This means that it is
difficult deriving a robust basis for empirical claims about the political economy process,
these difficulties are widely recognised by researchers on Vietnam (Gainsborough 2010).
The upshot of all this is that the standard of proof regarding the empirical claims made
here is necessarily lower than for studies, which have ample empirical evidence
connecting well-defined, causally contiguous phenomena. We have sought to address this
through the use of a longitudinal case study of the ESI, by drawing on a variety of
sources and data to generate a convincing narrative, and seeking verification of the
narrative from key informants with in-depth knowledge of the sector. There are clear
dangers with this approach. But we have not sought to obscure the uncertainty regarding
key elements of the account. We have also sought to guard against over-interpretation of
the evidence.
Finally, we feel the empirical difficulties of this approach are greatly outweighed by the
value of the resarch. That a research question presents a topic that is difficult to address
does not mean that it should not be investigated. In this case, we approached a topic (the
political economy of technological change) that is highly relevant to issues of climate
change mitigation, but has received very little attention. Similarly, in the case of Vietnam,
we approach a topic (the political economy of the ESI), which has not really been
investigated, but is critically important to understanding the scope for mitigation policy.
Furthermore, while some objects of research are amenable to division into discrete, easily
tractable questions, this is not always the case. As Simon’s (1962) work on hierarchical
complexity served to emphasise, even in complex systems relatively independent
subsystems are likely to develop (Chapter 2, section 2.4.2), these may be amenable to
separate study. The ESI and its relationship to the national policy are a different
proposition, and as we have tried to show in this thesis, when considering system wide
technological change we need an approach that will enable us to capture the fundamental
dynamics of such a process, this necessarily incorporates system wide issues and the
national polity.
7.7 Recommendations for future study
The research leaves many questions unanswered and many others requiring the
development of a more robust evidence base. Key recommendations for future research
262
relate to more general theoretical issues, research on the ESI and other technological
systems, and research on Vietnam in particular. First, considering theory, there is a
considerable amount of work needed in linking evolutionary economic approaches to
political theory, specifically as relates to technological change. We have identified
possible reasons for better considering the linkages between political economy and
technological change but it remains under theorised. In particular, as it relates to general-
purpose technologies and systematic technological change. In a similar vein, there is a
need for evolutionary economists to engage more seriously with the issue of economic
development.
Second, concerning research on technological systems, there is a serious need for the
development of more country case studies exploring the linkages between technological
systems and change in these systems and the political economy context. Emerging
economies which are seeing rapid development of technological systems would be good
candidates for study (such as Turkey, Colombia, Nigeria, Indonesia etc.). This is
especially urgent as we have argued the political economy context is likely to determine
to a significant extent the possibility for serious climate change mitigation efforts. Finally,
as regards Vietnam, with a few notable exceptions (Fforde and Gainsborough being
prime examples), there is a paucity of work looking at linkages between the political
economy and the process of development. Given Vietnam’s experience of rapid
development and its popularity amongst donors as a glib example of a developmentally
effective state, there is a need to understand the dynamics of its development – and the
political economy of its development better.

263
Bibliography AB Bank, 2007, AB Bank Annual Report, Hanoi, Vietnam Abramovitz, M., 1986, Catching Up, Forging Ahead, and Falling Behind, Journal of Economic History, 46(02), pp. 385-406. Abramson, J., Press Release, 2011, AES Closes $1.55 Billion in Non-Recourse Financing for the Mong Duong II Power Plant in Vietnam; Proceeds With Construction, 1 September 2011. Abusharkh, S., Arnold, R., Kohler, J., Li, R., Markvart, T., Ross, J., Steemers, K., Wilson, P. & Yao, R., 2006, Can microgrids make a major contribution to UK energy supply? Renewable and Sustainable Energy Reviews, 10(2), pp. 78-127. Acemoglu, D., Johnson, S. & Robinson, J.A., 2000, The colonial origins of comparative development: An empirical investigation. Paper, Department of Economics, MIT, retrieved from http://web.mit.edu/daron/www/colonial8comp.pdf on 10 June 2012 Acemoglu, D., Johnson, S. & Robinson, J.A., 2001, Reversal of fortune: Geography and institutions in the making of the modern world income distribution. Paper, Department of Economics, MIT, retrieved from http://economics.mit.edu/files/4127 on 10 June 2012 Acemoglu, D., Johnson, S. & Robinson, J.A. 2005, Institutions as a fundamental cause of long-run growth, in Handbook of economic growth, Elsevier, pp. 385-472. Adam, C. & Dercon, S., 2009, The political economy of development: an assessment, Oxf Rev Econ Policy, 25(2), pp. 173-89. Adams, C. 2012, Public debt sustainability and fiscal vulnerability in Viet Nam, in B. Ferrarini, R. Jha & A. Ramayandi (eds), Public Debt Sustainability in Developing Asia, Asian Development Bank and Routledge, London and New York. ADB, 2001, Technical Assistance (financed by the Government of France) to the Socialist Republic of Viet Nam for the Road Map for Power Sector Reform (TAR:VIE 34343). Manila, Phillippines. ADB, 2003, Special Evaluation Study of Cost Recovery in the Power Sector. Manila, Phillippines. ADB, 2004, Technical assistance audit report on advisory technical assistance for power sector institutional strengthening in Viet Nam. Manila, Philippines. ADB, 2007, Viet Nam: Loan and Political Risk Guarantee to the Phu My 3 Power Project. Manila, Philippines. ADB, 2008, Loan and Political Risk Guarantee under the Coguarantee Program VIE: Phu My 2.2 Power Project. Manila, Philippines. ADB & AFD, 2012, Assessment of Public-Private Partnerships in Viet Nam. Constraints and Opportunities. Manila, Philippines.

264
Aghion, P. & Howitt, P., 2007, Capital, innovation, and growth accounting, Oxford Review of Economic Policy, 23(1), pp. 79-93. Aidt, .S., 2009, Corruption, institutions, and economic development, Oxford Review of Economic Policy, 25(2), pp. 271-91. Allen, R.C., 2012, Backward into the future: The shift to coal and implications for the next energy transition, Energy Policy, 50, pp. 17-23. Altinbilek, D. et al, 2007, World Energy Congress Rome 2007, Hydropower's contribution to energy security. Rome, Italy. American Chamber of Commerce Vietnam, 2009, Vietnam's Electricity Pricing Policy. Hanoi, Vietnam. Amsden, A.H., 1992, Asia's next giant: South Korea and late industrialization, Oxford University Press, USA. Anderson, D. & Winne, S., 2007, Energy system change and external effects in climate change mitigation, Environment and Development Economics, 12, pp. 359-78. Andrews, M., 2008, The Good Governance Agenda: Beyond Indicators without Theory, Oxford Development Studies, 36(4), pp. 379-407. Ansar, J. & Sparks, R., 2009, The experience curve, option value, and the energy paradox, Energy Policy, 37(3), pp. 1012-20. Arrow, K.J., 1962, The economic implications of learning by doing, The review of economic studies, 29(3), pp. 155-73. Arthur, W.B., 1989, Competing Technologies, Increasing Returns, and Lock-In by Historical Events, The Economic Journal, 99(394), pp. 116-31. Arthur, W.B., 1994, Inductive Reasoning and Bounded Rationality, The American Economic Review, 84(2), pp. 406-11. Arthur, W.B., 1996, Increasing returns and the new world of business, Harvard Business Review, 74(4), pp. 100-110. Asian Power, 2009, Laykin, J., Vietnam promises promises, 24, April 2009. Retrived from http://www.ippfpowerasia.com/artitcles/pdf/published/Vietnam%20promises%20promises%20(Jan-Feb2009).pdf on 20 November 2011 Asian Power, 2012, Vietnam establishes 3 power generation firms, 13 June 2012. Asian Power, 2012, Tordesillas, C. Vietnam, Russia cooperate in nuclear power project. 12 December 2012. Asia Times, 2012, Vietnam power needs unresolved by sacking. 16 March 2012.
265
Asif, M. & Muneer, T., 2007, Energy supply, its demand and security issues for developed and emerging economies, Renewable and Sustainable Energy Reviews, 11(7), pp. 1388-413. Asoni, A., 2008, Protection Of Property Rights And Growth As Political Equilibria, Journal of Economic Surveys, 22(5), pp. 953-87. Babbar, S., 2003, IDA Guarantee supports first competitively-bid private power project in Vietnam. World Bank, Washington DC, USA Bacon, R.W., 1995, Privatization and reform in the global electricity supply industry, Annual Review of Energy and the Environment, 20(1), pp. 119-43. Bacon, R.W. & Besant-Jones, J., 2001, Global Electric Power Reform, Privatization, and Liberalization of the Electric Power Industry in Developing Countries, Annual Review of Energy and Environment, 26, pp. 331-59. Bardhan, P. 1995, Chapter 46: The contributions of endogenous growth theory to the analysis of development problems: an assessment, in Handbook of Development Economics, Elsevier, pp. 2983-98. Barnett, W., 2004, Dimensions and economics: some problems, Quarterly Journal of Austrian Economics, 7(1), pp. 95-104. Baruya, P., 2010, Prospects for coal and clean coal technologies in Vietnam. IEA Clean Coal Centre, London, UK. Basberg, B., 1987, Patents and the measurement of technological change: A survey of the literature , Research Policy, 16(1987), pp. 131 - 147. Bazilian, M., Hobbs, B.F., Blyth, W., MacGill, I. & Howells, M., 2011, Interactions between energy security and climate change: A focus on developing countries, Energy Policy. Bazzi, S. & Clemens, M., 2009, Blunt instruments: On establishing the causes of economic growth. Working Paper 171, Centre for Global Development, Washington D.C., USA. Becheikh, N., Landry, R. & Amara, N., 2006, Lessons from innovation empirical studies in the manufacturing sector: A systematic review of the literature from 1993–2003, Technovation, 26(5-6), pp. 644-64. Beeson, M. & Pham, H.H., 2012, Developmentalism with Vietnamese Characteristics: The Persistence of State-led Development in East Asia, Journal of Contemporary Asia, 42(4), pp. 539-59. Bejan, A., Lorente, S., Yilbas, S. & Sahin, Z., 2011, The effect of size on efficiency: Power plants and vascular designs, International Journal of Heat and Mass Transfer, 54(7-8), pp. 1475-81.
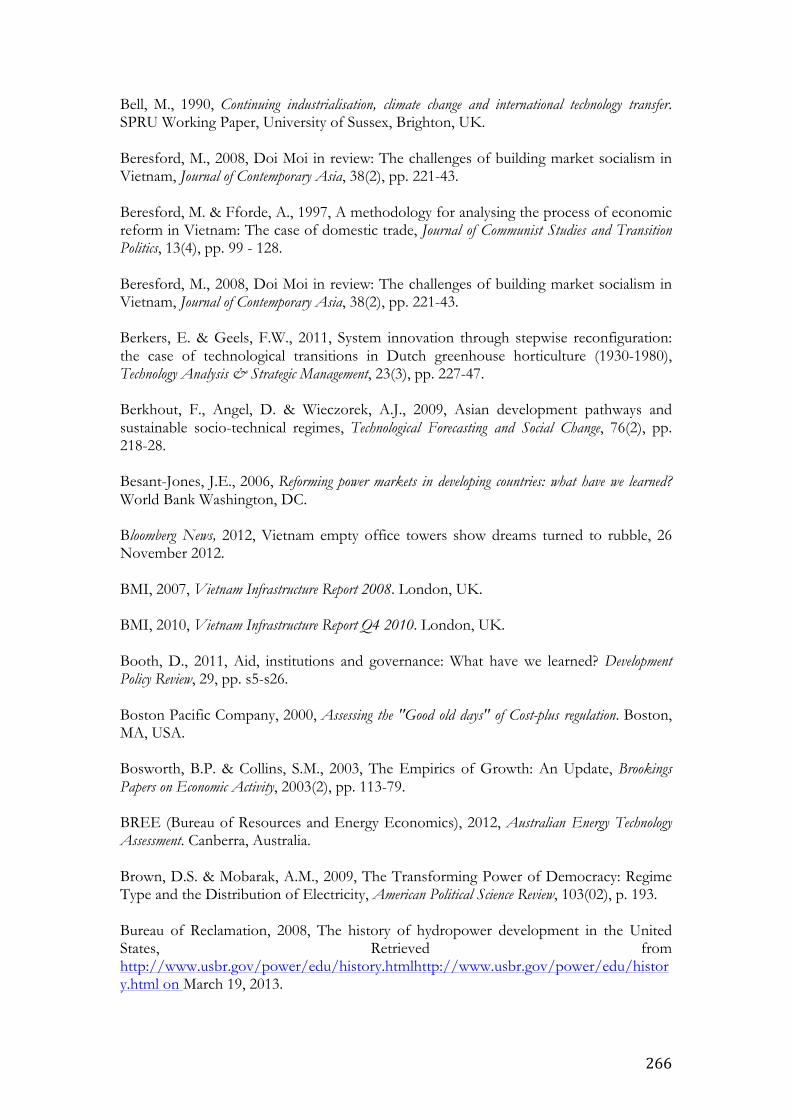
266
Bell, M., 1990, Continuing industrialisation, climate change and international technology transfer. SPRU Working Paper, University of Sussex, Brighton, UK. Beresford, M., 2008, Doi Moi in review: The challenges of building market socialism in Vietnam, Journal of Contemporary Asia, 38(2), pp. 221-43. Beresford, M. & Fforde, A., 1997, A methodology for analysing the process of economic reform in Vietnam: The case of domestic trade, Journal of Communist Studies and Transition Politics, 13(4), pp. 99 - 128. Beresford, M., 2008, Doi Moi in review: The challenges of building market socialism in Vietnam, Journal of Contemporary Asia, 38(2), pp. 221-43. Berkers, E. & Geels, F.W., 2011, System innovation through stepwise reconfiguration: the case of technological transitions in Dutch greenhouse horticulture (1930-1980), Technology Analysis & Strategic Management, 23(3), pp. 227-47. Berkhout, F., Angel, D. & Wieczorek, A.J., 2009, Asian development pathways and sustainable socio-technical regimes, Technological Forecasting and Social Change, 76(2), pp. 218-28. Besant-Jones, J.E., 2006, Reforming power markets in developing countries: what have we learned? World Bank Washington, DC. Bloomberg News, 2012, Vietnam empty office towers show dreams turned to rubble, 26 November 2012. BMI, 2007, Vietnam Infrastructure Report 2008. London, UK. BMI, 2010, Vietnam Infrastructure Report Q4 2010. London, UK. Booth, D., 2011, Aid, institutions and governance: What have we learned? Development Policy Review, 29, pp. s5-s26. Boston Pacific Company, 2000, Assessing the "Good old days" of Cost-plus regulation. Boston, MA, USA. Bosworth, B.P. & Collins, S.M., 2003, The Empirics of Growth: An Update, Brookings Papers on Economic Activity, 2003(2), pp. 113-79. BREE (Bureau of Resources and Energy Economics), 2012, Australian Energy Technology Assessment. Canberra, Australia. Brown, D.S. & Mobarak, A.M., 2009, The Transforming Power of Democracy: Regime Type and the Distribution of Electricity, American Political Science Review, 103(02), p. 193. Bureau of Reclamation, 2008, The history of hydropower development in the United States, Retrieved from http://www.usbr.gov/power/edu/history.htmlhttp://www.usbr.gov/power/edu/history.html on March 19, 2013.
267
Cantwell, J., Dunning, J.H. & Lundan, S.M., 2010, An evolutionary approach to understanding international business activity: The co-evolution of MNEs and the institutional environment, Journal of International Business Studies, 41(4), pp. 567-86. Caselli, F., 2005, Accounting for cross-country income differences, Handbook of economic growth, 1, pp. 679-741. Cesaratto, S., 2010, Endogenous Growth Theory Twenty Years on: A Critical Assessment, Bulletin of Political Economy, 4(1), pp. 1 - 30. Chandler, A.D., 1992, Organizational Capabilities and the Economic History of the Industrial Enterprise, The Journal of Economic Perspectives, 6(3), pp. 79-100. Chandler, A.D., Amatori, F. & Hikino, T., 1999, Big business and the wealth of nations, Cambridge Univ Press, Cambridge, UK. Chang, H.J., 1993, The political economy of industrial policy in Korea, Camb. J. Econ., 17(2), pp. 131-57. Chang, H.J., 1994, State, institutions and structural change, Structural Change and Economic Dynamics, 5(2), pp. 293-313. Chang, H.J., 1996, The Political Economy of Industrial Policy, Macmillan, London. Chang, H.J., 2007, Institutional Change and Economic Development, United Nations University Press and Anthem Press, New York and London. Chang, H.J., 2011, Institutions and economic development: theory, policy and history, Journal of Institutional Economics, 7(04), pp. 473-98. Chao, H.P., Oren, S. & Wilson, R. 2007, Re-evaluation of vertical integration and unbundling in restructured electricity markets, in P Sioshansi (ed), Competitive Electricity Markets: Design, Implementation, and Performance. Elsevier, Oxford, UK. Cheon, A. & Urpelainen, J., 2012, Oil prices and energy technology innovation: An empirical analysis, Global Environmental Change, 22(2), pp. 407-17. Cheshier, S. & Penrose, J., 2007, Top 200: Industrial strategies of Viet Nam's largest firms. United Nations Development Program, Policy Discussion Paper, Hanoi, Vietnam. Chick, M., 2011, The 3 Rs: Regulation, risk and responsibility in British utilities since 1945, Business History, 53(5), pp. 747-60. Chidamber, S.R. & Kon, H.B., 1994, A Research Retrospective Of Innovation Inception And Success - The Technology-Push, Demand-Pull Question, International Journal of Technology Management, 9(1), pp. 94-112. Christensen, C.M., 1999, Innovation and the general manager, Irwin/McGraw-Hill, Cambridge, M.A., USA.
268
Christensen, L.R. & Greene, W.H., 1976, Economies of scale in US electric power generation, The Journal of Political Economy, pp. 655-76. Cimoli, M., Dosi, G. & Stiglitz, J.E. 2009, The Political Economy of Capabilities Accumulation: The Past and Future of Policies for Industrial Development, in M Cimoli, G Dosi & JE Stiglitz (eds), Industrial Policy and Development: The Political Economy of Capabilities Accumulation, Oxford University Press, Oxford. Clifton, J., Lanthier, P. & Schröter, H., 2011, Regulating and deregulating the public utilities 1830–2010, Business History, 53(5), pp. 659-72. Cling, J.P., Razafindakoto, M. & Roubaud, F., 2009, Desperately seeking model countries: The World Bank in Vietnam. Economics Papers from University Paris Dauphine, Paris, France. Cohen, A.J. & Harcourt, G.C., 2003, Retrospectives: whatever happened to the Cambridge capital theory controversies? The Journal of Economic Perspectives, 17(1), pp. 199-214. Collier, P., 2003, Breaking the conflict trap: Civil war and development policy, World Bank Policy Research Report, World Bank, Washington D.C., USA. Commander, S., 2012, A Guide to the Political Economy of Reforming Energy Subsidies. Policy Paper No. 52, IZA Policy Papers, Bonn, Germany. Commons, J.R., 1931, Institutional economics, The American Economic Review, pp. 648-57. Conaty, S., 2010, Vietnam: Examining Current IPP Trends and Issues, Infrastructure Journal (May 2010). de Coninck, H., Fischer, C., Newell, R.G. & Ueno, T., 2008, International technology-oriented agreements to address climate change, Energy Policy, 36(1), pp. 335-56. Coopersmith, J., 1993, Soviet electrification: the roads not taken, Technology and Society Magazine, IEEE, 12(2), pp. 13-20. Correljé, A. & van der Linde, C., 2006, Energy supply security and geopolitics: A European perspective, Energy Policy, 34(5), pp. 532-43. Cosslette & Shaw, 1987, Vietnam industry. Electronic Article. Retrieved March 20, 2013, fromlcweb2.loc .gov/c gi-bin/que ry/r? frd/c stdy:@fie ld(DOCID+ vn0075) Cowan, R., 1990, Nuclear Power Reactors - A Study in Technological Lock-in, Journal of Economic History, 50(3), pp. 541-67. Crafts, N., 2010, Cliometrics and technological change: a survey, European Journal of the History of Economic Thought, 17(5), pp. 1127-47. Dagdeviren, H., 2009, Limits to competition and regulation in privatized electricity markets, Annals of Public and Cooperative Economics, 80(4), pp. 641-64.
269
Daiss, T., 2012, Cracks Appear in Vietnam's Economic Miracle, Energy Tribune, 2 October 2012. Retrieved from http://www.energytribune.com/20182/cracks-appear-in-vietnams-economic-miracle-3#sthash.LiAxfLz9.dpbs on 2 March 2013. Damian, M., 1992, Nuclear power: The ambiguous lessons of history, Energy Policy, 20(7), pp. 596-607. Dan Tri, 2011, EVN’s huge debts may drive up electricity prices. 6 August 2011. Dapice, D., 2008, Choosing success: The lessons of East and Southeast Asia and Vietnam’s future. A Policy Framework for Vietnam’s Socio-economic Development 2011 – 2020. Policy Paper. John F. Kennedy School of Government, Harvard University, Cambridge, M.A., USA. Das, S.B. & Shrestha, O.L., 2009, Vietnam: Further challenges in 2009, Asean Economic Bulletin, 26(1), pp. 1-10. David, P.A., 1985, Clio and the Economics of QWERTY, The American Economic Review, 75(2), pp. 332-7. David, P.A. & Bunn, J.A., 1988, The economics of gateway technologies and network evolution: Lessons from electricity supply history, Information Economics and Policy, 3(2), pp. 165-202. Deese, D.A., 1979, Energy: economics, politics, and security, International Security, 4(3), pp. 140-53. Delmon, J., 2009, Private sector investment in infrastructure: Project finance, PPP projects and risks, PPIAF and World Bank, Washington, D.C., USA.. Deloitte, 2013, Vinh Son - Song Hinh Hydropower Joint Stock Company Audited Financial Statements For the year ended 31 December 2012. Retrieved from http://www.vshpc.evn.com.vn/Portals/0/userfiles/vshpc/BCTC%20kiem%20toan%20hop%20nhat%202012.TAnh.pdf on 22 May 2013. Denison, E.F., 1962, United States Economic Growth, The Journal of Business, 35(2), pp. 109-21. Devine, W.D., 1983, From Shafts to Wires: Historical Perspective on Electrification, Journal of Economic History, 43(02), p. 347. Do, T. & Sharma, D., 2011, Vietnam's energy sector: A review of current energy policies and strategies, Energy Policy, 39(10), pp. 5770-7. Dobb, M., 1949, Soviet economic development since 1917.The Economic Journal Vol. 60, No. 237 (Mar., 1950), pp. 122-126 Dollar, D. & Kraay, A., 2002, Growth is Good for the Poor, Journal of Economic Growth, 7(3), pp. 195-225.

270
Dosi, G., 1982, Technological paradigms and technological trajectories: A suggested interpretation of the determinants and directions of technical change, Research Policy, 11, pp. 147 - 162. Dosi, G., 1988, Sources, Procedures, and Microeconomic Effects of Innovation, Journal of Economic Literature, XXVI, pp. 1120 - 1171. Dosi, G., 1997, Opportunities, Incentives and the Collective Patterns of Technological Change, The Economic Journal, 107(444), pp. 1530-47. Dosi, G., 2007, Statistical Regularities in the Evolution of Industries. A Guide through some Evidence and Challenges for the Theory, Perspectives on innovation, pp. 153-86. Dosi, G., 2011, Economic Coordination and Dynamics: Some Elements of an Alternative “Evolutionary” Paradigm. Institute for New Economic Thinking Discussion Paper. Retrieved from http://www2.econ.iastate.edu/tesfatsi/EconomicCoordinationAndDynamics.GDosi2012.INET.pdf on 12 June 2012. Dosi, G. & Nelson, R.R., 1994, An introduction to evolutionary theories in economics, Journal of Evolutionary Economics, 4(3), pp. 153-72. Dosi, G., Cimoli, M. & Stiglitz, J.E., 2009, Industrial Policy and Development. The Political Economy of Capabilities Accumulation, Oxford University Press, New York. Do, T.M., Analysis of future energy pathways for Vietnam (2011). PhD Thesis, Faculty of Engineering and Information Technology University of Technology, Sydney. Dry, E. & Vecchi, S.E., 2000, Bringing a BOT Project to Closure in Vietnam: Problems and Prospects, Journal of Project Finance, 6(1). DTI News, 2010, Ministry wants ineffective hydropower projects shelved, 24 December 2010. DTI News, 2012, PM requests that EVN withdraw from non-core businesses, 27 November 2012. DTI News, 2013, Obstacles to competitive electricity market, 5 March 2013. Dubash, N.K. & Morgan, B., 2012, Understanding the rise of the regulatory state of the South, Regulation & Governance. Volume 6, Issue 3, pages 261–281, September 2012. Dung 2007, Japanese ODA for Vietnam, in D. D. Dinh & G. Mills (eds), Vietnam and Africa Comparative lessons and mutual opportunities, The Social Science Publishers, Hanoi. Dung, H.T. & Tuan, N.A., 2011, Science and Technology, 2011 EPU-CRIS International Conference, Vietnam power system: Overview and challenges. pp. 1-5. Dunkerley, J., 1995, Financing the energy sector in developing countries: Context and overview, Energy Policy, 23(11), pp. 929-39.
271
Dutz, A.D. & Sharma, S., 2012, Green Growth, Technology and Innovation. World Bank Policy Research Working Paper No. 5932, World Bank, Washington D.C., USA. East Asia Forum, 2009, Quang, D.H., Vietnam: a switch from growth to stability, 20 January 2009. East Asia Forum, 2013, Pincus, J., Vietnam's need for deeper structral reform, 7 April 2013. Easterly, W. & Levine, R., 2001, What have we learned from a decade of empirical research on growth? It's Not Factor Accumulation: Stylized Facts and Growth Models, The World Bank Economic Review, 15(2), pp. 177-219. Edquist, C., 2000, Systems of Innovation: growth, competitiveness and employment, Edward Elgar, London, UK. Electricity Today, 2006, Baird, S. The future of electricity, 2006, pp. 9 - 11. Elzen, B., Geels, F.W. & Green, K., 2004, System innovation and the transition to sustainability: theory, evidence and policy, Edward Elgar, London, UK. Energy Tribune, 2013, Daiss, T., Vietnam Inks Deal for Second Oil Refinery Amid Growing Energy Consumption, 13 February 2013. Eng, K., 2012, Pha Lai Thermal Power. Maybank, Company Update, Hanoi, Vietnam. Retrieved from http://www.docin.com/p-485502586.html on 3 March 2013. England, S. & Kammen, D.M., 1993, Energy Resouces and Development in Vietnam, Annual Review of Energy and Environment(18), pp. 137-67. ERAV, 2008, Master plan on competitive power production market and restructure of the electricity industry for the development of the electric market. Policy Document, MoIT, Hanoi, Vietnam. ERAV, 2010, Power Market Developments in Vietnam (Presentation), Hanoi, Vietnam. Erdogdu, 2010, Electricity Market Reform: Lessons for developing countries. MPRA Paper No. 27317 available at http://mpra.ub.uni-muenchen.de/27317/. Erdogdu, E., 2011a, The impact of power market reforms on electricity price-cost margins and cross-subsidy levels: A cross country panel data analysis, Energy Policy, 39(3), pp. 1080-92. Erdogdu, E., 2011b, What happened to efficiency in electricity industries after reforms? Energy Policy, 39(10), pp. 6551-60. ESMAP, 1995, Power Sector Reform and Restructuring in Viet Nam. Final Report to the Steering Committee.Report No. 174/95. Hanoi, Vietnam. ESMAP, 1999, Global Energy Sector Reform in Developing Countries: A Scorecard. Report 219/99, Washiongton D.C., USA.
272
Estache, A., 2004, Emerging infrastructure policy issues in developing countries - a survey of the recent economic literature. Background Paper for the October 2004 Berlin meeting of the POVNET Infrastructure Working Group, available at http://elibrary.worldbank.org/doi/book/10.1596/1813-9450-3442. Estache, A. & Goicoechea, A., 2005, How widespread were private investment and regulatory reform in infrastructure utilities during the 1990s? World Bank Policy Research Working Paper (3595). Evans, P., 1998, Transferable lessons? Re-examining the institutional prerequisites of East Asian economic policies, The Journal of Development Studies, 34(6), pp. 66-86. Evans, P., 2006, Extending the ‘institutional’ turn: Property, politics and development trajectories, WIDER Working Papers, UNU-WIDER, available at http://www.wider.unu.edu/publications/working-papers/research-papers/2006/en_GB/rp2006-113/ EVN, 2012, The turning point in history, Vietnam Electricity Group History. Retrieved August 15, 2012, www.evn.com.vn/Home /Detail/tabid/84/ItemId/1140/Vie w/2/Cate Id/141/language /vi-VN/De fault.aspx EVN, 2006, Vietnam Electricity Annual Report 2005 - 2006. Hanoi, Vietnam EVN, 2009a, Điện lúc Việt nam đi lên cùng đặt nước (Electricity Vietnam supplies the country). Hanoi, Vietnam. EVN, 2009b, Điện lúc Việt nam đi lên cùng đặt nước (Electricity Vietnam supplies the country). Hanoi, Vietnam EVN Hanoi, 2012, History of Power Corporation Hanoi, Retrieved August 15, 2012, evnhanoi.vn/lichsuphattrien/17-Lich-su-phat-trien.aspx EVN HCMC, 2012, Process of formation and development of the company, Ho Chi Minh Power Company. Website retrieved from http://english.hcmpc.com.vn/customer/gioithieu.aspx?id=7 on 12 August 2013. Felipe, J. & McCombie, J.S.L., 2007, Is a theory of total factor productivity really needed? Metroeconomica, 58(1), pp. 195 - 229. Felipe, J. & McCombie, J.S.L., 2010, What is wrong with aggregate production functions. On Temple’s ‘aggregate production functions and growth economics’, International Review of Applied Economics, 24(6), pp. 665-84. Ferguson, R., Wilkinson, W. & Hill, R., 2000, Electricity use and economic development, Energy Policy, 28(13), pp. 923-34. Ferrey, S., 2009, The Missing International Link for Carbon Control, The Electricity Journal, 22(3), pp. 17-28. Fforde, A., 2005, Persuasion: Reflections on economics, data, and the ‘homogeneity assumption’, Journal of Economic Methodology, 12(1), pp. 63-91.
273
Fforde, A., 2007, Vietnamese State Industry and the Political Economy of Commercial Renaissance: Dragon's tooth or curate's egg? Chandos, Oxford, UK. Fforde, A., 2009, Luck, policy or something else entirely? Vietnam’s economic performance in 2009 and prospects for 2010, Journal of Current Southeast Asian Affairs, 28(4), pp. 71-94. Fforde, A., 2010, Rethinking the Political Economy of Conservative Transition: The Case of Vietnam, Journal of Communist Studies and Transition Politics, 26(1), pp. 126-46. Fforde, A., 2011, Policy Recommendations As Spurious Predictions: Toward A Theory Of Economists’ ignorance, Critical Review, 23(1-2), pp. 105-15. Fforde, A., 2012, Vietnam in 2011, Asian Survey, 52(1), pp. 176-85. Fforde, A., 2013, Vietnam in 2012: The End of the Party, Asian Survey, 53(1), pp. 101-8. Fforde, A. & De Vylder, S., 1996, From plan to market: The economic transition in Vietnam, Westview Press, Boulder, Colorado, USA. Financial Times, 2010, Steinglass, M., Vietnam power shortages fuel calls to break up monopoly, 28 June 2010. Financial Times, 2011, Vietnam: grappling with change, 24 November 2011. Financial Times, 2012, Vietnam uncovers $1.5 billion of ‘wrongful spending’, 6 April 2012. Fine, B., 2000, Critical survey. Endogenous growth theory: a critical assessment, Cambridge Journal of Economics, 24(2), pp. 245-65. Finger, M. & Künneke, R., 2006, The need for coherence between institutions and technology in liberalized infrastructures: the case of network unbundling in electricity and railways. Paper presented on the 5th Conference on Applied Infrastructure Research Sustainable European Infrastructure Financing under the Conditions of Competition, Environmental Concerns, and EU-Enlargement. Berlin, 6-7 October, 2006. Finon, D., 2013, The transition of the electricity system towards decarbonization: the need for change in the market regime, Climate Policy, 13(sup01), pp. 130-45. Flachaire, E., Garcia-Penalosa, C. & Konte, M., 2011, Political versus Economic Institutions in the Growth Process, CESifo Working Paper Series No. 3432. Forbes, 2010, Oxford Analytica, Vietnam's Power Surge, 21 June 2010. Forester, J., 1984, Bounded Rationality and the Politics of Muddling Through, Public Administration Review, 44(1), pp. 23-31. Fouquet, R. & Pearson, P.J., 2012, Past and prospective energy transitions: Insights from history, Energy Policy, 50, pp. 1-7.
274
Foxon, T., 2003, Inducing innovation for a low-carbon future: drivers, barriers and policies. A report for The Carbon Trust available at http://www.esrc.ac.uk/my-esrc/grants/RES-332-25-0009/outputs/Read/becb927f-fa26-4a56-bd13-1692616d1e26 Foxon, T., 2006, Bounded rationality and hierarchical complexity: Two paths from Simon to ecological and evolutionary economics, Ecological Complexity, 3(4), pp. 361-8. Foxon, T.J., 2010, A coevolutionary framework for analysing a transition to a sustainable low carbon economy (Working Paper No.31), p. 27. Foxon, T.J., 2011, A coevolutionary framework for analysing a transition to a sustainable low carbon economy, Ecological Economics, 70(12), pp. 2258-67. Freeman, C., 1995, The ‘National System of Innovation’ in historical perspective, Cambridge Journal of Economics, 19(1), pp. 5-24. Freeman, C., 2002, Continental, national and sub-national innovation systems-complementarity and economic growth, Research Policy, 31(2), pp. 191-211. Freeman, C. & Perez, C. 2000, Structural crises of adjustment, business cycles and investment behaviour, in BR Martin & P Nightingale (eds), The political economy of science, technology, and innovation, Edward Elgar Publishing Limited, Cheltenham, p. 321. Freshfields Bruckhaus Deringer, 2005, Vietnam–new electricity law. Breifing report, Hanoi, Vietnam. Friedman, M., 1953, The methodology of positive economics, The Philosophy of economics: an anthology, 2, pp. 180-213. Fritz, V. & Menocal, A.R., 2007, Developmental states in the new millennium: Concepts and challenges for a new aid agenda, Development Policy Review, 25(5), pp. 531-52. Fu, X., Pietrobelli, C. & Soete, L., 2011, The Role of Foreign Technology and Indigenous Innovation in the Emerging Economies: Technological Change and Catching-up, World Development, 39(7), pp. 1204-12. Gainsborough, M., 2002, Understanding communist transition: Property rights in Ho Chi Minh City in the late 1990s, Post-Communist Economies, 14(2), pp. 227-43. Gainsborough, M., 2005, Between exception and rule - Ho Chi Minh City's political economy under reform, Critical Asian Studies, 37(3), pp. 363-90. Gainsborough, M., 2007, Globalisation and the state revisited: A view from provincial Vietnam, Journal of Contemporary Asia, 37(1), pp. 1-18. Gainsborough, M., 2009a, The (Neglected) Statist Bias and the Developmental State: the case of Singapore and Vietnam, Third World Quarterly, 30(7), pp. 1317-28. Gainsborough, M., 2009b, Privatisation as State Advance: Private Indirect Government in Vietnam, New Political Economy, 14(2), pp. 257-74.
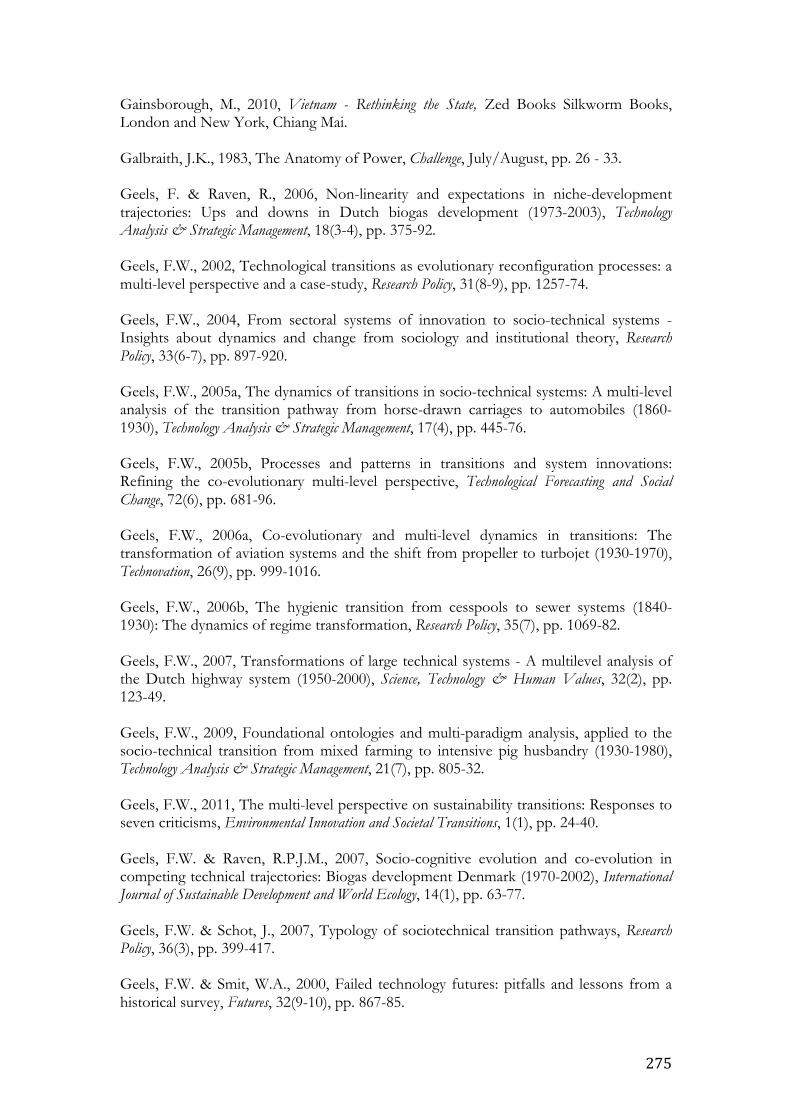
275
Gainsborough, M., 2010, Vietnam - Rethinking the State, Zed Books Silkworm Books, London and New York, Chiang Mai. Galbraith, J.K., 1983, The Anatomy of Power, Challenge, July/August, pp. 26 - 33. Geels, F. & Raven, R., 2006, Non-linearity and expectations in niche-development trajectories: Ups and downs in Dutch biogas development (1973-2003), Technology Analysis & Strategic Management, 18(3-4), pp. 375-92. Geels, F.W., 2002, Technological transitions as evolutionary reconfiguration processes: a multi-level perspective and a case-study, Research Policy, 31(8-9), pp. 1257-74. Geels, F.W., 2004, From sectoral systems of innovation to socio-technical systems - Insights about dynamics and change from sociology and institutional theory, Research Policy, 33(6-7), pp. 897-920. Geels, F.W., 2005a, The dynamics of transitions in socio-technical systems: A multi-level analysis of the transition pathway from horse-drawn carriages to automobiles (1860-1930), Technology Analysis & Strategic Management, 17(4), pp. 445-76. Geels, F.W., 2005b, Processes and patterns in transitions and system innovations: Refining the co-evolutionary multi-level perspective, Technological Forecasting and Social Change, 72(6), pp. 681-96. Geels, F.W., 2006a, Co-evolutionary and multi-level dynamics in transitions: The transformation of aviation systems and the shift from propeller to turbojet (1930-1970), Technovation, 26(9), pp. 999-1016. Geels, F.W., 2006b, The hygienic transition from cesspools to sewer systems (1840-1930): The dynamics of regime transformation, Research Policy, 35(7), pp. 1069-82. Geels, F.W., 2007, Transformations of large technical systems - A multilevel analysis of the Dutch highway system (1950-2000), Science, Technology & Human Values, 32(2), pp. 123-49. Geels, F.W., 2009, Foundational ontologies and multi-paradigm analysis, applied to the socio-technical transition from mixed farming to intensive pig husbandry (1930-1980), Technology Analysis & Strategic Management, 21(7), pp. 805-32. Geels, F.W., 2011, The multi-level perspective on sustainability transitions: Responses to seven criticisms, Environmental Innovation and Societal Transitions, 1(1), pp. 24-40. Geels, F.W. & Raven, R.P.J.M., 2007, Socio-cognitive evolution and co-evolution in competing technical trajectories: Biogas development Denmark (1970-2002), International Journal of Sustainable Development and World Ecology, 14(1), pp. 63-77. Geels, F.W. & Schot, J., 2007, Typology of sociotechnical transition pathways, Research Policy, 36(3), pp. 399-417. Geels, F.W. & Smit, W.A., 2000, Failed technology futures: pitfalls and lessons from a historical survey, Futures, 32(9-10), pp. 867-85.
276
Geels, F.W., Pieters, T. & Snelders, S., 2007, Cultural enthusiasm, resistance and the societal embedding of new technologies: Psychotropic drugs in the 20th century, Technology Analysis & Strategic Management, 19(2), pp. 145-65. Gerring, J., Thacker, S.C. & Alfaro, R., 2012, Democracy and Human Development, Journal of Politics, 74(01), pp. 1-17. Gerschenkron, A., 1962, Economic backwardness in historical perspective: a book of essays, the Belknap press of Harvard university Press, Cambridge, M.A., USA. Gibson, G., Clugston, S. & Sutherland, G., 2013, Infrastructure in Vietnam - Needs and Progress, Infrastructure Journal. 6 August 2013. Gillespie, J., 1994, Private commercial rights in Vietnam: A comparative analysis, Stanford Journal of International Law, 30(2). Gillespie, J., 2008, Localizing global rules: public participation in lawmaking in Vietnam, Law & Social Inquiry, 33(3), pp. 673-707. Gisselquist, R.M., 2012, Good Governance as a Concept, and Why This Matters for Development Policy. WIDER Working Paper No. 2012/30. UNU-WIDER available at http://www.wider.unu.edu/publications/working-papers/2012/en_GB/wp2012-030/_files/87241489663918216/default/wp2012-030.pdf Gnansounou, E., 2008, Assessing the energy vulnerability: Case of industrialised countries, Energy Policy, 36(10), pp. 3734-44. Godin, B., 2006, The Linear Model of Innovation: The Historical Construction of an Analytical Framework, Science, Technology & Human Values, 31(6), pp. 639-67. Gonzalez, P.D., 2009, The empirical analysis of the determinants for environmental technological change: A research agenda, Ecological Economics, 68(3), pp. 861-78. Gómez-Ibáñez, A.J., 2007, Commission on Growth and Development at the Workshop on Global Trends and Challenges September, Private Infrastructure in Developing Countries: Lessons from Recent Experience. Gratwick, K.N. & Eberhard, A., 2008, Demise of the standard model for power sector reform and the emergence of hybrid power markets, Energy Policy, 36(10), pp. 3948-60. Greacen, C. & Palettu, A. 2007, Electricty sector planning and hydropower in the Mekong Region, in L Lebel, J Dore, R Daniel & YS Koma (eds), Democratising Water Governence in the Mekong Region, Mekong Press. Griliches, Z., 1957, Hybrid Corn: An Exploration in the Economics of Technological Change, Econometrica, 25(4), pp. 501-22. Grindle, M.S., 2004, Good enough governance: poverty reduction and reform in developing countries, Governance, 17(4), pp. 525-48.
277
Grindle, M.S., 2007, Good enough governance revisited, Development Policy Review, 25(5), pp. 533-74. Growth, C.O., 2008, The Growth Report: Strategies for Sustained Growth and Inclusive Development, World Bank Publications. Grubb, M., Jamasb, T. & Pollit, M.G. 2008, A low-carbon electricity sector for the UK: issues and options, in M Grubb, T Jamasb & MG Pollit (eds), Delivering a Low-Carbon Electricity System. Technologies, Economics and Policy, Cambridge University Press, Cambridge, UK, pp. 1 - 27. Grubler, A., 2004, Transitions in energy use. Encyclopedia of Energy, Volume 6. Elsevier, London, UK. Grubler, A., 2010, The costs of the French nuclear scale-up: A case of negative learning by doing, Energy Policy, 38(9), pp. 5174-88. GSO (General Statistical Office of Vietnam), 2003, Statistical Yearbook 2003, Statistical Publishing House, Hanoi, Vietnam. GSO, 2013, Statistical Data. Retrieved April 12, 2013, http://www.gso.gov.vn/default_en.aspx?tabid=491 Gupta, S. et al 2007, Policies, Instruments and Co-operative Arrangements, in B Metz, OR Davidson, PR Bosch, R Dave & LA Meyer (eds), Climate Change 2007: Mitigation. Contribution of Working Group III to the Fourth Assessment Report of the Intergovernemntal Panel on Climate Change, Cambridge University Press, Cambridge, United kingdom and New York, NY, USA. Hadjilambrinos, C., 2000, Understanding technology choice in electricity industries: a comparative study of France and Denmark, Energy Policy, 2000(28), pp. 1111 - 1126. Hafner-Burton, E., Hughes, A. & Victor, D., 2011, The Behavioural Psychology of Elite Decision Making: Implications for Political Science. Electronic paper. Available at http://polisci2.ucsd.edu/dhughes/research/Elites.pdf Haggard, S., 2004, Institutions and Growth in East Asia, Studies in Comparative International Development, 38(4), pp. 53-81. Haggard, S. & Tiede, L., 2011, The Rule of Law and Economic Growth: Where are We? World Development, 39(5), pp. 673-85. Haggard, S., MacIntyre, A. & Tiede, L., 2008, The Rule of Law and Economic Development, Annual Review of Political Science, 11(1), pp. 205-34. Hall, D., Lobina, E. & de Motte, R.L., 2005, Public resistance to privatisation in water and energy, Development in Practice, 15(3-4), pp. 286-301. Hall, D., Thomas, S. & Corral, V., 2009, Global experience with electricity liberalisation. Report commissioned by Public Services International (PSI) www.world-psi.org for a conference at Paramadina University, Jakarta, 19th January 2010.
278
Hall, J., Lacasa, I.D. & Guenther, J., 2011, Path Dependence and QWERTY's Lock-In: Toward a Veblenian Interpretation, Journal of Economic Issues, 45(2), pp. 457-64. Ha Noi Moi, 2013, Petrovietnam Nhon Trach 2 power JSC: Procuction, effective business, 12 June 2013. Hamamoto, M., 2006, Environmental regulation and the productivity of Japanese manufacturing industries, Resource and Energy Economics, 28(4), pp. 299-312. Harrington, W., Morgenstern, R.D. & Sterner, T., 2004, Choosing Environmental Policy. Comparing Instruments and Outcomes in the United States and Europe, Resources for the Future, Washington D.C. Harris, C., 2003, Private participation in infrastructure in developing countries: trends, impacts, and policy lessons, World Bank Publications. Washington D.C., USA. Harris, J., Hawkes, K., Abdul, N.P., Buyhoff, G.F. & Schaefer, C., 2009, Vietnam's Independent Power Producers Sector: Towards Market Liberalisation. Lovells LLP, Hanoi, Vietnam. Hausman, W.J. & Neufeld, J.L., 2011, How politics, economics, and institutions shaped electric utility regulation in the United States: 1879–2009, Business History, 53(5), pp. 723-46. Hausman, W.J., Hertner, P. & Wilkins, M., 2008, Global electrification: multinational enterprise and international finance in the history of light and power, 1878-2007, Cambridge University Press, Cambridge, UK.. Hayward, J., Graham, P. & Campbell, P., 2011, Projections of the future costs of electricity generation technologies.An application of CSIROs Global and Local Learning Model (GALLM). CSIRO Energy Transformed Flagship. Newcastle, NSW, Australia. Heather, D., 2009, Vietnam Posters, Prestel, London, UK. Hechtr, M.M., 2010, Vietnam is moving ahead with nuclear, 21st century science and technology, Winter 2009/2010 (Nuclear report). Heffer, S., 2011, A Short History of Power, Notting Hill editions Ltd, London, UK. Helm, D., 2010, Government failure, rent-seeking, and capture: the design of climate change policy, Oxford Review of Economic Policy, 26(2), pp. 182-96. Hepburn, C., 2010a, Environmental policy, government, and the market, Oxf Rev Econ Policy, 26(2), pp. 117-36. Hickey, S., 2012, Turning Governance Thinking Upside-down? Insights from ‘the politics of what works’, Third World Quarterly, 33(7), pp. 1231-47. Hicks, J.R., 1932, The Theory of Wages, 2nd edition ed. Macmillan, London, UK.
279
Higgins, P., 2008, Electricity: levelling the renewables playing field, Renewable Energy Focus, 9(5), pp. 42-6. Hirsh & Sovacool, B.J., 2006, Technological Systems and Momentum Change: American Electric Utilities, Restructuring, and Distributed Generation Technologies, Journal of Technology Studies, pp. 72 - 85. Hirsh, R.F., 1999, Power loss: The origins of deregulation and restructuring in the American electric utility system, MIT Press Cambridge, MA, USA Hirsh, R.F., 2003, Technology and transformation in the American electric utility industry, Cambridge University Press, Cambridge, UK. Hirsh, R.F., 2007, University of Houston Conference on American Energy Policy, Electricity Policy in the 1970s: The Bizarre and Unanticipated Driver of Utility System Restructuring in the 1990s and Beyond.University of Houston Conference on American Energy Policy in the 1970s, 9-10 November 2007. History, Song Da Corporation. Retrieved July 10, 2011, from http://www.songda.vn/en/tabid/179/ItemID/1/View/Details/Default.aspx Hobday, M., 1995, East Asian latecomer firms: learning the technology of electronics, World Development, 23(7), pp. 1171-93. Hofman, P.S. & Elzen, B., 2010, Exploring system innovation in the electricity system through sociotechnical scenarios, Technology Analysis & Strategic Management, 22(6), pp. 653-70. Holland, S.P. & Neufeld, J.L., 2009, The Evolution of Government Policy and the Structure of the US Electric Power Industry.University of North Carolina, Greensboro, North Carolina, USA. Horn, R.C., 1987, Vietnam and Sino-Soviet relations: What price rapprochement? Asian Survey, 27(7), pp. 729-47. House of Lords, 2012, EU Agriculture, Fisheries, Environment and Energy Sub-Committee EU Energy: decarbonisation and economic competitiveness, Oral and written evidence. Hughes, T.P., 1976, Technology and Public Policy: The Failure of Giant Power, Proceedings of the IEEE, 64(9). Hughes, T.P., 1983, Networks of power: electrification in Western society, 1880-1930, Johns Hopkins University Press, Cambridge, MA, USA. Hughes, T.P. 1987, The Evolution of Large Technological Systems, in W.E. Bijker, TP Hughes & J Pinch (eds), The Social Construction of Technological Systems. MIT Press, Cambridge, MA, USA. Hulten, C.R. 2001, Total factor productivity. A short biography, in University of Chicago Press, Chigago, USA.
280
ICEM, 2008, SEA of the Quang Nam Province Hydropower Plan for the Vu Gia-Thu Bon River Basin. Consultancy Report for the ADB, Hanoi, Vietnam ICEM, 2010, MRC Strategic Environmental Assessment (SEA) of hydropower on the Mekong mainstream, Consultancy report for the Mekong River Commission Secretariat, Vientiane, Lao PDR. IE (Institute of Energy), 2007, National power development master plan VI 2006 - 2010. Policy Document. MoIT, Hanoi, Vietnam. IEA, 2013, Energy Statistics and Balances of Non-OECD Countries, Energy Statistics of OECD Countries, and Energy Balances of OECD Countries [computer file]. Paris, France. IEA, 2011, What is hydropower's history? What is hydropower's history_ - IEA Hydropower.pdf. Retrieved March 19, 2013, from www.ieahydro.org/Wha t_is_hydropower 's_history.html IEA, 2010, Energy Technology Perspectives. Scenarios and Strategies to 2050. Paris, France. IEA, 2012a, Climate & Electricity Annual 2011. Paris, France. IEA, 2012b, IEA Estimates of Fossil Fuel Consumption Subsidies. Paris, France. IEA, 2012c, World Energy Outlook 2012. Paris, France. IEA, OPEC, OECD & World Bank, 2011, Joint report by IEA, OPEC, OECD and World Bank on fossil-fuel and other energy subsidies: An update of the G20 Pittsburgh and Toronto Commitments. Paris, France. Indochina Energy, 2012, EVN should stick to what it knows best, 8 August 2012. Indochina Energy, 2013, EVN's power factories make fat profit, but still insist on power price hike, 10 January 2013. IMF, 2011, IMF Executive Board Concludes 2011 Article IV Consultation with Vietnam, no. 4 December 2011, Washington, DC, USA. IMF, 2012, Vietnam 2012 Article IV Consultation.Washington, DC, USA. IMF, 2013, Energy Subsidy Reform: Lessons and Implications.Washington, DC, USA. Intarakumnerd, P., Chairatana, P. & Tangchitpiboon, T., 2002, National innovation system in less successful developing countries: the case of Thailand, Research Policy, 31(8-9), pp. 1445-57. Inter Press Service, 2005, IPS, Energy: Vietnam's Power Problems Prompt Talk of Privatisation, 15 July 2005.

281
IPCC, 2011: Summary for Policymakers. In: IPCC Special Report on Renewable Energy Sources and Climate Change Mitigation [O. Edenhofer, R. Pichs-Madruga, Y. Sokona, K. Seyboth, P. Matschoss, S. Kadner, T. Zwickel, P. Eickemeier, G. Hansen, S. Schlömer, C. von Stechow (eds)], Cambridge University Press, Cambridge, United Kingdom and New York, NY, USA. Islas, J., 1997, Getting round the lock-in in electricity generating systems: The example of the gas turbine, Research Policy, 26(1), pp. 49-66. Jaccard, M., 1995, The changing rationale for government intervention in the electricity industry , Energy Policy, 23(7), pp. 579 - 592. Jaffe, A.B. & Palmer, K., 1997, Environmental regulation and innovation: a panel data study, Review of Economics and Statistics, 79(4), pp. 610-9. Jaffe, A.B. & Stavins, R.N., 1994, The energy paradox and the diffusion of conservation technology, Resource and Energy Economics, 16(2), pp. 91-122. Jaffe, A.B., Newell, R.G. & Stavins, R.N., 2002, Environmental policy and technological change, Environmental & Resource Economics, 22(1-2), pp. 41-69. Jaffe, A.B., Newell, R.G. & Stavins, R.N., 2005, A tale of two market failures: Technology and environmental policy, Ecological Economics, 54(2-3), pp. 164-74. Jamasb, T., 2006, Between the state and market: Electricity sector reform in developing countries, Utilities Policy, 14(1), pp. 14-30. Jamasb, T., 2007, Technical Change Theory and Learning Curves: Patterns of Progress in Electricity Generation Technologies, The Energy Journal, 28(3). Jandl, T., 2012, Economic Decentralization and Central Political Control in Vietnam . Vietnam Investment Review, 2013, Japanese ODA charges Vietnam power development, 3 September 2013. Jasper, J.M., 1992, Gods, Titans and mortals: Patterns of state involvement in nuclear development, Energy Policy, 20(7), pp. 653-9. JBIC, 2003, JBIC supports Vietnam power sector with project finance loans for power project with private participation. Hanoi, Vietnam. JBIC, 2008, JBIC's ODA Operations in Vietnam. Hanoi, Vietnam Jehan, S.N. & Luong, T.N., 2010, Vietnam’s Real Estate Market: Can it Sail through the Capital Puzzle? Ritsumeikan Asia Pacific University. Available at http://www.apu.ac.jp/rcaps/uploads/fckeditor/publications/journal/RJAPS_V29_Jehan_Luong.pdf Jhirad, D., 1990, Power Sector Innovation in Developing Countries: Implementing Multifaceted Solutions, Annu Rev Energy, 15(1), pp. 365-98.
282
Johnson, C.A., 1982, MITI and the Japanese miracle: the growth of industrial policy, 1925-1975, Stanford University Press, Rewood City, CA, USA. Johnstone, N., Haščič, I. & Popp, D., 2009, Renewable Energy Policies and Technological Innovation: Evidence Based on Patent Counts, Environmental and Resource Economics, 45(1), pp. 133-55. Joskow, P.L., 1987, Productivity growth and technical change in the generation of electricity, The Energy Journal, 8(1), pp. 17-38. Joskow, P.L., 2011, Comparing the costs of intermittent and dispatchable electricity generating technologies, The American Economic Review, 101(3), pp. 238-41. Kadono, T. & Au Minh, T., 2012, ADB on Viet Nam Project in Energy Sector. Overview of Viet Nam Power Sector. Presentation. Manila, Philippines. . Kahrl, F., Williams, J.H. & Hu, J., 2012, The political economy of electricity dispatch reform in China, Energy Policy. Volume 53, February 2013, pp. 361–369. Kaldor, N., 1967, Strategic factors in economic development, New York State School of Industrial and Labor Relations, Cornell University Ithaca, New York, New York, USA. Katz, M.L. & Shapiro, C., 1994, Systems Competition And Network Effects, Journal of Economic Perspectives, 8(2), pp. 93-115. Kaufmann, D., 2004, Governance Redux: the empirical challenge.Working Paper, Wold Bank Institute, Washington D.C., USA. Kaufmann, D. & Kraay, A., 2002, Growth without governance, World Bank Policy Research Working Paper No. 2928.Washington D.C., USA. Kaufmann, D., Kraay, A. & Mastruzzi, M., 2009, Governance matters VIII: aggregate and individual governance indicators, 1996-2008.Working Paper, Wold Bank Institute, Washington D.C., USA. Kaufmann, D., Kraay, A., Mastruzzi, M., Growth, W.B.D.R.G., Team, M. & Programs, W.B.I.G., 2007, The worldwide governance indicators project: answering the critics, World Bank, World Bank Institute, Global Programs, and Development Research Group, Growth and Macroeconomics Team.Washington D.C., USA. Keefer, P., 2007, Beyond legal origin and checks and balances: Political credibility, citizen information, and financial sector development, World Bank Policy Research Working Paper No. 4154. Washington D.C., USA. Keefer, P. & Knack, S., 2002, Polarization, politics and property rights: Links between inequality and growth, Public Choice, 111(1), pp. 127-54. Kemp, R. & Pontoglio, S., 2011, The innovation effects of environmental policy instruments — A typical case of the blind men and the elephant? Ecological Economics, 72, pp. 28-36.

283
Kemp, R. & Rotmans, J., 2001, Paper presented at the International Conference Towards Environmental Innovation Systems, Garmisch-Partenkirchen, September, 2001, The management of the co-evolution of technical, environmental and social systems. Kenny, C. & Williams, D., 2001, What Do We Know About Economic Growth? Or, Why Don't We Know Very Much? World Development, 29(1), pp. 1 - 22. Kerkvliet, B.J., 2005, The power of everyday politics: how Vietnamese peasants transformed national policy, Cornell University Press, Ithica, N.Y., USA. Kerr, S. & Newell, R.G., 2003, Policy-induced technology adoption: Evidence from the US lead phasedown, Journal of Industrial Economics, 51(3), pp. 317-43. Kessides, .N., 2005, Infrastructure Privatization and Regulation: Promises and Perils, World Bank Research Observer, 20(1), pp. 81-108. Kessides, I.N., 2009, Nuclear Power and Sustainable Energy Policy: Promises and Perils, The World Bank Research Observer, 25(2), pp. 323-62. Kessides, I.N., 2012a, The future of the nuclear industry reconsidered: Risks, uncertainties, and continued promise, Energy Policy. Volume 48, September 2012, pp. 185–208. Kessides, I.N., 2012b, The Impacts of Electricity Sector Reforms in Developing Countries, The Electricity Journal, 25(6), pp. 79-88. Khalil, E.L., 2012, Why Europe? A Critique Of Institutionalist And Culturalist Economics, Journal of Economic Surveys, 26(2), pp. 351-72. Khan, M., 2007a, Governance, economic growth and development since the 1960s. DESA Working Paper No. 54, New York, NY, USA. Khan, M., 2007b, Governance and Growth: A Preliminary Report. SOAS Working papers, University of London, London, UK. Khan, M., 2010, Political settlements and the governance of growth-enhancing institutions. SOAS Working papers, University of London, London, UK. Khan, M.H. 2000, Rents, Efficiency and Growth, in MH Khan & KS Jomo (eds), Rents, Rent-seeking and Economic Development: Theory and Evidence in Asia, Cambridge University Press, Cambridge, UK. Khan, M.H., 2005, Markets, states and democracy: Patron--client networks and the case for democracy in developing countries, Democratisation, 12(5), pp. 704-24. Khan, M.H., 2010, Learning, Technology Acquisition and Governance Challenges in Developing Countries. SOAS Working papers, University of London, London, UK. Khan, M.H., 2012, Governance and Growth: History, Ideology, and Methods of Proof, p. 51.
284
Khan, M.H. & Blankenburg, S. 2009, The Political Economy of Industrial Policy in Asia and Latin America, in G Dosi, M Cimoli & JE Stiglitz (eds), Industrial Policy and Development. The Political Economy of Capabilities Accumulation, Oxford University Press. Khan, M.H. & Jomo, K.S., 2000, Rents, rent-seeking and economic development: Theory and evidence in Asia, Cambridge University Press, Cambridge and New York, UK and USA. Kim, L., 1997, Imitation to innovation: the dynamics of Korea's technological learning, Harvard Business Press, Cambridge, M.A., USA. Kim, L., 2001, The dynamics of technological learning in industrialisation, International Social Science Journal, 53(168), pp. 297-308. Kim, L. & Nelson, R.R., 2000, Technology, Learning, and Innovation: Experiences of Newly Industrialised Economics, Cambridge University Press, Cambridge, UK. Kim, W., Nam, I.-C. & Cuong, T., 2010, On the Governance of State-Owned Economic Groups in Vietnam, Available at SSRN 1729093. Kleinknecht, A. & Verspagen, B., 1989, Demand and innovation: Schmookler re-examined , Research Policy, 19(1990), pp. 387 - 394. Kolk, A., Lindeque, J. & Buuse, D., 2013, Regionalization Strategies of EU Electric Utilities, (January 30, 2013) British Journal of Management. Available at SSRN:http://ssrn.com/abstract=2209367 Kolstad, I. & Wiig, A., 2009, It's the rents, stupid! The political economy of the resource curse, Energy Policy, 37(12), pp. 5317-25. Kong, T., 2007, A Selective Review of Recent Developments in the Economic Growth Literature, Asian-Pacific Economic Literature, 21(1), pp. 1-33. Krishnaswamy, V., Stuggins, G., 2007, Closing the electricity supply-demand gap. Energy and Mining Sector Discussion Paper, Paper No. 20, World Bank, Washington, D.C., USA. Krugman, P., 1994, The myth of Asia's miracle, Foreign Affairs, 73(6), pp. 62-78. Krugman, P.R., 1997, Development, geography, and economic theory, The MIT Press, Cambridge, M.A., USA. Kubik, L., Coker, J. & Hunt, C., 2012, The role of conventional generation in managing variability, Energy Policy, 50, pp. 253-61. Kumar, A. et al 2011, Hydropower, in K Seyboth, P Matschoss, S Kadner, T Zwickel, P Eickemeier, G Hansen, S Schlomer, C von Stechow, O Edenhofer, R Pichs-Madruga & Y Sokana (eds), IPCC Special Report on Renewable Energy Sources and Climate Change Mitigation, Cambridge University Press, Cambridge, United Kingdom and New York, NY, USA, pp. 409-33. Kunneke, W., 1999, Electricity networks: how 'natural' is the monopoly? Utilities Policy, 8, pp. 99 - 108.

285
Künneke, R., Groenewegen, J. & Ménard, C., 2010, Aligning modes of organization with technology: Critical transactions in the reform of infrastructures, Journal of Economic Behavior & Organization, 75(3), pp. 494-505. Künneke, R.W., 2008, Institutional Reform and Technological Practice: The Case of Electricity, Industrial and Corporate Change, Vol 17, Issue 2, pp 233-265, 2008. Lall, S., 1994, The East-Asian Miracle - Does The Bell Toll For Industrial-Strategy, World Development, 22(4), pp. 645-54. Lall, S. 2000, Chapter 2 Technological Change and Industrialisation in the Asian Newly Industrializing Economies: Achievements and Challenges, in Technology, Learning, and Innovation: Experiences of Newly Industrialising Economies, Cambridge University Press, Cambridge UK, pp. 13-67. Lao Dong, 2005, Electricity price hike annulled, 18 February 2005. Lanjouw, J.O. & Mody, A., 1996, Innovation and the international diffusion of environmentally responsive technology, Research Policy, 25(4), pp. 549-71. Lawhon, M. & Murphy, J.T., 2011, Socio-technical regimes and sustainability transitions: Insights from political ecology, Progress in Human Geography. June 2012 vol. 36 no. 3 pp. 354-378 Le, D.P., 2012, Programme for Nuclear Power Development in Vietnam. IAEA/INPRO Consultants’ Meeting on Survey of Existing National Long Range Nuclear Energy Strategies Vienna, 22-23 March 2012. Retrived from http://www.iaea.org/INPRO/activities/Task3/Survey_LRNES/Vietnam.pdf on 12 June 2013. Le, L.S., 2008, Vietnam in Denial Over Economic Woes, Far Eastern Economic Review, 171(8), p. 45. Le, N.A., Tran, T.H.Y., Le, H.H. & Nguyen, T.N., 2012, Industry overview: Energy industry and hydropower industry legal framework. ACBS Securities, Hanoi, Vietnam. Leftwich, A., 1995, Bringing Politics Back In: Towards a Model of the Development State, Journal of Development Studies, 31(3), pp. 400-27. Leftwich, A., 2005, Politics in command: Development studies and the rediscovery of social science, New Political Economy, 10(4), pp. 573-607. Leftwich, A., 2008, Developmental states, effective states and poverty reduction: The primacy of politics. UNRISD Project on Poverty Reduction and Policy Regimes, Geneva, Switzerland. Leonard-Barton, D., 1992, Core capabilities and core rigidities: A paradox in managing new product development, Strategic Management Journal, 13(S1), pp. 111-25.
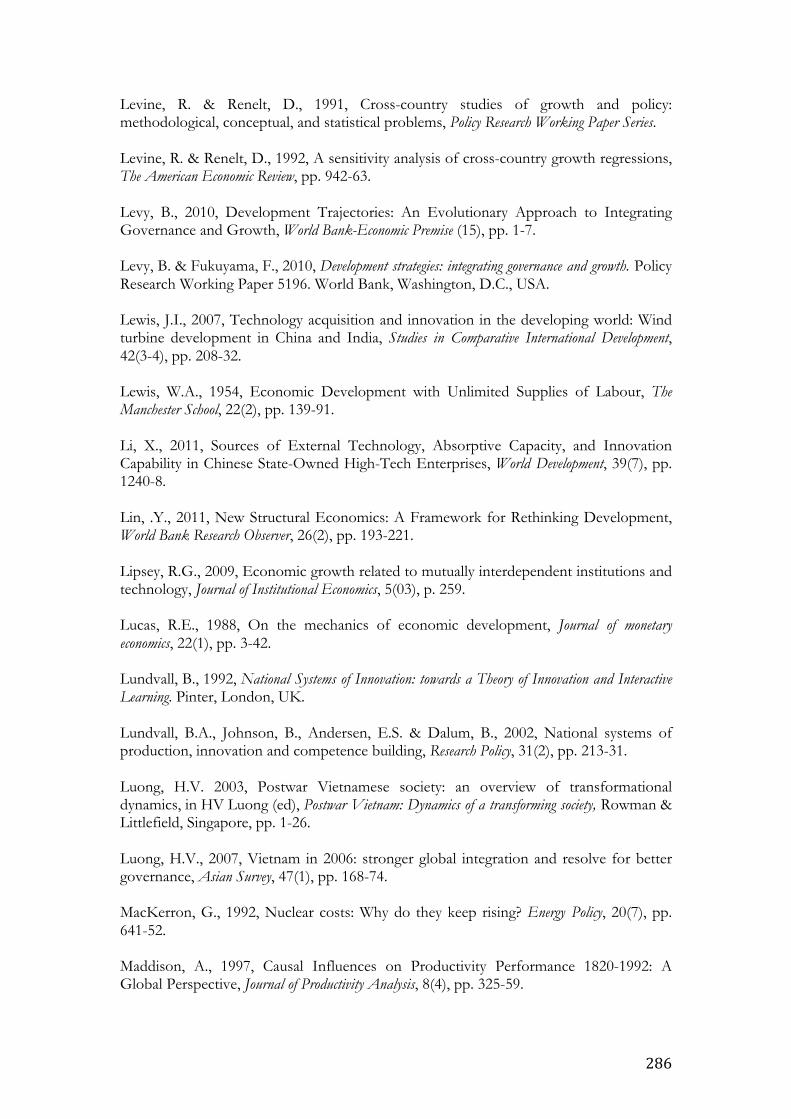
286
Levine, R. & Renelt, D., 1991, Cross-country studies of growth and policy: methodological, conceptual, and statistical problems, Policy Research Working Paper Series. Levine, R. & Renelt, D., 1992, A sensitivity analysis of cross-country growth regressions, The American Economic Review, pp. 942-63. Levy, B., 2010, Development Trajectories: An Evolutionary Approach to Integrating Governance and Growth, World Bank-Economic Premise (15), pp. 1-7. Levy, B. & Fukuyama, F., 2010, Development strategies: integrating governance and growth. Policy Research Working Paper 5196. World Bank, Washington, D.C., USA. Lewis, J.I., 2007, Technology acquisition and innovation in the developing world: Wind turbine development in China and India, Studies in Comparative International Development, 42(3-4), pp. 208-32. Lewis, W.A., 1954, Economic Development with Unlimited Supplies of Labour, The Manchester School, 22(2), pp. 139-91. Li, X., 2011, Sources of External Technology, Absorptive Capacity, and Innovation Capability in Chinese State-Owned High-Tech Enterprises, World Development, 39(7), pp. 1240-8. Lin, .Y., 2011, New Structural Economics: A Framework for Rethinking Development, World Bank Research Observer, 26(2), pp. 193-221. Lipsey, R.G., 2009, Economic growth related to mutually interdependent institutions and technology, Journal of Institutional Economics, 5(03), p. 259. Lucas, R.E., 1988, On the mechanics of economic development, Journal of monetary economics, 22(1), pp. 3-42. Lundvall, B., 1992, National Systems of Innovation: towards a Theory of Innovation and Interactive Learning. Pinter, London, UK. Lundvall, B.A., Johnson, B., Andersen, E.S. & Dalum, B., 2002, National systems of production, innovation and competence building, Research Policy, 31(2), pp. 213-31. Luong, H.V. 2003, Postwar Vietnamese society: an overview of transformational dynamics, in HV Luong (ed), Postwar Vietnam: Dynamics of a transforming society, Rowman & Littlefield, Singapore, pp. 1-26. Luong, H.V., 2007, Vietnam in 2006: stronger global integration and resolve for better governance, Asian Survey, 47(1), pp. 168-74. MacKerron, G., 1992, Nuclear costs: Why do they keep rising? Energy Policy, 20(7), pp. 641-52. Maddison, A., 1997, Causal Influences on Productivity Performance 1820-1992: A Global Perspective, Journal of Productivity Analysis, 8(4), pp. 325-59.
287
Mahoney, P., 2001, The Common Law and Economic Growth: Hayek Might Be Right, The Journal of Legal Studies, 30(2), pp. 503-25. Malesky, E. & Taussig, M., 2010, Out of the gray: The impact of provincial institutions on business formalization in Vietnam. Mankiw, N.G., Phelps, E.S. & Romer, P.M., 1995, The growth of nations, Brookings papers on economic activity, 1995(1), pp. 275-326. Mankiw, N.G., Romer, D. & Weil, D.N., 1992, A contribution to the empirics of economic growth, The Quarterly Journal of Economics, 107(2), pp. 407-37. Marerba, F. & Nelson, R., 2010, Catching up in different sectoral systems: evidence from six industries. Markard, J. & Truffer, B., 2006, Innovation processes in large technical systems: Market liberalization as a driver for radical change? Research Policy, 35(5), pp. 609-25. Martin, S. & Scott, J.T., 2000, The nature of innovation market failure and the design of public support for private innovation, Research Policy, 29(4-5), pp. 437-47. Marx, K., 1867, Capital. Reprint 1990, Pengin Classics, London, UK. Masina, P., 2004, Vietnam's development strategies, Routledge, London, UK. Mathaba, 2007, Power distributors' equitisation ceases, 19 September 2007. Mazyrin, V. & Moscow, L., 2010, Russia in Indochina: Back to the Future? International Affairs(6), pp. 40-50. McCloskey, D.N., 2009, The Institution of Douglass North. MPRA Paper No. 21768. Retried from http://mpra.ub.uni-muenchen.de/21768/1/MPRA_paper_21768.pdf on 2 August 2012. McDonald, A. & Schrattenholzer, L., 2001, Learning rates for energy technologies, Energy Policy, 29(4), pp. 255-61. McMillan, M.S. & Rodrik, D., 2011, Globalization, structural change and productivity growth. NBER Working Paper 17143. McNerney, J., Doyne Farmer, J. & Trancik, J.E., 2011, Historical costs of coal-fired electricity and implications for the future, Energy Policy, 39(6), pp. 3042-54. Meadowcroft, J., 2005, Environmental political economy, technological transitions and the state, New Political Economy, 10(4), pp. 479-98. Meadowcroft, J., 2009, What about the politics? Sustainable development, transition management, and long term energy transitions, Policy Sciences, 42(4), pp. 323-40. Meadowcroft, J., 2011, Engaging with the politics of sustainability transitions, Environmental Innovation and Societal Transitions, 1(1), pp. 70-5.

288
Meier, P., 2013, Small Hydro Development. Unpublished consultancy report. Mekong Securities, 2008, Pha Lai Thermal Power Joint Stock Company. Ho Chi Minh City, Vietnam. Metz, B., Davidson, O.R., Bosch, P.R., Dave, R. & Meyer, L.A., 2007, Climate Change 2007: Mitigation. Contribution of Working Group III to the Fourth Assessment Report of the Intergovernmental Panel on Climate Change, Cambridge University Press, Cambridge, UK and New York, NY. Meyer, N.I., 2003, European schemes for promoting renewables in liberalised markets, Energy Policy, 31(7), pp. 665-76. Migheli, M., 2012, Do the Vietnamese Support the Economic Doi Moi? Journal of Development Studies, 48(7), pp. 939-68. Millward, R., 2011a, Geo-politics versus market structure interventions in Europe's infrastructure industries c. 1830–1939, Business History, 53(5), pp. 673-87. Millward, R., 2011b, Public enterprise in the modern western world: an historical analysis, Annals of Public and Cooperative Economics, 82(4), pp. 375-98. Mitchell, C., 2010, The Political Economy of Sustainable Energy, Elliott, D. ed. Palgrave MacMillan, London. Moe, E., 2009, Mancur Olson and structural economic change: Vested interests and the industrial rise and fall of the great powers, Review of International Political Economy, 16(2), pp. 202-30. Moe, E., 2010, Energy, industry and politics: Energy, vested interests, and long-term economic growth and development, Energy, 35(4), pp. 1730-40. MoI, 1997, Power Sector Policy Statement. Hanoi, Vietnam. MOIT, 2011, Phe duyet Quy hoach phat trien dien luc qoc giai doan 2011 - 2020 co xet den nam 2030 (Decision adopting National Power Development Plan for 2011 - 2020 with a strategic vision to 2030). Hanoi, Vietnam. Mokyr, J., 1992, Technological inertia in economic history, Journal of Economic History, 52(2), pp. 325-38. Mokyr, J., 1997, The Political Economy of Technological Change: Resistance and Innovation in Economic History. Retrived from http://www.fsalazar.bizland.com/PYMES/Berg.pdf on 22 December 2009. Mokyr, J., 1998, Induced technical innovation and medical history: an evolutionary approach, Journal of Evolutionary Economics, 8(2), pp. 119-37. Mokyr, J. 2005, Long-Term Economic Growth and the History of Technology, in P Aghion & SN Durlauf (eds), Handbook of Economic Growth, Volume 1B, pp. 1113-80.
289
Mokyr, J., 2006, Economic transformations: General purpose technologies and long-term economic growth, Journal of Economic History, 66(4), pp. 1072-5. Mokyr, J., 2009, Intellectual Property Rights, the Industrial Revolution, and the Beginnings of Modern Economic Growth, The American Economic Review, 99(2), pp. 349-55. Mokyr, J. & Nye, J.V.C., 2007, Distributional coalitions, the Industrial revolution, and the origins of economic growth in Britain, Southern Economic Journal, pp. 50-70. MoNRE, 2010, Second National Communication to the United Nations Framework Convention on Climate Change. Morton, D.L., 2002, Reviewing the history of electrification, Endeavour, 26(2). Mowery, D. & Rosenberg, N., 1979, The influence of market demand upon innovation: a critical review of some recent empirical studies, Research Policy, 8, pp. 102 - 153. Mowery, D.C., Nelson, R.R. & Martin, B., 2009, Technology policy and global warming: Why new models are needed (or why putting new wine in old bottles won't work), Provocation 10. MRC (Mekong River Commission), 2009, Hydropower Project Database [computer file]. Vientiane, Lao PDR. Murray, B., 2009, Power markets and economics: energy costs, trading, emissions, Wiley. London, UK. Myrdal, G., 1968, Asian Drama: An enquiry into the poverty of nations, The Twentieth Century Fund, New York, USA. Myrdal, G., 1990, The political element in the development of economic theory, Transaction Publishers, London, UK. Nabli, M.K. & Nugent, J.B., 1989, The new institutional economics and its applicability to development, World Development, 17(9), pp. 1333-47. National Assembly, 2005, Electricity Law. Hanoi, Vietnam. Negro, S.O., Alkemade, F. & Hekkert, M.P., 2012, Why does renewable energy diffuse so slowly? A review of innovation system problems, Renewable and Sustainable Energy Reviews, 16(6), pp. 3836-46. Nellis, J. & Kikeri, S., 1989, Public enterprise reform: Privatization and the World Bank, World Development, 17(5), pp. 659-72. Nelson, R., 2004, The challenge of building an effective innovation system for catch-up, Oxford Development Studies, 32(3), pp. 365-74. Nelson, R.R., 1981, Research on Productivity Growth and Productivity Differences: Dead Ends and New Departures, Journal of Economic Literature, 19(3), pp. 1029 - 1064.
290
Nelson, R.R., 1993, National innovation systems: a comparative analysis, Oxford University Press, USA. Nelson, R.R., 2008, Economic development from the perspective of evolutionary economic theory, Oxford Development Studies, 36(1), pp. 9-21. Nelson, R.R. & Langlois, R.N., 1983, Industrial-Innovation Policy - Lessons From American-History, Science, 219(4586), pp. 814-8. Nelson, R.R. & Nelson, K., 2002, Technology, institutions, and innovation systems, Research Policy, 31(2), pp. 265-72. Nelson, R.R. & Pack, H., 1999, The Asian miracle and modern growth theory, Economic Journal, pp. 416-36. Nelson, R.R. & Winter, S.G., 1977, In search of useful theory of innovation, Research Policy, 6(1977), pp. 36 - 76. Nelson, R.R. & Winter, S.G., 1982, An evolutionary theory of economic change, Belknap press. Nelson, R.R. & Winter, S.G., 2002, Evolutionary theorizing in economics, Journal of Economic Perspectives, 16(2), pp. 23-46. Nelson, R.R.N., 1995, Recent Evolutionary Theorising About Economic Change, Journal of Economic Literature, XXXIII(March 1995), pp. 48 - 90. Nemet, G.F., 2009, Demand-pull, technology-push, and government-led incentives for non-incremental technical change, Research Policy, 38(5), pp. 700-9. Nepal, R. & Jamasb, T., 2011, Reforming the Power Sector in Transition: Do Institutions Matter?. EPRG Working Paper, 1109 Cambridge Working Paper in Economics 1125. Retrived from http://www.econ.cam.ac.uk/dae/repec/cam/pdf/cwpe1125.pdf on 16 March 2012. Neufeld, J.L., 1987, Price discrimination and the adoption of the electricity demand charge, The Journal of Economic History, 47(03), pp. 693-709. Neufeld, J.L., 2008, Corruption, quasi-rents, and the regulation of electric utilities, Journal of Economic History, 68(04), pp. 1059-97. Newbery, D.M. & Pollitt, M.G., 1997, The restructuring and privatisation of Britain's CEGB—was it worth it? The Journal of Industrial Economics, 45(3), pp. 269-303. Newell, R.G., 2010, The role of markets and policies in delivering innovation for climate change mitigation, Oxf Rev Econ Policy, 26(2), pp. 253-69. Newell, R.G., Jaffe, A.B. & Stavins, R.N., 1998, The induced innovation hypothesis and energy saving technological change, Working Paper 6437. New York Times, 2012, In Vietnam, Growing fears of an economic meltdown, 22 August 2012.

291
Nguyen, A.T., 2012, A Case Study on Power Sector Restructuring in Vietnam. Pacific Energy Summit, 2012 papers. Retrived from www.nbr.org on 14 June 2013. Nguyen, K.Q., 2008, Impacts of a rise in electricity tariff on prices of other products in Vietnam, Energy Policy, 36(8), pp. 3145-9. Nguyen, K.Q., 2013, Situational Analysis - Vietnam. Unpublished report for the CGIAR-Australia Aid funded project on the Potential for deployment of renewables energies in the Lower Mekong Basin. Hanoi, Vietnam. Nguyen, N.Q., 2009, Ba Ria Thermal Power JSC Prelisting report. SSI, Research and Investment Advisory, Ho Chi Minh City, Vietnam. Nguyen, T.N., Ha-Duong, M., Tran, T.C., Shrestha, R.M. & Nadaud, F., 2010, Barriers to the adoption of cleaner and energy efficient technologies in Vietnam, GMSARN International Journal, 4(2). Nguyen, X.T., 2010, Viet Nam's Infrastructure Constraints. UNDP Policy Dialogue Paper, Ho Chi Minh city, Vietnam. Nguyen, N.T., 2011, Programming Sustainable Development in a Developing Country: A Social Optimization of the Vietnamese Power Sector. PhD Thesis. EHESS, Paris, France. Nilsson, M., Nilsson, L.J., Hildingsson, R., Stripple, J. & Eikeland, P.O., 2011, The missing link: Bringing institutions and politics into energy future studies, Futures, 43(10), pp. 1117-28. North, D.C., 1990a, Institutions, institutional change, and economic performance, Cambridge University Press, Cambridge, UK. North, D.C., 1990b, A Transaction Cost Theory of Politics, Journal of Theoretical Politics, 2(4), pp. 355-67. North, D.C., 1994, Economic Performance Through Time, The American Economic Review, 84(3), pp. 359-68. North, D.C., 2005, Understanding the process of economic change, Princeton University Press, Princeton, N.J., USA. North, D.C. & Thomas, R.P., 1973, The Economic History Review, Cambridge University Press, Cambridge, UK. North, D.C., Wallis, J.J. & Weingast, B.R., 2009, Violence and social orders, Cambridge University Press, Cambridge, UK. NREL & DOE, 2013, Transparent cost database, Open Energy Info. Retrieved May 5, 2013, from http://en.openei.org/apps/TCDB/ OECD, 1992, Technology and the Economy: The key relationships. OECD, Paris, France.
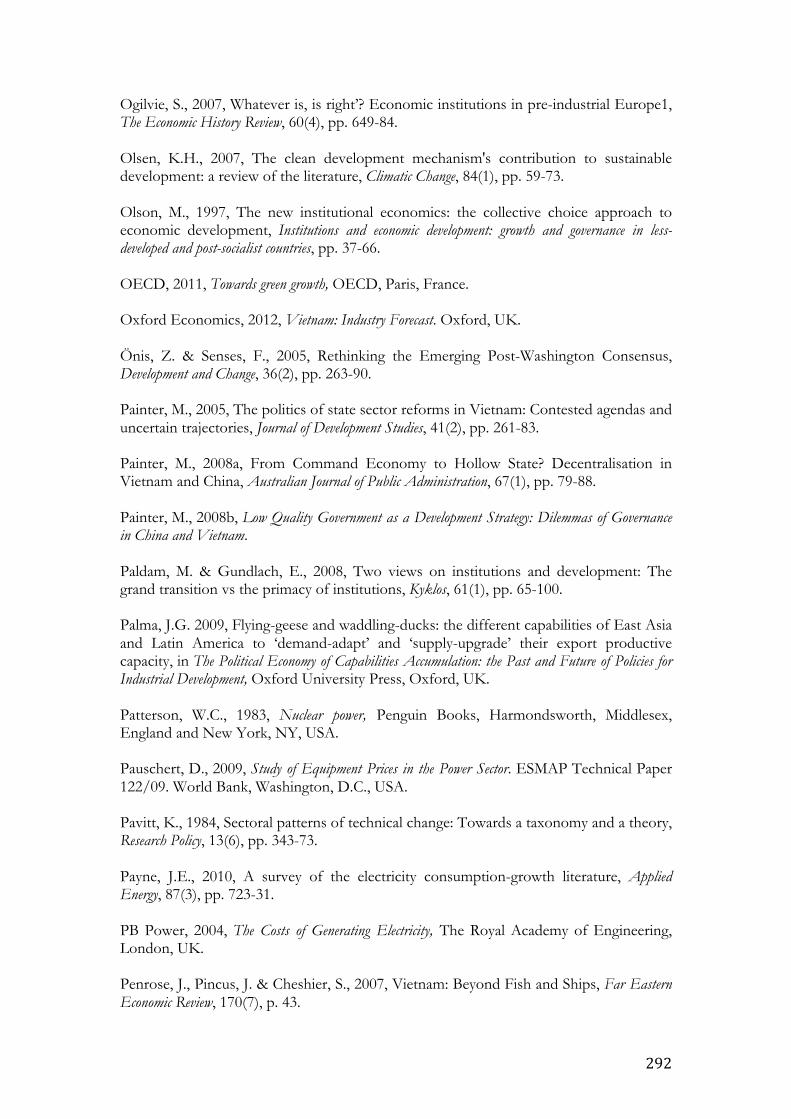
292
Ogilvie, S., 2007, Whatever is, is right’? Economic institutions in pre-industrial Europe1, The Economic History Review, 60(4), pp. 649-84. Olsen, K.H., 2007, The clean development mechanism's contribution to sustainable development: a review of the literature, Climatic Change, 84(1), pp. 59-73. Olson, M., 1997, The new institutional economics: the collective choice approach to economic development, Institutions and economic development: growth and governance in less-developed and post-socialist countries, pp. 37-66. OECD, 2011, Towards green growth, OECD, Paris, France. Oxford Economics, 2012, Vietnam: Industry Forecast. Oxford, UK. Önis, Z. & Senses, F., 2005, Rethinking the Emerging Post-Washington Consensus, Development and Change, 36(2), pp. 263-90. Painter, M., 2005, The politics of state sector reforms in Vietnam: Contested agendas and uncertain trajectories, Journal of Development Studies, 41(2), pp. 261-83. Painter, M., 2008a, From Command Economy to Hollow State? Decentralisation in Vietnam and China, Australian Journal of Public Administration, 67(1), pp. 79-88. Painter, M., 2008b, Low Quality Government as a Development Strategy: Dilemmas of Governance in China and Vietnam. Paldam, M. & Gundlach, E., 2008, Two views on institutions and development: The grand transition vs the primacy of institutions, Kyklos, 61(1), pp. 65-100. Palma, J.G. 2009, Flying-geese and waddling-ducks: the different capabilities of East Asia and Latin America to ‘demand-adapt’ and ‘supply-upgrade’ their export productive capacity, in The Political Economy of Capabilities Accumulation: the Past and Future of Policies for Industrial Development, Oxford University Press, Oxford, UK. Patterson, W.C., 1983, Nuclear power, Penguin Books, Harmondsworth, Middlesex, England and New York, NY, USA. Pauschert, D., 2009, Study of Equipment Prices in the Power Sector. ESMAP Technical Paper 122/09. World Bank, Washington, D.C., USA. Pavitt, K., 1984, Sectoral patterns of technical change: Towards a taxonomy and a theory, Research Policy, 13(6), pp. 343-73. Payne, J.E., 2010, A survey of the electricity consumption-growth literature, Applied Energy, 87(3), pp. 723-31. PB Power, 2004, The Costs of Generating Electricity, The Royal Academy of Engineering, London, UK. Penrose, J., Pincus, J. & Cheshier, S., 2007, Vietnam: Beyond Fish and Ships, Far Eastern Economic Review, 170(7), p. 43.
293
Pereira, M., 2008, Review of power system expansion planning in Vietnam. World Bank. Unpublished consultancy report. Perkins, D. & Vu, T.T.A., 2010, Viet Nam's Industrial Policy - Designing Policies for sustainable Development, Paper Number 3. John F. Kennedy School of Government, Harvard University, Cambridge, M.A., USA. Pham, P., Nguyen, N. & Nguyen, H.D., 2011, Energy supply, demand, and policy in Viet Nam, with future projections, Energy Policy, 39(11), pp. 6814-26. Pierson, P., 2000, Increasing Returns, Path Dependence, and the Study of Politics, The American Political Science Review, 94(2), pp. 251 - 267. Pierson, P., 2004, Politics in time: History, institutions, and social analysis, Princeton University Press, Princeton, N.J., USA. Pincus, J., 2009, Vietnam: Sustaining Growth in Difficult Times, Asean Economic Bulletin, 26(1), pp. 11-24. Pincus, J. & Vu, T.T.A., 2008, Vietnam feels the heat, Far Eastern Economic Review, 171(4), pp. 28-34. Pinkse, J. & Kolk, A., 2010, Challenges and trade-offs in corporate innovation for climate change, Business Strategy and the Environment, 19(4), pp. 261-72. PM (Prime Minister), 2006, Decision on forming the parent company - Vietnam Electricity Group. 148/2006/QD-TTg. Hanoi, Vietnam Pollitt, M.G., 2012, The role of policy in energy transitions: Lessons from the energy liberalisation era, Energy Policy. Volume 50, November 2012, pp.128–137 Pond, R., 2006, Liberalisation, privatisation and regulation in the UK electricity sector. PIQUE Research Paper, Working Lives Research Institute, London Metropolitan University, London, UK. Popp, D., 2002, Induced innovation and energy prices , American Economic Review, 92(1), pp. 160-80. Popp, D., 2005, Lessons from patents: Using patents to measure technological change in environmental models, Ecological Economics, 54(2-3), pp. 209-26. Popp, D., 2010, Innovation and climate policy. NBER Working Paper 15673. Availble at http://www.nber.org/papers/w15673 15673. Popp, D., 2011a, International Technology Transfer, Climate Change, and the Clean Development Mechanism, Review of Environmental Economics and Policy, 5(1), pp. 131-52. Popp, D., 2011b, The Role of Technological Change in Green Growth. Draft report for the World Bank. Retrived from http://faculty.maxwell.syr.edu/dcpopp/index.html on 2 February 2012.
294
Popp, D.C., Newell, R.G. & Jaffe, A.B., 2009, Energy, the Environment, and Technological Change. NBER Working Paper 14832. Availble at http://www.nber.org/papers/w14832 Porta, R.L., Lopez-de-Silane, F., Shleifer, A. & Vishny, R.W., 1996, Law and finance. NBER Working Paper 5661. Availble at http://www.nber.org/papers/w5661 Power Engineering International, 2013, A land of both opportunities and challenges, 4 September 2013. Power Insider, 2013a, Chinese investing heavily in Vietnam power market, 25 June 2013. Power Insider, 2013b, Residents resentful over EVN monopoly and price hikes, 27 August 2013. Prahalad, C.K., 1993, The role of core competencies in the corporation, Research Technology Management, 36, pp. 40 - 47. Pritchett, L., 1997, Divergence, big time, The Journal of Economic Perspectives, 11(3), pp. 3-17. Pritchett, L., 2000, Understanding patterns of economic growth: Searching for hills among plateaus, mountains, and plains, The World Bank Economic Review, 14(2), pp. 221-50. Probert, J. & Young, S.D., 1995, The Vietnamese road to capitalism: Decentralisation,de facto privatisation and the limits to piecemeal reform, Communist Economies and Economic Transformation, 7(4), pp. 499-525. Przeworski, A. & Limongi, F., 1993, Political Regimes and Economic Growth, The Journal of Economic Perspectives, 7(3), pp. 51-69. PVN, 2012, Partnership with Petrovietnam 2012. Retrieved from http://www.subseauk.com/documents/partnership%20with%20petrovietnam%202012.pdf on 26 October 2012. Quang, T.N. & Diep Hoai, N., 2003, BOT Project Financing in Vietnam. YKVN Lawyers, Ho Chi Minh City, Vietnam. Quinn, B.J., 1998, Review of power sector reform issues in Viet Nam. Development Discussion Paper No. 620. Harvard Institute for International Development. Retrieved from http://www.cid.harvard.edu/hiid/620.pdf on 23 January 2009. Rama, M., 2008, Making Difficult Choices: Vietnam in Transition. Commission on Growth and Development Working Paper No. 40. World Bank, Washington D.C., USA. Raven, R.P.J.M. & Geels, F.W., 2010, Socio-cognitive evolution in niche development: Comparative analysis of biogas development in Denmark and the Netherlands (1973-2004), Technovation, 30(2), pp. 87-99. Reddy, A.K., 1991, Barriers to improvements in energy efficiency, Energy Policy, 19(10), pp. 953-61.
295
REN21, 2012, Renewables 2012 global status report. Renewable Energy Policy Network, Paris, France. REN21, 2013, Renewables 2013 global status report. Renewable Energy Policy Network, Paris, France. Renewable Energy World, 2012, Mints, P. How Grid Parity (Among Other Fallacies) Almost Killed The Solar Industry, 13 October 2012. Reuters, 2011, UPDATE 2Vietnam's 2012 coal exports to fall, imports eyed, 1 December 2011. Reuters, 2012, Insight: Debt risks lurk in Vietnam's unreformed state giants, 23 August 2012. RFA, 2013, Coal and mineral industries group and EVN are Vietnam's two largest debtors, 12 January 2013. Rip, A. & Kemp, R. 1998, Technological Change, in A Rip, R Kemp, S Rayner & E Malone (eds), Human Choice and Climate Change. An International Assessment , Batelle Press, Washington D.C., pp. 327-99. Robinson, J.A. 2011, Industrial Policy and Development: A Political Economy Perspective, in World Bank, Washington D.C., pp. 61-79. Rodrik, D., 2006, Goodbye Washington consensus? Hello Washington confusion? A review of the World Bank's economic growth in the 1990s: Learning from a decade of reform, Journal of Economic Literature, 44(4), pp. 973-87. Rodrik, D. 2007a, 5 Institutions for Growth, in One Economics Many Recipes, Princeton University Press, Princeton, New Jersey, pp. 153 - 183. Rodrik, D., 2007b, Normalizing industrial policy. Commission on Growth and Development Working Paper No. 3. World Bank, Washington D.C., USA. Rodrik, D., 2008, One economics, many recipes: globalization, institutions, and economic growth, Princeton University Press, N.J., USA. Rodrik, D., 2010a, Diagnostics before prescription, The Journal of Economic Perspectives, 24(3), pp. 33-44. Rodrik, D., Subramanian, A. & Trebbi, F., 2002, Institutions rule: the primacy of institutions over geography and integration in economic development. Retrived from https://www.sss.ias.edu/files/pdfs/Rodrik/Research/institutions-rule.pdf on 14 December 2012. Rogers, M., 2003, A survey of economic growth, Economic Record, 79(244), pp. 112-35. Romer, P., 1991, Endogenous technological change. The Journal of Political Economy, Vol. 98, No. 5, Part 2: The Problem of Development: A Conference of the Institute for the Study of Free Enterprise Systems. (Oct., 1990), pp. S71-S102
296
Romer, P.M., 1986, Increasing returns and long-run growth, The Journal of Political Economy, pp. 1002-37. Romer, P.M., 1989, Human capital and growth: theory and evidence. NBER Working Paper No. 3173. Available at http://www.nber.org/papers/w3173 Romer, P.M., 1994, The Origins of Endogenous Growth, The Journal of Economic Perspectives, 8(1), pp. 3-22. Routley, L., 2012, Developmental states: a review of the literature. ESID Working Paper No. 03, School of Environment and Development, The University of Manchester, Manchester, UK. Rubin, E.S., Taylor, M.R., Yeh, S. & Hounshell, D.A., 2004, Learning curves for environmental technology and their importance for climate policy analysis, Energy, 29(9-10), pp. 1551-9. Ruttan, V.W., 1997, Induced Innovation, Evolutionary Theory and Path Dependence: Sources of Technical Change, The Economic Journal, 107(444), pp. 1520-9. Ruttan, V.W., 1998, The new growth theory and development economics: a survey, The Journal of Development Studies, 35(2), pp. 1-26. Ruttan, V.W., 2001, Technology, growth, and development: An induced innovation perspective, Oxford University Press, USA. Sachs, J.D. & Warner, A.M., 1997, Fundamental sources of long-run growth, The American Economic Review, 87(2), pp. 184-8. Saigon Daily, 2010, Power shortage weights down Vietnam, 23 April 2010. Saigon Daily, 2013, Hydropower plants accountable for damages to residents, 19 November 2013. Saigon Giai Phong, 2012, Small hydropower enterprises accuse EVN for exploiting, 13 June 2012. Saigon Times, 2008, Swiss firm to build wind power plant on Con Dao Island, 11 December 2008. Saigon Times, 2012, Transparency needed to curb corruption, 7 May 2012. Saigon Times, 2013a, EVN's VND 9.3 tril. debts to PVN, Vinacomin, 9 July 2013. Saigon Times, 2013b, Power trader accused of abusing monopoly position, 12 August 2013. Salter, W.E.G. & Reddaway, W.B., 1966, Productivity and technical change. Cambridge University Press, Cambridge, UK.
297
Sanden, B.A. & Azar, C., 2005, Near-term technology policies for long-term climate targets economy wide versus technology specific approaches, Energy Policy, 33(12), pp. 1557-76. Savoia, A., Easaw, J. & McKay, A., 2010, Inequality, Democracy, and Institutions: A Critical Review of Recent Research, World Development, 38(2), pp. 142-54. Sawdon, J., 2011, Investment Environment and Government Policy for Climate Change Adaptation and Mitigation Technology Focused Venture Capital Funds. Final Draft Report. Prepared for the Asian Development Bank Asia Climate Change and Clean Energy Venture Capital Initiative (unpublished). Scherer, F.M., 1982, Demand-pull and technological invention: Schmookler revisited, The Journal of Industrial Economics, XXX(3), pp. 225 - 237. Schleicher-Tappeser, R., 2012, How renewables will change electricity markets in the next five years, Energy Policy, 48, pp. 64-75. Schmidt, T.S., Born, R. & Schneider, M., 2012, Assessing the costs of photovoltaic and wind power in six developing countries, Nature Climate Change, 2(7), pp. 548-53. Schmookler, J., 1962, Changes in Industry and in the State of Knowledge as Determinants of Industrial Invention in The Rate and Direction of Inventive Activity: Economic and Social Factors. Universities-National Bureau, UMI. Retrieved from http://www.nber.org/chapters/c2118.pdf on 28 August 2012. Schot, J. & Geels, F.W., 2008, Strategic niche management and sustainable innovation journeys: theory, findings, research agenda, and policy, Technology Analysis & Strategic Management, 20(5), pp. 537-54. Schumpeter, J.A., 1939, Business cycles, Cambridge University Press, Cambridge, UK. Schumpeter, J.A., 1934, The Theory of Economic Development. Translated from the German by Redvers Opie, Harvard University Press, Cambridge, M.A., USA. Scrase, I. & Smith, A., 2009, The (non-)politics of managing low carbon socio-technical transitions, Environmental Politics, 18(5), pp. 707-26. Severnini, E.R., 2012, The Power of Hydroelectric Dams: Agglomeration Spillovers. Retrieved from https://sites.google.com/site/ersevernini/home on 23 January 2013. Sharpe, H., Nguyen, Q. & Coulthart, A., 2006, Urban Development Strategy. World Bank, Hanoi, Vietnam. Silva, P.C. & Klagge, B., 2013, The Evolution of the Wind Industry and the Rise of Chinese Firms: From Industrial Policies to Global Innovation Networks, European Planning Studies, pp. 1-16. Simon, H.A., 1955, A Behavioral Model of Rational Choice, The Quarterly Journal of Economics, 69(1), pp. 99-118.

298
Simon, H.A., 1959, Theories of Decision-Making in Economics and Behavioral Science, The American Economic Review, 49(3), pp. 253-83. Simon, H.A., 1962, The architecture of complexity, Proceedings of the American philosophical society, 106(6), pp. 467-82. Simon, H.A., 1986, Rationality in Psychology and Economics, The Journal of Business, 59(4), pp. S209-24. Singer, B., 1988, Power politics, Technology and Society Magazine, IEEE, 7(4), pp. 20-7. Sioshansi, F.P., 2009, De-carbonizing electricity generation: It won't be easy, cheap, nor enough, Utilities Policy, 17(3-4), pp. 217-24. Smil, V., 2009, The harsh realities of energy. Seed Magazine, 7 April 2009. Smil, V., 2010, Power Density Primer, Parts I-V. Retrieved from http://vaclavsmil.com/wp-content/uploads/docs/smil-article-power-density-primer.pdf on 17 April 2012. Smith, A., 1776, An Inquiry Into the Nature and Causes of the Wealth of Nations (1999 Reprint). Penguin Classics, London, UK. Smith, A. & Stirling, A., 2007, Moving Outside or Inside? Objectification and Reflexivity in the Governance of Socio-Technical Systems, Journal of Environmental Policy & Planning, 9(3-4), pp. 351-73. Smith, A. & Stirling, A., 2010, The politics of social-ecological resilience and sustainable socio-technical transitions, Ecology and Society, 15(1), p. 11. Smith, A., Stirling, A. & Berkhout, F., 2005, The governance of sustainable socio-technical transitions, Research Policy, 34(10), pp. 1491-510. Smits, J.P., Woltjer, P.J. & Ma, D., 2008, A Dataset on Comparative Historical Accounts , ca. 1870 -1950: A Time-Series Perspective [computer file]. Smits, M. & Bush, S.R., 2010, A light left in the dark: The practice and politics of pico-hydropower in the Lao PDR, Energy Policy, 38(1), pp. 116-27. Soderholm, P. & Sundqvist, T., 2007, Empirical challenges in the use of learning curves for assessing the economic prospects of renewable energy technologies, Renewable Energy, 32(15), pp. 2559-78. Soete, L., 1985, International Diffusion of Technology, Industrial Development and Technological Leapfrogging, World Development, 13(3), pp. 409 - 422. Soete, L., 2007, From Industrial to Innovation Policy, Journal of Industry, Competition and Trade, 7(3-4), pp. 273-84. Solomon, B.D. & Krishna, K., 2011, The coming sustainable energy transition: History, strategies, and outlook, Energy Policy, 39(11), pp. 7422-31.
299
Solow, R.M., 1956, A Contribution to the Theory of Economic Growth, The Quarterly Journal of Economics, 70(1), pp. 65-94. Solow, R.M., 1957, Technical Change and the Aggregate Production Function, The Review of Economics and Statistics, 39(3), pp. 312-20. Solow, R.M., 1994, Perspectives on growth theory, The Journal of Economic Perspectives, 8(1), pp. 45-54. Sovacool, B.K., 2008, Placing a glove on the invisible hand: How intellectual property rights may implede innovation in energy resarch and development, Albany Law Journal of Science and Technology(18). Sovacool, B.K., 2008, Renewable Energy: Economically Sound, Politically Difficult, The Electricity Journal, 21(5), pp. 18-29. Sovacool, B.K., 2009, The intermittency of wind, solar, and renewable electricity generators: Technical barrier or rhetorical excuse? Utilities Policy, 17(3-4), pp. 288-96. Sovacool, B.K., 2012, Design principles for renewable energy programs in developing countries, Energy & Environmental Science. Sovacool, B.K. & Valentine, S.V., 2010, The socio-political economy of nuclear energy in China and India, Energy, 35(9), pp. 3803-13. Spencer, R., 2011, Vietnam's Power Sector: An Overview. Power Sector Experience Sharing Event Dhaka February 9, 2011. Retrieved from https://www.esmap.org/sites/esmap.org/files/Vietnam's%20Power%20Sector%20.pdf on 3 February 2013. Srinivasan, T.N., 1995, Long-run growth theories and empirics: anything new? in Growth Theories in Light of the East Asian Experience Takatoshi Ito and Anne O. Krueger, (eds), University of Chicago Press, Chicago, USA. Steiner, F., Co-operation, O.F.E. & Dept, D.E., 2000, Regulation, industry structure and performance in the electricity supply industry, OECD, Paris, France. Stern, D.I., 2011, The role of energy in economic growth, Ann NY Acad Sci, 1219, pp. 26-51. Stern, N., 2007, The Economics of Climate Change: The Stern Review, 2007 ed. Cambridge University Press, Cambridge, UK. Steves, F., Treisman, D. & Teytelboym, A., 2011, Political Economy of Climate Change in the Transition Region. Stubbs, R., 2008, Rethinking Asia's Economic Miracle: The Political Economy of War, Prosperity, and Crisis, Journal of International Relations and Development, 11(3), pp. 317-9. Suárez, F.F. & Utterback, J.M., 1995, Dominant designs and the survival of firms, Strategic Management Journal, 16(6), pp. 415-30.
300
Szirmai, A., 2011, Industrialisation as an Engine of Growth in Developing Countries, 1950-2005, Structural Change and Economic Dynamics. Tabellini, G., 2005, The Role of the State in Economic Development, Kyklos, 58(2), pp. 283-303. Tainter, J.A., 2011, Energy, complexity, and sustainability: A historical perspective, Environmental Innovation and Societal Transitions, 1(1), pp. 89-95. Tan, J., 2011, Infrastructure privatisation: oversold, misunderstood and inappropriate, Development Policy Review, 29(1), pp. 47-74. Teece, D.J. 2000, Chapter 4 Firm Capabilities and Economic Development: Implications for Newly Industrialising Economies, in Technology, Learning, and Innovation: Experiences of Newly Industrializing Economies, Cambridge University Press, Cambridge UK, pp. 105-28. Temple, J., 1999, The New Growth Evidence, Journal of Economic Literature, 37(1), pp. 112-56. Temple, J., 2006, Aggregate production functions and growth economics, International Review of Applied Economics, 20(3), pp. 301-17. Thai, N.F., 2000, Hoa Binh Hydroelectric Power Plant on the Da River in the Socialist Republic of Vietnam: Ten Years of Service, Hydrotechnical Construction, 34(3). Thanh Nien, 2012a, EVN chairman dismissed for poor performance, 5 February 2012. Thanh Nien, 2012b, Power price hike spotlights EVN opacity, 28 December 2012. Thanh Nien, 2013a, Power prices in Vietnam go up again, 1 August 2013. Thanh Nien, 2013b, EVN monopoly evokes resentment over price hike, 26 August 2013. Thanh Nien Daily, 2012, An, D., Damning evidence no match for dam pushers, 7 December 2012. Thanh Nien News, 2011, State will continue to dominate power market, 29 July 2011. Thanh Nien News, 2012, Hydropower lucre hides major fault lines, 5 October 2012. Thao, N.D., 2004, Development strategy and the application of circulating fluidized bed combustion in power generation projects of Vietnam National Coal Corporation (VINACOAL), Electricity Supply Industry in Transition: Issue and Prospect for Asia. Thayer, C., 1992, Political reform in Vietnam: Doi moi and the emergence of civil society, The development of civil society in communist systems, pp. 110-29. Thayer, C.A., 2008, Upholding State Sovereignty Through Global Integration.Paper presented to Workshop on “Viet Nam, East Asia & Beyond” Southeast Asia Research Centre, City University of Hong Kong Hong Kong, December 11-12, 2008. Retrieved
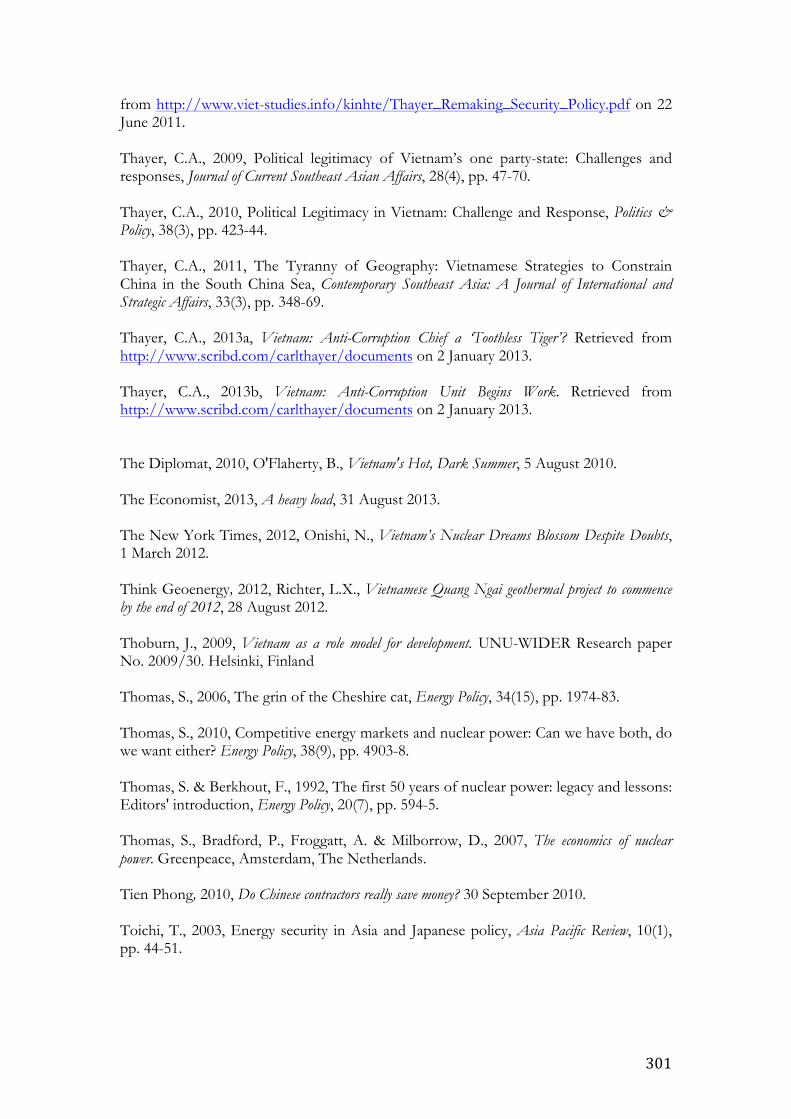
301
from http://www.viet-studies.info/kinhte/Thayer_Remaking_Security_Policy.pdf on 22 June 2011. Thayer, C.A., 2009, Political legitimacy of Vietnam’s one party-state: Challenges and responses, Journal of Current Southeast Asian Affairs, 28(4), pp. 47-70. Thayer, C.A., 2010, Political Legitimacy in Vietnam: Challenge and Response, Politics & Policy, 38(3), pp. 423-44. Thayer, C.A., 2011, The Tyranny of Geography: Vietnamese Strategies to Constrain China in the South China Sea, Contemporary Southeast Asia: A Journal of International and Strategic Affairs, 33(3), pp. 348-69. Thayer, C.A., 2013a, Vietnam: Anti-Corruption Chief a ‘Toothless Tiger’? Retrieved from http://www.scribd.com/carlthayer/documents on 2 January 2013. Thayer, C.A., 2013b, Vietnam: Anti-Corruption Unit Begins Work. Retrieved from http://www.scribd.com/carlthayer/documents on 2 January 2013. The Diplomat, 2010, O'Flaherty, B., Vietnam's Hot, Dark Summer, 5 August 2010. The Economist, 2013, A heavy load, 31 August 2013. The New York Times, 2012, Onishi, N., Vietnam’s Nuclear Dreams Blossom Despite Doubts, 1 March 2012. Think Geoenergy, 2012, Richter, L.X., Vietnamese Quang Ngai geothermal project to commence by the end of 2012, 28 August 2012. Thoburn, J., 2009, Vietnam as a role model for development. UNU-WIDER Research paper No. 2009/30. Helsinki, Finland Thomas, S., 2006, The grin of the Cheshire cat, Energy Policy, 34(15), pp. 1974-83. Thomas, S., 2010, Competitive energy markets and nuclear power: Can we have both, do we want either? Energy Policy, 38(9), pp. 4903-8. Thomas, S. & Berkhout, F., 1992, The first 50 years of nuclear power: legacy and lessons: Editors' introduction, Energy Policy, 20(7), pp. 594-5. Thomas, S., Bradford, P., Froggatt, A. & Milborrow, D., 2007, The economics of nuclear power. Greenpeace, Amsterdam, The Netherlands. Tien Phong, 2010, Do Chinese contractors really save money? 30 September 2010. Toichi, T., 2003, Energy security in Asia and Japanese policy, Asia Pacific Review, 10(1), pp. 44-51.
302
Torvanger, A. & Meadowcroft, J., 2011, The political economy of technology support: Making decisions about carbon capture and storage and low carbon energy technologies, Global Environmental Change, 21(2), pp. 303-12. Tran, N.B. & Jones, R., 2011, Value Chain and Policy Analysis of Fossil Fuel Trade, Subsidy and Tax. Package One: Draft Report. Tran, T.Q., 2009, Sudden surge in FDI and infrastructure bottlenecks: The case in Vietnam, Asean Economic Bulletin, 26(1), pp. 58-76. Tafunell, X., 2011, The electric revolution in Latin America, Universitat Pompeu Fabra - Barcelona (Spain). Retrieved from http://repositori.upf.edu/bitstream/handle/10230/11713/1236.pdf?sequence=1 on 5 May 2012. Tuoi Tre, 2011, Ministry inspects salaries at power group, 23 December 2011. Tuoi Tre, 2012a, Chinese contractor quits with plant still unfinished, 14 September 2012. Tuoi Tre, 2012b, EVN asked to divest from realty, banking sector, 24 November 2012. Tuoi Tre, 2013, Massive power outage across southern Vietnam, 22 May 2013. Turnheim, B. & Geels, F.W., 2012, Regime destabilisation as the flipside of energy transitions: Lessons from the history of the British coal industry (1913–1997), Energy Policy, 50, pp. 35-49. Tversky, A. & Kahneman, D., 1986, Rational choice and the framing of decisions, Journal of business, pp. 251-78. UN, 1952, World Energy Supplies in Selected Years 1929 - 1950. United Nations, New York, N.Y., USA. UNCTAD, 2008, World Investment Report 2008: Transnational Corporations and the Infrastructure Challenge. Geneva, Switzerland. UNDP, 2006, Impacts of Basic Public Services Liberalization on the Poor and Marginalized People: The Case of Health, Education and Electricity in Viet Nam. Hanoi, Vietnam. Unruh, G.C., 2000, Understanding carbon lock-in, Energy Policy, 28(12), pp. 817-30. Unruh, G.C., 2002, Escaping carbon lock-in, Energy Policy, 30(4), pp. 317-25. Unruh, G.C. & Carrillo-Hermosilla, J., 2006, Globalizing carbon lock-in, Energy Policy, 34(10), pp. 1185-97. Urban, F., Nordensvärd, J. & Zhou, Y., 2012, Key actors and their motives for wind energy innovation in China, Innovation and Development, 2(1), pp. 111-30. Valentine, S.V. & Sovacool, B.K., 2010, The socio-political economy of nuclear power development in Japan and South Korea, Energy Policy, 38(12), pp. 7971-9.
303
Van Arkadie, B. & Mallon, R., 2003, Viet Nam: a transition tiger? Asia Pacific Press. National Library of Australia. Canberra, Australia. van den Bergh, J., 2007, Evolutionary thinking in environmental economics, Journal of Evolutionary Economics, 17(5), pp. 521-49. Veblen, T., 1900, The preconceptions of economic science, The Quarterly Journal of Economics, 14(2), pp. 240-69. Veblen, T., 1998, Why is economics not an evolutionary science? Cambridge Journal of Economics, 22, pp. 403-14. Verbong, G. & Geels, F., 2007, The ongoing energy transition: Lessons from a socio-technical, multi-level analysis of the Dutch electricity system (1960-2004), Energy Policy, 35(2), pp. 1025-37. Verbong, G.P.J. & Geels, F.W., 2010, Exploring sustainability transitions in the electricity sector with socio-technical pathways, Technological Forecasting and Social Change, 77(8), pp. 1214-21. Verdolini, E. & Galeotti, M., 2011, At home and abroad: An empirical analysis of innovation and diffusion in energy technologies, Journal of Environmental Economics and Management, 61(2), pp. 119-34. Victor, D.G. & Heller, T.C., 2007, The political economy of power sector reform: the experiences of five major developing countries, Cambridge University Press, Cambridge, UK. Vietnam Business Forum, 2010, Minh, H., Pha Lai Thermal Power JSC: Full Operation to Power National Economy, 17 August 2010. Vietnam Business News, 2011, VietBiz24, Electricity producers facing difficulties in price negotiation with EVN, 22 June 2011. Vietnam Investment Review, 2008, PVN “hunt” 13 power projects, 23 September 2008. Vietnam Investment Review, 2013a, EVN's power pricing rationale questioned, 11 May 2013. Vietnam Investment Review, 2013b, Foster, T. A, Difficult road to smooth PPP projects, 4 June 2013. Vietnam Investment Review, 2013c, Chinese plug into local power, 19 June 2013. VietNamNet, 2013, Phong, T., EVN too lazy to generate electricty, 15 March 2013. VietNamNet Bridge, 2008, An, D., Vietnam real estate: Property fever and burnt fingers, 25 March 2008. VietNamNet Bridge, 2009a, Current low electricity prices must go, say 'big three', 2009.

304
VietNamNet Bridge, 2009b, PetroVietnam – Gas shortage not only reason for electricity shortage, 6 March 2009. VietNamNet Bridge, 2009c, Vinacomin still cannot get agreement with EVN on electricity price, 20 March 2009. VietNamNet Bridge, 2009d, Electricity price negotiations to precede power plant construction? 23 May 2009. VietNamNet Bridge, 2011a, EVN accused of pressing price down, not providing enough electricty, 23 June 2011. VietNamNet Bridge, 2011b, EVN accused of pressing prices down, not providing enough electricty, 23 June 2011. VietNamNet Bridge, 2012a, Thuy, T., EVN in the reign of Dao Van Hung: time of powercuts, 16 February 2012. VietNamNet Bridge, 2012b, EVN in the reign of Dao Van Hung: the reputable and disreputable events, 20 February 2012. VietNamNet Bridge, 2013, Big guys' alliance causes worry about monopoly in energy sector, 11 March 2013. Viet Nam News, 2005a, The notorious ‘Hoa Binh Reservoir effect’, 6 May 2005. Viet Nam News, 2005b, Severe droughts hurt power supplier, 30 April 2005. Viet Nam News, 2005c, The whole northern half had to cut power consumption, 24 May 2005. Viet Nam News, 2005d, Higher electricity prices on the way, 9 September 2005. Viet Nam News, 2005e, Electric utility elbows into telecom services, 20 January 2005. Viet Nam News, 2005f, EVN plans big cellphone investment, 16 May 2005. Viet Nam News, 2005g, Gov't to help EVN build infrastructure, 4 July 2005. Viet Nam News, 2006a, Power plant trouble prompts power cuts, 14 June 2006. Viet Nam News, 2006b, Power shortages disrupt daily life, 30 June 2006. Viet Nam News, 2006c, EVN reports falling profits, 7 January 2006. Viet Nam News, 2006d, Ministry evaluates revised power rates, 16 March 2006. Viet Nam News, 2006e, Lower electricity rates await market reforms, 26 October 2006. Viet Nam News, 2006f, EVN Telecom prepares to take on mobile giants, 8 March 2006. Viet Nam News, 2006g, EVN forms its own securities company, 8 August 2006.
305
Viet Nam News, 2006h, EVN, partners to form reinsurer, 24 August 2006. Viet Nam News, 2006i, Banks agree to co-finance power plants, 24 April 2006. Viet Nam News, 2006j, Vietcombank exceeds 15% loan limit, 9 October 2006. Viet Nam News, 2006k, Banks pump cash into EVN, 27 May 2006. Viet Nam News, 2007a, State electric company predicts power shortage, 2 March 2007. Viet Nam News, 2007b, Power outages irk city dwellers, 4 April 2007. Viet Nam News, 2007c, Gov't seeks power shortage end, 10 April 2007. Viet Nam News, 2007d, Multi-sector expansion: the upside and downside, 16 November 2007. Viet Nam News, 2007e, World Bank concerns over power scheme needless: EVN executive, 13 June 2007. Viet Nam News, 2007f, Centralised power buys undercut aims of electricity market: expert, 13 June 2007. Viet Nam News, 2007g, Lending limits lifted for EVN projects, 24 January 2007. Viet Nam News, 2007h, Faster equitization key to powering country, 29 March 2007. Viet Nam News, 2007i, Private electricity plants encouraged, 5 March 2007. Viet Nam News, 2007j, Petrovietnam looks to electricty, 16 June 2007. Viet Nam News, 2008a, EVN director can't guarantee dry-season demand, 13 February 2008. Viet Nam News, 2008b, EVN sheds light on power shortage, 29 April 2008. Viet Nam News, 2009, Viet Nam faces severe power shortage for next few years, 11 August 2009. Viet Nam News, 2010, Dry rivers spell power shortage, 21 April 2010. Viet Nam News, 2011a, Electricity price hike ‘vital’ - Opinion - VietNam News, 13 December 2011. Viet Nam News, 2011b, Likely electric rate hikes worry industry, 14 May 2011. Viet Nam News, 2012a, Firm 'misused $508 million in State-owned funds', 5 April 2012. Viet Nam News, 2012b, Busting the electric monopoly, 21 July 2012. Viet Nam News, 2012c, EVN in the reign of Dao Van Hung: the telecom, finance disillusion, 8 February 2012.
306
Viet Nam News, 2012d, Ending the power monopoly, 24 October 2012. Vinacomin, 2012, Vinacomin and EVN's electricity purchase power costs PVN, 11 May 2012. VoV (Voice of Vietnam), 2010, Energy group asks for 50 percent price hike, 17 August 2010. Vollebergh, H., 2007, Impacts of Environemntal Policy. Instruments on Technological Change Environment Directorate Centre for Tax Policy and Administration. OECD, Paris, France. von Tunzelmann, N.v., 2003, Historical coevolution of governance and technology in the industrial revolutions, Structural Change and Economic Dynamics, 14(2003), pp. 365 - 384. Vujić, J., Antić, D.P. & Vukmirović, Z., 2012, Environmental impact and cost analysis of coal versus nuclear power: The U.S. case, Energy. Volume 45, Issue 1, September 2012, pp. 31–42 Vuong, Q.H. & Tran, T.D., 2010, Corporate Bond Market in the Transition Economy of Vietnam, 1990-2010, Centre Emile Bernheim Research Institute in Management Sciences Working Paper, 10(001). Vuong, Q.H. & Tran, T.D., 2010, Vietnam’s Corporate Bond Market, 1990-2010: Some Reflections, Journal of Economic Policy and Research, 6(1), pp. 1-46. Vuving, A.L., 2010, Vietnam: A tale of four players, Southeast Asian Affairs, 2010(1), pp. 366-91. Wade, R., 2004, Governing the market: Economic theory and the role of government in East Asian industrialization, Princeton University Press, Princeton, N.J., USA. Wade, R., 2009, Beware what you wish for: Lessons for international political economy from the transformation of economics, Review of International Political Economy, 16(1), pp. 106-21. Walz, R. & Delgado, J.N., 2012, Different routes to technology acquisition and innovation system building? China's and India's wind turbine industries, Innovation and Development, 2(1), pp. 87-109. Walz, R. & Marscheider-Weidermann, F., 2011, Technology-specific absorptive capacities for green technologies in Newly Industrialising Countries, International Journal of Technology and Globalisation, 5(3/4), pp. 212 - 229. Wamukonya, N., 2003, Power sector reform in developing countries: mismatched agendas, Energy Policy, 31(12), pp. 1273-89. Watson, J., 2004, Selection environments, flexibility and the success of the gas turbine, Research Policy, 33(8), pp. 1065-80. Watson, J., Byrne, R., Stua, M., Ockwell, D., Xiliang, Z., Da, Z., Tianhou, Z., Xiaofeng, Z., Xunmin, O. & Mallett, A., 2011, UK-China Collaborative Study on Low Carbon Technology Transfer.
307
WCD, 2001, Financial, Economic and Distributional Analysis.Unpublished background paper for the World Commission on Dams. WCD, 2000, Dams and Development: A New Framework for Decision-making: the Report of the World Commission on Dams, November 2000, Routledge, London, UK. Weingast, B.R., 1997, The Political Foundations of Democracy and the Rule of Law, The American Political Science Review, 91(2), pp. 245-63. White, M.W., Joskow, P.L. & Hausman, J., 1996, Power struggles: Explaining deregulatory reforms in electricity markets, Brookings Papers on Economic Activity. Microeconomics, 1996, pp. 201-67. Williams, J. H., & Ghanadan, R., 2006, Electricity reform in developing and transition countries: A reappraisal, Energy, 31(6-7), pp. 815-44. Williams, J.H., & Dubash, N.K., 2004, Asian Electricity Reform in Historical Perspective, Pacific Affairs, Vol. 77(No. 3). Williamson, O.E., 1985, The Economic Institutions of Capitalism Firms Markets Relational Contracting, Free Press, New York, N.Y., USA. Williamson, O.E., 1998, Transaction cost economics: How it works; Where it is headed, Economist, 146(1), pp. 23-58. Williamson, O.E., 2000, The new institutional economics: Taking stock, looking ahead, Journal of Economic Literature, 38(3), pp. 595-613. Wilson, C., 2012, Up-scaling, formative phases, and learning in the historical diffusion of energy technologies, Energy Policy, 50, pp. 81-94. Wilson, D. & Stupnytska, A., 2007, The N-11: More Than an Acronym. Retrieved from http://www.goldmansachs.com/our-thinking/archive/archive-pdfs/brics-book/brics-chap-11.pdf on 27 July 2011. Winkler, H., Simões, A.F., Rovere, E.L.L., Alam, M., Rahman, A. & Mwakasonda, S., 2011, Access and Affordability of Electricity in Developing Countries, World Development, 39(6), pp. 1037-50. Winskel, M., 2002, When Systems are Overthrown: The ‘Dash for Gas’ in the British Electricity Supply Industry, Social Studies of Science, 32(4), pp. 563-98. Wood, E.M., 2002, The origin of capitalism: a longer view, Verso Books, London, UK. Woodhouse, E.J., 2005, Presented at the General Counsel’s Roundtable, The Experience with Independent Power Projects in Developing Countries: Interim Report. Program on Energy and Sustainable Development, Stanford University, Stanford University.
308
Woodhouse, E.J., 2006, The Obsolescing Bargain Redux? Foreign Investment in the Electric Power Sector in Developing Countries, International Law and Politics, 38(121), pp. 121 - 220. World Bank, 1993, Viet Nam Energy Sector Investment and Policy Review. Volume I - Main report. Washington, D.C., USA. World Bank, 1996, Viet Nam Power Development Project. Washington, D.C., USA. World Bank, 1997, Proposed credit in the amount of US$ 199 million equivalent to the socialist republic of Vietnam for a transmission, distribution and disaster reconstruction project (17016-VN). Washington, D.C., USA. World Bank, 1999, Fueling Vietnam's Development - New Challenges for the Energy Sector.Washington, D.C., USA. World Bank, 2001, Implementation Completion report(IDA -27240) on a credit in the amount of SDR 165 million to the Socialist Republic of Vietnam for a power sector rehabilitation and expansion project (21347-VN). World Bank, 2002, Vietnam System Efficiency Improvement, Equitisation and Renewable. World Bank, 2003, Project Appraisal Document On A Proposed Grant In The Amount Of Us$5.5 Million To The Socialist Republic Of Vietnam For A Demand-Side Management And Energy Efficiency Project.Washington, D.C., USA. World Bank, 2006a, Infrastructure Strategy: Cross-sectoral issues. Hanoi, Vietnam. World Bank, 2006b, Power Strategy: Managing Growth and Reform. Hanoi, Vietnam. World Bank, 2006c, Transport strategy: Transition, Reform and Sustainable Management. Hanoi, Vietnam. World Bank, 2008a, Project Appraisal Document On A Proposed Credit In The Amount Of Sdr 91.1 Million (US$150 Million Equivalent) To The Socialist Republic Of Vietnam For A Rural Distribution Project. Washington, D.C., USA. World Bank, 2008b, Vietnam Development Report 2009: Capital Matters. Hanoi, Vietnam. World Bank, 2009a, Project appraisal document on a proposed credit in the amount of SDR 136.9 million to the Socialist Republic of Vietnam for a Renewable Energy Development Project. Washington, D.C., USA. World Bank, 2009b, Vietnam Power Sector: Generation Options. Hanoi, Vietnam.
309
World Bank, 2010a, Taking Stock. An Update on Vietnam’s Recent Economic Developments. Prepared by the World Bank For the Mid-year Consultative Group Meeting for Vietnam Rach Gia, June 9-10, 2010. Hanoi, Vietnam. World Bank, 2010b, Vietnam Development Report 2011: Natural Resources Management. Hanoi, Vietnam. World Bank, 2010c, Vietnam Gas Sector Development Framework. Hanoi, Vietnam. World Bank, 2010d, World Development Report 2010: Development and Climate Change, World Bank, Washington D.C., USA. World Bank, 2011a, Doing Business in a more transparent world. Washington D.C., USA. World Bank, 2011b, State and People, Central and Local, Working Together: The Vietnam Rural Electrification Experience. Hanoi, Vietnam. World Bank, 2011c, Vietnam Development Report 2012: Market Economy For A Middle-Income Vietnam. Hanoi, Vietnam. World Bank, 2012a, Inclusive Green Growth: The Pathway to Sustainable Development. Washington D.C., USA. World Bank, 2012b, Program Document For A Proposed Loan In The Amount Of US$ 100 Million and A Proposed Credit In The Amount Of SDR 64.5 Million (US$100 Million Equivalent) To The Socialist Republic Of Vietnam For A Second Power Sector Reform Development Policy Operation. Washington D.C., USA. World Bank, 2013, World Development Indicators [computer file]. Washington D.C., World Bank [distributor]. Washington D.C., USA. World Bank & PPIAF, 2013, Private Participation in Infrastructure Database [computer file].Washington D.C., USA. Wrigley, E.A., 2011, Energy and the English industrial revolution, Cambridge Books, Cambridge, UK. Wu, W. & Wang, Z., 2006, Combined cooling, heating and power: A review, Progress in Energy and Combustion Science, 32(5-6), pp. 459-95. Wüstenhagen, R. & Menichetti, E., 2012, Strategic choices for renewable energy investment: Conceptual framework and opportunities for further research, Energy Policy, 40, pp. 1-10. Wyatt, A.B., 2002, Asia Power Sector Reforms Workshop 2002, Power Sector Restructuring in Vietnam: The Construction and Transfer of Risk. Bangkok, Thailand. Yeh, E.T. & Lewis, J.I., 2004, State Power and the Logic of Reform in China's Electricity Sector, Pacific Affairs, 77(3), pp. 437-65.
310
Yergin, D., 1996, The Prize: The Epic Quest for Oil, Money and Power. Simon and Shuste, New York, N.Y., USA. Yergin, D., 2006, Ensuring energy security, Foreign Affairs, pp. 69-82. Yergin, D. & Stanislaw, J., 1998, The Commanding Heights: The Battle for the World Economy, New York: Touchstone, New York, USA. Yoo, S.H. & Lee, J.S., 2010, Electricity consumption and economic growth: A cross-country analysis, Energy Policy, 38(1), pp. 622-5. Yoon, W. & Hyun, E., 2009, How Relevant and Useful is the Concept of National Systems of Innovation? Journal of Technology Management and Innovation, 4(3), pp. 1 - 13. Young, A., 1995, The Tyranny of Numbers: Confronting the Statistical Realities of the East Asian Growth Experience, The Quarterly Journal of Economics, 110(3), pp. 641-80.
311
Annexes
A2 Annexes to Chapter 2 A2.1 Linear accounts of technological change: from ‘supply-push’ to ‘demand-
pull’
Schumpeter has been perhaps the most influential account of technological change, in
terms of both this analysis of the process of technological innovation and of the role it
played in understanding economic growth and the business cycle (Foxon 2003).
Schumpeter stressed the ‘creative destruction’ that accompanies technological change as
old firms lumbered with incumbent technologies are replaced by new firms and
technologies (Schumpeter 1934; Schumpeter 1939). Positing a three-stage process of
technological development, composed of invention, innovation and diffusion stages. The
process of technological diffusion was characterized by an S-shaped (sigmoid) curve,
with slow uptake of technologies in the initial stages of development followed by a
period of exponential growth, slowing down once again when the market approaches
saturation (Figure 2.2). Schumpeter regarded the invention stage as a creative process,
and exogenous to the economic process. Innovation and diffusion, however, were both
considered to involve economic decisions made by the firm (Schumpeter 1934). It was
not until the 1950s with the development of greater interest in the causes of productivity
growth and technological change, that the first, three-stage linear model of technological
change emerged and the theoretical work began in earnest (Godin 2006).267
The simple linear model of innovation that emerged in the 1950s and 1960s suggested a
sequential process leading from investment in research and development, through a
process of commercialisation, which culminated in bringing a new technology to market
and leading to the broader diffusion of the technology through market accumulation
(Figure A2.1) (Godin 2006).
267 Although the origins of the linear model are somewhat nebulous and unclear, Godin (2006) argues convincingly that the linear model developed as a rhetorical device used in advocacy by various different interest groups in their competition for resources. The linear model persists despite its inadequacies as it has become embedded in the statistical practices of such organisations as the OECD.

312
Figure A2.1: Simple linear model of technological change
Note: Schumpeterian technological change shown as a three-step process of invention, innovation and
diffusion. In recent years, while maintaining the suggestion of discrete-chorological steps in a linear
process, the number of steps have been elaborated and increased.
Initially, there were two main ways in which the causal processes behind this model were
interpreted. One emphasised a supply-push, where investment in research was deemed to
be a sufficient condition for the development of new technologies and therefore
technological change. The second emphasising ‘demand-pull’, that is the importance of
market demand in stimulating the development of new technology.268 The fundamental
difference between the theories lay in the extent to which the innovation process was
considered independent of short-run changes in the economic environment (Dosi 1982;
Ruttan 1997). Or, more simply put, the difference lies in the emphasis placed on the role
of market forces in the innovation process.
A simplified supply-push approach suggests that scientific research plays the primary
causal role in generating innovation and technological change, albeit with some lag. This
account was found to be unsatisfactory, as demand-side factors seemed to have a clear
role in technological innovation, which a simple supply-push theory cannot incorporate.
In contrast, the demand-pull (induced innovation) account was motivated by the notion
that technological development is responsive to market demand, and that market
demand ‘induces’ innovation. The induced innovation account relied upon a
conventional economic account where technological change was the response of
economic agents to a market signal. The induced innovation account suggests that the
innovation process is driven primarily by market demand, that is to say market demand is
the primary cause of innovation. A version of this approach is attributed to Hicks (1932),
in his suggestion that demand for new technology may be led by changing factor prices:
268 This is a rather crude characterization here they are used in a purely instrumental manner to aid exegesis.
313
“A change in the relative prices of factors of production is itself a spur to innovation and to inventions of a
particular kind - directed at economising the use of a factor which has become relatively expensive” (Hicks
1932: 124-5).
Dosi (1982) drew attention to three main theoretical weaknesses in the simple version of
induced innovation account presented here. Firstly, the account sees technological
change as a purely mechanical reaction to market conditions.269 Secondly, the account is
incapable of explaining why a particular technology appears at a particular time, given
that there are a potentially infinite number of needs to be met (i.e. there is no well-
defined choice set). Finally, the account says nothing about changes in the ability to
invent overtime which may have no direct relationship to market demand. Ruttan (1997)
acknowledges the failings of the induced innovation approach, echoing Dosi’s criticisms:
“The major limitation of the microeconomic version is that its internal mechanism - the learning, search and
formal R&D processes - remains inside a black box. The model is driven by exogenous changes in the
economic environment in which the firm (or public research agency) finds itself.”[emphasis added](Ruttan
1997: 1521)
More nuanced induced innovation accounts allow for pervasive market failures
associated with the innovation process and the possibility of dynamic increasing returns,
both of which can explain inertia in the technological system. These accounts are of
particular relevance to this research as they have been highly influential in guiding the
development of policies to address environmental externalities, and climate change in
particular. A paradigm example is found the discussion of Jaffe et al (2002; 2005) on
policy to promote environmental technological change.
Relying heavily on an induced innovation account, Jaffe (Jaffe et al 2005) and Popp
(Popp 2010) both suggest that dealing with long-term environmental externalities
requires both policies to generate demand for environmental technologies through
internalisation of environmental costs (ideally through market based instruments), and
instruments to address market failures associated with the innovation process.270 Jaffe
269 As Mowery and Rosenberg put it “…innovations are in some sense ‘called forth’ or ‘triggered’ in response to demands for the satisfaction of certain classes of needs.’” (”{Mowery & Rosenberg 1979:\: 104)\}
270 The distinction drawn here is that between market based and command-and-control policy instruments. In principle the former are least cost, at least when polluters face heterogeneous cost curves and the possibility of government failure is high ({Jaffe et al 2002;Hepburn 2010}
314
distinguishes between market failures associated with the innovation process within the
firm, and those associated with the wider diffusion of technology in the market.
As regards innovation, there are knowledge externalities and financial market failures
associated with investment in R&D, which mean that it is likely to be undersupplied by
firms. Firstly, the end product of R&D activities is knowledge mainly about the process
of manufacturing a product. 271 Once such knowledge is created it is difficult to prevent
‘spill over’ to other firms or consumers who can benefit from this knowledge. Thus firms
that invest in R&D are unlikely to be able to capture all or even most of the benefits
associated with that investment. Investment is therefore likely to be undersupplied
relative to the social optimum (Martin & Scott 2000; Jaffe et al 2002; Foxon 2003).
Secondly, unlike investments in capital equipment, investments in R&D have
unpredictable returns, where much of the investment value may result from low
probability high value outcomes. The asset created by R&D activity is also ‘specialised,
sunk and intangible’, which means it cannot be collateralised as debt. Both of these
characteristics of R&D make it difficult to finance externally, particularly a barrier for
small firms with limited internal financial resources (Jaffe et al 2002). 272
The market failure stemming from positive externalities to the production of knowledge
and financial market failures resulting from the intrinsic uncertainty and inappropriability
of the investment in R&D, together mean that R&D investment is below the social
optimum, and that there is thus a prima facie case for public intervention to promote
R&D (Martin & Scott 2000).
Similarly, in relation to the process of diffusion of an innovation in the wider market,
Jaffe et al (Jaffe et al 2002; Jaffe et al 2005) note that dynamic increasing returns are
associated with the scale of adoption of a new technology. These are understood as the
result of positive knowledge externalities relating to learning-by-doing, learning-by-using,
or the formation of networks.273 Learning-by-doing has already been addressed above,
suffice to say this kind of knowledge externality relates to the incremental development
of tacit knowledge of the production process garnered only by engaging in the process
itself. Learning-by-using is usually associated with capital goods and relates to knowledge 271 ‘Learning-by-doing’ see (Arrow 1962) 272 Dosi (1988) expands on the possible market failures in relation to R&D in greater detail. 273 There is an important literature on learning curves and learning rates, which seek to formalize these concepts (e.g. McDonald & Schrattenholzer 2001).
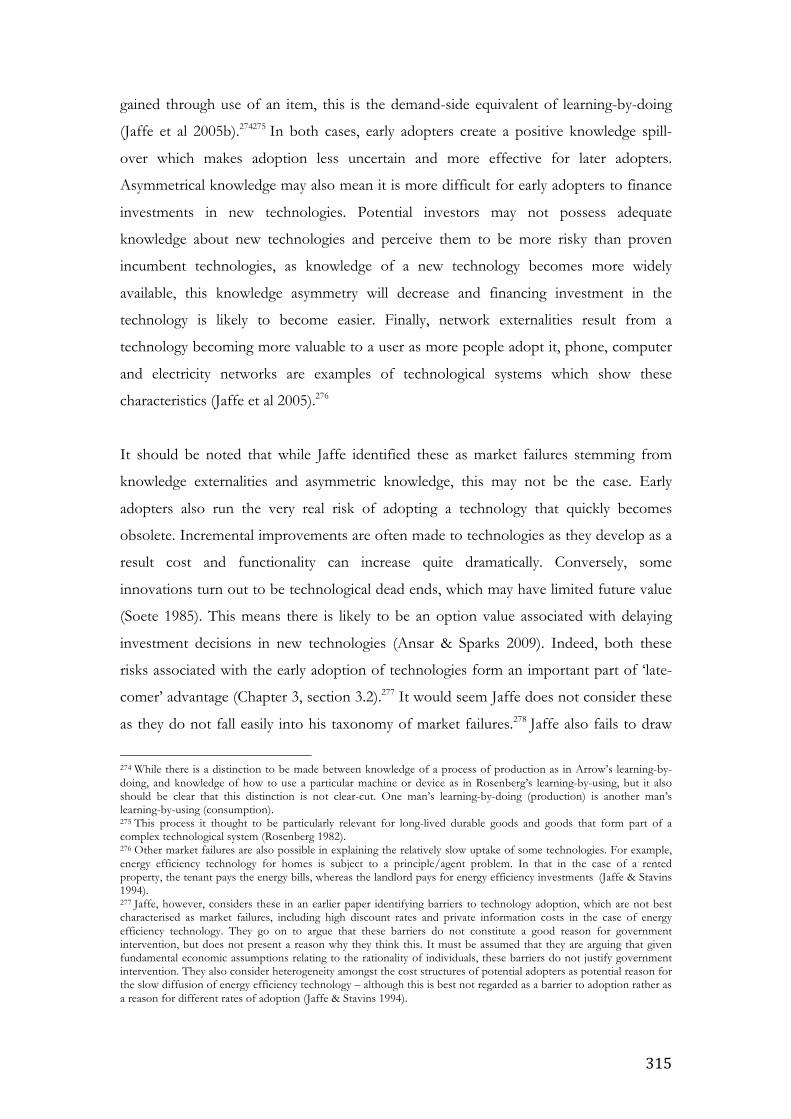
315
gained through use of an item, this is the demand-side equivalent of learning-by-doing
(Jaffe et al 2005b).274275 In both cases, early adopters create a positive knowledge spill-
over which makes adoption less uncertain and more effective for later adopters.
Asymmetrical knowledge may also mean it is more difficult for early adopters to finance
investments in new technologies. Potential investors may not possess adequate
knowledge about new technologies and perceive them to be more risky than proven
incumbent technologies, as knowledge of a new technology becomes more widely
available, this knowledge asymmetry will decrease and financing investment in the
technology is likely to become easier. Finally, network externalities result from a
technology becoming more valuable to a user as more people adopt it, phone, computer
and electricity networks are examples of technological systems which show these
characteristics (Jaffe et al 2005).276
It should be noted that while Jaffe identified these as market failures stemming from
knowledge externalities and asymmetric knowledge, this may not be the case. Early
adopters also run the very real risk of adopting a technology that quickly becomes
obsolete. Incremental improvements are often made to technologies as they develop as a
result cost and functionality can increase quite dramatically. Conversely, some
innovations turn out to be technological dead ends, which may have limited future value
(Soete 1985). This means there is likely to be an option value associated with delaying
investment decisions in new technologies (Ansar & Sparks 2009). Indeed, both these
risks associated with the early adoption of technologies form an important part of ‘late-
comer’ advantage (Chapter 3, section 3.2).277 It would seem Jaffe does not consider these
as they do not fall easily into his taxonomy of market failures.278 Jaffe also fails to draw
274 While there is a distinction to be made between knowledge of a process of production as in Arrow’s learning-by-doing, and knowledge of how to use a particular machine or device as in Rosenberg’s learning-by-using, but it also should be clear that this distinction is not clear-cut. One man’s learning-by-doing (production) is another man’s learning-by-using (consumption). 275 This process it thought to be particularly relevant for long-lived durable goods and goods that form part of a complex technological system (Rosenberg 1982). 276 Other market failures are also possible in explaining the relatively slow uptake of some technologies. For example, energy efficiency technology for homes is subject to a principle/agent problem. In that in the case of a rented property, the tenant pays the energy bills, whereas the landlord pays for energy efficiency investments (Jaffe & Stavins 1994). 277 Jaffe, however, considers these in an earlier paper identifying barriers to technology adoption, which are not best characterised as market failures, including high discount rates and private information costs in the case of energy efficiency technology. They go on to argue that these barriers do not constitute a good reason for government intervention, but does not present a reason why they think this. It must be assumed that they are arguing that given fundamental economic assumptions relating to the rationality of individuals, these barriers do not justify government intervention. They also consider heterogeneity amongst the cost structures of potential adopters as potential reason for the slow diffusion of energy efficiency technology – although this is best not regarded as a barrier to adoption rather as a reason for different rates of adoption (Jaffe & Stavins 1994).
316
any further implications from the acknowledgement of increasing marginal returns to
adoption of a technology, save the reductive assumption that they can be explained by
positive externalities (which can be reductively internalised by providing the right price
signals to economic agents). In a similar vein, in a recent review of the literature, Newell
(2010) also notes the possibility of dynamic increasing returns to the adoption of
technologies, possibly leading to ‘lock-in’, but fails to draw any further conclusions from
this.
Although there is a general agreement that demand has an important role to play in
innovation process, and may even be a necessary condition for innovation, there are
good prima facie reasons to believe that an induced innovation account does not represent
a particularly powerful or enlightening account of the innovation process. On this
account, bounded by the micro-economic canon, the innovation process remains a
‘black-box’ and identifiable market failures remain - if not the sole factors obstructing
innovation – the only suitable levers for policy intervention (Newell 2010). The approach
fails to adequately address the possibility of technological lock-in or that of radical, non-
linear technological change. Nevertheless, the question is an empirical one and the
subject of induced innovation has been a fertile area of empirical research generating a
large empirical literature.
Before going on to look at the empirical work it is important to note that the induced
innovation account has been highly influential in the design of environmental policy, and
in recent years, the design of climate change mitigation policy. At its simplest the induced
innovation account suggests that to encourage the innovation of environmental
technologies market demand for these technologies needs to be created, as Newell
(2010) notes:
“Since environmental policy implicitly or explicitly makes environmental inputs more expensive, the
“induced innovation” hypothesis suggests an important pathway for the interaction of environmental
policy and technology, and for the introduction of impacts on technological change as a criterion for
evaluation of different policy instruments.” (Newell 2010: 12)
Given the more sophisticated account, which acknowledges pervasive market failures
there is also a role for policy in supporting environmental R&D. The faith in the efficacy
of market mechanisms for delivering environmental technological change goes further. If
317
polluters face heterogeneous cost structures and heterogeneous abatement costs, they are
likely to know much better how to reduce these costs than an outside regulator.
Therefore - from a static-allocative perspective - flexible, price based instruments that
allow polluters to reduce their pollution in the most cost-effective way, rather than more
rigid environmental performance or technology standards are likely to be preferable
(Kerr & Newell 2003; Hepburn 2010b). As regards innovation, price incentives are also
claimed to offer a dynamic incentive for technological innovation that does not exist
with regulatory instruments – thus not only resulting in a higher quantity of
environmental innovation but also a higher quality (Popp 2005). Essentially, the message
is that the best possible outcome can be achieved by correcting market failures and
getting the prices right.
Although there is a close relationship between the induced innovation literature and the
case for market based environmental policy instruments, the latter does not necessarily
imply the former. The case for the primacy market-based policies can be rejected while
maintaining an induced innovation without inconsistency. A weak version of the induced
innovation hypothesis would only suggest that demand (no matter how it is created) is
necessary for innovation but only as part of a broader set of conditions. Conversely, it is
difficult to see how the induced innovation account could be rejected without also
rejecting the case for the necessary primacy of market based environmental policy. If we
accept that the process might be more complex than the induced innovation account
suggests, then it is unlikely that the innovation and diffusion of technology will respond
to market signals in a straightforward way. More specifically, technological change might
not respond to marginal changes in price in a linear way, and lock-in to technologies may
be pervasive (Unruh 2000; Anderson & Winne 2007).279 This is especially the case for
the radical technological change that is likely to be needed to address the impending
climate crisis (Sanden & Azar 2005).
A2.2 Review of empirical evidence on induced innovation
There is a large empirical literature on technological innovation and change, which
precludes more detailed or systematic analysis here. The objective is rather to assess the 279 To put it another way, short-term price elasticities for pollution might be very low, there is a distinct possibility that for a number of reasons the rate of response may be non-linear over time. Alternatively price elasticities might not be constant over all changes in price. It may take a large price hike in the cost of pollution to illicit any change in behaviour, that is the supply curve for pollution maybe non-linear. Mickwitz et al (2008) makes a similar observation, “Whether economic instruments are efficient means of supporting the emergence or diffusion of environmental friendlier technologies largely depends on whether it is politically feasible to set them at sufficiently high levels.”(169)
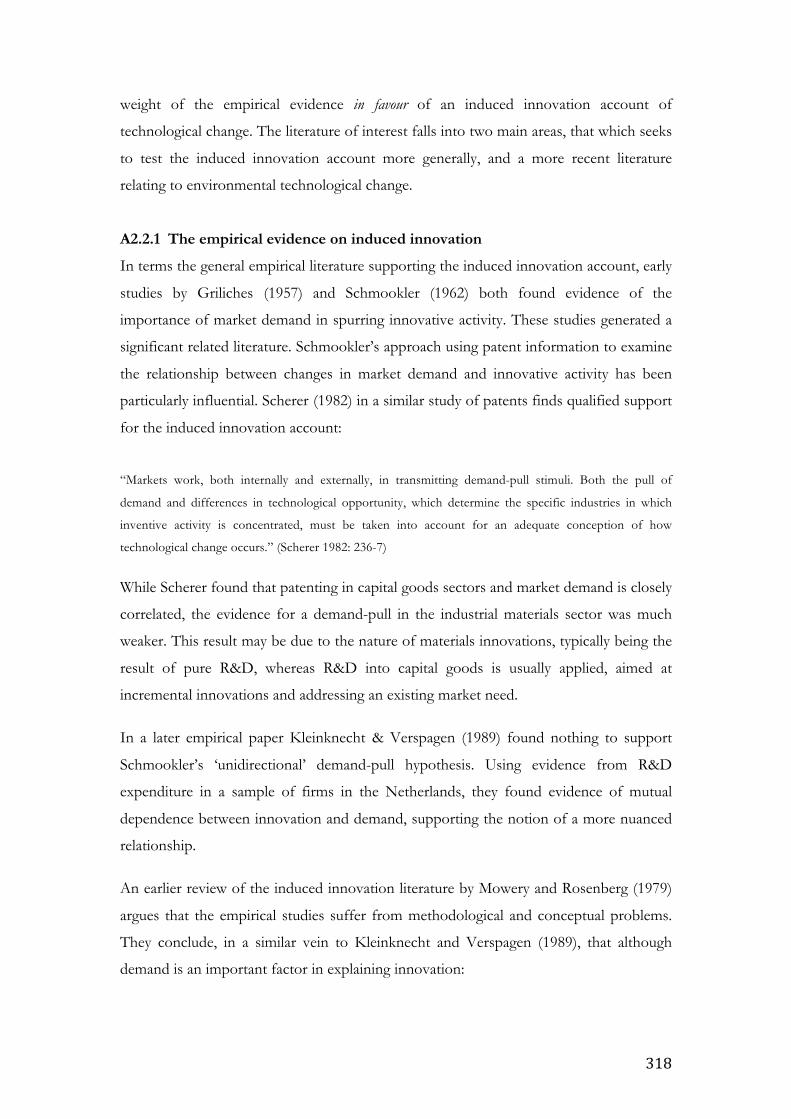
318
weight of the empirical evidence in favour of an induced innovation account of
technological change. The literature of interest falls into two main areas, that which seeks
to test the induced innovation account more generally, and a more recent literature
relating to environmental technological change.
A2.2.1 The empirical evidence on induced innovation
In terms the general empirical literature supporting the induced innovation account, early
studies by Griliches (1957) and Schmookler (1962) both found evidence of the
importance of market demand in spurring innovative activity. These studies generated a
significant related literature. Schmookler’s approach using patent information to examine
the relationship between changes in market demand and innovative activity has been
particularly influential. Scherer (1982) in a similar study of patents finds qualified support
for the induced innovation account:
“Markets work, both internally and externally, in transmitting demand-pull stimuli. Both the pull of
demand and differences in technological opportunity, which determine the specific industries in which
inventive activity is concentrated, must be taken into account for an adequate conception of how
technological change occurs.” (Scherer 1982: 236-7)
While Scherer found that patenting in capital goods sectors and market demand is closely
correlated, the evidence for a demand-pull in the industrial materials sector was much
weaker. This result may be due to the nature of materials innovations, typically being the
result of pure R&D, whereas R&D into capital goods is usually applied, aimed at
incremental innovations and addressing an existing market need.
In a later empirical paper Kleinknecht & Verspagen (1989) found nothing to support
Schmookler’s ‘unidirectional’ demand-pull hypothesis. Using evidence from R&D
expenditure in a sample of firms in the Netherlands, they found evidence of mutual
dependence between innovation and demand, supporting the notion of a more nuanced
relationship.
An earlier review of the induced innovation literature by Mowery and Rosenberg (1979)
argues that the empirical studies suffer from methodological and conceptual problems.
They conclude, in a similar vein to Kleinknecht and Verspagen (1989), that although
demand is an important factor in explaining innovation:
319
“…the primacy of market demand forces within the innovation process is simply not demonstrated. At a
more general level, however, the weaknesses of the broad conceptual framework of the studies become
clear; the uncritical appeal to market demand as the governing influence in the innovation process simply
does not yield useful insights into the complexities of that process.” (Mowery and Rosenberg 1979: 139)
Cidamber & Kon (1994), in their review of eight key empirical studies on innovation
research also find similar results to those of Mowery & Rosenberg (1979) suggesting that
the evidence for the primacy of either demand-pull or technology-push factors in
influencing technological innovation is inconclusive. Similarly, Becheikh et al (2006) in a
recent systematic review of the empirical literature on innovation in the manufacturing
sector published between 1993 and 2003 found support for the induced innovation
hypothesis, qualified by the observation that innovation seems to be the product of a
wide range of different factors both internal to the firm and external, contextual factors.
For example, factors internal to the firm included age, size, ownership, firm strategy, firm
management, culture and structure, and past performance. External factors included
location, sector, competition in the sector, suppliers, customers, level of firm
concentration as well as market demand growth (Becheikh et al 2006).
A2.2.2 Empirical evidence on induced innovation and environmental
technological change
The debate relating to induced innovation has important implications for policy to
promote environmental technological change. In recent years, a significant and influential
literature has developed specifically relating to environmental technological change and
its determinants, and the efficacy, or otherwise, of different policy approaches. Again, it
is not the intention to survey the literature, the objective is simply to establish the
strength of evidence in support of the induced innovation account, and the
environmental policy this perspective implies. 280
The evidence broadly in support of a relatively strong version of the induced innovation
account is dominated by econometric studies using large datasets to establish correlation
between innovation and market demand. This literature, in line with Jaffe et al (2005),
frequently distinguishes between innovation of technology and the diffusion of
technology.
280 More through reviews of the literature is available elsewhere such as in Popp et al (2009), Harrington et al (2004) , Vollebergh (2007) and Kemp and Pontoglio (2011).
320
Lanjouw & Mody (1996) look at patenting of environmental technologies in Germany,
Japan and the USA and 14 low and middle-income countries, in response to changes in
pollution abatement capital expenditures (PACE) during the 1970s and 1980s. They
found environmental patents increased with increases in PACE. In their study of US
industry between 1974 – 1991, Jaffe & Palmer (1997) also using PACE to proxy
demand-pull incentives, and a combination of patents and R&D expenditures as
indicators of innovative activity, found no connection between PACE and patenting, but
found a significant relationship between PACE and R&D expenditure. Hamamoto
(2006) in a study of Japanese industry between 1966 and 1976, also found a significant
relationship between PACE and R&D expenditure supporting a demand-pull hypothesis.
Studies by Newell et al (1998), Popp (2002), Verdolini & Galeotti (2011) and Cheon &
Urpelainen (2012) investigate the impact of changing energy prices on the rate of
environmental technological change. Popp (2002) uses US patent data from 1970 - 1994
to measure the impact on innovative activity of changes in energy prices, finding that
innovative activity responds rapidly to changes in energy prices. He also found that
existing knowledge stocks were an important determinant of innovation, but that there
were also signs of decreasing marginal returns to innovative activity within a particular
field, explaining the decline overtime of patenting in response to a change in energy
prices. Newell et al (1998) using US data on technology characteristics and energy prices
between 1958 – 1993 found that technological change (in terms of the innovation and
the diffusion of technology) was responsive to both regulation and change in price levels,
but that a large proportion of technological change over time was ‘autonomous,’ that is it
remained unexplained in their model.
More recent studies by Verdolini & Galeotti (2011) and Cheon & Urpelainen (2012) find
that energy technology innovation does respond to changes in price levels but with some
important caveats. In a cross country study of technology diffusion across 38 countries
Verdolini & Galeotti (2011) found that demand-pull in the form of energy prices is a
significant determinant of environmental technology diffusion for a selected sample of
energy technologies. Both energy prices and value-added had a positive effect on
innovation. Moreover, government commitment to energy efficiency and state R&D
funding were also associated with higher levels of innovation. They also found that

321
geographical distance acts to limit diffusion of technologies, the initial stock of domestic
knowledge is an important determinant of technology diffusion.
Cheon & Urpelainen (2012) investigated the impact of changing energy prices on R&D
expenditure and patents in the renewable energy sector. They found evidence to suggest
that there is a significant technology response to a demand-pull from increased energy
prices. They noted, supporting the evidence from Popp (2002), and Verdolini & Galeotti
(2011) that the ability of countries to respond was dependant on existing knowledge
stocks, or in this case was strongly dependent upon the existing capabilities. Elaborating
on this they suggest that, “….only effective innovation systems for renewable energy can
sustain a powerful political–economic response to changes in international oil prices.”
(Cheon & Urpelainen 2012: 407)
On the basis of their results they argue that while demand does have a significant role to
play in generating innovation it also depends crucially on existing national technological
capabilities. Thus their findings suggest that the notion of induced innovation is
consistent with accounts of path-dependency, a position also taken by Ruttan (1997).
Before going on to look at the implications of this literature, we first take a brief look at
the parallel literature on environmental policy and technological change.
The large literature on environmental policy choice is reviewed in Harrington et al
(2004), Vollebergh (2007), Popp et al (2009), Newell (2010), Popp (2010). These reviews
generally suggest that environmental regulation has demonstrable impact on
environmental technological change. Popp et al (2009), Newell (2010) and Popp (2010)
generally seem to find (qualified) support for an induced innovation account, augmented
with an understanding of the market failures associated with environmental pollution and
technological change.281 Concomitant with this finding, based upon empirical studies they
also suggest that market-based environmental policy (as opposed to regulatory, or
command-and-control policy) is the most effective in generating technological change.
While supporting the induced innovation, market-based policy account, in his wide-
ranging review of environmental policy in OECD countries, Vollebergh (2007) is
equivocal about the empirical evidence for the primacy given to market-based policies.
281 For a recent study typical of the literature see Johnstone et al (2009).
322
He finds little evidence to support the supposed primacy of market-based environmental
policies, as in practice policies are frequently tailored to fit particular conditions on the
ground, with many overlapping instruments, exemptions and differing applications over
different sectors, jurisdictions and time periods. Moreover, the distinction between
command-and-control and market based policies is misleading as many instruments have
elements of both.
On one hand, evidence for a weak induced innovation account seems relatively strong.
The empirical evidence suggests that market demand of some sort is an important factor
in understanding technological change. In this we would agree with Ruttan (1997), that
the intuition that market demand must play a role is correct. On the other hand, the
evidence for a relatively strong induced innovation account, where market demand is the
primary (if not the only) cause of technological innovation is highly equivocal. Other
factors are important, at least including knowledge stocks or capabilities – already
identified in the literature. Kemp & Pontoglio (2011), amongst others, detect a systematic
bias in the literature towards both an induced innovation account and market-based
policy instruments, which is in turn closely related to the methodological approaches
taken in much of the quantitative empirical work.
Criticisms have focused on the methodology and the conceptualization of the innovation
process, which belies it (Mowery & Rosenberg 1979; Becheikh et al 2006).
Methodologically, the use of indirect proxies for innovative activity is problematic.
Patent information has been questioned as it is deemed to be a poor indicator of
innovative activity for a number of reasons. First, patenting is not innovation. Patent
information might illustrate in inventive response to market demand, but this does not
equal innovation as not all patents result in innovation – to assume this is to revert to a
simplistic linear model of the innovation process (Mowery & Rosenberg 1979; Basberg
1987). Second, not all innovations are patented; other methods to protect rents from
innovation are used such as maintaining a lead over competitors, technological
complexity and industrial secrets. Third, the propensity to patent differs between sectors
(Becheikh et al 2006). Fourth, patenting practices and legislation differ across countries
meaning that they are not all directly comparable. A number of studies also use R&D
measures, but these are also unreliable as for similar reasons. That is, not all R&D
323
expenditures result in innovation, and the measure tends to be bias against small firms,
which may not have a dedicated R&D budget (Becheikh et al 2006).
Moreover, there is a question about the interpretation of coefficients in the results of the
statistical analysis. In complex systems, where contingent causation is the norm, an
outcome of a process is often in response to the interaction of many causal factors. Even
those that contributed ‘less’ to the process could nevertheless be necessary. In such a
circumstance, interpreting the causal significance of coefficients is problematic, statistical
correlation is not the same as causal efficacy.
An important point raised by both Mowery & Rosenburg (1979), Cidamber & Kon
(1994) and in a recent review paper by Kemp & Pontoglio (2011) point to a close
relationship between methodology and underlying conceptual frameworks. Setting aside,
for now, concerns with the proxy variables, if the process is linear, and driven primarily
by a demand-pull then what is inside the ‘black-box’ does not matter, the firm is reduced
to an innovation production function, where “….inputs are mysteriously transformed
into outputs.”(Cidamber & Kon 1994: 17).
Cidamber & Kon (1994) point out that to make any generalisation about the innovation
process, or any other process for that matter, necessarily abstracts from the particular
and to a greater or lesser extent results in a ‘black-box’. Inevitably the very detailed
information that would allow us to trace every step in the causal chain is not always
available. Case studies, for example, allow us to do just this sort of detailed causal
analysis, but are only feasible in a very limited number of cases due to logistical and
resource constraints, and suffer from the inability to produce useful generalizations.
There is thus an inevitable tension between the general and the particular, which is hard
to reconcile. On the other hand, the criticism of a ‘black-box’ approach, might not be the
box itself, but the relative extent to which the process is hidden from us. The answer to
this dilemma is probably to adopt a more eclectic approach to methodology. Both Kemp
& Pontoglio (2011) and Cidamber & Kon (1994) suggest the use of mixed methods
combining case studies, quantitative surveys and statistical examination of large
secondary data sets is warranted in the study of innovation.
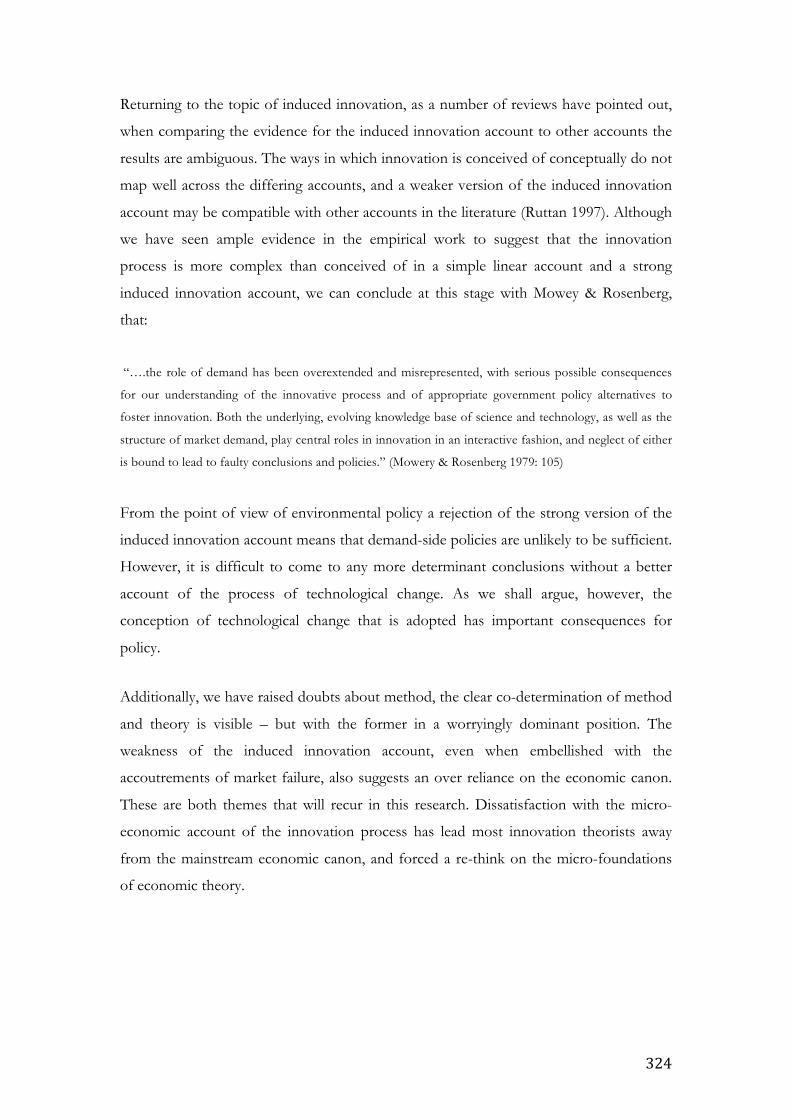
324
Returning to the topic of induced innovation, as a number of reviews have pointed out,
when comparing the evidence for the induced innovation account to other accounts the
results are ambiguous. The ways in which innovation is conceived of conceptually do not
map well across the differing accounts, and a weaker version of the induced innovation
account may be compatible with other accounts in the literature (Ruttan 1997). Although
we have seen ample evidence in the empirical work to suggest that the innovation
process is more complex than conceived of in a simple linear account and a strong
induced innovation account, we can conclude at this stage with Mowey & Rosenberg,
that:
“….the role of demand has been overextended and misrepresented, with serious possible consequences
for our understanding of the innovative process and of appropriate government policy alternatives to
foster innovation. Both the underlying, evolving knowledge base of science and technology, as well as the
structure of market demand, play central roles in innovation in an interactive fashion, and neglect of either
is bound to lead to faulty conclusions and policies.” (Mowery & Rosenberg 1979: 105)
From the point of view of environmental policy a rejection of the strong version of the
induced innovation account means that demand-side policies are unlikely to be sufficient.
However, it is difficult to come to any more determinant conclusions without a better
account of the process of technological change. As we shall argue, however, the
conception of technological change that is adopted has important consequences for
policy.
Additionally, we have raised doubts about method, the clear co-determination of method
and theory is visible – but with the former in a worryingly dominant position. The
weakness of the induced innovation account, even when embellished with the
accoutrements of market failure, also suggests an over reliance on the economic canon.
These are both themes that will recur in this research. Dissatisfaction with the micro-
economic account of the innovation process has lead most innovation theorists away
from the mainstream economic canon, and forced a re-think on the micro-foundations
of economic theory.
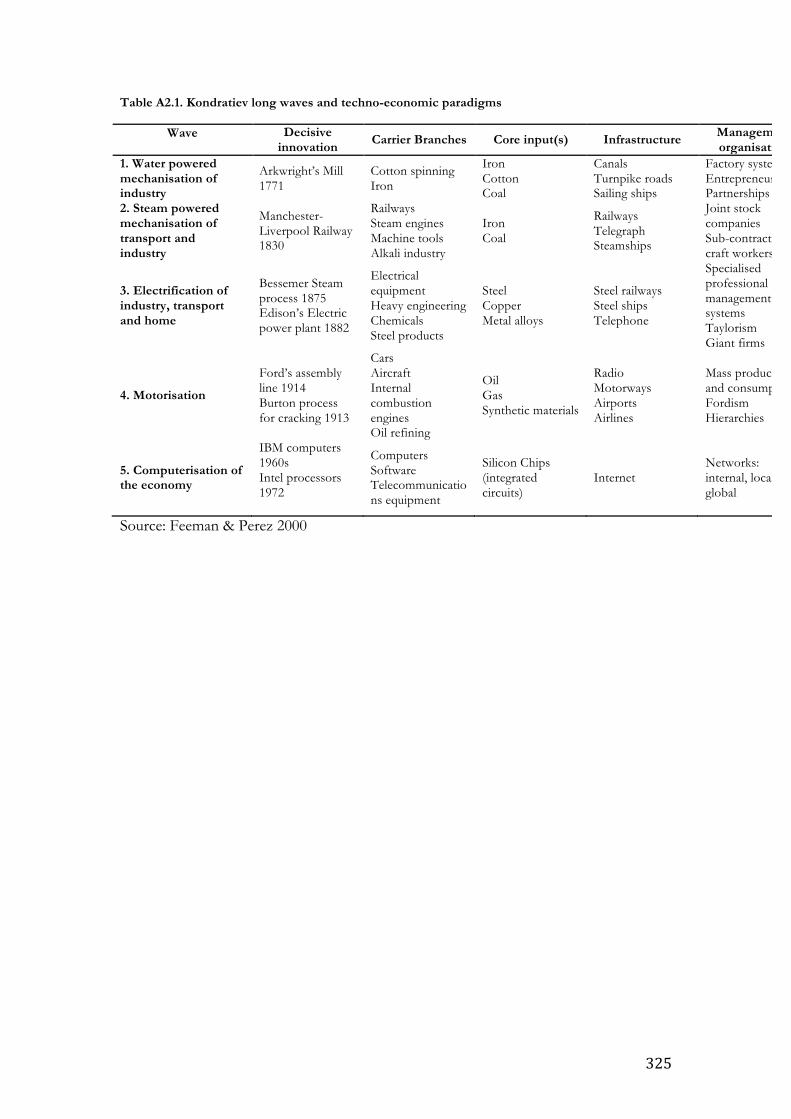
325
Table A2.1. Kondratiev long waves and techno-economic paradigms
Wave Decisive innovation
Carrier Branches Core input(s) Infrastructure Management organisation
Up-swing Down-swing
1. Water powered mechanisation of industry
Arkwright’s Mill 1771
Cotton spinning Iron
Iron Cotton Coal
Canals Turnpike roads Sailing ships
Factory systems Entrepreneurs Partnerships
1782 – 1815 1815 - 1848
2. Steam powered mechanisation of transport and industry
Manchester-Liverpool Railway 1830
Railways Steam engines Machine tools Alkali industry
Iron Coal
Railways Telegraph Steamships
Joint stock companies Sub-contracting to craft workers
1848 – 1873 1873 - 1895
3. Electrification of industry, transport and home
Bessemer Steam process 1875 Edison’s Electric power plant 1882
Electrical equipment Heavy engineering Chemicals Steel products
Steel Copper Metal alloys
Steel railways Steel ships Telephone
Specialised professional management systems Taylorism Giant firms
1895 – 1918 1918-1940
4. Motorisation
Ford’s assembly line 1914 Burton process for cracking 1913
Cars Aircraft Internal combustion engines Oil refining
Oil Gas Synthetic materials
Radio Motorways Airports Airlines
Mass production and consumption Fordism Hierarchies
1941 – 1973 1973 - ?
5. Computerisation of the economy
IBM computers 1960s Intel processors 1972
Computers Software Telecommunications equipment
Silicon Chips (integrated circuits)
Internet Networks: internal, local, global
Approx. 1980
Source: Feeman & Perez 2000
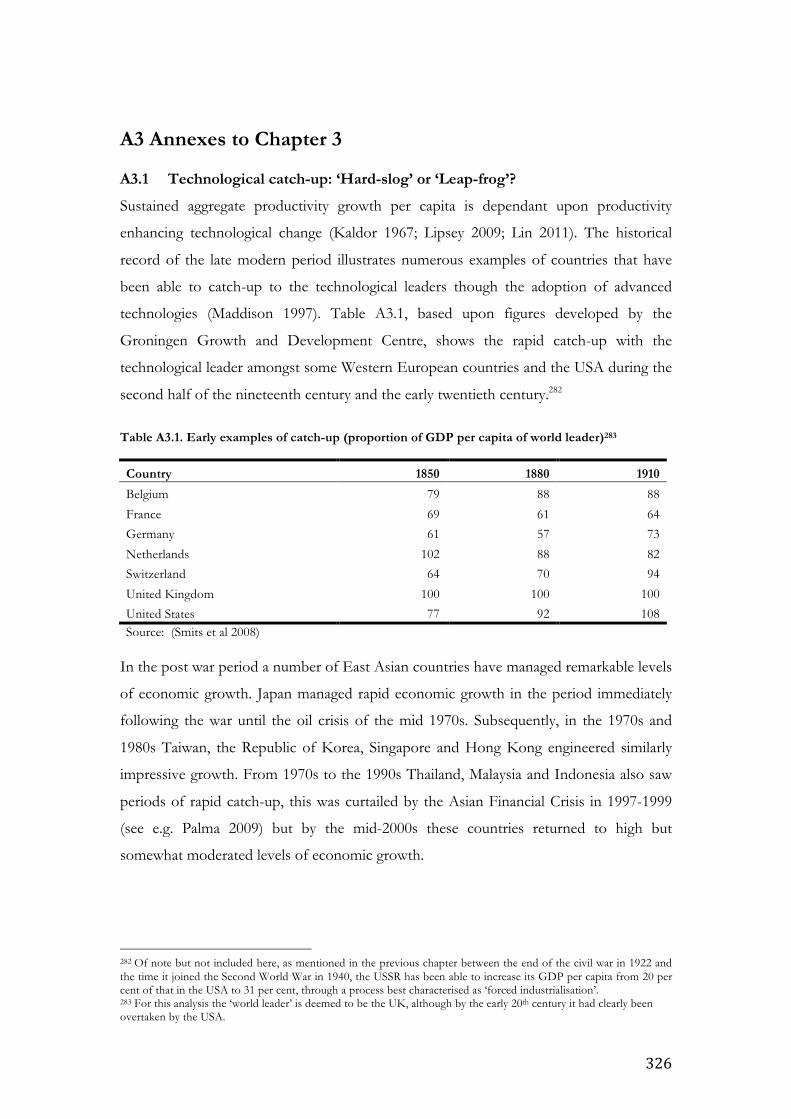
326
A3 Annexes to Chapter 3 A3.1 Technological catch-up: ‘Hard-slog’ or ‘Leap-frog’?
Sustained aggregate productivity growth per capita is dependant upon productivity
enhancing technological change (Kaldor 1967; Lipsey 2009; Lin 2011). The historical
record of the late modern period illustrates numerous examples of countries that have
been able to catch-up to the technological leaders though the adoption of advanced
technologies (Maddison 1997). Table A3.1, based upon figures developed by the
Groningen Growth and Development Centre, shows the rapid catch-up with the
technological leader amongst some Western European countries and the USA during the
second half of the nineteenth century and the early twentieth century.282
Table A3.1. Early examples of catch-up (proportion of GDP per capita of world leader)283
Country 1850 1880 1910
Belgium 79 88 88
France 69 61 64
Germany 61 57 73
Netherlands 102 88 82
Switzerland 64 70 94
United Kingdom 100 100 100
United States 77 92 108 Source: (Smits et al 2008)
In the post war period a number of East Asian countries have managed remarkable levels
of economic growth. Japan managed rapid economic growth in the period immediately
following the war until the oil crisis of the mid 1970s. Subsequently, in the 1970s and
1980s Taiwan, the Republic of Korea, Singapore and Hong Kong engineered similarly
impressive growth. From 1970s to the 1990s Thailand, Malaysia and Indonesia also saw
periods of rapid catch-up, this was curtailed by the Asian Financial Crisis in 1997-1999
(see e.g. Palma 2009) but by the mid-2000s these countries returned to high but
somewhat moderated levels of economic growth.
282 Of note but not included here, as mentioned in the previous chapter between the end of the civil war in 1922 and the time it joined the Second World War in 1940, the USSR has been able to increase its GDP per capita from 20 per cent of that in the USA to 31 per cent, through a process best characterised as ‘forced industrialisation’. 283 For this analysis the ‘world leader’ is deemed to be the UK, although by the early 20th century it had clearly been overtaken by the USA.
327
Table A3.2. Later instances of catch-up in East Asia (proportion GDP per capita of world leader)
Country 1960 1980 2000 2008
China 6 6 12 22
India 7 5 7 10
Indonesia* 9 10 12 14
Japan 35 72 73 73
South Korea 11 22 50 63
Thailand 10 14 22 28
Taiwan 12 28 59 67
Hong Kong 28 57 82 102
Malaysia 14 20 29 33
Singapore 20 49 79 90
Vietnam 7 4 6 10
United States 100 100 100 100
Source: (Smits et al 2008) * including Timor until 1999 Over the last decades countries which seem to be undergoing a relatively successful
period of late industrialisation include China, India, Brazil, Bangladesh, Vietnam, Turkey,
Egypt and Botswana. Many other countries have been unable to realise these high levels
of economic growth, nevertheless, the essential message is clear, economic catch-up is
possible. The descriptive statistics (Tables A3.1, A3.2 and A3.3) are fairly conclusive.
Looking in greater detail, as described originally in Lewis’ two-sector model, rapid
productivity growth seen in instances of sustained catch-up is a process of structural
change, as labour shifts from the agricultural sector, which has typically low levels of
labour productivity to the higher productivity industrial sector (and to a lesser extent
service sector) (Lewis 1954; Kaldor 1967; McMillan & Rodrik 2011; Szirmai 2011).
Higher productivity in the industrial sector is explained, in part, by the accumulation of
capital goods allowing the application of greater levels of physical capital per worker than
in the traditional sector. The process by which greater levels of capital intensity can be
brought to bear by labour to achieve increased levels of productivity is crucially
dependant upon the application of knowledge or technology. Whether this be embodied
in capital goods, in the know-how of skilled labour, in various processes of production
and trade, or in the institutions which support them. In a field where consensus is rare,
there is general agreement on the broad brush-stokes of this story. Disagreements tend
to turn not on the description of what are generally accepted historical facts, but on the
relative importance of the different causal factors, which lie behind productivity growth
and the implications these have for the process of catch-up.

328
More specifically, the central disagreement relates to the extent to which high
productivity technologies used in countries at the technological frontier are available to
latecomer countries. Gerschenkron (1962) famously argued in his analysis of catch-up,
that latecomer countries could enjoy certain ‘advantages of backwardness’ in that they
can enjoy access to advanced technologies developed in the industrial leaders, without
needing to spend time and resources, or bear the considerable risks involved in
developing new technologies. If the conditions are right to enable the up-take of
advanced technology in developing countries, then the process of catch-up could be
increasingly rapid.284 Indeed, experiences of catch-up have led to increasingly rapid
periods of economic development in latecomer countries, as illustrated in the higher
levels of GDP growth in instances of late catch-up, compared to earlier examples (Table
A3.3), this ‘technological leapfrogging’ is described by Seote:
“...the opportunities offered by the international diffusion of technology to jump particular technological
paradigms and import the more if not the most, sophisticated technologies that will neither displace the
capital invested nor the skilled labour of the previous technological paradigm, constitute one of the most
crucial advantages of newly industrialising countries in their bid for rapid industrialisation.” (Soete
1985:416)
Nevertheless, as Soete (2007) points out in a later article, Gerschenkron was also
concerned with the barriers to the process of technological catch-up that might emerge
for latecomer countries. For example, during the early stages of the Industrial Revolution
in Great Britain, industrial technology tended to be small scale and labour intensive, as
such it could be self-financed by firms. Over time economies of scale meant that
technologies became much more capital intensive. By the time of Germany’s catch-up,
new institutions needed to be developed to enable the mobilization of resources and
allow technological acquisition that could not be managed by firms alone.285 Similar
arguments have also been made relating to the process of catch-up in East Asian
countries (e.g. Johnson 1982; Amsden 1992; Wade 2004). In short, Gerschenkron’s
insight was that initial conditions determining the ability of countries to make use of new
technology are important, and that these conditions likely change over time.
284 See Szirmai (2011) and Pritchett (2000) for recent statistical evidence on periods of catch-up. 285 See also Freeman (1995) for an account of German catch-up.
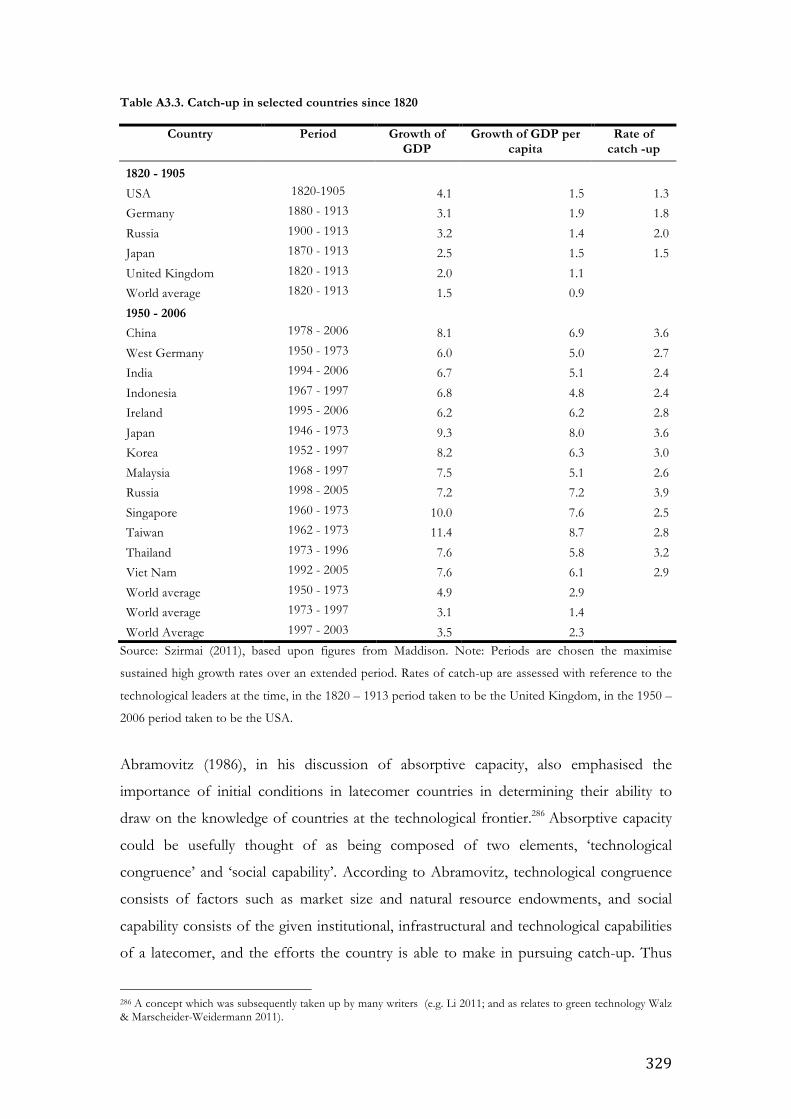
329
Table A3.3. Catch-up in selected countries since 1820
Country Period Growth of GDP
Growth of GDP per capita
Rate of catch -up
1820 - 1905
USA 1820-1905 4.1 1.5 1.3
Germany 1880 - 1913 3.1 1.9 1.8
Russia 1900 - 1913 3.2 1.4 2.0
Japan 1870 - 1913 2.5 1.5 1.5
United Kingdom 1820 - 1913 2.0 1.1 World average 1820 - 1913 1.5 0.9 1950 - 2006
China 1978 - 2006 8.1 6.9 3.6
West Germany 1950 - 1973 6.0 5.0 2.7
India 1994 - 2006 6.7 5.1 2.4
Indonesia 1967 - 1997 6.8 4.8 2.4
Ireland 1995 - 2006 6.2 6.2 2.8
Japan 1946 - 1973 9.3 8.0 3.6
Korea 1952 - 1997 8.2 6.3 3.0
Malaysia 1968 - 1997 7.5 5.1 2.6
Russia 1998 - 2005 7.2 7.2 3.9
Singapore 1960 - 1973 10.0 7.6 2.5
Taiwan 1962 - 1973 11.4 8.7 2.8
Thailand 1973 - 1996 7.6 5.8 3.2
Viet Nam 1992 - 2005 7.6 6.1 2.9
World average 1950 - 1973 4.9 2.9 World average 1973 - 1997 3.1 1.4 World Average 1997 - 2003 3.5 2.3 Source: Szirmai (2011), based upon figures from Maddison. Note: Periods are chosen the maximise
sustained high growth rates over an extended period. Rates of catch-up are assessed with reference to the
technological leaders at the time, in the 1820 – 1913 period taken to be the United Kingdom, in the 1950 –
2006 period taken to be the USA.
Abramovitz (1986), in his discussion of absorptive capacity, also emphasised the
importance of initial conditions in latecomer countries in determining their ability to
draw on the knowledge of countries at the technological frontier.286 Absorptive capacity
could be usefully thought of as being composed of two elements, ‘technological
congruence’ and ‘social capability’. According to Abramovitz, technological congruence
consists of factors such as market size and natural resource endowments, and social
capability consists of the given institutional, infrastructural and technological capabilities
of a latecomer, and the efforts the country is able to make in pursuing catch-up. Thus
286 A concept which was subsequently taken up by many writers (e.g. Li 2011; and as relates to green technology Walz & Marscheider-Weidermann 2011).
330
Abramovtitz takes care to stress the importance of historical, institutional and
technological contingencies that are likely to affect the possibility of catch-up:
“The state of a country’s capability to exploit emerging technological opportunity depends on a social
history that is particular to itself and that may not be closely bound to its existing level of productivity. And
there are changes in the character of technological advance that make it more congruent with the resources
and institutional outfits of some countries but less congruent with those of others.” (Abramovitz 1986:
406)
The debate relating to technological catch-up has turned on the relative emphasis placed
upon, either i) the ability of developing countries to draw on advanced technology
developed elsewhere; or, ii) the role of a country’s absorptive capacity - and in particular,
institutional arrangements - in determining conditions for catch-up. There is a wide
spectrum of opinion in the literature, but the debate has been characterised between
those accounts that present technological change and economic catch-up as a more or
less automatic consequence of investment and capital accumulation. And those accounts,
on the other hand, which recognise the importance of capital accumulation, but also
emphasise the importance of Abramovitz’s social capabilities and the development of
complementary capabilities to allow the assimilation of new technologies.
In the following sections we outline the main contours of the debate surrounding
accounts of economic growth and technological change, and the resulting policy
implications. Our objective is not to give anything other than an instrumental account of
what is an otherwise large literature. We simply seek to present the essential elements of
the literature in such a way to facilitate the development of our argument.
A3.1.1 Neoclassical growth theory
The orthodox account of economic growth has its origins in the Solow-Swan model.
This model is based upon constant returns to scale and an aggregate production
function, which describes, for a particular capital/labour ratio the maximum possible
outputs. Long-term growth rates themselves are exogenous to the model and determined
by long-run rates of productivity enhancing technological change. For a given level of
savings (investment) and labour technological advance allows higher levels of labour
productivity and consumption (Solow 1956). Solow’s 1957 paper applied this model to
explain change in labour productivity in the US between 1909 and 1949. The empirical
331
approach attempted a disaggregation of economic growth into components due to
labour, capital (i.e. factor accumulation or movement along the production function) and
technological change (movement of the production function itself). To the surprise of
the academic community at the time, this study estimated that only around 20% of
productivity growth was attributable to factor accumulation, the residual 80% according
to the model was deemed to be attributable to technological change (Solow 1957).
Although later authors have pointed out that the residual simply represents that element
of growth that cannot be accounted for by factor accumulation, whatever it may be.
Various attempts were made to clarify what the residual represented, and with them the
notion of ‘total factor productivity’ (TFP) and TFP growth were developed. There
remains little agreement in the literature. However, a common and useful way of thinking
about what TFP is likely to represent is a measure of the sum of externalities associated
with technological, organisational and institutional change once all the other input
endowments have been accounted for (Hulten 2001). Refinements to the model in
subsequent decades have taken the form of attempts to further disaggregate the residual
and express in somewhat greater detail the components of productivity growth, such as
by including human capital, structural change, trade liberalization, energy price effects
etc. (Mankiw et al 1992; Maddison 1997).287 Within the contemporary growth accounting,
development accounting and Cliometric literatures, TFP continues to be seen as an
important means of empirically identifying the sources of economic growth (Hulten
2001; Bosworth & Collins 2003; Caselli 2005; Aghion & Howitt 2007; Crafts 2010).
The main problem facing exogenous growth theory was the lack of explanatory power of
a growth model that relegated the largest portion of productivity growth to the
unexplained and exogenously determined ‘residual’ (Srinivasan 1995). 288 Even if we
accept the theoretical premises behind the growth accounting story, it is fair to say that
its explanatory power is quite limited. Despite efforts to further decompose and interpret
the residual it (and the process of economic growth and technological change) remains,
for the most part, unexplained:
287 With these further efforts to disaggregate TFP, the empirical method moved beyond the Solow model to the extent that some critics have suggested the concept of TFP is a-theoretical (Felipe & McCombie 2007). 288 It should be noted that Solow was not denying that technological change could be part of an economic process, but it was treated as exogenous because he was not sure how it could be accounted for within a model, “It would be very odd indeed if all that activity had nothing to do with the actual achievement of technological progress. The question is whether one has any- thing useful to say about the process, in a form that can be made part of an aggregative growth model.” (Solow 1994: 48)
332
“It is noteworthy, therefore, that despite all the effort to make the “residual” go away it still is very much
with us…[…]…And despite all the effort to give substance to its interpretation as “technological
advance,” or “advance of knowledge,” that interpretation is far from persuasive. Everybody knows that the
residual accounts for a hodgepodge of factors, but these are difficult to sort out. If this “measure of our
ignorance” is not completely mysterious, it certainly is not well understood.” (Nelson 1981: 1035).
Felipe & McCombie (2007) make a similar point, casting doubt on the very notion of
TFP. They argue that it is not useful as an explanatory concept as it emerges solely as a
consequence of the growth accounting method, and is essentially just an accounting
identity. Barnett (2004) also notes fundamental problems with interpreting the notion of
TFP.
Leaving these criticisms aside there are three main implications of exogenous growth
theory (and the associated growth accounting literature) for technological catch-up and
understanding technological change. Firstly, that in a particular circumstance where
economic growth is dependent upon capital accumulation alone, it is unlikely to be
sustainable in the long-term due to decreasing returns to capital, technological change or
TFP growth, is needed for sustainable long-term growth (Krugman 1994). On the other
hand, this decomposition also suggests, to the extent that technology is embodied in
capital stock, technological leapfrog is possible. Secondly, to the extent that economic
growth can be attributed to the accumulation of capital stock – and in later
interpretations human capital - other externalities associated with technological change
are not important for developing countries. If the accumulation of capital stock is
sufficient to explain the rates of economic growth that have been experienced, then all
that is needed for increased productivity is investment:
“The neoclassical growth model of Robert Solow highlights the importance of technological change as the
primary determinant of long-run, steady-state growth. However, by assuming that everyone has access to
the same technology, the model also assigns a large role to the accumulation of physical and human capital
for countries that are in a transitional or catch-up phase” (emphasis added Bosworth & Collins 2003: 124)
This implies that developing countries do not need policy interventions to allow the
internalisation of the positive learning externalities associated with technological change,
innovation or entrepreneurship, they simply need to be able to access the global
technology stock and encourage investment (Nelson & Pack 1999). Finally, and perhaps
333
most significantly, all other things being equal, long-term convergence in productivity
between countries is predicted, as greater returns to capital are available in countries with
a lower capital-labour ratio (the so called process of ‘capital deepening’). Therefore,
capital seeking higher returns will flow to these countries (Ruttan 2001).
Endogenous growth theory was largely as a response to some of the key failures of
exogenous growth theory, which had been unable to explain either i) the absence of
evidence of convergence towards steady state growth between economies predicted by
the theory; or ii) persistent differences in incomes and income growth rates between
countries (Romer 1994; Ruttan 1998; Easterly & Levine 2001; Kenny & Williams
2001).289 Endogenous growth theory, as its name suggests, endeavours to account for all
aspects of economic development within a single model, by incorporating those factors
attributed in exogenous theory to the residual. Of particular interest to our concerns, it is
a theory that attempts to account for technological change (Bardhan 1995).
The first models of endogenous growth theory by writers such as Romer (1986; 1989;
1991) and Lucas (1988) drew on micro-economic theory relating to market failures and
thus sought to introduce knowledge externalities, scale effects and human capital into the
modelling exercise (Fine 2000). As Ruttan (2001) points out, from a perspective to
technological change, these models lead to an important result:
“….when investment takes place in an economic environment with increasing returns to scale the marginal
product of capital need not, as in the neoclassical model, decline over time to the level of the discount rate.
Thus, at least in the model, the incentive to enhance the quality of human and physical capital may
permanently raise the long-run rate of growth in per capita income. This means it is possible for
government to permanently increase the rate of economic growth, and not just the level of per capita
income, by pursuing an active technology policy.” (Ruttan 2001: 28)
Positive externalities to the creation of knowledge and human capital lie at the heart of
endogenous growth theory. The creation of new knowledge though R&D investment or
the accumulation of human capital can therefore explain persistently high productivity
growth rates and the failure of economies to converge in the long-run. This also suggests
a role for the institutional environment shaping the investment decisions of firms.
289 As mentioned above the endogenous growth literature is used here in a purely instrumental way to develop the argument, it is not the purpose of this section to give anything approaching an overview of the literature.
Comprehensive reviews can be found in (Ruttan 1998; Temple 1999; Kenny & Williams 2001; Rogers 2003).
334
Intellectual property legislation, for example, can incentivize firm investment in R&D
and raise the long run growth rate. As regards developing countries human capital and
R&D models are not particularly relevant, neo-Schumpeterian models relating to trade
and the international diffusion of technology are of much greater importance (Bardhan
1995; Kong 2007; Cesaratto 2010).
As the endogenous growth project has progressed, models have increased the range of
explanatory variables beyond the initial focus on physical capital, to include - in rough
chronological order - human capital, policy reform, institutional reform, ‘social
development’ and political economy (Kenny & Williams 2001). We return specifically to
the inclusion of the seemingly less tractable institutional variables in Chapter 3, section
3.2, here it is relevant to note the ever-increasing scope of the literature, which has
moved considerably beyond a narrowly economic focus (Fine 2000).
As a number of authors have pointed out in many ways endogenous growth theory is
best understood as an elaboration of exogenous growth theory, incorporating insights
from micro-economics relating to technological change that were previously relegated to
the residual and not explicitly modelled:
“As recognised by many of its practitioners, it is simply a market imperfections theory of technical change
in which, in contrast to static general equilibrium or exogenous growth theory, the impact of the
imperfections is felt on the rate of growth rather than upon the level of output or welfare for a given rate
of growth. The last point, the transformation from level to rate of growth of output, is the only novelty.
For market imperfections are now deemed to have cumulative effects over time.” (Fine 2000: 250)
As such, there is a legitimate question as to how much endogenous growth theory has
added to our knowledge of the process of technological catch-up and economic
development, and indeed the extent to which the formalism and empirical approaches
adopted by endogenous growth theory obscure important lessons obtained by other, less
formal means (Bardhan 1995; Fine 2000).
The theoretical work on both exogenous and endogenous growth theory has motivated
the extensive use of cross-country econometric analysis in attempts to identify the
proximate causes of economic growth. Much of this empirical work has been highly
influential – and controversial - in international development policy (Young 1995; Sachs
335
& Warner 1997; Dollar & Kraay 2002).290 The veracity of the empirical work has been
challenged by a number of authors citing problems with data and model specification
problems, questions surrounding the development of proxy indicators for many of the
factors that this analysis attempts to capture,291 and above all the inability of the work to
generate true predictions of growth (Levine & Renelt 1991, 1992; Solow 1994; Bardhan
1995; Srinivasan 1995; Pritchett 1997, 2000; Kenny & Williams 2001; Rodrik 2006,
2007b; Nelson 2008). To cite Kenny & Williams:
“…the econometric study of growth, different formulations, different proxies and different combinations
of a wide range of factors have been subjected to many millions of tests in many thousands of papers
produced using cross country growth regressions. A list of variables that have been put into modern cross
country growth regressions would include well over 100 overlapping economic, policy, structural,
sociological, geographical and historical factors seen to influence economic growth directly or indirectly.
Yet a brief survey of surveys appears to suggest that the results of all this computation have been
disappointing…”(Kenny & Williams 2001: 8)292
Endogenous growth theory and the associated voluminous cross-country literature has
not been particularly successful at explaining the process of long-term economic growth.
Reviews of the empirical literature have shown only investment and institutional
variables to be robust to statistical tests (Levine & Renelt 1992; Kenny & Williams
2001), even Gregory Mankiw, a doyen of neo-classical economics has shown scepticism
about the empirical work:
“Using these regressions to decide how to foster growth is also most likely a hopeless task. Simultaneity,
multi-collinearity, and limited degrees of freedom are important practical problems for anyone trying to
draw inferences from international data. Policymakers who want to promote growth would not go far
wrong ignoring most of the vast literature reporting growth regressions. Basic theory, shrewd observation,
and common sense are surely more reliable guides for policy.” (Mankiw et al 1995: 307-8)
There is a growing consensus that this lack of success is due to deep-seated theoretical
and associated methodological problems with the neo-classical growth research.
290 For further commentary on this see Rodrik (2006). 291 Solow seems to agree with these comments on the empirical literature, “I do not find this a confidence-inspiring project. It seems altogether too vulnerable to bias from omitted variables, to reverse causation, and above all to the recurrent suspicion that the experiences of various national economies are not to be explained as if they represent different 'points' on some well-defined surface.” (Solow 1994:51) 292 In recent years, the recognition that institutions are important for economic growth and development – greatly influenced by the work of Douglas North – have lead to the incorporation of a institutional indicators in the empirical work (Acemoglu et al 2000; Rodrik et al 2002; Evans 2006). We return to the issue of the ‘institutional turn’ in development economics in section 3.2 Chapter 3.
336
The main criticisms relate to i) the assumption of an aggregate global production
function; and, related to this ii) the commitment to an epistemic ‘universalism’. Firstly,
the assumption that the capital stock of an economy can be usefully represented in an
aggregate production function has been challenged. Opponents have suggested that such
an assumption represents an example of the ‘fallacy of composition’, in that
differentiated capital stock cannot be represented as an aggregate of homogenous units
of capital. This was the subject to a long running debate, which while never reaching a
satisfactory conclusion and rather inexplicably, has not been seriously addressed in the
economic canon (Cohen & Harcourt 2003; Temple 2006; Felipe & McCombie 2010).293
A related point of criticism is the belief that the stock of available technology can be
characterised through the supposition of a global production function (Kenny & Williams
2001). The assumption is that all other things being equal these stocks of technology are
equally available to all countries.
Secondly, and of greater significance to our argument here, is the implicit commitment to
epistemological universalism inherent in both neo-classical growth theory and the
empirical literature it has generated. That is to say, the assumption that the same factors
of production enter into economic growth in the same way across the whole population
of countries (Fine 2000; Fforde 2005; Rodrik 2007b; Fforde 2011).294
This commitment to a universally applicable model of economic growth has allowed the
generation of a large literature. The attraction is that from a number of stylized facts,
tractable within the economic canon a series of plausible models can be generated.
Empirical work was also able to progress though the ability to include more and more
cross-country data. Although, as noted by Nelson (2008), and Felipe & McCombie
(2007) amongst others, the empirical work using cross-country data and growth
accounting methodologies has moved a considerable way beyond the limits of formal
theory. As indicated above, the limited findings of the empirical work allow the
identification of some key variables but are plagued by problems of endogeneity, in short
it is not clear that in a complex open system this method is able to reliably identify causal
293 The notion is that factors of production are complements not substitutes, it is therefore not clear how we can think of attributing ‘shares’ of productivity to factor endowments if a combination of them is necessary for production. The failure of neo-classical account to take this damaging criticism on board, leads one to query clams to methodological rigor. 294 This, of course, is also related to the assumption of the aggregate production function. If we conceive of the world as constructed of undifferentiated, substitutable aggregates, then the very lack of differentiation and structure suggests common ways in which these aggregates interact, that is a common production function.
337
patterns. What is more, the failure of the empirical work to arrive at universal
characterizations of the process of economic growth itself, as we have argued, should be
some indication that the theorizing has gone wrong somewhere.295 Here it is suffice to
note that in parallel with the concerns expressed relating to the neo-classical micro-
foundations of technological change observed in Annex A2, in neo-classical growth
theory, the commitment to abstract, universal models, and the absence of historical
contingency and uncertainty seems somewhat problematic.
Despite the concerns relating to neo-classical growth theory, this naïve universalism has
been influential in development policy debates (Rodrik 2006; Rodrik 2010b). Playing an
important role in the debate on specific growth policies. As we noted earlier, exogenous
growth theory leaves little room for policy interventions as convergence and technology
leapfrogging are more or less automatic, so long as savings are adequate and population
growth low enough. Endogenous growth theory, on the other hand opens up the
possibility for greater state intervention to correct market failures, many of which relate
to technology adoption. Nevertheless, intervention is only justified to the extent that
market failures exist, as the ‘melorative’ trend in the operation of economies will
otherwise ensure optimal outcomes.
Kong (2007) identifies this shift in the emphasis of economists from the notion of
accumulation of physical capital, human capital and the knowledge used in production as
the proximate causes of economic growth, to a focus on incentives, which are seen as
more fundamental. A focus on incentives is a critical step, if we need to ask about
people’s incentives, we can no longer model economic agents independent of the context
in which they find themselves. Even if we accept an individual rationality postulate,
actions will only be rational with respect to the incentive structure agents face, this is no
longer a given but determined by idiosyncratic institutional and political arrangements that
frame their actions (Adam & Dercon 2009). Incentives are dependent upon context and
structure becomes important. This points towards a need to understand how institutions
create incentives for actions with economic (and technological) implications. And - from
a perspective of long-term economic growth and development – how particular
institutional forms develop. It is not clear how this can be incorporated into some 295 Of course, the problem is that economics is not the science it thinks it is, it is not falsifiable as it is protected by the ceteris paribus clause. In fact, it is a little bemusing that Friedman’s appeal to Popperian epistemological tenants, took on what it needed (i.e. instrumentalism) but has not really embraced the second essential part of this theory, falsificationism.
338
generalizable growth model. Indeed, North (2005) echoing comments by Nelson and
Arthur (Chapter 2) contends that neo-classical theory is unsuited to these tasks:
“The economic paradigm – neo-classical theory – was not created to explain the process of economic change. We live
in an uncertain and ever changing world that is continually evolving in new and novel ways. Standard
theories are of little help in this context. Attempting to understand economic, political, and social change
(and one cannot grasp change in only one without the others) requires a fundamental recasting of the way
we think. Can we develop a dynamic theory of change comparable in elegance to general equilibrium
theory? The answer is probably not. But if we can achieve an understanding of the underlying process of
change then we can develop somewhat more limited hypotheses about change that can enormously
improve the usefulness of social science theory in confronting human problems.” [emphasis added] (North
2005: vii)
We look at the ‘institutional turn’ in development economics in section 3.3 in greater
detail with a view to developing an analytical framework for a positive institutional and
political economy analysis. In the following section we look at alternative approaches to
conceptualizing the process of economic growth and technological change, which are in
accord with the evolutionary micro-foundations expounded in Chapter 2.
A3.1.2 A heterodox approach to development: National Innovation Systems
Broadly neo-classical accounts of economic growth and technological change (or the
lack-of it), turn on market failures in a particular economic system. This is essentially a
scaled-up, macro-level account of the induced innovation accounts we addressed in the
previous chapter. The notion of market failures that the orthodox account ends up
relying on so heavily, turns out not to be a particularly good explanation. The ‘market
failures’ emerge only relative to some theoretical optimum, which not only does not
exist, but with the existence of systematic failures, cannot exist. Meaning there is actually no
theoretical optimum against which market failures can be identified (Nelson 2008).
Developing this idea, in his influential analysis of latecomer catch-up in the East Asian
Newly Industrializing Countries (NICs), Lall writes:
“It is misleading to think of market failure as something that can, or should, be remedied in order that the
economy can be brought back to a desired (static) optimum. In developing countries, where technological
learning is essential to industrial development, externalities are rife, and markets highly imperfect – indeed,
when new markets, agents or endowments are being created – it is difficult to describe policy as remedying
market failure in the neo-classical sense. Where economies of scale exist in intermediate products, leading
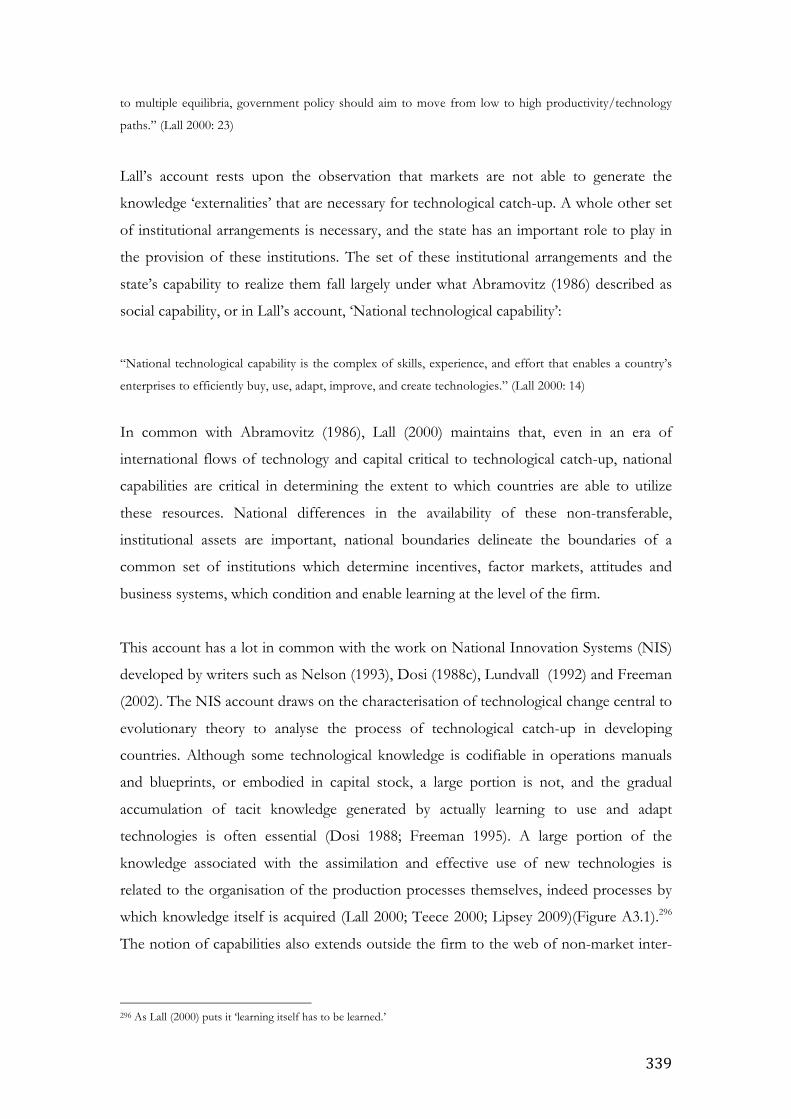
339
to multiple equilibria, government policy should aim to move from low to high productivity/technology
paths.” (Lall 2000: 23)
Lall’s account rests upon the observation that markets are not able to generate the
knowledge ‘externalities’ that are necessary for technological catch-up. A whole other set
of institutional arrangements is necessary, and the state has an important role to play in
the provision of these institutions. The set of these institutional arrangements and the
state’s capability to realize them fall largely under what Abramovitz (1986) described as
social capability, or in Lall’s account, ‘National technological capability’:
“National technological capability is the complex of skills, experience, and effort that enables a country’s
enterprises to efficiently buy, use, adapt, improve, and create technologies.” (Lall 2000: 14)
In common with Abramovitz (1986), Lall (2000) maintains that, even in an era of
international flows of technology and capital critical to technological catch-up, national
capabilities are critical in determining the extent to which countries are able to utilize
these resources. National differences in the availability of these non-transferable,
institutional assets are important, national boundaries delineate the boundaries of a
common set of institutions which determine incentives, factor markets, attitudes and
business systems, which condition and enable learning at the level of the firm.
This account has a lot in common with the work on National Innovation Systems (NIS)
developed by writers such as Nelson (1993), Dosi (1988c), Lundvall (1992) and Freeman
(2002). The NIS account draws on the characterisation of technological change central to
evolutionary theory to analyse the process of technological catch-up in developing
countries. Although some technological knowledge is codifiable in operations manuals
and blueprints, or embodied in capital stock, a large portion is not, and the gradual
accumulation of tacit knowledge generated by actually learning to use and adapt
technologies is often essential (Dosi 1988; Freeman 1995). A large portion of the
knowledge associated with the assimilation and effective use of new technologies is
related to the organisation of the production processes themselves, indeed processes by
which knowledge itself is acquired (Lall 2000; Teece 2000; Lipsey 2009)(Figure A3.1).296
The notion of capabilities also extends outside the firm to the web of non-market inter-
296 As Lall (2000) puts it ‘learning itself has to be learned.’
340
firm networks, methods of doing business and other institutions, including consumer
markets and state institutions (Lall 2000; Soete 2007; Cimoli et al 2009).
Figure A3.1: Technology transfer in National Innovation Systems
Source: Adapted from Bell 1990; Watson et al 2011 In contrast to the picture suggested by the ‘leapfrog’ characterisation of technological
change where technological advance is largely a result of capital accumulation, from the
NIS perspective, technological catch-up is neither cost nor risk free, but is time
consuming, uncertain and costly. The description given by Kim (1997) of the efforts
expended by Hyundai in developing car manufacture offers a powerful illustration of the
processes involved in technological learning:
“Despite the training and consulting services of experts, Hyundai engineers repeated trials and errors for
fourteen months before creating the first prototype. But the engine block broke into pieces at its first test.
New prototype engines appeared almost every week, only to break in testing. No one on the team could
figure out why the prototypes kept breaking down, casting serious doubts even among Hyundai
management, on its capability to develop a competitive engine. The team had to scrap eleven more broken
prototypes before one survived the test. There were 2,888 engine design changes ... Ninety-seven test
engines were made before Hyundai refined its natural aspiration and turbocharger engines.... In addition,
more than 200 transmissions and 150 test vehicles were created before Hyundai perfected them in 1992.”
(Kim 1997: 122 cited in Nelson and Pack 1999)
Four points salient to our argument emerge out of the NIS account. Firstly, a rejection of
the notion that countries can costlessly access new technologies and the production
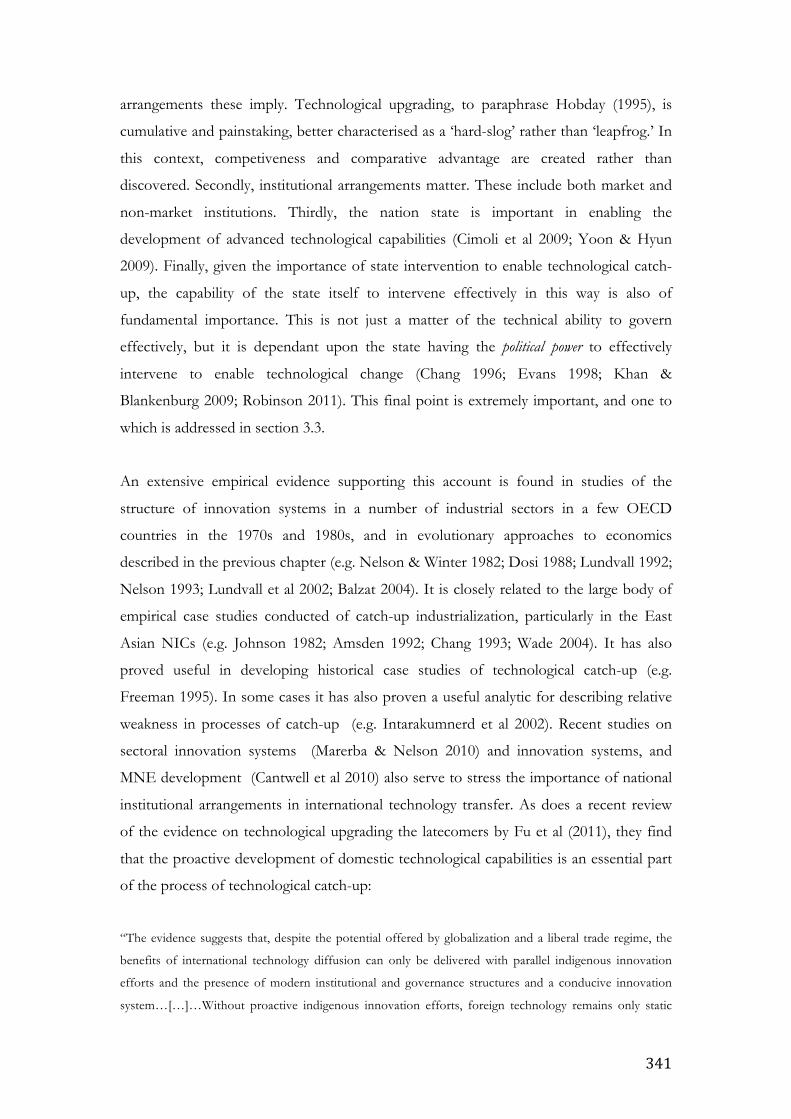
341
arrangements these imply. Technological upgrading, to paraphrase Hobday (1995), is
cumulative and painstaking, better characterised as a ‘hard-slog’ rather than ‘leapfrog.’ In
this context, competiveness and comparative advantage are created rather than
discovered. Secondly, institutional arrangements matter. These include both market and
non-market institutions. Thirdly, the nation state is important in enabling the
development of advanced technological capabilities (Cimoli et al 2009; Yoon & Hyun
2009). Finally, given the importance of state intervention to enable technological catch-
up, the capability of the state itself to intervene effectively in this way is also of
fundamental importance. This is not just a matter of the technical ability to govern
effectively, but it is dependant upon the state having the political power to effectively
intervene to enable technological change (Chang 1996; Evans 1998; Khan &
Blankenburg 2009; Robinson 2011). This final point is extremely important, and one to
which is addressed in section 3.3.
An extensive empirical evidence supporting this account is found in studies of the
structure of innovation systems in a number of industrial sectors in a few OECD
countries in the 1970s and 1980s, and in evolutionary approaches to economics
described in the previous chapter (e.g. Nelson & Winter 1982; Dosi 1988; Lundvall 1992;
Nelson 1993; Lundvall et al 2002; Balzat 2004). It is closely related to the large body of
empirical case studies conducted of catch-up industrialization, particularly in the East
Asian NICs (e.g. Johnson 1982; Amsden 1992; Chang 1993; Wade 2004). It has also
proved useful in developing historical case studies of technological catch-up (e.g.
Freeman 1995). In some cases it has also proven a useful analytic for describing relative
weakness in processes of catch-up (e.g. Intarakumnerd et al 2002). Recent studies on
sectoral innovation systems (Marerba & Nelson 2010) and innovation systems, and
MNE development (Cantwell et al 2010) also serve to stress the importance of national
institutional arrangements in international technology transfer. As does a recent review
of the evidence on technological upgrading the latecomers by Fu et al (2011), they find
that the proactive development of domestic technological capabilities is an essential part
of the process of technological catch-up:
“The evidence suggests that, despite the potential offered by globalization and a liberal trade regime, the
benefits of international technology diffusion can only be delivered with parallel indigenous innovation
efforts and the presence of modern institutional and governance structures and a conducive innovation
system…[…]…Without proactive indigenous innovation efforts, foreign technology remains only static
342
technology embedded in imported machines which will never turn into real indigenous technological
capability.” (Fu et al 2011: 1210)297
As we have pointed out this literature has an important implication for the role of
government in economic catch-up. Specifically in the development institutional
arrangements that can act to foster economic growth (Yoon & Hyun 2009).
A3.1.3 What does all this tell us about technological catch-up?
Returning to the considerations mentioned at the start of this section relating to
understanding the process of technological catch-up, and the extent to which it is best
characterised as a process of ‘leapfrog,’ or as in Hobday’s (1995) characterisation as a
‘hard-slog’. Experiences of increasingly rapid technological catch-up point to a realisation
of the Gerschenkronian ‘advantages of backwardness’, which may suggest that the
process is simply one of factor accumulation and of moving along a global production
function (Szirmai 2011). But such an account would be silent on the causal processes by
which this happens, or why in many cases this fails to happen, the process itself would
remain something of a black-box.
In exogenous growth theory and the empirical growth accounting work that it inspired,
the black-box lays in a, more or less, undifferentiated and nebulous residual. The
achievement of endogenous growth theory, lies in not so much opening the box to gain
an understanding of the actual causal processes by which factor accumulation and growth
occurs, as in replacing it, with the generation of a multitude of models that, given
particular market failures, allow a demonstration of how factor accumulation and
economic growth could occur within a neo-classical mathematical model. Either way, as
with our discussion of induced innovation (Chapter 2), we are left with not so much an
explanation, but with a series of aggregate inputs mediated by fictitious market-based
allocation, and the unexplained emergence of a series of aggregate outputs.
What emerges from the empirical work conducted within the broadly neo-classical
growth tradition is that determinate causal processes have been very difficult to pin down
using growth accounting, cross-country accounting or cross-country regression analysis.
As we have argued, more fundamental issues belie familiar problems related to the use of
297 This mirrors findings from Verdolini and Galeotti 2011, cited in Chapter 2, which suggests that countries are only able to respond to changes in energy prices if they possess the domestic institutional apparatus to allow them to do so.
343
proxy indicators, data quality, endogeneity and model specification. In line with the
arguments we presented in Chapter 2 and Annex A2, we contend that the contingent
causation, feedbacks and path-dependency that characterise the process of economic
growth and technological catch-up are likely to preclude the discovery of non-trivial
universally valid generalisations.
The alternative account suggests that the process of factor accumulation, and
technological catch-up is difficult to achieve and impossible to understand from any
perspective that seeks to obscure the uncertain, contingent and path-dependant nature of
economic change. If technological catch-up is difficult to achieve, and is not an
automatic economic response to factor accumulation, then it becomes important to
understand how this process has been realised. NIS accounts, in contrast to neo-classical
theory, present a perspective that traces the means by which nation states effected factor
accumulation and developed absorptive capabilities. They present a cogent picture in
which the activity of the public and private sectors working together within a national
institutional context were able to create conditions for rapid economic growth and catch-
up. Importantly for our argument, they present a picture where non- market institutions and
the state play a central role in creating the conditions for economic growth.
What emerges out of the consideration of both the cross-country empirical literature and
the NIS country case studies is that the role of domestic institutions is critical in the
process of technological catch-up. Once the assumption of perfectly functioning markets
is relaxed, there is nothing in their functioning that can guarantee an optimal outcome.
This constitutes a prima facie argument for extra-market interventions. Whether or not
interventions are justified in order to promote catch-up in fact depends upon the ability of
the state to intervene effectively. The question of whether the state is able to intervene
effectively is a question relating to its institutional, and crucially its political capabilities.
This leaves us in a position, along with an increasing number of influential writers, from
both neo-classical and heterodox economic traditions, where the political economy is
deemed the crucial variable in determining the success or otherwise of national
development policy and by implication of the process of technological change
(Acemoglu et al 2005; Khan & Blankenburg 2009; Khan 2010; Levy & Fukuyama 2010;
Robinson 2011):
344
“To promote industrialization in a society, we need a positive theory of policy. I use the term “political
equilibrium” to refer to the concatenation of political forces that determines this policy outcome. It is the
political equilibrium of a society that leads to particular policy choices. To give policy advice that would
foster industry, one has to understand this political equilibrium and either attempt to change it or work
within the environment it generates.” (Robinson 2011: 134)
Thus our investigation of the process of technological catch-up is leads us towards the
same conclusions we reached in Chapter 2, that the political economy is likely to be
crucial to an understanding of the process of technological change, and therefore the
process of environmental technological change.
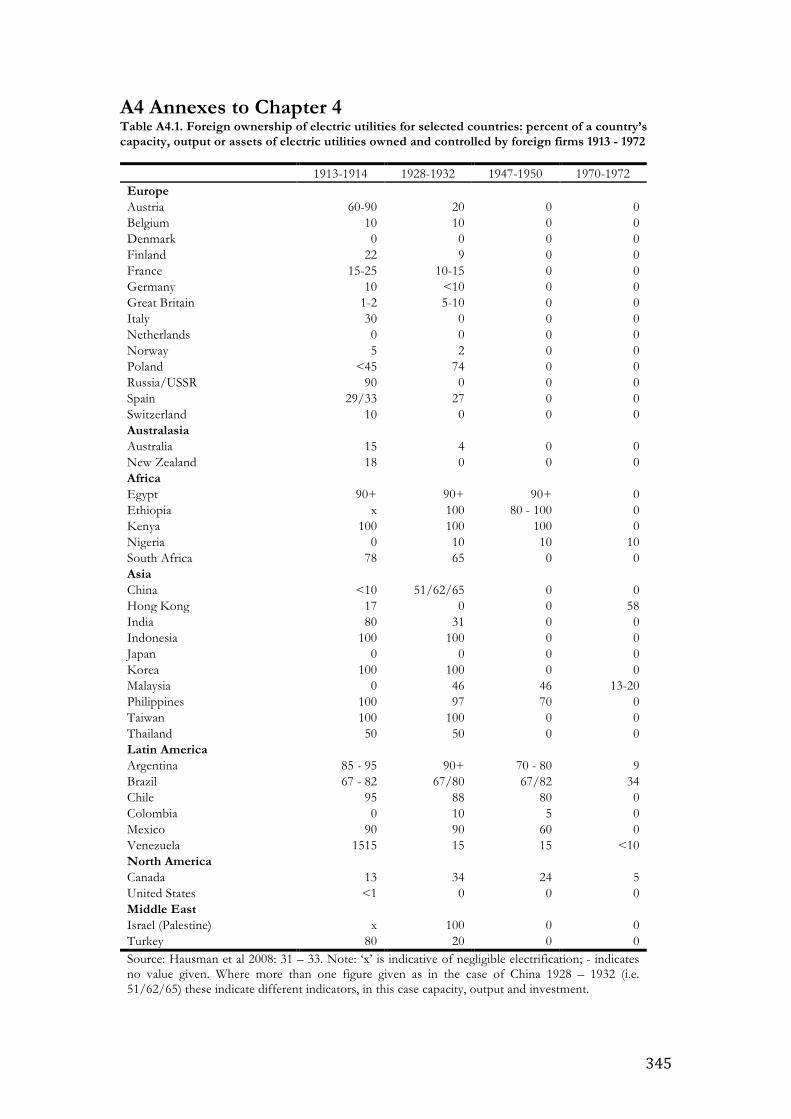
345
A4 Annexes to Chapter 4 Table A4.1. Foreign ownership of electric utilities for selected countries: percent of a country’s capacity, output or assets of electric utilities owned and controlled by foreign firms 1913 - 1972
1913-1914 1928-1932 1947-1950 1970-1972
Europe Austria 60-90 20 0 0
Belgium 10 10 0 0 Denmark 0 0 0 0 Finland 22 9 0 0 France 15-25 10-15 0 0 Germany 10 <10 0 0 Great Britain 1-2 5-10 0 0 Italy 30 0 0 0 Netherlands 0 0 0 0 Norway 5 2 0 0 Poland <45 74 0 0 Russia/USSR 90 0 0 0 Spain 29/33 27 0 0 Switzerland 10 0 0 0 Australasia
Australia 15 4 0 0 New Zealand 18 0 0 0 Africa
Egypt 90+ 90+ 90+ 0 Ethiopia x 100 80 - 100 0 Kenya 100 100 100 0 Nigeria 0 10 10 10 South Africa 78 65 0 0 Asia
China <10 51/62/65 0 0 Hong Kong 17 0 0 58 India 80 31 0 0 Indonesia 100 100 0 0 Japan 0 0 0 0 Korea 100 100 0 0 Malaysia 0 46 46 13-20 Philippines 100 97 70 0 Taiwan 100 100 0 0 Thailand 50 50 0 0 Latin America
Argentina 85 - 95 90+ 70 - 80 9 Brazil 67 - 82 67/80 67/82 34 Chile 95 88 80 0 Colombia 0 10 5 0 Mexico 90 90 60 0 Venezuela 1515 15 15 <10 North America
Canada 13 34 24 5 United States <1 0 0 0 Middle East
Israel (Palestine) x 100 0 0 Turkey 80 20 0 0 Source: Hausman et al 2008: 31 – 33. Note: ‘x’ is indicative of negligible electrification; - indicates no value given. Where more than one figure given as in the case of China 1928 – 1932 (i.e. 51/62/65) these indicate different indicators, in this case capacity, output and investment.
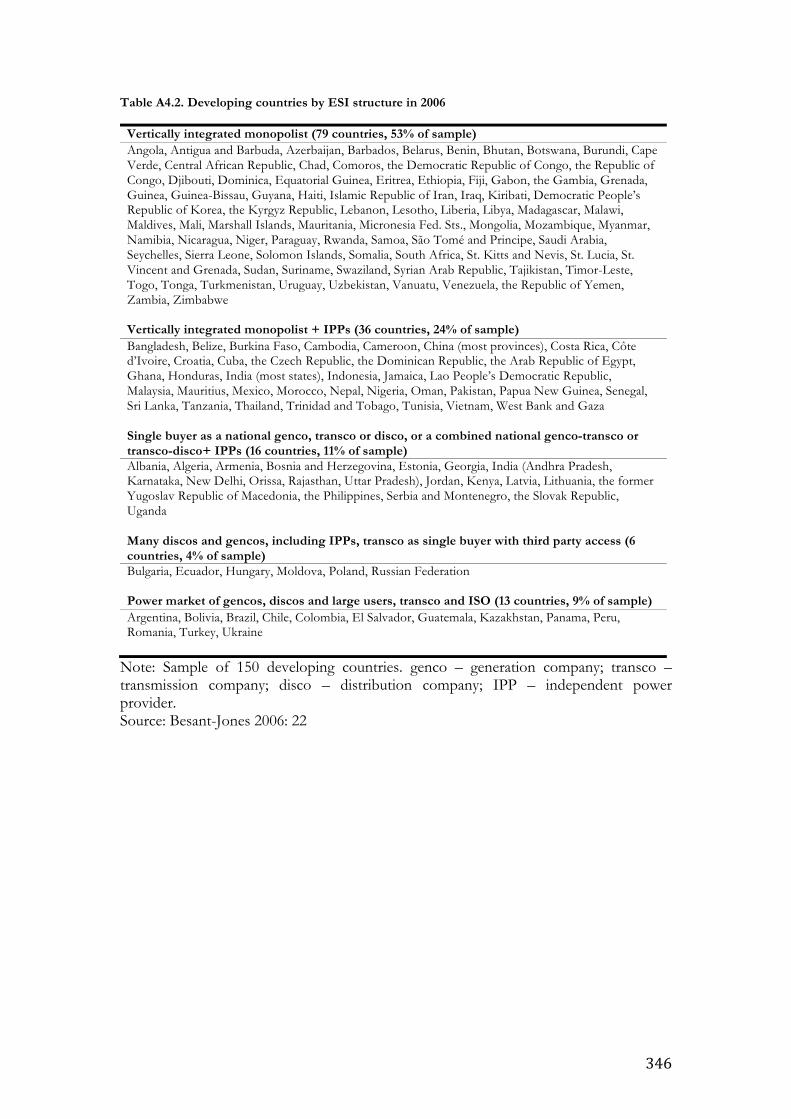
346
Table A4.2. Developing countries by ESI structure in 2006
Vertically integrated monopolist (79 countries, 53% of sample) Angola, Antigua and Barbuda, Azerbaijan, Barbados, Belarus, Benin, Bhutan, Botswana, Burundi, Cape Verde, Central African Republic, Chad, Comoros, the Democratic Republic of Congo, the Republic of Congo, Djibouti, Dominica, Equatorial Guinea, Eritrea, Ethiopia, Fiji, Gabon, the Gambia, Grenada, Guinea, Guinea-Bissau, Guyana, Haiti, Islamic Republic of Iran, Iraq, Kiribati, Democratic People’s Republic of Korea, the Kyrgyz Republic, Lebanon, Lesotho, Liberia, Libya, Madagascar, Malawi, Maldives, Mali, Marshall Islands, Mauritania, Micronesia Fed. Sts., Mongolia, Mozambique, Myanmar, Namibia, Nicaragua, Niger, Paraguay, Rwanda, Samoa, São Tomé and Principe, Saudi Arabia, Seychelles, Sierra Leone, Solomon Islands, Somalia, South Africa, St. Kitts and Nevis, St. Lucia, St. Vincent and Grenada, Sudan, Suriname, Swaziland, Syrian Arab Republic, Tajikistan, Timor-Leste, Togo, Tonga, Turkmenistan, Uruguay, Uzbekistan, Vanuatu, Venezuela, the Republic of Yemen, Zambia, Zimbabwe Vertically integrated monopolist + IPPs (36 countries, 24% of sample) Bangladesh, Belize, Burkina Faso, Cambodia, Cameroon, China (most provinces), Costa Rica, Côte d’Ivoire, Croatia, Cuba, the Czech Republic, the Dominican Republic, the Arab Republic of Egypt, Ghana, Honduras, India (most states), Indonesia, Jamaica, Lao People’s Democratic Republic, Malaysia, Mauritius, Mexico, Morocco, Nepal, Nigeria, Oman, Pakistan, Papua New Guinea, Senegal, Sri Lanka, Tanzania, Thailand, Trinidad and Tobago, Tunisia, Vietnam, West Bank and Gaza Single buyer as a national genco, transco or disco, or a combined national genco-transco or transco-disco+ IPPs (16 countries, 11% of sample) Albania, Algeria, Armenia, Bosnia and Herzegovina, Estonia, Georgia, India (Andhra Pradesh, Karnataka, New Delhi, Orissa, Rajasthan, Uttar Pradesh), Jordan, Kenya, Latvia, Lithuania, the former Yugoslav Republic of Macedonia, the Philippines, Serbia and Montenegro, the Slovak Republic, Uganda Many discos and gencos, including IPPs, transco as single buyer with third party access (6 countries, 4% of sample) Bulgaria, Ecuador, Hungary, Moldova, Poland, Russian Federation Power market of gencos, discos and large users, transco and ISO (13 countries, 9% of sample) Argentina, Bolivia, Brazil, Chile, Colombia, El Salvador, Guatemala, Kazakhstan, Panama, Peru, Romania, Turkey, Ukraine
Note: Sample of 150 developing countries. genco – generation company; transco – transmission company; disco – distribution company; IPP – independent power provider. Source: Besant-Jones 2006: 22
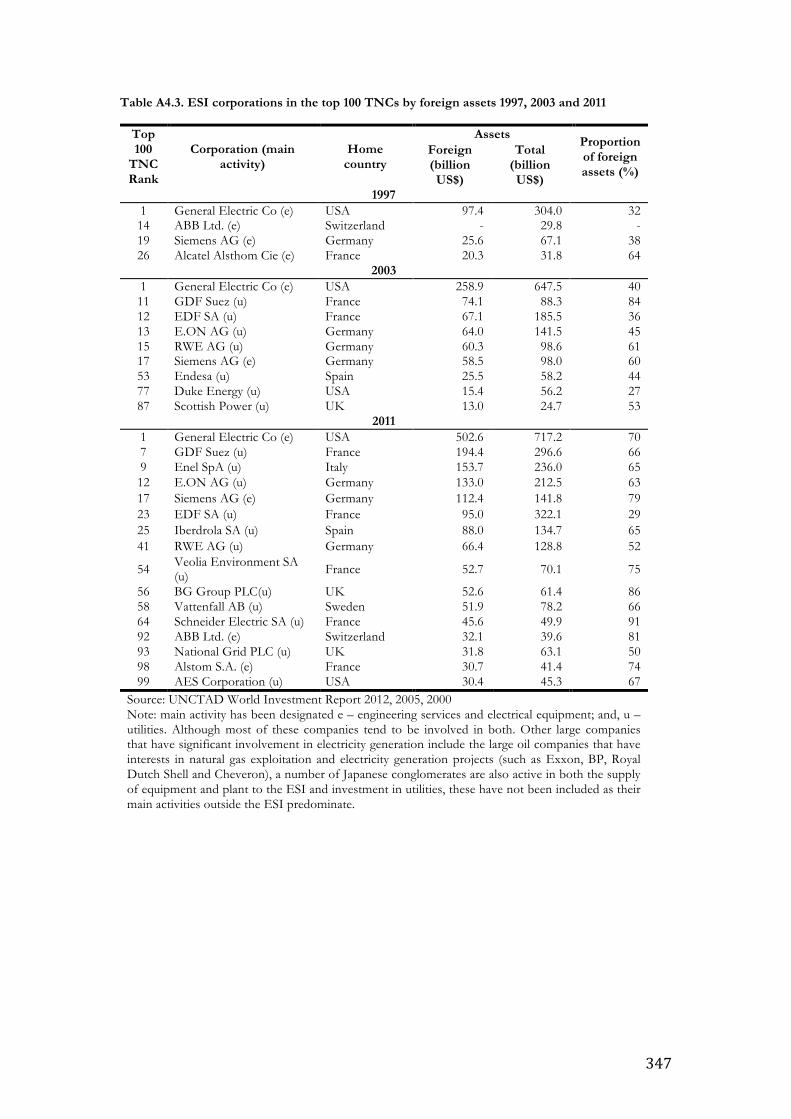
347
Table A4.3. ESI corporations in the top 100 TNCs by foreign assets 1997, 2003 and 2011
Top 100
TNC Rank
Corporation (main activity)
Home country
Assets Proportion of foreign assets (%)
Foreign (billion US$)
Total (billion US$)
1997 1 General Electric Co (e) USA 97.4 304.0 32 14 ABB Ltd. (e) Switzerland - 29.8 - 19 Siemens AG (e) Germany 25.6 67.1 38 26 Alcatel Alsthom Cie (e) France 20.3 31.8 64
2003 1 General Electric Co (e) USA 258.9 647.5 40 11 GDF Suez (u) France 74.1 88.3 84 12 EDF SA (u) France 67.1 185.5 36 13 E.ON AG (u) Germany 64.0 141.5 45 15 RWE AG (u) Germany 60.3 98.6 61 17 Siemens AG (e) Germany 58.5 98.0 60 53 Endesa (u) Spain 25.5 58.2 44 77 Duke Energy (u) USA 15.4 56.2 27 87 Scottish Power (u) UK 13.0 24.7 53
2011 1 General Electric Co (e) USA 502.6 717.2 70 7 GDF Suez (u) France 194.4 296.6 66 9 Enel SpA (u) Italy 153.7 236.0 65 12 E.ON AG (u) Germany 133.0 212.5 63 17 Siemens AG (e) Germany 112.4 141.8 79 23 EDF SA (u) France 95.0 322.1 29 25 Iberdrola SA (u) Spain 88.0 134.7 65 41 RWE AG (u) Germany 66.4 128.8 52
54 Veolia Environment SA (u) France 52.7 70.1 75
56 BG Group PLC(u) UK 52.6 61.4 86 58 Vattenfall AB (u) Sweden 51.9 78.2 66 64 Schneider Electric SA (u) France 45.6 49.9 91 92 ABB Ltd. (e) Switzerland 32.1 39.6 81 93 National Grid PLC (u) UK 31.8 63.1 50 98 Alstom S.A. (e) France 30.7 41.4 74 99 AES Corporation (u) USA 30.4 45.3 67
Source: UNCTAD World Investment Report 2012, 2005, 2000 Note: main activity has been designated e – engineering services and electrical equipment; and, u – utilities. Although most of these companies tend to be involved in both. Other large companies that have significant involvement in electricity generation include the large oil companies that have interests in natural gas exploitation and electricity generation projects (such as Exxon, BP, Royal Dutch Shell and Cheveron), a number of Japanese conglomerates are also active in both the supply of equipment and plant to the ESI and investment in utilities, these have not been included as their main activities outside the ESI predominate.

348
A4.1 Emerging political imperatives, emerging energy imperatives?
It is beyond the scope of this research to go into detail about the future direction of the
ESI. Nevertheless, in completing this review of the interactions between the political
economy and the development of the ESI it is worthwhile considering current pressures
facing the ESI, and how they might effect the techno-economic paradigm and broader
institutional and political economy considerations. As we have noted, the wave of
liberalisation reforms that were implemented in the sector from the 1990s have not
resulted in the emergence of a stable set of institutional arrangements. Indeed, Thomas
(2006) argues that very little is actually left of the substance of market reforms even in
the economies that lead it. In the industrialised world, tightly regulated oligopolistic ESIs
have emerged with few firms, and limited competition:
“….mergers and alliances between European utilities have been accelerated. As a consequence it is
expected that strong business concentrations will emerge in the electricity sector and may even lead to the
creation of private monopolies.” (Meyer 2003: 676)
Perhaps the most significant change has been with the way the system is run. In the past
considerations of reliability and IRS dominated an engineering oriented approach, but
reforms served to place cost and financial management considerations to the fore. Or as
Verbong & Geels (2010) put it, the ESI has moved from an institutional system
dominated by engineers to a “market based system ruled by managers”(1215). This is a
point echoed by Kessides (2005) who acknowledges the shortcomings of ESI reforms
but suggests that reforms have served to put considerations of financial sustainability and
cost at the heart of electricity provision.
In developing countries, as we have seen, in most cases the reforms relative to the
‘standard model’ have been limited. Where reforms have taken place they have answered
the voracious appetite for capital that characterises the ESI. But here too the emergence
of large utilities companies, whether state owned or private is a common feature as a
number of writers have noted (Williams & Ghanadan 2006; Victor & Heller 2007;
Hausman et al 2008). These systems are dominated by the need to increase supply, and
the costs of which tend to dominate investment decisions. In developing countries, the
weakness of regulatory institutions and the central role the state maintains in ESIs means

349
that frequently they remain dominated by the need to allocate resources to strategically
important sectors and groups.
In many ways, the pressures facing the ESI have not changed much since the beginning
post war period. Concerns about energy security and price, in developing countries
ensuring universal access, and above all the need for capital investment dominate sector
considerations. If anything, these concerns are now more acute than they were 60 years
ago. In addition, there is the overriding concern relating to the long-term environmental
impacts of the ESI, and in particular climate change. These in turn point to a range of
other issues within the ESI, securing a reliable fuel supply, keeping tariffs at manageable
levels, technology choice, and securing adequate investment in the sector.
Firstly, security of energy supply has been a concern in Western Europe since the 1950s,
and globally since the 1970s (e.g. see Deese 1979). Since the 1970s, Asian, European and
many developing countries have become increasingly reliant upon energy imports
(Toichi 2003; Correljé, & van der Linde 2006; ASIF, & MUNEER 2007; Gnansounou
2008). The world is still relies heavily upon fossil fuel resources concentrated in what are
regarded as potentially politically volatile regions, such as Russia and the Persian Gulf,
fuel transit through pipelines and shipping lanes also have to pass through potentially
volatile regions such as central Asia and the trans-Caucasus region (Yergin 2006). It is
currently unclear what the implications of the development of shale gas will have for
energy security in the long to medium term. Ensuring energy supply remains a key
strategic and political issue, and one that bears on technology choice in the ESI.
Secondly, closely related to this is the issue of energy price, a key cost of fossil fuel
thermal electricity generation is the cost of the fuel itself. Recent years have seen
increasingly volatile prices for fossil fuels. The rapid increase in demand from China,
India and other emerging economies has been an important factor in driving these price-
rises. This has been characterised not only by fuel price increases well above the rate of
inflation, but also increased volatility in fuel prices (Figure A4.1). Price volatility can be
hedged through long term contracts and futures markets, although this does little to
mitigate longer-term cost increases. In countries with domestic fuel reserves it may be
the case that, at the opportunity cost of foregoing higher export prices, fuels can be
made available to the ESIs at subsidised prices. Price controls on electricity tariffs are
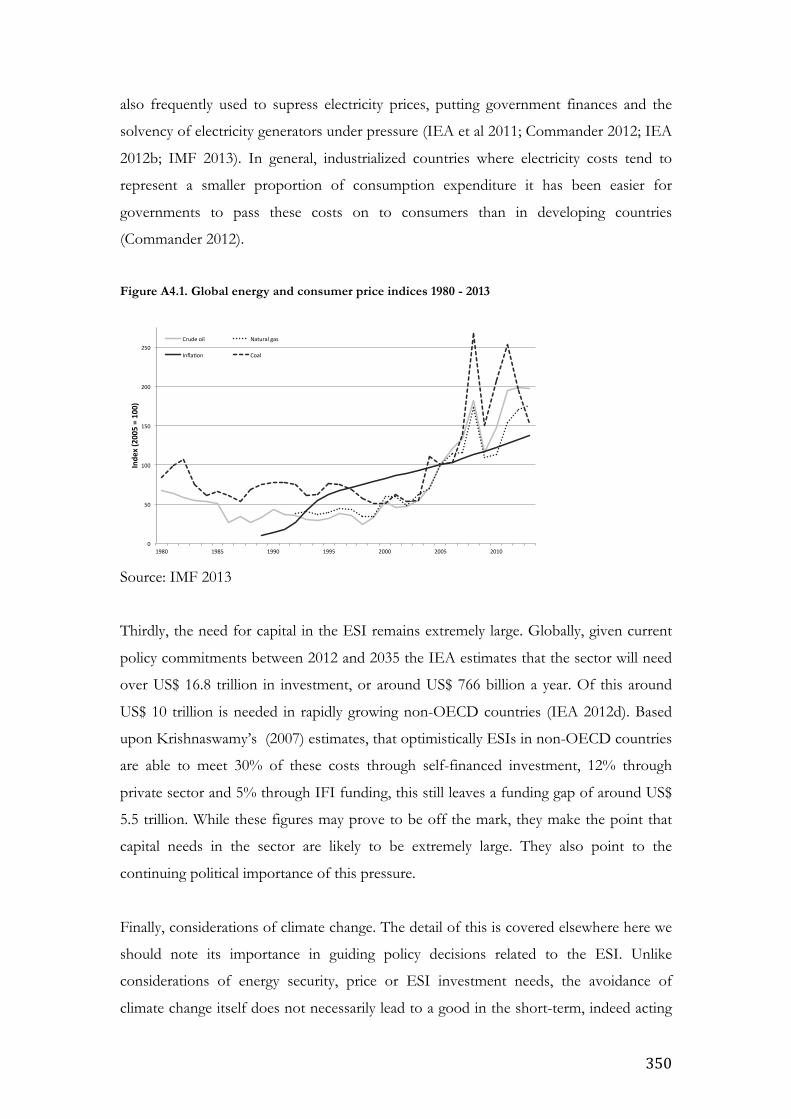
350
also frequently used to supress electricity prices, putting government finances and the
solvency of electricity generators under pressure (IEA et al 2011; Commander 2012; IEA
2012b; IMF 2013). In general, industrialized countries where electricity costs tend to
represent a smaller proportion of consumption expenditure it has been easier for
governments to pass these costs on to consumers than in developing countries
(Commander 2012).
Figure A4.1. Global energy and consumer price indices 1980 - 2013
Source: IMF 2013
Thirdly, the need for capital in the ESI remains extremely large. Globally, given current
policy commitments between 2012 and 2035 the IEA estimates that the sector will need
over US$ 16.8 trillion in investment, or around US$ 766 billion a year. Of this around
US$ 10 trillion is needed in rapidly growing non-OECD countries (IEA 2012d). Based
upon Krishnaswamy’s (2007) estimates, that optimistically ESIs in non-OECD countries
are able to meet 30% of these costs through self-financed investment, 12% through
private sector and 5% through IFI funding, this still leaves a funding gap of around US$
5.5 trillion. While these figures may prove to be off the mark, they make the point that
capital needs in the sector are likely to be extremely large. They also point to the
continuing political importance of this pressure.
Finally, considerations of climate change. The detail of this is covered elsewhere here we
should note its importance in guiding policy decisions related to the ESI. Unlike
considerations of energy security, price or ESI investment needs, the avoidance of
climate change itself does not necessarily lead to a good in the short-term, indeed acting
0"
50"
100"
150"
200"
250"
1980" 1985" 1990" 1995" 2000" 2005" 2010"
Inde
x&(2005&=&100)&
Crude"oil" Natural"gas"
Infla8on" Coal"
351
to mitigate climate change is likely to be costly in the short term. Many authors take the
political commitment to climate change in ESI policy making for granted (e.g. see Geels
2011; Negro et al 2012), but because of the short-term costs involved it would pay to be
sceptical about ostensive political commitments. It is beyond the scope of this research
to investigate the question of commitment further, it is enough to note that in some
countries at least, and for whatever reason, the commitment seems serious and has
resulted in significant investment in climate mitigation technologies.298
These four broad considerations are of differing importance in different countries
depending upon their level of development, economic structure, growth of demand,
institutional arrangements, resource endowment and disposition of political power
amongst other things. But almost everywhere they are influential to a greater or lesser
extent in guiding policy in the ESI. Although these are portrayed as separate issues there
are important linkages between all four. As a number of authors have pointed out there
are significant relationships between energy security and energy price and climate change
mitigation in the ESI (e.g. Asif & Muneer 2007; Bazilian et al 2011). Renewables energy
technologies tend to use indigenous energy resources (wind, sunshine, waves, falling
water), thus mitigating energy security concerns somewhat for import dependant
countries. On the other hand, countries with large indigenous fossil fuel reserves such as
South Africa, India and China, climate considerations trade-off energy security and price
considerations (Bazilian et al 2011). As relates to costs, climate change mitigation is likely
to increase costs in the short to medium term at least. With the exception of
hydropower, most renewables technologies tend to be more expensive than fossil fuel
alternatives even with recent fossil fuel price increases. What is more, climate mitigation
technologies imply proportionately greater up-front capital costs than fossil fuel
technologies and higher technology and policy risk potentially compounding financing
issues (PB Power 2004; Murray 2009; Hayward et al 2011; Joskow 2011; BREE 2012;
REN21 2012; Schmidt et al 2012; NREL & DOE 2013).
If all these challenges are to be met, it is likely to imply significant changes to the
technological and economic characteristics of the sector, which will in turn imply
institutional change. Some technological changes may not be particularly disruptive of
the ESI, such as moderate expansion of renewables and distributed generation (such as
298 For an index measuring climate change policy commitments see Steves et al (2011).
352
CHP), nuclear, end-of-pipe technologies such as CCS and the greater pursuit of demand
side management. All of which could reasonably be achieved within the dominant system
design (Unruh & Carrillo-Hermosilla 2006). More significant changes such as the much
higher penetration of renewables technologies, the development of micro-grids and
increased reliance on distributed generation, the wide scale introduction of smart grid
technologies and the development of trans-national grids for the international transport
of renewables resources (Abusharkh et al 2006; Hofman & Elzen 2010; Verbong &
Geels 2010; Schleicher-Tappeser 2012).
Characteristics of renewable technologies including high capital costs relative to
operational costs, small-scale modular nature of the some renewables technologies (PV
cells in particular) technology and the intermittent availability may imply significant
change to the structure of the ESI. In particular, the intermittency of electricity
production from many renewables sources (wind, solar, ocean and wave) means that
electricity generation is unpredictable and adequate back-up supply needs to be operated
to ensure the reliability of the grid. For small amounts of renewables this back-up need
can be met through existing reserve margins using conventional technologies (although
not without additional operational costs for these generators). For higher levels of
variable renewables penetration additional measures are likely to be needed. Suggestions
have included, i) additional installation of conventional back-up capacity; 299 ii) the
interconnection of geographically dispersed renewables energy resources, acting to
smooth renewables intermittency; iii) reactive demand side management and smart
metering; and, iv) transmission scale electricity storage, amongst mother things (Hofman
& Elzen 2010; Verbong & Geels 2010; Kubik et al 2012; House of Lords 2012).
Recent papers by Hofman & Elzen (2010), Verbong & Geels (2010) and Schleicher-
Tappeser (2012) investigate the possibilities for different types of ESI structure that may
emerge in response to these technological changes. They suggest two fundamentally
different sectoral structures that could emerge, i) a continuation of large-scale grid
structures linking geographically dispersed utility-scale renewables sources (possibly
across international boundaries as with the European super-grid (Higgins 2008)) and
299 Where available hydropower would be favored as it can rapidly alter generation output, CCGTs may also provide relatively quick response.
353
increased nuclear power generation with HVDC transmission lines;300 ii) a move towards
wide scale distributed generation, with either independent or national grid connected
micro-grids. This would incorporate smaller scale renewables, CHP and smart grid
technologies, and imply a significant change to the grid structure. At the current time,
while distributed generation technologies have made significant inroads, through CHP,
and renewables technologies in a range of different technological niches, it remains
unclear how these changes are likely to unfold (Künneke et al 2010).
Whatever the eventual structure of the ESI, it will have significant implications for the
institutional organisation of the ESI. Indeed there are an increasing number of doubts
expressed as to the ability of a liberalized power sector to secure a long-term transition to
more environmentally benign technologies (Meyer 2003; Finger & Künneke 2006;
Mitchell 2010; Chick 2011; Kessides 2012b; Finon 2013):
“There is widespread agreement that liberalized, unbundled electricity markets are poorly designed to
encourage large-scale investment in, and deployment of, renewable and other low-carbon generating
technologies. The transition to a renewable energy will give rise to new regulatory and market design issues.
It will also generate important financing challenges because of the cost characteristics of these
technologies.” (Kessides 2012b: 87)301
In general, the large-scale incorporation of intermittent renewables implies is much more
complex from an operational perspective than a grid based upon dispatchable fossil fuels
(Finon 2013). It also requires a level of coordination of long-term investments and
research, and, in terms of system operations, is likely to imply mechanisms that are
unlikely to be realized without greater government intervention (Mitchell 2010; Mayer
2003). In this regard it is worthwhile quoting Chick (2011) in his deft identification of the
problem:
300 Indeed, the search for cheap power is motivation the search for cross-broader power sales. Such as from Nepal to India, DRC to South Africa, Lao PDR to Thailand, China and Vietnam, Myanmar to China and Thailand to name a few. 301 It may be that Kessides has nuclear in mind when he is thinking about the potential efficacy of markets in this regard, as Thomas suggest: “Without the approval and underwriting from governments, even if sometimes tacit, for waste disposal, materials security, insurance, siting and decommissioning, nuclear power cannot survive…[…]…signals from the market should not be ignored; but it would be foolish dogma to dismiss an energy source of the potential of nuclear power simply because it did not fit into a particular way of organizing electricity supply.” (Thomas, & Berkhout 1992:594)
354
“The liberalisation of markets in which large sunk investments were required simply increased uncertainty
and risk, and made those investments less likely to occur. Increased competition could make the existing
assets work harder, but the increased uncertainty about future returns and relative prices pushed time-
related discount rates higher thereby reducing investment in new large sunk assets. This might not matter,
except that in industries like energy, governments express concern about the security implications, be they
environmental, economic or military, of a failure to solicit sufficient long-term sunk investment. While
issues of national security are a legitimate area for government activity, most of those concerns, be they
with global warming or electricity capacity shortages, currently work backwards to the present from a
future projection of danger. Government appears to have shifted its area of responsibilities forward in
time, while working with present markets which accommodate time inadequately. It might be better for
government to accept responsibility for the present precisely by acting to reduce current uncertainty about
the future.” (Chick 2011: 759)
Much of this comment focuses on ESIs in European and other industrialized countries,
these are essentially technological concerns which relate to both the type of technology
and the economic attributes emerging from these technological characteristics, and to
that extent these questions are also of relevance to developing countries. Developing
countries however face tighter investment constraints, lower tolerance for upwards
pressure on end-user tariffs and lower levels of regulatory, planning and technological
capability which will be needed for the successful implementation of these technologies,
and their future institutional arrangements.
What is clear in both the case of industrialized and developing countries is that the
challenges facing the ESI and the proposed technological solutions, if such change were
to go ahead, would be disruptive of incumbent vested interests. Despite the dramatic
change wrought by the development of the power sector, it has not been disruptive of
important vested interests in fossil fuel extraction. But the transitions envisaged here
could well be. This may especially be a problem in developing countries where the
economic and political power of these interests is large relative to other groups. Down-
stream impacts may also feature large if end-user tariffs increase or smart metering has
unpopular impacts on use patterns. Finally, resistance may come from inside the sector,
if the established interests of utilities are threatened. The particular context and
generation mix will determine how the political economy is elaborated and how
considerations of technological change interact with other pressures facing the ESI.
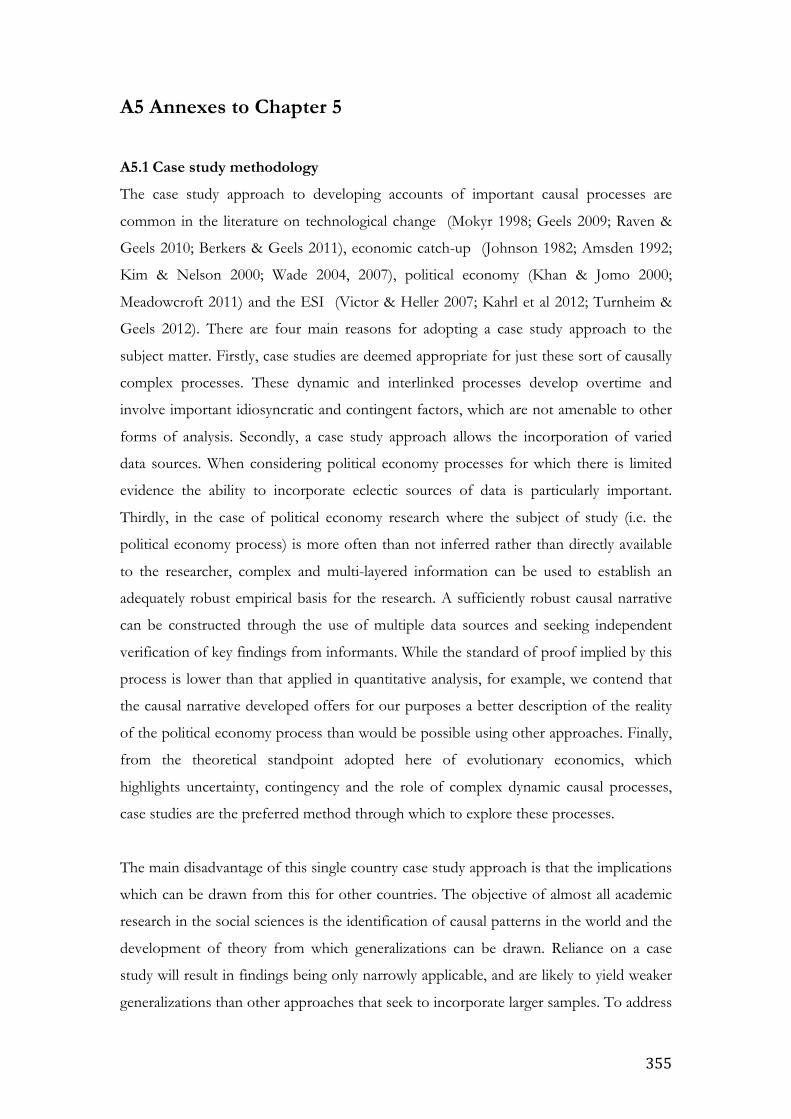
355
A5 Annexes to Chapter 5
A5.1 Case study methodology
The case study approach to developing accounts of important causal processes are
common in the literature on technological change (Mokyr 1998; Geels 2009; Raven &
Geels 2010; Berkers & Geels 2011), economic catch-up (Johnson 1982; Amsden 1992;
Kim & Nelson 2000; Wade 2004, 2007), political economy (Khan & Jomo 2000;
Meadowcroft 2011) and the ESI (Victor & Heller 2007; Kahrl et al 2012; Turnheim &
Geels 2012). There are four main reasons for adopting a case study approach to the
subject matter. Firstly, case studies are deemed appropriate for just these sort of causally
complex processes. These dynamic and interlinked processes develop overtime and
involve important idiosyncratic and contingent factors, which are not amenable to other
forms of analysis. Secondly, a case study approach allows the incorporation of varied
data sources. When considering political economy processes for which there is limited
evidence the ability to incorporate eclectic sources of data is particularly important.
Thirdly, in the case of political economy research where the subject of study (i.e. the
political economy process) is more often than not inferred rather than directly available
to the researcher, complex and multi-layered information can be used to establish an
adequately robust empirical basis for the research. A sufficiently robust causal narrative
can be constructed through the use of multiple data sources and seeking independent
verification of key findings from informants. While the standard of proof implied by this
process is lower than that applied in quantitative analysis, for example, we contend that
the causal narrative developed offers for our purposes a better description of the reality
of the political economy process than would be possible using other approaches. Finally,
from the theoretical standpoint adopted here of evolutionary economics, which
highlights uncertainty, contingency and the role of complex dynamic causal processes,
case studies are the preferred method through which to explore these processes.
The main disadvantage of this single country case study approach is that the implications
which can be drawn from this for other countries. The objective of almost all academic
research in the social sciences is the identification of causal patterns in the world and the
development of theory from which generalizations can be drawn. Reliance on a case
study will result in findings being only narrowly applicable, and are likely to yield weaker
generalizations than other approaches that seek to incorporate larger samples. To address
356
this concern the case study is described as an instance of the wider general argument we
have developed in Chapters 2, 3 and 4. The argumentation in Chapters 6 and 7 has
sought to draw on a wide body of evidence to support it.
A5.2 Sources of empirical evidence
To enable the development of a robust case study information sources that have been
drawn on have been as broad as possible. These include a range of available information
from sources including official documentation, grey literature, secondary quantitative
data and key informant interviews.
First, official documentation understanding state policy and plans is central to
understanding the political economy. These include sectoral planning documents,
legislation and administrative documents. Firstly, as a means of to developing an
overview of how policy in the key areas related to the ESI in Vietnam. Secondly, while
policy and planning may only be indirectly indicative of the political economy they
nevertheless represents ostensive state intentions. Thirdly, an understanding of the gap
between stated (de jure) policy intentions and actual (de facto) policy outcomes can be
indicative of how political economy power in a country is articulated.
Second, the grey literature relating to the broad topic of this research is significant. In the
absence of other sources the grey literature has been of particular importance in building
the case study. Both foreign language and Vietnamese sources have been extensively
utilised. These sources include Vietnamese language press, English language press,
foreign media, donor reports and project documentation, consultancy reports and other
technical materials. The extensive use of grey literature may be seen to pose epistemic
problems, as these sources lack the supposed veracity of peer reviewed academic
literature. Nevertheless, as the standpoints of the author institutions are usually clear it is
not a difficult task to discern bias in their reporting. Moreover, they can often be an
important source of policy information or factual evidence which is not subject to bias to
the same extent as the analysis or opinion of the source. Finally, given their particular
institutional perspective they can be a useful source on the views of key interest groups
in approaching these policies.
357
Third, secondary quantitative data, this study has not sought to collect primary
quantitative data on the ESI as it is either difficult to obtain, generally not available or in
some cases (such as accounting information on SOEs) is a closely guarded secret.
However, a range of secondary data is available including that gathered by the
government, IFIs and other organizations as a key source of evidence. In particular,
energy and electricity usage and demand projections, information on investment flows to
different sectors, and general macroeconomic data, which have all been important basis
for the development of the argument. The quality of this data is a concern. It is a well-
know, if not widely acknowledged amongst researchers that some datasets are of poor
quality. However, this is less of a problem in the ESI where much of the data has been
externally verified, comes form reliable sources or is of a non-controversial nature.
Nevertheless, caution has still been required in the use of data. For example, information
on transmission and distribution losses is reputedly unreliable (see Chapter 6), and much
of the information on the financial performance of EVN and other energy parastatals
has been open to question. Where these questions of data reliability emerge, caveats have
been added in the text.
Fourth, key informant interviews have been an important source of information,
essential in developing a convincing picture of sectoral development in Vietnam, and
especially in developing an accurate picture of the political economy. Annex A6.6
includes a list of interviewees questioned during the course of this research. Due to the
nature of this research a substantial proportion of these interviews have been conducted
on an informal basis. Unstructured interviews were used to obtain an overall picture of
the sector, to find out about specific events, which were illustrative of the political
economy of the sector and to verify the findings of the research. Frequently, interviews
and other communications (phone and e-mail) were conducted on an iterative basis the
picture of the development of the sector was built up.
The relatively closed and opaque nature of the Vietnamese polity and the sensitive nature
of the research means that it has been important to maintain the anonymity of all
informants. Government officials were not available for interview, although in some
cases where they were employed as consultants or work in affiliated institutes they have
been questioned, staff from international organisations have also been an important
source of information (e.g. World Bank, IFC, ADB, JICA etc.). Other groups
358
interviewed include private sector developers, businesses, lawyers, financiers, and private
individuals and companies working in international development and infrastructure
provision have also been an important source of information.
A5.3 Vietnam’s economic context and the prelude to reform
A5.3.1 Recent economic performance and perceptions of future prospects
In the two decades between 1990 and 2010, Vietnam saw an average annual real GDP
growth of 7.4%, coupled with relatively modest population growth, this lead to dramatic
increases in per capita GDP and declines in the poverty rates (Table 5.1) (Rama 2008;
GSO 2013; World Bank 2013). Growth in the industrial and service sectors has been,
and continues to be, largely responsible for the rapid economic growth.302 Poverty rates
declined both as a consequence of improvements in agricultural productivity and job
creation in manufacturing industry (Van Arkadie & Mallon 2003; Das & Shrestha
2009).303
All ownership sectors were important in realising this rapid economy growth, including
domestically owned private enterprises and foreign invested enterprises, but the lion’s
share of growth during the 1990s was accounted for by the state owned sector, while the
sector continues to play an important part in the economy, since around the turn of the
century private sector investment has been of more importance in driving growth
(Beresford 2008; Ffrode 2007; Van Arakadie & Mallon 2003; Perkins 2010). In particular
and in common with other East Asian industrialising economies, trade and inward
investment in the shape of FDI have been important contributing factors (Luong 2007;
Thoburn 2009). Export earnings have increased rapidly, both in absolute terms and in
relation to GDP - increasing from 36.0% of GDP in 1990 to 77.5% of GDP by 2010
(Table 5.1). The export of commodities and primary products has played an important
role in this growth accounting for around 35% of export value in 2010 (GSO 2013).304
However, since 2002 commodity exports have been exceeded by exports of
302 Although the solid performance in agricultural sector, creating conditions in which secondary and tertiary sector growth could take off should not be overlooked. 303 As observed in Chapter 3 and Annex A3 see also Szirmai (2011). 304 Of which the largest was seafood and crude oil both accounting for around 6.9% of exports, wood and wooden products accounted fro 4.8% of exports, rice 4.5%, rubber 3.3%, coffee 2.5% and coal 2.2%. Volatility in commodity prices suggests we should be cautious in interpreting the implications of this, but a review of export revenue between 1995 and 2010 shows a secular decline in the share of commodities in exports from around 67% in 1995, to around 50% in 2002, to the current figure of 35% (GSO 2013). We return to look in greater detail at the importance of exports of fossil fuels in section 5.2.1.
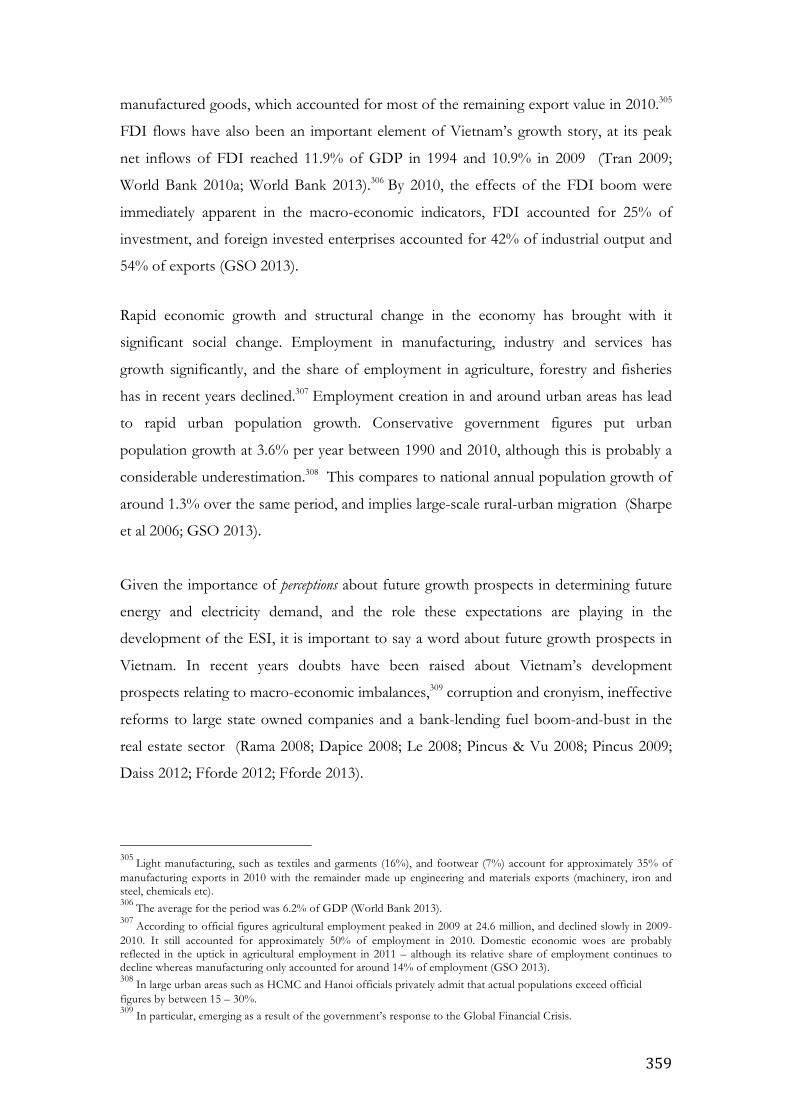
359
manufactured goods, which accounted for most of the remaining export value in 2010.305
FDI flows have also been an important element of Vietnam’s growth story, at its peak
net inflows of FDI reached 11.9% of GDP in 1994 and 10.9% in 2009 (Tran 2009;
World Bank 2010a; World Bank 2013).306 By 2010, the effects of the FDI boom were
immediately apparent in the macro-economic indicators, FDI accounted for 25% of
investment, and foreign invested enterprises accounted for 42% of industrial output and
54% of exports (GSO 2013).
Rapid economic growth and structural change in the economy has brought with it
significant social change. Employment in manufacturing, industry and services has
growth significantly, and the share of employment in agriculture, forestry and fisheries
has in recent years declined.307 Employment creation in and around urban areas has lead
to rapid urban population growth. Conservative government figures put urban
population growth at 3.6% per year between 1990 and 2010, although this is probably a
considerable underestimation.308 This compares to national annual population growth of
around 1.3% over the same period, and implies large-scale rural-urban migration (Sharpe
et al 2006; GSO 2013).
Given the importance of perceptions about future growth prospects in determining future
energy and electricity demand, and the role these expectations are playing in the
development of the ESI, it is important to say a word about future growth prospects in
Vietnam. In recent years doubts have been raised about Vietnam’s development
prospects relating to macro-economic imbalances,309 corruption and cronyism, ineffective
reforms to large state owned companies and a bank-lending fuel boom-and-bust in the
real estate sector (Rama 2008; Dapice 2008; Le 2008; Pincus & Vu 2008; Pincus 2009;
Daiss 2012; Fforde 2012; Fforde 2013).
305 Light manufacturing, such as textiles and garments (16%), and footwear (7%) account for approximately 35% of manufacturing exports in 2010 with the remainder made up engineering and materials exports (machinery, iron and steel, chemicals etc). 306 The average for the period was 6.2% of GDP (World Bank 2013). 307 According to official figures agricultural employment peaked in 2009 at 24.6 million, and declined slowly in 2009-2010. It still accounted for approximately 50% of employment in 2010. Domestic economic woes are probably reflected in the uptick in agricultural employment in 2011 – although its relative share of employment continues to decline whereas manufacturing only accounted for around 14% of employment (GSO 2013). 308 In large urban areas such as HCMC and Hanoi officials privately admit that actual populations exceed official figures by between 15 – 30%. 309 In particular, emerging as a result of the government’s response to the Global Financial Crisis.
360
While it is clear Vietnam faces substantial challenges in maintaining rapid economic
growth, the perception remains that in the medium to long term Vietnam has relatively
good growth prospects. A number of influential investment reviews have noted
Vietnam’s long term growth prospects, for example, Goldman-Sachs identified Vietnam
as one of the ‘Next Eleven’ emerging economies after Brazil, India, Russia and China,
and forecasted a growth rates exceeding 6% to 2030 and above 4% to 2050 (Wilson &
Stupnytska 2007). Similar growth prospects are envisaged in official planning documents,
for example the current power development plan foresees a growth rate exceeding 7.5%
between 2010 and 2030 (MOIT 2011). Suffice to say that despite current economic
turbulence the general perception is that Vietnam’s long-term economic growth
prospects remain strong. Such perceptions are critical in determining investment in and
policy towards the energy sector (IMF 2012; Oxford Economics 2012).
A5.3.2 The context for economic reform
Vietnam’s much vaunted economic success seems all the more remarkable considering
its particularly traumatic recent history. Three decades of armed conflict preceded the
unification of North and South Vietnam under Communist Party (CP) rule in 1976,
following the end of the Vietnam War in 1975.310 The CP inherited a physically shattered
and politically divided country. From an economic perspective, immediately following
the end of the conflict managing the aftermath of the war was the main priority. The CP
faced with large numbers of internally displaced persons, the wholesale destruction of
infrastructure and the integration of two independent and very different economic
systems. Nevertheless, from 1976 economic policy and planning focussed on the
development of a centralised command economy along Soviet lines with state ownership
over the means of production.311 In principle, the allocation of resources (financial,
material and labour) was determined by a centralised planning process, enterprises were
required to meet production targets set by the state planners, marketing and distribution
of goods, price, salaries and the use of investment funds were all determined by the plan.
More substantively, this implied a concentration of resources on heavy industry
(including the energy sector) and ‘production of the means of production’, with light
manufacturing and agricultural sectors receiving relatively little state investment – and
this despite agricultural development being a priority of stated policy (Probert & Young
310 Official reunification took place in 1976 with the formation of the Socialist Republic of Vietnam. 311 At this time the influence of Soviet planners and economic experts was important in developing economy policy.
361
1995; Van Arkadie & Mallon 2003).312 Efforts to promote a socialist transformation of
the country gathered pace in 1978, with campaigns to nationalise private enterprises and
collectivise agriculture in the south (Van Arkadie & Mallon 2003).
Efforts to realise national industrialisation and renewal through central planning were
largely unsuccessful. And through the late 1970s and early 1980s the country lurched
from economic crisis to economic crisis, with falling production in industrial and
agricultural sectors, food shortages, high levels of inflation and declining balance of trade
(Luong 2003).313 Reforms in the 1979 - 1982 restored some production incentives and
lead to increasing agricultural and industrial output. This offered only temporary
reprieve, reforms had failed to tackle issues relating to pricing, incentives facing
bureaucrats or financial management (Probert & Young 1995; Van Arkadie & Mallon
2003). By the mid 1980s inflationary pressures and falling growth lead the government to
increase state wages, expand the money supply and reform prices. However, this lead to
a loss of faith in the value of the Dong and a damaging inflationary spiral, falling
economic growth and by 1986 annual inflation was running in excess of 700 % (Luong
2003).
Geopolitical factors also featured large in Vietnam’s economic woes. The aftermath of
the war left Vietnam subject to a US embargo and isolated internationally, as a result aid
flows that were expected in the aftermath of the war did not emerge. While both China
and the USSR had been important supporters of the communist north during the war,
peace brought escalating tensions with China following the Sino-Soviet split and rising
Chinese suspicions of Soviet influence in Vietnam. Vietnam was pulled closer into the
Soviet orbit through membership of the Council for Mutual Economic Assistance
(CEMA) in 1978 (Probert & Young 1995; Luong 2003). Relations with China soured
further in 1978 with the Vietnamese invasion of Cambodia and an ‘anti-capitalist’
campaign, which targeted small businesses in the south of the country which were largely
owned by ethnic Chinese. Chinese economic assistance was cancelled at this time. This
culminated in a short border war with China in 1979 and intermittent low-level conflict
on the border, which rumbled through the 1980s. Finally, the occupation of Cambodia,
312 New plans promoting central planning were adopted in 1976 (1976 – 1980), and interim three year plan to address the failing of the previous plan in 1978 (1978 – 1980) and in 1980 (1981 – 1985) (Van Arkadie, & Mallon 2003). 313 Van Arkadie and Mallon (2003) cite an report of the Asian Development Bank, suggesting that “By the late 1970s, Viet Nam was facing a ‘major economic crisis, with acute shortages of food, basic consumer goods, and inputs to agriculture and industry, and growing external debt.” (47)
362
which continued until 1989 also made considerable demands on Vietnam’s limited
economic resources (Horn 1987; Luong 2003;Van Arkadie & Malllon 2003).
In the face of a gathering economic crisis and growing popular discontent, a change in
the strategic direction of economic policy was formally announced at the sixth
Communist Party Congress (CPC) in 1986 in the shape of ‘Doi Moi’. Doi Moi heralded a
significant change in direction for government economic policy, with an emphasis on the
development of a ‘market oriented’ economy and a shift away from a centralised
command economy. While a number of key reforms were adopted in the years
immediately following the announcement of Doi Moi – such as wide-reaching agricultural
reforms in 1986 and 1988, the abolition of the two price system for most goods in 1989,
and the official sanctioning of private and joint venture enterprises in 1990 – it was not
until after the seventh CPC in 1991 that reforms started to bear fruit economic growth
started to take off, and economic indicators started to show significant (and somewhat
unexpected) improvement (Fforde & De Vylder 1996; Luong 2003; Van Arkadie &
Mallon 2003; Beresford 2008).
Most diagnoses of the immediate internal causes of Vietnam’s poor economic
performance during this period centre on the failure of central planning to offer
appropriate incentives for improved productivity, the overemphasis on heavy industry,
the passive resistance to the operation of central planning (particularly at the level of
agricultural collectives) and the state’s inability to effectively implement policy. External
factors including the end of preferential CEMA trade agreements and Soviet aid with the
collapse of communist governments in Eastern Europe and the USSR also dealt a severe
blow to the industrial rump of Vietnam’s economy which relied heavily upon this
support (Probert & Young 1995; Van Arkadie & Mallon 2003; Kerkvliet 2005; Perkins
& Vu 2010).314
The broad contours of the impetus for reform and of economic performance in the
reform period are generally agreed upon. As are important endogenous factors including
314 Comicon, or the Council for Mutual Economic Assistance (CEMA) was an economic organization for trade and multilateral aid composed of mainly eastern European but also other communist countries lead by the USSR.
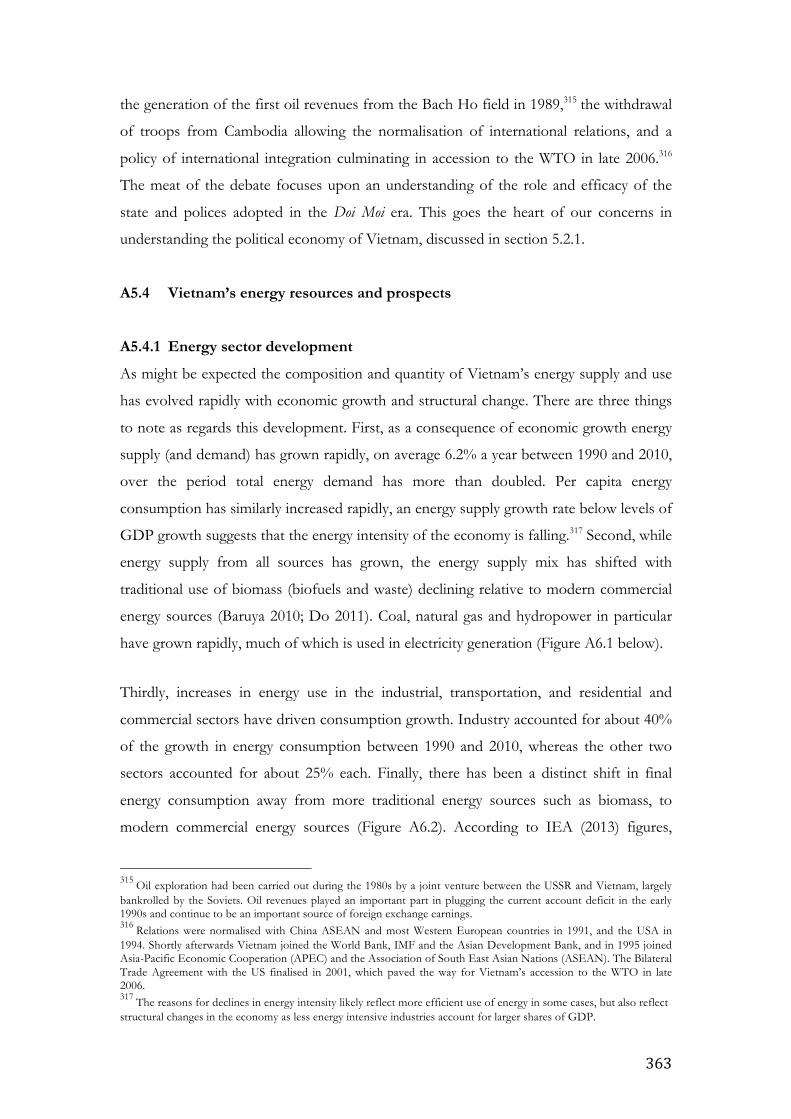
363
the generation of the first oil revenues from the Bach Ho field in 1989,315 the withdrawal
of troops from Cambodia allowing the normalisation of international relations, and a
policy of international integration culminating in accession to the WTO in late 2006.316
The meat of the debate focuses upon an understanding of the role and efficacy of the
state and polices adopted in the Doi Moi era. This goes the heart of our concerns in
understanding the political economy of Vietnam, discussed in section 5.2.1.
A5.4 Vietnam’s energy resources and prospects
A5.4.1 Energy sector development
As might be expected the composition and quantity of Vietnam’s energy supply and use
has evolved rapidly with economic growth and structural change. There are three things
to note as regards this development. First, as a consequence of economic growth energy
supply (and demand) has grown rapidly, on average 6.2% a year between 1990 and 2010,
over the period total energy demand has more than doubled. Per capita energy
consumption has similarly increased rapidly, an energy supply growth rate below levels of
GDP growth suggests that the energy intensity of the economy is falling.317 Second, while
energy supply from all sources has grown, the energy supply mix has shifted with
traditional use of biomass (biofuels and waste) declining relative to modern commercial
energy sources (Baruya 2010; Do 2011). Coal, natural gas and hydropower in particular
have grown rapidly, much of which is used in electricity generation (Figure A6.1 below).
Thirdly, increases in energy use in the industrial, transportation, and residential and
commercial sectors have driven consumption growth. Industry accounted for about 40%
of the growth in energy consumption between 1990 and 2010, whereas the other two
sectors accounted for about 25% each. Finally, there has been a distinct shift in final
energy consumption away from more traditional energy sources such as biomass, to
modern commercial energy sources (Figure A6.2). According to IEA (2013) figures,
315 Oil exploration had been carried out during the 1980s by a joint venture between the USSR and Vietnam, largely bankrolled by the Soviets. Oil revenues played an important part in plugging the current account deficit in the early 1990s and continue to be an important source of foreign exchange earnings. 316 Relations were normalised with China ASEAN and most Western European countries in 1991, and the USA in 1994. Shortly afterwards Vietnam joined the World Bank, IMF and the Asian Development Bank, and in 1995 joined Asia-Pacific Economic Cooperation (APEC) and the Association of South East Asian Nations (ASEAN). The Bilateral Trade Agreement with the US finalised in 2001, which paved the way for Vietnam’s accession to the WTO in late 2006. 317 The reasons for declines in energy intensity likely reflect more efficient use of energy in some cases, but also reflect structural changes in the economy as less energy intensive industries account for larger shares of GDP.
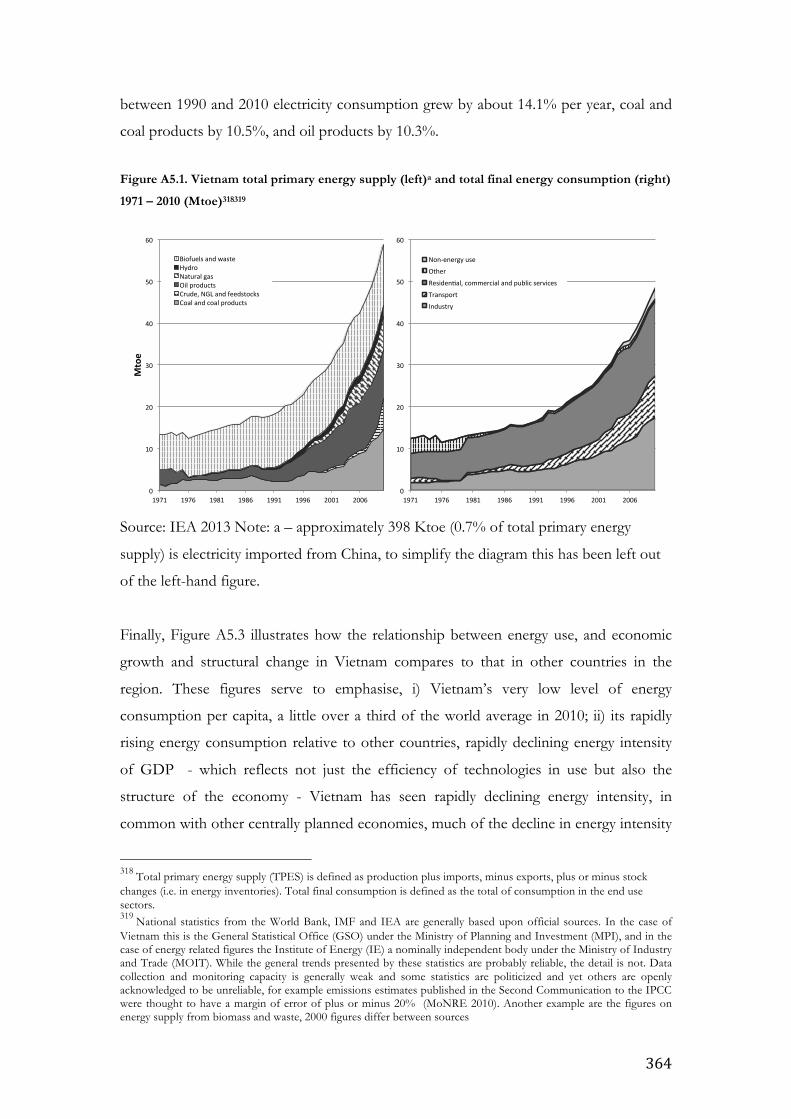
364
between 1990 and 2010 electricity consumption grew by about 14.1% per year, coal and
coal products by 10.5%, and oil products by 10.3%.
Figure A5.1. Vietnam total primary energy supply (left)a and total final energy consumption (right)
1971 – 2010 (Mtoe)318319
Source: IEA 2013 Note: a – approximately 398 Ktoe (0.7% of total primary energy
supply) is electricity imported from China, to simplify the diagram this has been left out
of the left-hand figure.
Finally, Figure A5.3 illustrates how the relationship between energy use, and economic
growth and structural change in Vietnam compares to that in other countries in the
region. These figures serve to emphasise, i) Vietnam’s very low level of energy
consumption per capita, a little over a third of the world average in 2010; ii) its rapidly
rising energy consumption relative to other countries, rapidly declining energy intensity
of GDP - which reflects not just the efficiency of technologies in use but also the
structure of the economy - Vietnam has seen rapidly declining energy intensity, in
common with other centrally planned economies, much of the decline in energy intensity
318 Total primary energy supply (TPES) is defined as production plus imports, minus exports, plus or minus stock changes (i.e. in energy inventories). Total final consumption is defined as the total of consumption in the end use sectors. 319 National statistics from the World Bank, IMF and IEA are generally based upon official sources. In the case of Vietnam this is the General Statistical Office (GSO) under the Ministry of Planning and Investment (MPI), and in the case of energy related figures the Institute of Energy (IE) a nominally independent body under the Ministry of Industry and Trade (MOIT). While the general trends presented by these statistics are probably reliable, the detail is not. Data collection and monitoring capacity is generally weak and some statistics are politicized and yet others are openly acknowledged to be unreliable, for example emissions estimates published in the Second Communication to the IPCC were thought to have a margin of error of plus or minus 20% (MoNRE 2010). Another example are the figures on energy supply from biomass and waste, 2000 figures differ between sources
0"
10"
20"
30"
40"
50"
60"
1971" 1976" 1981" 1986" 1991" 1996" 2001" 2006"
Mtoe%
Biofuels"and"waste"Hydro"Natural"gas"Oil"products"Crude,"NGL"and"feedstocks"Coal"and"coal"products"
0"
10"
20"
30"
40"
50"
60"
1971" 1976" 1981" 1986" 1991" 1996" 2001" 2006"
NonFenergy"use"
Other"
ResidenIal,"commercial"and"public"services"
Transport"
Industry"

365
is structural and related to a relative shift away from an inefficient allocation of resources
to energy intensive sectors;320 iii) With the obvious caveat that there are likely to be
structural differences in economies, Vietnam has a long way to go to catch-up to the
technological leaders (here represented by Japan and Korea) in terms of energy
efficiency.
Figure A5.2. Vietnam share of final energy consumption by fuel 1971 - 2010
Source: IEA 2013
Figure A5.3. Vietnam’s energy intensity in comparison with selected countries, per capita 1971 –
2010 (left) and per unit value added 1980 – 2010 (right)
Source: World Bank 2013
A5.4.2 Energy resources
Vietnam has significant fossil fuel reserves, hydropower and renewable energy generation
potential (Table A5.1). The presence of ample domestic hydropower and coal resources
320 Although in recent years energy intensity has seen something of an upsurge, it is not clear yet whether this represents a long-term trend.
0"
10"
20"
30"
40"
50"
60"
70"
80"
90"
1971" 1976" 1981" 1986" 1991" 1996" 2001" 2006"
Percen
t'
Biofuels"and"waste"
Oil"products"
Coal"and"coal"products"
Electricity"
0"
200"
400"
600"
800"
1,000"
1,200"
1,400"
1,600"
1,800"
2,000"
1971" 1976" 1981" 1986" 1991" 1996" 2001" 2006"
Koe/capita*
China"
India"
Indonesia"
Philippines"
Thailand"
Vietnam"
World"
100"
150"
200"
250"
300"
350"
400"
1980" 1985" 1990" 1995" 2000" 2005" 2010"
Koe/USD
*1,000
*(200
5*PP
P)*
India"
Indonesia"
Japan"
Korea"
Philippines"
Thailand"
Vietnam"
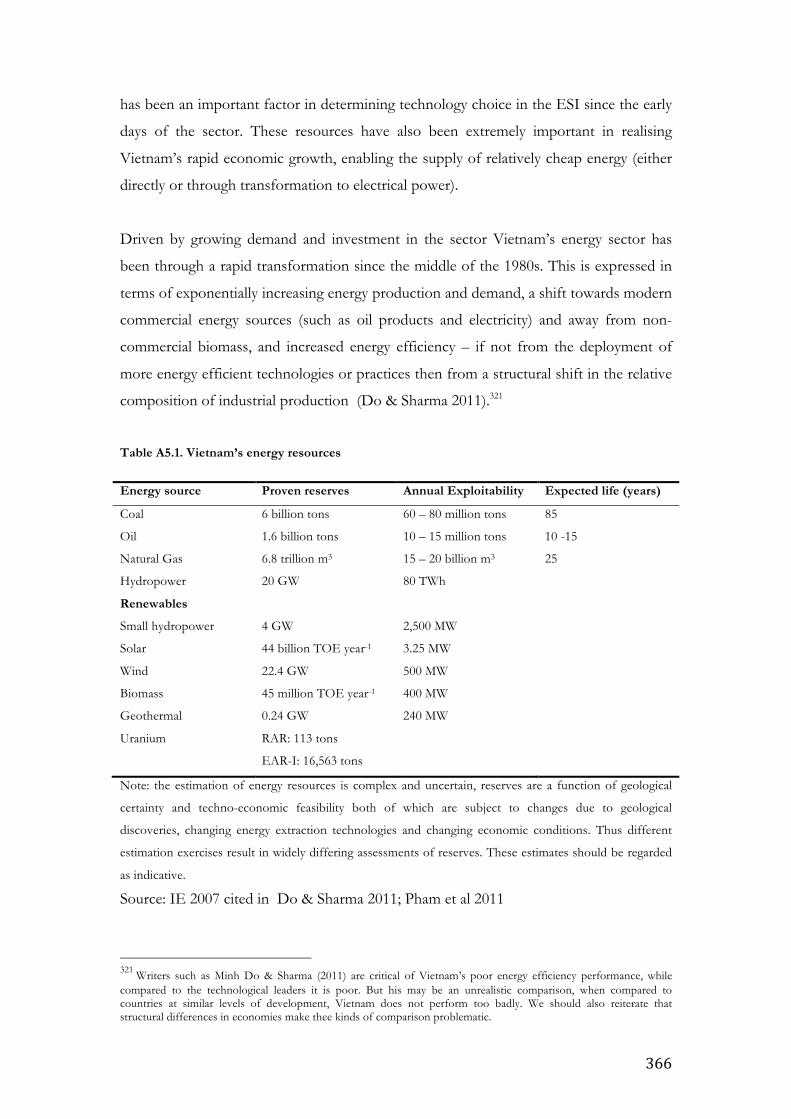
366
has been an important factor in determining technology choice in the ESI since the early
days of the sector. These resources have also been extremely important in realising
Vietnam’s rapid economic growth, enabling the supply of relatively cheap energy (either
directly or through transformation to electrical power).
Driven by growing demand and investment in the sector Vietnam’s energy sector has
been through a rapid transformation since the middle of the 1980s. This is expressed in
terms of exponentially increasing energy production and demand, a shift towards modern
commercial energy sources (such as oil products and electricity) and away from non-
commercial biomass, and increased energy efficiency – if not from the deployment of
more energy efficient technologies or practices then from a structural shift in the relative
composition of industrial production (Do & Sharma 2011).321
Table A5.1. Vietnam’s energy resources
Energy source Proven reserves Annual Exploitability Expected life (years)
Coal 6 billion tons 60 – 80 million tons 85
Oil 1.6 billion tons 10 – 15 million tons 10 -15
Natural Gas 6.8 trillion m3 15 – 20 billion m3 25
Hydropower 20 GW 80 TWh
Renewables
Small hydropower 4 GW 2,500 MW
Solar 44 billion TOE year-1 3.25 MW
Wind 22.4 GW 500 MW
Biomass 45 million TOE year-1 400 MW
Geothermal 0.24 GW 240 MW
Uranium RAR: 113 tons
EAR-I: 16,563 tons
Note: the estimation of energy resources is complex and uncertain, reserves are a function of geological
certainty and techno-economic feasibility both of which are subject to changes due to geological
discoveries, changing energy extraction technologies and changing economic conditions. Thus different
estimation exercises result in widely differing assessments of reserves. These estimates should be regarded
as indicative.
Source: IE 2007 cited in Do & Sharma 2011; Pham et al 2011
321 Writers such as Minh Do & Sharma (2011) are critical of Vietnam’s poor energy efficiency performance, while compared to the technological leaders it is poor. But his may be an unrealistic comparison, when compared to countries at similar levels of development, Vietnam does not perform too badly. We should also reiterate that structural differences in economies make thee kinds of comparison problematic.
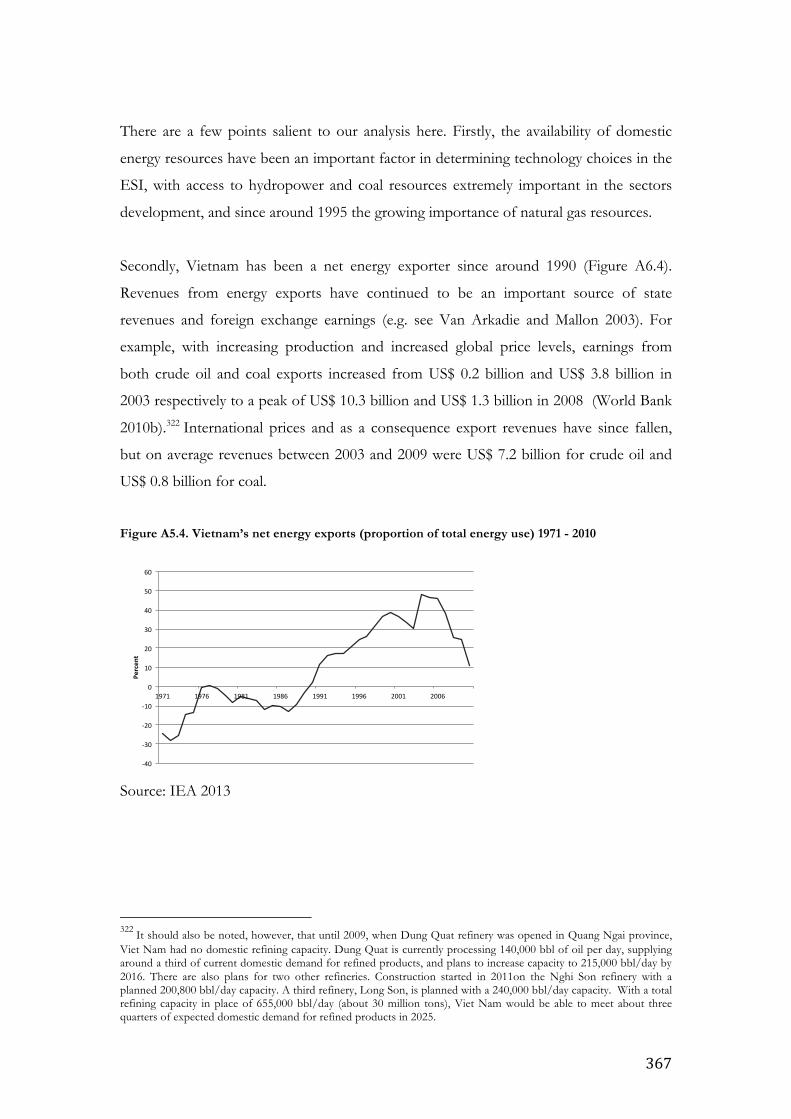
367
There are a few points salient to our analysis here. Firstly, the availability of domestic
energy resources have been an important factor in determining technology choices in the
ESI, with access to hydropower and coal resources extremely important in the sectors
development, and since around 1995 the growing importance of natural gas resources.
Secondly, Vietnam has been a net energy exporter since around 1990 (Figure A6.4).
Revenues from energy exports have continued to be an important source of state
revenues and foreign exchange earnings (e.g. see Van Arkadie and Mallon 2003). For
example, with increasing production and increased global price levels, earnings from
both crude oil and coal exports increased from US$ 0.2 billion and US$ 3.8 billion in
2003 respectively to a peak of US$ 10.3 billion and US$ 1.3 billion in 2008 (World Bank
2010b).322 International prices and as a consequence export revenues have since fallen,
but on average revenues between 2003 and 2009 were US$ 7.2 billion for crude oil and
US$ 0.8 billion for coal.
Figure A5.4. Vietnam’s net energy exports (proportion of total energy use) 1971 - 2010
Source: IEA 2013
322 It should also be noted, however, that until 2009, when Dung Quat refinery was opened in Quang Ngai province, Viet Nam had no domestic refining capacity. Dung Quat is currently processing 140,000 bbl of oil per day, supplying around a third of current domestic demand for refined products, and plans to increase capacity to 215,000 bbl/day by 2016. There are also plans for two other refineries. Construction started in 2011on the Nghi Son refinery with a planned 200,800 bbl/day capacity. A third refinery, Long Son, is planned with a 240,000 bbl/day capacity. With a total refining capacity in place of 655,000 bbl/day (about 30 million tons), Viet Nam would be able to meet about three quarters of expected domestic demand for refined products in 2025.
!40$
!30$
!20$
!10$
0$
10$
20$
30$
40$
50$
60$
1971$ 1976$ 1981$ 1986$ 1991$ 1996$ 2001$ 2006$
Percen
t'
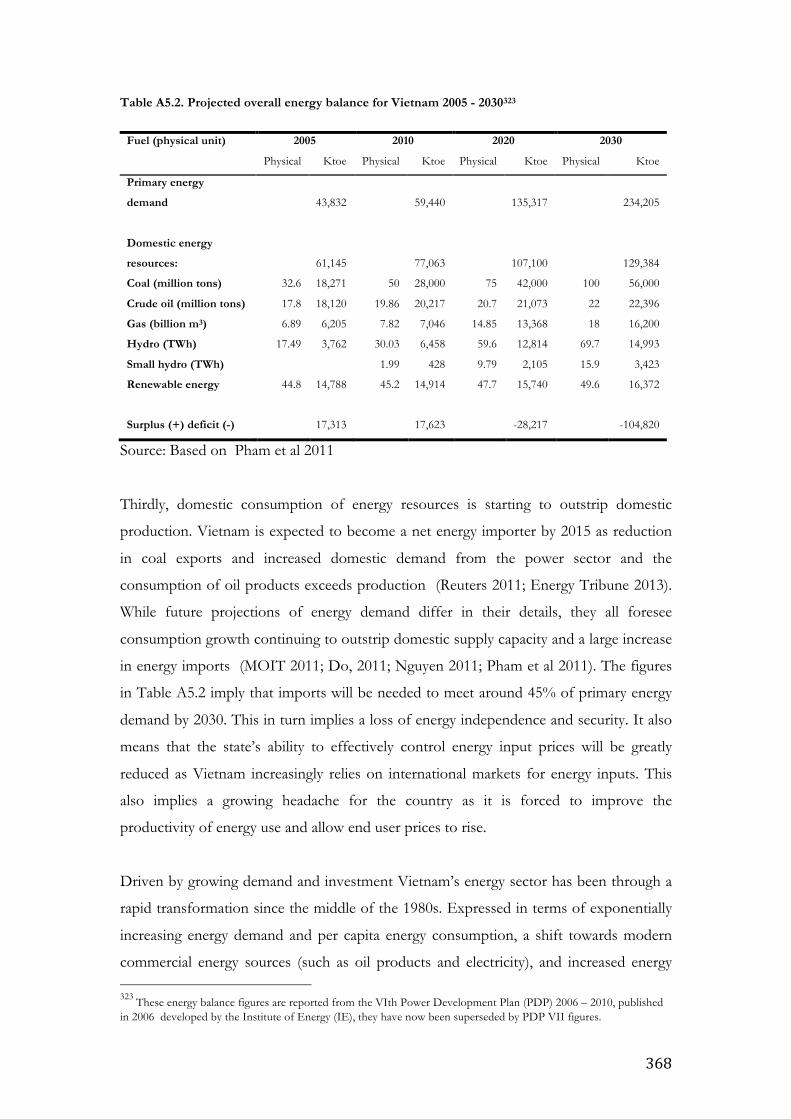
368
Table A5.2. Projected overall energy balance for Vietnam 2005 - 2030323
Fuel (physical unit) 2005 2010 2020 2030
Physical Ktoe Physical Ktoe Physical Ktoe Physical Ktoe
Primary energy
demand
43,832
59,440
135,317
234,205
Domestic energy
resources:
61,145
77,063
107,100
129,384
Coal (million tons) 32.6 18,271 50 28,000 75 42,000 100 56,000
Crude oil (million tons) 17.8 18,120 19.86 20,217 20.7 21,073 22 22,396
Gas (billion m3) 6.89 6,205 7.82 7,046 14.85 13,368 18 16,200
Hydro (TWh) 17.49 3,762 30.03 6,458 59.6 12,814 69.7 14,993
Small hydro (TWh)
1.99 428 9.79 2,105 15.9 3,423
Renewable energy 44.8 14,788 45.2 14,914 47.7 15,740 49.6 16,372
Surplus (+) deficit (-)
17,313
17,623
-28,217
-104,820
Source: Based on Pham et al 2011
Thirdly, domestic consumption of energy resources is starting to outstrip domestic
production. Vietnam is expected to become a net energy importer by 2015 as reduction
in coal exports and increased domestic demand from the power sector and the
consumption of oil products exceeds production (Reuters 2011; Energy Tribune 2013).
While future projections of energy demand differ in their details, they all foresee
consumption growth continuing to outstrip domestic supply capacity and a large increase
in energy imports (MOIT 2011; Do, 2011; Nguyen 2011; Pham et al 2011). The figures
in Table A5.2 imply that imports will be needed to meet around 45% of primary energy
demand by 2030. This in turn implies a loss of energy independence and security. It also
means that the state’s ability to effectively control energy input prices will be greatly
reduced as Vietnam increasingly relies on international markets for energy inputs. This
also implies a growing headache for the country as it is forced to improve the
productivity of energy use and allow end user prices to rise.
Driven by growing demand and investment Vietnam’s energy sector has been through a
rapid transformation since the middle of the 1980s. Expressed in terms of exponentially
increasing energy demand and per capita energy consumption, a shift towards modern
commercial energy sources (such as oil products and electricity), and increased energy 323 These energy balance figures are reported from the VIth Power Development Plan (PDP) 2006 – 2010, published in 2006 developed by the Institute of Energy (IE), they have now been superseded by PDP VII figures.
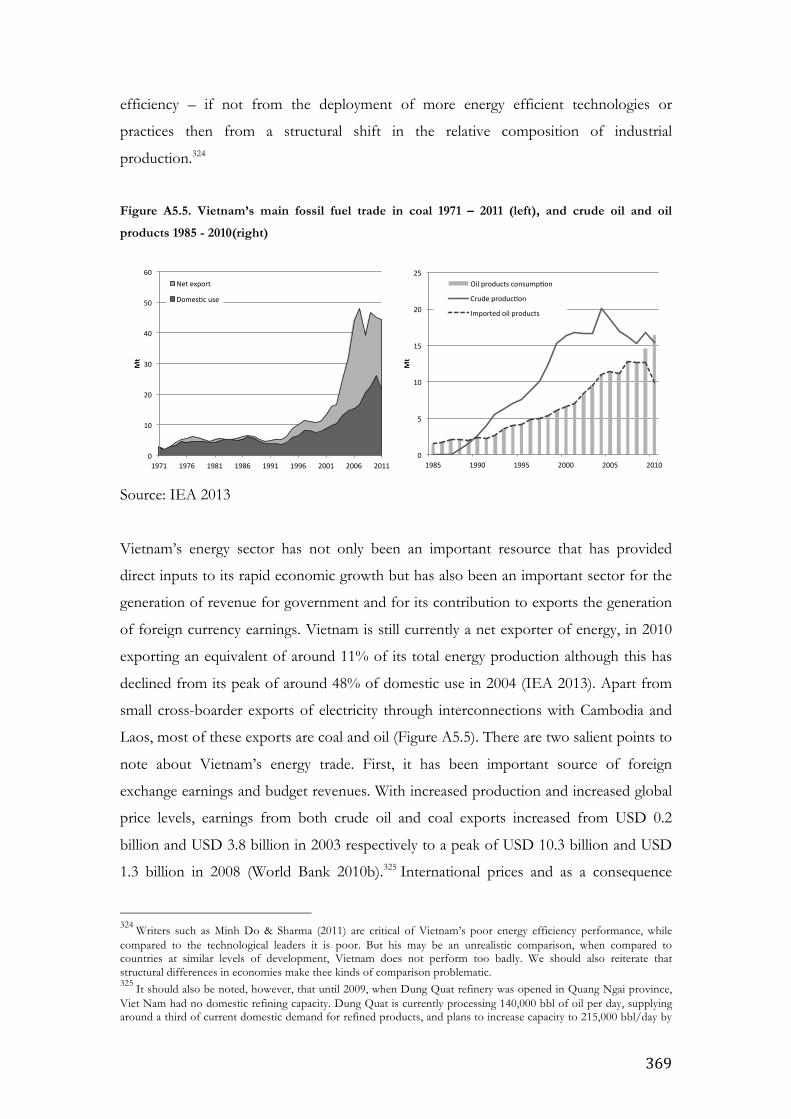
369
efficiency – if not from the deployment of more energy efficient technologies or
practices then from a structural shift in the relative composition of industrial
production.324
Figure A5.5. Vietnam’s main fossil fuel trade in coal 1971 – 2011 (left), and crude oil and oil
products 1985 - 2010(right)
Source: IEA 2013
Vietnam’s energy sector has not only been an important resource that has provided
direct inputs to its rapid economic growth but has also been an important sector for the
generation of revenue for government and for its contribution to exports the generation
of foreign currency earnings. Vietnam is still currently a net exporter of energy, in 2010
exporting an equivalent of around 11% of its total energy production although this has
declined from its peak of around 48% of domestic use in 2004 (IEA 2013). Apart from
small cross-boarder exports of electricity through interconnections with Cambodia and
Laos, most of these exports are coal and oil (Figure A5.5). There are two salient points to
note about Vietnam’s energy trade. First, it has been important source of foreign
exchange earnings and budget revenues. With increased production and increased global
price levels, earnings from both crude oil and coal exports increased from USD 0.2
billion and USD 3.8 billion in 2003 respectively to a peak of USD 10.3 billion and USD
1.3 billion in 2008 (World Bank 2010b).325 International prices and as a consequence
324 Writers such as Minh Do & Sharma (2011) are critical of Vietnam’s poor energy efficiency performance, while compared to the technological leaders it is poor. But his may be an unrealistic comparison, when compared to countries at similar levels of development, Vietnam does not perform too badly. We should also reiterate that structural differences in economies make thee kinds of comparison problematic. 325 It should also be noted, however, that until 2009, when Dung Quat refinery was opened in Quang Ngai province, Viet Nam had no domestic refining capacity. Dung Quat is currently processing 140,000 bbl of oil per day, supplying around a third of current domestic demand for refined products, and plans to increase capacity to 215,000 bbl/day by
0"
10"
20"
30"
40"
50"
60"
1971" 1976" 1981" 1986" 1991" 1996" 2001" 2006" 2011"
Mt#
Net"export"
Domes6c"use"
0"
5"
10"
15"
20"
25"
1985" 1990" 1995" 2000" 2005" 2010"
Mt#
Oil"products"consump6on"
Crude"produc6on"
Imported"oil"products"
370
export revenues have since fallen, but on average revenues between 2003 and 2009 were
USD 7.2 billion for crude oil and US$ 0.8 billion for coal. Oil revenues have been of
particular importance making up, on average, about 23% (US$ 3.5 billion) of budget
revenues between 2000 and 2010, with a peak of 30% (US$ 5.2 billion) of revenues in
2006. Although a significant proportion these revenues have been used to subsidise
domestic energy consumption, IEA subsidy estimates suggest that energy consumption
subsidies were equivalent to around 78% of oil revenues in 2010 (IEA 2012b; IMF 2011,
2012; GSO 2013).326
Secondly, domestic consumption of energy resources is starting to outstrip domestic
production. Vietnam is expected to become a net energy importer by 2015 as reduction
in coal exports and increased domestic demand from the power sector and the
consumption of oil products exceeds production (Reuters 2011; Energy Tribune 2013).
While future projections of energy demand differ in their details, they all foresee
consumption growth continuing to outstrip domestic supply capacity and a large increase
in energy imports (MOIT 2011; Do, 2011; Nguyen 2011; Pham et al 2011). For example,
the figures in Table A5.2 imply that imports will be needed to meet around 45% of
primary energy demand by 2030.
2016. There are also plans for two other refineries. Construction started in 2011on the Nghi Son refinery with a planned 200,800 bbl/day capacity. A third refinery, Long Son, is planned with a 240,000 bbl/day capacity. With a total refining capacity in place of 655,000 bbl/day (about 30 million tons), Viet Nam would be able to meet about three quarters of expected domestic demand for refined products in 2025. 326 Estimation of fossil fuel subsidies is a fraught exercise, as fossil fuels frequently enjoy a range of explicit and implicit subsidies all through the value chain. The IEA estimates cited here are for consumption subsidies and are calculated using a ‘price gap’ approach, for more information on this method see IEA (2012b). It should be noted the price gap approach may over-estimate the actual level of fiscal transfers as in the case of Vietnam, much of the subsidy actually represents the opportunity cost of domestic consumption.
371
A6 Annexes to Chapter 6 A6.1 Early development of the ESI in Vietnam 1892 - 1975
Electrification spread rapidly to cities round the world, only 10 years after the Pearl
Street Station opened in New York, in December 1892 a 500 kW generator was installed
near Hoan Khiem lake in the centre of Hanoi by the Lake Side Lamp Company. Saigon
followed soon afterwards with the construction of Cho Quan power plant in 1896.327
Vietnam’s electrification followed a similar pattern to that of other European colonies.
Privately owned commercial power utilities operated in Hanoi, Saigon and other large
population centres such as Hai Phong. Large industrial users owned off-grid isolated
generation units. Although small gird networks were developed in the first decades of the
twentieth century, such as that linking larger population centres on the Red River Delta,
in general the electricity systems that existed were small and fragmented (EVN HCMC
2012; EVN Hanoi 2012). Information on the ownership and institutional arrangements
surrounding the ESI in these early days is not available. It is probable that, as elsewhere,
a variety of ownership patterns developed. References to power plants in the large cities
imply private companies owned them. Other plants were developed by the colonial
authorities. For example, An Kroet hydropower plant in Lam Dong province was
originally commissioned in 1945 by the Indochina Department of Public Works to
supply Da Lat city (EVN 2012; EVN Hanoi 2012).
In terms of the overall size of the sector, disaggregated figures have not been available
for the three French protectorates of Tonkin, Annam and Chochinchina that now make
up Vietnam. Nevertheless, figures of the whole of Indochina328 are available and give
some indication of the limited extent of electricity provision in the colonial period, with
only an estimated 63 GWh of electricity production in 1929 which had expanded to 182
GWh by 1950 (UN 1952), suggesting a relatively modest growth rate during the war-
disrupted period between 1929 and 1950 of 5.2%.329
327 Both Hanoi and Saigon had electric trams, those in Hanoi only ceased operation in 1991. 328 Mostly what is now Cambodia, Lao PDR and Vietnam. 329 It should be noted that figures on Vietnamese electricity production and consumption and estimates of T&D losses and own use differ between sources (For example there are considerable differences between figures reported by the World Bank (1999) and figures included in the World Development Database maintained by the World Bank (2013)). It is not clear from the available data, which are the most reliable. However, in general the detail is not important to illustrate the general trends of the case, where these are not in agreement this is noted and care is taken to justify the path taken.
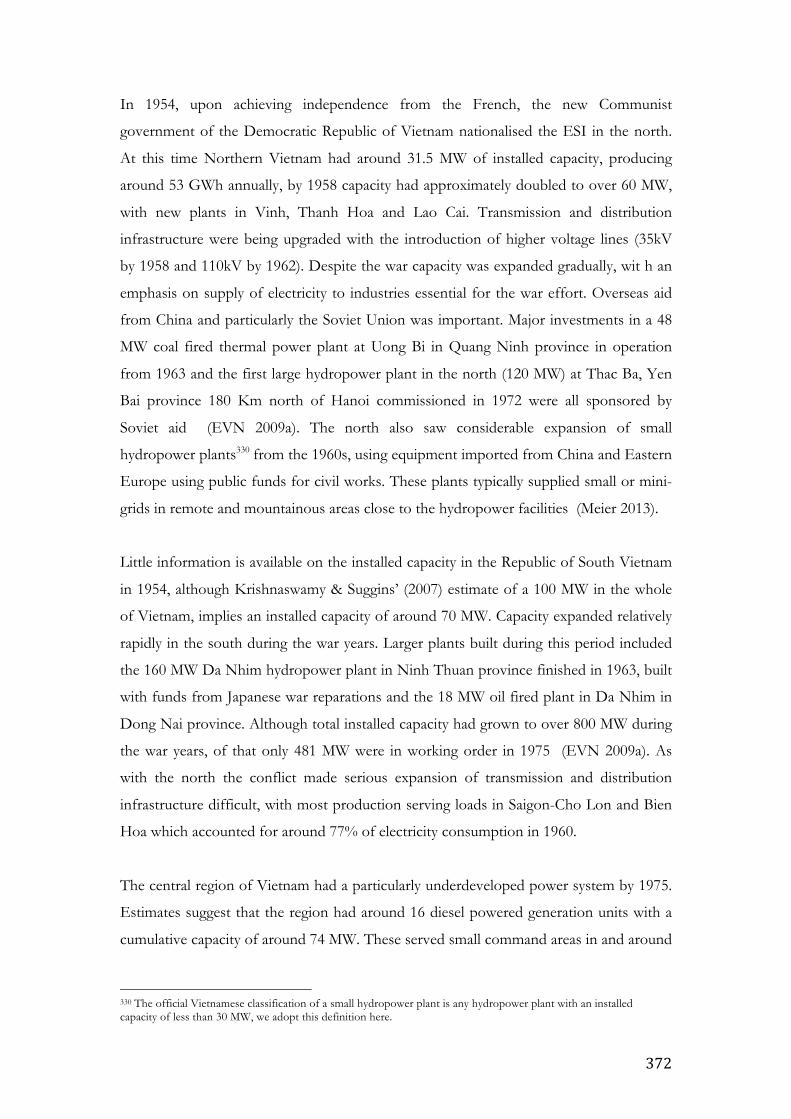
372
In 1954, upon achieving independence from the French, the new Communist
government of the Democratic Republic of Vietnam nationalised the ESI in the north.
At this time Northern Vietnam had around 31.5 MW of installed capacity, producing
around 53 GWh annually, by 1958 capacity had approximately doubled to over 60 MW,
with new plants in Vinh, Thanh Hoa and Lao Cai. Transmission and distribution
infrastructure were being upgraded with the introduction of higher voltage lines (35kV
by 1958 and 110kV by 1962). Despite the war capacity was expanded gradually, wit h an
emphasis on supply of electricity to industries essential for the war effort. Overseas aid
from China and particularly the Soviet Union was important. Major investments in a 48
MW coal fired thermal power plant at Uong Bi in Quang Ninh province in operation
from 1963 and the first large hydropower plant in the north (120 MW) at Thac Ba, Yen
Bai province 180 Km north of Hanoi commissioned in 1972 were all sponsored by
Soviet aid (EVN 2009a). The north also saw considerable expansion of small
hydropower plants330 from the 1960s, using equipment imported from China and Eastern
Europe using public funds for civil works. These plants typically supplied small or mini-
grids in remote and mountainous areas close to the hydropower facilities (Meier 2013).
Little information is available on the installed capacity in the Republic of South Vietnam
in 1954, although Krishnaswamy & Suggins’ (2007) estimate of a 100 MW in the whole
of Vietnam, implies an installed capacity of around 70 MW. Capacity expanded relatively
rapidly in the south during the war years. Larger plants built during this period included
the 160 MW Da Nhim hydropower plant in Ninh Thuan province finished in 1963, built
with funds from Japanese war reparations and the 18 MW oil fired plant in Da Nhim in
Dong Nai province. Although total installed capacity had grown to over 800 MW during
the war years, of that only 481 MW were in working order in 1975 (EVN 2009a). As
with the north the conflict made serious expansion of transmission and distribution
infrastructure difficult, with most production serving loads in Saigon-Cho Lon and Bien
Hoa which accounted for around 77% of electricity consumption in 1960.
The central region of Vietnam had a particularly underdeveloped power system by 1975.
Estimates suggest that the region had around 16 diesel powered generation units with a
cumulative capacity of around 74 MW. These served small command areas in and around
330 The official Vietnamese classification of a small hydropower plant is any hydropower plant with an installed capacity of less than 30 MW, we adopt this definition here.
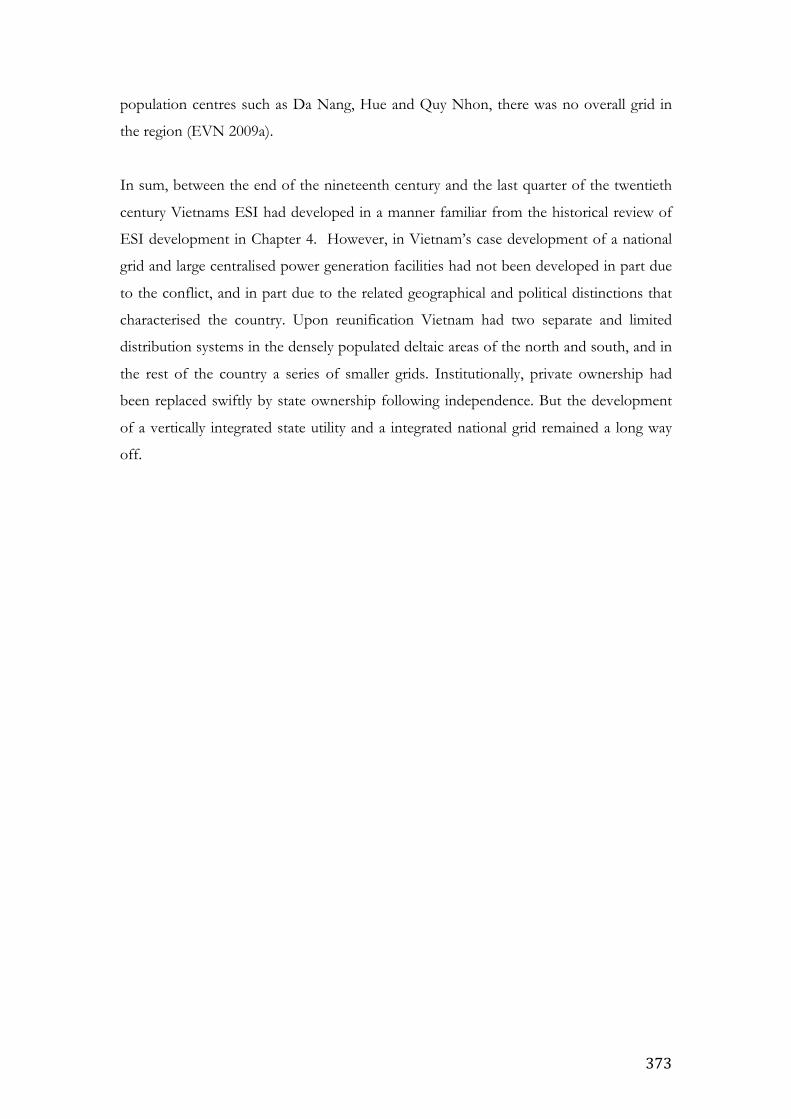
373
population centres such as Da Nang, Hue and Quy Nhon, there was no overall grid in
the region (EVN 2009a).
In sum, between the end of the nineteenth century and the last quarter of the twentieth
century Vietnams ESI had developed in a manner familiar from the historical review of
ESI development in Chapter 4. However, in Vietnam’s case development of a national
grid and large centralised power generation facilities had not been developed in part due
to the conflict, and in part due to the related geographical and political distinctions that
characterised the country. Upon reunification Vietnam had two separate and limited
distribution systems in the densely populated deltaic areas of the north and south, and in
the rest of the country a series of smaller grids. Institutionally, private ownership had
been replaced swiftly by state ownership following independence. But the development
of a vertically integrated state utility and a integrated national grid remained a long way
off.

374
A6.2 Images of electrification in state propaganda Figure A6.1. Propaganda posters illustrating ideological the importance of the ESI
Note: Clockwise from top-left – 1. Date unknown, the socialist iconography of science
and technology show a young woman in the foreground clasping a science text book
which bears the stylised atom in its top left corner, the centre of the image is dominated
by an electricity transmission tower, and in the background to the left water flows from
large hydropower dam. The caption reads “Science. Technology. We have the strength to develop
the homeland”; 2. A poster dating from 2004 commemorating 50 years of Vietnamese
independence following victory of the French at the Dein Bien Phu. In the background
of the left hand side of the picture, the familiar silhouettes of factories and transmission
lines; 3. Dating from 1982 this image links the typical socialist iconography of the red
ground with the yellow star of Vietnam in the left and the hammer and sickle of the
Communist Party on the right with an image of Ho Chi Minh in the middle, in the
middle ground are the tropes of modernisation, tower blocks and a hydropower dam to
the left and modern industrial factories to the right, including what resembles a cooling
tower and an electricity transmission tower. The caption reads “ For the socialist fatherland,
for the ideals of Uncle Ho, for the happiness of the people”; 4. Date unknown, this poster shows
the terraced rice field and hydropower production in the mountainous area of Dien Bien.
In the foreground a hydropower engineer stands beside a woman dressed in a traditional
costume resembling the Red Dao minority group, a school child stands in from of them.
375
The caption reads, “Promoting the traditional hero of Dien Bien. Let’s be determined in making the
fatherland rich and powerful” alluding to the victory over the French at Dien Bien Phu in
1954; 5. Date unknown probably dates from before 1975, showing a farmer maintaining
an irrigation pump, sporting an olive green shirt and pith helmet reminiscent of a
soldier’s uniform. Note the electricity transmission lines and dam in the background and
the implied link to the electrical irrigation pump. The caption draws parallels between
productive and military activities reading “Brave fighter. Exemplary in production”
Source: Heather 2009 Figure A6.2. Reverse side of 5,000 Dong note in circulation since 1993
Note: The hydropower plant continues to be a familiar and very much socialist
ideological trope. The reverse side of the 5,000 VND note still in circulation shows the
hydropower plant at Tri Anh in the Dong Nai river basin, in Dong Nai province in
South-Eastern Vietnam. The plant was constructed with Soviet assistance between 1986
and 1988. The installed capacity of the dam is 400 MW and has produced on average
1.76 TWh per year since commissioning in 1988. The plant is now wholly owned by a
subsidiary of EVN.
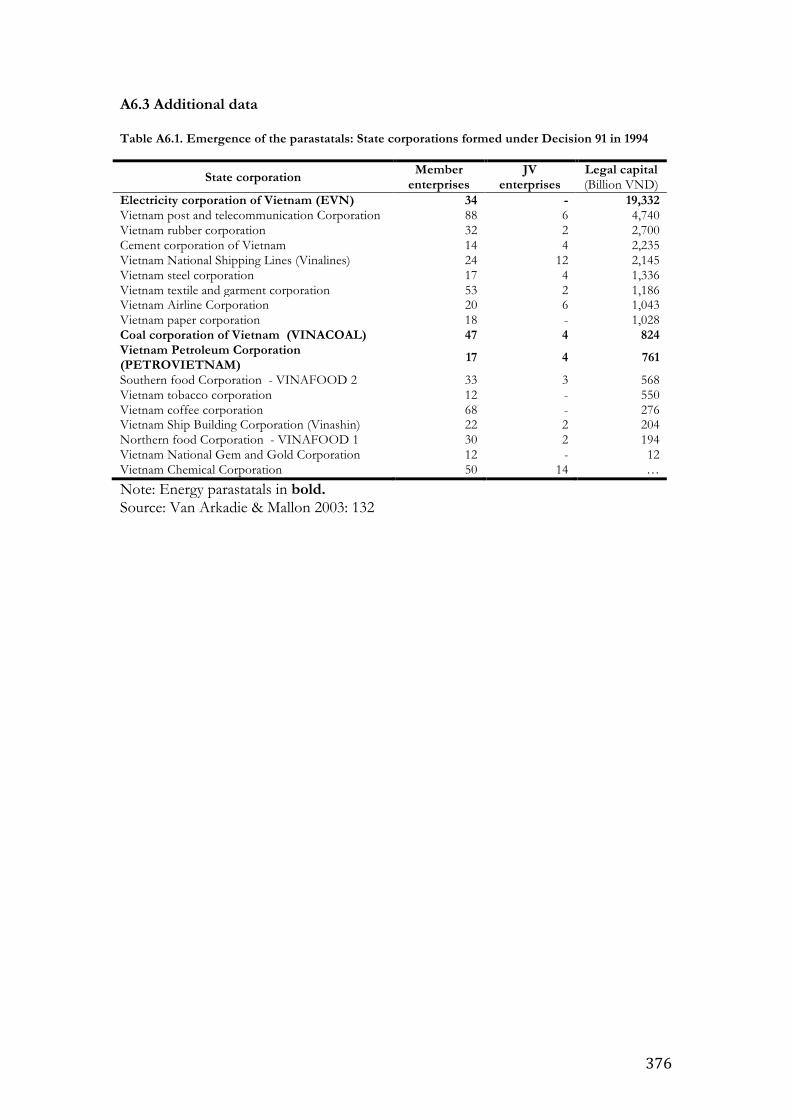
376
A6.3 Additional data Table A6.1. Emergence of the parastatals: State corporations formed under Decision 91 in 1994
State corporation Member
enterprises JV
enterprises Legal capital (Billion VND)
Electricity corporation of Vietnam (EVN) 34 - 19,332 Vietnam post and telecommunication Corporation 88 6 4,740 Vietnam rubber corporation 32 2 2,700 Cement corporation of Vietnam 14 4 2,235 Vietnam National Shipping Lines (Vinalines) 24 12 2,145 Vietnam steel corporation 17 4 1,336 Vietnam textile and garment corporation 53 2 1,186 Vietnam Airline Corporation 20 6 1,043 Vietnam paper corporation 18 - 1,028 Coal corporation of Vietnam (VINACOAL) 47 4 824 Vietnam Petroleum Corporation (PETROVIETNAM) 17 4 761
Southern food Corporation - VINAFOOD 2 33 3 568 Vietnam tobacco corporation 12 - 550 Vietnam coffee corporation 68 - 276 Vietnam Ship Building Corporation (Vinashin) 22 2 204 Northern food Corporation - VINAFOOD 1 30 2 194 Vietnam National Gem and Gold Corporation 12 - 12 Vietnam Chemical Corporation 50 14 …
Note: Energy parastatals in bold. Source: Van Arkadie & Mallon 2003: 132
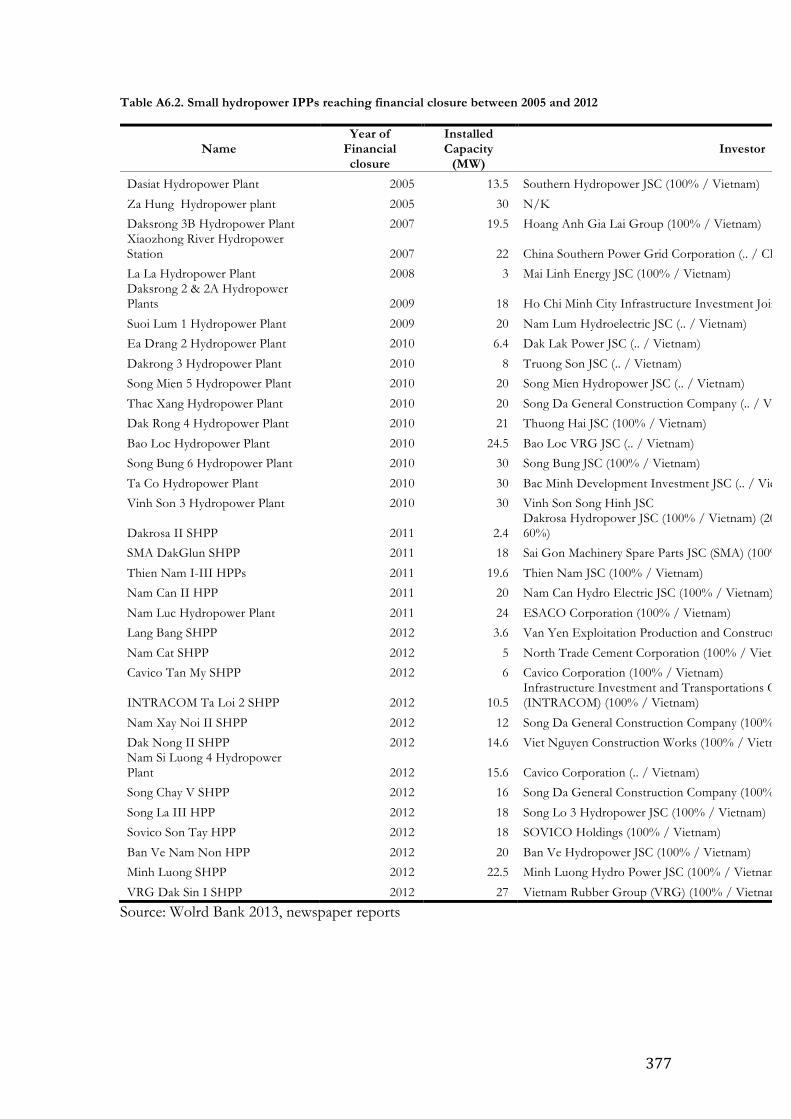
377
Table A6.2. Small hydropower IPPs reaching financial closure between 2005 and 2012
Name Year of
Financial closure
Installed Capacity
(MW) Investor
Investment (Million US$)
Dasiat Hydropower Plant 2005 13.5 Southern Hydropower JSC (100% / Vietnam) 11.6
Za Hung Hydropower plant 2005 30 N/K Daksrong 3B Hydropower Plant 2007 19.5 Hoang Anh Gia Lai Group (100% / Vietnam) 20
Xiaozhong River Hydropower Station 2007 22 China Southern Power Grid Corporation (.. / China) 28.68
La La Hydropower Plant 2008 3 Mai Linh Energy JSC (100% / Vietnam) 2.5 Daksrong 2 & 2A Hydropower Plants 2009 18 Ho Chi Minh City Infrastructure Investment Joint Stock Company (.. / Vietnam) 33.6
Suoi Lum 1 Hydropower Plant 2009 20 Nam Lum Hydroelectric JSC (.. / Vietnam) 22.7
Ea Drang 2 Hydropower Plant 2010 6.4 Dak Lak Power JSC (.. / Vietnam) 6.25
Dakrong 3 Hydropower Plant 2010 8 Truong Son JSC (.. / Vietnam) 8.9
Song Mien 5 Hydropower Plant 2010 20 Song Mien Hydropower JSC (.. / Vietnam) 18.4
Thac Xang Hydropower Plant 2010 20 Song Da General Construction Company (.. / Vietnam) 20.8
Dak Rong 4 Hydropower Plant 2010 21 Thuong Hai JSC (100% / Vietnam) 22.4
Bao Loc Hydropower Plant 2010 24.5 Bao Loc VRG JSC (.. / Vietnam) 29
Song Bung 6 Hydropower Plant 2010 30 Song Bung JSC (100% / Vietnam) 30.5
Ta Co Hydropower Plant 2010 30 Bac Minh Development Investment JSC (.. / Vietnam) 33.5
Vinh Son 3 Hydropower Plant 2010 30 Vinh Son Song Hinh JSC 31.2
Dakrosa II SHPP 2011 2.4 Dakrosa Hydropower JSC (100% / Vietnam) (2011 VSSH JSC (EVN JSC) aquired 60%) 2.4
SMA DakGlun SHPP 2011 18 Sai Gon Machinery Spare Parts JSC (SMA) (100% / Vietnam) 23.1
Thien Nam I-III HPPs 2011 19.6 Thien Nam JSC (100% / Vietnam) 23.6
Nam Can II HPP 2011 20 Nam Can Hydro Electric JSC (100% / Vietnam) 35
Nam Luc Hydropower Plant 2011 24 ESACO Corporation (100% / Vietnam) 25.1
Lang Bang SHPP 2012 3.6 Van Yen Exploitation Production and Construction JSC (100% / Vietnam) 3.6
Nam Cat SHPP 2012 5 North Trade Cement Corporation (100% / Vietnam) 5
Cavico Tan My SHPP 2012 6 Cavico Corporation (100% / Vietnam) 6.7
INTRACOM Ta Loi 2 SHPP 2012 10.5 Infrastructure Investment and Transportations Construction Joint Stock Company (INTRACOM) (100% / Vietnam) 10.5
Nam Xay Noi II SHPP 2012 12 Song Da General Construction Company (100% / Vietnam) 12.8
Dak Nong II SHPP 2012 14.6 Viet Nguyen Construction Works (100% / Vietnam) 14.7 Nam Si Luong 4 Hydropower Plant 2012 15.6 Cavico Corporation (.. / Vietnam) 17.2
Song Chay V SHPP 2012 16 Song Da General Construction Company (100% / Vietnam) 16.3
Song La III HPP 2012 18 Song Lo 3 Hydropower JSC (100% / Vietnam) 25
Sovico Son Tay HPP 2012 18 SOVICO Holdings (100% / Vietnam) 24.2
Ban Ve Nam Non HPP 2012 20 Ban Ve Hydropower JSC (100% / Vietnam) 24.6
Minh Luong SHPP 2012 22.5 Minh Luong Hydro Power JSC (100% / Vietnam) 17.7
VRG Dak Sin I SHPP 2012 27 Vietnam Rubber Group (VRG) (100% / Vietnam) 32.2
Source: Wolrd Bank 2013, newspaper reports
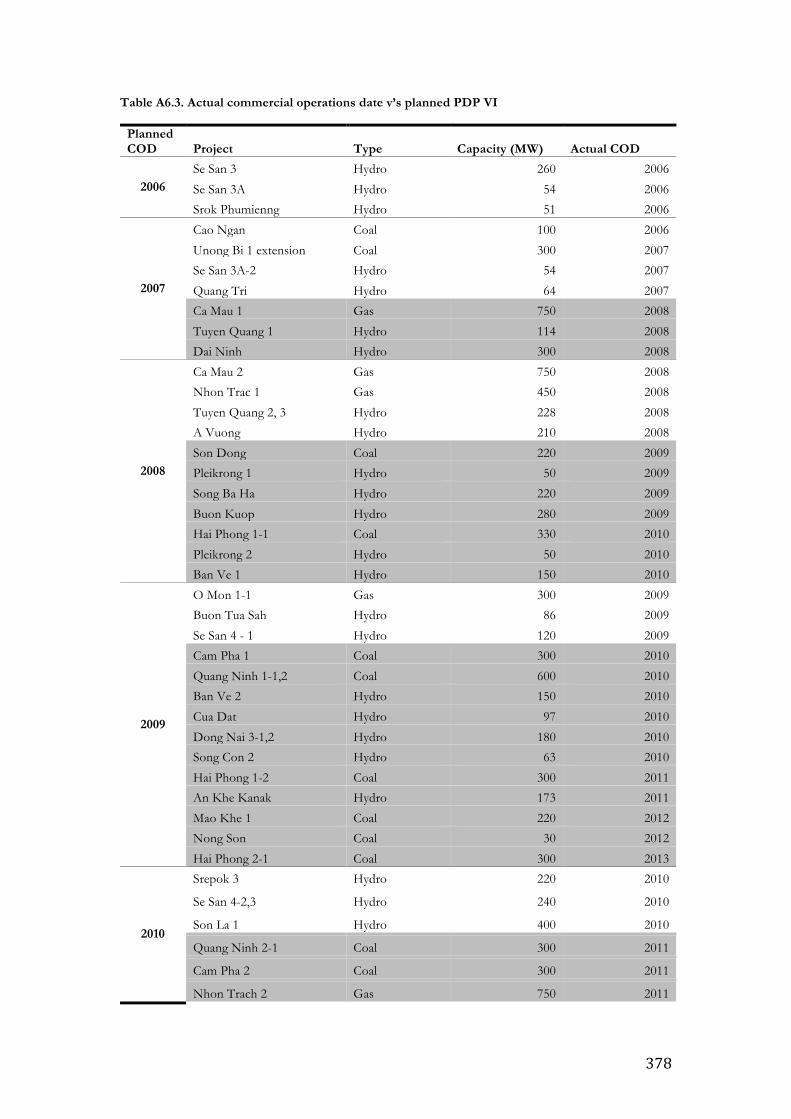
378
Table A6.3. Actual commercial operations date v’s planned PDP VI
Planned COD Project Type Capacity (MW) Actual COD
2006 Se San 3 Hydro 260 2006
Se San 3A Hydro 54 2006
Srok Phumienng Hydro 51 2006
2007
Cao Ngan Coal 100 2006
Unong Bi 1 extension Coal 300 2007
Se San 3A-2 Hydro 54 2007
Quang Tri Hydro 64 2007
Ca Mau 1 Gas 750 2008
Tuyen Quang 1 Hydro 114 2008
Dai Ninh Hydro 300 2008
2008
Ca Mau 2 Gas 750 2008
Nhon Trac 1 Gas 450 2008
Tuyen Quang 2, 3 Hydro 228 2008
A Vuong Hydro 210 2008
Son Dong Coal 220 2009
Pleikrong 1 Hydro 50 2009
Song Ba Ha Hydro 220 2009
Buon Kuop Hydro 280 2009
Hai Phong 1-1 Coal 330 2010
Pleikrong 2 Hydro 50 2010
Ban Ve 1 Hydro 150 2010
2009
O Mon 1-1 Gas 300 2009
Buon Tua Sah Hydro 86 2009
Se San 4 - 1 Hydro 120 2009
Cam Pha 1 Coal 300 2010
Quang Ninh 1-1,2 Coal 600 2010
Ban Ve 2 Hydro 150 2010
Cua Dat Hydro 97 2010
Dong Nai 3-1,2 Hydro 180 2010
Song Con 2 Hydro 63 2010
Hai Phong 1-2 Coal 300 2011
An Khe Kanak Hydro 173 2011
Mao Khe 1 Coal 220 2012
Nong Son Coal 30 2012
Hai Phong 2-1 Coal 300 2013
2010
Srepok 3 Hydro 220 2010
Se San 4-2,3 Hydro 240 2010
Son La 1 Hydro 400 2010
Quang Ninh 2-1 Coal 300 2011
Cam Pha 2 Coal 300 2011
Nhon Trach 2 Gas 750 2011
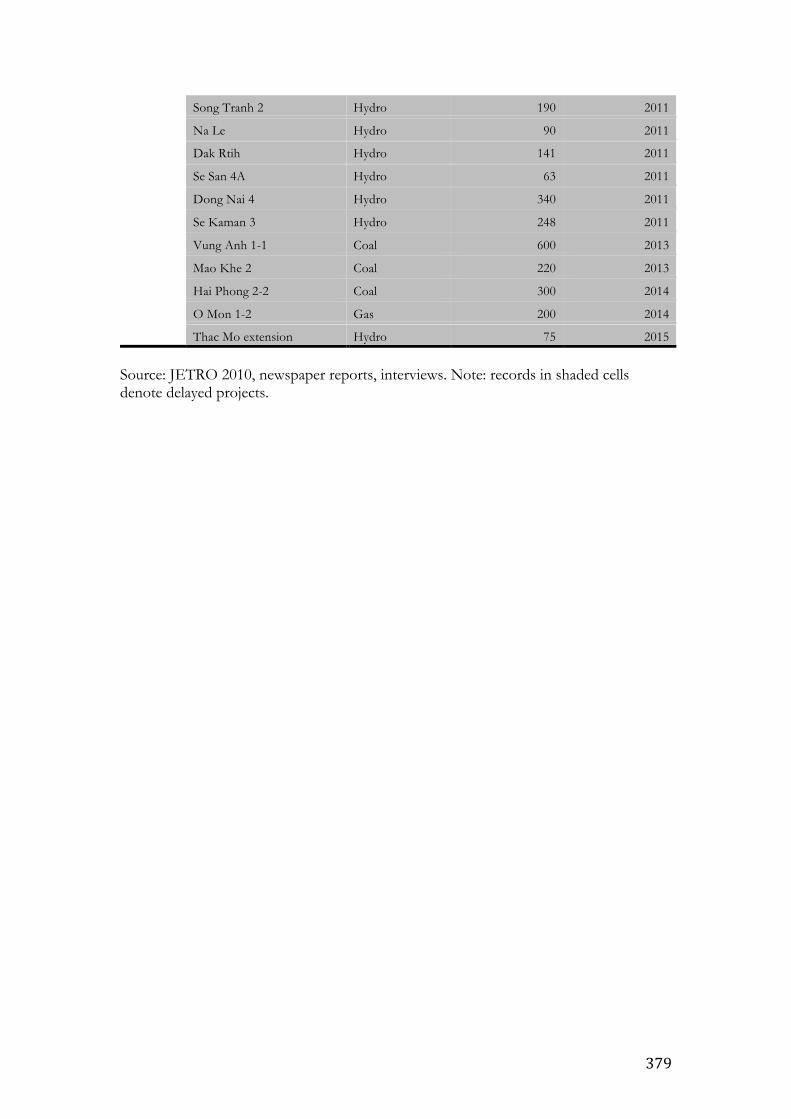
379
Song Tranh 2 Hydro 190 2011
Na Le Hydro 90 2011
Dak Rtih Hydro 141 2011
Se San 4A Hydro 63 2011
Dong Nai 4 Hydro 340 2011
Se Kaman 3 Hydro 248 2011
Vung Anh 1-1 Coal 600 2013
Mao Khe 2 Coal 220 2013
Hai Phong 2-2 Coal 300 2014
O Mon 1-2 Gas 200 2014
Thac Mo extension Hydro 75 2015
Source: JETRO 2010, newspaper reports, interviews. Note: records in shaded cells denote delayed projects.
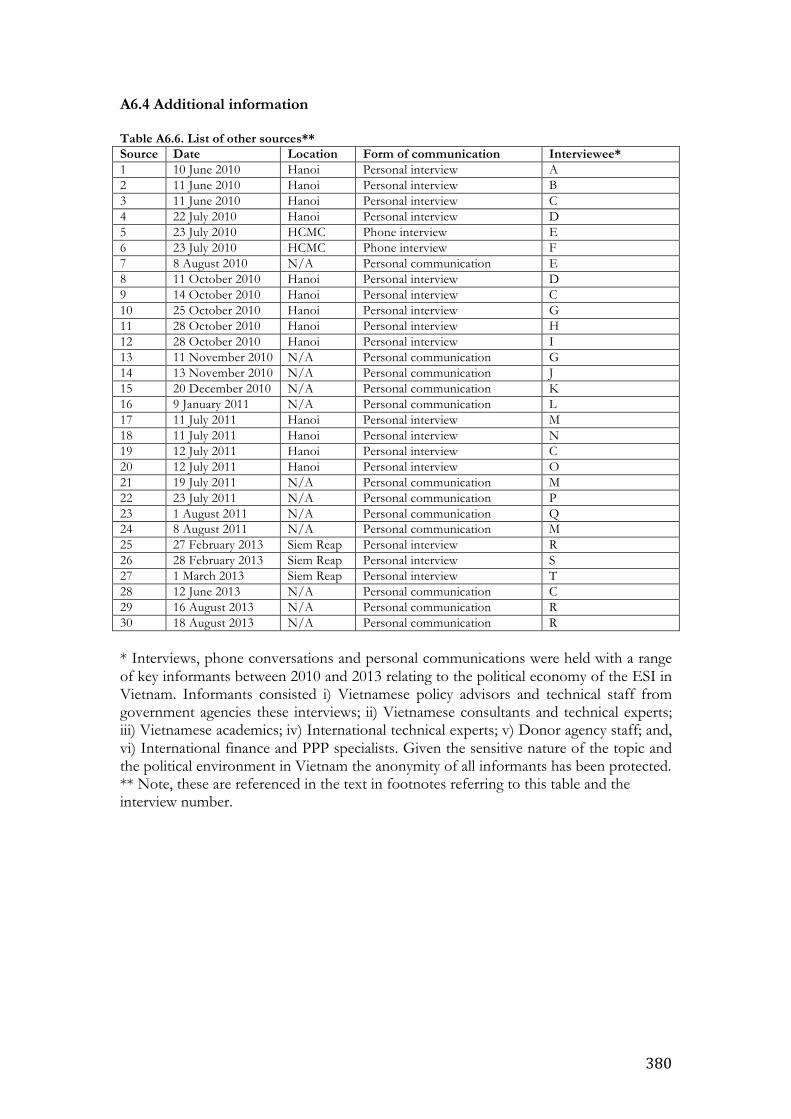
380
A6.4 Additional information Table A6.6. List of other sources** Source Date Location Form of communication Interviewee* 1 10 June 2010 Hanoi Personal interview A 2 11 June 2010 Hanoi Personal interview B 3 11 June 2010 Hanoi Personal interview C 4 22 July 2010 Hanoi Personal interview D 5 23 July 2010 HCMC Phone interview E 6 23 July 2010 HCMC Phone interview F 7 8 August 2010 N/A Personal communication E 8 11 October 2010 Hanoi Personal interview D 9 14 October 2010 Hanoi Personal interview C 10 25 October 2010 Hanoi Personal interview G 11 28 October 2010 Hanoi Personal interview H 12 28 October 2010 Hanoi Personal interview I 13 11 November 2010 N/A Personal communication G 14 13 November 2010 N/A Personal communication J 15 20 December 2010 N/A Personal communication K 16 9 January 2011 N/A Personal communication L 17 11 July 2011 Hanoi Personal interview M 18 11 July 2011 Hanoi Personal interview N 19 12 July 2011 Hanoi Personal interview C 20 12 July 2011 Hanoi Personal interview O 21 19 July 2011 N/A Personal communication M 22 23 July 2011 N/A Personal communication P 23 1 August 2011 N/A Personal communication Q 24 8 August 2011 N/A Personal communication M 25 27 February 2013 Siem Reap Personal interview R 26 28 February 2013 Siem Reap Personal interview S 27 1 March 2013 Siem Reap Personal interview T 28 12 June 2013 N/A Personal communication C 29 16 August 2013 N/A Personal communication R 30 18 August 2013 N/A Personal communication R * Interviews, phone conversations and personal communications were held with a range of key informants between 2010 and 2013 relating to the political economy of the ESI in Vietnam. Informants consisted i) Vietnamese policy advisors and technical staff from government agencies these interviews; ii) Vietnamese consultants and technical experts; iii) Vietnamese academics; iv) International technical experts; v) Donor agency staff; and, vi) International finance and PPP specialists. Given the sensitive nature of the topic and the political environment in Vietnam the anonymity of all informants has been protected. ** Note, these are referenced in the text in footnotes referring to this table and the interview number.

381