The Orthodox Christian Poor and Pauper families in Salonica (18th-19th c.); how many and how strong...
22
New Trends in Ottoman Studies University of Crete – Department of History and Archaeology Foundation for Research and Technology-Hellas – Institute for Mediterranean Studies Editor-in-chief: Marinos Sariyannis Editors: Gülsün Aksoy-Aivali, Marina Demetriadou, Yannis Spyropoulos, Katerina Stathi, Yorgos Vidras Consulting editors: Antonis Anastasopoulos, Elias Kolovos Papers presented at the 20 th CIÉPO Symposium Rethymno, 27 June – 1 July 2012
Transcript of The Orthodox Christian Poor and Pauper families in Salonica (18th-19th c.); how many and how strong...
ISBN 978-960-524-.....
New Trends in Ottoman Studies
�is volume includes 83 essays which were originally delivered as papers at the 20th CIÉPO Symposium. �e Symposium was held in Rethymno, Crete, Greece, between 27 June and 1 July 2012, and was organised by the Department of History and Archaeology of the University of Crete and the Institute for Mediterranean Studies of the Foundation for Research and Technology – Hellas (IMS/FORTH), in collaboration with the Region of Crete, Regional Unit of Rethymno, and the Municipality of Rethymno.
�e essays cover a wide array of subjects, and are organised in six thematic sections: Economy and Finances; Institutions and Elites; �e Ottoman Provinces; Inside a Wider World; Culture and Ideology; Fine Arts, Architecture, and Archaeology.
University of Crete – Department of History and ArchaeologyFoundation for Research and Technology-Hellas – Institute for Mediterranean Studies
Cover photo: Giorgos Benakis (knocker, 10, P. Koronaiou Str., Rethymno)
Back cover photo: Joshua M. White
Mar
inos
Sar
iyan
nis (
ed.)
Editor-in-chief: Marinos Sariyannis
Editors: Gülsün Aksoy-Aivali, Marina Demetriadou, Yannis Spyropoulos, Katerina Stathi, Yorgos Vidras
Consulting editors: Antonis Anastasopoulos, Elias Kolovos
Papers presented at the 20th CIÉPO Symposium
Rethymno, 27 June – 1 July 2012
New
Tre
nds
in O
ttom
an S
tudi
es
New Trends in Ottoman StudiesPapers presented at the 20th CIÉPO SymposiumRethymno, 27 June – 1 July 2012
Editor-in-chief: Marinos SariyannisEditors: Gülsün Aksoy-Aivali, Marina Demetriadou, Yannis Spyropoulos, Katerina Stathi, Yorgos Vidras
Consulting editors: Antonis Anastasopoulos, Elias Kolovos
University of Crete – Department of History and ArchaeologyFoundation for Research and Technology-Hellas – Institute for Mediterranean Studies
Rethymno 2014
393
THE ORTHODOX CHRISTIAN POOR AND PAUPER FAMILIES
IN SALONICA (18TH-19TH C.); HOW MANY AND HOW STRONG THEY WERE
Evanghelos Hekimoglou*
This paper is about the dimensions of poverty in the Orthodox Christian Com-munity (OCC) of Salonica from the 1790s through the 1860s. The conclusions are based on tax registers, in combination with the general sources regarding the same period.
In this paper, the term “poverty” does not mean the lack of sufficient money or the minimal requirements human needs to survive. Poverty is conceived as the economic condition of those Orthodox Christians who were classified in the lower tax categories in three different periods, i.e. the 1790s, the 1830s and the 1860s. This relative poverty is examined only in the context of the OCC of Salonica.
1. Late 18th century
The source
Our source for the late 18th century is an unpublished account book, kept by the Orthodox Christian Community of Thessaloniki (O.C.C) during the period 1792-94.1 The account book lists thirty nine guilds and a number of residents
* Curator of the Jewish Museum of Thessaloniki, [email protected] State Archive of Greece, Historical Archive of Macedonia, untitled register of the Greek
Community of Thessaloniki; see the relevant bibliography in Evanghelos Hekimoglou, “Surnames of the Christian Inhabitants of Thessaloniki in the Late Eighteenth Century”, in Χαριστήριον τω Παναγιωτάτω Μητροπολίτη Θεσσαλονίκης κ.κ. Παντελεήμονι επί τη συμπληρώσει εικοσαετούς εν Θεσσαλονίκη ποιμαντορίας (1974-1994), Thessaloniki 1994, 885-898.
394
eVANGheLOs hekimOGLOu
recorded individually (characterized as perakende = scattered) with the sum levied upon every guild and individual for the purpose of discharging the OCC’s accumulated high debt (borc-i mukaddem).2
The distribution of the tax burden
The sum levied upon each Christian resident ranged between 90 and 7,500 kuruş.3 According to the account book, the sums levied upon the residents were defined in the process of a general assembly of the OCC.4
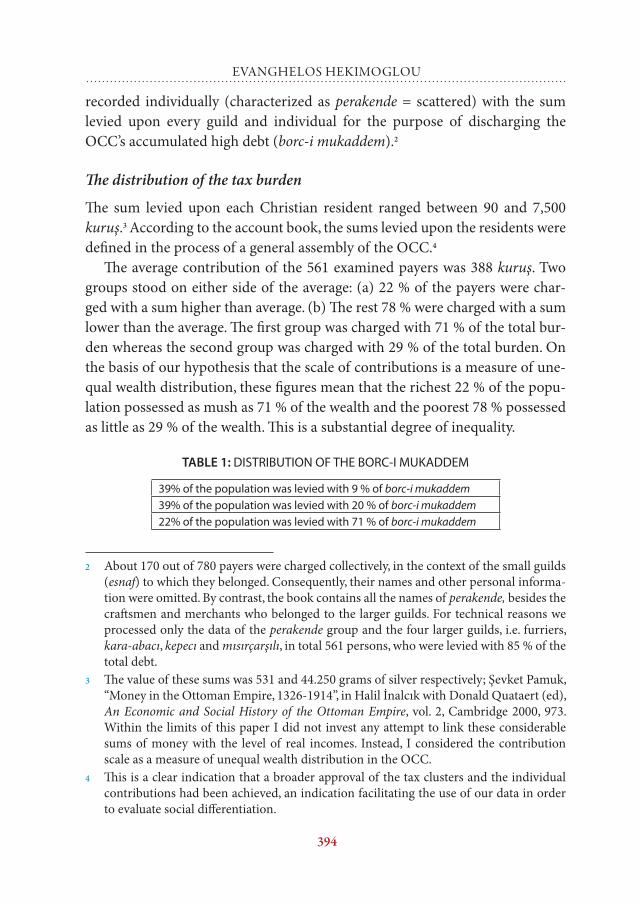
The average contribution of the 561 examined payers was 388 kuruş. Two groups stood on either side of the average: (a) 22 % of the payers were char-ged with a sum higher than average. (b) The rest 78 % were charged with a sum lower than the average. The first group was charged with 71 % of the total bur-den whereas the second group was charged with 29 % of the total burden. On the basis of our hypothesis that the scale of contributions is a measure of une-qual wealth distribution, these figures mean that the richest 22 % of the popu-lation possessed as mush as 71 % of the wealth and the poorest 78 % possessed as little as 29 % of the wealth. This is a substantial degree of inequality.
TABLE 1: DISTRIBUTION OF THE BORC-I MUKADDEM
39% of the population was levied with 9 % of borc-i mukaddem39% of the population was levied with 20 % of borc-i mukaddem22% of the population was levied with 71 % of borc-i mukaddem
2 About 170 out of 780 payers were charged collectively, in the context of the small guilds (esnaf) to which they belonged. Consequently, their names and other personal informa-tion were omitted. By contrast, the book contains all the names of perakende, besides the craftsmen and merchants who belonged to the larger guilds. For technical reasons we processed only the data of the perakende group and the four larger guilds, i.e. furriers, kara-abacı, kepecı and mısırçarşılı, in total 561 persons, who were levied with 85 % of the total debt.
3 The value of these sums was 531 and 44.250 grams of silver respectively; Şevket Pamuk, “Money in the Ottoman Empire, 1326-1914”, in Halil İnalcık with Donald Quataert (ed), An Economic and Social History of the Ottoman Empire, vol. 2, Cambridge 2000, 973. Within the limits of this paper I did not invest any attempt to link these considerable sums of money with the level of real incomes. Instead, I considered the contribution scale as a measure of unequal wealth distribution in the OCC.
4 This is a clear indication that a broader approval of the tax clusters and the individual contributions had been achieved, an indication facilitating the use of our data in order to evaluate social differentiation.
395
the orthodox christian poor and pauper families
Thirty nine % of the examined cases were charged with the minimum cont-ribution of 90 kuruş. These cases might be considered as the poorest between the Christian residents. On the basis of the above mentioned contribution/wealth correlation hypothesis, this poor group appears to possess only 9 % of the Christian community’s wealth.
The payers of a second group, which accounted for thirty nine % of the cases, were charged with sums between 120 and 375 kuruş, contributing 20 % of the total burden. According to the mentioned contribution/wealth hypothesis this group possessed 20 % of the wealth.
According to the data illustrated in Table 1, the Gini index equals 0.53, as high as the Gini index for the income distribution in modern Chile (2003). It seems that the OCC of Thessaloniki suffered of serious economic inequality.
Factors affecting prosperity
According to our data, individuals’ economic prosperity in the OCC was linked with two basic factors:
(a) Being settled in the city for a considerable length of time.5 (b) Belonging to an esnaf.6 Presumably, the wealth-generating factors were the following: (a) Being sett-
led in the city for at least two generations; (b) belonging to an esnaf.7
Factors affecting poverty
In the next step we will focus at the poorest 39 % of our sample. One out of five in this category was a woman. Being both a woman and a family provider was a good reason for being poor. Forty out of the 76 women of our sample belonged
5 Payers identified by the name of their parents (usually their father) -a strong indication that their families lived in the city for at least two generations- were charged with an av-erage contribution of 825 kuruş, four times higher than average contribution of all the other payers (197 kuruş).
6 The average contribution of the individuals belonging to guilds was 487 kuruş, 70 % higher than average contribution for the scattered individuals (perakende), which was 289 kuruş.
7 In fact, those two factors coincided, because 61 % of the guild-organised payers were identified by their parents’ name, comparing to only 17 % of perakende. The vast major-ity of perakende were recognised by other characteristics, like their job, their origin, their employer, their neighbourhood or their physical characteristics, all being indications that they were new-comers.
396
eVANGheLOs hekimOGLOu
to the poorest 39 % of the sample, comparing to only seven women who belon-ged to the richest 22% of our sample. The average contribution of the women was 194 kuruş, comparing to 419 kuruş which was the average contribution of the men. Most of the women were widows, an indication that they were poor because they had no protector and supporter.
Poor widows shared the hard core of the poorest category with another group composed of poor esnafli. One out of five in the poorest category belon-ged to the guilds; their majority were identified by their parents’ name. They should be characterised as the “unlucky” fraction of the oldest residents, i.e. individuals who failed to exploit the goods of the guilds system, although their families had lived in the city for at least two generations and they themselves had been accepted in the guilds.8
Another category of persons rather unknown to the older residents of the city shared the hard core of the poor stratum. They were recognised as “sons-in-law” of older residents and they usually lived in the houses of their fathers-, mothers- or brothers-in-law.9
Around the hard core of poverty lies an unstable cycle of newcomers. Newco-mers, who increased the number of artisans, were identified and reordered on the basis of (a) their craftsmanship, (b) the names of their employers, or (c) their origin.10 A remarkable finding is that the newcomers who were identified by their ori-gin were not poor. Their average contribution was close to the average contri-bution of the whole sample.11
8 We must keep in mind that the esnaf system was a kind of protected market, not a non-market structure. “The industrial class”, Torquay wrote some years after our source was compiled, “which gives so much impetus to the wellbeing of others is thus much more exposed to sudden and irremediable evils”. Widows who lost their male protectors and men who failed in the market were the victims of these “evils” and consequently they formed the hard core of the poor Christians.
9 “Sons-in-law” accounted for 5 % of our sample, half of them being very poor.10 Those identified by their craftsmanship give us a good sample to understand which jobs
attracted the newcomers (see below, “Occupational patterns linked to poverty”).11 Out of 53 individuals identified by their origin (accounting for 10 % of the sample), only
15 belonged to the poorest category. Most of them had immigrated to Salonica from the surrounding rural areas. Although those who were identified by their origin should be considered as newcomers, the fact that their origin was so well known as to give them a surname is a strong indication that they had already lived some years in the city; conse-quently, the other residents became familiar with their personal stories. By contrast, old-
397
the orthodox christian poor and pauper families
We might draw another, even more unstable cycle around these categories of newcomers, a circle containing individuals who were almost unknown to OCC. The account book identifies them by their residence or by a physical characte-ristic of their appearance or even by their Christian name only.12
Occupational patterns linked to poverty
The social group of the poorest Christians was comprised to a large extend of working poor artisans, either belonging to the guilds or not. A remarkably high percentage of guild-organised artisans (about one out of four) was charged with the minimum contribution of 90 kuruş and was classified to this poorest group. Some of these artisans were nominally charged with their contribution in borc-i mukaddem as members of the respective guild, but in fact they had moved to other jobs.13
Besides artisans who had left their guilds and changed jobs, our source records some very poor members of the guilds who worked either for other artisans or independently. This finding implies that a number of the guild arti-sans were really poor, although the guilds included the richest and middle-class Christians.
On the other hand, about half of the very poor artisans belonged to pera-kende, apparently because their occupation was not guilded. The more usual occupations of this kind were those of alacacı, bağcı, hancı, kayıkçı, kiracı, sakicı, stivadore14, tutuncı, tuzlacı, and some domestic occupations.
er residents were hardly familiar with the background of people recognized by their job only.
12 Presumably, they were not present in the city long enough to acquire surnames, or they did not have stable social characteristics which would distinguish them personally. This is an indication that they were poor newcomers, not yet absorbed in the urban structure.
13 For example, some former abacı are found as “çorapçı” and an ex-furrier as “subaşi”. It is a matter of guessing to decide if the change in jobs was the reason of poverty or, on the contrary, if these individuals changed their occupation because they failed as guilded ar-tisans. In other words, we do not know if the change of jobs was a result of a crisis within the guilds or a regular consequence of the market performance.
14 A man whose occupation is to stow cargoes on board of ships; see Arthur Young – James Brisbane, Nautical Dictionary, London 1863, 390.
398
eVANGheLOs hekimOGLOu
2. 1830s
The source
Our source for the 1830s is a published poll tax (cizye) register,15 compiled after a survey which was conducted in the period 1830/1835. The surviving codex contains only the list of the Christian population of Salonica. The lists of the other religion groups are missing.
The register lists 3,621 male Christians, of which 2,410 were older than 12 years; 2,175 of them were levied with poll tax. They were recorded on the basis of the neighbourhood they lived. The register contains 12 Christian neighbo-urhoods.16
Some signs of the crafts already met in the 1790s are traceable, but we do not know to what extend the craftsmen were still organised in guilds, because the contribution was imposed on a personal basis.17
All recorded persons, taxpayers or not, were identified by their Christian names, the names of their fathers and their occupation, besides the colour of their moustaches and in many cases their origin. Like the previous source, there was a distinction between regular and new residents.18 Unfortunately, we can-
15 Vassilis Dimitriadis, Η Θεσσαλονίκη της παρακμής. Η ελληνική κοινότητα της Θεσσα-λονίκης κατά την δεκαετία του 1830 με βάση ένα οθωμανικό κατάστιχο απογραφής του πληθυσμού [Thessaloniki (Salonica) in Decline. The Greek Community of Thessaloni-ki during the 1830s on the basis of an Ottoman population register], Herakleion 1997. See also Meropi Anastassiadou, «Yanni, Nikola, Lifder et les autres... Le profil démogra-phique et socio-professionnel de la population orthodoxe de Salonique a la veille des Tanzimat », Südost-Forschungen 53 (1994), 73-130.
16 Dimitriadis, Η Θεσσαλονίκη της παρακμής, 29-30.17 Abacı were levied with 5.5 % of the total burden and kürkçi (furriers) with 4 % respec-
tively. Both groups collectively accounted for 8.7 % of the taxpayers and 9.5 % of the tax burden. Consequently, although the guilds retained their fiscal significance, their eco-nomic value was undoubtedly inferior to that of the 1790s. The respective percentage for 1790s was 42 %. See Evanghelos Hekimoglou, «Χριστιανικές συντεχνίες της Θεσσαλο-νίκης στα τέλη του 18ου αιώνα» [Christian Guilds of Thessaloniki During the Late 18th Century], in Πρακτικά Ε΄ επιστημονικού Συμποσίου, Xριστιανική Θεσσαλονίκη: Οθωμα-νική περίοδος 1430-1912, Thessaloniki 1993, 113-136.
18 The regular residents (ca. 65 %) and the new residents (ca. 35 %) of almost every neigh-bourhood were recorded separately. The new residents were registered under different capacities, like yabancilar, müstecir, kıracılar, hacılar; Dimitriadis, Η Θεσσαλονίκη της παρακμής, 137.
399
the orthodox christian poor and pauper families
not use the individuals’ participation in a guild as a parameter, but we may substitute this omission with the occupation patterns of the tax payers.
The distribution of the tax burden
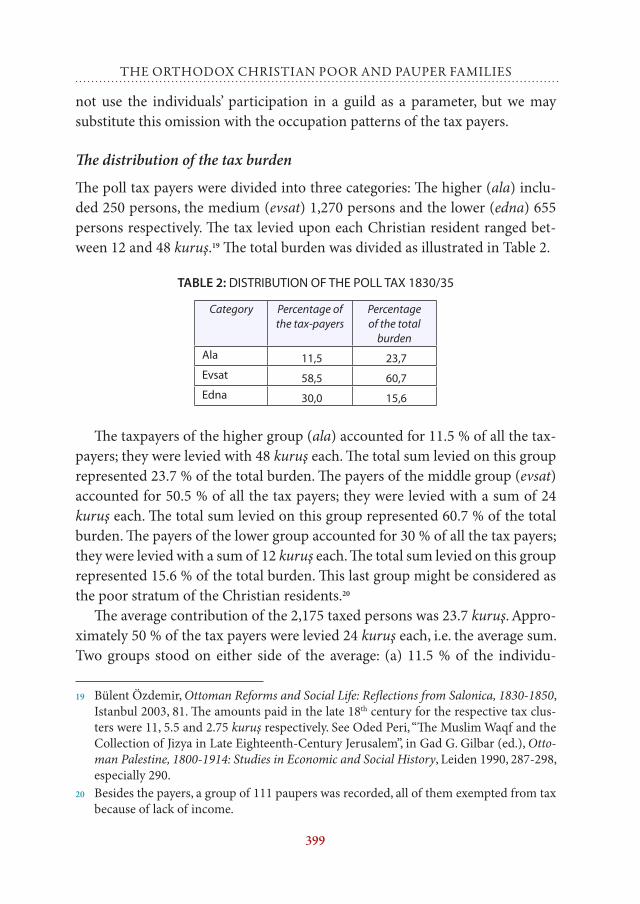
The poll tax payers were divided into three categories: The higher (ala) inclu-ded 250 persons, the medium (evsat) 1,270 persons and the lower (edna) 655 persons respectively. The tax levied upon each Christian resident ranged bet-ween 12 and 48 kuruş.19 The total burden was divided as illustrated in Table 2.
TABLE 2: DISTRIBUTION OF THE POLL TAX 1830/35
Category Percentage of the tax-payers
Percentage of the total
burdenAla 11,5 23,7Evsat 58,5 60,7Edna 30,0 15,6
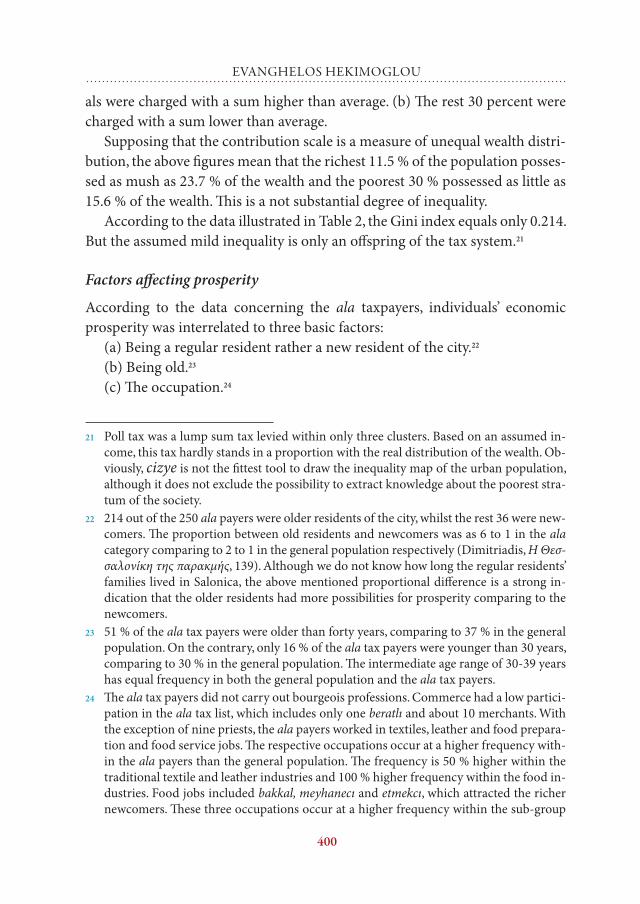
The taxpayers of the higher group (ala) accounted for 11.5 % of all the tax-payers; they were levied with 48 kuruş each. The total sum levied on this group represented 23.7 % of the total burden. The payers of the middle group (evsat) accounted for 50.5 % of all the tax payers; they were levied with a sum of 24 kuruş each. The total sum levied on this group represented 60.7 % of the total burden. The payers of the lower group accounted for 30 % of all the tax payers; they were levied with a sum of 12 kuruş each. The total sum levied on this group represented 15.6 % of the total burden. This last group might be considered as the poor stratum of the Christian residents.20
The average contribution of the 2,175 taxed persons was 23.7 kuruş. Appro-ximately 50 % of the tax payers were levied 24 kuruş each, i.e. the average sum. Two groups stood on either side of the average: (a) 11.5 % of the individu-
19 Bülent Özdemir, Ottoman Reforms and Social Life: Reflections from Salonica, 1830-1850, Istanbul 2003, 81. The amounts paid in the late 18th century for the respective tax clus-ters were 11, 5.5 and 2.75 kuruş respectively. See Oded Peri, “The Muslim Waqf and the Collection of Jizya in Late Eighteenth-Century Jerusalem”, in Gad G. Gilbar (ed.), Otto-man Palestine, 1800-1914: Studies in Economic and Social History, Leiden 1990, 287-298, especially 290.
20 Besides the payers, a group of 111 paupers was recorded, all of them exempted from tax because of lack of income.
400
eVANGheLOs hekimOGLOu
als were charged with a sum higher than average. (b) The rest 30 percent were charged with a sum lower than average.
Supposing that the contribution scale is a measure of unequal wealth distri-bution, the above figures mean that the richest 11.5 % of the population posses-sed as mush as 23.7 % of the wealth and the poorest 30 % possessed as little as 15.6 % of the wealth. This is a not substantial degree of inequality.
According to the data illustrated in Table 2, the Gini index equals only 0.214. But the assumed mild inequality is only an offspring of the tax system.21
Factors affecting prosperity
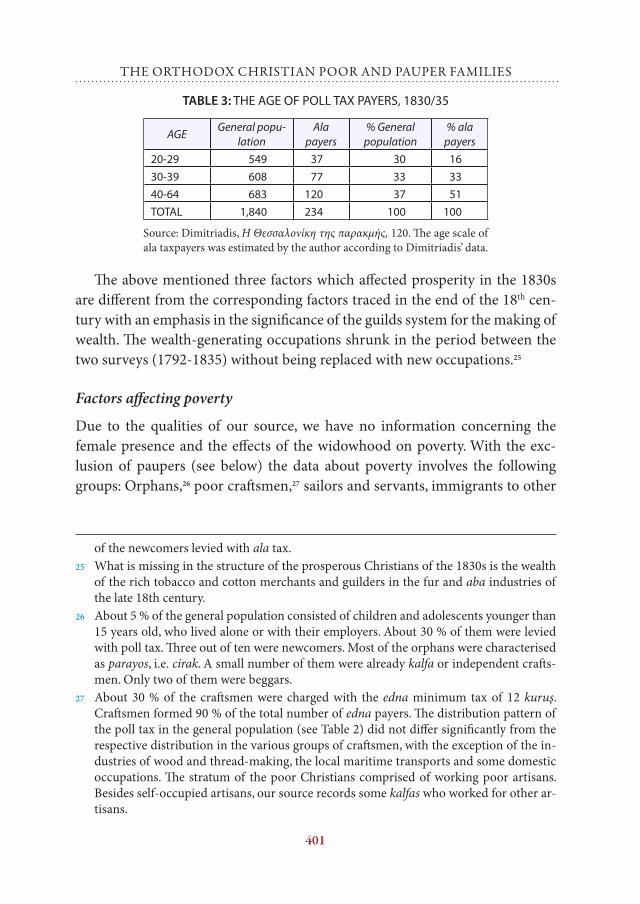
According to the data concerning the ala taxpayers, individuals’ economic prosperity was interrelated to three basic factors:
(a) Being a regular resident rather a new resident of the city.22 (b) Being old.23 (c) The occupation.24
21 Poll tax was a lump sum tax levied within only three clusters. Based on an assumed in-come, this tax hardly stands in a proportion with the real distribution of the wealth. Ob-viously, cizye is not the fittest tool to draw the inequality map of the urban population, although it does not exclude the possibility to extract knowledge about the poorest stra-tum of the society.
22 214 out of the 250 ala payers were older residents of the city, whilst the rest 36 were new-comers. The proportion between old residents and newcomers was as 6 to 1 in the ala category comparing to 2 to 1 in the general population respectively (Dimitriadis, Η Θεσ-σαλονίκη της παρακμής, 139). Although we do not know how long the regular residents’ families lived in Salonica, the above mentioned proportional difference is a strong in-dication that the older residents had more possibilities for prosperity comparing to the newcomers.
23 51 % of the ala tax payers were older than forty years, comparing to 37 % in the general population. On the contrary, only 16 % of the ala tax payers were younger than 30 years, comparing to 30 % in the general population. The intermediate age range of 30-39 years has equal frequency in both the general population and the ala tax payers.
24 The ala tax payers did not carry out bourgeois professions. Commerce had a low partici-pation in the ala tax list, which includes only one beratlı and about 10 merchants. With the exception of nine priests, the ala payers worked in textiles, leather and food prepara-tion and food service jobs. The respective occupations occur at a higher frequency with-in the ala payers than the general population. The frequency is 50 % higher within the traditional textile and leather industries and 100 % higher frequency within the food in-dustries. Food jobs included bakkal, meyhanecı and etmekcı, which attracted the richer newcomers. These three occupations occur at a higher frequency within the sub-group
401
the orthodox christian poor and pauper families
TABLE 3: THE AGE OF POLL TAX PAYERS, 1830/35
AGEGeneral popu-
lationAla
payers% General
population% ala
payers
20-29 549 37 30 16
30-39 608 77 33 33
40-64 683 120 37 51
TOTAL 1,840 234 100 100
Source: Dimitriadis, Η Θεσσαλονίκη της παρακμής, 120. The age scale of ala taxpayers was estimated by the author according to Dimitriadis’ data.
The above mentioned three factors which affected prosperity in the 1830s are different from the corresponding factors traced in the end of the 18th cen-tury with an emphasis in the significance of the guilds system for the making of wealth. The wealth-generating occupations shrunk in the period between the two surveys (1792-1835) without being replaced with new occupations.25
Factors affecting poverty
Due to the qualities of our source, we have no information concerning the female presence and the effects of the widowhood on poverty. With the exc-lusion of paupers (see below) the data about poverty involves the following groups: Orphans,26 poor craftsmen,27 sailors and servants, immigrants to other
of the newcomers levied with ala tax.25 What is missing in the structure of the prosperous Christians of the 1830s is the wealth
of the rich tobacco and cotton merchants and guilders in the fur and aba industries of the late 18th century.
26 About 5 % of the general population consisted of children and adolescents younger than 15 years old, who lived alone or with their employers. About 30 % of them were levied with poll tax. Three out of ten were newcomers. Most of the orphans were characterised as parayos, i.e. cirak. A small number of them were already kalfa or independent crafts-men. Only two of them were beggars.
27 About 30 % of the craftsmen were charged with the edna minimum tax of 12 kuruş. Craftsmen formed 90 % of the total number of edna payers. The distribution pattern of the poll tax in the general population (see Table 2) did not differ significantly from the respective distribution in the various groups of craftsmen, with the exception of the in-dustries of wood and thread-making, the local maritime transports and some domestic occupations. The stratum of the poor Christians comprised of working poor artisans. Besides self-occupied artisans, our source records some kalfas who worked for other ar-tisans.
402
eVANGheLOs hekimOGLOu
places,28 and newcomers.29
The relative position of the poor Christians
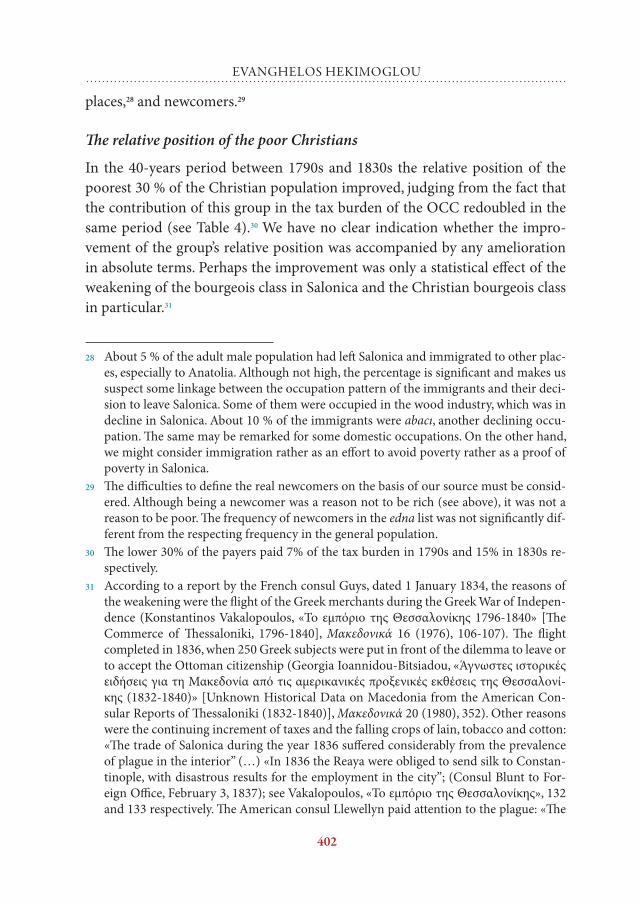
In the 40-years period between 1790s and 1830s the relative position of the poorest 30 % of the Christian population improved, judging from the fact that the contribution of this group in the tax burden of the OCC redoubled in the same period (see Table 4).30 We have no clear indication whether the impro-vement of the group’s relative position was accompanied by any amelioration in absolute terms. Perhaps the improvement was only a statistical effect of the weakening of the bourgeois class in Salonica and the Christian bourgeois class in particular.31
28 About 5 % of the adult male population had left Salonica and immigrated to other plac-es, especially to Anatolia. Although not high, the percentage is significant and makes us suspect some linkage between the occupation pattern of the immigrants and their deci-sion to leave Salonica. Some of them were occupied in the wood industry, which was in decline in Salonica. About 10 % of the immigrants were abacı, another declining occu-pation. The same may be remarked for some domestic occupations. On the other hand, we might consider immigration rather as an effort to avoid poverty rather as a proof of poverty in Salonica.
29 The difficulties to define the real newcomers on the basis of our source must be consid-ered. Although being a newcomer was a reason not to be rich (see above), it was not a reason to be poor. The frequency of newcomers in the edna list was not significantly dif-ferent from the respecting frequency in the general population.
30 The lower 30% of the payers paid 7% of the tax burden in 1790s and 15% in 1830s re-spectively.
31 According to a report by the French consul Guys, dated 1 January 1834, the reasons of the weakening were the flight of the Greek merchants during the Greek War of Indepen-dence (Konstantinos Vakalopoulos, «Το εμπόριο της Θεσσαλονίκης 1796-1840» [The Commerce of Thessaloniki, 1796-1840], Μακεδονικά 16 (1976), 106-107). The flight completed in 1836, when 250 Greek subjects were put in front of the dilemma to leave or to accept the Ottoman citizenship (Georgia Ioannidou-Bitsiadou, «Άγνωστες ιστορικές ειδήσεις για τη Μακεδονία από τις αμερικανικές προξενικές εκθέσεις της Θεσσαλονί-κης (1832-1840)» [Unknown Historical Data on Macedonia from the American Con-sular Reports of Thessaloniki (1832-1840)], Μακεδονικά 20 (1980), 352). Other reasons were the continuing increment of taxes and the falling crops of lain, tobacco and cotton: «The trade of Salonica during the year 1836 suffered considerably from the prevalence of plague in the interior” (…) «In 1836 the Reaya were obliged to send silk to Constan-tinople, with disastrous results for the employment in the city”; (Consul Blunt to For-eign Office, February 3, 1837); see Vakalopoulos, «Το εμπόριο της Θεσσαλονίκης», 132 and 133 respectively. The American consul Llewellyn paid attention to the plague: «The
403
the orthodox christian poor and pauper families
TABLE 4: PATTERNS OF INEQUALITY, 1792-1835
Percentage within tax payers Percentage of the tax burden 1790s
Percentage of the tax burden 1830s
22% of the payers paid 71% of the tax burden 35% of the tax burden48% of the payers paid 22% of the tax burden 50% of the tax burden30% of the payers paid 7% of the tax burden 15% of the tax burden
In fact the absolute number of the poor families was higher in 1835, because the Christian population of Salonica increased about 40 %, mainly as a result of the immigration from the Macedonian interior to the city. The increase of the relative significance of the poor families respecting the fiscal obligations of the OCC and the increase in their number gave them the necessary political power to press the rich families who ruled the community for a new deal in the distri-bution of the fiscal burden.32 Consequently, the poor guilds pressed the leaders of the OCC to impose a voluntary tax of 1 ‰ on the turnover of the Orthodox Christian companies, in favour of the communal schools.33
last 8 months the import trade has mush suffered owing to the existence of the plague in town and particularly so in the interior”; see Ioannidou-Bitsiadou, «Άγνωστες ιστορικές ειδήσεις». As the number of the rich taxpayers decreased, the burden levied on the poor stratum relatively increased, giving the impression of a statistical improvement.
32 The peak in this process occurred in 1840 with the establishment of a committee, with the participation of guilds, to check the account books of the OCC; Vakalopoulos, «Το εμπόριο της Θεσσαλονίκης 1796-1840», 115.
33 Georgios A. Stogioglou, Νέα στοιχεία για τα σχολεία της ελληνικής κοινότητας της Θεσ-σαλονίκης στην εποχή του Μητροπολίτη Ιερώνυμου (1841-1853) [New Evidence on the Schools of the Greek Community of Thessaloniki During the Period of Archbishop Hi-eronymos (1841-1853)], Thessaloniki 1985, 43. The yield of this tax was very weak; see ibid., 44 and 51. Bishop Hieronymos (1841-53) persuaded the Orthodox Christians who were subjects of European countries, and therefore had no legal obligation to pay com-munal taxes, to contribute to the education system of the OCC. The communal school population tended to increase faster than the Christian population as a whole, not only for demographic but also for social reasons. The moving force was the demand of the poor craftsmen to secure free schools for their children. Between 1839 and 1852 the expenses of the communal schools increased 16 times (Evanghelos Hekimoglou, “Administration and Funding of Schools at Times of Profound Social Change: The Example of Thessalon-iki (1792-1912)”, in Education in the Balkans: from the Enlightenment to the Founding of the Nation-States, Thessaloniki 2000, 333-352), mainly because of employing more teach-ers and building new schools and premises (Stogioglou, Νέα στοιχεία, 51-53).
404
eVANGheLOs hekimOGLOu
Paupers
Our source gives as a chance to take a glimpse in the pauper reaya of Salonica, an opportunity not given by the register of 1792. About a hundred residents (i.e. 3 % of the general population) were exempted from the poll tax because they were old-aged, blind, disabled or beggars. Almost half of them were recorded with their craftsmanship, which they obviously did not practice anymore.
3. 1860s
The source
Our third source is a published list, compiled in 1865.34 The list contains 954 Ottoman subjects who paid bedel-i askeri,35 instead of serving in the army. Foreign subjects had no obligation for military service and they were not included in the list. Because the average foreign subject was richer than the average Ottoman Christian, this quality of our source may direct us to a misleading lower degree of inequality.
The bedel was imposed on the basis of the twelve Christian neighborhoods, with the exception of the guild-organized trades.36 The trades were grouped by their guilds and then sorted by their neighborhood.
34 Konstantinos Vakalopoulos, «Χριστιανικές συνοικίες, συντεχνίες και επαγγέλματα» [Christian Quarters, Guilds and Professions], Μακεδονικά 18 (1978), 103-142.
35 See Ekmeleddin İhsanoğlu (ed.), History of the Ottoman State, Society and Civilisation, vol. 1, Istanbul 2002, 416. Özdemir (Ottoman Reforms and Social Life, 81) states that the cizye tax continued “..to be exacted under the name of bedel-i-askeri, the tax from the ex-emption of non-Muslims from military service, which was made mandatory to all citi-zens of the empire after the Tanzimat. When voices were raised against the new measure of compulsory military service for non-Muslims by the leaders of Christian and Jewish communities, the old cizye tax was renamed beled-i-askeri”. The edict about the gener-al military service was issued in 1856 and gave equal rights to all the Ottoman subjects; Bruce Alan Masters – Gábor Ágoston (eds), Encyclopaedia of the Ottoman Empire, New York 2009, 595.
36 Bakal, bakers, furriers, abacı, meyhanecı, uzumcı, aktar, tutuncı, candy-makers, boyacı, shoe-makers, semercı, astarcı, and tailors), i.e. about half of the enlisted persons. Furri-ers accounted for 5 % of the bedel payers and were imposed 4 % of the burden. Abacı accounted for 3.5 % of the population and were imposed 5 % of the burden. These pro-portions are identical with the 1830s poll tax data, an indication that the fiscal and eco-nomic significance of the guilds did not change.
405
v
All recorded persons were identified by their Christian names, the names of their fathers and usually their occupations, besides the neighborhood they lived in. There are no clear indications about the difference between older and new residents, a rather traceable distinction in the previous sources, with the exception of the very few persons who were identified with a family name.
The distribution of the tax burden
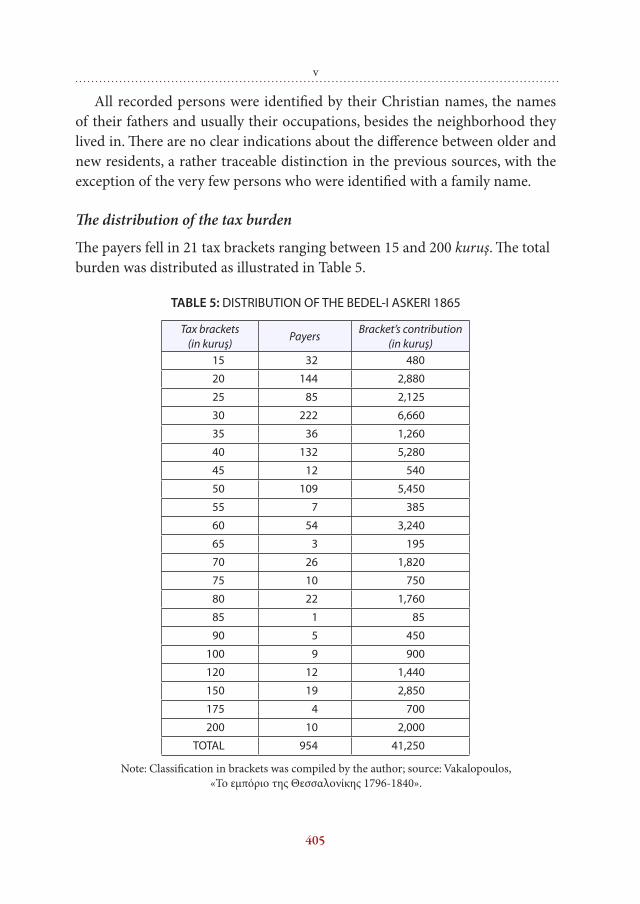
The payers fell in 21 tax brackets ranging between 15 and 200 kuruş. The total burden was distributed as illustrated in Table 5.
TABLE 5: DISTRIBUTION OF THE BEDEL-I ASKERI 1865
Tax brackets (in kuruş)
Payers Bracket’s contribution
(in kuruş)15 32 480
20 144 2,880
25 85 2,125
30 222 6,660
35 36 1,260
40 132 5,280
45 12 540
50 109 5,450
55 7 385
60 54 3,240
65 3 195
70 26 1,820
75 10 750
80 22 1,760
85 1 85
90 5 450
100 9 900
120 12 1,440
150 19 2,850
175 4 700
200 10 2,000
TOTAL 954 41,250
Note: Classification in brackets was compiled by the author; source: Vakalopoulos, «Το εμπόριο της Θεσσαλονίκης 1796-1840».
406
eVANGheLOs hekimOGLOu
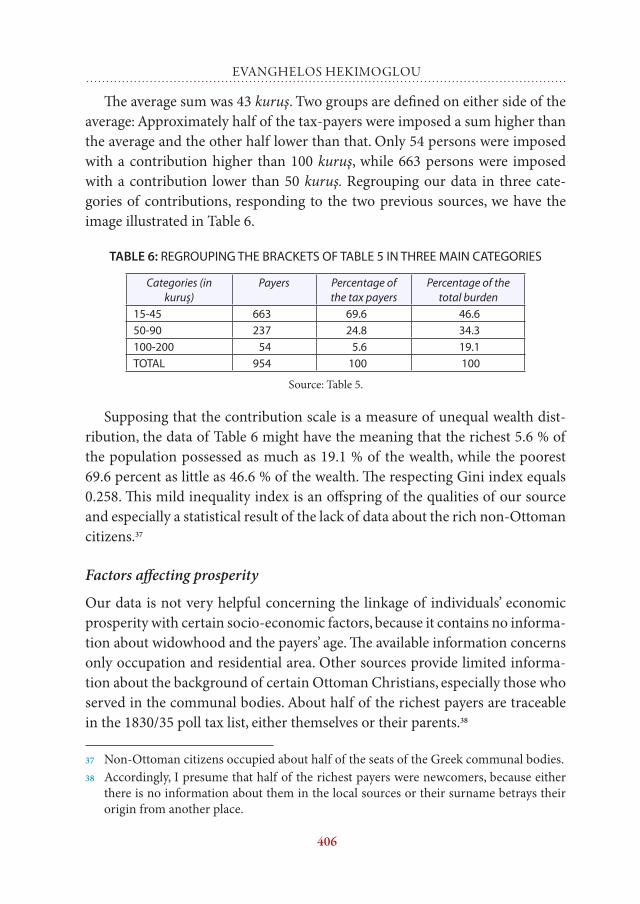
The average sum was 43 kuruş. Two groups are defined on either side of the average: Approximately half of the tax-payers were imposed a sum higher than the average and the other half lower than that. Only 54 persons were imposed with a contribution higher than 100 kuruş, while 663 persons were imposed with a contribution lower than 50 kuruş. Regrouping our data in three cate-gories of contributions, responding to the two previous sources, we have the image illustrated in Table 6.
TABLE 6: REGROUPING THE BRACKETS OF TABLE 5 IN THREE MAIN CATEGORIES
Categories (in kuruş)
Payers Percentage of the tax payers
Percentage of the total burden
15-45 663 69.6 46.650-90 237 24.8 34.3100-200 54 5.6 19.1TOTAL 954 100 100
Source: Table 5.
Supposing that the contribution scale is a measure of unequal wealth dist-ribution, the data of Table 6 might have the meaning that the richest 5.6 % of the population possessed as much as 19.1 % of the wealth, while the poorest 69.6 percent as little as 46.6 % of the wealth. The respecting Gini index equals 0.258. This mild inequality index is an offspring of the qualities of our source and especially a statistical result of the lack of data about the rich non-Ottoman citizens.37
Factors affecting prosperity
Our data is not very helpful concerning the linkage of individuals’ economic prosperity with certain socio-economic factors, because it contains no informa-tion about widowhood and the payers’ age. The available information concerns only occupation and residential area. Other sources provide limited informa-tion about the background of certain Ottoman Christians, especially those who served in the communal bodies. About half of the richest payers are traceable in the 1830/35 poll tax list, either themselves or their parents.38
37 Non-Ottoman citizens occupied about half of the seats of the Greek communal bodies.38 Accordingly, I presume that half of the richest payers were newcomers, because either
there is no information about them in the local sources or their surname betrays their origin from another place.
407
the orthodox christian poor and pauper families
Concerning the positive factors of prosperity, i.e. occupation and neighbor-hood, almost all the richest payers were bakal, bakers and merchants of flour, raisin and tobacco, as well as land-owners, and lived in the two central paris-hes of Saint Athanasios and Saint Nicholas. Those who are recognized in the 1830/35 poll list fell also in the higher bracket of this list, an indication that they were and remained relatively rich.
According to our data, belonging to an esnaf does not seem to be a factor of prosperity in the 1860s. Most of the esnaflı fell in the lower tax brackets.
Factors affecting poverty
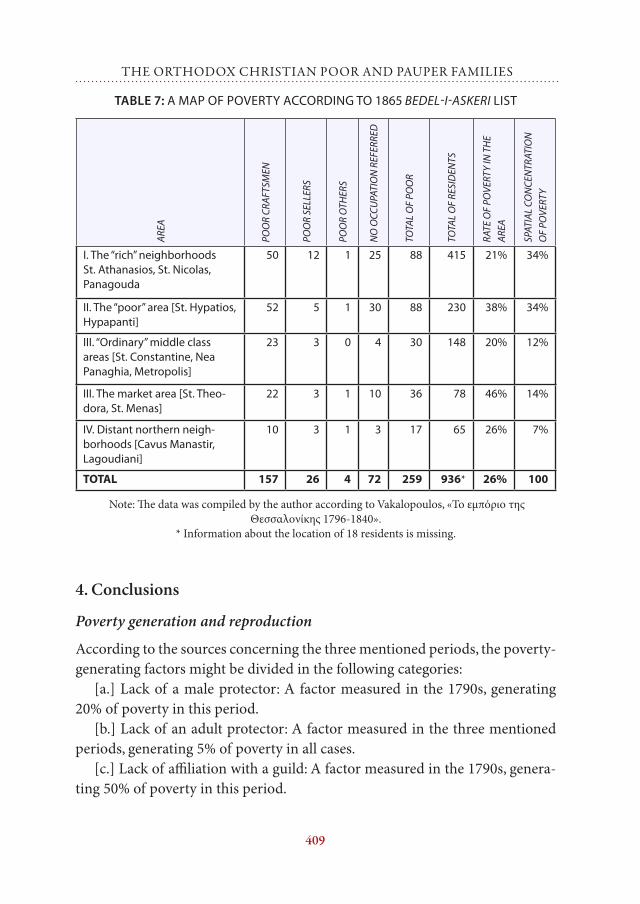
In the next step we will focus at the poorest 27 % of the population (brackets of 15 to 25 kuruş). The list contains 259 persons, i.e. 157 craftsmen, 26 small merchants, 4 other workers.39 One out of three guild-organized craftsmen is identified as poor. The kind of poverty we face is the offspring of the guilds’ decline, a poverty of people employed in traditional crafts like shoe-making, leather processing and textiles.
It seems that there is a strong relation between the residential environment and the spatial distribution of poverty. The mapping of our data identifies two indexes of spatial distribution of the poor Christian (see Table 7): (a) The rate of poverty in the respecting area,40 and (b) the spatial concentration of poverty.41
Another factor we had to cope about was the percentage of the newcomers among the poor, in order to estimate the impact of immigration on poverty.
39 There is no piece of information about the professional status of 72 poor persons (per-haps they were jobless, either invalid, or too old to work).
40 In the richer neighborhoods of St. Athanasios and St. Nicolas the rate of poverty was 21 and 20 % respectively, whereas in the poor area close to the eastern Kalamaria gate the rate was as high as 38 %. This area was the less developed and it was not organized in parishes until the 1860s; in 1864 the residents occupied the two churches of the neigh-borhood (St. Hypatios and Hypapanti), which belonged to a monastery and operated as dependencies of this monastery. The occupiers wanted the monks to contribute regular-ly for the establishment of a local elementary school. In the market area the poverty rate was even higher mounting up to 46 %, but the number of poor was not significant due to the low absolute number of the Christian residents in these neighborhoods.
41 The “rich” area and the “poor” area concentrated the same number of poor Christian res-idents, although the rate of poverty differed a lot, due to the lower number of residents in the poor area. The Kalamaria Gate area concentrated 34 % of the poor and the “rich” area accounted for the same percentage. That means that about two thirds of the poor Christian lived along the eastern part of the main street of the city.
408
eVANGheLOs hekimOGLOu
Our data provides no straight information concerning how long each resident lived in the city, with the exception of few persons with a geographical surname. Instead, I collected twenty cases with not very usual names and I tried to find traces of them in the poll tax list of 1830/35 (source II).42 There were clear tra-ces for ten of them,43 unclear traces for one44 and no traces for the remaining nine,45 either in this list or in other sources. The same percentage of old resi-dents (50%) was found between the richer tax payers (see above). So, we have a strong indication that the percentage of the immigrants in the poor stratum of the Greek community was rather high.
Being an orphan was also a traceable reason to be poor. In the list of the bedel payers who fell in the lower clusters I identified 14 cases with a maternal surname, besides a person clearly recorded as “orphan”.
42 Finding traces is not easy because family names did not exist and the Christian names were written with multiple forms. There is a special difficulty with the old Vlach forms of the Christian names, which are not in use any more, i.e. Athanasios>Nasos,>Soulas, or Demetrios>Tzimas, Demetrios >Mitas, Georghios>Goulas, Panaghiotis>Goutas e.tc.). For the same reasons, traces for the common Christian names with common paternal surnames can hardly be to be found.
43 Athanasios Zisi (Dimitriadis, Η Θεσσαλονίκη της παρακμής, 258), Demetrios nephew of Haci Polyzos (the later was a protégée, known by other source; Ioannis Vasdravellis, Ιστο-ρικά Αρχεία Μακεδονίας [Historical Archives of Macedonia], vol. I, Thessaloniki 1952, 536), Athanasios Mousiou (Dimitriadis, ibid. 270), Kostakis Stavrou (ibid. 237), Deme-trios Nicolaou Zoziou (ibid. 231), Demetrios Cobanoğlu (family known even by source I), Stavrakis Mestane (family refered even by source 1), Haci Demetrios Stoikou (ibid., 254), Konstantis Markou (ibid., 225), Prokopios Thoma (ibid., 307).
44 Kostas Zachou (similar name is traced, but the context is not plausible).45 Yannos Triantafyllou, Theoharis Georgiou, Goutas Theodorou, Georghios Ioannou of
the fisherman, Haci Prodromos, Soterios Vamva, Christos Theohari, Nicolaos Demou, Georghios Douma.
409
the orthodox christian poor and pauper families
TABLE 7: A MAP OF POVERTY ACCORDING TO 1865 BEDEL-I-ASKERI LIST
ARE
A
POO
R CR
AFT
SMEN
POO
R SE
LLER
S
POO
R O
THER
S
NO
OCC
UPA
TIO
N R
EFER
RED
TOTA
L O
F PO
OR
TOTA
L O
F RE
SID
ENTS
RATE
OF
POVE
RTY
IN T
HE
ARE
A
SPAT
IAL
CON
CEN
TRAT
ION
O
F PO
VERT
Y
I. The “rich” neighborhoods St. Athanasios, St. Nicolas, Panagouda
50 12 1 25 88 415 21% 34%
II. The “poor” area [St. Hypatios, Hypapanti]
52 5 1 30 88 230 38% 34%
III. “Ordinary” middle class areas [St. Constantine, Nea Panaghia, Metropolis]
23 3 0 4 30 148 20% 12%
III. The market area [St. Theo-dora, St. Menas]
22 3 1 10 36 78 46% 14%
IV. Distant northern neigh-borhoods [Cavus Manastir, Lagoudiani]
10 3 1 3 17 65 26% 7%
TOTAL 157 26 4 72 259 936* 26% 100
Note: The data was compiled by the author according to Vakalopoulos, «Το εμπόριο της Θεσσαλονίκης 1796-1840».
* Information about the location of 18 residents is missing.
4. Conclusions
Poverty generation and reproduction
According to the sources concerning the three mentioned periods, the poverty-generating factors might be divided in the following categories:
[a.] Lack of a male protector: A factor measured in the 1790s, generating 20% of poverty in this period.
[b.] Lack of an adult protector: A factor measured in the three mentioned periods, generating 5% of poverty in all cases.
[c.] Lack of affiliation with a guild: A factor measured in the 1790s, genera-ting 50% of poverty in this period.
410
eVANGheLOs hekimOGLOu
[d.] Being a newcomer: A factor measured in the three mentioned periods, generating 10%, 18% and 20% of poverty respectively.
[e.] Failure in the market (concerning poor guild-organized crafts): A fac-tor measured in the 1790s and 1860s, generating 10% and 70% of poverty res-pectively.
Two types of poverty
There is a clear distinction between two detected types of poverty. The main rea-son for poverty in the 1790s was the lack of affiliation with the guild system. The main reason for poverty in the 1860s was the low income of craftsmen affiliated to the guild system. Being a newcomer in the city was the second rea-son for poverty with increasing significance in all three examined cases.
The significance of immigration
Until the Ottoman reforms of the mid-19th century, immigration from the sur-rounding villages to Salonica was a crucial poverty-generating factor in Salo-nica. During this period, the immigration occurred because of the accumulated debts and the heavy taxation on the rural communities around Salonica46. The frequency of newcomers in the lower tax category was not significantly diffe-rent from the respecting frequency in the general population. The immigra-tion affected urban poverty only when an increase of poverty occurred in rural areas.
Structural differences
There is a clear distinction between the two following factors: (i) “lack of affi-liation with a particular guild”, and (ii) “being a newcomer”. However, the two factors coincide to some extent, because no newcomer was affiliated with a par-ticular guild. Consequently, the difference between the two types of poverty
46 For the accumulated debts of the surrounding rural communities in the 18th century ac-cording to unpublished Ottoman sources, see Seyyed Mohammad Tagi Shariat-Panahi, «Όψεις της κοινωνίας της Θεσσαλονίκης στην ευρύτερη περίοδο της ρωσο-οθωμανικής σύγκρουσης 1768-1774 με βάση τις οθωμανικές πηγές» [Aspects of the Society of Thes-saloniki During the Period of Russian-Ottoman Conflict, 1768-1774, on the Basis of Ot-toman Sources], unpublished Ph.D. dissertation, National and Capodistriac University of Athens, Athens 2010, 167ff. (http://thesis.ekt.gr/thesisBookReader/id/22568#page/1/mode/2up; retrieved 21/5/2012)
411
the orthodox christian poor and pauper families
named above is based on the decreasing importance of the guild system. Because the petty commodity production was not efficiently protected by the guild system, the proportion of the poor artisans in the guild-organized crafts had grown higher by the 1860s.
The external competition
In the period 1829/31 through 1837/40 the value of imports in Salonica increa-sed by 7.6 times. The value increased by 7.7 times again in the period 1840-1860 and doubled again until 1872. That is, in 1872 the import value was 14 times higher than 184047 and 100 times higher than 1829. We lack detailed data con-cerning the content of the imports, with the exception of 1845.48 This year the cotton manufacture and other textiles accounted for 65 % of the import value, i.e. 3.5 million francs or 14 million kuruş, a sum 140-fold greater than the cizye paid by Christian and Jew reayas collectively. This is a serious indication that the imported commodities dominated the local market with negative effects for the craftsmen.
How many the poor Christians were?
The number of the poor Christians doubled in the period 1790-1835 and rema-ined stable until 1865. The number increased with craftsmen who failed in the market, newcomers and orphans and decreased with immigration to other pla-ces and physical deaths.
How strong the poor Christians were?
In the period between 1790s and 1860s the relative political significance of the poor Christians increased for two reasons: (a) the number of the rich Christian merchants decreased; (b) the number of the rich craftsmen affiliated with the
47 Imports in Salonica (in francs): 1840=1.0, 1841=1.5, 1842=1.9, 1843=1.3, 1845=2.5, 1846=3.7, 1851=4.5, 1860=7.7, 1866=7.5, 1868=10.4, 1871=6.2, 1872=14.2, Konstantinos Vakalopoulos, Οικονομική λειτουργία του μακεδονικού και θρακικού χώρου στα μέσα του 19ου αιώνα στα πλαίσια του διεθνούς εμπορίου [The Economic Function of Macedonia and Thrace During the Mid-Nineteenth Century in the Context of International Com-merce], Thessaloniki 1980, 55-86; Özdemir, Ottoman Reforms and Social Life, 90-134; Basil C. Gounaris, Steam over Macedonia, 1870-1912. Socio-economic Change and the Railway Factor, New York 1993, 174.
48 Vakalopoulos, Οικονομική λειτουργία του μακεδονικού και θρακικού χώρου, 64.
412
eVANGheLOs hekimOGLOu
guild system fold to zero. Consequently, the poor Christians had to pay an inc-reasing proportion of the tax burden in the context of the OCC. The respecting Gini indexes for the three examined sources of tax distribution tend to fall. The increasing importance of the poor Christian stratum in regard to the distribu-tion of the communal tax burden gave them political power in the same con-text. This power appears to be used after the Tanzimat reforms.