The Life Cycle of Family Ownership: International Evidence
56
The Life Cycle of Family Ownership: International Evidence Julian Franks * , Colin Mayer ** , Paolo Volpin * and Hannes F. Wagner *** 27 October 2010 * London Business School; ** Saïd Business School, University of Oxford; *** Bocconi University. We are grateful for research support from the ESRC (Grant No. R060230004), the Institute for Family Business, London Business School’s Centre of Corporate Governance and the Fritz Thyssen Foundation. We are grateful to Grant Gordon for many helpful discussions. We also wish to thank Viral Acharya, Christian Andres, Joao Cocco, Paul Coombes, Mara Faccio, Nigel Nicholson, Ignacio Requejo, Antoinette Schoar, Henri Servaes, Mike Staunton, and seminar participants at the Bank of Italy, Cambridge University, EAP Paris, the European Central Bank, Institute for Family Business, London Business School, New York University, Norwegian School of Economics and Business, University of Salamanca, the 2009 American Finance Association Meetings in San Francisco, the 2009 FIRS Conference in Prague, the 2009 European Finance Association Meetings in Bergen, the 2008 German Finance Association Meeting for comments and suggestions.
Transcript of The Life Cycle of Family Ownership: International Evidence
The Life Cycle of Family Ownership: International Evidence
Julian Franks*, Colin Mayer**, Paolo Volpin* and Hannes F. Wagner***
27 October 2010
* London Business School; ** Saïd Business School, University of Oxford; *** Bocconi University. We are grateful for research support from the ESRC (Grant No. R060230004), the Institute for Family Business, London Business School’s Centre of Corporate Governance and the Fritz Thyssen Foundation. We are grateful to Grant Gordon for many helpful discussions. We also wish to thank Viral Acharya, Christian Andres, Joao Cocco, Paul Coombes, Mara Faccio, Nigel Nicholson, Ignacio Requejo, Antoinette Schoar, Henri Servaes, Mike Staunton, and seminar participants at the Bank of Italy, Cambridge University, EAP Paris, the European Central Bank, Institute for Family Business, London Business School, New York University, Norwegian School of Economics and Business, University of Salamanca, the 2009 American Finance Association Meetings in San Francisco, the 2009 FIRS Conference in Prague, the 2009 European Finance Association Meetings in Bergen, the 2008 German Finance Association Meeting for comments and suggestions.

The Life Cycle of Family Ownership: International Evidence
ABSTRACT
This paper studies the ownership of private and public firms, and their evolution over time. We
show that in countries with developed financial markets, high M&A activity and strong investor
protection (outsider countries) family control follows a life cycle: family firms evolve into widely
held companies as they age. In countries with less developed financial markets, low M&A
activity and weak investor protection (insider countries), family control is very persistent over
time. Also, while family control in outsider countries is concentrated in industries with lower
external financing needs, this is not so in insider countries where the presence of family control is
unrelated to external financing needs. This suggests that where families are a dominant
organizational form, the country’s financial institutions are better shaped to serve their financing
needs.
JEL Classification: G32, G34
Keywords: ownership, family firms, life cycle, corporate performance

1
“Parallel with the growth in the size of the industrial unit has come a dispersion in its ownership such that an important part of the wealth of individuals consists of
interests in great enterprises of which no one individual owns a major part. A rapidly increasing proportion of wealth appears to be taking this form and there is
much to indicate that the increase will continue.” Source: Berle and Means (1932)
1. Introduction
According to the traditional view that can be traced back to Berle and Means (1932), firm
ownership follows a life cycle. Firms start as family-controlled entrepreneurial entities, raise
external capital to grow, and as a result dilute founding family ownership. This transition
involves the firm becoming a public company with diffused ownership, run by a professional
manager and subject to the market for corporate control.
While this is one of the most widely cited stylized facts about the firm, there is
remarkably little evidence on it. There is some support for specific aspects of it from studies
such as Helwege, Pirinsky and Stulz (2007) and Foley and Greenwood (2010) which show that
insider ownership decays over time in firms that have recently been through IPOs but there is
nothing that looks at the longer term development of firms and in particular how this differs
across countries.
The life cycle view of family ownership suggests that the probability of a firm being
family controlled should be negatively related to its age. We provide support for this proposition
but show that the nature of this relationship varies significantly across countries with family
control diminishing far more rapidly in some countries than others. We examine the
determinants of this relationship and conjecture that the development of financial markets may
have a critical bearing on it.
There are three principal ways in which financial markets may affect firm ownership –
protection of investors, the financing of firms, and mergers and acquisitions. Shareholdings by
outside investors are encouraged where regulation provides strong protection of their interests;
family shareholdings will be diluted where firms need to raise substantial amounts of equity
finance; and family control is more likely to be relinquished in the presence of active external
markets for corporate control.
There are fragments of evidence for some of these assertions. For example, ownership
concentration has been shown to decay over time in the UK and US, two countries with strong
investor protection (Helwege, Pirinsky and Stulz (2007) and Franks, Mayer and Rossi (2009)),
2
while Aganin and Volpin (2005) find no evidence of decay of insider ownership over time in
Italy, a country with weak investor protection. However, there has been no systematic attempt to
determine the influence of minority shareholder protection, the external financing requirements
of firms and markets for corporate control on the evolution of family ownership.
This paper attempts to do this for a broad sample of firms, both private and listed, in many
countries. This poses significant data challenges. To provide as comprehensive an analysis as
possible we have used three separate data sets of non-financial European firms - two detailed
panels of four countries (the UK, France, Germany and Italy) and one cross-section which we use
to examine the robustness of our results in a broader setting. The data refer to both private as well
as listed companies and therefore avoid the sample selection biases of previous studies. By
including private as well as listed firms, our paper avoids any sample selection bias due to
conditioning on a firm being publicly traded. Furthermore, having access to private company
data, we are able to trace ultimate ownership of private as well as listed firms.
Since the U.K. can be regarded as an outsider system and France, Germany and Italy as
insider systems, we expect U.K. family firms to follow the life cycle theory of ownership more
closely than their Continental European counterparts. Our results on the life cycle of family
control are consistent with this prediction in two respects. First, we find a strong negative
correlation between family control and firm age in the U.K. – the older a firm is, the less likely it
is to be family controlled - whereas we find no such relation in the other three countries. Second,
over the period 1996-2006, U.K. family firms have a significantly lower chance of remaining
family-controlled than French, German and Italian family firms.
Conditional on survival, only 30% of listed U.K. family firms remain family-controlled
over a decade, compared with 52% in Germany, 59% in France and 73% in Italy. These results
hold for both private and public firms and controlling for the use of control mechanisms such as
dual class shares, pyramids and wedges between cash flow and voting rights which are frequently
used to enhance control by families (La Porta et al. (1999), Claessens, Djankov and Lang (2000),
Faccio and Lang (2002)). The life cycle is faster for large and listed than small and unlisted
firms.
We examine the influence of external financing and markets for corporate control on the
life cycle. We exploit industry-level differences in the needs for external financing (Rajan and
Zingales (1998)) and M&A activity (Andrade, Mitchell and Stafford (2001), Harford (2005)) to

3
test for how the life cycle is influenced by these two factors. Specifically, where external
financing is a source of dilution of family ownership then family firms should be concentrated in
industries with lower needs for external financing. Where selling family equity stakes is a source
of dilution of family control then family firms should be concentrated in industries with a lower
volume of M&A activity. In other words, if external equity financing and control are significant
then the incidence of family ownership should not be random across industries (Villalonga and
Amit (2009)). We test the robustness of these results in a cross-section of 27 countries by
examining the relation between the life cycle of ownership and an index measuring the degree of
outsider orientation of a financial system based on such measures as shareholder protection, stock
market development, M&A activity and private benefits of control. We find a negative
correlation between family control and firm age in countries that are outsider–dominated but no
correlation in countries that are insider-dominated. We also confirm that the presence of family
control is lower in industries with higher dependence on external capital and with higher M&A
activity in outsider but not in insider countries.
Finally we analyze the relative performance of family and non-family firms in insider-
and outsider-dominated countries. We find on average family firms are somewhat more profitable
than non-family ones in insider countries, where legal and political considerations lend
advantages to families, but not in outsider countries where they do not.
In summary, our evidence points to a life cycle of family control in outsider- but not
insider-dominated countries. This life cycle stems from both external financing and corporate
control requirements and is reflected in a higher level of profitability of family firms in insider
but not outsider systems.
The structure of the remainder of the paper is as follows. Section 2 reviews the existing
literature and develops the testable hypotheses. The data set and empirical methodology are
described in Section 3. The evolution of ownership over the decade of the panel data is analyzed
in Section 4; Section 5 describes the larger cross-sectional results; and Section 6 concludes that
article.
2. Literature and Hypotheses
In this section, we provide an overview of the existing literature on family ownership and
develop testable hypotheses from the life-cycle view of ownership.
4
2.1 The Family Firm Literature
There is now an extensive literature comparing the performance of family-controlled and widely-
held companies (Morck, Wolfenzon, and Yeung (2005)). This literature concludes that the
relation between family control and performance depends on the nature of the control. If control
is held directly, i.e. without the use of cross-holdings, pyramids and non-voting shares, family-
controlled firms out-perform non-family ones (Khanna and Palepu (2000); Anderson and Reeb
(2003); Barontini and Caprio (2005), Sraer and Thesmar (2007)). However, where families
control companies via cross-holdings, pyramids and non-voting shares, performance is worse
than in widely-held companies (Morck, Strangeland and Yeung (2000); Claessens et al. (2002);
Bertrand, Mehta and Mullainathan (2002)) because families are then able to extract private
benefits of control.
These observations on the relation of performance to ownership raise questions about the
evolution of ownership. According to Berle and Means (1932) and Chandler (1977), firms
develop from family owned enterprises into managerially controlled ones with wide share
ownership. De Marzo and Urosevic (2006) model this in a dynamic, general equilibrium model
where a large shareholder (for example a family) decides whether to keep their stake (and retain
an undiversified portfolio) or reduce it (and lower the value of the firm due to less monitoring in
the presence of moral hazard). They show that ownership is diluted slower when the moral
hazard problem is more serious.
Despite being one of the most widely “stylized facts”, there is remarkably little evidence
on the life cycle theory of the firm. Previous papers have only analyzed selected samples of
firms. For instance, Foley and Greenwood (2010) focus on ownership changes at the IPO stage
across countries, and Franks, Mayer and Rossi (2009) study a 100-year panel of listed firms in
the UK. Some papers have studied the process of succession and have observed that value is
destroyed in the passing of active management from the founder to his/her descendants (Morck
and Yeung (2003); Pérez-González (2006); Bloom and Van Reenen (2007); Villalonga and Amit
(2006); Bennedsen et al. (2007); Bertrand et al. (2008)) and that country-specific legal
institutions, like inheritance laws and norms, influence the likelihood of succession (Ellul,
Pagano and Panunzi (2008)).

5
2.2 Life Cycle Propositions
We examine the proposition that there is a life cycle evolution of firms by looking at the relation
of family control to firm age over cross-sections of firms at a particular point in time and changes
in the probability of family firm survival over time. We hypothesize that:
H1) Age: Firm age is negatively correlated with family control.
and H2) Survival: The frequency of family firms decreases over time.
We take an institutional financial market approach to the evolution of ownership and
argue that firms’ ownership structure reflects two main factors – financing and corporate control.
Family ownership is relinquished more rapidly where firms finance their growth through external
equity markets and control can be ceded to other investors through markets for corporate control.
There are well-known differences across industries in the external financing needs of
companies (Rajan and Zingales (1998)) and the level of M&A activity (Andrade, Mitchell and
Stafford (2001), Harford (2005)). We use these differences to relate dilution of family ownership
to industry variations in external financing and corporate control. First, if family ownership is
diluted in the primary market for raising external capital then family firms should be concentrated
in industries with lower external financing needs:
H3) External financing: Family ownership will be more concentrated in industries with less
need for external capital.
Second, if family ownership is diluted in the secondary market for corporate control then
family firms should be concentrated in industries with lower volumes of M&A activity.
H4) Mergers and Acquisitions: Family ownership will be more concentrated in industries
with less M&A activity.
6
2.3 Insider versus Outsider Systems
There are well known differences in the financing of firms across financial systems. In some
countries, there is a stronger propensity for firms to use internal finance and to raise external
finance in the form of debt rather than equity than in others. This depends on a number of factors
including the relative importance of banks versus stock markets in a financial system (Mayer
(1988)) and the legal protection of equity and debt investors (La Porta et al. (1997)). Hence,
raising external finance is not therefore necessarily associated with the evolution of family into
widely held firms.
Similarly, families are more likely to sell their stakes where private benefits of control are
lower and they can sell them in efficient M&A markets. Since the development of the market for
corporate control varies across countries (Rossi and Volpin (2004)), and private benefits of
control are larger in countries with weaker investor protection (Dyck and Zingales (2004)), active
M&A markets and lower private benefits of control should positively affect the decision of
family shareholders to sell their equity stakes.
We capture these differences in the concept of insider versus outsider systems: the value
of the private benefits of control is lower, new equity is less expensive and the market for
corporate control is more efficient in “outsider” than “insider” systems.
H5) Insider versus Outsider Countries: The life-cycle theories described above apply in
outsider systems but not insider systems, i.e. (i) age is more negatively correlated with family
control in outsider systems than in insider systems; (ii) family firms have a lower probability
of survival in outsider than insider systems; and (iii) family ownership is more concentrated
in industries with less need for external capital and less M&A activity in outsider systems.
In other words, we examine differences across industries and financial systems, and
“differences in differences” across industries and financial systems. In addition, we argue that
institutions adapt to the needs of the dominant form of ownership. In insider countries (where
family businesses are prevalent), institutions adapt to the needs of family ownership, through for
example the development of relationship banking that provides alternative forms of financing to
external equity and through family structures that provide alternative control mechanisms to
M&A. Family businesses will then not be at a disadvantage to widely held companies even in

7
sectors with high dependence on external capital or intense M&A activity. In contrast, where
family businesses are not dominant, institutions do not develop in this way and firms become
widely-held particularly in industries with high external dependence and high M&A activity. One
implication is that family firms should therefore be relatively more profitable than non-family
firms in insider systems where institutions develop to their benefit but not in outsider countries
where they do not.
H6) Profitability: Family firms are more profitable than non-family firms in insider but not
outsider systems.
3. Data
We test the life cycle theory of the firm using three data sets of listed and private firms. Two of
them are panels of firms that we trace over ten years from 1996 and the third is a large cross-
section of firms in 2006.
The first data set comprises the 4,000 largest companies, private or listed, in France,
Germany, Italy and the U.K.. We collected ownership data at December 1996 and ownership
changes over the period 1996 to 2006. This uses hand-collected and carefully cleaned ownership
data that accurately traces the evolution of ownership of all firms over the decade. We refer to
this first data set as the TOP 4,000 sample. The second data set comprises all listed family-
controlled firms in France, Germany, Italy and the U.K. in December 1996. It is based on the data
set of Faccio and Lang (2002) (henceforth FL), which we cross-check with alternative sources.
An important refinement that we make to the data set is to establish the ultimate owner for every
firm, including cases where the chain of control from the firm to its ultimate owner is via a
private firm. We refer to this second data set as the LISTED FAMILY sample. The third data set
comprises private and listed firms with sales greater than EUR 50 million in 27 European
countries in December 2006. It contains 27,652 firms and is a cross-sectional data set of private
and listed firms. We refer to this data set as the ALL FIRM sample. The structure of these three
data sets is described in Figure 1.
In what follows, we describe in detail the ownership data of the three samples and the
methodology used to obtain them.
8
3.1 TOP 4,000 Sample
We collect data on the largest 1,000 firms in each of the four largest economies in Western
Europe (France, Germany, Italy and the U.K.), using sales as our measure of size. Our starting
point is the universe of companies covered by AMADEUS, a pan-European financial database
produced by Bureau van Dijk (BvD), as of December 1996. From this data set, we obtain basic
financial and ownership information for each of the 4,000 companies. We then trace whether the
company survived from 1996 until 2006. If it did, we record its ownership and financial
information in 2006; otherwise, we record the reason for non-survival and thereby produce a
record of ultimate ownership at two points in time, in 1996 and 2006.
Generally, we find that ownership data in AMADEUS is of poor quality in 1996 but
improves greatly by 2006. In 1996 AMADEUS provides data on direct and some indirect
shareholdings only, and no data on ultimate ownership of firms. From 1997 onwards it starts to
provide some data on ultimate owners, from 2000 onwards it provides basic information on the
type of the ultimate owner (companies or individuals), and from 2002 onwards it provides
detailed information on ultimate owners, including a detailed breakdown of different types of
ultimate owners, such as families, financial investors and non-financial investors. We undertook
extensive checking to ensure that the data were consistent over time. We use direct and total
shareholding information from AMADEUS as a starting point to construct measures of
ownership at the beginning of the period in 1996 and correct and supplement it with hand-
collected information from a large number of sources as described below to trace control of every
firm to their ultimate owner.
We classify a company’s ultimate ownership in seven categories depending upon whether
the company was (i) widely-held or held by: (ii) a family, (iii) the State, (iv) another widely held
company, (v) several non family shareholders (referred to as a ‘multiple block’), (vi) a foreign
blockholder or (vii) other shareholder types (referred to as “other”). The category “foreign
blockholder” is further broken down into foreign family, foreign State, or foreign widely held
company. “Other shareholder” is a residual category of ultimate owners that includes private
equity and non-family controlled foundations.
We define ultimate ownership as control of at least 25 percent of voting rights, where this
stake is held directly or via a control chain whose links all exceed the 25 percent threshold. A
widely held company is defined as one where there is no ultimate owner. The 25 percent
9
threshold definition of a controlling stake is used by AMADEUS in 2006 and thus allows a direct
comparison with the ALL FIRM data, discussed below. Where there are two or more shareholders
with individual blocks of 25 percent or more, this is counted as two or more controlling stakes. In
the event that one of the blockholders is a family we classify the company as family-controlled. If
none of the blocks are family-controlled we describe the company as controlled by multiple
stakes. We trace controlling stakes through all layers of ownership until we identify the ultimate
owner and define the ultimate owner’s controlling stake as the minimum voting rights along the
control chain.1
We have spent considerable efforts to ensure the accuracy of our data. First, for every firm
in 1996 we manually trace controlling stakes through all layers of ownership until we identify the
ultimate owner. As pointed out earlier, we cannot rely on AMADEUS for this, as it does not
contain information about ultimate ownership in 1996. We therefore manually trace ultimate
owners for all 4,000 firms, using the 25 percent voting rights threshold. To do this we combine
the shareholding links reported in AMADEUS with a large number of alternative sources,
including Wer gehoert zu Wem for Germany, the London Share Price Data Base for the U.K.,
Consob for Italy, and DAFSA for France, with the complete list of data sources provided in
Appendix B.
Second, by 2006 AMADEUS data quality is considerably improved and in addition to
direct shareholdings also contains ultimate ownership data. However, for a large number of firms
in each country (roughly one quarter of all firms in the sample) AMADEUS does not contain
information about the ultimate owner even in 2006. In most cases this does not mean that the firm
is widely held, but that ultimate ownership is unclassified in the database. Not surprisingly,
unclassified ownership is more frequent for private than for listed firms. For all these firms,
1 We apply the 25 percent threshold of voting rights for tracing ownership via the weakest link in all control layers between a firm and the ultimate owner in a pyramid structure. For example, if a family owns 25 percent of the voting rights of Firm A that owns 30 percent of the voting rights of Firm B, then we regard Firm B (and Firm A) as family controlled. If instead Firm A owns just 15 percent of Firm B, then we regard Firm B as controlled by a widely held parent firm (and Firm A as family controlled). Where there are multiple stakes held by individuals (or investment vehicles traced to individuals), we aggregate these stakes across individuals within the same family. Where there are two families within one firm, we aggregate these into one family holding. This is important because individual family members frequently hold small equity stakes when the aggregate family stake is above 25 percent. Our approach therefore distinguishes firms that are widely held from family controlled firms where individual family members do not hold controlling stakes but in aggregate they do.

10
which amount to roughly 25 percent of the sample in 2006, we manually trace control to the
ultimate owner as we do for all firms in 1996.
Third, where one company has a block in another, that company may be classified by the
database as the ultimate owner. This is clearly not the ultimate owner, unless the holding
company is widely held itself. We identify the true ultimate owner by tracing the controlling
stake to the final ownership layer, using the alternative sources already described.
Fourth, to study the evolution of ownership, we have traced the history of all our
companies for a decade, from 1996 to 2006. Many companies that are present in 1996 are not
present in 2006 because the database has incorrectly assumed that the company has died. The
incorrect classification is due to reasons such as changes of name, of address of incorporation and
of control. Such changes usually trigger a new company identifier in electronic databases, which
make them observationally identical to the cases of firm death. To amend incorrect classifications
we manually determine the reason for the disappearance for each company recorded in 1996 that
does not reappear in AMADEUS in 2006. Incorrect classification of death has additional
implications for identifying ownership of related firms; that is, if a company that is a shareholder
of another company is reclassified then that reclassification may affect the related company.
Where there are ownership connections between companies, reclassification presents complex
challenges in data collection and, with the exception of identifying ownership of private firms,
this process of tracing of public and private firms over time is the most time-consuming part of
the data collection exercise in the paper.2
3.2 LISTED FAMILY Sample
The most widely used sample of family controlled companies is the FL data set. This sample is a
snapshot of the ultimate ownership of all listed companies in 13 European countries, taken
around 1996. The FL data set contains information on the type of ultimate controlling
shareholders. From the FL data set we select all firms classified as family-controlled and subject
them to our methodology of tracing control through both public and private entities to identify the
2 We also account for a possible contraction in size of the company, i.e. we search among all companies in AMADEUS in December 2006 (not only the largest 1,000). In many cases we find that companies have survived, but have diminished considerably in size relative to other firms and therefore dropped out of the largest 1,000.

11
ultimate controlling shareholder, i.e. we subject every firm to the same identification process of
identifying the ultimate owner as described in the previous section for the TOP 4,000 sample.
We do this for two reasons: first, to classify family controlled companies and determine
whether our profile of family controlled companies is similar to that of FL; and, second, to study
the evolution of family firms and the role of the family within the family firm, such as board
membership and effects of generational change over time. Sufficient information on these
variables is only available for listed firms.
The sample of companies identified as family controlled companies by FL includes two
types of family firms, those where the ultimate shareholder is unequivocally a family, and those
where the ultimate owner is a private company whose shareholders are unknown, which are
assumed by FL to be family controlled. Since we can trace the shareholders of private companies
we are able to refine the classification of family controlled firms in regard to the latter category.
Using FL’s list of 1,359 family controlled companies in 1996 for our four countries we
find that our classification of family ownership is different from FL’s in 32% of cases. The
differences in classification mainly relate to companies that are controlled by a private company,
which are assumed by FL to be family firms. We provide comparisons between FL and our
dataset in Appendix C. Our final LISTED FAMILY sample contains 827 listed family-controlled
firms. For this sample, we collect information over the subsequent decade, tracing changes in
ownership, board membership, control transfers to other shareholders outside the family (both to
other family and non family firms), survival, and effects of generational change. We combine
these with data from FL on the use of preferred shares, the difference between cash-flow and
voting rights and the presence of pyramids in these firms.
3.3 ALL FIRM Sample
The starting point for the ALL FIRM sample is the firm coverage of AMADEUS. Our analysis is
based on the December 2006 issue, which contains 1,633,308 firms from 41 countries.3 The
database contains firm-level data and covers a large range of data items, including company
financials and ownership data. Availability of data items is very good for larger firms and
3 According to BvD, a firm must meet at least one of three criteria to be included in the database. i) Turnover must be greater than EUR 10 million. ii) Number of employees must be greater than 150. iii) Total assets must be greater than EUR 10 million. Banks and insurance companies are not included in the database.

12
generally decreases strongly with firm size. The median firm in the database is somewhat small—
during fiscal year 2005, the median firm has 25 employees and sales of EUR 2.79 million, with
data available for 748,003 firms—and consequently has few data items available.
In order to obtain a sample for which most basic data are available we extract only firms
that meet the following requirements: i) firm status is active according to the database; ii) sales,
assets, operating profit, incorporation year, and industry (US SIC code) are reported for fiscal
year 2005; iii) sales are at least EUR 50 million and assets are at least EUR 25 million; and iv)
the firm is incorporated in a country covered by Djankov et al. (2008). This screening yields
28,900 firms.
We exclude firms with SIC codes above 8900 (non-classifiable establishments and public
administration-type firms) and firms in Fama-French industries with less than ten firms in total
(but we check whether this affects our results). This leaves 27,652 firms from 27 countries as our
final sample.
One caveat of the ALL FIRM sample is that the coverage of AMADEUS differs between
countries, which is primarily due to differences in national reporting requirements and
consequently the amount and types of data that BvD has available. AMADEUS therefore may not
be representative of the universe of firms in a given country. A detailed discussion of this is
provided in Klapper, Laeven and Rajan (2006). One solution is to impose unified restrictions on
firms sampled from the database that exceed country-specific criteria for inclusion in the
database. We take this approach and impose restrictions on sales (minimum EUR 50 million) and
assets (minimum EUR 25 million) for our sample firms that exceed the minimum criteria for
inclusion of a firm in AMADEUS (minimum EUR 10 million in both cases). The ALL FIRM
sample therefore includes medium-size but not small firms. In unreported regressions we find
that there is no evidence of an evolutionary path from family firm to widely held firm in small
firms (below EUR 50 million in sales), independently of the country we focus on. One possible
explanation is that small firms are less likely to raise external financing and to be subject to the
market for corporate control. Another possibility is that the quality of data is particularly poor in
smaller companies, particularly with respect to the equity ownership.
Key to our analysis is identification of whether a firm has an ultimate owner and if so,
whether this owner is a family. In the simple case, the ultimate owner has a direct stake in the
firm under investigation and basic data on direct shareholdings in a firm suffices to identify the

13
owner. AMADEUS contains such direct shareholding data that are comparable to
WORLDSCOPE or Compact Disclosure. In the more complex cases, however, the ultimate
owner has an indirect stake in the firm under investigation, and thus identification of the ultimate
owner requires tracing controlling stakes through potentially many layers between the firm and
its ultimate owner.
While we undertake this tracing manually using a large number of sources for all firms in
our TOP 4,000 and LISTED FAMILY samples, this approach is not feasible for the 27,684 firms
in the ALL FIRM sample. We instead utilize a unique feature of AMADEUS, which provides
summary metrics of ownership links for every firm.4
AMADEUS traces control by, first, calculating voting rights but not cash-flow rights.
Second, it refers to entities as the ultimate owners of a firm if the entity controls the firm directly
at a defined threshold or via a control chain whose links all exceed that threshold. The threshold
in the December 2006 version of AMADEUS can be configured to be 25 or 50 percent, and we
set it to 25 percent. Third, a company that is known to have no ultimate owner is referred to as
widely held.
Using this threshold, we rely on AMADEUS to separate firms into the following four
categories: (i) widely held; (ii) ultimately controlled by a family; (iii) ultimately controlled by a
non-family owner; and (iv) ultimately controlled by an unknown type of shareholder. We apply
several filters to the classification provided by AMADEUS (which is described in detail in
Appendix D) to create a dummy variable for identifying family control.
3.4 Insider and Outsider Systems
An important question is how to classify countries as insider or outsider dominated. First, let us
compare France, Germany, Italy and the U.K. from a purely qualitative viewpoint.
4 The data set provider, BvD, has built up this database over several years, relying on a large number of public and semi-public sources. In October 2006 it contained 6.69 million ownership links. BvD maintains the link database dynamically, updating it with new information on ownership when it becomes available. Therefore the database represents snapshots of the international web of shareholder structures at relatively precise points in time. The database assigns identifiers to firms and shareholders, where shareholders can be virtually any type of legal person. The database identifies ownership by limited and unlimited liability firms, public and private firms, cooperatives, foundations, individuals and families, municipalities and states. Another feature is that links between firms and shareholders are traced internationally. For every firm in AMADEUS, BvD provides a large number of data items, designed to capture all ownership links that the firm has. The construction of these data items is typically complex and explained in a detailed technical document by BvD. To conserve space, we limit our discussion to two aspects: i) the way AMADEUS traces control, and ii) how we identify whether a firm has a family as its ultimate owner.
14
Corporate governance regulation was significantly different across the four countries in
1996. Only the U.K. had a corporate governance code of conduct with a comply-or-explain
requirement. Since the 1992 Cadbury report, most companies have boards (and audit and
compensation committees) with a majority of independent directors and a strict separation of
Chairman and CEO. Directors in France, Germany and Italy were not subject to similar
regulation.
In the U.K., shareholders have historically enjoyed substantial power vis-à-vis managers
and directors. Black and Coffee (1994) argue that, as a result, the U.K. provides an ideal
laboratory for shareholder activism. For example, shareholders must approve a large number of
corporate actions, such as share buy-backs, dividend payments, and large acquisitions, while
current shareholders have pre-emption rights in all new issues. Also, it is easier in the UK for
minority shareholders to call an extraordinary general meeting and remove members of the board
of directors. To illustrate, in the U.K. in 1996 only 10 percent of shareholders were required to
call an extraordinary general meeting, compared with 20 percent in Italy. Finally, derivative suits
were permitted in the UK but not in Germany and Italy; they were allowed in France, but rarely
used.
Deviations from the one-share-one-vote principle were common in France, Germany and
Italy, but were rarely observed in the U.K. In 1996, neither Germany nor Italy had a “mandatory
bid rule” in place.5 Executive compensation was disclosed only in the U.K. As a result we treat
the U.K. as the only outsider country and France, Germany and Italy as insider countries. A
quantitative measure of outsider versus insider characteristics described below shows that the
U.K. has a significantly higher outsider score than the other three countries.
To help the analysis of the large, cross-sectional ALL FIRM sample, we develop a
quantitative measure, the Outsider index, which aggregates measures of investor protection,
financial development, M&A activity and private benefits for a larger number of countries. The
Outsider index is reported for the 27 countries in our samples in Appendix A. The index is
calculated as the equally-weighted sum of eight normalized indicators: Antidirector rights - a
measure of the rights of minority shareholders against directors, as revised by Djankov et al.
(2008); Anti-self-dealing - the indicator produced by Djankov et al. (2008) to measure the power
5 The mandatory bid rule requires that the acquirer of a control block must make an offer for all the remaining shares at a price equivalent to that paid for the block

15
of minority shareholders against self-dealing by managers and controlling shareholders; Stock
market capitalization over GDP in 2006; the number of listed firms scaled by population (in
millions) in 2006; M&A activity - the percentage of traded companies targeted in a completed
deal between 2001 and 2006, computed using SDC Platinum; Hostile takeovers - the number of
attempted hostile takeovers as a percentage of traded companies during the same period,
computed using SDC Platinum; Voting premium - the average percentage difference in market
value of voting shares compared to non-voting shares from Nenova (2003); Block premium - the
difference between the price per share paid for the control block and the exchange price two days
after the announcement of the control transaction, as a percentage of the exchange price two days
after the announcement from Dyck and Zingales (2004). Each variable is normalized by
subtracting the worldwide average and dividing by the worldwide standard deviation, the latter is
computed using the 72 countries covered by Djankov et al. (2008).
The aggregate score ranges from a minimum of -0.9 to a maximum of 1.19, with a median
of 0.01 and a standard deviation of 0.53. A higher score indicates more outsider system
characteristics. Appendix A shows that there are significant differences across countries, with
countries like the U.K. and Ireland scoring very high (1.19 and 1.02, respectively), and countries
like Austria (-0.9) and Italy (-0.25) scoring very low. France and Germany are close to the
average (0.1 and 0.02, respectively). This also confirms our prior qualitative assessment that the
U.K. is different from the other three countries.
In addition to the above, the life cycle of family firms might be influenced by inheritance
taxes. Tsoutsoura (2009), for example, shows that inheritance tax in Greece is associated with
less family firm investment. We collect data on the maximum payable inheritance tax rate in all
27 countries of this study.6 This inheritance tax measure is positively correlated with the
Outsider index, with a correlation coefficient of 0.39, significant at the 5 percent level.
4. Evolution of Ownership
In this section we study the evolution of ownership over the period 1996-2006 in France,
Germany, Italy and the UK. We first analyze the TOP 4,000 sample and report summary statistics 6 We collect tax rates from the Deloitte International Tax and Business Guides and assign a zero percent rate for countries in which there is no inheritance tax or in which inheritance from parent to child is tax-exempt (Austria, the Czech Republic, Latvia, Portugal, Romania, the Russian Federation, Slovakia, Sweden, Switzerland, and Ukraine). Inheritance tax rates have a mean of 15.7% and standard deviation of 18%.

16
on ultimate ownership for the cross-section of firms in each country in 1996. Then, we analyze
the evolution of ownership over the decade and test the predictions of the life cycle theory of
family ownership by comparing survival rates of family firms in the four countries. We examine
whether firm age is a determinant of family control, and we assess the explanatory power of
external financing needs and M&A activity for family control.
We then turn to the analysis of the LISTED FAMILY sample, which includes 827 listed
family firms and explore in greater detail the evolution of ownership in family firms. In the case
of the TOP 4,000 we know whether firms die over the ten-year period but we cannot identify the
precise cause of death. For the LISTED FAMILY sample we can distinguish the causes of death -
takeover, going private, sale of stake and insolvency - which allows us to evaluate why listed
family firms in outsider countries evolve differently from those in insider countries. We also
analyze how family characteristics such as the CEO being a family member affect survival rates
for the LISTED FAMILY sample.
4.1 Descriptive Statistics
In Table 1 we describe the landscape of ultimate ownership for 1996 for the largest 1,000
companies in each country both listed and unlisted. While the ownership categories in the table
are very detailed, in the discussion here we focus mostly on family-controlled and widely-held
companies. Also, as we move through the table from Panel A to Panel C, we show different types
of ownership aggregation. The final panel, Panel C, describes the sample we will use for the
remainder of this section.
Panel A reports data on the full sample, which includes the largest 1,000 firms in each
country with the exception of the few firms for which ultimate ownership cannot be identified.
The actual numbers are 923 firms in Germany, 970 in France, 980 in the U.K. and 954 in Italy.
Among these, family ownership is highest in Italy at 47.9% and lowest in the U.K. at 10.9%.
Conversely, the percentage of widely held companies is highest in the U.K. at 27.4% and lowest
in Italy at 5.6%. State ownership is significant and about 10% in all countries except the U.K.
where it is 1%. A noticeable fact is that foreign control is the second most prevalent form of
ownership in France, Germany and Italy at between 18 and 28 percent. In the U.K. foreign
shareholders play the most significant role: a striking 34% of firms are controlled by a foreign
blockholder. Finally, the fraction of companies that have a widely held parent is also significant,
17
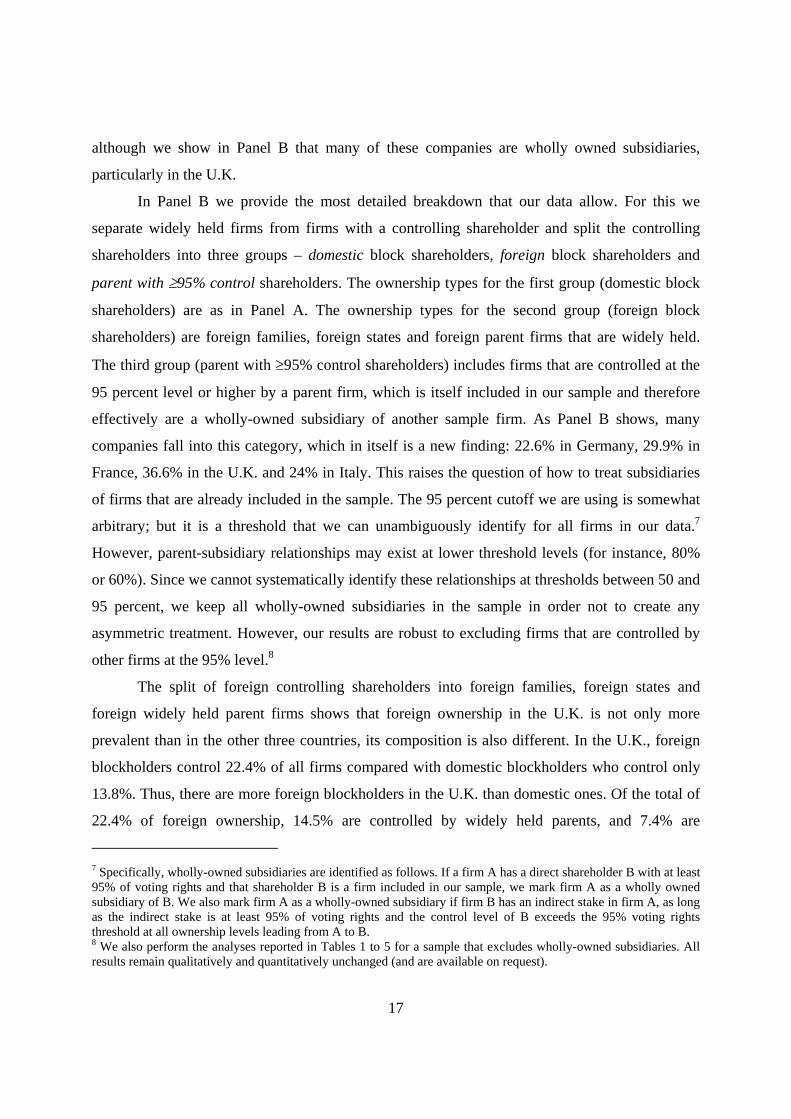
although we show in Panel B that many of these companies are wholly owned subsidiaries,
particularly in the U.K.
In Panel B we provide the most detailed breakdown that our data allow. For this we
separate widely held firms from firms with a controlling shareholder and split the controlling
shareholders into three groups – domestic block shareholders, foreign block shareholders and
parent with 95% control shareholders. The ownership types for the first group (domestic block
shareholders) are as in Panel A. The ownership types for the second group (foreign block
shareholders) are foreign families, foreign states and foreign parent firms that are widely held.
The third group (parent with 95% control shareholders) includes firms that are controlled at the
95 percent level or higher by a parent firm, which is itself included in our sample and therefore
effectively are a wholly-owned subsidiary of another sample firm. As Panel B shows, many
companies fall into this category, which in itself is a new finding: 22.6% in Germany, 29.9% in
France, 36.6% in the U.K. and 24% in Italy. This raises the question of how to treat subsidiaries
of firms that are already included in the sample. The 95 percent cutoff we are using is somewhat
arbitrary; but it is a threshold that we can unambiguously identify for all firms in our data.7
However, parent-subsidiary relationships may exist at lower threshold levels (for instance, 80%
or 60%). Since we cannot systematically identify these relationships at thresholds between 50 and
95 percent, we keep all wholly-owned subsidiaries in the sample in order not to create any
asymmetric treatment. However, our results are robust to excluding firms that are controlled by
other firms at the 95% level.8
The split of foreign controlling shareholders into foreign families, foreign states and
foreign widely held parent firms shows that foreign ownership in the U.K. is not only more
prevalent than in the other three countries, its composition is also different. In the U.K., foreign
blockholders control 22.4% of all firms compared with domestic blockholders who control only
13.8%. Thus, there are more foreign blockholders in the U.K. than domestic ones. Of the total of
22.4% of foreign ownership, 14.5% are controlled by widely held parents, and 7.4% are
7 Specifically, wholly-owned subsidiaries are identified as follows. If a firm A has a direct shareholder B with at least 95% of voting rights and that shareholder B is a firm included in our sample, we mark firm A as a wholly owned subsidiary of B. We also mark firm A as a wholly-owned subsidiary if firm B has an indirect stake in firm A, as long as the indirect stake is at least 95% of voting rights and the control level of B exceeds the 95% voting rights threshold at all ownership levels leading from A to B. 8 We also perform the analyses reported in Tables 1 to 5 for a sample that excludes wholly-owned subsidiaries. All results remain qualitatively and quantitatively unchanged (and are available on request).

18
controlled by foreign families. Thus, foreign families control about the same proportion of U.K.
firms as domestic families.
For the Continental countries the pattern is reversed; domestic blockholders are much
more prevalent than foreign blockholders. In Germany, France and Italy domestic blockholders
control about 50% of all firms compared with foreign blockholders who control only about 15%.
Widely held parent companies control most of the latter companies (10.5% in Germany, 9.4% in
France and 13.4% in Italy). Foreign families control much fewer firms in the three countries than
in the U.K.: 2.6% of firms in Germany, 4.0% in France and 2.7% in Italy.
In what follows we do not distinguish between foreign and domestic ownership. Hence, in
Panel C we report the ownership types that we will use for the remainder of the section. Since our
main goal is to focus on the differences across ownership types (family, state, widely held parent
firm) and not on the distinction between domestic and foreign-owned firms, we redistribute
foreign-owned firms across ownership types. This raises the percentage of family controlled
firms in the U.K. from 7.3% in Panel B to the final 21% in Panel C, half of which are foreign
controlled.
Table 2 partitions the companies described in Panel C of Table 1 into listed and private
firms. Panel A shows that 27.8% of U.K. companies are listed. The proportion of listed
companies is much lower in the other three countries, 14.5% in Germany, 13.6% in France and
8.4% in Italy. The higher proportion of U.K. listed firms in part reflects the size and importance
of the country’s stock market.
In Panel B we describe the ownership characteristics of listed companies only. As
documented by Barca and Becht (2001), listed firms in France, Germany and Italy are much less
likely to be widely held than firms in the U.K. As many as 85% of U.K. listed companies are
classified as widely held, compared with only 22% of German, 21% of French and 3% of Italian
companies. The large controlling blocks in countries like Italy are held mainly by families, where
66% of all listed companies have a family blockholder; the corresponding proportions are 49% in
France, and 34% in Germany. In the U.K. families control only 8% of listed companies.
In Panel C, we describe the ownership of private firms. Particularly for the U.K. we
expect the proportion of family controlled firms to be much higher among private firms than
among listed firms, because both mechanisms for the dilution of family control—the raising of
external finance and M&A activity—are expected to be less important for private firms. The

19
results show that in the U.K. the proportion of family [private] firms is 26%, much lower than in
Continental European countries, although considerably higher than for U.K. listed companies.
This number declines to less than half if only domestic families are considered. In Continental
Europe the proportion of family firms is strikingly similar to those for listed firms, at 39% in
Germany, 43% in France and 52% in Italy.
Finally, a comparison of Panel B and C shows that by moving from listed to private firms,
family ownership increases from 29.8 percent to 40.8 percent on average, confirming that family
firms are generally more likely to be private than listed. At the country level however, with the
exception of the U.K., the proportion of family firms among private firms is close to or, in the
case of France and Italy, even lower than the proportion of family-owned firms among listed
firms. The explanation is that while absolute numbers of family firms among private firms are
high, there are also significant numbers of widely-held cooperatives (especially in France and
Germany), state-owned firms (especially in Germany and Italy), firms with multiple blockholders
and firms controlled by non-family foundations, depressing the relative share of family firms.
4.2 Survival of Family Ownership, 1996 to 2006
Having established differences between family firms across the four countries, we now examine
the evolution of ownership structures to test the life cycle hypotheses. Do family firms have a
lower chance of survival in outsider compared to insider systems?
For this purpose, we trace the history of each company from 1996 to 2006. We first
determine whether a firm still exists in 2006 (‘survivors’) or whether the firm has exited (‘exits’).
In our classification of firms as survivors we do not require them to stay within the top 1,000
firms. For survivors we determine whether ownership has changed as of December 2006. If it
has, we (re)classify companies into the ownership categories previously defined in Section 3. For
exits the reasons for death include: (i) bankruptcy or liquidation and (ii) dissolution of the legal
entity, for example through acquisition.
In Panel A of Table 3 we show that survival patterns differ across countries. The
proportion of companies in our 1996 sample that survived as independent entities in 2006 was
52% in Germany, 70% in France, 65% in the U.K. and 63% in Italy. Of those that survived 35%
remained in the top 1,000 in Germany, 49% in France, 41% in the U.K., and 35% in Italy.

20
Panel B reports the transition matrix from 1996 to 2006, conditional on the firm surviving
as an entity. For tractability we aggregate ownership categories into family controlled, widely
held, state controlled, and others. In the table, stability of control translates into high percentages
on the matrix diagonals. The main conclusion is that, with the exception of family firms in the
U.K., there is considerable stability of ownership across time in all countries. Stability of control
means that firms do not switch from one form of control to another over the decade.
The largest change in family ownership occurs in the U.K. Of all family controlled firms
in 1996 that survived until 2006, only 50% remain family firms in 2006. Family ownership in the
Continental European countries by comparison is much more stable than in the U.K. By 2006,
75% of German family firms survive as family firms and survival rates are 66% and 77% in
France and Italy, respectively. Family control in Continental Europe therefore is on average about
one fifth more stable than in the U.K.
As regards widely held firms, in all four countries widely they predominantly stay widely
held. The likelihood of remaining widely held in 2006 is lowest in Germany at 54%, and it is
highest in Italy at 81%. Of the 46% that did not survive as widely held in Germany, a sixth were
acquired by families, while the others were acquired by other blockholders, including private
equity.
In summary, we find evidence in favor of the hypothesis that family firms have a
significantly lower chance of survival as family-controlled firms in outsider compared with
insider systems.
4.3 Influence of Firm Age on Family Ownership
As discussed in the hypotheses section, a different way to test the life cycle hypothesis is to rely
on cross-sectional differences in firm age across firms. Our hypothesis is that, as firms age, they
are less likely to be family controlled, particularly in outsider systems. We therefore expect firm
age to be negatively correlated with family ownership in the U.K., but not in the Continental
European countries.
Table 4 reports probit regressions in Columns 1 and 2 where the dependent variable is
whether a family controls the firm in 1996. The regressions control for Fama-French industry
fixed effects. Coefficients are reported as marginal effects and standard errors are calculated by
delta method, following Powers (2005), and clustered by country.
21
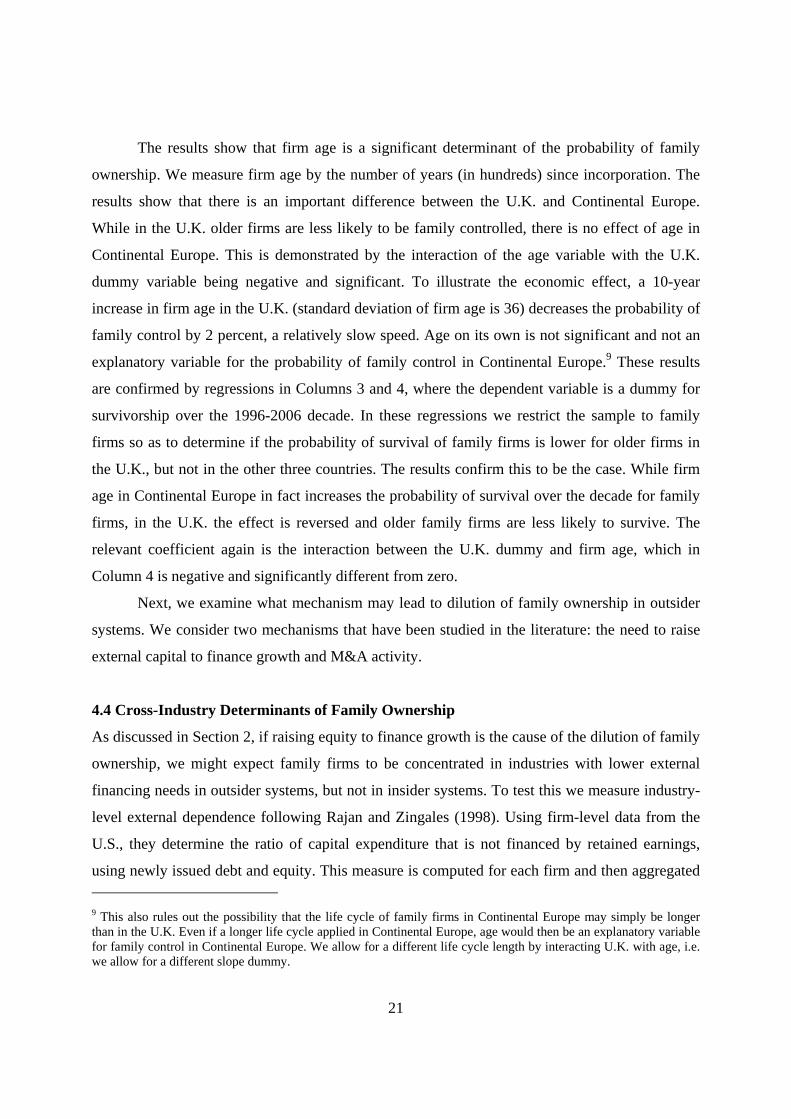
The results show that firm age is a significant determinant of the probability of family
ownership. We measure firm age by the number of years (in hundreds) since incorporation. The
results show that there is an important difference between the U.K. and Continental Europe.
While in the U.K. older firms are less likely to be family controlled, there is no effect of age in
Continental Europe. This is demonstrated by the interaction of the age variable with the U.K.
dummy variable being negative and significant. To illustrate the economic effect, a 10-year
increase in firm age in the U.K. (standard deviation of firm age is 36) decreases the probability of
family control by 2 percent, a relatively slow speed. Age on its own is not significant and not an
explanatory variable for the probability of family control in Continental Europe.9 These results
are confirmed by regressions in Columns 3 and 4, where the dependent variable is a dummy for
survivorship over the 1996-2006 decade. In these regressions we restrict the sample to family
firms so as to determine if the probability of survival of family firms is lower for older firms in
the U.K., but not in the other three countries. The results confirm this to be the case. While firm
age in Continental Europe in fact increases the probability of survival over the decade for family
firms, in the U.K. the effect is reversed and older family firms are less likely to survive. The
relevant coefficient again is the interaction between the U.K. dummy and firm age, which in
Column 4 is negative and significantly different from zero.
Next, we examine what mechanism may lead to dilution of family ownership in outsider
systems. We consider two mechanisms that have been studied in the literature: the need to raise
external capital to finance growth and M&A activity.
4.4 Cross-Industry Determinants of Family Ownership
As discussed in Section 2, if raising equity to finance growth is the cause of the dilution of family
ownership, we might expect family firms to be concentrated in industries with lower external
financing needs in outsider systems, but not in insider systems. To test this we measure industry-
level external dependence following Rajan and Zingales (1998). Using firm-level data from the
U.S., they determine the ratio of capital expenditure that is not financed by retained earnings,
using newly issued debt and equity. This measure is computed for each firm and then aggregated 9 This also rules out the possibility that the life cycle of family firms in Continental Europe may simply be longer than in the U.K. Even if a longer life cycle applied in Continental Europe, age would then be an explanatory variable for family control in Continental Europe. We allow for a different life cycle length by interacting U.K. with age, i.e. we allow for a different slope dummy.

22
at the industry level, and used across countries and industries as a measure of the natural level of
dependence on external finance of the industry. We apply the same methodology using U.S.
COMPUSTAT data from 1987 to 1996 and calculate an external dependence measure for all
Fama-French industries in the TOP 4,000 sample in the four countries. Then, we test whether
family ownership is more common in sectors that are less dependent on external capital.
The results are reported in Table 5, Columns 1 and 3. The dependent variable is a dummy
for whether the firm is family controlled or not in 1996. We find that in the U.K. external
dependence (Ext Dep) is negatively correlated with family control, while no such correlation
exists in the other three countries. This can be seen from the coefficient of the interaction
between the U.K. dummy and external dependence, which is negative and strongly significant.
The probit regressions include industry and country fixed effects. Since external dependence is an
industry-level variable and the regression includes industry fixed effects, we include the
interaction of external dependence with the U.K. dummy variable, but not Ext Dep itself. These
results are confirmed by regressions reported in Columns 4 and 6, where the dependent variable
is a dummy for survivorship over the 1996-2006 decade. In these regressions we restrict the
sample to family firms so as to determine if the probability of survival of family firms is lower in
sectors that have higher dependence on external capital in the U.K., but not in the other three
countries. This prediction is confirmed by the regressions. The relevant coefficient again is the
interaction between the U.K. dummy and external dependence, which in both Columns 4 and 6 is
negative and statistically different from zero.
These results suggest that the external financing hypothesis only applies to the U.K. One
reason might be that family businesses are so important on the Continent that they are able to
shape institutions and overcome financial constraints without giving up control. Evidence
consistent with this in Continental Europe includes the importance of relationship banking (Boot
(1999)), the use of pyramids and business groups (Faccio and Lang (2002)), and families
wielding political power (Bertrand et al. (2004), Faccio (2006)). Hence, unlike their U.K.
counterparts, family firms are able to thrive even in industries with high external financing
needs.10
10 An example of this might be the relative dominance of family ownership in the automotive sector in Continental Europe.

23
If selling the family equity stake is the cause of the dilution of family control, we expect
family firms to be concentrated in industries with lower M&A activity. We test this prediction by
developing an industry-level indicator of M&A activity based on US data, built in a similar
fashion to the measure of external dependence used above. Using SDC data of acquisitions, we
compute the total number of completed acquisition deals of listed companies over the 1987-1996
decade in the U.S. for each Fama-French industry. We scale this by the total number of listed
firms over the same decade by industry (from CRSP), and thus obtain a measure of the degree of
M&A activity in that industry. We then define a dummy variable that equals one for industries
that have above-median M&A activity and zero otherwise, which is our final measure of M&A
activity at the industry level. This measure is akin to a merger wave indicator, as developed by
Mitchell and Mulherin (1996) and Harford (2005). The prediction is that family ownership
should be lower in industries that have experienced a merger wave in the previous decade, and
particularly so in outsider countries.11
The results are reported in Columns 2 and 3 of Table 5. The dependent variable is a
dummy for whether the firm is family controlled or not in 1996. Consistent with our previous
results, we find that in the U.K. M&A activity is negatively correlated with family control, while
no such correlation exists in the other three countries. This can be seen from the coefficient of the
interaction between the U.K. dummy and M&A activity, which is negative and strongly
significant. The probit regressions include industry and country fixed effects. These results are
confirmed by regressions reported in Columns 5 and 6, where the dependent variable is a dummy
for survivorship over the 1996-2006 decade. The results show that the probability of survival is
lower in sectors that have high M&A activity in the U.K., but not in the other three countries. The
coefficient of the interaction between the U.K. dummy and M&A activity is negative and
statistically different from zero.
In summary, we find that raising external capital and engaging in M&A activity is
associated with dilution of family ownership in the U.K., but not in Continental Europe. While
we find significant industry concentration of family firms in all countries, this industry
concentration is unrelated to financing needs for family firms in Continental Europe, while in the 11 Our industry-level M&A activity measure on its own of course is a relatively crude test. M&A activity may not be a good proxy for the market for corporate control in family firms. For example, in Continental Europe the sale of smaller stakes might be an important part of the market for corporate control and would not be captured by our data. In Section 4.5 we analyze the source of control changes for the FAMILY LISTED sample in more detail.

24
U.K. high external financing needs reduce the probability of observing family control. Further,
Continental European family firms do not exhibit slower growth than their U.K. peers over the
1996-2006 period, suggesting that family businesses are able to overcome financial constraints in
Continental Europe without giving up control.12
4.5 Listed Family Firms
In this section we study our second LISTED FAMILY sample of companies consisting of all
family-controlled listed firms in 1996 in our four countries. We use this sample to explore in
greater detail the evolution of ownership in family firms. Specifically, we can now be more
precise about the reasons why a family firm does not survive over the decade, distinguishing
between takeovers, going private, dilution of control and insolvency. This allows us to test more
precisely the hypothesis that differences in the efficiency of the market for corporate control are
at the source of the differences in the evolution of family firms in outsider and insider countries.
We also analyze how family characteristics such as the CEO being a family member affect
survival as a family firm.
For each of the 827 listed firms in the sample, we collected information on the name of
the controlling family and whether it descended directly from the firm’s founder. As shown in
Panel A of Table 6, this is true for almost 70 percent of family firms across all four countries.
There are interesting differences across countries: 91.2 percent of U.K. family firms are
controlled by a descendant of the founder while in half of the cases German companies are
controlled by a different family than the founding family. This suggests that families (or their
12 We reject the competing hypothesis that firms in Continental Europe in industries with high external financial dependence and high M&A activity simply avoid raising external financing or engaging in M&A activity and choose to stay small and grow less. We perform two types of tests. First, we run regressions as in Table 5 but with firm size (log of sales) as the dependent variable and the sample restricted to family firms. If Continental European family firms in industries with high external dependence avoid raising external financing or engaging in M&A activity, they should be smaller than their U.K. competitors in the same sectors. However, we find the opposite result, namely family firms in sectors with higher external dependence are larger in Continental Europe than their U.K. competitors, rejecting the competing hypothesis. Second, we use the relative size ranking of family firms that survive the 1996 to 2006 period. Firms that belonged to the largest 1,000 firms in 1996 may or may not belong to the largest 1,000 firms in 2006. If in Continental Europe family firms in industries with high external dependence or high M&A activity avoid external financing and mergers and acquisitions, we would expect surviving family firms to end up lower in the Top 1,000 ranking (or below the Top 1,000) in 2006 than surviving non-family firms. We find however that no such difference exists, again rejecting the hypothesis of lower growth in Continental European family firms.

25
firms) are very active as acquirers of other family companies in Germany (and in the rest of
Continental Europe) but not at all in the U.K.13
We also identify the cases where the CEO is a family member, where control is divided
among more than one individual, where the firm has dual class shares outstanding, where control
is exercised via a pyramid, as well as the age of the firm and which generation of family members
is in control of the company. We also record the ratio of cash-flow to voting rights of the family,
the size of its stake as well as return on sales.
In the U.K. and in Italy, family firms are younger and are more often run by the founder
than in France and Germany. Also, t-tests of equality of means between the U.K. and Continental
Europe (whose p-values are reported in Panel A of Table 6) show that Continental European
firms are less likely to have a family CEO, family stakes are held more often by several family
members, more control is exercised via pyramids, and there are lower cash-flow to voting rights
ratios and higher family voting stakes in 1996.
Furthermore, we have collected information on the history of each firm in the period
1996-2006. By 2006, a firm may still be in family control or may have been taken private by the
controlling family. We classify these two outcomes together as no change of control.
Alternatively, the firm may have become widely held, insolvent or may have been taken over or
acquired. In Panel B these three outcomes are combined and classified as a change of control. We
find that almost half of our companies have undergone a change of control. In the U.K., 70
percent of family firms went through a change of control (having become widely held or
acquired) compared with only 27 percent of firms in Italy, 49 percent in Germany and 41 percent
in France. The differences in the frequency of control changes confirm our life cycle results:
family firms in the U.K. are significantly more likely to experience a change of control than their
Continental European counterparts. The most common reason for family firms to change their
form of ownership is a takeover. Selling the family equity stake is thus an important channel
through which family control is diluted. The second most common reason for ownership changes
in the U.K. is for family firms to become widely held, without a takeover: this happens in 37% of
all control changes in the U.K., while it happens in only 10 to 20 percent of control changes in
13 As an example, in July 2008 Schaeffler Group, a private company owned by the German Schaeffler family, acquired a majority stake in Continental AG, a large German tire manufacturer that was previously widely-held, for about 12 billion Euro. Such a transaction by a family-controlled firm would be almost unconceivable in the U.K.
26
the other three countries. This confirms raising external capital as an important channel for
dilution of family control in the U.K.
Having established the differences in family firm characteristics and control changes over
time, we turn to a multivariate analysis of these control changes in family firms. Specifically, we
investigate which family characteristics most influence the likelihood of survival of a family
firm. These characteristics include whether family control involves a pyramid, the family that is
in control in 1996 is the founding family, control is divided among family members, the size of
the block held by the family, the CEO is a family member, there is a wedge between the family’s
cash-flow rights and voting rights, and which generation of the family is in control.
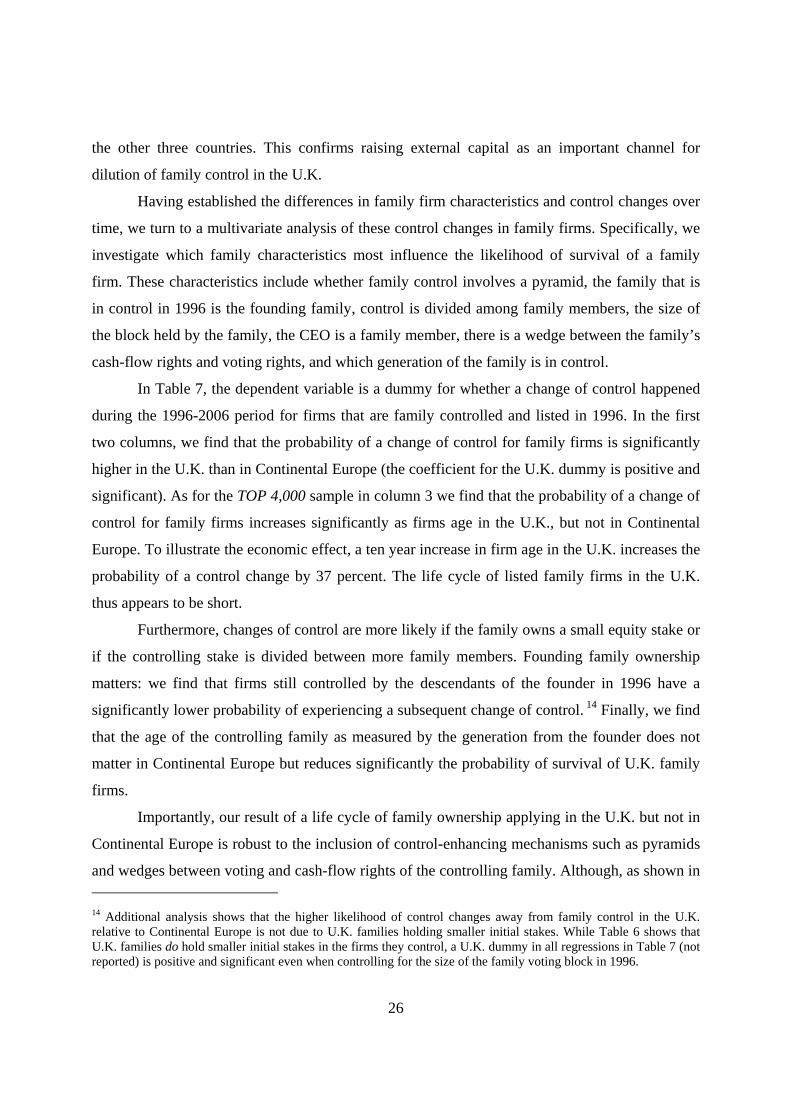
In Table 7, the dependent variable is a dummy for whether a change of control happened
during the 1996-2006 period for firms that are family controlled and listed in 1996. In the first
two columns, we find that the probability of a change of control for family firms is significantly
higher in the U.K. than in Continental Europe (the coefficient for the U.K. dummy is positive and
significant). As for the TOP 4,000 sample in column 3 we find that the probability of a change of
control for family firms increases significantly as firms age in the U.K., but not in Continental
Europe. To illustrate the economic effect, a ten year increase in firm age in the U.K. increases the
probability of a control change by 37 percent. The life cycle of listed family firms in the U.K.
thus appears to be short.
Furthermore, changes of control are more likely if the family owns a small equity stake or
if the controlling stake is divided between more family members. Founding family ownership
matters: we find that firms still controlled by the descendants of the founder in 1996 have a
significantly lower probability of experiencing a subsequent change of control. 14 Finally, we find
that the age of the controlling family as measured by the generation from the founder does not
matter in Continental Europe but reduces significantly the probability of survival of U.K. family
firms.
Importantly, our result of a life cycle of family ownership applying in the U.K. but not in
Continental Europe is robust to the inclusion of control-enhancing mechanisms such as pyramids
and wedges between voting and cash-flow rights of the controlling family. Although, as shown in 14 Additional analysis shows that the higher likelihood of control changes away from family control in the U.K. relative to Continental Europe is not due to U.K. families holding smaller initial stakes. While Table 6 shows that U.K. families do hold smaller initial stakes in the firms they control, a U.K. dummy in all regressions in Table 7 (not reported) is positive and significant even when controlling for the size of the family voting block in 1996.

27
Table 6, pyramids and control wedges are used significantly more often in Continental Europe
than in the U.K., they explain very little of the probability of a change of control from family to
non-family in our sample. Both mechanisms have the expected negative sign, but the pyramids
coefficient is never significant and the control wedge coefficient is marginally significant only in
Column 4. This result matters, because the life-cycle result, that family ownership declines over
time in the U.K. but not in Continental Europe, might simply be due to the greater use of such
control mechanisms in Continental Europe relative to the U.K. Our results indicate that the
survival of family firms in Continental Europe is not driven by the use of control-enhancing
mechanisms.15 As described in the literature review, previous results have recorded
underperformance of firms employing control devices; even more strikingly, we now find that
they do not even make family control more durable.
An interesting result is our finding that if the family stake is divided between at least two
family members, there is a higher likelihood of a control transfer over the following decade. This
may be an indication that dispersion of blocks among family members may lead to conflicts
within the family over control and ultimately to a sale of the business itself: for instance, one
family member may extract private benefits of control at the cost of the other family members
and the minority shareholders. This is consistent with the finding for Thai business groups in
Bertrand et al. (2008), where dividing the family business among more descendants leads to
lower subsequent performance.
Our key result from Table 4 is that age is a good predictor of changes of control in the
U.K. but not in Continental Europe. This result was obtained from the sample of the largest 1,000
private and listed firms from each country and, given that our selection criterion is size, we may
be introducing a survivorship bias in our analysis. In this section, we can test the life cycle
hypothesis on a different sample: the universe of listed family firms. In Columns 2 and 3 of Table
7, we check whether family generation and firm age have a differential impact on the probability
of changes of control in the U.K. compared to Continental Europe. Our results confirm those in
15 These results are related to the growing literature on the relation between family characteristics within family firms and performance. We confirm the results in Anderson and Reeb (2003) and Barontini and Caprio (2005) that founding family control is positively related to performance. However, we do not find evidence that second or higher generations are associated with higher chances of control changes. This result is potentially in conflict with the existing evidence that passing control from founder to descendants is associated with a reduction in performance (Pérez-González (2006), Villalonga and Amit (2006), and Morck, Strangeland and Yeung, (2000)).

28
Table 4, changes of control are more likely in family firms after the first generation and in older
firms in the U.K., whereas they are less likely after the first generation and in older firms in
Continental Europe.
In Column 4, we add return on sales and firm size (as measured by the log of sales) to the
specification estimated in Column 1. We find that changes in control are less likely in larger
companies and that poorly performing companies are more likely to experience a change of
control (although the result is not statistically significant).
5. Cross-Sectional Evidence from 27 Countries
In this section we test the robustness of our results on a much larger number of countries using
the ownership structure of private and listed firms in the ALL FIRM data set. First, we examine
firm age as the determinant of family control. Second, we assess the explanatory power of
external financing needs and M&A activity for family control. Third, we consider the differences
in profitability between family and non-family firms, in outsider versus insider systems.
5.1 Life Cycle Hypothesis
Our first hypothesis is that, as they age, firms are less likely to be family controlled in outsider
systems versus insider systems. We therefore expect firm age to be negatively correlated with
family ownership, particularly in countries with high scores of the Outsider index.
Table 8 reports descriptive statistics for each country in 2006 in Panel A. The median
sample firm is private, 18 years old, with EUR 122 million sales, EUR 83 million assets and 370
employees. Panel B shows univariate correlations between the family control dummy variable
and firm age, firm size as well as industry-level external dependence, M&A activity and the
country-level Outsider index in Panel A.
Panel B reports probit regressions where the dependent variable is the family control
dummy variable. The regressions control for country and Fama-French industry fixed effects.
Coefficients are reported as marginal effects and standard errors (in square brackets) are
calculated by delta method and clustered at the country level. External dependence and M&A
activity are calculated at the Fama-French industry level as in Table 5. Because ownership
information is for 2006, we compute external dependence using data from the 1997-2006 period
(instead than the 1987-1996 period as done before).

29
In Column 1, we show that on average there is no correlation between firm age on its own
and family ownership. However, we find that the coefficient on the product of (Firm age) x
(Outsider) is negative and statistically significant. The effect is economically significant: an
increase by 27 years (which is one standard deviation of firm age) in a country such as the U.K.
(which has an Outsider score of 1.19) is associated with a 4-percent larger decline in the
probability of family ownership than a similar increase in firm age in Austria (which has an
Outsider score of -0.9).
In Column 2, we test whether family firms are more likely to survive in industries with
lower dependence on external finance. Since external dependence is an industry-level variable
and the regression includes industry fixed effects, we include the interaction of external
dependence with the Outsider index, but not Ext Dep itself. As in Table 5, we again find a
negative correlation between external dependence (Ext Dep) and family ownership in outsider
countries: The negative interaction (OUT) x (Ext Dep) coefficient shows that family firms are
less common in industries that are more dependent on external capital in countries with a higher
Outsider index.
In Column 3, we test whether family firms are more likely to survive in industries with
less M&A activity. As before, we find a negative correlation between M&A activity (M&A Act)
and family ownership in countries with a higher Outsider index, as the interaction (OUT) x
(M&A Act) has a significantly negative coefficient.
In Column 4 we include all three interactions terms. The results are unchanged and all
coefficients remain negative and significant, showing that the effects of external dependence and
M&A activity are distinct influences on family ownership.
As a robustness test, we also re-run all regressions in Table 8 without industry fixed
effects and add external dependence, and M&A activity as industry-level variables, while
keeping the interaction terms. The results (not reported) show that all three industry-level
variables have negative coefficients and are significant at the 1 percent level or better, while
coefficients of the interactions are unchanged. As a further test we also construct an interaction of
firm age and our inheritance tax variable and include it in regressions similar to those in Columns
1 to 4. The coefficient of the interaction is always negative but never significant, suggesting that
our measure of inheritance tax does not influence the life cycle of family ownership. Since our
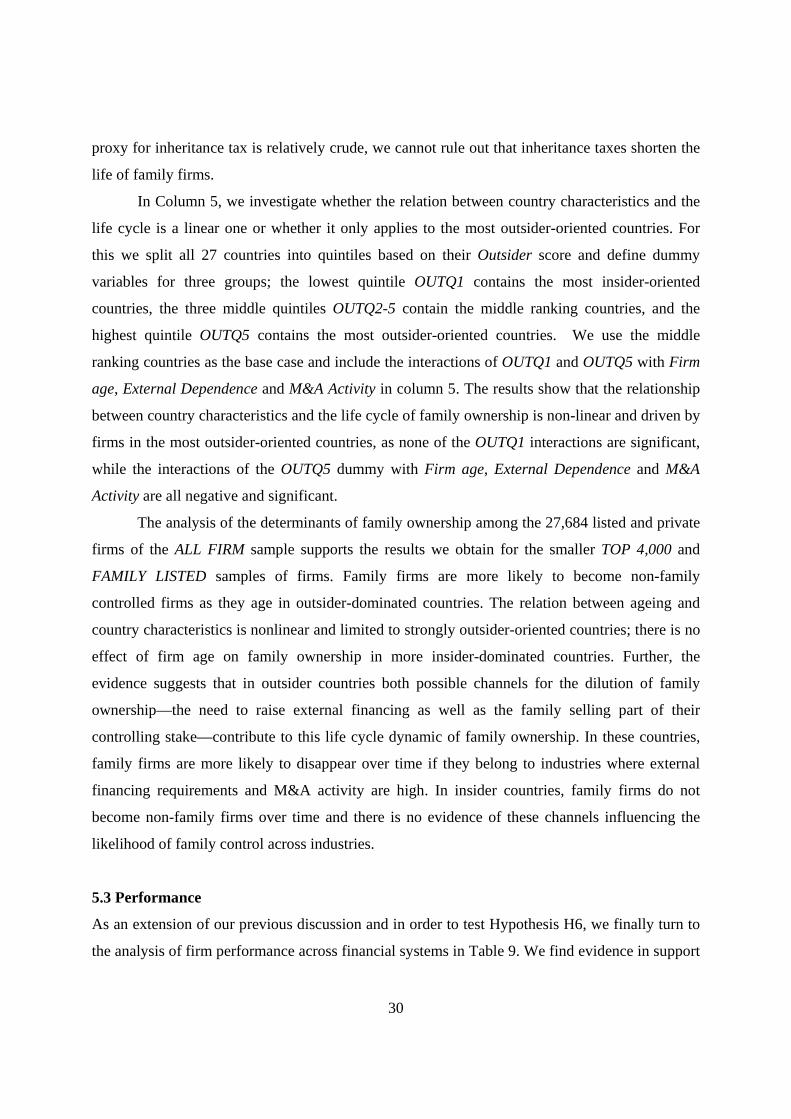
30
proxy for inheritance tax is relatively crude, we cannot rule out that inheritance taxes shorten the
life of family firms.
In Column 5, we investigate whether the relation between country characteristics and the
life cycle is a linear one or whether it only applies to the most outsider-oriented countries. For
this we split all 27 countries into quintiles based on their Outsider score and define dummy
variables for three groups; the lowest quintile OUTQ1 contains the most insider-oriented
countries, the three middle quintiles OUTQ2-5 contain the middle ranking countries, and the
highest quintile OUTQ5 contains the most outsider-oriented countries. We use the middle
ranking countries as the base case and include the interactions of OUTQ1 and OUTQ5 with Firm
age, External Dependence and M&A Activity in column 5. The results show that the relationship
between country characteristics and the life cycle of family ownership is non-linear and driven by
firms in the most outsider-oriented countries, as none of the OUTQ1 interactions are significant,
while the interactions of the OUTQ5 dummy with Firm age, External Dependence and M&A
Activity are all negative and significant.
The analysis of the determinants of family ownership among the 27,684 listed and private
firms of the ALL FIRM sample supports the results we obtain for the smaller TOP 4,000 and
FAMILY LISTED samples of firms. Family firms are more likely to become non-family
controlled firms as they age in outsider-dominated countries. The relation between ageing and
country characteristics is nonlinear and limited to strongly outsider-oriented countries; there is no
effect of firm age on family ownership in more insider-dominated countries. Further, the
evidence suggests that in outsider countries both possible channels for the dilution of family
ownership—the need to raise external financing as well as the family selling part of their
controlling stake—contribute to this life cycle dynamic of family ownership. In these countries,
family firms are more likely to disappear over time if they belong to industries where external
financing requirements and M&A activity are high. In insider countries, family firms do not
become non-family firms over time and there is no evidence of these channels influencing the
likelihood of family control across industries.
5.3 Performance
As an extension of our previous discussion and in order to test Hypothesis H6, we finally turn to
the analysis of firm performance across financial systems in Table 9. We find evidence in support

31
of the view that the dominant form of ownership alters institutions to their own advantage: family
firms are more profitable than non-family firms in insider countries but not in outsider countries.
Related to our earlier results, higher profitability of family firms in insider systems in turn
increases the availability of internal financing and may thus further reduce the importance of
external financing on family control in insider countries. We test the hypothesis for the 27,652
firms in the ALL FIRM sample in Columns 1 to 3 and for the largest 4,000 firms in the TOP
4,000 sample in Column 4.
We consider three measures of performance, return on equity, return on sales and return
on assets. In Panel A, on average we find that family firms have a higher return on equity than
non-family ones. This difference in performance disappears in countries with a higher Outsider
index. This result is consistent with hypothesis H6, which states that family firms are more
profitable in countries with lower Outsider index.
In Panel B, we use return on sales as the measure of profitability. In this case, we do not
find any difference in profitability on average between family and non-family firms. However, in
more outsider countries family firms are less profitable than other firms, which may be consistent
with hypothesis H6. Results are weaker in Panel C, where return on assets is the performance
measure.
To illustrate the economic effect of these results, compare the relative profitability of
family versus non-family firms in Austria (with a low Outsider score of -0.9) and Ireland (with a
high Outsider score of 1) in Column 1. In Austria, family firms are more profitable than non-
family ones: the difference is 4.92 percent (ROE), 0.90 percent (ROS), and 0.59 percent (ROA).
Conversely, in Ireland family firms are less or similarly profitable than non-family firms: the
difference is -0.4 percent (ROE), -1.0 percent (ROS), and exactly +0.4 percent for ROA. These
differences, based on all firms in Column 1, extend with similar coefficients to listed firms only
in Column 2, private firms only in Column 3, and to the TOP 4,000 firms in Column 4.
6. Conclusion
The striking feature to emerge from this paper is that, while the life cycle theory is one of the
most widely cited “stylized facts” about the firm, it receives little support from the extensive
analysis of this paper. It applies in some countries, but in many it is weak and slow. Basically it
reflects a dilution of family ownership where a large amount of external equity is raised or there
32
is an active market for corporate control. In industries or countries where these do not occur then
family ownership persists, even in the absence of control devices such as pyramids and dual class
shares.
What has made the emergence of these insights possible in this paper is a combination of
three things. First, we have had access to data on private as well as listed companies. Since
private firms account for more than 80 percent of the top 1,000 companies in France, Germany
and Italy, their exclusion from previous analyses has been a serious omission. Second, we have
been able to trace through ownership to its ultimate source, even in cases where it is held via
private firms. The previous attribution of ownership in these cases to concentrated family
holdings has been found to be frequently incorrect. Third, and perhaps most significantly, we
have been able to supplement cross-section analyses of the nature of ownership at a particular
point in time in a large number of countries with more detailed panels of evolution over time.
This is important in light of the large amount of control changes that occur in some but not all
circumstances in a relatively short space of time.
Previous studies have reported the superior performance of family controlled firms in the
absence of such control mechanisms as pyramids and dual class shares. This paper has observed
the superior performance of family relative to dispersed ownership firms in insider but not
outsider systems. These observations combined with the conclusion that equity markets dilute
and extinguish family ownership in some but by no means all countries and industries suggests
the potential co-existence of different ownership and control structures. Where financing and
control can be achieved without stock markets or special control devices then family ownership is
a powerful and persistent arrangement. Where it cannot then family ownership is rapidly
extinguished and superior equity market related ownership patterns emerge. Consistent with the
previous literature, this paper suggests the more successful transfer of family ownership across
generations in some, namely insider, systems than other outsider systems. Whether overall one
system dominates another and convergence on one system in preference to another is to be
expected still remains to be answered.
33
References
Aganin, Alexander, and Paolo Volpin, 2005. “The History of Corporate Ownership in Italy,” in: Randall K. Morck ed., The History of Corporate Governance Around the World, University of Chicago Press, 325-361.
Almeida, Heitor, Sang Yong Park, Marti Subrahmanyam, and Daniel Wolfenzon, 2008. “Beyond Cash Flow and Voting Rights: Valuation and Performance of Firms in Complex Ownership Structures,” Working Paper University of Illinois at Urbana-Champaign.
Anderson, Ronald and David Reeb, 2003. “Founding Family Ownership and Firm Performance,” Journal of Finance 58, 1301-1328.
Andrade, Gregor, Mark Mitchell and Erik Stafford, 2001. “New Evidence and Perspectives on Mergers,” Journal of Economic Perspectives 15, 103-120.
Barca, Fabrizio and Marco Becht, 2001. The Control of Corporate Europe, Oxford University Press, Oxford, U.K.
Barontini, Roberto, and Lorenzo Caprio, 2005. “The Effect of Family Control on Firm Value and Performance. Evidence from Continental Europe,” ECGI Working Paper 88.
Becht, Marco, Julian Franks, Colin Mayer, and Stefano Rossi, 2009. “"Returns to Shareholder Activism: Evidence from a Clinical Study of the Hermes UK Focus Fund," Review of Financial Studies 22, 3093-3129.
Bennedsen, Morten, Kasper M. Nielsen, Francisco Pérez-González, and Daniel Wolfenzon, 2007. “Inside the Family Firm: the Role of Families in Succession Decisions and Performance,” Quarterly Journal of Economics 122, 647-691.
Berle, A. A. Jr. and G. C. Means, 1932. The Modern Corporation and Private Property. Macmillan, New York, N.Y.
Bertrand, Marianne, Paras Mehta and Sendhil Mullainathan, 2002. “Ferreting Out Tunneling: An Application to Indian Business Groups,” Quarterly Journal of Economics 117, 121-148.
Bertrand, Marianne, Francis Kramarz, Antoinette Schoar and David Themsar, 2004. “Politically Connected CEOs and Corporate Outcomes: Evidence from France,” Working Paper University of Chicago.
Bertrand, Marianne, Simon Johnson, Krislert Samphantharak and Antoinette Schoar, 2008. “Mixing Family with Business: A Study of Thai Business Groups and the Families Behind Them,” Journal of Financial Economics 88, 466-498.
Black, Bernard S., and John C. Coffee, 1994. “Hail Britannia?: Institutional Investor Behavior under Limited Regulation,” Michigan Law Review 92, 1997-2087.
34
Bloom, Nick and John Van Reenen, 2007. “Measuring and Explaining Management Practices across Firms and Countries,” Quarterly Journal of Economics 122, 1351-1408.
Boot, Arnoud, 1999. “Relationship Banking: What Do We Know?” Journal of Financial Intermediation 9, 7-25.
Chandler, Alfred, 1977. The Visible Hand. The Managerial Revolution in American Business. Belknap Harvard, Cambridge, MA.
Claessens, Stijn, Simeon Djankov, Joseph Fan, and Larry Lang, 2002. “Disentangling the Incentive and Entrenchment Effects of Large Shareholdings,” Journal of Finance 57, 2741-2771.
Claessens, Stijn, Simeon Djankov and Larry Lang, 2000. “Separation of Ownership from Control of East Asian Firms,” Journal of Financial Economics 58, 81–112.
DeMarzo, Peter, and Branko Urosevic, 2006, “Ownership Dynamics and Asset Pricing with a Large Shareholder,” Journal of Political Economy 114, 774-815.
Djankov, Simeon, Rafael La Porta, Florencio Lopez-de-Silanes, and Andrei Shleifer, 2008. “The Law and Economics of Self Dealing Comparison,” Journal of Financial Economics 88, 430-465.
Dyck, Alexander, Luigi Zingales, 2004. “Private Benefits of Control: an International Comparison,” Journal of Finance 59, 537-600.
Ellul, Andrew, Marco Pagano and Fausto Panunzi, 2008. “Inheritence Law and Investment in Family Firms,” Working Paper Indiana University Bloomington. Faccio, Mara, 2006. "Politically Connected Firms," American Economic Review 96, 369-386.
Faccio, Mara, and Larry H.P. Lang, 2002. “The Ultimate Ownership of Western European Corporations,” Journal of Financial Economics 65, 365-395.
Foley, C. Fritz, and Robin Greenwood, 2010. “The Evolution of Corporate Ownership after IPO: The Impact of Investor Protection,” Review of Financial Studies 23, 1231-1260.
Franks, Julian, Colin Mayer and Stefano Rossi, 2009. “Ownership: Evolution and Regulation,” Review of Financial Studies 22, 4009-4056.
Giannetti, Mariassunta, 2003. "Do Better Institutions Mitigate Agency Problems? Evidence from Corporate Finance Choices," Journal of Financial and Quantitative Analysis 38, 185-212.
Harford, Jarrad, 2005. “What Drives Merger Waves?”, Journal of Financial Economics 77, 529-560.
Helwege, Jean, Christo Pirinsky and Rene Stulz. 2007. “Why Do Firms Become Widely Held? An Analysis of the Dynamics of Corporate Ownership,” Journal of Finance 62, 995-1028.

35
John, Kose and Simi Kedia, 2006. “Institutions, Markets and Growth: A Theory of Comparative Corporate Governance,” Working Paper New York University.
Khanna, Tarun and Krishna Palepu, 2000. “Is Group Affiliation Profitable in Emerging Markets? An Analysis of Diversified Indian Business Groups,” Journal of Finance 55, 867–891.
Klapper, Leora, Luc Laeven and Raghuram Rajan, 2006. "Entry Regulation as a Barrier to Entrepreneurship," Journal of Financial Economics 82, 591-629.
La Porta, Rafael, Florencio Lopez-de-Silanes, Andrei Shleifer and Robert W. Vishny, 1997. "Legal Determinants of External Finance," Journal of Finance 52, 1131-50.
La Porta, Rafael, Florencio Lopez-de-Silanes, Andrei Shleifer and Robert W. Vishny, 1998. “Law and Finance,” Journal of Political Economy 101, 678-709.
La Porta, Rafael, Florencio Lopez-de-Silanes and Andrei Shleifer, 1999. “Corporate Ownership Around the World,” Journal of Finance 54, 471-517.
Mayer, Colin, 1988. “New Issues in Corporate Finance,” European Economic Review 32, 1167-1183.
Mitchell, Mark L. and Mulherin, J. Harold, 1996. "The Impact of Industry Shocks on Takeover and Restructuring Activity," Journal of Financial Economics 41, 193-229.
Morck, Randall, David Strangeland and Bernard Yeung, 2000. “Inherited Wealth, Corporate Control, and Economic Growth: The Canadian Disease,” in Randall Morck (ed.), Concentrated Corporate Ownership, NBER Conference Volume, Cambridge, MA.
Morck, Randall and Bernard Yeung, 2003. “Agency Problems in Large Family Business Groups,” Entrepreneurship Theory and Practice 27, 367-382.
Morck, Randall, Daniel Wolfenzon, and Bernard Yeung. 2005. “Corporate Governance, Economic Entrenchment and Growth,” Journal of Economic Literature 43, 655-720.
Nenova, Tatiana, 2003. “The Value of Corporate Voting Rights and Control: A Cross-Country Analysis,” Journal of Financial Economics 68, 325-351.
Pérez-González, Francisco, 2006. “Inherited Control and Firm Performance,” American Economic Review 96, 1559-1588.
Powers, Eric A., 2005. “Interpreting Logit Regressions with Interaction Terms: An Application to the Management Turnover Literatur,” Journal of Corporate Finance 11, 504-522.
Rajan, Raghuram G. and Luigi Zingales, 1998. “Financial Dependence and Growth,” American Economic Review 88, 559-586.
Rossi, Stefano, and Paolo Volpin, 2004. “Cross-Country Determinants of Mergers and Acquisitions,” Journal of Financial Economics 74, 277-304.

36
Sraer, David and David Thesmar. 2007. “Performance and Behavior of Family Firms: Evidence From the French Stock Market,” Journal of the European Economic Association 5, 709-751.
Tsoutsoura, Margarita, 2009. “The Effect of Succession Taxes on Family Firm Investment: Evidence from a Natural Experiment,” Working Paper Columbia University.
Villalonga, Belen, and Raphael Amit, 2006. “How do Family Ownership, Control and Management Affect Firm Value?,” Journal of Financial Economics 80, 385-417.
Villalonga, Belen and Raphael Amit, 2008. “Family Control of Firms and Industries,” Working Paper Harvard University.
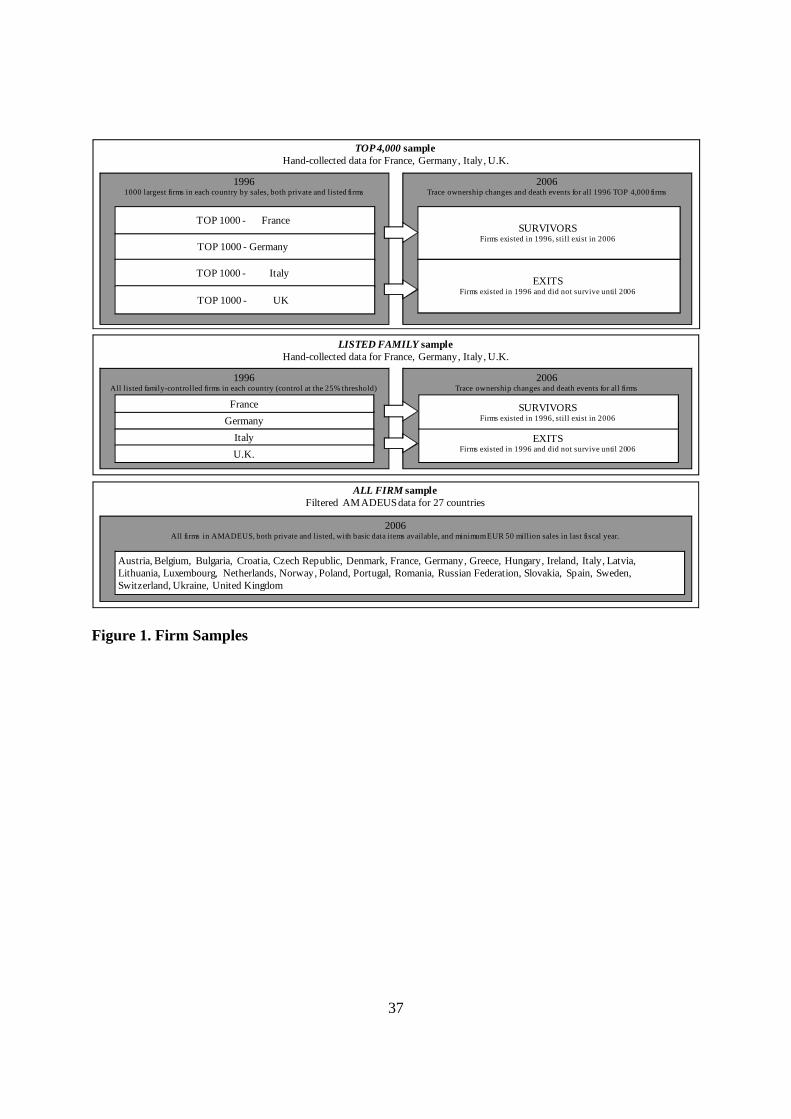
37
19961000 largest firms in each country by sales, both private and listed firms
TOP 1000 - Germany
TOP 1000 - France
TOP 1000 - Italy
TOP 1000 - UK
2006Trace ownership changes and death events for all 1996 TOP 4,000 firms
EXITS Firms existed in 1996 and did not survive until 2006
SURVIVORS Firms existed in 1996, still exist in 2006
TOP 4,000 sampleHand-collected data for France, Germany, Italy, U.K.
ALL FIRM sampleFiltered AMADEUS data for 27 countries
2006 All firms in AMADEUS, both private and listed, with basic data items available, and minimum EUR 50 million sales in last fiscal year.
Austria, Belgium, Bulgaria, Croatia, Czech Republic, Denmark, France, Germany, Greece, Hungary, Ireland, Italy, Latvia, Lithuania, Luxembourg, Netherlands, Norway, Poland, Portugal, Romania, Russian Federation, Slovakia, Spain, Sweden, Switzerland, Ukraine, United Kingdom
LISTED FAMILY sampleHand-collected data for France, Germany, Italy, U.K.
1996All listed family-controlled firms in each country (control at the 25% threshold)
Germany
France
Italy
U.K.
2006Trace ownership changes and death events for all firms
EXITS Firms existed in 1996 and did not survive until 2006
SURVIVORS Firms existed in 1996, still exist in 2006
Figure 1. Firm Samples

38
Table 1. The Landscape of Ownership This table reports percentages of ownership types for the largest 1,000 firms by sales in France, Germany, Italy and the U.K. in 1996, i.e. the TOP 4,000 sample. Panel A reports all firms with available ownership data. Panel B reports all firms that meet the criterion of Panel A and splits domestic and foreign block shareholder categories. In Panel C foreign ownership is redistributed into the other ownership categories. Numbers may not add to 100 percent due to rounding.
Panel A: Ownership status of largest 1,000 firms Ownership types (in percent) Germany France U.K. Italy Total Multiple blocks 4.4% 2.0% 0.3% 2.0% 2.1%Family 35.9% 38.4% 10.9% 47.9% 33.1%Foreign 18.4% 20.6% 33.9% 27.6% 25.2%Other 2.1% 3.2% 2.8% 2.2% 2.6%State 12.1% 8.8% 1.0% 12.5% 8.5%Widely held 9.9% 8.9% 27.4% 5.6% 13.0%Widely held parent 17.2% 18.2% 23.7% 2.3% 15.4%
TOTAL number of firms 923 970 980 954 3827
Panel B: Ownership status of largest 1,000 firms, domestic and foreign blockholders separated Ownership types (in percent) Germany France U.K. Italy Total
Domestic block shareholder Multiple blocks 3.9% 1.9% 0.3% 1.7% 1.9%Family 30.6% 28.7% 7.3% 40.5% 26.6%Other 1.4% 2.6% 1.7% 2.2% 2.0%State 10.0% 6.8% 0.8% 8.2% 6.4%Widely held parent 8.2% 7.5% 3.7% 1.7% 5.3%Total 54.1% 47.5% 13.8% 54.3% 42.2%
Foreign block shareholder Family 2.6% 4.0% 7.4% 2.7% 4.2%State 1.1% 0.6% 0.5% 0.1% 0.6%Widely held parent 10.5% 9.4% 14.5% 13.4% 12.0%Total 14.2% 14.0% 22.4% 16.2% 16.8%
Parent with 95% control 22.6% 29.9% 36.3% 24.0% 28.3% Widely held 9.1% 8.7% 27.3% 5.6% 12.8%
TOTAL number of firms 923 970 980 954 3827
Panel C: Ownership status of largest 1,000 firms, foreign and domestic blockholders combined Ownership types (in percent) Germany France U.K. Italy Total Multiple blocks 4.4% 2.0% 0.3% 2.0% 2.1%Family 38.6% 43.8% 21.0% 53.1% 39.0%Other 2.1% 3.2% 2.8% 2.2% 2.6%State 13.5% 10.1% 2.0% 12.7% 9.5%Widely held 9.9% 8.9% 27.4% 5.6% 13.0%Widely held parent 31.5% 32.1% 46.4% 24.4% 33.7%
TOTAL number of firms 923 970 980 954 3827
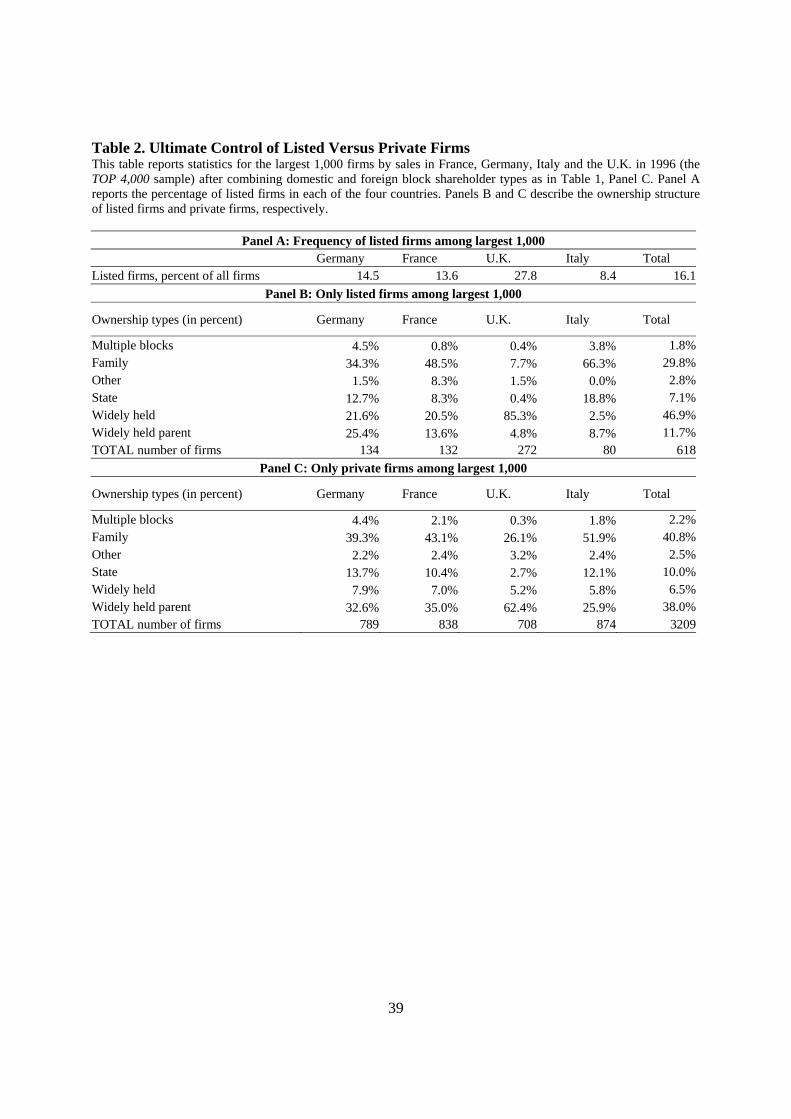
39
Table 2. Ultimate Control of Listed Versus Private Firms This table reports statistics for the largest 1,000 firms by sales in France, Germany, Italy and the U.K. in 1996 (the TOP 4,000 sample) after combining domestic and foreign block shareholder types as in Table 1, Panel C. Panel A reports the percentage of listed firms in each of the four countries. Panels B and C describe the ownership structure of listed firms and private firms, respectively.
Panel A: Frequency of listed firms among largest 1,000 Germany France U.K. Italy Total Listed firms, percent of all firms 14.5 13.6 27.8 8.4 16.1
Panel B: Only listed firms among largest 1,000
Ownership types (in percent) Germany France U.K. Italy Total
Multiple blocks 4.5% 0.8% 0.4% 3.8% 1.8%Family 34.3% 48.5% 7.7% 66.3% 29.8%Other 1.5% 8.3% 1.5% 0.0% 2.8%State 12.7% 8.3% 0.4% 18.8% 7.1%Widely held 21.6% 20.5% 85.3% 2.5% 46.9%Widely held parent 25.4% 13.6% 4.8% 8.7% 11.7%TOTAL number of firms 134 132 272 80 618
Panel C: Only private firms among largest 1,000
Ownership types (in percent) Germany France U.K. Italy Total
Multiple blocks 4.4% 2.1% 0.3% 1.8% 2.2%Family 39.3% 43.1% 26.1% 51.9% 40.8%Other 2.2% 2.4% 3.2% 2.4% 2.5%State 13.7% 10.4% 2.7% 12.1% 10.0%Widely held 7.9% 7.0% 5.2% 5.8% 6.5%Widely held parent 32.6% 35.0% 62.4% 25.9% 38.0%TOTAL number of firms 789 838 708 874 3209
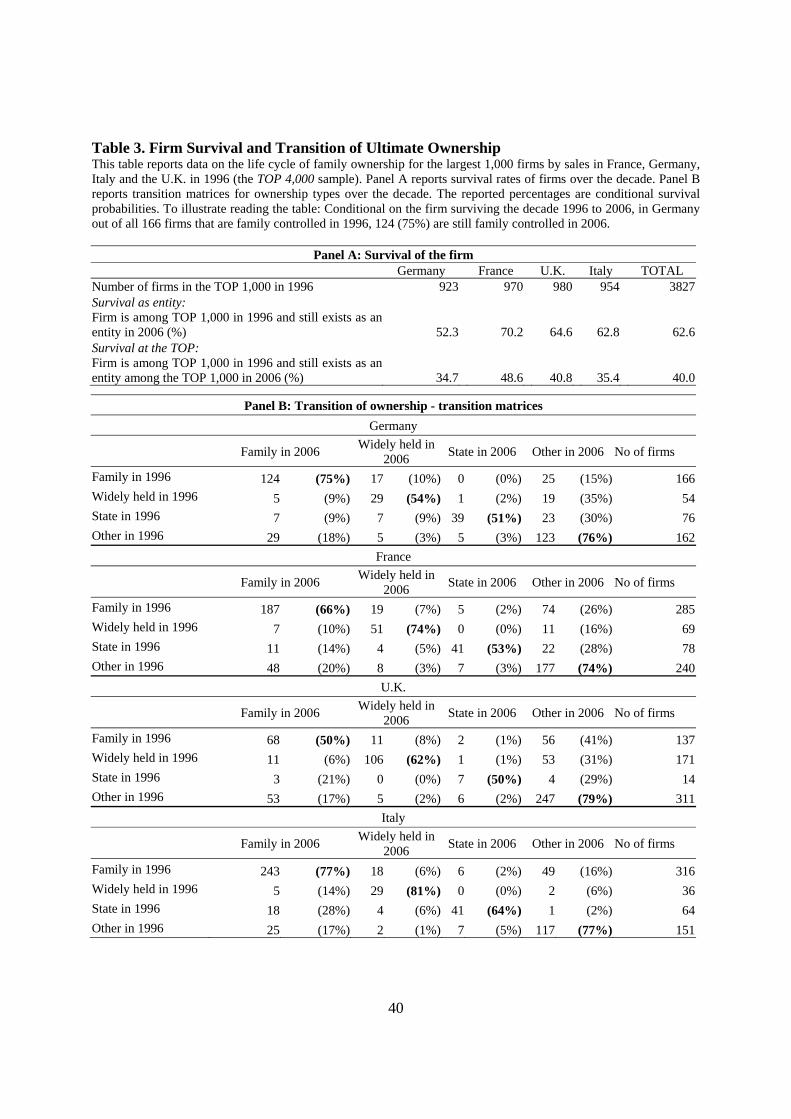
40
Table 3. Firm Survival and Transition of Ultimate Ownership This table reports data on the life cycle of family ownership for the largest 1,000 firms by sales in France, Germany, Italy and the U.K. in 1996 (the TOP 4,000 sample). Panel A reports survival rates of firms over the decade. Panel B reports transition matrices for ownership types over the decade. The reported percentages are conditional survival probabilities. To illustrate reading the table: Conditional on the firm surviving the decade 1996 to 2006, in Germany out of all 166 firms that are family controlled in 1996, 124 (75%) are still family controlled in 2006.
Panel A: Survival of the firm Germany France U.K. Italy TOTAL Number of firms in the TOP 1,000 in 1996 923 970 980 954 3827Survival as entity: Firm is among TOP 1,000 in 1996 and still exists as an entity in 2006 (%) 52.3 70.2 64.6 62.8 62.6Survival at the TOP: Firm is among TOP 1,000 in 1996 and still exists as an entity among the TOP 1,000 in 2006 (%) 34.7 48.6 40.8 35.4 40.0
Panel B: Transition of ownership - transition matrices
Germany
Family in 2006 Widely held in
2006 State in 2006 Other in 2006 No of firms
Family in 1996 124 (75%) 17 (10%) 0 (0%) 25 (15%) 166Widely held in 1996 5 (9%) 29 (54%) 1 (2%) 19 (35%) 54State in 1996 7 (9%) 7 (9%) 39 (51%) 23 (30%) 76Other in 1996 29 (18%) 5 (3%) 5 (3%) 123 (76%) 162
France
Family in 2006 Widely held in
2006 State in 2006 Other in 2006 No of firms
Family in 1996 187 (66%) 19 (7%) 5 (2%) 74 (26%) 285Widely held in 1996 7 (10%) 51 (74%) 0 (0%) 11 (16%) 69State in 1996 11 (14%) 4 (5%) 41 (53%) 22 (28%) 78Other in 1996 48 (20%) 8 (3%) 7 (3%) 177 (74%) 240
U.K.
Family in 2006 Widely held in
2006 State in 2006 Other in 2006 No of firms
Family in 1996 68 (50%) 11 (8%) 2 (1%) 56 (41%) 137Widely held in 1996 11 (6%) 106 (62%) 1 (1%) 53 (31%) 171State in 1996 3 (21%) 0 (0%) 7 (50%) 4 (29%) 14Other in 1996 53 (17%) 5 (2%) 6 (2%) 247 (79%) 311
Italy
Family in 2006 Widely held in
2006State in 2006 Other in 2006 No of firms
Family in 1996 243 (77%) 18 (6%) 6 (2%) 49 (16%) 316Widely held in 1996 5 (14%) 29 (81%) 0 (0%) 2 (6%) 36State in 1996 18 (28%) 4 (6%) 41 (64%) 1 (2%) 64Other in 1996 25 (17%) 2 (1%) 7 (5%) 117 (77%) 151

41
Table 4. Firm Age and Family Ownership This table reports probit regression results with the dependent variable being whether a firm is ultimately family-controlled (1) or not (0) in columns 1-3 and whether a firm survives the decade 1996-2006 (1) or not (0) in columns 4-6. It uses the TOP 4,000 sample, i.e. the largest 1,000 firms by sales in France, Germany, Italy and the U.K. in 1996, both private and listed. Ultimate control is traced manually for all firms using the sources described in Appendix A. Coefficients are reported as marginal effects. Firm age is measured in hundreds of years. Foreign control equals one if the firm is ultimately controlled by a shareholder located in a different country from the firm itself. All regressions include industry fixed effects (not reported). U.K., France, and Italy are country-level dummy variables, with Germany as the base case. Robust standard errors of the marginal effects are calculated by delta method and clustered by country. *, ** and *** indicate a coefficient significantly different from 0 at the 10%, 5% and 1% confidence level, respectively. Dependent variable Firm is family controlled (1) or not (0) Firm survives the decade (1) or not (0)
Sample All firms All firms Family firms Family firms
(1) (2) (3) (4)
Firm age 0.012 0.055 0.092*** 0.107***
[0.047] [0.046] [0.020] [0.021]
(U.K.) X (Firm age) -0.254*** -0.158***
[0.040] [0.018]
France -0.012 -0.005 0.111*** 0.113***
[0.013] [0.010] [0.006] [0.004]
U.K. -0.145*** -0.039 0.143*** 0.202***
[0.021] [0.027] [0.016] [0.012]
Italy 0.076*** 0.087*** 0.124*** 0.128***
[0.027] [0.024] [0.017] [0.018]
Listed firm -0.104* -0.106* 0.110 0.109
[0.056] [0.059] [0.075] [0.076]
Foreign ultimate control -0.184 -0.190 -0.019 -0.021
[0.126] [0.122] [0.022] [0.022]
Log (Sales) -0.040*** -0.039*** 0.005 0.005
[0.010] [0.010] [0.011] [0.011]
Industry fixed effects YES YES YES YES
Observations 3732 3732 1359 1359
Pseudo R2 0.138 0.142 0.0574 0.0583
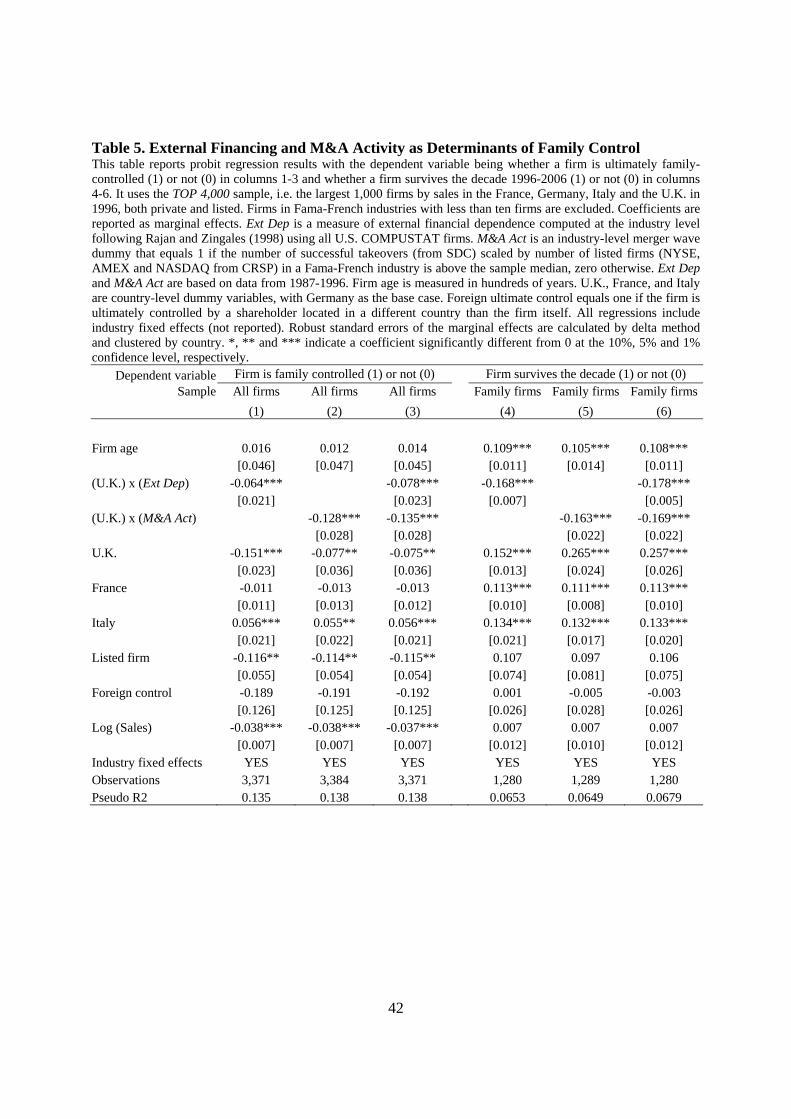
42
Table 5. External Financing and M&A Activity as Determinants of Family Control This table reports probit regression results with the dependent variable being whether a firm is ultimately family-controlled (1) or not (0) in columns 1-3 and whether a firm survives the decade 1996-2006 (1) or not (0) in columns 4-6. It uses the TOP 4,000 sample, i.e. the largest 1,000 firms by sales in the France, Germany, Italy and the U.K. in 1996, both private and listed. Firms in Fama-French industries with less than ten firms are excluded. Coefficients are reported as marginal effects. Ext Dep is a measure of external financial dependence computed at the industry level following Rajan and Zingales (1998) using all U.S. COMPUSTAT firms. M&A Act is an industry-level merger wave dummy that equals 1 if the number of successful takeovers (from SDC) scaled by number of listed firms (NYSE, AMEX and NASDAQ from CRSP) in a Fama-French industry is above the sample median, zero otherwise. Ext Dep and M&A Act are based on data from 1987-1996. Firm age is measured in hundreds of years. U.K., France, and Italy are country-level dummy variables, with Germany as the base case. Foreign ultimate control equals one if the firm is ultimately controlled by a shareholder located in a different country than the firm itself. All regressions include industry fixed effects (not reported). Robust standard errors of the marginal effects are calculated by delta method and clustered by country. *, ** and *** indicate a coefficient significantly different from 0 at the 10%, 5% and 1% confidence level, respectively.
Dependent variable Firm is family controlled (1) or not (0) Firm survives the decade (1) or not (0) Sample All firms All firms All firms Family firms Family firms Family firms
(1) (2) (3) (4) (5) (6)
Firm age 0.016 0.012 0.014 0.109*** 0.105*** 0.108*** [0.046] [0.047] [0.045] [0.011] [0.014] [0.011]
(U.K.) x (Ext Dep) -0.064*** -0.078*** -0.168*** -0.178*** [0.021] [0.023] [0.007] [0.005] (U.K.) x (M&A Act) -0.128*** -0.135*** -0.163*** -0.169*** [0.028] [0.028] [0.022] [0.022] U.K. -0.151*** -0.077** -0.075** 0.152*** 0.265*** 0.257*** [0.023] [0.036] [0.036] [0.013] [0.024] [0.026] France -0.011 -0.013 -0.013 0.113*** 0.111*** 0.113*** [0.011] [0.013] [0.012] [0.010] [0.008] [0.010] Italy 0.056*** 0.055** 0.056*** 0.134*** 0.132*** 0.133*** [0.021] [0.022] [0.021] [0.021] [0.017] [0.020] Listed firm -0.116** -0.114** -0.115** 0.107 0.097 0.106 [0.055] [0.054] [0.054] [0.074] [0.081] [0.075] Foreign control -0.189 -0.191 -0.192 0.001 -0.005 -0.003 [0.126] [0.125] [0.125] [0.026] [0.028] [0.026] Log (Sales) -0.038*** -0.038*** -0.037*** 0.007 0.007 0.007 [0.007] [0.007] [0.007] [0.012] [0.010] [0.012] Industry fixed effects YES YES YES YES YES YES Observations 3,371 3,384 3,371 1,280 1,289 1,280 Pseudo R2 0.135 0.138 0.138 0.0653 0.0649 0.0679

43
Table 6. Family-Controlled Listed Firms This table is based on the population of 827 family-controlled listed firms in France, Germany, Italy and the U.K. in December 1996, i.e. the LISTED FAMILY sample. In Panel A, controlled via pyramids indicates that the firm has an ultimate owner that indirectly controls the firm through another corporation that the ultimate owner does not wholly control. Controlled via pyramids and average ratio of cash-flow to voting rights are from Faccio and Lang (2002) and calculated at the 20% control threshold. All reported values are country averages, unless otherwise noted. Firm age is measured in years. Panel B reports whether and how the status of the firm changed from being a listed family-controlled firm in 1996 over the decade. No change indicates the firm is still a listed firm controlled by the same family as in 1996. Went private indicates the firm delisted. Widely held in 2006 indicates the family no longer holds a controlling stake in 2006 but the firm was not subject to a takeover. Takeover indicates the firm was subject to a takeover. Default indicates the firm went into liquidation. Unknown status indicates the firm’s ultimate owner in 2006 or the exact reasons for its disappearance over the decade are unknown. p-values indicate if the U.K. and the Continental European countries are significantly different using a t-test (rank sum test for return on sales).
Panel A: Summary statistics for listed family firms in 1996 Germany France U.K. Italy Total p-value Founding family still in control 49.0% 72.3% 91.2% 60.4% 69.7% 0.000CEO is a family member 59.0% 80.8% 81.1% 74.5% 74.1% 0.001Control divided among family members 63.4% 81.0% 47.0% 61.3% 58.5% 0.000Dual class shares 23.7% 0.8% 16.6% 43.4% 17.4% 0.710Controlled via pyramids 15.8% 13.1% 2.3% 22.6% 12.3% 0.000Founder in control 15.8% 44.6% 56.2% 57.5% 40.5% 0.0003rd generation in control 45.5% 19.9% 15.2% 22.6% 26.8% 0.000 Ratio of cash-flow to voting rights 88.2% 98.1% 96.1% 73.6% 91.4% 0.000Voting rights 68.1% 62.1% 41.8% 58.7% 57.9% 0.000Return on sales (median) 2.3% 11.5% 6.9% 2.2% 4.0% 0.122Firm age 91.5 71.7 38.6 48.6 66.2 0.210
Panel B: Evolution of ownership from 1996 to 2006 Germany France U.K. Italy Total p-value NO CHANGE 104 113 50 56 323 Went private 17 34 15 21 87 Widely held in 2006 (A) 13 17 56 6 92 TAKEOVER (B) 75 81 79 15 250 DEFAULT (C) 26 6 17 8 57 Unknown status 18 0 0 0 18 Total 253 251 217 106 827 Frequency of changes in control (A+B+C) 48.5% 41.4% 70.0% 27.4% 48.3% 0.000

44
Table 7. Ownership Changes in Listed Family Firms The table reports the estimates of a probit model for the LISTED FAMILY sample, i.e. all family-controlled listed firms in 1996 in France, Germany, Italy and the U.K. The dependent variable is whether the firm experiences a change of control during the period 1996 to 2006 (1) or not (0). A change of control is defined as a case where a family-controlled firm in 1996 is widely held in 2006, was taken over or defaulted between 1996 and 2006. Control wedge is a dummy for whether the family’s voting rights differ from its cash-flow rights (1) or not (0). All other variables are from Table 6. Firms in column 4 satisfy the additional requirement of having financial data available on COMPUSTAT Global for 1996. Robust standard errors are in brackets. *, ** and *** indicate a coefficient significantly different from 0 at the 10%, 5% and 1% confidence level, respectively. Dependent variable: Change of control from 1996 to 2006
Sample All firms Inc. year known
COMPUSTAT coverage
(1) (2) (3) (4)
Pyramids -0.224 -0.128 0.098 -0.288
[0.171] [0.171] [0.212] [0.243]
Control wedge -0.107 -0.168 -0.185 -0.313*
[0.129] [0.129] [0.168] [0.173]
Founding family in control in 1996 -0.690*** -0.773*** -1.089*** -0.977***
[0.123] [0.124] [0.159] [0.187]
Control divided among family members 0.200* 0.205* 0.282* 0.384**
[0.110] [0.111] [0.147] [0.156]
Voting rights (%) -0.018*** -0.014*** -0.011*** -0.020***
[0.003] [0.003] [0.004] [0.004]
CEO is family member -0.03 -0.058 -0.163 -0.081
[0.124] [0.124] [0.164] [0.180]
1st generation in control -0.159 -0.003
[0.126] [0.170]
3rd generation in control -0.147 -0.055
[0.135] [0.185]
>=2nd generation -0.139
[0.119]
(>=2nd generation) x (U.K.) 0.887***
[0.176]
Firm age -0.009*
[0.005]
(U.K.) x (Firm age) 0.046**
[0.019]
Return on sales -0.169
[0.796]
Log(sales) -0.128***
[0.042]
Industry and country fixed effects YES YES YES YES
Observations 722 722 428 422
Pseudo R-squared 0.102 0.126 0.157 0.178

45
Table 8. Life Cycle Hypothesis in 27 Countries This table reports results for the ALL FIRM sample, i.e. all firms in the AMADEUS database in December 2006, both private and listed, that meet the following requirements: i) Firm status is active according to the database, ii) sales, assets, operating profit, incorporation year, and industry are reported. iii) Net sales are at least EUR 50 million. Firms incorporated in countries not covered by Djankov et al. (2008) are excluded. Also excluded are firms in Fama-French 48 industries with less than ten firms in total. Panel A reports descriptive statistics and Panel B reports probit regressions, with the dependent variable being whether a family is family controlled (1) or not (0). Coefficients are reported as marginal effects. Firm age is measured in hundreds of years. OUT is the Outsider index from Appendix A. OUT Q1 and OUT Q5 are dummy variables for the lowest and highest quintiles of the Outsider index. Ext Dep is a measure of external financial dependence computed at the industry level following Rajan and Zingales (1998) using all U.S. COMPUSTAT firms. M&A Act is an industry-level merger wave dummy that equals 1 if the number of successful takeovers (from SDC) scaled by number of listed firms (NYSE, AMEX and NASDAQ from CRSP) in a Fama-French industry is above the sample median, zero otherwise. Ext Dep and M&A Act are based on data of U.S. firms from 1997-2006. All regressions include country and industry fixed effects (not reported). Robust standard errors of the marginal effects are calculated by delta method and clustered by country. *, ** and *** indicate a coefficient significantly different from 0 at the 10%, 5% and 1% confidence level, respectively.
Panel A: ALL FIRM sample descriptive statistics Country Austria Belgium Bulgaria Croatia Czech R. Denmark France Germany Greece Sample firms 39 1,499 14 87 311 1,127 4,801 2,189 319Family firms 11 59 4 34 24 115 1,097 527 107Median assets 91 60.8 74.2 84 69.1 77.6 77 105.2 97.9Median sales 186.1 113.3 94.1 107 115.6 119.2 115.2 149.8 112.4Median age 16 21 13 15 13 15 21 18 23Median employees 703 212 209.5 477 375 390 336 607 250 Country Hungary Ireland Italy Latvia Lithuania Luxemb. Netherl. Norway Poland Sample firms 175 122 2,716 13 16 7 1,373 979 133Family firms 3 35 567 4 10 1 28 127 31Median assets 52 91.2 84 22.1 44.4 77.4 92.2 86.7 59.3Median sales 126.5 125.5 105.6 82.7 91.5 255.6 145.7 119.5 99.2Median age 13 17 25 10 13 15 20 15 15Median employees 456 140 249 110 138.5 0 368 156.5 360 Country Portugal Romania Russia Slovakia Estonia Sweden Switzerl. Ukraine United K.Sample firms 350 155 507 50 1,039 1,568 219 272 7,604Family firms 56 43 17 1 157 65 26 44 1,687Median assets 101.1 62.8 81.3 19.4 87.1 80.8 337.1 79.5 87.4Median sales 111.8 96.9 129.8 100.3 112.2 121.1 312.7 118.9 130.9Median age 23.5 10 14 11.5 20 24 46 11.5 17Median employees 474 943 2315 375 332 378 1242 2175.5 465
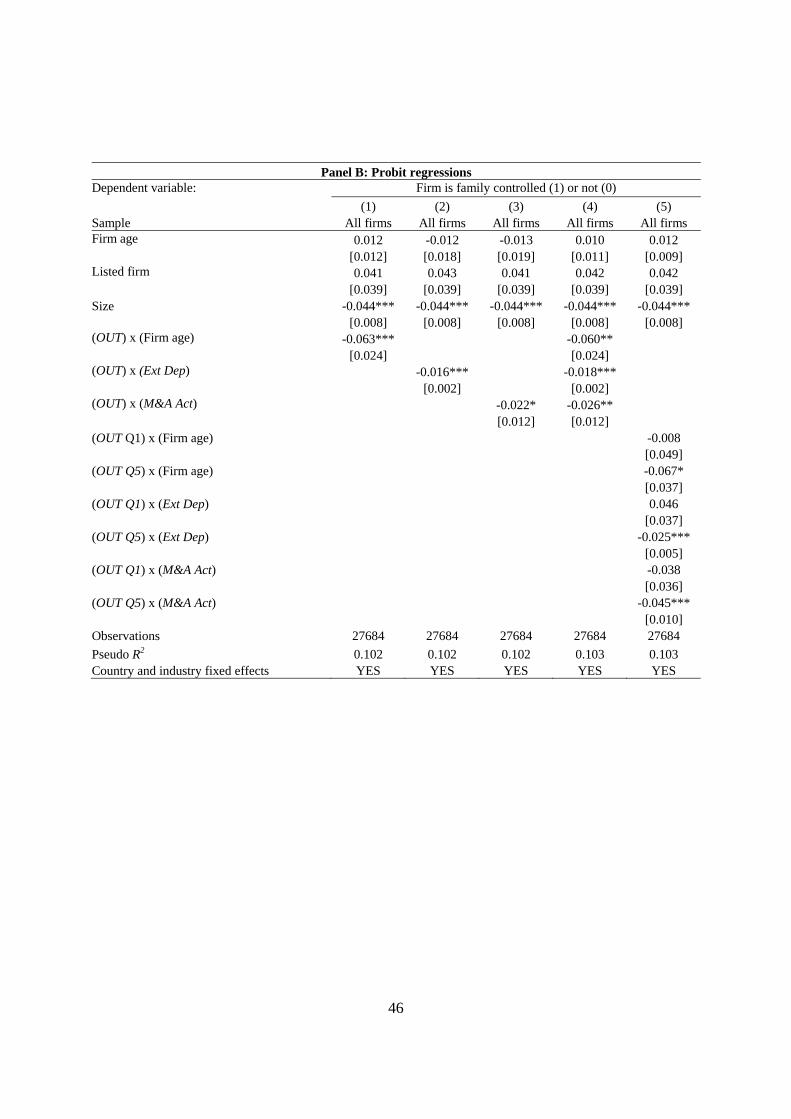
46
Panel B: Probit regressions
Dependent variable: Firm is family controlled (1) or not (0)
(1) (2) (3) (4) (5) Sample All firms All firms All firms All firms All firms Firm age 0.012 -0.012 -0.013 0.010 0.012 [0.012] [0.018] [0.019] [0.011] [0.009] Listed firm 0.041 0.043 0.041 0.042 0.042 [0.039] [0.039] [0.039] [0.039] [0.039] Size -0.044*** -0.044*** -0.044*** -0.044*** -0.044*** [0.008] [0.008] [0.008] [0.008] [0.008] (OUT) x (Firm age) -0.063*** -0.060** [0.024] [0.024] (OUT) x (Ext Dep) -0.016*** -0.018*** [0.002] [0.002] (OUT) x (M&A Act) -0.022* -0.026** [0.012] [0.012] (OUT Q1) x (Firm age) -0.008 [0.049] (OUT Q5) x (Firm age) -0.067* [0.037] (OUT Q1) x (Ext Dep) 0.046 [0.037] (OUT Q5) x (Ext Dep) -0.025*** [0.005] (OUT Q1) x (M&A Act) -0.038 [0.036] (OUT Q5) x (M&A Act) -0.045*** [0.010] Observations 27684 27684 27684 27684 27684
Pseudo R2 0.102 0.102 0.102 0.103 0.103 Country and industry fixed effects YES YES YES YES YES

47
Table 9. Comparison of Performance of Family versus non Family Firms This table reports OLS for the ALL FIRM and the TOP 4,000 samples, where the dependent variable is return on equity in Panel A, return on sales in Panel B and return on assets in Panel C. Accounting items are lagged and as of December 2005. Performance is calculated by dividing operating profit (AMADEUS item Operating P/L) by book equity (item Shareholder funds), net sales (item Operating revenue/turnover) and total assets (item Total assets). All regressions include industry and country fixed effects. Robust standard errors are clustered by country and reported in brackets. *, ** and *** indicate a coefficient significantly different from 0 at the 10%, 5% and 1% confidence level, respectively.
Sample ALL FIRM sample TOP 4,000 sample All firms Only listed Only private All firms (1) (2) (3) (4)
Panel A: Dependent variable - return on equity Family control 0.024*** 0.020 0.025** 0.033 (0.009) (0.018) (0.010) (0.042) (OUT) x (Family control) -0.028*** -0.009 -0.030*** (0.011) (0.020) (0.011) (U.K.) x (Family control) -0.037 (0.040) Log (sales) 0.003 0.024*** -0.001 0.020*** (0.002) (0.009) (0.004) (0.008) Listed firm -0.124*** -0.081*** (0.016) (0.031) Adj. R2 0.0340 0.0273 0.0324 0.0398
Panel B: Dependent variable - return on sales Family control -0.000 -0.005 -0.000 0.012 (0.002) (0.005) (0.002) (0.009) (OUT) x (Family control) -0.010*** 0.001 -0.011*** (0.002) (0.004) (0.002) (U.K.) x (Family control) -0.019* (0.010) Log (sales) 0.000 0.005*** -0.001 0.002** (0.001) (0.001) (0.001) (0.001) Listed firm 0.025*** 0.007 (0.003) (0.008) Adj. R2 0.134 0.135 0.119 0.110
Panel C: Dependent variable - return on assets Family control 0.005 0.006 0.005 0.013 (0.004) (0.005) (0.004) (0.009) (OUT) x (Family control) -0.001 0.002 -0.002 (0.003) (0.005) (0.003) (U.K.) x (Family control) -0.011 (0.010) Log (sales) -0.001 0.005*** -0.002** 0.005*** (0.001) (0.001) (0.001) (0.001) Listed firm 0.006 0.001 (0.004) (0.012) Adj. R2 0.0414 0.104 0.0385 0.0932 Industry and country fixed effects YES YES YES YES Observations 27652 2058 25594 1911

Appendix A. The Outsider Index The table reports country-level data for the Outsider index and its components. Higher values of Outsider indicate more outsider-oriented financial systems. The index is calculated for all countries that are covered both by AMADEUS in December 2006 and by Djankov et al. (2008). Antidirector rights measure the rights of minority shareholders against directors, as revised by Djankov et al. (2008). Anti-self-dealing is the indicator produced by Djankov et al. (2008) to measure the power of minority shareholders against self-dealing by managers and controlling shareholders. Stock market capitalization over GDP is the ratio of the stock market capitalization to GDP for 2006. The number of listed firms is scaled by population (in millions) in 2006. M&A activity is the percentage of traded companies targeted in a completed deal between 2001 and 2006. Hostile takeovers is the number of attempted hostile takeovers as a percentage of traded companies during the same period. Both measures are from SDC Platinum. The voting premium is the average percentage difference in market value of voting shares compared to non-voting shares from Nenova (2003), Table 4. The block premium is the difference between the price per share paid for the control block and the exchange price two days after the announcement of the control transaction, as a percentage of the exchange price two days after the announcement from Dyck and Zingales (2004), Table 6. Both private benefits of control indicators are multiplied by minus one to capture that higher values indicate weaker governance. For each variable we compute the worldwide average and standard deviation using 72 countries. Outsider index is calculated as the equal-weighted sum of the eight normalized indicators. Indicators are normalized by worldwide average and standard deviation.
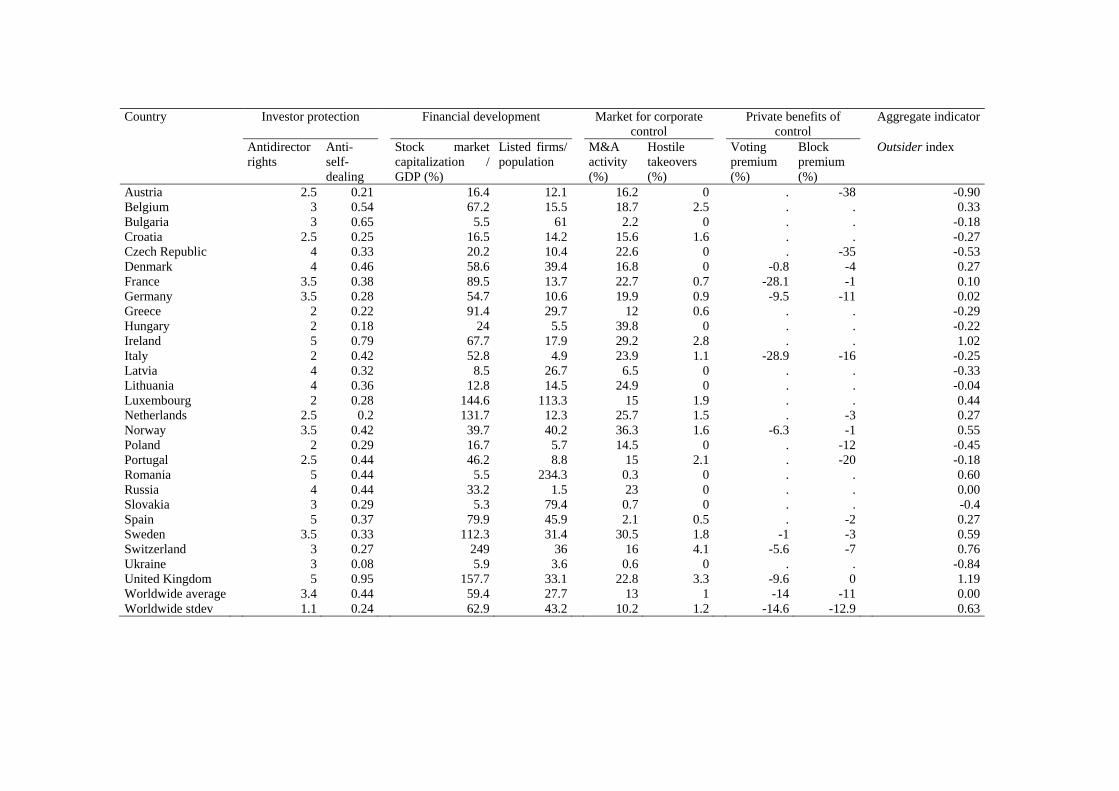
Country Investor protection Financial development Market for corporate
control Private benefits of
control Aggregate indicator
Antidirector rights
Anti-self-dealing
Stock market capitalization / GDP (%)
Listed firms/ population
M&A activity (%)
Hostile takeovers (%)
Voting premium (%)
Block premium (%)
Outsider index
Austria 2.5 0.21 16.4 12.1 16.2 0 . -38 -0.90Belgium 3 0.54 67.2 15.5 18.7 2.5 . . 0.33Bulgaria 3 0.65 5.5 61 2.2 0 . . -0.18Croatia 2.5 0.25 16.5 14.2 15.6 1.6 . . -0.27Czech Republic 4 0.33 20.2 10.4 22.6 0 . -35 -0.53Denmark 4 0.46 58.6 39.4 16.8 0 -0.8 -4 0.27France 3.5 0.38 89.5 13.7 22.7 0.7 -28.1 -1 0.10Germany 3.5 0.28 54.7 10.6 19.9 0.9 -9.5 -11 0.02Greece 2 0.22 91.4 29.7 12 0.6 . . -0.29Hungary 2 0.18 24 5.5 39.8 0 . . -0.22Ireland 5 0.79 67.7 17.9 29.2 2.8 . . 1.02Italy 2 0.42 52.8 4.9 23.9 1.1 -28.9 -16 -0.25Latvia 4 0.32 8.5 26.7 6.5 0 . . -0.33Lithuania 4 0.36 12.8 14.5 24.9 0 . . -0.04Luxembourg 2 0.28 144.6 113.3 15 1.9 . . 0.44Netherlands 2.5 0.2 131.7 12.3 25.7 1.5 . -3 0.27Norway 3.5 0.42 39.7 40.2 36.3 1.6 -6.3 -1 0.55Poland 2 0.29 16.7 5.7 14.5 0 . -12 -0.45Portugal 2.5 0.44 46.2 8.8 15 2.1 . -20 -0.18Romania 5 0.44 5.5 234.3 0.3 0 . . 0.60Russia 4 0.44 33.2 1.5 23 0 . . 0.00Slovakia 3 0.29 5.3 79.4 0.7 0 . . -0.4Spain 5 0.37 79.9 45.9 2.1 0.5 . -2 0.27Sweden 3.5 0.33 112.3 31.4 30.5 1.8 -1 -3 0.59Switzerland 3 0.27 249 36 16 4.1 -5.6 -7 0.76Ukraine 3 0.08 5.9 3.6 0.6 0 . . -0.84United Kingdom 5 0.95 157.7 33.1 22.8 3.3 -9.6 0 1.19Worldwide average 3.4 0.44 59.4 27.7 13 1 -14 -11 0.00Worldwide stdev 1.1 0.24 62.9 43.2 10.2 1.2 -14.6 -12.9 0.63
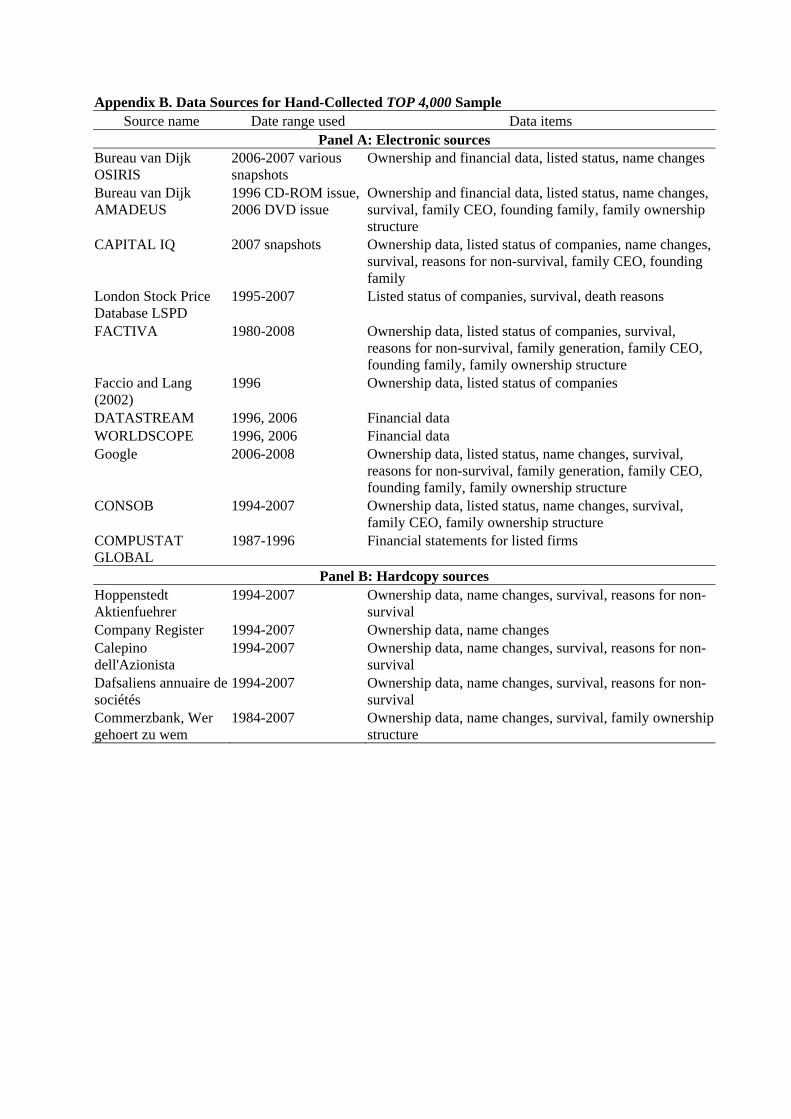
Appendix B. Data Sources for Hand-Collected TOP 4,000 Sample Source name Date range used Data items
Panel A: Electronic sources Bureau van Dijk OSIRIS
2006-2007 various snapshots
Ownership and financial data, listed status, name changes
Bureau van Dijk AMADEUS
1996 CD-ROM issue, 2006 DVD issue
Ownership and financial data, listed status, name changes, survival, family CEO, founding family, family ownership structure
CAPITAL IQ 2007 snapshots Ownership data, listed status of companies, name changes, survival, reasons for non-survival, family CEO, founding family
London Stock Price Database LSPD
1995-2007 Listed status of companies, survival, death reasons
FACTIVA 1980-2008 Ownership data, listed status of companies, survival, reasons for non-survival, family generation, family CEO, founding family, family ownership structure
Faccio and Lang (2002)
1996 Ownership data, listed status of companies
DATASTREAM 1996, 2006 Financial data WORLDSCOPE 1996, 2006 Financial data Google 2006-2008 Ownership data, listed status, name changes, survival,
reasons for non-survival, family generation, family CEO, founding family, family ownership structure
CONSOB 1994-2007 Ownership data, listed status, name changes, survival, family CEO, family ownership structure
COMPUSTAT GLOBAL
1987-1996 Financial statements for listed firms
Panel B: Hardcopy sources Hoppenstedt Aktienfuehrer
1994-2007 Ownership data, name changes, survival, reasons for non-survival
Company Register 1994-2007 Ownership data, name changes Calepino dell'Azionista
1994-2007 Ownership data, name changes, survival, reasons for non-survival
Dafsaliens annuaire de sociétés
1994-2007 Ownership data, name changes, survival, reasons for non-survival
Commerzbank, Wer gehoert zu wem
1984-2007 Ownership data, name changes, survival, family ownership structure
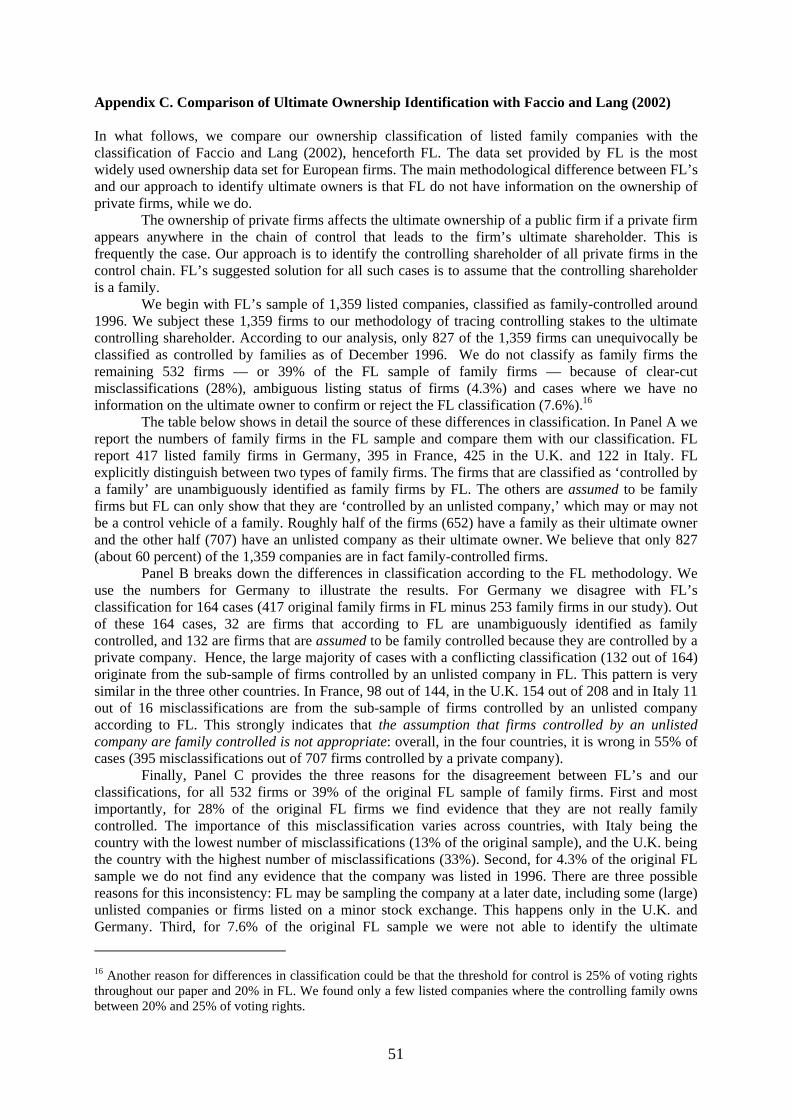
51
Appendix C. Comparison of Ultimate Ownership Identification with Faccio and Lang (2002) In what follows, we compare our ownership classification of listed family companies with the classification of Faccio and Lang (2002), henceforth FL. The data set provided by FL is the most widely used ownership data set for European firms. The main methodological difference between FL’s and our approach to identify ultimate owners is that FL do not have information on the ownership of private firms, while we do.
The ownership of private firms affects the ultimate ownership of a public firm if a private firm appears anywhere in the chain of control that leads to the firm’s ultimate shareholder. This is frequently the case. Our approach is to identify the controlling shareholder of all private firms in the control chain. FL’s suggested solution for all such cases is to assume that the controlling shareholder is a family.
We begin with FL’s sample of 1,359 listed companies, classified as family-controlled around 1996. We subject these 1,359 firms to our methodology of tracing controlling stakes to the ultimate controlling shareholder. According to our analysis, only 827 of the 1,359 firms can unequivocally be classified as controlled by families as of December 1996. We do not classify as family firms the remaining 532 firms — or 39% of the FL sample of family firms — because of clear-cut misclassifications (28%), ambiguous listing status of firms (4.3%) and cases where we have no information on the ultimate owner to confirm or reject the FL classification (7.6%).16
The table below shows in detail the source of these differences in classification. In Panel A we report the numbers of family firms in the FL sample and compare them with our classification. FL report 417 listed family firms in Germany, 395 in France, 425 in the U.K. and 122 in Italy. FL explicitly distinguish between two types of family firms. The firms that are classified as ‘controlled by a family’ are unambiguously identified as family firms by FL. The others are assumed to be family firms but FL can only show that they are ‘controlled by an unlisted company,’ which may or may not be a control vehicle of a family. Roughly half of the firms (652) have a family as their ultimate owner and the other half (707) have an unlisted company as their ultimate owner. We believe that only 827 (about 60 percent) of the 1,359 companies are in fact family-controlled firms.
Panel B breaks down the differences in classification according to the FL methodology. We use the numbers for Germany to illustrate the results. For Germany we disagree with FL’s classification for 164 cases (417 original family firms in FL minus 253 family firms in our study). Out of these 164 cases, 32 are firms that according to FL are unambiguously identified as family controlled, and 132 are firms that are assumed to be family controlled because they are controlled by a private company. Hence, the large majority of cases with a conflicting classification (132 out of 164) originate from the sub-sample of firms controlled by an unlisted company in FL. This pattern is very similar in the three other countries. In France, 98 out of 144, in the U.K. 154 out of 208 and in Italy 11 out of 16 misclassifications are from the sub-sample of firms controlled by an unlisted company according to FL. This strongly indicates that the assumption that firms controlled by an unlisted company are family controlled is not appropriate: overall, in the four countries, it is wrong in 55% of cases (395 misclassifications out of 707 firms controlled by a private company).
Finally, Panel C provides the three reasons for the disagreement between FL’s and our classifications, for all 532 firms or 39% of the original FL sample of family firms. First and most importantly, for 28% of the original FL firms we find evidence that they are not really family controlled. The importance of this misclassification varies across countries, with Italy being the country with the lowest number of misclassifications (13% of the original sample), and the U.K. being the country with the highest number of misclassifications (33%). Second, for 4.3% of the original FL sample we do not find any evidence that the company was listed in 1996. There are three possible reasons for this inconsistency: FL may be sampling the company at a later date, including some (large) unlisted companies or firms listed on a minor stock exchange. This happens only in the U.K. and Germany. Third, for 7.6% of the original FL sample we were not able to identify the ultimate
16 Another reason for differences in classification could be that the threshold for control is 25% of voting rights throughout our paper and 20% in FL. We found only a few listed companies where the controlling family owns between 20% and 25% of voting rights.
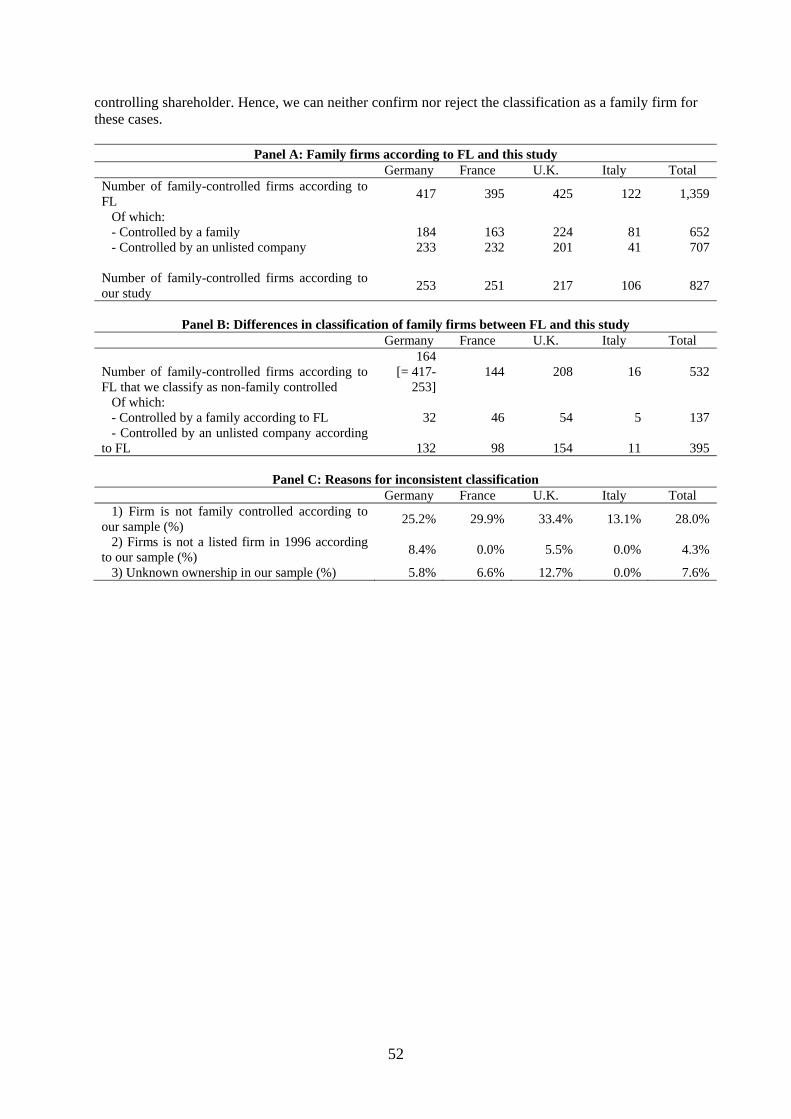
52
controlling shareholder. Hence, we can neither confirm nor reject the classification as a family firm for these cases.
Panel A: Family firms according to FL and this study Germany France U.K. Italy Total Number of family-controlled firms according to FL
417 395 425 122 1,359
Of which: - Controlled by a family 184 163 224 81 652 - Controlled by an unlisted company 233 232 201 41 707 Number of family-controlled firms according to our study
253 251 217 106 827
Panel B: Differences in classification of family firms between FL and this study
Germany France U.K. Italy Total
Number of family-controlled firms according to FL that we classify as non-family controlled
164 [= 417-
253] 144 208 16 532
Of which: - Controlled by a family according to FL 32 46 54 5 137 - Controlled by an unlisted company according to FL 132 98 154 11 395
Panel C: Reasons for inconsistent classification
Germany France U.K. Italy Total 1) Firm is not family controlled according to our sample (%)
25.2% 29.9% 33.4% 13.1% 28.0%
2) Firms is not a listed firm in 1996 according to our sample (%)
8.4% 0.0% 5.5% 0.0% 4.3%
3) Unknown ownership in our sample (%) 5.8% 6.6% 12.7% 0.0% 7.6%

53
Appendix D. Ownership information for the ALL FIRM sample To classify firms, we rely on seven AMADEUS data items:
1. Independence Indicator: Classifies the degree of independence of the firm. Ranges from A+ (highest independence) to D (lowest independence), also takes value U (unknown independence).
2. Shareholder type: Classifies shareholder types. Types include, but are not limited to, “Bank”, “Financial company”, “Insurance company”, “Industrial company”, “Public authorities”, “One or more known individuals or families”, “Employees/managers/directors”, “Self ownership”.
3. Direct Ownership: Percentage of voting rights held by the shareholder directly. 4. Total Ownership: Percentage of total voting rights held by the shareholder where the path
through which ownership is held may be direct and indirect. 5. Ultimate Owner type: Classifies the entity identified as the ultimate owner of a firm.
Types include, but are not limited to, “Bank”, “Financial company”, “Insurance company”, “Industrial company”, “Public authorities”, “One or more known individuals or families”, “Employees/managers/directors”.
6. Ultimate Owner Direct Ownership: Percentage of voting rights held by the ultimate owner directly.
7. Ultimate Owner Total Ownership: Percentage of total voting rights held by the ultimate owner where the path through which ownership is held may be direct and indirect.
8. Ultimate Owner BvD number: Unique identifier of the ultimate owner We proceed by cleaning the raw data in several steps: Independence Indicators are grouped into
five categories, A, B, C, D, U, eliminating subcategories A+, A-, etc. Then, Ultimate Owner BvD numbers are extracted for known ultimate owners and merged with data taken from OSIRIS, an additional BvD database. OSIRIS covers firms globally and therefore allows identification of ultimate owners outside of the geographical coverage of AMADEUS, i.e. outside Europe. Next, special cases of Direct Ownership and Total Ownership are translated into numeric values. Examples of this are “wholly owned” is translated into 100% ownership, “majority owned” is translated into 51% ownership. Then, for both Ultimate Owner and for Shareholder, aggregate the reported stakes by using the Total Ownership stake and replacing it with the Direct Ownership stake if Total Ownership is missing. Next, remove blocks of unaffiliated shareholders that for reporting purposes have been grouped together by AMADEUS in categories such as “Public”, “Small shareholders”, “Unnamed private shareholders” etc.
After this initial cleaning, we apply seven filters to assign each firm to one of the previously described four ownership categories:
Filter 1: Classify a firm as being widely held if the firm is known not have any shareholder with a stake larger than 25 percent, i.e. a firm that is classified as independent. [Classifies 2,768 firms]
Filter 2: Classify a firm as ultimately controlled by a family if it is reported to have a family as its ultimate owner. [Classifies 4,274 firms]
Filter 3: Classify a firm as ultimately controlled by a non-family owner if the firm’s ultimate controlling shareholder is a firm that itself is widely held, i.e. does not have an ultimate controlling shareholder. [Classifies 4,866 firms]
Filter 4: If information about the type of the ultimate owner is missing classify but the firm is not widely held, classify the firm as having a family as ultimate owner if there are shareholders listed that are classified as “Individual(s) or family member” and one shareholders owns at least 5 percent and all family type shareholders together own at least 25 percent. [Classifies 560 firms]
Filter 5: If the firm is reported to have an ultimate controlling shareholder that is a bank, an insurance company, another type of financial company, a foundation or an industrial company, classify the firm as having a family as its ultimate controlling shareholder if there are family-type shareholders of the firm that hold at least a 5% stake. If the firm has no family-type shareholder who owns at least a 5% stake classify the firm as having a non-family ultimate controlling shareholder. [Classifies 5,719 firms]
54
Filter 6: If the ownership status of the firm is unknown and the independence of the firm is unknown according to AMADEUS, classify the firm as having an unknown ownership status. [Classifies 6,929 firms]
Filter 7: If the firm is known to have a shareholder that holds at least a 25% stake but the type of the ultimate controlling shareholder is unknown, classify the firm as family-controlled if there are family-type shareholders reported that own at least a 25% stake. If there is no family-type shareholder reported that owns at least a 25% stake, but there are other types of shareholders with stakes of 25% or higher, classify the firm as controlled by a non-family ultimate shareholder. If there are no shareholders with stakes of at least 25% classify the firm as having an unknown ownership status. [Classifies 2,568 firms]
Collectively, the filters assign each of the 27,684 sample firms to one of the ownership categories.