The Journal of Physical Chemistry 1967 Volume.71 No.3
326
TH E J O U R N A L PHYSICAL CHEMISTRY 0 F Volume 71, Number 3 February 1967 T h e I n f r a r e d S p e c t r u m o f A m m o n i a A d s o r b e d o n S i l i c a - A l u m i n a . Michael R. Basila and Theodore R. Kantner 467 M o l e c u l a r A s s o c i a t i o n i n S o d i u m , P o t a s s i u m , a n d C e s i u m V a p o r s a t H i g h T e m p e r a t u r e s . . C. T. Ewing, J. P. Stone, J. R. Spann, and R. R. Miller 473 L u m i n e s c e n c e a n d E n e r g y T r a n s f e r i n S o l u t i o n s o f R a r e E a r t h C o m p l e x e s . I I . S t u d i e s o f t h e S o l v a t i o n S h e l l i n E u r o p i u m ( I I I ) a n d T e r b i u m ( I I I ) a s a F u n c t i o n o f A c e t a t e C o n c e n t r a t i o n . . John L. Kropp and Maurice W. Windsor 477 O s m o t i c C o e f f i c i e n t D a t a f o r t h e S y s t e m B e n z e n e - B e n z o i c A c i d a t 2 5 ° . Kenneth R. Harris and Peter J. Dunlop 4S3 P y r o l y s i s a n d H i g h - T e m p e r a t u r e R a d i o l y s i s o f o - T e r p h e n y l ......................... J. M. Scarborough and R. B. Ingalls 4 8 6 R a t e s a n d S o l v e n t P a r t i c i p a t i o n i n A c i d - B a s e R e a c t i o n s o f S u b s t i t u t e d P h e n o l s a n d P h e n o x i d e s i n M e t h a n o l . . . Ernest Grunwald, Charles F. Jumper, and Mohindar S. Puar 492 N i t r o g e n I s o t o p e E f f e c t s i n N i c k e l - A m m o n i a C o m p l e x a n d A m m o n i a S y s t e m . . . A. R. Gupta and S. K. Sarpal 5 0 0 T h e I n f l u e n c e o f 1 , 4 - D i o x a n e a n d T e t r a h y d r o f u r a n a s S o l v e n t s u p o n t h e S t a b i l i t y a n d t h e S o l v a t i o n o f N e g a t i v e I o n s o f t h e P o t a s s i u m C o m p o u n d s o f N a p h t h a l e n e a n d A n t h r a c e n e . . . Karlheinz K. Brandes and R. J. Gerdes 508 A e r o s o l S t u d i e s b y L i g h t S c a t t e r i n g . V . P r e p a r a t i o n a n d P a r t i c l e S i z e D i s t r i b u t i o n o f A e r o s o l s C o n s i s t i n g o f P a r t i c l e s E x h i b i t i n g H i g h O p t i c a l A b s o r p t i o n ......................... R. T. Jacobsen, M. Kerker, and E. Matijevie 5 1 4 U l t r a s o n i c V i b r a t i o n P o t e n t i a l s a n d T h e i r U s e i n t h e D e t e r m i n a t i o n o f I o n i c P a r t i a l M o l a l V o l u m e s Raoul Zana and Ernest Yeager 521 R e a c t i o n o f A l C l ( g ) w i t h M g O ( c ) a n d t h e H e a t o f F o r m a t i o n o f M g A L O f f c ) . D. Bhogeswara Rao and V. V. Dadape 537 R e v e r s i b l e P h o t o c h e m i c a l D i m e r i z a t i o n o f A c e n a p h t h y l e n e . I . T h e R e a c t i o n i n L i q u i d S o l u t i o n s . . Robert Livingston and Kei Sin Wei 541 R e v e r s i b l e P h o t o c h e m i c a l D i m e r i z a t i o n o f A c e n a p h t h y l e n e . I I . T h e R e a c t i o n i n t h e M o l t e n a n d C r y s t a l l i n e P h a s e s ........................................................................................ Kei Sin Wei and Robert Livingston 5 4 8 A d s o r p t i o n o f P o t e n t i a l - D e t e r m i n i n g I o n s a t t h e F e r r i c O x i d e - A q u e o u s E l e c t r o l y t e I n t e r f a c e . . . R. J. Atkinson, A. M. Posner, and J. P. Quirk 550 R e a c t i o n o f NO (A2S +) w i t h C a r b o n D i o x i d e ...................................................... Norman Cohen and Julian Heicklen 5 5 8 C a l o r i m e t r i c S t u d y o f S e l f - A s s o c i a t i o n o f 6 - M e t h y l p u r i n e i n W a t e r ............................. P. R. Stoesser and S . J. G i l l 5 6 4 P r o t o n C h e m i c a l S h i f t s a n d H y d r o g e n B o n d i n g i n t h e T e r n a r y S y s t e m C a r b o n T e t r a c h l o r i d e - D i o x a n e - W a t e r Norbert Muller and Paul Simon 5 6 8 S t r u c t u r a l E f f e c t s o n t h e E n t h a l p y a n d E n t r o p y o f D i l u t i o n o f A q u e o u s S o l u t i o n s o f t h e Q u a t e r n a r y A m m o n i u m H a l i d e s a t 2 5 ° .................................................. G . E . Boyd, J. W. Chase, and F. Vaslow 5 7 3 I o n i c I n t e r a c t i o n s i n O r g a n i c I o n E x c h a n g e r s . C o m p a r i s o n s w i t h M o d e l E l e c t r o l y t e M i x t u r e s . . S. Lindenbaum and G. E. Boyd 581 E x c i t e d - S t a t e R e a c t i v i t i e s . I I . B a s i c i t i e s o f S o m e P o l y m e t h y l b e n z e n e s i n T h e i r E x c i t e d S i n g l e t S t a t e s . . . R. L. Flurry, Jr., and R. Keith Wilson 589 O x i d a t i o n o f S o o t b y H y d r o x y l R a d i c a l s ....................................................................... C . P. Fenimore and G . W. Jones 5 9 3 3A
-
Upload
khangminh22 -
Category
Documents
-
view
1 -
download
0
Transcript of The Journal of Physical Chemistry 1967 Volume.71 No.3
T H E J O U R N A L
P H Y S I C A L C H E M I S T R Y0 F
Volume 71, Number 3 February 1967
T h e I n f r a r e d S p e c t r u m o f A m m o n i a A d s o r b e d o n S i l i c a - A l u m i n a . Michael R. Basila and Theodore R. Kantner 467
M o l e c u l a r A s s o c i a t i o n i n S o d i u m , P o t a s s i u m , a n d C e s i u m V a p o r s a t H i g h T e m p e r a t u r e s. . C. T. Ewing, J. P. Stone, J. R. Spann, and R. R. Miller 473
L u m i n e s c e n c e a n d E n e r g y T r a n s f e r i n S o l u t i o n s o f R a r e E a r t h C o m p l e x e s . I I . S t u d i e s o f t h e S o l v a t i o n S h e l l i n E u r o p i u m ( I I I ) a n d T e r b i u m ( I I I ) a s a F u n c t i o n o f A c e t a t e C o n c e n t r a t i o n
. . John L. Kropp and Maurice W . Windsor 477
O s m o t i c C o e f f i c i e n t D a t a f o r t h e S y s t e m B e n z e n e - B e n z o i c A c i d a t 2 5 °. Kenneth R. Harris and Peter J. Dunlop 4S3
P y r o l y s i s a n d H i g h - T e m p e r a t u r e R a d i o l y s i s o f o - T e r p h e n y l . . . . . . . . . . . . . . . . . . . . . . . . . J. M. Scarborough and R. B. Ingalls 4 8 6
R a t e s a n d S o l v e n t P a r t i c i p a t i o n i n A c i d - B a s e R e a c t i o n s o f S u b s t i t u t e d P h e n o l s a n d P h e n o x i d e s i n M e t h a n o l. . . Ernest Grunwald, Charles F. Jumper, and Mohindar S. Puar 492
N i t r o g e n I s o t o p e E f f e c t s i n N i c k e l - A m m o n i a C o m p l e x a n d A m m o n i a S y s t e m . . . A. R. Gupta and S. K. Sarpal 5 0 0
T h e I n f l u e n c e o f 1 , 4 - D i o x a n e a n d T e t r a h y d r o f u r a n a s S o l v e n t s u p o n t h e S t a b i l i t y a n d t h e S o l v a t i o n o f N e g a t i v e I o n s o f t h e P o t a s s i u m C o m p o u n d s o f N a p h t h a l e n e a n d A n t h r a c e n e
. . . Karlheinz K. Brandes and R. J. Gerdes 508
A e r o s o l S t u d i e s b y L i g h t S c a t t e r i n g . V . P r e p a r a t i o n a n d P a r t i c l e S i z e D i s t r i b u t i o n o f A e r o s o l s C o n s i s t i n go f P a r t i c l e s E x h i b i t i n g H i g h O p t i c a l A b s o r p t i o n . . . . . . . . . . . . . . . . . . . . . . . . . R. T. Jacobsen, M. Kerker, and E. Matijevie 5 1 4
U l t r a s o n i c V i b r a t i o n P o t e n t i a l s a n d T h e i r U s e i n t h e D e t e r m i n a t i o n o f I o n i c P a r t i a l M o l a l V o l u m e sRaoul Zana and Ernest Yeager 521
R e a c t i o n o f A l C l ( g ) w i t h M g O ( c ) a n d t h e H e a t o f F o r m a t i o n o f M g A L O f f c ). D. Bhogeswara Rao and V. V. Dadape 537
R e v e r s i b l e P h o t o c h e m i c a l D i m e r i z a t i o n o f A c e n a p h t h y l e n e . I . T h e R e a c t i o n i n L i q u i d S o l u t i o n s. . Robert Livingston and Kei Sin Wei 541
R e v e r s i b l e P h o t o c h e m i c a l D i m e r i z a t i o n o f A c e n a p h t h y l e n e . I I . T h e R e a c t i o n i n t h e M o l t e na n d C r y s t a l l i n e P h a s e s . . . . . . . . . . . . . . . . . . . . . . . . . . . . . . . . . . . . . . . . . . . . . . . . . . . . . . . . . . . . . . . . . . . . . . . . . . . . . . . . . . . . . . . . Kei Sin Wei and Robert Livingston 5 4 8
A d s o r p t i o n o f P o t e n t i a l - D e t e r m i n i n g I o n s a t t h e F e r r i c O x i d e - A q u e o u s E l e c t r o l y t e I n t e r f a c e. . . R. J. Atkinson, A. M. Posner, and J. P. Quirk 550
R e a c t i o n o f NO(A2S +) w i t h C a r b o n D i o x i d e . . . . . . . . . . . . . . . . . . . . . . . . . . . . . . . . . . . . . . . . . . . . . . . . . . . . . . Norman Cohen and Julian Heicklen 5 5 8C a l o r i m e t r i c S t u d y o f S e l f - A s s o c i a t i o n o f 6 - M e t h y l p u r i n e i n W a t e r . . . . . . . . . . . . . . . . . . . . . . . . . . . . . P. R. Stoesser and S . J. G i l l 5 6 4
P r o t o n C h e m i c a l S h i f t s a n d H y d r o g e n B o n d i n g i n t h e T e r n a r y S y s t e m C a r b o n T e t r a c h l o r i d e - D i o x a n e - W a t e rNorbert Muller and Paul Simon 5 6 8
S t r u c t u r a l E f f e c t s o n t h e E n t h a l p y a n d E n t r o p y o f D i l u t i o n o f A q u e o u s S o l u t i o n s o f t h eQ u a t e r n a r y A m m o n i u m H a l i d e s a t 2 5 ° . . . . . . . . . . . . . . . . . . . . . . . . . . . . . . . . . . . . . . . . . . . . . . . . . . G . E . Boyd, J. W. Chase, and F. Vaslow 5 7 3
I o n i c I n t e r a c t i o n s i n O r g a n i c I o n E x c h a n g e r s . C o m p a r i s o n s w i t h M o d e l E l e c t r o l y t e M i x t u r e s. . S. Lindenbaum and G. E. Boyd 581
E x c i t e d - S t a t e R e a c t i v i t i e s . I I . B a s i c i t i e s o f S o m e P o l y m e t h y l b e n z e n e s i n T h e i r E x c i t e d S i n g l e t S t a t e s. . . R. L. Flurry, Jr., and R. Keith Wilson 589
O x i d a t i o n o f S o o t b y H y d r o x y l R a d i c a l s . . . . . . . . . . . . . . . . . . . . . . . . . . . . . . . . . . . . . . . . . . . . . . . . . . . . . . . . . . . . . . . . . . . . . . . C . P. Fenimore and G . W. Jones 5 9 3
3A

I m p o r t a n t T e x t s
f r o m
M c G r a w - H i l l
EXPERIMENTS IN PHYSICAL CHEMISTRY, Second Edition.B y D a v i d P. S h o e m a k e r and C a r l W . G a r l a n d , Massachusetts Institute o f Technology.
The new edition of this valuable laboratory textbook includes new, contemporary experiments and goes deeper into the theory of each experiment than the usual college-level text for a lecture course. Designed for a laboratory course at the junior-year level, the book includes 47 experiments, carefully selected to illustrate the principles of physical chemistry as well as to acquaint the student with experimental techniques. Both the theory illustrated or tested by each experiment and the phenomenological theory of the operation of the apparatus are fully covered.
New experiments have been added in the areas of chemical kinetics and macromolecules, and changes throughout clarify procedures and principles involved. Experimental procedures are described in detail to permit efficient operation of the laboratory where a designated number of experiments must be completed in a limited time. However, departures from these procedures are encouraged through variations in the experiments or through special projects. The preparation of written reports is also stressed and illustrated by a sample report. Winter
AD VAN CED CONCEPTS IN PHYSICAL CHEMISTRY.By E r n e s t D. K a u f m a n , St. M ary’s College.M c G r a w - H i l l U n d e r g r a d u a t e C h e m i s t r y S e r i e s
This valuable second- or third-year text extends the student’s knowledge of quantum mechanics, spectroscopy, statistical thermodynamics, kinetic molecular theory, and kinetics. Theoretical aspects are utilized for discussion, and examples demonstrate the wide applicability of the principles involved. Mathematical derivations facilitate understanding without excessive interpolations of steps. The latest developments in theoretical kinetics and some material not yet published even in professional journals are included. 288 pp., $9.95
PHYSICAL CHEMISTRY, Second Edition.B y G o r d o n M. B a r r o w , Case Institute o f T echnology.M c G r a w - H i l l U n d e r g r a d u a t e C h e m i s t r y S e r i e s
This undergraduate text helps students acquire a physical-chemical basis for studying organic, inorganic and analytical chemistry and biochemistry, and advanced physical chemical topics. The book directs the student toward a fuller awareness and comprehension of the molecular world and helps him to interpret macroscopic behavior in molecular terms. It has been carefully revised, supplemented, and reorganized for more flexible course use. and important new material has been added on thermodynamics and on the energies of collections of molecules. 768 pp., $12.50
Examination Copies Available on Request.McGRAW-HILL BOOH COMPANY
3 3 0 West 4 2 nd Street, New York, N.Y. 1 0 0 3 6
PHYSICAL CHEMISTSBASIC AND EXPLORATORY RESEARCHPostdoctoral or permanent research positions are available for physical
chemists with superior records. These positions are in the Research Center of the R. J. Reynolds Tobacco Company, a large diversifying manufacturer, and will consist of performing research with Dr. Karol J. Mysols.
Candidates should be interested in (a) the experimental study of basic problems in surface chemistry such as the nature of double-layer and van der Waal's forces between surfaces or the ultra-fast kinetics of desorption from solution interlaces and/or, (b) the exploration of new experimental or theoretical approaches to fields ot interest of the Company, such as aerosols, biopolymers, boundary lubrication, organoleptic phenomena, etc.
Research facilities are located in Winston-Salem, N. C., a pleasant, progressive community. Salary open.
Please write lull details ot education, experience and salary requirements to: Mr. Watt C. White, Jr., Research Department.
R. J. REYNOLDS TOBACCO COMPANYWinston-Salem, North Carolina
• Tobacco Products • Food and Industrial Corn Products Fruit Juice Beverages • Packaging Materials
An Cquâl Opportunity Employe'
4A • The Journal of Physical Chemistry
Cobalt-60 7 Radiolysis of Solutions of Potassium Bromide in 0.8 N Sulfuric A c i d ................................. Farhataziz
The Conformational Transition of Poly (methacrylic acid) in SolutionM . M andel, J. C. Leyte, and M. G. Stadhouder
The Pyridine-Sensitized Isomerization of cis-2-B utene........................................................................... Jacques Lem aire
Application of Irreversible Thermodynamics to Electrolyte Solutions. II. Ionic Coefficients forIsothermal Vector Transport Processes in Ternary Systems.......................................................... D onald G. M iller
Electron Spin Resonance Studies of Aromatic Hydrocarbons Adsorbed on Silica Alumina. I. PeryleneG. M. M uha
Electron Spin Resonance Studies of Aromatic Hydrocarbons Adsorbed on Silica-Alumina. II. AnthraceneG. M. M uha
Intramolecular Hydrogen Bonding and Potential Functions of Carboxylic and Percarboxylic AcidsW. V. F. Brooks and Clyde M . Haas
The Dielectric Constant of Water and Heavy Water between 0 and 40°G. A. V idulieh, D. F. Evans, and R. L. Kay
Electromotive Force Studies in Aqueous Solutions at Elevated Temperatures. VIII. The ThermodynamicProperties of Hydrochloric Acid-Lanthanum Chloride Mixtures . M . H. L ietzke and R . W . S toughton
Structure and Electrolyte Properties in Bolaform Electrolytes. II. The Conductance of Potassium Salts of Several Rigid Bolaform Disulfonic Acids in Dioxane-Water Mixtures at 25°
Bert R . Staples and G ordon A tkinson
The Kinetics of Ion Association in Manganese Sulfate Solutions. II. Thermodynamics of StepwiseAssociation in W a t e r ................................................................................................ G ordon A tkinson and S. K . K or
Mechanism of Oxygen Isotopic Exchange in Mixtures of Carbon Monoxide and Oxygen in a Quartz Vessel. . . E. A. Th. V erdurm en
Structure and Properties of Amorphous Silicoaluminas. III. Hydrated Aluminas and Transition AluminasA. J. Léonard, F. Van Cauwelaert, and J. J. Fripiat
Radiolysis of Cyclohexane and a Mixture of Cyclohexane and Benzene K ent H. Jones
Time Variation of Ionic and Neutral Evaporation from Alkali Metal Iodides on a Heated Platinum Surface. H iroyuki Kaw ano and H ok otom o Inouye
The Carbon Tetrachloride Sensitized Photooxidation of Leuco Ethyl Crystal V io let............................. A. M acLachlan
Proton Resonance Spectra of Selected Mono-, Di-, and Trisubstituted Silanes. . . H. J. C am pbell-Ferguson , E. A. V. Ebsworth, A. G. M acD iarm id, and T. Y oshioka
Reaction Boundaries and Elution Profiles in Column ChromatographyL. W. N ichol, A. G. Ogston, and D. J. W inzor
The Dehydration of Porous G la s s .......................................................... M . J. D. Low and N. R am asubram anian
Adsorption of Sodium Dodecyl Sulfate at Various Hydrocarbon-Water Interfaces.........................Selwyn J. R ehfeld
Acid -Base Properties of Quartz Suspensions................................. S. Storgaard J0rgensen and A. T ovborg Jensen
Ionization of Diketocyclobutenediol and Its Metal C om plexes............................. D. T . Ireland and H. F. W alton
The Radiolysis of Ethanol. V. Reactions of the Primary Reducing Species in the Liquid PhaseJ. C. Russell and G. R . Freem an
NOTES
Disproportionation and Combination Reactions of Isopropoxy Radicals with Nitric Oxide. Barbara E. Ludw ig and G. R . M cM illan
Miscibility of Metals with Salts. VII. The Potassium Potassium Sulfide SystemA. S. Dw orkin and M . A. Bredig
The Nitrogen-14 Nuclear Quadrupole and Spin-Rotation Coupling Constants in Methyl Isocyanide andMethyl C y a n id e ........................................................................... M . K . K em p, J. M . P ochan , and W . H. Flygare
Photosensitized Reactions of Cinnamate E s te rs ................................. H. G. C urm e, C. C. Natale, and D. J. K elley
Magnetic Susceptibility Changes in Silver Powders during Oxidation-Reduction Cycling . A. W . Czanderna
The Radiation-Induced Oxidation of Peptides in Aqueous Solutions. H arriette L. Atkins, W inifred B ennett-C orn iea , and W arren M . Garrison
Volume 71, Number 3 February 1967 •
598
602
612
616
633
640
650
656
662
667
673
673
695
709
712
718
723
726
730
738
745
751
755
762
734
765
767
770
772
5 A

Think small !..............CHEMICAL ABSTRACTS on
M i c r o f i l m
1 Volume (13 Issues) of ______ 1 Volume (13 Issues) ofCHEMICAL ABSTRACTS ----------- CHEMICAL ABSTRACTS
on Microfilm
If y o u w o u ld l ik e t o p a c k a lo t in to a s m a l l s p a c e , C H E M IC A L A B S T R A C T S o n M ic r o f i lm w ill s u i t y o u r n e e d s . A ll 3 . 4 m il l io n a b s t r a c t s p u b l i s h e d s i n c e 1 9 0 7 a r e f i lm e d o n 1 6 m m m i c r o f i lm t o f o r m a r e a d i ly a c c e s s i b l e f i l e d o c u m e n t i n g 5 9 y e a r s o f c h e m i c a l p r o g r e s s .
Y o u c a n f in d a b s t r a c t s q u i c k l y a n d e a s i ly , u s in g a v a r ie t y o f m i c r o f i l m r e a d e r -p r in t e r e q u i p m e n t . A b s t r a c t s m a y b e p h o t o c o p i e d a t t h e t o u c h o f a b u t t o n , e l im in a t in g t h e n e e d t o m a k e h a n d w r it t e n n o t e s . A s a c o n s e q u e n c e u s e r s r e p o r t a s u b s t a n t ia l t im e s a v in g a n d i n c r e a s i n g u s e o f C H E M IC A L A B S T R A C T S .
T o f in d o u t h o w y o u c a n u s e t h is m o d e r n in fo r m a t io n t o o l in y o u r p r o g r a m , w r ite o r t e l e p h o n e E. G . J o h n s o n , S u b s c r i b e r I n fo r m a t io n D e p a r t m e n t ( 6 1 4 2 9 3 - 5 0 2 2 ) .
Columbus, Ohio 43216
6A • The Journal of Physical Chemistry

COM M UNICATIONS TO THE EDITOR
The Absorption Spectrum of the Allyl Radical by Pulse Radiolysis. E. J. Burrell, Jr., and P. K. B hattacharyya 774
Reply to Bond Lengths in Iron Pentacarbonyl.............................................................. M . I. Davis and H. P. H anson 775
The Iron Pentacarbonyl P ro b le m ............................................................................................J. D onohue and A. Caron 777
Comments on the Paper, “ Cation Exclusion from Gels,” by R. A. H o r n e ................................. Russell W . M aatm an 778
Double-Layer Perturbation without Equilibrium between Concentrations and Potential. P. Delahay, K . H olub, G. Susbielles, and G. Tessari 779
Barium Ion Exchange of Linde 1 3 - X .......................................................................................................... H ow ard S. Sherry 780
Simultaneous Voltammetric Generation of U(III) and Spectrophotometric Observation of the U (III)-U (IV )System in Molten Lithium Fluoride-Beryllium Fluoride-Zirconium Fluoride
J. P. Y oung, Gleb M am antov, and F. L. W hiting 782
Reactions of Thiyl Radicals. I. Methylthiyl Recombination and Thionitrite Formation in thePhotolysis of M ethaneth iol...............................................................R . P. Steer, B. L. Kalra, and A. R . K n ight 783
Radiation-Induced Isomerization of H exafluorobenzene................................. J. Fajer and D. R . M acK enzie 784
Corrections of Schlieren D a t a ........................................................................................H. J. Vreem an and Y. W iersem a 785
Volume 71, Number S February 1967 • 1A
AUTHOR INDEX
Atkins, H. L., 772 Atkinson, G., 667, 673 Atkinson, R. J., 550
Basila, M. R., 467 Bennett-Corniea, W.,
772Bhattacharyya, P. K.,
774Boyd, G. E., 573, 581 Brandes, K. K., 508 Bredig, M. A., 764 Brooks, W. V. F.,
650Burrell, E. J., Jr., 774
Campbell-F erguson,H. J., 723
Caron, A., 777 Chase, J. W., 573 Cohen, N., 558 Curme, H. G., 767 Czanderna, A. W.,
770
Dadape, V. V., 537 Davis, M. L, 775 Delahay, P., 779 Donohue, J., 777 Dunlop, P. J., 483 Dworkin, A. S., 764
Ebsworth, E. A. V., 723
Evans, D. F., 656 Ewing, C. T., 473
Fajer, J., 784 Farhataziz, 598 Fenimore, C. P., 593 Flurry, R. L., Jr., 589 Flygare, W. H., 765 Freeman, G. R., 755 Fripiat, J. J., 695
Garrison, W. M., 772 Gerdes, R. J., 508 Gill, S. J., 564 Grunwald, E., 492 Gupta, A. R., 500
Haas, C. M., 650 Hanson, H. P., 775 Harris, K. R., 483 Heicklen, J., 558 Holub, K., 779
Ingalls, R. B., 486 Inouye, H., 712 Ireland, D. T., 751
Jacobsen, R. T., 514 Jensen, A. T., 745 Jones, G. W., 593
Jones, K. H., 709 Jorgensen, S. S., 745 Jumper, C. F., 492
Kalra, B. L., 783 Kantner, T. R., 467 Kawano, H., 712 Kay, R. L., 656 Kelley, D. J., 767 Kemp, M. K., 765 Kerker, M., 514 Knight, A. R., 783 Kor, S. K., 673 Kropp, J. L., 477
Lemaire, J., 612 Leonard, A. J., 695 Leyte, J. C., 603 Lietzke, M. H., 662 Lindenbaum, S., 581 Livingston, R.,l541,]
548Low, M. J. D., 730 Ludwig, B. E., 762
Maatman, R. W., 778 MacDiarmid, A. G.,
723MacKenzie, D. R.,
784MacLachlan, A., 718 Mamantov, G., 782
Mandel, M., 603 Matijevic, E., 514 McMillan, G. R „ 762 Miller, D. G., 616 Miller, R. R., 473 Muha, G. M., 633,
640Muller, N., 568
Natale, C. C., 767 Nichol, L. W., 726
Ogston, A. G., 726
Pochan, J. M., 765 Posner, A. M., 550 Puar, M. S., 492
Quirk, J. P., 550
Ramasubramanian, N „ 730
Rao, D. B., 537 Rehfeld, S. J., 738 Russell, J. C., 755
Sarpal, S. K., 500 Scarborough, J. M.,
486Sherry, H. S„ 780 Simon, P., 568 Spann, J. R., 473
Stadhouder, M. G., 603
Staples, B. R., 667 Steer, R. P., 783 Stoesser, P. R., 564 Stone, J. P., 473 Stoughton, R. W.,
662Susbielles, G., 779
Tessari, G., 779
Van Cauwelaert, F., 695
Vaslow, F., 573 Verdünnen, E. A. Th.,
678Vidulich, G. A., 656 Vreeman, H. J., 785
Walton, H. F., 751 Wei, K. S., 541, 548 Whiting, F. L., 782 Wiersema, Y., 785 Wilson, R. K., 589 Windsor, M. W., 477 Winzor, D. J., 726Yeager, E., 521 Yoshioka, T., 723 Young, J. P., 782
Zana, R., 521
8 A • The Journal of Physical Chemistry

T H E J O U R N A L O F
P H Y S I C A L C H E M I S T R YR eg istered in U . S . P a ten t Office © C op yrigh t, 1967 , by the A m er ica n C h em ica l S ocie ty
VOLUME 71, NUMBER 3 FEBRUARY 15, 1967
T h e I n f r a r e d S p e c t r u m o f A m m o n ia A d s o r b e d o n S i l i c a - A lu m in a
b y M i c h a e l R . B a s i l a a n d T h e o d o r e R . K a n t n e r
G u lf Research & Developm ent Co., Pittsburgh, P ennsylvania {Received October 28, 1966)
An infrared spectroscopic study of ammonia adsorbed on silica-alumina has shown that physically adsorbed NH3, coordinately bonded NH3, and NH4+ are the only detectable adsorbed species. From the relative intensities of the appropriate bands, the ratio of Lewis and Br0nsted acid sites was found to be 4:1. As in the case of pyridine chemisorption, the effect of H20 was to convert a portion of the Lewis sites to Bronsted sites. Subsequent evacuation selectively removed H20 and the original distribution of Lewis and Br0nsted acid sites was recovered. The results of this study are consistent with and hence support the model proposed in which all of the primary acid sites on a silica- alumina are of the Lewis type centered on active surface aluminum atoms, and apparent Br0nsted sites are produced by a second-order interaction between the molecule chemisorbed on a Lewis site and a nearby surface hydroxyl group. Direct spectroscopic evidence for the transfer of protons from a chemisorbed molecule to a physically adsorbed molecule was obtained in a study of the dual adsorption of ammonia and pyridine.
I n t r o d u c t i o n
The amount of ammonia adsorbed at a given temperature is frequently used as a measure of the number of acid sites of a given strength (defined arbitrarily by the temperature) on a catalytic surface.1'2 3 4 5 6 A number of studies have been made of the infrared spectrum of NH3 adsorbed on a variety of surfaces, such as synthetic silica-alumina,3-6 alumina,7’8 porous glass,9'10 iron oxide,11 natural aluminum silicates,12 and zeolites.13 The object of most of these studies was to distinguish between Lewis and Br0nsted type acid sites by utilizing differences in the infrared spectra of coordinately bonded NH3 (LNH3) and NH4+. In all but the silica- aluminas, only LNH3 (or its decomposition products) are observed.7-11 In synthetic silica-alumina cracking catalysts both LNH3 and NH4+ are observed with LNH3 predominating in the highly dehydrated and
NH4+ predominating in the hydrated form.3-7 Both species are also observed on the zeolite, the ratio being dependent on the degree of hydration.13 On the other
(1) A. N. Webb, In d . E ng. Chem ., 49, 261 (1957).(2) R. T. Barth and E. V. Ballou, A n a l. Chem ., 33, 1080 (1961).(3) J. E. Mapes and R. P. Eischens, J . P h y s . Chem ., 58, 1059 (1954).(4) L. M. Roev, V. N. Filimonov, and A. N. Terenin, Opt. i S pektro- skopiya , 4 , 328 (1958).(5) D. E. Nicholson, N ature, 186, 630 (1960).(6) J. J. Fripiat, A. Leonard, and J. B. Uytterhoeven, J . P h ys. Chem ., 69, 3274 (1965).(7) R. P. Eischens and W. A. Pliskin, “ Advances in Catalysis,” Vol. X , Academic Press, Inc., New York, N. Y., 1958, pp 1-56.(8) (a) J. B. Peri and R. B. Hannan, J . P h ys . Chem ., 64, 1526 (1960); (b) J. B. Peri, ibid., 69, 231 (1965).(9) (a) M. Folman and D. J. C. Yates, P roc . R oy . Soc. (London),A246, 32 (1958). (b) M. Folman and D. J. C. Yates, J . P hys. Chem.,63, 183 (1959).(10) M. Folman, Trans. F araday Soc., 57, 2000 (1961).
467

468 M ichael R. Basila and T heodore R. K antner
hand, only the adsorbed NH<t+ species was observed on natural aluminum silicates.11 12 13 14 15
Recent studies of the infrared spectrum of pyridine chemisorbed on a synthetic silica-alumina cracking catalyst have indicated the presence of both Lewis and Brpnsted acid sites.14-16 Estimates16 of the relative absorption coefficients of the bands characteristic of the protonated and coordinately bonded chemisorbed species led to the conclusion that the ratio of Lewis to Brpnsted acid sites is approximately six. The present paper reports a study of the infrared spectrum of ammonia adsorbed on the same synthetic silica-alumina.E x p e r i m e n t a l S e c t i o n
Materials. The silica-alumina used in this work was the same sample of American Cyanamid Triple A that was used in our previous work.15-17 It contains 25% A120 3 by weight on a dry basis and has a surface area of 430 m2/g.
Matheson anhydrous ammonia was distilled in vacuo over P2O5 through a glass wool-P20 5 drying train immediately before use. This treatment lowered the H20 content to less than 0.1% as estimated by infrared measurements.
Techniques. The preparation of catalyst samples and spectroscopic techniques were identical with those used in our previous work.15-17 The sample wafers were slowly heated with continuous evacuation from ambient to 500° over a 3-hr period after which they were calcined in oxygen for 4 hr or longer at 500°. Following calcination, the samples were evacuated at 500° for at least 3 hr, but generally overnight. A conventional vacuum system capable of maintaining pressures in the 10_6-mm range was used. Samples prepared by this technique are referred to as SA.
A Perkin-Elmer 421 grating spectrophotomer was used to record the spectra in most of the work. For a few experiments a Perkin-Elmer 221 prism-grating instrument was used. Both instruments were frequency calibrated against known standards. The frequencies quoted are believed to be within 1 or 2 cm-1 of the true values. The spectral slit width of the Model 421 was approximately 2-3 cm-1 and that of the Model 221 was roughly 4 cm“ 1. All spectra were recorded at room temperature using standard instrument settings. In some cases an attenuator was used in the reference beam to compensate for losses due to reflection and scattering by the sample.
A conventional quartz spiral balance having a sensitivity of 0.5 mm/mg was used for the quantitative chemisorption experiments.R e s u l t s
Ammonia Chemisorption on Silica-Alumina. In
Figure 1. (a) SA calcined 16 hr in O2 at 500°, evacuated 5 hrat 500°; (b) exposed to 10 mm of NHj for 1 hr at 150°,evacuated 1 hr at 150°; (c) subsequently exposed to10 mm of NH3 for 1 hr at 25°, evacuated for 1 hr at25°; (d) subsequently exposed to 10 mm of NHSfor 1 hr, no evacuation. Very weak bands dueto gaseous NH3 have been subtracted.
Figure 1 spectra of NH3 adsorbed on SA under various conditions are given. The bands in spectrum (a) of SA have been previously assigned.17 The band at 3745 cm“ 1 is due to free (nonhydrogen-bonded) surface OH groups attached to surface Si atoms; the band at 1633 cm-1 is an SiO overtone and is associated with the lattice rather than the surface; the band at 1394 cm“ 1, on the other hand, is due to a surface group which has not been identified to date. In (b) the spectrum of NH3 adsorbed on SA at 150° is given. The NH3 was added by exposing the evacuated SA to 10 mm of NH3 vapor for 1 hr and evacuating for 1 hr, all at 150°. Bands are observed at 3341, 3280, 3230, 3195, 1620, and 1432 cm” 1. A decrease in the intensity of the 3745- cm“ 1 band and the disappearance of the 1394-cm“ 1 band are also noted. In (c) the spectrum of NH3 adsorbed at 25° is given. The NH3 was adsorbed by the same 1-hr exposure and 1-hr evacuation technique. All bands increased in intensity except the 3745- cm“ 1 band which decreased. In (d) the spectrum of
(11) G. Blyholder and E. A. Richardson, J. P h ys . Chem ., 66, 2597 (1962).(12) M. M. Mortland, J. J. Fripiat, J. Chaussidon, and J. Uytter- hoeven, ibid., 67, 248 (1963).(13) J. B. Uytterhoeven, L. G. Christner, and W. K. Hall, ib id ., 69, 2117 (1965).(14) E. P. Parry, J. Catalysis, 2, 371 (1963).(15) M. R. Basila, T. R. Kantner, and K. H. Rhee, J. P h ys . Chem ., 68, 3197 (1964).(16) M. R. Basila and T. R. Kantner, ibid., 70, 1681 (1966).(17) M. R. Basila, ibid., 66, 2223 (1962).
The Journal of Physical Chemistry
Infrared Spectrum of Ammonia Adsorbed on Silica-A lumina 469
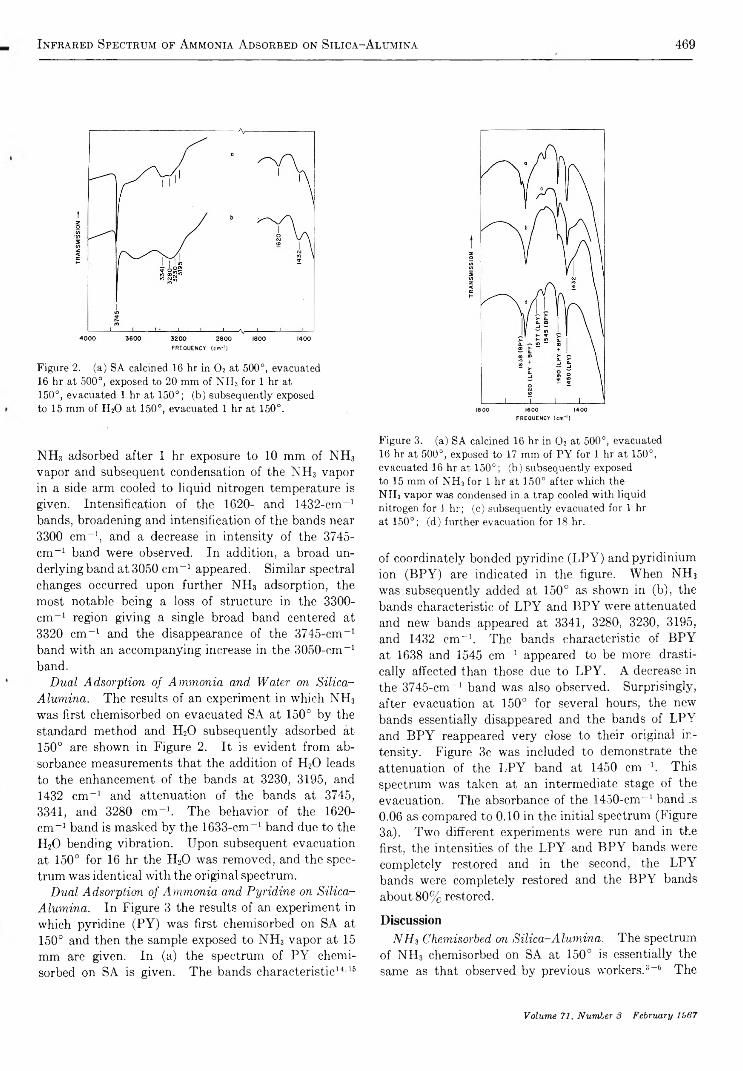
FREQUENCY (cm-1)Figure 2. (a) SA calcined 16 hr in O2 at 500°, evacuated16 hr at 500°, exposed to 20 mm of NH3 for 1 hr at 150°, evacuated 1 hr at 150°; (b) subsequently exposed to 15 mm of H20 at 150°, evacuated 1 hr at 150°.
NH3 adsorbed after 1 hr exposure to 10 mm of NH3 vapor and subsequent condensation of the NH3 vapor in a side arm cooled to liquid nitrogen temperature is given. Intensification of the 1620- and 1432-cm“ 1 bands, broadening and intensification of the bands near 3300 cm-1, and a decrease in intensity of the 3745- cm "1 band were observed. In addition, a broad underlying band at 3050 cm-1 appeared. Similar spectral changes occurred upon further NH3 adsorption, the most notable being a loss of structure in the 3300- cm_1 region giving a single broad band centered at 3320 cm-1 and the disappearance of the 3745-cm"1 band with an accompanying increase in the 3050-cm-1 band.
Dual Adsorption of Ammonia and Water on Silica- Alumina. The results of an experiment in which NH3 was first chemisorbed on evacuated SA at 150° by the standard method and H20 subsequently adsorbed at 150° are shown in Figure 2. It is evident from absorbance measurements that the addition of H20 leads to the enhancement of the bands at 3230, 3195, and 1432 cm-1 and attenuation of the bands at 3745, 3341, and 3280 cm-1. The behavior of the 1620- c m '1 band is masked by the 1633-cm"1 band due to the H20 bending vibration. Upon subsequent evacuation at 150° for 16 hr the H20 was removed, and the spectrum was identical with the original spectrum.
Dual Adsorption of Ammonia and Pyridine on Silica- Alumina. In Figure 3 the results of an experiment in which pyridine (PY) was first chemisorbed on SA at 150° and then the sample exposed to NH3 vapor at 15 mm are given. In (a) the spectrum of PY chemisorbed on SA is given. The bands characteristic14'16
Figure 3. (a) SA calcined 16 hr in 0 2 at 500°, evacuated16 hr at 500°, exposed to 17 mm of PY for 1 hr at 150°, evacuated 16 hr at 150°; (b) subsequently exposed to 15 mm of NH3 for 1 hr at 150° after which the NH3 vapor was condensed in a trap cooled with liquid nitrogen for 1 hr; (c) subsequently evacuated for 1 hr at 150°; (d) further evacuation for 18 hr.
of coordinately bonded pyridine (LPY) and pyridinium ion (BPY) are indicated in the figure. When NH3 was subsequently added at 150° as shown in (b), the bands characteristic of LPY and BPY were attenuated and new bands appeared at 3341, 3280, 3230, 3195, and 1432 cm-1. The bands characteristic of BPY at 1638 and 1545 cm "1 appeared to be more drastically affected than those due to LPY. A decrease in the 3745-cm-1 band was also observed. Surprisingly, after evacuation at 150° for several hours, the new bands essentially disappeared and the bands of LPY and BPY reappeared very close to their original intensity. Figure 3c was included to demonstrate the attenuation of the LPY band at 1450 cm "1. This spectrum was taken at an intermediate stage of the evacuation. The absorbance of the 1450-cm"1 band :s 0.06 as compared to 0.10 in the initial spectrum (Figure 3a). Two different experiments were run and in the first, the intensities of the LPY and BPY bands were completely restored and in the second, the LPY bands were completely restored and the BPY bands about 80% restored.
DiscussionNH3 Chemisorbed on Silica-Alumina. The spectrum
of NH3 chemisorbed on SA at 150° is essentially the same as that observed by previous workers.3" 6 The
Volume 71, Number 3 February 1967
470 M ichael R. Basila and T heodore R. K antner
assignment of the bands is summarized in Table I. These assignments are supported by the observation that the dual adsorption of H20 and NH3 on SA enhances the bands at 3230, 3195, and 1432 cm-1 which have been assigned to LNH3. The net effect of H20 is to increase the protonated chemisorbed species at the expense of the coordinately bonded chemisorbed species, as has been shown in other work14’16 on the dual adsorption of H20 and pyridine. The H20 is removed by extended evacuation giving the original distribution of LNH3 and NH4+ as was observed in the dual adsorption of pyridine and H20 .16
Table I : Assignment of the Bands of NH3 Chemisorbed on Silica-Alumina
Frequency, Adsorbedcm-1 species“ Assignment
3341 l n h 3, p n h 3 n (e) (NH stretch)3280 LNH3, PNHa v i (a4) (NH stretch)3230 n h 4+ v s (t2) (NH stretch)3195 n h 4+ v i (ai) (NH stretch)1620 l n h 3, p n h 3 v t (1) (HNH deformation)1432 n h 4+ v ì (t2) (HNH deformation)
0 See text for definitions of LNH3 and PNH3.
Model for Brflnsted Sites on Silica-Alumina. In our earlier work16 it was suggested that all the primary acidic sites on a highly dehydrated silica-alumina are of the Lewis type. It was also suggested that surface OH groups adjacent to Lewis acid sites can transfer protons to a molecule chemisorbed on a Lewis site provided that the interaction distance does not exceed the CID (critical interaction distance) and that the molecule is suitably activated by the Lewis site. A similar conclusion was reached by Fripiat, et al.f in a study of ammonia chemisorption on a series of silica- aluminas in various stages of dehydration. The nature of the chemisorbed molecule is an important factor; for example, an olefin requires a proton to form a classical carbonium ion, whereas a paraffin can form a classical carbonium ion by hydride abstraction, as proposed by Leftin and Hall,18 and hence does not require a proton.
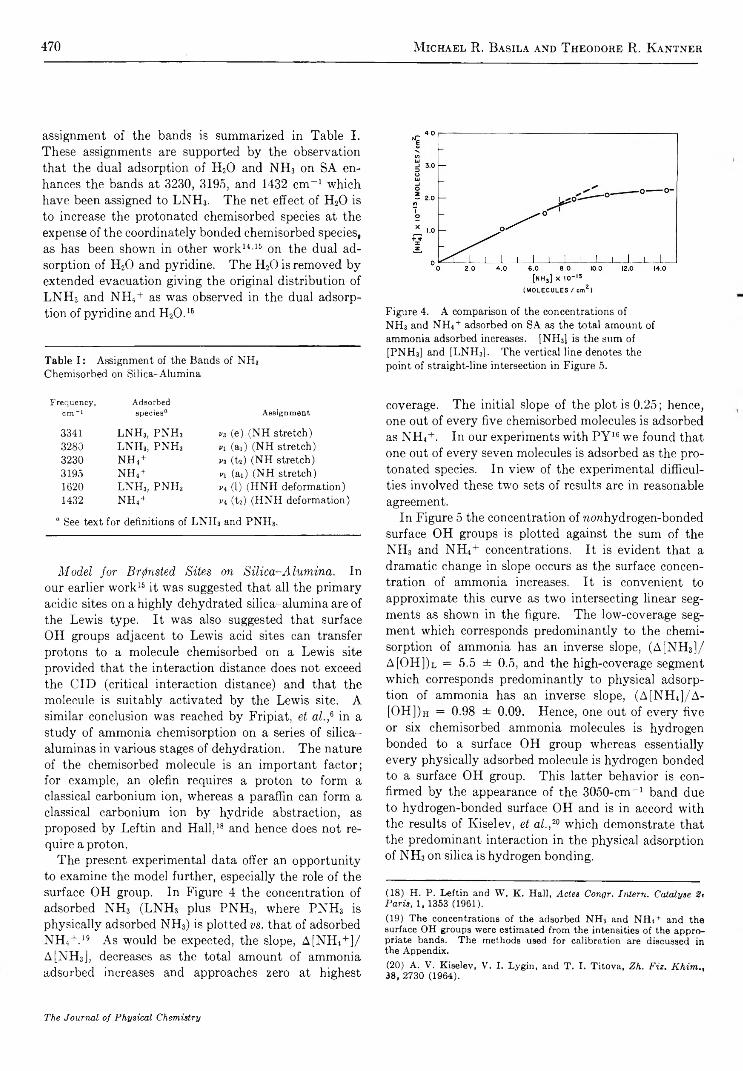
The present experimental data offer an opportunity to examine the model further, especially the role of the surface OH group. In Figure 4 the concentration of adsorbed NH3 (LNH3 plus PNH3, where PNH3 is physically adsorbed NH3) is plotted vs. that of adsorbed NH4+.19 A s would be expected, the slope, A[NH4+]/ A[NH3], decreases as the total amount of ammonia adsorbed increases and approaches zero at highest
Figure 4. A comparison of the concentrations of NH3 and NH4 + adsorbed on SA as the total amount of ammonia adsorbed increases. [NH3] is the sum of [PNH3] and [LNH3] . The vertical line denotes the point of straight-line intersection in Figure 5.
coverage. The initial slope of the plot is 0.25; hence, one out of every five chemisorbed molecules is adsorbed as NH4+. In our experiments with P Y 16 we found that one out of every seven molecules is adsorbed as the protonated species. In view of the experimental difficulties involved these two sets of results are in reasonable agreement.
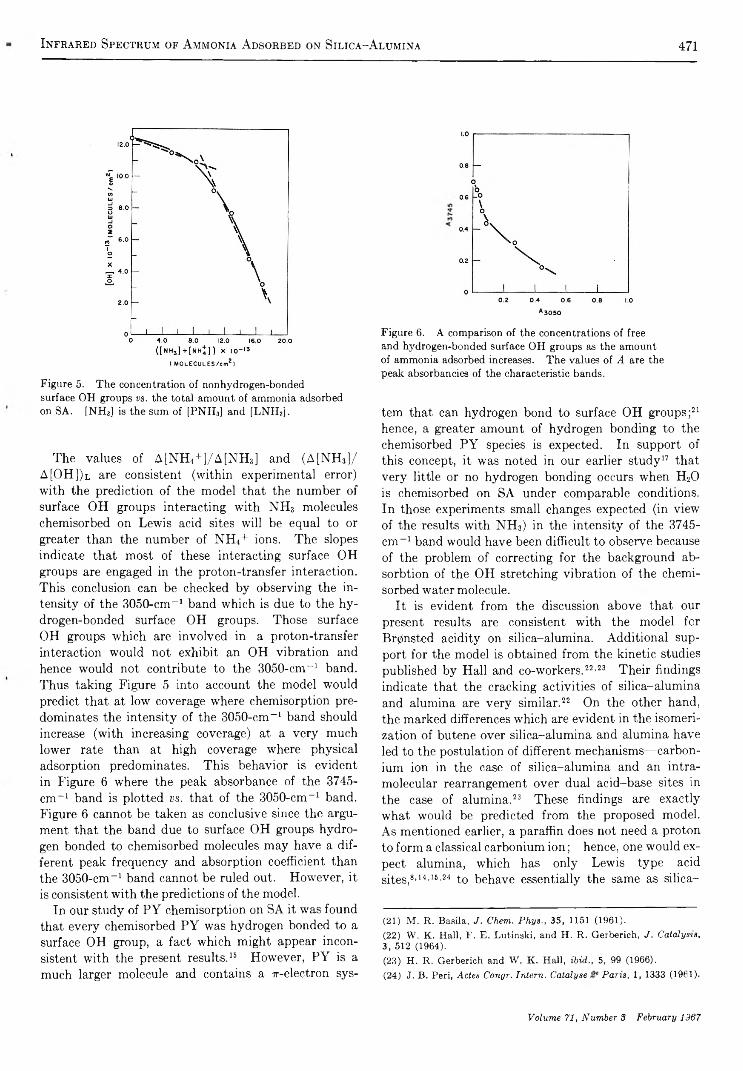
In Figure 5 the concentration of norehydrogen-bonded surface OH groups is plotted against the sum of the NH3 and NH4+ concentrations. It is evident that a dramatic change in slope occurs as the surface concentration of ammonia increases. It is convenient to approximate this curve as two intersecting linear segments as shown in the figure. The low-coverage segment which corresponds predominantly to the chemisorption of ammonia has an inverse slope, (A[NH3] / A[OH])l = 5.5 ± 0.5, and the high-coverage segment which corresponds predominantly to physical adsorption of ammonia has an inverse slope, (A[NH4]/A - [OH])h = 0.98 ± 0.09. Hence, one out of every five or six chemisorbed ammonia molecules is hydrogen bonded to a surface OH group whereas essentially every physically adsorbed molecule is hydrogen bonded to a surface OH group. This latter behavior is confirmed by the appearance of the 3050-cm-1 band due to hydrogen-bonded surface OH and is in accord with the results of Kiselev, et al.,20 which demonstrate that the predominant interaction in the physical adsorption of NH3 on silica is hydrogen bonding.
(18) H. P. Leftin and W. K. Hall, Actes Congr. Intern. Catalyse 2? Paris, 1,1353 (1961).(19) The concentrations of the adsorbed NHs and NH4+ and the surface OH groups were estimated from the intensities of the appropriate bands. The methods used for calibration are discussed in the Appendix.(20) A. V. Kiselev, V. I. Lygin, and T. I. Titova, Zh. Fiz. K him ., 38, 2730 (1964).
The Journal of Physical Chemistry
Infrared Spectrum of Ammonia Adsorbed on Silica-A lumina 471
( MOLECULES/em2)Figure 5. The concentration of nonhydrogen-bonded surface OH groups v s . the total amount of ammonia adsorbed on SA. [NH3] is the sum of [PNH3] and [LNH3],
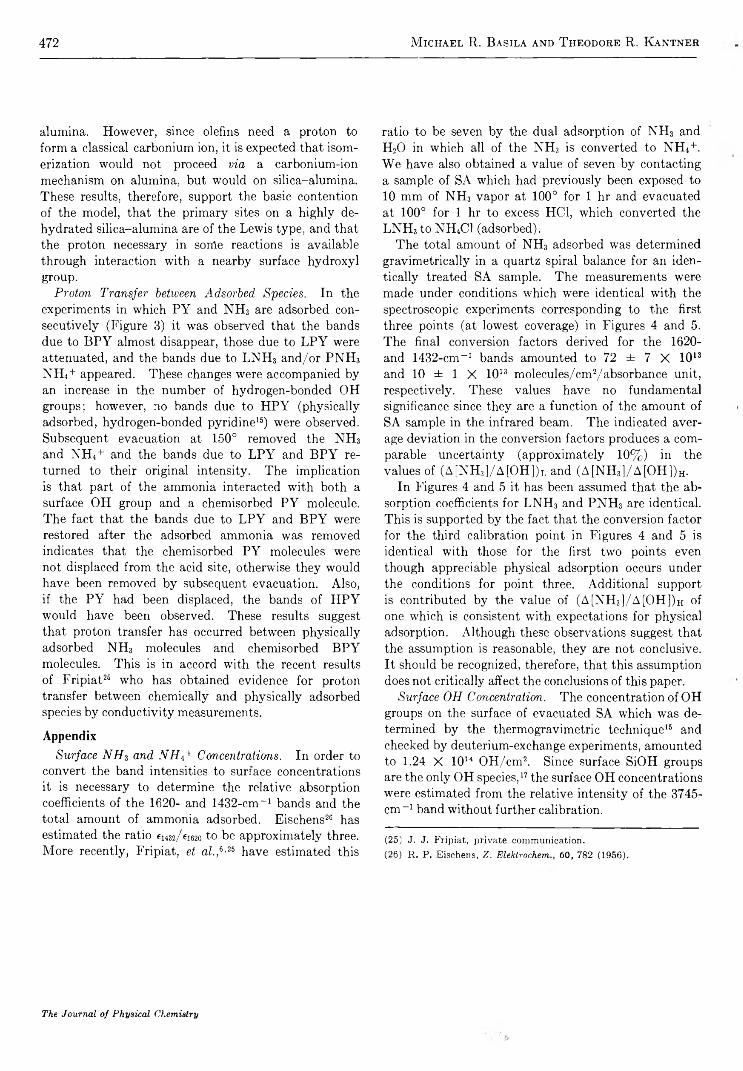
The values of A[NH4+]/A[NH3] and (A[NH»]/ A[OH])l are consistent (within experimental error) with the prediction of the model that the number of surface OH groups interacting with NH3 molecules chemisorbed on Lewis acid sites will be equal to or greater than the number of NH4+ ions. The slopes indicate that most of these interacting surface OH groups are engaged in the proton-transfer interaction. This conclusion can be checked by observing the intensity of the 3050-cm_1 band which is due to the hydrogen-bonded surface OH groups. Those surface OH groups which are involved in a proton-transfer interaction would not exhibit an OH vibration and hence would not contribute to the 3050-cm_1 band. Thus taking Figure 5 into account the model would predict that at low coverage where chemisorption predominates the intensity of the 3050-cm-1 band should increase (with increasing coverage) at a very much lower rate than at high coverage where physical adsorption predominates. This behavior is evident in Figure 6 where the peak absorbance of the 3745- c m '1 band is plotted vs. that of the 3050-cm-1 band. Figure 6 cannot be taken as conclusive since the argument that the band due to surface OH groups hydrogen bonded to chemisorbed molecules may have a different peak frequency and absorption coefficient than the 3050-cm-1 band cannot be ruled out. However, it is consistent with the predictions of the model.
In our study of PY chemisorption on SA it was found that every chemisorbed PY was hydrogen bonded to a surface OH group, a fact which might appear inconsistent with the present results.15 However, PY is a much larger molecule and contains a ^-electron sys-
Figure 6. A comparison of the concentrations of free and hydrogen-bonded surface OH groups as the amount of ammonia adsorbed increases. The values of A are the peak absorbancies of the characteristic bands.
tern that can hydrogen bond to surface OH groups;21 hence, a greater amount of hydrogen bonding to the chemisorbed PY species is expected. In support of this concept, it was noted in our earlier study17 that very little or no hydrogen bonding occurs when H20 is chemisorbed on SA under comparable conditions. In those experiments small changes expected (in view of the results with NH3) in the intensity of the 3745- cm_1 band would have been difficult to observe because of the problem of correcting for the background ab- sorbtion of the OH stretching vibration of the chemisorbed water molecule.
It is evident from the discussion above that our present results are consistent with the model for Br0nsted acidity on silica-alumina. Additional support for the model is obtained from the kinetic studies published by Hall and co-workers.22,23 Their findings indicate that the cracking activities of silica-alumina and alumina are very similar.22 On the other hand, the marked differences which are evident in the isomerization of butene over silica-alumina and alumina have led to the postulation of different mechanisms— carbon- ium ion in the case of silica-alumina and an intramolecular rearrangement over dual acid-base sites in the case of alumina.23 24 These findings are exactly what would be predicted from the proposed model. As mentioned earlier, a paraffin does not need a proton to form a classical carbonium ion ; hence, one would expect alumina, which has only Lewis type acid sites,8,14,16,24 to behave essentially the same as silica-
(21) M. R. Baaila, J. Chem. Phys., 35, 1151 (1961).(22) W. K. Hall, F. E. Lutinski, and H. R. Gerberich, J . Catalysis, 3, 512 (1964).(23) H. R. Gerberich and W. K. Hall, ibid., 5, 99 (1966).(24) J. B. Peri, Actes Congr. Intern. Catalyse Paris, 1, 1333 (1961).
Volume 71, Number S February 1367
472 M ichael R. Basila and T heodore R. Kantner
alumina. However, since olefins need a proton to form a classical carbonium ion, it is expected that isomerization would not proceed via a carbonium-ion mechanism on alumina, but would on silica-alumina. These results, therefore, support the basic contention of the model, that the primary sites on a highly dehydrated silica-alumina are of the Lewis type, and that the proton necessary in sorfle reactions is available through interaction with a nearby surface hydroxyl group.
Proton Transfer between Adsorbed Species. In the experiments in which PY and NH3 are adsorbed consecutively (Figure 3) it was observed that the bands due to BPY almost disappear, those due to LPY were attenuated, and the bands due to LNH3 and/or PNH3 NH4+ appeared. These changes were accompanied by an increase in the number of hydrogen-bonded OH groups; however, no bands due to HPY (physically adsorbed, hydrogen-bonded pyridine15) were observed. Subsequent evacuation at 150° removed the NH3 and NH,t+ and the bands due to LPY and BPY returned to their original intensity. The implication is that part of the ammonia interacted with both a surface OH group and a chemisorbed PY molecule. The fact that the bands due to LPY and BPY were restored after the adsorbed ammonia was removed indicates that the chemisorbed PY molecules were not displaced from the acid site, otherwise they would have been removed by subsequent evacuation. Also, if the PY had been displaced, the bands of HPY would have been observed. These results suggest that proton transfer has occurred between physically adsorbed NH3 molecules and chemisorbed BPY molecules. This is in accord with the recent results of Fripiat25 who has obtained evidence for proton transfer between chemically and physically adsorbed species by conductivity measurements.
AppendixSurface NH3 and NH4+ Concentrations. In order to
convert the band intensities to surface concentrations it is necessary to determine the relative absorption coefficients of the 1620- and 1432-cm-1 bands and the total amount of ammonia adsorbed. Eischens26 has estimated the ratio €1432/ei62o to be approximately three. More recently, Fripiat, et afi,6,25 have estimated this
ratio to be seven by the dual adsorption of NH3 and H20 in which all of the NH3 is converted to NH4+. We have also obtained a value of seven by contacting a sample of SA which had previously been exposed to 10 mm of NH3 vapor at 100° for 1 hr and evacuated at 100° for 1 hr to excess HC1, which converted the LNH3 to NH4C1 (adsorbed).
The total amount of NH3 adsorbed was determined gravimetrically in a quartz spiral balance for an identically treated SA sample. The measurements were made under conditions which were identical with the spectroscopic experiments corresponding to the first three points (at lowest coverage) in Figures 4 and 5. The final conversion factors derived for the 1620- and 1432-cm_1 bands amounted to 72 ± 7 X 10¹³ and 10 ± 1 X 10¹³ molecules/cm2/absorbance unit, respectively. These values have no fundamental significance since they are a function of the amount of SA sample in the infrared beam. The indicated average deviation in the conversion factors produces a comparable uncertainty (approximately 10%) in the values of (A[NH3]/A[OH ])L and (A[N H,]/A[OH ])h.
In Figures 4 and 5 it has been assumed that the absorption coefficients for LNH3 and PNH3 are identical. This is supported by the fact that the conversion factor for the third calibration point in Figures 4 and 5 is identical with those for the first two points even though appreciable physical adsorption occurs under the conditions for point three. Additional support is contributed by the value of (A[NH3]/A[OH ])h of one which is consistent with expectations for physical adsorption. Although these observations suggest that the assumption is reasonable, they are not conclusive. It should be recognized, therefore, that this assumption does not critically affect the conclusions of this paper.
Surface OH Concentration. The concentration of OH groups on the surface of evacuated SA which was determined by the thermogravimetric technique16 and checked by deuterium-exchange experiments, amounted to 1.24 X 10¹⁴ OH/cm2. Since surface SiOH groups are the only OH species,17 the surface OH concentrations were estimated from the relative intensity of the 3745- cm_1 band without further calibration.
(25) J. J. Fripiat, private communication.(26) R. P, Eischens, Z. Elektrochem60, 782 (1956).
The Journal of Physical Chemistry
M olecular Association in Sodium, Potassium, and Cesium Vapors 473
M o le c u la r A s s o c ia t i o n in S o d iu m , P o t a s s iu m , a n d C e s iu m
V a p o r s a t H ig h T e m p e r a t u r e s
by C. T. Ewing, J. P. Stone, J. R. Spann, and R. R. Miller
U. S. Naval Research Laboratory, Washington, D. C. 20390 {Received December 14, 1965)
Imperfections in three alkali metal vapors at high temperatures (to 1400°) and high pressures (to 30 atm) are examined. Recently measured compressibility data are analyzed quasi-chemically by assuming that all types of imperfections may be treated ideally as an extent of the association of atoms into molecules. This analysis confirms the existence of substantial dimerization in the vapors and suggests that stable tetramer molecules may also exist. The equilibrium constants and enthalpies of dimerization and tetramerization (except for cesium) are evaluated.
Introduction
Spectroscopic and vapor-pressure1 studies have shown that the vapors of alkali metals exhibit significant dimerization. Corroborating evidence from PVT data has been lacking and no information has been available on the type and extent of larger molecules (trimers or tetramers) which may also exist in the vapors. Compressibility data for vapor states of sodium, potassium, and cesium over substantial temperature ranges were reported by Stone, et at.2 These data were reduced by the present authors3-5 to yield consistent bodies of engineering properties, but the thermodynamic treatment of each metal was based on virial equations and no information on the molecular state of the vapors resulted. A quasi-chemical analysis of the same PVT data has been made in an effort to identify the molecular reactions occurring in the vapors and obtain quantitative information as to their extent.
Quasi-Chemical Study of PVT Data
Imperfections in Alkali Metal Vapors. An apparent equilibrium constant of dimerization, k f , may be computed from PVT data at any given temperature and pressure by assuming that only ideal monomeric and dimeric species are present. A cursory examination of the PVT data of Stone, et al.f based on this assumption reveals several facts. The apparent constants along any given isotherm increase substantially with increase in pressure and this increase varies systematically with temperature, becoming more pronounced at
lower temperatures. This dependency of k f on temperature and pressure is characteristic of all three metals. It can be explained by the neglect of molecular species higher than the dimer, by failure to treat the individual species as real gases, or by any combination of higher molecular weight species and nonideality.
Theories dealing with association and gas imperfections may be reduced to two general forms. One, which is discussed by Hirschfelder, et al.f fundamentally assumes that all imperfections may be regarded as the association of perfect-gas atoms to form perfect- gas assemblies of two or more atoms. The second theory, illustrated in the treatise by Vukalovich, et al.f assumes that the atoms in a gas may combine to form stable molecules, but that both the interacting
(1) W. H. Evans, R. Jacobson, T. R. Munson, and D. D. Wagman, J. Res. Natl. Bur. Std., 55, 83 (1955).(2) J. P. Stone, C. T. Ewing, J. R. Spann, E. W. Steinkuller, D. D. Williams, and R. R. Miller, J. Chem. Eng. Data, 11, 309 (1966).(3) C. T. Ewing, J. P. Stone, J. R. Spann, and R. R. Miller, ibid., 11, 460 (1966).(4) C. T. Ewing, J. P. Stone, J. R. Spann, and R. R. Miller, ibid., 11, 468 (1966).(5) C. T. Ewing, J. P. Stone, J. R. Spann, and R. R. Miller, ibid., 11, 473 (1966).(6) J. O. Hirschfelder, F. T. McClure, and I. F. Weeks, J. Chem. Phys., 10, 201 (1942).(7) M. P. Vukalovich, I. I. Novikov, D. V. Lebed, V, S. Siletsky, B. V. Dzampov, V. N. Zubarev, and D. S. Rasskasov, Proc. Conf. Thermodyn. Transport Properties Fluids (London), 91 (1958).
w iK foj« fiTkiQyiu'irt'râm
Volume 71, Number 3 February 1967
474 C. T. Ewing, J. P. Stone, J. R. Spann, and R. R. M iller
particles and the molecules must- be treated as van der Waals (imperfect) gases.
Simple collisions among the species undoubtedly do lead to imperfections of the type described by Vukalo- vich, but whether or not these van der Waals imperfections may be incorporated ideally into association equilibria is debatable. In any event, since the contribution from this source to total imperfection (including association) would be expected to be small and cannot, at present, be partitioned from the total, it will be assumed for this treatment that all species behave as perfect gases.
Quasi-Chemical Method and Treatment of PVT Data. For an equilibrium mixture of ideal molecular species, the association of the vapor can be represented by a series of independent equilibria of the type
nX X „ (1)
and the equilibrium constants in the series are definedby
* - . (2)n ~ ( A W 1 { )
where N is mole fraction, p is pressure, and n may be 2, 3, or 4 for the dimeric, trimeric, and tetrameric reactions.
The method employed to identify species higher than the dimer is one which has been applied to the study of association in hydrogen-bonded organics.8,9 The apparent equilibrium constant of dimerization, k/, can be expressed as a power series8 9
k2 = k2 -(- 2kzp -j- 3hp2 -j-2k32p3 — 2k2kAp3 + . . . (3)
involving the pressure and the true equilibrium constants of the association reactions. The apparent dimerization constants at a given temperature may be computed from the PVT data, and the relationship of the apparent constants to pressure may be used to identify the higher reactions present in the vapor and to compute their equilibrium constants.
Although the possibility of the coexistence of significant amounts of trimer and tetramer was recognized, the existence of only one higher molecular weight species was believed to be more probable. If PVT data are of sufficiently high precision, a distinction between trimer and tetramer can be made with eq 3. If, in a vapor mixture, species of molecular weight higher than the trimer are not present, eq 3 (by setting = 0) reduces to
h ' — 2 k32p3 = k2 + 2 k3p (4)
Likewise, if the trimeric species is taken as insignificant, the same equation reduces to
k2' + 2k2kip3 = k2 + 3 kip2 (5)
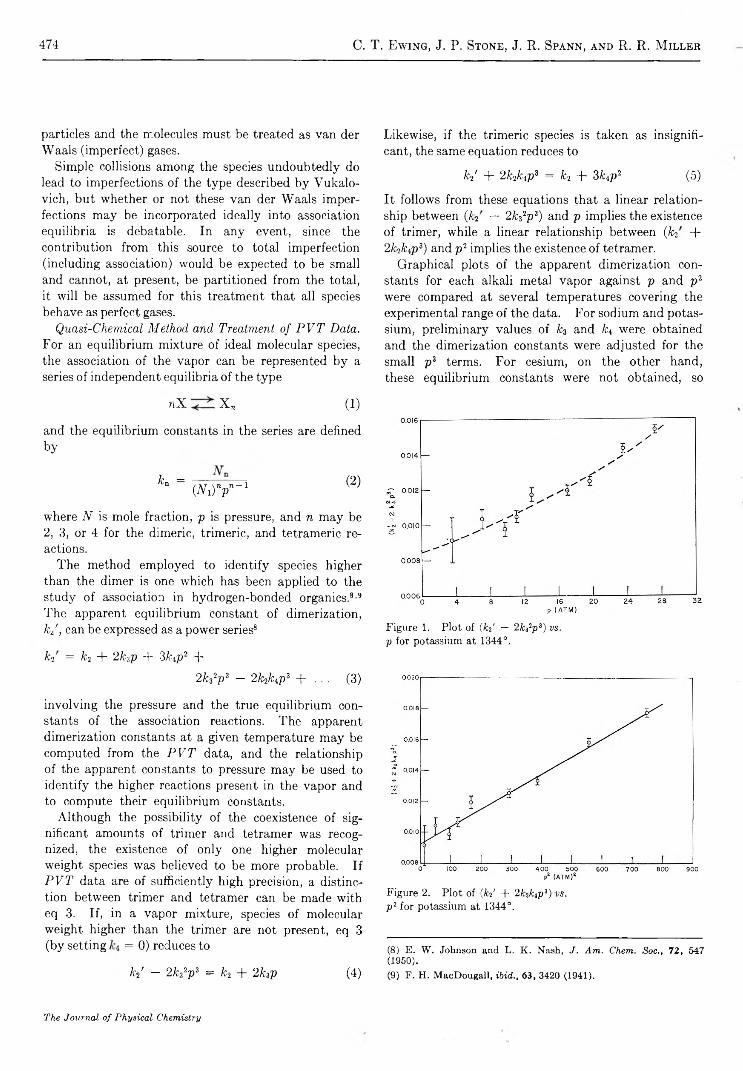
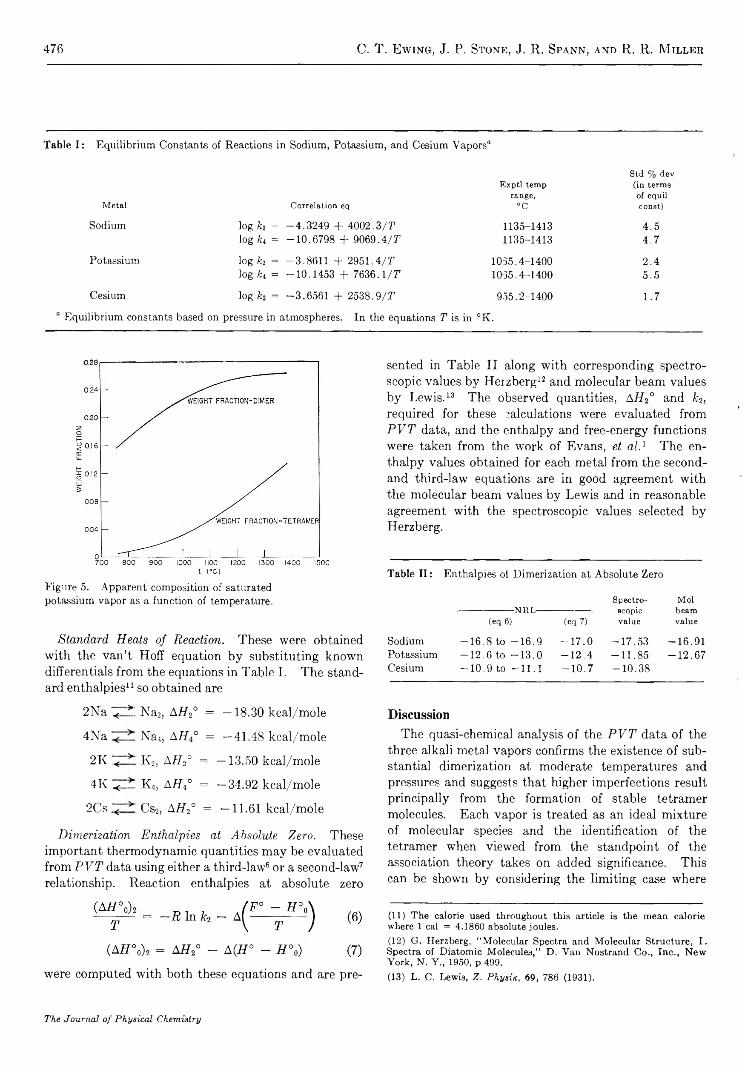
It follows from these equations that a linear relationship between (kv — 2k32p3) and p implies the existence of trimer, while a linear relationship between (k2 + 2k2ktp3) and p2 implies the existence of tetramer.
Graphical plots of the apparent dimerization constants for each alkali metal vapor against p and p2 were compared at several temperatures covering the experimental range of the data. For sodium and potassium, preliminary values of k3 and fc4 were obtained and the dimerization constants were adjusted for the small p3 terms. For cesium, on the other hand, these equilibrium constants were not obtained, so
Figure 1. Plot of ( J e d — 2k 32p 3 ) v s .
p for potassium at 1344°.
Figure 2. Plot of ( k d + 2feLp3) v s .
p 2 for potassium at 1344°.
(8) E. W. Johnson and L. K. Nash, J. Am. Chem. Soc., 72, 547 (1950).(9) F. H. MacDougall, ibid., 63, 3420 (1941).
The Journal of Physical Chemistry

M olecular Association in Sodium, Potassium, and Cesium Vapors 475
Figure 4. Plot of fe' vs. p2 for cesium at 1316°.
the higher order terms were neglected. The graphical testing of the data is illustrated with typical plots for potassium (Figures 1 and 2) and for cesium (Figures 3 and 4). Corresponding plots for sodium are not included since they are qualitatively similar to those presented for potassium. The tetramer relationship was found to provide the best correlation of the data for all three metals, but it is satisfactory for cesium only up to a pressure of 20 atm. Above this point, an even higher degree of association is required to satisfy the quasi-chemical picture. This analysis suggests that the more correct model for sodium and potassium is a near-perfect mixture of monomeric, dimeric, and tetrameric species, and that the more correct model for cesium is a similar mixture of nearperfect gases with a fourth species of molecular weight higher than the tetramer. However, the higher temperature and pressure states for cesium are much closer to the critical state than are those for potassium and sodium, and it is possible that interaction
imperfections of the van der Waals type may become important for this metal.
Equilibrium Constants and Equations of State. Equilibrium constants were derived graphically by plotting functions along constant temperature lines. The functions were derived from smoothed compressibilities (at 27.8° temperature intervals) as obtained from large-scale plots of the data reported by Stone, et al.- The association constant of the dimer reaction at each temperature was obtained as the lim k2\v^ 0) and the association constant of the tetramer reaction as d- (k2')/d(3p2 — 2k2pz). The constants for each reaction for the full temperature range were effectively fitted by a single logarithmic relationship in l/T. The resulting equations, together with their experimental ranges and the standard deviations of the experimental points, are presented in Table I.
Equilibrium constants for the tetramer reaction are reported for two of the metals but not for cesium, since reactions of even higher order are required to satisfy the quasi-chemical picture for this metal. For sodium or potassium, the equations in Table I for the two reactions (with all species behaving as perfect gases) constitute an equation of state. The degree of fit of each equation of state to the observed PVT data may be shown mathematically. For example, all the compressibility data for either potassium or sodium as reported by Stone, et al.,2 may be calculated from the appropriate equation of state with a standard deviation of less than 0.35%.
Apparent Equilibrium Composition of the Saturated Vapor of an Alkali Metal. If it is assumed that an alkali metal vapor is an ideal mixture of monomeric, dimeric, and tetrameric species, the relative amounts of dimer and tetramer in the equilibrium vapor at any pressure and temperature state may be computed with a modification of the method of Ritter and Simons.10
The molecular composition of sodium and potassium vapor was computed at saturation states covering the experimental temperature ranges. The two metals exhibited similar trends of composition with temperature, and the results presented for potassium in Figure 5 are typical of both metals. For a vapor system of this type, increasing temperature favors dissociation of each complex molecule while increasing pressure favors its formation. It is interesting that at saturation conditions the effect due to increasing pressure overbalances that due to increasing temperature, and both the dimer content and the apparent tetramer content increase with temperature. 10
(10) H. L. Ritter and J. H. Simons, J. Am. Chem. Soc., 67, 757 (1945).
Volume 71, Number 3 February 1967
476 C. T. Ewing, J. P. Stone, J. R. Spann, and R. R. M iller
Table I: Equilibrium Constants of Reactions in Sodium, Potassium, and Cesium Vapors'*
Metal Correlation eq
Exptl temp range,
"C
Std % dev (in terms of equil const)
Sodium log fa = -4.3249 + 4002.3/7* 1135-1413 4.5log fa = -10.6798 + 9069.4/ T 1135-1413 4.7
Potassium log fa = -3.8611 + 2951.4/7* 1035.4-1400 2.4log fa = -10.1453 + 7636.1/7* 1035.4-1400 5.5
Cesium log fa = -3.6561 + 2538.9/7* 955.2-1400 1.7
“ Equilibrium constants based on pressure in atmospheres. In the equations 7* is in °K.
Figure 5. Apparent composition of saturated potassium vapor as a function of temperature.
Standard Heats of Reaction. These were obtained with the van’t Hoff equation by substituting known differentials from the equations in Table I. The standard enthalpies11 so obtained are
2Na < >. Na2, AH2° = —18.30 kcal/mole
4Na Nat, AH ° = —41.48 kcal/mole
2K < > K2, AH2° = —13.50 kcal/mole
4K < L K4, AH40 = —34.92 kcal/mole
2Cs < > Cs2, AH2° = —11.61 kcal/mole
Dimerization Enthal-pies at Absolute Zero. These important thermodynamic quantities may be evaluated from PE T data using either a third-law6 or a second-law7 relationship. Reaction enthalpies at absolute zero
were computed with both these equations and are pre
sented in Table II along with corresponding spectroscopic values by Herzberg12 and molecular beam values by Lewis.13 The observed quantities, AH2° and fc2, required for these calculations were evaluated from PVT data, and the enthalpy and free-energy functions were taken from the work of Evans, et at.1 The enthalpy values obtained for each metal from the second- and third-law equations are in good agreement with the molecular beam values by Lewis and in reasonable agreement with the spectroscopic values selected by Herzberg.
Table II: Enthalpies oí Dimerization at Absolute Zero
Spec tro- M olr---------------------■NRL---- scopic beam
(eq 6) (eq 7) value value
Sodium — 16.8 to --16.9 -1 7 .0 -17 .53 -16.91Potassium — 12.6 to --13.0 -1 2 .4 -11 .85 -1 2 .6 7Cesium — 10.9 to --11.1 -1 0 .7 -10 .38
D i s c u s s i o n
The quasi-chemical analysis of the PVT data of the three alkali metal vapors confirms the existence of substantial dimerization at moderate temperatures and pressures and suggests that higher imperfections result principally from the formation of stable tetramer molecules. Each vapor is treated as an ideal mixture of molecular species and the identification of the tetramer when viewed from the standpoint of the association theory takes on added significance. This can be shown by considering the limiting case where
(11) The calorie used throughout this article is the mean calorie where 1 cal = 4.1860 absolute joules.(12) G. Herzberg, “ Molecular Spectra and Molecular Structure, I. Spectra of Diatomic Molecules,” D. Van Nostrand Co., Inc., New York, N. Y., 1950, p 499.(13) L. C. Lewis, Z. Physik, 69, 786 (1931).
The Journal of Physical Chemistry

Luminescence and Energy Transfer in Solutions of R are Earth Complexes 477
the assumed ideality of the vapor species is incorrect and all the higher imperfections are simple interactions which do not lead to stable complexes. If these interactions are then analyzed as association equilibria, one would expect on a pure probability basis to find principally dimer and trimer molecules. The fact that trimers were not identified in the quasi-chemical fitting of the PVT data suggests that the higher order imperfections are due mainly to the association of particles into tetramer complexes. It must be recognized that
this conclusion, in addition to its dependence upon the validity of the association theory, is further subject to the limitations imposed by the precision of the PVT data. There is an obvious need for the identification of the higher molecular weight species by an alternate technique.
Acknowledgment. This work was supported in part by the National Aeronautics and Space Administration.
L u m in e s c e n c e a n d E n e r g y T r a n s f e r in S o lu t io n s o f R a r e E a r t h C o m p le x e s . I I .
S tu d ie s o f th e S o lv a t io n S h e l l in E u r o p iu m ( I I I ) a n d T e r b i u m ( I I I )
a s a F u n c t i o n o f A c e t a t e C o n c e n t r a t io n
b y J o h n L . K r o p p a n d M a u r i c e W . W i n d s o r
Chemical Sciences Department, Quantum Physics Laboratory, Physical Research Center, TRW Systems, Redondo Beach, California (Received March 22, 1966)
The fluorescence intensity and fluorescence lifetimes of Eu3+ and Tb3+ ions have been measured in H20 solution and in D20 solution as a function of the concentration of added acetate ion. By comparing the data for H20 with those for D20 solutions, it is possible to obtain (a) the radiative rate constant for fluorescence, &f ( A c _ ) , and (b) the fractional amount of water in the ion solvation shell m/ms, both as a function of acetate ion concentration. The value of fcF(Ac- ) increases steadily with acetate concentration, which indicates that acetate lowers the symmetry of the ion environment. This is supported by spectral absorption data. Agreement between our values of m/me and potentiometric measurements by Sonesson is obtained provided the ratio ms/n = 6, where ms is the hydration number in pure water and n is the number of water molecules replaced by each acetate ion. This agreement indicates the possibility of using the differential (H20 — D20) quenching rate to assay the fractional water content of the ion solvation shell.
I . I n t r o d u c t i o n
The fluorescence yield and fluorescence lifetime of rare earth ions in solution are a function o f the environment about the ion, being dependent upon the nature, number, and arrangement of the molecules present in the coordination shell of the ion. We have shown
previously (part I of this series) that the dominant mode of quenching for excited rare earth ions in solution occurs via coupling of the electronic excitation to O-H and C -H vibrations in the solvation shell and that the rate constant for quenching is proportional to the number of bonds of each species present.1 We showed
Volume 71, Number 3 February 1967
478 John L. K ropp and Maurice W. W indsor
also that solvent deuteration greatly suppressed these nonradiative processes and led to a marked increase in the intensity and lifetime of fluorescence. In the present study, we have applied the technique of fluorescence enhancement by solvent deuteration to obtain information about the composition of the coordination shell surrounding Eu3+ and Tb3+ ions in aqueous solution, and how changes in the nature of the coordination shell affect the rate constants for fluorescence and for quenching for these ions. Data are obtained on lifetime and intensity of rare earth ion fluorescence as a function of the concentration of acetate ion. The data allow the determination of the fraction of the hydration shell not replaced by acetate and the rate constant for fluorescence emission by the excited ion as a function of acetate concentration.
I I . E x p e r i m e n t a l S e c t i o n
Anhydrous europium chloride and terbium chloride were prepared by heating the rare earth oxide in a 33% solution of HC1. Anhydrous Baker AR grade potassium acetate was used as received. Potassium ace- tate-ds was used as received from Merck Sharp and Dohme of Canada. H20 was distilled water further deionized to remove heavy metals. D20 was 99.7+% from General Dynamics Corp. (San Carlos, Calif.).
Stock solutions of europium chloride and terbium chloride in H20 or D20 were prepared at 0.5 M. Likewise, potassium acetate and potassium acetate-d3 were prepared at about 10 M in either H20 or D20. The experimental solutions were made by mixing and appropriately diluting portions of the above stock solutions. Solutions were not deoxygenated because previous work had shown oxygen quenching of rare earth ion fluorescence in solution to the unimportant.1 Gravimetric analyses showed that the rare earth salts, as prepared, were not strictly anhydrous; thus the D20 solution may have had up to 1.0% H20 present as an impurity. Lifetime and intensity measurements were made on an apparatus previously described.1
I I I . R e s u l t s a n d D i s c u s s i o n
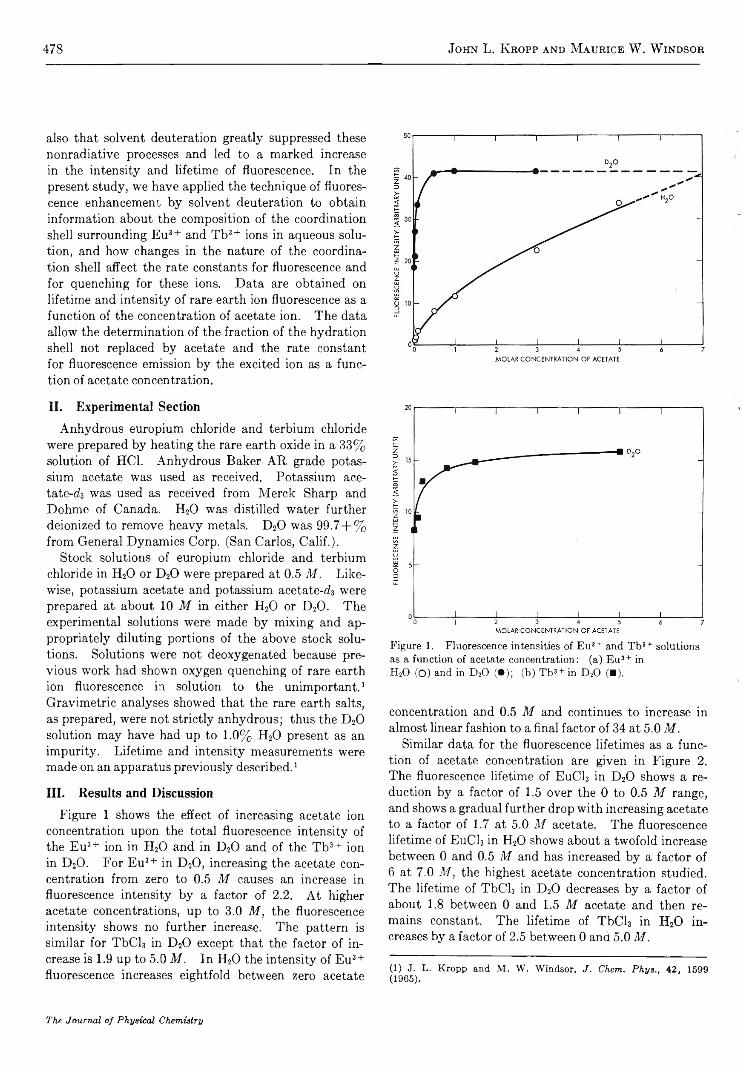
Figure 1 shows the effect of increasing acetate ion concentration upon the total fluorescence intensity of the Eu3+ ion in H20 and in D20 and of the Tb3+ ion in D20. For Eu3+ in D20, increasing the acetate concentration from zero to 0.5 M causes an increase in fluorescence intensity by a factor of 2.2. At higher acetate concentrations, up to 3.0 M, the fluorescence intensity shows no further increase. The pattern is similar for TbCl3 in D20 except that the factor of increase is 1.9 up to 5.0 M. In H20 the intensity of Eu3+ fluorescence increases eightfold between zero acetate
Figure 1. Fluorescence intensities of Eu3 + and Tb3+ solutions as a function of acetate concentration: (a) Eu3+ in H20 (O) and in D20 (•); (b) Tb3+ in D20 (■).
concentration and 0.5 M and continues to increase in almost linear fashion to a final factor of 34 at 5.0 M.
Similar data for the fluorescence lifetimes as a function of acetate concentration are given in Figure 2. The fluorescence lifetime of EuC13 in D20 shows a reduction by a factor of 1.5 over the 0 to 0.5 M range, and shows a gradual further drop with increasing acetate to a factor of 1.7 at 5.0 M acetate. The fluorescence lifetime of EuC13 in H20 shows about a twofold increase between 0 and 0.5 M and has increased by a factor of 6 at 7.0 M, the highest acetate concentration studied. The lifetime of TbCl3 in D20 decreases by a factor of about 1.8 between 0 and 1.5 M acetate and then remains constant. The lifetime of TbCl3 in H20 increases by a factor of 2.5 between 0 and 5.0 M ,
(1) J. L. Kropp and M. W. Windsor, J. Chem. Phya., 42, 1599 (1965).
The Journal of Physical Chemistry

Luminescence and Energy T ransfer in Solutions of R are Earth Complexes 479
Figure 2. Fluorescence lifetimes, tf, of EuC18 and TbCl3 solutions as a function of acetate ion concentration: (a) EuCff in II2O (O) and in D20 (•). The insert shows the variation of tf at low acetate ion concentration, (b) TbCh in H2O (□) and in D20 (■).
For all solutions, a plot of log I vs. t gives a linear relationship. This corresponds to a single lifetime characteristic of the solution studied. Gallagher2 has done experiments similar to our previous work and reports two distinct lifetimes, one of 0.12 msec and one of 3.9 msec. On the basis of these lifetimes, he assumes that two fluorescing species are present: (a) a long- lived species having an hydration shell consisting entirely of D 20, and (b) species with one or more OH groups in the hydration shell, all of which have a lifetime of 0.12 msec. We have shown elsewhere3 that with regard to the functional way in which the fluorescence intensity of Eu3+ varies with per cent D20, Gallagher’s data and ours are in agreement. However, we do not agree on the lifetime measurements. We have carefully reevaluated our previous data and those measured for the present report and find always a single decay time. In optically thin samples, there is a fast initial decay with a time constant of about 20 nsec,
but this corresponds to the lifetime of the flashlamp. According to Gallagher, we should observe an initial decay time of 0.12 msec for all solutions containing less than 90% D20. In fact, we do not observe such behavior. We cannot explain this difference between our observations and Gallagher’s.
We do not think that Gallagher’s two-species model is reasonable in view of what is known about the rate of exchange of water molecules between the hydration shell and the bulk solvent. We can find no data on the exchange rates between hydrated water and solvent water specifically for Eu3+. However, exchange rates of about 2 X 10⁷ sec-1 have been quoted by Caldin4 * for La8+. This is much faster than the rate of fluorescence of the Eu3+ ion. The net effect of this exchange will be to quench those Eu3+ ions that had a complete D20 shell when originally excited. Thus, using Gallagher’s assumption that one OH in the hydration shell is sufficient to quench the Eu3+ fluorescence completely to the pure H20 value of 0.12 msec, we would expect a two-component decay. There would be an initial decay of 0.12 msec corresponding to species having at least one OH in their hydration shell at the time of excitation (static quenching). In addition, there would be a long-lived component whose lifetime varies between 0.12 msec and 3.9 msec depending on the H20 concentration in the bulk solution. This latter corresponds to ions which have a complete D20 shell when initially excited, but which are quenched subsequently owing to the migration of H20 into the hydration shell (dynamic quenching).
Our observation of a single decay time which varies with H20 concentration, together with the above arguments, leads us to conclude that exchange between bulk solvent and hydration shell is so rapid that each excited Eu3+ ion sees the same average environment at a given solvent composition. Our failure to observe a short-lived component strengthens our conviction that the quenching rate increases with the number of O-H bonds present in the hydration shell.
Thus, we shall interpret our present results in terms of the model we described previously.1 We assume that the rare earth chloride in water is completely dissociated and that the Eu3+ or Tb3+ ion is surrounded by water molecules in the solvation shell. In HsO solution, the excised rare earth ion is strongly quenched by radiationless processes which involve transfer of the electronic excitation of the ion to the high-fre-
(2) P. K. Gallagher. J. Chem. Phys., 43, 1742 (1965).(3) J. L. Kropp and M. W. Windsor, ibid., 45, 761 (1966).(4) E. F. Caldin, “ Fast Reactions in Solution,” John Wiley andSons, Inc., New York, N. Y., 1964, p 277.
Volume 71, Number S February 1967

480 John L. K ropp and Maurice W. W indsor
quency O-H vibrations of the solvent. By substitution of D20 for H20, these radiationless processes are almost eliminated, because of the lower frequency of the O -D vibration.: The effect is to increase both the fluorescence efficiency and the observed lifetime. Acetate ions displace H20 or D20 from the solvation shell because the rare earth ion and acetate ion form a more stable complex. Acetate affords protection against quenching similar to that provided by D20. This accounts in part for the enhancement of intensity and lifetime caused by acetate in the H20 solutions. In the case of acetate, however, there is an added effect; whereas D20 does not affect the rate constant for fluorescence emission, fcF, acetate lowers the symmetry about the rare earth ion, thereby enhancing &F. Thus in D20 solutions, the fluorescence intensity is increased, but the lifetime is shortened when acetate is added.
The change in symmetry with changing ion environment is known to affect the absorption spectra. Miller, Sayre, and Freed5 6® found, in comparing methanol solutions to those in 80% water-20% methanol mixtures, that the electric dipole transitions were enhanced in the methanol-rich system compared to water, while those that were magnetic dipole had the same intensity in both solutions. They attribute this to a lowering of the symmetry about the Eu3+ ion from D2i in water5b to C2v in methanol. We have similar data for some transitions in europium acetate solutions. The 6D0 7F0 transition at 5800 A shows a slight decrease in integrated area with increase in acetate concentration. This transition is electric dipole in nature, and one may expect that the addition of acetate would make it more allowed. The other transitions, however, all show normal behavior. The transition at 5290 A, (6Di •*- 7Fi), according to previous workers, is electric dipole and increases in intensity from almost zero at low acetate ion concentration up to about 1.0 at 4 M acetate ion; the transition at 5240 A (6Di 7F0) is magnetic dipole in character and is unaffected by acetate ion from zero to 4 M acetate ion. The band at 4650 A (6D2 7F0) is electric dipole in character andincreases by a factor of 30 from zero acetate to 4 Hi acetate ion. These changes are all in the direction one expects if the complexing by acetate ion lowers the symmetry about the rare earth ion. Thus, the spectral data substantiate the conclusion drawn from the fluorescence intensity and lifetime data.
Evaluation of Rate Constants. We can evaluate the various rate constants more explicitly. Previous work has shown that in solution at room temperature almost all emission occurs from the lowest excited state of the Eu3 + or Tb3+ ion. Energy is removed from this level by several processes. These, with their
respective rate constants, are: fluorescence, fcF;quenching by hydrogen vibrations, k n , or deuterium vibrations, k n > ; quenching by acetate, /c a „ ; and quenching by unspecified residual mechanisms, kx. In a previous paper,1 we determined values for (kry + kx) . It is not possible from the data available to separate these two rate constants. In the present treatment, therefore, we use fcD to represent the sum of these two processes ( k o > + k x ) . This will be shown to introduce very little error because ( k w + fcx) is small compared to k n .
The values of ku, ko, and &ac will vary with the number of water molecules or acetate ions in the coordination shell. We have shown previously that ku is a linear function of the number of H20 molecules in the coordination shell.1 It is reasonable to expect a similar relationship to hold for &ac- We define kn', kv , and k\D' to be the rate constants for quenching per molecule or ion present in the coordination shell. If at zero acetate concentration, there are ms water molecules present,6-9 and if each acetate replaces n water molecules, the fluorescence intensity 7f and the fluorescence lifetime, tf, can be expressed in terms of rate constants as
I f = Ckp{Ac ) &f(Ac ) T rulin' 4-
T F
- ( m , — m)kAc'n (1)
fcF(Ac ) + mkn + - (ms — m)fcAo' n (2)
where C is a proportionality constant and m is the number of H20 molecules present in the coordination shell at any given acetate solution (i.e., the ligand number). Similar expressions hold for the D20 case with ko' replacing kn. As already pointed out, the radiative rate constant, fcF(Ac- ) will be a function of the acetate concentration, but, as we have defined them, k n and k o will have constant values and k \ c', although it may vary with acetate concentration, will have the same value in both H20 and D20 solutions. Dividing eq 1 by 2 we obtain
(5) (a) D. G. Miller, E. V. Sayre, and S. Freed, J. Chem. Phys., 29, 454 (1958); (b) E. V. Sayre, D. G. Miller, and S. Freed, ibid., 26, 109 (1957).(6) There is considerable uncertainty in the literature regarding the correct value of m8. Morgan7 and Ketelaar8 show that the coordination number may be 8 or 9. However, Judd9 shows that numbers between 6 and 9 are all possible. Thus, although 9 seems to be the favored coordination number for Eu3+ in water, we have chosen to leave ra8 unspecified in the present discussion.(7) L. O. Morgan, J. Chem. Phys., 38, 2786 (1963).(8) J. A. A. Ketelaar, Physica, 4, 619 (1937).(9) B. R. Judd, Phys. Rev., 127, 750 (1962).
The Journal of Physical Chemistry

Luminescence and Energy T ransfer in Solutions of Rare Earth Complexes 481
I f / tf = C/cf(Ac ) (3)
Dividing this by its corresponding expression at zero acetate concentration, (fcF(Ac~ = 0) = fcF°), we get
*f(Ac- ) = fcF° X (4)tf/ tf
The value of /cF° is not known for Eu3+ in aqueous solution. However, for Eu3+ in hydrated crystals, the value has been determined to be 70 sec-1 ;10 the solution value should be similar. For TbCL in H20 and in D20, a value of 120 sec“ 1 for fcF° has been determined in this laboratory.11 Using these values and data in Figures 1 and 2, we can determine fcF(Ac- ) as a function of [Ac- ] for the D20 solutions.12 The result is given in Figure 3. For Eu3+ the value for fcF(Ac- ) shows a slight drop at low [Ac“ ] from the value in pure H20 and then increases steadily to a value of 190 sec-1 at [Ac“ ] = 3.0 M. For Tb3+ no low concentration values are available, but ky(A c- ) increases to 360 at [Ac-] = 5.0 M.
Change in Hydration Shell with Acetate Concentration. The difference between eq 2 and its analog for the D20 solution at the same acetate concentration gives
1/ tfh — 1/ tfd = m[kn' — +[fcFH(Ac“ ) - fcFD(Ac“ )] (5)
Since fcF(Ac“ ), although dependent on acetate concentration, is independent of whether the solvent is H20 or D20, the last term on the right in eq 5 is zero. Previous work in Eu3+ solutions1 shows kn is 9400 sec“ 1 and hence kn = 9400/mB sec“ 1. Similarly, fcD was found to be 370 sec-1, giving fcD' = 370/ms sec-1. Actually, as stated earlier, kn includes contributions from unspecified residual quenching mechanism in addition to quenching by O-D vibrations. The true value for quenching by O-D vibrations alone may, therefore, be somewhat lower.13 However, the value of kr> does not greatly affect the determination of m since kn « under any circumstances.14 For Tb3+ solutions, the corresponding values of kn' and kv are 2200/ms sec“ 1 and 275/ms sec-1. Using these values, we can calculate values for m/ms. The results are shown in Figure 4. The fraction m/me measures the fraction of the hydration shell not replaced by acetate. For both Eu3+ and T b3+ the hydration shell is about half replaced by acetate at an acetate concentration of 0.5 M.
Sonesson has measured ligand numbers, l, for acetate ion in the acetate complexes of Gd3+, Sm3+, and D ys+ by a potentiometric method.16,16 Unfortunately, he studied neither Eu3+ nor Tb3+. However, one would expect Eu3+ to be intermediate in behavior
Figure 3. Variation of the radiative rate constant, fo-(Ac“ ), for Eu3 + (•) and Tb3 + (■) in D20 as a function of acetate ion concentration. Values for Tb3+ have been divided by 2 to fit the curve.
Figure 4. The fraction m / m , as a function of acetate concentration, (O) for Eu3+, and (■) for Tb3+.
between Sm3+ and Gd3+, and Tb3+ to be intermediate between Gd3+ and D y3+. We can obtain values of m/ms from Sonesson’s data using the relation m/mB = (1 — (n/ms)l). This can be done for various values of the ratio ms/n. The shaded area in Figure 4 embraces the results of this calculation for ms/n = 6 for Gd3+, Sm3+, and D y3+ from Sonesson’s data. In addition, we have calculated values of m/ms from Sonesson’s data, using ms/n = 5 and also 7. The 10 11 12 13 14 15 16
(10) B. Rinck, Z. Naturforsch., 3a, 406 (1948).(11) W. R. Dawson, J. L. Kropp, and M. W. Windsor, J. Chem. Phys., 44, 2410 (1966).(12) In H20 solutions, the value of 7 f ° has too large an uncertainty to yield meaningful values of ta(Ac- ).(13) A recent determination by Gallagher2 sets ta at 186 sec-1.(14) Use of Gallagher’s value for ta changes (ta — ta) by only 2%, which is not a significant change compared to the experimental error in the value of ta itself.(15) A. Sonesson, Acta Chem. Scand., 12, 165 (1958).(16) A. Sonesson, ibid., 12, 1937 (1958).
Volume 71, Number 3 February 1987
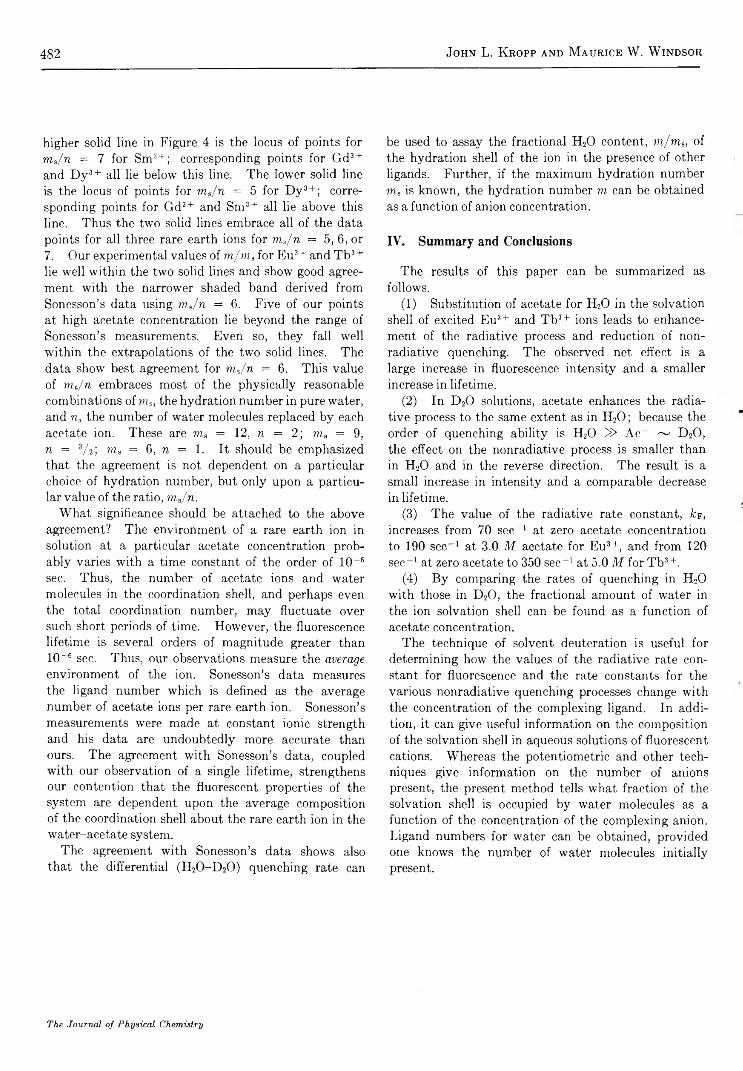
482 John L. K ropp and Maurice W. W indsor
higher solid line in Figure 4 is the locus of points for ms/n = 7 for Sm3+; corresponding points for Gd3+ and D y3+ all lie below this line. The lower solid line is the locus of points for ms/n = 5 for D y3+; corresponding points for Gd3+ and Sm3+ all lie above this line. Thus the two solid lines embrace all of the data points for all three rare earth ions for ms/n = 5, 6, or7. Our experimental values of m/ms for Eu3+ and Tb3 + lie well within the two solid lines and show good agreement with the narrower shaded band derived from Sonesson’s data using m jn = 6. Five of our points at high acetate concentration lie beyond the range of Sonesson’s measurements. Even so, they fall well within the extrapolations of the two solid lines. The data show best agreement for ms/n = 6. This value of ms/n embraces most of the physically reasonable combinations of ms, the hydration number in pure water, and n, the number of water molecules replaced by each acetate ion. These are ms = 12, n = 2; ms = 9, n = V2; ms = 6, n = 1. It should be emphasized that the agreement is not dependent on a particular choice of hydration number, but only upon a particular value of the ratio, mjn.
What significance should be attached to the above agreement? The environment of a rare earth ion in solution at a particular acetate concentration probably varies with a time constant of the order of 10~6 sec. Thus, the number of acetate ions and water molecules in the coordination shell, and perhaps even the total coordination number, may fluctuate over such short periods of time. However, the fluorescence lifetime is several orders of magnitude greater than 10-« sec. Thus, our observations measure the average environment of the ion. Sonesson’s data measures the ligand number which is defined as the average number of acetate ions per rare earth ion. Sonesson’s measurements were made at constant ionic strength and his data are undoubtedly more accurate than ours. The agreement with Sonesson’s data, coupled with our observation of a single lifetime, strengthens our contention that the fluorescent properties of the system are dependent upon the average composition of the coordination shell about the rare earth ion in the water-acetate system.
The agreement with Sonesson’s data shows also that the differential (H2O-D2O) quenching rate can
be used to assay the fractional H20 content, m/ms, of the hydration shell of the ion in the presence of other ligands. Further, if the maximum hydration number Tos is known, the hydration number m can be obtained as a function of anion concentration.
I V . S u m m a r y a n d C o n c l u s i o n s
The results of this paper can be summarized as follows.
(1) Substitution of acetate for H20 in the solvation shell of excited Eu3+ and Tb3+ ions leads to enhancement of the radiative process and reduction of non- radiative quenching. The observed net effect is a large increase in fluorescence intensity and a smaller increase in lifetime.
(2) In D20 solutions, acetate enhances the radiative process to the same extent as in H20 ; because the order of quenching ability is H20 » A c- ~ D20, the effect on the nonradiative process is smaller than in H20 and in the reverse direction. The result is a small increase in intensity and a comparable decrease in lifetime.
(3) The value of the radiative rate constant, /îf, increases from 70 sec-1 at zero acetate concentration to 190 sec-1 at 3.0 M acetate for Eu3+, and from 120 sec-1 at zero acetate to 350 sec-1 at 5.0 M for T b3+.
(4) By comparing the rates of quenching in H20 with those in D20, the fractional amount of water in the ion solvation shell can be found as a function of acetate concentration.
The technique of solvent deuteration is useful for determining how the values of the radiative rate constant for fluorescence and the rate constants for the various nonradiative quenching processes change with the concentration of the complexing ligand. In addition, it can give useful information on the composition of the solvation shell in aqueous solutions of fluorescent cations. Whereas the potentiometric and other techniques give information on the number of anions present, the present method tells what fraction of the solvation shell is occupied by water molecules as a function of the concentration of the complexing anion. Ligand numbers for water can be obtained, provided one knows the number of water molecules initially present.
The Journal of Physical Chemistry
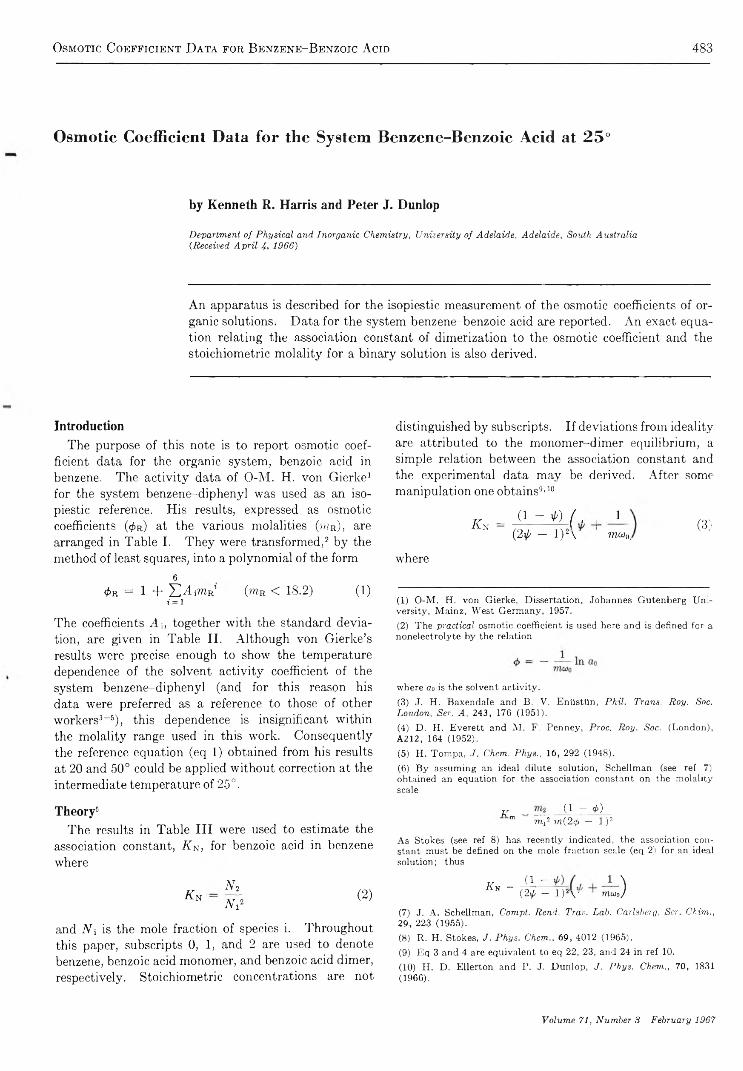
Osmotic Coefficient D ata for Benzene-B enzoic Acid 483
O s m o t i c C o e f f i c ie n t D a ta f o r t h e S y s te m B e n z e n e - B e n z o i c A c i d a t 2 5 °
b y K e n n e t h R . H a r r i s a n d P e t e r J . D u n l o p
Department of Physical and Inorganic Chemistry, University of Adelaide, Adelaide, South Australia {Received April If., 1966)
An apparatus is described for the isopiestic measurement of the osmotic coefficients of organic solutions. Data for the system benzene-benzoic acid are reported. An exact equation relating the association constant of dimerization to the osmotic coefficient and the stoichiometric molality for a binary solution is also derived.
I n t r o d u c t i o n
The purpose of this note is to report osmotic coefficient data for the organic system, benzoic acid in benzene. The activity data of O-M. H. von Gierke1 for the system benzene-diphenyl was used as an isopiestic reference. His results, expressed as osmotic coefficients ( < £ r ) at the various molalities (ma) , are arranged in Table I. They were transformed,2 3 4 5 by the method of least squares, into a polynomial of the form
6<#>r = 1 + S A i T O r * ( o t .r < 1 8 . 2 ) ( 1 )
i = lThe coefficients A it together with the standard deviation, are given in Table II. Although von Gierke’s results were precise enough to show the temperature dependence of the solvent activity coefficient of the system benzene-diphenyl (and for this reason his data were preferred as a reference to those of other workers3-5), this dependence is insignificant within the molality range used in this work. Consequently the reference equation (eq 1) obtained from his results at 20 and 50° could be applied without correction at the intermediate temperature of 25°.
T h e o r y 6 7 8 9 10
The results in Table III were used to estimate the association constant, A n, for benzoic acid in benzene where
A nA l
A i2 (2)
and Ni is the mole fraction of species i. Throughout this paper, subscripts 0, 1, and 2 are used to denote benzene, benzoic acid monomer, and benzoic acid dimer, respectively. Stoichiometric concentrations are not
distinguished by subscripts. If deviations from ideality are attributed to the monomer-dimer equilibrium, a simple relation between the association constant and the experimental data may be derived. After some manipulation one obtains9,10
A n = (1 - *) ( , , 1(2\p — 1)2\ mo),( (3)
where
(1) O-M. H. von Gierke, Dissertation, Johannes Gutenberg University, Mainz, West Germany, 1957.(2) The practical osmotic coefficient is used here and is defined for a nonelectrolyte by the relation
where ao is the solvent activity.(3) J. H. Baxendale and B. V. Enüstün, Phil. Trans. Roy. Soc. London, Ser. A, 243, 176 (1951).(4) D. H. Everett and M. F. Penney, Proc. Roy. Soc. (London), A212, 164 (1952).(5) H. Tompa, J. Chem. Phys., 16, 292 (1948).(6) By assuming an ideal dilute solution, Schellman (see ref 7) obtained an equation for the association constant on the molality scale
k ■= — G ~~ 40m mp m{2(f> — l )2As Stokes (see ref 8) has recently indicated, the association constant must be defined on the mole fraction scale (eq 2) for an ideal solution; thus
An = A ~ )(2\p — 1)2V mao/
(7) J. A. Schellman, Compt. Rend. Trav. Lab. Carlsberg, Ser. Chirn., 29, 223 (1955).(8) R. H. Stokes, J. Phys. Chem., 69, 4012 (1965).(9) Eq 3 and 4 are equivalent to eq 22, 23, and 24 in ref 10.(10) H. D. Ellerton and P. J. Dunlop, J. Phys. Chem., 70, 1831 (1966).
Volume 71, Number 3 February 1967

484 K enneth R. Harris and Peter J. D unlop
, expfawtoo) - 1'P = ------------------ ( 4 )mu o
where co0 is one thousandth of the solvent molecular weight. It will be noted that as m 0, -*■<!>-*■ I.
Experimental SectionMaterials. Univar “ Analytical Reagent” thiophene-
free benzene was shaken with concentrated sulfuric acid several times until no further discoloration was observed, in order to remove unsaturated, nonaromatic, and heterocyclic compounds. It was then washed, dried, and crystallized. The crystallized fraction (about two-thirds) was distilled through a clean, dry, 1-m column packed with stainless steel helices 4 mm X 4 mm. The center fraction was collected and
Table I : Osmotic Coefficients (<#>r ) of Diphenyl-Benzene of Various Molalities ( t o r ) at 20 and 50° (Derived from the Results of von Gierke1)
•2 0 ° ------------------------ , ,------------------------5 0 °-
m n 4> R <PR
0.3959 0.9557 0.5320 0.96530.8243 0.9442 0.7450 0.94961.166 0.9285 1.069 0.93531.487 0.9151 1.841 0.90101.775 0.8983 2.215 0.88711.787 0.8996 3.052 0.85592.129 0.8854 3.192 0.85092.397 0.8756 4.554 0.80952.517 0.8688 4.689 0.80652.652 0.8669 6.548 0.75972.689 0.8584 6.985 0.75112.864 0.8570 8.783 0.71483.577 0.8310 10.52 0.68513.596 0.8300 11.40 0.67144.447 0.8052 14.28 0.63184.484 0.8047 17.16 0.59734.500 0.8045 17.61 0.59156.016 0.7659 18.20 0.58496.243 0.75806.311 0.7604
Table II
Polynomialorder,
i Coefficient
1 -0 .77257 X 10->2 0.14703 X 10“ 13 -0.22935 X 10“ 24 0.20176 X IO“ 35 -0.88044 X 10~66 0.14837 X 10-sStd dev 0.47 X 10~2
Table III : Experimental Isopiestic Molalities, Osmotic Coefficients (<£), and Corresponding Values of the Function (¡j/)
> Diphenyl-benzene— /------------ Benzoic acid—benzene-m R 4> R m *
0.1883 0.9860 0.3643 0.5096 0.51330.2065 0.9847 0.4016 0.5063 0.51040.2264 0.9832 0.4406 0.5052 0.51960.3058 0.9777 0.5993 0.4989 0.50480.3392 0.9754 0.6699 0.4939 0.50030.3473 0.9748 0.6857 0.4937 0.50030.3874 0.9721 0.7669 0.4911 0.49830.4238 0.9697 0.8402 0.4891 0.4971
stored over sodium wire. Analysis by gas chromatography showed less than 0.05% impurity. The density, determined with Pyrex, single-stem pycnometers, was found to be dK = 0.87366 ± 0.00001 g/cc, which may be compared with the literature value11'12 of 0.87368.
Diphenyl, obtained from British Drug Houses Ltd., U. K., was recrystallized from Univar AR petroleum ether (bp 60-80°). No difference was detected between the first and second recrystallized samples by the isopiestic method. It was then dried in vacuo and stored over silica gel.
ACS standard benzoic acid from Matheson, Coleman and Bell was similarly purified and stored. No difference between the unpurified, dried sample and the first recrystallized sample was detected by the isopiestic method.
The Isopiestic Apparatus and Its Operation. All solutions were prepared gravimetrically and the weights recorded were corrected to values in vacuo. They were prepared so that their molality ratio was reasonably close to its equilibrium value. The molecular weights used for benzene, benzoic acid, and diphenyl were 78.1150, 122.1247, and 154.2135, respectively; the densities of benzoic acid and diphenyl were taken to be 1.120 and 1.166 g/cc, respectively.
The apparatus (Figure 1) consisted of a large copper block mounted in a Pyrex vacuum desiccator, 8 in. in diameter, which had a brass lid. A brass plate, held in position by four rods and suspended a little above the block, contained eight holes symmetrically arranged, each for an isopiestic dish. Each dish was always placed in the same hole during each run. A 11 12
(11) G. Scatchard, S. E. Wood, and J. M. Mochel, J. Am. Chem. Soc., 68, 1960 (1946).(12) F. D. Rossini, et al., “ Selected Values of Physical and Thermodynamic Properties of Hydrocarbons and Related Compounds,” Carnegie Press, Pittsburgh, Pa., 1953.
The Journal of Physical Chemistry

Osmotic Coefficient D ata for Benzene-B enzoic A cid 485
Figure 1. Section of the isopiestic apparatus, (a) Piston and sealing 0 ring, (b) brass lid, (c) clamping rings (with polythene padding around the glass lip), (d) movable upper plate, (e) fixed lower plate, (f) copper block, (g) guide rod. The diaphragm tap which is attached directly to the exit tube and which rests on the lid is not shown.
second plate, which could be moved up and down on the four guide rods by a piston in the lid, also had eight holes in it. The lids had small, circular handles which protruded through the holes when the plate rested on the dishes. Short pieces of nylon rod fitted loosely into the lid handles and held the lids to the top plate. Thus, when the desiccator was closed, the dish lids could be raised by screwing the piston home into the top plate and lifting it. The dishes had small brass tabs fitted to their sides which enabled them to be placed (via slots in the plate) so that, if the lids stuck slightly when the piston was moved upwards, the dishes pulled against the plate. The resultant pull was enough to free the lids without any splashing. The apparatus was sealed by buna rubber 0 rings, one around the lip of the lid and two between the piston and its cylinder. A diaphragm (Teflon) vacuum tap was used. These modifications of the more usual apparatus were made to reduce the benzene losses caused by evaporation which contribute most to the experimental error.
The apparatus was used in the following way. Four dishes were each filled with 5 cc of diphenyl solution and four with the same volume of benzoic acid solution. The dishes were weighed before and after filling. They were then placed on the copper block in the holes in the lower plate and the upper plate fixed to the lids by the nylon rods. A small crystallizing dish containing phosphorus pentoxide was placed on the upper plate to absorb any moisture present in the system. Two more isopiestic dishes without lids and containing a
small amount of benzene, i.e., enough to saturate the volume of the desiccator and to compensate for that lost during the pumping down process, were also included. The lid was replaced and air pumped slowly out of the apparatus until the internal pressure was a little above the vapor pressure of benzene. The presence of the pure benzene seemed to prevent the solutions from “ splattering.” The lid was clamped down (to prevent leaks) and the desiccator placed in a water bath and rocked gently to and fro by a special mechanical framework. Three stainless steel ball bearings (4 mm in diameter) in each dish served to stir the solutions. The dishes were removed after a week, reweighed to determine the equilibrium concentrations and the molalities were averaged. At the end of a run, the dishes were weighed as quickly as possible, having been kept on a silvered copper block in a benzene saturated atmosphere before being weighed.
The isopiestic dishes were made of cast silver and had polished flat bottoms. Some were gold or rhodium plated, but no difference was detected in the behavior of the three types of dish. The temperature of the water bath was kept constant to ±0.005° over a period of 24 hr by a mercury-toluene regulator.
R e s u l t s
The experimental equilibrium molalities, the corresponding osmotic coefficients, and the corresponding values of the function tp are given in Table III. It is believed that the experimental molalities are precise to ±0 .2% or better.
Since the values of the function \p are close to a half so that (2tp — 1) has values comparable to the experimental error of \p, viz., ± 0.4%, K may not be accurately determined by use of eq 3.13 However the results show that activity data may be readily obtained for systems in which the solvent has a much greater vapor pressure than water, provided the solute has a low enough volatility.
It is interesting to note that the densities of benzoic acid-benzene solutions, which we have also measured at 25°, show no variation with concentration in a way which might be ascribed to association of the solute. The density may be expressed by the equation
d = 0.87366 + 0.029824C (0.044 < C < 0.65)
with an average deviation of ±0.003%, where C is the
(13) F. T. Wall and P. E. Rouse, Jr., J. Am. Chem. Soc., 63, 3002 (1941), have also studied this system by a volumetric isopiestic method. Their experiments were performed at lower concentrations than ours (about 0.09-0.38 m) and at higher temperatures (32.5, 44, and 56°); by assuming their reference solution (benzene-phen- anthrene) to be ideal they obtained log K at each temperature to an accuracy of approximately ±1.6%.
Volume 71, Number 3 February 1967
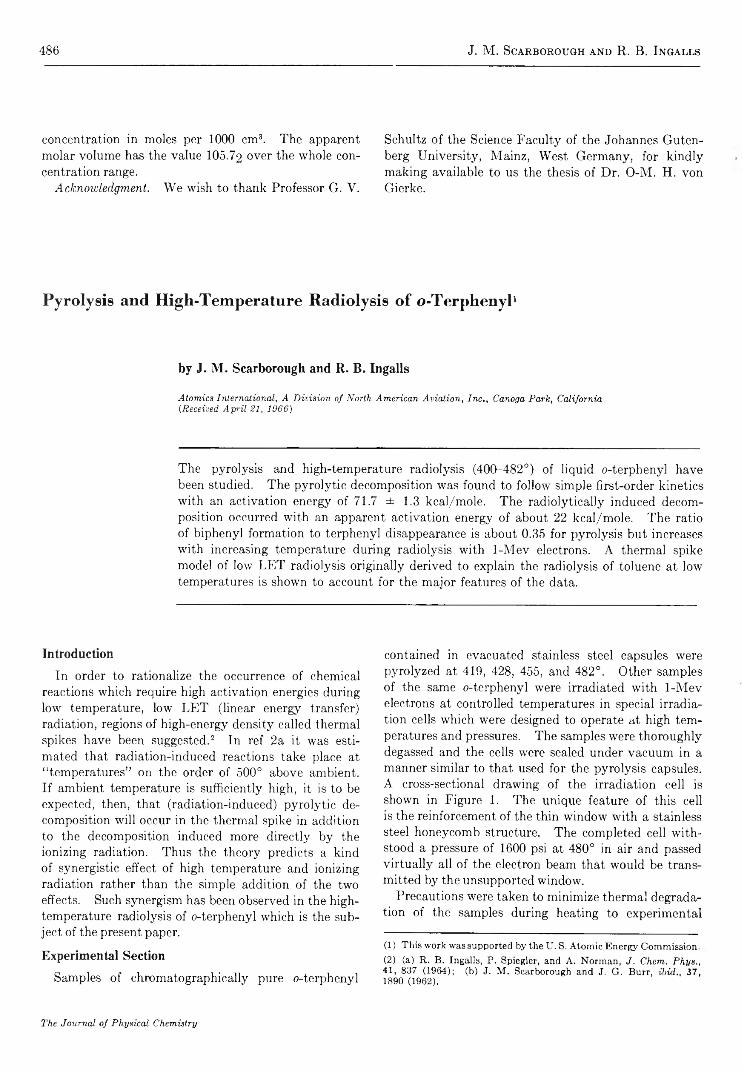
486 J. M. Scarborough and R. B. Ingalls
concentration in moles per 1000 cm3. The apparent molar volume has the value 105.72 over the whole concentration range.
Acknowledgment. We wish to thank Professor G. Y.
Schultz of the Science Faculty of the Johannes Gutenberg University, Mainz, West Germany, for kindly making available to us the thesis of Dr. O-M. H . von Gierke.
P y r o ly s i s a n d H ig h -T e m p e r a t u r e R a d io ly s is o f o - T e r p h e n y l 1
b y J . M . S c a r b o r o u g h a n d R . B . I n g a l l s
Atomics International, A Division of North American Aviation, Inc», Canoga Park, California CReceived April 21, 1966)
The pyrolysis and high-temperature radiolysis (400-482°) of liquid o-terphenyl have been studied. The pyrolytic decomposition was found to follow simple first-order kinetics with an activation energy of 71.7 ± 1.3 kcal/mole. The radiolytically induced decomposition occurred with an apparent activation energy of about 22 kcal/mole. The ratio of biphenyl formation to terphenyl disappearance is about 0.35 for pyrolysis but increases with increasing temperature during radiolysis with 1-Mev electrons. A thermal spike model of low LET radiolysis originally derived to explain the radiolysis of toluene at low temperatures is shown to account for the major features of the data.
I n t r o d u c t i o n
In order to rationalize the occurrence of chemical reactions which require high activation energies during low temperature, low LET (linear energy transfer) radiation, regions of high-energy density called thermal spikes have been suggested.2 In ref 2a it was estimated that radiation-induced reactions take place at “ temperatures” on the order of 500° above ambient. If ambient temperature is sufficiently high, it is to be expected, then, that (radiation-induced) pyrolytic decomposition will occur in the thermal spike in addition to the decomposition induced more directly by the ionizing radiation. Thus the theory predicts a kind of synergistic effect of high temperature and ionizing radiation rather than the simple addition of the two effects. Such synergism has been observed in the high- temperature radiolysis of o-terphenyl which is the subject of the present paper.
E x p e r i m e n t a l S e c t i o n
Samples of chromatographically pure o-terphenyl
contained in evacuated stainless steel capsules were pyrolyzed at 419, 428, 455, and 482°. Other samples of the same o-terphenyl were irradiated with 1-Mev electrons at controlled temperatures in special irradiation cells which were designed to operate at high temperatures and pressures. The samples were thoroughly degassed and the cells were sealed under vacuum in a manner similar to that used for the pyrolysis capsules. A cross-sectional drawing of the irradiation cell is shown in Figure 1. The unique feature of this cell is the reinforcement of the thin window with a stainless steel honeycomb structure. The completed cell withstood a pressure of 1600 psi at 480° in air and passed virtually all of the electron beam that would be transmitted by the unsupported window.
Precautions were taken to minimize thermal degradation of the samples during heating to experimental
(1) This work was supported by the U. S. Atomic Energy Commission.(2) (a) R. B. Ingalls, P. Spiegler, and A. Norman, J. Chem. Phys.,41, 837 (1964); (b) J. M. Scarborough and J. G. Burr, ibid., 37,1890 (1962).
The Journal of Physical Chemistry
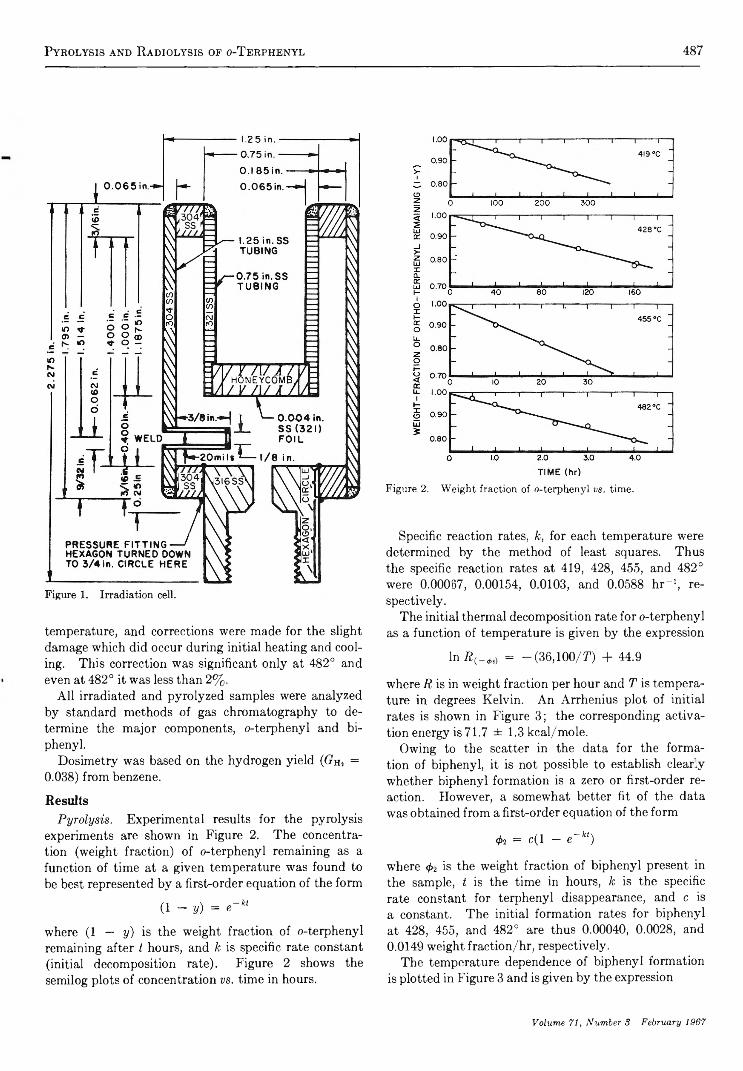
Pyrolysis and R adiolysis of o-Terphenyl 487
temperature, and corrections were made for the slight damage which did occur during initial heating and cooling. This correction was significant only at 482° and even at 482° it was less than 2%.
All irradiated and pyrolyzed samples were analyzed by standard methods of gas chromatography to determine the major components, o-terphenyl and biphenyl.
Dosimetry was based on the hydrogen yield (Gn, = 0.038) from benzene.
ResultsPyrolysis. Experimental results for the pyrolysis
experiments are shown in Figure 2. The concentration (weight fraction) of o-terphenyl remaining as a function of time at a given temperature was found to be best represented by a first-order equation of the form
(1 - y) = e - ktwhere (1 — y) is the weight fraction of o-terphenyl remaining after t hours, and k is specific rate constant (initial decomposition rate). Figure 2 shows the semilog plots of concentration vs. time in hours.
Figure 2. Weight fraction of o-terphenyl vs. time.
Specific reaction rates, k, for each temperature were determined by the method of least squares. Thus the specific reaction rates at 419, 428, 455, and 482° were 0.00067, 0.00154, 0.0103, and 0.0588 hr“ 1, respectively.
The initial thermal decomposition rate for o-terphenyl as a function of temperature is given by the expression
In R C_0S) = —(36,100/T) + 44.9
where R is in weight fraction per hour and T is temperature in degrees Kelvin. An Arrhenius plot of initial rates is shown in Figure 3; the corresponding activation energy is 71.7 ± 1.3 kcal/mole.
Owing to the scatter in the data for the formation of biphenyl, it is not possible to establish clearly whether biphenyl formation is a zero or first-order reaction. However, a somewhat better fit of the data was obtained from a first-order equation of the form
<h = c(l - e~kt)
where <t>2 is the weight fraction of biphenyl present in the sample, t is the time in hours, k is the specific rate constant for terphenyl disappearance, and c is a constant. The initial formation rates for biphenyl at 428, 455, and 482° are thus 0.00040, 0.0028, and 0.0149 weight fraction/hr, respectively.
The temperature dependence of biphenyl formation is plotted in Figure 3 and is given by the expression
Volume 71, Number 3 February 1967
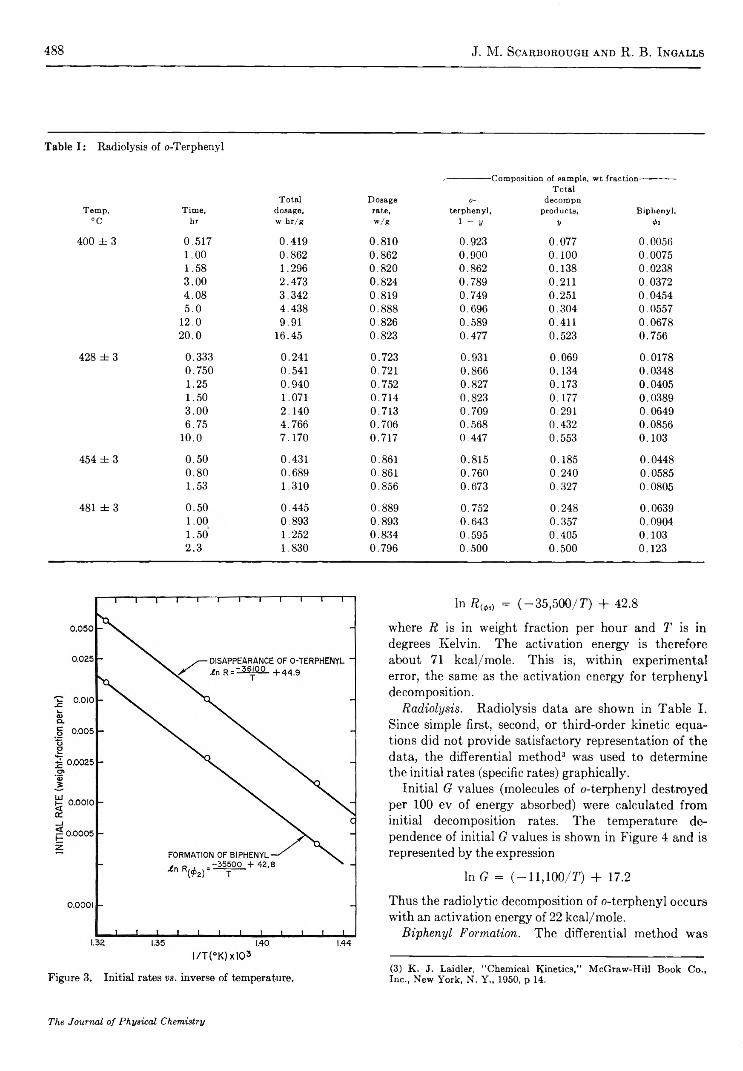
488 J. M. Scarborough and R. B. Ingalls
Table I : Radiolysis of o-Terphenyl
/----------------Composition of sample, wt fraction-
Temp, Time,Total
dosage,Dosagerate,
0-terphenyl,
Totaldecompn
products, Biphenyl,°C hr w hr/g w/g 1 - y V 02
400 ± 3 0.517 0.419 0.810 0.923 0.077 0.00561.00 0.862 0.862 0.900 0.100 0.00751.58 1.296 0.820 0.862 0.138 0.02383.00 2.473 0.824 0.789 0.211 0.03724.08 3.342 0.819 0.749 0.251 0.04545.0 4.438 0.888 0.696 0.304 0.0557
12.0 9.91 0.826 0.589 0.411 0.067820.0 16.45 0.823 0.477 0.523 0.756
428 ± 3 0.333 0.241 0.723 0.931 0.069 0.01780.750 0.541 0.721 0.866 0.134 0.03481.25 0.940 0.752 0.827 0.173 0.04051.50 1.071 0.714 0.823 0.177 0.03893.00 2.140 0.713 0.709 0.291 0.06496.75 4.766 0.706 0.568 0.432 0.0856
10.0 7.170 0.717 0.447 0.553 0.103
454 ± 3 0.50 0.431 0.861 0.815 0.185 0.04480.80 0.689 0.861 0.760 0.240 0.05851.53 1.3 10 0.856 0.673 0.327 0.0805
481 ± 3 0.50 0.445 0.889 0.752 0.248 0.06391.00 0.893 0.893 0.643 0.357 0.09041.50 1.252 0.834 0.595 0.405 0.1032.3 1.830 0.796 0.500 0.500 0.123
In RM = (-35,500/T) + 42.8
where R is in weight fraction per hour and T is in degrees Kelvin. The activation energy is therefore about 71 kcal/mole. This is, within experimental error, the same as the activation energy for terphenyl decomposition.
Radiolysis. Radiolysis data are shown in Table I. Since simple first, second, or third-order kinetic equations did not provide satisfactory representation of the data, the differential method3 was used to determine the initial rates (specific rates) graphically.
Initial G values (molecules of o-terphenyl destroyed per 100 ev of energy absorbed) were calculated from initial decomposition rates. The temperature dependence of initial G values is shown in Figure 4 and is represented by the expression
In (7 = ( — 11,100/T1) + 17.2
Thus the radiolytic decomposition of o-terphenyl occurs with an activation energy of 22 kcal/mole.
Biphenyl Formation. The differential method was
(3) K. J. Laidler, “ Chemical Kinetics,” McGraw-Hill Book Co., Inc., New York, N. Y., 1950, p 14.
The Journal of Physical Chemistry
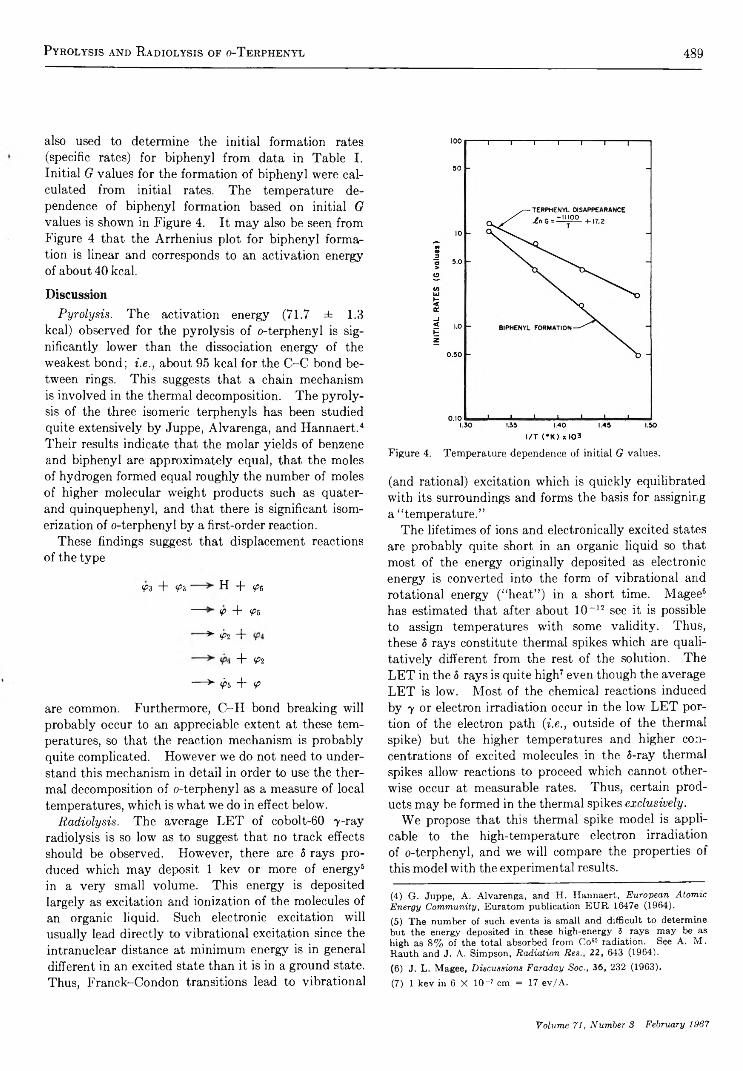
Pyrolysis and Radiolysis of o-T erphenyl 489
also used to determine the initial formation rates (specific rates) for biphenyl from data in Table I. Initial G values for the formation of biphenyl were calculated from initial rates. The temperature dependence of biphenyl formation based on initial G values is shown in Figure 4. It may also be seen from Figure 4 that the Arrhenius plot for biphenyl formation is linear and corresponds to an activation energy of about 40 kcal.
D i s c u s s i o n
Pyrolysis. The activation energy (71.7 ± 1.3 kcal) observed for the pyrolysis of o-terphenyl is significantly lower than the dissociation energy of the weakest bond; i.e., about 95 kcal for the C-C bond between rings. This suggests that a chain mechanism is involved in the thermal decomposition. The pyrolysis of the three isomeric terphenyls has been studied quite extensively by Juppe, Alvarenga, and Hannaert.4 Their results indicate that the molar yields of benzene and biphenyl are approximately equal, that the moles of hydrogen formed equal roughly the number of moles of higher molecular weight products such as quater- and quinquephenyl, and that there is significant isomerization of o-terphenyl by a first-order reaction.
These findings suggest that displacement reactions of the type
<Ps + <Pt H + <P6
— V + <Ps,
*■ <P2 +
4 + <P2
---- > <¿>5 + <P
are common. Furthermore, C -H bond breaking will probably occur to an appreciable extent at these temperatures, so that the reaction mechanism is probably quite complicated. However we do not need to understand this mechanism in detail in order to use the thermal decomposition of o-terphenyl as a measure of local temperatures, which is what we do in effect below.
Radiolysis. The average LET of cobolt-60 7-ray radiolysis is so low as to suggest that no track effects should be observed. However, there are 5 rays produced which may deposit 1 kev or more of energy5 in a very small volume. This energy is deposited largely as excitation and ionization of the molecules of an organic liquid. Such electronic excitation will usually lead directly to vibrational excitation since the intranuclear distance at minimum energy is in general different in an excited state than it is in a ground state. Thus, Franck-Condon transitions lead to vibrational
Figure 4. Temperature dependence of initial G values.
(and rational) excitation which is quickly equilibrated with its surroundings and forms the basis for assigning a “ temperature.”
The lifetimes of ions and electronically excited states are probably quite short in an organic liquid so that most of the energy originally deposited as electronic energy is converted into the form of vibrational and rotational energy (“ heat” ) in a short time. Magee6 has estimated that after about 10 ~12 sec it is possible to assign temperatures with some validity. Thus, these 5 rays constitute thermal spikes which are qualitatively different from the rest of the solution. The LET in the 5 rays is quite high7 even though the average LET is low. Most of the chemical reactions induced by 7 or electron irradiation occur in the low LET portion of the electron path (i.e., outside of the thermal spike) but the higher temperatures and higher concentrations of excited molecules in the 5-ray thermal spikes allow reactions to proceed which cannot otherwise occur at measurable rates. Thus, certain products may be formed in the thermal spikes exclusively.
We propose that this thermal spike model is applicable to the high-temperature electron irradiation of o-terphenyl, and we will compare the properties of this model with the experimental results.
(4) G. Juppe, A. Alvarenga, and H. Hannaert, European Atomic Energy Community, Euratom publication EUR 1647e (1964).(5) The number of such events is small and difficult to determine but the energy deposited in these high-energy 8 rays may be as high as 8% of the total absorbed from Co60 radiation. See A. M. Rauth and J. A. Simpson, Radiation Res., 22, 643 (1964).(6) J. L. Magee, Discussions Faraday Soc., 36, 232 (1963).(7) 1 kev in 6 X 10_T cm = 17 ev/A.
Volume 71, Number 3 February 1967

490 J. M. Scarborough and R. B. Ingalls
The decomposition of o-terphenyl induced by ionizing radiation at room temperature is more than an order of magnitude lower than that induced by radiation at the temperature used in this investigation. Thus to a first approximation the decomposition induced directly by the ionizing radiation may be neglected by comparison with the decomposition which is induced by both heat and radiation. Presumably, most of the energy of the ionizing radiation is lost in processes which are quite independent of temperature.
However, temperatures in the thermal spike have been estimated2® to be in the order of 500° above the temperature of the bulk of the sample. Although these thermal spikes are of short duration, encompass a small number of molecules, and account for only 8% of the energy of the ionizing radiation, they may be responsible for initiating most of the decomposition observed during radiolysis at high temperatures. Thermal spikes attaining “ temperatures” of several hundred degrees above the temperatures at which the irradiations reported in this paper were carried out result in the thermal dissociation of substrate molecules as well as free radicals and other intermediates. This initiation is followed by a chain and thereby enhances the decomposition markedly. Thus, we propose that the only chemically important step in the “ radiation-induced pyrolysis” of o-terphenyl which occurs in the thermal spike is the initial dissociation of the molecules into free radicals which requires about 95 kcal/mole, since there is not time for the chain reactions involved to take place before the thermal spike cools off. Chain propagation probably requires a sufficiently low activation energy that it occurs readily outside the thermal spike in these experiments. Thus the thermal spike “ temperature” referred to in this paper is “ vibrational temperature,” since translational and rotational degrees of freedom do not play a major role in the dissociation of molecules.
The conclusion that there is a chain reaction occurring outside the thermal spike is supported by the magnitude of the yields observed. At 481° G ( — o-terphenyl) is 12.7, which requires that about 1500 molecules be decomposed per thermal spike. There are only about 300 molecules in a volume with a radius of 3 X 10 ~7 cm,8 however, so that the spikes are simply not large enough to account for the yields if all the reaction were to take place in the spike. Furthermore, at 1200-1500°K only a fraction of the molecules in the spike are expected to decompose in 10~n sec.8 This time is long compared to the lifetime of excited states in a liquid and is long compared to the time required for a molecule to dissociate, but at 1200-1500°K only a small fraction of the molecules have sufficient energy to dissociate. Thus, it is clear that the model requires
that a chain reaction continue outside the thermal spike in general agreement with the accepted interpretation of the pyrolysis of o-terphenyl.
Therefore, the energy required to break the weakest bond (~95 kcal) and initiate the chain is taken as the approximate activation energy of the “ radiation- induced pyrolysis” and a value of 1430°K is obtained for the temperature in the thermal spike calculated on that basis.9 This is some 700° higher than the bulk temperature which is higher than the 500° above ambient estimated in the case of toluene. Quite obviously these estimates do not take into account all the observed decomposition such as the temperature dependence of chain length, so that 500 and 700° temperature rise for these two systems is satisfactory agreement.
The fact that pyrolytic reactions are not the only reactions involved in the high-temperature radiolysis of o-terphenyl is demonstrated by the fact that the ratio of biphenyl yield to o-terphenyl disappearance is constant in pyrolysis but varies with temperature in radiolysis (Figure 5). Thus, the model must not only account for a variation of the ratio of biphenyl formation to o-terphenyl disappearance, but it must account for a higher value of the ratio of biphenyl formation to terphenyl disappearance in high-temperature radiolysis than in pure pyrolysis.
These results are accounted for by the model because of the formation of a high concentration of phenyl and biphenyl radicals as a result of thermal dissociation in the thermal spike. These radicals are then available for reaction with the biphenyl-cyclohexa- dienyl radical produced via radiolysis.10 The products of these reactions are probably benzene, biphenyl, terphenyl, and quaterphenyl. Another reaction which may occur in the thermal spike which would result in the formation of benzene and biphenyl is the direct combination of hydrogen atoms with phenyl and biphenyl radicals (produced pyrolytically). By either of these mechanisms or by a combination of the two, the relative yield of biphenyl will increase with increasing temperature, and can exceed the yields, relative to terphenyl disappearance, which occur in pure pyrolysis.
However, it should be pointed out that this is by no
(8) The dimensions of the thermal spike were estimated theoretically in ref 2a.(9) The estimate of the local temperature in the thermal spike is made as in ref 2a by solving for the temperature T at which a reaction with an activation energy E = 95 kcal will change its rate by the observed factor p = 12.7/2.14 = 5.94 in a change of temperature AT = 400° — 481° = —81°, as observed. This temperature is 1430°K.(10) Hydrogen atoms, a major intermediate in the radiolysis of aromatic systems, add to the aromatic substrate to produce cyclohexa- dienyl radicals.
The Journal of Physical Chemistry

Pyrolysis and R adiolysis of o-T erphenyl 491
Figure 5. Ratio of biphenyl formation to terphenyl disappearance vs. temperature.
means the only possible kind of explanation for our results. Other workers11 have suggested that the thermal decomposition of free radicals produced by the ionizing radiation leads to a chain reaction and is responsible for the small variations of yield with temperature. Such a mechanism is possible in saturated hydrocarbon systems. However, aromatic radicals in the o-terphenyl will not dissociate with an activation energy near 20 kcal/mole. Therefore, this explanation is not applicable to the o-terphenyl system. “ Hot” atoms or radicals may provide the basis for still another explanation.12 Radiolytic instability of some pyrolytic decomposition products13 or pyrolysis of radiation-induced products14 have also been suggested for aromatic systems. However, the success of the thermal spike model in accounting qualitatively for the variation of yields of products formed by high activation energy processes (those products produced mostly in the thermal spike) in at least two systems makes it attractive even if other explanations exist for each system separately.
Thus the thermal spike model provides the basis for explanation of the large yields observed and temperature dependence of the data presented, and this same model has been used to explain the low-temperature dependence and low yields of hydrogen observed in the low-temperature radiolysis of toluene.2“ In the earlier example of its application the bulk temperature was so low and the LET so small that no significant pyrolysis occurred. In the experiments reported here, the bulk temperature is apparently high enough so that
the energy density in the thermal spike is sufficient to induce significant thermal dissociation. This initiation is followed by a chain reaction which leads to the high yields of products observed.
If the combined pyrolytic and radiolytic decomposition yields are compared to the pyrolytic yields and low- temperature radiolysis yields (assuming that radiolysis and pyrolysis are additive), it is found that, separately, they each contribute only slightly to the total decomposition rate. Even at 482° pyrolysis alone accounts for less than 6% of the combined radiolytic and pyrolytic rate, at a dosage rate of 0.8 w /g and the low-temperature radiation yield is lower by more than an order of magnitude. Thus high temperatures and ionizing radiation are synergistic, as predicted by the thermal spike model.
The thermal spike model is admittedly crude and in need of refinement. It is inherently approximate so long as it uses the concept of “ temperature” to describe a region which is obviously not in thermodynamic equilibrium. Also, an exact description of the shape of the spike (i.e., energy density as a function of time and space) is not easily determinable. However such limitations may not impair the usefulness of the model in correlating observations and predicting results.
Summary and ConclusionsThe pyrolytic decomposition of o-terphenyl follows
simple first-order kinetics. Specific reaction rates were established at 419, 455, and 482° and the activation energy for the thermal decomposition of o-terphenyl was found to be 71.7 ± 1.3 kcal/mole.
Biphenyl formation in pyrolysis also follows apparent first-order kinetics and may occur with the same rate- determining step as the decomposition of o-terphenyl; the activation energy for biphenyl formation is equal within experimental error to that for o-terphenyl disappearance.
This work establishes a temperature dependence for the radiolysis of o-terphenyl not clearly indicated in previous work. An activation energy of 22 kcal/mole was observed in the temperature range studied which is significantly lower than that expected for free- radical dissociations in aromatic systems. Thus, this
(11) A. V. Topchiev, “ Radiolysis of Hydrocarbons,” English ed, R. A. Holroyd, Ed., Elsevier Publishing Co., Amsterdam, 1964, p 204; and P. L. Lucchesi, B. L. Tarmy, R. B. Long, D. L. Baeder, and J. P. Longwell, Ind. Eng. Chem., 50, 879 (1958).(12) J. Y. Yang and J. G. Burr, J. Chem. Phys., 44, 1307 (1966); R. B. Ingalls, ibid., 44, 1308 (1966).(13) J. Weiss, C. H. Collins, J. Sacher, and N. Carciello, Ind. Eng. Chem., 3, 73 (1964).(14) P. Leveque, F. Franzetti, M. Yan der Venne, and M. Guilani, U. N. Intern. Conf. Peaceful Uses At. Energy, 3rd, A, 28/P/53, May 1964.
Volume 71, Number 3 February 1967

492 E. Grunwald, C. F. Jumper, and M. S. Puar
result suggests that one or more of the rate-controlling steps in the high-temperature radiolytic decomposition involves thermal dissociation in a thermal spike.
Acknowledgment. The authors wish to thank Dr. Richard Holroyd of our laboratory for extremely
helpful discussions and criticism of this work. We wish to acknowledge the help of Dr. Trent Tiedeman, also of this laboratory, for his assistance in calculating the activation energies of certain free-radical processes which may occur during pyrolysis of o-terphenyl.
R a t e s a n d S o lv e n t P a r t i c ip a t i o n in A c i d - B a s e R e a c t io n s o f S u b s t it u t e d
P h e n o l s a n d P h e n o x id e s in M e t h a n o l1“
b y E r n e s t G r u n w a l d , lb C h a r l e s F . J u m p e r , a n d M o h i n d a r S . P u a r lb
Bell Telephone Laboratories, Inc., Murray Hill, New Jersey, and Leeks Chemical Laboratories, Brandeis University, Waltham, Massachusetts (.Received May 31, 1966)
The kinetics of proton exchange between methanol (the solvent) and p-nitrophenol or p- bromophenol has been investigated by the nmr method in buffered solutions containing phenol and phenoxide and in acid solutions containing phenol and HC1 at —80°. Rates of proton exchange are derived from measurements of the CH3- and OH- proton resonances of methanol and of the OH-proton resonance of the phenol. The following processes involving the given numbers of solvent molecules have been identified: (1) base dissociation of ArO- , which involves two solvent molecules, ArO- + HO(CH3) + HOCH3 ArOH + (CH3)OH + ~OCH3; (2) a symmetrical process that involves one solvent molecule, ArO- + HO(CHa) + HOAr—>- ArOH + (CH3)OH + - OAr; and (3) a process that involves one methyloxonium ion, one ArOH, and an unknown number of solvent molecules. Rate constants for these processes and base dissociation constants K b for reaction 1 are reported. Substituent effects on K b at —80° are nearly equal to those at 25° and are largely entropy effects. Reversal of reaction 1 is fast enough so that this rate could be diffusion controlled even at —80°. The self-association of p-nitrophenol was measured at —80° by means of nmr chemical shifts and was substantially that to be expected on the basis of volume fraction statistics. A noteworthy and unsolved problem in the interpretation of the CH3-proton resonance of methanol is that plausible rate laws can be obtained only if values of 1 /r based on the Bloch equations are first corrected by means of an empirical function, 4>{t), as described in the paper.
In previous papers from these laboratories, nuclear magnetic resonance (nmr) was used to measure rates and solvent participation in acid-base reactions in water and other hydroxylic solvents.2 We now apply the nmr method to the proton exchange reactions of phenols and their conjugate bases in methanol. Our
substrates are p-bromophenol and p-nitrophenol, the reaction temperature is —80°, and the pH of the reac
(1) (a) Work supported in part by the Petroleum Research Fundof the American Chemical Society. Grateful acknowledgment is made to the donors of that fund, (b) Brandeis University Waltham, Mass.
The Journal of Physical Chemistry

Rates and Solvent Participation of Substituted Phenols and Phenoxides 493
tion mixtures ranges from about + 2 (0.01 M HC1) to that of buffers containing both phenol and phenoxide. Under these conditions, we find the following reactions to be kinetically significant.
1. Reaction of ArOH with Methanol and Methoxide Ion
ArOH + OH + -OCH3| k-'mkbdCH3
ArO- + HO + HOCHs (1)/
c h 3
Note that the reverse of reaction 1 is the base dissociation of ArO - as a Br0nsted base (rate constant kbd).
2. Reaction of ArOH with Methanol and ArO~
ArOH + OH + - OAr -X -
CH3ArO- + HO + HOAr (2)
/CH3
8. Reaction of ArOH with Methyloxonium Ion. The number of methanol molecules participating here could not be determined. Some plausible reaction mechanisms are shown below.
CH3OH + OH + OCHsI I IH Ar H
CH30 + HO + HOCHs (3a)
H Ar H+ &sb
ArO + HO + HOCH3 ^
H CH3 H
ArOH + OH + OCH3 (3b)
H CH3 H
Reaction 3a represents a symmetrical proton exchange process analogous to reaction 2; reaction 3b is the conjugate of reaction 1 in the sense that the protons move toward rather than away from ArOH.
4. Proton Exchange between CH%0~ and Methanol. In addition, in the buffered solutions there is proton exchange between CH30 - and methanol,2 3 4 5 6 7 and in the presence of HC1 there is proton exchange between CH3OH2+ and methanol.3
Since some of the measurements were made at moderate solute concentrations (up to 0.7 M ArOH), we also measured chemical shifts of solvent and solute protons as a function of concentration in order to elucidate the intermolecular interactions. We found that the self-association of p-nitrophenol, i.e., the probability of formation of adjacent pairs of ArOH-ArOH, is substantially that expected for an ideal mixture of ArOH and methanol. Moreover, there was no significant interaction chemical shift when the two solutes, ArOH and NaOAr, were both present in solution.
Rate constants have been reported in water at 25° for analogous proton transfer reactions between ArOH and the hydroxide ion, between ArO- and the hydrogen ion, and between phenol, water, and the phenoxide ion.4-7 Lifetimes for proton transfer between ArOH and methanol have been reported for o-ClCeH4OH in very concentrated solutions.8 If these lifetimes may be extrapolated to dilute solution, they probably describe the acid dissociation of ArOH in methanol.
Experimental SectionMaterials. Solvent methanol for most experiments
was first dried with magnesium and then doubly distilled, as described previously.3 Since the interpretation of nmr spectra in this solvent ran into an unexplained complication (see below) we wished to rule out the possible presence of kinetically active impurities. We therefore repeated some measurements using a sample of methanol that had been supplied to us by Dr. Calvin D. Ritchie, whose cooperation we acknowledge gratefully. This sample had been dried by Dr. Ritchie with molecular sieves, and acidic or basic impurities had been removed by treatment with ion-exchange resins. The sample was then redistilled by us just before use, the middle fraction being used. Nmr spectra for solutions in this solvent were indistinguishable from those for formally identical solutions in the magnesium-dried solvent.
Eastman White Label p-bromophenol was twice recrystallized from chloroform and dried in vacuo.
(2) See, for example, (a) E. Grunwald, C. F. Jumper, and S. Mei- boom, J. Am. Chem. Soc., 85s 522 (1963); (b) Z. Luz and S. Mei- boom, J. Chem. Phys., 39, 366 (1963); (c) E. Grunwald and M. Cocivera, Discussions Faraday Soc., 39, 105 (1965).(3) E. Grunwald, C. F. Jumper, and S. Meiboom, J. Am. Chem. Soc., 84, 4664 (1962).(4) M. Eigen and K. Kustin, ibid., 82, 5952 (1960).(5) Z. Luz and S. Meiboom, ibid., 86, 4766 (1964).(6) For a recent review see M. Eigen, W. Kruse, G. Maas, and L. De Maeyer, Progr. Reaction Kinetics, 2, 285 (1964).(7) Protolysis kinetics of electronically excited ArOH has been reviewed by A. Weller, ibid., 1, 187 (1961).(8) E. Krakower and L. W. Reeves, Trans. Faraday Soc., 59, 2528 (1963).
Volume 71, Number 3 February 1967

494 E. Grunwald, C. F. Jumper, and M. S. Puar
For experiments involving very high acid-base ratios, this recrystallized material was further zone refined on a Fisher zone refiner.
Fisher White Label p-nitrophenol was twice recrystallized from toluene, air dried, and finally dried in vacuo over Mg(C104)2-
Solutions. Solutions were made up from freshly prepared reagents by quantitative methods. Standard solutions of sodium methoxide (for HOAr-NaOAr solutions) or of HC1 were prepared from pure methanol and pure sodium metal or HC1 gas in all-glass apparatus. Since some of the phenoxide or HC1 concentrations were very low (10-4 10-3 M), these concentrations were checked by potentiometric titration of the actual reaction mixtures (which of course also contained HOAr) using methanolic HC1 or NaOMe titrants. Furthermore, for the p-nitrophenyl reagents concentrations were also confirmed by spectrophotometry of the reaction mixtures. As a result, we are confident that we know concentrations with an accuracy of at least 2% in even the most weakly buffered of the reaction mixtures.
In order to minimize errors from ion exchange of the sodium or hydrogen ion between weakly buffered reaction mixtures and their glass containers, we prepared all such mixtures twice. The first preparation was used only to establish ionic quasi-equilibrium between the solution and the required containers, including the nmr sample tube. The containers were then rinsed with pure methanol, dried, and used to receive a second, duplicate preparation on which the actual measurements were made.
Water content of the reaction mixtures was monitored by Karl Fischer titration after the conclusion of each series of experiments (usually 1 or 2 days after preparation) and was usually less than 0.01 M and always less than 0.015 M.
Nmr Measurements. All measurements were made at a frequency of 60 Mc/sec. Most of the measurements were made on Dr. S. Meiboom’s nmr spectrometer at Bell Telephone Laboratories;3 the rest were made at Brandeis University on a Varian Model HR60 nmr spectrometer equipped with Meiboom’s temperature-controlled probe.9
Experimental techniques followed previous practice.2“ 3 All measurements were made on air-saturated solutions at a nominal temperature of —80°.
I n t e r p r e t a t i o n o f N m r S p e c t r a
In measuring kinetic order with respect to methanol in the proton transfer reactions of p-bromo- and p- nitrophenol we used a method reported by Grunwald, Jumper, and Meiboom.2“ Briefly, we used the CH3-
proton resonance of methanol to evaluate proton exchange rates in the spin-coupled OH group of methanol; and we used the OH-proton resonance of the ArOH-CH3OH proton system (which collapses into a single line at fast exchange rates) to evaluate proton exchange rates in the OH group of ArOII.
OH-Proton Exchange Rate of Methanol. The calculation of proton exchange rates in the OH group of methanol from slow passage nmr spectra of the spin- coupled CH3 group has already been described in detail.3 We now wish to report a complication that had not been envisaged in the previous work. We cannot give a theoretical explanation of the complicating phenomenon, but we shall try to characterize it empirically. In the following report we shall use the notation of ref 3.
The slow passage nmr spectrum of the CH3 protons of methanol is regarded as a function of two characteristic times: the transverse relaxation time, T2, of the CH3 protons and the time, r, between proton spin inversions in the OH group. OH-proton spin inver-
1/ t =2 (rate of OH-proton spin inversion/[MeOH]) (4)
sion is assumed to occur by two parallel mechanisms, Ti relaxation and chemical exchange (which proceeds at a rate of R g-atom/1. sec-1). On the basis of a large
1/ t = (1/rOoH + R/ [MeOH] (5)
body of data for proton exchange in methanol at —80° we find, however, that we cannot derive plausible rate laws unless we add an empirical correction, <j>, as in
1 /r = (1/rOoH + 0 (t) + R/ [MeOH] (6)
eq 6.10 This correction is a function either of t or R—we cannot decide empirically because (7 \ )o h , on the basis of spin-echo measurements, varies relatively little in the experimental range. All our evidence indicates, however, that </> does not depend on the nature of the solutes or the rate law for R. For convenience we shall write <j>{r) and values of 4> at —80° are plotted vs. 1 /r in Figure 1. As shown below, these values were obtained from slow passage CH3-proton spectra for a single system, p-nitrophenol-p-nitrophenoxide ion in methanol, under conditions where the rate law
(9) We gratefully acknowledge the help of Dr. S. Meiboom with construction and installation.(10) After completion of this manuscript A. Allerhand, H. S. Gutow-sky, J. Jonas, and R. A. Meinzer have published a critical analysis of errors in nmr measurements of chemical exchange rates [J. Am. Chem. Soc., 88, 3185 (1966)]. However none of the errors described by them could have been large enough in our experiments to account for In particular, the theoretical line shapes used for evaluating r were based on density-matrix line shape equations, see ref 3.
The Journal of Physical Chemistry

R a t e s a n d S o l v e n t P a r t i c i p a t i o n o f S u b s t i t u t e d P h e n o l s a n d P h e n o x i d e s 495
Figure 1. Plot of the empirical function 4> (t ) in eq 6 for CH3-proton resonance of methanol at —80°.The smooth curve is a plot of 117r/(l + 478r2).
for R is simple. Although our method of evaluating 4> involves an arbitrary assumption, it accomplishes the following result. Without the <£(r) correction, slow passage CH3-proton spectra of methanol at — 80° lead to implausible rate laws for solutions of the following acids and their conjugate bases: benzoic acid, acetic acid, p-bromophenol, p-nitrophenol, and trimethylammonium ion. On applying the <j>(r) correction shown in Figure 1 the kinetic behavior of all of these substrates becomes entirely rational.
Let us give an example. In previous work2a on benzoic acid-benzoate buffers in methanol at —80°, we calculated R on the basis of eq 5 and obtained the rate law
R = fcx[HBz] + h [HBz][NaBz] +/c3 [LIBz ]1/1 [NaBz ]1/1
The third (square root) kinetic term seemed implausible because we could not make it consistent with any theory that conformed to (i) the mass law of chemical reaction rate, (ii) microscopic reversibility in chemical systems at dynamic equilibrium, and (iii) stability principles of molecular structure. However, when the same data are recalculated on the basis of eq 6, taking 4 > { t ) from Figure 1, the implausible (square root) kinetic term becomes insignificant and can be dropped from the rate law.
4 > ( t ) in eq 6 for the CH3-proton resonance of methanol at —80° was evaluated using our extensive slow passage nmr data for p-nitrophenol-p-nitrophenoxide buffers in methanol. Experimental results for 1 /r at [ArOH]/[NaOAr] ratios ranging from 90 to 1000 depend accurately on a single variable, the concentration product [ArOH][NaOAr], This suggests that reaction 2 is the only reaction that is kinetically significant under these conditions. If in first approximation we calculate R on the basis of eq 5 and if we then calculate an apparent rate constant j 2 according
Figure 2. Histogram showing^ (eq 7) as a function of 1/ t for p-nitrophenol-p-nitrophenoxide solutions in methanol at —80°. The ratio [ArOH]/[NaOAr] ranges from 90 to 1000 in these experiments.
to eq 7, we obtain the result shown in Figure 2. It
jt = [r-1 - (Ti)oh- 1 ] [MeOH] / [ArOH] [NaOAr] (7)
is seen that/2 is constant within experimental error when 1 /r > 40 and that j 2 increases significantly as 1 /r goes to lower values. We have been unable to reconcile this variation of j 2 with any plausible reaction mechanism.
To calculate <f>/(r) we assume that j 2 approaches fc2 in the limit as 1 /r becomes large. In Figure 2, we have taken this limit to be 4.28 X 10⁶ sec-1 M~l. We then calculate <£(r) from eq 8. The resulting values and estimated standard errors are plotted in Figure 1.
4 > ( t ) = r - 1 — ( j F j ) o h - 1 —
h [ArOH] [NaOAr]/ [MeOH] (8)
The smooth curve in Figure 1 is a graph of the empirical eq 9, which fits the values satisfactorily. Accordingly,
<Kt)_80° = 117r/(l + 478r2) (9)
4 > ( t ) at —80° approaches zero at both large and small values of r and goes through a maximum at 1 /r =21.9 sec-1. This maximum very nearly coincides with that value of 1/r at which the CH3 resonance of methanol just fails to be a resolved doublet. As 1/r increases above 21.9 sec-1 <j>(r) rapidly becomes of the order of the experimental error in 1/r, amounting to 10% of 1/r at 26 sec-1 and to 5% at 43 sec-1. On the other hand, as 1/r decreases below 21.9 sec-1 <f>(r) gains progressively in relative importance, amounting to 25% of 1/r at 4 sec-1.
Volume 71, Number 3 February 1967

496 E. G r u n w a l d , C. F. Ju m p e r , a n d M. S. P u a r
The physical significance of <£(r) is obscure to us. The effect cannot be ascribed to an impurity in the methanol solvent because of its high reproducibility, considering that the solvent was prepared by two different methods and in many independent batches. For a given value of r, the effect is independent of pH and, apparently, of the nature of the solutes. Thus everything indicates that $(r) is a characteristic property of the solvent, methanol. Perhaps 4>{t) represents a mechanism of OH -proton spin inversion that is triggered by proton exchange in a nonspecific way so that the effect depends only on the total rate of exchange. (In that case we should write <t>(R) rather than 4>(t).) It is more likely that there is a flaw in the equations that were used to calculate theoretical nmr spectra for methanol as a function of r.11 This explanation is suggested by the fact that 4>{t) goes through a maximum near the “ coalescence point” of the CH3 doublet. Cocivera, in spin-echo measurements of Ti, has obtained evidence for cross relaxation of magnetization between CH3 and OH protons of the sort described by Solomon and Bloem- bergen.12 His work is relevant because a term for cross relaxation was not included explicitly in the theoretical equations.11 However, that sort of cross relaxation is at a maximum when 1 /r = S, whereas our effect is at a maximum when 1 /r ~ J/y/2. (•/ = spin couplingconstant, 5 = difference in chemical shift.) Note that for methanol at —80° b/ J ~ 30. Note also that in the present as in previous work, spin-echo measurements on a representative number of solutions indicate that ( 1 / T i ) o h varies only slightly, and approximately linearly with solute concentration, in the experimental range of 1 /r < 100 sec-1.
OH-Proton Exchange Rate of ArOH. In some experiments we measured the OH-proton resonance of ArOH under conditions of lifetime broadening; in others we measured the coalesced OH resonance of ArOH and methanol. The interpretation of these nmr spectra was analogous to that of C 02H -0H proton spectra for benzoic acid solutions in methanol.2a 1/Ti for the phenolic OH protons was measured by rf saturation of slow passage spectra and was found to be 6.0 sec-1 for p-bromophenol and 6.7 sec-1 for p-nitrophenol at —80°. The chemical shift between the two kinds of OH protons was 4.07 ppm for p- bromophenol and 5.27 ppm for p-nitrophenol at ~ T .l M [ArOH] and -8 0 ° .
R e s u l t s
Rate Constants. We shall use the symbol k with a superscript to denote a phenomenological rate constant
in an empirical rate law and k with a subscript to denote an actual rate constant for a particular reaction.
The OH-proton exchange rate of methanol, R, was measured in the near-neutral to alkaline pH range. The data for p-bromophenol are consistent with the rate law, eq 10. The data for p-nitrophenol are con-
R = A;1 [ArO- ]/[ArOH] flic* [ArO- ] fl- k**[ArOH] [ArO- ] (10)
sistent with the same rate law except that the term fc*[ArO- ] is insignificantly small. Rate constants are listed in Table I.
Table I : Rate Constants for Proton Exchange of p-Bromophenol and p-Nitrophenol in Methanol“
■Value and std dev for-Kinetic p-Bromophenol, p-Nitrophenol,
constant -81.6° -80.0°k1 = ÄlMeO-Z B (1.08 ± 0.1) X 104 42 ± 2k* = 3kbd (9 ± 2) X 104 bk** = fe (1.43 ± 0.15) X 10s 4.28 X 10«k*' = kbi (3 ± 1) X 104 ck**’ = fo (1.52 ± 0.10) X 10« ck" = k3 (21 ± 4) X 104 (0.94 ± 0.1) X
“ All kinetic constants are based on the second as the unit of time and the mole per liter (at the reaction temperature) as the unit of concentration. b Too small to measure (<2 X 10⁴). c Not measured.
The OH-proton exchange rate of ArOH, R1, was measured for p-bromophenol both in the near-neutral and in the distinctly acid pH range. The data are consistent with the rate law eq 11. For p-nitrophenol
R' = fc*'[ArO-] +fc * *' [ Ar OH ] [ArO ~ ] + ¿/'[ArOH] [MeOH2+] (11)
R' was measured only in the distinctly acid pH range where only the last term of eq 11 is significant. Rate constants are given in Table I.
Because of their concentration dependence and for reasons stated below, we believe that kinetic terms can be identified with chemical reactions as follows:(a) k1 [ArO- ]/[ArOH] = fcMeo-[M eO- ], proton exchange between methoxide ion and methanol. Hence, kl = fcMeo-XB, where K b = [ArOH][MeO- ]/[ArO - ];(b) k* and k*' with reaction 1; (c) k** and k**' with reaction 2; and (d) k" with reaction 3.
(11) See ref 3 and literature references cited therein.(12) (a) M. Cocivera, Bell Telephone Laboratories, private communication; (b) I. Solomon, Phys. Rev., 99, 559 (1955); (c) I.Solomon and N. Bloembergen, J. Chem. Phys., 25, 261 (1956).
The Journal of Physical Chemistry
R a t e s a n d S o l v e n t P a e t i c i p a t i o n o f S u b s t i t u t e d P h e n o l s a n d P h e n o x i d e s 497
The rate laws, eq 10 and 11, were established with high statistical probability on the basis of an extensive series of measurements covering a wide range of all relevant concentrations. All told, the measurements of R involved 41 separate solutions for p-bromophenol and 35 for p-nitrophenol; those of R' involved 15 separate solutions for p-bromophenol and 7 for p-nitro- phenol. The complete data are made available elsewhere.13
Solvent Participation. The number of methanol molecules participating in a given kinetic process can be deduced from the ratio of rate constants for corresponding kinetic terms in the rate laws for R and R' (eq 10 and 11).2a Thus, for the kinetic term proportional to [ArO- ], fc* = 3k*' within experimental error. Since the rates are measured at dynamic equilibrium, the corresponding reaction must be such that in each reversible cycle three methanol molecules exchange an OH proton for every ArOH molecule that exchanges an OH proton. Furthermore, the forward reaction of the reversible cycle must be formulated so as to be kinetically of the first order in [ArO- ]. A reversible cycle consisting of reaction 1, first from right to left, then from left to right, will fit these requirements. To predict the three-to-one ratio, we count the protons that enter a given state in one cycle, regardless of where they come from.14 15 In reaction 1 from right to left, one proton enters the state “ methanol” and one proton enters the state “ ArOH.” In the reverse of this reaction, two protons enter the state “ methanol” and zero protons enter the state “ ArOH.” If this interpretation be granted, then k*' must be identified with/¿bd*
For the kinetic term proportional to [ArOH] [ArO- ], fc** = fc**' within experimental error. Hence, the two kinds of OH protons exchange in a 1:1 ratio. This result is consistent with reaction 2.
Reactions 1 and 2 share with many other proton- transfer processes the feature that they are termolecu- lar16 and that they probably involve a concerted push- pull mechanism.16 •16
Acid and Base Dissociation Constants, pKa has been measured in methanol at 25° for phenol (14.2) and p-nitrophenol (11.2).17 Upon applying Hammett’s p-rs equation with appropriate <r~ values18 we calculate that p = 2.36 and predict that K A{p-KOs)/KA{p-BY) = 280.
The above substituent effects at 25° may be compared with substituent effects on the kinetic parameter fc1 at —80°. If fc1 = fciMeo -K b, then fcT(p-Br)/ ¥(p-N 02) = K A(p-N0 2)/Ka(p-Br) = 260 using the data in Table I. Similarly, p = —(8R log ki/8Ba~) =2.32 at —80°. The close agreement between these
values and those obtained at 25° from the thermodynamic pKA values suggests that fc1 is indeed equal to kMeo-Ks as assumed. If this be granted, then it follows that substituent effects on pKA of phenols in methanol are quite independent of the temperature; hence, 8BAH° ~ 0 and the substituent effect is largely an entropy effect. From a long extrapolation of data at 25 and 0°319 we estimate that fcMeo- ~ 5 X 10® sec-1 at —80°. This in turn enables us to estimate pAB because Kn = ¥/kueo~. The result is pKb =4.7 for p-bromophenol and 7.1 for p-nitrophenol at — 80°. For p-nitrophenol we can also estimate AHb° and AiS’b0 since pKn = 5.7 at 25° on the basis of pKA and the autoprotolysis constant of methanol.20 Thus AHb° = 3.5 kcal and A<SB° = —14 eu at about —30°. By comparison, an independent and quite different kinetic determination of K b in methanol leads to A //B0 = 0.7 kcal for phenol at about 50°.21
The absence of a kinetic term due to acid dissociation in eq 10 and 11 establishes a lower limit of 14.4 to pRA of p-nitrophenol, and hence of 14.4 + 7.1, or21.5, to pAautoprotolysis of methanol at —80°. From an extrapolation of the data of Koskikallio20 we estimate a pAautopro to lysis of 22.2 at —80°, well above the lower limit based on the kinetic data.
Given the estimates of pAB, we are able to test; whether the previous identification of k*' = k* /3 with fcbd in eq 1 is physically reasonable. In water, reaction of the hydroxide ion with phenols appears to be diffusion controlled.4'6 If the reaction of methoxide ion with p-bromophenol at —80° were similarly diffusion controlled, the rate constant, fci (eq 1), for this reaction should be about 8 X 10s M~x sec-1 at —80°.22
(13) Document No. 9223 with the A. D. I. Auxiliary Publication Project, Photoduplication Service, Library of Congress, Washington, D. C. 20540. A copy may be obtained by citing document number and advance payment of $1.25 for photocopy or $1.25 for microfilm. Make checks payable to Chief, Photoduplication Service.(14) Alternatively we could count the number of protons that leave a given state in one cycle and obtain the identical result.(15) (a) E. Grunwald and M. Cocivera, Discussions Faraday Soc., 39, 105 (1965); (b) E. Grunwald and S. Meiboom, J. Am. Chem. Soc., 85, 2047 (1963).(16) (a) C. G. Swain and M. M. Labes, ibid., 79, 1084 (1957); (b) C. G. Swain, J. T. McKnight, and V. P. Kreiter, ibid., 79, 1088 (1957).(17) C. W. Clare, D. Cook, E. C. F. Ko, Y. C. Mac, and A. J. Parker, ibid., 88, 1911 (1966). This paper reviews the previous literature and also lists pKA values for several ortho-substituted phenols.(18) (a) L. P. Hammett, “ Physical Organic Chemistry,” McGraw- Hill Book Co., New York, N. Y., 1940, Chapter 7; (b) J. E. Leffler and E. Grunwald, "Rates and Equilibria of Organic Reactions.” John Wiley and Sons, Inc., New York, N. Y., 1963, pp 211, 235.(19) E. Grunwald, to be submitted.(20) J. Koskikallio, Suomen Kemistilehti, B30, 111, 155 (1957).(21) B. D. England and D. A. House, J. Chem. Soc., 4421 (1962).
Volume 71, Number 3 February 1967

498 E, G r u n w a l d , C. F. J u m p e r , a n d M. S. P u a r
We therefore predict that Kb = fcbd/fci = 4 X 10⁻⁶ and that pKb = 4.4 for p-bromophenol, in adequate agreement with the previous estimate of 4.7.
Brflnsted Slopes. Reactions 2 and 3 can be regarded as examples of general acid or base catalysis. Although we have data for only two phenols, it is of interest to estimate the Brpnsted catalytic slopes, a, for comparison with other systems.18 We shall calculate a from eq 12, where k is /c2 or fc3. Thus a = 0.19 for re-
a = — 5 log k/5 log k1 (12)
action 2 and —0.56 for reaction 3. The a value for reaction 2 is very similar to that obtained for the analogous reaction of substituted benzoic acids in methanol at 25°.16b The absolute value of a for reaction 3 is very similar to that obtained for other proton-transfer reactions in which either the forward or the reverse reaction in the cycle of reactions leading to proton exchange is ultrafast.23
Solute-Solute Interaction. The existence of aromatic molecules on adjacent sites can be detected easily by the nmr chemical shifts that result from the interaction of magnetic nuclei with nearby circuits of aromatic ring current.24 We have therefore measured some proton chemical shifts of solutions of p-nitrophenol and p- nitrophenoxide in methanol at —80°. The analysis of phenyl proton nmr spectra of para-disubstituted benzenes has been discussed exhaustively by Martin and Dailey.25 Our spectra were of the A2X 2 type (Figure 3 of ref 25) and were closely analogous22 23 24 25 to those of p-nitroanisole and p-nitroaniline in two respects: (1) the dominant spin-spin interaction between protons on adjacent carbon atoms was identical with that reported for p-nitroaniline and p-nitroanisole and amounted to 9.0 ± 0 . 1 cps for both p-nitrophenol and p-nitrophenoxide; and (2) spin-spin interaction of protons on meta or para sites is relatively small. In our case, in methanol at —80°, the 9.0-cps spin-spin interaction was the only one that could be resolved. We have therefore calculated the chemical shifts of the phenyl protons on the assumption that the small, unresolved couplings are zero. If the couplings were actually the same as for p-nitroaniline or p-nitroanisole, assuming them to be zero would introduce a constant error of 0.006 ppm at all concentrations.
Our results for p-nitrophenol solutions are listed in Table II. In that table and throughout this section, chemical shifts are expressed relative to the CH3- proton resonance of methanol, which is used as an internal standard. We have estimated the self-association constant of p-nitrophenol as follows.
Assuming a monomer-dimer equilibrium we let c, cm, and cd denote the formal, monomer, and dimer con-
Table II : Proton Chemical Shifts“ in Solutionsof p-Nitrophenol in Methanol at —80°
[ArOH],M MeOH
-------- Chemical shift (ppm)------Phenyl-A Phenyl-B ArOH
0.824 2.485 3 .4 94 4 .7 740 .7 40 2 .4 76 3.494 4 .7 79 7 .6 830.577 2 .4 65 3.501 4 .7 90 7 .6 830 .4 49 2 .4 56 3 .5 12 4 .8 020 .3 30 2 .4 4 8 3 515 4 .8 08 7 .6 8 00.208 2 .4 37 3.524 4 .8 19 7 .6 8 30.082 2 .4 26 3.531 4 .8 3 0O.OOO5 2 .4 20 3.5375 4 .8 3 8 7 .6 8 0
" Relative to CH3-proton resonance of methanol. 6 Extrapolated.
centration, respectively. Thus we write eq 13 and1 4 , where K is the self-association constant. For 2 c d / c
c = Cm -f- 2 c d ( 1 3 )
Cd = K(c — 2 c d ) 2
cD = Kc2( 1 - 2 c d / c ) 2 (14)
< 1, the quantity (1 — 2 cd / c) 2 may be expressed as a convergent power series of Kc as in eq 15. Since
cd = Kc2[ 1 - 4Xc(l - 5Kc + 12X2c2 - . . . ) ] (15)
the self-association takes place very rapidly, the formal chemical shift8 of any solute proton species is the weighted mean of the chemical shifts of monomer ( 5 m )
and dimer ( 5 d ) as in eq 1 6 . Finally, combining eq 1 3 ,
5 = ( c m 5 m + 2 c d Sd ) / c ( 1 6 )
15, and 16 we obtain eq 17. Equation 17 contains the
(6 — 5 m ) / c = 2 ( 5 d — 5 m )K X[1 - 4Xc(l - 5Kc + 12X2c2 - . . . ) ] (17)
quantities 5 m , ( 5 e — 5 m ) , and K. 5 M is obtained by a short extrapolation of 5 to c = 0. The other quantities were calculated by a method of successive approximations. In the first approximation the term in
(22) W e use the equation, ki = a4:irNo(D\ + D b ) / 1 0 0 0 , where No is A vogadro’s number, a the collision diameter, and D the diffusion coefficient. In methanol at — 8 0 ° 1 0 6D « 1 . 8 6 cm 2/sec for p- bromophenol and 0 . 5 9 cm 2/sec for methoxide ion on the basis of D at 1 5 ° and the viscosity ratio ( — 8 0 ° / 1 5 ° ) of methanol. F or a we use 4 . 3 A, consistent with the termolecular mechanism shown in eq 1. See “ International Critical Tables,” Vol. V , M cG raw -H ill Book Co., New York, N. Y., pp 1 1 , 7 2 ; A. G. Ogsten, Trans. Faraday Soc., 3 2 , 1 6 7 9 ( 1 9 3 6 ) .
(23) E. Grunwald, Progr. Phys. Org. Chem3, 317 (1965).(24) J. A . Pople, W . G . Schneider, and H . J. Bernstein, “ H igh- Resolution Nuclear M agnetic Resonance,” M cG raw-H ill B ook C o., New Y ork, N. Y ., 1959, p 180.(25) J. M artin and B . P. Dailey, J. Chem. Phys., 37, 2594 (1962).
The Journal of Physical Chemistry
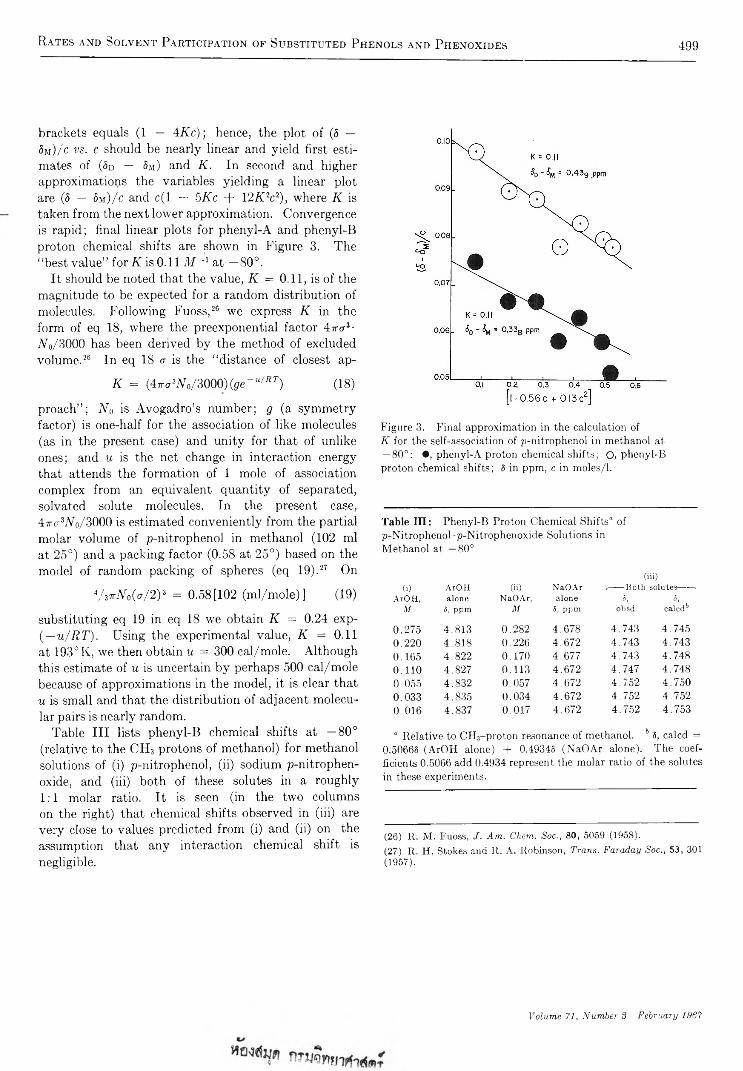
R a t e s a n d S o l v e n t P a r t i c i p a t i o n o f S u b s t i t u t e d P h e n o l s a n d P h e n o x i d e s 499
brackets equals (1 — 4Kc); hence, the plot of (5 — 5 m ) / c v s . c should be nearly linear and yield first estimates of (<5d — 5m) and K. In second and higher approximations the variables yielding a linear plot are (5 — 5M)/c and c(l — 5Kc + 12K 2c2), where K is taken from the next lower approximation. Convergence is rapid; final linear plots for phenyl-A and phenyl-B proton chemical shifts are shown in Figure 3. The “ best value” for K is 0.11 M -1 at —80°.
It should be noted that the value, K = 0.11, is of the magnitude to be expected for a random distribution of molecules. Following Fuoss,26 we express K in the form of eq 18, where the preexponential factor 4-ira3- No/3000 has been derived by the method of excluded volume.26 In eq 18 a is the “ distance of closest ap-
K = (47rvW0/3000)(ge“ u/i;T) (18)
proach” ; N0 is Avogadro’s number; g (a symmetry factor) is one-half for the association of like molecules (as in the present case) and unity for that of unlike ones; and u is the net change in interaction energy that attends the formation of 1 mole of association complex from an equivalent quantity of separated, solvated solute molecules. In the present case, 47n7Wo/3000 is estimated conveniently from the partial molar volume of p-nitrophenol in methanol (102 ml at 25°) and a packing factor (0.58 at 25°) based on the model of random packing of spheres (eq 19).27 On
y 37riVo(<7/2)3 = 0.58[102 (ml/mole)] (19)
substituting eq 19 in eq 18 we obtain K = 0.24 exp- ( — u/RT). Using the experimental value, K = 0.11 at 193°K, we then obtain u = 300 cal/mole. Although this estimate of u is uncertain by perhaps 500 cal/mole because of approximations in the model, it is clear that u is small and that the distribution of adjacent molecular pairs is nearly random.
Table III lists phenyl-B chemical shifts at —80° (relative to the CH3 protons of methanol) for methanol solutions of (i) p-nitrophenol, (ii) sodium p-nitrophen- oxide, and (iii) both of these solutes in a roughly 1:1 molar ratio. It is seen (in the two columns on the right) that chemical shifts observed in (iii) are very close to values predicted from (i) and (ii) on the assumption that any interaction chemical shift is negligible.
F igure 3. F inal approxim ation in the ca lculation of K fo r the self-association o f p -n itroph enol in m ethanol at — 8 0 °: • , p h en y l-A p roton chem ical sh ifts ; O, p henyl-B p roton chem ical sh ifts; 5 in ppm , c in m oles /l.
Table III: P hen yl-B P roton C hem ical S h ifts“ o fp -N itrop h en ol-p -N itrop h en ox id e Solutions in M eth an ol at —80°
(iii)(i) ArOH (ii) NaOAr ,—■— Both solutes------*
ArOH, alone NaOAr, alone 5, s,M 8, ppm M 8, ppm obsd calc<P
0.275 4.813 0.282 4.678 4.743 4.7450.220 4.818 0.226 4.672 4.743 4.7430.165 4.822 0.170 4.677 4.743 4.7480 .110 4.827 0 .1 13 4.672 4.747 4.7480.055 4.832 0.057 4.672 4.752 4.7500.033 4.835 0.034 4.672 4.752 4.7520.016 4.837 0.017 4.672 4.752 4.753
“ R elative to C H 3-p r o to n resonance o f m ethanol. b 5, ca lcd = 0.50665 (A rO H alone) + 0.49345 (N a O A r a lone). T h e coefficients 0.5066 add 0.4934 represent the m olar ratio o f the solutes in these experim ents.
(26) R . M . Fuoss, J. A m . Chem. Soc., 80, 5059 (1958).(27) R . H . Stokes and R . A . Robinson, Trans. F araday Soc., 53, 301 (1957).
Volume 71, Number S February 1967

500 A. R. G u p t a a n d S. K. S a r p a l
Nitrogen Isotope Effects in Nickel-Ammonia Complex and Ammonia System
by A. R. Gupta and S. K. Sarpal
A tom ic E nergy Establishment Trom bay, Chem istry D iv ision , Bom bay 28, In d ia {Received June 8, 1966)
The nitrogen isotope effect in nickel-ammonia complexes/ammonia equilibrium has been determined, using an ion-exchange breakthrough operation, as a function of resin cross- linking and ammonia concentration. The experimental (over-all) single-stage factors have been calculated from the data using the material balance equation as well as Glueck- auf’s theory of ion-exchange columns. The good agreement between the calculated and observed breakthrough curves provides an experimental proof of the validity of Glueckauf’s theory. The effect of cross-linking on the height equivalent of a theoretical plate and over-all efficiency of the column has been discussed in terms of various parameters like the diffusion coefficients and the effective single-stage factors. The single-stage separation factors for Ni(NH3)42+, Ni(NH3)s2+, and Ni(NH3)62+ vs. ammonia equilibria in the aqueous phase have been obtained from an analysis of the data, taking into consideration the equilibrium concentrations of various nickel-ammonia complexes at different ammonia concentrations; the values are 1.0062, 1.0079, and 1.010, respectively. The single- stage factor for the hexaammine nickel-ammonia system has been calculated from the available vibrational data for this complex. There is good agreement between the calculated and experimentally determined values for the single-stage factor of the Ni(NH3)62+- NH3(aq) system.
In the chemical equilibrium between transition metal ammines and ammonia in aqueous solutions, a considerable nitrogen isotope effect has been observed1 2 because of the very different chemical environment of the nitrogen atom in the two compounds. The isotope-exchange reaction involved can be written as
[M(MNH,)B_1(wNH,)]*+(aq) + 16NH3(aq) ^[M(1‘ NH,)n_1(“ ] m >)]*+(aq) + 14NH3(aq) (A)
This reaction has an isotope separation factor defined by2
aA = (N16/N 14)compiex/(N 16/N 14) _ ia = (1 /n)KA
where K A is the equilibrium constant of the reaction A as written, i.e.
= { M (14NH3)„_1(15NH3) } a+(aq) / 15NH3(aq)A {M (MNH8)^.1(14NH3)}*+(aq)/ 14NH3(aq)
The magnitude of this isotope effect varies with the nature of the transition metal ion which determines the strength of the metal-nitrogen bond formed. On the one hand, for very strong complexes, it may be
comparable to the effect observed in NH4+-NH3 system and on the other side, for very weak complexes, it will approach unity. For this effect to be experimentally observed, a further requirement is that the above exchange reaction should be rapid. Thus besides a strong interaction between metal cation and ammonia, the complex formed should also be labile. Many of the very stable transition metal ammines, e.g., Co(NH3)63+ and Cr(NH3)63+, also happen to be inert. Out of the labile ammonia complexes of transition metal cations, nickel, copper, and zinc complexes are quite stable. Nickel-ammonia complexes have special features, e.g., more pronounced dependence of the equilibrium distribution of various species (complexes with different n values) on ammonia concentration. F or these reasons, we have first selected nickel-ammonia complex for a detailed investigation, so that we can have a better understanding of the theoretical implications of these isotope effects as well
(1) T . Ishimori, B ull. Chem. Soc. Japan , 33, 520 (1960).(2) J. Bigeleisen in “ Separation of Isotopes,” H. London, E d., George Newnes Ltd., London, 1961, pp 100-123.
The Journal of Physical Chemistry
N i t r o g e n I s o t o p e E f f e c t s i n N i c k e l - A m m o n i a C o m p l e x 501
as of the special features one encounters in the experimental determination of the same.
In principle, the isotope effect for reaction A can be calculated if the normal vibrational frequencies of the various species involved are known. From a survey of the literature on the vibrational spectra of transition metal ammines, it appeared that frequencies corresponding to some of the vibrational modes either have not been observed at all or have not been assigned unequivocally. The existing data, therefore, are not sufficient to calculate these isotope effects exactly. With the help of the available data, however, one can calculate these effects, though not to a very high degree of accuracy. These results for the hexaammine nickel- ammonia system are reported here. Whereas Ishi- mori1 depended upon a salting-out technique for the experimental determination of the equilibrium isotope effects in this complex, an ion-exchange column technique has been successfully used here. The ion- exchange method is based on the property of transition metal ions that they form stable complexes in the exchanger phase.3 4 5 6 In general, it has been observed that, if the situation is not complicated by any specific interactions between the ligand and the resin matrix or between the metal ion and the resin, the stability of the variety of such complexes formed by the transition metal ions is almost the same as in the solution phase.4-6 As similar data on the nickel-ammonia complexes are not available, the stability of these complexes in different ion exchangers vis a vis their stability in aqueous solutions was first investigated. Having confirmed the nature of the nickel-ammonia complex in the resin phase, the isotope effect was determined by a breakthrough operation on ion-exchange columns. The use of the column technique, besides permitting a clean separation between the complex and ammonia, also multiplies the isotope effect. The latter can be of great advantage in those cases where the separation factor is small. The isotope effects have been calculated from the data in two independent ways: (i) the usual application of material balance equation, and (ii) Glueckauf’s7 theory of ion-exchange columns. The effective separation factors have been measured using ion exchangers of 4, 8, and 12% DVB content. In the presence of the ion exchanger, instead of reaction A, the following isotopic exchange reaction takes place
[Ni(14NH3) re_1(HNH3) ]rz+ + 16NH3(aq) % %
[Ni(14NH3)n_1(15NH3)]Ri+ + 14NH3(aq) (B)
This reaction is related to the reaction A through the additional equilibrium
[Ni(14NH3)re_i(14NH3) ]r2+ +[Ni(I4NH3)„_1(15NH3) ]«+(aq)
[Ni(14NH3)M_1(15NH3) ]RZ+ +[Ni(14NH3)M_1(14NH3) ]‘ +(aq) (C)
The relation between the three equilibria is K A = K b/Kc and the separation factor for reaction A is given by
ais/ac = « a
There is no way of directly observing ac, as the nickel-ammonia complexes are stable only in an excess of ammonia. The importance of equilibrium C is shown by the varying values of c*b obtained from experiments on ion exchangers of different cross linking. In the absence of directly measured values of ac they have been estimated from a consideration of similar equilibria on these resins. The single-stage factor for reaction A thus obtained has been discussed in the light of the theoretically calculated value and the previously observed value for the same reaction.
E x p e r i m e n t a l S e c t i o n
Chemicals. Resins used were of sulfonic acid type, viz., Dowex 50 W of different cross-linking (4, 8, and 12% DVB) and different mesh size (20-50 and 100-200) supplied by J. T. Baker Chemicals Co., Phillipsburg,N. J. Nickel chloride was BDH(LR) grade and was purified by filtering its ~ 1 M solution and then passing it through an ion-exchange column. Ammonia used was E. Merck GR grade.
Stability of Nickel-Ammonia Complexes in the Ion Exchanger. The stability of nickel-ammonia complexes in the ion-exchanger phase was determined as follows. A stock of Ni form of the resin (20-50 mesh) was prepared in the usual manner in a column and air- dried at room temperature (~30°). Its capacity was determined by volumetric estimation of Ni by the KCN method.8 * The value was verified by converting the resin into H form and then estimating the H+ ions. The values of the capacity obtained by the two methods were in very good agreement. The capacities and the moisture contents of the different resins were as follows: Dowex 50 W-X4, 2.224 mequiv, 40.97%; Dowex
(3) R. Nelson and H. F. Walton, J. Phys. Chem., 48, 406 (1944).(4) R. H. Stoke and H. F. Walton, J. Am. Chem. Soc., 7 6 , 3327 (1954).(5) L. Cockerell and H. F. Walton, J. Phys. Chem.. 66, 75 (1962).(6) M. G. Suryaraman and FI. F. Walton, ibid,., 66, 78 (1962).(7) E. Glueckauf in “ Separation of Isotopes,” H. London, Ed., George Newnes Ltd., London, 1961, pp 209-248.(8) A. I. Vogel, “A Textbook of Quantitative Inorganic Analysis,”Longmans Green & Co., London, 1958, p 264.
Volume 71, Number S February 1967

502 A. R. G u p t a a n d S. K. S a r p a l
50 W-X8, 2.665 mequiv, 37.58%; and Dowex 50 W -X- 12, 2.828 mequiv., 26.69% (all referred to the Ni formof the resin).
Weighed quantities of the Ni form of resin, usually1.0 g, were taken in 100-ml conical flasks and equilibrated by overnight shaking with 50 ml of ammonia solutions of different concentrations. The outside ammonia solution, in equilibrium with the nickel complex in the resin, was titrated volumetrically using a mixed indicator.5 The average number of ammonia molecules coordinated to nickel ion (n) was calculated from the difference in the concentrations of ammonia solutions before and after equilibration. The amount of free ammonia in the resin was neglected as the resin volume is much less compared with the total solution volume.
Column Experiments for the Nitrogen Isotope Effects. Columns of about 55-cm length and 19-mm i.d. were used for these experiments. Resin of the desired cross linking (100-200 mesh) was packed in the columns. Smaller size particles were removed from the column by repeated back washing. The columns were subjected to sodium-hydrogen cycle in the usual manner to ensure uniform packing. Total exchange capacity of the column in the hydrogen as well as the nickel form was determined by estimating the eluted H+ and Ni2+ ions as described earlier. The column was thoroughly washed with distilled water after converting it into Ni form. Ammonia solution of ^0.15 N strength was taken in a reservoir kept at a height and connected to the column with a tygon tube. The flow rate of ammonia solution was controlled by the stopcock at the bottom of the column. The front boundary of the band moved down fairly sharply and no channeling was usually observed. When the whole of the column .was converted into the nickel complex form and,ammonia appeared in the effluent, a number of 10-ml fractions were collected and their ammonia content determined by titrating against standard HC1 using the mixed indicator. The acidified samples were concentrated to a convenient volume for isotopic analysis. The amount of ammonia coordinated to Ni was estimated by eluting the complex with dilute HC1 and determining the ammonia in the effluent by Kjeldahl distillation technique. However, a correction was made for the excess of ammonia which was not present in the complex form in the column. This amount of ammonia was determined by repeating the experiment with Na form of the resin instead of the nickel form and keeping all other parameters constant.
Preparation and Isotopic Analysis of the Samples. The ammonia samples from the column, in the ammonium chloride form, were decomposed by sodium hy-
pobromite solution to get gaseous nitrogen as described by Rittenberg.10a Isotopic analysis was carried out with the CEC mass spectrometer type 21-103C (180° and single collector), using 28 and 29 peaks.
R e s u l t s a n d D i s c u s s i o n
A. Calculation of the Isotope Effect. A general analysis of the various vibrational modes of an octahedral hexaammine like M (NH3)6Z+ has been discussed by Cotton.10b For an exact calculation of the isotope effect, one should know the frequencies of all the normal vibrational modes of the molecule. In the case of Ni- (NH3)62+ many of the normal modes have not been observed. Thus an exact calculation of this isotope effect cannot be performed. However, the magnitude of the primary isotope effect is essentially determined by changes in the force constants of bonds made directly with the isotopically substituted atom.9 10 11 12 On this basis it has been pointed out by Kresge, et al.,n that to a good approximation primary isotope effects can be understood by considering only the isotopically substituted atom and those atoms which are bound directly to it. Accordingly, in the present problem the NiNH3 model for the complex has been chosen. This model is consistent with the assumption generally made in the interpretation of vibrational spectra of complexes that the interaction of vibrations in one NH3 ligand with those in another is small or negligible. Further, the only vibrational modes this particular model excludes from consideration, e.g., N -N i-N bending modes, are those which lie in the low-frequency range. Their contribution to the isotope effect, in any case, will be negligible. Thus no serious error is introduced by their exclusion from the isotope effect calculations.
Assuming a tetrahedral orientation of NiNH3 and an over-all symmetry of C3v for this part, the observed vibrational frequencies of the nickel hexaammine perchlorate have been assigned to different modes of vibration.13 The frequencies and their assignments are given in Table I.
(9) This indicator was prepared by mixing five parts of 0.1% solution of bromocresol green and one part of 0.1% solution of methyl red in methyl alcohol. Fresh indicator was prepared after every 2 weeks. The end point was detected by change in color from blue to red.(10) (a) D. Rittenberg, “Preparation and Measurement of Isotopic Tracers,” J. W. Edwards, Ann Arbor, Mich., 1948, p 34; (b) F. A. Cotton in “ Modern Coordination Chemistry,” J. Lewis and R. G. Wilkins, Ed., Interscience Publishers, Inc., New York, N. Y., 1960, p 361.(11) M. Wolfsberg and M. J. Stern, Pure Appl. Chem., 8, 225 (1964).(12) A. J. Kresge, N. N. Lichtin, K. N. Rao, and R. E. Weston, Jr., J. Am. Chem. Soc., 87, 437 (1965).(13) K. Nakamoto, “ Infrared Spectra of Inorganic Coordination Compounds,” John Wiley and Sons, Inc., New York, N. Y., 1963.
The Journal of Physical Chemistry
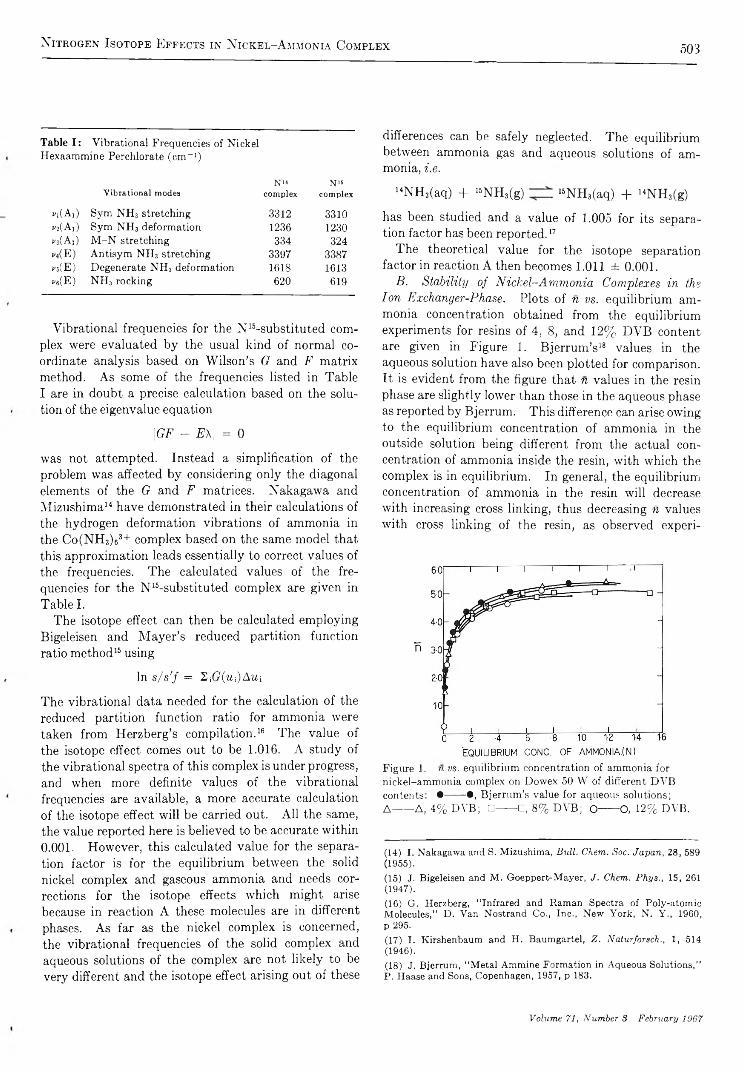
N i t r o g e n I s o t o p e E f f e c t s i n N i c k e l - A m m o n i a C o m p l e x 503
Table I : Vibrational Frequencies of Nickel Hexaammine Perchlorate (cm-1)
Vibrational modesN14
complexN15
complex
gi(A,) Sym NH3 stretching 3312 3310^(Ai) Sym NH3 deformation 1236 1230Vz(Ai) M -N stretching 334 324v4(E) Antisym NH3 stretching 3397 3387*»b(E) Degenerate NH3 deformation 1618 1613re(E) NH3 rocking 620 619
Vibrational frequencies for the N 15-substituted complex were evaluated by the usual kind of normal coordinate analysis based on Wilson’s G and F matrix method. As some of the frequencies listed in Table I are in doubt a precise calculation based on the solution of the eigenvalue equation
|GF - E\\ = 0
was not attempted. Instead a simplification of the problem was affected by considering only the diagonal elements of the G and F matrices. Nakagawa and Mizushima14 have demonstrated in their calculations of the hydrogen deformation vibrations of ammonia in the Co(NH3)63+ complex based on the same model that this approximation leads essentially to correct values of the frequencies. The calculated values of the frequencies for the N 15-substituted complex are given in Table I.
The isotope effect can then be calculated employing Bigeleisen and Mayer’s reduced partition function ratio method15 using
In s/s'f = 2i(?(wj)Awi
The vibrational data needed for the calculation of the reduced partition function ratio for ammonia were taken from Herzberg’s compilation.16 The value of the isotope effect comes out to be 1.016. A study of the vibrational spectra of this complex is under progress, and when more definite values of the vibrational frequencies are available, a more accurate calculation of the isotope effect will be carried out. All the same, the value reported here is believed to be accurate within0.001. However, this calculated value for the separation factor is for the equilibrium between the solid nickel complex and gaseous ammonia and needs corrections for the isotope effects which might arise because in reaction A these molecules are in different phases. As far as the nickel complex is concerned, the vibrational frequencies of the solid complex and aqueous solutions of the complex are not likely to be very different and the isotope effect arising out of these
differences can be safely neglected. The equilibrium between ammonia gas and aqueous solutions of ammonia, i.e.
14NH3(aq) + 15NH3(g) 16NH3(aq) + 14NH3(g)
has been studied and a value of 1.005 for its separation factor has been reported.17
The theoretical value for the isotope separation factor in reaction A then becomes 1.011 ± 0.001.
B. Stability of Nickel-Ammonia Complexes in the Ion Exchanger-Phase. Plots of n vs. equilibrium ammonia concentration obtained from the equilibrium experiments for resins of 4, 8, and 12% DVB content are given in Figure 1. Bjerrum’s18 values in the aqueous solution have also been plotted for comparison. It is evident from the figure that n values in the resin phase are slightly lower than those in the aqueous phase as reported by Bjerrum. This difference can arise owing to the equilibrium concentration of ammonia in the outside solution being different from the actual concentration of ammonia inside the resin, with which the complex is in equilibrium. In general, the equilibrium concentration of ammonia in the resin will decrease with increasing cross linking, thus decreasing n values with cross linking of the resin, as observed experi-
Figure 1. n v s . equilibrium concentration of ammonia for nickel-ammonia complex on Dowex 50 W of different DVB contents: •—•—• , Bjerrum’s value for aqueous solutions;A------A, 4% DVB; □— C, 8% DVB; O------O, 12% DVB.
(14) I. Nakagawa and S. Mizushima, Bull. Chem. Soc. Japan, 28, 589 (1955).(15) J. Bigeleisen and M. Goeppert-Mayer, J. Chem. Phys., 15, 261 (1947).(16) G. Herzberg, “ Infrared and Raman Spectra of Poly-atomic Molecules,” D. Van Nostrand Co., Inc., New York, N. Y., 1960, p 295.(17) I. Kirshenbaum and H. Baumgartel, Z. Naturforsch., 1, 514 (1946).(18) J. Bjerrum, “ Metal Ammine Formation in Aqueous Solutions,” P. Haase and Sons, Copenhagen, 1957, p 183.
Volume 71, Number 3 February 1967

504 A. R. G u p t a a n d S. K. S a r p a l
Table II : Apparent Separation Factors on Resins of Different Cross-Linking
Ammonia BedExptno.
Resin,%
concn,N
Capacity,mequiv
height,cm
Flow rate, ml/min a «av
1 4 0.150 213.4 40.0 1.43 1.0042 1.00432 4 0.146 213.4 39.0 1.43 1.00453 8 0.147 225.0 33.1 1.84 1.00624“ 8 0.149 154.9 23.7 1.56 1.0056 1.00635 8 0.147 154.9 23.3 2.06 1.00636 12 0.150 231.9 31.6 1.47 1.0072 1.00707 12 0.149 231.9 31.2 1.59 1.00688 4 0.400 160.0 . 28.5 1.90 1.0051 1.00519 12 0.397 231.9 31.1 0.89 1.0081 1.0081
“ Some channeling was observed in this experiment.
mentally. Thus from the data in. Figure 1 it is concluded that the nickel-ammonia complexes in the resin phase are almost as stable as they are in the aqueous solution.
C. Experimental Separation Factors. (1) From the Material Balance Equation. From the information obtained from chemical and isotopic analyses of effluent samples, the isotopic composition of the ion- exchange column can be calculated. The isotopic enrichment factor vs. the amount of ammonia in the effluent samples has been plotted for some typical runs in Figure 2. Curves A, B, and C have been obtained on 4, 8, and 12% DBV resins, respectively. In general, it was observed in these experiments that the ammonia concentration in the effluent reached the initial value very rapidly, indicating a sharp front. On the other hand, the isotopic composition of the samples reached the natural value much more slowly (Figure 2), implying that isotopic equilibrium is attained more slowly than chemical equilibrium. The area under the curves in Figure 2 directly gives the amount of N 16 transferred to the column. Knowing the total capacity of the column for ammonia at the concentration used, one can calculate the effective separation factor in a straightforward way. The effective separation factor is related to the apparent or experimental separation factor for the isotope-exchange reaction taking place in the column by the following relation7
Oiapp 16e" = 1 + (cC/F)
where a is the void fraction, C the concentration in millimoles/milliliter in the solution phase, and F the concentration in millimoles/milliliter in the resin phase. As we are using resins of different cross linking, a and F are expected to be different in each case. To de-
Figure 2. Breakthrough curves for the system nickel-ammonia eomplex/ammonia at ^0.15 N
ammonia concentration on Dowex 50 W of different cross linking: A, 4% DVB; B, 8% DVB; C, 12% DVB.
termine aapp, <x and F were measured for each resin sample and aC/F calculated. Its value in all the three cases was of the order of 0.0001 and for all practical purposes can be neglected. The results of the experiments on Dowex 50 W-X4, Dowex 50 W-X8, and Dowex 50 W-X12 with different ammonia concentrations are summarized in Table II. The estimated error in the value of the separation factors is less than 0.001.
The Journal of Physical Chemistry
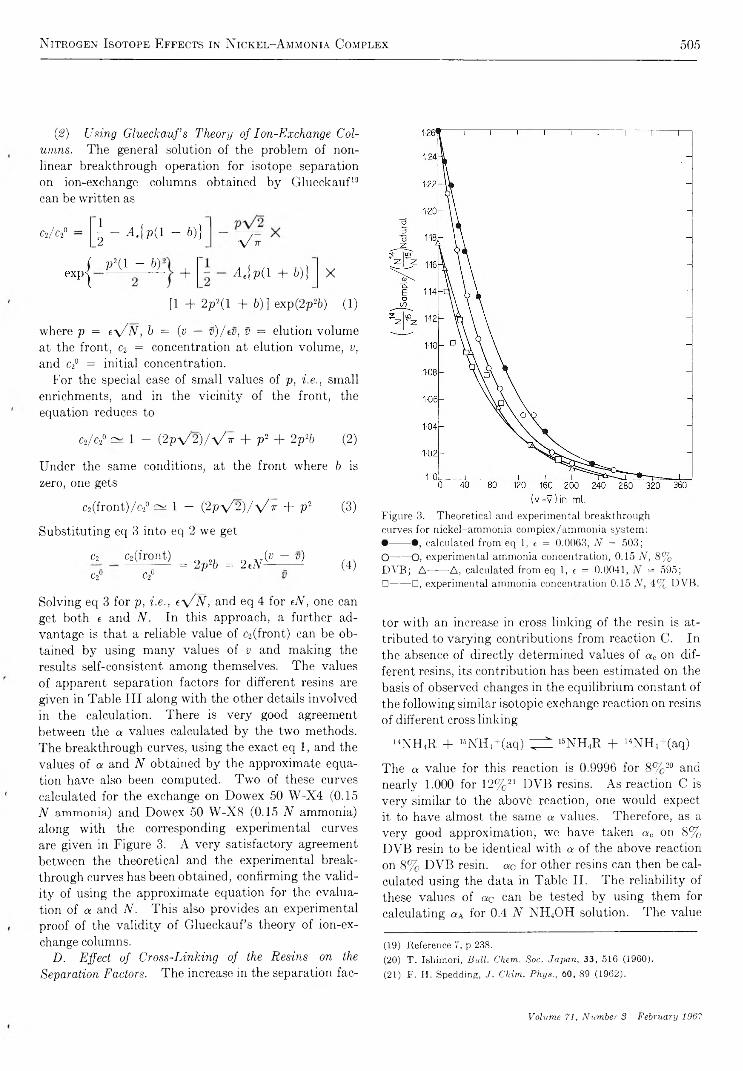
N i t r o g e n I s o t o p e E f f e c t s i n N i c k e l - A m m o n i a C o m p l e x 505
(#) Using Glueckauf’s Theory of Ion-Exchange Columns. The general solution of the problem of nonlinear breakthrough operation for isotope separation on ion-exchange columns obtained by Glueckauf19 can be written as
C2/c 2° \ - A \ v { 1 - 6 ) }\/ IT
p 2(i — by+ Ae{p(l + 6)} X
[1 + 2p2(l + 5)] exp(2p2b) (1)
where p = e \ / N , b = (v — v ) / tv, v = elution volume at the front, c2 = concentration at elution volume, v,
and c2° = initial concentration.For the special case of small values of p, i.e., small
enrichments, and in the vicinity of the front, the equation reduces to
c2/c 2° ~ 1 — (2 p V 2 ) /V t + p2 + 2p2b (2)
Under the same conditions, at the front where b is zero, one gets
c2(front)/c2° ~ 1 — (2pv/ 2)/'V / it + p2 (3)
Substituting eq 3 into eq 2 we get
c, affront) _ ^ _ 2<A, f f ^ r ) (4)C2U C2U
Solving eq 3 for p, i.e., es/N, and eq 4 for eN, one can get both e and N. In this approach, a further advantage is that a reliable value of c2(front) can be obtained by using many values of v and making the results self-consistent among themselves. The values of apparent separation factors for different resins are given in Table III along with the other details involved in the calculation. There is very good agreement between the a values calculated by the two methods. The breakthrough curves, using the exact eq 1, and the values of a and N obtained by the approximate equation have also been computed. Two of these curves calculated for the exchange on Dowex 50 W-X4 (0.15 N ammonia) and Dowex 50 W -X8 (0.15 N ammonia) along with the corresponding experimental curves are given in Figure 3. A very satisfactory agreement between the theoretical and the experimental breakthrough curves has been obtained, confirming the validity of using the approximate equation for the evaluation of a and N. This also provides an experimental proof of the validity of Glueckauf’s theory of ion-exchange columns.
D. Effect of Cross-Linking of the Resins on the Separation Factors. The increase in the separation fac
Figure 3. Theoretical and experimental breakthrough curves for nickel-ammonia compiex/ammonia system:•------•, calculated from eq 1, t = 0.0063, N = 503;O------O, experimental ammonia concentration, 0.15 N , 8%DVB; A------A, calculated from eq 1, e = 0.0041, N = 595;□------□, experimental ammonia concentration 0.15 N , 4% DVB.
tor with an increase in cross linking of the resin is attributed to varying contributions from reaction C. In the absence of directly determined values of ac on different resins, its contribution has been estimated on the basis of observed changes in the equilibrium constant of the following similar isotopic exchange reaction on resins of different cross linking
uNH4R + 16NH4+(aq) ^ 1SNH„R + 14NH4+(aq)
The a value for this reaction is 0.9996 for 8% 20 and nearly 1.000 for 12%21 DVB resins. As reaction C is very similar to the above reaction, one would expect it to have almost the same a values. Therefore, as a very good approximation, we have taken a 0 on 8% DVB resin to be identical with a of the above reaction on 8% DVB resin. ac for other resins can then be calculated using the data in Table II. The reliability of these values of ac can be tested by using them for calculating aA for 0.4 N NH4OH solution. The value
(19) Reference 7, p 238.(20) T. Ishimori, Bull. Chem. Soc. Japan, 33, 516 (1960).(21) F. H. Spedding, J. Chim. Phys., 60, 89 (1962).
Volume 71, Number 8 February 1967

506 A. R. G u p t a a n d S . K . S a r p a l
Table III: Calculation of e and N Using c2/c2° = 1 — [(2p V 2 )/ V H + P 2 + 2p26
2(p - s) HETP,V V C 2/ C 2° tN € N m m
A. 4% D V B resinv = 2850; c2/c2°(t>) = 0.850; A N = 0.01
2860 0.00703 0.8673 2.46 0.00407 6032865 0,01051 0.8757 2.44 0.00410 5952870 0.01402 0.8840 2.43 0.00413 587
Av 0.0041 Av 595 0 . 6 6
B . 8% D V B resinv = 2990; c2/c2°(S) = 0.794; e!JV = ; 0.02017
3000 0.0067 0.8150 3.13 0.00645 4853010 0.0134 0.8380 3.28 0.00615 5333020 0.0201 0.8569 3.14 0.00640 490
A v 0.0063 Av 503 0 . 6 8
C. 12% D V B resinv = 2926; c2/c2°(ü) = 0.848; A N = 0.01
2940 0.00952 0.863 1.575 0.00635 2482950 0.01640 0.874 1.585 0.00632 2512960 0.02320 0.884 1.550 0.00645 240
Av 0.0064 Av 246 1.28
of ac for different cross-linked resins and « a for different ammonia concentrations are given in Table IV. The close agreement between the values of aA obtained from data on resins of different cross-linking shows that this approach to the problem as well as the values of ac are essentially correct.
Table IV : Separation Factors for Reactions A and C
■aA-Resin, 0.15 V 0.40 N
% «C NH,OH NHiOH4 0 . 9 9 7 1.0068 1.00808 0.9996 1.0067
12 1.0003 1.0067 1.0078Av 1.0067 1.0079
Besides the effective separation factor, the difference in the cross linking of the resin also influences the over-all separation in a column, or in other words, the efficiency of the column. The best way to discuss this is in terms of the total number of theoretical plates of HETP (height equivalent of theoretical plate) obtained in a particular column. HETP in an ion-ex- change column depends upon the diffusion coefficient, particle size, flow rate, and distribution coefficient. For the experiments described in Table III the linear flow rates (1.0-1.2 cm/hr), the particle size (100-200 mesh), and the distribution coefficients were quite
comparable. The diffusion coefficients in resins of different cross linking are expected to be different and vary in the following order: D (4% DVB) > D (8% DVB) > D(12% DVB). As isotopic equilibrium in the column is achieved by the diffusion of ammonia molecules into and out of the resin particles, one would expect the largest number of plates (or the smallest HETP) in 4% DVB resin column and the least number (or the largest HETP) in 12% DVB resin column, the particle size and flow rate being the same. The data in Table III confirm the above expectation. The separation, i.e., the depletion in the front of the band, however, depends on both the number of plates in a column and the effective separation factor. As these two factors vary in opposite directions with an increase in cross linking of the resin, the frontal depletion does not follow a definite pattern. The largest separation has been achieved on resin of 8% DVB content, which shows the importance of considering both the factors, i.e., HETP and eeff, simultaneously if the aim is to obtain maximum separation.
E. Effect of Ammonia Concentration on Separation Factors. The interpretation of the experimental values of the separation factors is complicated by the presence of many different species in the system. In fact, all the nickel complexes having one to six ammonia molecules coordinated to the nickel ion are present in equilibrium with one another at a particular ammonia concentration. Thus aapp or aexp represents the weighted average of the six independent separation
The Journal of Physical Chemistry

N i t r o g e n I s o t o p e E f f e c t s i n N i c k e l - A m m o n i a C o m p l e x 507
factors of the equilibria represented by reaction A having n values from one to six. The equilibrium concentrations of the various species change with ammonia concentration and thus their contribution to <2exp also varies. The data in Table IV clearly show that «exp increases with ammonia concentration. Ishimori’s value of 1.0076 for a of this system at ~ 0 .3 N ammonia concentration is intermediate between the values at 0.15 and 0.40 N reported here and confirms the above trend. This dependence of the separation factor on ammonia concentration, i.e., concentration of various complex species present in the system, implies that the separation factors for equilibria involving individual complexes are different. These will be denoted by <*i, «2, etc., and (on — 1) and (a2 — 1) by ei, «2, etc. To evaluate the individual contributions of the equilibria with the nickel complexes having specific values of n, one needs to know the equilibrium distribution of the various species at different ammonia concentrations. Using the stability constants for the nickel- ammonia complexes given by Bjerrum, et al,,22 the equilibrium distribution of the various stepwise complexes was calculated for the three different ammonia concentrations and is given in Table V. It is obvious that the major contribution to aexp comes from equilibria where complexes with three, four, five and six ammonia molecules are involved.
Table V : Equilibrium Composition“ of Nickel-Ammonia Complexes at Various Concentrations
Concnof am- -------------------- No. of ammonia molecules-monia 1 2 3 4 5 6
0 .1 5 0 .8 3 2 .1 6 1 7 .27 4 0 .3 3 3 .13 5 .50 .3 0 .0 7 0 .3 9 6 .2 2 8 .9 4 8 .7 15 .70 .4 0 0 .0 2 5 0 .1 8 0 .3 2 2 3 .7 5 3 .0 2 2 .7
“ In mole per cent.
The concentration of the complex having three ammonia molecules is significant only at 0.15 N ammonia. As a first approximation, <23 is taken to be equal to a4. Then aexp can be written as
(«exp — 1) = (£3 + £4) («4 — 1) +
CC5 ( « 5 — 1 ) + X t , (a $ — 1 )
or
£ e x P £ 4 | X b £ 5 I T g 6 3
where x3, x4, etc., represent the mole fractions of the corresponding nickel-ammonia complexes. Using the
Table VI : Separation Factors for Different Nickel-Ammonia Complexes
No. of ammoniamolecules a
4 1 .006155 1 .00796 1.010
three different values of <2eXp for different x4, xb, and x6, a set of three simultaneous equations is obtained which can be solved for the three unknowns, e4, e6, and £6. The results are given in Table VI.
The theoretically calculated value of the separation factor is for the hexaammine nickel-ammonia system and compares very favorably with the experimentally observed value for the isotopic exchange reaction involving hexaammine nickel ion.
Conclusions
The above agreement shows that the various approximations made in the theoretical calculations of the isotope effects—particularly the one proposed by Kresge, et al.,12 that only those atoms which are directly bonded to the isotopic atom need be considered in such calculations— are quite valid. The success of the simple ion-exchange breakthrough technique in the isotope effect determination demonstrates the power of this technique in solving such problems. A much needed experimental proof of the validity of Glueckauf’s theory of ion-exchange columns, especially for the breakthrough operations, is provided for the first time by the good agreement between the values of the single-stage factor obtained from this theory and the material balance equation. A simple way of calculating single-stage factors and the number of theoretical plates from the experimental data based on this theory has been found and successfully applied. A more convincing proof of Glueckauf’s theory is provided by the good agreement between the calculated and observed breakthrough curves. This new application of Glueckauf’s theory can be of great importance for the industrial chemist interested in large-scale separations on ion-exchange columns. However, the most significant result which emerges out of this investigation is that the isotope effects, in a series of stepwise complexes of a metal cation with the same ligand, are different. This implies that the funda-
(22) J. Bjerrum, G. Schwarzenbach, and L. G. Sillen, “ Stability Constants,” Vol. II, The Chemical Society, London, 1958, p 47.
Volume 71, Number 3 February 1967

508 K a r l h e i n z K . B r a n d e s a n d R . J. G e r d e s
mental vibrational frequencies or the force constants are different in these stepwise complexes. It will be interesting to see whether one can experimentally observe such differences in the vibrational spectra of the different nickel-ammonia complexes.
Acknowledgment. The authors wish to express their sincere thanks to Dr. J. Shankar for his interest and encouragement during the course of this investigation. They also wish to acknowledge the help of Mr. K. N. Bhide in the isotopic analysis of the samples.
The Influence of 1,4-Dioxane and Tetrahydrofuran as Solvents upon the
Stability and the Solvation of Negative Ions of the Potassium
Compounds of Naphthalene and Anthracene
b y K a r l h e i n z K . B r a n d e s a n d R . J . G e r d e s 1 2 3 4 5
Contribution from the Department of Chemistry, Newberry College, Newberry, South Carolina3 and the Georgia Institute of Technology, Atlanta, Georgia 30832 (Received June 10, 1966)
Potassium compounds of naphthalene and anthracene were prepared under high-vacuum conditions (10-7 to 10 ~8 torr). Electronic spectra of the solutions of the compounds indicate that dipotassium anthracene is stable in tetrahydrofuran but partly splits into monopotassium anthracene and potassium metal if dissolved in 1,4-dioxane. Dipotassium naphthalene is not soluble in 1,4-dioxane. In tetrahydrofuran as solvent it is completely decomposed into monopotassium naphthalene. The electric conductivities of the potassium compounds of naphthalene and anthracene dissolved in tetrahydrofuran and 1,4- dioxane were determined to be about 106 * times higher than the corresponding conductivities of the solutions in 1,4-dioxane as solvent. The dissociation energies of the potassium compounds of naphthalene and anthracene in the two solvents used were found to be 2 to 3 kcal/mole in 1,4-dioxane and — 5 to — 7 kcal/mole in tetrahydrofuran, at room temperature.
I n t r o d u c t i o n
Compounds of aromatic hydrocarbons and alkali metals are now generally agreed to consist of ion-pair complexes with the hydrocarbon as the negative ion. This assumption is mainly based on electronic spectra2-10 and on esr spectra11-14 of the dissolved compounds. In some cases, however, the published results differed. This was, for instance, the case for a wide absorption band at 23,000 cm-1 in the spectrum of potassium naphthalene and several maxima in the spectrum of dipotassium anthracene.16 There is al
ready some evidence from conductivity measurements15’16 that these differences may be due to the
(1) To whom all correspondence should be addressed at Georgia Institute of Technology, Atlanta, Ga,(2) G. J. Hoijtink and J. van Schooten, Rec. Trav. Chirn., 71, 1089 (1958).(3) G. J. Hoijtink and J. van Schooten; ibid., 73, 355 (1954).(4) P. Balk, G. J. Hoijtink, and J. W. H. Schreuers, ibid., 76, 813 (1957).(5) P. Balk, S. de Bruijn; and G. J. Hoijtink, ibid., 76, 907 (1957).(6) G. J. Hoijtink and H. van de Meij, Z. Physik. Chem. (Frankfurt), 20, 1 (1959).
The Journal of Physical Chemistry
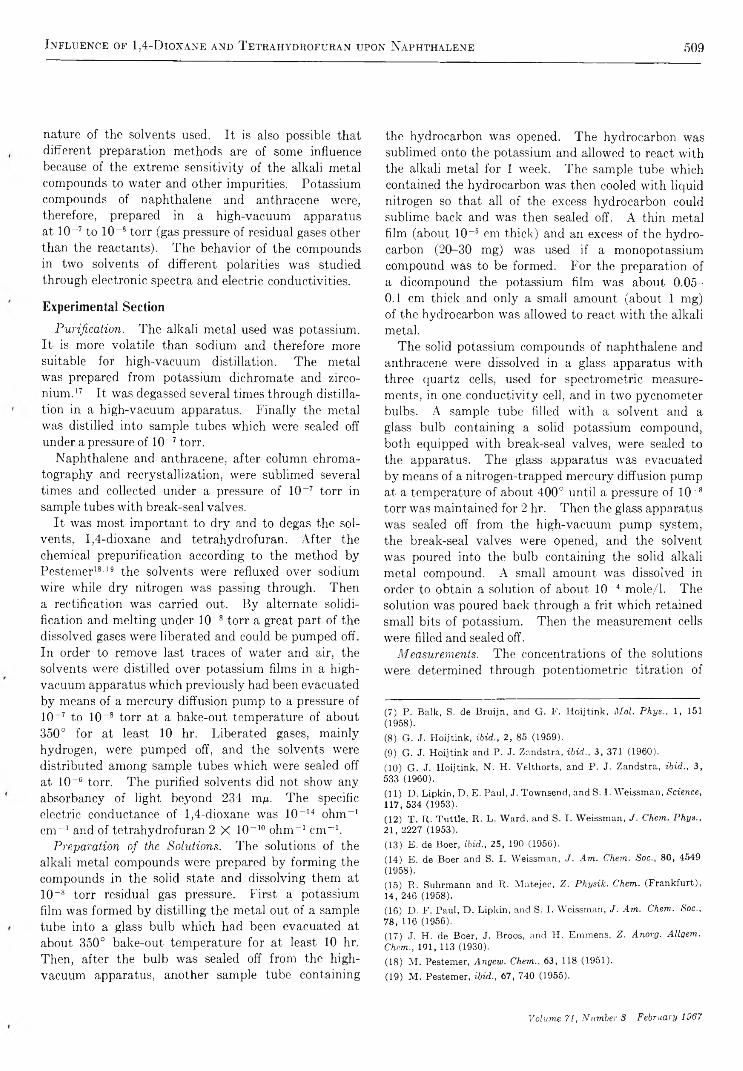
I n f l u e n c e o f 1 ,4 -D i o x a n e a n d T e t r a h y d r o f u r a n u p o n N a p h t h a l e n e 509
nature of the solvents used. It is also possible that different preparation methods are of some influence because of the extreme sensitivity of the alkali metal compounds to water and other impurities. Potassium compounds of naphthalene and anthracene were, therefore, prepared in a high-vacuum apparatus at 10“ 7 to 10“ 8 torr (gas pressure of residual gases other than the reactants). The behavior of the compounds in two solvents of different polarities was studied through electronic spectra and electric conductivities.
E x p e r i m e n t a l S e c t i o n
Purification. The alkali metal used was potassium. It is more volatile than sodium and therefore more suitable for high-vacuum distillation. The metal was prepared from potassium dichromate and zirconium.17 It was degassed several times through distillation in a high-vacuum apparatus. Finally the metal was distilled into sample tubes which were sealed off under a pressure of 10“ 7 torr.
Naphthalene and anthracene, after column chromatography and recrystallization, were sublimed several times and collected under a pressure of 10 _7 torr in sample tubes with break-seal valves.
It was most important to dry and to degas the solvents, 1,4-dioxane and tetrahydrofuran. After the chemical prepurification according to the method by Pestemer18'19 the solvents were refluxed over sodium wire while dry nitrogen was passing through. Then a rectification was carried out. By alternate solidification and melting under 10“ 8 torr a great part of the dissolved gases were liberated and could be pumped off. In order to remove last traces of water and air, the solvents were distilled over potassium films in a high- vacuum apparatus which previously had been evacuated by means of a mercury diffusion pump to a pressure of 10-7 to 10“ 8 torr at a bake-out temperature of about 350° for at least 10 hr. Liberated gases, mainly hydrogen, were pumped off, and the solvents were distributed among sample tubes which were sealed off at 10-6 torr. The purified solvents did not show any absorbancy of light beyond 234 mu- The specific electric conductance of 1,4-dioxane was 10-14 ohm-1 cm-1 and of tetrahydrofuran 2 X 10~10 ohm-1 cm“ 1.
Preparation of the Solutions. The solutions of the alkali metal compounds were prepared by forming the compounds in the solid state and dissolving them at 10-8 torr residual gas pressure. First a potassium film was formed by distilling the metal out of a sample tube into a glass bulb which had been evacuated at about 350° bake-out temperature for at least 10 hr. Then, after the bulb was sealed off from the high- vacuum apparatus, another sample tube containing
the hydrocarbon was opened. The hydrocarbon was sublimed onto the potassium and allowed to react with the alkali metal for 1 week. The sample tube which contained the hydrocarbon was then cooled with liquid nitrogen so that all of the excess hydrocarbon could sublime back and was then sealed off. A thin metal film (about 10~6 cm thick) and an excess of the hydrocarbon (20-30 mg) was used if a monopotassium compound was to be formed. For the preparation of a dicompound the potassium film was about 0.05- 0.1 cm thick and only a small amount (about 1 mg) of the hydrocarbon was allowed to react with the alkali metal.
The solid potassium compounds of naphthalene and anthracene were dissolved in a glass apparatus with three quartz cells, used for spectrometric measurements, in one conductivity cell, and in two pycnometer bulbs. A sample tube filled with a solvent and a glass bulb containing a solid potassium compound, both equipped with break-seal valves, were sealed to the apparatus. The glass apparatus was evacuated by means of a nitrogen-trapped mercury diffusion pump at a temperature of about 400° until a pressure of 10“ 8 torr was maintained for 2 hr. Then the glass apparatus was sealed off from the high-vacuum pump system, the break-seal valves were opened, and the solvent was poured into the bulb containing the solid alkali metal compound. A small amount was dissolved in order to obtain a solution of about 10“ 4 mole/i. The solution was poured back through a frit which retained small bits of potassium. Then the measurement cells were filled and sealed off.
Measurements. The concentrations of the solutions were determined through potentiometric titration of 7 8 9 10 11 12 13 14 15 16 17 18 19
(7) P. Balk, S. de Bruijn, and G. F. Hoijtink, Mol. Phys., 1, 151 (1958).(8) G. J. Hoijtink, ibid., 2, 85 (1959).(9) G. J. Hoijtink and P. J. Zandstra, ibid., 3, 371 (1960).(10) G. J. Hoijtink, N. H. Velthorts, and P. J. Zandstra, ibid., 3, 533 (1960).(11) D. Lipkin, D. E. Paul, J. Townsend, and S. I. Weissman, Science, 117, 534 (1953).(12) T. R. Tuttle, R. L. Ward, and S. I. Weissman, J. Chem. Phys., 21, 2227 (1953).(13) E. de Boer, ibid., 25, 190 (1956).(14) E. de Boer and S. I. Weissman, J. Am. Chem. Soc., 80, 4549 (1958).(15) R. Suhrmann and R. Matejec, Z. Physik. Chem. (Frankfurt), 14, 246 (1958).(16) D. F. Paul, D. Lipkin, and S. I. Weissman, J. Am. Chem. Soc., 78, 116 (1956).(17) J. H. de Boer, J. Broos, and H. Emmens, Z. Anorg. Allgem. Chem., 191, 113 (1930).(18) M. Pestemer, Angew. Chem., 63, 118 (1951).(19) M. Pestemer, ibid., 67, 740 (1955).
Volume 71, Number 3 February 1967

510 K a r l h e i n z K . B r a n d e s a n d R . J. G e r d e s
Figure 1. Spectra of the solutions of monopotassium naphthalene in tetrahydrofuran (c = 3.55 X 10⁻¹ mole/1.) and in 1,4-dioxane (c = 2.1 X 10“ 4 mole/1.).
v
S It It 20 ZS 31 It <0 IS it►----------► mo* cm-1
Figure 3. Spectra of the solutions of dipotassium anthracene in tetrahydrofuran (c = 1.0 X 10 ~ 4
mole/1.) and in 1,4-dioxane (c = 1.8 X 10⁻⁵ mole/1.).
Figure 2. Spectra of the solutions of monopotassium anthracene in tetrahydrofuran (c = 3.05 X 10⁻⁴ mole/1.) and in 1,4-dioxane (c = 1.4 X 10~4 mole/1.).
the potassium hydroxide formed by hydrolyzing the solutions. The concentrations were in the range of 10-4 mole/1. The electronic spectra were measured by means of a Hilger and Watts (London) spectrophotometer H 700 308. A Knick (Berlin) picoamperemeter P 27 equipped with a 120-v dc source was used for the determination of the low-electric conductivity of the solutions in 1,4-dioxane. The higher conductivity data of the corresponding solutions in tetrahydrofuran were measured by means of a Wheatstone bridge and a Heathkit voltmeter as null indicator. The voltage was 12 v, 50 cps ac.
Results and DiscussionElectronic Spectra. The spectra of the solutions of
x2100 uto ooo too m 200 200*11
Figure 4. Spectrum of the solution of monopotassium naphthalene, obtained by dissolving solid dipotassium naphthalene in tetrahydrofuran (c = 2.1 X 10~4 mole/1.).
the green monopotassium naphthalene (Figure 1) and of the blue monopotassium anthracene (Figure 2) in both solvents, 1,4-dioxane and tetrahydrofuran, are actually identical. Although 1,4-dioxane and tetrahydrofuran have different dielectric constants (2.2 and7.6), the polarity of the solvent apparently has no appreciable influence upon the energy of ir-electron transitions in the mononegative ions of naphthalene and anthracene. The results agree also with data of the monosodium compounds of naphthalene and anthracene which have been published previously.4-10
The blue dipotassium anthracene, dissolved in tetrahydrofuran (Figure 3), has its main absorption bands at 30.2 X 10³ and 16.2 X 103 cm-1. The
The Journal of Physical Chemistry

I n f l u e n c e o f 1 ,4 -D i o x a n e a n d T e t r a h y d r o f u r a n u p o n N a p h t h a l e n e 511
CASE I : Es + Ec > J - Ea
a* t e k -
A+ + B “ 1 ea r
J
A 4 BEs + Eq eg
(A+,,,B”)solv. ±A+solv. + B“solv. - STABLE IN
(A+,,,B”)iatticeSOLUTION
' STABLELATT1CE
aUi¡5 CASE 11 : Es + Ec < J - Ea
A M * e"
A+ + B“ ‘ EA r
J
(A+-B’ )solv. :A+solv + B~solv. .
Eg
UNSTABLE INA + B
SOLUTION
(A+-"B“)lattice STABLELATTICE
Figure 5. Energy diagram indicating the behavior of the monopotassium and dipotassium compounds in solid state and in solution: J , ionization of the energy of the alkali metal; Ea, electron affinity of the electron acceptor;E c , ion-pair bonding energy; Eg, lattice energy; and EBi solvation energy of the ion-pair complex.
corresponding solution in 1,4-dioxane shows, in addition to these two peaks, the main absorption maxima of the mononegative ion of anthracene to some extent. According to this result, the dipotassium anthracene is partly split into the monocompound and free alkali metal. A further peculiarity of the solution of dipotassium anthracene in 1,4-dioxane is the low-saturation concentration of 1.8 X 10⁻⁶mole/l.
The dipotassium naphthalene, which is purple in the solid state,20 is not soluble in 1,4-dioxane. In tetra- hydrofuran the compound could be dissolved. However, the color of the solution obtained was not purple but green, and the spectrum of this solution (Figure4) was actually identical with the spectrum of monopotassium naphthalene. This result indicates that a complete cleavage of the dipotassium naphthalene into the monopotassium naphthalene and free alkali metal had occurred.
The more or less complete cleavage of the dissolved dipotassium compounds of naphthalene and anthra
cene may be interpreted by means of the energy diagram in Figure 5.
An ion-pair complex, AB, is formed in the solid state if Eg > J — Ea. It is also stable in solution if Ec + Es > J — Ea (case 1). Examples are the monopotassium compounds of naphthalene and anthracene. On the other hand, a compound containing positive and negative ions will decompose in solution, more or less completely, into its initial components if Ec + Es < J — Ea (case 2), for instance, as does dipotassium naphthalene in tetrahydrofuran. The dissolved dipotassium anthracene shows both kinds of behavior: it is stable in tetrahydrofuran (case 1) but partly unstable in 1,4-dioxane (case 2). Apparently this is due to a small solvation energy, Es, of the dissolving process in 1,4-dioxane, a fact that might also explain the insolubility of the dipotassium compound of naphthalene in this solvent. This concept appears reasonable in view of the difference of the dielectric constants of the solvents, 1,4-dioxane (d = 2.2) and tetrahydrofuran (d = 7.6).
The spectra of the alkali metal compounds of naphthalene and anthracene show changes with time. However, these alterations caused a change of the color only in one case: the color of the solution obtained bydissolving the dipotassium naphthalene in tetrahydrofuran changed from green to orange within 1 hr. But in all spectra a broad absorption band at 22,500-23,000 cm-1 appeared after about 2 days. In the spectra of the mononegative ions this band was a mere shoulder, but it became very pronounced in the spectrum of the dinegative ion of anthracene. These changes are very probably caused by the formation of the protonated negative ion of naphthalene and anthracene.6’9'10
Electrical Conductance. The electric conductances of solutions of the potassium compounds of naphthalene and anthracene dissolved in 1,4-dioxane and tetrahydrofuran at 20° are listed in Table I.
The electric conductance of the solutions in tetrahydrofuran is about 106 times higher than the conductance of the solutions in 1,4-dioxane. These extremely great differences can be interpreted only by assuming a much higher degree of dissociation of the ion-pair complexes if dissolved in the more polar tetrahydrofuran rather than in 1,4-dioxane.
The molar conductivities of alkali metal compounds of naphthalene and anthracene in 1,4-dioxane agree with earlier results determined by Suhrmann and
(20) Solid dipotassium naphthalene could be identified by its spectrum; M. M. Gloger, Ph.D. Thesis, Technische Hochschule, Hannover, Germany, 1964.
Volume 71, Number 3 February 1967

512 K a r l h e i n z K. B r a n d e s a n d R. J. G e r d e s
Table I : Spécifié and Molar Electric Conductances
X, C , ActSolvent Compound ohm-1 cm-1 mole/1. ohm*-1 cm2 mole-1
Tetrahydrofuran Monopotassiumnaphthalene
6.4 X 10“7 3.55 X IO“ 4 1.8 X IO” 3
Monopotassiumanthracene
20.7 X 10⁻⁷ 3.05 X IO“ 4 6.8 X 10⁻³
Dipotassiumanthracene
6.1 X 10“ 7 1.00 X IO“ 4 6.1 X IO“ 3
1,4-Dioxane Monopotassiumnaphthalene
2.9 X 10~13 2.1 X 10⁻⁴ 1.4 X IO“ »
Monopotassiumanthracene
5.05 X 10⁻¹³ 1.2 X 10⁻⁴ 4.2 X 10⁻⁹
Matejec.15 The corresponding data of the solutions in tetrahydrofuran, however, turned out to be much lower than those found by other investigators16 who did not work under comparable high-vacuum conditions.
The electric conductance of the potassium compounds in 1,4-dioxane increases with the temperature in the range of 11°, the melting point of the solvent, up to 35°. In the case of the solutions in tetrahydrofuran, which solidifies at a much lower temperature, the conductance also increases with the temperature, but after passing a maximum in the range of —20 to — 10°, an inverse effect was observed. Plotting the logarithm of the molar conductivities of the solutions in 1,4-dioxane vs. 1/T yields straight lines (Figure 6). From the corresponding data for the solutions in tetrahydrofuran, curves with maxima have been obtained. The sloping and ascending branches of these curves can be approximated by straight lines (Figure 7).
The electrolytic dissociation and the viscosity of the solvent are the main influences in the temperature dependence of the electric conductance of a dissolved ionic compound. The Debye-Hückel interionic attraction can be neglected if the solution is as dilute as the investigated solutions of the potassium compounds of naphthalene and anthracene (1-4 X 10⁻⁴ mole/1.). With
Ac = constant X 1/?? X (cA+ + cB-) = constant' X
l/v X ca+ (1)
where A„ is molar conductance, viscosity coefficient, and ca+ and cB- concentrations of the ions formed from 1 mole of the compound, AB, and with
kd = Ca+Cb- / cab (2)
where kd is the dissociation constant, one obtains
Ac = constant' X 1/y X y/kd (3)
<5
Figure 6. Logarithm of the molar conductance as a function of 1/T of the compounds dissolved in 1,4-dioxane: top, monopotassium naphthalene (c = 2.1 X 10~4 mole/1.); bottom, monopotassium anthracene (c = 1.2 X 10~4 mole/1.).
if kd is small, and cA+ = cB-, and if cAB is unity. Writing eq 3 in logarithmic form and substituting for kd from the van’t Hoff law, In kd = —AHd/RT + const, will lead to the expression
log A0 + log r\ = const" — loge/2Æ X AHd X 1 /T (4)
The dissociation enthalpies of the potassium compounds of naphthalene and anthracene in the two sol-
The Journal of Physical Chemistry
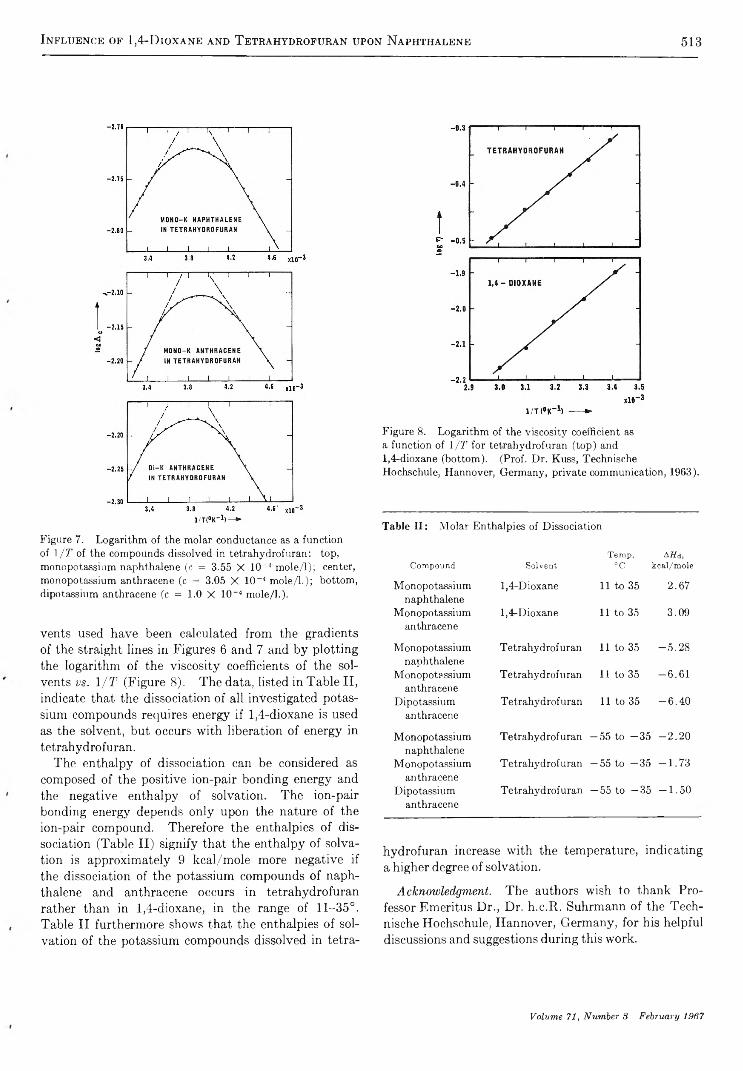
I n f l u e n c e o f 1 ,4 -D i o x a n e a n d T e t r a h y d r o f u r a n u p o n N a p h t h a l e n e 5 1 3
Figure 7. Logarithm of the molar conductance as a function of l / T of the compounds dissolved in tetrahydrofuran: top, monopotassium naphthalene (c = 3.55 X 10⁻⁴ mole/1); center, monopotassium anthracene (c = 3.05 X 10~4 mole/1.); bottom, dipotassium anthracene (c = 1.0 X 10~4 mole/1.).
vents used have been calculated from the gradients of the straight lines in Figures 6 and 7 and by plotting the logarithm of the viscosity coefficients of the solvents vs. l/T (Figure 8). The data, listed in Table II, indicate that the dissociation of all investigated potassium compounds requires energy if 1,4-dioxane is used as the solvent, but occurs with liberation of energy in tetrahydrofuran.
The enthalpy of dissociation can be considered as composed of the positive ion-pair bonding energy and the negative enthalpy of solvation. The ion-pair bonding energy depends only upon the nature of the ion-pair compound. Therefore the enthalpies of dissociation (Table II) signify that the enthalpy of solvation is approximately 9 kcal/mole more negative if the dissociation of the potassium compounds of naphthalene and anthracene occurs in tetrahydrofuran rather than in 1,4-dioxane, in the range of 11-35°. Table II furthermore shows that the enthalpies of solvation of the potassium compounds dissolved in tetra-
Figure 8. Logarithm of the viscosity coefficient as a function of l / T for tetrahydrofuran (top) and 1,4-dioxane (bottom). (Prof. Dr. Kuss, Technische Hochschule, Hannover, Germany, private communication, 1963).
Table II: Molar Enthalpies of Dissociation
Temp, AHd,Compound Solvent °C 1scal/mole
Monopotassiumnaphthalene
1,4-Dioxane 11 to 35 2.67
Monopotassiumanthracene
1,4-Dioxane 11 to 35 3.09
Monopotassiumnaphthalene
Tetrahydrofuran 11 to 35 -5 .2 8
Monopotassiumanthracene
Tetrahydrofuran 11 to 35 -6 .6 1
Dipotassiumanthracene
T etrahydrofuran 11 to 35 -6 .4 0
Monopotassiumnaphthalene
Tetrahydrofuran -5 5 to -3 5 -2 .2 0
Monopotassiumanthracene
Tetrahydrofuran -5 5 to -3 5 -1 .7 3
Dipotassiumanthracene
Tetrahydrofuran — 55 to —35 -1 .5 0
hydrofuran increase with the temperature, indicating a higher degree of solvation.
Acknowledgment. The authors wish to thank Professor Emeritus Dr., Dr. h.c.R. Suhrmann of the Technische Hochschule, Hannover, Germany, for his helpful discussions and suggestions during this work.
Volume 71, Number 3 February 1967

514 R. Ja c o b s e n , M . K e r k e r , a n d E . M a t i j e v i c
Aerosol Studies by Light Scattering.1 V. Preparation and Particle Size
Distribution of Aerosols Consisting of Particles Exhibiting
High Optical Absorption
b y R . T . J a c o b s e n , 2 M . K e r k e r , a n d E . M a t i j e v i c
Department of Chemistry and Institute of Colloid and Surface Science, Clarkson College of Technology, Potsdam, New York 18676 (Received June 13, 1966)
Aerosols consisting of solid spheres have been prepared in a newly designed generator by two-stage evaporation-condensation of vanadium pentoxide in a furnace capable of operating up to 1500°. Nuclei were prepared by evaporation of aluminum at 1000°, condensation to an aluminum aerosol, and subsequent burning in oxygen to AI2O3. The particle size distribution of the aerosols was determined by analysis of the angular distribution of the polarization of the scattered light. The special feature of this work resides in the high optical absorption of aerosol particles at the blue end of the visible spectrum (comparable to that of metals) and the low absorption at the red end (comparable to dielectrics). By considering several wavelengths, the very different scattering data on the same physical system led to size distributions which agreed with each other. The uniqueness of these results was explored with the aid of error contour maps.
I n t r o d u c t i o n
This paper describes the preparation of aerosols consisting of submicronic spheres obtained by evaporation-condensation of vanadium pentoxide and the determination of their particle size distribution by light scattering. The special feature of this aerosol, which motivated the research, is its high optical absorption in the lower wavelength part of the visible spectrum, comparable to that of metals. On the other hand, the dispersion of the optical constants is such that at the higher visible wavelengths there is very little absorption, so that in this range it behaves as a dielectric. Thus the same physical system scatters light as a metallike highly absorbing material or as a moderately absorbing “ colored” material, depending upon which part of the visible spectrum is selected for the incident radiation.
Interestingly, ir_ his development of the theory of scattering by spheres, Mie3 was primarily concerned with metal sols, and in Born’s book4 the subject of light scattering is still classified under the “ optics of metals.” However, although there has been some recent work on aerosols5 and hydrosols6 7" 8 consisting of metallic or highly
absorbing particles, the overwhelming bulk of experimental work today deals with dielectric spheres.
In earlier studies, we developed a light-scattering technique, designated as the polarization ratio method,9 in order to determine the particle size distribution of hydrosols,10 of aerosols consisting of liquid droplets,11
(1) This investigation was supported by Grant DA-SIG-36-039- 61-G-15, U. S. Army Material Agency, Ft. Monmouth, N. J.(2) The work presented in this paper is based on the Ph.D. Thesis of If. T. Jacobsen.(3) G. Mie, Ann. Phys., (4) 25, 377 (1908).(4) M. Born and E. Wolf, “ Principles of Optics,” Pergamon Press, London, 1959.(5) M. Kerker, A. L. Cox, and M. D. Schoenberg, J. Colloid Sci., 10, 413 (1955).(6) M. Kerker, G. L. Jones, Jr., J. B. Reed, C. N. P. Yang, and M. D. Schoenberg, J. Phys. Chem., 58, 1147 (1954).(7) R. H. Doremus, J. Chem. Phys., 42, 414 (1965).(8) R. H. Morriss and L. F. Collins, ibid., 41, 3357 (1964).(9) M. Kerker, E. Matijevic, W. F. Espenscheid, W. A. Farone, and S. Kitani, J. Colloid Sci., 19, 213 (1964).(10) M. Kerker, E. Daby, G. Cohen, J. P. Kratohvil, and E. Matijevic, J. Phys. Chem., 67, 2105 (1963).(11) E. Matijevic, S. Kitani, and M. Kerker, J. Colloid Sci., 19, 223 (1964); E. Matijevic, M. Kerker, and K. F. Schulz, ibid., 17, 26 (1962).
The Journal of Physical Chemistry
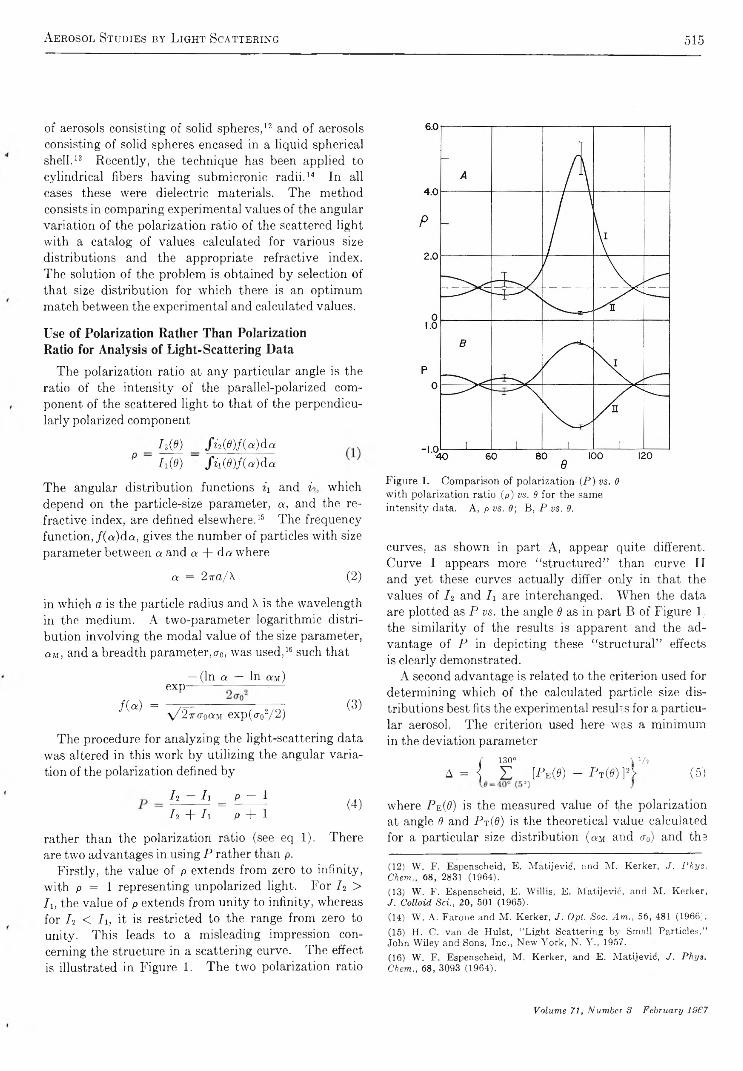
A e r o s o l S t u d i e s b y L i g h t S c a t t e r i n g 515
of aerosols consisting of solid spheres,12 and of aerosols consisting of solid spheres encased in a liquid spherical shell.13 Recently, the technique has been applied to cylindrical fibers having submicronic radii.14 In all cases these were dielectric materials. The method consists in comparing experimental values of the angular variation of the polarization ratio of the scattered light with a catalog of values calculated for various size distributions and the appropriate refractive index. The solution of the problem is obtained by selection of that size distribution for which there is an optimum match between the experimental and calculated values.
U s e o f P o l a r i z a t i o n R a t h e r T h a n P o l a r i z a t i o n
R a t i o f o r A n a l y s i s o f L i g h t - S c a t t e r i n g D a t a
The polarization ratio at any particular angle is the ratio of the intensity of the parallel-polarized component of the scattered light to that of the perpendicularly polarized component
_ HO) _ S m f j c d d a P h ( 0 ) f i i ( 6 )f ( a ) d a
The angular distribution functions ix and i>, which depend on the particle-size parameter, a, and the refractive index, are defined elsewhere.15 The frequency function, f ( a ) d a , gives the number of particles with size parameter between a and a. + da where
a = 2wa/\ (2)
in which a is the particle radius and X is the wavelength in the medium. A two-parameter logarithmic distribution involving the modal value of the size parameter, a¡vi, and a breadth parameter, <r0, was used,16 such that
— (In a — In aii)exp----------— -----—
/ ( « ) = - & = — (3 ) \/2ir(Toau exp (croV 2 )
The procedure for analyzing the light-scattering data was altered in this work by utilizing the angular variation of the polarization defined by
h - h = P - 1 l ì + l i p + 1 (4)
rather than the polarization ratio (see eq 1). There are two advantages in using P rather than p.
Firstly, the value of p extends from zero to infinity, with p = 1 representing unpolarized light. For h > I lt the value of p extends from unity to infinity, whereas for h < h, it is restricted to the range from zero to unity. This leads to a misleading impression concerning the structure in a scattering curve. The effect is illustrated in Figure 1. The two polarization ratio
F ig u re 1. Com parison of polarization ( P ) vs. 8 w ith polarization ratio (p ) vs. 8 for the same in tensity data. A , p vs. 8; B , P vs. 9.
curves, as shown in part A, appear quite different. Curve I appears more “ structured” than curve II and yet these curves actually differ only in that the values of / 2 and h are interchanged. When the data are plotted as P vs. the angle 6 as in part B of Figure 1, the similarity of the results is apparent and the advantage of P in depicting these “ structural” effects is clearly demonstrated.
A second advantage is related to the criterion used for determining which of the calculated particle size distributions best fits the experimental results for a particular aerosol. The criterion used here was a minimum in the deviation parameter
/ 1 3 0 ° A ‘ A
A = { £ LPe(0) - P t(0)]*> (5)
where P e (8 ) is the measured value of the polarization at angle 6 and Pt(0) is the theoretical value calculated for a particular size distribution (as and <r0) and the
(12) W . F . Espenscheid, E . M atijevic , and M . Kerker, J. P h ys . Chem., 68, 2831 (1964).(13) W . F . Espenscheid, E . W illis , E . M atijevic , and M . K e rke r, J. Colloid Sei., 20, 501 (1965).(14) W . A . Farone and M . Kerker, J. Opt. Soc. A m ., 56, 481 (1966).(15) H . C . van de H u lst, “ L ight Scattering by Small Partic les ,’ ’ John W iley and Sons, In c ., New Y o rk , N . Y . , 1957.(16) W . F . Espenscheid, M . Kerker, and E . M atijevic , J. P h ys. Chem., 68, 3093 (1964).
Volume 71, Number 3 February 19C7
516 R. J a c o b s e n , M. K e r k e r , a n d E. M a t i j e v i 6
complex refractive index at the particular wavelength.In the earlier work in which the polarization ratio had
been used, the corresponding criterion utilized the residuals of the fractional deviations of the experimental and calculated values of p. Actually, it was not quite correct to assume a constant fractional error in p as had been done because values of p close to zero or very large values of p correspond to one of the polarized components being very weakly scattered. Under such circumstances, the systematic errors (spurious reflection, dark current noise, etc.) become significant compared to those errors which are proportional to the signal. Accordingly, there is a higher fractional error. However, for the polarization P, this effect is at least partially compensated for when only the residual of P is used, as in eq 5. This follows because, for a constant fractional error in the intensity (which, in turn, leads to a constant fractional error in p), the residual in P is smaller for values of P closer to unity. It is just these values of P that correspond to values of p which are either close to zero or are large. Accordingly, using the unweighted residuals in P corresponds to using weighted residuals of the fractional deviations in p. This effect is shown in Figure 1, where the vertical lines depict the error corresponding to a 10% error in p. The corresponding error in P is less as P approaches unity.
Theoretical values of P were calculated from / 2 and 7i which, in turn, were computed for an array of an, 0, <r0, and m combinations. In computing J2 and h, the numerical integration was cut off at limits e*3™.
V a n a d i u m P e n t o x i d e A e r o s o l G e n e r a t o r
The technique for producing aerosols, consisting of solid submicronic spheres, by evaporation of vanadium pentoxide differs somewhat from that used earlier to prepare aerosols of NaCl12'17 and AgCl.13 19 20 21 A carrier gas, upon passage through a furnace, picks up vapor of the material from which the aerosol is to be formed. The gas mixture cools after leaving the furnace, and condensation takes place upon foreign nuclei, if these have been introduced into the system, or, in their absence, upon fluctuation embryos. The first case will be referred to as heterogeneous nucleation, the second as homogeneous nucleation.
Earlier experience in generating solid aerosols of NaCl and AgCl indicated the following general rules.
(1) Particle size increases with furnace temperature.
(2) If the aerosol is formed in two successive stages, this results in a narrower size distribution, but addition of a third stage does not continue to narrow the distribution significantly.
(3) For a given set of operating conditions, larger particles are formed in the presence of foreign nuclei. Up to a certain point, decreasing the concentration of foreign nuclei results in still larger particles.
(4) Under conditions of self-nucleation, larger particles are formed at higher flow rates of carrier gas. With foreign nuclei present, smaller particles are formed at higher flow rates.
Even with these guidelines, we were unable, by exhaustive trial and error experimentation with the previously existing apparatus, to obtain the aerosols required for this work. These should consist of particles with radii in the tenths of a micron range and of narrow size distribution. The particle concentration should be sufficiently high to give appreciable light scattering and yet not so high that extensive coagulation or multiple scattering occurs.
It seemed reasonable to expect that the crucial parameter might be the vapor pressure generated in the furnace. The temperature ranges over which various aerosols (NaCl, AgCl, octanoic acid) had previously been obtained indicated that optimum conditions for homogeneous nucleation were reached when the vapor pressure was approximately 1 torr. On this basis, it appeared that a temperature of 1000°, or even considerably higher, would be needed for vanadium pentoxide.18-21
A high-temperature furnace, capable of operating up to 1500°, was designed and built. The refractory material was Harbison and Walker H-W 28 insulating brick. The heating elements were carborundum Delta Globars, Type AT. Temperature was monitored by measurement of power dissipation after calibration by a chromel-alumel thermocouple. Detailed drawings of the high-temperature furnace and its operating conditions are described elsewhere.22
A schematic diagram of the new aerosol generator is shown in Figure 2. The upper section of the diagram is the nucleator where the small, nonvolatile foreign nuclei are produced and dispersed into the gas stream. The lower section depicts the main part of the generator where either heterogeneously or homogeneously nu-
(17) W. F. Espenscheid, E. Matijevie, and M. Kerker, J. Colloid Sci., 18, 91 (1963).(18) “ International Critical Tables,” Vol. Ill, National Research Council, 1928, p 213.(19) C. G. Maier, U. S. Bureau of Mines Technical Paper 360, 1925.(20) Yu. Polyakov, J. Phys. Chem. USSR, 20, 1021 (1946).(21) J. Berkowitz, W. A. Chupka, and M. G. Inghram, J. Chem. Phys., 27, 87 (1957),(22) R. T. Jacobsen, Ph.D. Thesis, Clarkson College of Technology, 1966, University Microfilm.
The Journal of Physical Chemistry

A e r o s o l S t u d i e s b y L i g h t S c a t t e r i n g 517
Figure 2. Schematic diagram of the aerosol generator: (1) argon source; (2a, b) oxygen sources; (3a, b, c, d) flow meters; (4a, b) mixing chambers; (5a, b, c) viewing chambers; (6) nucleator furnace; (7) burner furnace; (8) boiler furnace; (9a, b, c, d) combustion tubes; (10) thermopositor; (11) light-scattering photometer; (12) light-scattering cell.
cleated aerosols are formed. The lower section will be described first.
A stream of metered carrier gas enters a viewing chamber (5a) from either the nucleator or from an external source and is then directed through combustion tubes (9c) and (9d) located in the high-temperature furnace (8). In (9c) the carrier gas picks up the vapor supplied from a glazed porcelain boat containing vanadium pentoxide. Condensation to an aerosol occurs v/hen the vapor stream reaches the cold zone near the exit of the furnace. A second stage of growth occurs in the second combustion tube (9d), and the aerosol may then be directed to a chamber (5c) for visual inspection, a thermal precipitator (10) for collection on electron microscope grids, or a cell for light-scattering measurements (11, 12). All exhausts were led into a fume hood. The reader is cautioned that vanadium oxide vapors have been reported to be highly toxic.23
Despite the expectation that a furnace temperature cf 1000° or slightly higher might generate sufficient vapor to form aerosols of sufficiently large particle size, this did not turn out to be the case.
In the molten phase, "WOs begins to polymerize at temperatures above 900°, as evidenced by a marked increase in the apparent viscosity of the melt and also by a complete change in appearance upon cooling. Whereas the material cooled from 750° was quite lustrous and decidedly crystalline in appearance with a definite melting point, the material cooled from temperatures above 900° slowly thickened into a dull mass.
In addition, the V2O5 began to decompose at the high temperatures, probably into oxygen and a lower oxide,
as has been reported in the literature.24'25 This was evidenced by the formation of a precipitate in the hot melt. In order to inhibit this decomposition, the carrier gas was changed from helium to oxygen, and this did result in the aerosol particles becoming somewhat larger. The enhanced stability of vanadium pentoxide in an oxygen atmosphere is in accordance with thermodynamic data as reported by Mah and Kelley.26
Further improvement was obtained by installing quartz stirrers in each combustion tube in order to mix the heavy vapors with the carrier gas. With these improvements, self-nucleated aerosols, having a modal radius ranging from 0.075 to 0.200 g, could be produced over the temperature range 1000-1400° at a flow rate of 0.6 l./min. Useful aerosols were not obtained at substantially higher temperatures, probably due to the decomposition even in pure oxygen.
We now consider the problem of selection of a substance from which to form foreign nuclei. The conditions are rather stringent. The material should be sufficiently volatile to vaporize and then condense to nuclei, and yet it may not evaporate in the high- temperature furnace of the generator where it must serve as a condensation nucleus.
The technique finally evolved utilizes aluminum in a two-step process. This will be described with reference to the nucleator section of the schematic diagram in Figure 2. Filtered and metered argon (1) passes through a combustion tube which contains molten aluminum in a glazed porcelain boat (9a). Both furnaces in this section of the generator were standard hinged-type single-tube combustion furnaces controlled by auto-transformers. The combustion tubes were fused quartz, since it was found that the aluminum vapor attacks ceramic tubes, causing rupture after 2 or 3 hr of operation. In the nucleator furnace the inert carrier stream picks up aluminum vapor which presumably condenses into nuclei upon leaving the hot zone. From here, the aluminum-argon stream enters flask (4a) where it is mixed with oxygen entering through flow meter (3b), and the mixture passes into furnace (7) where the aluminum burns to Al2Oa. The carrier gas with the A120 3 nuclei then passes into mixing chamber (4b) where it is diluted further with oxygen, then into viewing chamber (5a) where visual inspection in a light beam can be performed to ensure that the
(23) E. A. Mel’nikova, Gigiena i Sanit., 22, 25 (1957).(24) K. Iwase and N. Nasu, Sci. Rept. Tohoku Univ., Series 1, K. Honda Anniversary Vol., 476 (1936).(25) F. Vratny and F. Micale, Trans. Faraday Soc., 59, 2739 (1963).(26) A. D. Mah and K. K. Kelley, U. S. Bureau of Mines Report Investigation 5858, 1961.
Volume 71, Number 8 February 1967

518 R. Ja c o b s e n , M . K e r k e r , a n d E. M a t i j e v i 6
particles are not too large. From here, part of the stream can be exhausted to adjust the final flow rate before entering the generator section.
The temperature at which to operate furnace (6) was determined in the same manner used to predict the necessary furnace temperatures for the V2O5. Previous experimental experience indicated that successful nucleation resulted when the vapor pressure of the nucleating material (e.g., NaCl, NaF) was approximately 0.1 torr. In this work, the nucleator furnace was kept at 1000°, at which temperature the vapor pressure of aluminum is ~ 0 .1 torr.
O t h e r E x p e r i m e n t a l A r r a n g e m e n t s
The other experimental arrangements were, for the most part, the same as used in our earlier work. Collection for electron micrographic observation was made by means of thermal precipitation in a Model B thermopositor produced by the American Instrument Co. The deposition was on collodion-coated, 200-mesh, Vs-in. copper screens. Observations were made directly on the samples as collected with a Philips Model 75B electron microscope. No shadowing or replication techniques were used. The particles appeared spherical, and any aggregation in the electron micrographs appeared to be an artifact of the collection procedure. This was shown to be the case by varying the collection time. As this is shortened, the fraction of apparently aggregated particles decreases, indicating that the aggregates actually form by collision on the collection grid.
No attempt was made to determine the composition of the aerosol particles obtained by the condensation of the vaporized V2O5. Electron diffraction patterns were taken of especially dense collections of particles. These showed none of the sharp lines characteristic of crystalline material, but only a single diffuse diffraction maximum which was due in a large part to the collodion substrate. The lack of a sharp diffraction pattern apparently was not due to line broadening caused by the small particle size, since the electron diffraction pattern for particles from a V20 6 hydrosol, which are even smaller but which are crystalline, did give a sharp diffraction pattern. It is quite possible that the aerosol particles consisted of a mixture of vanadium oxides.27 This, however, has no effect upon the particle size distribution analysis by light scattering, because the measurements were taken on the same aerosol using different wavelengths, and the refractive index was obtained by a fitting procedure.
Particle size analyses of the electron micrographs were made on a Zeiss Model TGZ-3 particle size analyzer.28 Calibration to absolute size was accomplished
by means of a carbon replica grating with 28,800 lines/ in. This was photographed with each aerosol at the same electron microscope settings.
For the light-scattering measurements, the aerosol was directed into a specially designed cell mounted on the cell table of a modified Brice-Phoenix Series 2000 light-scattering photometer, as described elsewhere.13 Glan-Thompson prisms were used in place of the standard polaroid filters, and the wiring to the lamp house of the instrument was modified to accept either the standard power supply for an AH-3 mercury arc or a6-v, 18-amp projector lamp which was used with interference filters for wavelengths of 489 and 659 m/i. The 406, 436, 546, and 578-myii mercury lines were also isolated with interference filters. A 2-mm circular nose piece was mounted in front of the photomultiplier, producing a 5° angle of acceptance.
R e f r a c t i v e I n d e x o f V a n a d i u m P e n t o x i d e
The complex refractive index necessary for the calculation of i\ and i% was not known for vanadium pent- oxide. This was determined ellipsometrically by reflectance measurements from a single crystal of vanadium pentoxide approximately 2 X 8 X 25 mm, grown by Servi-Elements, Inc., and cut and polished by Harshaw Chemical, Crystal and Solid State Division. Because crystalline vanadium pentoxide is anisotropic, this led to three principal refractive indices corresponding to the three symmetry axes. Since the composition of the aerosol particles was not known, an average of the three refractive indices for the crystal was used as a 'preliminary trial value in the light-scattering work. The final result was a set of values for aM, 00, and the complex refractive index which gave the best fit between the calculated and experimental values of the polarization over the angular range 40°(5°) 130°. The values for the complex refractive index of the aerosol particles which were finally used are given in Table I. The ellipsometric work is described in detail elsewhere.22
R e s u l t s a n d D i s c u s s i o n
Although the technique for producing aerosols using solid V2O5 as starting material, which was finally evolved as described above, did produce aerosols which were amenable to light-scattering analysis, these were not as stable nor as reproducible nor could they be prepared over as wide a range of sizes as the NaCl and AgCl aerosols obtained earlier. For this reason, there will be no attempt here to correlate the aerosol proper-
(27) L. Brewer, Chem. Rev., 52, 1 (1953).(28) F. Endter and H. Gebauer, Optik, 13, 97 (1965).
The Journal of Physical Chemistry
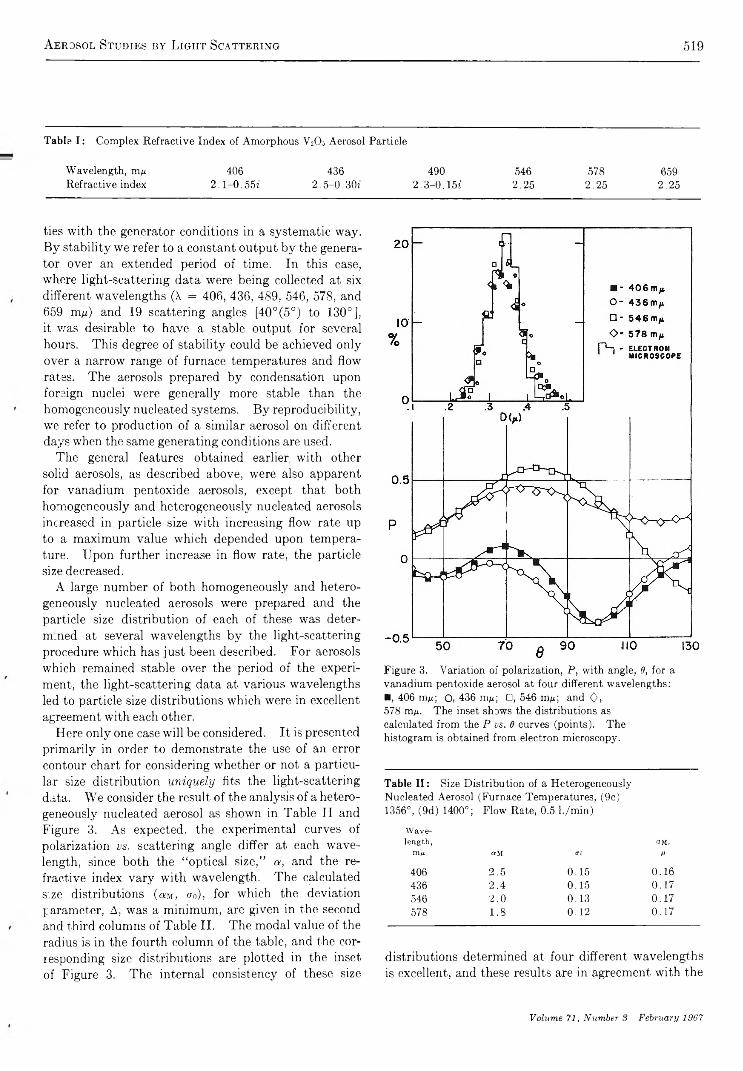
A e r o s o l S t u d i e s b y L i g h t S c a t t e r i n g 519
Table I: Complex Refractive Index of Amorphous V2Os Aerosol Particle
Wavelength, mM 406 436 490 546 578 659Refractive index 2.1-0.55f 2.5-0.30f 2 .3 -0 .15i 2.25 2.25 2.25
ties with the generator conditions in a systematic way. By stability we refer to a constant output by the generator over an extended period of time. In this case, where light-scattering data were being collected at six different wavelengths (X = 406, 436, 489, 546, 578, and 659 m/r) and 19 scattering angles [40°(5°) to 130°], it v/as desirable to have a stable output for several hours. This degree of stability could be achieved only over a narrow range of furnace temperatures and flow rates. The aerosols prepared by condensation upon foreign nuclei were generally more stable than the homogeneously nucleated systems. By reproducibility, we refer to production of a similar aerosol on different days when the same generating conditions are used.
The general features obtained earlier with other solid aerosols, as described above, were also apparent for vanadium pentoxide aerosols, except that both homogeneously and heterogeneously nucleated aerosols increased in particle size with increasing flow rate up to a maximum value which depended upon temperature. Upon further increase in flow rate, the particle size decreased.
A large number of both homogeneously and heterogeneously nucleated aerosols were prepared and the particle size distribution of each of these was determined at several wavelengths by the light-scattering procedure which has just been described. For aerosols which remained stable over the period of the experiment, the light-scattering data at various wavelengths led to particle size distributions which were in excellent agreement with each other.
Here only one case will be considered. It is presented primarily in order to demonstrate the use of an error contour chart for considering whether or not a particular size distribution uniquely fits the light-scattering data. We consider the result of the analysis of a heterogeneously nucleated aerosol as shown in Table II and Figure 3. As expected, the experimental curves of polarization vs. scattering angle differ at each wavelength, since both the “ optical size,” a, and the refractive index vary with wavelength. The calculated size distributions (aM) <ro), for which the deviation parameter, A, was a minimum, are given in the second and third columns of Table II. The modal value of the radius is in the fourth column of thehable, and the corresponding size distributions are plotted in the inset of Figure 3. The internal consistency of these size
Figure 3. Variation of polarization, P, with angle, 8 , for a vanadium pentoxide aerosol at four different wavelengths: ■, 406 mju; O, 436 m x; □, 546 mfi; and 0 ,
578 m/x. The inset shows the distributions as calculated from the P v s . 8 curves (points). The histogram is obtained from electron microscopy.
Table II : Size Distribution of a HeterogeneouslyNucleated Aerosol (Furnace Temperatures, (9c) 1356°, (9d) 1400°; Flow Rate, 0.5 l./min)
Wavelength, <XM,
mß «M <ro e
406 2 .5 0 .1 5 0 .1 6436 2 .4 0 .1 5 0 .1 7546 2.0 0 .1 3 0 .1 7578 1.8 0.12 0 .1 7
distributions determined at four different wavelengths is excellent, and these results are in agreement with the
Vohimè 71, Number 8 February 1967
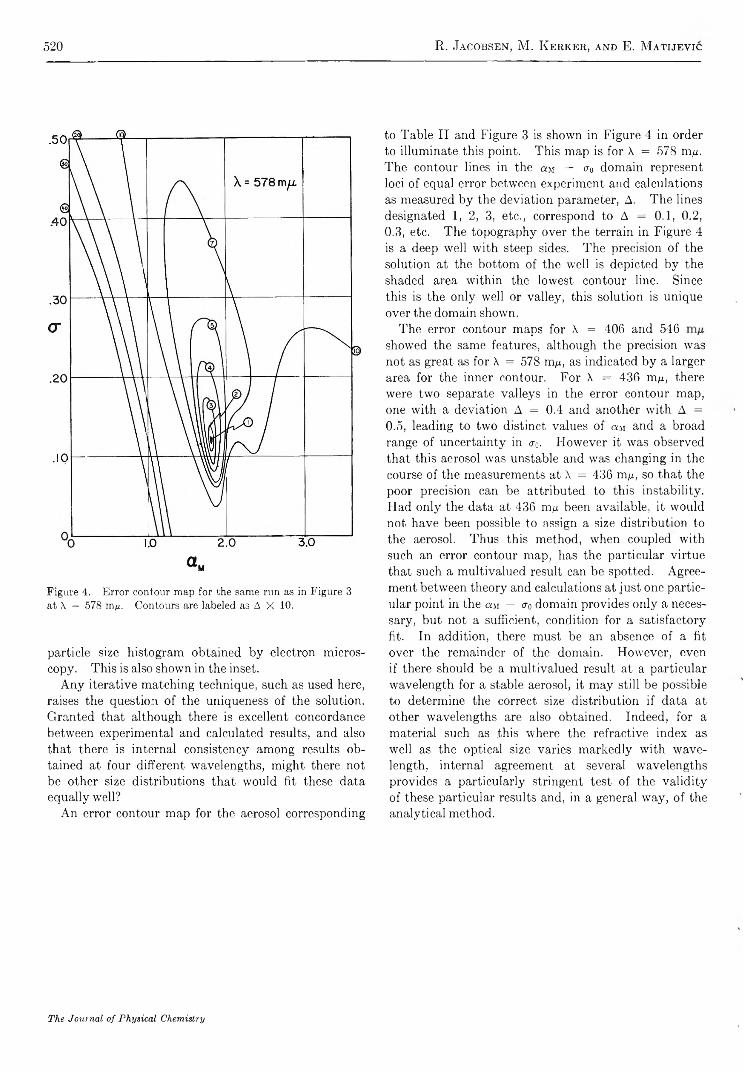
520 R. Ja c o b s e n , M. K e r k e r , a n d E. M a t i j e v i c
Figure 4. Error contour map for the same run as in Figure 3 at X = 578 m/j. Contours are labeled as A X 10.
particle size histogram obtained by electron microscopy. This is also shown in the inset.
Any iterative matching technique, such as used here, raises the question of the uniqueness of the solution. Granted that although there is excellent concordance between experimental and calculated results, and also that there is internal consistency among results obtained at four different wavelengths, might there not be other size distributions that would fit these data equally well?
An error contour map for the aerosol corresponding
to Table II and Figure 3 is shown in Figure 4 in order to illuminate this point. This map is for X = 578 m,u. The contour lines in the an — <ro domain represent loci of equal error between experiment and calculations as measured by the deviation parameter, A. The lines designated 1, 2, 3, etc., correspond to A = 0.1, 0.2, 0.3, etc. The topography over the terrain in Figure 4 is a deep well with steep sides. The precision of the solution at the bottom of the well is depicted by the shaded area within the lowest contour line. Since this is the only well or valley, this solution is unique over the domain shown.
The error contour maps for X = 406 and 546 showed the same features, although the precision was not as great as for X = 578 mp, as indicated by a larger area for the inner contour. For X = 436 m/n, there were two separate valleys in the error contour map, one with a deviation A = 0.4 and another with A = 0.5, leading to two distinct values of au and a broad range of uncertainty in o-0. However it was observed that this aerosol was unstable and was changing in the course of the measurements at X = 436 mpi, so that the poor precision can be attributed to this instability. Had only the data at 436 m^ been available, it would not have been possible to assign a size distribution to the aerosol. Thus this method, when coupled with such an error contour map, has the particular virtue that such a multivalued result can be spotted. Agreement between theory and calculations at just one particular point in the an — o-0 domain provides only a necessary, but not a sufficient, condition for a satisfactory fit. In addition, there must be an absence of a fit over the remainder of the domain. However, even if there should be a multivalued result at a particular wavelength for a stable aerosol, it may still be possible to determine the correct size distribution if data at other wavelengths are also obtained. Indeed, for a material such as .this where the refractive index as well as the optical size varies markedly with wavelength, internal agreement at several wavelengths provides a particularly stringent test of the validity of these particular results and, in a general way, of the analytical method.
The Journal of Physical Chemistry

U l t r a s o n i c V i b r a t i o n P o t e n t i a l s 521
Ultrasonic Vibration Potentials and Their Use in the Determination
of Ionic Partial Molal Volumesla
b y R a o u l Z a n a lb a n d E r n e s t Y e a g e r
Condensed State Center and Department of Chemistry, Western Reserve University, Cleveland, Ohio (Received June 27, 1966)
The propagation of ultrasonic waves through an ionic solution gives rise to alternating potential differences (ionic vibration potentials) within the solution as a result of differences in the dynamic reactions of the cations and anions to the acoustical waves. The amplitude of the effect is a function of the masses of the solvated ions minus the mass of the free solvent displaced by each ion. Experimental studies have been carried out with many electrolytes with particular attention to the elimination of possible false effects. The observed dependence of the ionic vibration potentials on various parameters is in good agreement with theory. From ionic vibration potentials and density data, the absolute values for the ionic partial molal volumes have been determined for a number of simple monovalent ions without any assumption as to the value for a given ion or the ratio of values for any pair of ions.
I . I n t r o d u c t i o n
In an electrolytic solution, ultrasonic waves produce alternating potentials between points separated by a phase distance other than an integral multiple of the wavelength. These alternating potentials were first predicted by Debye2a in 1933 and were suggested by him as a means for studying ion-solvent interactions.
The effect occurs because of differences in the amplitudes and phases of the displacements of the cations and anions as a consequence of differences in the effective masses and fractional coefficients of the solvated cations and anions. The mechanism is represented in Figure 1 with displacements at a particular instant represented on the ordinate and distance in the direction of propagation on the abscissa. The lengths of the arrows are intended to indicate the relative displacements of the cations (+ ) and anions ( —) at any instant with the former assumed smaller (for purposes of illustration). For the conditions represented in Figure 1, region A will be charged positively relative to region B. If inert metal probes are placed at positions A and B, an alternating potential difference will be observed since the curve representing displacement may be considered as traveling in the positive direction at the speed of sound in a progressive sound field. The frequency of
the alternating potentials corresponds to that of the sound field. Ionic vibration potentials can be measured in terms of either the potential difference between two points or the potential variations at any one point relative to the average potential of the solution.
I I . T h e o r y
The dynamic reaction of a particular ion (jth ion) in the sound field must be equal to the various forces acting on the ion2b
-electric fieldrfrictional force
[-relaxation force
ejX — Pi(vj — Vo)F |eje2 qnX
6i L(3DkT) [1 + g1/!(l + to0)‘A
ejXKpj67T770
kT òlii dr0« 7 ^ + üiS° dt
= ill';dr;df
Lreaction Lpressure gradient
Ldiffusion gradient ^electrophoretic force
(1)
Volume 71, Number 3 February 1967
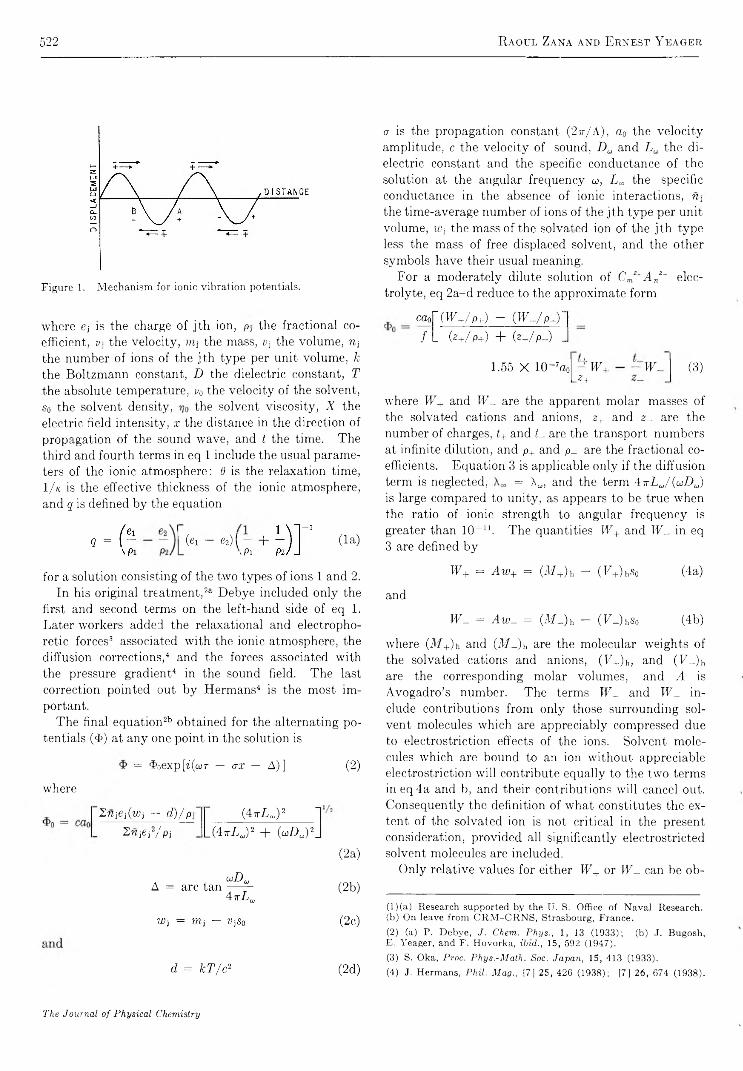
522 R a o u l Z a n a a n d E r n e s t Y e a g e r
Figure 1. M ech an ism for ion ic v ibration potentials.
where e\ is the charge of jth ion, p, the fractional coefficient, V, the velocity, in, the mass, v} the volume, n\ the number of ions of the jth type per unit volume, k the Boltzmann constant, D the dielectric constant, T the absolute temperature, v0 the velocity of the solvent, So the solvent density, the solvent viscosity, X the electric field intensity, x the distance in the direction of propagation of the sound wave, and t the time. The third and fourth terms in eq 1 include the usual parameters of the ionic atmosphere: d is the relaxation time, 1 / k is the effective thickness of the ionic atmosphere, and q is defined by the equation
Q = (ßi — 62) ( +.Pi
(la)
for a solution consisting of the two types of ions 1 and 2.In his original treatment,211 Debye included only the
first and second terms on the left-hand side of eq 1. Later workers added the relaxational and electrophoretic forces3 associated with the ionic atmosphere, the diffusion corrections,4 and the forces associated with the pressure gradient4 in the sound field. The last correction pointed out by Hermans4 is the most important.
The final equation211 obtained for the alternating potentials ($) at any one point in the solution is
= d>o e x p [ f (a )r — ax — A ) ] (2 )
where
2«jej(wj - d)/P, (4tt LX)1 2 3 4 1ZwjeiVPj L(4xL J 2 + M ) J 2J
(2a)
CO DaA = arc tan
4 ttLu(2b)
Wj = nij — VjS0 (2c)
d = kT/c2 (2d)
a is the propagation constant (2ir/A), a0 the velocity amplitude, c the velocity of sound, Da and Lu the dielectric constant and the specific conductance of the solution at the angular frequency <0, L„ the specific conductance in the absence of ionic interactions, n, the time-average number of ions of the jth type per unit volume, Wj the mass of the solvated ion of the jth type less the mass of free displaced solvent, and the other symbols have their usual meaning.
For a moderately dilute solution of Cmz+Anz" electrolyte, eq 2a-d reduce to the approximate form
caof (W+/p+) - (IF -/P -)' / L (z+ / p+ ) + ( Z - / P - ) ■
1.55 X 10⁻⁷ao : W4 :W--2+
( 3 )
where W+ and BY are the apparent molar masses of the solvated cations and anions, z+ and 2_ are the number of charges, t+ and f_ are the transport numbers at infinite dilution, and p+ and p_ are the fractional coefficients. Equation 3 is applicable only if the diffusion term is neglected, = X„, and the term 47tL „ /(coD J is large compared to unity, as appears to be true when the ratio of ionic strength to angular frequency is greater than 10- n . The quantities W+ and JIT in eq 3 are defined by
W+ = Aw+ = (M+) h — (F + )h S o (4a)
and
W - = Aw_ = (M _)h - (JY)hSo (4b)
where (M+)h and (MX)h are the molecular weights of the solvated cations and anions, (F+)h, and (F_)h are the corresponding molar volumes, and A is Avogadro’s number. The terms JF+ and TF_ include contributions from only those surrounding solvent molecules which are appreciably compressed due to électrostriction effects of the ions. Solvent molecules which are bound to an ion without appreciable électrostriction will contribute equally to the two terms in eq 4a and b, and their contributions will cancel out. Consequently the definition of what constitutes the extent of the solvated ion is not critical in the present consideration, provided all significantly electrostricted solvent molecules are included.
Only relative values for either W+ or JF can be ob-
(1) (a) Research supported by the U. S. Office of Naval Research, (b) On leave from CRM-CRNS, Strasbourg, France.(2) (a) P. Debye, J. Chem. Phys., 1, 13 (1933); (b) J. Bugosh,E. Yeager, and F. Hovorka, ibid., 15, 592 (1947).(3) S. Oka, Proc. Phys.-Math. Soc. Japan, 15, 413 (1933).(4) J. Hermans, Phil. Mag., [7] 25, 426 (1938); [7] 26, 674 (1938).
The Journal of Physical Chemistry

U l t r a s o n i c V i b r a t i o n P o t e n t i a l s 523
tamed from measurements of ionic vibration potentials alone. Any attempt to determine absolute values for W+ and JF_ from measurements in several electrolytes with common cations and/or anions is unsuccessful because the various equations of the form of eq 3 for the series of electrolytes are linearly dependent and cannot be solved for unique solutions.
The apparent masses of the solvated ions can be related to the ionic partial molal volumes. In eq 4a and b, the mass of the jth solvated ions is given by the equation
(Afi)h = + (M¡)w (5)
where is the intrinsic molar mass of the ion and (iff j)w is the mass of bound water per mole of ion. The precise definition of what constitutes bound water is unnecessary since (M¡)w will cancel out of the calculations. In dilute solutions, the ionic partial molal volume, V j, is
Vi = (V¡)h - (M¡)w/so (6)
where (F¡)h is the molar volume of the solvated jth ion. The term (Mj)w/s0 corresponds to the volume which the bound water would have occupied if it were free. From eq 4-6, the apparent mass of the jth ion is
W ¡ = - FjS0 (7)
While the values for F+ and F_ are unknown, the sum m+V+ + w_F_ corresponds to the over-all partial molal volume, V2, of the electrolyte and can be obtained from density data. From a knowledge of V2 and ionic vibration potentials, with eq 3 and 7 it is possible to determine the individual values for V+ and V- as well as W+ and IF- without the usual assumption concerning the partial molal volume of some reference ion or the ratio of the values for some electrolyte.
A theoretical treatment of ionic vibration potentials which takes into account fast physical and chemical processes occurring within the solution has not yet been developed. Of possible interest is the situation where the mean times for exchange of solvent molecules between the hydration sheaths of the ions and the bulk of the solvent are comparable to the period of the sound waves. One might expect the frequency dependence of the vibration potentials to deviate substantially from that predicted by eq 2a under such circumstances and furthermore that the frequency dependence might be used to study the kinetics of such exchange processes. Unfortunately preliminary considerations indicate that ionic vibration potentials cannot be used for this purpose. The reasoning is as follows: when a water molecule associated with an ion exchanges with a bulk water molecule, the velocity of the ion momentarily increases
or decreases, depending on its velocity relative to the solvent, because of the need for the newly bound water molecule to acquire the same velocity as the ion. The time required for steady-state velocity to be reached relative to the bulk solvent, however, is only 10-12 to 10-13 sec, depending on the mass and drag coefficient of the ion. For a significant deviation in the frequency dependence of the ionic vibration potentials to be observed, the exchange rates for either the cations or anions or both would need to be sufficient for the velocity of the ions relative to the solvent to be perturbed substantially (10u to 1012 exchanges/sec) and, in addition, the frequency of the sound waves would need to approach within one order of magnitude of the exchange rates (1010 to 1011 cycles). While the exchange rates for water molecules associated with simple univalent ions such as Na+, K+, Cl- , and Br- are probably sufficient to affect substantially the velocity of these ions, measurements of ionic vibration potentials at sufficiently high frequencies are quite impossible.
I I I . P r e v i o u s E x p e r i m e n t a l W o r k
Experimental evidence for the existence of ionic vibration potentials was first reported5 6 in 1949, some 16 years after Debye’s original prediction. This delay reflects in part difficulties associated with the measurement of an acoustically produced electrical signal of the order of 10-6 v when many watts of electrical energy of the same frequency are used in close proximity for the generation of sound waves. The detection of the effect in 1949 was accomplished at 265 kc with a standing wave technique which permitted the acoustically produced effect to be distinguished from the false electromagnetically induced signals in terms of the spatial dependence of the observed signals on the nodeantinode structure of the standing wave field. Only relative values for the amplitude of the observed effect were determined, however, because of complications associated with accurate velocity-amplitude measurement in the complex standing wave field. An estimate of 3 juv per unit velocity amplitude (1 cm/sec) was made for the amplitude of the effect in a 0.005 N KC1 solution on the basis of acoustical intensities as evaluated from radiation-pressure measurements. The effect was found to depend on the type of electrolyte but to be substantially independent of electrolyte concentration in the range 5 X 10⁻⁴ to 5 X 10⁻³ N for uniunivalent electrolytes. In 1951, Derouet and Denizot.6 reported that they had detected the effect in 0.005 N
(5) E . Yeager, J . Bugosh, F . Hovorka, and J . M cCarthy, J. Chem. P hys., 17, 411 (1949).(6) B . Dèrouet and F . Denizot, Compì. Rend., 233, 368 (1951).
Volume 71, Number 3 February 1967
524 R a o u l Z a n a a n d E r n e s t Y e a g e r
KC1 at 80 kc, also with a standing wave technique. These workers found a value of 10"5 v per unit velocity- amplitude.
In 1953, ionic vibration potentials were measured7 8 at Western Reserve with pulse-modulated ultrasonic waves which permitted differentiation between the acoustically produced effect and false electromagneti- cally induced effects on the basis of the difference in the time of propagation of the acoustical waves and the electromagnetic waves. In addition, more reliable measurements of velocity amplitude were possible with pulse-modulated sound waves, since reflected waves and waves scattered from the walls of the confining vessel could be distinguished from the directly received waves. In further studies with pulse-modulated ultrasonic waves in 1959,3 an effect of 3 nv per unit velocity amplitude was found in 0.01 N KC1 at both 200 and 840 kc. This value corresponds to a difference of approximately 40 apparent mass units between the cations and anions.
In 1958, Hunter9 called attention to the existence of acoustically produced alternating potentials observed with glass-mounted platinum probes in conductivity water. With pulse-modulated waves at a frequency of 465 kc, Hunter found an effect for pure water of approximately 50 /tv per unit velocity amplitude, a value an order of magnitude greater than that for alkali halide solutions such as 0.01 N IvCl. Even more alarming were the results of Rutgers and Rigole10 who, using standing waves at 1 Me, observed an apparent effect not only in distilled water, but also in pure organic liquids such as methanol, ethanol, 2-propanol, nitrobenzene, and even n-heptane. While a satisfactory explanation for these potentials in nonionic solutions was not advanced by either Hunter or Rutgers and Rigole, both suggested that such effects might cause serious complications in the quantitative interpretation of ultrasonic vibration potentials in electrolyte solutions. Weinmann11 has considered, as a possible explanation for the effects observed by Hunter9 and also Rutgers and Rigole10 in pure liquids, the interaction of the sound waves with solvent dipoles, but Weinmann's treatment does not establish she absolute magnitude of such an effect.
Millner12 has measured ionic vibration potentials with pulse-modulated ultrasonic waves at 200 kc in various alkali halide solutions. Millner also reported a residual effect in distilled water, but with a single probe consisting of platinum sealed in glass capillary tubing, the residual effect in distilled water was only approximately 2 juv per unit velocity amplitude. At concentrations of the alkali halides above 10~3 N, Millner’s data show
very little variation with concentration in accord with the theory of ionic vibration potentials.
Work in the authors’ laboratory13 has demonstrated that one possible source for the effect observed in distilled water and nonionic liquids is the glass tubing in which the platinum probes are sealed. Measurements have been carried out with probe assemblies in which only the platinum probes entered the liquid under examination. Under these conditions, ac signals were observed only in ionic solutions. When glass-mounted platinum probes were slowly lowered into a pure liquid with ultrasonic waves at a frequency of 200 kc, no effect was observed (<10~6 v per unit velocity amplitude), even with high-input impedance amplifiers, until the glass mounting contacted the liquid, at which instant a large signal abruptly appeared. Millner14 has confirmed this finding. Thus the experimental evidence indicates that any effect associated with the interaction of the sound waves with solvent dipoles in pure liquids is well below 10-6 v per unit velocity amplitude.
The abnormal acoustical response associated with the glass probe mounting may be caused by pseudo-piezoelectric properties of the strained glass, some type of streaming potential, or a condenser microphone effect in which the capacity between the platinum wire and the glass-liquid interface is modulated by the sound waves. In any event, the ac response associated with the mounting for the probe wires should be characterized by a high internal impedence. At reasonable ionic concentrations (e.g., greater than 0.001 N) in aqueous solutions, the internal impedance associated with the ionic vibration potentials is quite low. As a result, the observed response in ionic solutions should be predominaratly the ionic vibration potentials and not any false microphonic effects associated with the probe mounting. If solutions of ionic strength much less than 10~3 are used, however, serious complications may arise unless precautions are taken to prevent such false effects (see part V).
(7) E. Yeager, H. Dietrick, and F. Hovorka, J. Acoust. Soc. Am., 25, 456 (1953).(8) E. Yeager, J. Booker, and F. Hovorka in “ The Structure of Electrolytic Solutions,” W. Hamer, Ed., John Wiley and Sons, Inc., New York, N. Y., 1959, pp 86-96.(9) A. Hunter, Proc. Phys. Soc. (London), 71, 847 (1958); A. Hunter and T. Jones, ibid., 79, 795 (1962).(10) A. Rutgers and R. Rigole, Trans. Faraday Soc., 54, 139 (1958).(11) A. Weinmann, Proc. Phys. Soc. (London), 73, 345 (1959)- 75 102 (1960).(12) R. Millner, Z. Elektrochem., 65, 639 (1961).(13) E. Yeager, J. Booker, and F. Hovorka, Proc. Phys. Soc. (London), 73, 690 (1959).(14) R. Millner, private communication, 1965; R. Millner and H. D. Muller, Ann. Physik, 17, 160 (1966).
The Journal of Physical Chemistry
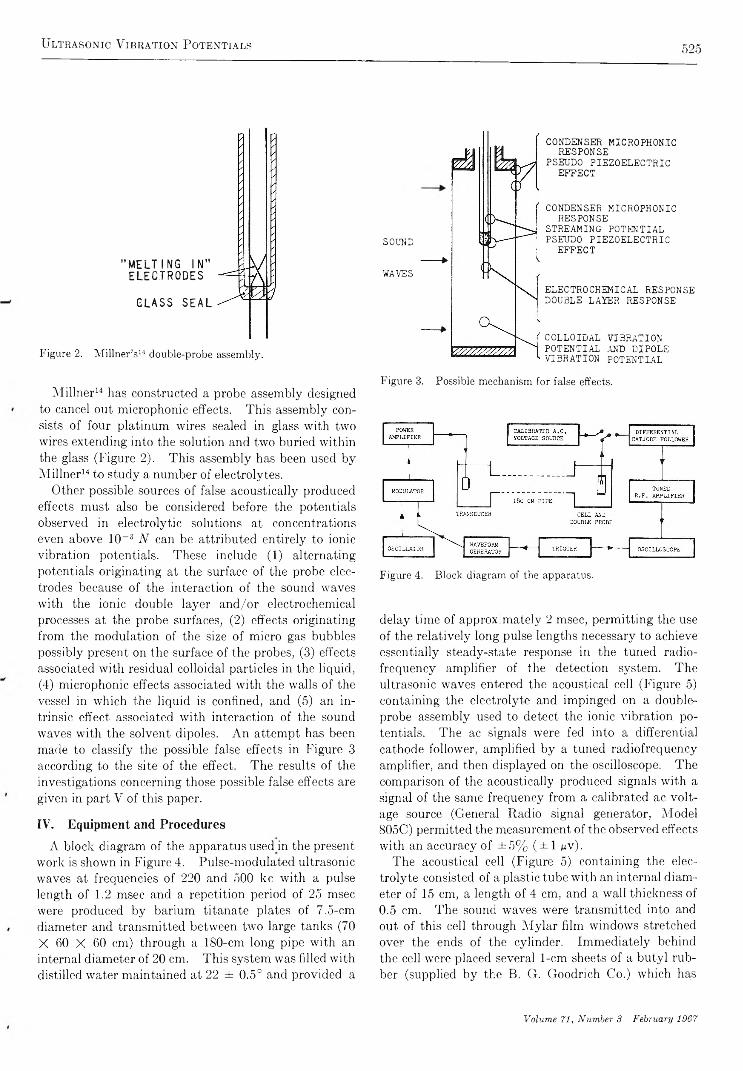
U l t r a s o n i c V i b r a t i o n P o t e n t i a l s 525
"M ELT ING IN" ELECTRODES
GLASS SEAL
Figure 2. Millner’s14 double-probe assembly.
Millner14 has constructed a probe assembly designed to cancel out microphonic effects. This assembly consists of four platinum wires sealed in glass with two wires extending into the solution and two buried within the glass (Figure 2). This assembly has been used by Millner14 to study a number of electrolytes.
Other possible sources of false acoustically produced effects must also be considered before the potentials observed in electrolytic solutions at concentrations even above 10-3 N can be attributed entirely to ionic vibration potentials. These include (1) alternating potentials originating at the surface of the probe electrodes because of the interaction of the sound waves with the ionic double layer and/or electrochemical processes at the probe surfaces, (2) effects originating from the modulation of the size of micro gas bubbles possibly present on the surface of the probes, (3) effects associated with residual colloidal particles in the liquid,(4) microphonic effects associated with the walls of the vessel in which the liquid is confined, and (5) an intrinsic effect associated with interaction of the sound waves with the solvent dipoles. An attempt has been made to classify the possible false effects in Figure 3 according to the site of the effect. The results of the investigations concerning those possible false effects are given in part V of this paper.
I V . E q u ip m en t and Procedures
A block diagram of the apparatus used in the present work is shown in Figure 4. Pulse-moclulated ultrasonic waves at frequencies of 220 and 500 kc with a pulse length of 1.2 msec and a repetition period of 25 msec were produced by barium titanate plates of 7.5-cm diameter and transmitted between two large tanks (70 X 60 X 60 cm) through a 180-cm long pipe with an internal diameter of 20 cm. This system was filled with distilled water maintained at 22 ± 0.5° and provided a
SOUND
WAVES♦
>
CONDENSER MICROPHONIC RESPONSE
PSEUDO PIEZOELECTRIC EFFECT
CONDENSER MICROPHONIC RESPONSE
STREAMING POTENTIAL PSEUDO PIEZOELECTRIC
EFFECT
ELECTROCHEMICAL RESPONSE DOUBLE LAYER RESPONSE
COLLOIDAL VIBRATION POTENTIAL .AND DIPOLE VIBRATION POTENTIAL
Figure 3. Possible mechanism for false effects.
Figure 4. Block diagram of the apparatus.
delay time of approximately 2 msec, permitting the use of the relatively long pulse lengths necessary to achieve essentially steady-state response in the tuned radiofrequency amplifier of the detection system. The ultrasonic waves entered the acoustical cell (Figure 5) containing the electrolyte and impinged on a doubleprobe assembly used to detect the ionic vibration potentials. The ac signals were fed into a differential cathode follower, amplified by a tuned radiofrequency amplifier, and then displayed on the oscilloscope. The comparison of the acoustically produced signals with a signal of the same frequency from a calibrated ac voltage source (General Radio signal generator, Model 805C) permitted the measurement of the observed effects with an accuracy of ± 5% ( ± 1 gv).
The acoustical cell (Figure 5) containing the electrolyte consisted of a plastic tube with an internal diameter of 15 cm, a length of 4 cm, and a wall thickness of 0.5 cm. The sound waves were transmitted into and out of this cell through Mylar film windows stretched over the ends of the cylinder. Immediately behind the cell were placed several 1-cm sheets of a butyl rubber (supplied by the B. G. Goodrich Co.) which has
Volume 71 y Number 3 February 1967
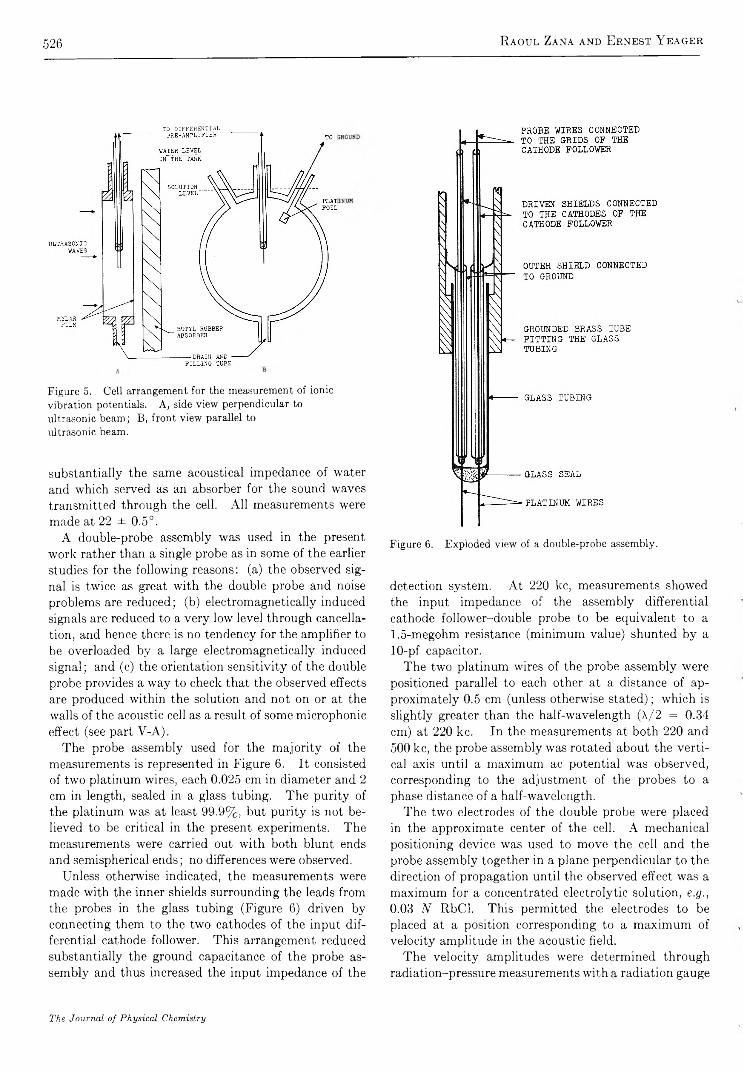
526 R a o u l Z a n a a n d E r n e s t Y e a g e r
TO DIFFERENTIAL
Figure 5. Cell arrangement for the measurement of ionic vibration potentials. A, side view perpendicular to ultrasonic beam; B, front view parallel to ultrasonic beam.
substantially the same acoustical impedance of water and which served as an absorber for the sound waves transmitted through the cell. All measurements were made at 22 ± 0.5°.
A double-probe assembly was used in the present work rather than a single probe as in some of the earlier studies for the following reasons: (a) the observed signal is twice as great with the double probe and noise problems are reduced; (b) electromagnetically induced signals are reduced to a very low level through cancellation, and hence there is no tendency for the amplifier to be overloaded by a large electromagnetically induced signal; and (c) the orientation sensitivity of the double probe provides a way to check that the observed effects are produced within the solution and not on or at the walls of the acoustic cell as a result of some microphonic effect (see part Y-A).
The probe assembly used for the majority of the measurements is represented in Figure 6. It consisted of two platinum wires, each 0.025 cm in diameter and 2 cm in length, sealed in a glass tubing. The purity of the platinum was at least 99.9%, but purity is not believed to be critical in the present experiments. The measurements were carried out with both blunt ends and semispherical ends; no differences were observed.
Unless otherwise indicated, the measurements were made with the inner shields surrounding the leads from the probes in the glass tubing (Figure 6) driven by connecting them to the two cathodes of the input differential cathode follower. This arrangement reduced substantially the ground capacitance of the probe assembly and thus increased the input impedance of the
Figure 6. Exploded view of a double-probe assembly.
detection system. At 220 lcc, measurements showed the input impedance of the assembly differential cathode follower-double probe to be equivalent to a1.5-megohm resistance (minimum value) shunted by a 10-pf capacitor.
The two platinum wires of the probe assembly were positioned parallel to each other at a distance of approximately 0.5 cm (unless otherwise stated); which is slightly greater than the half-wavelength (A/2 = 0.34 cm) at 220 kc. In the measurements at both 220 and 500 kc, the probe assembly was rotated about the vertical axis until a maximum ac potential was observed, corresponding to the adjustment of the probes to a phase distance of a half-wavelength.
The two electrodes of the double probe were placed in the approximate center of the cell. A mechanical positioning device was used to move the cell and the probe assembly together in a plane perpendicular to the direction of propagation until the observed effect was a maximum for a concentrated electrolytic solution, e.g., 0.03 N RbCl. This permitted the electrodes to be placed at a position corresponding to a maximum of velocity amplitude in the acoustic field.
The velocity amplitudes were determined through radiation-pressure measurements with a radiation gauge
The Journal of Physical Chemistry

Ultrasonic V ibration Potentials 527
similar to that of Herrey16 employing a highly absorbing rubber disk of 50-cm2 area (approximately 8 -cm diameter) perpendicular to the direction of propagation of sound waves. In these measurements the nonhomogeneity of the acoustic field in the cell over the area subtended by the radiation disk was taken into account. The profile of the pressure amplitude over the dimensions of the disk was determined with an uncalibrated hydrophone consisting of a 2 -mm diameter barium titanate cylinder.7 The response of the hydrophone along two diameters of the cell, one vertical and the other horizontal and both perpendicular to the direction of propagation of the sound waves, is shown in Figure 7. Those curves have been obtained by placing the hydrophone in the cell after removing the probe electrodes. The maximum corresponds to the position occupied by the center of the probe electrode. A calibration factor was then derived relating the response of the hydrophone to the integrated radiation pressure over the area subtended by the disk. The maximum response to the hydrophone within the cell was then used with the calibration factor to calculate the velocity amplitude over the central section, 2.5-cm diameter of the disk. The response of the hydrophone was found to vary by only 1 0 % over this central section of the disk. Since the probe wires used to obtain the final data were only 1.5-2 cm long and positioned centrally, the velocity amplitude was practically uniform between and over the length of the dual probes. The estimated accuracy of the radiation-pressure measurements was 1 0 %.
The sound level was sufficient to produce velocity amplitudes of at least 6 cm/sec within the acoustical cell containing the liquid under study. As the noise level was about 2 /*v, with the double-probe assembly the sensitivity of the measuring apparatus expressed in terms of $ /a 0 was about 0.15 ^v cm- 1/sec.
The electrolytes were all of reagent grade purity. The water used for the preparation of the solutions was singly distilled water. No difference was observed with two solutions of a given electrolyte at a given concentration prepared with singly and triply distilled water. V.
V. Experimental Studies of False Effects and Electrical Loading
In view of the questions raised by other authors9 ’ 10 as to possible interference from false effects, this aspect of the research will be presented in some detail.
A . R esponse A ssociated with the Cell Structure. Conclusive evidence that the signal observed with the double-probe assembly is not associated to any appreciable extent with some type of response of the overall cell structure (e .g ., capacitance modulation or
R
D ista n c e , cm .
Figure 7. R elative response, R, o f the h ydrop hon e placed w ith in the cell along the horizontal axis, — • — , and the vertica l a x is ,------- 1------- .
pseudo-piezoelectric effects arising at the walls or Mylar windows) to the acoustical waves is provided by the following observations: (1 ) the observed signal disappears completely when an absorbing material is placed in the ultrasonic beam just in front of the platinum probes, leaving the cell walls exposed to the sound field; (2 ) the introduction of a grounded lead into the solution within the cell produces no detectable change in the observed signals; and (3) the observed response shows the expected dependence on polar orientation of the double-probe assembly (see Figure 8 ) with no observed signal when the two wires are positioned in a plane parallel to the wave front.
The curves in Figure 8 represent the polar responses of two double-probe assemblies in a 0.03 N RbCl solution at 2 2 0 kc as functions of the angle between the wave front and the plane defined by the two probe electrodes. The twro probe assemblies used in obtaining the data shown in this figure differed in interelectrode distance, with one 0.35 cm (close to X/2 = 0.34 cm at 220 kc) and the other 0.45 cm. The response of the first assembly exhioited two maxima corresponding to the plane defined by the two electrodes perpendicular to the wave front. The response of the second assembly involved four maxima, each of which corresponded to the projection of the interelectrode distance in the direction of propagation of the sound waves equal to 15
(15) E. Herrey, J . A coust. Soc. A m ., 27, 891 (1955).
Volume 71, Number 3 February 1967

528 R aoul Zana and Ernest Y eager
U L T R A S O N I C W A V E S
Figure 8. P olar responses of tw o different dou ble-p robe assem blies at 220 ke. C u rve A , in terelectrode distance 3 .4 m m ; curve B , in terelectrode distance 4 .5 m m .
A/2. For both assemblies there was no response when the plane of the two probe electrodes was coincident with the acoustic wave front since the signals from each were equal and in phase and hence canceled out in the differential cathode follower input stage. The graphs in Figure 8 provide rather strong evidence that the acoustically produced ac signals originated in the solution between the probe wires or at the surfaces of the probe wires.
In earlier work with a glass acoustical cell, 7 the ac signals observed with a single-probe electrode relative to ground were just one-half of those found between the two electrodes of the double-probe assembly at an orientation corresponding to a phase difference of 180° between the two electrodes. This has been shown in the present work to be true only in relatively concentrated electrolytic solutions (> 10 ~ 2 N ). In more dilute solutions the single-probe response was usually greater than one-half of that found with the doubleprobe assembly. Furthermore, a substantial residual effect was observed with the single probe when an acoustically opaque material was placed in the ultrasonic field just in front of the single probe but not blocking the cylindrical walls of the cell. In addition, the introduction of a grounded platinum wire or foil into the cell (see Figure 5) produced a significant change in the observed effect with the single probe, even with
the grounded conductor located in a remote position relative to the detection probe. These difficulties with the single-probe assembly in dilute solutions can be explained on the basis of ac potential differences produced by the sound waves between the inside and outside surfaces of the cell walls and Mylar windows.
B . The Junction Effect. No detectable effect (<0 .15 yuv cm“ 1 sec) was observed at 220 kc with the double-probe assembly with or without the driven shield in singly or triply distilled water or in polar organic liquids such as methanol or acetone, provided the liquid was in contact with only the platinum electrodes. If the liquid level was raised relative to the probe assembly so as to place the liquid in contact with the glass seal, an observed effect of 1 0 - 2 0 /iv cm- 1 sec abruptly appeared. This phenomenon has also been observed at 1 0 0 0 kc in earlier work13 with a single-probe assembly and a similar observation has been reported by Millner. 14 With the double-probe assembly in 2 X 10 - 6 N KC1, the ac signal increase from less than 0.3 to 15 /uv cm- 1 sec as the liquid contacted the junction. The same experiment in 0.2 N KC1, however, yielded an increase from only 1.6 to 1.7 ^v cm- 1 sec. The change in the more concentrated electrolyte is much smaller than in the very dilute solution or distilled water because the effective internal ac impedance associated with the junction effect is very high and loaded out internally when the ac impedance of the solution is low.
The nature of the junction effect has not yet been established. Possible mechanisms include streaming potentials, a pseudo-piezoelectric effect, and the modulation of the capacity between the wire as it enters within the mounting and the solution surrounding the mounting.
Two procedures .are possible for minimizing or eliminating the junction effect in dilute solutions: (1 ) the use of additional metal leads completely buried in the glass or plastic seal, as employed by Millner14 (see Figure 2), and (2) the positioning of the junction outside of the sound field by either having the junction completely out of contact with the liquid (see Figure 9b) or having such long probe wires that the junction can be located at a position where the sound pressure is virtually zero. The first procedure suffers from uncertainty as to whether the buried metal probes fully cancel out the junction effect, particularly over a range of frequencies, orientations, and electrolyte concentrations. Since the junction effect can be large, partial cancellation can still lead to substantial errors. Even with his presumedly best probe assembly, Millner14 still observed a residual effect of 1.6 /¿v cm“ 1
sec in pure water, not taking into account the large
The Journal of Physical Chemistry
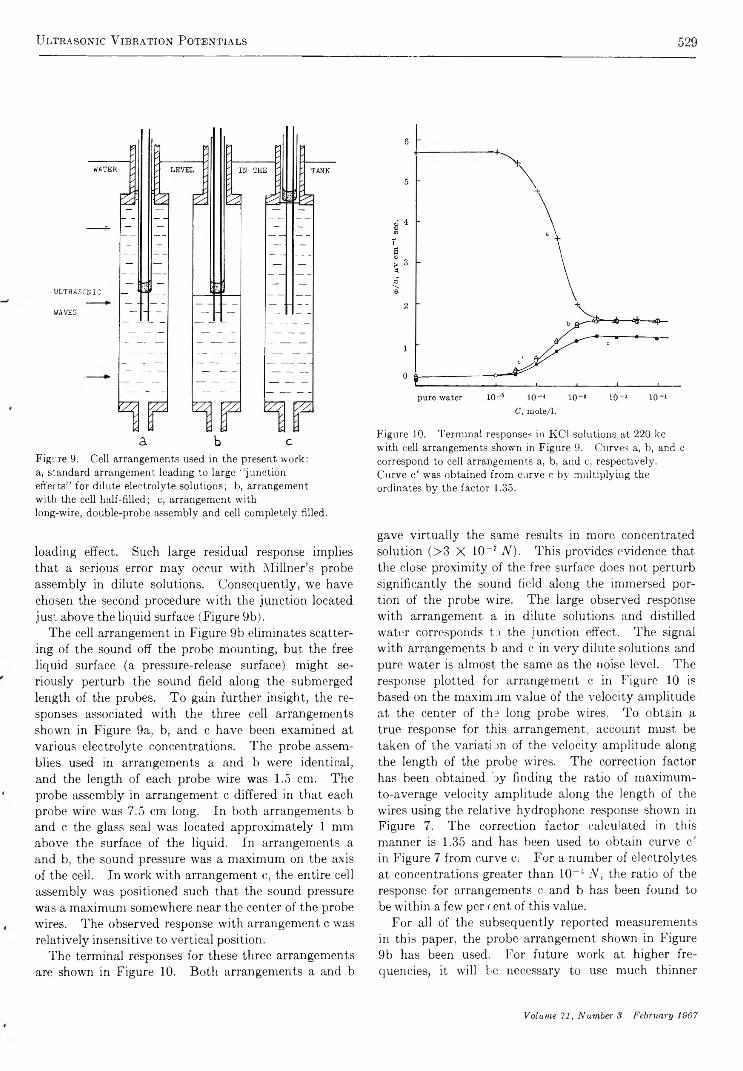
Ultrasonic V ibration Potentials 529
WATER
ULTRASONIC
WAVES
a b c
Figure 9. Cell arrangem ents used in the present w ork: a, standard arrangem ent leading to large “ ju nction effects” for dilute electrolyte solutions; b, arrangem ent w ith the cell half-filled; c, arrangem ent with long-wire, d ou b le-p robe assem bly and cell com pletely filled.
loading effect. Such large residual response implies that a serious error may occur with Millner’s probe assembly in dilute solutions. Consequently, we have chosen the second procedure with the junction located just above the liquid surface (Figure 9b).
The cell arrangement in Figure 9b eliminates scattering of the sound off the probe mounting, but the free liquid surface (a pressure-release surface) might seriously perturb the sound field along the submerged length of the probes. To gain further insight, the responses associated with the three cell arrangements shown in Figure 9a, b, and c have been examined at various electrolyte concentrations. The probe assemblies used in arrangements a and b were identical, and the length of each probe wire was 1.5 cm. The probe assembly in arrangement c differed in that each probe wire was 7.5 cm long. In both arrangements b and c the glass seal was located approximately 1 mm above the surface of the liquid. In arrangements a and b, the sound pressure was a maximum on the axis of the cell. In work with arrangement c, the entire cell assembly was positioned such that the sound pressure was a maximum somewhere near the center of the probe wires. The observed response with arrangement c was relatively insensitive to vertical position.
The terminal responses for these three arrangements are shown in Figure 10. Both arrangements a and b
Figure 10. T erm inal responses in KC1 solutions at 220 ko w ith cell arrangem ents show n in F igure 9. C urves a, b, and c correspond to cell arrangem ents a, b, and c, respectively . C urve c ' was obtained from curve o b y m ultiplying the ordinates b y the factor 1.35.
gave virtually the same results in more concentrated solution (>3 X 10 -£ N ). This provides evidence that the close proximity of the free surface does not perturb significantly the sound field along the immersed portion of the probe wire. The large observed response with arrangement a in dilute solutions and distilled water corresponds to the junction effect. The signal with arrangements b and c in very dilute solutions and pure water is almost the same as the noise level. The response plotted for arrangement c in Figure 10 is based on the maximum value of the velocity amplitude at the center of the long probe wires. To obtain a true response for this arrangement, account must be taken of the variation of the velocity amplitude along the length of the probe wires. The correction factor has been obtained by finding the ratio of maximum- to-average velocity amplitude along the length of the wires using the relative hydrophone response shown in Figure 7. The correction factor calculated in this manner is 1.35 and has been used to obtain curve c' in Figure 7 from curve c. For a number of electrolytes at concentrations greater than 10 - 4 N , the ratio of the response for arrangements c and b has been found to be within a few per cent of this value.
For all of the subsequently reported measurements in this paper, the probe arrangement shown in Figure 9b has been used. For future work at higher frequencies, it will be necessary to use much thinner
Volume 71, Number 3 February 1967

530 Raoul Zana and Ernest Y eager
wires and to meet much more rigid requirements with respect to parallelism. This can be realized only by anchoring the wires in some type of frame under tension. Furthermore, the junctions of the wires with the frame must be shielded acoustically in order that the sound pressure at the junctions is essentially zero. Studies involving such more sophisticated probe assemblies are in progress.
C. F alse E ffects A risin g in the L iqu id Phase. The measurements in pure liquids cited in part V-B as well as earlier publications13 ,14 have failed to indicate any intrinsic effect associated with nonionic species and provide evidence that earlier reports of the existence of such effects by other workers9,10 are the result of the junction effect and possibly other artifacts. Hunter, 9
however, has raised the question of whether our failure to observe an intrinsic effect in pure nonionic solvents is associated with a large loading effect as a result of a high ratio of internal to external impedance. This explanation does not appear valid. In the present work with, for example, distilled water, the measured internal impedance between the two probes corresponded to 20 pi shunted by 300 kilohm, while the load impedance of the detection system including the probe assembly (without the driven shield) corresponded to 20 pf shunted by 1.5 megohm. Thus the ratio of the terminated to open-circuit response would be expected to be approximately 1 : 2 , and the present experiment should have been capable of detecting an effect with an open-circuit response of 0.4 y v cm- 1 sec. On the basis of these observations the authors concluded that measurements in ionic solutions of substantial concentration ( > 1 0 " 3 N ) have not been perturbed by any appreciable intrinsic effect associated with the solvent, e.g., dipole vibration potentials. 9" 1 1 The lack of a detectable effect in pure liquids also provides evidence that residual colloidal particles are insufficient, at least in pure liquids, to provide any appreciable response.
D . Electrochem ical Response o f the Probe Surfaces. Theoretical considerations16 indicate that temperature and pressure variations in a sound field can give rise to an alternating component in the potential of an electrode whose potential is determined by one or more temperature and/or pressure-sensitive faradaic processes, e.g., H+ + e " H (adSorbed). The effect should decrease rapidly with increasing frequency, however, because of the internal loading effect associated with the large nonfaradaic capacitive component associated with the electrode interface. At a frequency as high as that involved in the present work ( 2 2 0 kc), very few faradaic processes could be sufficiently reversible to exhibit detectable ac response.
A means for experimentally demonstrating that such electrochemical response does not interfere appreciably with ionic vibration potential measurements is to compare the observed signals with probes consisting of different metals. The nature and reversibility of any possible potential-determining faradaic process should be strongly dependent on the particular metal as well as its prior treatment. In Table I are reported the results for dual probes consisting of platinum and gold wires sealed in glass and tantalum and nickel wires sealed in Kel-F with neither mounting material in contact with the solution. All four probe assemblies were geometrically identical. The small deviations evident in this table are within experimental error, particularly considering the difficulty of aligning the two wire electrodes exactly parallel to each other. Consequently, electrochemical response is not a significant factor in the present study.
Table I: O bserved Values“ o f 4>/a ( mv cm 1 sec)at 220 K c and 22°
Tantalum Nickel Platinum Goldin in in in
Electrolyte Kel-F Kel-F glass glass
3 X in 2 .V C sC l 8 .6 8 .0 8 .6 8 .23 X 10 N R b C l 5 .0 5 .1 5 .3 4 .83 X IO ’ 2 N B aC lj 4 .7 4 .1 5 .0 4 .4
° D ou b le -p robe assem bly w ith cell arrangem ent show n in F igure 9b.
E . M odulation o f the D ouble-L ayer C apacity. Acoustically produced periodic variations in the dielectric constant and thickness of the ionic double layer can lead to periodic variations in both the Helmholtz and diffuse-layer components of the double-layer capacity. Such variations in turn can result in alternating components16 in the electrode potential with the amplitude dependent on the potential drop across the double layer and, hence, the electrical potential relative to the point of zero charge. The dc potential of the electrode can be controlled by biasing the electrode with an external dc voltage source of such high impedance that the alternating component is not appreciably loaded. The biasing of the two platinum probes in a 0.01 N KC1 solution from —0.5 to +0 .7 v (reference electrode Ag'AgCl(s)), 0.01 N KC1 resulted in a change in the observed response from 1.7 to 1.6 ¿¿v cm" 1 sec, or an almost negligible change of —0.1 yuv cm" 1 sec. Within this range of dc voltages the potential drop across the
(16) E. Yeager and F. Hovorka, J . Electrochem . S o c 98, 14 (1951).
The Journal of Physical Chemistry

Ultrasonic V ibration Potentials 531
double layer should have gone to zero and changed sign. 17 These results indicate that any error associated with the modulation of the double-layer capacity is probably not more than ± 0 . 1 /¿v cm- 1 sec, which is about the precision of the experiments from run to run.
F . Loading E ffects o f the M easurem ent C ircuit. In dilute solutions, the effective internal impedance associated with the vibration potentials becomes comparable with the input impedance of the measurement system and corrections for loading effects are necessary in quantitative studies. The internal impedance associated with the vibration potentials has been determined by placing various additional resistive loads across the probes and then solving the simultaneous equations for the real and imaginary components of the internal impedance. This approach assumes that the concept of lumped internal impedance is valid for the vibration potentials as measured with the doubleprobe assembly. These studies indicate that loading effects are negligible at concentrations greater than 10 ~ 3 N . For example, a 3 X 10 ~ 3 N RbCl solution was found to have an internal impedance equivalent to 3.5 kilohms shunted by 200 pf at 200 kc. This is to be compared with an impedance of 1.5 megohm shunted by 1 0 pf to ground for either side of the input circuit of the measurement system including the probe mounting with the driven shield. 18 Under these circumstances the terminated response is just a few per cent lower than the open-circuit response. With the exception of the data represented in Figure 10, all of the values for ionic vibration potential herein reported are for concentrations of 10 _s N or higher and hence, corrections for loading effects have been considered unimportant.
The rapid decrease of the response with decreasing concentration of KC1 below 10 - 3 N , shown by curves b and c in Figure 10, is not believed to be caused principally by either loading effects or a decrease in the second term on the right side of eq 2 a, but rather by the presence of carbonic acid in the solutions. The ionic vibration potential for this electrolyte would be expected to be very small on the basis of the ionic partial molal volumes reported later in this paper (part VI-A). As a component in a mixture, it would be expected to depress the observed effect (see part VI-B).
VI. Experimental Results
A . Io n ic V ibration Potentials in Single E lectrolytes. Table II contains the values measured at 220 kc and 2 2 ° for the ionic vibration potentials expressed as $/a in p v cm- 1 sec for a series of 1 - 1 , 2 —1 , 1 - 2 , and 2 - 2
electrolytes at various concentrations in the range 1 0 - 3
to 1 N . The precision of the measurements listed in Table II has been found to be ± 5 % (± 0 .3 ¡xv cm- 1
sec), depending on whichever is larger, for a sound level corresponding to a velocity amplitude of 6 cm/sec. A major portion of the 1 - 1 electrolytes has also been studied at 500 kc and found to yield the same results within the precision of the measurements. In most instances the effect appears to be independent of concentration above 3 X 10 ~ 3 N , as is to be expected from eq3. Some variation of the effect with concentration above this value was found for electrolytes with vibration potentials smaller than 1 fxv cm- 1 sec, i.e ., NaOH, KOH, HC1, CuSCh, NaF, and NaCl. For the first four of these electrolytes, these variations are lvithin the over-all precision but were found consistently in each of three independent runs. For NaOH and KOH the changes with concentration are probably associated with the formation of carbonates. The abnormal behavior of NaF and NaCl at low concentrations remains unexplained.
The values for $ /a in Table I II have been obtained from the data in Table II and similar data for other electrolytes at various concentrations by assuming that the most meaningful values for $/a are those corresponding to the plateaus in the plots of $ /a vs. concentration. In most instances, the variation of <t>/a with concentration has been found to be of the same order as the precision of the measurements and a mean value weighted somewhat towards higher concentrations has been chosen. The signs indicated for $/a in Table I II have been assigned in such a way as to render the data self-consistent. For electrolytes with small values of 3?/a, possible confusion concerning sign has been avoided by studying mixtures of the electrolyte in question with a second electrolyte for which no ambiguity exists as to the sign of the effect. This procedure will be more evident to the reader after he has examined the results in part VI-C.
In Table I II are also listed values for the ionic partial molal volumes, V+ and F_, calculated from the transference numbers, t - and £_, at low concentrations or infinite dilution as compiled by Parsons19 and the overall partial molal volumes of the electrolytes at low concentrations or infinite dilutions as listed in various
(17) B .g., P. Delahay in “ D ouble Layer and Electrode K inetics,” Interscience Publishers, Inc., John Wilejr and Sons, Inc., New York, N. Y „ 1965, p 133.(18) The input capacbance of the measurement circuit was this high despite the use of a driven shield principally because the input circuit contained a switch assembly which was not surrounded by a driven shield. In newly designed equipment for future work this shortcoming has been remedied.(19) R . Parsons, “ H andbook of Electrochemical Constants,” Butterworth and Co. Ltd., London, 1959, pp 60, 85.
Volume 71, Number s February 1967

532 R aoul Zana and Ernest Y eager
Table II : D epen den ce o f I o n ic V ibra tion P otentia ls“ 4>/a ( m v c m -1 sec) on E lectro ly te C on centration a t 220 K c and 22°
Electro- *------- ----------- ---------------------------------------------------------------- C o n c e n tra tio n s , N -
lytes 10-« 3 x 10-* IO"2 3 X 1 0 '2 10-1 3 x 10⁻¹ 1
N aF 2 .1 1 .5 1 .0 0 .9 0 .8 . . .
K F 2 .2 2 .0 1 .9 1 .9 1 .9 2 .0 2 .0R b F 6 .6 5 .9 5 .9 5 .9 5 .8C sF 9 .4 9 .4 9 .4 9 .4 9 .4
H C l 0 .2 0 .3 0 .5 0 .6 0 .6 0 .5
L iC l 0 .3 0 .1 0 .0 5 0 .1 0 .0 5 0 .0 5 0 .0 5N aC l 1 .1 5 1 .0 0 .8 0 .7 0 .6 0 .6 0 .5KC1 1 .9 1 .8 1 .7 1 .7 1 .7 1 .7R b C l 5 .2 5 .2 5 .2 5 .2 5 .2 5 .2C sC l 8 .1 8 .1 8 .1 8 .1 8 .1 8 .1
L iIO s 8 .7 9 .2 9 .7 ' 9 .7 9 .7 9 .7 . . .
N a I 0 3 7 .7 6 .8 6 .9 6 .8 6 .7K I O 3 4 .5 4 .4 4 .5 4 .4 4 .2
H N O 3 0 .3 0 .1 0 .1 0 .1 0 .1
K N O 3 0 .6 0 .7 0 .7 0 .7 0 .7 0 .8
N aO H 0 .2 0 .1 0 .4 0 .5 0 .5 0 .3K O H 0 .2 0 .2 0 .2 0 .2 0 .3 0 .4
M g C b 1 .1 1 .1 1 .1 1 .1 1 .1 1 .1 1 .0C aC l2 1 .2 1 .2 1 .2 1 .2 1 .2 1 .1 1 .0SrC k 2 .5 2 .4 2 .4 2 .4 2 .3 2 .1B aC l2 4 .0 4 .1 4 .1 4 .0 4 .0 3 .9 3 .5
B e (N 0 3)2 0 .7 0 .7 0 .7 0 .7 0 .8 1 .0M g ( N 0 3)2 0 .2 0 .2 0 .2 0 .2 0 .1 0 .1C a (N 0 3)2 0 .2 0 .1 0 .1 0 .1 0 .1 0 .1S r (N 0 3)2 1 .3 1 .3 1 .3 1 .3 1 .2 1 .2B a (N 0 3)2 2 .6 2 .6 2 .6 2 .6 2 .6 2 .6
LÌ2SO 4 2 .4 2 .4 2 .4 2 .4 2 .4 , . ,
N a 2S 0 4 1 .7 1 .7 1 .7 1 .7 1 .7k 2s o 4 0 .3 0 .3 0 .3 0 .3 0 .2Z 11S04 0 .5 0 .4 0 .3 0 .3 0 .3C u s 0 4 0 .5 0 .4 0 .3 0 .3 0 .2COS04 0 .4 0 .4 0 .5 0 .5 0 .4
“ M easured w ith dou b le -p robe assem bly w ith cell arrangem ent in F igure 9b and driven inner shields.
compilations. 1 9 - 2 2 A test for the self-consistency of the results is to compare the values for Fj for a given ion obtained by measurements in various salts. From the precision of ± 0 .3 ,av cm- 1 sec in the measurements of vibration potentials, deviations from the mean values of ionic partial molal volumes are expected to be not more than approximately ± 2 cm3/mole for monovalent ions and ± 4 cm3/mole for divalent ions. This is confirmed by the data compiled in Table I I I with the exception of salts cf Li+, A l8+, Be2+, M g2+, B a2+, and Pb2+. Hydrolysis, incomplete dissociation, and/or ion pairing occur extensively in general with the higher valency electrolytes. Such effects cause difficulties in the calculation of ionic partial molal volumes from vibration potential data and in the determination of
true partial molal volumes, F2, from density data. For the electrolytes with polyvalent cations the lack of additivity for V+ and F_ is quite evident from the inconsistency of the differences in F2 between various pairs of electrolytes containing a common divalent cation.
The mean values for the ionic partial molal volumes have been calculated from the data in Table I l ia and b. These values for univalent cations and anions plus C 0 22- and S O 42 - are listed in Table IV together 20 21 22
(20) B. Owens and S. Brinkley, Chem. Rem., 29, 461 (1942),(21) A . Couture and K . Laidler, Can. J . Chem ., 34, 1209 (1956).(22) A. Bodansky and W . Kauzmann, J , P h y s . Chem ., 66, 179 (1962).
The Journal o f Physical Chemistry
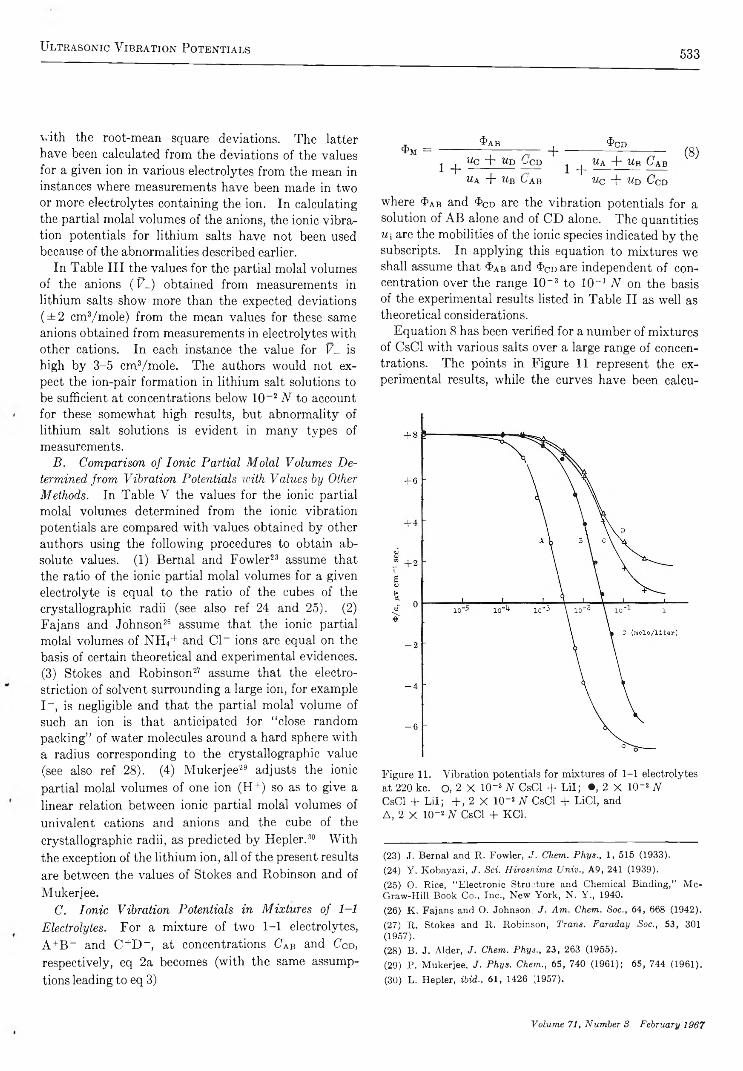
Ultrasonic V ibration Potentials 533
vith the root-mean square deviations. The latter have been calculated from the deviations of the values for a given ion in various electrolytes from the mean in instances where measurements have been made in two or more electrolytes containing the ion. In calculating the partial molal volumes of the anions, the ionic vibration potentials for lithium salts have not been used because of the abnormalities described earlier.
In Table I II the values for the partial molal volumes of the anions (P_) obtained from measurements in lithium salts show more than the expected deviations ( ± 2 cm8/mole) from the mean values for these same anions obtained from measurements in electrolytes with other cations. In each instance the value for F_ is high by 3-5 cm3/mole. The authors would not expect the ion-pair formation in lithium salt solutions to be sufficient at concentrations below 10 - 2 N to account for these somewhat high results, but abnormality of lithium salt solutions is evident in many types of measurements.
B . Com parison o f Io n ic P artial M ola l Volum es D etermined from V ibration Potentials with V alues by Other M ethods. In Table V the values for the ionic partial molal volumes determined from the ionic vibration potentials are compared with values obtained by other authors using the following procedures to obtain absolute values. (1) Bernal and Fowler23 24 25 assume that the ratio of the ionic partial molal volumes for a given electrolyte is equal to the ratio of the cubes of the crystallographic radii (see also ref 24 and 25). (2)Fajans and Johnson26 assume that the ionic partial molal volumes of NH4+ and Cl- ions are equal on the basis of certain theoretical and experimental evidences.(3) Stokes and Robinson27 28 assume that the électrostriction of solvent surrounding a large ion, for example I - , is negligible and that the partial molal volume of such an ion is that anticipated for “ close random packing” of water molecules around a hard sphere with a radius corresponding to the crystallographic value (see also ref 28). (4) Mukerjee29 adjusts the ionicpartial molal volumes of one ion (H+) so as to give a linear relation between ionic partial molal volumes of univalent cations and anions and the cube of the crystallographic radii, as predicted by Hepler. 30 With the exception of the lithium ion, all of the present results are between the values of Stokes and Robinson and of Mukerjee.
C. Io n ic V ibration Potentials in M ixtu res o f 1 -1 Electrolytes. For a mixture of two 1 - 1 electrolytes, A+B~ and C+D~, at concentrations C ap and C c d ,
respectively, eq 2 a becomes (with the same assumptions leading to eq 3)
$M =1 +
^AB______lie + Md Ccd U a + Mb C a b
+CD
1 +U a + Mb C a b
Me + md C c d
(8 )
where $ a b and 4>c d are the vibration potentials for a solution of AB alone and of CD alone. The quantities Mi are the mobilities of the ionic species indicated by the subscripts. In applying this equation to mixtures we shall assume that 4>a b and 4>C d are independent of concentration over the range 10 ~ 3 to 10 _ 1 N on the basis of the experimental results listed in Table II as well as theoretical considerations.
Equation 8 has been verified for a number of mixtures of CsCl with various salts over a large range of concentrations. The points in Figure 1 1 represent the experimental results, while the curves have been calcu-
Figure 11. V ibration potentials for m ixtures o f 1 -1 electrolytes at 220 kc. O, 2 X lO “ 3 N C sC l + L i l ; • , 2 X 10~2 N C sC l + L i l ; + , 2 X 10~ 2 N C sC l + L iC l, and A , 2 X 1 0 -2 N C sC l + KC1.
(23) J . Bernal and R . Fow ler, J. Chem. P h y s ., 1, 515 (1933).(24) Y . Kobayazi, J. Sci. H iroshim a U niv., A9, 241 (1939).(25) 0 . R ice, “ Electronic Structure and Chemical B ind ing,” M cG raw -H ill Book Co., In c ., New Y o rk , N . Y . , 1940.(26) K . Fa jans and O. Johnson, J. A m . Chem. Soc., 64, 668 (1942).(27) R . Stokes and R . Robinson, Trans. Faraday Soc., S3, 301 (1957).(28) B . J . Alder, J . Chem. P h ys ., 23, 263 (1955).(29) P . Mukerjee, J. P h ys . Chem., 65, 740 (1961); 65, 744 (1961).(30) L . Hepler, M d ., 6 1 , 1426 (1957).
Volume 71, Number S February 1967

534 Raoul Zana and Ernest Y eager
T able I I I : Ion ic V ibration P otentials“ at 220 K c and 22° and C alcu lated P artial M ola i V olum es
#/a, Vi, V+, V - ,Electro- A*v cm-1 cm*/ cm8/ cm8/
lytes Bee t+ mole mole mole
a. 1 -1 E lectrolytesN aF 0 .8 0 .4 7 6 0 .5 2 4 - 3 .5 - 6.1 2 .6K F 2 .0 0 .5 7 0 0 .4 3 0 6 .6 4 .0 2 .6R b F 5 .8 0 .5 8 5 0 .4 1 5 1 2 .8 9 .7 3.1C sF 9 .4 0 .5 8 0 0 .4 2 0 2 0 .1 15 .1 5 .0
HC1 0 .4 0 .8 2 0 0 .1 8 0 1 7 .8 - 5 . 6 2 3 .4L iC l 0 0 .3 3 6 0 .6 6 4 1 7 .0 - 9 . 5 2 6 .5N aC l 0 .6 0 .3 9 6 0 .6 0 4 1 6 .4 - 6 . 4 2 2 .8N H 4CI - 0.1 0 .4 9 0 0 .5 1 0 3 6 .0 9 .6 2 6 .4KC1 1.7 0 .4 9 0 0 .5 1 0 2 6 .5 3 .7 2 2 .8R b C l 5 .2 0 .5 11 0 .4 8 9 3 1 .9 8 .4 2 3 .5C sC l 8.1 0 .5 0 0 0 .5 0 0 3 9 .2 1 5 .7 2 3 .5
N aB r - 3.1 0 .3 9 2 0 .6 0 8 2 3 .5 - 6 . 5 3 0 .0K B r - 1.3 0 .4 8 5 0 .5 1 5 3 3 .7 3 .4 3 0 .3
L il - 7 .2 0 .3 4 4 0 .6 5 6 3 5 .5 - 1 2 . 0 4 7 .5N a l - 6 .4 0 .3 9 5 0 .6 0 5 3 5 .1 - 5 . 4 4 0 .5K I - 4 .0 0 .4 8 8 0 .5 1 2 4 5 .4 3 .1 4 2 .3
LiO H - 0 .5 0 .1 6 4 0 .8 3 6 - 4 . 0 - 1 2 . 6 8 .6N aO H - 0 .4 0 .2 0 2 0 .7 9 8 - 4 . 6 - 9 . 5 4 .9K O H - 0 .2 0 .2 71 0 .7 2 9 5 .4 3 .6 1 .8
L ilO s - 9 .7 0 .4 8 7 0 .5 1 3 2 4 .8 - 1 1 . 2 3 6 .0NalOa - 6 . 8 0 .5 5 4 0 .4 4 6 2 4 .2 - 1 0 . 4 3 4 .6K IO 3 - 4 . 4 0 .6 4 4 0 .3 5 6 3 4 .3 3 .1 3 1 .2
HNOa 0 0 .8 3 0 0 .1 7 0 2 9 .8 - 5 . 2 3 5 .0K N O s 0 .7 0 .5 0 7 0 .4 9 3 3 8 .3 3 .6 3 4 .6
K C IO 3 0 0 .5 3 3 0 .4 6 7 4 5 .2 2 .1 4 3 .1K C IO 4 - 0 . 9 0 .5 2 2 0 .4 7 8 5 2 .2 3 .7 4 8 .5N a acetate 1 .7 0 .4 7 8 0 .5 2 2 4 0 .1 - 1 0 . 1 5 0 .2N a H C O s 0 0 .5 3 0 0 .4 7 0 2 2 .6 - 5 . 9 2 8 .5
b . 1 -2 E lectrolytesLÌ2SO4 - 2 . 4 0 .3 2 5 0 .6 7 5 11 .6 - 1 0 . 5 3 2 .6N a2S 0 4 - 1 . 7 0 .3 8 6 0 .6 1 4 11 .5 - 5 . 9 2 3 .6k 2s o 4 - 0 . 3 0 .4 8 0 0 .5 2 0 3 2 .3 4 .3 2 3 .6(N H 4)2S 0 4 - 2 . 3 0 .4 8 0 0 .5 2 0 5 1 .3 1 1 .4 2 8 .4NaaCOa - 0 . 6 0 .4 2 0 0 .5 8 0 - 6 . 7 - 6 . 1 5 .5
c. 2 -1 and 3 -1 E lectrolytesM g C l2 1 .1 0 .4 1 0 0 .5 9 0 15 .3 - 3 6 . 7 26C aC l2 1 .2 0 .4 3 8 0 .5 6 2 1 8 .3 - 2 5 . 5 2 1 .9SrC l2 2 .4 0 .4 3 8 0 .5 6 2 17 .9 - 2 2 . 1 2 0 .0B aC l2 4 .1 0 .4 5 4 0 .5 4 6 2 3 .6 - 1 5 . 6 1 9 .6C d C l2 4 .0 0 .4 1 4 0 .5 8 6 2 3 .2 - 3 2 . 4 2 7 .8B e (N 0 3)2 - 0 . 7 0 .3 8 6 0 .6 1 4 5 2 .7 - 3 0 . 7 4 1 .7M g(N O a )2 - 0 . 2 0 .4 2 7 0 .5 7 3 3 7 .5 - 3 5 . 6 3 6 .8C a(N O a)2 0 .2 0 .4 5 5 0 .5 4 5 4 0 .6 - 2 8 . 6 3 4 .6Sr(NOa)a 1 .3 0 .4 5 5 0 .5 4 5 4 0 .2 - 2 4 . 6 3 2 .4B a (N O a)2 2 .6 0 .471 0 .5 2 9 4 5 .7 - 9 . 5 2 7 .6C d (N 0 3)2 1 .7 0 .4 3 0 0 .5 7 0 3 8 .0 - 2 2 . 2 3 0 .1N i(N O a)2 0 .6 0 .4 3 0 0 .5 7 0 3 4 .0 - 3 3 . 6 3 4 .2C o (N 0 3)2 0 .7 0 .4 0 7 0 .5 9 3 3 0 .6 - 3 8 . 4 3 4 .5P b (N O s)2 5 .5 0 .4 9 5 0 .5 0 5 4 2 .5 - 6 . 9 2 4 .7Al(NOa)a - 0 . 8 0 .4 7 0 0 .5 3 0 43 - 4 6 . 7 2 9 .9
The Journal o f P h ysica l Chem istry

Ultrasonic V ibration Potentials 535
Table III (Continued)
<&/a, V2, v+> V - ,E le c t r o p v c m " 1 c m 3/ c m 3/ c m 3/
ly te s sec t+ m ole m ole m o le
d. 2 -2 E lectrolytesM g S 0 4 - 1 . 3 0 .4 0 0 0 .6 0 0 - 6.0 - 34.6 2 8 .6Z n S 0 4 - 0 . 4 0 .4 0 0 0 .6 0 0 - 7 .6 - 3 2 . 4 2 4 .8C o S 0 4 - 0 . 4 0 .3 8 0 0 .6 2 0 - 4.2 - 3 4 . 0 2 9 .8C u S 0 4 - 0.3 0 .4 1 5 0 .5 8 5 - 11.2 - 3 2 . 4 2 1 .2N iS 0 4 - 0 .3 0 .4 0 0 0 .6 0 0 - 10.2 - 3 6 . 2 26
a See T a b le I I , fo o tn ote a.
Table IV : M ean Values fo r Ion ic P artial M ola l V olum es ( Vj) and R oot-M ean -S qu are D eviations (a-) betw een Values in Various E lectrolytes (cm 3/m o le )
Ion Vi <7H + - 5 . 4 0.2L i + -1 1 .2 1.2N a + - 7 . 4 1.9K + 3.4 0.6Rb+ 9.0 0.7Cs+ 15.5 0.3n h 4+ 10.5 1.5F - 3.3 1 .0c i - 23.7 1.2B r - 30.2 0.2I - 41.4 0.9N O 3- 34.8 0.2c i o 3- 43.2I0 3 32.9 1.7C 104- 48.5A ceta te - 50.2H C O 3- 28.5C ( V - 5.5S 0 42~ 27.0 3.5
V isc o s ity r e la t iv e to w a te r .
Figure 12. D epen den ce o f ion ic v ibration potential on viscosity at 220 k c and 22°.
lated with eq 8 using for $ ab and 4>cd the values listed in Table II. In all instances the agreement is well
Table V : C om parison o f Values for Ion ic Partial M ola l V olum es (c m 3/m o le ) D eterm ined b y V arious M ethod s
IonPresentvalues B-F23 F-J26 S -R ” M»»
L i + - 11.2 - 8 . 0 - 0 . 9 - 8 . 2 - 5 . 2Na + - 7.4 - 8 . 5 - 1 . 7 - 8 . 7 - 5 . 7K + 3.4 8 8.4 1.5 4.5R b + 9.0 15.5 13.7 6.4 9.5Cs+ 15.5 27 21.1 13.9 16.9
n h 4+ 10.5 12 18 10.6H + - 5 . 4 -8 0 .1 - 7 . 2 - 4 . 5
F - 3.3 6 - 1 . 8 5.1 2.1c i - 23.7 37 18 25.3 22.3Br- 30.2 47.5 25.1 32.2 29.2I - 41.4 66 36.7 43.8 40.8
CIOs" 43.2 61 35.1c i o 4- 48.5 44.5 51.1 50.6IO," 32.9 42NO3- 34.8 38 29.4 36.6 33.6
Ac“ 50.2 40.5HCOs- 28.5 45 22.3 29.1C032- 5.5 7 - 2 . 8 10.7S042- 27.0 39 15.4 24.8
within the precision of the measurements. An inversion in the phase of the observed effect is evident for the mixtures of CsCl and Lil.
D . V iscosity D ependence o f Io n ic V ibration P oten tials. In eq 2a, the frictional coefficient of the jth ion (pj) includes the viscosity of the solvent. Since p, appears in both numerator and denominator of the right term in eq 2 a, the vibration potentials, $, should be independent of solvent viscosity. To establish the validity of this prediction experimentally, the effective viscosity of the solvent has been modified through the introduction of a water-soluble, nonionic, complex, synthetic polyacrylamide, Polyhall-27.31 Figure 12 shows the effect on the observed ionic vibration poten
(31) Provided by Stein, H a ll, and Co., Ine ., New Y o rk , N . Y .
Volume 71, Number 8 February 1967
536 R aoul Zana and Ernest Y eager
tials of adding Polyhall-27 to 0.05 and 0.2 N K I solutions. A small intrinsic potential of 0.5-1 /iv cm- 1 sec was observed in pure water containing Polyhall-27 with the magnitude of the intrinsic effect dependent on the polymer concentration. This intrinsic effect is to be compared with the value of 0.3 n v cm- 1 sec observed with just pure water. Although a significant decrease in the ionic vibration potentials is produced with the addition of the polymer to the solution, this decrease is quite small in view of the extremely large increment (up to 2 1 -fold) in the viscosity produced by the addition of the polymer. Furthermore, some change in the magnitude of the effect is to be anticipated even though eq 2 a does not explicitly indicate a dependence on viscosity because of the direct electrostatic interaction of the ions with the polymer and the attendant changes in the apparent masses (W i). All things considered, the behavior in Figure 12 appears quite reasonable.
VII. Conclusions
On the basis of the present experimental study of ionic vibration potentials, the following conclusions have been reached. (1) Measurements of ionic vibration potentials are subject to several false effects, but these can be eliminated or reduced to a magnitude where they have very little effect on the measurements. (2 ) Experimentally measured values for the ionic vibration potentials are in good agreement with presently available theoretical treatments. (3) Ionic vibration potentials in conjunction with density data provide an attractive approach to the determination of the absolute values of ionic partial molal volumes.
Acknowledgm ent. The authors are pleased to acknowledge the support of this research by the Office of Naval Research.
The Journal of Physical Chemistry
R eaction of AlCl(g) with MgO(c) and Heat of Formation of MgAl20 4(c) 537
Reaction of AlCl(g) with MgO(c) and the Heat of Formation of MgAl20 4(c)
by D. Bhogeswara Rao and V. V. Dadape
Com m unication N o. 939 from the N ational Chemical Laboratory, P oona , In d ia (Received June 38, 1966)
The reaction of aluminum monochloride with magnesium oxide was investigated between 1298 and 1465°K employing a flow method. The products of the reaction and the weight- loss measurements suggest that the equilibrium reaction was 4MgO(c) + 3AlCl(g) MgAl20 4(c) + AlCl3(g) + 3Mg(g). The reaction yielded a third-law heat, A H 298 = 21.85 ± 0.84 kcal mole- 1 , which compared favorably with the second-law value of 24.03 ±2.49 kcal mole- 1 . These values gave —553.36 ± 1.89 and —551.18 ± 3.55 kcal mole- 1 , respectively, for the heat of formation of magnesium aluminate from the elements. The heat of formation of MgAl20 4(c) from the oxides at 298°K was found to be —9.26 ± 1.89 kcal mole- 1 from the third law and —7.08 ± 3.55 kcal mole- 1 from the second law.
IntroductionAlthough the vapor-phase existence of aluminum
monochloride and its highly reducing nature has been realized long ago, 1 very little is known about its action on refractory oxides. Semenkovitch2 has reported that aluminum monochloride reacted with refractory oxides, viz., MgO, BeO, Zr02, and Si02, but not with alumina. His experiments were purely qualitative. He has suggested the following mechanism for the reaction of aluminum monohalide with MgO(c) at 1100°
3MgO(c) + 6 AlCl(g) =
3MgCl2(g) + Al20 3(c) + 4A1(1) (1)
but the possibility of the aluminum metal reacting with MgO(c) was not taken into consideration. Altman3 '4 and Grjotheim, Herstad, and Toguri5 have measured the vapor pressures of Mg metal at about the same temperatures by studying the reaction
MgO(c) + 2A1(1) ^ MgAl20 4(c) + 3Mg(g) (2 )
This suggests the formation of the spinel, MgAl20 4(c), in the reaction of AlCl(g) with MgO(c) at these temperatures, which was overlooked by Semenkovitch. 2
The presence of aluminum metal also reduces the magnesium chloride with the formation of A1C13 at these temperatures, as was indicated in the work of Balduni.6
From the above information it appears that the course of reaction between AlCl(g) and MgO(c) is not according to that indicated by Semenkovitch2 (see reaction
1 ) and hence the necessity for the present investigation.
In continuation of the study of the equilibrium reaction7
2A1(1) + AlCl,(g) ^ 3AlCl(g) (3)
the gaseous monochloride was allowed to react with solid MgO. In order to establish the reaction scheme, equilibrium measurements were carried out together with the identification of the products.
Experimental SectionM aterials. The magnesium oxide used in this in
vestigation was of E. Merck grade and was dried at 1200° for 20 hr. The powder was pressed into briquettes at 1000 kg/cm2. The briquettes were broken into small pieces to give rise to a large sample surface area to make the conditions favorable for ensuring equilibrium with the carrier gas. Aluminum chloride was also of E. Merck grade and was resublimed in an inert atmosphere before use. The material was always handled in a drybox. Aluminum metal used in the production of mono chloride was of spectrographi-
(1) L. Frommer and M . Polayni, Z . P h ysik . Chem ., B6, 380 (1930).(2) S. A. Semenkovitch, J . A p p l. Chem . U S S R , 33, 557 (1960).(3) R . L . Altman, J. P h ys . Chem ., 67, 366 (1963).(4) R . L . Altman, ibid., 68, 3425 (1964).(5) K . Grjotheim , O. Herstad, and J. M . Toguri, Can. J . Chem., 39, 443 (1961).(6) H . Balduni, M onaish. Chem., 88, 1038 (1957).(7) D. B. R ao and Y . Y . Dadape, J. P h ys . Chem., 70, 1349 (1966).
Volume 71, Number 3 February 1967
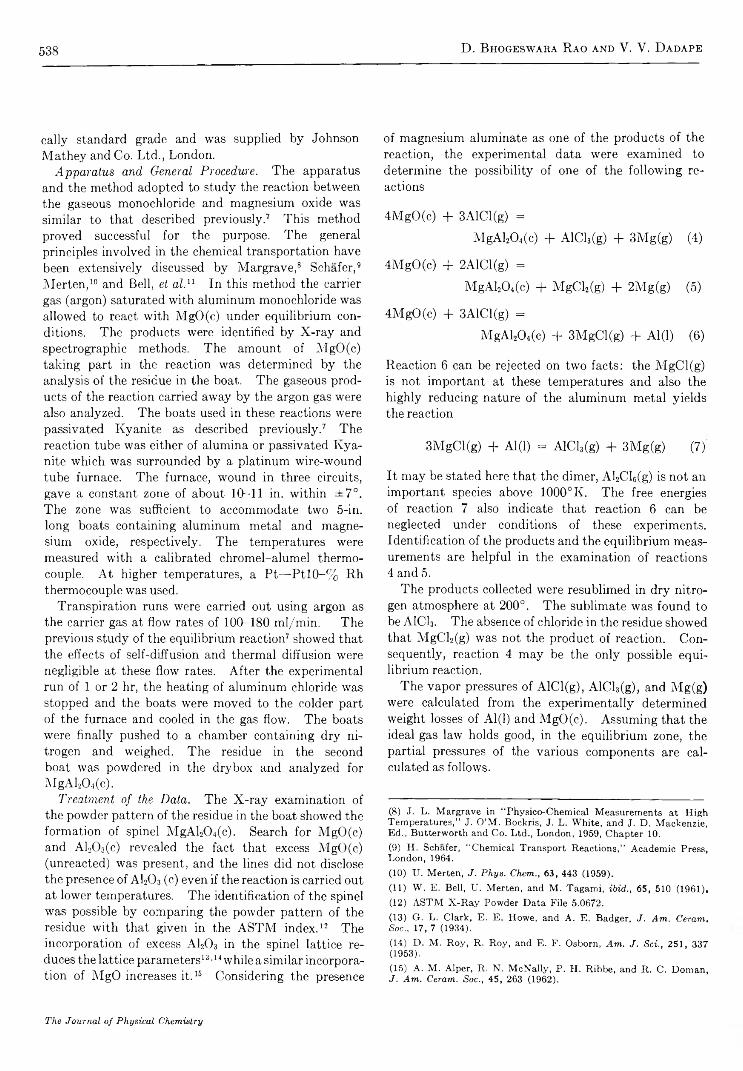
538 D. B hogeswara R ao and V. V. D adape
cally standard grade and was supplied by Johnson Mathey and Co. Ltd., London.
A pparatus and General Procedure. The apparatus and the method adopted to study the reaction between the gaseous monochloride and magnesium oxide was similar to that described previously.7 This method proved successful for the purpose. The general principles involved in the chemical transportation have been extensively discussed by Margrave,8 Schafer, 9
Merten, 10 11 and Bell, et a l.u In this method the carrier gas (argon) saturated with aluminum monochloride was allowed to react with MgO(c) under equilibrium conditions. The products were identified by X-ray and spectrographic methods. The amount of MgO(c) taking part in the reaction was determined by the analysis of the residue in the boat. The gaseous products of the reaction carried away by the argon gas were also analyzed. The boats used in these reactions were passivated Kyanite as described previously. 7 The reaction tube was either of alumina or passivated Ivya- nite which was surrounded by a platinum wire-wound tube furnace. The furnace, wound in three circuits, gave a constant zone of about 10 - 1 1 in. within ± 7 °. The zone was sufficient to accommodate two 5-in. long boats containing aluminum metal and magnesium oxide, respectively. The temperatures were measured with a calibrated chromel-alumel thermocouple. At higher temperatures, a P t—PtlO-% Rh thermocouple was used.
Transpiration runs were carried out using argon as the carrier gas at flow rates of 100-180 ml/min. The previous study of the equilibrium reaction7 showed that the effects of self-diffusion and thermal diffusion were negligible at these flow rates. After the experimental run of 1 or 2 hr, the heating of aluminum chloride was stopped and the boats were moved to the colder part of the furnace and cooled in the gas flow. The boats were finally pushed to a chamber containing dry nitrogen and weighed. The residue in the second boat was powdered in the drybox and analyzed for MgAl20 4(c).
Treatm ent o f the Data. The X-ray examination of the powder pattern of the residue in the boat showed the formation of spinel MgAl20 4(c). Search for MgO(c) and Al20 3(c) revealed the fact that excess MgO(c) (unreacted) was present, and the lines did not disclose the presence of AI2O3 (c) even if the reaction is carried out at lower temperatures. The identification of the spinel was possible by comparing the powder pattern of the residue with that given in the ASTM index. 12 The incorporation of excess A120 3 in the spinel lattice reduces the lattice parameters13 ■ *4 15 while a similar incorporation of MgO increases it . 16 Considering the presence
of magnesium aluminate as one of the products of the reaction, the experimental data were examined to determine the possibility of one of the following reactions
4MgO(c) + 3AlCl(g) =
MgAl20 4(c) + AlCl3(g) + 3Mg(g) (4)
4MgO(c) + 2AlCl(g) =
MgAl20 4(c) + MgCl2(g) + 2Mg(g) (5)
4MgO(c) + 3AlCl(g) =
MgAl20 4(c) + 3MgCl(g) + Al(l) (6 )
Reaction 6 can be rejected on two facts: the MgCl(g) is not important at these temperatures and also the highly reducing nature of the aluminum metal yields the reaction
3MgCl(g) + Al(l) = AlCla(g) + 3Mg(g) (7)
It may be stated here that the dimer, Al2Cl6(g) is not an important species above 1000°K. The free energies of reaction 7 also indicate that reaction 6 can be neglected under conditions of these experiments. Identification of the products and the equilibrium measurements are helpful in the examination of reactions 4 and 5.
The products collected were resublimed in dry nitrogen atmosphere at 200°. The sublimate was found to be A1C13. The absence of chloride in the residue showed that MgCl2(g) was not the product of reaction. Consequently, reaction 4 may be the only possible equilibrium reaction.
The vapor pressures of AlCl(g), AlCl3(g), and Mg(g) were calculated from the experimentally determined weight losses of Al(l) and MgO(c). Assuming that the ideal gas law holds good, in the equilibrium zone, the partial pressures of the various components are calculated as follows.
(8) J. L. M argrave in "Physico-Chem ical Measurements at High Temperatures,” J. O ’M . Bockris, J. L. W hite, and J. D . M ackenzie, Ed., Butterworth and Co. Ltd., London, 1959, Chapter 10.(9) H . Schafer, “ Chemical Transport Reactions,” Academ ic Press, London, 1964.(10) U. Merten, J . P h ys . Chem ., 63, 443 (1959).(11) W . E. Bell, TJ. Merten, and M . Tagami, ibid., 65, 510 (1961),(12) A ST M X -R a y Powder Data File 5.0672.(13) G. L. Clark, E . E. Howe, and A. E. Badger, J. A m . C eram . Soc., 17, 7 (1934).(14) D . M . R oy, R. R oy, and E. F. Osborn, A m . J . Sci., 251, 337 (1953).(15) A. M . Alper, R . N. M cN ally, P . H. R ibbe, and R . C. Dom an,J . A m . Ceram . Soc., 45, 263 (1962).
The Journal of Physical Chemistry
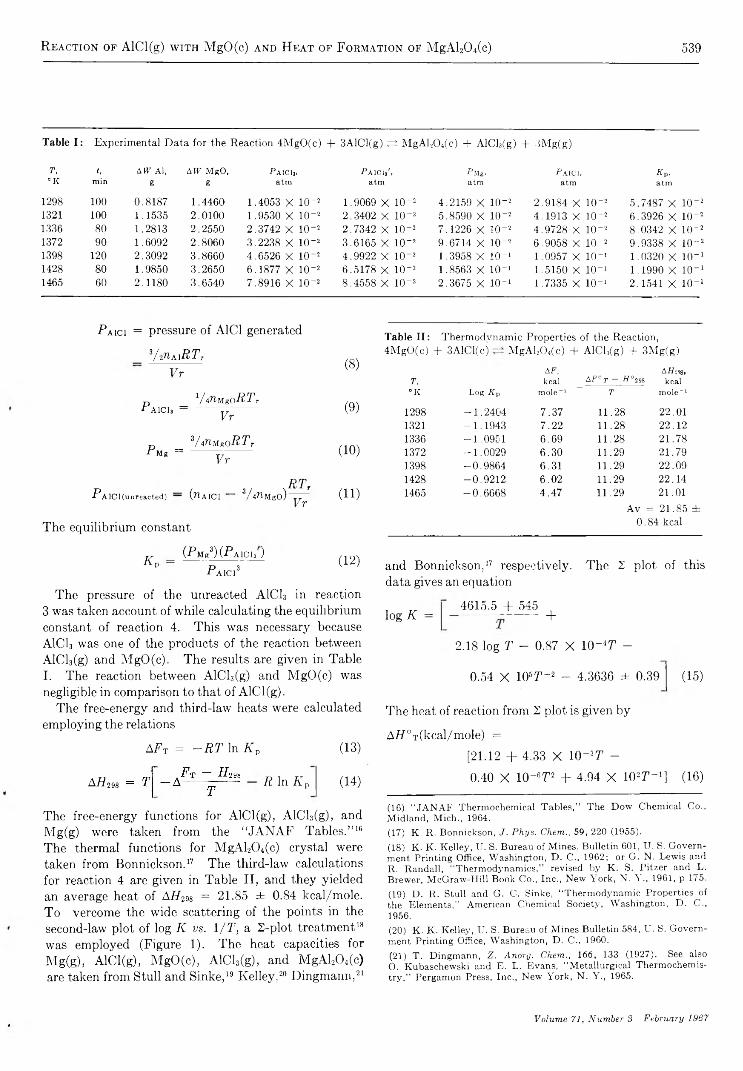
R eaction op AlCl(g) with MgO(c) and Heat op Formation of MgAl20 4(c) 539
Table I: E xperim ental D a ta for the R eaction 4 M g O (c ) + 3 A lC l(g ) ^ M g A k 0 4(c ) + A lC h (g ) + 3 M g (g )
T , t, A W A l, A W M gO , P aici3. P a ICIj', P Mg, -Paici, A'p,°K m in g g a tm a tm a tm a tm a tm
1298 100 0 .8187 1 .4460 1 .4053 X 10 “ 2 1 .9069 X 10 “ 2 4 .2 15 9 X 10“ 2 2 .9 1 8 4 X 10~ 2 5 .7 4 8 7 X 10 - 21321 100 1 .1535 2.0100 1 .9530 X 10“ 2 2 .3 40 2 X 10 - 2 5 .8 59 0 X 10“2 4 .1 9 1 3 X 1 0 “ 2 6 .3 9 2 6 X IO“ 21336 80 1.2813 2 .2 55 0 2 .3 7 4 2 X IO“ 2 2 .7 3 4 2 X 1 0 “ 2 7 .1 22 6 X 10^2 4 .9 7 2 8 X 10“ 2 8 .0 34 2 X 1 0~ 21372 90 1 .6092 2 .8 0 6 0 3 .2 2 3 8 X 1 0 “ 2 3 .6 1 6 5 X 1 0 “ 2 9 .6 7 1 4 X 10"2 6 .9 0 5 8 X 10 - 2 9 .9 3 3 8 X 1 0 - 21398 120 2 .3092 3 .8 66 0 4 .6 5 2 6 X 1 0 “ 2 4 .9 9 2 2 X 1 0 “ 2 1 .3958 X io -> 1 .0957 X 1 0 -» 1 .0 32 0 X 10“ 11428 80 1 .9850 3 .2 6 5 0 6 .1 8 7 7 X 10“ 2 6 .5 1 7 8 X 1 0 “ 2 1 .8563 X 10- ‘ 1 .5150 X 10“ 1 1 .1 99 0 X 1 0 - 11465 60 2 .1 18 0 3 .6540 7 .8 9 1 6 X 1 0 - 2 8 .4 5 5 8 X 10“ 2 2 .3675 X 10-1 1 .7335 X 1 0 “ 1 2 .1 54 1 X 1 0 - 1
R aici = pressure of A1C1 generated
VVuiÄTVV r
P Aids =
P Mg =
l/nn,MgoPTr
Vr
V iUUgoRTr
V r
P AlCl (unreacted) — (ttAlCl 3 ! 4?lMgo)R T rV r
The equilibrium constant
Table II: T h erm odyn am ic Properties o f the R eaction ,4 M g O (c ) + 3 A lC l(c ) M g A l20 4(c ) + A lC l3(g ) + 3 M g (g )
(8 )T,°K Log Kp
A F, kcal
mole-1A F°T — R°298
“ T
A#298»kcal
mole-1
(9) 1298 - 1 .2 4 0 4 7 .3 7 11 .28 22.011321 - 1 .1 9 4 3 7 .2 2 11 .28 22.12
(1 0 )1336 - 1 .0 9 5 1 6 .6 9 11 .28 2 1 .7 81372 - 1 .0 0 2 9 6 .3 0 11 .29 2 1 .7 91398 - 0 .9 8 6 4 6 .3 1 11 .29 2 2 .0 91428 - 0 .9 2 1 2 6.02 11 .29 2 2 .1 4
(1 1 ) 1465 - 0 .6 6 6 8 4 .4 7 11 .29 21.01A v = 2 1 .8 5 ±
0 .8 4 kcal
K P(P M g3) (P A \C h)
P A l C l 3(1 2 )
The pressure of the unreacted AICI3 in reaction 3 was taken account of while calculating the equilibrium constant of reaction 4. This was necessary because AICI3 was one of the products of the reaction between AlCh(g) and MgO(c). The results are given in Table I. The reaction between AlCl3(g) and MgO(c) was negligible in comparison to that of AlCl(g).
The free-energy and third-law heats were calculated employing the relations
ARt = - R T ln K p
AH298 R In K p
(13)
(14)
The free-energy functions for AlCl(g), AlCl3(g), and Mg(g) were taken from the “ JA N A F Tables. ” 16
The thermal functions for MgAl20 4(c) crystal were taken from Bonnickson. 17 The third-law calculations for reaction 4 are given in Table II, and they yielded an average heat of A H Ma = 21.85 ± 0.84 kcal/mole. To vercome the wide scattering of the points in the second-law plot of log K vs. l/ T , a 2 -plot treatment18
was employed (Figure 1). The heat capacities for Mg(g), AlCl(g), MgO(c), AlCl3(g), and MgAl20 4(c) are taken from Stull and Sinke, 19 Kelley , 20 Dingmann, 21
and Bonnickson, 17 respectively. The 2 plot of this data gives an equation
log K =4615.5 + 545
+
2.18 log T - 0.87 X 10 " 4T -
0.54 X 10⁶T - 2 - 4.3636 ± 0.39 (15)
The heat of reaction from 2 plot is given by
AH°T(kcal/mole) =
[21.12 + 4.33 X 10 - 3T -
0.40 X 10 - 6T2 + 4.94 X lO2?1- 1] (16)
(16) “ JA N A F Thermochemical Tables,” The D ow Chemical Co., M idland, M ich., 1964.(17) K . R . Bonnickson, J . P h y s . Chem., 59, 220 (1955).(18) K . K . Kelley, U. S. Bureau o f Mines, Bulletin 601, U. S. Governm ent Printing Office, V/ashington, D . C., 1962; or G. N. Lewis and R . Randall, “ Therm odynam ics,” revised by K . S. Pitzer and L. Brewer, M cG raw-H ill B ook Co., Inc., New Y ork, N. Y ., 1961, p 1 /5 .(19) D . R . Stull and G. C. Sinke, “ Therm odynam ic Properties of the Elements,” American Chemical Society, W ashington, D . C., 1956.(20) K . K . Kelley, U. S. Bureau of Mines Bulletin 584, U. S. Government Printing Office, W ashington, D . C., 1960.(21) T . Dingmann, Z . A norg . Chem ., 166, 133 (1927). See alsoO. Kubaschewski and E. L. Evans, “ Metallurgical Thermochemistry ,” Pergamon Press, Inc., New York, N . Y ., 1965.
Volume 71, Number 8 February 1967
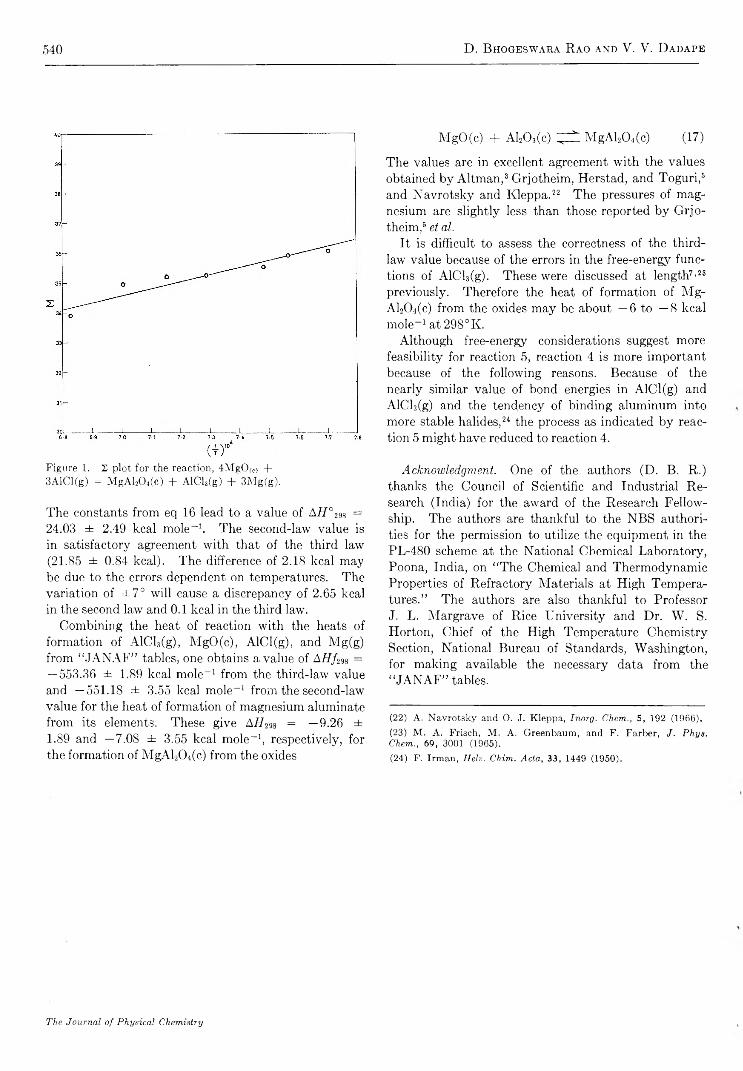
540 D. Bhogeswara R ao and V. Y. D adape
Figure 1. 2 p lot for the reaction, 4M gO (C) +3 A lC l(g ) = M g A l20 4(c ) + A lC l8(g ) + 3 M g (g ).
The constants from eq 16 lead to a value of A H °MS =24.03 ± 2.49 kcal mole- 1 . The second-law value is in satisfactory agreement with that of the third law (21.85 ± 0.84 kcal). The difference of 2.18 kcal may be due to the errors dependent on temperatures. The variation of ± 7 ° will cause a discrepancy of 2.65 kcal in the second law and 0 . 1 kcal in the third law.
Combining the heat of reaction with the heats of formation of AlCl3(g), MgO(c), AlCl(g), and Mg(g) from “ JA N A F” tables, one obtains avalué of A H f^s = — 553.36 ± 1.89 kcal mole- 1 from the third-law value and —551.18 ± 3.55 kcal mole- 1 from the second-law value for the heat of formation of magnesium aluminate from its elements. These give A H i9$ = —9.26 ± 1.89 and —7.08 ± 3.55 kcal mole- 1 , respectively, for the formation of MgAl20 4(c) from the oxides
MgO(c) + A120 3(c) ^ MgAl20 4(c) (17)
The values are in excellent agreement with the values obtained by Altman, 3 Grjotheim, Herstad, and Toguri, 5
and Navrotsky and Kleppa. 22 The pressures of magnesium are slightly less than those reported by Grjotheim,5 et al
i i is difficult to assess the correctness of the third- law value because of the errors in the free-energy functions of AlCl3(g). These were discussed at length7 ’23
previously. Therefore the heat of formation of Mg- Al20 4(c) from the oxides may be about — 6 to — 8 kcal mole- 1 at 298°K.
Although free-energy considerations suggest more feasibility for reaction 5, reaction 4 is more important because of the following reasons. Because of the nearly similar value of bond energies in AlCl(g) and AlCl3(g) and the tendency of binding aluminum into more stable halides, 24 the process as indicated by reaction 5 might have reduced to reaction 4.
Acknowledgm ent. One of the authors (D. B. R.) thanks the Council of Scientific and Industrial Research (India) for the award of the Research Fellowship. The authors are thankful to the NBS authorities for the permission to utilize the equipment, in the PL-480 scheme at the National Chemical Laboratory, Poona, India, on “ The Chemical and Thermodynamic Properties of Refractory Materials at High Temperatures.” The authors are also thankful to Professor J. L. Margrave of Rice University and Dr. W. S. Horton, Chief of the High Temperature Chemistry Section, National Bureau of Standards, Washington, for making available the necessary data from the “ JA N A F” tables.
(22) A. Navrotsky and O. J. Kleppa, Inorg. Chem., 5, 192 (1966).(23) M . A . Frisch, M . A . Greenbaum, and F. Farber, J. Phys. Chem., 69, 3001 (1965).(24) F. Irman, Heh . Chim. Acta, 33, 1449 (1950).
The Journal of Physical Chemistry
R eversible Photochemical D imerization of Acenaphthylene 541
Reversible Photochemical Dimerization of Acenaphthylene. I.
The Reaction in Liquid Solutions1
by Robert Livingston and Kei Sin Wei
D ivision o f P hysica l Chem istry, U niversity o f M innesota , M inneapolis, M innesota (R eceived J u ly 5, 1966)
Acenaphthylene is photodimerized by visible and near-ultraviolet light. In solution, the quantum yield increases with increasing concentration and is depressed by dissolved 0 2. Only the cis dimer is formed in 0 2-saturated solutions. In 0 2-free solutions, both dimers are formed; the trans dimer is the dominant species in dilute solutions and the cis dimer in concentrated solutions. The effects of the nature of the solvent and of temperature were studied. The results are compatible with a relatively simple mechanism. The dimers are efficiently photodissociated, re-forming acenaphthylene. The quantum yield of photodissociation does not depend on the concentrations of dimer or of 0 2.
IntroductionThe photodimerization of acenaphthylene was first
reported in 1912 by Dziewonski and Rapalski2 3 and was studied quantitatively by Bowen and Marsh in 1947.3a Our present study of this reaction is in general agreement with these published results; however, being more extensive and differing quantitatively in some respects from earlier studies, it demands a somewhat more complex mechanism than that outlined by Bowen.3a Unlike acenaphthene and alkyl-substituted naphthalenes, acenaphthylene is weakly, if at all, fluorescent3b and has an absorption tail which extends far into the visible. The dimer, cyclobuta(l,2-a:3,4-a')diacenaphthylene, exists in two stereoisomeric forms. In 0 2-saturated solutions, the product of photodimerization is exclusively the cis form, but in the absence of 0 2 a mixture of the isomers is formed, low concentration favoring the trans isomer. The dimers are efficiently photodissociated, reforming acenaphthylene. If light of wavelength longer than 350 m/x is used, dimerization only is observed, since the dimers do not absorb in this region. B y the use of shorter wavelengths (e.g., 254 m p) and dilute solutions of a dimer, the dimerization may be neglected relative to photodissociation, since the quantum yield of dimerization is small for dilute solutions (less than 0 . 0 1 for concentrations smaller than 0.05 M ) and the yield for photodissociation is about one and independent of concentration. The use of ultraviolet light and of moderately concen
trated solutions results in a steady state, in which the concentrations of dimer and monomer are comparable.
Methods and MaterialsM aterials. The acenaphthylene was a K and K
product. Before use, it was thrice recrystallized from methanol and then passed through a silica gel column using hexane as the elutant. This material has a melting point of 92-93°. In an alternative method of purification, the cis dimer was prepared photochemi- cally, recrystallized, and then converted to acenaphthylene photochemically.
The solvents were either of analytical reagent or spectrograde and were used without further purification.
The samples of the dimers which were prepared photochemically were freed from unchanged acenaphthylene by washing with hexane on an alumina column. They were separated by recrystallization from methanol, in which the trans is much less soluble than the cis dimer. The melting points of these samples of trans and cis dimers were 305 and 234°,2 respectively.
D eterm ination o f Quantum Yields. The number of
(1) This work was sponsored by the U. S. Arm y Research Office (Durham ). K . S. W . wishes also to express his gratitude for a fellowship from E. I. du Pont de Nemours Co.(2) K . Dziewonski and G. Rapalski, Chem. B er., 45, 2491 (1912); 46, 1986 (1913); 47, 1679 (1914).(3) (a) E. J. Bowen and J. M arsh, J . Chem. Soc., 109 (1947); (b) E. J. Bowen, Advan. P hotochem ., 1, 36 (1963).
Volume 71, Number 8 February 1967
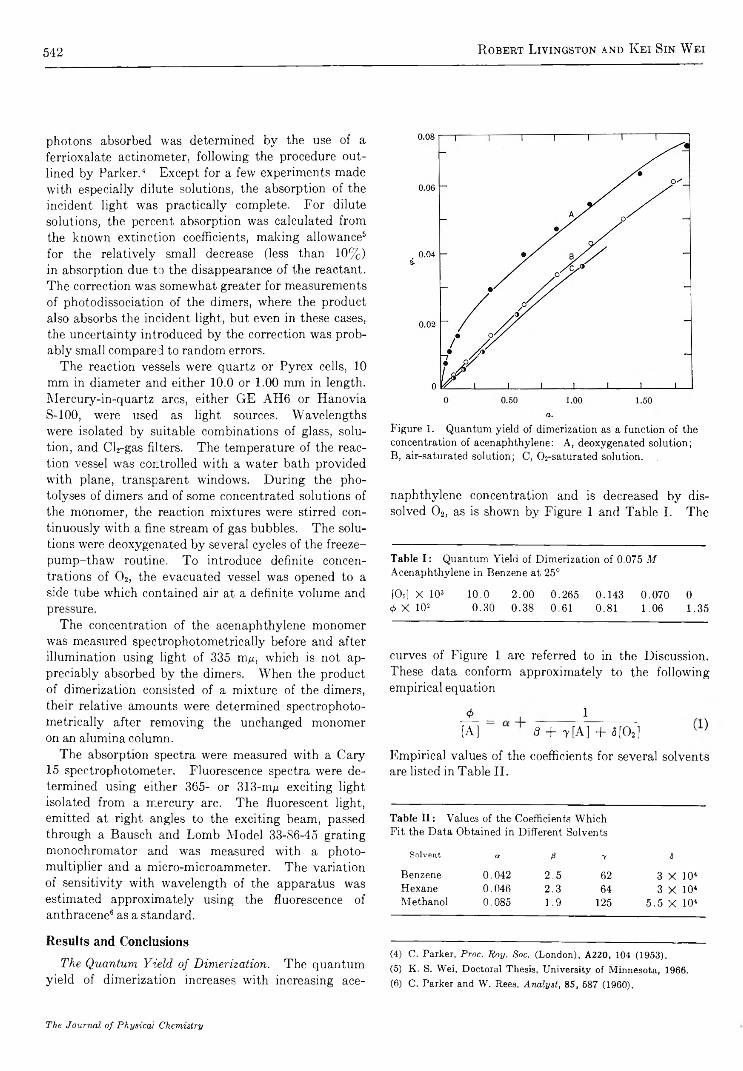
542 R obert Livingston and K ei Sin W ei
photons absorbed was determined by the use of a ferrioxalate actinometer, following the procedure outlined by Parker. 4 5 Except for a few experiments made with especially dilute solutions, the absorption of the incident light was practically complete. For dilute solutions, the percent absorption was calculated from the known extinction coefficients, making allowance6
for the relatively small decrease (less than 1 0 %) in absorption due to the disappearance of the reactant. The correction was somewhat greater for measurements of photodissociation of the dimers, where the product also absorbs the incident light, but even in these cases, the uncertainty introduced by the correction was probably small compared to random errors.
The reaction vessels were quartz or Pyrex cells, 10 mm in diameter and either 1 0 . 0 or 1 . 0 0 mm in length. Mercury-in-quartz arcs, either G E AH 6 or HanoviaS-100, were used as light sources. Wavelengths were isolated by suitable combinations of glass, solution, and Ck-gas filters. The temperature of the reaction vessel was controlled with a water bath provided with plane, transparent windows. During the pho- tolyses of dimers and of some concentrated solutions of the monomer, the reaction mixtures were stirred continuously with a fine stream of gas bubbles. The solutions were deoxygenated by several cycles of the freeze- pump-thaw routine. To introduce definite concentrations of 0 2, the evacuated vessel was opened to a side tube which contained air at a definite volume and pressure.
The concentration of the acenaphthylene monomer was measured spectrophotometrically before and after illumination using light of 335 m^, which is not appreciably absorbed by the dimers. When the product of dimerization consisted of a mixture of the dimers, their relative amounts were determined spectrophotometrically after removing the unchanged monomer on an alumina column.
The absorption spectra were measured with a Cary 15 spectrophotometer. Fluorescence spectra were determined using either 365- or 313-niyu exciting light isolated from a mercury arc. The fluorescent light, emitted at right angles to the exciting beam, passed through a Bausch and Lomb Model 33-86-45 grating monochromator and was measured with a photomultiplier and a micro-microammeter. The variation of sensitivity with wavelength of the apparatus was estimated approximately using the fluorescence of anthracene6 as a standard.
Results and Conclusions
The Q uantum Y ield o f D im erization . The quantum yield of dimerization increases with increasing ace-
F i g u r e 1 . Q u a n t u m y i e l d o f d i m e r i z a t i o n a s a f u n c t i o n o f t h e c o n c e n t r a t i o n o f a c e n a p h t h y l e n e : A , d e o x y g e n a t e d s o l u t i o n ;B , a i r - s a t u r a t e d s o l u t i o n ; C , C h - s a t u r a t e d s o l u t i o n .
naphthylene concentration and is decreased by dissolved 0 2, as is shown by Figure 1 and Table I. The
Table I : Q u a n t u m Y i e l d o f D i m e r i z a t i o n o f 0 . 0 7 5 M A c e n a p h t h y l e n e i n B e n z e n e a t 2 5 °
[ O a ] X 1 0 3 1 0 . 0 2 . 0 0 0 . 2 6 5 0 . 1 4 3 0 . 0 7 0 0<t> X 1 0 2 0 . 3 0 0 . 3 8 0 . 6 1 0 . 8 1 1 . 0 6 1 . 3 5
curves of Figure 1 are referred to in the Discussion. These data conform approximately to the following empirical equation
J>_ = 1
[A] d + 7 [A] + 5[02] ^
Empirical values of the coefficients for several solvents are listed in Table II.
Table I I : V a l u e s o f t h e C o e f f i c i e n t s W h i c h F i t t h e D a t a O b t a i n e d i n D i f f e r e n t S o l v e n t s
Solvent a. ß 7 ä
B e n z e n e 0 . 0 4 2 2 . 5 6 2 3 X 1 0 4H e x a n e 0 . 0 4 6 2 . 3 6 4 3 X 1 0 *M e t h a n o l 0 .0 8 5 1 . 9 1 2 5 5 . 5 X 1 0 4
(4) C. Parker, P roc. R oy. Soc. (London), A220, 104 (1953).(5) K. S. W ei, D octoral Thesis, University of M innesota, 1966.(6) C. Parker and W . Rees, A nalyst, 8 5 , 587 (1960).
The Journal of Physical Chemistry

R eversible Photochemical D imerization of A cenaphthylene 543
A few measurements of the quantum yield which were made in other solvents, at 25° in air-saturated solutions, are summarized in Table III .
Table III : Q uantum Y ields o f D im erization in O ther Solvents
----------------------------------- Solvent-----------------------------------s[A],
moles/1. TolueneEthylether Ethanol CCI.
0 .1 0 0 .0 0 6 0 .0 0 5 0 .011 0 .0 0 60 .4 0 0 .0 21 0 .0 1 7 0 .0 4 2 0 .0 2 20 .8 0 0 .0 5 3 0 .0 4 2 0 .0 5 4
The addition of water to methanol increases the quantum yield, as is shown in the following table. The measurements were made at 25° with air-saturated solutions, using 0.025 M acenaphthylene.
Table IV : E ffect o f A dd ed W ater on the Q uantum Y ie ld in M ethan ol
M o le % 0 1 1 .0 2 0 .0 2 8 .5 3 5 .5 4 2 .54> X 103 2 .0 0 2 .3 3 2 .6 5 3 .1 0 4 .0 5 5 .2 5
The effect of temperature on the quantum yield is relatively small and depends upon the concentration of 0 2 and, in deoxygenated solutions, to a lesser extent on the concentration of acenaphthylene. For reasons of experimental convenience, toluene rather than benzene was the solvent in these experiments. In the air-free solutions, the concentration of acenaphthylene was 0.020 M ; in the air-saturated solutions, it was 0.20 M . These data conform closely to the Arrhenius relation. The energy of activation is 1200 ± 7 5 cal/mole for air-free solutions, and has the negative value, —600 ± 50 cal/mole, for air-saturated solutions.
Table V : Q uantum Y ields as a F u n ction o f T em perature inA ir-Free and A ir-Saturated Solutions in T olu en e
0« 42° 90°
A ir saturated 1 .1 0 X 1 0 ~ 2 9 .6 X 1 0 '1 8 .3 X 10~3D eoxygen ated 6 .5 X 10 “ 3 8 .5 X 10~s 1 .1 2 X 1 0 ~1
To test for a possible effect of solvent viscosity on the quantum yield, comparable measurements were made in n-hexane (r? = 0.374 cp at 17 °) and in cyclohexane (n = 1.02 cp at 17°). In 0.20 M air-saturated solutions,
the yields were 0.0125 and 0.0120—identical within the limits of uncertainty. In air-free solutions, the yields in normal and cyclohexane were, respectively, 0.0235 and 0.0156 at 0.20 M and 0.075 and 0.0048 at 0.020 M .
The quantum yield of dimerization was measured (in a 0.20 M air-saturated solution in benzene) using light intensities ranging from 2 X 10 ~ 7 to 3 X 10 - 6
einstein/cm2 sec. Within the limit of uncertainty, which was about ± 4 % , the measured values were independent of the intensity.
From 4360 to 2537 A the quantum yield of dimerization appears to be independent of the wavelength of the actinic light. These experiments were made using 0.05 M acenaphthylene dissolved in air-free cyclohexane at 25°. The yields using separately 4360 and 3660 A were determined by direct comparison to the ferrioxalate actinometer. Direct measurements of the yields were not practicable when light of 3130 or 2537 A was used, since both monomer and dimer absorb strongly in this region. The yields in this range were determined from measurements of the steady-state concentrations, utilizing the directly measured value of the yield of photodissociation and the extinction coefficients of monomer and dimer. The values obtained, in order of decreasing wavelength, are 0.0032, 0.0030, 0.0033, and 0.0033; the average errors of single values, based upon eight measurements at each wavelength, ranged from 3% at 4300 A to 6 % at 2537 A. In some cases (e.g., the data of Table I), relative quantum yields were determined using the radiation from a G E AH 6 mercury arc after it passed through a glass filter which absorbed wavelengths shorter than 3400 A.
S pectroscopic and Related D ata. The absorption spectrum of acenaphthylene in solution has a relatively sharp peak at 322 m/i (log e 4.0) and a stronger absorption on the short-wavelength side of 230 m^. Unlike acenaphthene and alkyl-substituted naphthalenes, its absorption extends weakly to long wavelengths, at least to 500 m/x (see Figure 2 ). This long-wave- length tail was not affected by careful purification (including preparation by photodissociation of a purified sample of the dimer). This fact and the persistence of the vibrational structure to about 470 m y indicate that the weak tail is an intrinsic property of acenaphthylene rather than being due to a persistent impurity. The use of methanol rather than hexane as the solvent has little effect on the absorption spectra; the maxima are not appreciably shifted, although the vibrational structure appears to be somewhat less sharp in methanol. In benzene, the extinction coefficients of acenaphthylene appeared to be independent of concentra-
Volume 71, Number S February 1967

544 R obert Livingston and K ei Sin W ei
Figure 2. A bsorption spectrurr, o f acenaphthylene in n-hexane: A , 8.S X 1 0 -5 M ; B , 2.35 X lO “ 3 M ; C, 7.0 X lO “ 3 M .
tion, in the range 10 ~ 3 to 1.5 M . A quartz cell with adjustable optica, path (1 .0 0 - 0 . 0 1 0 mm) was employed in these measurements. In an attempt to learn whether the weak tail corresponded to a singlet-triplet transition, the absorption spectrum was measured in CH2- Br2. There was no marked enhancement of the weak absorption.
It has been reported313 that acenaphthylene is non- fluorescent. Our samples of the purified material exhibited a weak fluorescence, extending from about 420 to 5S0 npu, with a maximum at 500 mju. A crude comparison of the intensity of the fluorescence of 1 0 ~ 4
M acenaphthylene in hexane to a dilute alkaline solution of fluorescein indicated that the quantum yield of fluorescence is about 0.001. It is difficult to establish that such weak fluorescence is not due to a trace of a strongly fluorescent impurity. However, the fluorescence could not be due to the most likely contaminant, acenaphthene, since its fluorescence maximum is at about 335 m^. Measurements7 with a phase-shift apparatus on a deaerated hexane solution, about 1 0 ~ 6 M solution of acenaphthylene, indicated a mean lifetime of about 5 X 10 ~ 9 sec.
Since acenaphthylene is practically photochemically stable in dilute solution ( < 10 - 3 M ) and is almost non- fluorescent,8b it was anticipated that it would exhibit a transient (triplet-triplet?) absorption when studied with flash photolytic apparatus. Using carefully deoxygenated solutions in hexane at concentrations from 10 - 5 to 10 - 4 M , no absorption transients were observed in the range between 380 and 600 m/x. Our apparatus8 should have detected transients with mean lifetimes equal to or greater than 2 0 tisec.
The absorption spectrum of purified samples of the cis and trans dimers were measured in n-hexane and are plotted on Figure 3. It is noteworthy that the area under the long-wavelength band is much less for the cis than for the trans dimer.
Figure 3. A bsorption spectra o f trans and cis dim ers o f acenaphthylene in n-hexane.
Relative Y ields o f cis and trans D im ers. The relative amounts of cis and trans forms in a mixture can be determined spectrophotometrically, conveniently, by measuring the optical densities at 312.5 and 298 m¡x. However, most experiments were terminated when about 1 0 % of the monomer had reacted and the absorption of the remaining monomer masked that of the dimers. To eliminate this difficulty, the monomer was separated from the mixture of dimers on an alumina column. The dimers were then eluted with acetone and their relative amounts determined spectrophotometrically. This analytical method was checked using solutions containing known amounts of the pure compounds.
In air-saturated solutions, the photochemical product is practically the pure cis dimer, but in air-free solutions, it is a mixture of the two dimers, their relative amounts being determined by the solvent and by the concentration of the monomer. The mole per cent of cis dimer formed in deoxygenated solutions is shown on Figure 4. Curve C of this figure is referred to in the Discussion.
Photodissociation o f the D im ers. The dimers are efficiently photodissociated into monomeric acenaphthylene when they are illuminated with ultraviolet light. B y using dilute solutions (10 ~ 3 to 2 X 10 ~ 6 M ),
(7) W e are indebted to R . Lum ry and M . Walker, Biophysical Laboratory, School of Chemistry, University of M innesota, for these measurements.(8) K .-H . Grellmann, R . M emming, and R . Livingston, J . Am . Chem .Soc., 84, 546 (1962).
The Journal of Physical Chemistry
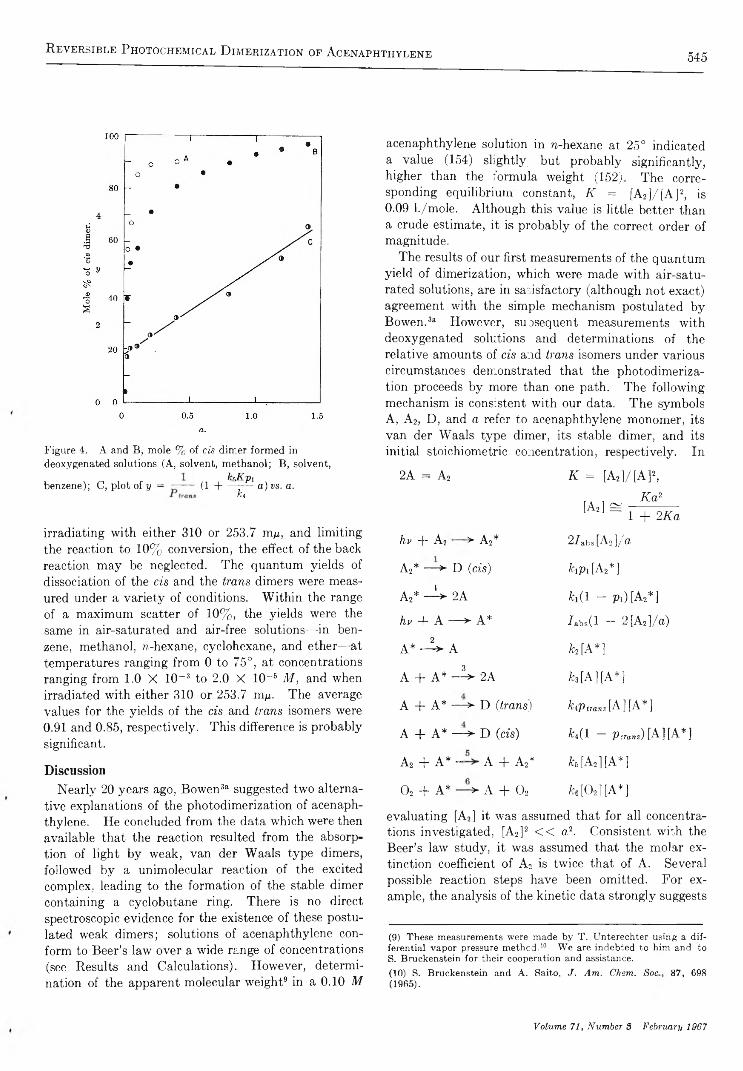
R eversible Photochemical D imerization of Acenaphthylene 545
Figure 4. A and B, m ole % o f cis dim er form ed in deoxygenated solutions (A , solvent, m ethan ol; B , solvent,
benzene); C , p lo t o f y = —— k-JCpi(1 H-----;— a ) vs. a.
ki
irradiating with either 310 or 253.7 m p, and limiting the reaction to 1 0 % conversion, the effect of the back reaction may be neglected. The quantum yields of dissociation of the cis and the trans dimers were measured under a variety of conditions. Within the range of a maximum scatter of 1 0 %, the yields were the same in air-saturated and air-free solutions—in benzene, methanol, n-hexane, cyclohexane, and ether—at temperatures ranging from 0 to 75°, at concentrations ranging from 1.0 X 10 - 3 to 2.0 X 10 ~ 5 M , and when irradiated with either 310 or 253.7 m/u. The average values for the yields of the cis and trans isomers were 0.91 and 0.85, respectively. This difference is probably significant.
DiscussionNearly 20 years ago, BowenSa suggested two alterna
tive explanations of the photodimerization of acenaphthylene. He concluded from the data which were then available that the reaction resulted from the absorption of light by weak, van der Waals type dimers, followed by a unimolecular reaction of the excited complex, leading to the formation of the stable dimer containing a cyclobutane ring. There is no direct spectroscopic evidence for the existence of these postulated weak dimers; solutions of acenaphthylene conform to Beer’s law over a wide range of concentrations (see Results and Calculations). However, determination of the apparent molecular weight9 in a 0.10 M
acenaphthylene solution in n-hexane at 25° indicated a value (154) slightly, but probably significantly, higher than the formula weight (152). The corresponding equilibrium constant, K = [A2]/[A]2, is0.09 l./mole. Although this value is little better than a crude estimate, it is probably of the correct order of magnitude.
The results of our first measurements of the quantum yield of dimerization, which were made with air-saturated solutions, are in satisfactory (although not exact) agreement with the simple mechanism postulated by Bowen.8a However, subsequent measurements with deoxygenated solutions and determinations of the relative amounts of cis and trans isomers under various circumstances demonstrated that the photodimerization proceeds by more than one path. The following mechanism is consistent with our data. The symbols A, A2, D, and a refer to acenaphthylene monomer, its van der Waals type dimer, its stable dimer, and its initial stoichiometric concentration, respectively. In
2A = A2
h v -f- A 2 • > A2*
A2* -—> D (cis)
A2* —U- 2A
h v + A — > A*2
A* — > A
A + A* - V 2A
A + A* — > D (trans)
A + A* — > D (cis)
A2 + A* — A + A2*
0 2 -f- A* > A + Oa
K = [A2 ]/ [A]2,
[Aa] SA a 2
1 -)- 2 K a
2/abs [Aa \/a
M A , * ]
h ( l - Pi) [Aa*]
7abS(l - 2[Aa]/a)
M A *]
h [A] [A*]
M w JA ] [ A * ]
/c4(l - p t r a n s ) [A] [A*]
M A 2][A*]
MOa][A*]
evaluating [A2] it was assumed that for all concentrations investigated, [A2 ] 2 < < a2. Consistent with the Beer’s law study, it was assumed that the molar extinction coefficient of A2 is twice that of A. Several possible reaction steps have been omitted. For example, the analysis of the kinetic data strongly suggests
(9) These measurements were made by T . Unterechter using a differential vapor pressure m ethod.10 W e are indebted to him and to S. Bruckenstein for their cooperation and assistance.(10) S. Bruckenstein and A. Saito, J . Am. Chem. S o c 87, 698 (1965).
Volume 71, Number S February 1967
546 R obert L ivingston and K ei Sin W ei
that the quenching of A2* by 0 2 is negligible, even in 0 2-saturated solutions, presumably because the mean lifetime of A2* is very short (< 10 - 1 0 sec). Making the usual steady-state approximation and tentatively neglecting step 5 (the transfer of energy of excitation), it follows that
= r V 2 K a { 2 K p i +
]'i
k2 -f- Jcq [0 2] -f- (2 k2K -j- lc% -)- ki -f- 2Kk$\02])a
Comparison of this equation with the data indicates that in 0 2-saturated solutions (and approximately in air-saturated solutions) the second term is of negligible importance and
<fc(0 2 satd) =2 K p xa
1 + 2 K a(3)
The three curves of Figure 1 are plots of the relation
a<t> d — 1 -f- 0.17a
0.0495 +
0.0180.0486 + a + 1.7 X 10 3 [O2] (4)
which is consistent with eq 2 . The factor 0.17 = 2 K corresponds to K = 0.085, in fortuitous agreement with the value obtained from the vapor pressure measurements. The corresponding value of p x, the probability that the excitation of A 2 will lead to the formation of D, is 0.29. Comparing eq 2 and 4, it follows that k6/k2 = 4 X 10 4 M ~ l and k6/kt = 105. Since k6 ^ 10 10 M ~ l sec- 1 , it follows that fe2 <C 2.5 X 10⁵ sec- 1 . This value is incompatible with the measured mean life, 5 X 10 - 9
sec, of fluorescence, indicating either that the photo- chemically active state is a relatively short-lived triplet or that the observed fluorescence is due to a persistent impurity. The observation reported by Schenck and Wclgast, 1 1 that Rosebengal sensitizes the dimerization of acenaphthylene in air-free methanol to light of 590 mg, yielding 65% of the trans isomer, appears to be consistent with the postulate that the excited monomer is a triplet state. A similar step in the mechanism of the photodimerization of coumarin was suggested by Hammond, et a l.12
Additional important information on the reaction mechanism can be obtained from a study of the effects of 0 2 and acenaphthylene concentrations upon the relative amounts of cis and trans dimers formed. In 0 2 or air-saturated solutions, the product appears to be exclusively the cis isomer, indicating that step 1 yields only this product. In air-free solutions, a mixture of
the isomers is formed, high concentrations favoring the production of the cis compound (Figure 4). It seems very probable that the relative amount of cis isomer formed by step 4 will be independent of the monomer concentration. Setting p lrans equal to the molar proportion of the trans compound formed in this way and introducing step 5 into the mechanism, the following expressions are obtained for the total quantum yield and for the quantum yield of the trans dimer, both in the absence of 0 2.
4> d — 1 + 2 K a
2 K p i +
X
h K p ia + /<4A’2 -)- (2k>,K -\- kz -{- kA)a -j- k^Ka2 J
(5)
4>v,t 1 + 2 K aX
P tr a n s k i
k2 -{- (2k2K -{- kz -|- ki)a -j- kxK a 2(6 )
It follows that
2 K p xa
4)0 ~ 1 + 2K a 1 ^ , h K P l \ _y = ----- --------------= - — ( 1 + ~ r ~ a ) (7)
tyl), trans Ptrans\ &4 /
A plot of the function y against a (Figure 4) is a straight line with a slope of 2.6 l./mole and an intercept of 1.40; i.e ., Pimns = 0.71. Combining these data with the value K p x = 0.0248, we obtain /c6/fc4 = 7.5. To be consistent, an equation corresponding to eq 5 but containing the 0 2 terms, rather than eq 2 , should have been fitted to the data of Figure 1. However, it is apparent that such an equation, which is similar to eq 2 but contains an additional adjustable constant, would be consistent with the data. For high concentrations of 0 2, both equations reduce to eq 3 and therefore yield the same values of K and p 1. Substitution of the complete equation for eq 2 would change the values of ke/lc4 and ke/k2. However, these changes should not be great, since keK p ia does not exceed fc4/ 5
even for high values of a.The effects of temperature (Table V) are consistent
with the mechanism. For air-saturated solutions where dimerization is due chiefly to step 1 , temperature can affect only K p i. The observed small negative “ energy of activation” suggests that p x is not noticeably affected by temperature, since the molar enthalpy of formation of A 2 should have a small negative value.3a For dilute
(11) G. Schenck and R . Wolgast, N aturwissenschaften, 49 , 36 (1962).(12) G. Hammond, C. Stout, and A. Lamola, J. A m . Chem. Soc., 86, 3103 (1964).
The Journal of Physical Chemistry
R eversible Photochemical D imerization of A cenaphthylene 547
air-free solutions, the principal effect of changing temperature should be on fc4/fc2. It is postulated in the mechanism that step 4 (like steps 3, 5, and 6 ) is an efficient bimolecular reaction whose rate is probably limited by diffusion. Step 2 is chiefly a nonradiative transition; as such, it may be temperature dependent. Accordingly, the energy of activation of k i/ k2 should be equal to or less than the value calculated from the variation of viscosity with temperature. The experimental values are AH „ (for toluene) = 2 . 1 kcal/mole and L±n± ki/k, = 1 .2 kcal/mole.
The mechanism also implies that the quantum yield of the reaction in 0 2-saturated solutions should be independent of viscosity, but for the reaction in 0 2-free solutions it should decrease with increasing viscosity. The results of measurements in w-hexane and cyclohexane are consistent with these predictions.
Substitution of an alcohol for a hydrocarbon solvent (Table III) or addition of water to methanol13 (TableIV) increases the quantum yield for an air-saturated solution and therefore K p i. This change is probably due to an increase in K .
The two acenaphthylene molecules which constitute the weak complex, A2, are presumably held together by the dispersion forces between the it electrons of the naphthalene rings. If the two external double bonds occur at the same end of the complex, electronic excitation could lead directly to the formation of the cis but not the trans dimer. I f the external double bonds are at opposite ends of the complex, photodimerization would not be expected to occur. This crude analysis is consistent with the observation that step
1 leads exclusively to the formation of the cis dimer with a probability pi = 0.29. It is not obvious what fraction of the reactions involving the excited monomer, step 4, should result in the formation of the cis dimer. The corresponding experimental quantity, 1 — p tmns, is 0.29.
Step 5 was introduced into the mechanism to render it consistent with the observed cis-tran s ratio of the dimers in air-free solutions. This is by no means the only possible interpretation of the data. Indeed, the equation derived from this mechanism is not compatible with a few results obtained in very dilute solutions (4% cis dimer formed in 0.0018 M solution). An alternative explanation8 could be based on the postulate that two different excited states, A* and A ', are intermediates in the reaction. I f it be further assumed that the intrinsic lifetime of A ' is greater than that of A* and that A ' leads exclusively to the trans dimer, the amended mechanism is consistent with all of the available data. A systematic study of the photosensitized reaction may be of help to distinguish between these alternative mechanisms.
No direct c is -trans isomerization of the dimers was observed. However, ultraviolet radiation of moderately concentrated solutions should lead to stereoisomerization by way of photodissociation followed by photodimerization. This indirect isomerization should be most efficient if trans dimers were illuminated in an air-saturated solution.
(13) K . Uberreiter and K . Jonder, Makromol. Chem., 40, 97 (1960).
Volume 71 f Number 8 February 1967

548 K ei Sin W ei and R obert Livingston
Reversible Photochemical Dimerization of Acenaphthylene. II. The
Reaction in the Molten and Crystalline Phase1 2
by Kei Sin Wei and Robert Livingston
D ivision o f P hysica l C hem istry, U niversity o f M innesota , M in neapolis , M innesota (Received Ju ly 5, 1966)
Between 0 and 25° the photodimerization of crystalline acenaphthylene is inefficient (<p < 0.005) and the only product is the trans isomer. Above 60°, the cis isomer is the dominant product, and the yield increases rapidly with increasing temperature, reaching 0.04 at 70°. Illumination of molten acenaphthylene produces both the cis dimer and a polymer. The quantum yield of dimerization is 0.20 at 90°.
Photochemical reactions of both crystalline211 and molten2b acenaphthylene have been reported. In the present study we have confirmed the published qualitative results and have determined the quantum yields under several different conditions.
Materials and Methods
The methods and materials were similar to those described in part I of this study. 3 A few special techniques are described in the following sections.
D im erization and P olym erization in the M olten State. Illumination of the melt produces the cis dimer, a polymer, and traces of a yellow substance which was not identified. No trans dimer was detected in the products.
The melt, contained in Pyrex cylinders about 1.0 mm thick, was exposed to light of 436 mg, which was isolated from the radiation of an AH 6 mercury arc. The measurements were made at 90°. This is 2° below the melting point of acenaphthylene, but at this temperature the supercooled melt did not crystallize spontaneously. In comparing this photochemical reaction to the actinometer, 4 it was assumed that the melt absorbed all of the light incident upon it.
The polymer was separated from the dimer and unchanged monomer by treating the mixture with an excess of methanol. The polymer is insoluble in methanol; it was filtered out of the solution, washed, dried, and weighed. The remaining mixture was transferred to n-hexane, and the dimer was washed free from the monomer with n-hexine on an alumina column. 3
The average of eight determinations of the quantum
yield of dimerization is 0.20 ± 0.02. A comparison of these results with those obtained in solution indicates that this dimerization is due to excitation of the van der Waals dimers, step 1 of the proposed mechanism. 3
The corresponding quantum yield of polymerization, expressed in terms of disappearance of the monomer, is 0.14 ± 0.01. The average molecular weight of the polymer formed by a thermal, induced reaction is reported213 to be about 2 X 10⁴. If the molecular weight of the photopolymer is of the same order of magnitude, the photoinitiation of polymerization is very inefficient at 90°. Presumably, radicals are formed by a side reaction of the excited monomer molecules— an inefficient and temperature-dependent process.
The ultraviolet spectrum (Figure 1) of the photopolymer, dissolved in CCb, was compared to that of a sample of polymer which was prepared by a thermal reaction initiated by benzoyl peroxide.2b The spectra, normalized at 300 mg, were identical.
D im erization o f Crystalline A cenaphthylene. Crystalline acenaphthylene was photolyzed in the form of thin layers of fine crystals. These layers were deposited on the inner surface of a window of a Pyrex cell by evaporating the hexane from a solution of acenaphthy-
(1) This work was sponsored by the U. S. Arm y Research Office (Durham ). K . S. W . wishes also to express his gratitude for a fellowship from the E. I. du Pont de Nemours Co.(2) (a) K . Dziewonski and G. Rapalski, Chem. B er., 45, 2491 (1912); 46, 1986 (1913); 47, 1679 (1914) ; (b) K . Überreiter and K . Jonder, M akrom ol. Chem., 40, 97 (1960).(3) R. Livingston and K. S. Wei, J . P h ys. Chem., 71 , 541 (1967).(4) C. Parker, P roc. R oy. Soc. (London), A220, 104 (1953).
The Journal of Physical Chemistry
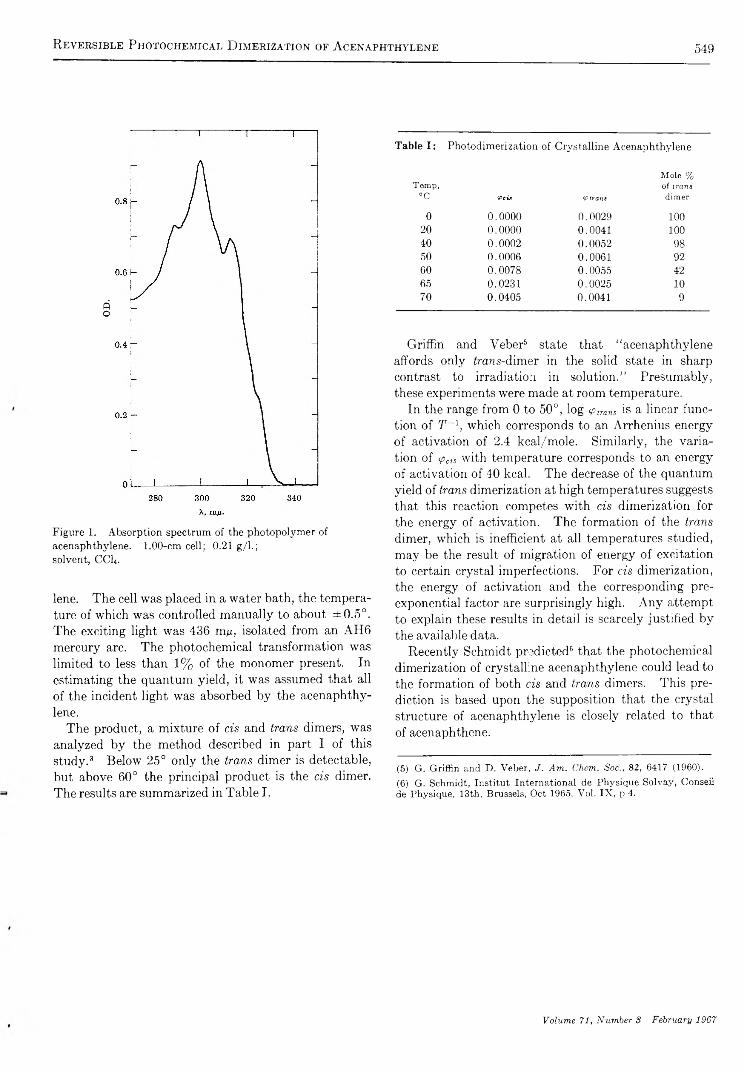
R eversible Photochemical D imerization of A cenaphthylene 549
Figure 1. A bsorption spectrum of the ph otop olym er of acenaphthylene. 1 .00-cm cell; 0.21 g /1 .; solvent, CCI4.
lene. The cell was placed in a water bath, the temperature of which was controlled manually to about ±0 .5°. The exciting light was 436 mp, isolated from an AH6
mercury arc. The photochemical transformation was limited to less than 1% of the monomer present. In estimating the quantum yield, it was assumed that all of the incident light was absorbed by the acenaphthylene.
The product, a mixture of cis and trans dimers, was analyzed by the method described in part I of this study. 3 Below 25° only the trans dimer is detectable, but above 60° the principal product is the cis dimer. The results are summarized in Table I.
T ab le I : P h otod im erization o f C rystalline A cenaphthylene
Temp,°C <Pci* <P trans
Mole % of trans dimer
0 0.0000 0.0029 1 0 0
2 0 0.0000 0.0041 1 0 0
40 0.0002 0.0052 9850 0.0006 0.0061 9260 0.0078 0.0055 4265 0.0231 0.0025 1070 0.0405 0.0041 9
Griffin and Yeber5 6 state that “ acenaphthylene affords only trans-dimer in the solid state in sharp contrast to irradiation in solution.” Presumably, these experiments were made at room temperature.
In the range from 0 to 50°, log <ptrans is a linear function of 71- 1, which corresponds to an Arrhenius energy of activation of 2.4 kcal/mole. Similarly, the variation of ipas with temperature corresponds to an energy of activation of 40 kcal. The decrease of the quantum yield of trans dimerization at high temperatures suggests that this reaction competes with cis dimerization for the energy of activation. The formation of the trans dimer, which is inefficient at all temperatures studied, may be the result of migration of energy of excitation to certain crystal imperfections. For cis dimerization, the energy of activation and the corresponding preexponential factor are surprisingly high. Any attempt to explain these results in detail is scarcely justified by the available data.
Recently Schmidt predicted6 that the photochemical dimerization of crystalline acenaphthylene could lead to the formation of both cis and trans dimers. This prediction is based upon the supposition that the crystal structure of acenaphthylene is closely related to that of acenaphthene.
(5) G. Griffin and D. Veber, J. A m . Chem. Soc., 82, 6417 (1960).(6) G. Schmidt, Institut International de Physique Solvay, Conseil de Physique, 13th, Brussels, Oct 1965, Vol. IX , p 4.
Volume 71, Number 3 February 1967

550 R. J. Atkinson, A. M. Posner, and J. P. Quirk
Adsorption of Potential-Determining Ions at the Ferric
Oxide-Aqueous Electrolyte Interface
by R. J. Atkinson, A. M . Posner, and J. P. Quirk
Departm ent o f S oil Science and P lant N utrition , Institute o f Agriculture, U niversity o f W estern A ustralia , Nedlands, W estern A u stralia {Received J u ly 6, 1966 )
Potentiometric titrations in indifferent aqueous electrolyte were used to measure the surface charge characteristics of microcrystalline particles of ferric oxides. The net adsorption density ( rH + — r 0 H- microequivalents per gram) is described by equations for the surface excesses of H+ and OH- , derived by equating the electrochemical potentials of potential-determining ions and indifferent counterions in solution and surface phases, and neglecting counterions in the diffuse layer. The equations contain interaction constants arising from the small but finite distances of separation between planes of adsorbed potential-determining ions and indifferent counterions under conditions of ferric ion solvation at the interface. The B E T nitrogen area does not satisfactorily represent the dependence of parameters and interaction constants on particle surface area, for different preparations. The equations were interpreted as showing that adsorbed counterions remain solvated, forming electrostatically bound ion pairs with only a small proportion dissociating into the diffuse layer.
Solid oxide particles immersed in aqueous electrolyte solutions develop surface electrical charges by adsorption or desorption of potential-determining ions. For ferric oxide, 1 - 6 these ions are H+ and OH- , and ferric hydroxo complex ions derived from the solid phase by dissolution, when any ions which are specifically adsorbed at the oxide surface are absent. The contribution made to surface charge by transfer of metal hydroxo complex ions across the interface is usually considered to be very small in relation to H + and OH - ion transfer, since solubility data3 -6 show that either H+ or OH- ions always greatly exceed ferric hydroxo complex ion in solution concentration for the pH range 3.5 to 1 1 . Surface charge measurement thus requires only acsorption-desorption measurements for H+, which are readily carried out by the direct method of potentiometric titration of microcrystalline particles of oxide in dilute aqueous suspension using various ionic strengths of an indifferent electrolyte. 3’ 4
From such measurements, it is known that ferric oxide- aqueous electrolyte interfaces have important differences in double-layer structure and the magnitude of electrical properties when compared with Agl, Ag2S,
or liquid mercury in contact with aqueous electrolyte. 3 -6
Quantitative interpretation has not been attempted, and in previous publications the ferric oxide system has been characterized only by measurements of the pH at the zero point of charge.
In this paper, equations to describe potential-determining ion binding are derived for ferric oxides in aqueous suspension under conditions of high ionic strength of indifferent electrolyte. The form of analysis was suggested by the ideas of Gilbert and Rideal6
on the titration of fibrous proteins. Two simple methods of eliminating electrical potential terms from ion-binding equations are examined, and it is found that the more satisfactory method does not require one to 1 2 3 4 5 6
(1) G. A. Parks, Chem. Rev., 65, 177 (1965).(2) P. G. Johansen and A . S. Buchanan, A ustralian J . Chem., 10, 392 (1957).(3) G. A . Parks and P. L . de Bruyn, J . P h ys . Chem ., 66, 967 (1962).(4) A . E. Albrethson, P h.D . Thesis, Massachusetts Institute of Technology, 1963.(5) G. Y . Onoda and P. L. de Bruyn, Surface Sci., 4, 48 (1966).(6) G. A . Gilbert and E. K . Rideal, P roc. R oy . Soc. (London), A 182, 335 (1944).
The Journal of Physical Chemistry
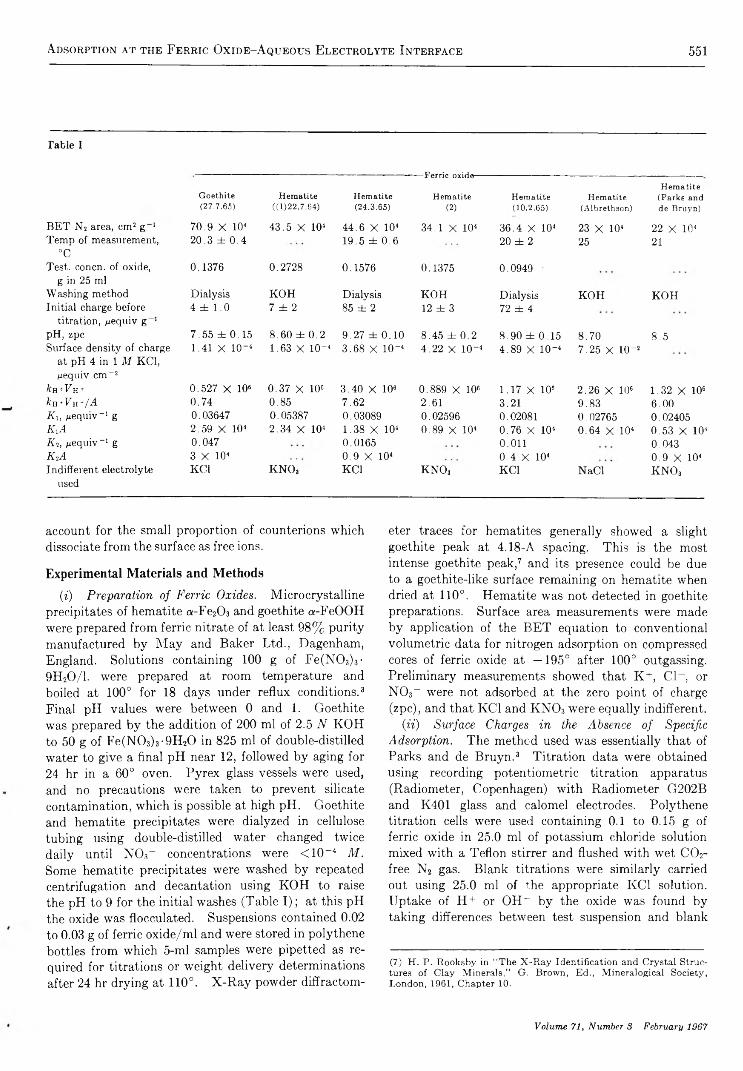
Â.DSORPTION AT THE FERRIC Ox IDE-AqUEOUS ELECTROLYTE INTERFACE 551
Table I
B E T N 2 area, cm 2 g 1
Goethite(27.7.65)
7 0 .9 X 104T em p o f m easurem ent, 2 0 .3 ± 0 .4
°CT est, ooncn. o f oxide, 0 .1376
g in 25 mlW ashing m ethod D ialysisInitial charge before 4 ± 1 .0
titration, ^equiv g 1pH , zpc 7 .5 5 ± 0 .1 5Surface density o f charge 1.41 X 10~4
at pH 4 in 1 M KC1, nequiv c m -2
^h +Th + 0 .5 2 7 X 10«ks+ V s+fA 0 .7 4K i, juequiv-1 g 0 .03647Ki A 2 .5 9 X 10⁴K ì, p eq u iv -1 g 0 .0 4 7KiA 3 X 10⁴Indifferent electrolyte KC1
used
-Ferric oxide
Hematite Hematite Hematite((1)22.7.64) (24.3.65) (2)
4 3 .5 X 104 4 4 .6 X 104 1 9 .5 ± 0 .6
3 4 .1 X 104
0 .2728 0 .1 57 6 0 .1375
K O H D ialysis K O H7 ± 2 85 ± 2 12 ± 3
8 .6 0 ± 0 .2 9 .2 7 ± 0 . 1 0 8 .4 5 ± 0 .21 .6 3 X 10“ 4 3 .6 8 X 1 0 “ 4 4 .2 2 X 10~4
0 .3 7 X 10s 3 .4 0 X 10« 0 .8 8 9 X 1060 .8 5 7 .6 2 2 .6 10 .05387 0.03089 0.025962 .3 4 X 10⁴ 1 .3 8 X 10⁴
0 .0165 0 .9 X 104
0 .8 9 X 10⁴
k n o 3 KC1 K N O s
Hematite(10.2.65)
Hematite(Albrethson)
Hematite (Parks and de Bruyn)
3 6 .4 X 104 20 ± 2
23 X 104 25
22 X 104 21
0 .0 94 9 •
D ialysis 72 ± 4
K O H K O H
8 .9 0 ± 0 .1 5 4 .8 9 X 10~4
8 .7 07 .2 5 X IO “ 2
8 .5
1 .1 7 X 10⁶ 2 .2 6 X 10« 1 .3 2 X 1063 .2 1 9 .8 3 6 .0 00.02081 0 .02765 0 .024050 .7 6 X 10⁴ 0 .6 4 X 10⁴ 0 .5 3 X 1040 .011 0 .0 430 .4 X 104 0 .9 X 104KC1 N aC l k n o 3
account for the small proportion of counterions which dissociate from the surface as free ions.
Experimental Materials and Methods
(i) Preparation o f F erric Oxides. Microcrystalline precipitates of hematite a-Fe20 3 and goethite a-FeOOH were prepared from ferric nitrate of at least 98% purity manufactured by M ay and Baker Ltd., Dagenham, England. Solutions containing 100 g of Fe(N 03)3' 9H20/1. were prepared at room temperature and boiled at 1 0 0 ° for 18 days under reflux conditions. 3
Final pH values were between 0 and 1. Goethite was prepared by the addition of 200 ml of 2.5 N KOH to 50 g of Fe(N 0 3)3 -9H20 in 825 ml of double-distilled water to give a final pH near 12, followed by aging for 24 hr in a 60° oven. Pyrex glass vessels were used, and no precautions were taken to prevent silicate contamination, which is possible at high pH. Goethite and hematite precipitates were dialyzed in cellulose tubing using double-distilled water changed twice daily until N 0 3_ concentrations were < 10 “ 4 M . Some hematite precipitates were washed by repeated centrifugation and decantation using KOH to raise the pH to 9 for the initial washes (Table I ) ; at this pH the oxide was flocculated. Suspensions contained 0.02 to 0.03 g of ferric oxide/ml and were stored in polythene bottles from which 5-ml samples were pipetted as required for titrations or weight delivery determinations after 24 hr drying at 110 °. X -R ay powder diffractom
eter traces for hematites generally showed a slight goethite peak at 4.18-A spacing. This is the most intense goethite peak,7 and its presence could be due to a goethite-like surface remaining on hematite when dried at 110 °. Hematite was not detected in goethite preparations. Surface area measurements were made by application of the B E T equation to conventional volumetric data for nitrogen adsorption on compressed cores of ferric oxide at —195° after 100° outgassing. Preliminary measurements showed that K+, CD, or N 0 3“ were not adsorbed at the zero point of charge (zpc), and that KC1 and K N 0 3 were equally indifferent.
( i i) Surface Charges in the A bsence o f S pecific Adsorption . The method used was essentially that of Parks and de Bruyn . 3 Titration data were obtained using recording potentiometric titration apparatus (Radiometer, Copenhagen) with Radiometer G202B and K401 glass and calomel electrodes. Polythene titration cells were used containing 0.1 to 0.15 g of ferric oxide in 25.0 ml of potassium chloride solution mixed with a Teflon stirrer and flushed with wet C 0 2- free N2 gas. Blank titrations were similarly carried out using 25.0 ml of the appropriate KC1 solution. Uptake of H+ or OH“ by the oxide was found by taking differences between test suspension and blank
(7) H . P. Rooksby in “ The X -R a y Identification and Crystal Structures o f Clay Minerals,” G. Brown, Ed., Mineralogical Society, London, 1961, Chapter 10.
Volume 71, Number 3 February 1967

552 R. J. Atkinson, A. M. Posner, and J. P. Quirk
titration volumes at particular pH values. Adsorption densities (FH + — Toh-) microequivalents per gram of oxide (1 1 0 ° dry weight) were calculated relative to the zpc located by the common point of intersection of titration curves at different ionic strengths. The temperature for titrations was 20 ± 1.5°. Thetitrants used were 0.1 A HC1 and 0.1 A KOH which were standardized against 0.005 M potassium hydrogen phthalate and 0.001 M borax N ^ B A V IO ^ O ; all solutions were prepared with double-distilled water. Additions of titrant did not exceed 0.25 ml in the pH range3.5 to 10.5, so that ionic strengths were kept essentially constant except at the lowest ionic strength, 0 . 0 0 2 M . Each titration was carried out twice using two different speeds which corresponded approximately to2.5 and 5 pH units/hr. Good agreement (± 3% ) was found between these replicate titrations. The uncertainty in pH measurements was ±0.05, although absolute errors were greater at pH extremes. Preliminary experiments showed that suspension effects were not significant and liquid junction potentials were taken as being close to zero. The ferric oxides used in the adsorption experiments reported here were not subjected to any drying treatments.
Results and Discussion
Criteria for attainment of equilibria in reactions at hydrated solid surfaces are often difficult to establish. After the initially rapid adsorption or desorption of H+ occurring with pH change, ferric oxide surfaces continue to adsorb or desorb protons very slowly. The slow H+ transfer has been attributed to the extension of the proton-excess charge (or proton-deficit charge) into hydrated surface layers of the oxide,5
or may arise from structural rearrangement of ferric hydroxo complex ions existing at the surface, to expose effectively a greater number of proton acceptor or proton donor sites at the interface. The slow H+ transfer in any event involves reactions different in form to the initial rapid H+ transfer occurring when solution pH is changed, and accordingly only the initial fast reaction at the phase boundary is considered here. Other experiments are being conducted in these laboratories to gain information on the structural bases for differences in ferric oxide adsorption capacities for H+, which cannot be simply related to B E T nitrogen surface area or known differences in preparation methods.
Preliminary experiments on the adsorption behavior of dried (1 1 0 °) finely ground hematite indicated that H+ adsorption or desorption from solution was greatly reduced with respect to quantity and rate, while phosphate adsorption was only slightly depressed. This suggested that the degree of crystal dispersion was not
the important factor, and instead the possibility that slow insertion of water molecules into surface crystalline layers is a rate-determining step for dried ferric oxides is being investigated.
The quantity obtained from potentiometric titration measurements is the net adsorption, Fh + — Toh-, in microequivalents per gram. Thus
o- = ^ (P h+ — r 0H-) /uequiv cm“ 2 (1)
where a is the surface density of charge, r H+ and T o h -
are the surface excesses, in microequivalents per gram, and A is the surface area in square centimeters per gram. In the presence of an excess of indifferent electrolyte, the adsorbed potential-determining ions are assigned to the solid side of the interface; 3 that is, the only counterions present in the solution phase are solvated C l“ (or K + if the surface is negatively charged).
Two features of the ferric oxide titration curves (Figures 1 and 2 ) suggest a form for theoretical analyses.
(i) The titration curves may be regarded as adsorption isotherms for H+ or OH“ by use of the approximations
cr A = (Fh+ — Ton-) — Fh +
on the acid side of the zpc (2 )
aA = ( rH+ — T o h - ) — — F o h -
on the alkaline side of the zpc (3)
Positive charges on the surface are thus considered to be due entirely to excess adsorbed H+ with respect to the zpc. Negative charges are considered to arise entirely from a surface excess of OH- .
(ii) The uptake of HC1 or KOH does not appear to reach any maximum value as pH is decreased or increased, respectively. Dissolution of the solid is not thought to be appreciable until pH <3.5, when the curves became steeper and time dependence for HC1 uptake became important, so that no reliable equilibrium pH was established below 3.5. Plots of ( rH + — Ton-) as a function of hydrogen ion concentration suggest the same conclusions. There was no evidence for appreciable dissolution at pH 1 1 . The lack of any defined HC1 or KOH adsorption maxima suggest that in the pH range 4 to 1 1 only a small proportion of available adsorption sites became charged, and that fractional coverages of the surface with positively or negatively charged sites remain small. An example of the highest recorded charge densities is 4.9 X 10 “ 4 /lequiv cm“ 2 (47 ^coulombs cm“ 2) for hematite no. 10.2.65 (Table I) at pH 4 in 1 I f KC1, corresponding to one
The Journal of Physical Chemistry
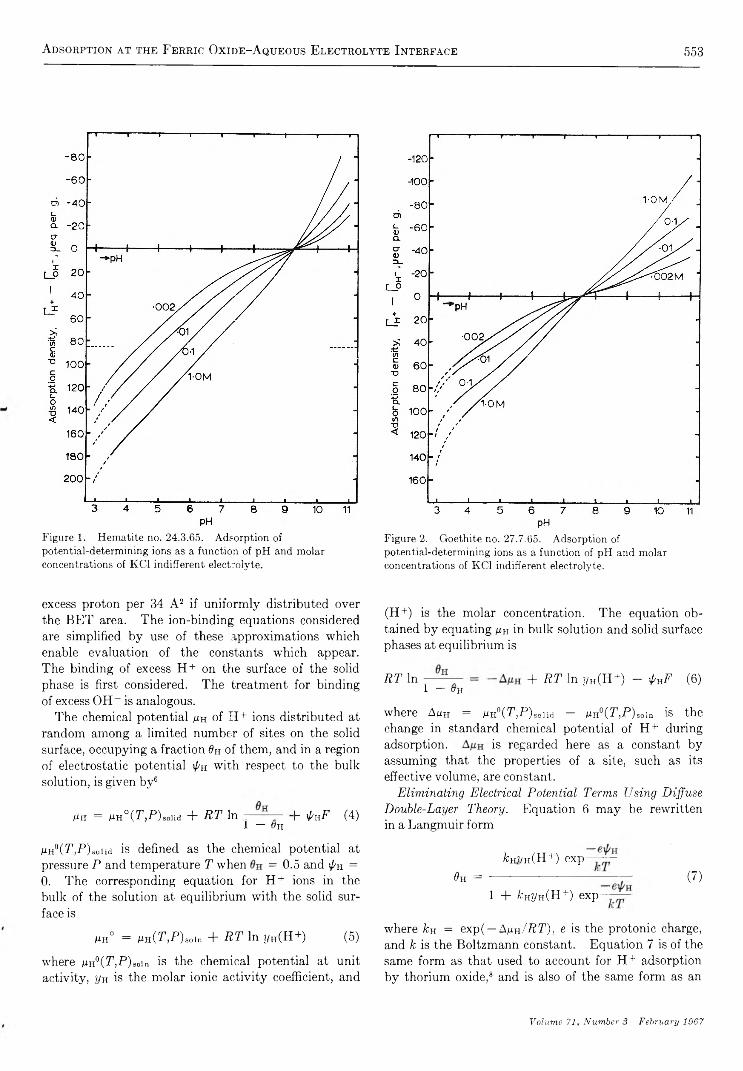
Adsorption at the Ferric Oxide-A queous Electrolyte Interface 553
Figure 1. H em atite no. 24.3.65. A dsorp tion of potentia l-determ in ing ions as a fu n ction o f p H and m olar concentrations o f KC1 indifferent electrolyte.
F igure 2. G oeth ite no. 27.7.65. A dsorp tion of potentia l-determ in ing ions as a fu n ction o f p H and m olar concentrations of KC1 indifferent electrolyte.
excess proton per 34 A 2 if uniformly distributed over the B E T area. The ion-binding equations considered are simplified by use of these approximations which enable evaluation of the constants which appear. The binding of excess H+ on the surface of the solid phase is first considered. The treatment for binding of excess OH - is analogous.
The chemical potential mh of H+ ions distributed at random among a limited number of sites on the solid surface, occupying a fraction 0h of them, and in a region of electrostatic potential \f/h with respect to the bulk solution, is given by6
y h = mh°(T ,F)solid + R T In - - H >AhF (4)1 — Oh
HH°(T,P)eoiid is defined as the chemical potential at pressure P and temperature T when = 0.5 and \pn = 0. The corresponding equation for H+ ions in the bulk of the solution at equilibrium with the solid surface is
mh° = m ( T , P ) som + R T In j/h(H+) (5)
where JuH0(7,,P)sc,in is the chemical potential at unit activity, j/H is the molar ionic activity coefficient, and
(H+) is the molar concentration. The equation obtained by equating yn in bulk solution and solid surface phases at equilibrium is
R T In + R T In j/H(H+) - ^HP (6 )l — UK
where A yu = m ° ( T ,P ) soud - y u ° (T ,P )so]n is the change in standard chemical potential of H+ during adsorption. is regarded here as a constant byassuming that the properties of a site, such as its effective volume, are constant.
E lim inating Electrical P otential Term s U sing D iffuse D ouble-Layer Theory. Equation 6 may be rewritten in a Langmuir form
fcH?/H(H+) exPes = ----------------------- t— — (7)
1 + k Hy h(H+) exp
where &h = exp( — A yn / R T ), e is the protonic charge, and k is the Boltzmann constant. Equation 7 is of the same form as that used to account for H+ adsorption by thorium oxide,8 and is also of the same form as an
Volume 71, Number 3 February 1967

554 R. J. Atkinson, A. M. Posner, and J. P. Quirk
equation used for adsorption of long-chain alkyl ions at air-water and oil-water interfaces. 8 9
If Th+ is small relative to F h+, the maximum number of sites available for H+, the denominator in eq 7 may be approximated to one, and since 0 H = Tu.*/Vn + then
log Th+ + pH = log kRV H+ — — (8 )
A simple approximation with which \p may be eliminated from eq 8 is obtained from diffuse double-layer theory for colloidal particles when \p is small. 10
intercept log fcHP h+ and slopes which vary inversely with the square root of ionic strength, \ / l. Although linear plots were obtained (Figure 3A), the slopes were relatively insensitive to changes of KC1 concentration from 0.002 to 1.0 M (Figure 3B). It was concluded that the use of simple diffuse double-layer theory to eliminate electrical potential terms could not satisfactorily account for the effect of varying ionic strength on H + or OH - binding by ferric oxides.
E lim ination o f E lectrical P otential Term s U sing E quations fo r the Electrochem ical Potential o f Counterions. The positive charge on the acid side of the zpc is considered first. The equation for chloride counterions at the surface,6 corresponding to eq 4 for H+ ions, is
i/'o is the potential at the surface identified with \pn, t is the dielectric constant, and n = concentration of ions in the bulk solution. Therefore, from eq 8
log r „ . + pH - log (10)
since a has been approximated to r H+/A /rnquiv cm-2. This suggests that plots of log r H + + pH as a function of r H+ should approximate to straight lines having
- L - Peq per 9-Figure 3. H em atite no. 24.3.65. F igure 3 A : p lots o f eq 10. F igure 3 B : the reciprocal slopes of the straight lines in 3A p lotted as a fun ction o f \/l (om ittin g a ctiv ity coefficients).
Mci — Mci°(T,P)soiid + RT In--------— — tciF (11)1 — 0ci
where definitions of terms are analogous to those given for H+ and the chloride ions are in a region of electrostatic potential \pci- For chloride ions in solution, the equation corresponding to eq 5 for H+ ions (with analogous definitions of terms) is
Mci = m°(T ,P )s„,„ + R T In ¡foi(Cl-) (12)
Equating the chemical potential of C l- in solution and surface phases at equilibrium leads to
On IR T i a~ = ~ AMci + R T In i/ci(Cl~) -f- ypc\F
1 — 0c\(13)
where Amci is the change in standard chemical potential of C l- during adsorption.
If eq 6 and 13 are added and it is assumed that the number of sites for H+ and C l“ are equal, i.e ., dH = 0ci, then the equation obtained is
2R T In - — = — (Amh + Amci) +i f'H
R T In (H+)(C1-) - F ( i H - (14)
Activity coefficients have been omitted in view of the approximation made in relation to use of the potential difference (\ps — i/m) . 1 1 Equation 14 may be rewritten in the form
Ah
1 - 0HfcHV (H + )(C l-) exp
F
2 R T(P n — ypci)
(15)
(8) P. J. Anderson, Trans. Faraday Soc., 54, 130 (1958).(9) J. T . Davies, P roc. R oy. Soc. (London), A245, 417 (1958).(10) J. Th. G. Overbeek in “ Colloid Science,” Vol. I, H . R . K ruyt, Ed., Amsterdam, 1952, Chapter IV.(11) E. A. Guggenheim, “ Therm odynam ics,” N orth-H olland Publishing Co., Amsterdam, 1959, Chapter 9.
The Journal of Physical Chemistry

Adsorption at the Ferric Oxide-A queous Electrolyte Interface 555
in which
— (A jUH + AjLtci)
k” * - expL-------m F ------- J
Two further approximations are then made. If F h+, the maximum number of sites available for H+, is large compared with r H+, then 0H/ 1 — da — r H+/FH+. Secondly, it is assumed that r H+, the surface excess of H+, is a linear function of the potential difference ( i n — ic\ )- The simplest approximation that i n = i c i , which was used by Gilbert and Rideal,6 does not prove useful in this case.
The equation to be tested is
r H+ = H+)(C 1 -) e x p i - K M (1 6 )
in which K i is an interaction constant which is inversely proportional to surface area A . Dimensions are microequivalents- 1 gram for K\, and moles liter- 1
for fcH+. The linear form for eq 16 is
log r H+ + y ,pH = log A:h+Fh+ +
‘A tog (Ci-) - | ^ | - * (.7)
which is tested in Figures 4 and 5 for hematite no.
Figure 4. H em atite no. 24.3.65. P lots of eq 17 on the acid side o f th e zpc.
F igure 5. G oeth ite no. 27.7.65. P lots o f eq 17 on the acid side o f the zp c
24.3.65 and goethite no. 27.7.65, having approximately obtained Th+ from r H+ - Toh- data (Figures 1 and2 ). The intercepts log k;i+V h+ + 1/t log (Cl- ) should form a straight line of unit slope when plotted as a function of (A log (Cl- ) (see Figure 6 ). Both requirements appear to be satisfied. Some values of the constants K i and fcn+FH + are given in Table I.
Recalculation of isotherms requires constants for the corresponding equation oa the alkaline side of the zpc, viz.
F oh- = k o a - V o a - V (K +)(OH- ) exp(—A 2Foh-) (18)
in which Toh-, the magnitude of the surface excess of OH- , is small compared with F o h - , the maximum number of sites for OH- . Other symbols are analogous to those in eq 16. The linear form is
log T o h - — 7*pH = V 2 og K w +
OFT —log fcoH-Fon- + V, log (K+) - (19)
in which Kw is the appropriate dissociation constant for water.
However, the approximations made to evaluate constants on the acid side cf the zpc are not suitable for the restricted range of Toh- values on the alkaline side
Volume 71, Number 3 February 1967
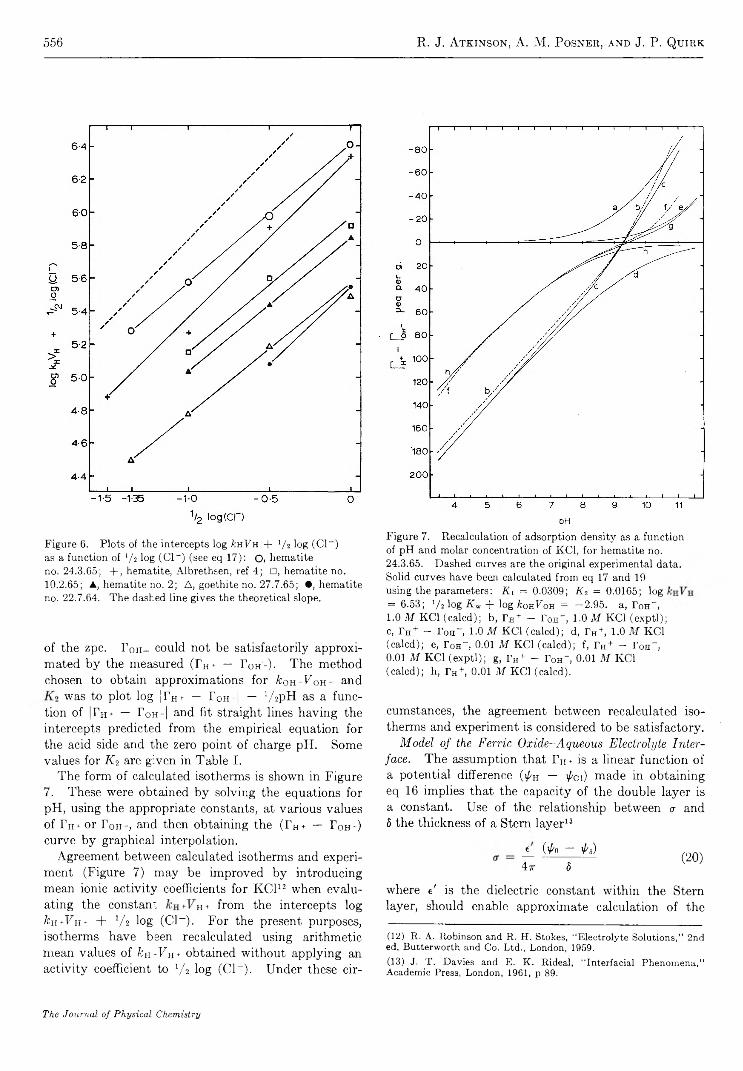
556 R. J. Atkinson, A. M. Posner, and J. P. Quirk
Figure 6. P lots o f the in tercepts log krtVrt + x/ 2 log ( C l " ) as a fun ction of l/i log ( C l " ) (see eq 1 7 ): O, hem atite no. 24.3.65; + , hem atite, A lbrethsen, ref 4 ; □ , h em atite no. 10.2.65; A, hem atite no. 2 ; A , goeth ite no. 27 .7 .65 ; • , hem atite no. 22.7.64. T h e dashed line gives the theoretica l slope.
of the zpc. P0 H- could not be satisfactorily approximated by the measured ( P H + — T o h '-) . The method chosen to obtain approximations for fcoH-UoH- and
was to plot log jr H+ — r 0H-| — V 2PH as a function of |rH+ — Poh -| and fit straight lines having the intercepts predicted from the empirical equation for the acid side and the zero point of charge pH. Some values for K i are given in Table I.
The form of calculated isotherms is shown in Figure 7. These were obtained by solving the equations for pH, using the appropriate constants, at various values of r H+ or Foh -j and then obtaining the (Fh + — r 0H-) curve by graphical interpolation.
Agreement between calculated isotherms and experiment (Figure 7) may be improved by introducing mean ionic activity coefficients for K C 1 12 when evaluating the constant h+ from the intercepts log kn+VH+ + XA log (C1-). For the present purposes, isotherms have been recalculated using arithmetic mean values of &h+Uh + obtained without applying an activity coefficient to 1/2 log (Cl- ). Under these cir-
Figure 7. R eca lcu lation of adsorption density as a fun ction o f pH and m olar concentration of KC1, fo r h em atite no. 24.3.65. D ashed curves are th e original experim ental data. Solid curves h ave been calcu lated from eq 17 and 19 using the param eters: K i = 0 .0309; K i = 0 .0165; log = 6 .53; V 2 log i7 w + log fconFon = —2.95. a, T o n ",1.0 M KC1 (ca lcd ) ; b , r H+ - r 0H" , 1.0 M KC1 (e x p t l) ; c, r H+ - r 0H" , 1.0 M KC1 (ca lcd ) ; d, r H+, 1.0 M KC1 (ca lcd ) ; e, Toh" , 0.01 M KC1 (ca lcd ) ; f, r H+ — Toh" ,0.01 M KC1 (e x p t l) ; g, r H+ - T o n ", 0.01 M KC1 (ca lcd ) ; h, r H+, 0.01 M KC1 (ca lcd ).
cumstances, the agreement between recalculated isotherms and experiment is considered to be satisfactory.
M odel o f the Ferric O xid e-A qu eou s Electrolyte In terface. The assumption that FH+ is a linear function of a potential difference (^H — \pCi) made in obtaining eq 16 implies that the capacity of the double layer is a constant. Use of the relationship between u and 8 the thickness of a Stern layer13
A_ (’/'Q ~ 'Ps) 4-7T 8
(2 0 )
where e' is the dielectric constant within the Stern layer, should enable approximate calculation of the
(12) R . A. Robinson and R . H. Stokes, “ Electrolyte Solutions,” 2nd ed, Butterworth and Co. Ltd., London, 1959.(13) J. T . Davies and E. K . Rideal, “ Interfacial Phenom ena,” Academic Press, London, 1961, p 89.
The Journal of Physical Chemistry
Adsorption at the Ferric Oxide-A queous Electrolyte Interface 557
interaction constants K , and K 2. is identified with iAh, with \pc\, and Yu*/A with u. The expression obtained on evaluating constants at 293°K is
K =4:ttFS
2 R T V A
2.16 X 1055Mequiv- 1 g (2 1 )
A is expressed in sciuare centimeters per gram and S is expressed in Angstrom units. 8 is the average distance, in the direction normal to the surface plane, between the plane of surface charge and the plane of average approach of the centers of solvated counterions. Values for 8 and t are not known; however, the correct magnitude for K is obtained on taking reasonable assumed values. For example, calculation using 8 = 0.5 A and a value14 of e' = 6 for water at dielectric saturation, leads to K , ~ 0.04 for hematite no. 24.3.65 of B E T nitrogen area 44.5 X 10 4 cm2 g- 1 , compared with the experimental value K\ = 0.03.
It is possible that both t and 8 decrease with increasing surface charge while their ratio remains approximately constant. The hydrated ferric oxide surface is likely to have a sufficiently irregular configuration to permit small values of 8, of the order of 0.2 to 2 A, by “ embedding” of the solvated counterions. The variation in values of the interaction constants K (Table I) for different hematite preparations may be understood qualitatively by consideration of the structural nature of the surface.
In the bulk of hematite crystals, each ferric ion is surrounded by a distorted octahedral arrangement of oxygen ions, but in the surface phase of crystals in aqueous suspension the coordinated species may be oxygen ions, hydroxyl ions, or water molecules. Ferric ions at the surface are partially solvated and the surface phase consists of polymerized derivatives of ferric hydroxo complex ions with coordinated water molecules and hydroxyl ions behaving as proton donors and acceptors. Although protons are probably relatively mobile within the surface phase, extension of the proton- excess (or proton-deficit) charge into the crystal lattice proper probably involves only a small fraction of the excess protons and would be limited to small distances of the order of 2 to 5 A. Little information is available on the effect of drying, 15 but the surface phase found on precipitated hematite crystals is probably lost by mild drying to p/p0 = 0.95.
In the preparation methods used here for hematite, the final stage of crystal growth occurs when the pH of the refluxed suspension is increased during washing to remove H N 03, causing precipitation of the high solution content of ferric ions which exists at very acid pH. Washing by dialysis is thought to complete crystal growth under conditions of high surface charge
with slow attachment of ferric ions of the form Fe (0H)(H20) 52+ or Fe(0H )2(H20 )4+, resulting in a well- ordered surface. Poorly ordered surfaces with relatively greater inclusion of water molecules result from KOH washing which completes crystal growth by rapid attachment of polymerized derivatives of ferric ions under conditions of slight surface charge. These considerations suggest the average distance of closest approach of counterions is likely to vary for different ferric oxide preparations. This factor is proposed as the cause of differences in values of the interaction constant K which remain after multiplication by surface area A . That is, t 'A K is proportional to 8 considering e' to be a characteristic constant for all systems and considering relative values of A to be represented by the B E T nitrogen area. Hematite preparations washed by KOH would thus be expected to have smaller values for A K , than hematites washed by distilled water dialysis only, as closer penetration of C l- counterions could occur into a more disordered surface structure compared with surface structures in dialyzed preparations. However, in Table I the relationship between the interaction constant K and the washing method is not clear. This suggests that the suitability of the B E T nitrogen area for representing relative surface areas should be examined.
The similarity o: the interaction constants K , and K i for positive and negative charges is considered to reflect similar distances of approach for C l- and K + counterions. Under the pH conditions of these experiments, chloride ions or nitrate ions do not enter the first coordination shells of ferric ions, although it is possible that water molecules are shared between Fe3 + coordination shells and C l- hydration spheres. The binding of solvated K+, C l- , or NO3- counterions is largely electrostatic in origin and arises from the requirements for electroneutrality in the surface phase. Anions such as phosphate which are desolvated and specifically adsorbed by ferric oxides are considered to form a new potential determining layer by ligand exchange reactions with OH- or H20 in the ferric first coordination shell.
In view of the approximations necessary to evaluate the constants of eq 14 and 16, the agreement of these equations with experiment is considered satisfactory. The approximations made to eliminate the electrical potential terms appear to be suitable for the ferric oxide-aqueous electrolyte interface. Since the equations neglect the presence of counterions in the diffuse
(14) J. O ’M . Bockris, M . A. V. Devanathan, and K . Müller, Proc. R oy . Soc. (London), A274, 55 (1963).(15) J. J. Jurinak, J. Colloid Sei., 19, 447 (1964).
Volume 71, Number 8 February 1967
558 Norman Cohen and Julian Heicklen
layer or Gouy layer by equating 0h and 0c 1, it is suggested that under these conditions the proportion of counterions in the diffuse layer is small, and surface potentials are reduced as a result of ion binding between counterions and the surface. 16 Electrokinetic phenomena, determined by the small proportion of counterions in the diffuse layer, are not expected to give reliable calculations of amounts of adsorbed ions under the conditions of ionic strength used here.
The considerable extent of ion-pair binding16 of counterions is suggested to be primarily related to the closeness of counterion approach which is possible under the conditions of ferric ion solvation at the interface. The electrostatic interaction is then large compared with the thermal energy of ions. An al
ternative suggestion6 is that for large particles, of “ microscopic” rather than “ atomic” dimensions, only a very small fractional dissociation of counterions is required to give large electrostatic interactions relative to the thermal energies of the particle and counterions, when surface densities of charge are not low.
Acknowledgm ents. Scholarship assistance received by R. J . Atkinson from the Australian Agricultural Council and the Commonwealth Scientific and Industrial Research Organization is gratefully acknowledged.
(16) D . G. Edwards, A . M . Posner, and J. P. Quirk, Trans. Faraday Soc., 61, 2808 (1965).
Reaction of NO(A2X)+) with Carbon Dioxide
by Norman Cohen and Julian Heicklen
Aerospace Corporation, E l Segando, C alifornia (Received J u ly S I, 1966)
In the presence of C 0 2, NO(A22 +) was produced by irradiation of N 0 -C 0 2 mixtures with a cadmium arc. The products monitored were N2, whose yield dropped as the (C 02) : (NO) ratio was enhanced, and CO, whose yield rose with the (C02) : (NO) ratio to a constant upper limit. Product formation was unaffected by temperature changes (23-300°) or by the addition of xenon or N 02. The results are explained by the simple competition NO(A22 +) + NO -*■ N2 + other products and NO(A22 +) + C 0 2 -> N 0 2 + CO. Carbon dioxide is about 3.4 times more efficient than NO in the competition.
I. Introduction
As part of a continuing program in our laboratory on the reactions of NO(A22 +), we have examined its reaction with C 0 2. Fluorescence quenching of the A 22 + state of NO by C 0 2 has been studied in a number of laboratories, 1 - 6 and the quenching constant is reasonably well known. It is very large ( ~ 10 n M - 1 sec- 1), and it has been suggested that chemical reaction may occur. 1 2 3 4 5 However, as far as we know, no detailed study of product formation has been made prior to our work.
II. Experimental Details
The quartz reaction vessel was 10 cm long and 5 cm in diameter. It was jacketed in a wire-wound furnace
(1) A. V. Kleinberg and A. N. Terenin, Dokl. AJcad. N auk S S S R , 101, 1031 (1955).(2) N. Basco, A. B. Callear, and R . G. W . Norrish, P roc. R oy . Soc. (London), A260, 459 (1961).(3) R . Young and R . Sharpless, D iscussions Faraday Soc., 33, 228(1962) .(4) A . B. Callear and I. W . M . Smith, Trans. Faraday Soc., 59, 1720(1963) .(5) H . Broida and T . Carrington, J . Chem. P h ys ., 38, 136 (1963)
The Journal of Physical Chemistry
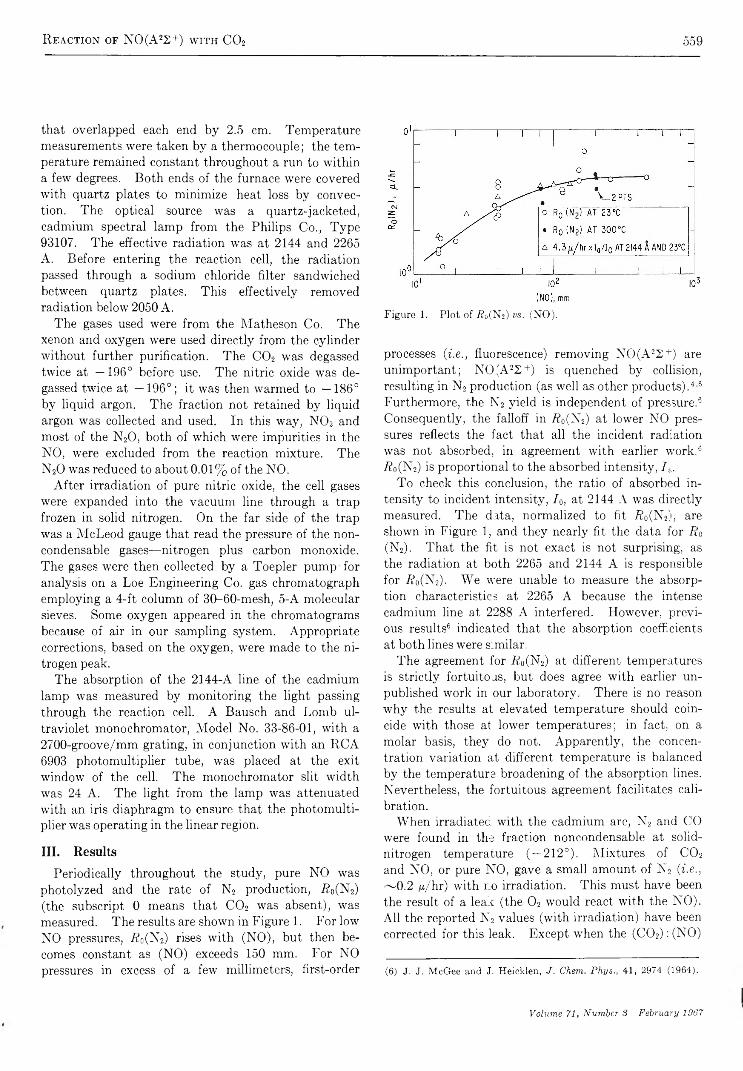
R eaction of NO(A2S+) with C 02 559
that overlapped each end by 2.5 cm. Temperature measurements were taken by a thermocouple; the temperature remained constant throughout a run to within a few degrees. Both ends of the furnace were covered with quartz plates to minimize heat loss by convection. The optical source was a quartz-jacketed, cadmium spectral lamp from the Philips Co., Type 93107. The effective radiation was at 2144 and 2265 A. Before entering the reaction cell, the radiation passed through a sodium chloride filter sandwiched between quartz plates. This effectively removed radiation below 2050 A.
The gases used were from the Matheson Co. The xenon and oxygen were used directly from the cylinder without further purification. The C 0 2 was degassed twice at —196° before use. The nitric oxide was degassed twice at —196°; it was then warmed to —186° by liquid argon. The fraction not retained by liquid argon was collected and used. In this way, N 0 2 and most of the N20, both of which were impurities in the NO, were excluded from the reaction mixture. The N20 was reduced to about 0.01% of the NO.
After irradiation of pure nitric oxide, the cell gases were expanded into the vacuum line through a trap frozen in solid nitrogen. On the far side of the trap was a McLeod gauge that read the pressure of the noncondensable gases—nitrogen plus carbon monoxide. The gases were then collected by a Toepler pump' for analysis on a Loe Engineering Co. gas chromatograph employing a 4-ft column of 30-60-mesh, 5-A molecular sieves. Some oxygen appeared in the chromatograms because of air in our sampling system. Appropriate corrections, based on the oxygen, were made to the nitrogen peak.
The absorption of the 2144-A line of the cadmium lamp was measured by monitoring the light passing through the reaction cell. A Bausch and Lomb ultraviolet monochromator, Model No. 33-86-01, with a 2700-groove/mm grating, in conjunction with an RCA 6903 photomultiplier tube, was placed at the exit window of the cell. The monochromator slit width was 24 A. The light from the lamp was attenuated with an iris diaphragm to ensure that the photomultiplier was operating in the linear region.
III. Results
Periodically throughout the study, pure NO was photolyzed and the rate of N2 production, R 0(N2) (the subscript 0 means that C 0 2 was absent), was measured. The results are shown in Figure 1. For low NO pressures, Ro(N2) rises with (NO), but then becomes constant as (NO) exceeds 150 mm. For NO pressures in excess of a few millimeters, first-order
F ig u re 1. P lo t o f R 0(N 2) vs. (N O ) .
processes (i.e., fluorescence) removing NO(A22 +) are unimportant; NO(A22 +) is quenched by collision, resulting in N 2 production (as well as other products) . 4,6
Furthermore, the N 2 yield is independent of pressure.6
Consequently, the falloff in R 0(N2) at lower NO pressures reflects the fact that all the incident radiation was not absorbed, in agreement with earlier work.6
A0(N2) is proportional to the absorbed intensity, / 6.To check this conclusion, the ratio of absorbed in
tensity to incident intensity, Jo, at 2144 A was directly measured. The data, normalized to fit Ao(N2), are shown in Figure 1, and they nearly fit the data for R 0 (N2). That the fit is not exact is not surprising, as the radiation at both 2265 and 2144 A is responsible for J?o(N 2). We were unable to measure the absorption characteristics at 2265 A because the intense cadmium line at 2288 A interfered. However, previous results6 indicated that the absorption coefficients at both lines were similar.
The agreement for Ao(N2) at different temperatures is strictly fortuitous, but does agree with earlier unpublished work in our laboratory. There is no reason why the results at elevated temperature should coincide with those at lower temperatures; in fact, on a molar basis, they do not. Apparently, the concentration variation at different temperature is balanced by the temperature broadening of the absorption lines. Nevertheless, the fortuitous agreement facilitates calibration.
When irradiated with the cadmium arc, N 2 and CO were found in the fraction noncondensable at solid- nitrogen temperature ( — 212°). Mixtures of C 0 2
and NO, or pure NO, gave a small amount of N 2 (i.e., ~ 0 .2 n/hr) with r_o irradiation. This must have been the result of a lealc (the 0 2 would react with the NO). All the reported N2 values (with irradiation) have been corrected for this leak. Except when the (C02) : (NO)
(6) J. J. M cGee and J. Heicklen, J. Chem. Phys., 41, 2974 (1964).
Volume 71, Number 3 February 1967
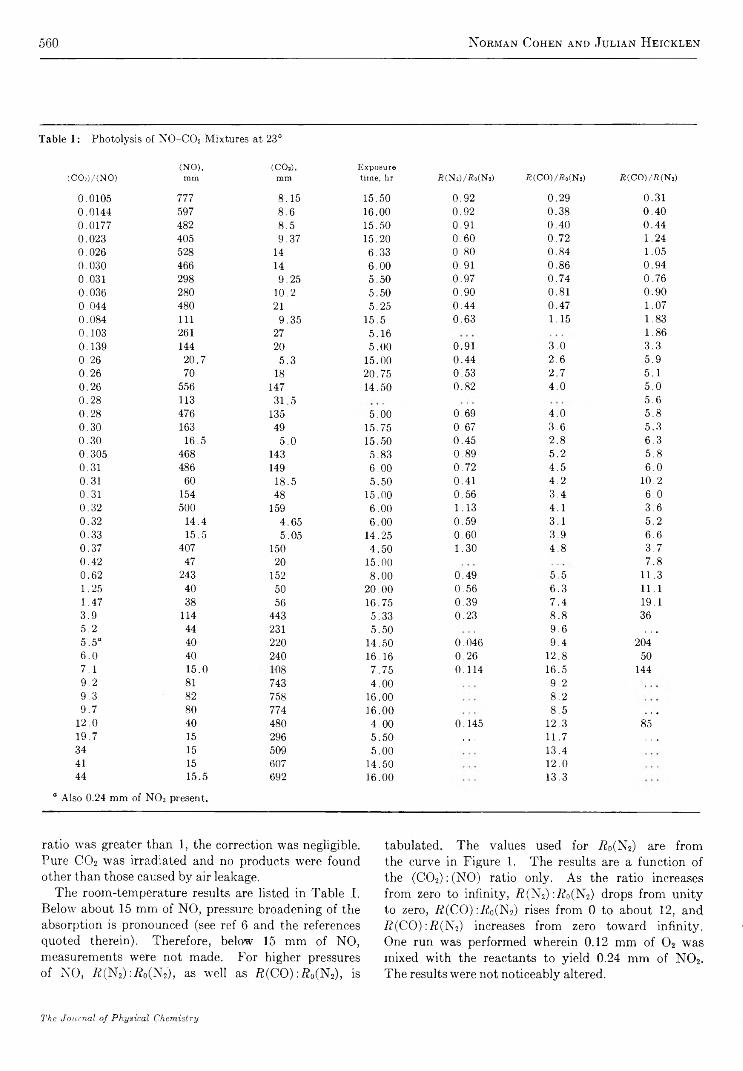
560 Norman Cohen and Julian Heicklen
T ab le I : P hotolysis o f N 0 - C 0 2 M ixtures at 23°
(NO), (COO, Exposure(CO¡)/(NO) mm mm time, hr B(N2)/Ro(N2) ñ(CO)/fío(N!) R(CO)/íe(N!)
0.0105 777 8 .15 15.50 0 .92 0 .29 0 .310.0144 597 8 .6 16.00 0 .92 0 .3 8 0 .4 00.0177 482 8 .5 15.50 0.91 0 .4 0 0 .4 40.023 405 9 .37 15.20 0 .6 0 0 .7 2 1.240.026 528 14 6.33 0 .8 0 0 .8 4 1.050 .030 466 14 6 .0 0 0.91 0 .86 0 .9 40.031 298 9 .2 5 5 .50 0 .97 0 .7 4 0 .760 .036 280 10.2 5 .50 0 .90 0.81 0 .9 00.044 480 21 5.25 0 .4 4 0 .47 1 .070.084 111 9 .3 5 15.5 0 .6 3 1.15 1.830.103 261 27 5.16 1 .860.139 144 20 5 .0 0 0 .91 3 .0 3 .30 .26 20 .7 5 .3 15.00 0 .4 4 2 .6 5 .90 .26 70 18 20 .75 0 .53 2 .7 5 .10 .26 556 147 14.50 0 .82 4 .0 5 .00 .28 113 31 .5 5 .60 .28 476 135 5 .00 0 .69 4 .0 5 .80 .30 163 49 15.75 0 .67 3 .6 5 .30 .3 0 16.5 5 .0 15.50 0 .4 5 2 .8 6 .30 .305 468 143 5 .83 0 .89 5 .2 5 .80.31 486 149 6 .0 0 0 .7 2 4 .5 6 .00.31 60 18.5 5 .50 0.41 4 .2 10 .20.31 154 48 15.00 0 .56 3 .4 6 .00 .32 500 159 6 .0 0 1.13 4 .1 3 .60 .32 14.4 4 .65 6 .0 0 0 .59 3 .1 5 .20 .33 15.5 5 .05 14.25 0 .6 0 3 .9 6 .60 .37 407 150 4 .5 0 1 .30 4 .8 3 .70 .42 47 20 15.00 7 .80 .62 243 152 8 .0 0 0 .49 5 .5 11.31.25 40 50 20 .00 0 .56 6 .3 11.11.47 38 56 16.75 0 .39 7 .4 19.13 .9 114 443 5.33 0 .23 8 .8 365 .2 44 231 5 .5 0 9 .6 . . .
5 . 5 “ 40 220 14.50 0 .046 9 .4 2046 .0 40 240 16.16 0 .2 6 12.8 507 .1 15 .0
OO0
7 .7 5 0 .114 16.5 1449 .2 81 743 4 .0 0 9 .29 .3 82 758 16.00 8 .29 .7 80 774 16 .00 8 .5 . • •
12 .0 40 480 4 .0 0 0 .145 12.3 8519.7 15 296 5 .5 0 . . . 11.7 . ■ «
34 15 509 5 .0 0 13.441 15 607 14.50 12.044 15.5 692 16 .00 13 .3
° A lso 0 .24 m m o f N 0 2 present.
ratio was greater than 1 , the correction was negligible. Pure C 0 2 was irradiated and no products were found other than those caused by air leakage.
The room-temperature results are listed in Table I. Below about 15 mm of NO, pressure broadening of the absorption is pronounced (see ref 6 and the references quoted therein). Therefore, below 15 mm of NO, measurements were not made. For higher pressures of NO, f?(N2) :R 0(N i), as well as K(CO) :i?0(N2), is
tabulated. The values used for /¿0(N2) are from the curve in Figure 1. The results are a function of the (CO2) : (NO) ratio only. As the ratio increases from zero to infinity, R (N 2) :if0(N2) drops from unity to zero, R (C O ):R o (N i) rises from 0 to about 1 2 , and .R(CO) :fl(N 2) increases from_ zero toward infinity. One run was performed wherein 0.12 mm of 0 2 was mixed with the reactants to yield 0.24 mm of N 0 2. The results were not noticeably altered.
The Journal of Physical Chemistry
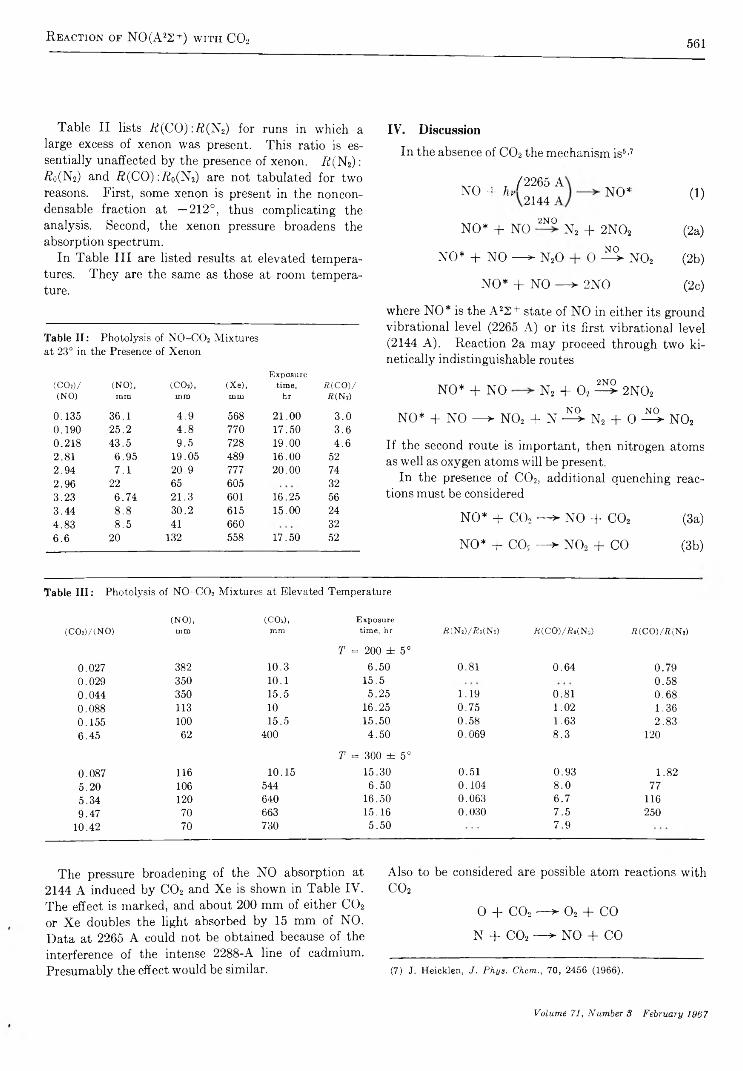
R eaction of NO(A22+) with C 02 561
Table II lists i?(CO):R(N2) for runs in which a large excess of xenon was present. This ratio is essentially unaffected by the presence of xenon. R(N 2) : R o m and R(CO) :/20(N2) are not tabulated for two reasons. First, some xenon is present in the noncondensable fraction at —2 1 2 °, thus complicating the analysis. Second, the xenon pressure broadens the absorption spectrum.
In Table I II are listed results at elevated temperatures. They are the same as those at room temperature.
Table I I : P hotolysis o f N 0 - C 0 2 M ixtures at 23° in the Presence o f X en on
(CO,)/ (NO),(NO) ram
0.135 36 .10.190 25 .20.218 43 .52.81 6 .9 52 .94 7 .12 .96 223.23 6 .7 43 .44 8 .84 .83 8 .56 .6 20
(CO,), (Xe),mm mm
4 .9 5684 .8 7709 .5 728
19.05 48920 .9 77765 60521 .3 60130 .2 61541 660
132 558
E x p o su retim e ,
hrR ( C O)/
R( NO
21 .00 3 .017.50 3 .619.00 4 .616.00 5220 .00 74
3216.25 5615.00 24
3217.50 52
IV. Discussion
In the absence of C 0 2 the mechanism is6'7
NO + hv'/2265 A
2144 ANO*
2 N ONO* + NO N2 + 2N 02
NO* + NO — > N20
NO* + NO — > 2NO
NO0 — > n o 2
(1 )
(2 a)
(2 b)
(2 c)
where NO* is the A 22 + state of NO in either its ground vibrational level (2265 A) or its first vibrational level (2144 A). Reaction 2a may proceed through two ki- netically indistinguishable routes
NO* + NO„ 2 N 0
N 2 + 0 2 — > 2N 02
NO* + NO — > N 0 2 + N ^ N2 + 0 ^ N 0 2
If the second route is important, then nitrogen atoms as well as oxygen atoms will be present.
In the presence of C 0 2, additional quenching reactions must be considered
NO* + C 0 2 - -> NO + C 0 2 (3a)
NO* + CO, —-> N 0 2 + CO (3b)
Table III : P hotolysis o f N 0 - C 0 2 M ixtures at E levated T em perature
(C O ,)/ (N O )(N O ),
m m(C O i),
m mE x p o su re tim e , h r ie (N i)/ F o (N i) U (C O )/K o (N s) K ( C O ) / I i iN ,)
0.027 382 10.3
T = 200 ± 5° 6 .5 0 0.81 0 .6 4 0 .79
0.029 350 10.1 15 .5 0 .5 80 .044 350 15.5 5 .25 1.19 0.81 0 .6 80.088 113 10 16.25 0 .75 1.02 1.360.155 100 15.5 15.50 0 .5 8 1.63 2 .8 36 .45 62 400 4 .5 0 0.069 8 .3 120
0.087 116 10.15
T = 300 ± 5° 15.30 0.51 0 .9 3 1 .82
5 .20 106 544 6.50 0.104 8 .0 775.34 120 640 16.50 0.063 6 .7 1169.47 70 663 15.16 0.030 7 .5 250
10.42 70 730 5 .5 0 7 .9
The pressure broadening of the NO absorption at 2144 A induced by C 0 2 and X e is shown in Table IV. The effect is marked, and about 200 mm of either C 0 2
or Xe doubles the light absorbed by 15 mm of NO. Data at 2265 A could not be obtained because of the interference of the intense 2288-A line of cadmium. Presumably the effect would be similar.
Also to be considered are possible atom reactions withC 0 2
0 + C 0 2 — > 0 2 + CO
N + C 0 2 — *■ NO + CO
(7) J. Heicklen, J. Phys. Chem., 70, 2456 (1966).
Volume 71, Number 3 February 1967
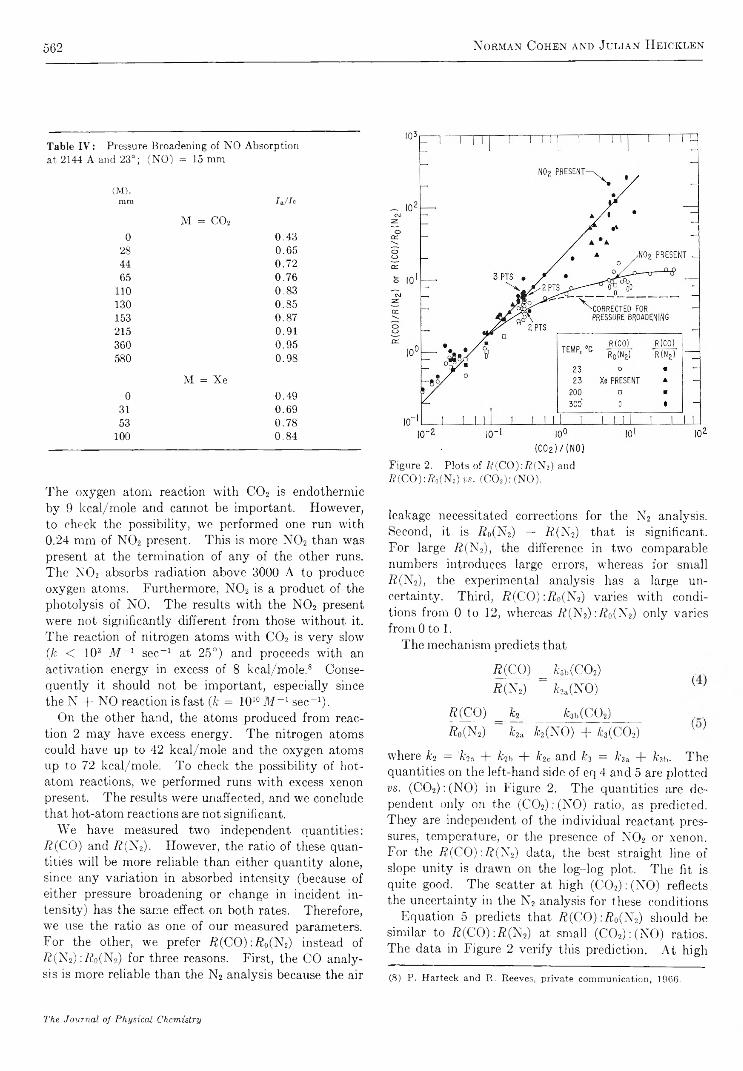
562 N o r m a n C o h e n a n d J u l i a n H e i c k l e n
Table IV: P r e s s u r e B r o a d e n i n g o f N O A b s o r p t i o na t 2 1 4 4 A a n d 2 3 ° ; ( N O ) = 1 5 m m
( M ) ,
mm
M = C 0 2
1JU
0 0.4328 0.6544 0.7265 0.76
110 0.83130 0.85153 0.87215 0.91360 0.95580
M = X e
0.98
0 0.4931 0.6953 0.78
100 0.84
The oxygen atom reaction with C 0 2 is endothermic by 9 lccal/mole and cannot be important. However, to check the possibility, we performed one run with 0.24 mm of N 0 2 present. This is more N 0 2 than was present at the termination of any of the other runs. The N 0 2 absorbs radiation above 3000 A to produce oxygen atoms. Furthermore, N 0 2 is a product of the photolysis of NO. The results with the N 0 2 present were not significantly different from those without it. The reaction of nitrogen atoms with C 0 2 is very slow (k < 10 3 M ~ l sec- 1 at 25°) and proceeds with an activation energy in excess of 8 kcal/mole.8 Consequently it should not be important, especially since the N + NO reaction is fast (k = 10 10 M _ 1 sec- 1).
On the other hand, the atoms produced from reaction 2 may have excess energy. The nitrogen atoms could have up to 42 kcal/mole and the oxygen atoms up to 72 kcal/mole. To check the possibility of hot- atom reactions, we performed runs with excess xenon present. The results were unaffected, and we conclude that hot-atom reactions are not significant.
We have measured two independent quantities: .ft(CO) and R (N2). However, the ratio of these quantities will be more reliable than either quantity alone, since any variation in absorbed intensity (because of either pressure broadening or change in incident intensity) has the same effect on both rates. Therefore, we use the ratio as one of our measured parameters. For the other, we prefer R (C O ) :i?0(N2) instead of .ft(N2) :/2o(N2) for three reasons. First, the CO analysis is more reliable than the N2 analysis because the air
F i g u r e 2 . P l o t s o f / i'(C O ):7?(N 2) a n d F (C O ):/? o(N 2) vs. (C 0 2): (NO).
leakage necessitated corrections for the N2 analysis. Second, it is R 0(N2) — R (N2) that is significant. For large R (N2), the difference in two comparable numbers introduces large errors, whereas for small R(N2), the experimental analysis has a large uncertainty. Third, R (C O ) :R o(N 2) varies with conditions from 0 to 1 2 , whereas R (N 2) :/fo(N2) only varies from 0 to 1 .
The mechanism predicts that
R ( CO) = ¿3b(C02)R ( N*) hi .(NO) ( }
R ( CO) = h fc,b(C02)____fto(N2) h a /c2(NO) + /c3(C02) ( j
where k2 = k2& T k2b + /c2c and k,2 = A'3a T fc3b. The quantities on the left-hand side of eq 4 and 5 are plotted vs. (CO,): (NO) in Figure 2 . The quantities are dependent only on the (C02) : (NO) ratio, as predicted. They are independent of the individual reactant pressures, temperature, or the presence of N 0 2 or xenon. For the if (CO) :S (N 2) data, the best straight line of slope unity is drawn on the log-log plot. The fit is quite good. The scatter at high (C 02) : (NO) reflects the uncertainty in the N2 analysis for these conditions
Equation 5 predicts that R (C O ) :R 0(N 2) should be similar to R (C O ) :R (N 2) at small (C02) : (NO) ratios. The data in Figure 2 verify this prediction. A t high
(8) P. Harteck and R. Reeves, private communication, 1966.
The Journal o f P hysica l Chem istry

R eaction of N 0(A 22+) with C 02 563
(C02):(N 0), R(CO) : / ? o( N 2) should be constant and equal to f a f a b / f a Bf a . The data points in Figure 2 approach a constant upper limit of about 12. However, at high (C02) : (NO), pressure broadening is important and the absorbed intensity is enlarged. From the data in Table IV, the extent of pressure broadening can be estimated if we assume that the results at 2265 and 2144 A are comparable. The dotted line in Figure 2 shows the values of R(CO ): A0(N2) corrected for the pressure broadening. The constant upper limit is reduced from 12 to 5.8.
The rate-constant ratios are summarized in TableV. The values for fab/faa. and fafab/faBfa are about 20 and 5.8, respectively. Now fa has been found1 - 5 to be about 1 0 1 1 M - 1 sec- 1 , which is a very large rate constant. Consequently one would expect, in accordance with Kleinberg and Terenin’s suggestion, 1 that quenching is mainly by chemical reaction and that faB is negligible compared to f a b . If so, then fa/faB is about5.8. This value is in excellent agreement with the value of 5.3 found in another study.7 Combining the two ratios obtained from eq 5 gives a value of 0.29
for fa/fa. This value is in good agreement with the most reliable value4 of 0.34 found by fluorescence quenching.
Table V : S u m m a r y o f R a t e - C o n s t a n t D a t a
R a t io V a lu e S o u rc e
&3b/&2a 2 0 E q 4 a n d 5 ; F i g u r e 2fe/C sb /faafo 5 . 8 E q 5 ; F i g u r e 2f a / f a a 5 . 8 A s s u m e s k 3 = k 3b
5 . 3 R e f 7k i/ k s 0 . 2 9 C o m b i n a t i o n o f f i r s t t w o r a t i o s
0 . 3 4 R e f 40 . 9 3 R e f 50 . 5 0 R e f 1
Acknowledgm ent. The authors wish to thank Mr. Richard Frey for assistance with the experiments, Dr. Sidney Benson for useful discussions, and Mrs. Barbara Peer for assistance with the manuscript. This work was supported by the U. S. Air Force under Contract No. A F 04(695)-669.
Volume 71, Number 8 February 1967
564 P. R. Stoesser and S. J. G ill
Calorimetric Study of Self-Association of 6 -Methylpurine in Water1
by P. R. Stoesser and S. J. Gill
Departm ent o f C hem istry , U niversity o f Colorado, B oulder, Colorado (.Received J u ly 22, 1966)
A determination of the thermodynamics of self-association of 6 -methylpurine in water has been made from heat of dilution measurements. Theoretical equations which relate the concentration dependence of the relative molal enthalpy are used to obtain one estimate of both the self-association constant, K , and the enthalpy of self-association, AH ° , from calorimetric data. The respective values are 8 . 6 ± 1 . 1 ?n- 1 and —5.6 ± 0.2 kcal/ mole. A second estimate of the enthalpy of self-association is made by a combination of heat of dilution data and osmotic coefficient data (Ts’o) to give a value of —6.3 ± 0.1 kcal/mole. An average value of A11° = —6.0 ± 0.4 kcal/mole is suggested from these values. With Ts’o’s value of AG ° = —1.1 kcal/mole a value of AS ° = —16 ± 1 eu is obtained at 25°.
Introduction
The work of Ts’o and colleagues2 ' 3 has demonstrated that aqueous solutions of 6 -methylpurine form complexes of various degrees of polymerization depending upon the total concentration. A stacked configuration is indicated from nuclear resonance data. 3 '4 5 The forces which govern the formation of such complexes are of considerable interest both from a theoretical viewpoint4'6 as well as their likely presence in stabilizing polynucleotide structures6 '7 and polynucleotide-nucleotide complexes.7 ’8
Determination of the vapor pressures as a function of temperature for a series of purine and pyrimidine compounds has provided a measure of the interaction forces in the crystal from the heats of sublimation. 9
Several recent spectroscopic studies on adenylic acid oligomers10 11“ 12 in water have given estimates of the interaction enthalpy between purine rings of the order of —9 kcal mole- 1 . In all of these studies a variety of effects may be present so that it is difficult to sort out the importance of various types of interactions.
The system of 6 -methylpurine avoids some of these problems. It is uncharged. The equilibrium between various species can be considered to be characterized by a single equilibrium constant. 2 The mode of complexation has been indicated to be that of stacking. 3 '4
It was felt that a direct calorimetric measurement of the enthalpy of association of the complex could provide relevant information on the particular inter
action forces of this complex. Furthermore with the availability of enthalpy data the entropy of formation could be calculated by use of the equilibrium constant. In this way a complete thermodynamic description of the purine ring interaction for 6 -methylpurine could be obtained.
Theory
The enthalpy of self-association for a dissolved compound can be determined from an analysis of heats of dilution using either additional equilibrium information13 or assuming particularly simple reaction param
(1 ) (a) P resented in part b y P . R . Stoesser in a P h .D . thesis, U n iversity o f C o lorad o , 1966; (b ) presented at the 40th N a tion a l C o llo id S ym posium , U niversity o f W isconsin , June 16, 1966.(2) P . O . P . T s ’o and S. I. C han, J . A m . Chem. Soc., 8 6 , 4176 (1 96 4 ).(3 ) S. I . C han, M . P . Schweiger, P . O . P . T s ’ o, and G . K . H elm k am p , ibid., 8 6 , 4182 (1964).(4) O. Jardetzky, Bio-polym ers S ym p ., 1, 501 (1964).(5) B . P ullm an, J . Chem. P h ys., 4 3 , S233 (1965).(6) D . M . C rothers and B run o H . Z im in , J . M ol. B io l., 9 , 1 (1964).(7) D . N . H o lco m b and I. T in o co , Jr., B iopolym ers, 3 , 121 (1965).(8) M . N . L ip sett, L . A . H eppel, and D . F . B rad ley , / . B iol. C hem ., 2 3 6 , 857 (1961).
(9) L . B . C lark , G . G . P eschel, and I. T in o co , Jr., J . P h ys . C hem ., 6 9 , 3615 (1965).
(10) J. B rahm s, A . M . M ich elson , and K . E . V a n H old e , J . M o l. B iol., 15, 467 (1966).(11) K . E . V an H old e , J . B rahm s, and A . M . M ich elson , ib id ., 12, 726 (1965).(12) M . L eng and G . F elsen feld , ibid., 15, 220 (1966).
The Journal of Physical Chemistry
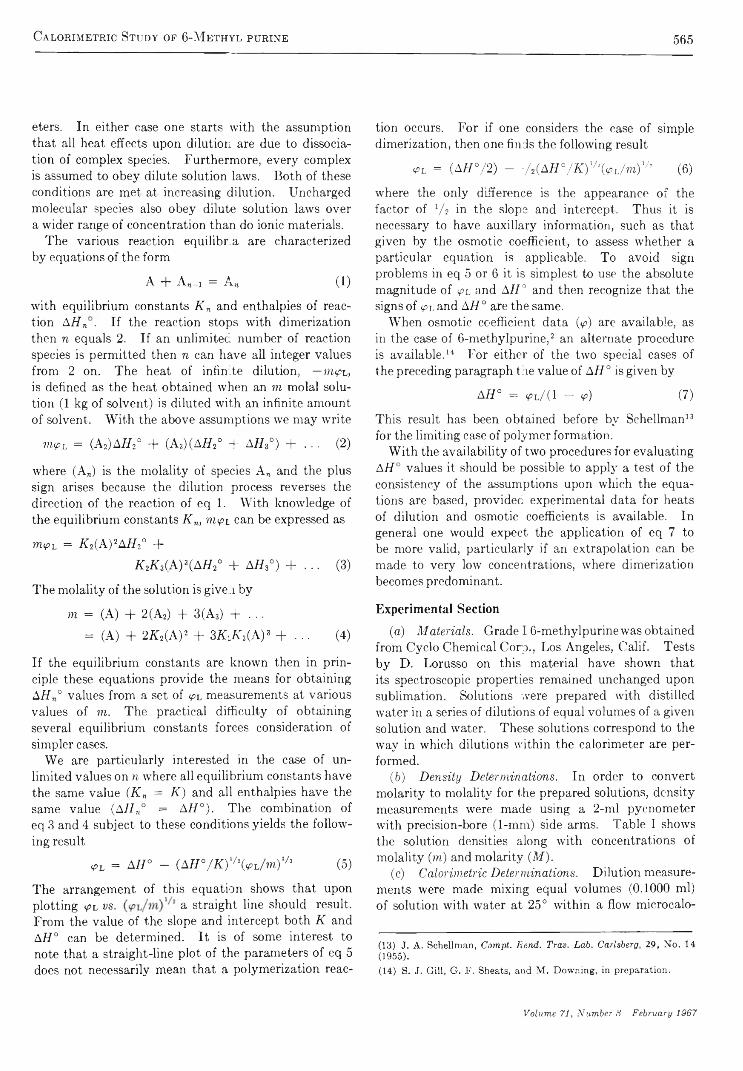
Calorimetric Study of 6-Methyl purine 565
eters. In either case one starts with the assumption that all heat effects upon dilution are due to dissociation of complex species. Furthermore, every complex is assumed to obey dilute solution laws. Both of these conditions are met at increasing dilution. Uncharged molecular species also obey dilute solution laws over a wider range of concentration than do ionic materials.
The various reaction equilibr.a are characterized by equations of the form
A + A n_i = A n (1)
with equilibrium constants K n and enthalpies of reaction AHn . If the reaction stops with dimerization then n equals 2. If an unlimited number of reaction species is permitted then n can have all integer values from 2 on. The heat of infinite dilution, —niipL, is defined as the heat obtained when an m molal solution ( 1 kg of solvent) is diluted with an infinite amount of solvent. With the above assumptions we may write
m<pL = (A*) A H A + (A,) (A H ,° + A H t°) + . . . (2)
where (An) is the molality of species A n and the plus sign arises because the dilution process reverses the direction of the reaction of eq 1. With knowledge of the equilibrium constants K n, m<pj_ can be expressed as
mip-L = K 2(A y A H 2° +
K 2K 3( A y ( A I h ° + A H A ) + . . . (3)
The molality of the solution is given by
m = (A) + 2 (A2) + 3(As) + . . .
= (A) + 2 t f2(A) 2 + S K J C t W + . . . (4)
If the equilibrium constants are known then in principle these equations provide the means for obtaining AH n° values from a set of <pl measurements at various values of m. The practical difficulty of obtaining several equilibrium constants forces consideration of simpler cases.
We are particularly interested in the case of unlimited values on n where all equilibrium constants have the same value ( K n = K ) and all enthalpies have the same value (AH n° = A H ° ). The combination of eq 3 and 4 subject to these conditions yields the following result
<Pl = A i r - ( A i r / K y ^ / m ) 1 - (5)
The arrangement of this equation shows that upon plotting <pl vs. a straight line should result.From the value of the slope and intercept both K and AH ° can be determined. It is of some interest to note that a straight-line plot of the parameters of eq 5 does not necessarily mean that a polymerization reac
tion occurs. For if one considers the case of simple dimerization, then one finds the following result
<Pl = (A H °/ 2 ) - :A ( A F ° /F ) ,/I(n / « ) 1/I (6)
where the only difference is the appearance of the factor of V , in the slope and intercept. Thus it is necessary to have auxiliary information, such as that given by the osmotic coefficient, to assess whether a particular equation is applicable. To avoid sign problems in eq 5 or 6 it is simplest to use the absolute magnitude of ¡pl and AH ° and then recognize that the signs of (pl and AH ° are the same.
When osmotic coefficient data (<p) are available, as in the case of 6 -methylpurine, 2 an alternate procedure is available. 14 For either of the two special cases of the preceding paragraph the value of AH ° is given by
AH ° = (pL/( 1 - (p) (7)
This result has been obtained before by Schellman13 14
for the limiting case of polymer formation.With the availability of two procedures for evaluating
AH ° values it should be possible to apply a test of the consistency of the assumptions upon which the equations are based, provided experimental data for heats of dilution and osmotic coefficients is available. In general one would expect the application of eq 7 to be more valid, particularly if an extrapolation can be made to very low concentrations, where dimerization becomes predominant.
Experimental Section
(a) M ateríais. Grade 16-methylpurine was obtained from Cyclo Chemical Corp., Los Angeles, Calif. Tests by D. Lorusso on this material have shown that its spectroscopic properties remained unchanged upon sublimation. Solutions were prepared with distilled water in a series of dilutions of equal volumes of a given solution and water. These solutions correspond to the way in which dilutions within the calorimeter are performed.
(b) D en sity D eterm inations. In order to convert molarity to molality for the prepared solutions, density measurements were made using a 2 -ml pycnometer with precision-bore (1-mm) side arms. Table I shows the solution densities along with concentrations of molality (m ) and molarity (M ).
(c) Calorim etric D eterm inations. Dilution measurements were made mixing equal volumes (0 . 1 0 0 0 ml) of solution with water at 25° within a flow microcalo-
(13) J. A . Schellm an, Compt. Rend. Trav. Lab. Carlsberg, 2 9 , N o . 14 (1955).(14) S. J. G ill, G . F . Sheats, and M . D ow n in g , in preparation .
Volume 71, Number 3 February 1967
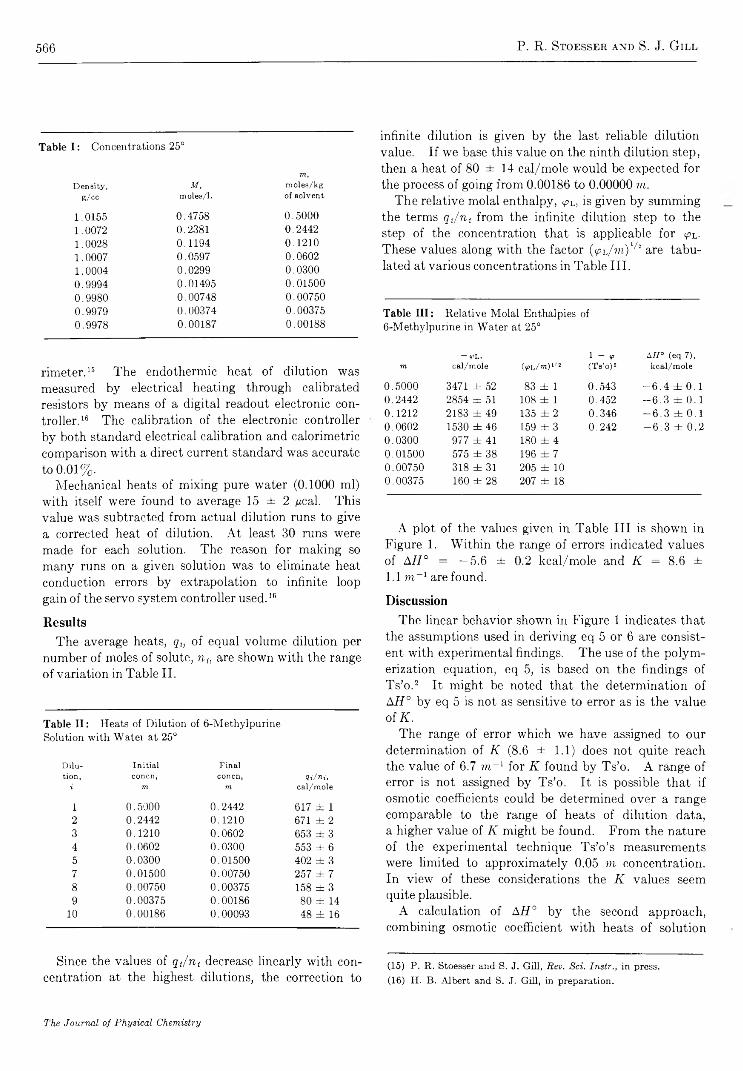
566 P. R. Stoesser and S. J. G ill
Table I: C oncentrations 25°
D e n s ity ,g /c c
M ,m o le s/1 .
7 7 1 ,
m o le s /k g o f so lv e n t
1 .0155 0 .4758 0 .5 0 0 01 .0072 0 .2381 0 .24421 .0028 0 .1 19 4 0 .1 21 01 .0007 0 .0597 0 .06021 .0 00 4 0 .0299 0 .0 3 0 00 .9 99 4 0.01495 0 .0 15 0 00 .9980 0 .00748 0 .007500 .9979 0 .00374 0 .003750 .9 97 8 0 .00187 0 .00188
rimeter. 16 The endothermic heat of dilution wasmeasured by electrical heating through calibrated resistors by means of a digital readout electronic controller. 16 The calibration of the electronic controller by both standard electrical calibration and calorimetric comparison with a direct current standard was accurate to 0 .0 1 %.
Mechanical heats of mixing pure water (0.1000 ml) with itself were found to average 15 ± 2 ¿¿cal. T h is
value was subtracted from actual dilution runs to give a corrected heat of dilution. At least 30 runs were made for each solution. The reason for making so many runs on a given solution was to eliminate heat conduction errors by extrapolation to infinite loop gain of the servo system controller used. 16
infinite dilution is given by the last reliable dilution value. If we base this value on the ninth dilution step, then a heat of 80 ± 14 cal/mole would be expected for the process of going from 0.00186 to 0 . 0 0 0 0 0 m.
The relative molal enthalpy, <px, is given by summing the terms q j n i from the infinite dilution step to the step of the concentration that is applicable for ¡px These values along with the factor ( < /> l / h i ) 1 / 2 are tabulated at various concentrations in Table III.
Table III: R e la tive M ola l Enthalpies of 6 -M eth ylpu rin e in W ater at 25°
m-*>l ,
cal/mole (i>L/m)1'»1 — <p (Ts’o)2
AH” (eq 7), kcal/mole
0 .5 0 0 0 3471 ± 52 83 ± 1 0 .5 4 3 - 6 . 4 ± 0 .10 .2 44 2 2854 ± 51 108 ± 1 0 .4 52 - 6 . 3 ± 0 .10.1212 2183 ± 49 135 ± 2 0 .3 4 6 - 6 . 3 ± 0 . 10 .0 60 2 1530 ± 46 159 ± 3 0 .2 4 2 - 6 . 3 ± 0 .20 .0 3 0 0 977 ± 41 180 ± 40 .01500 575 ± 38 196 ± 70 .00750 318 ± 31 205 ± 100 .00375 160 ± 28 207 ± 18
A plot of the values given in Table I II is shown in Figure 1. Within the range of errors indicated values of AH ° = —5.6 ± 0.2 kcal/mole and K = 8 . 6 ±1 . 1 to- 1 are found.
Discussion
ResultsThe average heats, qit of equal volume dilution per
number of moles of solute, n u are shown with the range of variation in Table II.
Table II: H eats of D ilu tion of 6 -M eth ylpu rin e Solu tion w ith W ater at 25°
D ilu In i t ia l F in a ltion , con cn , con cn , i i / n i ,
i 771 771 c a l/m o le
i 0 .5 00 0 0 .2442 617 ± 12 0 .2 44 2 0 .1 21 0 671 ± 23 0 .1 21 0 0 .0 60 2 653 ± 34 0 .0 60 2 0 .0 3 0 0 553 ± 65 0 .0 3 0 0 0 .01500 402 ± 37 0 .01500 0 .00750 257 ± 78 0 .00750 0 .00375 158 ± 39 0 .00375 0 .00186 80 ± 14
10 0 .00186 0 .00093 48 ± 16
The linear behavior shown in Figure 1 indicates that the assumptions used in deriving eq 5 or 6 are consistent with experimental findings. The use of the polymerization equation, eq 5, is based on the findings of Ts’o. 2 It might be noted that the determination of AH ° by eq 5 is not as sensitive to error as is the value of K .
The range of error which we have assigned to our determination of K (8 . 6 ± 1.1) does not quite reach the value of 6.7 m "_1 for K found by Ts’o. A range of error is not assigned by Ts’o. It is possible that if osmotic coefficients could be determined over a range comparable to the range of heats of dilution data, a higher value of K might be found. From the nature of the experimental technique Ts’o’s measurements were limited to approximately 0.05 m concentration. In view of these considerations the K values seem quite plausible.
A calculation of AH ° by the second approach, combining osmotic coefficient with heats of solution
Since the values of g</n, decrease linearly with con- (15) P. R. St0esser and s. j. G ill, Rev. S ti. in s tr ., in press,
centration at the highest dilutions, the correction to (16) H . B . A lb ert and S. J. G ill, in preparation .
The Journal of Physical Chemistry

Calorimetric Study of 6-Methylpurine 567
Figure 1.
data, can be made using eq 7. Ts’o has fitted his osmotic coefficient data to a sixth-degree polynomial which can be employed to calculate values of <p or 1 — <p at concentrations given in Table III. Since the osmotic coefficient data were taken on solutions above 0.05 m we shall apply Ts’o’s equation only to concentrations above this range. The values of 1 — ip (Ts’o) are given in Table I II along with the calculation of AH ° by eq7.
Whereas the application of eq 5 yields a value of AH ° = — 5.6 ± 0.2 kcal/mole, the application of eq 7 in conjunction with osmotic and calorimetric data yields a value of —6.3 ± 0.1 kcal/mole. This difference appears to be beyond experimental error and more likely reflects the different weight that each of the methods places upon the assumption of ideal solution behavior. The application of eq 7 should become increasingly accurate for more and more dilute solutions
where ideal solution behavior always occurs. Unfortunately osmotic coefficient data are most difficult to obtain at these low concentrations and so it seems the best that can be done at present is to assign a value for the heat of self-association of 6 -methylpurine in water at 25° as —6.0 ± 0.4 kcal/mole. With this value and Ts’o’s value2 of —1.1 kcal/mole for AG °, the value of A S ° is —16 ± 1 eu.
A value of AH ° in the range of — 6 kcal/mole indicates that the strength of the stacking interaction between these bases is relatively large. This is in at least qualitative agreement with studies on adenylic acid oligomers1 1 _ 1 2 which provide an estimate in the range of — 8 to —10 kcal/mole. A variety of factors such as steric effects and differences in electronic distribution are undoubtedly the cause of these differences. A number of theoretical calculations have been made of the interaction energies between purine and pyrimidine molecules using different basic assumptions.6 ' 17 A calculation by Vande Vorst and A. Pullman18 on 6 - methylpurine assuming vertical overlap of the ir- electron clouds has given a value of 0.37-0.43 in terms of Hiickel units. 18 With a conversion factor of16.5 kcal/b” ' unit19 the stabilization energy is between — 6.1 and —7.1 kcal/mole. It is difficult to assess the precise effect of solvent on these values. The theoretically calculated interaction energies are of a similar magnitude as those observed experimentally and the stacking picture offers a satisfactory explanation of the experimental observations.
Acknowledgm ents. We wish to acknowledge the assistance from the National Institutes of Health in the form both of research grant support and of fellowship support for one of us (P. R. S.). We also wish to acknowledge the many helpful discussions about this work with H. B. Albert and M. Downing.
(17) B . Pullm an, P . C laverie, and J. C aillet, Compt. R end., 260, 5387 (1965).(18) A . V ande V orst and A . Pullm an, ibid., 261, 827 (1965).(19) R . D audel, R . L efevore , and C . M oser, “ Q uantum C h em istry— M eth od s and A p p lica tion s,’ ’ In terscience P ublishers, In c ., N ew Y o rk , N . Y „ 1961, p 177.
Volume 71, Number 3 February 1967
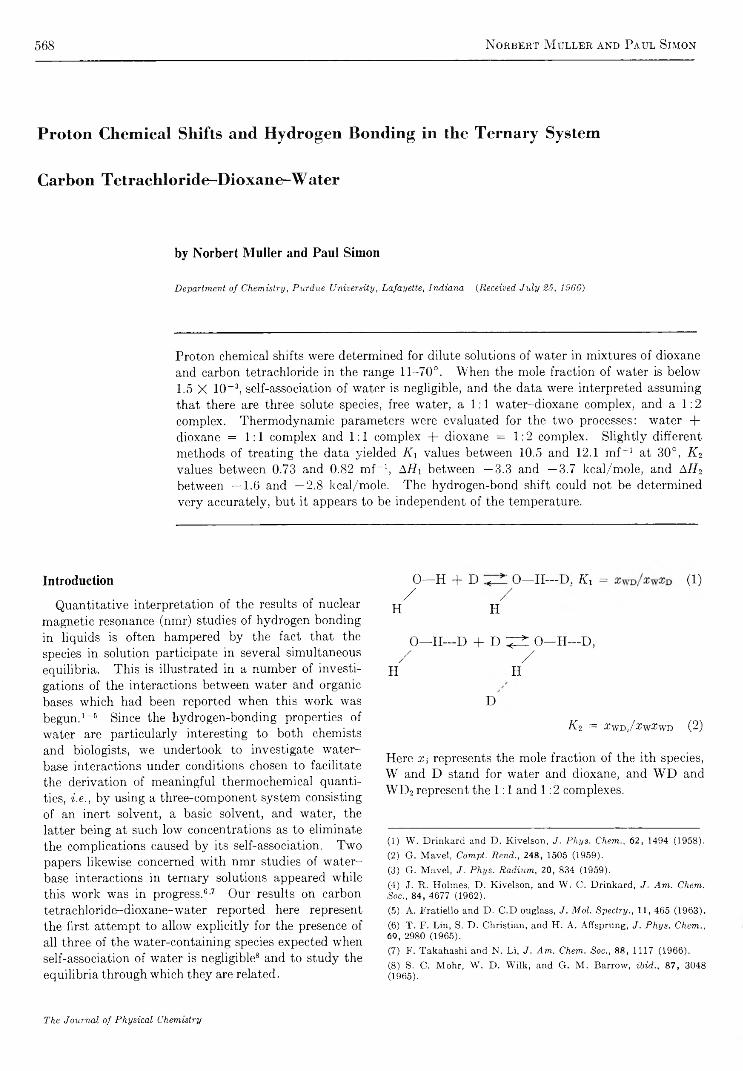
568 Norbert M uller and Paul Simon
Proton Chemical Shifts and Hydrogen Bonding in the Ternary System
Carbon Tetrachloride-Dioxane-Water
by Norbert Muller and Paul Simon
Departm ent o f C hem istry, P urdu e U niversity, L afayette, Indian a {Received Ju ly 25, 1966 )
Proton chemical shifts were determined for dilute solutions of water in mixtures of dioxane and carbon tetrachloride in the range 11-7 0 °. When the mole fraction of water is below1.5 X 10 -3, self-association of water is negligible, and the data were interpreted assuming that there are three solute species, free water, a 1 : 1 water-dioxane complex, and a 1 : 2
complex. Thermodynamic parameters were evaluated for the two processes: water + dioxane = 1 : 1 complex and 1 : 1 complex + dioxane = 1 : 2 complex. Slightly different methods of treating the data yielded K , values between 10.5 and 12 .1 mf- 1 at 30°, K 2 values between 0.73 and 0.82 mf- 1 , A H , between —3.3 and —3.7 kcal/mole, and AH 2 between —1.6 and —2,8 kcal/mole. The hydrogen-bond shift could not be determined very accurately, but it appears to be independent of the temperature.
Introduction
Quantitative interpretation of the results of nuclear magnetic resonance (nmr) studies of hydrogen bonding in liquids is often hampered by the fact that the species in solution participate in several simultaneous equilibria. This is illustrated in a number of investigations of the interactions between water and organic bases which had been reported when this work was begun. 1 - 6 Since the hydrogen-bonding properties of water are particularly interesting to both chemists and biologists, we undertook to investigate water- base interactions under conditions chosen to facilitate the derivation of meaningful thermochemical quantities, i.e., by using a three-component system consisting of an inert solvent, a basic solvent, and water, the latter being at such low concentrations as to eliminate the complications caused by its self-association. Two papers likewise concerned with nmr studies of water- base interactions in ternary solutions appeared while this work was in progress.6’7 Our results on carbon tetrachloride-dioxane-water reported here represent the first attempt to allow explicitly for the presence of all three of the water-containing species expected when self-association of water is negligible8 and to study the equilibria through which they are related.
O—H T D O—H— 1). K , = (1)/ /
H H
O—H—D + D ^ i O—H—D,/ /
H H
D
K i = XwdJ%wXwd (2 )
Here aq represents the mole fraction of the ith species, W and D stand for water and dioxane, and WD and WD2 represent the 1 : 1 and 1 : 2 complexes. 1 2 3 4 5 6 7 8
(1) W . D rin kard and D . K ive lson , J. Phys. Chem., 6 2 , 1494 (1958).(2) G . M a vel, Compt. Rend., 248, 1505 (1959).(3 ) ‘ G . M a vel, J. Phys. Radium, 20, 834 (1959).(4) J. R . H olm es, D . K ive lson , and W . C. D rin kard , J. Am. Chem. Soc., 84, 4677 (1962).(5) A. F ratie llo and D . C .D ouglass, J. Mol. Spectry., 11, 465 (1 96 3 ),(6) T . F. L in , S. D . C hristian, and H. A . A ffspru ng, J. Phys. Chem., 69, 2980 (1965).(7 ) F . T ak ahash i and N . L i, J. Am. Chem. Soc., 88, 1117 (1966 ).(8 ) S. C. M oh r, W . D . W ilk , and G . M . B arrow , ibid., 8 7 , 3048 (1965).
The Journal of Physical Chemistry

Proton Chemical Shifts and Hydrogen Bonding 569
Experimental Procedures and Results9
Mallinckrodt SpectrAR grade carbon tetrachloride was dried with phosphorus pentoxide and transferred to a storage bulb containing Linde 5A Molecular Sieve pellets. Technical grade dioxane was purified by standard methods, 10 the product from the final distillation being collected under nitrogen and immediately transferred to a storage bulb, painted black to exclude light, attached to the vacuum line. Water from the laboratory distilled water supply was vacuum transferred into a third storage bulb.
Nmr samples were made on a vacuum manifold equipped with several calibrated reservoirs so that desired amounts of material could be measured by volume, assuming ideal-gas behavior. To determine pressures, the vapor in the measuring bulb was equilibrated with the appropriate liquid in the storage bulb maintained at a known temperature by an external cooling bath. Each tube was sealed under vacuum and stored when not in use in a lightproof container kept at about —15°. This precaution was adopted after preliminary observations had shown that storage of samples under ordinary laboratory illumination resulted in a progressive displacement of the water peak to lower fields, presumably a consequence of photolysis of the mixture. 1 1 Such samples also showed an impurity peak, apparently chloroform, which was absent otherwise.
Chem ical-shift determ inations were made with a Yarian V-4311 spectrometer operated at 56.4 MHz and equipped with a VK-3529 high-sensitivity kit and V-4340 variable-temperature probe assembly. Shifts were measured by the side-band technique and represent averages of four or more sweeps in each direction, with mean deviations of about 0.3 Hz. Temperatures were maintained constant to within about ± 1 ° of the reported values. Dioxane was used as an internal reference except for the solutions of water in “ pure” carbon tetrachloride, where a trace of added cyclohexane was used instead. To allow conversion of the data to a scale based on tetramethylsilane (TMS) we examined a mixture of dioxane, cyclohexane, and TM S dissolved in a large excess of carbon tetrachloride and found the dioxane peak at —3.57 ppm and the cyclohexane peak at —1.44. The shift difference between dioxane and cyclohexane changes considerably if a major change is made in the solvent, 9 but we found that for cyclohexane dissolved in a mixture of dioxane and carbon tetrachloride it is essentially independent of the dioxane: carbon tetrachloride ratio.
Results at four temperatures are reported in Table I for several sets of samples, each with varying water
concentrations at a fixed solvent composition specified by the parameter
S = (moles of dioxane)/'
(moles of dioxane + moles of CC14) (3)
Since the mole fraction of water never exceeded 1.5 X 10 - 3 except when S = 1, <S is for all practical purposes equal to the mole fraction of dioxane. Some of the more dilute samples were not examined at all temperatures because the spectrometer sensitivity was reduced during operation at other than room temperature.
T ab le i : C hem ical Sniftc as a F u n ction o f C om position and Tem perature for D ilu te Solutions o f W ater in D iox a n e -C a rb on T etrach loride M ixtures
S o lv e n t W a te rcom p n , eoncn,
S m f X 10< i i ° 3 0 ° 5 0 ° 7 0 °
0 1 .9 6 1 4 0 .4 “3 .9 9 1 4 0 .3 “6 .4 3 1 3 9 .1 “ 1 4 0 .6 “ 1 4 2 .3 “ 1 4 3 .8 “
10 .5 1 3 9 .3 “ 1 4 0 .4 “ 1 4 2 .2 “
0 .0567 4 .1 8 116 .07 .2 6 109 .3 117.1 123 .2 128 .18 .2 0 109 .9 116 .9 1 2 3 .0 127 .6
13 .8 109 .3 115 .7 1 2 2 .0 1 2 8 .0
0 .1 3 3 .4 1 1 0 4 .44 .0 4 9 7 .4 1 0 3 .85 .6 5 9 7 .6 1 0 4 .5 111 .1 117 .78 .0 1 1 0 3 .8 1 1 0 .0 1 1 6 .2
1 0 .4 9 4 .2 1 0 3 .4 109 .9 116 .3
0 .1 6 2 .8 9 9 3 .5 100 .836 9 0 .4 1 0 0 .0 105 .9 112 .53 .6 4 9 4 .0 100 .96* 9 2 .4 1 0 0 .0 106 .7 113 .06 .4 0 9 3 .1 1 0 0 .29 .8 7 9 0 .5 9 8 .7 106 .2 1 1 2 .4
0 .3 6 4 .4 6 7 8 .8 8 4 .44 .8 8 7 8 .2 8 5 .57 .3 5 8 4 .6 9 1 .3
14 .1 7 8 .7 8 5 .8 9 1 .9 9 8 .2
1 .0 0 5 .7 9 6 1 .7 7 6 .61 3 .8 6 2 .1 7 6 .6
115 5 9 .2 6 4 .3 7 0 .5 7 5 .9
“ M easured from cyclohexan e and con verted to th e dioxane scale b y adding 120.0 H z. 6 Sam ples in w hich the w ater con centration was know n on ly to w ith in a bou t ± 2 0 % . c Values are in H z at 56.4 M H z from dioxane, internal reference.
(9) F or a d d itiona l details, see P . S im on , P h .D . T hesis, P urdue U n iversity , 1966.(10) A . I . V oge l, “ P ractica l O rganic C h em istry ," L ongm ans, G reen and C o., L td ., L on d on , 1951, p 175.(11) S. Forsen, A cta Chem. Scand., 14, 231 (1960).
Volume 71, Number 3 February 1967

570 Norbert M uller and Paul Simon
Obtaining data for very dilute samples at S = 1 proved difficult because the water peak lies in the same region as the multiplet C 13 satellite signal of the diox- ane. 12 At 70° the water peak is upheld of these interfering peaks if the spectrometer is operated at 60 MHz, and the data reported at this temperature were obtained on a Varian A-60 and corrected to 56.4 MHz.
Discussion
The data in Table I show no systematic variation of the chemical shift with changing water concentration below 1.5 X 10 ~ 3 mole fraction. This supports the conclusion (also implied by Figure 1 of ref 6 ) that self-association of water is negligible in this concentration range. Hence the average of the observed shifts at any particular value of S may be equated with the limiting value approached at zero water concentration. (The results for S = 1 include one sample with a much higher water concentration, which must be left out in taking the average.) The resulting values are presented in Table II. In this table, the origin of the chemical-shift scale has been changed for convenience in the subsequent analysis, the shifts at each temperature being referred to the observed shift at S = 0 at that temperature. It should be noted that the
T a b le I I : V a lu es o f 5 — Sw as a F u n c t io n o f S o lv e n t C o m p o s it io n an d T e m p e ra tu re
Solventcompn,
S 11° 30 ° 50° 70°
0 (0) (0) (0) (0)0.0567 -2 9 .7 -2 4 .0 -1 9 .6 -1 5 .90.13 -4 2 .8 -3 6 .4 -3 2 .0 -2 7 .10.16 -4 7 .1 -4 0 .3 -3 6 .0 -3 1 .20.36 -6 0 .6 -5 5 .3 -5 0 .7 -4 5 .61.00 -7 7 .3 -7 3 .9 “ -7 0 .5 “ -6 7 .2
: O btained b y linear interpolation betw een the m easuredv a lu e s a t I I a n d 7 0 ° .
signal from water in “ pure” carbon tetrachloride moves linearly to somewhat higher fields as the temperature is raised. This must be ascribed to a temperature dependence of the solvent effect of carbon tetrachloride on the water and not to water self-association effects.
For the three water-containing species participating in reactions 1 and 2 the exchange-averaged hydroxyl chemical shift will be given by
5 = Or-wSw + Z w d Sw d -f- £ w d 25 w d 2) /
( x w + £ w d + X w d 2) (4)
or, introducing the equilibrium constants and the parameter S
8 = (5w + K iS8\yd + A iA 2»S25wd2)/
( 1 + K J5 + K iK z S 2) (5)
The dependence of 5 on S at each temperature is then governed by the five parameters, 5w, 5wd, 6w d 2, K\, and K 2. Complete analysis of the data also requires the evaluation of the temperature coefficient of each 8 and of the two reaction enthalpies. The available information, however, does not suffice for the accurate determination of ten unknowns, and one is forced to adopt, at least provisionally, some simplifying assumptions.
We assumed that at each temperature the shifts of the free-water monomer and of the free-OH proton in the 1 : 1 complex are the same and equal to the measured shift at S = 0. We further assumed that the bridging protons have the same shift in WD as in WD2. It then follows that
8 w d = 0.5 (5w + 5wd2) (6)
One set of calculations made with the alternative assumption 5 W d = 0.455w + 0 . 5 5 5 w d 2 is discussed below. Equation 5 then yields
8 — 5w = (5wd2 — Sw)-Ku$(l + 2K2S ) /
2(1 + K rS + K 1K 2S 2) (7)
The left member of eq 7 is the observed shift referred to the shift at S = 0, displayed in Table II. The parameters remaining to be determined at each temperature are the two equilibrium constants and the “ total hydrogen-bond shift” defined as 5b = 5Wd2 — 5w-
To obtain a preliminary value of K i one may use an estimated value of 5b and the datum at S = 0.0567, noting that for small values of S eq 7 reduces to
8 - 5W M TiS/2(l + K VS) (8 )
The result is that K\ lies between 10 and 20, which suggests that K 2 may be approximated using the datum at S = 1 and
(5 - M w = *>(1 + 2Kt)/2(l + K 2) (9)
This gives K 2 values of the order of unity, much smaller than the values of K\. Indeed, all attempts to fit the data with the restriction K\ — K 2 give very poor results.
Best values of K\, K 2, and 5b were obtained by a least- squares method using an IBM 7094 digital computer. 13 * 506
(12) N . S heppard and J. J. T urner, P roc . R oy . Soc. (L o n d o n ), A 2S2,506 (1959).
The Journal of Physical Chemistry

Proton Chemical Shifts and Hydrogen Bonding 571
T a b le I I I : Least-Squares Param eters O btained w ith Several A lternative Assum ptions
11° 3 0 ° 5 0 ° 7 0 °
K i (m f *) 1 9 .5 12.1 8 .8 6 .3A. B est fit w ith K i (m f-1 ) 1 .2 0 .8 2 0 .6 3 0 .5 2
5wd = 0 .5 (5w + 5wd2) 5b (H z ) - 1 0 2 . 3 - 1 0 6 .2 - 1 0 8 . 4 - 1 0 9 . 9Std d ev (H z) 0 .3 1 0 .5 5 0 .3 5 9 0 .5 9
B . B est fit w ith Kr 1 8 .7 12.1 9 .0 6 .65wd = 0 .5 (5 w + 5wd2) K i 0 .9 9 0 .8 2 0 .6 9 0 .6 0and 5b = — 106 .2 Std dev 0 .3 3 0 .5 5 0 .3 6 3 0 .6 0
C. B est fit w ith 5wd = 0 . 455w T 0 . 555wd2
A ,K i5b
15 .90 .8 9
- 1 0 4 . 4
10 .50 .7 3
- 1 0 4 . 7
7 .90 .6 0
- 1 0 5 . 2
5 .80 .5 0
- 1 0 6 . 3^Std dev 0 .5 0 0 .7 9 0 .5 8 0 .7 5
For a series of trial values of K 2, K j , and 5b were each adjusted until the standard deviation between the observed shifts and values calculated by eq 7 was minimized. The best K 2 was considered to be the value which gave the smallest minimal standard deviation. The results are shown in part A of Table III, and the agreement between calculated and observed shifts at 30° is illustrated in Figure 1. The room- temperature values, K i = 1 2 . 1 and f f 2 = 0.82 mf- 1 , from Table I I I were used to calculate the fraction of the total water present in each of the three forms, W, WD, and WD2, as a function of solvent composition. The results, presented graphically in Figure 2 , show that even at high S values a substantial amount of the 1 : 1 complex is present and the concentration of unbonded water monomers remains appreciable.
Obviously the 5b values at different temperatures do not agree well with one another. Indeed, one of the objectives of the present study was to find whether or not 5b would become smaller with increasing temperature, as suggested by observations on carboxylic acids. 13 1 4 15’16 Table I II shows a trend in the opposite direction. This could be rationalized if 5wd2 were to have a fixed value relative to TM S or cyclohexane, since 5wd does not, but it seems doubtful that the trend is significant. To test this, two additional calculations were made9 in which 5b was assigned the temperature-independent value of —106.2 or —108.0 Hz and the K values were adjusted to fit the data. Results of one of these calculations are given in part B of Table III. The agreement with the experimental values is very nearly as good as it is for the “ best” fit, and one must conclude that the measurements do not allow 5b to be evaluated with an uncertainty less than perhaps ± 5 Hz.
Fortunately the equilibrium constants obtained with 5b fixed are not very different from the best-fit values,
Figure 1. Chem ical shift (5 — 5W) as a fu n ction o f so lven t com position at 30°. T h e solid curve represents ca lcu lated values using param eters from part A o f T ab le I I I .
and the same applies for Affi, obtained from a plot of In K i against 1/T (see Figure 3). Aff2, similarly evaluated, is somewhat more sensitive to changes in 5b. These enthalpies are given in Table IV with the corresponding entropy changes. The latter were calculated first with the K values referred to concentrations in mf units and again with K values reexpressed in atm - 1 to facilitate comparison with the tabulated values. 16 The results are in good general agreement with values for somewhat similar systems reported in ref 6 and 7.
(13) W e are indebted t o P rofessor M . L askow ski, Jr., and M r. W . R . F inken stadt fo r the loan o f a com p u ter p rogra m and assistan ce in using it.(14) N . M u ller and R . C . R eiter, J . Chem. P h ys ., 4 2 , 3265 (1965), and references g iven there.(15) N . M u ller and O. R . H ughes, J . P h ys. Chem ., in press.(16) G . C . P im entel and A . L . M cC lellan , “ T h e H yd rogen B o n d ,” W . H . F reem an and C o ., San F rancisco , C alif., 1960, A p pen d ix B .
Volume 71, Number 3 February 1967
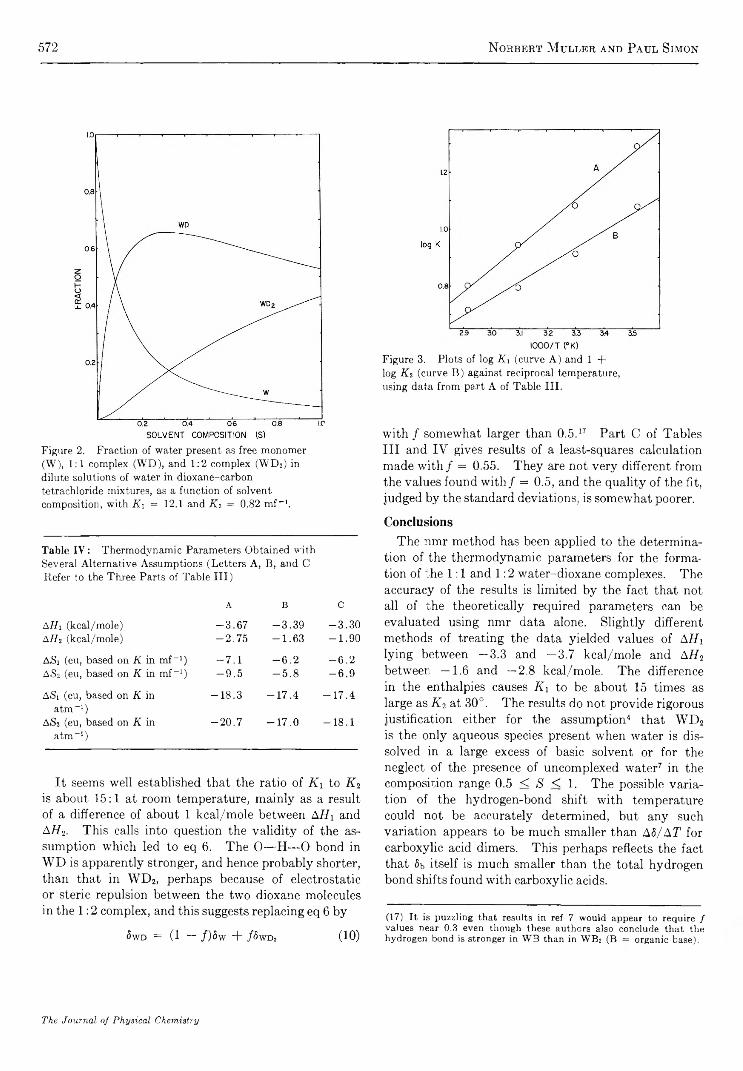
572 Norbert M uller and Paul Simon
Figure 2. Fraction o f w ater present as free m onom er (W ), 1 :1 com plex (W D ), and 1 :2 com plex (W D 2) in dilute solutions o f water in d iox an e-carbon tetrachloride mixtures, as a function of so lven t com position , w ith K 1 = 12.1 and K 2 = 0.82 m f-1 .
T able I V : T h erm odyn am ic Param eters O btained w ith Several A lternative Assum ptions (L etters A , B , and C R efer to the T h ree Parts o f T a b le I I I )
A B C
AHi (k ca l/m o le ) - 3 . 6 7 - 3 . 3 9 - 3 . 3 0AH2 (k ca l/m o le ) - 2 . 7 5 - 1 . 6 3 - 1 . 9 0
ASi (eu, based on K in m f-1 ) - 7 . 1 - 6 . 2 - 6 . 2AS2 (eu, based on K in m f-1 ) - 9 . 5 - 5 . 8 - 6 . 9
ASi (eu, based on K in - 1 8 . 3 - 1 7 . 4 - 1 7 . 4a tm -1 )
A Si (eu, based on K in - 2 0 . 7 - 1 7 . 0 - 1 8 . 1a tm -1 )
It seems well established that the ratio of K\ to K 2 is about 1 5 : 1 at room temperature, mainly as a result of a difference of about 1 kcal/mole between A H i and AH 2. This calls into question the validity of the assumption which led to eq 6 . The 0 —H—0 bond in WD is apparently stronger, and hence probably shorter, than that in WD2, perhaps because of electrostatic or steric repulsion between the two dioxane molecules in the 1 : 2 complex, and this suggests replacing eq 6 by
5wd = (1 — /)5w + fS wo, (10)
Figure 3. P lots o f log K i (curve A ) and 1 + log K i (curve B ) against reciprocal tem perature, using data from part A o f T ab le III .
with / somewhat larger than 0.5. 17 Part C of Tables I I I and IV gives results of a least-squares calculation made w ith/ = 0.55. They are not very different from the values found with/ = 0.5, and the quality of the fit, judged by the standard deviations, is somewhat poorer.
ConclusionsThe nmr method has been applied to the determina
tion of the thermodynamic parameters for the formation of the 1 : 1 and 1 :2 water-dioxane complexes. The accuracy of the results is limited by the fact that not all of the theoretically required parameters can be evaluated using nmr data alone. Slightly different methods of treating the data yielded values of A H i lying between —3.3 and —3.7 kcal/mole and AH 2 between —1.6 and —2.8 kcal/mole. The difference in the enthalpies causes K i to be about 15 times as large as K 2 at 30°. The results do not provide rigorous justification either for the assumption4 that WD2
is the only aqueous species present when water is dissolved in a large excess of basic solvent or for the neglect of the presence of uncomplexed water7 in the composition range 0.5 < S < 1. The possible variation of the hydrogen-bond shift with temperature could not be accurately determined, but any such variation appears to be much smaller than A8/AT for carboxylic acid dimers. This perhaps reflects the fact that 6b itself is much smaller than the total hydrogen bond shifts found with carboxylic acids.
(17) It is puzzling that results in ref 7 would appear to require / values near 0.3 even though these authors also conclude that the hydrogen bond is stronger in W B than in W B 2 (B — organic base).
The Journal of Physical Chemistry

Enthalpy and Entropy of D ilution of Quaternary Ammonium Halides 573
Structural Effects on the Enthalpy and Entropy of Dilution of Aqueous
Solutions of the Quaternary Ammonium Halides at 2 5 ° 1
by G. E. Boyd, J. W . Chase, and F. Vaslow
Oak Ridge N ational Laboratory, Oak R idge, Tennessee 37830 (Received J u ly 29, 1966)
Heats of dilution and solution measurements at 25° were performed on the quaternary ammonium halides derived from tétraméthylammonium chloride and bromide by substituting either a /3-hydroxyethyl or a benzyl group, or both, for methyl groups. Heat was absorbed on dilution of all the salts except with (/3-hydroxyethyl)benzyldimethyl- ammonium fluoride whose solutions evolved heat. Values of the relative partial molal entropy, Si — S i° , of water in these solutions were derived by combining the measured apparent molal heat contents, <J>l, with free energies computed from osmotic and activity coefficient determinations. The replacement of a methyl group in the tétraméthylammonium cation by either a /3-hydroxyethyl or a benzyl group lowered 5, — S i° at all concentrations. These changes were interpreted in terms of the relative “ water-structurebreaking” efficiencies of the quaternary ammonium cations or of the direct interaction of the cation with individual water molecules. Comparisons between the standard heats of halide ion exchange, AH ° , for cross-linked polystyrene type strong-base exchangers containing structurally bound (/3-hydroxyethyl)benzyldimethylammonium groups and values of A^L° for the corresponding “ model compound” halides indicated that the anion exchangers became more like concentrated aqueous electrolyte mixtures as their cross- linking increased.
This paper will report findings made in additional studies on the thermodynamics of aqueous solutions of a series of quaternary ammonium halides derived by substitution of one or more of the methyl groups in the tétraméthylammonium cation. Osmotic and mean molal activity coefficient measurements have been published recently on the resultant compounds. 2
Substitution of a /3-hydroxyethyl for a methyl group in tétraméthylammonium (TMA) chloride or bromide produced a salt whose osmotic and activity coefficients were lower than those for TM A at all concentrations up to near saturation. It was suggested that the increased “ water-structure-breaking” action of a /3- hydroxyethyl compared with a methyl group was the cause for the smaller coefficients of the choline halides relative to the TM A salts. Structure breaking should be reflected in other thermodynamic properties of these solutions, such as in the entropy of dilution, for example, and, therefore, determinations of the apparent molal heat contents (i .e ., heats of dilution to infinite
dilution) of aqueous choline chloride and bromide solutions were undertaken. These measurements were combined with the osmotic and activity coefficient values for these salts to give dilution entropies.
Additional thermochemical measurements were made on solutions of benzyltrimethylammonium chloride and bromide and on (/3-hydroxyethyl)benzyldimethyl- ammonium fluoride, chloride, bromide, and iodide. These compounds were of interest in addition to the fact that they are derived from tétraméthylammonium halide because they are “ model compounds” for two important types of strong-base anion exchangers of which Dowex-1 and Dowex-2, respectively, are examples. Derived free energy and heat of dilution
(1) P resented be fore the D iv is ion of P hysica l C hem istry, 152nd N ation a l M eetin g o f th e A m erican C hem ical S ociety , N ew Y o rk , N . Y ., Sept 1966. R esearch sponsored b y th e U . S. A to m ic E nergy C om m ission under con tract w ith th e U n ion C arbide C orp.(2) G . E . B o y d , A . Schw arz, and S. L indenbaum , J. P hys. Chem., 70, 821 (1966).
Volume 71, Number 8 February 1967
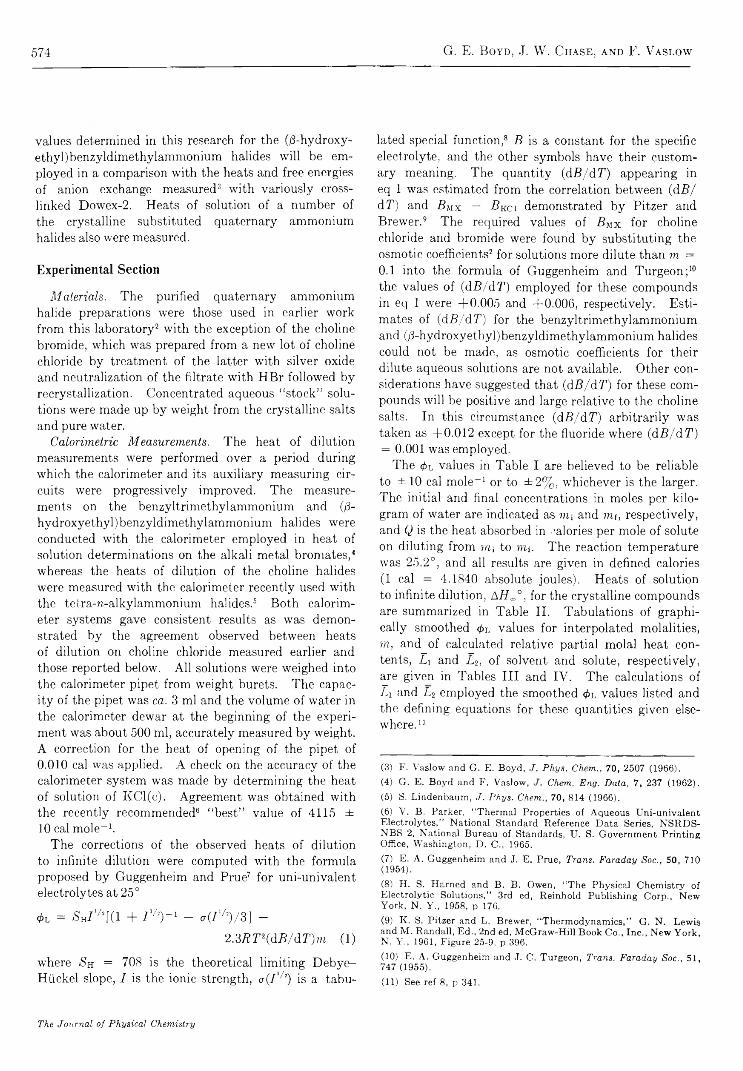
574 G. E. Boyd, J. W. Chase, and F. Vaslow
values determined in this research for the (/3-hydroxy- ethyl) benzyldimethylammonium halides will be employed in a comparison with the heats and free energies of anion exchange measured3 with variously cross- linked Dowex-2. Heats of solution of a number of the crystalline substituted quaternary ammonium halides also were measured.
Experimental Section
M aterials. The purified quaternary ammonium halide preparations were those used in earlier work from this laboratory2 with the exception of the choline bromide, which was prepared from a new lot of choline chloride by treatment of the latter with silver oxide and neutralization of the filtrate with HBr followed by recrystallization. Concentrated aqueous “ stock” solutions were made up by weight from the crystalline salts and pure water.
Calorim etric M easurem ents. The heat of dilution measurements were performed over a period during which the calorimeter and its auxiliary measuring circuits were progressively improved. The measurements on the benzyltrimethylammonium and (/3- hydroxyethyl)benzyldimethylammonium halides were conducted with the calorimeter employed in heat of solution determinations on the alkali metal bromates,4 5
whereas the heats of dilution of the choline halides were measured with the calorimeter recently used with the tetra-n-alkylammonium halides.6 Both calorimeter systems gave consistent results as was demonstrated by the agreement observed between heats of dilution on choline chloride measured earlier and those reported below. All solutions were weighed into the calorimeter pipet from weight burets. The capacity of the pipet was ca. 3 ml and the volume of water in the calorimeter dewar at the beginning of the experiment was about 500 ml, accurately measured by weight. A correction for the heat of opening of the pipet of 0.010 cal was applied. A check on the accuracy of the calorimeter system was made by determining the heat of solution of KCl(c). Agreement was obtained with the recently recommended6 “ best” value of 4 115 ± 1 0 cal mole- 1 .
The corrections of the observed heats of dilution to infinite dilution were computed with the formula proposed by Guggenheim and Prue7 for uni-univalent electrolytes at 25°
0L = S h / 1 / ! [ ( 1 + I ' h ) ~ l - * ( I l h ) / 3 ] -
2 .3 R T 2(d B / d T )m (1)
where Sn = 708 is the theoretical limiting Debye- Hückel slope, I is the ionic strength, a ( I l/!) is a tabu
lated special function,8 B is a constant for the specific electrolyte, and the other symbols have their customary meaning. The quantity (dB/dT) appearing in eq 1 was estimated from the correlation between (dB/ dT) and B Mx — B KCi demonstrated by Pitzer and Brewer.9 The required values of B Mx for choline chloride and bromide were found by substituting the osmotic coefficients2 for solutions more dilute than m = 0.1 into the formula of Guggenheim and Turgeon ; 10
the values of (d B / d T ) employed for these compounds in eq 1 were +0.005 and +0.006, respectively. Estimates of (d B / d T ) for the benzyltrimethylammonium and (/3-hydroxyethyl)benzyldimethylammonium halides could not be made, as osmotic coefficients for their dilute aqueous solutions are not available. Other considerations have suggested that (d B / d T ) for these compounds will be positive and large relative to the choline salts. In this circumstance (dB/dT) arbitrarily was taken as + 0 .0 12 except for the fluoride where (dB/dT) = 0 . 0 0 1 was employed.
The 0l values in Table I are believed to be reliable to ± 1 0 cal mole- 1 or to ± 2 %, whichever is the larger. The initial and final concentrations in moles per kilogram of water are indicated as m; and m it respectively, and Q is the heat absorbed in calories per mole of solute on diluting from m ; to nif. The reaction temperature was 25.2°, and all results are given in defined calories (1 cal = 4.1840 absolute joules). Heats of solution to infinite dilution, AH „ ° , for the crystalline compounds are summarized in Table II. Tabulations of graphically smoothed </>l values for interpolated molalities, m, and of calculated relative partial molal heat contents, Li and L 2, of solvent and solute, respectively, are given in Tables I II and IV. The calculations of T\ and U employed the smoothed <£l values listed and the defining equations for these quantities given elsewhere. 1 1
(3) F . V aslow and G . E . B o y d , J. P h ys . Chem ., 70, 2507 (1966).(4) G . E . B o y d and F . V aslow , Chem. Eng. D ata, 7 , 237 (1962 ).(5) S. L indenbaum , J . P h ys. Chem., 70, 814 (1966).(6) V . B . Parker, “ T herm al P roperties o f A qu eou s U n i-un ivalen t E le c tro ly te s ,” N ation a l S tandard R eferen ce D a ta Series, N S R D S - N B S 2, N ation a l B ureau o f Standards, U . S. G ov ern m en t P rin tin g Office, W ash ington , D . C ., 1965.
(7) E . A . G uggenheim and J. E . Prue, Trans. Faraday Soc., 50, 710 (1954).
(8) H . S. H arned and B . B . Ow en, “ T h e P hysica l C h em istry o f E lec tro ly tic S olu tion s,” 3rd ed, R e in h old P u b lish in g C orp ., N ew Y ork , N . Y ., 1958, p 176.
(9) K . S. P itzer and L . Brew er, “ T h e rm o d y n a m ics ,” G . N . L ew is and M . R an dall, E d ., 2nd ed, M cG ra w -H ill B o o k C o ., In c ., N ew Y o r k , N . Y ., 1961, F igure 25-9, p 396.
(10) E . A . G u ggenheim and J. C . T u rgeon , Trans. F araday Soc., 51, 747 (1955).(11) See ref 8, p 341.
The Journal o f P hysica l Chem istry
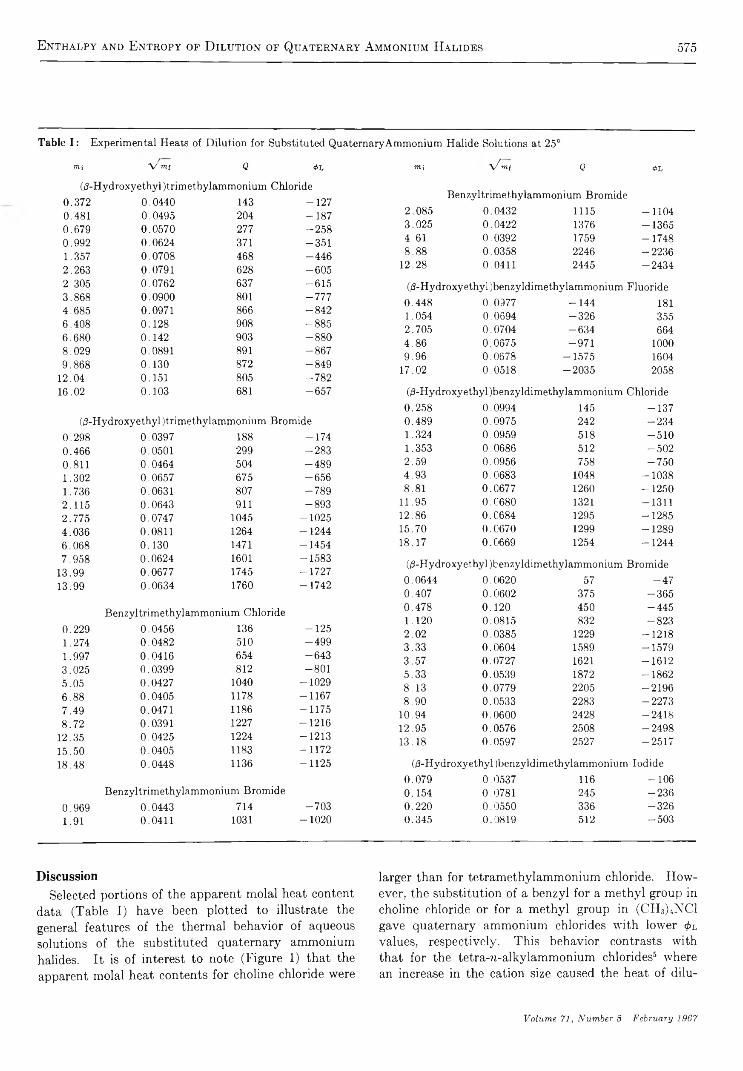
Enthalpy and Entropy of D ilution of Quaternary Ammonium Halides 575
Table I : E xperim ental H eats o f D ilu tion for Substituted Q uaternaryA m m onium H alide Solutions at 25°
m-, V mi Q ¿L
(/3-H ydroxyethyl )trim ethylam m onium C hloride0 .3 7 2 0 .0 44 0 143 - 1 2 70 .481 0 .0 49 5 204 - 1 8 70 .6 79 0 .0 5 7 0 277 - 2 5 80 .9 9 2 0 .0 62 4 371 - 3 5 11.357 0 .0 70 8 468 - 4 4 62 .2 6 3 0 .0791 628 - 6 0 52 .3 0 5 0 .0 76 2 637 - 6 1 53 .8 6 8 0 .0 9 0 0 801 - 7 7 74 .6 8 5 0 .0971 866 - 8 4 26 .4 0 8 0 .1 2 8 908 - 8 8 56 .6 8 0 0 .1 4 2 903 - 8 8 08 .0 29 0 .0891 891 - 8 6 79 .8 6 8 0 .1 3 0 872 - 8 4 9
12 .04 0 .151 805 - 7 8 216 .02 0 .1 0 3 681 - 6 5 7
(/3-H ydroxyethyl )trim ethylam m onium B rom ide
0 .2 98 0 .0 39 7 188 - 1 7 40 .4 66 0 .0501 299 - 2 8 30.811 0 .0464 504 - 4 8 91.302 0 .0 65 7 675 - 6 5 61 .736 0 .0631 807 - 7 8 92 .1 1 5 0 .0643 911 - 8 9 32 .7 7 5 0 .0 74 7 1045 - 1 0 2 54 .0 3 6 0 .0811 1264 - 1 2 4 46 .0 6 8 0 .1 3 0 1471 - 1 4 5 47 .9 5 8 0 .0 62 4 1601 - 1 5 8 3
13 .99 0 .0 67 7 1745 - 1 7 2 71 3 .99 0 .0 63 4 1760 -1 7 4 2
B en zyltrim ethylam m oniu m C hloride
0 .2 29 0 .0 45 6 136 - 1 2 51.274 0 .0 48 2 510 - 4 9 91.997 0 .0 41 6 654 - 6 4 33 .0 25 0 .0 39 9 812 - 8 0 15 .0 5 0 .0427 1040 - 1 0 2 96 .8 8 0 .0 40 5 1178 - 1 1 6 77 .4 9 0 .0471 1186 - 1 1 7 58 .7 2 0 .0391 1227 - 1 2 1 6
12 .35 0 .0 42 5 1224 - 1 2 1 315 .50 0 .0405 1183 - 1 1 7 218 .48 0 .0 44 8 1136 - 1 1 2 5
B en zyltrim ethylam m oniu m B rom ide
0 .9 69 0 .0443 714 - 7 0 31 .91 0 .0411 1031 - 1 0 2 0
mi y/m i Q 0L
B enzyltrim ethylam m onium B rom ide2 .0 8 5 0 .0432 1115 — 11043 .0 2 5 0 .0 42 2 1376 — 13654 .6 1 0 .0392 1759 - 1 7 4 88 .8 8 0 .0 35 8 2246 - 2 2 3 6
12 .28 0 .0411 2445 - 2 4 3 4
(/3-H ydroxyethyl)benzyldim ethylam m onium Fluoride0 .4 4 8 0 .0 97 7 - 1 4 4 1811 .0 54 0 .0 69 4 - 3 2 6 3552 .7 0 5 0 .0 70 4 - 6 3 4 6644 .8 6 0 .0 67 5 - 9 7 1 10009 .9 6 0 .0 67 8 - 1 5 7 5 1604
17 .02 0 .0518 - 2 0 3 5 2058
(/3-H ydroxyethyl )benzyldim ethylam m onium C hloride0 .2 5 8 0 .0994 145 - 1 3 70 .4 8 9 0 .0 97 5 242 - 2 3 41 .3 24 0 .0 95 9 518 - 5 1 01 .353 0 .0 68 6 512 - 5 0 22 .5 9 0 .0956 758 - 7 5 04 .9 3 0 .0683 1048 - 1 0 3 88 .8 1 0 .0 67 7 1260 - 1 2 5 0
11 .95 0 .0 6 8 0 1321 -1 3 1 112 .86 0 .0 6 8 4 1295 -1 2 8 51 5 .70 O.C'670 1299 - 1 2 8 918 .17 0 .0669 1254 - 1 2 4 4
(/3 -H ydroxyethyl)benzyld im ethylam m onium B rom ide0 .0 64 4 0 .0 62 0 57 - 4 70 .4 0 7 0 .0 60 2 375 - 3 6 50 .4 7 8 0 .1 2 0 450 - 4 4 51 .120 0 .0 81 5 832 - 8 2 32 .0 2 0 .0 38 5 1229 - 1 2 1 83 .3 3 0 .0 60 4 1589 -1 5 7 93 .5 7 0 .0727 1621 - 1 6 1 25 .3 3 0 .0539 1872 - 1 8 6 28 .1 3 0 .0 77 9 2205 - 2 1 9 68 .9 0 0 .0533 2283 - 2 2 7 3
10 .94 0 .0 6 0 0 2428 - 2 4 1 812 .95 0 .0 57 6 2508 - 2 4 9 813 .18 0 .0 59 7 2527 - 2 5 1 7
(/3-H ydroxyethyl )benzyldim ethylam m onium Iod id e0 .0 7 9 0 .0537 116 - 1 0 60 .1 5 4 0 .0 78 1 245 - 2 3 60 .2 2 0 0 .0 5 5 0 336 - 3 2 60 .3 4 5 0 .0 81 9 512 - 5 0 3
DiscussionSelected portions of the apparent molal heat content
data (Table I) have been plotted to illustrate the general features of the thermal behavior of aqueous solutions of the substituted quaternary ammonium halides. It is of interest to note (Figure 1) that the apparent molal heat contents for choline chloride were
larger than for tétraméthylammonium chloride. However, the substitution of a benzyl for a methyl group in choline chloride or for a methyl group in (CH3)4NC1 gave quaternary ammonium chlorides with lower <f>l values, respectively. This behavior contrasts with that for the tetra-n-alkylammonium chlorides5 where an increase in the cation size caused the heat of dilu-
Volum e 71, N um ber 8 February 1967
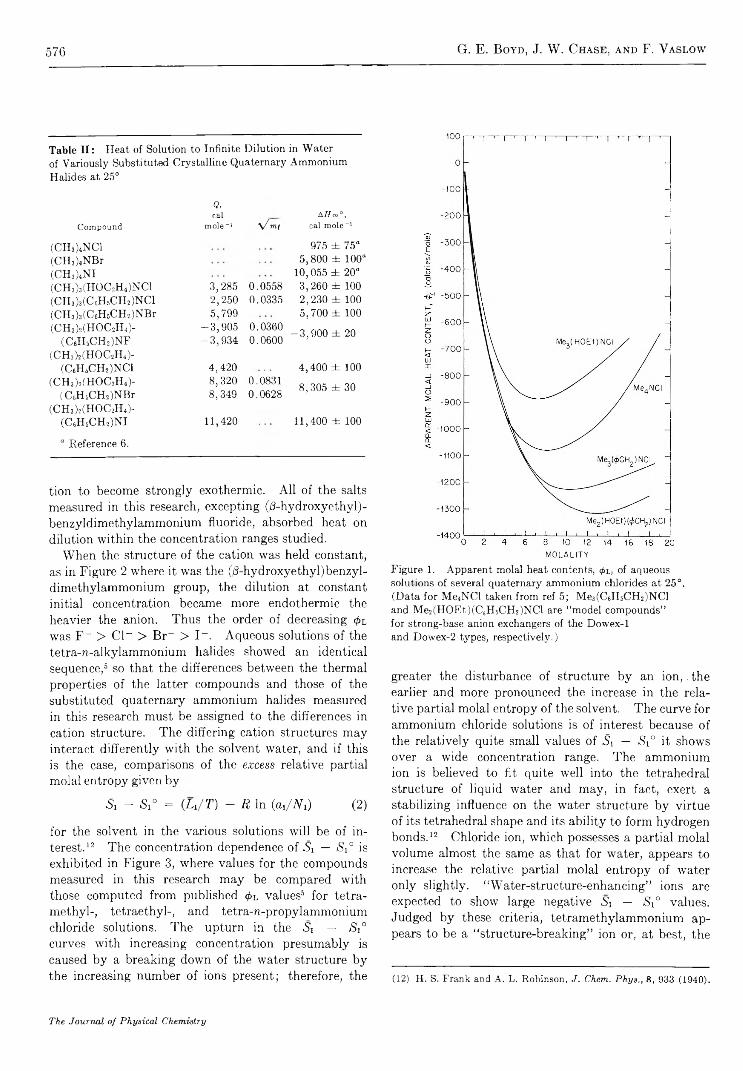
576 G. E. Boyd, J. W. Chase, and F. Yaslow
Table II: H eat o f Solution to In fin ite D ilu tion in W ater o f V ariously Substituted C rystalline Q uaternary A m m onium H alides at 25°
Q,cal A fTco°,
C o m p o u n d m o le - 1 y / m c a l m o le - 1
(C H 3)4NC1 975 ± 75“(C H 3)4N B r 5 ,8 0 0 ± 100“(C H 3)4N I 1 0 ,055 ± 20“(C H 3)3(H 0 C 2H 4)NC1 3 ,2 85 0 .0 55 8 3 ,2 6 0 ± 100(C H 3)3(C 6H 6C H 2)NC1 2 ,2 5 0 0 .0335 2 ,2 3 0 ± 100(C H 3)3(C 6H 6C H 2)N B r 5 ,7 99 5 ,7 0 0 ± 100(C H 3)2(H O C 2H 4)- - 3 ,9 0 5 0 .0360
- 3 , 9 0 0 ± 20(C6H 6C H 2)N F
(C H 3)2(H O C 2H 4)-- 3 , 9 3 4 0 .0 60 0
(C 6H 5C H 2)NC1 4 ,4 2 0 4 ,4 0 0 ± 100(C H 3)2(H O C 2H 4)- 8 ,3 2 0 0 .0831
8 ,3 0 5 ± 30(C 6H 5C H 2)N B r
(C H 3)2(H O C 2H 4)-8 ,3 4 9 0 .0 62 8
(C 6H 5C H 2)N I 11 ,420 1 1 ,400 ± 100
“ R eference 6.
tion to become strongly exothermic. All of the salts measured in this research, excepting (/3-hydroxyethyl)- benzyldimethylammonium fluoride, absorbed heat on dilution within the concentration ranges studied.
When the structure of the cation was held constant, as in Figure 2 where it was the (/3-hydroxyethyl)benzyl- dimethylammonium group, the dilution at constant initial concentration became more endothermic the heavier the anion. Thus the order of decreasing 0l was F~ > C l“ > Br~ > 1 “ . Aqueous solutions of the tetra-n-alkylammonium halides showed an identical sequence, 6 so that the differences between the thermal properties of the latter compounds and those of the substituted quaternary ammonium halides measured in this research must be assigned to the differences in cation structure. The differing cation structures may interact differently with the solvent water, and if this is the case, comparisons of the excess relative partial molal entropy given by
5i — S i° = CU / T ) - R In (a,/N O (2 )
for the solvent in the various solutions will be of interest. 12 The concentration dependence of Si — $ 1 ° is exhibited in Figure 3, where values for the compounds measured in this research may be compared with those computed from published 4>l values5 for tetra- methyl-, tetraethyl-, and tetra-u-propylammonium chloride solutions. The upturn in the Ai — <Si° curves with increasing concentration presumably is caused by a breaking down of the water structure by the increasing number of ions present; therefore, the
Figure 1. A pparent m olal heat contents, 0 l, o f aqueous solutions o f several quaternary am m onium chlorides at 25°. (D ata fo r M e 4N C l taken from ref 5 ; M e3(C6H6C H 2)N C l and M e 2(H O E t)(C 6H 5C H 2)N C l are “ m odel com pou nds” for strong-base anion exchangers o f the D ow ex-1 and D ow ex-2 types, respectively .)
greater the disturbance of structure by an ion,. the earlier and more pronounced the increase in the relative partial molal entropy of the solvent. The curve for ammonium chloride solutions is of interest because of the relatively quite small values of Si — Sx° it shows over a wide concentration range. The ammonium ion is believed to fit quite well into the tetrahedral structure of liquid water and may, in fact, exert a stabilizing influence on the water structure by virtue of its tetrahedral shape and its ability to form hydrogen bonds. * 5 12 Chloride ion, which possesses a partial molal volume almost the same as that for water, appears to increase the relative partial molal entropy of water only slightly. “ Water-structure-enhancing” ions are expected to show large negative Si — S i0 values. Judged by these criteria, tetramethylammonium appears to be a “ structure-breaking” ion or, at best, the
(12) H . S. F rank and A . L . R ob in son , J . Chem. P h ys ., 8 , 933 (1940 ).
The Journal of Physical Chemistry

Enthalpy and Entropy of D ilution of Quaternary Ammonium Halides 577
T ab le I I I : A pparent M ola l and R e la tiv e P artial M ola l H eat C ontents o f C h oline and B en zyltrim ethylam m onium H alides
---------- (C H jM H O C j I D N C I ----------- .--------(C H îM H O C sH O N B r-------- , ,--------(C H sM C iH sC m O N C l--------. ,------ (CH j)«iC«H (C H j)N B r-m <t> L Li io-*l. ■#> L Li 10“!L2
0 . 1 (-5) (-34)0 . 2 (-53) (-106)0.3 ( - 1 0 2 ) -178 1 . 1 -3 .8
0.4 -148 1 . 2 -3 .2 -242 1 . 8 -4 .90.5 -188 1 . 8 -3 .8 -302 2 . 6 -5 .90 . 6 -226 2.4 -4 .5 -358 3.5 - 6 . 8
0.7 -262 3.1 - 5 . 1 -410 4.6 -7 .70 . 8 -296 3.7 -5 .6 -462 5.6 -8 .50.9 -327 4.4 - 6 . 0 -507 6 . 2 -8.9
1 . 0 -356 5.0 -6 .4 -547 7.0 -9 .41 . 2 -408 6.3 -7 .0 -620 9.1 - 1 01.4 -453 7.5 -7 .5 -687 1 1 - 1 1
1 . 6 -493 8.9 - 8 . 0 -749 14 - 1 2
1 . 8 -530 1 0 -8 .5 -806 16 - 1 32 . 0 -564 1 2 -9 .0 -860 19 - 14
2.5 -647 17 - 1 0 -981 25 - 1 53.0 -7 13 19 - 1 1 -1080 30 - 163.5 -763 19 - 1 1 -117 0 35 - 1 7
4.0 -799 19 - 1 1 -1240 39 - 184.5 -827 18 - 1 0 -1300 42 - 185.0 -849 17 - 1 0 -1350 46 -19
5.5 -864 14 - 1 0 -1400 51 - 196 -875 1 2 -9 .8 -1450 54 - 2 0
7 -885 1 . 8 -9 .0 -1520 60 - 2 0
8 -881 -9 .8 - 8 . 1 -1590 63 - 2 09 - 8 6 8 -26 - 7 . 1 -1630 60 - 2 0
1 0 -846 -43 - 6 . 1 -1670 56 - 2 0
1 2 -791 -78 -4 .3 -1720 47 - 1914 -727 - 1 2 0 - 2 . 6 -1740 32 -1916 -657 -170 - 0 . 8
18
•t> L Li 10 -«L! <t> L Li I0 -2L2
(-49) (-7 1)(-107) (-164)-158 0 . 8 -3 .0 (-256)
-203 1.3 -3 .8 (-340)-245 1 . 8 -4 .5 (-414)-284 2.5 -5 .2 (-480)
-322 3.3 -5 .8 (-542)-358 4.0 -6 .4 (-600)-392 4.8 -6 .9 (-652)
-424 5.5 -7 .3 -702 8 . 6 - 1 2-480 6.7 -7 .9 -788 1 1 - 1 3-528 7.9 -8 .4 - 8 6 6 13 - 14
-570 9.2 -8 .9 -940 17 - 1 5-608 1 1 -9 .4 - 1 0 1 0 20 - 16-643 1 2 -9 .9 -1080 23 - 17
-724 17 - 1 1 -1230 34 - 2 0-797 2 2 - 1 2 -1380 45 - 2 2-861 27 - 1 3 -15 10 55 -24
-921 33 - 14 -1630 63 -25-977 39 - 15 -1730 68 -26
-1030 44 - 15 -1820 73 -26
-1070 45 - 1 5 -1890 78 -27- 1 1 1 0 44 - 15 -1960 82 -27-117 0 38 - 1 5 -2070 90 -28
- 1 2 0 0 31 - 14 -2170 98 -28- 1 2 2 0 18 - 1 3 -2240 1 0 0 -29-1230 2.7 - 1 2 -2310 1 1 0 -29
- 1 2 2 0 -23 - 1 1 -2420 1 2 0 -30-1190 -46 - 1 0
-1160 -69 -9 .2
-1130 -96 -8 .4
least strongly “ structure-forming” quaternary ammonium ion. Choline chloride appears to be a better “ structure-former” than (CHj^NCl; therefore, the cause for the lower activity coefficients of the former compared with the latter compound cannot be attributed only to the effect of the cation on water structure as was assumed earlier. The curves for benzyltrimethylammonium and (d-hydroxyethyl) benzyldimeth- ylammonium chlorides indicate increased structure formation, and, therefore, their relatively quite small mean molal activity coefficients in concentrated solutions likewise cannot be understood on the basis of water structure. The possibility that extensive ion- pair formation occurs, particularly with bromide and iodide ion, deserves to be investigated.
C om parisons with Standard F ree Energies and H eats o f A n io n Exchange. As was pointed out in the introductory paragraphs of this paper, the benzyltrimethylammonium and the (d-hydroxyethyl)benzyldimethyl- ammonium halides are “ model compounds” for the strong-base anion exchangers of the Dowex-1 and Dowex-2 types, respectively. The standard-state anion-exchange reaction conceptually may thus be written
RiNXiCmO + X 2- R 4N X 2(ot,) + X ," (A)
where X i~ and X 2_ are differing halide ions, respectively, and the reactants and products are in their standard states. Reaction A may be regarded as the sum of two partial processes: (a) the dilution of R 4NX] at initial concentration, W;, to infinite dilution
Volume 71, Number 8 February 1967
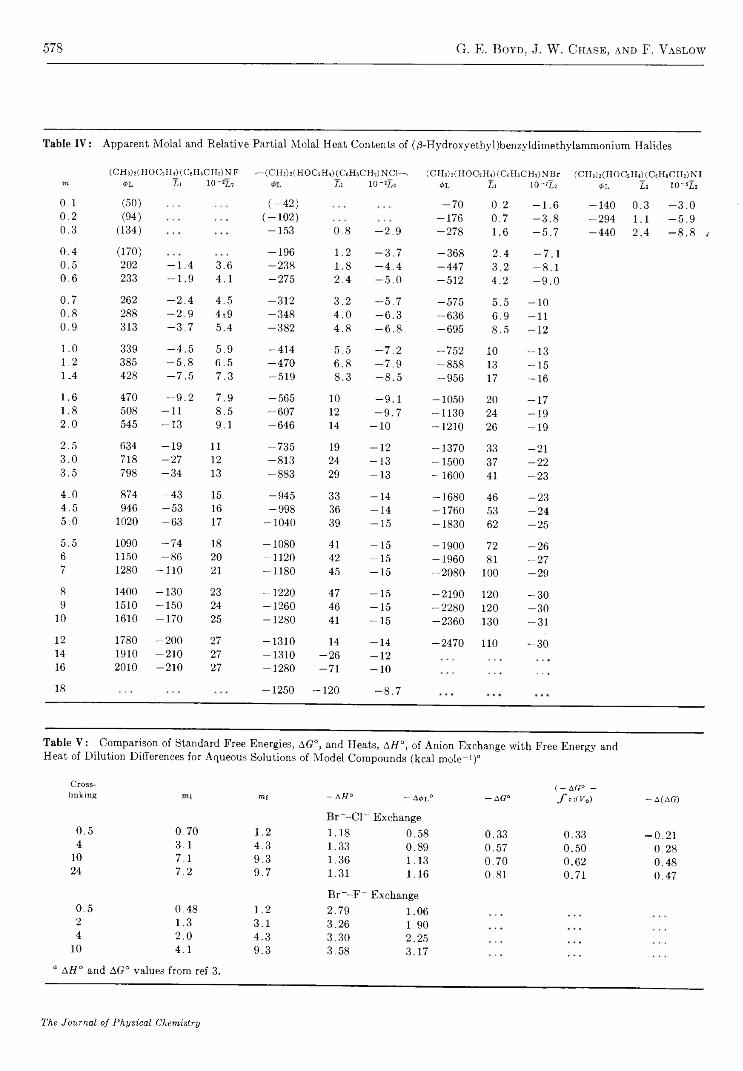
578 G. E. Boyd, J. W. Chase, and F. Vaslow
T a b le I V : A pparent M ola l and R e la tiv e P artia l M ola l H eat C ontents o f (/3-H ydroxyeth yl)benzy ld im eth ylam m oniu m H alides
(CHj)2(HOC2H4)(CeH5CH2)N F ^ -(C H sM H O C jH A (C üH sC H î) N C 1 - , (C H jM H O C iH iK C s H tC & JN B r ( C H 3) a(HO C2H4) (C 6H 5C H 2) N Im <t> L L i 10 -*L 2 L L i i o - y ,2 0L L i 10 -*1,2 <#> L L i 10 - ‘ L i
0 .1 (50) ( - 4 2 ) 70 0 .2 - 1 . 6 - 1 4 0 0 .3 - 3 . 00 .2 (94) ( - 1 0 2 ) — 176 0 .7 - 3 . 8 - 2 9 4 1 .1 - 5 . 90 .3 (134) - 1 5 3 0 .8 - 2 . 9 - 2 7 8 1 .6 - 5 . 7 - 4 4 0 2 .4 - 8 . 8
0 .4 (170) - 1 9 6 1 .2 - 3 . 7 - 3 6 8 2 .4 - 7 . 10 .5 202 - 1 . 4 3 .6 - 2 3 8 1 .8 - 4 . 4 - 4 4 7 3 .2 - 8 . 10 .6 233 - 1 . 9 4 .1 - 2 7 5 2 .4 - 5 . 0 - 5 1 2 4 .2 - 9 . 0
0 .7 262 - 2 . 4 4 .5 - 3 1 2 3 .2 - 5 . 7 - 5 7 5 5 .5 - 1 00 .8 288 - 2 . 9 4*9 - 3 4 8 4 .0 - 6 . 3 - 6 3 6 6 .9 - 1 10 .9 313 - 3 . 7 5 .4 - 3 8 2 4 .8 - 6 . 8 - 6 9 5 8 .5 - 1 2
1 .0 339 - 4 . 5 5 .9 - 4 1 4 5 .5 - 7 . 2 - 7 5 2 10 - 1 31 .2 385 - 5 . 8 6 .5 - 4 7 0 6 .8 - 7 . 9 - 8 5 8 13 - 1 51 .4 428 - 7 . 5 7 .3 - 5 1 9 8 .3 - 8 . 5 - 9 5 6 17 - 1 6
1 .6 470 - 9 . 2 7 .9 - 5 6 5 10 - 9 . 1 - 1 0 5 0 20 - 1 71 .8 508 - 1 1 8 .5 - 6 0 7 12 - 9 . 7 - 1 1 3 0 24 - 1 92 .0 545 - 1 3 9 .1 - 6 4 6 14 - 1 0 - 1 2 1 0 26 - 1 9
2 .5 634 - 1 9 11 - 7 3 5 19 - 1 2 - 1 3 7 0 33 - 2 13 .0 718 - 2 7 12 - 8 1 3 24 - 1 3 - 1 5 0 0 37 - 2 23 .5 798 - 3 4 13 - 8 8 3 29 - 1 3 - 1 6 0 0 41 - 2 3
4 .0 874 - 4 3 15 - 9 4 5 33 - 1 4 - 1 6 8 0 46 - 2 34 .5 946 - 5 3 16 - 9 9 8 36 - 1 4 - 1 7 6 0 53 - 2 45 .0 1020 - 6 3 17 - 1 0 4 0 39 - 1 5 - 1 8 3 0 62 - 2 5
5 .5 1090 - 7 4 18 - 1 0 8 0 41 - 1 5 - 1 9 0 0 72 - 2 66 1150 - 8 6 20 - 1 1 2 0 42 - 1 5 - 1 9 6 0 81 - 2 77 1280 - 1 1 0 21 - 1 1 8 0 45 - 1 5 - 2 0 8 0 100 - 2 9
8 1400 - 1 3 0 23 - 1 2 2 0 47 - 1 5 - 2 1 9 0 120 - 3 09 1510 - 1 5 0 24 - 1 2 6 0 46 - 1 5 - 2 2 8 0 120 - 3 0
10 1610 - 1 7 0 25 - 1 2 8 0 41 - 1 5 - 2 3 6 0 130 - 3 1
12 1780 - 2 0 0 27 - 1 3 1 0 14 - 1 4 - 2 4 7 0 110 - 3 014 1910 - 2 1 0 27 - 1 3 1 0 - 2 6 - 1 216 2010 - 2 1 0 27 - 1 2 8 0 - 7 1 - 1 0 . . .
18 - 1 2 5 0 - 1 2 0 - 8 . 7
T a b le V : C om parison o f Standard Free Energies, AG°, and H eats, AH°, o f A n ion E xchange w ith F ree E n ergy and H eat of D ilu tion D ifferences for A queous Solutions o f M od e l C om poun ds (k ca l m o le “ 1)“
Cross- ( — A G ° -linking m f - A H ° - A 0 l ° - A 0 ° firdVe) — A (AG)
311
" E xch ange0. 5 0 .7 0 1.2 1 .1 8 0 .5 8 0 .3 3 0 .3 3 — 0 .2 14 3 .1 4. 3 1 .3 3 0 .8 9 0 .5 7 0 .5 0 0 .2 8
10 7 .1 9 .3 1 .3 6 1 .1 3 0 .7 0 0 .6 2 0 .4 824 7 .2 9 .7 1 .31 1 .1 6 0 .8 1 0 .7 1 0 .4 7
B r - - F - E xch ange0 .5 0 .4 8 1.2 2 .7 9 1 .0 62 1 .3 3.1 3 .2 6 1 .9 04 2 .0 4. 3 3 .3 0 2 .2 5
10 4 .1 9. 3 3 .5 8 3 .1 7
“ AH ° and AG ° values from ref 3.
The Journal of Physical Chemistry

Enthalpy and Entropy of D ilution of Quaternary Ammonium Halides 579
Figure 2. C on centration dependence o f the apparent m olal heat contents o f aqueous (/3-hydroxyethyl)benzyldim ethylam m onium halide solutions at 25°. (N ote lim ited solubility o f the iod ide .)
F igure 3. R ela tive partial m olal en tropy, Si — Si°, of w ater in 1 :1 valence ty p e salt solutions at 25°.
R 4N X 1 (mi) ^ R 4N+(m = 0) + X f ( m = 0) (B)
and (b) the concentration of R 4N + and X 2~ initially at infinite dilution to a final concentration of rrn
R 4N+(to = 0) + X 2~(m = 0) ^ R 4N X 2(mf) (C)
The enthalpy change in reaction B will be — 4>h°(mi) and that in reaction C will be +<f>L0 (raf), and it is proposed that their sum may be compared with the standard heat of anion exchange, AH ° , for a cross-linked polymeric exchanger
A H ° = 0 L°(tRf) — <f>L “ (wii) = A0l ° (3)
Similarly, the standard free energy of anion exchange, AG °, for the cross-linked exchanger corrected for the decrease in the free energy of its molecular network, f i r d V e, accompanying the standard-state reaction may be compared with the difference in the free energy of dilution, A(A(7), of the “ model compound” solutions
/‘ V i
irdVe = AG (m i) - A G (m t) = A(A G) (4)V i
The dilution free energies per mole of solute were computed with eq 5 13
AG = 2RT[<f> — In (my±)] (5)
where <f> is the molal osmotic coefficient, m the molality, and 7 ± the solute mean molal activity coefficient,
/ ‘ ViTrdVe, was evaluated
Vifrom an equation of state14 relating the swelling pres
(13) See ref 9, p 642.(14) G . E . B o y d and B . A . S oldano, Z . E lektrochem ., 57, 162 (1953).
Volume 71, Number 3 February 1967
580 G. E. Boyd, J. W. Chase, and F. Vaslow
sure, it, of the exchanger to its equivalent volume, V e
7T = k (V e - Vo) (6 )
where k is dependent on the cross-linking of the exchanger network and V 0, its “ strain-free” equivalent volume.
Values of A</>l ° computed with the data in Table IV and of A (AG) computed from previously published data2 are compared in Table V with AH ° and AG° — fw d V e values for the bromide-chloride and bromide- fluoride anion-exchange reactions in variously cross- linked Dowex-2. The molalities, mi, of the fluoride- and chloride-salt forms, R 4N X 1, and m-t of the bromide salt-forms, R 4N X 2, each in their standard states given in Table V, were taken from an earlier publication. 15
The agreement between A<£l ° and AH ° is seen to become progressively better as the cross-linking of the exchanger increases above a nominal 4% DVB content. The large differences for the most weakly cross-linked
preparations suggest that the average concentrations m, and ntf in the cross-linked gel are not relevant to the localized ionic concentrations in the vicinity of the charged polymeric chains which make up the open molecular network of these exchangers. Effectively, the exchange groups in the weakly cross-linked anion exchangers are at much higher concentrations than the “ average” gel concentration obtained by dividing the moles of exchange groups per unit mass by the total water content per unit mass. This interpretation suggests that the halide ions are constrained to the vicinity of the charged polymeric chains rather than distributed throughout a diffuse double layer. When the cross-linking increases sufficiently that the counterion atmospheres overlap extensively, the “ homogeneous gel solution” picture of the exchanger becomes more valid. * 65
(15) G . E . B o y d , S. L indenbaum , and G . E . M yers , J . P h ys. Chem65, 577 (1961).
The Journal of Physical Chemistry

Ionic Interactions in Organic Ion Exchangers 581
Ionic Interactions in Organic Ion Exchangers. Comparisons with
Model Electrolyte Mixtures1
by S. Lindenbaum and G. E. Boyd
Oak R idge N ational Laboratory, Oak Ridge, T ennessee 37880 (Received A ugust 15, 1966)
The molalities of aqueous mixtures of “ model electrolyte compounds” for strong-acid cation and strong-base anion exchangers, respectively, in vapor phase equilibrium with reference solutions were determined at 25° using the gravimetric isopiestic comparison method. The activity coefficients of both components were evaluated, and the logarithm of their ratio was compared with the ratio computed from isopiestic vapor pressure measurements taken on chemically analogous lightly cross-linked ion exchangers. Satisfactory agreement was obtained between the model compound mixtures and the ion exchangers for concentrations above 5 m; below this concentration, however, the activity coefficient ratio for the electrolyte mixture became progressively smaller than for the ion exchanger and extrapolated to unity at infinite dilution. The analogy between ion exchangers and concentrated electrolyte mixtures thus appears valid for relatively high concentrations. At lower concentrations the exchanger exhibited a polyelectrolyte behavior in that activity coefficient ratios appreciably different from unity were observed even at high dilution.
A long-standing, 2 generally fruitful approach to the interpretation of the equilibrium behavior of organic ion exchangers has been based on their analogy with concentrated aqueous electrolyte mixtures. Osmotic coefficient measurements on cation exchangers containing singly charged ions, 3 '4 5 for example, have shown that the concentration dependence of this property is quite similar to that for strong, 1 - 1 electrolytes in aqueous solution. The application of Harned’s rule for electrolyte mixtures to the evaluation of the thermodynamic activity coefficients of ions in exchangers has been proposed,6 and cation-exchange equilibrium constants have been estimated3 using this rule and the assumption that the interaction coefficients, au and «2i, obeyed B r0 nsted’s relation, au = — cm- Thermodynamic calculations6'7 of equilibrium constants which do not assume empirical relations such as the Harned rule have shown that the predominant contribution was given by the logarithm of the activity coefficient ratio for the ions in the exchanger. The changes in the free energy of the cross-linked molecular network of the copolymer could be neglected for these systems. The logarithm of the activity coefficient ratio for a very lightly cross-linked exchanger was found to be
a nearly linear function of the weight normality, A m, of its ion-exchange sites (Am is expressed in equivalents per kilogram of absorbed water).
A direct test of the analogy between ion exchangers and concentrated electrolytes will be made in this paper by comparing activity coefficient ratios derived from isopiestic vapor pressure measurements on mixed aqueous solutions of “ model compounds” with the ratios derived from measurements on lightly cross- linked polyelectrolytes. p-Ethylbenzenesulfonic acid and its alkali metal salts were taken as the model compounds for polystyrenesulfonate-type cation exchangers,
(1) Presented before the D iv is ion o f C o llo id and S urface C h em istry , 148th N ationa l M eetin g o f the A m erican C hem ical S ociety , C h ica go , 111., Sept 1964 (see A bstracts o f P apers, p 21, N o . 3 ) ; research sponsored b y the U . S. A to m ic E n ergy C om m ission under con tract w ith U n ion C arbide C orp .(2) W . C . B aum an and J. E ichorn , J. A m . Chem. S oc ., 6 9 , 2830 (1947).(3 ) E . G lueck au f, P roc. R oy . Soc. (L o n d o n ), A 214, 207 (1952).(4) G . E . B o y d and B . A . S oldano, Z . E lektrochem ., 57 , 162 (1953).(5) S . W . M a yer , J . A m . Chem. Soc., 72, 2292 (1950).(6) G . E . M y ers and G . E . B o y d , J . P h ys . Chem ., 60, 521 (1956).(7) G . E . B oyd , S. L indenbaum , and G . E . M yers , ibid., 65 , 577 (1961).
Volum e 71, N um ber 3 February 1967

582 S. Lindenbaum and G. E. Boyd
while the quaternary ammonium salts, benzyltrimeth- ylammonium and (/3-hydroxyethyl)benzyldimethylam- monium halides, were employed as “ models” for two important strong-base anion exchangers. Justification for the use of low molecular weight aromatic sulfonic acids in the interpretation of cation-exchange equilibria has been given by Bonner,8 who demonstrated that sulfonates of differing degrees of polymerization but with the same recurring monomer unit have similar osmotic properties.
Agreement at low stoichiometric molalities between activity coefficient ratios for aqueous model electrolyte mixtures and for lightly cross-linked polyelectrolytes cannot be expected; the ionogenic groups on the poly- electrolyte cannot be separated indefinitely by dilution as can the ions in ordinary electrolyte solutions. The local concentration of counterions near a polyelectrolyte chain is much higher than the average concentration, N m, defined above. Comparisons with concentrated aqueous electrolyte solutions may be valid, however, when N m is large and the polyelectrolyte chains are sufficiently close together that their ion atmospheres overlap extensively.
Experimental Section
M aterials. Syntheses of the strong-acid cation- exchanger “ model compound,” p-ethylbenzenesulfonic acid, were conducted following the methods of Wiley and Davis9 and of Sempotowski, 10 respectively. Purification was accomplished by recrystallization of the barium salt of the acid; this compound was converted to the lithium and sodium salts by treatment with a small excess of Li2S 0 4 or Na2C0 3 , respectively. Further purification and isolation was effected by two recrystallizations from methanol and “ freeze-drying.” The melting points of the o- and p-toluidine derivatives of the acid were in agreement with literature values. Molecular weights of the salts computed from C, H, and metal analyses were in fair agreement with theory. Equivalent weights were determined by titration of the acid released when solutions containing known weights of salt were passed through a deep bed of El- form cation exchanger. Values of 185.4 and 210.3, compared with theory values of 192.2 and 208.2, were found for the Li and Na p-ethylbenzenesulfonates, respectively.
The anion-exchanger model compounds were benzyl- trimethylammonium chloride and bromide and (/?- hydroxyethyl)benzyldimethylammonium chloride and bromide, respectively. The sources, methods of purification, and analysis of these compounds have been given in a recent publication. 1 1
Isop iestic V apor Pressure Com parisons. The ap
paratus and techniques employed in measuring the molalities of the solutions of the model compound mixtures of known composition in vapor pressure equilibrium have been described. 12 Concentrated stock solutions of lithium and sodium p-ethylbenzenesulfo- nate were made up, and weight burets were employed in the analysis of their concentrations by cation-exchange and precision acidimétrie titrations. Mixtures with varying fractions of lithium and sodium salt were prepared by weighing known amounts of these solutions into the dishes used in the gravimetric isopiestic vapor pressure comparison apparatus. Mixtures of the anion-exchanger model compounds and of tétraméthylammonium chloride and bromide were made up in a similar manner.
Equilibrium isopiestic concentrations for four sets of mixtures are presented in Tables IA-D , inclusive. Concentrations of the reference sodium chloride solutions in isopiestic equilibrium also are given for the p-ethylbenzenesulfonate mixtures. The reference solutions for the calculations performed later in this paper with the data in Tables IB -D , inclusive, were those for which ZBr- = 0 . 0 0 0 and x^r- = 1 .0 0 0 , respectively. The data (Table I A) for the pure sodium salt solutions (i.e ., x Na = LOO) extend to concentrations higher than the equilibrium solubility because of supersaturation effects. The osmotic coefficients for the pure and mixed lithium and sodium p-ethylbenzenesulfonates were computed with the equation
: vTm T4>r (1 )
where the number of ions, v, is 2 , m x is the molality of the sulfonate solution, 4>x is its osmotic coefficient, and mr and 4>t are the molality and osmotic coefficient of the reference electrolyte (NaCl), respectively. The osmotic coefficients for the pure sodium salt agree with previously published values; 13 however, there was a small, systematic disagreement with the lithium salt. The concentration range for the tétraméthylammonium chloride-bromide mixtures was limited by the solubility of the pure bromide salt which recently has been determined14 as 6.353 m at 25°.
(8 ) O. D . B onner and J. R . O verton , J . P h ys. Chem ., 6 7 ,1 0 3 5 (1 96 3 ).(9) R . H . W iley and R . P . D av is , J . A m . Chem. Soc., 74, 6142 (1952).(10) L . S em potow ski, Chem. B er., 22, 2662 (1889).(11) G . E . B o y d , A . Schw arz, and S. L indenbaum , J . P h ys . Chem ., 70, 821 (1966).(12) S . L indenbaum and G . E . B o y d , ib id ., 68 , 911 (1964).(13) O . D . B on n er and O. C . R ogers, ib id ., 6 4 , 1499 (1960).(14) B . J. L evien , A u stralian J . Chem ., 18, 1161 (1965 ).
The Journal o f P hysical Chem istry
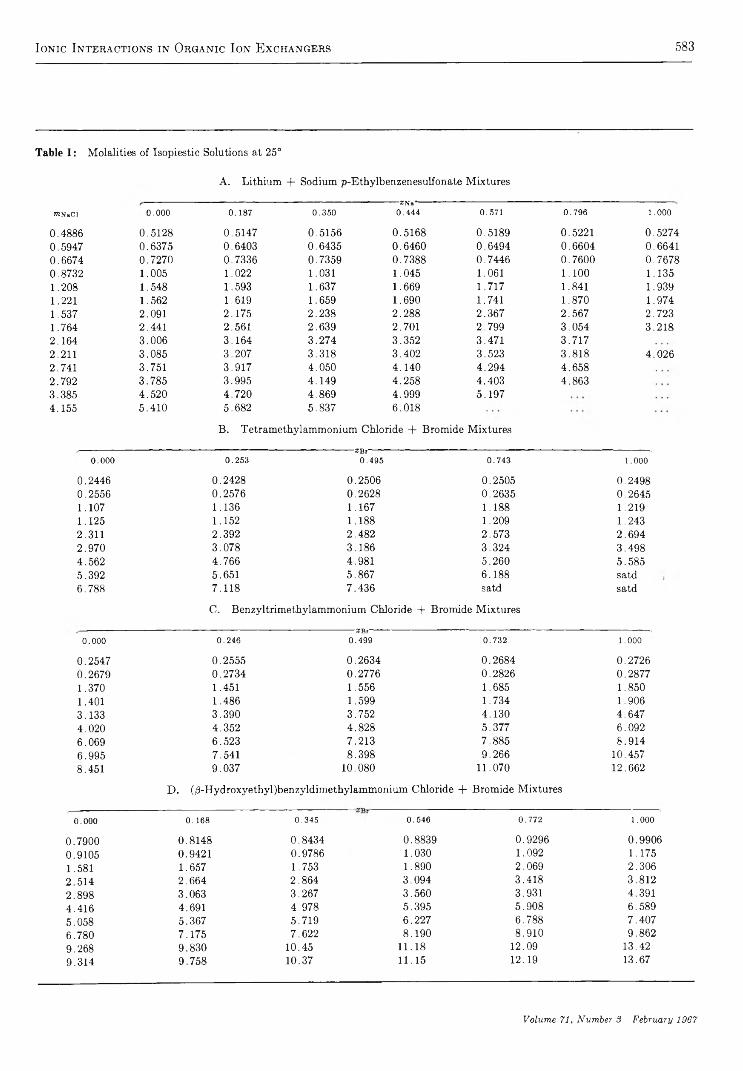
Ionic Interactions in Organic Ion Exchangers 583
Table I : M olalities o f Isop iestic Solutions at 25°
A . L ith ium + Sodium p-E thylbenzenesu lfonate M ixtures
™NaCl 0.000 0.187 0.350----------- INa'------------
0.444 0.571 0.796 1.000
0 .4 88 6 0 .5 1 2 8 0 .5 14 7 0 .5 15 6 0 .5 16 8 0 .5 18 9 0 .5221 0 .5 2 7 40 .5947 0 .6 37 5 0 .6 40 3 0 .6 43 5 0 .6 4 6 0 0 .6 4 9 4 0 .6 6 0 4 0 .6 64 10 .6 67 4 0 .7 2 7 0 0 .7336 0 .7359 0 .7 38 8 0 .7 44 6 0 .7 6 0 0 0 .7 6 7 80 .8732 1 .005 1 .022 1.031 1 .0 45 1.061 1 .1 0 0 1 .1 351 .208 1 .5 48 1 .593 1 .6 37 1 .669 1 .7 17 1 .841 1 .9 391.221 1 .562 1 .619 1 .659 1 .6 90 1 .741 1 .8 70 1 .9 741 .537 2 .0 91 2 .1 7 5 2 .2 3 8 2 .2 8 8 2 .3 6 7 2 .5 6 7 2 .7 2 31 .764 2 .4 41 2 .5 61 2 .6 3 9 2 .701 2 .7 9 9 3 .0 5 4 3 .2 1 82 .1 6 4 3 .0 0 6 3 .1 6 4 3 .2 7 4 3 .3 5 2 3 .4 71 3 .7 1 72 .211 3 .0 8 5 3 .2 0 7 3 .3 1 8 3 .4 0 2 3 .5 2 3 3 .8 1 8 4 .0 2 62 .741 3 .7 51 3 .9 1 7 4 .0 5 0 4 .1 4 0 4 .2 9 4 4 .6 5 82 .7 92 3 .7 8 5 3 .9 9 5 4 .1 4 9 4 .2 5 8 4 .4 0 3 4 .8 6 33 .3 8 5 4 .5 2 0 4 .7 2 0 4 .8 6 9 4 .9 9 9 5 .1 9 74 .155 5 .4 1 0 5 .6 8 2 5 .8 3 7 6 .0 1 8
B . T étram éthylam m on iu m C hloride + B rom ide M ixtures
-XB r-0.000 0.253 0.495 0.743 1.000
0 .2446 0 .2 42 8 0 .2 50 6 0 .2505 0 .2 49 80 .2556 0 .2 57 6 0 .2 62 8 0 .2 63 5 0 .2 64 51 .107 1 .1 36 1 .1 67 1 .1 88 1 .2 191 .1 25 1 .152 1 .1 88 1 .209 1 .2 432 .3 11 2 .3 9 2 2 .4 8 2 2 .5 7 3 2 .6 9 42 .9 7 0 3 .0 7 8 3 .1 8 6 3 .3 2 4 3 .4 9 84 .5 6 2 4 .7 6 6 4 .9 81 5 .2 6 0 5 .5 8 55 .3 9 2 5 .651 5 .8 6 7 6 .1 8 8 satd6 .7 8 8 7 .1 1 8 7 .4 3 6 satd satd
C . B enzyltrim ethylam m onium C hloride + B rom ide M ixtures
0.000 0.246XBr
0.499 0.732 1.000
0 .2 54 7 0 .2 55 5 0 .2 6 3 4 0 .2 6 8 4 0 .2 72 60 .2 67 9 0 .2 7 3 4 0 .2 77 6 0 .2 82 6 0 .2 87 71 .370 1.451 1 .5 56 1 .685 1 .8 5 01.401 1 .4 86 1 .599 1 .7 34 1 .9 063 .1 3 3 3 .3 9 0 3 .7 5 2 4 .1 3 0 4 .6 4 74 .0 2 0 4 .3 5 2 4 .8 2 8 5 .3 7 7 6 .0 9 26 .0 6 9 6 .5 2 3 7 .2 1 3 7 .8 8 5 8 .9 1 46 .9 9 5 7 .5 4 1 8 .3 9 8 9 .2 6 6 10 .4578 .451 9 .0 3 7 10 .080 11 .070 12 .662
D . (/3-H ydroxyeth yl)benzyld im eth ylam m oniu m C hloride + B rom ide M ixtures
0.000 0.168 0.345
0 .7 9 0 0 0 .8 1 4 8 0 .8 4 3 40 .9105 0 .9421 0 .97861 .581 1 .6 57 1 .7532 .5 1 4 2 .6 6 4 2 .8 6 42 .8 9 8 3 .0 6 3 3 .2 6 74 .4 1 6 4 .6 91 4 .9 7 85 .0 58 5 .3 6 7 5 .7 1 96 .7 8 0 7 .1 7 5 7 .6 2 29 .2 68 9 .8 3 0 1 0 .459 .3 1 4 9 .7 5 8 10 .37
0.546 0.772 1.000
0 .8839 0 .9296 0 .9 9 0 61 .030 1 .092 1 .1 751 .8 90 2 .0 6 9 2 .3 0 63 .0 9 4 3 .4 1 8 3 .8 1 23 .5 6 0 3 .9 31 4 .3915 .3 9 5 5 .9 0 8 6 .5 8 96 .2 2 7 6 .7 8 8 7 .4 0 78 .1 9 0 8 .9 1 0 9 .8 6 2
1 1 .1 8 12 .09 13 .421 1 .15 12 .19 13 .67
Volume 71, Number 3 February 1967

584 S. Lindenbaitm and G. E. Boyd
Treatment of Experimental DataM ethod fo r A ctiv ity Coefficient Calculations. Mean
molal activity coefficients for each salt in the mixed aqueous solutions were computed following the method outlined by Robinson, 15 who has expressed the basic equation of M cKay and Perring16 as
In Yc = In Yc° + In R -(-
R -M
d (M<t>) (2 )
where yc and yc° are the activity coefficients of electrolyte C in the mixture with electrolyte B and in its own pure solution at the same ionic strength, respectively; R = M / m is the isopiestic ratio where m = m 3
+ vie is the total molality and M is the molality of the solution of pure C isopiestic with m ; <t> is the molal osmotic coefficient, and x is defined by m 3 = xm where wb is the molality of electrolyte B.
If R can be expressed as a quadratic function in x
R = 1 — ax — bx2 (3)
then eq 2 takes the form
(b/M)d(M(f>) (4) 0
for each value of M . Additionally, when (b/M ) can be described by a quadratic in M<f>
- ( b / M ) = j + 2k(M f>) + 3 l(M4>Y (5)
eq 4 becomes
In Yc = ln 7 c° + In -R +
x 2(M<t>)[j + k(M<j>) + l(M<f>)2] (6 )
When the isopiestic ratio is a linear function of x for each M value, eq 2 simplifies to
In yc = hi yc° + In R (7)
Analogous equations may be written for the calculation of the activity coefficient, yb , of electrolyte B in the mixture.
Tétram éthylam m onium Chloride-Brom ide M ixtures. Within the experimental accuracy, R for this system was a linear function of x ; eq 7 therefore was used for the calculation of yb and yc, where B and C refer to the bromide and chloride salts, respectively. The required values of yb° and yc° were interpolated from smooth curves constructed with the activity coefficients listed in published tables. 12
Benzyltrim ethylam m onium C hloride-B rom ide M ix tures. Equation 7 also was applicable to this system, and the activity coefficient values, yb° and yc°, for the pure electrolyte solutions were interpolated. 1 1
(/3-Hydroxyethyl) benzyldim ethylam m onium C hloride- Brom ide M ixtures. Equation 3 was required to describe the variation of R with x for each value of m, and eq 5 was needed to reproduce the dependence of (b/M ) on (M(j>). Least-squares methods were employed to fit the data of Table ID to eq 3 and 5, respectively, and values of yb° and yc° were interpolated. 1 1
L ith ium -S odium p-Ethylbenzenesulfonate M ixtures. The dependence of R on x and x 2 for all M values in this system also required the use of eq 3 and 5. The osmotic and activity coefficients for the pure lithium and sodium salt solutions (Table II) were calculated following the procedure described earlier. 12 The required yb° and yc° values (B = sodium ; C = lithium) were found by interpolation from smooth curves constructed with Table II.
Table II : O sm otic and A ct iv ity C oefficients for L ith ium and Sodium p-E thylbenzenesu lfonate Solutions at 25°
----------------Li-p-EBS----------- , ---------------Na-p-EBS-m <t> 7 <f> 7
0 . 1 (0 .9 3 1 ) (0 .7 7 3 ) (0 .9 2 5 ) (0 .7 5 9 )0 .2 (0 .9 2 0 ) (0 .7 3 0 ) (0 .9 1 2 ) (0 .7 1 5 )0 .3 (0 .9 0 6 ) (0 .7 0 2 ) (0 .8 9 8 ) (0 .6 7 8 )
0 .4 (0 .8 9 5 ) (0 .6 7 2 ) 0 .8 8 2 0 .6 4 70 .5 (0 .8 8 0 ) (0 .6 4 6 ) 0 .8 6 2 0 .6 1 60 .6 0 .8 6 6 0 .6 2 2 0 .8 4 0 0 .5 8 7
0 .7 0 .8 5 3 0 .601 0 .8 19 0 .5 5 90 .8 0 .8 38 0 .5 8 0 0 .7 9 5 0 .5 3 20 .9 0 .8 22 0 .5 6 0 0 .7 7 0 0 .5 0 6
1 . 0 0 .8 0 7 0 .541 0 .7 4 7 0 .4 8 21 .2 0 .7 7 8 0 .5 0 6 0 .7 0 4 0 .4 3 91 .4 0 .7 53 0 .4 7 6 0 .6 6 7 0 .4 0 3
1 .6 0 .7 33 0 .451 0 .6 3 4 0 .3 7 21 .8 0 .7 18 0 .4 3 0 0 .6 0 6 0 .3 4 62 .0 0 .7 1 0 0 .4 1 4 0 .5 85 0 .3 2 5
2 .5 0 .7 0 6 0 .3 8 6 0 .5 5 2 0 .2 8 53 .0 0 .7 1 6 0 .3 7 0 0 .5 3 7 0 .2 5 83 .5 0 .7 3 8 0 .3 62 0 .5 3 7 0 .2 41
4 .0 0 .7 6 9 0 .361 0 .5 4 7 0 .2 2 94 .5 0 .7 99 0 .3 63 0 .5 6 4 0 .2215 .0 0 .8 3 2 0 .3 6 8 0 .5 8 3 0 .2 1 5
5 .5 0 .8 73 0 .3 7 8
Calculation o f the In teraction Coefficients. The calculated y b and y c values for the mixed electrolyte
(15) R . A . R ob in son , J . P hys. Chem., 65 , 662 (1961).(16) H . A . M c K a y and J. K . Perring, Trans. Faraday S oc., 49 , 163 (1953).
The Journal of Physical Chemistry

Ionic Interactions in Organic Ion Exchangers 585
Figure 1. V ariation o f interaction param eters for aqueous tétram éthylam m onium chloride + brom ide m ixtures w ith concentration .
solutions were employed to obtain values for the coefficients, aB and ac, respectively, by means of the equations17
a B = — (1 /mc) log (yb/ yb°) (8 a)
ac = — ( 1 / t o b ) log ( y c / y c ° ) ( 8 b j
The variation of these coefficients and their sum (aB + ac) with the total molality, m = M , is given in Figures 1-4. There was evidence that aB and/or ac also were dependent on x = mB/m, although in several instances the accuracy of the data was low. An illustration of this dependence is shown in Figure 4 for the (/3-hydroxyethyl)benzyldimethylammonium chloride-bromide mixtures. A dependence of a B and/ or ac on x implies a quadratic rather than a linear dependence of the activity coefficients on molality.
log yb = log yb° — a Bmc — (SbRIc2 (9a)
log Yc = log Yc° — acmB — /3cmB2 (9b)
A necessary consequence18 of eq 9 is that
a B + ac = constant — 2m(/3B + dc) (10)
If aB + ac is independent of m, then /3b + dc = 0 ; however, from the slope of the aB (or ac) vs. x plots, estimates of /3b (or /3c) may be derived. The numerical values of /3b and /3c were expected to be quite small, as generally a B + ac was close to zero.
Results and DiscussionTétram éthylam m onium C hloride-B rom ide M ixtures.
In this system (Figure 1) aB + ac = 0.0038 ± 0.0017, and the sum was independent of the molality within experimental error indicating that /3B + /3c ~ 0. However, aB (be., aBr-) was slightly dependent on x ; hence /3b = —/3c ~ 0.0005. The nearly “ Br0 nsted behavior” observed with these mixtures may be compared with that for aqueous mixtures of KC1 and KBr
1 2 3 4 5 6 7 8MOLALITY (M )
Figure 2. C oncentration dependence ofinteraction param eters for aqueous benzyltrim ethylam m onium chloride + brom ide mixtures.
(17) H . S. H arned and B . B . O w en, “ T h e P hysica l C hem istry o f E lec tro ly tic S o lu tion s ,” 3rd ed, R e in h old P ublish in g C orp ., N ew Y ork , N . Y ., 1958, p 616.(18) E . G lueckau f, H . A . C . M c K a y , and A . R . M ath ieson , J. Chem. Soc., S299 (1949).
Volume 71, Number S February 1967

586 S. Lindenbaum and G. E. Boyd
Figure 3. C oncentration dependence o f “ first-order” in teraction coefficients for aqueous (/S -hydroxyethyl)benzyldim ethylam m onium chloride + brom ide mixtures.
where, within experimental error, as = — ac was observed19 for total molalities from 2.0 to 5.5. The values of ctB and a c for the tetramethylammonium halide mixtures were an order of magnitude larger than for the K(C1 + Br) mixtures, however.
Benzyltrim ethylam m onium C hloride-B rom ide M ix tures. The values of a® and ac for these mixtures were larger than for the tetramethylammonium chloride + bromide mixtures over the same concentration range, but, like the latter, they decreased with increasing concentration (Figure 2). The quantity (aB + ac) appeared to be independent of the molality within experimental error and showed an average value of 0.0063 ± 0.0014 for total molalities of 1.4-7.0 m. Both aB and ac were slightly dependent on x , indicating that /3b = —/3c ~ 0.0005.
(fi-H ydroxyethyl) benzyldim ethylam m onium C hloride- B rom ide M ixtures. The interaction coefficients for this system (Figure 3) appeared to be smaller than for the benzyltrimethylammonium chloride-bromide mixtures, but they also decreased with increasing concen
tration. The quantity ( a B + a c ) was quite small (i .e ., ~ 0.0015) and almost independent of the total molality. However, a B was dependent on x (Figure4) , while ac was almost independent. These observations require /3c ~ —0 . 0 0 2 and /3B « 0 .0 .
L ith ium -S odium p-Ethylbenzenesulfonate M ixtures. The interaction coefficients for these mixtures (Figure5) exhibited appreciable individuality compared with the quaternary ammonium chloride-bromide solutions discussed above. The values of aLi + appeared to be virtually constant and independent of the molality, while aNa+ decreased so that au+ + aN»+ was concentration dependent. Moreover, the magnitudes of aNa+ were significantly larger than those for aia+, and B r0 nsted’s relationship was far from being obeyed. A value of S u * + dNa+ = —0.0034 was obtained from the slope of the plot of a Li+ + a Na+ with m in accordance with eq 10. It is possible that either dLi+ or /3Na+ is zero, but both coefficients cannot be zero. Unfortunately, the errors in the values of a Bi + and aN*+ were such as to obscure a dependence of these quantities on x and, hence, estimates of /3ll+ and /3ns+ could not be made.
A pplica tion s to Ion -E xchan ge System s. A consideration will now be given to the use of the foregoing values of aB, ac, /3B, and /3c in an interpretation of the phenomenon of ion-exchange selectivity. The basic Gibbs-Donnan equation for the equilibrium mass law concentration product ratio or selectivity coefficient, Z)cB, for the exchange of like, singly charged cations or anions may be written6,7
log D gb = P {v c — 5b)/2.3R T —
log (yc/y B ) r — 2 log ( y c / t b ) ^ (1 1 )
where the first term on the right-hand side measures the contribution of the “ strain energy” for the ion- exchange copolymer molecular network, and the second and third terms, which contain single-ion activity coefficient ratios, measure the “ interaction free energies” in the exchanger and in the dilute, external aqueous electrolyte mixture, respectively. The second term on the right-hand side of eq 1 1 is dominant for the exchange of bromide with chloride ion on cross-linked Dowex-2 preparations7 and for the exchange of sodium with lithium ions on Dowex-50,6 respectively, so that log Z)CB « log (yc/ yb)! to a fair approximation. The quantity log (yc/yB)r may be estimated from this approximation or computed from weight-swelling measurements taken on lightly cross-linked preparations of Dowex-27 and on Dowex-506 as a function of water
(19) W . H . M c C o y and W . E . W allace , J . A m . Chem . S o c 78 , 183 (1956).
The Journal of Physical Chemistry
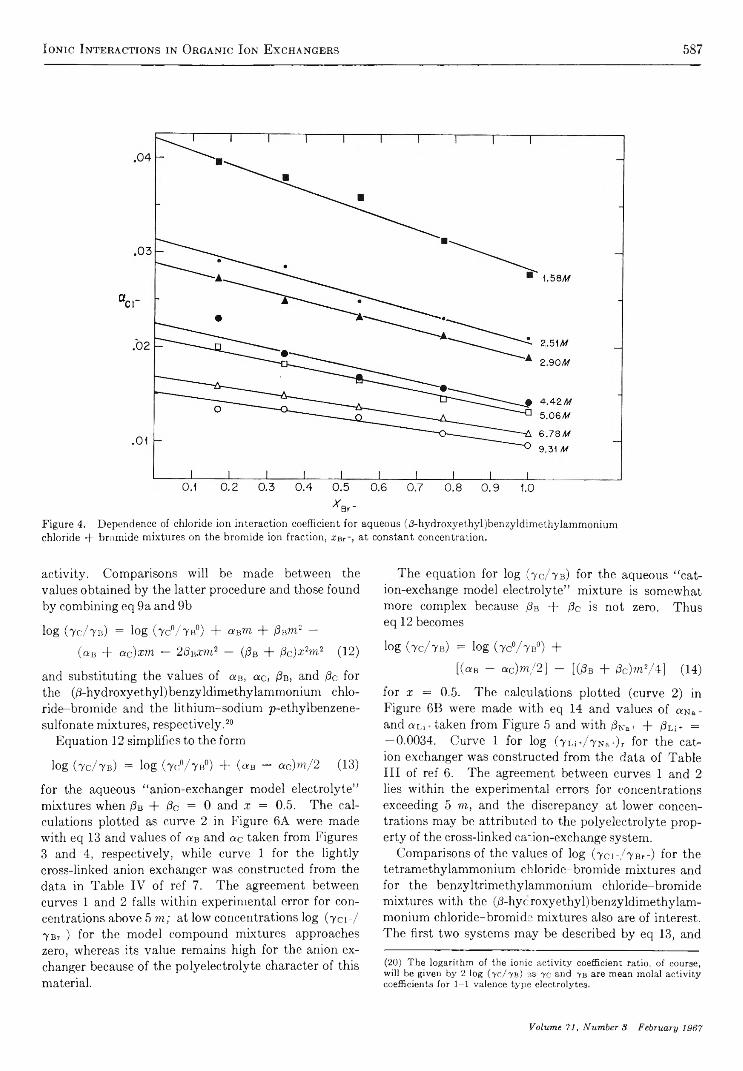
Ionic Interactions in Organic Ion Exchangers 587
F ig u r e 4 . D e p e n d e n c e o f c h l o r i d e i o n in t e r a c t i o n c o e f f i c ie n t f o r a q u e o u s ( /3 - h y d r o x y e t h y l ) b e n z y l d i m e t h y l a m m o n i u m c h l o r i d e + b r o m id e m ix t u r e s o n t h e b r o m id e i o n f r a c t i o n , x m - , a t c o n s t a n t c o n c e n t r a t io n .
activity. Comparisons will be made between the values obtained by the latter procedure and those found by combining eq 9a and 9b
log ( 7 c / 7 b ) = log (7 c0/ 7 b ° ) + « B m + 0B m 2 -
( « b + ac )xm — 2BbXwl2 — (Bn + B c)xh n 2 (12)
and substituting the values of an, ac, /3b, and Be for the ((J-hydroxyethyl)benzyldimethylammonium chloride-bromide and the lithium-sodium p-ethylbenzene- sulfonate mixtures, respectively. 20
Equation 12 simplifies to the form
log (7 c/7 b ) = log (7 c0/ 7 b ° ) + (aB — ac)m /2 (13)
for the aqueous “ anion-exchanger model electrolyte” mixtures when Bn + Be = 0 and x = 0.5. The calculations plotted as curve 2 in Figure 6 A were made with eq 13 and values of an and a c taken from Figures 3 and 4, respectively, while curve 1 for the lightly cross-linked anion exchanger was constructed from the data in Table IV of ref 7. The agreement between curves 1 and 2 falls within experimental error for concentrations above 5 m ; at low concentrations log (7 0 1 -/ 7B r-) for the model compound mixtures approaches zero, whereas its value remains high for the anion exchanger because of the polyelectrolyte character of this material.
The equation for log ( v c / v b ) for the aqueous “ cation-exchange model electrolyte” mixture is somewhat more complex because Bb + Be is not zero. Thus eq 1 2 becomes
log (7 c/7 b ) = log (7 c0/ 7 b ° ) +
[(«b — ac)m /2 ] — [(Bb + B c)m 2/4] (14)
for x = 0.5. The calculations plotted (curve 2) in Figure 6 B were made with eq 14 and values of a Na + and «Li +taken from Figure 5 and with Bnb.+ + Bl ì+ = — 0.0034. Curve 1 for log (7 u+/7 Na/)r for the cation exchanger was constructed from the data of Table I II of ref 6 . The agreement between curves 1 and 2 lies within the experimental errors for concentrations exceeding 5 m , and the discrepancy at lower concentrations may be attributed to the polyelectrolyte property of the cross-linked cation-exchange system.
Comparisons of the values of log (7 ci-/7 Br-) for the tétraméthylammonium chloride-bromide mixtures and for the benzyltrimethylammonium chloride-bromide mixtures with the (/3-hycroxyethyl)benzyldimethylam- monium chloride-bromide mixtures also are of interest. The first two systems may be described by eq 13, and
(20) The logarithm of the ionic activity coefficient ratio, o f course, will be given by 2 log ( 7 c / 7 b ) as 7 c and 733 are mean molai activity coefficients for 1-1 valence type electrolytes.
Volume 71, Number S February 1967
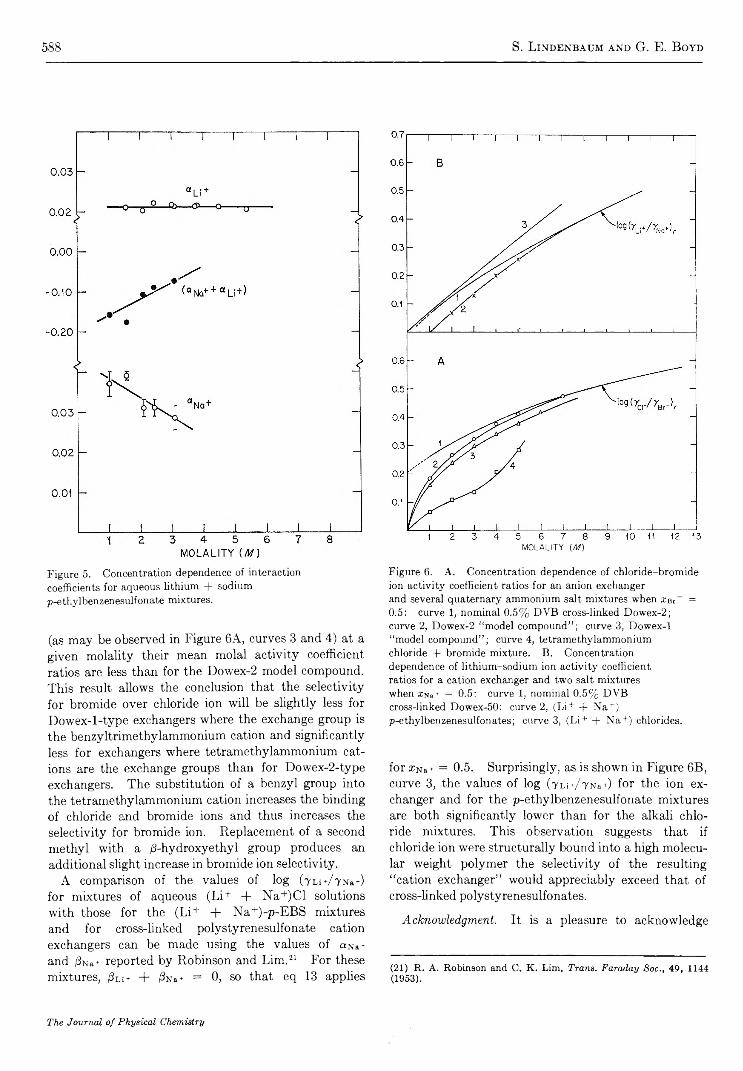
588 S. Lindenbaum and G. E. Boyd
Figure 5. C oncentration dependence of interaction coefficients for aqueous lithium + sodium p-ethylbenzenesulfonate mixtures.
(as may be observed in Figure 6 A, curves 3 and 4) at a given molality their mean molal activity coefficient ratios are less than for the Dowex-2 model compound. This result allows the conclusion that the selectivity for bromide over chloride ion will be slightly less for Dowex-l-type exchangers where the exchange group is the benzyltrimethylammonium cation and significantly less for exchangers where tétraméthylammonium cations are the exchange groups than for Dowex-2-type exchangers. The substitution of a benzyl group into the tétraméthylammonium cation increases the binding of chloride and bromide ions and thus increases the selectivity for bromide ion. Replacement of a second methyl with a (3-hydroxyethyl group produces an additional slight increase in bromide ion selectivity.
A comparison of the values of log (YLi+/YNa+) for mixtures of aqueous (Li+ + Na+)C1 solutions with those for the (Li+ + N a+)-p-EBS mixtures and for cross-finked polystyrenesulfonate cation exchangers can be made using the values of aNa + and /3Na+ reported by Robinson and Lim . 21 For these mixtures, /3l i+ + /3Na+ = 0, so that eq 13 applies
MOLALITY (M)
Figure 6. A . C oncentration dependence o f ch lorid e-b rom id e ion a ctiv ity coefficient ratios for an anion exchanger and several quaternary am m onium salt m ixtures w hen XBt~ = 0 .5 : curve 1, nom inal 0 .5 % D V B cross-linked D ow ex -2 ; curve 2, D ow ex-2 “ m odel com pou n d” ; curve 3, D ow ex-1 “ m odel com p ou n d ” ; curve 4, tétram éthylam m onium chloride + brom ide m ixture. B . C oncentration dependence o f lith iu m -sod iu m ion a ctiv ity coefficient ratios for a cation exchanger and tw o salt m ixtures when XNa+ = 0 .5 : curve 1, nom inal 0 .5 % D V Bcross-linked D ow ex-50 : curve 2, (L i+ + N a +) p-ethylbenzenesulfonates; curve 3, (L i+ + N a +) chlorides.
for ïNa+ = 0.5. Surprisingly, as is shown in Figure 6 B, curve 3, the values of log (7 Li+/7 Na+) for the ion exchanger and for the p-ethylbenzenesulfonate mixtures are both significantly lower than for the alkali chloride mixtures. This observation suggests that if chloride ion were structurally bound into a high molecular weight polymer the selectivity of the resulting “ cation exchanger” would appreciably exceed that of cross-linked polystyrenesulfonates.
Acknowledgm ent. It is a pleasure to acknowledge
(21) R . A . R ob in son and C . K . L im , Trans. Faraday S oc., 4 9 , 1144 (1953).
The Journal of Physical Chemistry

Excited-State R eactivities 589
with thanks the assistance of Q. V. Larson in the measurements with the lithium-sodium p-ethylbenzene-
sulfonate mixtures and of H. L. Holsopple in the preparation of several of the compounds used in this research.
Excited-State Reactivities. II. Basicities of Some Polymethylbenzenes
in Their Excited Singlet States
bv R. L. Flurry, Jr ., and R. Keith Wilson
D epartm ent o f C hem istry , L ouisian a State U niversity in N ew Orleans, N ew Orleans, Louisiana 70122 ( Received J u ly 29, 1966 )
The absorption and fluorescence spectra of all of the polymethylbenzenes having three or more methyl groups have been measured in the trifluoroacetic acid-boron trifluoride solvent system. The fluorescence spectra of benzene and all of the methylbenzenes have also been measured in hydrocarbon solvents. The values for the polymethylbenzenes have been used with a Forster cycle to determine the basicities of these compounds in their excited singlet states. The compounds are found to be from 17 to 28 powers of ten more basic in their excited states than in their ground states.
IntroductionThe weakly basic properties of aromatic hydro
carbons toward strong Br0 nsted acids have been recognized for some time. 1 2 3 Many of the ground- state properties of these protonated aromatic systems have been extensively studied. 2,3 All of these studies have dealt with the ground electronic states of the systems. Flurry and Lykos4 5 have presented a quantum chemical prediction of the excited triplet-state basicities of the methyl-substituted benzenes. Unfortunately, there have, as yet, been no experimental data to compare with these predictions. One of the present authors has also recently presented a quantum chemical treatment of the excited singlet-state basicities of the series.6
Ratios of excited-state equilibria to ground-state equilibria may be obtained spectroscopically from the Forster cycle6 by comparing the spectra of the reactants and products. The absorption spectra7 8 and ground-state equilibrium constants4,8 for the methyl- benzenes in liquid hydrogen fluoride are known. From these, estimates of the excited-state basicity constants
could be made. For most accurate results, however, the energies of the 0 - 0 transitions should be used in the Forster cycle. These 0 - 0 transitions are difficult to obtain directly. Levshin, however, discovered that there is an approximate mirror-image relationship between absorption and fluorescence spectra of complex molecules, 9 implying that a good estimate of the 0 - 0
(1 ) See, fo r exam ple, L . P . H am m et, “ P h ysica l O rganic C h em istry ,” M cG ra w -H ill B o o k C o ., In c ., N ew Y o rk , N . Y . , 1940.(2 ) F o r recent review s, see H . H . P erkam pus and E . B aum garten , A n gew . Chem. In tern . E d . E ngl., 3 , 776 (1964).(3 ) G . A . O lah and N . W . M ey er in “ F ried e l-C rafts and R ela ted R e a ctio n s ,” V ol. I , G . A . O lah, E d ., In terscience P ublishers, In c., N ew Y o rk , N . Y . , 1963, p 623.(4) R . L . F lu rry , Jr., and P . G . L y k o s , J . A m . Chem. Soc., 85 , 1033 (1963), paper I o f th is series.(5 ) R . L . F lu rry , Jr., ibid., 88, 5393 (1966).(6 ) T . F orster, Z . E lektrochem ., 54, 42 (1950).(7 ) R . L . F lu rry , Jr., and J. G . Jones, J . P h ys . Chem ., in press.(8 ) M . K ilp a tr ick and F . E . L u b orsk y , J . A m . Chem. Soc., 7 5 , 577 (1 95 3 ); E . L . M a ck o r , A . H ofstra , and J. H . va n der W aa ls , Trans. F araday Soc., 54, 186 (1958).(9 ) W . L . L evsh in , Z . P h ysik , 43, 230 (1931).
Volume 71, Number 3 February 1967
590 R. L. Flurry, Jr ., and R. K eith W ilson
transition for a given species can be obtained by averaging the energies of the absorption and fluorescence maxima. This, of course, will only be valid if the absorbing and fluorescing species are the same.
The present work presents an attempt to determine spectroscopically the excited-state basicity constants for all of the polymethylbenzenes having three or more methyl substituents based on the absorption spectra, the fluorescence spectra, and their average for the protonated species present in a trifluoroacetic acid- boron trifluoride system.
Experimental Section
Reagents. The methylbenzenes employed were com- merically available reagent grade compounds. The liquids were fractionally distilled and the solids sublimed before using. When necessary, sulfuric acid washing was used to remove oxygen containing impurities. Owing to the extreme sensitivity of fluorescence techniques to impurities, the fluorescence spectra in both cyclohexane and the CF 3COOH-BF3 system were taken as the final criteria for purity. In particular, the fluorescence spectra were examined for spurious peaks due to fluorescing impurities and for anomalous intensities which might be caused by the presence of fluorescence quenchers or photosensitizers. It was found that the fluorescence measurements were more sensitive to trace impurities than was gas chromatography, nmr, or the more common measurements of refractive index, melting point, or boiling point. With these precautions, the only probable impurities are very small amounts of positional isomers of the polymethyl compounds.
The fluorescence measurements of the uncomplexed aromatic were made in three solvents—ethanol, cyclohexane, and n-heptane. The ethanol was absolute ethanol from U. S. Industrial Chemicals Co. and the cyclohexane was fluorometric grade from Hartman- Leddon Co. Both of these were used without further purification. The heptane was Analytical reagent grade from Mallinckrodt. This was subjected to the usual hydrocarbon purification process of concentrated sulfuric acid wash, base wash, water wash, drying, and fractional distillation. It was found that the position of the fluorescence maximum was essentially insensitive to the solvent used.
The trifluoroacetic acid was Eastman White Label grade. It was distilled before use and redistilled into the absorption cells via a vacuum line. The boron trifluoride was from the Matheson Co. and was used without further purification.
Spectral M easurem ents. A vacuum line was used for preparing all of the samples in the C F 3COOH-BF3
medium. Approximately 0.1 g of the methylbenzene was placed in a 1 -cm quartz fluorescence cell with a ground-glass joint on it. This was attached to the vacuum line and approximately 3 ml of C F 3COOH was distilled in under reduced pressure. Boron trifluoride was then bubbled through the C F3COOH solution until the entire system was at atmospheric pressure. The cell was removed and quickly stoppered with a glass stopper. The spectra were recorded immediately after the sample was prepared. Before each sample preparation, the vacuum line was dismantled, cleaned, oven dried, and reassembled.
Reproducible results were somewhat difficult to obtain in the fluorescence measurements on the acid solutions. For this reason, at least three successive samples of a given compound were measured. The standard deviations calculated for the fluorescence results reported are no greater than 1% . Fluorescence results when using cyclohexane, heptane, or ethanol as the solvent were completely reproducible.
The fluorescence measurements were made on an Aminco-Bowman Model SPF spectrophotofluorimeter, with a slit arrangement corresponding to the Aminco arrangement no. 1. The wavelength calibration on the present instrument is good to an accuracy of approximately ± 1% . This, coupled with the experimental standard deviations, gives an over-all accuracy to the fluorescence energy measurements of approximately ± 2% . The absorption spectra were obtained on a Perkin-Elmer Model 450 spectrophotometer. The absorption spectra of the complexes were more easily reproducible than the fluorescence spectra.
Results and Discussion
Table I presents the absorption and fluorescence maxima for the uncomplexed aromatics and their proton complexes in C F 3COOH-BF3. For completeness, the uncomplexed values for benzene, toluene, and the xylenes are included. The complexes of these were apparently too unstable for their fluorescence to be observed under our conditions; consequently their absorption spectra in the acid media were not measured either. Also included for comparison are the absorption maxima of the entire series of complexes in liquid hydrogen fluoride.7
Thermodynamically, equilibrium constants are related to the difference in the standard free energy (AG °) between the reactant and product. Two equilibria
can be compared by comparing the AG ° values of the reactions involved (eq 2). From the Forster cycle6
The Journal o f P hysica l Chem istry

Excited-State R eactivities 591
In K a = — (A(tA° - AG b ° )
K b R T(2 )
(Figure 1) the changes in internal energy (A E ) for the ground and excited states of the proton complexes may be related to the transition energies of the uncomplexed and complexed aromatic. In Figure 1, Ar and Ar*
A E a i + A E s t = A E ArH + + A E s i * (3)
represent the ground and excited states of the aromatic, and ArH+ and ArH+* represent the ground and excited
Table I : A bsorption and F luorescence Spectra o f theM ethylbenzenes and T h eir P roton C om plexes
Xmax (fluorescence),' max (absorption), m/i— —s
CFs-m/x----------
CFs-Hydro- L iq u id COOH- Hydro- COOH-
C o m p o u n d carbon® HFb BFa carbon BFa
Benzene 255 320 285Toluene 262 330 289o-X ylen e 263 335m -X ylen e 265 336 292p -X y len e 274 350 291H em im ellitene 262 345 350 294 484Pseudo cum ene 267 351 344 315 461M esitylene 246 355 355 295 433Prehnitene 268 339 372 298 483Isodurene 268 365 370 298 493Durene 278 362 364 300 482P entam ethyl-
benzene270 375 375 303 432
H exam ethylbenzene
272 385 384 310 445
“ Am erican P etroleum In stitu te R esearch P ro je ct 44, “ C ata logue o f U ltraviolet Spectrogram s,” N ational B ureau of Standards, 1945-1950. 6 R eference 7.
states of the proton complex. In Figure 1 and eq3, A E A t is the energy of the first electronic transition of the aromatic, A E A th - is that of the complex, and A E s t
and A E s t * are the stabilization energies of the ground and excited states of the complex, respectively.
The AG ° values of eq 2 contain both enthalpy and entropy terms. If, however, there is no pressure- volume work done by the system, internal energy change is equal to enthalpy change. If, furthermore, the entropy change is the same for the equilibrium in the ground-state and the excited state,* 3 10 the ratios of the ground to excited-state basicities of the aromatics may be expressed as in eq 4. This relation also implies
K * ( A E a t — A E a t b .* ) ...°S ~ K = 2.303R T ( )
that there is no shift in A E a t in going from the hydro-
A r*
A t
aest
f
ÎAEArH +
Figure 1. F orster cycle8 for proton arom atic com plexes. A r and A r* refer to the energies o f the ground and excited states o f the uncom plexed arom atic. A rH +* and A r H + refer to those o f the proton com plexes.T h e A F St values are the stabilization energies.
carbon to the acid as the solvent. This is obviously an incorrect assumption; however, for lack of a method of estimating this shift, it was ignored. The first three columns of numbers in Table II present the logarithms of the ratios of excited-state to ground-state basicities for the molecules under consideration as calculated from the absorption spectra, the emission spectra, and the average of the two (presumably the energy difference for the 0 -0 transition). These values are for a temperature of 27°.
Column four of Table II presents the ground-state basicities of these compounds in liquid hydrogen fluoride referred to hexamethylbenzene as a standard.4'8 If the arguments of Hammett concerning relative basicities in various solvents are accepted,11 this same scale of relative basicities should carry over into other solvent systems, including the trifluoroacetic acid- boron trifluoride system under consideration here. The relative basicities of the excited state can then be compared to a common standard by using these values.
log ( K * / K 0* ) = log ( K * / K ) + log ( K / K 0) -
log ( K 0* / K o ) (5)
Columns five, six, and seven of Table II present the excited-state basicities relative to the excited-state basicity of hexamethylbenzene.
A number of interesting facts are evident from Table II. The first and most obvious consideration is that the excited-state equilibrium constants obtained from
(10) I t has been show n experim enta lly th a t th e e n tro p y ch an ge is nearly con sta n t fo r p roton ie equ ilibria in v o lv in g th e grou n d and excited states o f 3 -h y d ro x y q u in o lin e : J. C . H a y lo ck , S. F . M ason , and B . E . S m ith , J . Chem. Soc., 4897 (1963).(11) L . P . H a m m ett, “ P h ysica l O rganic C h em istry ,” M cG ra w -H ill B o o k C o ., In c ., N ew Y o rk , N . Y . , 1940, C h ap ter 9.
Volume 71, Number 8 February 1967
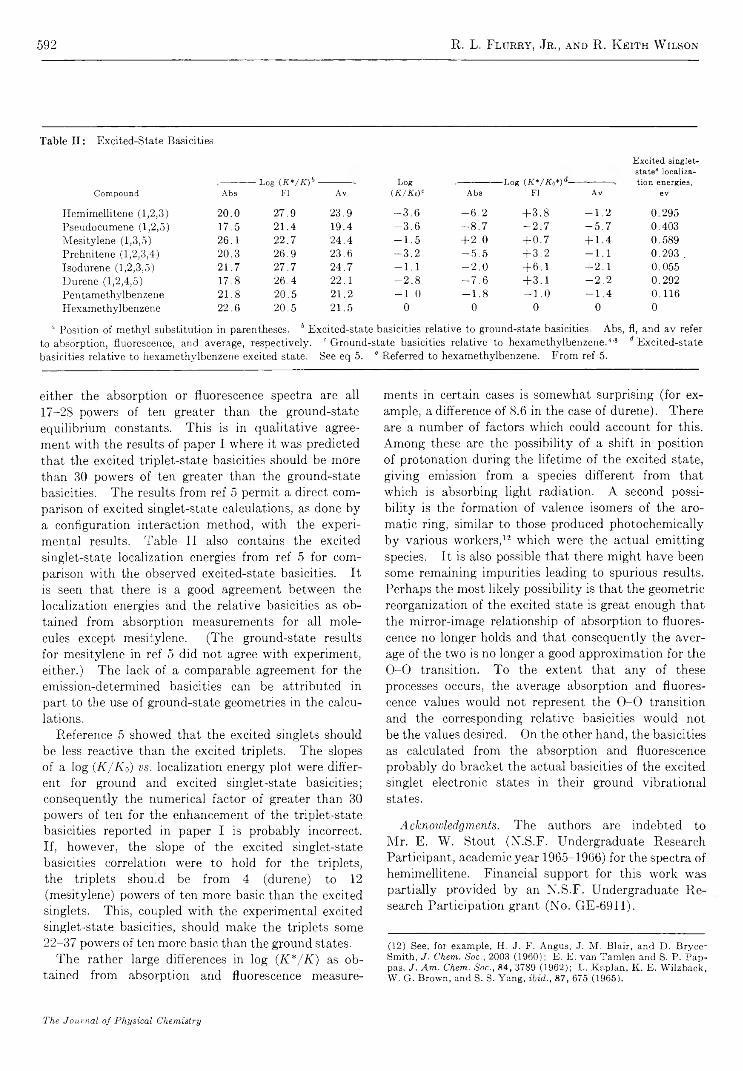
592 R. L. Flurry, Jr ., and R. K eith W ilson
T ab le II : E xcited -S tate Basicities
E x c i te d s in g le t- s ta te 6 lo c a liz a -
C o m p o u n d A b s- L o g ( K * / K ) b -
F l A vL o g
(A /A 'oP A b s- L o g ( K * / I C o * r -
F l A vt io n e n erg ies ,
e v
H em im ellitene (1 ,2 ,3 ) 2 0 .0 2 7 .9 2 3 .9 - 3 . 6 - 6 . 2 + 3 . 8 - 1 . 2 0 .2 9 5P seudocum ene (1,2 ,5) 1 7 .5 2 1 .4 1 9 .4 - 3 . 6 - 8 . 7 - 2 . 7 - 5 . 7 0 .4 03M esitylene (1,3 ,5) 2 6 .1 2 2 .7 2 4 .4 - 1 . 5 + 2 . 0 + 0 . 7 + 1 .4 0 .5 8 9Prehnitene (1,2 ,3 ,4 ) 2 0 .3 2 6 .9 2 3 .6 - 3 . 2 - 5 . 5 + 3 . 2 - 1 . 1 0 .2 9 3 .Isodurene (1,2 ,3 ,5) 2 1 .7 2 7 .7 2 4 .7 - 1 . 1 - 2 . 0 + 6 . 1 4 -2 .1 0 .0 5 5D urene (1,2 ,4 ,5 ) 1 7 .8 2 6 .4 2 2 .1 - 2 . 8 - 7 . 6 + 3 .1 - 2 . 2 0 .2 9 2P entam ethylbenzene 2 1 .8 2 0 .5 2 1 .2 - 1 . 0 - 1 . 8 - 1 . 0 - 1 . 4 0 .1 1 6H exam ethylbenzene 2 2 .6 2 0 .5 2 1 .5 0 0 0 0 0
“ P osition o f m ethyl substitution in parentheses. 6 E xcited-state basicities relative to ground-state basicities. A bs, fl, and a v refer to absorption, fluorescence, and average, respectively . ' G round-state basicities relative to hexam ethylbenzene.'1’8 d E xcited -sta te basicities relative to hexam ethylbenzene excited state. See eq 5. 6 R eferred to hexam ethylbenzene. F rom ref 5.
either the absorption or fluorescence spectra are all 17-2S powers of ten greater than the ground-state equilibrium constants. This is in qualitative agreement with the results of paper I where it was predicted that the excited triplet-state basicities should be more than 30 powers of ten greater than the ground-state basicities. The results from ref 5 permit a direct comparison of excited singlet-state calculations, as done by a configuration interaction method, with the experimental results. Table II also contains the excited singlet-state localization energies from ref 5 for comparison with the observed excited-state basicities. It is seen that there is a good agreement between the localization energies and the relative basicities as obtained from absorption measurements for all molecules except mesitylene. (The ground-state results for mesitylene in ref 5 did not agree with experiment, either.) The lack of a comparable agreement for the emission-determined basicities can be attributed in part to the use of ground-state geometries in the calculations.
Reference 5 showed that the excited singlets should be less reactive than the excited triplets. The slopes of a log ( K / K o ) v s . localization energy plot were different for ground and excited singlet-state basicities; consequently the numerical factor of greater than 30 powers of ten for the enhancement of the triplet-state basicities reported in paper I is probably incorrect. If, however, the slope of the excited singlet-state basicities correlation were to hold for the triplets, the triplets should be from 4 (durene) to 12 (mesitylene) powers of ten more basic than the excited singlets. This, coupled with the experimental excited singlet-state basicities, should make the triplets some22-37 powers of ten more basic than the ground states.
The rather large differences in log ( K * / K ) as obtained from absorption and fluorescence measure
ments in certain cases is somewhat surprising (for example, a difference of 8.6 in the case of durene). There are a number of factors which could account for this. Among these are the possibility of a shift in position of protonation during the lifetime of the excited state, giving emission from a species different from that which is absorbing light radiation. A second possibility is the formation of valence isomers of the aromatic ring, similar to those produced photochemically by various workers,12 which were the actual emitting species. It is also possible that there might have been some remaining impurities leading to spurious results. Perhaps the most likely possibility is that the geometric reorganization of the excited state is great enough that the mirror-image relationship of absorption to fluorescence no longer holds and that consequently the average of the two is no longer a good approximation for the 0 -0 transition. To the extent that any of these processes occurs, the average absorption and fluorescence values would not represent the 0 -0 transition and the corresponding relative basicities would not be the values desired. On the other hand, the basicities as calculated from the absorption and fluorescence probably do bracket the actual basicities of the excited singlet electronic states in their ground vibrational states.
A c k n o w l e d g m e n t s . The authors are indebted to Mr. E. W. Stout (N.S.F. Undergraduate Research Participant, academic year 1965-1966) for the spectra of hemimellitene. Financial support for this work was partially provided by an N.S.F. Undergraduate Research Participation grant (No. GE-6911).
(12 ) See, fo r exam ple, H . J . F . A ngu s, J. M . B la ir, an d D . B ry c e - S m ith , J . Chem. Soc., 2003 (1 96 0 ); E . E . va n T a m len an d S. P . P a p pas, J. A m . Chem. Soc., 8 4 , 3789 (1 96 2 ); L . K a p la n , K . E . W ilz b a ck , W . G . B row n , and S. S. Y a n g , ib id ., 87 , 675 (1965 ).
The Journal of Physical Chemistry

Oxidation of Soot by OH R adicals 593
Oxidation of Soot by Hydroxyl Radicals
by C. P. Fenimore and G. W . Jones
General E lectric Research and D evelopm ent Center, Schenectady, N ew Y ork (Received A u gu st 12, 1966)
In flame gases of temperatures from 1530 to 1890°K and Po2 ~ 10-4 to 0.3 atm, the rate of oxidation of soot does not depend very strongly on P02. The observations are consistent with the assumption that about 0.1 of the collisions of OH with the soot remove a carbon atom, the number of collisions being calculated from P 0H by kinetic theory.
Millikan1 inferred that tiny soot particles in fuel- rich hydrocarbon flames at 1700 to 1800°K were oxidized by OH radicals rather than by the much larger concentrations of C02 or H20. Graham and coworkers2 also considered OH to be a very reactive oxidant. They proposed that the gasification of massive pieces of carbon in a very hot stream of fuel-rich combustion products was due to the removal of a carbon atom in about 0.03 of the collisions of OH with pyrolytic carbon, or in about 0.1 of those with commercial graphites.
When 0 2 is present, OH might be less important. Lee and co-workers3 reported a rate of soot oxidation of
1.085 X 10⁴Po27,-1/2e-39'3 k™ l/R T g cm“ 2 sec“ 1 (1)
in flame gases, with Po2 = 0.05-0.10 atm and T = 1350-1650°K, as if 0 2 were the only important reactant when P 0 , was considerable. Neither P 0, nor T was constant in any experiment, however, and it is uncertain how well the separate effect of each variable was untangled from the observations.
We have measured soot oxidation in flame gases of constant P o, and T during each run, so that the variables were separated experimentally. In the ranges P o2 = 0.04-0.30 atm and T = 1530-1890°K, we findlittle dependence on P0r Even in slightly fuel-rich gas where P 0s is very small, soot oxidation remains considerable. Our rates are about five times faster than those reported by Lee and co-workers at the same temperature and P o r
One way of explaining our weak dependence on P o2 is to suppose that soot is mainly oxidized by OH in our flames. We measured the partial pressure of this radical in some of our runs and found that the observed oxidation rates could be accounted for by a collision
efficiency of OH on soot o: about 0.1.If OH was important, the fact should be revealed by
comparing the rate of oxidation in flames with the rate of a suspension of soot in dry gas where OH was absent. We could not make this comparison at the same temperature as we would have liked to. However, soot suspended in dry gas at 1200°K oxidized more slowly than would be expected from an extrapolation of our flame results. Furthermore, the rate of oxidation in dry gas depended on P o2. We think an additional mechanism besides oxidation by 0 2 is important in our flames, and we favor an oxidation by OH.
The slower rates observed by Lee and co-workers may reflect differences :n the flames used; P o h was doubtlessly smaller in their gases than in ours at the same Po2 and T . It is possible that when P 0 h is smaller, a reaction with 0 2 became more important, as is implied by their reported dependence on Po:.
Experimental SectionE x p e r i m e n t a l F l a m e s . Figure 1 is a sketch of the
apparatus used to obtain fuel-lean sooty flames. A rich mixture of molecular proportions of C2H4 + 1.202 + 2.0Ar was burnt on a porous burner4 to give a gas containing soot equal to about 1% of the carbon fed as ethylene. Sixteen per cent of the fuel remained in the products as hydrocarbons, mostly as acetylene and the rest as carbon oxides, steam, and hydrogen. The products were cooled, mixed with additional constituents, and finally burnt on a second burner. The
(1) R . C. Millikan, J . P h ys . Chem., 66, 794 (1962).(2) J. A . Graham, A. R . G. Brown, A. R . Hall, and W . W att, Soc. Chem. Ind . (London), 1958.(3) K . B. Lee, M . W . Thring, and J. M . Beer, Combust. F lam e, 6 , 137 (1962).(4) W . E. Kaskan, Syrnp. Combustion, 6th, 134 (1957).
Volume 71, Number 3 February 1967

594 C. P. Fenimore and G. W. Jones
ii
J ------ FUEL-LEAN, SOOTY FLAMEI
Figure 1. A rrangem ent of apparatus to get a fuel-lean sooty flame.
soot gasified in an environment of constant P 0 l and T
above the second burner.The second burner was a copper disk 2 cm in diam
eter by 0.6 cm thick with 220 0.1-cm holes running through it and a copper cooling coil soldered around it. Its flame consisted of a series of small cones, one per hole, whose flows merged into an approximately onedimensional stream of burnt gas 0.1 cm above the surface. The disks were made by W. E. Kaskan when he worked in our laboratory several years ago.
The second flame usually became unstable if its temperature fell below 1600°K, although one acceptable run was obtained at 1530°. Temperature was measured by a fine quartz-coated thermocouple.4
The extent of reaction was determined by sucking a measured volume of gas through a quartz probe held at various distances above the disk and catching the soot on a plug of Vycor wool in the cool leg of the probe. The probe was evacuated at room temperature and then heated with a flame while oxygen was passed through it. The stream of oxygen and carbon oxides was run through hot copper oxide and the carbon dioxide trapped at 113°K (isopentane slush). The trap was cooled further in liquid nitrogen and evacuated, then warmed, and its contents expanded into a mass spectrometer where the carbon dioxide was measured.
A correction was established by analyzing over-all fuel-lean runs in which the first burner was not ignited, so that all the reactants burnt at once on the disk in a soot-free flame. The correction was 8% of the soot measured close to the disk, but a larger percentage further downstream. Measurements were not attempted after the correction had grown to 30%, which means that the region of study rarely extended farther than 1 cm downstream of the disk.
Soot samples were also caught on carbon substrates in a similar probe and submitted to E. F. Koch of our laboratory for electron micrographs. These samples were strings of uniform spheres about 200 A in diameter before burning in the second flame and about 100 A in diameter after the soot content had fallen by oxidation to 0.22% of the carbon in the ethylene.
A r r a n g e m e n t f o r O x i d a t i o n i n D r y G a s . Soot, collected from the same flame used to generate it for the flame oxidations, was evacuated overnight at 500°I\, then cooled and loaded into a closed vessel equipped with a sealed stirrer to disperse it. A small flow of N2 through the stirred vessel carried entrained soot to mix with a large volume of dry preheated gas.
The large volume of preheated gas was N2 or N2- 0 2 mixtures piped through a quartz tube of 1.3 cm inside diameter. The tube was heated by two electric furnaces each 30 cm long. The gas was preheated in the first furnace, then mixed without much drop in temperature with about 0.1% of its volume of the soot suspension from the stirred vessel. The hot dilute suspension passed through the second furnace, and the surviving soot was caught on a plug of Vycor wool and measured as before.
The soot added to the preheated gas was taken to be that which was measured when N2 containing less than 0.2% 0 2 was used in the quartz tube. This amount was a constant ± 10%, independent of the gas temperature in the second furnace, 1000 to 1200°K when a constant flow was passed through the dispersing vessel. The extent of reaction was measured by the decrease in soot recovered when the hot dry gas contained oxygen. However, the uncertainty of ± 10% in the soot added meant that the minimum reaction rate observable was about 0.7 X 10⁻⁶ g of carbon cm '2 secM At 1140°K or less, the rate was certainly not larger than this when P o 2 = 0.21. At 1200°K, measurable rates were obtained for P o2 = 0.12 and 0.21 but not for Po2 = 0.05.
O t h e r E x p e r i m e n t s . A few measurements were made of the rate of oxidation of soot containing 1% manganese by weight. This was made by saturating the argon flow to the soot-forming burner with volatile manganese-methylcyclopentadienyl-tricarbonyl. The
The Journal of Physical Chemistry

Oxidation of Soot by OH R adicals 595
TIME, MILLISECONDSFigure 2. C u be roo t o f the soot con ten t vs. tim e. S oot is expressed as a percentage o f the carbon fed in the e th y len e ; tim e is inferred from the know n gas ve locity .
yield of soot was approximately the same whether it contained manganese or not.
Results
We assume that the soot consists of uniform spheres which react, at a constant rate per unit of area, with a surrounding gas of fixed temperature and composition. From geometrical considerations, the gasification can be expressed
N /per cent soot \1/3 1 2R ( t - to)(d/dtj) I , , ] 1 j (2 )\per cent soot0/ p<h
where d is the diameter of a particle, per cent soot equals the carbon present as soot, expressed as a percentage of the carbon fed in the ethylene, R the reaction rate in g of carbon cm-2 sec“ 1, t the time, and p
the density of a particle. The zero subscript refers to some arbitrary point at which d = do-
Figure 2 gives the flame data in plots of (per cent soot)1/3 v s . time. From each curve, a value of (2R /
pd0)o.6 appropriate to eq 2 was computed and listed in
5 7 9I0VT
Figure 3. R eaction rate vs. 1 /T. F lam e data from T ab le I . T h e range o f observations b y Lee and co-w orkers in the soo t cloud above a h ydrocarbon diffusion flame is indicated. T h e lower tw o p o in ts g ive m easurem ents o f oxidation rate in dry N 2- O 2 mixtures.
Table I. In these values d 0 is the d when (per cent soot)1/3 = 0.6; it is about 1 X 10⁻⁶ cm and unchanged from run to run; therefore, the values of (2P/pd0)o.6 are about 106 times R itself.
Values of 10“ 6(2.R/pdo)o.6 — R are plotted against the reciprocal of temperature in Figure 3. The six runs with appreciable P c 2 establish a line with activation energy of about 22 kcal mole. _1 The three slightly fuel-rich runs lie below this line, but surprisingly close if the oxidation is truly by 0 2. The slower, more oxygen-dependent rates reported by Lee and co-workers are indicated.
Figure 3 also contains two points for the oxidation of soot in dry gas at lower temperatures. These rates are less than the values expected from a long extrapolation of the flame data. Furthermore, the oxidation in dry gas depends more strongly on P 02 than does our flame oxidation. It is probable that our flames possess an additional mechanism besides oxidation by 0 2.
Figure 4 shows a plot of (2P/pd0)o.6 against the calculated equilibrium P o h - Since P o h was doubtlessly larger than the equilibrium pressure,6 we determined
(5) W. E. Kaskan, Combust. Flam e, 2, 229, 286 (1958).
Volume 71, Number 3 February 1967
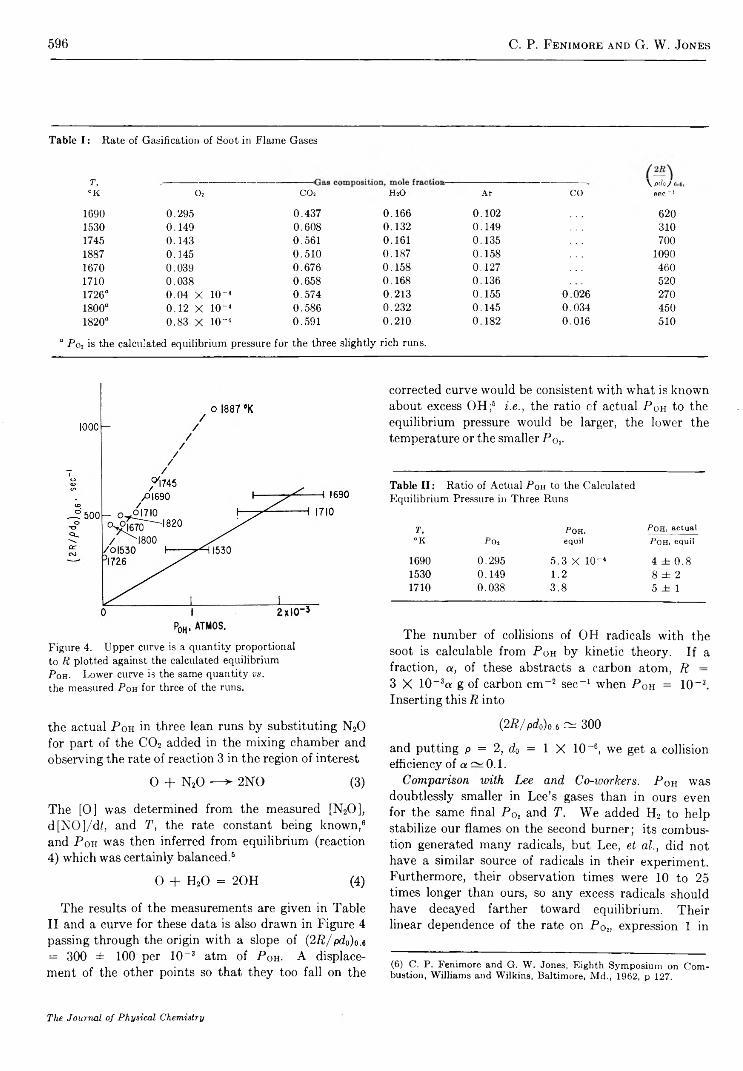
596 C. P. Fenimore and G. W. Jones
Table I : R ate o f G asification o f S oot in Flam e Gases
T, \pdo/ 0°K Oj C 02 H2O Ar CO sec-1
1690 0 .2 95 0 .4 3 7 0 .1 6 6 0.102 6201530 0 .1 4 9 0 .6 0 8 0 .1 3 2 0 .1 4 9 3101745 0 .1 43 0 .5 61 0 .161 0 .1 35 7001887 0 .145 0 .5 1 0 0 .1 8 7 0 .1 5 8 10901670 0 .0 39 0 .6 7 6 0 .1 5 8 0 .1 27 4601710 0 .0 3 8 0 .6 5 8 0 .1 6 8 0 .1 3 6 5201726“ 0 .0 4 X 1 0 “ 4 0 .5 7 4 0 .2 1 3 0 .1 55 0 .0 2 6 2701800“ 0 .1 2 X 1 0 -" 0 .5 8 6 0 .2 3 2 0 .1 4 5 0 .0 3 4 4501820“ 0 .8 3 X 1 0 -4 0 .5 9 1 0 .2 1 0 0 .1 8 2 0 .0 1 6 510
0 P o j is the calculated equilibrium pressure for the three slightly rich runs.
Figure 4. U pper curve is a quan tity proportional to R p lotted against the calculated equilibrium P oh. L ow er curve is the same quan tity vs. the m easured P oh for three o f the runs.
the actual Poh in three lean runs by substituting N20 for part of the C02 added in the mixing chamber and observing the rate of reaction 3 in the region of interest
0 + N20 — ► 2NO (3)
The [0] was determined from the measured [N20], d[NO]/di, and T , the rate constant being known,6 and Poh was then inferred from equilibrium (reaction4) which was certainly balanced.6
0 + H20 = 20H (4)
The results of the measurements are given in Table II and a curve for these data is also drawn in Figure 4 passing through the origin with a slope of (2P/pd0)o.6 = 300 ± 100 per 10-3 atm of Poh- A displacement of the other points so that they too fall on the
corrected curve would be consistent with what is known about excess OH;6 i . e . , the ratio of actual P oh to the equilibrium pressure would be larger, the lower the temperature or the smaller Po2.
Table I I : R atio o f A ctual P oh to the C alcu lated E quilibrium Pressure in T hree R uns
T, Poh, POHi actual°K POi equil -POH. equil
1690 0 .2 95 5 .3 x 1 0 -4 4 ± 0 .81530 0 .1 49 1 .2 8 ± 21710 0 .0 38 3 .8 5 ± 1
The number of collisions of OH radicals with the soot is calculable from Poh by kinetic theory. If a fraction, a , of these abstracts a carbon atom, R = 3 X 10~3a g of carbon cm-2 sec-1 when P0h = 10~3. Inserting this R into
(2P/pdo)o.6 ^ 300
and putting p = 2, d 0 = 1 X 10 ~6, we get a collision efficiency of a ~ 0.1.
C o m p a r i s o n w i t h L e e a n d C o - w o r k e r s . P0H was doubtlessly smaller in Lee’s gases than in ours even for the same final P0s and T . We added H2 to help stabilize our flames on the second burner; its combustion generated many radicals, but Lee, e t a l , did not have a similar source of radicals in their experiment. Furthermore, their observation times were 10 to 25 times longer than ours, so any excess radicals should have decayed farther toward equilibrium. Their linear dependence of the rate on P02, expression 1 in
(6) C. P. Fenimore and G. W. Jones, Eighth Symposium on Combustion, Williams and Wilkins, Baltimore, Md., 1962, p 127.
The Journal of Physical Chemistry
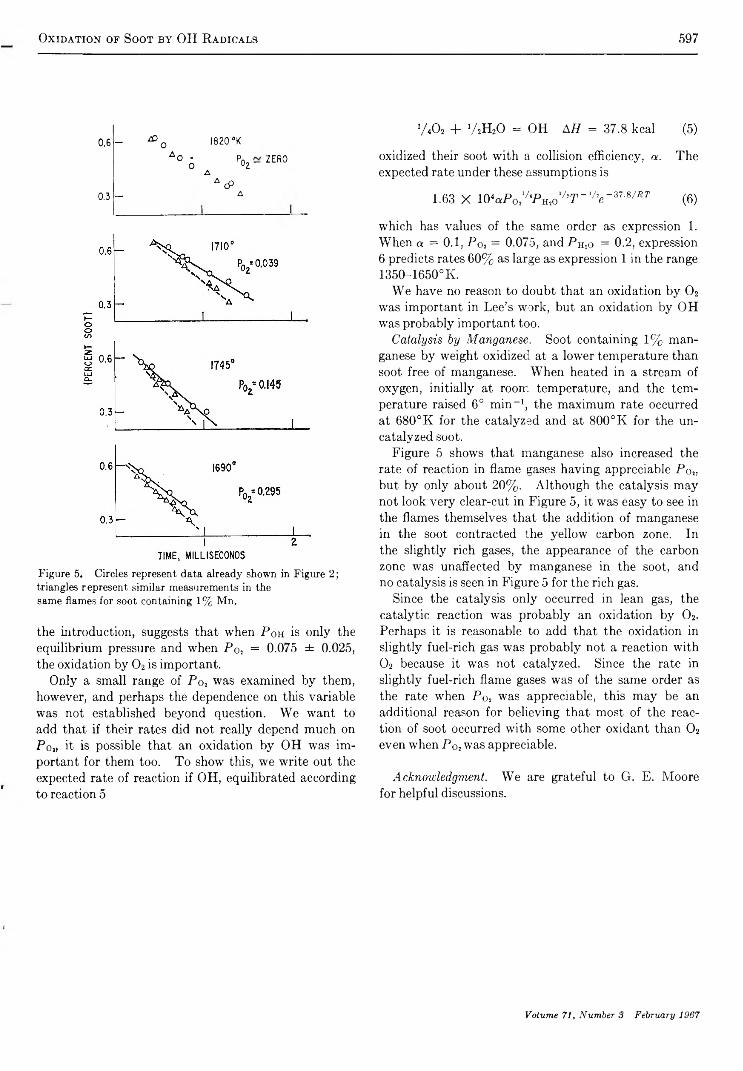
Oxidation of Soot by OH R adicals
0 . 6 - 40 0 1820 °K
* ° a po2 - zeroA
A<P0.3 - A
Figure 5. C ircles represent data already show n in Figure 2 ; triangles represent sim ilar m easurem ents in the sam e flam es for s oo t contain ing 1 % M n .
the introduction, suggests that when P o h is only the equilibrium pressure and when P 0% = 0.075 ± 0.025, the oxidation by 0 2 is important.
Only a small range of P o2 was examined by them, however, and perhaps the dependence on this variable was not established beyond question. We want to add that if their rates did not really depend much on P o„ it is possible that an oxidation by OH was important for them too. To show this, we write out the expected rate of reaction if OH, equilibrated according to reaction 5
597
y 40 2 + y 2H20 = OH AH = 37.8 kcal (5)
oxidized their soot with a collision efficiency, a . The expected rate under these assumptions is
1.63 X 10⁴aPO21/‘PH2o1AT_,/2e“ 37-8/Kr (6)
which has values of the same order as expression 1. When a = 0.1, P o2 = 0.075, andPH2o = 0.2, expression 6 predicts rates 60% as large as expression 1 in the range 1350-1650°K.
We have no reason to doubt that an oxidation by 0 2 was important in Lee’s work, but an oxidation by OH was probably important too.
C a t a l y s i s b y M a n g a n e s e . Soot containing 1% manganese by weight oxidized at a lower temperature than soot free of manganese. When heated in a stream of oxygen, initially at room temperature, and the temperature raised 6° min-1, the maximum rate occurred at 680° K for the catalyzed and at 800° K for the uncatalyzed soot.
Figure 5 shows that manganese also increased the rate of reaction in flame gases having appreciable P o2, but by only about 20%. Although the catalysis may not look very clear-cut in Figure 5, it was easy to see in the flames themselves that the addition of manganese in the soot contracted the yellow carbon zone. In the slightly rich gases, the appearance of the carbon zone was unaffected by manganese in the soot, and no catalysis is seen in Figure 5 for the rich gas.
Since the catalysis only occurred in lean gas, the catalytic reaction was probably an oxidation by 0 2. Perhaps it is reasonable to add that the oxidation in slightly fuel-rich gas was probably not a reaction with 0 2 because it was not catalyzed. Since the rate in slightly fuel-rich flame gases was of the same order as the rate when P02 was appreciable, this may be an additional reason for believing that most of the reaction of soot occurred with some other oxidant than 0 2 even when Po2 was appreciable.
A c k n o w l e d g m e n t . We are grateful to G. E. Moore for helpful discussions.
Volume 71, Number 3 February 1967
598 Farhataziz
Cobalt-60 7 Radiolysis of Solutions of Potassium Bromide in 0 .8 N Sulfuric Acid
by Farhataziz1
R adiation Laboratory ,2 U niversity o f N otre D am e, N otre D am e, Indiana 46656 (Received A u gu st 15, 1966)
The 60Co 7 radiolysis of potassium bromide in 0.8 N H2S04 has been studied in detail. A new mechanism is suggested for deaerated solutions in which 0 2 is produced with G =
0.008 and Br- disappears with G ~ 0.01. It is concluded that <7(H0 2) is 0.008 in 60Co 7
radiolysis of 0.8 N H2S04 solutions. (?(H2) = <7(H2) = 0.38 for bromide solutions in 0.8 N
H2S04. The H20 2 yields in bromide solutions containing 0 2 ~ 300 ¡ i M are higher by a few per cent than in the case of aerated solutions. This difference is due to micromolar quantities of C02 present in aerated solutions. The fcH + B r 2 has been estimated to be (12 ± 50%) X 1010 M - 1 sec-1.
The radiolysis of potassium bromide solutions has been studied by numerous workers with changing emphasis on the different aspects of the subject.3-17 Recent studies15-17 have exposed inadequacies in the previously accepted mechanism for radiolysis of aqueous bromide solutions at pH 2. In this paper, results of a detailed investigation of 60Co 7 radiolysis of bromide solutions in 0.8 N H2S04 are presented. Such results indicate a need for revision of the mechanism applicable to 0.8 N H2S04 solutions as well.
Experimental Section
The potassium bromide and sulfuric acid used in this work were Baker AR grade.
Distilled water from a Barnstead still was distilled under a stream of 0 2 in a two-stage Pyrex system. The first stage contained alkaline KMn04. The second stage contained no additives and was included to trap any Mn salt which under certain conditions comes over with the water. After every distillation stage, the mixture of 0 2 and steam passed through Pyrex tubing (2- cm o.d. and 25 cm long) heated to 350°. The triply distilled water was finally distilled in an Engelhard allquartz bidistillation apparatus, Model B3. The condensed water was stored in Pyrex vessels.
The glassware used for preparation of solutions and irradiation was cleaned with chromic acid, rinsed with tap water, rinsed with the high-purity water, dried in an oven, and then heated to 450° for about 1.5 hr. The syringe techniques for irradiation, degassing, and gas solution were essentially those of Hart, et a l . , is and are described in detail by Farhataziz and Dyne.19 The
commercially available all-glass 100-ml syringes were modified by sealing 5/20 T joints of N51 Kimble glass to their outlets. A Hochanadel-Ghormley type 2-kc 1 2 3 4 5 6 7 8 9 10 11 12 13 14 15 16 17 18 19
(1) On leave from Pakistan A to m ic E n ergy C om m ission .(2) T h e R ad ia tion L a b ora tory o f the U n iversity o f N otre D a m e is operated un der con tra c t w ith the U . S. A to m ic E n ergy C om m ission . T h is is A E C D ocu m en t N o . C O O -38-461.(3) H . F rick e and E . J. H art, J. Chem. Phys., 3 , 596 (1935).(4) C . J. H och an ad el, J. Phys. Chem., 56, 587 (1952).(5) E . R . Johnson and A . O . A llen , J. Am. Chem. Soc., 74, 4147 (1952).(6) T . J. Sw orski, ibid., 76, 4867 (1954).(7) A . O . A llen and R . A . H o lro y d , ibid., 77, 5852 (1955).(8) J. A . G h orm ley and C . J. H och an ad el, Radiation Res., 3 , 227 (1955).(9) H . A . M a h lm a n and J. W . B oy le , J. Am, Chem. Soc., 80 , 773(1 95 8 ) .(10) H . A . Schw arz, J . M . C affrey , and G . Scholes, ibid., 8 1 , 1801(1 95 9 ) .(11) M . B u rton and K . C . K u rien , J. Phys. Chem., 63, 899 (1959).(12) E . H a y o n , ibid., 65, 1502 (1961).(13) C . F erradin i and A . M . K ou lk es-P u jo , J. Chim. Phys., 1 0 4 ,
1310 (1963).(14) B . C ercek , M . E bert, J. P . K een e, and A . J. S w allow , Science, 145, 919 (1964).(15) A . R a il and H . C . S utton , Trans. Faraday Soc., 61, 877 (1965).(16) B . C ercek , M . E bert, C . W . G ilbert, and A . J. Sw allow , P ro ceedings o f the In ternational Sym posium on P ulse R ad iolysis, M anchester, E ngland , A p ril 1965, A ca d e m ic Press, L o n d o n , 1965, p 83.
(17) H . C . S u tton , G . E . A dam s, T . W . B oag , and B . O . M ich ael, P roceedin gs o f the In ternationa l S ym posium on P ulse R ad io lys is , M anchester, E ngland , A pril 1965, A ca d em ic Press, L on d on , 1965,p 6 1 .
(18) E . J. H art, S. G ord on , and D . A . H u tch ison , J. Am . Chem. Soc., 75, 6165 (1 95 3 ); E . J. H art, ibid., 76, 4312 (1954).(19) F arhataziz and P . J. D y n e , C R C -1 2 0 5 or A E C L -2 1 1 3 , 12, 1964.
The Journal o f P hysica l Chem istry

60Co 7 R adiolysis of Solutions of Potassium Bromide 599
60Co source was used. The dose rate was about 1.7 X 10²⁰ ev l.-1 min-1 in 0.8 N H2S04 as determined by Fricke dosimetry with (7(Fe3+) = 15.6.
Hydrogen peroxide was determined by mixing the irradiated solutions with a definite volume of ~ 2 mill FeSOi in 0.8 N H2SO4 and measuring Fe3+ extinction at 304 or 275 mu. Values of the extinction coefficient used are 2240 M ~ l cm-1 at 25° with a 0.7% per degree increase at 304 npa and 1830 M ~ l cm-1 at 275 m/r. If bromine is produced during radiolysis, it also will react with Fe2+ to give Fe3+, and this method will measure both H20 2 and bromine.
Bromide was measured by the spectrophotometric method based on complex formation between bromide and palladous salts.20 A stock solution of palladous sulfate of ~1 .5 X 10~2 M strength in 1.5 N H2SC>4 was prepared directly from PdS04-2H20. The 1:10 dilution of stock solution with water should give an optical density from 0.15 to 0.17 at 390 mu when compared against water in 1-cm cells. A slight precipitation of palladium occurs ir_ the stock solution after several days. The filtered solution should be tested by the 1:10 dilution test; if needed, more PdS04 should be dissolved. For analysis, the desired volume of KBr solution in 0.8 V H2S04 is taken and diluted with 0.8 N H2S04 to give a total volume of 5 ml. This solution is diluted to 10 ml by adding water and 0.25 ml of palladous sulfate stock solution. The absorbance is measured at 230 m against a blank prepared from 5 ml of 0.8 N H2S04. The extinction coefficient is 10,020 M ~ l cm-1. Hydrogen peroxide does not interfere in the estimation of bromide. However, at concentrations of -~200 f x M a correction for its absorption at 230 m/x must be applied.
The gases were extracted in a modified Van-Slyke apparatus and directly injected into an F and M 700 gas chromatograph for analysis. A Molecular Sieve 5A column of 3.5-ft length was used with a thermal conductivity detector at 150°. Argon was used as flow gas for H2 estimation and helium for 0 2 estimation with a flow rate of about 55 ml/min.
Results
D e a e r a t e d S o l u t i o n s . Measured 100-ev yields are denoted by G and primary yields by g . All solutions were in 0.8 N H2S04. Oxygen is produced with a G = 0.008 that is constant over the bromide concentration range 3 X 10⁻⁶ to 3 X 10⁻³ M and for doses up to 450 X 1020 ev l.-1. For the same dose range and for the bromide concentration range 1 X 10⁻⁶ to 3 X 10~3 M , G(H20 2 + Br2) = 0.38, where Br2 includes Br;i~.
In 3 X 10⁻⁵ M KBr solutions, which provided the best conditions for KBr analysis, G for the disappear-
Figure 1. H ydrogen form ation b y 60C o 7 irradiation o f potassium brom ide solutions in 0.8 N H 2SC>4 w ith follow ing initial concentrations o f brom ide:O, 3.23 X 10 “ 5 M , deaerated; □ , 3.19 X 10 - 3 M , deaerated; • , 3.41 X 1 0 -5 M , [O2]o = 282 yM ,A, 3.19 X 10“3 M , [Oslo = 262 yM .
ance of Br~ is estimated to be about 0.01 from Br~ measurements before and after a dose of ~450 X 1020 ev l.-1. Because all other yields were independent of dose over this range, it is assumed that disappearance of Br~ behaves similarly. It is further assumed that Br_ changes to Br2. Bromine is a stable product in the irradiation of aerated solutions at pH 2.16
Hydrogen yields are shown in Figure 1. The straight line has a small positive intercept on the ordinate; the slope gives (?(H2) = 0.38, independent of bromide concentration from 1 X 10~5 to 3 X 10⁻³ M .
O x y g e n a t e d S o l u t i o n s . No disappearance of Br~ was detectable in KBr solutions of 1 X 10⁻⁵ to 3 X 10~3 M containing 0 2 from 50 y M to saturation for doses up to 300 X 1020 evl.-1.
Dose dependence of the hydrogen peroxide yield in solutions of different KBr concentration containing about 300 i x M 0 2 is shown in Figure 2. A slight non- * 172
(20) F . W . C hapm an, Jr., and R . M . S herw ood , A nal. Chem., 29,172 (1957).
Volume 71. Number S February 1967

600 Farhataziz
Figure 2. H 20 2 form ation b y “ C o y irradiation o foxygenated ([O 2]o = 237 to 297 ixM; see T a b le I ) potassium brom ide solutions in 0.8 N H 2S 0 4 w ith follow ing initial concentrations o f b rom ide: □ , 3.23 X 10 -3 M ;A , 1.13 X 10“ 3 M ; O, 3.29 X 10~4 M ; C, 0.99 X 1 0 - 4 M ; O, 3.08 X 1 0 "6 M ; • , 1.30 X 1 0 "6 M .
linearity is observed. Formation of H20 2 in 3.39 X 10~4 M KBr solutions was found to increase slightly with increase in 0» concentration. The yield of H20 2 decreases with increase in KBr concentration of solutions containing 0 2 ~ 300 ¡ x M ■ The results are summarized in Table I.
The hydrogen yield is linear with dose absorbed for
T ab le I : In itia l Y ields fo r D ifferent In itial C oncentrations o f B rom ide and 0 2
[KBr],M
[O.],t iM G(mOi) (?(&,)<*
3 .2 3 X 1 0 " 3 284 0 .9 6 51 .1 3 X 1 0 “ 3 278 1 .0 73 .3 9 X lO “ 4 5 4 .9 1 .1 0 0 .3 83 .3 9 X 1 0 “ 4 295 1 .11 0 .3 73 .3 9 X 10~4 781 1 .1 3 0 .3 60 .9 9 X lO “ 4 276 1 .1 83 .0 8 X lO " 6 237 1 .2 21 .3 0 X l O '5 297 1 .2 3
° These values are fo r 3.3 X 10~4 M K B r solution containing 0 2 = 55, 260, and 750 yM , respectively . <y(H2) for zero 0 2 con centration is taken as 0.38.
[K B r]1/ 3, GxAf]1/ ’ .
F igure 3. In itial (j (H 20 2) as a fun ction o f cu be ro o t o f potassium brom ide con centration : O, present w ork, [O2]o = 237-297 yM (see T a b le I ) ; A , B u rton and K u rien ,11 aerated ;□ , Sw orski,6 aerated; • , ----------- , present w ork, aerated.
all solutions containing KBr from 1 X 10~5 to 3 X 10~3 M and 0 2 from 50 ¡ x M to saturation. Some results for solutions containing about 300 ¡ x M 0 2 are shown in Figure 1. (j(H2) increases slightly with decrease in0 2 concentration. For 3.3 X 10⁻⁴ M KBr solutions, G(H2) is 0.36, 0.37, and 0.38 for 0 2 concentrations of 750, 260, and 55 ¡ x M , respectively. (The value for 55 \ x M O 2 concentration is the initial yield.) The (?(H2) for zero 0 2 concentration is taken to be 0.38.
A e r a t e d S o l u t i o n s . The yield of hydrogen peroxide in aerated solutions (~250 ¡ x M 0 2) is slightly nonlinear with dose absorbed. The initial Cr(H202) is lower by a few per cent than in solutions to which pure 0 2 was added to give a concentration of about 300 \ x M , as shown in Figure 3. The aerated solutions contained about 12 n M C02. For ~3.2 X 10“4 M KBr solutions, the initial Cr(H20 2) was suppressed from 1.06 to 0.92 when the C02 concentration was increased to ~200 \ x M in aerated solutions.
DiscussionRafi and Sutton15 have shown that the classical mech
anism for ardiolysis of bromide solutions is inadequate in aerated solutions. Their conclusion that Br2_ plays an important role has been supported by recent pulse radiolysis studies.16 •17 A similar conclusion is necessary to explain the results in deaerated solutions. In such solutions, the (?(02) = 0.008, independent of dose and KBr concentration, must be attributable to a spur reaction. Hart21 has shown that a small (?(02) in the Fe2+-Cu2+ system results from H02 production in spurs by the reaction OH + H20 2 -* H 02 + H20. Considering the magnitude of values, G ( 0 2) = 0.008 measured in deaerated KBr system is in fairly good agreement with the value of 0.016 measured by Hart.
(21) E. J. H art, Radiation Res., 2, 33 (1955).
The Journal of Physical Chemistry

60Co 7 R adiolysis op Solutions of Potassium Bromide 601
Because Br2 is assumed to be produced (corresponding to measured Br~ loss) in radiolysis of the deaerated solutions, there are two possible reactions for 0 2 formation from H 02.
Br2 T H 02 ■ ^ Br2— -f- H -*“ -f- 0 2 (1)
and
H 02 -f- H02 — ^ H20 2 -f- 0 2 (2)
Sutton, e t a l . , 11 give h ~ 1 - 2 X 101 ilf-1 sec-1 while fc2 is 2.2 X 10⁶ M _1 sec-1.22’23 Consequently, reaction 1 must be responsible for 0 2 formation. This model of 0 2 formation requires that H 02 not be an intermediate in the reaction scheme. A new reaction scheme is suggested for deaerated solutions in 0.8 N H2S04 that includes reaction 1 and the followingreactions
H20 — ^ H, OH, H*, H A , H 02 (3)
OH + Br- —■> Br + OH~ (4)
Br + Br- ^ Br2- (5)
Br2- + Br2_ —> Br3~ + Br- (6)
Br3~ ^ Br2 + Br~ (7)
Br + Br — > Br2 (8)
H + Br2 — > H+ + Br- + Br (9)
H + H A — > OH + HO (10)
Reactions 4 and 9 can be written alternatively as17
Br-(aq) + H+(aq) ^ (Br“—-H+)(aq))
(Br-— H+)(aq) + OH — *- Br + H20) ^
H + Br2 — > H+ + Br2- (9a)
From the above reaction scheme, the following relations can be derived, where (7(Br2) includes Br2 and Br3-
2G(Br2) = G (-B r-) =M H O » ] _ 1
tf(OH) - <;(H02) + ------- (A)MO 1XI2U2 J .fc9[Br2]
G ( 0 2) = <KH02) (B)
6 ( H A ) + C ( B r 2) =
g ( H A ) - V*b(H) - g ( OH)] - y 2gr(H02) (C)
(7(H) = fir(H) = G (H A) + (7(Br2) + 2(7(02) (D)
Substitution into eq D of the measured values of G(HA) + (7(Br2) and G ( 0 2) gives (7(H) = 0.396,
which is in good agreement with the value of 0.38 measured. Substituting g(OH) = 2.95,22 23 24 25 g ( H ) = 3.65,24 k 10 = 1.7 X 10⁸ M - 1 sec“ 1,26 C (-B r -) = 0.01, and for [H20 2]/[Br2] the value of [(7(H20 2) + (7(Br2) — 1/ i G ( — B y - ) ] / [ 1/ \ G { — Br-)] in eq A, gives h ~ 12 X 1010 M -1 sec-1. Sutton, e t al.,11 give an estimate of k 9 ~ 1010 M -1 sec-1 in 0.1 N acid. However, they claim a fivefold uncertainty in their results. Considering the possibility of a rather large error in the measurement of G ( — Br- ) ~ 0.01, agreement between the two values of k g is satisfactory.
The small positive intercept obtained for hydrogen formation at zero dose in deaerated solutions ( c f . Figure 1) is attributed to the presence of organic impurities which can yield H by H-abstraction reactions. This assumption is confirmed by the results in oxygenated solutions, where H2 formation is linear over the whole dose range. Because H is present as H02 in such solutions, an H-abstrac.tion reaction is not possible. The value of G(H) = 0.38 is in good agreement with the value of 0.384-0.404 given by Hayon12 and 0.38 given by Ferradini and Koulkes-Pujo.13 However, higher values have been reported.8’9 The lower value satisfies the stoichiometric relation between H A and H2 (see eq D ); various studies agree well with (7(H20 2) + (?(Br2) = 0.38.6’13 Because other investigators do not estimate G ( — Br- ), their values for (?(H A) are equivalent to (7(HA) + (7(Br2) as measured in the present study. Thus the lower value cannot be attributed to a failure to determine accurately all oxidizing and reducing species produced.
The mechanism presented differs from the old mechanism in the introduction of Br2- reactions and rejection of reactions such as 11 and 12. The H 02 could conceivably become an intermediate through the following reactions.
Br2- + H A — > H+ + 2Br- + H02 (11)
Br + H A — > H+ + H 02 + Br- (12)
The studies of Rail and Sutton15 and Sutton, e t al.,11 indicate that reaction 11 is too slow to play an important role; however, the results of Cercek, et al.,ie are not in agreement with such a conclusion. If reaction 12 is to make a negligible contribution, it is necessary that fc5f[Br_ ] ^ 10 H [IF A ]. For 3 X 10“6 M
KBr solutions (which is the lowest KBr concentration used for 0 2 measurement) with accumulation of 250
(22) J. H . B axendale, Radiation R es., 17, 312 (1962),(23) G . C zapski and B . H . J. B ielski, J. P h ys . Chem ., 67, 2180 (1963).(24) A . O. A llen , Radiation Res. Suppt., 4 , 54 (1964).
(25) M . S . M a th eson , ib id „ 4 , 1 (1964).
Volume 71, Number 3 February 1967

602 Farhataziz
¡ x M H20 2 and using a value of h i = 5.4 X 109,16-17 a value of h i ^ 7 X 10⁷ M ~ l sec-1 is required. Such a value differs significantly from the value of k u « 2 .5 X 109 M -1 sec-1 for neutral solutions.17 However, the mechanism of reaction 12 in neutral solution may be
H202 H02- + H+
H 02- + Br — > H02 + Br~
which could not occur at an appreciable rate in 0.8 N
H2S04.O x y g e n a t e d S o l u t i o n s . In oxygenated solutions, H
atoms are converted to H 02 by
H + 0 2 — > H02 (13)
The results can be explained in terms of reactions 1-8 and 13. The stoichiometric relations are
<?(H20 2) = 0(H2O2) +V.iKH) - 0(OH)1 + V2fif(H02) (14)
C(H2) = ff(H2)
G(H202) + G(H2) = 2[<7(H202) + <?(H02)] (15)
G(H2) decreases slightly as the concentration of 0 2 is increased. Such an effect would be expected as 0 2 scavenges H in spurs. The decrease in (?(H2) must be accompanied by an equivalent increase in (?(H20 2) as is observed in the results of Table I. The decrease in (?(H20 2) with increased dose is attributable to H20 2 competition for H atoms by reaction 10; h i and h o are2.6 X 1010 and 1.7 X 10⁸ M ~ l sec-1, respectively.25 (t(H20 2) decreases with increasing concentration of KBr and conforms to a cube-root plot6 as shown in Figure 3. Such behavior has been interpreted in terms of scavenging by Br- of OH in spurs.6-26 The initial (?(H20 2) for [Br- ] = 0 and ~300 ¡ i M 0 2 is 1.28 ( c f . Figure 3), which becomes 1.27 when corrected for H scavenging in spurs by 0 2 (see Table I). Substituting <7(H20 2) = 1.27, ¡7(H02) = 0.008 and <?(H*) = 0.38 in eq 15 gives <7(H20 2) = 0.82, which is in good agreement with the value of 0.80 given by Allen.24 However, using gr(H) = 3.65,24 gr(OH) = 2.95,24 </(H02) = 0.008 in eq 14 and C give &r(H20 2) = 0.916
and 0.734, respectively. This apparent discrepancy can be understood by addition of eq 14 and C, which gives 2<7(H20 2) as the sum of measured peroxide yields in oxygenated and deaerated solutions. The ^(H20 2) so calculated is 0.825 which is in excellent agreement with the value of 0.82 calculated from eq 15. It would seem, therefore, that [g(H) — ^(OH)] must be 0.89 in the case of Br- radiolysis, rather than 0.70 as calculated from gr(H) = 3.65 and y(OH) = 2.95. Whether such a difference can be attributed to a change in either or both g ( H ) and ¡7(014) is not clear.
E f f e c t o f C O i o n f /20 2 Y i e l d s i n A e r a t e d S o l u t i o n s .
The aerated solutions have ~-250 p .M 0 2. G'(H20 2) in aerated solutions of KBr is consistently lower by a few per cent than in oxygenated solutions containing 0 2 ~ 300 n M ( c f . Figure 3.) The results shown in Figure 3 are in good agreement with those of Sworski6 but not those of Burton and Kurien,11 which may be an effect of different impurity levels in the water used.
<7(H20 2) was suppressed from 1.06 to 0.92 in aerated solutions of -~3.2 X 10⁻⁴ M KBr by the addition of -~200 y . M C02. Such a result strongly suggests that the lower G(H20 2) in aerated, as compared to oxygenated, solutions is attributable to the presence of ~12 n M C02. Although the effect has not been thoroughly investigated, the following reactions present a plausible interpretation.
C02 T Br2— — >• C02— -f- Br2
C02 + H 02 — >- C02- + H+ + 0 2
C02- + H+ — ► COOH
The radical COOH may dimerize to (COOH)2 or react with H20 2.27
COOH + H20 2 — ^ C02 + H20 + OH
A c k n o w l e d g m e n t s . The author is grateful to Dr.E. J. Hart for a critical discussion of the results. It is a pleasure to acknowledge the encouragement received from Dr. R. R, Hentz.
(26) T . R ig g , D iscussions Faraday Soc., 12, 119 (1952).(27) E . J. H art, J. K . T hom as, and S. G ord on , R adiation Res. S uppl., 4 , 74 (1964).
The Journal of Physical Chemistry
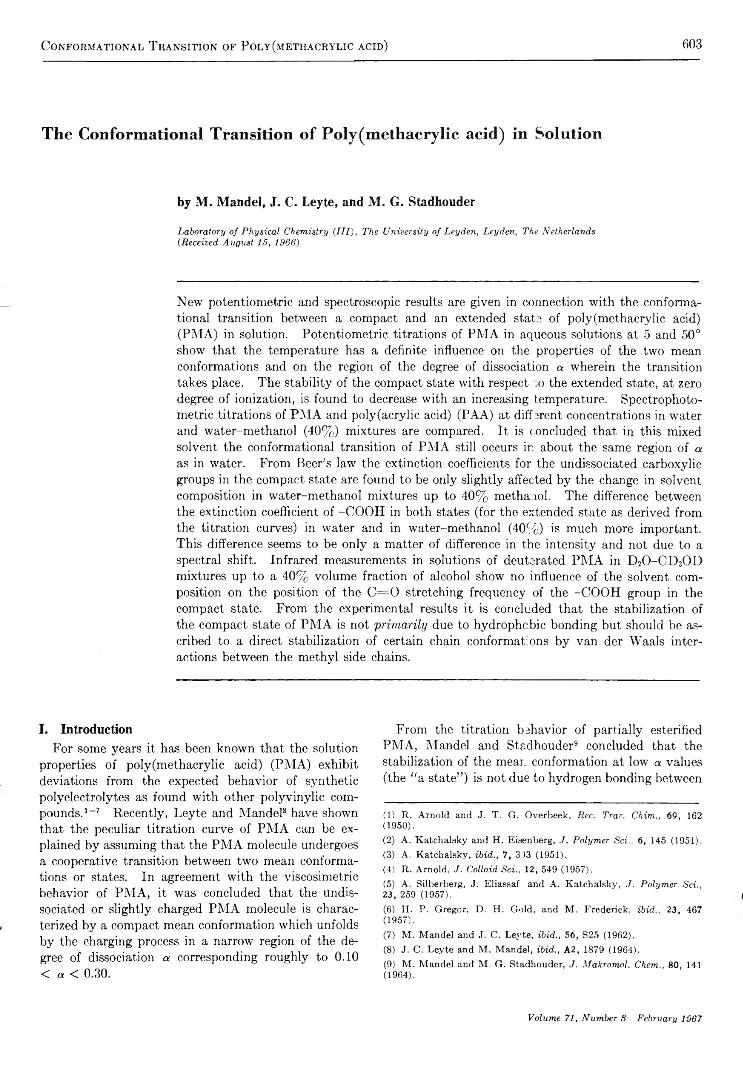
Conformational T ransition of Poly(methacrylic acid) 603
The Conformational Transition of Poly (methacrylie acid) in Solution
by M . Mandel, J. C. Leyte, and M . G. Stadhouder
Laboratory o f P h ysica l Chem istry { I I I ) , The U niversity o f L eyden , L eyden, The N etherlands {R eceived A u gu st 15, 1966 )
New potentiometric and spectroscopic results are given in connection with the conformational transition between a compact and an extended state of poly(methacrylic acid) (PMA) in solution. Potentiometric titrations of PMA in aqueous solutions at 5 and 50° show that the temperature has a definite influence on the properties of the two mean conformations and on the region of the degree of dissociation a wherein the transition takes place. The stability of the compact state with respect ~ o the extended state, at zero degree of ionization, is found to decrease with an increasing temperature. Spectrophoto- metric titrations of PMA and poly(acrylic acid) (PAA) at diff erent concentrations in water and water-methanol (40%) mixtures are compared. It is concluded that in this mixed solvent the conformational transition of PMA still occurs in about the same region of a
as in water. From Beer’s law the extinction coefficients for the undissociated carboxylic groups in the compact state are found to be only slightly affected by the change in solvent composition in water-methanol mixtures up to 40% methanol. The difference between the extinction coefficient of -COOH in both states (for the extended state as derived from the titration curves) in water and in water-methanol (40%) is much more important. This difference seems to be only a matter of difference in the intensity and not due to a spectral shift. Infrared measurements in solutions of deuterated PMA in D20-C D 30D mixtures up to a 40% volume fraction of alcohol show no influence of the solvent composition on the position of the C = 0 stretching frequency of the -COOH group in the compact state. From the experimental results it is concluded that the stabilization of the compact state of PMA is not 'p r i m a r i l y due to hydrophcbic bonding but should be ascribed to a direct stabilization of certain chain conformations by van der Waals interactions between the methyl side chains.
I. Introduction From the titration behavior of partially esterified PMA, Mandel and Stadhouder9 concluded that the stabilization of the mean conformation at low a values (the “a state”) is not due to hydrogen bonding between 1 2 3 4 5 6 7 8 9
For some years it has been known that the solution properties of poly(methacrylic acid) (PMA) exhibit deviations from the expected behavior of synthetic polyelectrolytes as found with other polyvinylic compounds.1-7 Recently, Leyte and Mandel8 have shown that the peculiar titration curve of PMA can be explained by assuming that the PMA molecule undergoes a cooperative transition between two mean conformations or states. In agreement with the viscosimetric behavior of PMA, it was concluded that the undissociated or slightly charged PMA molecule is characterized by a compact mean conformation which unfolds by the charging process in a narrow region of the degree of dissociation a corresponding roughly to 0.10
(1) R . A rn o ld and J. T . G . O verbeek , R ec. Trav. Chim ., 69, 162 (1950).(2 ) A . K a tch a lsk y and H . E isenberg , J . P olym er S ei., 6 , 145 (1951).(3 ) A . K a tch a lsk y , ib id ., 7 , 3 )3 (1951).(4) R . A rn old , J . Colloid S ei., 12, 549 (1957).(5) A . S ilberberg, J. E liassaf and A . K a tch a lsk y , J . P olym er Sei., 23, 259 (1957).(6) H . P . G regor, D . H . G o ld , and M . F rederick , ibid., 23 , 467 (1957).(7 ) M . M an d el and J. C . L e3Tte, ib id ., 56, S25 (1962).(8 ) J . C . L e y te and M . M an d el, ib id ., A 2 , 1879 (1964).(9) M . M an d el and M . G . S tadhouder, J . M akrom ol. Chem ., 80, 141 (1964).< a < 0.30.
Volume 71, Number 8 February 1967

604 M. Mandel, J. C. Leyte, and M. G. Stadhouder
the carboxylic groups and should be ascribed to van der Waals interactions between the methyl side groups. They also found that the transition only depends on the m e a n c h a r g e d e n s i t y along the chain, as for different degrees of esterification the same transition curve was obtained as a function of the fraction of ionized groups with respect to the total number of monomers.
At the 1965 IUPAC Symposium of Macromolecular Chemistry in Prague, the compact a state of PMA was simultaneously discussed in two papers which both concluded that the uncharged molecules in water are essentially stabilized by h y d r o p h o b i c i n t e r a c t i o n s in analogy with some theories about the structure of globular proteins. Liquori and co-workers10 showed that many properties of PMA in aqueous solutions are explainable in terms of the already proposed conformational transition between two different states. They concluded that the compact a state could be stabilized by hydrophobic interactions without obtaining any contradictions with the discussed properties. Anufrieva and co-workers11 gave more direct evidence for this kind of stabilization. They studied the influence of different alcohols on some properties of aqueous PMA solutions, especially the binding of fluorescent dyes by this polyelectrolyte. This binding was shown to decrease with an increasing volume fraction of the alcohol and to disappear above about 40%. Starting from the assumption that only the compact state binds the dyes, these authors reached the conclusion that alcohol tends to destroy the normal compact state. They showed this to be in agreement with viscosimetric data and to advocate hydrophobic binding as the stabilizing factor for the low-pH mean conformation.
In both papers the experimental evidence for the hydrophobic bonding as defined by Kauzmann12 and Scheraga and co-workers13’14 for globular proteins was either qualitative or indirect. As PMA, a very simple synthetic polyelectrolyte, may serve as a model for the understanding of the behavior of more complicated macromolecules, it seemed worthwhile to gather more experimental information about its conformational transition.
Some new potentiometric and spectroscopic (ultraviolet and infrared) results are presented here which do not seem to indicate that hydrophobic interactions are the important factor for the stabilization of the compact state of PMA.
II. Experimental Section
A . M a t e r i a l s . Conventional poly(methacrylic acid) was obtained by the method described previously.8 The fraction used in this work was characterized by
its molecular weight, M v = 185,000, determined according to Arnold and Overbeek.1
Poly(acrylic acid) was prepared by polymerization of acrylic acid in water in the presence of H20 2.15 16 The fraction used here had a molecular weight, M v =136,000, determined according to Newman, e t a l .u Aqueous solutions were prepared with conductance water obtained from a mixed-bed exchange column mostly by dilution of a more concentrated stock solution which was stored frozen in a polyethylene flask. The concentration of the polyelectrolyte solutions was determined by potentiometric titration.
NaOH (0.1 M ) was obtained by dilution from a Merck’s Titrisol ampulla; methanol p.a. (Analar, BDH) was used without further purification; D20 of 99.8% purity was obtained from the Dutch Reactor Center, RCN, Petten; CD3OD was of commercial origin (Merck); and deuterated PMA was obtained by repeatedly dissolving PMA in D20 and evaporating under reduced pressure.
B . P o t e n t i o m e t r i c T i t r a t i o n s . They were performed with a Radiometer automatic titration apparatus (TTT1, in conjunction with a SBR2 titrigraph and a SBU1 syringe buret) in a thermostated titration vessel under nitrogen atmosphere. Radiometer glass (G202C) and calomel (K4312) electrodes were used. All titrations were performed with 0.1 M NaOH.
C . S p e c t r o s c o p i c M e a s u r e m e n t s . Ultraviolet spectra were determined with a Zeiss nonrecording single-beam PMQ II. Ordinary cells of 1- or 0.5-cm optical path length, with Suprasil windows and a Teflon stopper, were used in testing Beer’s law. Spectrophotometric titrations were performed in a specially designed titration cell (Suprasil windows) of variable path length (0.2-0.4 cm) to which NaOH could be added, under vigorous agitation, by a microburet (agitation was stopped during the measurement of the absorbance). Compensation was obtained by a variable path length reference cell, also with Suprasil windows. The operations were carried out under a nitrogen atmosphere. All of the cells were thermostated at 20°.
Infrared spectra were recorded with a Unicam re-
(10) A . M . L iquori, G . B arone, V . C rescenzi, F . Q u adrifog lio , and V . V itagliano, IU P A C Sym posium o f M a crom olecu la r C hem istry , Prague, 1965, P reprin t, p 588.(11) E . V . A nu frieva, T . M . B irshtein , T . N . N ekrasova , O. B . P titsyn , and T . V . Sheveleva, ref 10, P reprin t, p 468.(12) W . K auzm ann, Advan. P rotein Chem., 14, 1 (1959).(13) G . N ém eth y and H . A . Scheraga, J. P h ys . Chem., 66 , 1773 (1962).
(14) H . A . Scheraga, A n n . N . Y . A cad. Sci., 125, 253 (1965).(15) P . Selier, Thesis, Leiden, 1965.(16) S. N ew m an, W . R . K rigbau m , C . L augier, and P . J. F lo ry , J . P olym er Sci., 14, 451 (1954).
The Journal of Physical Chemistry
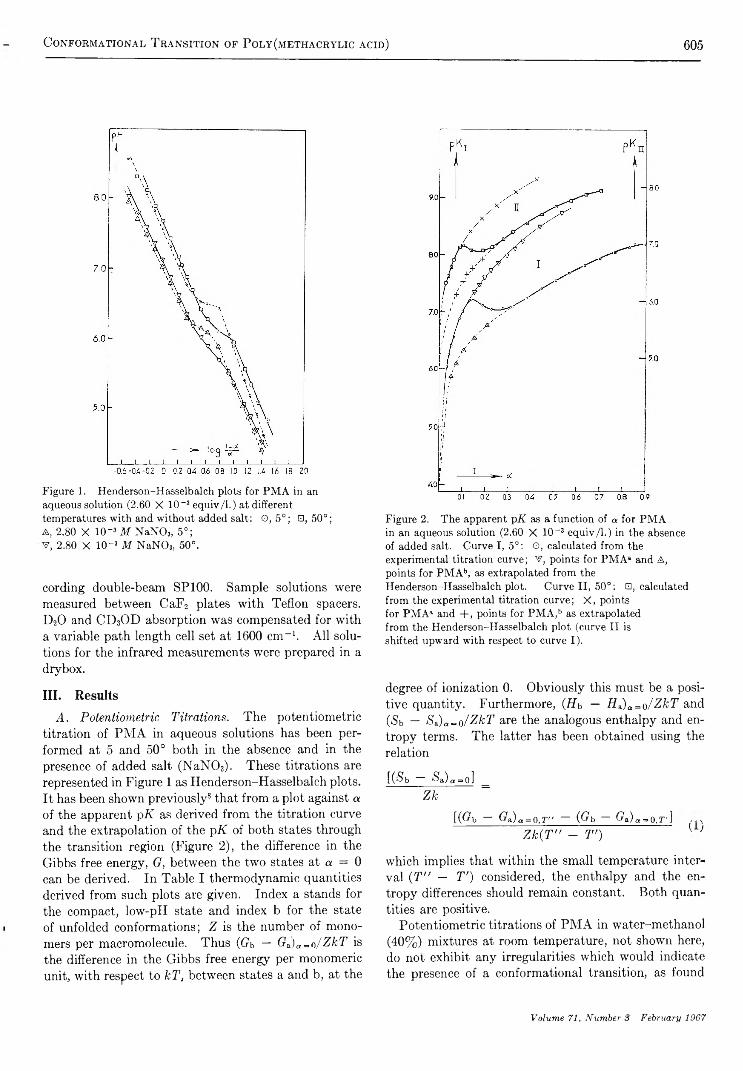
Conformational T ransition of Poly(methacrylic acid) 605
Figure 1. H end erson -H asselba lch p lots fo r P M A in an aqueous solution (2.60 X 10 ~3 eq u iv /1 .) at different tem peratures w ith and w ith ou t added salt: 0 , 5 ° ; 0 , 5 0 ° ;A, 2.80 X 10 ~3 M N a N 0 3, 5 ° ;V , 2.80 X 10 ~3 M N aN O s, 50°.
cording double-beam SP100. Sample solutions were measured between CaF2 plates with Teflon spacers. D20 and CD3OD absorption was compensated for with a variable path length cell set at 1600 cm-1. All solutions for the infrared measurements were prepared in a drybox.
III. Results
A . P o t e n t i o m e t r i c T i t r a t i o n s . The potentiometric titration of PMA in aqueous solutions has been performed at 5 and 50° both in the absence and in the presence of added salt (NaN03). These titrations are represented in Figure 1 as Henderson-Hasselbalch plots. It has been shown previously8 that from a plot against a
of the apparent pK as derived from the titration curve and the extrapolation of the pK of both states through the transition region (Figure 2), the difference in the Gibbs free energy, G , between the two states at a = 0 can be derived. In Table I thermodynamic quantities derived from such plots are given. Index a stands for the compact, low-pH state and index b for the state of unfolded conformations; Z is the number of monomers per macromolecule. Thus (Gb — G ii) a = <-I/ Z k T is the difference in the Gibbs free energy per monomeric unit, with respect to k T , between states a and b, at the
Figure 2. T h e apparent p X as a fu n ction o f a fo r P M A in an aqueous solution (2.60 X 1 0 ~3 eq u iv /1 .) in th e absence o f added salt. C u rve I, 5 ° : ©, calcu lated from the experim ental titration cu rve; V , points fo r P M A a and A , points for P M A b, as extrapolated from the H enderson -H asselba lch p lot. C u rve I I , 5 0 ° : □ , calculated from the experim ental titration cu rve; X , points for P M A a and + , poin ts fo r P M A ,b as extrapolated from th e H enderson -H asselba lch p lo t (curve I I is shifted upw ard w ith respect to curve I ) .
degree of ionization 0. Obviously this must be a positive quantity. Furthermore, ( H b — Ha)a=o/ZfcT and (»S'b — $ z ) a = n/ Z k T are the analogous enthalpy and entropy terms. The latter has been obtained using the relation
[QSb - &)„.(,] =Z lc
[ ( G b — G a ) a = 0 , r " — ( G b — f f a ) q „ 0 , r ] . . .
Z k { T " - T ' ) { ‘
which implies that within the small temperature interval (T " — T ’ ) considered, the enthalpy and the entropy differences should remain constant. Both quantities are positive.
Potentiometric titrations of PMA in water-methanol (40%) mixtures at room temperature, not shown here, do not exhibit any irregularities which would indicate the presence of a conformational transition, as found
Volume 71, Number 3 February 1967
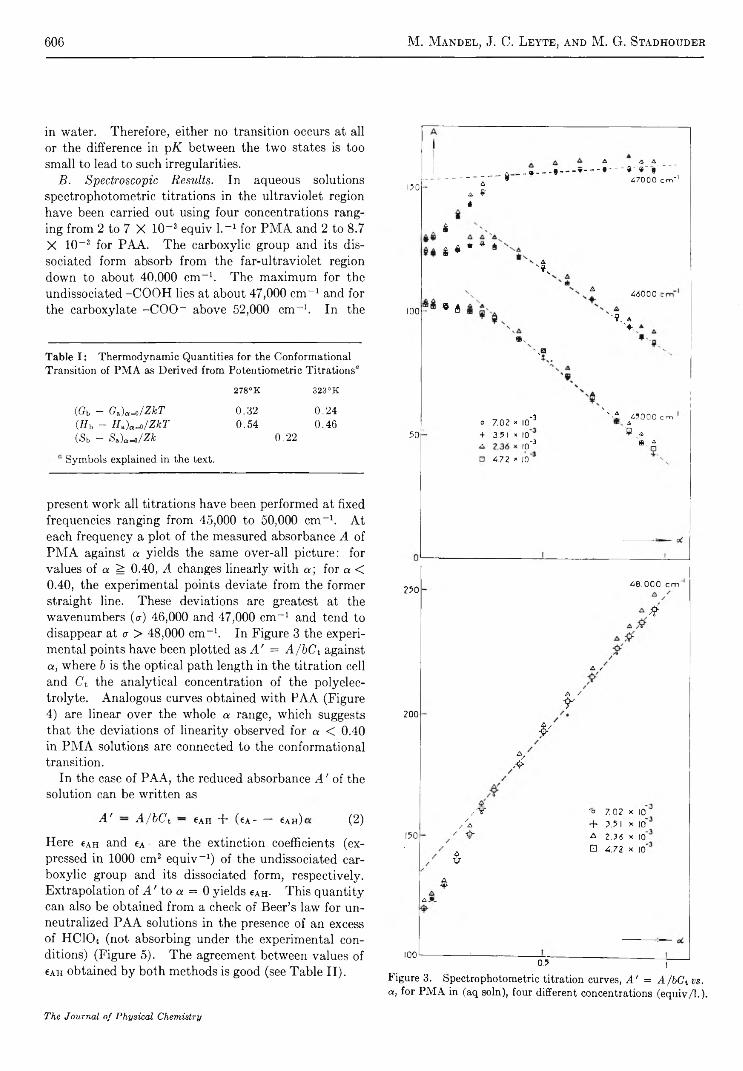
606 M. Mandel, J. C. Leyte, and M. G. Stadhouder
in water. Therefore, either no transition occurs at all or the difference in pK between the two states is too small to lead to such irregularities.
B . S p e c t r o s c o p i c R e s u l t s . In aqueous solutions spectrophotometric titrations in the ultraviolet region have been carried out using four concentrations ranging from 2 to 7 X 10⁻³ equiv l.-1 for PMA and 2 to 8.7 X 10⁻³ for PAA. The carboxylic group and its dissociated form absorb from the far-ultraviolet region down to about 40,000 cm-1. The maximum for the undissociated -COOH lies at about 47,000 cm-1 and for the carboxylate -COO- above 62,000 cm-1. In the
T a b le I : T h erm odyn am ic Q uantities for the C on form ation a l T ransition o f P M A as D erived from P otentiom etrie T itra tion s“
---------------------i1 5 0 ■
6 a V *
A A A _______» -----* -■ » "» '
4 7 0 0 0 c m - '
100 -
«
£ *
* A
* * ÉA
X
A4 6 0 0 0 I
' S . A >
«V•sn
278°K 323°K
{Ob — GAa-o/ZkT 0 .3 2 0 .2 4 N'■± 45000 cm
(f fb - H t )a^/ZkT 0 .5 4 0 .4 6 O 7.02 x I0*3 AsnOSb - Ss.)a-o/Zk 0 .2 2 50 + 3.51 x 10. -3
T .A a a
1 Sym bols explained in the text.
present work all titrations have been performed at fixed frequencies ranging from 45,000 to 50,000 cm-1. At each frequency a plot of the measured absorbance A of PMA against a yields the same over-all picture: for values of a ^ 0.40, A changes linearly with a ; for a < 0.40, the experimental points deviate from the former straight line. These deviations are greatest at the wavenumbers (<r) 46,000 and 47,000 cm-1 and tend to disappear at <r > 48,000 cm-1. In Figure 3 the experimental points have been plotted as A ' = A / b C t against a , where b is the optical path length in the titration cell and C t the analytical concentration of the polyelectrolyte. Analogous curves obtained with PAA (Figure 4) are linear over the whole a range, which suggests that the deviations of linearity observed for a < 0.40 in PMA solutions are connected to the conformational transition.
In the case of PAA, the reduced absorbance A ' of the solution can be written as
10 ' 4 . 7 2 * I 0 ’ :
250
200
A ' — A / b C t — 6a H + ( « A - — 6 a h ) c (2 )
Here 6ah and 6a- are the extinction coefficients (expressed in 1000 cm2 equiv-1) of the undissociated carboxylic group and its dissociated form, respectively. Extrapolation of A ' to a = 0 yields 6ah- This quantity can also be obtained from a check of Beer’s law for unneutralized PAA solutions in the presence of an excess of HC104 (not absorbing under the experimental conditions) (Figure 5). The agreement between values of 6a h obtained by both methods is good (see Table II).
150
100
4 8 . 0 0 0 c m ”
*
A /•
A /r
*
*
/ V "o 7 . 0 2 x 10'/
/ A + 5.5 1 x |0’/ iV A 2 .3 6 X io“'
0 □ 4 .7 2 x 10*V
*Ajf.
0.5 ,
Figure 3. Spectrop hotom etric titration curves, A ' = A/bCt vs. a, fo r P M A in (aq soin ), four different concentrations (e q u iv /L )-
The Journal of Physical Chemistry
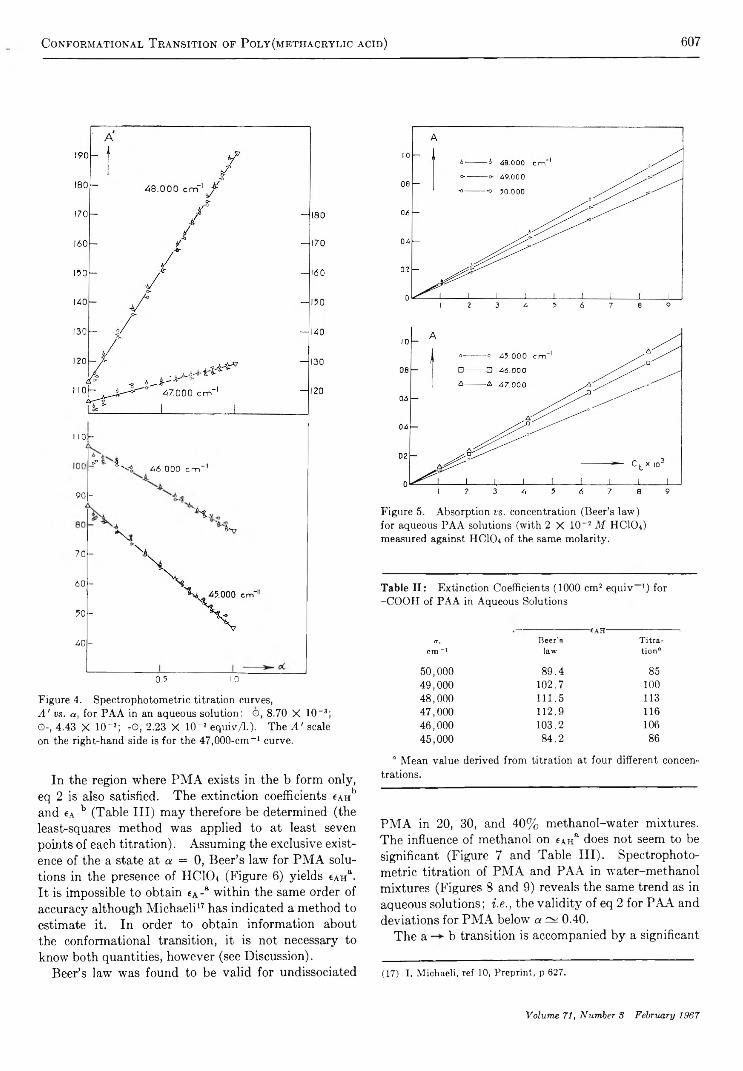
Conformational T ransition of Poly(methacrylic acid) 607
I I Oh
, A” «• i ''• t ¿6 .0 0 0 c m "
H .-,
^ 4«■-v
9 0 -
7 0 -
6 0 -
5 0 -
¿ 0 -
0 5 1.0
Figure 4. Sp ectrop h otom etric titration curves,A ' vs. a , fo r P A A in an aqueous solu tion : O, 8 .70 X 1 0 ~3; ©-, 4.43 X 10~ 3; -O , 2.23 X 1 0 “ 3 eq u iv A -)- T h e A ' scale on the right>hand side is fo r the 4 7 ,00 0 -cm -1 curve.
In the region where PMA exists in the b form only, eq 2 is also satisfied. The extinction coefficients 6AHb and «a -b (Table III) may therefore be determined (the least-squares method was applied to at least seven points of each titration). Assuming the exclusive existence of the a state at a. = 0, Beer’s law for PMA solutions in the presence of IIClOi (Figure 6) yields eAHa- It is impossible to obtain eA-a within the same order of accuracy although Michaeli17 has indicated a method to estimate it. In order to obtain information about the conformational transition, it is not necessary to know both quantities, however (see Discussion).
Beer’s law was found to be valid for undissociated
I 2 3 4 5 6 7 8 9
Figure 5. A bsorption vs. concentration (B eer’s law ) fo r aqueous P A A solutions (w ith 2 X 10 ~2 M H C IO 4) m easured against H C IO 4 o f the sam e m olarity.
T ab le I I : E xtin ction Coefficients (1000 cm 2 equ iv *) for -C O O H of P A A in A queous Solutions
■CAH-Vf Beer’s Titra
cm -1 law tion®
5 0 ,00 0 8 9 .4 8549,000 102 .7 1004 8 ,00 0 111 .5 1134 7 ,00 0 112 .9 1164 6 ,00 0 103 .2 1064 5 ,00 0 8 4 .2 86
“ M ean value derived from titration at fou r different concen trations.
PMA in 20, 30, and 40% methanol-water mixtures. The influence of methanol on eAHa does not seem to be significant (Figure 7 and Table III). Spectrophotometric titration of PMA and PAA in water-methanol mixtures (Figures 8 and 9) reveals the same trend as in aqueous solutions; i . e . , the validity of eq 2 for PAA and deviations for PMA below a ~ 0.40.
The a b transition is accompanied by a significant
(17) I . M ich aeli, ref 10, P reprin t, p 627.
Volume 71, Number S February 1967

608 M. Mandel, J. C. Leyte, and M. G. Stadhotjder
Figure 6. B eer ’ s law for aqueous P M A solutions (w ith 2 X 1 0 -2 M H C IO 4).
F igure 8. S p ectropho to m etric titration curves for solutions o f P M A in 4 0 % m ethanol.
I\
A ______. _______ A ___ 4 7 0 0 0 cm "1A j % _________r?-----------v — — '7— 4 6 0 0 0 c m 1
12 0 r— ^ ___________ + _______ ).---------------------- 4 8 0 0 0 c m " 1
_ v _______ x - --------- * 4 5 0 0 0 c m " 'x------------- £.■ 0° cF"-----------------------------------------0 - ----------n r - - 4 9 0 0 0 c m '1
o 5 0 0 0 0 c m '1
10 2 0 3 0 4 0 % m e t h a n o l
F igure 7. Values o f «ah 3, o f P M A for different volu m e fractions o f m ethanol.
T ab le I I I : E xtin ction Coefficients (1000 cm 2 e q u iv - 1 ) for -C O O H o f P M A
60% HaO +<7, r-------- H2O- —- 40% c:H3O B — , CHaOH
cm-1 «AH® 6AHb “ CAHa eAHb b «AH®
5 0 ,0 0 0 7 7 .6 82 7 7 . 1 784 9 ,0 0 0 9 8 .1 107 9 8 .3 101 8 7 .54 8 ,0 0 0 116 .3 135 1 1 7 .6 129 108 .34 7 ,0 0 0 1 2 6 .4 152 129 .3 148 1 2 2 .74 6 ,00 0 1 2 3 .0 150 127 .2 148 1 2 5 .34 5 ,00 0 103 .6 125 1 0 8 .9 126 112 .9
“ M ean va lu e determ ined from titrations at four different concentrations. b M ean value determ ined from titrations at three different concentrations.
change in the extinction coefficients (Table III) both in H20 and the H20-C H 30H mixture; no corresponding frequency shift is observed (Figure 10). (In pure methanol the -COOH absorption curve is slightly shifted to lower frequencies in agreement with current theories about medium effects).10 18 The values of eAH for PAA and PMA are nearly four times as large as the extinction coefficients for acetic acid (as derived from
Beer’s law in excess HCIO4)19 and butyric acid.20 These results suggest that the absorption of the -COOH group is strongly influenced by the accumulation of such
(18) H. H. Jaffé and M. Orchin, “Theory and Applications of U.V. Spectroscopy,” John Wiley and Sons, Inc., New York, N. Y„ 1962.(19) Unpublished results of this laboratory.(20) H. Ley and B. Arends, Z . P hysik . Chem. (Leipzig), B17, 177 (1932).
The Journal of Physical Chemistry

Conformational T ransition of Poly(methacrylic acid) 609
Figure 9. S p ectrop hotom etric titration curves fo r solutions of P A A in 4 0 % m ethanol at three different concentrations.
F igure 10. A bsorption spectra fo r the carboxylic acid group of P M A : O, cab“ in aqueous solutions;0 , fAHb in aqueous solutions; A , «ah4 in 10 0 % m ethanol solutions (<r, 103 c m -1 ).
groups on a polymeric chain and the conformation of this chain.
Finally, infrared measurements have been performed on unneutralized deuterated PMA in D2O-CH3OD
Figure 11. In frared spectra o f P M A in D 2O -C D 3O D m ixtures: I, P M A in D 20 ; I I , P M A in 3 0 % C D 8O D (curve I shifted 2 0 % dow nw ard on the transm ission sca le .)
mixtures with CH3OD volume fractions of 10, 20, 30, and 40%. Spectra have been recorded in the region where D20 transmits for the path lengths used, v i z . ,
between 1300 and 2150 cm-1. For all the solutions examined the spectra were identical and no shift was observed with increasing CH3OD concentration (up to 40%) for the position of the C = 0 stretching frequency at 1700 cm-1. As an example, the spectra obtained for 0 and 30% methanol are shown in Figure 11.
IV. Discussion
The validity of Beer’s law for undissociated PMA shows that no concentration-dependent interactions between carboxylic groups exist in the explored concentration range.
The spectrophotometric titration of aqueous PMA reveals the conformational transition as reported already by Michaeli17 and Barone, e t a l .n From the results presented here it is seen that this transition may also be observed by the spectrophotometric titration of PMA in water-methanol (40%) mixtures.
The spectrophotometric results may be analyzed in 21
(21) G . B arone, V . C rescenzi, and F . Q u adrifog lio , R ie. Sci., 8 , 393 (1965).
Volume 71, Number 8 February 1967

610 M. Mandel, J. C. Leyte, and M. G. Stadhouder
the following way (which differs from the approach usedby Michaeli17). Starting from the assumption that in the a region below 0.40, four different species can absorb the ultraviolet energy, the total absorbance in this re
]
c°/ct\
O Z 0 2 x lb"v 472 x 10" □ 3.51 * 10*
gion will be given by N\ a ? 36 x Id'
A = 6[eAHaC*AHa + eAHbCAHb + 0.?- | \6 A -aC A - a + 6A-bCA-b] (3)
where C -, stands for the concentration (in equiv l.“ 1) of the group j in the state i. Now using the obvious relations
CTh8 + CAHb — (1 — a)Ct (4 )
(5 )C A - a + C A - b = aC t
expression 3 can be transformed into
A = 6[(eAHa — eAHb)C,AHa +(eA-a - eA-b)C a -a + iAHb(l - a)Ct + iA-baCt] (6)
Using as a further assumption that for a g: 0.40, Ca = UAHa + La-8, = C'ah3 = C a - * = 0, v i z . , that the molecule is completely in the b state, only the two last terms of the right-hand side of eq 6 exist in that a. region. The difference between the extrapolation of the straight part of the curve, v iz . , Aex = 6[«AHb(l — C t)C t
+ tA-h^Ct], down to values below a = 0.40 and the measured values of A is given by
AA = Aex — A = 6[(iAHb fAHt )C a
(«AHb — fAH* — eA"b + ( A - a) C A-a] (7)
or
Figure 12. P lots o f O /C t vs. a, derived from the spectroph otom etric titration of aqueous P M A : bottom , 4.72 X 1 0 " 3 N P M A at four frequencies; top , values derived at 46,000 c m -1 for four concentrations o f P M A .
state a has disappeared at about a = 0.17. These curves visualize the conformational transition as derived from the spectroscopic data. Values of Ca/Ct obtained for PMA in aqueous solutions and the water- methanol mixture (40%) are compared in Table IV.
A A = b ( e \ Hb — eAHa)C 'a
(8 )
where Ae = eAHb — «ah3 — eA-b + «A-a. Now for a
< 0.40, Ca-8, < C,a. It can be expected that in the frequency range between 45,000 and 48,000 cm-1, «ah8, — eAHb is of the same order of magnitude as ca-8, — eA-b, as it was found that eAHb and 6A-b do not differ considerably. Assuming therefore that Ae/eAHb — «ah8< 1, we have i n a f i r s t a p p r o x i m a t i o n
AA' = AA / b C t z * (eAHb - eAHa)(Ca/C t) (9)
Thus from AA' and cAHb — eAHa the value of C ^ / C t can be deduced at any degree of dissociation between a = 0 and a = 0.40. In Figure 12, calculated values of Ca/ C t
for aqueous PMA are represented at constant concentration and four frequencies and at constant frequency and four concentrations. It may be seen that in each case the calculated points confine reasonably well to a common curve characterized by the fact that 50% of
1 -A« C A-
(iA H 8, — «AHb) G a T a b le I V : O /C t D eterm ined from Sp ectrop h otom etric T itrations at 46,000 c m -1 and D ifferen t C oncentrations o f P M A (m eq u iv /1 .)
a 2 .3 6— mo—
4 . 7 2 7 .0 2/•—6 0 % H 2O + 4 0 % m eth an ol-
2 .4 6 5 .2 0 7 .4 8
0 .0 5 0 .8 6 0 .8 6 0 .8 4 0 .9 8 0 .8 5 0 .9 10 .1 0 0 .7 1 0 .7 4 0 .7 3 0 .7 7 0 .6 4 0 .6 80 .1 5 0 .5 5 0 .5 9 0 .5 5 0 .5 0 0 .4 6 0 .5 00 .2 0 0 .3 1 0 .3 7 0 .3 8 0 .3 8 0 .3 3 0 .3 60 .2 5 0 .2 0 0 .2 3 0 .2 4 0 .2 7 0 .2 50 .3 0 0 .0 8 0 .1 8 0 .1 5 0 .1 6 0 .1 7 0 .1 8
The transition curve can also be calculated from po- tentiometric results.8 Values of C a/ C t derived from potentiometric titrations carried out on two aqueous PMA solutions used in the spectroscopic measurements are plotted in Figure 13. Here again 50% of state a has disappeared at about a = 0.17. The difference in the shape between this curve and those of Figure 12 is
The Journal of Physical Chemistry

Conformational Transition of Poly(methacrylic acid) 611
F ig u re 13. C a/ C t vs. a , d e r iv e d fr o m th e p o te n t io m e tr ic t itra t io n a t tw o co n ce n tra t io n s o f a q u eou s P M A .
caused by the unequal sensitivity of the two methods in differentiating between the a and b forms of PMA. The potentiometric behavior of the a form of PMA is markedly different from that of the b form of PMA (Figure 1). As apparently «a - — «a h is nearly equal for the two mean conformations, it is not even possible to observe at what degree of ionization the a — b transition starts. Furthermore, the error in C &/ C t determined spectrophotometrically is large because A A
is small everywhere.From this analysis and the spectrophotometric titra
tion curves themselves, it may be concluded that in the water-methanol mixtures as well as in pure water the transition occurs, and the stability of the a state is not significantly affected by the addition of methanol (up to 40%) (see Table IV). This view is supported by the absence of any change in the infrared spectrum of PMA on the addition of methyl alcohol, in contrast with the behavior of r(C =0) in the transition region for aqueous solutions.22
In water-methanol (40%), the transition has no visible effect on the potentiometric titration curve. It should be pointed out that in water the transition region may be observed because of the magnitude of the difference in the dissociation constants of the carboxylic acid groups of the two forms (0.3 pK unit). Now it is well known that the dissociation constant of a weak acid is very sensitive to solvent effects and that influence of the solvent on the dissociation equilibrium even for ordinary acids is very intricate. Nevertheless, it may be expected from qualitative considerations involving long-range medium effects, as represented by the dielectric constant, that the difference between the pK values of the two states must be smaller in the given
mixed solvent than in water (short-range effects will probably be less important as shown hereafter). This may explain the absence of a visible effect due to the transition on the titration curve of PMA in water- methanol (40%). In the case of aqueous PMA solutions the addition of salt also weakens the effect of the transition on the potentiometric titration curve.8
The observation that the conformational transition occurs in water-methanol (40%) is in contradiction with the results of Anufrieva, e t a l .11 The evidence of these authors was based on the change of the fluorescent properties when methanol was added to aqueous solutions containing PMA and certain dyes. This change occurs in the same region where these authors also observed a decrease in the intrinsic viscosity of PMA solutions on the addition of methyl alcohol. It is not clear why the postulated breakdown of the a form of PMA, known as compact, should result in a d e c r e a s e of the intrinsic viscosity. Neither has it been shown that the change in the fluorescent properties of the dyes in the presence of PMA by the addition of methanol may not be due to other effects instead of a conformational transition, i . e . , to the change of the solvent itself. We suggest that these fluorescence phenomena and the viscosimetric behavior in the mixed water-methanol solvent are too complex to be interpreted simply in terms of the a — b transition of PMA.
From the spectroscopic evidence, it seems that the conformational transition occurs in the 40% methanol- water mixture upon charging the polymer. Furthermore, the methanol in this mixture does not have an observable influence on the stability of the a form. This does not point to hydrophobic bonding as the de- terming factor for this stability.
The difference between the thermodynamic quantities of the a and b states of undissociated PMA (Table I) as derived from the potentiometric measurements shows that the transition to the compact state of PMA is accompanied by a d e c r e a s e in enthalpy and a s o m e w h a t
s m a l le r d e c r e a s e in entropy. This is exactly the opposite of what is to be expected if this transition were determined essentially by hydrophobic bonding.13 The results obtained with partially esterified PMA9 are also inconsistent with hydrophobic bonding as the main stabilizing factor for the a state, as has already been pointed out;23 replacement of -COOH by the more hydrophobic -COOCH3 does not affect the stability of the a state.
This does not mean that hydrophobic interactions
(22) J. C . L eyte , L . H . Zu iderw eg, and H . J. V ledder, to be published.(23) J . C . L eyte , P olym er Letters , 4 , 245 (1966).
Volume 71, Number 3 February 1967
612 Jacques Lemaire
should be totally excluded from the effects that tend to stabilize the low-pH state in PMA. The stability of this compact form seems, however, to be due p r i m a r i l y
to a direct stabilization of certain conformations of the chain by interactions between its nearest neighbors rather than through the intermediary of a change in the structure of the surrounding solvent. This conclusion, of course, does not exclude the possibility of establishing important hydrophobic interactions between different PMA molecules as suggested recently by Eliassaf.24 These should, however, become important at polyelectrolyte concentrations higher than those used in the present investigation.
Finally, it may be pointed out that the spectroscopic results give some additional information about the a state of PMA. In the previous work of this laboratory21 it has been shown that the infrared C = 0 stretching frequency of the -COOH group in PMA shifts gradually w i t h o u t s p l i t t i n g during the conformational
transition in D20. Thus it is not likely that the v ib r a t i o n a l s ta te s of the carboxylic acid group differ in the a and b forms of PMA. As in the latter case solvation of -COOH by water certainly occurs, the same solvation for most of the carboxylic groups in the a state may be expected. The absence of any influence on v ( C = 0 ) on the addition of methanol (up to 40%) shows that there is no infrared evidence for the replacement of water by methanol molecules at least in the first solvation layer of the -COOH group. The small changes observed for eAHa in the ultraviolet region on the addition of methanol may be attributed to long-range effects involving further solvation layers.
A c k n o w l e d g m e n t . The authors wish to thank Miss M. van Reisen for her help with the infrared measurements.
(24) J. E liassaf, P olym er L e t t e r s 3 , 767 (1965).
The Pyridine-Sensitized Isomerization of cis-2-Butene
by Jacques Lemaire1
Departm ent o f C hem istry, U niversity o f Texas, A u stin , T exas ( Received August 19, 1966)
The yields of isomerization of cfs-2-butene sensitized by pyridine have been measured. The yield is higher in the n it* than in the tt -*■ tt* region, but both yields are low. Neither fluorescence nor phosphorescence of pyridine vapor is observed. The possible methods of energy degradation are discussed.
IntroductionThe electronic structure of the pyridine molecule
has been extensively investigated. In the nearultraviolet absorption spectrum of pyridine there occurs an n-7r* transition as well as a 71—71-* transition.2
The most successful treatment of n-7r* transition uses simple molecular orbital theory in the one-electron approximation. The various singlet and triplet levels are predicted in reasonably good agreement with the data.3 Transition energies and intensities of the 71—7 7* bands of pyridine have been calculated.4 5-6
Evans6 observed an S -► T absorption band of pyridine in the presence of high pressures of oxygen. He con-
(1 ) T o w h om all correspon den ce should be addressed at L a b ora to ire de C him ie G enerale, U niversity o f N a n cy , F rance.(2) (a) M . K asha, D iscussions Faraday Soc., 9 , 14 (1 95 0 ); (b ) H . P . Stephenson , J . Chem. P h ys ., 22 , 1077 (1954).(3) L . G ood m a n and R . W . H arrell, ibid., 30 , 1131 (1959).(4 ) R . Pariser and R . G . Parr, ibid., 21, 466, 767 (1953).
(5) G . F avin i, I. V an don i, and M . S im onetta , Theoret. Chim . A cta 3 , 45, 418 (1965).(6 ) D . F . E vans, J. Chem. Soc., 3885 (1957).
The Journal of Physical Chemistry
Pyridine-Sensitized Isomerization of cts-2-Butene 613
eluded that the S —► T transition was 7t- tt* since it showed a very small solvent shift. The enhancement of the S —*■ T transition has been discussed theoretically by several authors.7-10 No fluorescence and no phosphorescence of pyridine has been observed either in the gas phase or in a solid matrix at low temperatures.11’12
The sensitized isomerizations of the 2-butenes have been used to determine singlet-triplet crossover yields for certain molecules.18 The general validity of this method has never been fully proven even when energy relationships seem to be satisfactory. The reported identity of crossover yields in benzene and in pyridine seemed surprising. First results cast doubt on this identity, and after the completion of this work and personal communication of our results to Cundall,14 a reinvestigation by him gave results in agreement with those reported below.
Experimental Section
M a t e r i a l s . Two samples of pyridine were used: Mallinckrodt, analytical grade, and United States Testing Co., spectrophotometric grade.
A very careful search for impurities was made in view of effects reported by Cundall, e t a l .13 Both mass spectrometry and gas chromatography were used and the following impurities were found:
(a) Mallinckrodt pyridine: 0.025% benzene (not detectable by mass spectrometry since less than 0.1% benzene in a mixture of pyridine-benzene could not be determined); 0 .1% H20.
(b) United States Testing Co. pyridine: no benzene; far less than 0.1% of an impurity X, not detectable by mass spectrometry and absent in pyridine Mallinckrodt; 0.001% H20.
Both pyridines were subjected to bulb-to-bulb distillation and different fractions behaved similarly.
The benzene was Matheson Coleman and Bell fluorometric or chromatographic grade. as-2-Butene (Phillips Petroleum Co., research grade) had as its only impurity 0.06% (rans-2-butene.
A conventional high-vacuum, grease-free line was employed.16 All experiments were carried out in a 50-ml T-shaped cell. The cell was encased in an aluminum block which reduced stray light and could be used as a furnace. The light sources were a HanoviaS-100 medium-pressure mercury arc and an Osram HBO 500W super-pressure mercury arc. The grating monochromator (Bausch and Lomb, Model 33-86-45) has 16 A/mm as reciprocal linear dispersion. Since quantum yields were low, relatively large slit widths were used, 10 and 4 mm, respectively, for the entrance slit and 4 mm for the exit slit in most of the experi
ments. Thus the wavelength range under the most favorable conditions exceeded 100 A although most of the intensity was in a 60-A range.
The light transmitted through the cell was measured with an RCA 935 phototube connected to a Keithley micro-microammeter Model 410. The emission intensity was measured by an RCA 1P28 photomultiplier placed opposite the side arm of the cell.
c i s - and foms-2-butene were analyzed on a Wilkens Hy-Fi Aerograph chromatograph, Model 600C, equipped with a 7.6-m dibenzyl ether (20% on firebrick 60-80 mesh) column followed by a 3.05-m silicone gum rubber column acting as a scrubber. At room temperature, the two peaks of c i s - and t r a n s -
2-butene, respectively, were well separated. Reproducibility was improved by heating the sample to about 50° in the injector.
ResultsE m i s s i o n o f P y r i d i n e . Emission by pyridine, either
fluorescence or phosphorescence, in the gas phase could not be observed either by use of the 1P28 tube or by use of an Aminco-Bowman spectrofluorimeter. Attempts to excite emission by wavelengths of 2400-3000 A failed. Experiments with the 1P28 tube equipped either with a Corning filter 754 (no. 9863) or with a filter 053 (no. 7740) were unsuccessful.
P h o t o c h e m i s t r y o f P y r i d i n e . Long irradiation of pure pyridine in the gas phase by either -it- tt* (2480 ± 128 A) or n — rr* excitation (2650 ± 64 A), did not produce gaseous products which could be detected either by the mass spectrograph or by gas chromatography. Long irradiations at 2480 ± 128 A and at 2650 ± 64 A with 6 and 3 X 10¹³ photons absorbed per second gave negative results. For example, pyridine at a pressure of 10 torr was irradiated in a cell 6 cm in length as follows: (a) X = 2480 ± 128 A; 6 X 10¹³ photons sec-1 absorbed in the entire cell of 50-ml volume; time = 4 hr; T = 90°; (b) X = 2650 ± 64 A; 3 X 10¹³ photons sec-1 absorbed in the entire cell of 50-ml volume; time = 23 hr; room temperature.
P y r i d i n e - S e n s i t i z e d I s o m e r i z a t i o n o f c i s - 2 - B u t e n e . 7 8 9 10 11 12 13 14 15
(7) M . T su bom u ra and R . S. M u lliken , J. A m . Chem. Soc., 82, 5966 (1960).(8) G . W . K in g and E . H . P inn in gton , J. M ol. Spectry., 15, 394 (1965).(9) G . J. H oijtin k , M ol. P hys., 3 , 67 (1960).(10) F . A . M atsen , J. P h ys. Chem., 6 8 , 3282 (1964).(11) C . R eid , J. Chem. P h ys ., 18, 1673 (1950).(12) G . J. B realey, ibid., 24, 571 (1956).(13) R . B . C undall, F . J. F letcher, and D . G . M ilne, Trans. Faraday Soc., 60, 1146 (1964).(14) R . B . C undall, p rivate com m unication .(15) Cf. I. U nger, J. P hys. Chem ., 69, 4284 (1965).
Volume 71, Number 3 February 1967
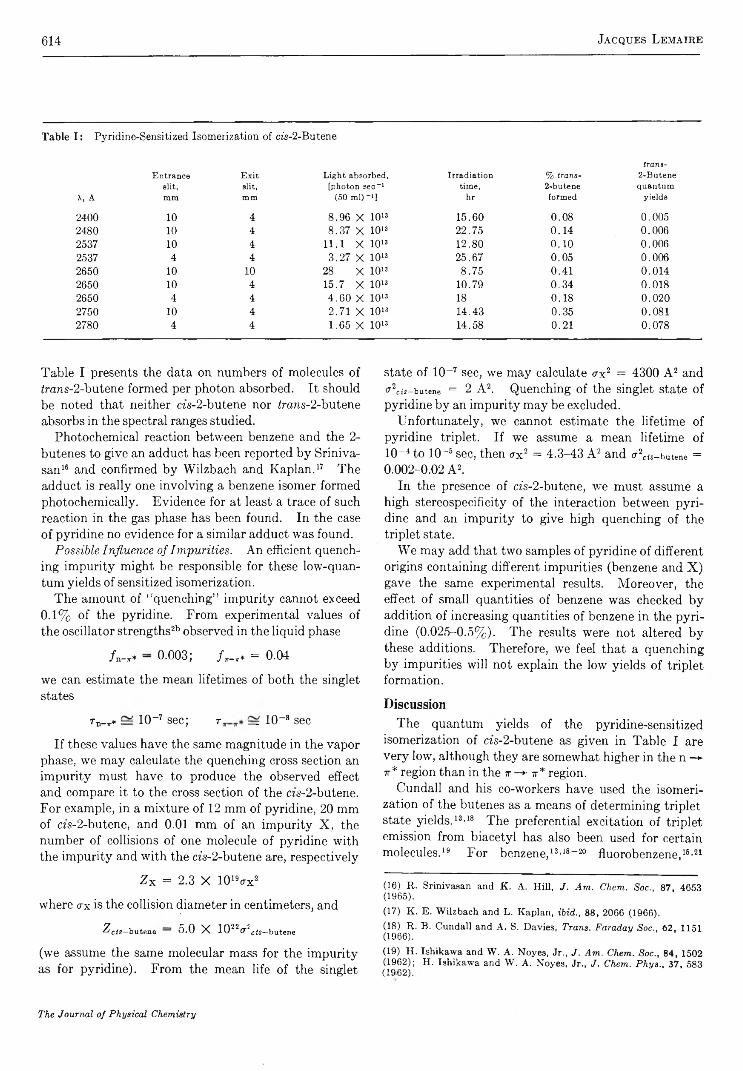
614 Jacques Lemaire
T ab le I : Pyridine-Sensitized Isom erization o f a 's-2 -B utene
t r a n s -
E n tra n c e E x i t L ig h t a b so rb ed , Ir r a d ia t io n % t r a n s - 2 -B u te n e
s lit , s lit , [p h o ton s e c - 1 t im e , 2-b u te n e q u a n tu m
X, A m m m m (50 m l) ->] h r fo rm ed y ie ld s
2400 10 4 8 .9 6 X 10¹³ 1 5 .60 0 .0 8 0 .0 0 52480 10 4 8 .3 7 X 10¹³ 2 2 .75 0 .1 4 0 .0 0 62537 10 4 11 .1 X 1013 12 .80 0 .1 0 0 .0 0 62537 4 4 3 .2 7 X 10¹³ 2 5 .67 0 .0 5 0 .0 0 62650 10 10 28 X 1013 8 .7 5 0 .4 1 0 .0 1 42650 10 4 15 .7 X 1013 10 .79 0 .3 4 0 .0 1 82650 4 4 4 .6 0 X 1013 18 0 .1 8 0 .0 2 02750 10 4 2 .7 1 X 10>3 14 .43 0 .3 5 0 .0 8 12780 4 4 1 .6 5 X 10¹³ 14 .58 0 .2 1 0 .0 7 8
Table I presents the data on numbers of molecules of imns-2-butene formed per photon absorbed. It should be noted that neither m-2-butene nor ¿rons-2-butene absorbs in the spectral ranges studied.
Photochemical reaction between benzene and the 2- butenes to give an adduct has been reported by Sriniva- san16 and confirmed by Wilzbach and Kaplan.17 The adduct is really one involving a benzene isomer formed photochemically. Evidence for at least a trace of such reaction in the gas phase has been found. In the case of pyridine no evidence for a similar adduct was found.
P o s s i b l e I n f l u e n c e o f I m p u r i t i e s . An efficient quenching impurity might be responsible for these low-quantum yields of sensitized isomerization.
The amount of “quenching” impurity cannot exceed 0.1% of the pyridine. From experimental values of the oscillator strengths2b observed in the liquid phase
fn-Tr* — 0.003; / tt- tt* = 0.04
we can estimate the mean lifetimes of both the singlet states
rn_„* ~ 10-7 sec; r = 10-8 sec
If these values have the same magnitude in the vapor phase, we may calculate the quenching cross section an impurity must have to produce the observed effect and compare it to the cross section of the m-2-butene. For example, in a mixture of 12 mm of pyridine, 20 mm of m-2-butene, and 0.01 mm of an impurity X, the number of collisions of one molecule of pyridine with the impurity and with the ds-2-butene are, respectively
Zx = 2.3 X 10¹⁹<rx2
where a x is the collision diameter in centimeters, and
^ cis—butene “ 5.0 X 10²V cis—butene
(we assume the same molecular mass for the impurity as for pyridine). From the mean life of the singlet
state of 10-7 sec, we may calculate <rx2 = 4300 A 2 and G^cis—butene = 2 A2. Quenching of the singlet state of pyridine by an impurity may be excluded.
Unfortunately, we cannot estimate the lifetime of pyridine triplet. If we assume a mean lifetime of 10-4 to 10-5 sec, then <rx2 = 4.3-43 A2 and o-2cis_butene = 0.002-0.02 A2.
In the presence of cfs-2-butene, we must assume a high stereospecificity of the interaction between pyridine and an impurity to give high quenching of the triplet state.
We may add that two samples of pyridine of different origins containing different impurities (benzene and X) gave the same experimental results. Moreover, the effect of small quantities of benzene was checked by addition of increasing quantities of benzene in the pyridine (0.025-0.5%). The results were not altered by these additions. Therefore, we feel that a quenching by impurities will not explain the low yields of triplet formation.
Discussion
The quantum yields of the pyridine-sensitized isomerization of m-2-butene as given in Table I are very low, although they are somewhat higher in the n —► 7r* region than in the tr —*■ tt* region.
Cundall and his co-workers have used the isomerization of the butenes as a means of determining triplet state yields.13’18 The preferential excitation of triplet emission from biacetyl has also been used for certain molecules.19 For benzene,13,18-20 fluorobenzene,16,21
(16) R . Srinivasan and K . A . H ill, J . A m . Chem . Soc., 8 7 , 4653(1965 ) .
(17) K . E . W ilzb ach and L . K ap lan , ibid., 88 , 2066 (1966).(18) R . B . C undall and A . S. D av ies , Trans. F araday Soc., 6 2 , 1151(1966 ) .
(19) H . Ish ikaw a and W . A . N oyes , Jr., J . A m . Chem. Soc., 8 4 , 1502 (1962 ); H . Ish ikaw a and W . A . N oyes , Jr., J . Chem. P h y s ., 3 7 , 583 (1962).
The Journal oj Physical Chemistry

Pyridine-Sensitized Isomerization of cts-2-Butene 615
and perfluorobenzene,22 agreement is good within a rather large experimental error between the two methods.
In the case of pyridine, the biacetyl method gave no positive results and the Cundall method as described above shows very little triplet formation. The question now arises as to whether triplet yields are in fact very small or whether the methods themselves are fallacious.
The triplet-state yields based on the assumptions made by Cundall, e t a l . , are given below. These are obtained by dividing the yields of frans-2-butene by 0.578, the fraction of excited m-2-butene which becomes t r a n s .u
Q u a n t u m Y i e l d o f T r i p l e t - S t a t e F o r m a t i o n : ( 2 4 0 0 -
2 5 8 7 A , 0 . 0 1 0 ± 0 . 0 0 1 ; 2 6 5 0 A , 0 . 0 3 0 ± 0 . 0 0 3 ; a n d
2 7 5 0 - 2 7 8 0 A , 0 . 1 4 ± 0 . 0 1 ) . Quite evidently, the yield is higher in the n —► 7r* than in the ir —► 7r* region. Nevertheless, the yields in both cases are very low and there is no emission. Thus if one accepts these values for the triplet-state yields, either products are formed which have so far escaped detection or there are means of energy degradation which account for nearly all of the energy.
There are reasons based on analogy with related molecules for believing that triplet yields should be small for pyridine. The pyridazine (1,2-diazine) does not phosphoresce, even in hydrogen and rare-gas matrices, at 4.2°K, and the intersystem crossover was shown23’24 to be 103 to 105 slower at low temperatures than in pyrazine or pyrimidine, which strongly phosphoresce.
The survey of the three diazines may allow us to point out that a lack of phosphorescence in azines at low temperatures seems to be more a consequence of an inefficient crossover than a consequence of rapid, radiationless deactivation processes from the lowest triplet state. It seems reasonable to assume that radiationless deactivation from the lowest triplet state has a similar importance for all these mono- and diazines.
Therefore, the lack of phosphorescence of pyridine at low temperatures may reflect the inefficient crossovers our results show.
Nevertheless, the formation of an adduct with benzene under certain experimental conditions raises a reasonable doubt about the universal validity of the isomerization technique for triplet-state measurement.
An excited singlet state of pyridine in the spectral region used could not transfer electronic energy directly to cfs-2-butene (unless spin conservation were violated). Nevertheless, an intermediate complex between excited pyridine and the double bond of an olefin is possible. This complex could dissociate to give two normal molecules.
It is wise not to pursue a discussion of these possibilities further. There may be methods for identifying such complexes.
Isomerization of benzene and of benzene derivatives at wavelengths around 2500 A is firmly established. The possibility of similar isomerizations with pyridine certainly exists, but no evidence for them has been reported. Such isomerizations might provide a pathway for energy degradations since the isomers would be formed endothermically from normal molecules to the extent of 2 or 3 ev. Attempts by others to find pyridine isomers have failed.
A c k n o w l e d g m e n t s . The author is greatly indebted to Professor W. A. Noyes, Jr., for his help and encouragement throughout the course of this work. He also wishes to thank colleagues for many helpful discussions. Financial support from the Robert A. Welch Foundation is also gratefully acknowledged. 20 21 22 23 24
(20) W . A . N oyes, Jr., W . A . M u lac, and D . A . H arter, J. Chem. P h ys ., 4 4 , 2100 (1966).(21) D . P hillips, private com m unica tion .(22) D . Phillips, in press.(23) M . A . E l Sayed , J . Chem. P h ys ., 36 , 573 (1962).(24) M . A . E l Sayed , ibid., 38, 2834 (1963).
Volume 71, Number 8 February 1987
616 D onald G. M iller
Application of Irreversible Thermodynamics to Electrolyte Solutions. II.
Ionic Coefficients for Isothermal Vector Transport Processes in
Ternary Systems12
by Donald G. Miller
Lawrence R adiation L aboratory, U niversity o f C alifornia , Liverm ore, C alifornia (Received A u gu st 22, 1966)
Irreversible thermodynamics is applied to ternary electrolyte solutions undergoing isothermal vector transport processes. Rigorous expressions for the conductance A, Hittorf transference numbers t (, and solvent-fixed thermodynamic diffusion coefficients ( L {j) 0
are derived systematically in terms of the six solvent-fixed ionic Onsager transport coefficients 1{J. Conversely, expressions for the l tj are given in terms of the six experimental quantities A, U, and ( L (j)0. Also given are rigorous expressions for flows J* in terms of these quantities as well as a proof that superposition of electrical and diffusion flow is valid. Values of l tj are calculated for all systems for which sufficient experimental data exist, namely, seven alkali halide mixtures at total concentrations from 0.5 to 3 N . The cross coefficients are from 5 to 30% of main coefficients and thus cannot be neglected. It is found empirically that ternary l i} can be closely approximated using binary l l} data, yielding good estimates of tt , A, and ( L tj)0. These l t j , with thermodynamic derivatives approximated from binary data, yield good estimates of ordinary ternary diffusion coefficients (-Dy)o from binary data alone. Such estimates are compared with experimental values. Explicit limiting expressions for l ^ / N , (L {j)0, and (Dw)0 at infinite dilution are given in terms of limiting ionic conductances. Limiting tracer and intradiffusion are briefly discussed. The friction coefficient formalism is briefly considered and values of ionic R tj are presented.
I. IntroductionIn paper I,8 irreversible thermodynamics was used
to provide a general macroscopic description of isothermal vector transport processes in electrolyte solutions. Binary systems were discussed in detail and equations for the fundamental transport coefficients, l t j , were derived in terms of experimentally measured quantities. Values of solvent-fixed l i} for several chlorides were presented and their concentration dependence discussed.
In this paper we extend the analysis to ternary isothermal systems, in particular to two binary electrolytes with a common ion in a neutral solvent.4’6 The Onsager reciprocal relations (ORR) are assumed throughout. The l i} are calculated from the limited data available for mixed chlorides at 25° and their
behavior is discussed. Empirically it is found that very good estimates of ternary l fJ can be obtained from the l a of appropriate binary systems. If thermodynamic data are available, these estimates lead to good approximations for ternary diffusion coefficients.
Limiting expressions for thermodynamic diffusion coefficients, L {], and ordinary diffusion coefficients, D u , are given for some special cases. 1
(1) T h is w ork was perform ed under the auspices o f th e U . S. A to m ic E n ergy C om m ission .
(2) P ortion s o f th is w ork w ere presented at the 94th A I M E m eetin g in C h icago , 111., F e b 1965, and at the 16th C I T C E m eetin g in B u d a pest, H un gary , S ept 1965.(3) D . G . M iller, J. P h ys . Chem., 70, 2639 (1963).(4) I f there w ere n o com m on ions, the system w ou ld be tern a ry fo r equilibrium processes b u t quaternary for transport processes.6'(5) B . R . Sundheim , J. Chem. P h ys ., 27 , 791 (1957).
The Journal of Physical Chemistry
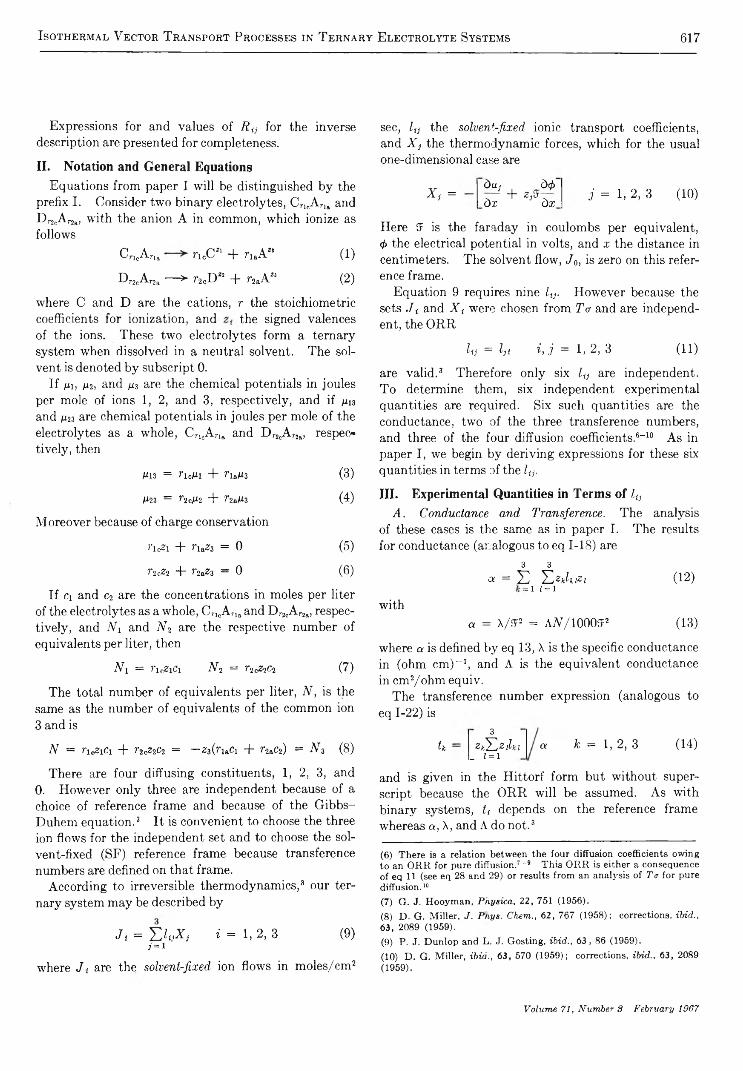
Isothermal Vector T ransport Processes in T ernary Electrolyte Systems 617
Expressions for and values of R (J for the inverse description are presented for completeness.
II. Notation and General EquationsEquations from paper I will be distinguished by the
prefix I. Consider two binary electrolytes, CricAru and Dr2oAr2a, with the anion A in common, which ionize as follows
CncAria rlcCZI + r„A” (1)
Dr2oAr2a — > r2oDZJ + r2aA21 (2)
where C and D are the cations, r the stoichiometric coefficients for ionization, and the signed valences of the ions. These two electrolytes form a ternary system when dissolved in a neutral solvent. The solvent is denoted by subscript 0.
If h i , h i , and h s are the chemical potentials in joules per mole of ions 1, 2, and 3, respectively, and if h u
and h is are chemical potentials in joules per mole of the electrolytes as a whole, CrieAria and D r2oAr2a, respectively, then
M13 = ruHi + fi&H3 (3)M23 = r2cHi + b!aM3 (4)
Moreover because of charge conservation
)’ic2i + r u z 3 = 0 (5)
P2cZ2 + r2azs = 0 (6)
If Ci and c2 are the concentrations in moles per liter of the electrolytes as a whole, CnoAria and Dr2oAr2a, respectively, and N i and N 2 are the respective number of equivalents per liter, then
N i = r lcziC i N 2 = r2cz2c2 (7)
The total number of equivalents per liter, N , is the same as the number of equivalents of the common ion 3 and is
N = r i ^ c i + r2cz2c2 = — z% {ruCi + r2ac2) = N % (8)
There are four diffusing constituents, 1, 2, 3, and 0. However only three are independent because of a choice of reference frame and because of the Gibbs- Duhem equation.3 It is convenient to choose the three ion flows for the independent set and to choose the solvent-fixed (SF) reference frame because transference numbers are defined on that frame.
According to irreversible thermodynamics,3 our ternary system may be described by
J t = Z h j X j i = 1, 2, 3 (9)1=1
where </* are the s o l v e n t - f i x e d ion flows in moles/cm2
sec, l i} the s o l v e n t - f i x e d ionic transport coefficients, and X j the thermodynamic forces, which for the usual one-dimensional case are
Z , =òu j
òr + z ßà<t>òr
j = 1, 2, 3 (10)
Here f? is the faraday in coulombs per equivalent, 4> the electrical potential in volts, and x the distance in centimeters. The solvent flow, J 0, is zero on this reference frame.
Equation 9 requires nine Zy. However because the sets J i and X { were chosen from T o - and are independent, the ORR
U i = h i i , j = 1 ,2 ,3 (11)
are valid.3 Therefore only six l tj are independent. To determine them, six independent experimental quantities are required. Six such quantities are the conductance, two of the three transference numbers, and three of the four diffusion coefficients.6-10 As in paper I, we begin by deriving expressions for these six quantities in terms of the l ( j .
III. Experimental Quantities in Terms of l (jA . C o n d u c t a n c e a n d T r a n s f e r e n c e . The analysis
of these cases is the same as in paper I. The results for conductance (analogous to eq 1-18) are
3 3OL = £ YjZfillZl
= l i = l
witha = x /j2 = AZV/lOOOff2
(1 2 )
(13)
where a is defined by eq 13, X is the specific conductance in (ohm cm)-1, and A is the equivalent conductance in cm6 7 2/ohm equiv.
The transference number expression (analogous to eq 1-22) is
tk
3Z k H z ilk l
_ ¡ = 1a k = 1, 2, 3 (14)
and is given in the Hittorf form but without superscript because the ORR will be assumed. As with binary systems, U depends on the reference frame whereas a , X, and A do not.3
(6 ) T here is a relation betw een the four diffusion coefficients ow ing t o an O R R fo r pure diffusion ." ~9 T h is O R R is either a con sequence o f eq 11 (see eq 28 and 29) or results from an analysis o f Ttr fo r pure d iffu sion .10(7) G . J. H ooym a n , Physica, 22, 751 (1956).(8) D . G . M iller, J. Pays. Chem., 62, 767 (1 95 8 ); corrections, ibid,., 63 , 2089 (1959).(9) P . J. D u n lop and L . J. G ostin g , ibid., 6 3 , 86 (1959).(10) D . G . M iller, ibid., 63, 570 (1 95 9 ); corrections, ibid., 63, 2089 (1959).
Volume 71, Number 3 February 1967

618 D onald G. M iller
B . D i f f u s i o n . The analysis of pure diffusion in ternary systems is more complex than in binaries. The expression of Fick’s law in terms of s o l v e n t - f i x e d
flows and s o l v e n t - f i x e d diffusion coefficients, ( D tJ)0,
• /« =y - i à x
i = 1, 2
where the flows «/i3 of electrolyte as a whole are
J\ _ Jirio r2c
J 13
(15)
(16)
For consistent units 0 i j )0 is in l./cm sec and is related to SF (Dw)o in the usual units (cm2/sec) by
(fl«)o = (D«)o/1000.027 (17)
The irreversible thermodynamic description in terms of these SF flows is11,12
• /« = - ¿ ( T « ) « ^ 3 ¿ = 1 , 2 (1 8 )y = i £>a;
where (7/y)0 denotes SF thermodynamic diffusion coefficients in mole2/joule cm sec.
The (7)w)o can be related to the ( L tj)0 and conversely by the equations7'9-11
l.Dtj) o / 1 (7v;,)oM*j ¿, J 1 , 24 = 1
(19)
and
(T n )o =ß2i(D ll)o — ß2l(D n)o
( ¿ 12)0 —
(¿2 1 ) 0 —
(¿22)0 —
M ll(D l2)o — M l2(D ll)o
1122(7)21)0 — 1121(7)22)0
Mil (-^22)0 ~ 1112(7)21)0
where
M — M11M22 — M12M21
The quantity for our systems is10
£>Mi3 i . J " D c 5 y , V i aMy — — Tit I---------- :0 Cj L D naci + r2ac2
(2 0 )
(2 1 )
. ö In y i+ ------OC7 _
», j = 1, 2 (22)
where B is the gas constant in joules/mole deg, T the absolute temperature in °K, Sw the Kronecker delta, y { the moles per liter activity coefficient, and r t = r ia + V
The expressions for ( L tj)0 in terms of ionic l tj are obtained below in a manner analogous to the binary case.
Although there are gradients of mo the current density, 7, is zero; i . e .
3 3 3
7 = E 2*3)7, = f f E E ^ uX , = 0 (23)4 = 1 4 = 1 z = i
Substituting eq 10 in eq 23 and solving for S b b / b x yields
(24)b<j>
^ b x =
3 3E '^L ^trlklibu 1/ b x )
4=1Z = 13 3
E Y j z A izi4 = 1 ï = 1
Upon substituting eq 24 into eq 9 and appropriately manipulating the sums, we obtain
J i = -
3 3 3E E EiiA^D^diq/öa;) - ¿¿(djiiî/dx)]
y=i 4 = 1 1 = 13 3
E E 2j/ u2î4=1Z=1
i = 1, 2, 3 (25)
Although the term in square brackets involves unmeasurable individual ion chemical potentials, fortunately all the indicated combinations reduce to the measurable ones, e .g .
b ß 1- 2 l-
b x b x(26)
Zz b y . 13 ?’i 0 da;
Evaluation of all such terms and division of the J , expression by rlc gives the result for pure diffusion
2- E
;' = iE E (lijlk l — l i i k j )
-k = 1 1 = 1 ^ j C _
b ß ß
b x3 3
2Dk = l 1 = 1
i = 1, 2
j - l l - <1 a — —Do
However (27) has precisely the same form as (18). Thus identification of terms yields the desired expression for pure diffusion (L tj) 0 in terms of ionic l i}
(L ij)o —E E Q n h i ~ U ih i )
k= 1 l = 1 ¥ ic^ jc 3 3
E E 2*/*^;4 = 1 Z = 1
i , j = 1,2
(28)
(11) J. G . K irk w ood , R . L . B aldw in , P . J. D u n lop . L . J. G ostin g , and G . K egeles, J . Chem. P h ys., 33, 1505 (1960).(12) L . A . W o o lf, D . G . M ille r , and L , J. G ostin g ; J . A m . Chem . Soc., 84 , 317 (1962).
The Journal of Physical Chemistry

Isothermal Vector T ransport Processes in T ernary Electrolyte Systems 619
The expressions for ( D tj)0 in terms of l i} are fairly complex and are omitted.
So far, the ORR’s have not been used in this section. From eq 28 we see that the ORR’s for the ionic l i} (e9 11) imply the ORR
A M i 2 , UT .
l o w + r i ° ( 11)0(36)
A i W
i o w 2 + 2c ( 22)0(37)
(L in )o — (¿21)0 (29)
for pure diffusion, which can be derived independently for any ternary diffusion system, ionic or otherwise.7,9'12 Equation 29, however, does not imply eq 11. A relation between the four (Dw)0 is obtained7 when eq 29 is introduced into eq 20, thus proving that only three are independent.
Equations 12, 14, and 28 are also valid for a system of n — 1 cations and a common anion if the k and Z run from 1 to n and i and j run from 1 to m — 1. The case of a common cation is clearly described by the same equations after proper relettering.
C . T h e S i x E x p e r i m e n t a l Q u a n t i t i e s . The equations for the six independent experimental quantities in terms of the la are now written out using eq 12,13, 14, and 28
a ~ , n n n » ) — + zJ-12 + Z3Zl3) +lUUOff222(2lll2 + 22/22 + 23/23) +
23(2l/l3 + 22Z23 d - 23 / 33) ( 3 0 )
ati = 2 1 (21/11 + Z2Z12 + Z3Z13) ( 3 1 )
ah — 2 2 (21/12 + 22/22 + 23Z23) ( 3 2 )
222(/llZ22 — Z122) +
2 2 22 3 (Z11/23 — l-I2Z13) + Z32(ZiiZ33 — Z132) ( 3 3 )
— aric)'2c(Ai2)o = Z \ Z t(ln h ï — Z122) +Z iZ iilu h z — Z12Z13) -p z223(Zi3Z22 — Z12Z23) -p
z ^ i f u l n — Z12Z33) (34)
a r ^ { L n ) o — Zi2(ln lìì — lu 2) +
22123 (Z13Z22 — Z12/23) *P 2Î3 (Z22Z33 — Z232) (35)
IV. The l {j in Terms of Measured QuantitiesA . E x p r e s s i o n s f o r th e l t j . The six equations 30-35
can be solved for the six coefficients ln , Z22, Z33, In, Z13, and Z2s. By analogy to the solution for the binary case, it is expected that a H d i / z ^ j and one or more (Ly)0 should be involved. Using this combination for i = 1, j = 1, and eq 3.3, one obtains an expression for Zn and similarly for In and Z22. Then Z13 and Z23 are obtained by substituting the previous results into eq 31 and 32, respectively. Finally Z33 comes from eq 30 or from the expression for a h analogous to eq 31 or 32.
The results are as shown in eq 36-41
Z33 —A N h 2
1 0 3f f V+ r n 2(L iì)a +
2 r iar 2 a(Li2)o + r 2a2 ( L 2 2 )o (38)
(39 )A N t i U
Z12 — " + T\cr2c\Ln)o1 0 3E5r22i22
Z13 = „ P ?Tc?Ta(Ull)o + I'lc?'2a (A l2)o (40)
¿23 —
1 0 3f f22i23
A N h h
1035 2Z2Z3"P T2c?Ta( L l 2)o + I,2cT2a (L 22)o (41)
with the units mole2/joule cm sec. They are valid for strong or weak electrolytes.
These equations are clearly generalizations of the binary case3 and reduce to that case if one of the electrolytes is at vanishing concentration. Thus if Dr2c- Ar2a is missing, then c2 = 0. By eq 22, u n = — °° and hence (Li2)0 and (L22)0 are 0 from eq 20. Moreover if c2 = 0, then there is no ion DZ! to carry any current, whence Z2 = 0. Consequently Zj2 = In — Z23 = 0, and everything has reduced to the binary case. Finally ( L n )o = 0 and (L12)0 = 0 imply (D2i)0 = 0 by eq 19, which can be proved independently by an analysis of eq 15.
It can be shown that N is factorable from the (Lw)0, leaving terms which are relatively concentration independent. Consequently all the Zw go to zero at infinite dilution. It is therefore plausible to tabulate U j / N , which remain finite at all concentrations.
By analogy to the binary systems, it is expected that l n / N , I n /N , and Z23/ N will be zero at infinite dilution. Moreover at finite concentrations l u / N and Z23/V should be positive because of coulombic attraction. However l n / N should (a) be negative because of coulombic repulsion and (b) be smaller because there are fewer encounters between ions 1 and 2 compared to 1 and 3 or 2 and 3 (since the concentration of 3 is greater than 1 or 2).
B . J i i n T e r m s o f O r d i n a r y T r a n s p o r t Q u a n t i t i e s .
Useful and rigorous expressions for SF J t in terms of the usual transport quantities U , A, and (Ly)0 or ( D , j ) o are obtained by substituting eq 36M1 into eq 9. After some algebra and recalling that the right-hand sides of eq 15 and 18 are the same for given i , we obtain the forms
Volume 71, Number 3 February 1967

620 D onald G. M iller
, AJVix— Ji = 7 r r z r " [ ] + /*!«
- J 2 =
i m wA N t i
1 0 *32zi
A N k
[ ] + n .
(T \ ^ 13 I (T \ ^ 23l-onjo .. T ( M 2 J 0 .. o x o x _
0 n ) o ~ + ( D n ) o ~OX o x .
(42)
ÎO3 ^ A N U
- J z =
1 0 3f f2Z2
A N k
[ ] + f 2
[ ] + >2c
l O ^ Z s[ ] + fia
f2a
ri \ ^ L 3 4 . r t {J-'njO “T VJLj220 ^o x O x _
(D2O0V + (Â 2)ovo x o x .
(T 'I ^L3 4- (T 1 — Wlljo T* WI2J0 >.O X O X _
(T \ à m i rr 1 ^ -3(¿>12,) 0 “T V- 2270 ^o x Ox .
(43)
+
A N U 1 0 3ff2z 31 i
ô c i[ ] + fla| ( D x i ) o ~ ^ + (D12)
ÔC2 ’
1 à x .
ôc2'
+
f2aF (D21) + 0 2 z ) o ^ (44)
where [] is defined as
t ] = -1 ^ + -2 + -8 ^-3 + ^ (45)Zl o x z2 o x z3 o x o x
Substitution of eq 42-44 into the expression for 7 in eq 23 yields the relation
[ ] = -i m i
N A(46)
V. Calculated Values of l tj for Seven SystemsData necessary for determining 1 {j, namely, f,, U ,
A , and (7/W)0, are exceedingly scarce. The ( L tJ)o can be obtained from n v and ( D y)0 using eq 20. The ( h y ) o in turn are obtained from partial molal volumes, V a , and the volume-fixed (VF) diffusion coefficients (Dy)v.9’n'12 Ternary systems for which (Dw)v and other data exist are seven strong electrolyte mixtures, namely, five compositions of H20-NaCl-KCl13 at 25° (systems IA-IE) and one composition each of H20-LiCl-KCl14 and H20-LiCl-NaCl14 at 25° (systems II and III, respectively). Values of ( L {j) 0 have been calculated for systems I using experimental yuy16 and for systems II and III using estimated yuw based on experimental ternary data at higher concentrations.16
There are some conductance data at 25° for NaCl- KC1 mixtures from 0.1 to 4 m17-20 and for LiCl-KCl mixtures from 0.001 to 0.2 N .21-23 These data can be predicted at low concentrations by the mixture rule
A = x iA is ’ + x 2A 23‘ (5 0 )
where Ai3’ is the conductance of the binary electrolyte at the same total equivalent concentration, N , of the mixture and where the “equivalent fractions” x t are given by
= N t N x + N z
i = 1, 2, 3
x s = Xx + x 2 = 1
(51)
Consequently we obtain the further useful results
j t x lJ 1 = - - — fi<
Z1
J z =
J 2 =
h I
z3 SF
£2 7 z 2 iF
fi.
f2,
(D x x )o — + 0 X 0 ~ o x o x .
, - s öci , - . ÔC2" ( D 2O 0T b 0 2 i )o T ^
o x o x
( 0 i i ) o y + 0 n ) ^O X o x .
?2a ( Â i ) o ^ + ( D 22) o“ o x o x
(47)
(48)
(49)
with similar equations when the square brackets containing D tj terms are replaced by the corresponding square brackets containing L tj terms.
Equations 47—49 represent a superposition of ion transport by current flow and diffusion flow. Consequently the analysis leading to them is a rigorous proof from irreversible thermodynamic principles that superposition of flows is valid in a ternary system, and obviously in an n-component system as well by an analogous argument.
Van Rysselberghe and Nutting24 derived a formula which represents conductance data as well as or better than eq 50 for all salt mixtures for which it could be tested24'25 and was within 0.1 conductance unit for NaCl-KCl mixtures18 to 4 N (it was less satisfactory for HC1-NaCl mixtures26). This formula is
(13) H. Fujita and L. J. Gosting, J . P hys. Chem ., 64, 1256 (1960).(14) P. J. Dunlop, ib id ., 68 , 3062 (1964).(15) D . G . Miller, ib id ., 69, 3374 (1965).(16) D . G. Miller, Lawrence Radiation Laboratory, U CRL-12462, M arch 1965.(17) A. E. Stearn, J. A m . Chem. Soc., 44, 670 (1922).(18) C. E. R uby and J. Kawai, ib id ., 48, 1119 (1926).(19) D. A . M aclnnes, I. A. Cowperthwaite, and T . Shedlovsky, ibid., 51, 2671 (1929).(20) R . W . Bremner, T . G. Thom pson, and C. L. Utterback, ibid., 61, 1219 (1939).(21) H. Egner, M edd. Vetenskapsakad. N obelinst., 6 , N o. 5, 1 (1923).(22) K . A . Krieger and M . Kilpatrick, J . A m . Chem. S oc., 59, 1878 (1937); corrections, 61, 3601 (1939).(23) G. Kell and A . R . Gordon, ib id ., 81, 3207 (1959).(24) P. Van Rysselberghe and L. Nutting, ib id ., 56, 1435 (1934).(25) N. C. C. L i and H . Fang, J . Chinese Chem. S oc., 6, 32 (1938).
The Journal of Physical Chemistry
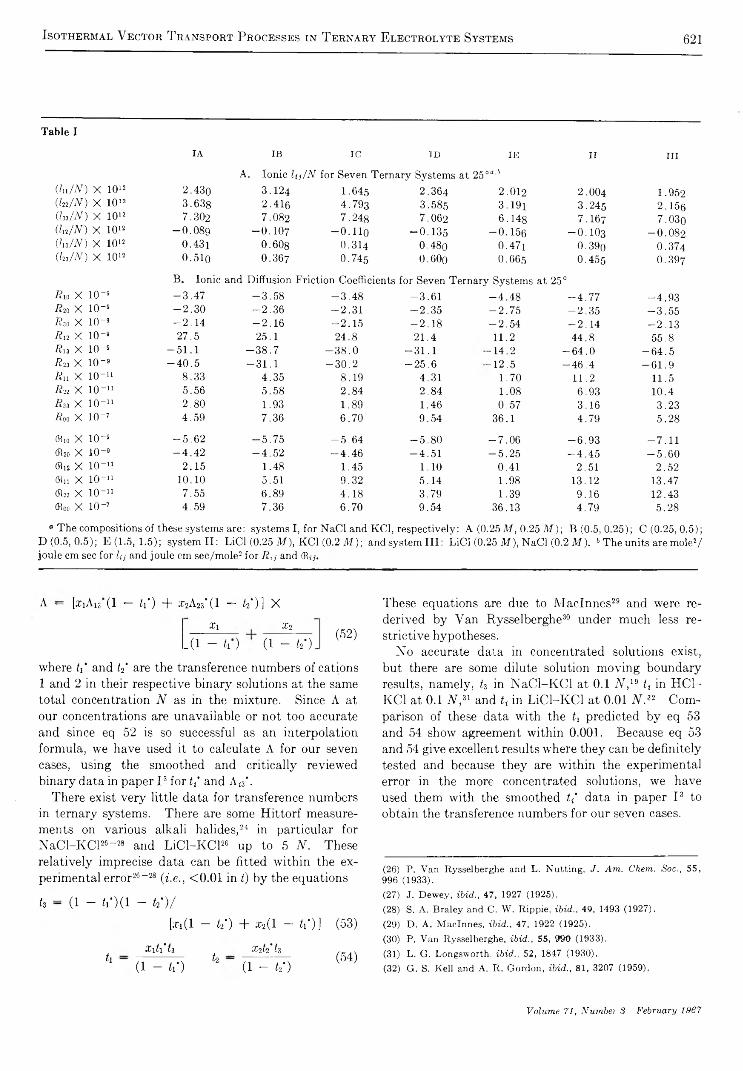
Isothermal Vector T ransport Processes in T ernary Electrolyte Systems 621
T a b le I
IA IB IC ID IE II IIIA . Ion ic kj/N for Seven T ern ary System s at 25 oa,’>
(lu/N) X 1012 2 .4 3 0 3 .1 2 4 1 .6 45 2 .3 6 4 2.012 2 .0 0 4 1 .9 52(V A T ) X 1012 3 .6 3 8 2 .4 1 6 4 .7 9 3 3 .5 8 5 3 .1 9 1 3 .2 4 5 2 .1 5 6( W A ) X 1012 7 .3 0 2 7 .0 8 2 7 .2 4 8 7 .0 6 2 6 .1 4 8 7 .1 6 7 7 .0 3 0Qn/N) X 1012 - 0.089 - 0.107 — 0 . I l o - 0 . 1 3 5 - 0 . 1 5 6 - O .I O 3 - 0.082(hi/N) X 1012 0 .4 31 0.608 0 .3 1 4 0 .4 8 o 0 .4 7 i 0 .3 9 0 0 .3 7 4( W A ) X 1012 0 .5 1 0 0 .3 6 7 0 .7 4 5 0 .6 0 o O.665 0 .4 5 5 0 .3 9 7
B . Ion ic and D iffusion F riction C oefficients for Seven T ernary System s at, 25°Aio X 10 “ 9 - 3 . 4 7 - 3 . 5 8 - 3 . 4 8 - 3 . 6 1 - 4 . 4 8 - 4 . 7 7 - 4 . 9 3A 20 X IO" 9 - 2 . 3 0 - 2 . 3 6 - 2 . 3 1 - 2 . 3 5 - 2 . 7 5 - 2 . 3 5 - 3 . 5 5Rso X IO -9 - 2 . 1 4 - 2 . 1 6 - 2 . 1 5 - 2 . 1 8 - 2 . 5 4 - 2 . 1 4 - 2 . 1 3Rio X IO" 9 2 7 .5 2 5 .1 2 4 .8 2 1 .4 11.2 4 4 .8 5 5 .8Rn X IO “ 9 - 5 1 . 1 - 3 8 . 7 - 3 8 . 0 - 3 1 . 1 - 1 4 . 2 - 6 4 . 0 - 6 4 . 5Ru X IO " 9 - 4 0 . 5 - 3 1 . 1 - 3 0 . 2 - 2 5 . 6 - 1 2 .5 - 4 6 . 4 - 6 1 . 9A n X IO “ 11 8 .3 3 4 .3 5 8 .1 9 4 .3 1 1 .7 0 11.2 1 1 .5R-a X IO - 11 5 .5 6 5 .5 8 2 .8 4 2 .8 4 1 .0 8 6 .9 3 1 0 .4Ä33 X IO “ 1» 2 .8 0 1 .9 3 1 .8 9 1 .4 6 0 .5 7 3 .1 6 3 .2 3A»» X IO “ 7 4 .5 9 7 .3 6 6 .7 0 9 .5 4 3 6 .1 4 .7 9 5 .2 8
(Rio X IO - 9 - 5 . 6 2 - 5 . 7 5 - 5 . 6 4 - 5 . 8 0 - 7 . 0 6 - 6 . 9 3 - 7 . 1 1(R20 X 10-« - 4 . 4 2 - 4 . 5 2 - 4 . 4 6 - 4 . 5 1 - 5 . 2 5 - 4 . 4 5 - 5 . 6 0(Rio X IO ” 11 2 .1 5 1 .4 8 1 .4 5 1.10 0 .4 1 2 .5 1 2 .5 2(Ru X IO “ 11 10.10 5 .5 1 9 .3 2 5 .1 4 1 .9 8 1 3 .12 1 3 .47ÔÎ22 X IO “ 11 7 .5 5 6 .8 9 4 .1 8 3 .7 9 1 .3 9 9 .1 6 1 2 .4 3(Rod X IO “ 7 4 .5 9 7 .3 6 6 .7 0 9 .5 4 3 6 .1 3 4 .7 9 5 .2 8
° T h e com positions o f these system s are: system s I, for N a C l and KC1, respectively : A (0.25 M , 0.25 M ) ; B (0 .5 ,0 .2 5 ) ; 0 (0 .2 5 ,0 .5 ) ; D (0.5, 0 .5 ); E (1.5, 1 .5 ); system I I : L iC l (0.25 M ), KC1 (0.2 AT); and system I I I : L iC l (0.25 M ), N aC l (0.2 M ). 6 T h e units are m o leV jou le cm sec for k, and jou le cm s e c /m o le 2 fo r A,-,- and (R,,.
A — [xiAis (1 — ¿i") T" T2A23*(1 — (2 " ) ] X
Xi
- ( 1 - t i )
X2
(1 - ¿ 2 -) .(52)
where t i and t i are the transference numbers of cations 1 and 2 in their respective binary solutions at the same total concentration N as in the mixture. Since A at our concentrations are unavailable or not too accurate and since eq 52 is so successful as an interpolation formula, we have used it to calculate A for our seven cases, using the smoothed and critically reviewed binary data in paper I 3 for t i and Ai3\
There exist very little data for transference numbers in ternary systems. There are some Hittorf measurements on various alkali halides,24 in particular for NaCl-KCF- 28 and LiCl-KCl26 up to 5 N . These relatively imprecise data can be fitted within the experimental error26 - 28 ( i .e . , < 0.01 in t) by the equations
£3 — ( 1 — i i ' ) ( l ~ k ’ ) /
fcci(l — t i ) + x2(l — ii*)] (53)
X itiU X itiUk —
(1 - t i )¿2 —
(1 - t i )(54)
These equations are due to Maclnnes29 and were rederived by Van Rysselberghe30 under much less restrictive hypotheses.
No accurate data in concentrated solutions exist, but there are some dilute solution moving boundary results, namely, ¿3 in NaCl-KCl at 0.1 V ,19 t t in HC1- KC1 at 0.1 V ,81 and U in LiCl-KCl at, 0.01 V .32 Comparison of these data with the t t predicted by eq 53 and 54 show agreement within 0.001. Because eq 53 and 54 give excellent results where they can be definitely tested and because they are within the experimental error in the more concentrated solutions, we have used them with the smoothed t i data in paper I3 to obtain the transference numbers for our seven cases.
(26) P . V an R ysselbergh e and L . N u ttin g , J . A m . Chem. Soc., 55, 996 (1933).(27) J. D ew ey , ib id ., 47, 1927 (1925).(28) S. A , B ra ley and C . W . R ip p ie , ib id ., 49, 1493 (1927 ).(29) D . A . M a cln n es , ibid., 47, 1922 (1925).(30) P . V an R ysselberghe, ib id ., 55, 99© (1933).(31) L . G . L ongsw orth . ib id ., 52, 1847 (1930).(32) G . S. K ell and A . R . G ord on , ib id ., 81, 3207 (1959).
Volume 71, Number 3 February 1967
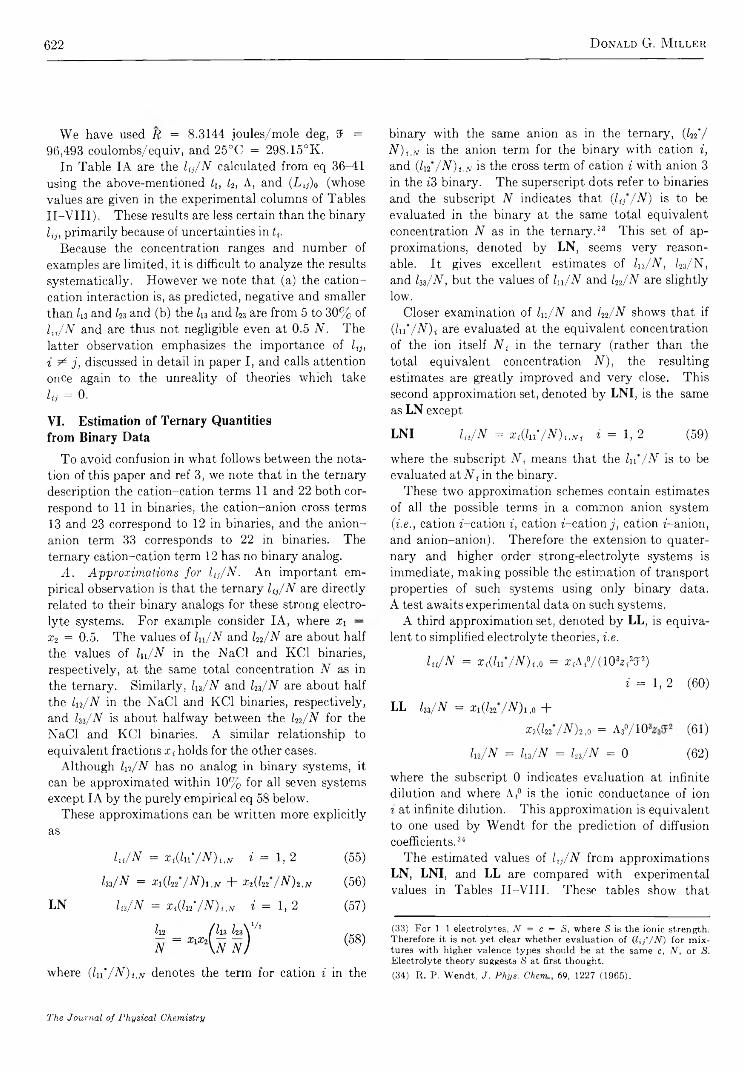
622 D onald G. M iller
We have used R = 8.3144 joules/mole deg, if = 96,493 coulombs/equiv, and 25°C = 298.15°K.
In Table IA are the l tj/ N calculated from eq 36-41 using the above-mentioned k , U , A, and ( L tj)0 (whose values are given in the experimental columns of TablesII-VIII). These results are less certain than the binary li}, primarily because of uncertainties in tt.
Because the concentration ranges and number of examples are limited, it is difficult to analyze the results systematically. However we note that (a) the cation- cation interaction is, as predicted, negative and smaller than In and k 3 and (b) the l l3 and Z23 are from 5 to 30% of lu/N and are thus not negligible even at 0.5 N. The latter observation emphasizes the importance of l ijy
i 9 * j , discussed in detail in paper I, and calls attention once again to the unreality of theories which takel tj = 0 .
VI. Estimation of Ternary Quantities from Binary Data
To avoid confusion in what follows between the notation of this paper and ref 3, we note that in the ternary description the cation-cation terms 11 and 22 both correspond to 11 in binaries, the cation-anion cross terms 13 and 23 correspond to 12 in binaries, and the anion- anion term 33 corresponds to 22 in binaries. The ternary cation-cation term 12 has no binary analog.
A . A p p r o x i m a t i o n s f o r l u / N . An important empirical observation is that the ternary l t]/ N are directly related to their binary analogs for these strong electrolyte systems. For example consider IA, where X i —
x 2 = 0.5. The values of ln / N and 1 & /N are about half the values of l n / N in the NaCl and KC1 binaries, respectively, at the same total concentration N as in the ternary. Similarly, l n / N and l n / N are about half the l n / N in the NaCl and KC1 binaries, respectively, and I33/ N is about halfway between the I22/ N for the NaCl and KC1 binaries. A similar relationship to equivalent fractions x { holds for the other cases.
Although ln/N has no analog in binary systems, it can be approximated within 10% for all seven systems except IA by the purely empirical eq 58 below.
These approximations can be written more explicitly as
l n / N = X i( ln ‘ / N ) itN i = 1, 2 (55)
hz/N = m i(Z22 /N)i,ff + x 2( l22 /N)2iN (56)
LN l u / N = x i i / i i ' / N ) i , x i = 1, 2 (57)
where ( l u ' / N ' ) t ,N denotes the term for cation i in the
binary with the same anion as in the ternary, ( I n ' /
N ) u n is the anion term for the binary with cation i ,
and ( I n / N ) i:N is the cross term of cation i with anion 3 in the 73 binary. The superscript dots refer to binaries and the subscript N indicates that ( l u / N ) is to be evaluated in the binary at the same total equivalent concentration N as in the ternary.53 This set of approximations, denoted by LN, seems very reasonable. It gives excellent estimates of l n / N , l n / N ,
and I33/ N , but the values of l n / N and l22/ N are slightly low.
Closer examination of l n / N and l n / N shows that if ( I n / N ) i are evaluated at the equivalent concentration of the ion itself N t in the ternary (rather than the total equivalent concentration N ) , the resulting estimates are greatly improved and very close. This second approximation set, denoted by LNI, is the same as LN except
LNI l u / N = x S N / N ) u n , i = 1, 2 (59)
where the subscript N t means that the l n / N is to be evaluated at N t in the binary.
These two approximation schemes contain estimates of all the possible terms in a common anion system (he., cation 7-cation i , cation 7-cation j , cation 7-anion, and anion-anion). Therefore the extension to quaternary and higher order strong-electrolyte systems is immediate, making possible the estimation of transport properties of such systems using only binary data. A test awaits experimental data on such systems.
A third approximation set, denoted by LL, is equivalent to simplified electrolyte theories, 7.e.
l u / N = x t( l u / N )il0 = aqA/y/lO W S 2)
7 = 1, 2 (60)
LL h z / N = X i ( l n / N ) 1,0 +X i ( k i / N )2,0 = A3°/10 (61)
l n / N = l n / N = l n / N = 0 (62)
where the subscript 0 indicates evaluation at infinite dilution and where At° is the ionic conductance of ion 7 at infinite dilution. This approximation is equivalent to one used by Wendt for the prediction of diffusion coefficients.33 34
The estimated values of l i}/ N from approximations LN, LNI, and LL are compared with experimental values in Tables II-VIII. These tables show that
(33) F or 1 -1 e lectro lytes , N = c = S, where S is the ion ic strength. T herefore it is n o t y e t clear w hether eva luation o f (U f/ N ) fo r m ix tures w ith higher va lence typ es should be at the sam e c, N , or S. E lectro ly te th eory suggests S a t first thought.(34) R . P . W en d t, J. Phys. C h e m 69, 1227 (1965).
The Journal of Physical Chemistry

Isothermal Vector T ransport Processes in T ernary Electrolyte Systems 623
Table I I : E stim ated T ernary P roperties at 25° for Strong E lectrolytes from D a ta on B inaries“ '6
IA H 20 -N a C l (0.25 M ) -K C l (0.25 M )
Exptl L N IE LNIB LNB LLB L L M C L K l LK2
(lu/N) X 1012 2 .4 3 2 .4 0 2 .4 0 2 .3 1 2 .6 9 2 .6 9(lu/N) X 1012 3 .6 4 3 .6 4 3 .6 4 3 .6 0 3 .9 5 3 .9 5(k»/N) X 1012 7 .3 0 7 .3 0 7 .3 0 7 .3 0 8 . 2 0 8 . 2 0(la/N) X 1012 - 0 . 0 9 - 0 . 1 2 - 0 . 1 2 - 0 . 1 2 0 0(lu/N) X 1012 0 .4 3 0 .4 2 0 .4 2 0 .4 2 0 0(kz/N) X 1012 0 .5 1 0 .5 2 0 .5 2 0 .5 2 0 0
h 0 .1 6 9 0 .1 6 6 0 .1 6 6 0 .1 6 6 0 .1 81 0 .1 81u 0 .2 6 8 0 .2 6 8 0 .2 6 8 0 .2 6 7 0 .2 6 6 0 .2 6 6A 1 0 5 .3 104 .5 1 0 4 .5 103 .3 138 .1 1 3 8 .1
(Lii)o X 10*RT 0 .2 6 1 0 .2 5 9 0 .2 5 9 0 .2 51 0 .2 7 3 0 .2 7 3(La)o X 10SRT — 0 .0 75 '1 - 0 . 0 7 6 - 0 .0 7 6 - 0 . 0 7 3 - 0 .0 8 9 - 0 . 0 8 9(La)o X 10»RT 0 .3 5 0 0 .3 5 2 0 .3 5 2 0 .3 4 8 0 .3 59 0 .3 5 9
(Lu), X 10>RT 0 .2 6 0 0 .2 5 8 0 .2 5 8 0 .2 5 0 0 .2 7 2 0 .2 7 2 0 .2 7 0 0 .2 6 6(La), X 10»RT —0 .0 7 8 d - 0 . 0 7 9 - 0 . 0 7 9 - 0 . 0 7 6 - 0 . 0 9 2 - 0 . 0 9 2 - 0 . 0 8 8 - 0 . 0 8 9(La), X WRT 0 .3 4 5 0 .3 4 7 0 .3 4 7 0 .3 4 4 0 .3 5 5 0 .3 55 0 .3 5 5 0 .3 4 9
(Bu), X 106 1 .3 7 1 .3 6 1 .3 6 1 .32 1 .4 2 1 .4 6(Da), X 106 - 0 . 0 0 - 0 . 0 1 - 0 . 0 0 0 . 0 0 - 0 . 0 5 0 .0 1(D 21)v X 106 0 .1 4 0 .1 3 0 .1 4 0 .1 5 0 .0 8 0 .1 9(Da), X 106 1 .8 2 1 .8 3 1 .8 3 1 .81 1 .85 1 .9 8
1 U nits: Uj in m ole2/jo u le cm sec; A in cm 2/o h m eq u iv ; (La)„RT and (La),RT in m o le /c m sec; and (D,j )v in cm 2/se c . 6 E refersto use o f experim ental a ctiv ity coefficient deriva tives ,16 B to derivatives estim ated from binary d a ta .10 e T h e sam e as W e n d t34 excep t assum e d In yi/brrij = 0 instead o f 2) In yi/bcj = 0 d T h e average of La and Z,2l ca lcu lated from experim ental d a ta .16
Table I I I : E stim ated T ern ary P roperties at 25° fo r Strong E lectrolytes from D a ta on B inaries“ ’6
IB H 20 -N a C l (0.5 M )- KC1 (0.25 M )
Exptl LN IE LN IB LNB LLB L L M C L K l LK2
(ln/N) X 1012 3 .1 2 3 .0 8 3 .0 8 2 .9 7 3 .5 9 3 .5 9(WN) X 1012 2 .4 2 2 .4 3 2 .4 3 2 .3 8 2 .6 3 2 .6 3(la/N) X 1012 7 .0 8 7 .0 8 7 .0 8 7 .0 8 8 .2 0 8 .2 0(la/N) X 1012 - 0 . 1 1 - 0 . 1 0 - 0 . 1 0 - 0 . 1 0 0 0(lu/N) X 1012 0 .6 1 0 .5 9 0 .5 9 0 .5 9 0 0(lu/N) X 1012 0 .3 7 0 .3 8 0 .3 8 0 .3 8 0 0
h 0 .2 3 0 0 .2 2 8 0 .2 2 8 0 .2 21 0 .2 4 9 0 .2 4 9i2 0 .1 8 6 0 .1 8 6 0 .1 8 6 0 .1 8 4 0 .1 8 2 0 .1 8 2A 9 7 .4 9 7 .2 9 7 .2 9 5 .7 1 3 4 .2 1 3 4 .2
(Ln)o X 1WÈT 0 .4 7 2 0 .4 7 1 0 .4 71 0 .4 5 9 0 .501 0 .5 01(La)o X 10»RT - 0 . 1 0 3 d - 0 . 1 0 2 - 0 . 1 0 2 - 0 . 0 9 7 - 0 . 1 2 2 - 0 . 1 2 2(La)o X 108ß T 0 .3 8 2 0 .3 8 4 0 .3 8 4 0 .3 7 8 0 .4 0 0 0 .4 0 0
(La), X WRT 0 .4 7 2 0 .4 6 5 0 .4 6 5 0 .4 53 0 .4 9 5 0 .4 9 5 0 .4 9 2 0 .4 7 4(La), X 10sRT - 0 . 1 1 0 d - 0 . 1 0 8 - 0 . 1 0 8 - 0 . 1 0 4 - 0 . 1 2 8 - 0 . 1 2 8 - 0 . 1 2 0 - 0 . 1 1 9(La), X 10*RT 0 .3 7 8 0 .3 8 0 0 .3 8 0 0 .3 7 3 0 .3 9 5 0 .3 9 5 0 .3 9 3 0 .3 81
(Du), X 106 1 .4 2 1 .4 0 1 .4 0 1 .3 6 1 .4 7 1 .5 1(Da), X 106 - 0 . 0 1 - 0 . 0 1 0 .0 1 0 .0 2 - 0 . 0 6 0 .0 1(D 21)v X 106 0 .0 9 0 .1 0 0 .1 1 0 .1 2 0 .0 6 0 .1 3(Da), X 106 1 .8 2 1 .8 3 1 .8 3 1 .8 0 1 .8 8 1 .9 7
“ U nits: hj in m ole2/jo u le cm sec; A in cm 2/o h m equiv ; (La )oRT and (Lij ) ,R T in m o le /cm sec ; and (Da), in cm 2/sec. 6 E refersto use of experim ental a ctiv ity coefficient der iva tives ,16 B to derivatives estim ated from binary d a ta .10 c T h e sam e as W e n d t34 except assume d In yi/àmj= 0 instead o f b In yi/bcj - 0. d T h e average o f La and L 2l ca lcu lated from experim ental d a ta .16
Volume 71, Number 3 February 1967

624 D onald G. M iller
Table IV : E stim ated T ernary P roperties at 25° for Strong E lectrolytes from D a ta on B inaries“ ’6
IC H îO -N a C l (0.25 M y KC1 (0.5 M )
E x p tl L N I E L N I B L N B l l b L L M C LKl LK2
{ln/N) X 1012 1 .6 4 1 .6 0 1 .6 0 1 .4 8 1 .7 9 1 .7 9(ln/N) X 1012 4 .7 9 4 .8 0 4 .8 0 4 .7 5 5 .2 6 5 .2 6(ln/N) X 1012 7 .2 5 7 .2 4 7 .2 4 7 .2 4 8 .2 0 8 .2 0(ln/N) X 1012 - 0 . 1 1 - 0 . 1 1 - 0 . 1 1 - 0 . 1 1 0 0( W N ) X 1012 0 .3 1 0 .3 0 0 .3 0 0 .3 0 0 0(W N ) X 1012 0 .7 4 0 .7 6 0 .7 6 0 .7 6 0 0
h 0 .1 0 8 0 .1 0 6 0 .1 0 6 0 .0 9 6 0 .1 1 8 0 .1 1 8h 0 .3 4 7 0 .3 4 8 0 .3 4 8 0 .3 4 9 0 .3 4 5 0 .3 4 5A 1 0 5 .7 1 0 5 .3 105 .3 1 0 3 .7 1 4 2 .0 1 4 2 .0
(A n )0 X 10SRT 0 .2 81 0 .2 7 4 0 .2 7 4 0 .2 5 6 0 .2 9 4 0 .2 9 4( ¿ 12)0 X IQSRT — 0 .0 99 * - 0 . 0 9 7 - 0 . 0 9 7 - 0 . 0 8 9 - 0 . 1 1 5 - 0 . 1 1 5( ¿ 22)0 X IWRT 0 .6 3 7 0 .6 3 8 0 .6 3 8 0 .6 3 1 0 .6 41 0 .641
( I n )v X 10 'Â r 0 .2 8 0 0 .2 7 3 0 .2 7 3 0 .2 5 5 0 .2 9 3 0 .2 9 3 0 .2 8 9 0 .2 8 7( i i i ) v X 10»RT - 0 .1 0 5 * - 0 . 1 0 2 - 0 . 1 0 2 - 0 . 0 9 5 - 0 . 1 2 0 - 0 . 1 2 0 - 0 . 1 1 3 - 0 . 1 1 7[U 0 v X 10SRT 0 .6 2 0 0 .6 2 1 0 .6 21 0 .6 1 5 0 .6 2 4 0 .6 2 4 0 .6 2 9 0 .6 1 7
(O n ) , X 10° 1 .3 6 1 .32 1 .3 2 1 .2 3 1 .4 0 1 .41( D 12)v x 105 0 .0 0 0 .0 0 0 .0 1 0 .0 1 - 0 . 0 2 0 .0 0( ö a )v X 105 0 .1 9 0 .2 0 0 .2 2 0 .2 5 0 .1 3 0 .2 4(T»22)v X 106 1 .8 4 1 .8 4 1 .8 4 1 .8 3 1 .83 1 .9 8
“ U n its: la in m o leV jou le cm sec; A in em 2/o h m eq u iv ; (.La)0RT and (Li,),RT in m o le /c m sec; and (O i ; ) , in cm 2/se c . 6 E refers to use o f experim ental a ctiv ity coefficient der iv a tiv es ,15 B to derivatives estim ated from binary d a ta .10 0 T h e sam e as W e n d t34 excep t assume d In 7 ¿/dm y = 0 instead o f 0 In yt/dcj = 0. * T h e average o f L n and L 21 calcu lated from experim ental d a ta .15
Table V : E stim ated T ernary Properties at 25° for Strong E lectrolytes from D a ta on B inaries“ .6
ID H 20 -N a C l (0.5 M )-K C 1 ( 0 . 5 1 )
Exptl LN IE LN IB LNB LLB L L M C L K l LK2
(ln/N) X 1012 2 .3 6 2 .3 1 2 .3 1 2 .1 6 2 .6 9 2 .6 9(ln/N) X 1012 3 .5 8 3 .6 0 3 .6 0 3 .5 4 3 .9 5 3 .9 5(ln/N) X 1012 7 .0 6 7 .0 4 7 .0 4 7 .0 4 8 . 2 0 8 . 0 2{ln/N) X 1012 - 0 . 1 4 - 0 . 1 3 - 0 . 1 3 - 0 . 1 3 0 0(ln/N) X 1012 ‘ 0 .4 8 0 .4 5 0 .4 5 0 .4 5 0 0(Z23/N) X 1012 0 .6 0 0 .6 1 0 .6 1 0 .6 1 0 0
0 .1 65 0 .1 6 4 0 .1 6 4 0 .1 5 2 0 .1 81 0 .1 81¡2 0 .2 6 9 0 .2 7 0 0 .2 7 0 0 .2 7 0 0 .2 6 6 0 .2 6 6A 9 8 .5 9 8 .4 9 8 .4 9 6 .4 138 .1 138 .1
(L n )o X W R T 0 .5 1 4 0 .5 0 2 0 .5 0 2 0 .4 7 6 0 .5 4 6 0 .5 4 6( ¿ 12)0 X 10*RT - 0 .1 5 0 * - 0 . 1 4 8 - 0 . 1 4 8 - 0 . 1 3 8 - 0 . 1 7 7 - 0 . 1 7 7( ¿ 22)0 X 10*RT 0 .6 9 8 0 .7 0 1 0 .7 01 0 .6 9 0 0 .7 1 8 0 .7 1 8
( U X 10SRT 0 .5 0 9 0 .4 9 7 0 .4 9 7 0 .4 71 0 .5 41 0 .541 0 .5 3 3 0 .5 2 2(T i2)v X 103Ä T - 0 .1 6 2 * - 0 . 1 6 0 - 0 . 1 6 0 - 0 . 1 5 0 - 0 . 1 8 9 - 0 .1 8 9 - 0 . 1 7 3 - 0 . 1 7 7(T 22V X 1QSRT 0 .6 81 0 .6 8 3 0 .6 8 3 0 .6 7 2 0 .7 0 0 0 .7 0 0 0 .7 0 1 0 .6 8 1
(B u)v X 10° 1 .3 9 1 .3 6 1 .35 1 .2 8 1 .4 6 1 .4 6(Dl2)v X 105 - 0 . 0 0 + 0 .0 0 0 . 0 2 0 . 0 2 - 0 . 0 2 0 . 0 1(T>2l)v X 105 0 .1 6 0 .1 6 0 .1 8 0 . 2 0 0 . 1 1 0 .1 9d>22)v X 105 1 .8 3 1 .8 4 1 .8 3 1.81 1 .8 5 1 .9 8
“ U n its: la in m oleV jou le cm sec; A in cn T /o h m equ iv ; (¿ ¡V oR T and {Ln\RT in m o le /c m sec; and (D ;,)v in cm 2/se c . 6 E refers to use o f experim ental a ctiv ity coefficient d erivatives ,16 B to derivatives estim ated from binary d a ta .10 c T h e sam e as W e n d t34 excep t assume à In 7-. /à rrij — 0 instead o f d In yi/dcj = 0. * T h e average o f Li2 and L 21 ca lcu lated from experim ental d a ta .15
The Journal of Physical Chemistry
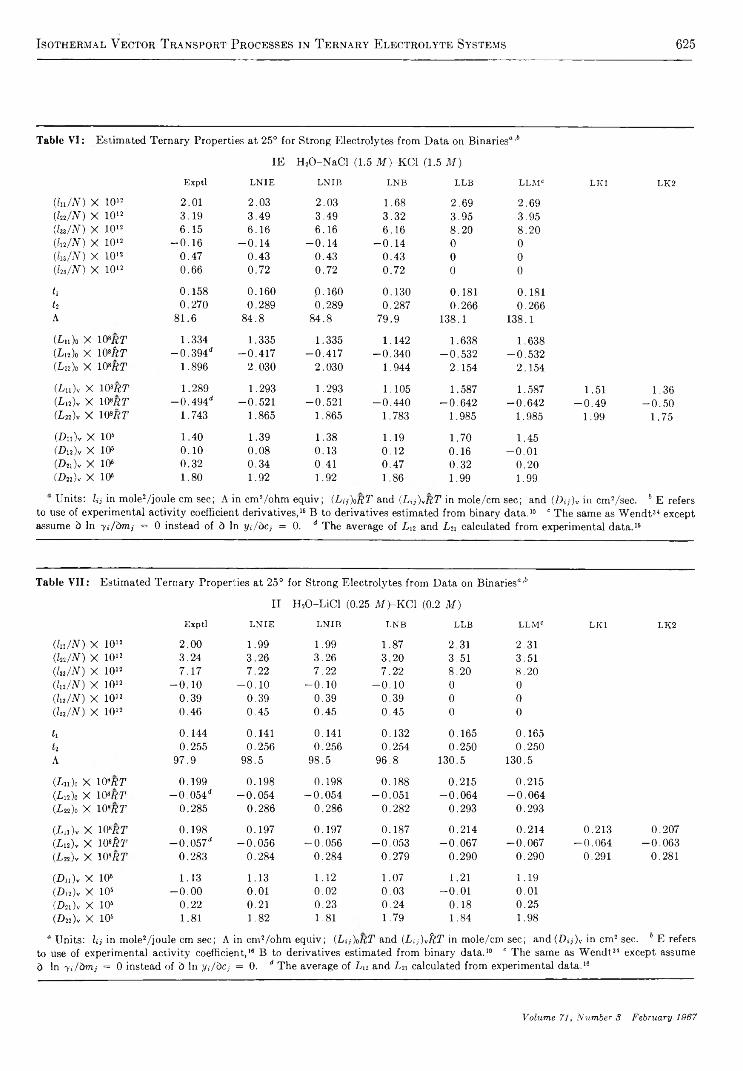
Isothermal Vector Transport Processes in T ernary Electrolyte Systems 625
Table VI: E stim ated T ern ary P roperties a t 25° for Strong E lectrolytes from D a ta on B inaries“ '6
IE H 20 -N a C l (1.5 M )-K C 1 (1.5 M)Exptl LN IE LNIB LNB LLB L L M C L K l LK2
(lu/N) X 1012 2.01 2.03 2.03 1.68 2.69 2.69(lu/N) X 1012 3.19 3.49 3.49 3.32 3.95 3.95( V A T ) X 1012 6.15 6.16 6.16 6.16 8.20 8.20(lu/N) X 1012 -0.16 -0.14 -0.14 -0.14 0 0(lu/N) X 1012 0.47 0.43 0.43 0.43 0 0(lu/N) X 1012 0.66 0.72 0.72 0.72 0 0k 0.158 0.160 0.160 0.130 0.181 0.181h 0.270 0.289 0.289 0.287 0.266 0.266A 81.6 84.8 84.8 79.9 138.1 138.1(L „ )o X 10sRT 1.334 1.335 1.335 1.142 1.638 1.638(Lu)0 X 10>kT — 0.394<i -0.417 -0.417 -0.340 -0.532 -0.532(Lm)0 X 10»RT 1.896 2.030 2.030 1.944 2.154 2.154(Ln)r X WRT 1.289 1.293 1.293 1.105 1.587 1.587 1.51 1.36(Lu)r X 10SRT —0.494d -0.521 -0.521 -0.440 -0.642 -0.642 -0.49 -0.50(La)v X 10¡RT 1.743 1.865 1.865 1.783 1.985 1.985 1.99 1.75(Du)v X 106 1.40 1.39 1.38 1.19 1.70 1.45(Du)y X 10° 0.10 0.08 0.13 0.12 0.16 -0.01(Da)y X 106 0.32 0.34 0.41 0.47 0.32 0.20(D22)v X 106 1.80 1.92 1.92 1.86 1.99 1.99U nits: U,- in m ole2/jo u le cm sec; A in cm 2/o h m equ iv ; (L,j)oRT and (Lij),RT in m o le /cm sec; and (Di, )v in cm 2/se c . 6 E refers
to use o f experim ental a ctiv ity coefficient derivatives,16 B to derivatives estim ated from binary d a ta .10 c T h e sam e as W e n d t34 except assume b In yi/bm,■ = 0 instead o f b In yi/bcj = 0. d T h e average o f Ln and Ln calcu lated from experim ental d a ta .16
Table VII: E stim ated T ern ary P roperties at 25° for Strong E lectro ly tes from D a ta on B inaries“ '6
I I H 20 -L iC l (0.25 M )-K C 1 (0.2 M)Exptl LNIE LNIB LNB LLB LLMC LKl LK2
(lu/N) X 1012 2.00 1.99 1.99 1.87 2.31 2.31(lu/N) X 10>2 3.24 3.26 3.26 3.20 3.51 3.51(WN) X 1012 7.17 7.22 7.22 7.22 8.20 8.20(lu/N) X 1012 -0.10 -0.10 -0.10 -0.10 0 0(lu/N) X 1012 0.39 0.39 0.39 0.39 0 0(lu/N) X 1012 0.46 0.45 0.45 0.45 0 0¿ 1 0.144 0.141 0.141 0.132 0.165 0.165f2 0.255 0.256 0.256 0.254 0.250 0.250A 97.9 98.5 98.5 96.8 130.5 130.5(Ln)o X 10»RT 0.199 0.198 0.198 0.188 0.215 0.215(Lu)o X 10»RT — 0.054li -0.054 -0.054 -0.051 -0.064 -0.064(La)0 X 10»RT 0.285 0.286 0.286 0.282 0.293 0.293(L u )v X 10sRT 0.198 0.197 0.197 0.187 0.214 0.214 0.213 0.207(Ln)y X IWtlT -0.0574 -0.056 -0.056 -0.053 -0.067 -0.067 -0.064 -0.063( i 22)v X 10sRT 0.283 0.284 0.284 0.279 0.290 0.290 0.291 0.281
(Dn)y X 10s 1.13 1.13 1.12 1.07 1.21 1.19(Dn)y X 106 -0.00 0.01 0.02 0.03 -0.01 0.01(Dzi)v X 106 0.22 0.21 0.23 0.24 0.18 0.25(D 22)v X 106 1.81 1.82 1.81 1.79 1.84 1.98
“ U nits: Uj in m ole2/jo u le cm sec; A in cm ! /o h m eq u iv ; (La)oRT and (La)rîtT in m o le /cm sec; and (Dij)y in cm 2 sec. 6 E refers to use o f experim ental activ ity coefficient,16 B to derivatives estim ated from binary d a ta .10 0 T h e sam e as W en d t34 excep t assume d ln yi/bmj = 0 instead o f d ln yi/bcj = 0. d T h e average o f Ln and Ln calculated from experim ental da ta .16
Volume 71, Number 3 February 1967
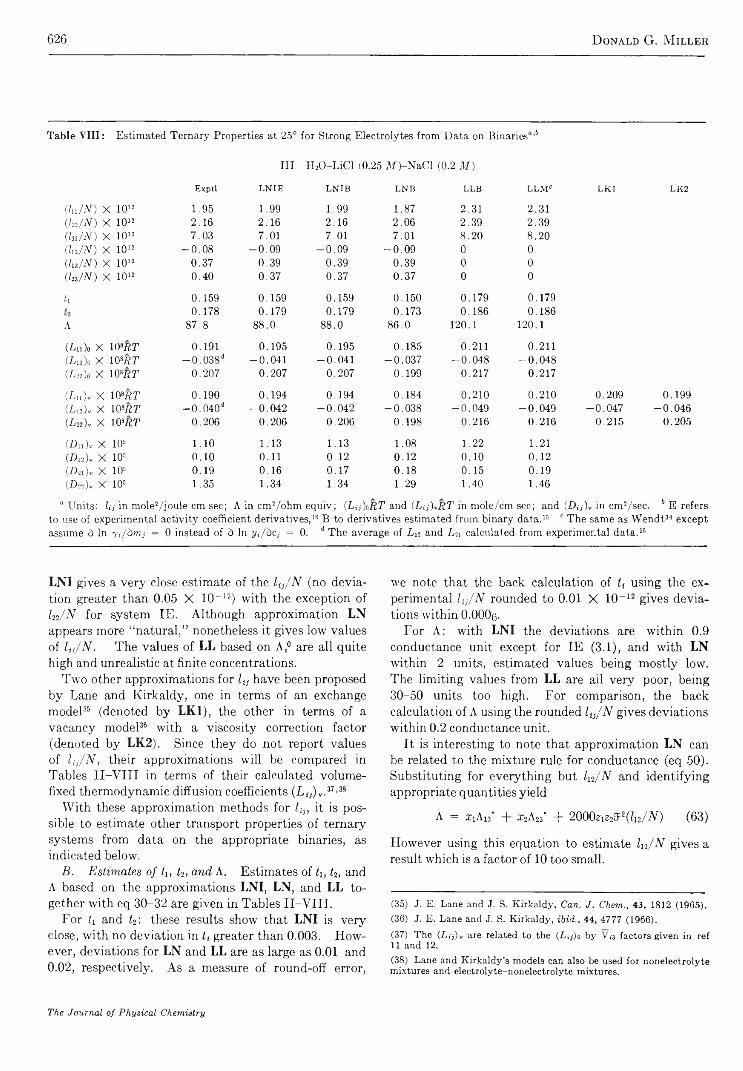
626 D onald G. M iller
Table VIII: E stim ated T ernary Properties at 25° fo r Strong E lectrolytes from D a ta on Binaries“ '11
III H 20 -L iC l (0.25 M)~NaCI (0.2 M)E x p t l L N I E L N I B L N B L L B L L M C L K l L K 2
( ln / N ) X 1012 1.95 1.99 1.99 1.87 2.31 2.31( ln / N ) X 1012 2.16 2.16 2.16 2.06 2.39 2.39( lu / N ) X 1012 7.03 7.01 7.01 7.01 8.20 8.20( ln / N ) X 1012 -0.08 -0.09 -0.09 -0.09 0 0( lu / N ) X 1012 0.37 0.39 0.39 0.39 0 0(U s/N ) X 1012 0.40 0.37 0.37 0.37 0 0
h 0.159 0.159 0.159 0.150 0.179 0.1790.178 0.179 0.179 0.173 0.186 0.186
A 87.8 88.0 88.0 86.0 120.1 120.1
(Axi)o X 10»RT 0.191 0.195 0.195 0.185 0.211 0.211(Lu)o X WRT — 0.038* -0.041 -0.041 -0.037 -0.048 -0.048(Ln\ X WRT 0.207 0.207 0.207 0.199 0.217 0.217
(lu), X WRT 0.190 0.194 0.194 0.184 0.210 0.210 0.209 0.199(Lu), X 10»RT -0.040* -0.042 -0.042 -0.038 -0.049 -0.049 -0.047 -0.046(L22), X 10ORT 0.206 0.206 0.206 0.198 0.216 0.216 0.215 0.205
(Du), X 105 1.10 1.13 1.13 1.08 1.22 1.21(D u )y X 10° 0.10 0.11 0.12 0.12 0.10 0.12(D ii)v X 10s 0.19 0.16 0.17 0.18 0.15 0.19(D22 )v X 105 1.35 1.34 1.34 1.29 1.40 1.46
“ U nits: la in m ole2/jo u le cm sec; A in cm 2/o h m equiv ; (La\RT and (Lij)vRT in m o le /c m sec; and (Dij)v in cm 2/se c . b E refers to use of experim ental activ ity coefficient derivatives,16 B to derivatives estim ated from binary data .10 c T h e sam e as W e n d t34 excep t assume à In y ¡ / d r a y = 0 instead of d In j/./dc,- = 0. * T h e average o f La and Ln calcu lated from experim ental d a ta .16
LNI gives a very close estimate of the U j / N (no deviation greater than 0.05 X 10~12) with the exception of Ua/N for system IE. Although approximation LN appears more “ natural,” nonetheless it gives low values of l u / N . The values of LL based on A*0 are all quite high and unrealistic at finite concentrations.
Two other approximations for l(j have been proposed by Lane and Kirkaldy, one in terms of an exchange model35 (denoted by LK1), the other in terms of a vacancy model36 with a viscosity correction factor (denoted by LK2). Since they do not report values of U j/N , their approximations will be compared in Tables II-V III in terms of their calculated volume- fixed thermodynamic diffusion coefficients (Ly)v.37'38
With these approximation methods for li}, it is possible to estimate other transport properties of ternary systems from data on the appropriate binaries, as indicated below.
B. Estimates of L, t2, and A. Estimates of fi, t2, and A based on the approximations LNI, LN, and LL together with eq 30-32 are given in Tables II-VIII.
For ti and t2: these results show that LNI is very close, with no deviation in tt greater than 0.003. However, deviations for LN and LL are as large as 0.01 and 0.02, respectively. As a measure of round-off error,
we note that the back calculation of t{ using the experimental l^/N rounded to 0.01 X 10⁻¹² gives deviations within 0.0006-
For A: with LNI the deviations are within 0.9 conductance unit except for IE (3.1), and with LN within 2 units, estimated values being mostly low. The limiting values from LL are all very poor, being 30-50 units too high. For comparison, the back calculation of A using the rounded l {j / N gives deviations within 0.2 conductance unit.
It is interesting to note that approximation LN can be related to the mixture rule for conductance (eq 50). Substituting for everything but lu/N and identifying appropriate quantities yield
A = Z1A13 -f- £2A23' -(- 2000ziZ2 2(lii/N) (63)
However using this equation to estimate ln/N gives a result which is a factor of 10 too small.
(35) J. E. Lane and J. S. Kirkaldy, Can. J. Chern., 43, 1812 (1965).(36) J. E. Lane and J. S. Kirkaldy, ibid., 44, 4777 (1966).(37) The (Lij)y are related to the (L;,-)o by V a factors given in ref 11 and 12.(38) Lane and Kirkaldy’s models can also be used for nonelectrolyte mixtures and electrolyte-nonelectrolyte mixtures.
The Journal of Physical Chemistry
Isothermal Vector T ransport Processes in T ernary Electrolyte Systems 627
C. Estimates of (Ly)v. Intercomparisons of approximations for (Li})o and for (Ly)v are similar, as can be seen in Tables II-V III. Therefore attention will be concentrated on (Ly)v both because they are more directly related to experiment and because Lane and Kirkaldy36,36 used them for comparisons. Deviations are given in per cent because of the strong concentration dependence.
Back calculations with rounded lt]/N yield maximum deviations of 0.3, 2.5, and 0.2% for (Lu)v, (Li2)v, and (Lm)vi respectively. Estimates by LNI give 3, 5, and 1% (except 7% for system IE), respectively. For LN the corresponding maximum deviations are 10 (except 16% for IE), 11, and 4%, with most Lit low, especially Ln. For LL, the values are all high, especially for (L12)v with maximum deviations of 10, 22, and 5%, except for IE where the deviations are substantially higher. The Lane and Kirkaldy schemes give maximum deviations for LK1 of 10 (except 15% for IE), 13 (except 18% for III), and 4% (except 14% for IE), and for LK2 of 5,15, and 1%.
The LNI estimates are excellent, even for IE where the over-all concentration is 3 N. Hence for mixed alkali chlorides at least, these ternary properties can be quite well estimated knowing the properties of the binaries. The next best is LK2 with LN somewhat poorer, followed by LK1 and LL. In general all schemes are better at lower concentrations.
D. Estimates of (D w)v. Ordinary diffusion coefficients (Dy)v are very hard to measure for multi- component systems but are often needed in particular situations. Therefore estimation methods are very useful. An obvious one is to work backward from estimates of the li}/N as follows. If the appropriate thermodynamic quantities, mtj, are available from experiment or can be reasonably approximated, it is possible to use eq 19 and (Ly)0 estimated from ltj to compute estimated values of (Dtj)0. From Va and these (Dij)0, we may then calculate the desired (Z)w)v by the equation11
(D„)v = E {skt - ^ ) ( D , , 0 i , j = 1, 2 (64)
This idea was proposed by Wendt,34 who used the approximation LL for lt]/N and the rather drastic approximation for ¡itj that the molar activity coefficient, y{, is independent of concentration. For strong electrolyte mixtures Wendt’s estimates of Di} were surprisingly good and required only limiting ionic conductances and Vi3 as input data.
It is naturally expected (and observed) that better estimates of (Dw)v would be obtained from better
estimates of both U j /N and m«- We have therefore considered approximations LNI, LN, and LL for the 11}/N together with various mo approximations. These are: (a) na calculated from actual ternary thermodynamic data used to get the experimental ltj/N (denoted by final letter E), (b) My estimated from binary activity data by the method in ref 10 (denoted by B), and (c) Mo based on the unrealistic approximation that the molal activity coefficient y >s concentration independent39 (denoted by M).
Five estimates of (Dtj)v are compared with experiment in Tables II-VIII. These are LNIE, based on binary lif/N and ternary thermodynamic data, LNIB, based wholly on binary data, LNB, also based only on binary data, LLB. based on limiting conductances but using binary My, and LLM, based on limiting conductances only.
Back calculations using rounded ltj/N and the actual ternary thermodynamic data (E) yield maximum deviations of O.OO5, 0.02, 0.02, and 0.00s f°r (Ai)v, (D»)v, (D21)v, and (D22)v, respectively, compared to experimental errors of the order of 0.01 (X 10-5). For LNIE it is noteworthy that the maximum deviations are not much greater than experimental errors, namely, 0.04, 0.03, 0.03, and 0.01 (except 0.12 for IE). LNIB, based wholly on binary data, yields exactly the same maximum deviations as LNIE except that AD2i = 0.09 for IE. The results for the others are progressively less satisfactory, namely, LNB: 0.13 (except 0.21 for IE), 0.03, 0.06 (except 0.15 for IE), 0.06; LLB: 0.12 (except 0.3 for IE), 0.06, 0.06, 0.06 (except 0.19 for IE ); LLM : 0.11, 0.02 (except 0.11 for IE), 0.05 (except 0.12 for IE), 0.19.
Clearly excellent estimates of (Z>y)v can be obtained at 1 N and below (with acceptable values even at 3 N ) for alkali halide mixtures by means of LNIB which is based wholly on binary data. This scheme is thus recommended for such mixtures. The same closeness of prediction should hold for other 1 - 1 strong electrolyte mixtures, although acid or higher valence type of mixtures may not give as good results.
Naturally the best scheme requires the most input data. Thus LNIB requires V, y, t, A, and (Z))0 for the appropriate binaries at all concentrations, whereas LLM, which gives fair Dtj only because of fortuitous canceling of errors (as shown by the poor values of t{ and A), requires only limiting ion conductances and F’s.
(39) This assumption, used instead of W endt’s, was made solely for our computational convenience and is of course nearly equivalent to his. The difference between them, discussed in ref 34, footnote 17, is significant only at higher concentrations.
Volume 71, Number S February 1967
628 D onald G. M iller
Although we have not calculated D(j from Lane and Kirkaldy’s LK2,36 the results should be good, as indicated by their good values for (L{j)v. This scheme requires A*0, the limiting self-diffusion coefficient of the solvent, D0*, the viscosity, y, of the mixtures (or estimates of it) at all concentrations, and V and 7 for the binaries at all concentrations.
VII. Limiting Values of Transport Quantities at Infinite Dilution
To get an idea of the general relative concentration dependence and to obtain approximate tracer equations, it is useful to consider the various transport quantities at infinite dilution. The systematic analysis below leads easily to expressions in terms of A/1 (which for a given ion are independent of the other ions present). Some of the results (e.g., for Di}°) have been obtained before but in different forms. In this section, reference frames will not be distinguished because the SF and VF reference frames become identical at infinite dilution, and quantities at infinite dilution will be denoted by a superscript 0.
A. Expressions for Ternary l{f . We begin by considering the limiting values for the binary ltf . As can be shown theoretically or experimentally,3 In /N —*■ 0 and (1 + cd In y/dc) -*■ 1 at infinite dilution. Therefore using these conditions in eq 1-41 and recalling that the ionic conductance, Ait is defined by
A i = L A (65)
we obtain the result for the diffusion coefficient at infinite dilution
rRTAfAfriZiff2A° (66)
which is the Nernst-Hartley equation (eq 1-47).Substitution of eq 66 into 1-41 for i, j = 1 ,2 yields
the following simple results for binary systems
hi = A*° hiN lO V ff2’ N (67)
For ternary systems, we substitute eq 67 in approximation schemes LN or LNI (since they are the same at infinite dilution) for lu/N and set lv/N = 0, i j, either on theoretical grounds or as a generalization of results on binary systems. Recalling that Xi = 1 , we obtain the results below (which are eq 60-62 and are equivalent to Wendt’s34)
lu° xtAf ÏV ~ 10V1F2 i = 1, 2, 3 (68)
hi — 13° _ ^3°N ~ N ~ W
The l{f/N depend on the relative concentration x {, but the expressions
; o 70t<11 1*4S v - f f . I = 1' 2' 3 {m
do not. In fact despite the restrictive assumptions of this section, this relation holds approximately at higher concentrations (compare IB, IC in Table I), and even with a change of over-all concentration up to IN (compare IA -ID , II, and III in Table I).
B. Expressions for A0, tf, L(j°/N, and Dtf . Upon substituting eq 68 in eq 30-35, we obtain the following trivial results for A0 and tf
A0 = ziAi0 + XiAf + A30
tf = xAf/A0
and the nontrivial results for L tf/Nm
Ln° _ a;iAi0(A° — rriAi0)N ~ l O V ^ ^ A 0-
Li2° _ X j X i A f A f
N 103ricr2C2iZ2ff2A0
¿22° _ 3^2° (A° — X j A f )
N ~ 10s(r20 2) 2ff2A°
(70)
(71)
(72)
(73)
(74)
We note that all Ltf/N are finite at infinite dilution and that L12°/N is negative. The nonzero value for Lif/N results from coupling due to the electroneutrality condition.36 Note that Ln°/xiX2N is constant for arbitrary x{. However the Ltf/x{N = L tf/Nt do depend on xt; they could vary by a factor of 2 for alkali halide mixtures and substantially more for HC1 mixtures.
To obtain expressions for Dtf, we substitute eq 72- 74 into eq 19 and use the equation for at infinite dilution
RTPa = — [ficSy + AaXj\ infinite dilution (75)
cj
Equation 75 is obtained from eq 22, after,noting that by the Debye-Huckel theory r,jd In y t/dcj goes to 0 as where S is the ionic strength. The resulting expressions are ternary analogs of the Nernst-Hartley equation and are
Dl2° = X\f2&R TAx°rlaff2A° L 22
Ao°+
(76)
(77) 40
(40) Equations 72-74 can also be obtained by setting 7,-,- = 0 in eq 39-41, solving for L i j , and using eq 71.
The Journal of Physical Chemistry
Isothermal Vector Transport Processes in T ernary Electrolyte Systems 629
D 0 _ _ W « W " A i ° A30' 21 r2a3:2A0 _ «1 23.
D220 —ÄTA2°i 2A0
A0 /A 2o A3'— — *2l — H------.«2 \ «2 23
(78)
(79)
Z/11*5 _ a:iTi*(Ai0) 2V ~ _ 103i 2(ric2i)2A°
Am*0 _ xi*A1°(A° - xl*Al°) N ~ 103ï 2(fic21)2A0
(85)
(86)
Equations 76-79 are the explicit formulas for the approximation used by Wendt for strong electrolytes at all concentrations.34 These equations specialized to 1-1 electrolytes were given earlier in a different form by Gosting.41'42
We see that D12°/x! and Dn°/x2 are constant for arbitrary x{, and inspection of Tables II-V I shows that this remains approximately true even as high as 3 N. Moreover since z3 is negative they may be positive or negative depending on the relative sizes of A{° and A3° and can be fairly large if H+ is a constituent. However the A H° do depend on x{, although the variation is not large except for systems including H+.
C. Tracer and Intradiffusion Expressions. For tracer quantities of constituent 2 in a solution of 1, we find that setting x\ = 1 and x2 — 0 reduces eq 72-74 to the binary case, with a Nernst-Hartley expression for An0/ N and with Ln°/N and L22°/N both being zero.
The diffusion coefficients reduce to
Dn° = g -Tf A3°( - - - ) = Nernst-Hartley (80) IFA0 \2i 23/
rJiTAÆ V A30'riaiPA0 \_ z2 zs _
D2 i° = 0
« - z252
(81)
(82)
(83)
where eq 80 is equivalent to eq 66. These equations were given in a different but equivalent form by Gosting.41 Since D2i° = 0 (which can be shown to be true for tracer diffusion at arbitrary concentrations of constituent 1), the flow of 2 is a Fick’s law flow; i.e., there is no effect of 1 on 2. However, owing to the nonzero Di2°, a finite flow of 1 is induced by the tracer’s gradient.
We now turn to the case where constituent 2 is an isotopically labeled form of constituent 1. This labeled form is denoted by 1* and may be present in large amounts. The differences between 1 and 1* are assumed to be sufficiently small that their diffusion and other solution properties are the same.
In this circumstance, the limiting expressions for Ln/N become
An0 tiAi°(A° — £iAi°)~N = ’ 103iF2(rlc2i)2A0
and the limiting expressions for the A M become
A n 0 =RTAi°IF2A0
A0 — T1A10 TiA30’21 23 J
X1RTA10
iF2A°'Ai_° A /'.21 23 .
A>i*i° — —X i* R T A i°
A2A°'A40 A30.21 z3.
A 1*1* —R T A I
5 2A°'A0 - a;i*Ai° a;i*A3(
21 23 J
(87)
(88)
(89)
(90)
From these equations it is easy to show that
A u ° A n * 0 . A i * i * °_____ Ai°A3° _~N + N + N ~ 103(ric2i)2fF2A° ~ bNH (91)
and that
An0 H- An*0 "b Ai*i° fl- Ai*i*° =2Ai°A;i(Â A / l _ 1 \
A2A° \Zl z j2AbNH (92 )
where the subscript bNH indicates the appropriate Nernst-Hartley expression for the binary system 13.
Two isotopically differing solutes43 clearly form a ternary solution. However Albright and Mills44 have shown how the ternary A w can be related to “ pseudo” binary coefficients in two special cases. First, they showed that the binary diffusion coefficient (A )v for isotopically labeled constituents diffusing in the solvent without regard to labels is given in terms of ternary Dtj by the equation
%(A )v = (Aii)v -|------(Au*)v = (Ai*i*)v + —x(Ai*i)v
Cl Ci*(93)
which is valid at any concentration. Our notation has been used in eq 93. Substitution of the limiting
(41) L . J. Gosting, Advan. Protein Chem., 11, 536 (1956).(42) I. J. O’Donnell and L. J. Gosting in “ T he Structure o f Electrolytic Solutions,” John W iley and Sons, Inc., New Y ork, N . Y ., 1959, Chapter 11.(43) W ith our present notation, the two cations are chosen to be isotopically different.(44) J. G . Albright and R . M ills, J. Phys. Chem., 69, 3120 (1965). Their equations are derived for a ternary nonelectrolyte case, but the results are equally valid for ternary electrolyte systems.
Volume 71, Number 3 February 1967
630 D onald G. M iller
eq 87 and 88 or 89 and 90 in eq 93 yields the Nernst- Hartley value of 7)°, as would be expected.
Second, Albright and Mills related intradifusion to binary processes. Intradiffusion is defined as follows.44 Consider a solution which is homogeneous except that, in a part of the container, a portion of one constituent is replaced by an equal portion of the labeled form of that constituent. The resulting diffusion between the labeled and unlabeled forms at a constant concentration (ci + C j * ) is called intradiffusion.VIII. 45 Because the total concentration of solute is constant, the ternary equations reduce to binary forms
J i = - D ^ (94)O X
Ji* = (95)O X
where is the intradiffusion coefficient. Albright and Mills44 have shown that in general
(D f ) v — (-Dn)v — ( A i * ) v = (D i* i*)v — (96)
Substitution of the limiting eq 87-90 in eq 96 yields the result
£>to = R ™ (97)
which upon relettering is the same as D^° for the tracer diffusion case (eq 83).
We obtain (Rj0 from (Ry by means of the equations3'46
X^(Ry = 0 i, j = 0, 1, 2 (101)3
We now turn to that form of the ionic 72y formalism which is obtained by inverting eq 9. This form gives forces in terms of independent ion flows rather than velocity differences, namely
- { t + ^ - k R,'ri < _ i ' 2' 3 <io2)The dependent solvent friction terms R10 are obtained from eq 101 adapted to ion concentrations, namely
Rm = — (1/ Co) [(ri&Rji + +
(ricRtt + i = 0, 1, 2, 3 (103)
An analysis using eq 102 of the conductance, transference, and diffusion experiments similar to that in section IV leads to the following results
a = (l/R*)W(R*Rn - R232) +222(72llfis3 — R li2) + Zi2(RllR22 — R122) +
2ziZ<2(R izR n — R12R23) H~
2 ziZz{R\JR,2% — R13R22) +2 223 (R12R13 — -fiWRn)] (104)
t\ = (1 /a) [Zl2(R22Rz3 — R232) +ZiZ2(RisRn — R12R33) +
ziZi(R\2R23 — 213 22) ] (105)
VIII. The Ri} Representation ¿2 — (1 /a) [ziZïiRnRw — R12R23) +Although the writer believes the “ friction coef
ficient” formalism (72y) to be less intuitive and straightforward than the “ mobility” one (Zy) used above, a number of 72y results are presented for completeness. The ORR are assumed.
Because they simplify the expressions for the ionic “ friction coefficients” Rtj, it is convenient to first consider the ternary diffusion friction coefficients (Ry (analogous to the (Ly) 0). In terms of friction coefficients, ternary diffusion is described by the inverse of eq 1846
<Vi3dx
2) . (R ijJj?,
i = 1i = 1, 2 (98)
The (Ry can be obtained from the (L{j)0 by Cramer’s rule, which yields
(Ru — (¿ 22)0/L) (R12 — —(¿ 12)0/^ ; (R22 — (¿ 11)0/L (99)
where
L — (7/11)0(^22)0 — (Ti2)o2 (100)
Z2K R 11R 33 R u 2) "t" Z 2 Z 3 (R i2 R i3 — R 23R 11) ] ( 1 0 6 )
(R u = ? 'ic27 7 u + 2?’i 0r i a72 i3 + r i a 27233 ( 1 0 7 )
(R12 = ricTicRiz + Tij'iJRn +riJiJtn + rijriJRw (108)
(R22 = rt *R» 4“ 2f2cr2a7?23 T r2e,2Rz3 (109)where
R = (R11R22R33 + 2R n R vR n ) —
(7?i227?33 + Riz2R22 + 7223277u) = det|72y| (110)
Equations 104-110 may be solved directly for Rtl in terms of a, ti, t2, (Ru, (R12, and (R22. Alternatively, since the matrix of coefficients R is the inverse of 1,
(45) Intradiffusion, can be tracer diffusion if the concentration of 1* is very small. However tracer diffusion can also refer to an essentially homogeneous solution with a tiny amount of a solute completely different from 1. Self-diffusion is intradiffusion in a system containing only isotopically different forms of the same species. These terms are discussed more completely in ref 44.(46) For example, R. W. Laity, J. Phys. Chern., 63, 80 (1959).
The Journal of Physical Chemistry
Isothermal V ector Transport Processes in T ernary Electrolyte Systems 631
the expressions for the inverse together with eq 36-41 can be used to get Rtj. Either route is very tedious. The results can be written in condensed form as
¿¿h ZjZj^jbu - Qibjj - t,)(Rkl a Z32 k,i Wza
i , j = 1 , 2 , 3 k, l = 1, 2
Ri 0Zi U: k) -kl l
23Co k,l rka(Ôifc
Z3 k rka,Ik)hlfcO i = 1, 2, 3
fc, / = 1, 2
•ßoo — ÖI00
(111)
(112)
(113)
Rod0 —10 352N~ x, x2 x3
Co2 Lap + M° +(116)
For Ru, R13, and R23, there are no simple limiting expressions without appeal to the Debye-Htickel theory or some other model. However by analogy to the binaries3
Rii “ pji/, i 9 j) i, j — 1, 2, 3 (117)
so that the Ri} of eq 117 are infinity at N = 0. It can also be shown by appropriate substitutions of limiting values that for N > 0
NRij0 = 0 (118)
These equations reduce to those of a binary system (eq 1-72-77) when one of the salt constituents vanishes.
Equation 113 is an interesting theorem, which may be used as a calculational check. It could be anticipated because the solvent-solvent “ friction” should be independent of whether one considers the transport of ions or of salts as a whole.
The values of Rtj and (Ri} for the seven ternary systems are given in Table IB. The general trends are analogous to the binary results.3 Again the intuitive notion of “ friction coefficient” seems completely inadequate, because “ frictions” should all be of the same sign; yet Rn and Rn are of opposite sign to Rn. Moreover the solvent-solvent friction R0o, which intuitively should be relatively constant, is concentration dependent.
Fairly good estimates for ternary Rn and R22 can be made by taking the values of the appropriate binary Ru at Nit and for Ru and R23 by taking the cross term of the appropriate binary at N. The same is true for R3i and R30 by taking linear combinations of the appropriate binary terms at N. However estimates of Rw and R2q from binaries are poor at both N and N ,, and are low. Moreover the writer has not found any good way to relate Ru to Ru and R23 or to Rw and R20. Consequently good estimates of f,, A, and Z>w from binary Ru data are not available—in contrast to the excellent estimates from binary data.
Values of R^ at infinite dilution can be obtained from the limiting values of ltj and are useful in getting an idea of approximate concentration dependences. Recalling that x3 = 1, we obtain
p,.° =¿vii l.PI'll
1()3Zi2$2XiNAt0
Ri o° —W z^ jïô u - 1)
c0 Ai0
i = 1, 2, 3 (114)
¿ = 1 , 2 , 3 (115)
Consequently the use of limiting values as the concentration increases is increasingly in error because the Ru in Table IB are in fact nonzero.
The pure diffusion <Jty° are given by
<R a0lO^Vicr ZjZjf 1 5jj \
N \A3° XiAi0)
(Rio0l O V v , / J _ J_\
Co U i0 + A37
i , j = T 2
(119)
i = 1 , 2 (120)
®oo° = Roo°
It is a curious fact that
(113)
« 120 = rlar2aß330 (121)
We note from eq 114, 115, 119, and 120 that V f7?4i, Rfo, N(R12, and (Ri0, respectively, should be independent of N and x{ and be relatively constant. This is seen from Table IB to be approximately true up to 1 N for the seven systems. However the other Rtj and (Rw quantities are expected to depend on xt, as is also found from the data.
IX. Remarks
The generality of irreversible thermodynamics is clearly necessary for ternary electrolyte solutions because the cross coefficients ltj, i 5 j, are significantly large even as low as 0.5 N. Setting them equal to zero is obviously as unsatisfactory here as it was in binary systems.3
We repeat an observation of paper I: although the lt] are determined numerically from the one-dimensional special cases of t,, A, and Du, the resulting Zi3- and the general equations are valid in two or three dimensions and for any isothermal vector process no matter how complex.
The discovery that ternary li} can be estimated to
Volume 71, Number 3 February 1967
632 D onald G. M iller
good approximation from binary data for strong electrolytes is useful in estimating usual transport coefficients such as tt or Di]t which are hard to measure.
An interesting application of these estimates is the generalization of Hafemann’s47 calculation of charge separation and liquid junction potentials. Hafemann used the simplified model that 1{J = 0, i ^ j, and by a step by step numerical calculation computed the motions of all the ions from the instant of forming a sharp, free diffusion, liquid junction boundary. With our estimation procedure it is now possible to include the cross terms, thereby eliminating his worst approximations. The coding of course will be more complex, but good agreement with experiment should be obtained.
Finally, we emphasize that transference number and diffusion data in ternary electrolyte solutions are very scarce and badly needed. It is hoped that experimentalists will increasingly turn their attention to these situations.48
Acknowledgments. The author wishes to thank Robert Carpenter and Guy McMillan for their aid in computer calculations.
(47) D . R . Hafemann, J. Phys. Chem., 69, 4226 (1965).(48) N ote A dded in Pboof. A paper on tracer diffusion by Rastas (J. Rastas, Acta Polytech. Scand., Chem. Met. Ser., 50, 37 (1966)) has just come to the author’s attention in which eq 36-41 have been independently derived. This interesting paper also contains a com parison o f experimental tracer data with tracer quantities estimated from the Onsager-Fuoss theory rather than LL-type approximations
The Journal of Physical Chemistry

Esr of Aromatic Hydrocarbons Adsorbed on Silica-A ltjmina 633
Electron Spin Resonance Studies of Aromatic Hydrocarbons
Adsorbed on Silica-Alumina. I. Perylene
by G. M . Muha
Esso Research and Engineering Company, Linden, New Jersey 07036 (Received August 22, 1966)
An analysis is presented of the electron spin resonance (esr) spectrum of the perylene radical cation generated on a silica-alumina catalyst surface. The magnitude of the larger proton hyperfine-coupling constants are shifted by 4% from the corresponding values obtained when the radical cation is prepared in sulfuric acid solution. The shift is discussed in terms of an electrostatic perturbation of the radical-cation ir-electron distribution due to the presence of the counterion. The severe line-width effects which are also observed are discussed in terms of a modulation of the anisotropic hyperfine and gf-tensor interactions. It is found that the line-width variation can be satisfactorily described by a polynomial equation in the nuclear spin quantum number of the equivalent proton groups provided that the value of the correlation time for the radical-cation motion is chosen to be comparable to that found in solution. From this result it is argued that the radical cation is relatively unrestricted in its motion and by implication, perhaps the counterion, i.e., electrophilic agent, is also somewhat unrestricted in its movements on the surface.
Examples of the generation and stabilization of radical ions on the surface of solids have been known for some time.1 Recently, this technique has been used to study the nature of the catalytically active sites on the surface of silica-alumina catalysts. These surface sites are thought to function, in some broad sense, as an acid2 and induce a carbonium ion type of reaction in an adsorbed hydrocarbon.3 When aromatic hydrocarbons are used, optical studies4-7 indicate the presence of a radical cation in addition to the “ classical” carbonium ion. Electron spin resonance (esr) studies4'8,9 confirm the presence of a paramagnetic material adsorbed on the surface.
To date, the principal use of these esr results has been to demonstrate certain features of the electrophilic sites responsible for the oxidation of the aromatic hydrocarbons. For example, it has been found that the intensity of the esr signal from the adsorbed species is decreased by a hydrogen reduction treatment of the catalyst6'10-13 and also (to a varying degree) by base exchange.7'9’11'13'14 In addition, the number of paramagnetic entities per unit surface area is approximately equal to the number of surface sites active in the generation of carbonium ions.16
Little attention has been given to some of the aberrant features observed in the esr spectra of these 1 2 3 4 5 6 7 8 9 10 11 12 13 14 15
(1) D. Bijl, H . Kainer, and A. C. Rose-Innes, Nature, 174, 830 (1954).(2) G. A. Olah in “ Friedel-Crafts and Related Reactions,” Vol. 1, G. A. Olah, Ed., Interscience Publishers, Inc., New Y ork, N. Y ., 1963, p 201.(3) Cf. H . H . Voge in “ Catalysis,” Vol. 6, P. P. Emmett, Ed., Reinhold Publishing Corp., New York, N. Y ., 1958, p 407.(4) M . Okuda and T . Tachibana, Bull. Chem. Soc. Ja-pan, 33, 863 (1960).(5) R . M . Roberts, C. Barter, and H . Stone, J. Phys. Chem., 63, 2077 (1959).(6) W . K . Hall, J. Catalysis, 1, 53 (1962).(7) A . Terenin, Y . Barachevsy, E . K otov , and V . Kalm ogarov, Spectrochim. Acta, 19, 1797 (1963).(8) J. J. Rooney and R . C. Pink, Proc. Chem. Soc., 70 (1961); Trans. Faraday Soc., 58, 1632 (1962).(9) D . M . Brouwer, Chem. Ind. (London), 177 (1961); J. Catalysis, 1 ,372 (1962).(10) J. K . Fogo, J. Phys. Chem., 65, 1919 (1961).(11) H. Imai, Y . Ono, and T . Keii, ibid., 69, 1082 (1965).(12) F . R . Dollish and W . K . Hall, ibid., 69, 4402 (1965).(13) B. D . Flockhart and R . C. Pink, J. Catalysis, 4 , 90 (1965).(14) R . P . Porter and W . K . Hall, ibid., 5, 366 (1966).(15) See ref 8 and 9; also see A . E. Hirschler and J. O. Hudson, ibid., 3 , 239 (1964); A. E. Hirschler, ibid., 5, 390 (1966).
Volume 71, Number 3 February 1967
634 G. M. M uha
surface-generated radicals. In this and in the following papers of this series,16 this aspect of the problem will be considered. It will be seen that by disentangling some of the physical and chemical interactions that manifest themselves in the line-width variations, exchange effects, and line shifts observed in these spectra, information concerning the nature of the surface interactions in this catalyst system can be obtained. Thus, in this paper, attention is directed to perylene and an analysis of the effects of the counterion on its esr spectrum. In II, a study is made of chemical- and electron- exchange effects as exhibited in the anthracene spectrum. In III, a measure of the oxidation strength of the electrophilic sites on this catalyst surface is given along with a discussion of the significance of the results of I and II to the theory of the action of this catalyst. Finally in IV, a discussion of the line-width effects in the spectra of methyl- substituted anthracenes is given which further illus- strates some aspects of the nature of adsorption on this surface.
Experimental Section
Esr Spectrometer. X-Band spectra were obtained with a Strand Model 600 spectrometer equipped with a Varían V-4531 variable-temperature cavity. The modulation amplitude and microwave power level were set below the point at which line broadening or saturation effects could be observed in the recorded spectrum. A lock-in reference frequency of 6 kHz and a field modulation frequency of either 6 or 3 kHz were used. The latter frequency was used for second-derivative presentation, the former for first-derivative presentation. When a second-derivative presentation was used, a multisection filter was placed between the modulation amplifier and the modulation coils to reduce the line distortion from a small admixture of the first- derivative signal.17
“ Line-sharpened” spectra18 were recorded by using a modulation wave form consisting of a superposition of three odd-harmonic frequencies.19 In our instrument, these frequencies were 6, 2, and 1.2 kHz.
Spectrum Calibration. The magnetic field was calibrated with a Harvey Wells F502 nmr gaussmeter, the frequency of which was monitored by a Hewlett- Packard 524C frequency counter. The g values were obtained by comparison with a diphenylpicryl- hydrazil (DPPH) sample (g = 2.0036) sealed in a capillary and placed concentric with and internal to the sample tube. The spin concentration was measured relative to the signal from a Cr3+-doped ruby sample securely mounted inside the microwave cavity and oriented so as to give a single line in a region (ca. g =
4) not overlapping the sample line.20 The comparison of the microwave susceptibility per gram of sample and the ruby standard was made on the basis of the integrated area obtained by doubly integrating the first-derivative curve. The reproducibility of this type of measurement is estimated as ±10% . The conversion of the relative spin concentration to absolute units was made by calibrating the ruby standard in terms of known weights of DPPH and CuS0 i -5H20. The absolute measurements are estimated to be correct within ±60% . For quantitative measurements on those adsorbed aromatics exhibiting hyperfine structure, the modulation amplitude was deliberately raised to a level such that a single modulation-broadened line was obtained in the recorded spectrum.21
Chemicals. The aromatics, deuterated aromatics, and solvents used in this study were obtained from commercial suppliers. Some were repurified before use and all were checked for decomposition or other impurities by suitable physical techniques. In addition, in those aromatic systems permitting, the esr spectrum of the sulfuric acid generated radical cation was examined for spurious lines. All deuterated aromatics were found to be at least 96 atom % deuterium as determined by mass spectroscopy.22 Solvents were stored for 24 hr over “ activated” silica- alumina (see below) prior to use.
Catalyst. The catalyst samples used in this study were taken from the same lot of an American Cyan- amid Aerocat AAA silica-alumina cracking catalyst containing ca. 22% AI2O3. Organic contaminants were removed by heating in air for 24 hr at 500°.
The catalyst samples were “ activated” by heating the decontaminated material in the esr tube at 500° in either an air or a hydrogen atmosphere. When activated in air, the samples were heated for 2 hr in an open- ended tube and then sealed (while still hot) with a tight- fitting rubber septum cap. A solution of the aromatic was introduced through the septum by means of a hypodermic syringe. Samples heated in a hydrogen atmosphere were similarly treated except the cell was equipped in addition with a stopcock and the
(16) G. M . Muha, J. Phys. Chern., 71, 640 (1967). In the text, these papers will be referred to as II, III , and IV , respectively.(17) J. Gendell, J. H. Freed, and G. K . Fraenkel, J. Chem. Phys., 41, 949 (1964).(18) L. C. Allen, H. M . Gladney, and S. H . Glarum, ibid., 40, 3135 (1964).(19) S. H . Glarum, Rev. Sci. Instr., 36, 771 (1965).(20) L . S. Singer, J. Appl. Phys., 30, 1463 (1959).(21) K . Halbaeh, Phys. Rev., 119, 1230 (1960); J. S. H yde and H. W . Brown, J. Chem. Phys., 37, 368 (1962).(22) The mass spectral analyses o f these com pounds were kindly performed by Dr. Theresa M ao.
The Journal of Physical Chemistry
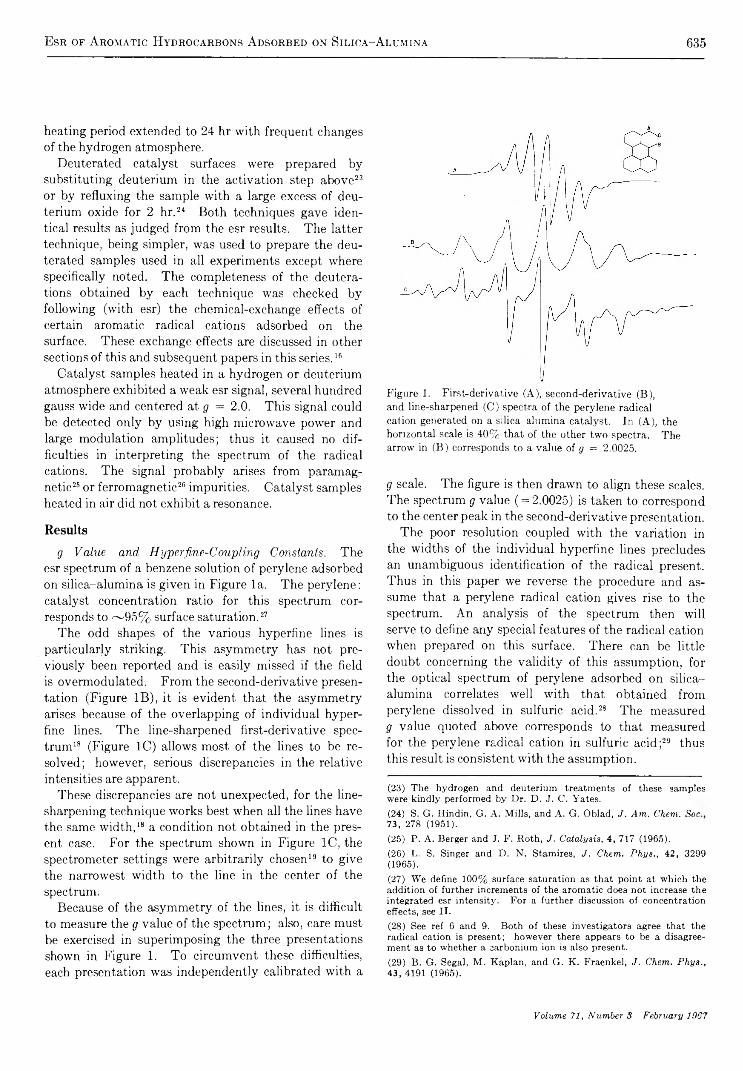
Esr of A romatic Hydrocarbons Adsorbed on Silica-A lumina 635
heating period extended to 24 hr with frequent changes of the hydrogen atmosphere.
Deuterated catalyst surfaces were prepared by substituting deuterium in the activation step above23 or by refluxing the sample with a large excess of deuterium oxide for 2 hr.24 25 Both techniques gave identical results as judged from the esr results. The latter technique, being simpler, was used to prepare the deuterated samples used in all experiments except where specifically noted. The completeness of the deutera- tions obtained by each technique was checked by following (with esr) the chemical-exchange effects of certain aromatic radical cations adsorbed on the surface. These exchange effects are discussed in other sections of this and subsequent papers in this series.16
Catalyst samples heated in a hydrogen or deuterium atmosphere exhibited a weak esr signal, several hundred gauss wide and centered at g = 2.0. This signal could be detected only by using high microwave power and large modulation amplitudes; thus it caused no difficulties in interpreting the spectrum of the radical cations. The signal probably arises from paramagnetic26 or ferromagnetic26 impurities. Catalyst samples heated in air did not exhibit a resonance.
Resultsg Value and Hyperfine-Coupling Constants. The
esr spectrum of a benzene solution of perylene adsorbed on silica-alumina is given in Figure la. The perylene: catalyst concentration ratio for this spectrum corresponds to -~95% surface saturation.27
The odd shapes of the various hyperfine lines is particularly striking. This asymmetry has not previously been reported and is easily missed if the field is overmodulated. From the second-derivative presentation (Figure IB), it is evident that the asymmetry arises because of the overlapping of individual hyperfine lines. The line-sharpened first-derivative spectrum18 (Figure 1C) allows most of the lines to be resolved; however, serious discrepancies in the relative intensities are apparent.
These discrepancies are not unexpected, for the line- sharpening technique works best when all the lines have the same width,18 a condition not obtained in the present case. For the spectrum shown in Figure 1C, the spectrometer settings were arbitrarily chosen19 to give the narrowest width to the line in the center of the spectrum.
Because of the asymmetry of the lines, it is difficult to measure the g value of the spectrum; also, care must be exercised in superimposing the three presentations shown in Figure 1. To circumvent these difficulties, each presentation was independently calibrated with a
Figure 1. F irst-derivative (A ), second -derivative (B ), and line-sharpened (C ) spectra o f the perylene radical cation generated on a silica -a lum ina catalyst. In (A ), the horizontal scale is 4 0 % that of the other tw o spectra. T h e arrow in (B ) corresponds to a value of g = 2.0025.
g scale. The figure is then drawn to align these scales. The spectrum g value ( = 2.0025) is taken to correspond to the center peak in the second-derivative presentation.
The poor resolution coupled with the variation in the widths of the individual hyperfine lines precludes an unambiguous identification of the radical present. Thus in this paper we reverse the procedure and assume that a perylene radical cation gives rise to the spectrum. An analysis of the spectrum then will serve to define any special features of the radical cation when prepared on this surface. There can be little doubt concerning the validity of this assumption, for the optical spectrum of perylene adsorbed on silica- alumina correlates well with that obtained from perylene dissolved in sulfuric acid.28 The measured g value quoted above corresponds to that measured for the perylene radical cation in sulfuric acid;29 thus this result is consistent with the assumption.
(23) The hydrogen and deuterium treatments of these samples were kindly performed b y Dr. D . J. C. Yates.(24) S. G. Hindin, G. A . M ills, and A . G. Oblad, J. Am. Chem. Soc 73, 278 (1951).(25) P. A . Berger and J. F. Roth, J. Catalysis, 4 , 717 (1965).(26) L. S. Singer and D . N. Stamires, J. Chem. Phys., 42, 3299 (1965).(27) W e define 100% surface saturation as that point at which the addition of further increments of the aromatic does not increase the integrated esr intensity. For a further discussion of concentration effects, see II.(28) See ref 6 and 9. Both o f these investigators agree that the radical cation is present; however there appears to be a disagreement as to whether a carbonium ion is also present.(29) B . G. Segal, M . Kaplan, and G. K . Fraenkel, J. Chem. Phys., 43, 4191 (1965).
Volume 71, Number S February 1967
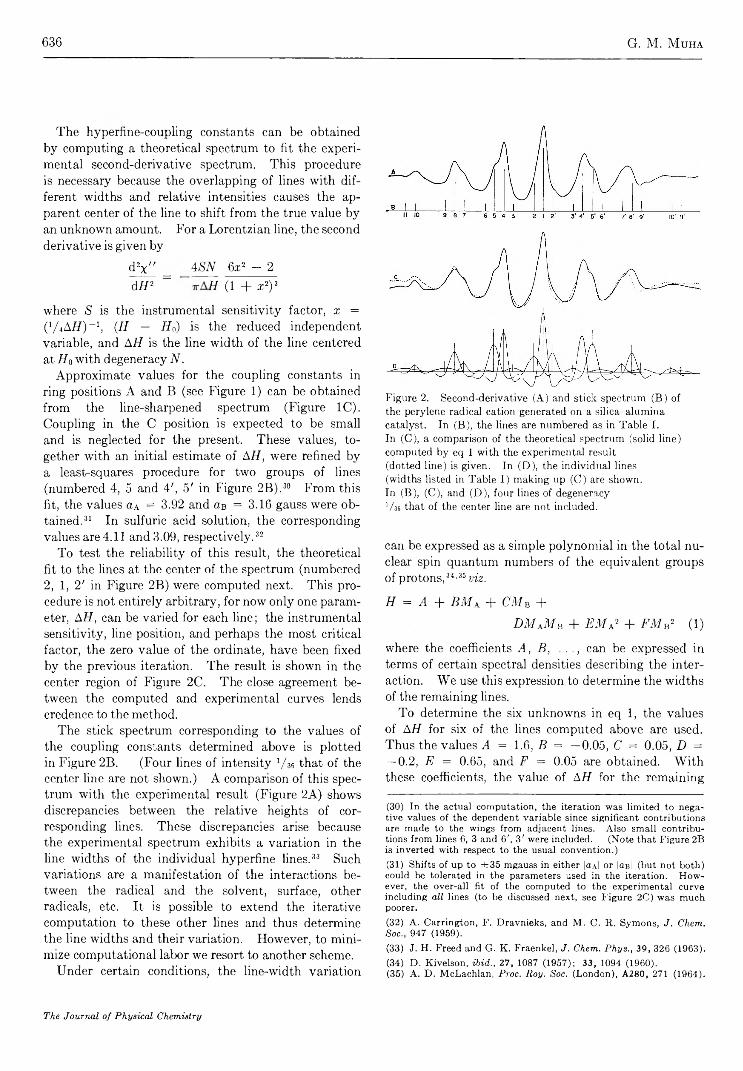
636 G. M. M uha
The hyperfme-coupling constants can be obtained by computing a theoretical spectrum to fit the experimental second-derivative spectrum. This procedure is necessary because the overlapping of lines with different widths and relative intensities causes the apparent center of the line to shift from the true value by an unknown amount. For a Lorentzian line, the second derivative is given by
d2x " _ TSW 6z2 - 2di p ~ h (i + x 2y
where S is the instrumental sensitivity factor, x = ( V iA H ) - 1 , (H — Ho) is the reduced independent variable, and AH is the line width of the line centered at H 0 with degeneracy N.
Approximate values for the coupling constants in ring positions A and B (see Figure 1) can be obtained from the line-sharpened spectrum (Figure 1C). Coupling in the C position is expected to be small and is neglected for the present. These values, together with an initial estimate of AH, were refined by a least-squares procedure for two groups of lines (numbered 4, 5 and 4', 5' in Figure 2B).30 From this fit, the values a a = 3.92 and as = 3.16 gauss were obtained.31 In sulfuric acid solution, the corresponding values are 4.11 and 3.09, respectively.32
To test the reliability of this result, the theoretical fit to the lines at the center of the spectrum (numbered 2, 1, 2' in Figure 2B) were computed next. This procedure is not entirely arbitrary, for now only one parameter, AH, can be varied for each line; the instrumental sensitivity, line position, and perhaps the most critical factor, the zero value of the ordinate, have been fixed by the previous iteration. The result is shown in the center region of Figure 2C. The close agreement between the computed and experimental curves lends credence to the method.
The stick spectrum corresponding to the values of the coupling constants determined above is plotted in Figure 2B. (Four lines of intensity 1/M that of the center line are not shown.) A comparison of this spectrum with the experimental result (Figure 2A) shows discrepancies between the relative heights of corresponding lines. These discrepancies arise because the experimental spectrum exhibits a variation in the line widths of the individual hyperfine lines.33 Such variations are a manifestation of the interactions between the radical and the solvent, surface, other radicals, etc. It is possible to extend the iterative computation to these other lines and thus determine the line widths and their variation. However, to minimize computational labor we resort to another scheme.
Under certain conditions, the line-width variation
Figure 2. Second-derivative (A ) and stick spectrum (B ) o f the perylene radical cation generated on a silica -a lum ina catalyst. In (B ), the lines are num bered as in T a b le I.In (C ), a com parison o f the theoretical spectrum (solid line) com pu ted b y eq 1 w ith the experim ental result (dotted line) is given . In (D ), the individual lines (w idths listed in T ab le I ) m aking up (C ) are shown.In (B ), (C ), and (D ), four lines o f degeneracy V sb that o f the center line are n ot included.
can be expressed as a simple polynomial in the total nuclear spin quantum numbers of the equivalent groups of protons,34 35'36 viz.
H = A + BM a + CMb +DMaMb + EM a2 + M b 2 (1)
where the coefficients A, B, .. ., can be expressed in terms of certain spectral densities describing the interaction. We use this expression to determine the widths of the remaining lines.
To determine the six unknowns in eq 1, the values of AH for six of the lines computed above are used. Thus the values A = 1.6, B = —0.05, C = 0.05, D = — 0.2, E = 0.65, and F = 0.05 are obtained. With these coefficients, the value of AH for the remaining
(30) In the actual computation, the iteration was limited to negative values o f the dependent variable since significant contributions are made to the wings from adjacent lines. A lso small contributions from lines 6, 3 and 6 ', S' were included. (N ote that Figure 2B is inverted with respect to the usual convention.)(31) Shifts o f up to ± 3 5 mgauss in either |«a | or |o-b| (but not both) could be tolerated in the parameters used in the iteration. H ow ever, the over-all fit o f the com puted to the experimental curve including all lines (to be discussed next, see Figure 2C) was m uch poorer.(32) A . Carrington, F . Dravnieks, and M . C . R . Symons, J. Chem. Soc., 947 (1959).(33) J. H . Freed and G. K . Fraenkel, J. Chem. Phys., 39, 326 (1963).(34) D . Kivelson, ibid., 27, 1087 (1957); 33, 1094 (1960).(35) A . D . M cLachlan, Proc. Roy. Soc. (London), A280, 271 (1964).
The Journal of Physical Chemistry
Esr of Aromatic Hydrocarbons Adsorbed on Silica-A lumina 637
lines can be computed. A summary of the results is given in Table I. The resulting calculated spectrum is given in Figure 2C and the individual line shapes are shown in Figure 2D.36
T a b le I : R esults o f th e L in e -W id th D eterm ination
.----Line iLeast-
rvidth---- .Line Degen square Fromno.“ M a M b eracy fit eq 111 -2 -1 4 3.910 -1 -2 4 2.09 -2 0 6 4.38 -1 -1 16 2.17 0 —2 6 1.76 -2 1 4 4.85 -1 0 24 2.34 0 -1 24 1.63 1 —2 4 2.72 -1 1 16 2.61 0 0 36 1.62' 1 -1 16 2.33' -1 2 4 3.04' 0 1 24 1.75' 1 0 24 2.26' 2 -1 4 4.57' 0 2 6 1.98' 1 1 16 2.19' 2 0 6 4.1
10' 1 2 4 2.111' 2 1 4 3.8
“ T h e num bering o f the lines is show n in F igure 2B . F ou r lines o f unit degeneracy are n o t included.
The over-all fit of the computed to the experimental curve is quite satisfactory except for the misalignment of the base line of the computed curve at high and low field and the overestimation of the region in the vicinity of line 8'. However, eq 1 certainly is an adequate first approximation with which to discuss the nature of the interactions giving rise to the line-width variations.
Effect of Solvents and the Aromatic Concentration. Within the interval 25-95% surface saturation,27 the spectral resolution, line-width variation, and coupling constants are not appreciably changed by the perylene: catalyst concentration ratio nor the choice of solvent. In the present experiments, carbon disulfide, carbon tetrachloride, hexane, benzene, and perdeu- teriobenzene were used as solvent.
Below 25% surface saturation, the signal-to-noise ratio of the spectrum degrades to such an extent that the second-derivative presentation is of marginal value in the direct measurement of the coupling con
stants; the first-derivative presentation, however; still exhibits the asymmetry noted above.
It is likely that even below 25% surface saturation, the solvents have little effect on the line widths or coupling constants, for it is possible to obtain resolved hyperfine spectra without the use of a solvent by distilling the aromatic, in vacuo, onto the surface of the catalyst.7'10 This method of preparation was not used in the present study since it was found that the mixing between the aromatic and the catalyst was nonuniform at the higher concentration levels and interradical- exchange effects became important (see II). At the lower concentration levels, the signal-to-noise ratio was poor and the second-derivative presentation could not be used. However, the first-derivative spectrum again exhibited asymmetry.
It is possible to remove the solvent by a vacuum- manipulation technique after the radicals have been formed. In this case, the same coupling constants and line-width variation are obtained as reported above. However, it is not possible to demonstrate that all of the solvent has been removed, and for this reason arguments concerning solvent effects based on this technique are not entirely convincing.
Temperature Effects. The appearance of the esr spectrum is essentially unchanged within the temperature interval defined by the boiling and freezing points of the particular solvent used. As the temperature is lowered below the freezing point of the solvent, the hyperfine lines quickly broaden, and at 77°K only a faint trace of the hyperfine structure remains. Anisotropy in the g tensor (as exhibited in a glass average) is too small an effect to account for this residual structure.
DiscussionHyperfine-Coupling Constants. In the preceding
section, it was noted that the hyperfine-coupling constants are shifted ~ 4 % from the values observed in sulfuric acid. In the present section we wish to consider the possibility that this shift is caused by a modulation of the isotropic magnetic interactions. This type of modulation effect can arise from internal vibrations and rotations as well as fluctuating solvent or counterion complexes with the radical cation.83
It is difficult to get an accurate quantitative estimate of the magnitude of the shift, for it is known that when line-width effects are large, static and dynamic frequency shifts37 must be considered.
(36) In summing the contributions from the individual lines that combine to form Figure 2C, it is necessary to adopt some cutoff procedure concerning the wings o f the line. For this purpose, the wings were truncated at the point at which they contribute less than 10% to the peak of the next adjacent line.(37) G. K . Fraenkel, J. Chem. Phys., 42, 4275 (1965).
Volume 71, Number S February 1967
638 G. M. M uha
For [<z b [ , the measured shift is ^0.12 gauss,31 a value two orders of magnitude too large as estimated from a simple second-order calculation,38 The complete theory of the shift37 is too complex to be applied to the present problem, and since the contribution from this type of correction appears to be small, it will be neglected. In this connection we note that in the case of anthracene (see II) and 9,10-dimethylan- thracene (see IV), shifts in the values of the larger coupling constants are again observed, but corrections due to static and dynamic effects are shown to be small. This point can be established with reasonable precision from the spectra of partially deuterated molecules.
Coupling-constant shifts of a similar magnitude have been observed for the protons in the anthracene radical anion generated by electrolytic39 and alkali metal reduction40 and in various radical cations prepared in antimony trichloride41 and pentahalide42 solvents. Much larger effects are observed in radicals having polar substituent groups.43,44
The effect is ascribed (in the case of alternant aromatic hydrocarbons) to a redistribution of the tr- electron density caused by fluctuation solvent complexes43 or an electrostatic perturbation due to the counterion.40 An explanation based on the latter mechanism is the more plausible for the present system since, as noted above, it is possible to prepare the radical cation in the absence of solvent. Thus the surface (he., the counterion) interaction must be the major cause of the isotropic modulation effects.
In principle, it should be possible to demonstrate a dependence of the magnitude of the coupling constant on temperature, concentration, and solvent.40 In the case of a solid catalyst system this is not practical, for in addition to the handicap of poor resolution, the “ counterion concentration” is fixed by the choice of catalysts46 and the surface heterogeneities lead to local concentration fluctuations (see II). Indeed, one of the more striking observations concerning the experiments with any of the aromatics studied16 is that the line-width variation and coupling constants are sensibly invariant over the range 25-95% surface saturation. This result suggests that the radical-counterion interactions are a major effect in these catalyst systems.
Shifts in the magnitude of a coupling constant can be understood in terms of a model involving a dissociative equilibrium between the radical-counterion complex and the individual components.43 In the complex the value of the coupling constant will differ from that in the uncomplexed “ free” radical. The experimental value is the average of these two values each weighted by the lifetime of the respective species.
Unfortunately, data are not available to allow an estimate of the lifetimes nor the coupling constant for the complexed and “ free” perylene radical cation. However consider the electrostatic perturbation approach.40 As determined experimentally, the magnitude of a.\ decreases while that of <xb increases. Thus the 7r-electron distribution is modified to increase the average charge density in the center of the molecule. (We use the Huckel approximation and thus the electronic density is proportional to the spin density.) Presumably then, the time-average location of the counterions is over the center of the molecule as would be required for the electrostatic perturbation to be effective.40
Therefore, when compared to the coupling constants measured in sulfuric acid, the silica-alumina results indicate that either the counterion has a closer distance of approach or, more probably, the complex has a longer lifetime. If the counterion were relatively immobile compared to its counterpart in solution, line- width effects would be more pronounced than experimentally observed. The question of the counterion mobility is considered again briefly in the next section and more fully in III.
If the counterion is paramagnetic, the lifetime of the complex must be shorter than the inverse of the hyper- fine splitting to preclude the possibility of quantum mechanical exchange broadening.35,46 Thus the lifetime would be shorter than 10-7 sec. If the lifetime of the complex could be lengthened by lowering the temperature, it might be possible to observe AM =1,2 transitions47 in a triplet complex similar to that observed in ketyl systems.48 As noted earlier, only the broad line due to the radical cation is observed and the fact that a faint trace of structure is still visible at 77°K indicates that some surface mobility is retained even at this temperature.
(38) R. W . Fessenden, J. Chem. Phys., 37, 747 (1962).(39) J. R . Bolton and G. K . Fraenkel, ibid., 40, 3307 (1964),(40) A . H . Reddoch, ibid., 43, 225 (1965).(41) E. C. Baughan, T . P. Jones, and L. G. Stoodley, Proc. Chem. Soc., 274 (1963).(42) I. C. Lewis and L. S. Singer, J. Chem. Phys., 43, 2712 (1965).(43) J. G. Gendell, J. H. Freed, and G. K . Fraenkel, ibid., 37, 2832 (1962).(44) P. Ludwig, T . Layloff, and R. N. Adams, J. Am. Chem. Soc., 86, 4568 (1964).(45) The counterion concentration apparently depends on the oxidation potential of the aromatic used. A discussion o f this effect is given in III .(46) J. D . Currin, Phys. Rev., 126, 1995 (1962).(47) J. H . van der Waals and M . S. Groot, Mol. Phys., 2 , 333 (1959).(48) N. Hirota and S. I. Weissman, J. Am. Chem. Soc., 86, 2538 (1964).
The Journal of Physical Chemistry

Esr of Aromatic Hydrocarbons Adsorbed on Silica-A lumina 639
If the counterion is diamagnetic, again a relative motion within the complex can give rise to a shift in the coupling constant,49 but in this case the result of the present experiment does not permit an estimate of the lifetime of the complex.
Line-Width Effects. In the preceding discussion only the isotropic modulation effects introduced by the relative motion of the counterion with respect to the radical cation were considered. More generally, it is necessary to consider other perturbations in addition, e.g., internal vibrations, random molecular tumbling, exchange interactions, etc. Each of these introduces a fluctuating time-dependent force on the spin system and thus results in a modulation of both the isotropic and anisotropic magnetic parameters. These modulation effects manifest themselves in a line-width variation among the different hyperfine lines of the esr spectrum.
The complete theory of the effect33 is too complex to apply to the present data. Thus in the following, an approximate analysis36 is used to estimate the effects arising from the anisotropic hyperfine interaction and the anisotropic part of the g tensor. Exchange and counterion effects are considered as an afterthought. The treatment is crude, for it assumes an arbitrary separation of the different contributions to the line width; nevertheless the agreement is quite remarkable.
In eq 1, an expression is given which describes the line widths in terms of the resultant nuclear spin quantum numbers of the individual groups of equivalent nuclei. A similar equation can be derived theoretically36 in which the average line width (T2_1) of each hyperfine line is evaluated in terms of the inner product of the anisotropic hyperfine and g tensors. The result is60-52
(JTt)-1 = K - m m A + 2138Mb +306MC - 1490MaM b - 212MAM C -
103MbMc + 3S00Ma2 + 10Mb2 + 0.7MC2 (2)
where
J = (4J0 + 3Ji) (60 X 10-12) “ 1
K = 6370(7Jo + 10Ji)(4J0 + S J i ) - ' - 2075
and J0 and Ji are the spectral densities of the interactions at zero and the microwave frequency, respectively.
Equation 2 shows that terms involving Me make a minimal contribution to the line widths, a result which follows from the small coupling constant in this position. This result presumably accounts for the success in the attempted fit between the computed
and experimental spectrum (Figure 2C) even though Me was neglected.
A comparison of eq 1 and 2 shows that the signs of the various terms53 are correctly predicted. The relative magnitude of the corresponding coefficients, however, exhibit considerable disagreement.54 55 Such a result is not surprising, for in addition to errors introduced through approximations inherent in the theory and in the calculation of the tensor components, the above treatment considers only the anisotropic effects. Line-width effects also arise from isotropic modulation43 and exchange effects;46 to a first approximation both of these contributions give rise to a variation that is symmetrical about the center of the spectrum and thus contribute to K and quadratic terms in M. (Other relaxation mechanisms also contribute to K that are independent of M.65)
These factors notwithstanding, it is possible to obtain an order of magnitude agreement between the larger coefficients in eq 1 and 2 if spectral densities corresponding to a correlation time of ~ 1 0 -9 sec are chosen; this value is comparable to that found for radicals in solution.35 Such a result, coupled with the correct prediction of the signs of the coefficients, indicates that the theory gives adequate agreement with experiment and, therefore, at least the principal features of the interaction are correctly described.
Such a result is quite remarkable, for on first viewing, the poor resolution and exaggerated line-width effects would suggest that a relaxation theory designed for radicals in solution might require major modification before it was applied to the problem of radicals on a surface, That such is not the case suggests that the radical cation is quite unrestricted in its movements (as opposed to being bound to a fixed catalytically active site on the surface). By implication then, the counterion may also be mobile since counterion effects are important to the description of the shift in the magnitude of the coupling constants. Such a picture
(49) E. de Boer and E. L. Mackor, J. Am. Chem. Soc., 86,1513 (1964).(50) The anisotropic hyperfine tensor is obtained from the measured coupling constant51 using Q — 23. The components o f the anisotropic g tensor are obtained from theoretical considerations.52 Throughout the calculation, the microwave frequency is taken to be 9200 mHz.(51) H . M . M cConnell and J. Strathdee, Mol. Phys2, 129 (1959).(52) A . J. Stone, ibid., 7, 311 (1964).(53) The signs of the coupling constant in positions A and B are the same and opposite to that in position C. See E. de Boer and E. L. M ackor, ibid., 5, 493 (1962).(54) It has been reported that this theory also accounts for the line- width effects observed in the perylene-sulfuric acid system ;35 however a numerical evaluation of the terms was not given. Also the experimental data on the solution line widths have not been published; thus a comparison with the present results is not possible.(55) P . W . Atkins and D . Kivelson, J. Chem. Phys., 44, 169 (1966).
Volume 71, Number 8 February 1967
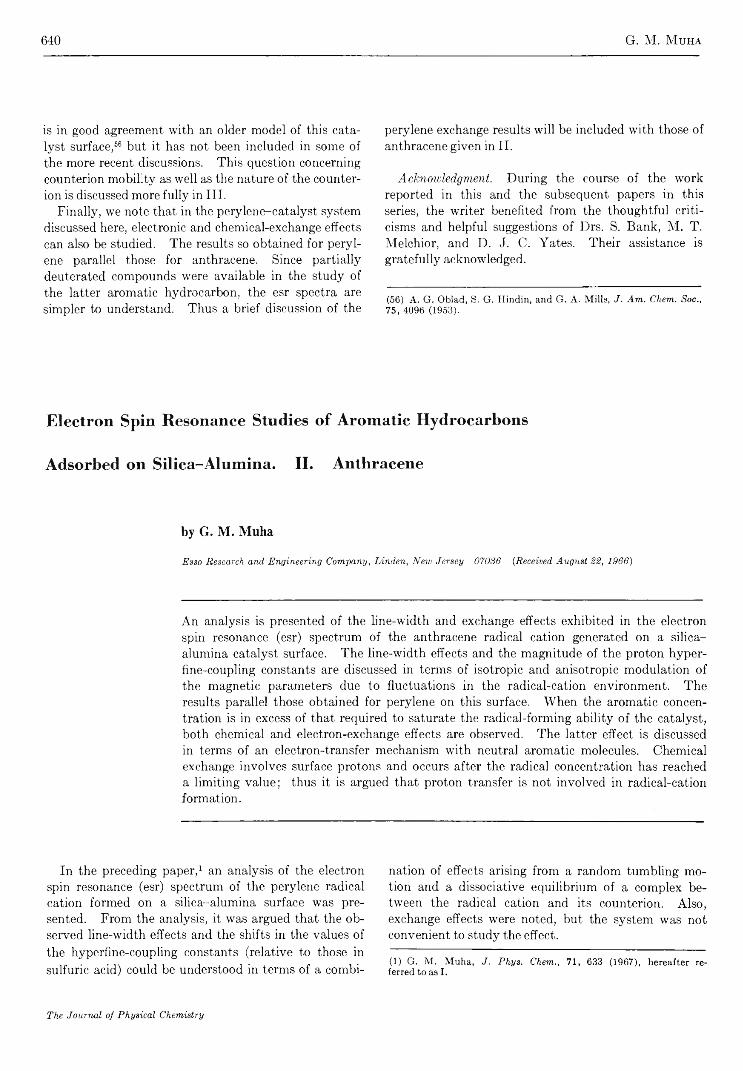
640 G. M. Muha
is in good agreement with an older model of this catalyst surface,56 but it has not been included in some of the more recent discussions. This question concerning counterion mobility as well as the nature of the counterion is discussed more fully in III.
Finally, we note that in the perylene-catalyst system discussed here, electronic and chemical-exchange effects can also be studied. The results so obtained for peryl- ene parallel those for anthracene. Since partially deut.erated compounds were available in the study of the latter aromatic hydrocarbon, the esr spectra are simpler to understand. Thus a brief discussion of the
perylene exchange results will be included with those of anthracene given in II.
Acknowledgment. During the course of the work reported in this and the subsequent papers in this series, the writer benefited from the thoughtful criticisms and helpful suggestions of Drs. S. Bank, M. T. Melchior, and D. J. C. Yates. Their assistance is gratefully acknowledged.
(56) A. G. Oblad, S. G. Hindin, and G. A. Mills, J. Am. Chem. Soc.,75, 4096 (1953).
Electron Spin Resonance Studies of Aromatic Hydrocarbons
Adsorbed on Silica-Alumina. II. Anthracene
by G. M . Muha
Esso Research and Engineering Company, Linden, New Jersey 07036 {Received August 32, 1966)
An analysis is presented of the line-width and exchange effects exhibited in the electron spin resonance (esr) spectrum of the anthracene radical cation generated on a silica- alumina catalyst surface. The line-width effects and the magnitude of the proton hyper- fine-coupling constants are discussed in terms of isotropic and anisotropic modulation of the magnetic parameters due to fluctuations in the radical-cation environment. The results parallel those obtained for perylene on this surface. When the aromatic concentration is in excess of that required to saturate the radical-forming ability of the catalyst, both chemical and electron-exchange effects are observed. The latter effect is discussed in terms of an electron-transfer mechanism with neutral aromatic molecules. Chemical exchange involves surface protons and occurs after the radical concentration has reached a limiting value; thus it is argued that proton transfer is not involved in radical-cation formation.
In the preceding paper,* 75 1 an analysis of the electron spin resonance (esr) spectrum of the perylene radical cation formed on a silica-alumina surface was presented. From the analysis, it was argued that the observed line-width effects and the shifts in the values of the hyperfine-coupling constants (relative to those in sulfuric acid) could be understood in terms of a combi
nation of effects arising from a random tumbling motion and a dissociative equilibrium of a complex between the radical cation and its counterion. Also, exchange effects were noted, but the system was not convenient to study the effect.
(1) G. M . Muha, J. Phys. Chem., 71, 633 (1967), hereafter referred to as I.
The Journal of Physical Chemistry
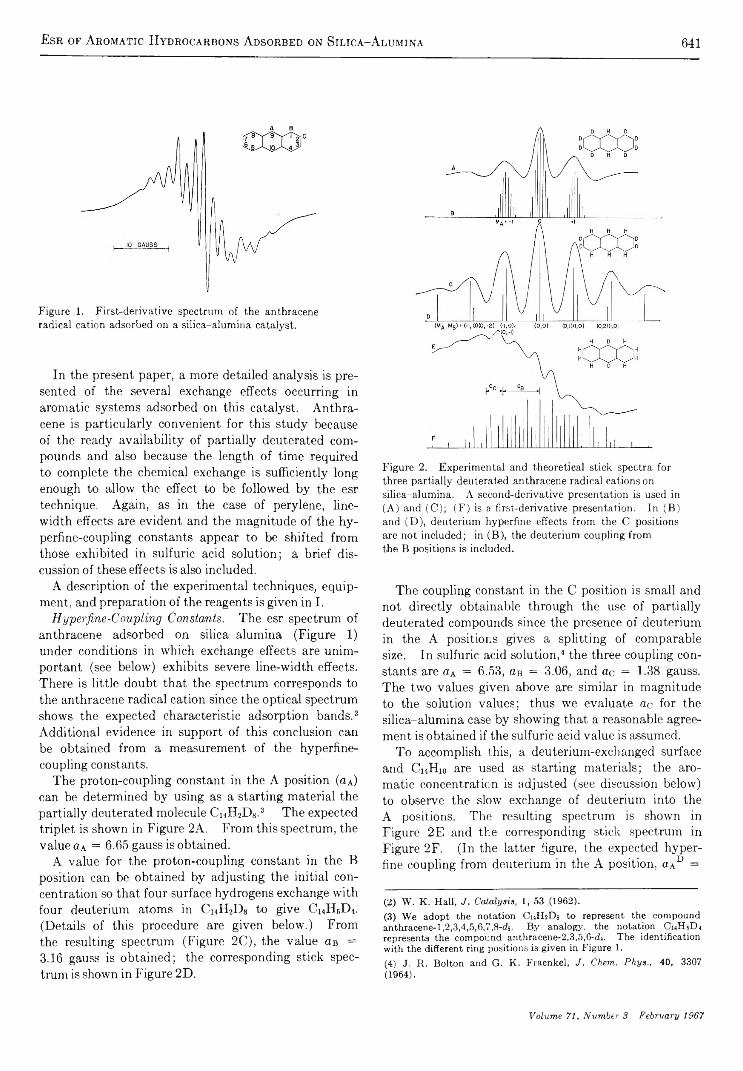
Esr of A romatic Hydrocarbons Adsorbed on Silica-A lumina 641
Figure 1. F irst-derivative spectrum o f the anthracene radical cation adsorbed on a s ilica -a lum ina catalyst.
In the present paper, a more detailed analysis is presented of the several exchange effects occurring in aromatic systems adsorbed on this catalyst. Anthracene is particularly convenient for this study because of the ready availability of partially deuterated compounds and also because the length of time required to complete the chemical exchange is sufficiently long enough to allow the effect to be followed by the esr technique. Again, as in the case of perylene, line- width effects are evident and the magnitude of the hy- perfine-coupling constants appear to be shifted from those exhibited in sulfuric acid solution; a brief discussion of these effects is also included.
A description of the experimental techniques, equipment, and preparation of the reagents is given in I.
Hyper fine-Coupling Constants. The esr spectrum of anthracene adsorbed on silica-alumina (Figure 1) under conditions in which exchange effects are unimportant (see below) exhibits severe line-width effects. There is little doubt that the spectrum corresponds to the anthracene radical cation since the optical spectrum shows the expected characteristic adsorption bands.2 Additional evidence in support of this conclusion can be obtained from a measurement of the hyperfine- coupling constants.
The proton-coupling constant in the A position (aa) can be determined by using as a starting material the partially deuterated molecule Ci4H2D8.3 The expected triplet is shown in Figure 2A. From this spectrum, the value (Za = 6.65 gauss is obtained.
A value for the proton-coupling constant in the B position can be obtained by adjusting the initial concentration so that four surface hydrogens exchange with four deuterium atoms in Ci4H2D8 to give ChH6D4. (Details of this procedure are given below.) From the resulting spectrum (Figure 2C), the value <zb =3.16 gauss is obtained; the corresponding stick spectrum is shown in Figure 2D.
Figure 2. E xperim ental and theoretical stick spectra for three partially deuterated anthracene radical cations on silica-alum ina. A second -derivative presentation is used in (A ) and (C ) ; (F ) is a first-derivative presentation. In (B ) and (D ) , deuterium hyperfine effects from the C positions are n ot included; in (B ), the deuterium coupling from the B positions is included.
The coupling constant in the C position is small and not directly obtainable through the use of partially deuterated compounds since the presence of deuterium in the A positions gives a splitting of comparable size. In sulfuric acid solution,4 the three coupling constants are aA = 6.53, a-e, = 3.06, and ac = 1.38 gauss. The two values given above are similar in magnitude to the solution values; thus we evaluate ac for the silica-alumina case by showing that a reasonable agreement is obtained if the sulfuric acid value is assumed.
To accomplish this, a deuterium-exchanged surface and C14H10 are used as starting materials; the aromatic concentration is adjusted (see discussion below) to observe the slow exchange of deuterium into the A positions. The resulting spectrum is shown in Figure 2E and the corresponding stick spectrum in Figure 2F. (In the latter figure, the expected hyperfine coupling from deuterium in the A position, aAD =
(2) W . K . Hall, J. Catalysis, I , 53 (1962).(3) W e adopt the notation C 14H 2D 8 to represent the compound anthraeene-l,2,3,4,5,6,7,8-da. B y analogy, the notation C « H 6D 4
represents the compound anthracene-2,3,5,6 -di. The identification with the different ring positions is given in Figure 1.(4) J. R . Bolton and G. K . Fraenkel, J. Chem. Phys., 40, 3307 (1964).
Volume 71, Number 3 February 1967

642 G. M. M uha
1.02 gauss, is included.) The agreement is good and thus, in the following, a value of ac = 1.35 gauss will be assumed.
Each of the spectra shown in Figure 2 were independently calibrated with a g scale. The figure is drawn to align these scales. The g value of the spectrum ( = 2.0025) is taken to correspond to the center of the largest peak in the second-derivative presentation shown in Figure 2B. This value is identical with that reported for the anthracene radical cation prepared in sulfuric acid.5
The values cjuoted above for oa and a-e. in the case of silica-alumina appear to differ from the corresponding values in sulfuric acid. It is difficult to determine if this is a real effect, for in the present case, the measurements are made on broad lines and the differences are small. A statistical analysis of the results for five identically prepared samples indicated a mean- square deviation of ±0.06 gauss with the mean values of aA and Ob quoted above. Thus it would appear that the difference is significant.
Corresponding shifts of the same relative magnitude were observed in the perylene radical cation generated on this surface.1 There it was argued that the shifts reflected a difference in the lifetime of the radical- counterion complex, perhaps due to the effect of the catalyst surface. In the anthracene case, the argument can be made somewhat stronger.
The magnitude of a given coupling constant is thought to depend on the electrostatic perturbation of the 7r-electron system due to the presence of the counterion.6 To compare the effect of the counterion then, the shift should be measured relative to the coupling constant of the “ free” or uncomplexed radical. The coupling constant of the free anthracene radical cation is not known;4 however, it has been computed for the radical anion.6 As a first approximation it might be expected that the direction of the shift would be independent of whether the counterion was an anion or a cation. On this basis, the predicted effect of the counterion electrostatic perturbation is to increase |oA[ and |oc| and to decrease |ob|-6 This is the observed shift of the silica-alumina values relative to those in sulfuric acid. Thus the counterion seems to have a larger effect when present on the catalyst surface than in solution— a conclusion analogous to that drawn from the perjdene results.
Line-Width Effects. In Figure 3 a comparison is given between the complete anthracene spectrum and the stick spectrum obtained by using the coupling constants deduced above. A discrepancy between the relative height of corresponding lines in these two spectra is evident. Such a discrepancy can arise if the
Figure 3. S econ d-derivative spectrum and theoretical stick spectrum o f the anthracene radical cation adsorbed on silica-alum ina.
experimental spectrum exhibits a variation in the widths of the individual hyperfine lines; the variation arises from a fluctuating time-dependent interaction at the different proton sites due to internal vibrations, complexes with the counterion and solvent, random molecular tumbling of the radical, exchange phenomena, etc.7
The line-width variation can be understood7 in terms of a modulation of both the isotropic and anisotropic magnetic parameters, again in a fashion analogous to the perylene system.1 In the present case, the spectrum is too complicated to attempt to obtain the line widths by a least-square procedure as was done with perylene; rather we content ourselves with considering an approximate theory involving only the modulation of the anisotropic hyperfine and the anisotropic part of the g tensor.8 In the case of anthracene, the following dependence9-11 of the average line width (T2_1) on the total nuclear magnetic quantum number of the various equivalent proton groups can be derived
(JTi)-1 = 8315K - 7220 + 54804/A2 +23804/b2 + 2684/c2 + 5086M AM B -
11104/A4 /C - 519MbMc - 575.34/A -26914/B + 6634/c
where
J = (4J0 + 3Jj) (60 X 10“ 12) “ 1
K = (7 Jo + 10 J i) (4J o + 3 JO“ 1
(5) B. G. Segal, M . Kaplan, and G. K. Fraenkel, J. Chem. Phys., 43, 4191 (1965).(6) A . H . Reddoch, ibid., 43, 225 (1965).(7) J. H . Freed and G. K. Fraenkel, ibid., 39, 326 (1963).(8) A. D . M cLachlan, Proc. Roy. Soc. (London), A280, 271 (1964).(9) The anisotropic hyperfine tensor is obtained from the coupling constants10 using Q - 23. The components of the anisotropic g tensor are estimated from theory.11 The m icrowave frequency is taken to be 9200 m Hz.(10) H. M . M cConnell and J. Strathdee, Mol. Phys., 2, 129 (1959).(11) A . J. Stone, ibid., 7, 311 (1964).
The Journal of Physical Chemistry
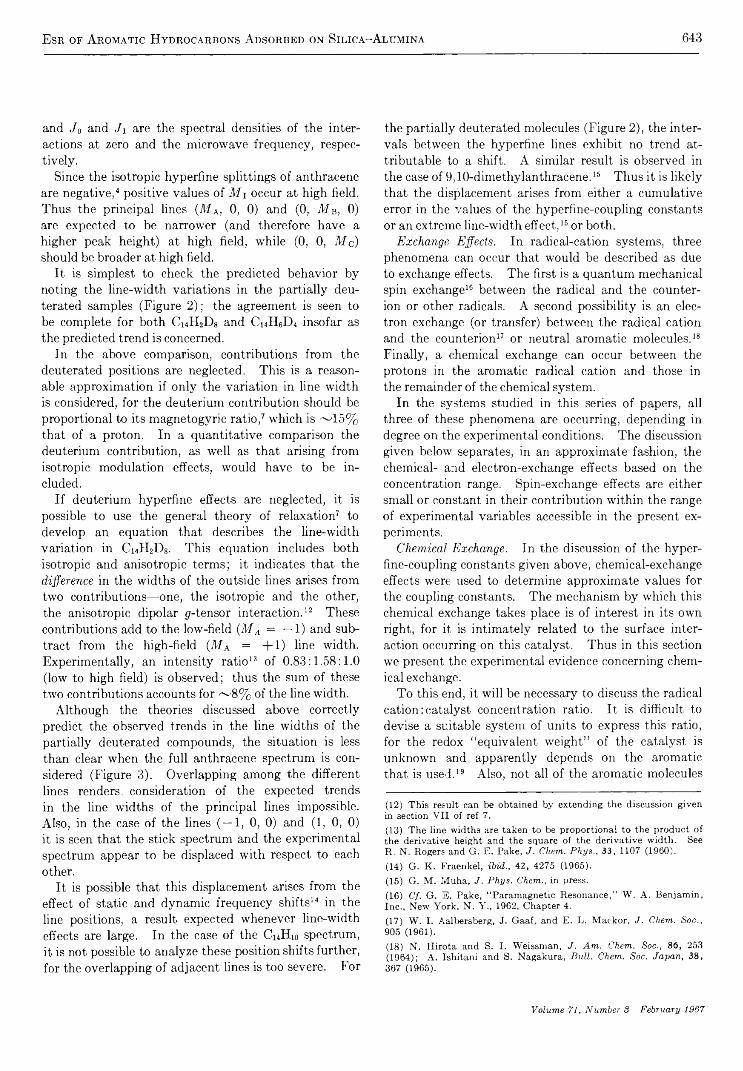
Esr of Aromatic Hydrocarbons Adsorbed on Silica-A lumina 643
and Jo and Ji are the spectral densities of the interactions at zero and the microwave frequency, respectively.
Since the isotropic hyperfine splittings of anthracene are negative,4 positive values of M i occur at high field. Thus the principal lines ( M a , 0, 0) and (0, M b , 0) are expected to be narrower (and therefore have a higher peak height) at high field, while (0, 0, Me) should be broader at high field.
It is simplest to check the predicted behavior by noting the line-width variations in the partially deu- terated samples (Figure 2); the agreement is seen to be complete for both Ci4H2D8 and Ci4H6D4 insofar as the predicted trend is concerned.
In the above comparison, contributions from the deuterated positions are neglected. This is a reasonable approximation if only the variation in line width is considered, for the deuterium contribution should be proportional to its magnetogyric ratio,7 which is ~ 15% that of a proton. In a quantitative comparison the deuterium contribution, as well as that arising from isotropic modulation effects, would have to be included.
If deuterium hyperfine effects are neglected, it is possible to use the general theory of relaxation7 to develop an equation that describes the line-width variation in Ci4H2D8. This equation includes both isotropic and anisotropic terms; it indicates that the difference in the widths of the outside lines arises from two contributions—one, the isotropic and the other, the anisotropic dipolar ¡/-tensor interaction.12 These contributions add to the low-field (MA = —1) and subtract from the high-field (Ma = + 1 ) line width. Experimentally, an intensity ratio13 of 0.83:1.58:1.0 (low to high field) is observed; thus the sum of these two contributions accounts for ~ 8 % of the line width.
Although the theories discussed above correctly predict the observed trends in the line widths of the partially deuterated compounds, the situation is less than clear when the full anthracene spectrum is considered (Figure 3). Overlapping among the different lines renders consideration of the expected trends in the line widths of the principal lines impossible. Also, in the case of the lines ( —1, 0, 0) and (1, 0, 0) it is seen that the stick spectrum and the experimental spectrum appear to be displaced with respect to each other.
It is possible that this displacement arises from the effect of static and dynamic frequency shifts14 15 in the line positions, a result expected whenever line-width effects are large. In the case of the CuHio spectrum, it is not possible to analyze these position shifts further, for the overlapping of adjacent lines is too severe. For
the partially deuterated molecules (Figure 2), the intervals between the hyperfine lines exhibit no trend attributable to a shift. A similar result is observed in the case of 9,10-dimethylanthracene.18 Thus it is likely that the displacement arises from either a cumulative error in the values of the hyperfine-coupling constants or an extreme line-width effect,16 or both.
Exchange Effects. In radical-cation systems, three phenomena can occur that would be described as due to exchange effects. The first is a quantum mechanical spin exchange16 between the radical and the counterion or other radicals. A second possibility is an electron exchange (or transfer) between the radical cation and the counterion17 or neutral aromatic molecules.18 Finally, a chemical exchange can occur between the protons in the aromatic radical cation and those in the remainder of the chemical system.
In the systems studied in this series of papers, all three of these phenomena are occurring, depending in degree on the experimental conditions. The discussion given below separates, in an approximate fashion, the chemical- and electron-exchange effects based on the concentration range. Spin-exchange effects are either small or constant in their contribution within the range of experimental variables accessible in the present experiments.
Chemical Exchange. In the discussion of the hyperfine-coupling constants given above, chemical-exchange effects were used to determine approximate values for the coupling constants. The mechanism by which this chemical exchange takes place is of interest in its own right, for it is intimately related to the surface interaction occurring on this catalyst. Thus in this section we present the experimental evidence concerning chemical exchange.
To this end, it will be necessary to discuss the radical cation:catalyst concentration ratio. It is difficult to devise a suitable system of units to express this ratio, for the redox “ equivalent weight” of the catalyst is unknown and apparently depends on the aromatic that is used.19 Also, not all of the aromatic molecules
(12) This result can be obtained by extending the discussion given in section V II of ref 7.(13) The line widths are taken to be proportional to the product of the derivative height and the square of the derivative width. See R . N. Rogers and G. E. Pake, J. Chem. Phys.. 33, 1107 (1960).(14) G. K . Fraenkel, ibid., 42, 4275 (1965).(15) G. M . Muha, J. Phys. Chem., in press.(16) Cf. G. E. Pake, “ Paramagnetic Resonance,” W . A . Benjamin, Inc., New York, N. Y ., 1962, Chapter 4.(17) W . I. Aalbersberg, J. Gaaf, and E. L. M ackor, ./. Chem. Soc., 905 (1961).(18) N . Hirota and S. I. Weissman, J. Am. Chem. Soc., 86, 253(1964); A . Ishitani and S. Nagakura, Bull. Chem. Soc. Japan, 38, 367 (1965).
Volume 71, Number 3 February 1967
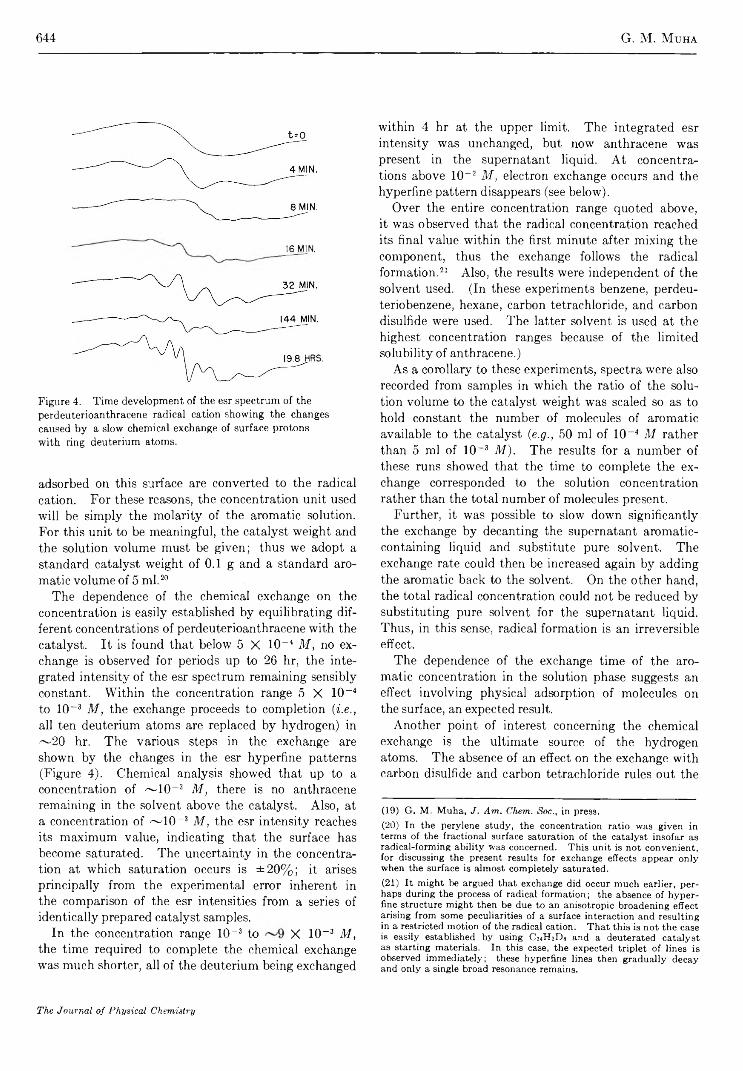
644 G. M. Muha
16 MIN.
Figure 4. T im e developm ent o f the esr spectrum o f the perdeuterioanthracene radical cation show ing the changes caused b y a slow chem ical exchange o f surface protons w ith ring deuterium atom s.
adsorbed on this surface are converted to the radical cation. For these reasons, the concentration unit used will be simply the molarity of the aromatic solution. For this unit to be meaningful, the catalyst weight and the solution volume must be given; thus we adopt a standard catalyst weight of 0.1 g and a standard aromatic volume of 5 ml.19 20
The dependence of the chemical exchange on the concentration is easily established by equilibrating different concentrations of perdeuterioanthracene with the catalyst. It is found that below 5 X 10⁻⁴ M, no exchange is observed for periods up to 26 hr, the integrated intensity of the esr spectrum remaining sensibly constant. Within the concentration range 5 X 10~4 to 10 ~3 M, the exchange proceeds to completion (i.e., all ten deuterium atoms are replaced by hydrogen) in ^~20 hr. The various steps in the exchange are shown by the changes in the esr hyperfine patterns (Figure 4). Chemical analysis showed that up to a concentration of ^ lO -3 M, there is no anthracene remaining in the solvent above the catalyst. Also, at a concentration of ^ lO " 3 M, the esr intensity reaches its maximum value, indicating that the surface has become saturated. The uncertainty in the concentration at which saturation occurs is ±20% ; it arises principally from the experimental error inherent in the comparison of the esr intensities from a series of identically prepared catalyst samples.
In the concentration range 10-3 to X 10~3 M, the time required to complete the chemical exchange was much shorter, all of the deuterium being exchanged
within 4 hr at the upper limit. The integrated esr intensity was unchanged, but now anthracene was present in the supernatant liquid. At concentrations above 10~2 M, electron exchange occurs and the hyperfine pattern disappears (see below).
Over the entire concentration range quoted above, it was observed that the radical concentration reached its final value within the first minute after mixing the component, thus the exchange follows the radical formation.21 Also, the results were independent of the solvent used. (In these experiments benzene, perdeu- teriobenzene, hexane, carbon tetrachloride, and carbon disulfide were used. The latter solvent is used at the highest concentration ranges because of the limited solubility of anthracene.)
As a corollary to these experiments, spectra were also recorded from samples in which the ratio of the solution volume to the catalyst weight was scaled so as to hold constant the number of molecules of aromatic available to the catalyst (e.g., 50 ml of 10-4 M rather than 5 ml of 10~3 M). The results for a number of these runs showed that the time to complete the exchange corresponded to the solution concentration rather than the total number of molecules present.
Further, it was possible to slow down significantly the exchange by decanting the supernatant aromatic- containing liquid and substitute pure solvent. The exchange rate could then be increased again by adding the aromatic back to the solvent. On the other hand, the total radical concentration could not be reduced by substituting pure solvent for the supernatant liquid. Thus, in this sense, radical formation is an irreversible effect.
The dependence of the exchange time of the aromatic concentration in the solution phase suggests an effect involving physical adsorption of molecules on the surface, an expected result.
Another point of interest concerning the chemical exchange is the ultimate source of the hydrogen atoms. The absence of an effect on the exchange with carbon disulfide and carbon tetrachloride rules out the
(19) G. M . Muha, J. Am. Chem. Soc., in press.(20) In the perylene study, the concentration ratio was given in terms of the fractional surface saturation of the catalyst insofar as radical-forming ability was concerned. This unit is not convenient, for discussing the present results for exchange effects appear only when the surface is almost completely saturated.(21) It might be argued that exchange did occur much earlier, perhaps during the process of radical formation; the absence of hyperfine structure might then be due to an anisotropic broadening effect arising from some peculiarities of a surface interaction and resulting in a restricted m otion o f the radical cation. That this is not the case is easily established by using C hH jD s and a deuterated catalyst as starting materials. In this case, the expected triplet o f lines is observed immediately; these hyperfine lines then gradually decay and only a single broad resonance remains.
The Journal of Physical Chemistry

Esr of A romatic Hydrocarbons A dsorbed on Silica-A lumina 645
solvents as the source. Similarly, full exchange is observed when perdeuterioanthracene is used as a starting material; thus the protons cannot originate from the aromatic molecule. Finally, to rule out solution impurities as a source of the protons, the experiments were repeated with a deuterated surface and perdeuterioanthracene dissolved in benzene and also perdeuteriobenzene. No proton hyperfine was observed within any of the concentration ranges; thus it is concluded that the ultimate source of the hydrogen must be the surface.
During the course of these experiments, attempts were made to obtain the spectrum corresponding to one hydrogen atom exchanged into the perdeuterioanthracene rings, i.e., Ci4HD9. All attempts were unsuccessful; the spectrum obtained always corresponded to C14H2D8. At the lowest concentration at which exchange occurs, 5 X 10 ~i M, the conversion of C14D 10 to C14H2D8 requires 20 min; thus it is possible to follow the reaction with esr. At this concentration, the appearance of the first hyperfine lines occurs at ^ 3 min after mixing. The resulting spectrum is shown in Figure 5A. From this spectrum, it is not possible to decide if a doublet (due to C14HD9) or a triplet is observed. That the latter is the case is clearly shown in the corresponding second-derivative spectrum (Figure 5B).
The result is of interest, for it implies that the radical cation is formed first, eventually exchanges one deuterium atom,21 and then, in a length of time that is short compared to that required to accomplish the first exchange, replaces a second deuterium with hydrogen.
To appreciate this argument, consider the possible alternatives. If all the radicals were formed in an identical environment or if the chemical exchange were in some way intimately connected with radical formation, the length of time to effect the first exchange would be roughly the same for all molecules. Most certainly a doublet would have to be observed unless the second exchange followed right after the first, which is the above hypothesis.
Alternatively, consider the radicals to be formed in a number of environments (sites) each with a different length of time required to effect the first exchange. Depending on the distribution in the “ exchange times” involved, a superposition of a doublet and a triplet spectrum with different relative intensities might be expected. The doublet lines would fall between the lines of the triplet; thus five equally spaced lines would be expected. The resolution might be poor, but at least more than three lines should be observed. (For example, see Figure 4 where a superposition of the triplet with hydrogen exchanging in the B position is
Figure 5. F irst- (A ) and second -derivative (B ) presentations o f the initial hyperfine lines that appear in the spectrum of perdeuterioanthracene adsorbed on silica-alum ina.T h e hyperfine lines arise from the chem ical exchange of ring deuterium atom s w ith surface protons.
shown.) The experimental results (Figure 5), however, show only the triplet, hence the above hypothesis.
The fact that the first hyperfine lines occur within 3 min of mixing, but that 20 min is required to complete the exchange in the meso positions, argues that the distribution in “ exchange times” is broad, possibly arising from the heterogeneous nature of the surface. The broad distribution precluded any attempt to measure an isotope effect or to estimate rate constants for the chemical exchange.
In summary then, in this section it has been shown that (1 ) there is no chemical exchange until the surface is nearly saturated in its capacity to generate radicals, (2) the exchange occurs with surface hydrogens (3) at a rate that depends on the concentration of the aromatic in the solution phase, and finally (4) the time required to complete the exchange of a deuterium in the 10 position after the 9 position is exchanged is short compared to the time for the first deuterium to exchange.
The results described here also apply qualitatively to perylene,1 tetracene,19 and methyl-substituted anthracenes15 in respect to the concentration dependence; however, the time to complete the exchange varies markedly.
Electron-Exchange Effects. Above a concentration of ^ lO -2 M, the hyperfine lines disappear and the line width narrows (Figure 6). One measure of the effect is the peak-to-peak separation in the first-derivative presentation; a better one is the second moment of the spectrum, for this quantity takes into account possible changes in the line shape. Both measures are given in
Volume 71, Number 3 February 1967

646 G. M. Muha
Table I. From this table it is seen that dipolar effects are important, for the replacement of hydrogen by deuterium in both the molecule and the surface decreases the line width and the second moment.
T ab le I ; L in e-W id th E ffects in the Presenceo f E lectron E xchange
,—Concn,“ M— Perdeuterio-
Peak-to-peakseparation, Second
anthracene gauss moment0
Satd soin 3 .6 1 2 .3IO“ 2 5 .1 1 4 .610- 3 '’ 8 .1 1 9 .710 4 8 .9 2 7 .2IO “ 5 b ~ 8 . 9 3 1 .6
Anthracene
Satd soin 6 .3 18 .3
Perdeuterio-anthracene-deuterated
surface
IO -4 4 .7 11 .5
° C arbon disulfide used as a solven t in all cases. 6 M easurem ents m ade on spectrum recorded before hyperfine observed. c C om puted from the first-derivative spectrum b y num erical integration. T h e integration lim its were taken to be the points at w hich the wings o f the curve disappear into the base-line noise.
If the line narrowing were the result of spin-exchange effects, the second moment should remain constant,16 and the hyperfine lines coalesce and shift to the unsplit Zeeman frequency.22 The predicted constancy of the second moment under similar circumstances has been observed in the perylene-molecular oxygen system.17
In the present system, the second moment changes appreciably with concentration and the hyperfine lines are found to broaden and disappear rather than coalesce and shift. To establish the latter point, a 10~3 M sample was prepared (Figure 7A), then the supernatant liquid decanted and replaced (without shaking) by a 10~2 M solution. The spectra given in Figures 7B and 7C show the time development as the higher concentration diffuses into the catalyst bed. The hyperfine lines can be made to reappear by washing the catalyst with pure solvent. The integrated esr intensity remains constant during this series of manipulations, but as seen in Figure 7B, the hyperfine lines do not return to full intensity. We have no explanation for the lack of complete reversibility.
Figure 6. F irst-derivative spectra o f perdeuterioanthracene radical cation on silica -a lum ina as a function o f arom atic concentration . These spectra correspond to the first five entries in T ab le I.
From this evidence it is concluded that the spin- exchange phenomenon does not explain the observed behavior. Most certainly the phenomenon is occurring, but apparently its contribution is small or perhaps constant in its effect within the concentration range accessible. The latter result would be obtained if the spin exchange occurred principally between the radical and its counterion.17 As an alternative explanation of the observed behavior, the possibility of an electron- transfer mechanism is considered.
In the concentration range in which the line narrowing occurs, the radical concentration remains constant with increasing aromatic concentration. A similar behavior has been reported in aromatic ketyl systems generated by alkali metal reduction.18 There it was observed that at higher concentrations the hyperfine fines collapse, and the resulting spectrum was that associated with the counterion (i.e., the alkali metal). The phenomena was explained in terms of a transfer process between the radical and neutral aromatic molecules in which the counterion and the electron spin are transferred together.23
The analogy between the concentration dependence exhibited in the present system and that in the ketyl
(22) D . Kivelson, J. Chem. Phys., 33, 1094 (1960); J. D . Currin, Phys. Rev., 126, 1995 (1962).(23) P . J. Zandstra and S. I. Weissman, J. Am. Chem. Soc., 84, 4408 (1962).
The Journal of Physical Chemistry
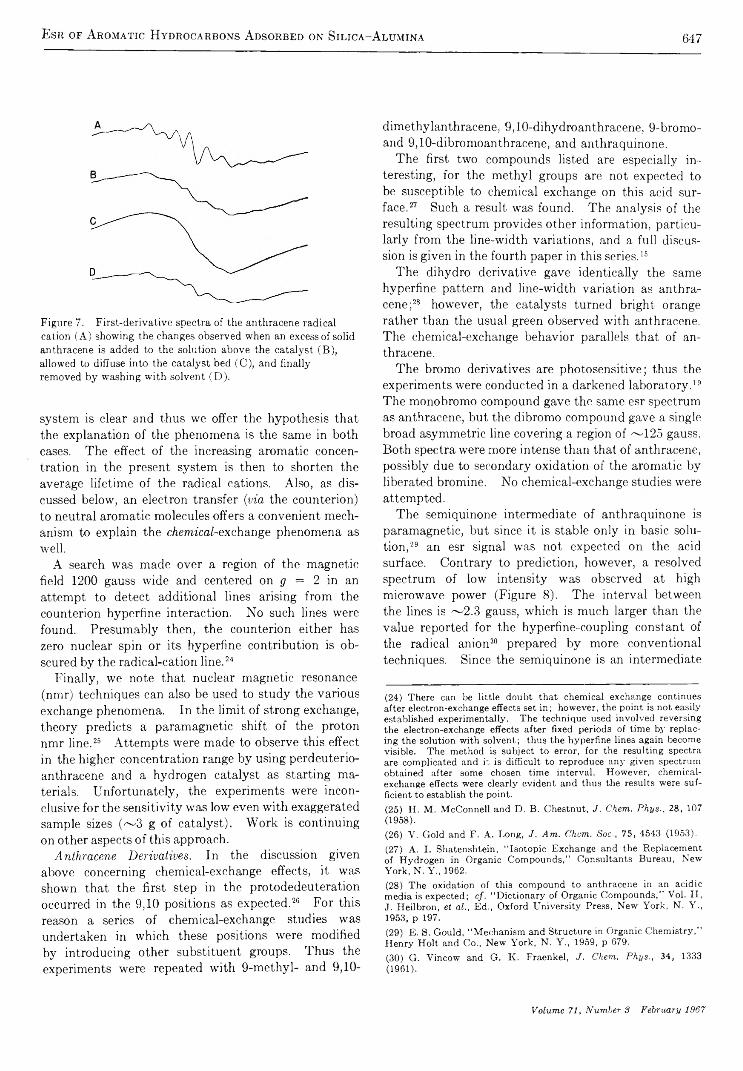
Esr of Aromatic Hydrocarbons A dsorbed on Silica-A lumina 647
Figure 7. F irst-derivative spectra o f the anthracene radical cation (A ) showing the changes observed w hen an excess o f solid anthracene is added to the solution ab ove the cata lyst (B ), allowed to diffuse into the catalyst bed (C ), and finally rem oved b y w ashing w ith solven t (D ) .
system is clear and thus we offer the hypothesis that the explanation of the phenomena is the same in both cases. The effect of the increasing aromatic concentration in the present system is then to shorten the average lifetime of the radical cations. Also, as discussed below, an electron transfer {via the counterion) to neutral aromatic molecules offers a convenient mechanism to explain the chemical-ex change phenomena as well.
A search was made over a region of the magnetic field 1200 gauss wide and centered on g = 2 in an attempt to detect additional lines arising from the counterion hyperfine interaction. No such lines were found. Presumably then, the counterion either has zero nuclear spin or its hyperfine contribution is obscured by the radical-cation line.24 25
Finally, we note that nuclear magnetic resonance (nmr) techniques can also be used to study the various exchange phenomena. In the limit of strong exchange, theory predicts a paramagnetic shift of the proton nmr line.26 Attempts were made to observe this effect in the higher concentration range by using perdeuterio- anthracene and a hydrogen catalyst as starting materials. Unfortunately, the experiments were inconclusive for the sensitivity was low even with exaggerated sample sizes (~ 3 g of catalyst). Work is continuing on other aspects of this approach.
Anthracene Derivatives. In the discussion given above concerning chemical-exchange effects, it was shown that the first step in the protodedeuteration occurred in the 9,10 positions as expected.26 For this reason a series of chemical-exchange studies was undertaken in which these positions were modified by introducing other substituent groups. Thus the experiments were repeated with 9-methyl- and 9,10-
dimethylanthracene, 9,10-dihydroanthracene, 9-bromo- and 9,10-dibromoanthracene, and anthraquinone.
The first two compounds listed are especially interesting, for the methyl groups are not expected to be susceptible to chemical exchange on this acid surface.27 Such a result was found. The analysis of the resulting spectrum provides other information, particularly from the line-width variations, and a full discussion is given in the fourth paper in this series.16
The dihydro derivative gave identically the same hyperfine pattern and line-width variation as anthracene;28 however, the catalysts turned bright orange rather than the usual green observed with anthracene. The chemical-exchange behavior parallels that of anthracene.
The bromo derivatives are photosensitive; thus the experiments were conducted in a darkened laboratory.19 The monobromo compound gave the same esr spectrum as anthracene, but the dibromo compound gave a single broad asymmetric line covering a region of ~125 gauss. Both spectra were more intense than that of anthracene, possibly due to secondary oxidation of the aromatic by liberated bromine. No chemical-exchange studies were attempted.
The semiquinone intermediate of anthraquinone is paramagnetic, but since it is stable only in basic solution,29 an esr signal was not expected on the acid surface. Contrary to prediction, however, a resolved spectrum of low intensity was observed at high microwave power (Figure 8). The interval between the lines is ~2.3 gauss, which is much larger than the value reported for the hyperfine-coupling constant of the radical anion30 prepared by more conventional techniques. Since the semiquinone is an intermediate
(24) There can be little doubt that chemical exchange continues after electron-exchange effects set in; however, the point is not easily established experimentally. The technique used involved reversing the electron-exchange effects after fixed periods of time bj' replacing the solution with solvent; thus the hyperfine lines again become visible. The method is subject to error, for the resulting spectra are complicated and it is difficult to reproduce any given spectrum obtained after some chosen time interval. However, chemical- exchange effects were clearly evident and thus the results were sufficient to establish the point.(25) H. M . M cConnell and D. B . Chestnut, J. Chem. Phys., 28, 107 (1958).(26) V. Gold and F. A . Long, J. Am. Chem. Soc., 75, 4543 (1953).(27) A. I. Shatenshtein, “ Isotopic Exchange and the Replacement of Hydrogen in Organic Com pounds,” Consultants Bureau, New York, N. Y „ 1962.(28) The oxidation of this compound to anthracene in an acidic media is expected; cf. “ Dictionary o f Organic Com pounds,” Vol. II, J. Heilbron, et al., Ed., Oxford University Press, New York, N. Y ., 1953, p 197.(29) E. S. Gould, “ Mechanism and Structure in Organic Chem istry,” Henry H olt and Co., New York, N. Y ., 1959, p 679.(30) G. Vincow and G. K . Fraenkel, J. Chem. Phys., 34, 1333 (1961).
Volume 71, Number S February 1967
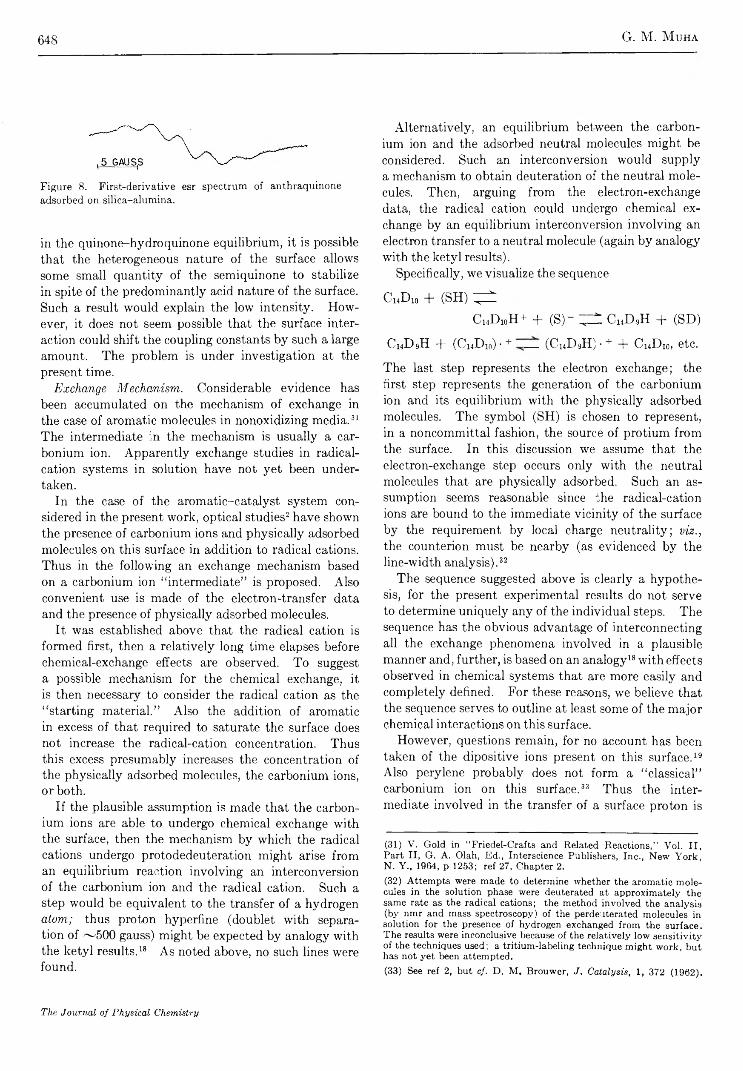
648 G. M. M uha
Figure 8. F irst-derivative esr spectrum o f anthraquinone adsorbed on silica-alum ina.
in the quinone-hydroquinone equilibrium, it is possible that the heterogeneous nature of the surface allows some small quantity of the semiquinone to stabilize in spite of the predominantly acid nature of the surface. Such a result would explain the low intensity. However, it does not seem possible that the surface interaction could shift the coupling constants by such a large amount. The problem is under investigation at the present time.
Exchange Mechanism. Considerable evidence has been accumulated on the mechanism of exchange in the case of aromatic molecules in nonoxidizing media.31 The intermediate in the mechanism is usually a car- bonium ion. Apparently exchange studies in radical- cation systems in solution have not yet been undertaken.
In the case of the aromatic-catalyst system considered in the present work, optical studies2 have shown the presence of carbonium ions and physically adsorbed molecules on this surface in addition to radical cations. Thus in the following an exchange mechanism based on a carbonium ion “ intermediate” is proposed. Also convenient use is made of the electron-transfer data and the presence of physically adsorbed molecules.
It was established above that the radical cation is formed first, then a relatively long time elapses before chemical-exchange effects are observed. To suggest a possible mechanism for the chemical exchange, it is then necessary to consider the radical cation as the “ starting material.” Also the addition of aromatic in excess of that required to saturate the surface does not increase the radical-cation concentration. Thus this excess presumably increases the concentration of the physically adsorbed molecules, the carbonium ions, or both.
If the plausible assumption is made that the carbonium ions are able to undergo chemical exchange with the surface, then the mechanism by which the radical cations undergo protodedeuteration might arise from an equilibrium reaction involving an interconversion of the carbonium ion and the radical cation. Such a step would be equivalent to the transfer of a hydrogen atom; thus proton hyperfine (doublet with separation of ~500 gauss) might be expected by analogy with the ketyl results.18 As noted above, no such lines were found.
Alternatively, an equilibrium between the carbonium ion and the adsorbed neutral molecules might be considered. Such an interconversion would supply a mechanism to obtain deuteration of the neutral molecules. Then, arguing from the electron-exchange data, the radical cation could undergo chemical exchange by an equilibrium interconversion involving an electron transfer to a neutral molecule (again by analogy with the ketyl results).
Specifically, we visualize the sequence
C 14D 10 + (SH) ^C14D 10H+ + (S )- ^ C14D 9H + (SD)
C14D 9H T (C14D 10) • + — (C14D 9H) ■ + + C i4D10, etc.
The last step represents the electron exchange; the first step represents the generation of the carbonium ion and its equilibrium with the physically adsorbed molecules. The symbol (SH) is chosen to represent, in a noncommittal fashion, the source of protium from the surface. In this discussion we assume that the electron-exchange step occurs only with the neutral molecules that are physically adsorbed. Such an assumption seems reasonable since the radical-cation ions are bound to the immediate vicinity of the surface by the requirement by local charge neutrality; viz., the counterion must be nearby (as evidenced by the line-width analysis).32
The sequence suggested above is clearly a hypothesis, for the present experimental results do not serve to determine uniquely any of the individual steps. The sequence has the obvious advantage of interconnecting all the exchange phenomena involved in a plausible manner and, further, is based on an analogy18 with effects observed in chemical systems that are more easily and completely defined. For these reasons, we believe that the sequence serves to outline at least some of the major chemical interactions on this surface.
However, questions remain, for no account has been taken of the dipositive ions present on this surface.19 Also perylene probably does not form a “ classical” carbonium ion on this surface.33 Thus the intermediate involved in the transfer of a surface proton is
(31) V. Gold in "Friedel-Crafts and Related Reactions,” Vol. I I , Part II, G. A. Olah, Ed., Interscience Publishers, Inc., New Y ork, N. Y ., 1964, p 1253; ref 27, Chapter 2.(32) Attem pts were made to determine whether the aromatic m olecules in the solution phase were deuterated at approximately the same rate as the radical cations; the method involved the analysis (by nmr and mass spectroscopy) of the perdeuterated m olecules in solution for the presence of hydrogen exchanged from the surface. The results were inconclusive because of the relatively low sensitivity of the techniques used; a tritium-labeling technique might work, but has not yet been attempted.(33) See ref 2, but cf. D. M . Brouwer, J. Catalysis, 1, 372 (1962).
The Journal of Physical Chemistry

Esr of Aromatic Hydrocarbons Adsorbed on Silica-A lumina 649
in question. However, perylene behaves differently than anthracene in other respects19 and thus may simply represent an anomalous case.34
The steps in the proposed sequence are written as equilibrium reactions, for we visualize a dynamic situation on the catalyst surface as opposed to a relatively static situation that would result if each radical cation were bound to a fixed immobile surface site (i . e counterion).1 In the first step the equilibrium shifts to the right at low aromatic concentrations since the exchangeable hydrogen is present in large excess. For example, in the case of silica-alumina, there are ~ 1 0 20 OH groups on our standard-size catalyst sample.35 The standard volume of solution even at 10-3 M contains ~ 3 X 10¹⁸ molecules or 3 X 10¹⁹ deuterium atoms to be exchanged. Thus a fully exchanged radical cation is expected in accordance with the observed esr results.
At the highest concentration used, there are 1.5 X 10²¹ atoms to be exchanged. Thus a distribution of the available deuterium between the catalyst and the radical cation is expected; consequently a different hyperfine pattern should be observed. Such a result may explain the complicated esr spectra that were obtained when this effect was investigated.24
The position of the equilibrium in the second line depends on the proximity of the radical cation to the neutral molecules; thus it would be expected to depend in a sensitive fashion on the concentration. Such is the observed dependence.
Data are not available for chemical-exchange rates in oxidizing acids; in DBr, anthracene is completely exchanged in less than 30 min.27 On silica-alumina, at 10-3 M, the complete exchange requires 3 hr. Since chemical exchange is a diffusion-controlled process,31
the difference in the two cases may be qualitatively understood in terms of a lower diffusion constant in the silica-alumina case caused by the essentially two- dimensional process involved.
Quantitative assessment of the difference is more complicated, for the heterogeneous nature of the surface must be taken into account. For example, there is no reason to believe that the simple physical mixing of the components does not result in local concentration gradients which are corrected in a length of time that is long with respect to the occurrence of the first chemical exchange. This factor, possibly compounded with others not yet suspected, may conspire to cause the meso positions to complete their exchange in a time short compared to the time required to initiate the first exchange.
Finally, we note that throughout the above discussion we have used the terms “ counterion” and “ source of exchangeable hydrogen” without attempting to indicate the nature or role of the corresponding species. A discussion of the properties of these species and resulting implications concerning the nature of the acidity of this catalyst forms the basis of the following paper.19
(34) An attempt was made to use esr to follow the chemical exchange o f perylene with the surface. The results were unsatisfactory, for perylene has two proton-coupling constants of the same m agnitude; thus the partially deuterated spectrum is too complicated to analyze. (Compare, for example, the anthracene spectrum shown in Figure 2D .) Also the similarity in the coupling constants implies a similar charge density at these positions and thus a comparable chemical- exchange rate. This possibility m ay explain why perylene appears to exchange completely much more rapidly than anthracene.(35) W . K . Hall, H. P. Leftin, F. J. Cheselske, and D . E. O ’Reilly, J. Catalysis, 2, 506 (1963). For computational convenience; we take the surface area to be 333 m 2/g .
Volume 71, Number 3 February 1967

650 W. Y. F. Brooks and Clyde M. Haas
Intramolecular Hydrogen Bonding and Potential Functions of
Carboxylic and Percarboxylic Acids
by W . V. F. Brooks and Clyde M . Haas
Department of Chemistry, Ohio University, Athens, Ohio (Received August 23, 1966)
To study the nature of the forces between the acidic hydrogen and the carbonyl oxygen atoms in organic acids, a normal coordinate analysis has been carried out for monomeric formic, acetic, trifluoroacetic, performic, and peracetic acids. The results indicate weak 0 • • • H forces in the carboxylic acids and considerably stronger 0 • • • H forces in the percarboxylic acids.
Introduction
The planar configuration of monomeric carboxylic acids, with the acidic hydrogen cis to the carbonyl oxygen,1-7 must be due to some combination of ir bonding between the carbon and oxygen atoms, steric effects, intramolecular hydrogen bonding, intramolecular dipole-dipole interactions, etc. Since the intramolecular forces, however they are classified, are part of the molecular potential function, the determination of force constants from vibrational frequencies is a method for investigating the nature and the magnitude of the forces responsible for this planar configuration. Formic, acetic, and trifluoroacetic acids were chosen as typical carboxylic acids for which adequate data are available, and as molecules small enough to be handled by the available computing equipment.8 Performic and peracetic acids were also treated because the per- carboxyl group is probably also planar and the extra oxygen permits an arrangement more favorable to hydrogen bonding.9
While vibrational analyses of some of these molecules have been done previously,1’10'11 no provision was made for forces acting between the acid hydrogen and the carbonyl oxygen. This study includes 0 • • • H stretching and additional bending coordinates.
Data and Computation
The models used for the carboxyl and percarboxyl groups are shown in Figures 1 and 2 and the parameter values are given in Table I. The models and values are based upon electron diffraction data,3’6 microwave data,2 6 and an assumed percarboxyl structure.8 It is
also assumed that the carboxyl group is identical in the three carboxylic acids and that the methyl and tri- fluoromethyl groups are tetrahedral. The percarboxylic acid problems were simplified by replacing the methyl group of peracetic acid with a single particle
T ab le I : S tructural Param eters o f M olecu les Studied
Bond Angledescrip- Length, descrip- Angle,
tion A tion degrees
c — c 1 .5 4 R — C = 0 125C — F 1 .3 5 R — C — 0 110C — H 1.0 9 C — 0 — H 107C — O 1.3 6 C — 0 — 0 105c = o 1 .2 5 0 — 0 — H 1000 — H 0 .9 70 — H (per acids) 1 .0 20 — 0 1 .4 9
(1) T . M iyazawa and K . S. Pitzer, J. Chem. Phys., 30, 1076 (19S9).(2) G. H. Kw ei and R. F. Curl, Jr., ibid., 32, 1592 (1960).(3) I. L. Karle and J. Karle, ibid., 22, 43 (1954).(4) J. H . N. Loubser, ibid., 21, 2231 (1953).(5) J. Karle and L. 0 . Brockway, J. Am. Chem. Soc., 66, 574 (1944).(6) R . E . Kagarise, J. Chem. Phys., 27, 519 (1956).(7) M . Davies and O. Thomas, Discussions Faraday Soc., 9, 335 (1950).(8) IB M 1620-1 computer with 40,000 digits of core m emory.(9) P. A. Giguere and A. W . Olmos, Can. J. Chem., 30, 821 (1952).(10) (a) O. Thomas, Discussions Faraday Soc., 9, 339 (1950); (b)K . Nakamoto and S. Kishida, J. Chem. Phys., 41, 1554 (1964).(11) R . Blinc and D . Hadzi, Spectrochim. Acta, 12, 82 (1959).
The Journal of Physical Chemistry
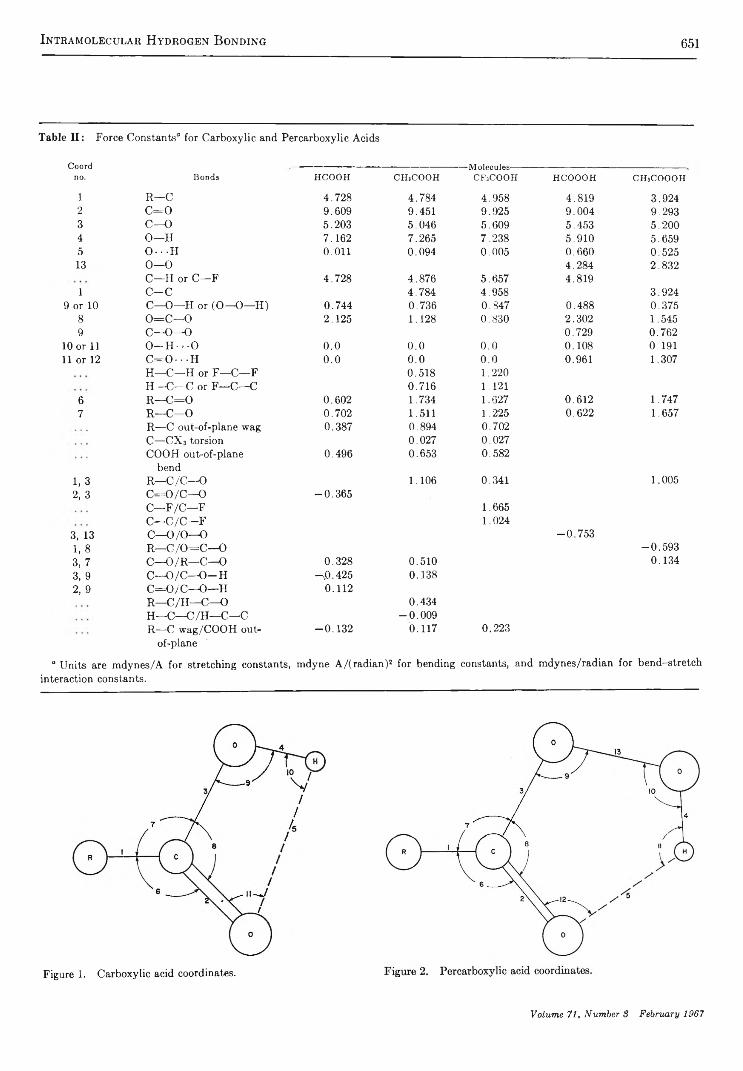
Intramolecular Hydrogen B onding 651
T a b le I I : F orce C onstants“ fo r C a rb ox y lic and P ercarboxy lic A cids
Coord ---- M olecules----------no. Bonds HCOOH CHaCOOH CFaCOOH HCOOOH CHaCOOOH
i R — C 4 .7 2 8 4 .7 8 4 4 .9 5 8 4 .8 1 9 3 .9 2 42 C = 0 9 .6 0 9 9 .4 51 9 .9 2 5 9 .0 0 4 9 .2 9 33 C — 0 5 .2 0 3 5 .0 4 6 5 .6 0 9 5 .4 5 3 5 .2 0 04 0 — H 7 .1 6 2 7 .2 6 5 7 .2 3 8 5 .9 1 0 5 .6 5 95 0 - - - H 0 .0 11 0 .0 9 4 0 .0 0 5 0 .6 6 0 0 .5 2 513 0 — 0 4 .2 8 4 2 .8 3 2
C — H or C — F 4 .7 2 8 4 .8 7 6 5 .6 5 7 4 .8 1 91 C - C 4 .7 8 4 4 .9 5 8 3 .9 2 4
9 or 10 C — 0 — H or ( 0 — 0 — H ) 0 .7 4 4 0 .7 3 6 0 .3 4 7 0 .4 8 8 0 .3 7 58 0 = C — 0 2 .1 2 5 1 .128 0 .8 3 0 2 .3 0 2 1 .5 459 C — 0 — 0 0 .7 2 9 0 .7 6 2
10 or 11 O - H - . - O 0 .0 0 .0 0 .0 0 .1 0 8 0 .1 9 111 or 12 C = 0 • • • H 0 .0 0 .0 0 .0 0 .961 1 .3 07
H — C — H or F — C — F 0 .5 1 8 1 .220H - C - C o r F — C — C 0 .7 1 6 1 .1 21
6 R — C = 0 0 .6 0 2 1 .734 1 .627 0 .6 1 2 1 .7 477 R _ C = 0 0 .7 0 2 1.511 1 .2 25 0 .6 2 2 1 .6 5 7
R — C ou t-o f-p la n e w ag 0 .3 8 7 0 .8 9 4 0 .7 0 2C — C X 3 torsion 0 .0 2 7 0 .0 2 7C O O H ou t-o f-p lan e 0 .4 9 6 0 .6 5 3 0 .5 8 2
bend1 ,3 R — C /C — 0 1 .1 06 0 .3 41 1 .0 052, 3 C = 0 / C — 0 - 0 . 3 6 5
C — F /C — F 1.665C — C /C — F 1 .0 24
3, 13 C — 0 / 0 — 0 - 0 . 7 5 31, 8 R — C / 0 = C — 0 - 0 . 5 9 33 ,7 C — O /R — C — 0 0 .3 2 8 0 .5 1 0 0 .1 3 43, 9 C —O /C — O - H —,0 .425 0 .1 3 82 ,9 C = 0 / 'C — 0 — H 0 .1 1 2
R — C /H — C — 0 0 .4 3 4H — C — C /H — C — C - 0 . 0 0 9R — C w a g /C O O H ou t- - 0 . 1 3 2 0 .1 1 7 0 .2 2 3
of-p lane
“ U nits are m d y n es /A fo r stretch ing constants, m dyne A /(r a d ia n )2 for bending constants, and m d yn es/ra d ia n for b en d -s tre tch interaction constants.
Figure 1. C arboxy lic acid coordinates.
Volum e 71, N um ber 3 February 1967

652 W. V. F. Brooks and Clyde M. Haas
T a b le I I I : Selected F orce C onstant V alues“
Bond Molecule Value SourceO — H stretch R C O O H 7.2 T h is w ork
R C O O O H 5.8 T h is w orkR C O O H 6.9* b( R C O O H ), 4.7* ch n o 3 7.1 dH C 0 3- (cry st) 3 .2* eh c o 3- 6.5 /c h 3o h 7.6 gh 2o 8.1 hh 2o 2 7.3 i
0 ■ • -H stretch R C O O H 0.06 T h is w orkR C O O O H 0 .6 T h is w orkH O O C C H = C H C O r 1.1* j(R C O O H )2 0.4* cH C 0 3- (cry s t) 0.76* e
C = 0 stretch R C O O H 9.7 T h is w orkR C O O O H 9.2 T h is w orkR C O O H 11.2* b( R C O O H )2 10.0* cH 2CO 12.4 kh c o 3- 9.1 f
11.8-13.4 l
C — -0 stretch R C O O H 5.3 T h is w orkR C O O O H 5.3 T h is w orkR C O O H 4.6* b(R C O O H ), 4.0* ch c o 3- 5.45 ± 0.15 fc h 3o h 5.15 g
5.0-5.8 k
X — 0 — H bend R C O O H 0.8 T h is w ork
& II O O R C O O O H 0.44 T h is w orkor H ) h o o c c h = c h c o 2- 0.1 j
h c o 3- 0.84 fh n o 3 0 .8 8 dC H 30H 0.79 gH ,0 0.70 hh 2o 2 0.90 i
° V alues are rounded and averaged. U nits are the sam e as in T a b le I I . Values fo llow ed b y * are from U rey -B ra d ley fo rce fields. 6 R e f 10b. c R e f 16. d G . E . M cG raw , D . L. Bernitt, and I. C . H isatsune, J. Chem. Phys., 42, 237 (1965). e K . N ak am oto , Y . A . Sarm a, and H . Ogoshi, ibid,., 43, 1177 (1965). f R e f 18. 0 R e f 14. h T . O ka and Y . M orin o, . / . M ol. Spectry., 8, 9 (1962). ‘ P . A . G iguere and O . B ain , Can. J. Chem., 5 6 ,3 4 0 (1 9 5 1 ). ' K . N akam oto, Y . A . Sarm a, and G . T . B ehnke, J. Chem. Phys., 42, 1662 (1 9 6 5 ).* T . O ka and Y . M orin o , J. Phys. Soc. Japan, 16, 1235 (1961). 1 R e f 12, p 175.
of mass 15.035 and treating only the in-plane vibrations.
The bond coordinates for in-plane motions are shown in Figures 1 and 2. The only unusual feature is that the acid hydrogen atom is treated as equivalent to the other atoms in a four (carboxyl)- or five (per- carboxyl)-membered ring system. All the bond coordinates are listed in Table II with the final values of the force constants. For the out-of-plane coordinate of the carboxyl group, a bending of the four-membered
ring was chosen instead of the usual torsion coordinate in order to avoid making an early judgment as to the kind of motion involved.
The Wilson F and G matrix method12 was used with a valency force field. G matrix formulation, solution of the secular equations, and determination of the best values of the force constants were done by digital
(12) E . B . W ilson, Jr., J. C. Decius, and P. C. Cross, “ M olecular Vibrations,” M cGraw-H ill B ook Co., Inc., New Y ork, N. Y ., 1955.
The Journal of Physical Chemistry
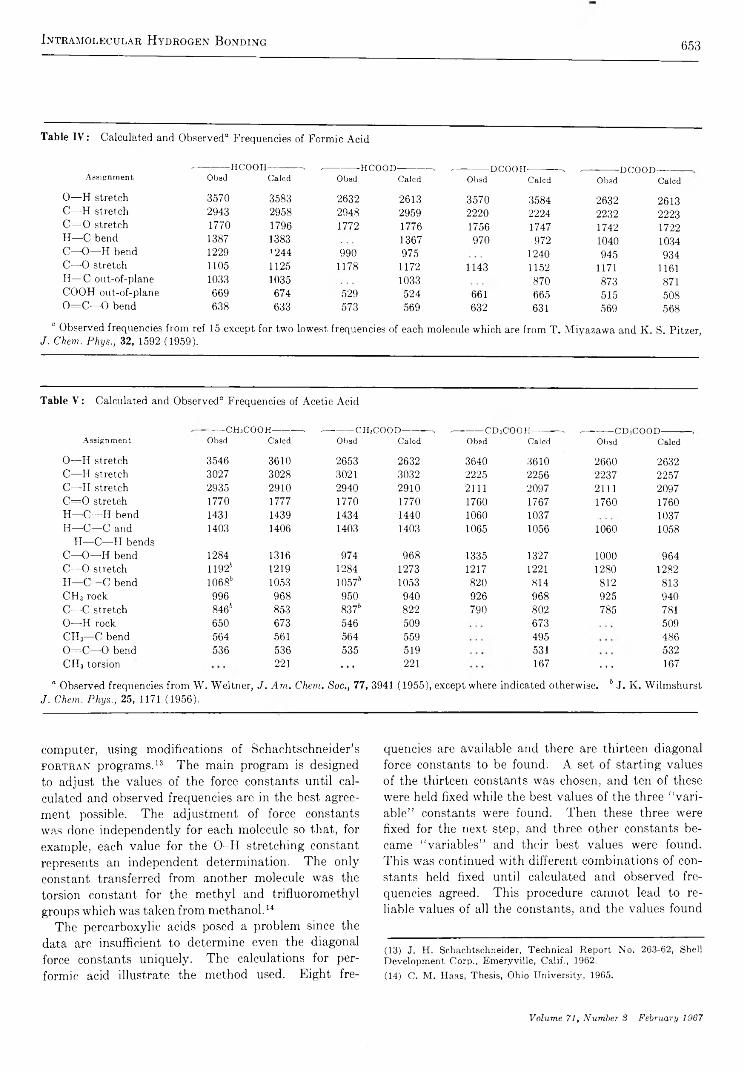
Intramolecular Hydrogen Bonding 653
T a b le IV : C alcu lated and O bserved“ Frequencies of F orm ic A cid
'-------------H CO O H ------------- , .-------------H C O O D ------------- . ,-------------D CO O H -------------, .---- ------- D C O O D -Assignment Obsd Caled Obsd Caled Obsd Caled Obsd Caled
O — H stretch 3570 3583 2632 2613 3570 3584 2632 2613C — H stretch 2943 2958 2948 2959 2220 2224 2232 2223C = 0 stretch 1770 1796 1772 1776 1756 1747 1742 1722H — C bend 1387 1383 1367 970 972 1040 1034C — 0 — H bend 1229 1244 990 975 1240 945 934C — 0 stretch 1105 1125 1178 1172 1143 1152 1171 1161H — C ou t-of-p lan e 1033 1035 1033 870 873 871C O O H ou t-of-p lan e 669 674 529 524 661 665 515 5080 = C — 0 bend 638 633 573 569 632 631 569 568
“ O bserved frequencies from ref 15 excep t for tw o low est frequencies of each m olecule w hich are from T . M iyazaw a and K . S. Pitzer,J. Chem. Phys., 32, 1592 (1959).
T ab le V : C alcu lated and O bserved“ Frequencies o f A cetic A cid
Assignment------CHsCObsd
OOH---------- -Caled
----- ------ CHaCObsd
OOD-----------,Caled
,---- ------ CDsCObsd
/OOH-----------sCaled
----- ------ CDaCObsd
:o o d ----------Caled
O — Id stretch 3546 3610 2653 2632 3640 3610 2660 2632C — Id stretch 3027 3028 3021 3032 2225 2256 2237 2257C — H stretch 2935 2910 2940 2910 2111 2097 2111 2097C = 0 stretch 1770 1777 1770 1770 1760 1767 1760 1760H — C — H bend 1431 1439 1434 1440 1060 1037 1037Id— C — C and 1403 1406 1403 1403 1065 1056 1060 1058
H — C — II bends C — O— Id bend 1284 1316 974 968 1335 1327 1000 964C — O stretch 11926 1219 1284 1273 1217 1221 1280 1282H — C — C bend 10686 1053 10576 1053 820 814 812 813C H 3 rock 996 968 950 940 926 968 925 940C — C stretch 8466 853 8376 822 790 802 785 781O — H rock 650 673 546 509 673 509C H 3— C bend 564 561 564 559 495 4860 = C — O bend 536 536 535 519 531 532CId3 torsion 221 . . . 221 167 . . . 167
° O bserved frequencies from W . W eltner, J. Am . Chem. Soc., 77, 3941 (1955), except where indicated otherw ise. 6 J . K . W ilm shurst J. Chem. Phys., 25, 1171 (1956).
computer, using modifications of Schachtschneider’s f o r t r a n programs.13 The main program is designed to adjust the values of the force constants until calculated and observed frequencies are in the best agreement possible. The adjustment of force constants was done independently for each molecule so that, for example, each value for the O-H stretching constant represents an independent determination. The only constant transferred from another molecule was the torsion constant for the methyl and t.rifluoromethyl groups which was taken from methanol.14
The percarboxylic acids posed a problem since the data are insufficient to determine even the diagonal force constants uniquely. The calculations for per- formic, acid illustrate the method used. Eight fre
quencies are available and there are thirteen diagonal force constants to be found. A set of starting values of the thirteen constants was chosen, and ten of these were held fixed while the best values of the three “ variable” constants were found. Then these three were fixed for the next step, and three other constants became “ variables” and their best values were found. This was continued with different combinations of constants held fixed until calculated and observed frequencies agreed. This procedure cannot lead to reliable values of all the constants, and the values found
(13) J. H . Schachtschneider, Technical R eport N o. 263-62, Shell Developm ent Corp., Emeryville, Calif., 1962.(14) C. M . Haas, Thesis, Ohio University, 1965.
Volume 71, Number 3 February 1967
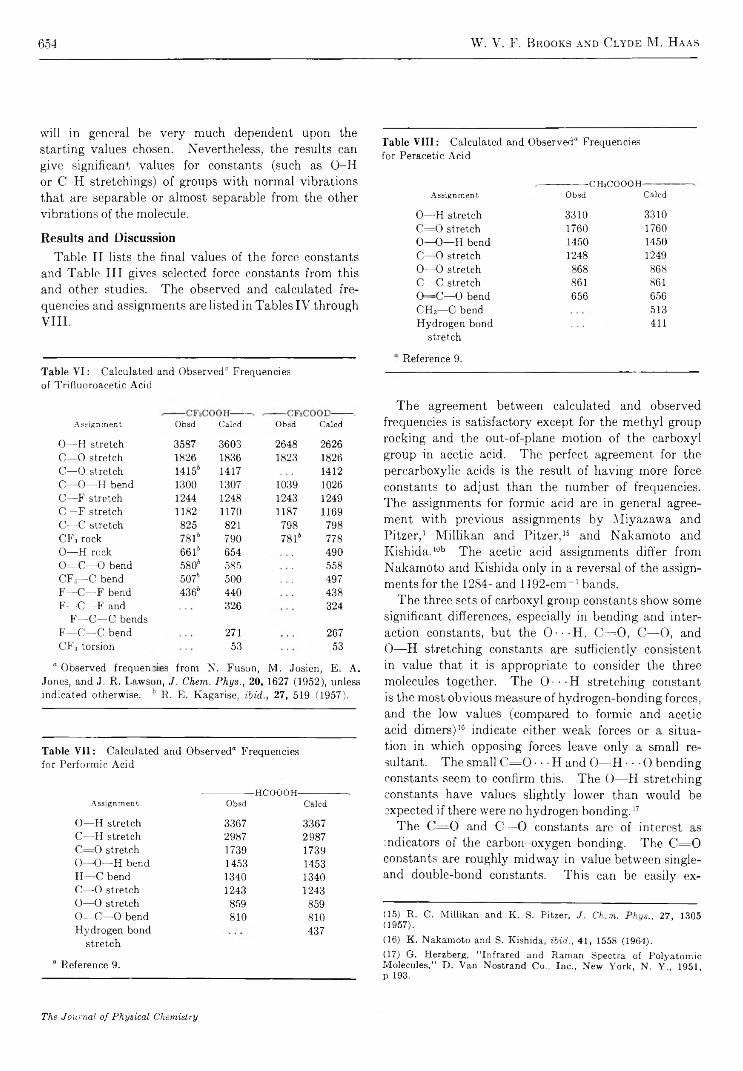
654 W. V. F. Brooks and Clyde M. Haas
will in general be very much dependent upon the starting values chosen. Nevertheless, the results can give significant values for constants (such as O-H or C-H stretchings) of groups with normal vibrations that are separable or almost separable from the other vibrations of the molecule.
Results and DiscussionTable II lists the final values of the force constants
and Table III gives selected force constants from this and other studies. The observed and calculated frequencies and assignments are listed in Tables IV throughVIII.
T ab le V I : Calculated and O bserved“ Frequenciesof T riflu oroacetic A cid
Assignment Obsd Caled Obsd Caled
0 — H stretch 3587 3603 2648 2626C = 0 stretch 1826 1836 1823 1826C — 0 stretch 1415b 1417 1412C — 0 — H bend 1300 1307 1039 1026C — F stretch 1244 1248 1243 1249C — F stretch 1182 1170 1187 1169C — C stretch 825 821 798 798C F 3 rock 7816 790 7816 7780 — H rock 6616 654 4900 = C — 0 bend 5806 585 558C F 3— C bend 507" 500 497F — C — F bend 436i 440 438F — C — F and 326 324
F — C — C bendsF — C — C bend 271 267C F 3 torsion 53 53
“ O bserved frequenc es from N . Fuson, M . Josien, E . A .Jones, and J. R . Law son, J. Chem. Phys., 20, 1627 (1952), unlessin dicated otherwise. b R . E . K agarise, ibid. 27, 519 (1957).
T ab le V II : C alcu lated and O bserved“ Frequenciesfor P erform ic A cid
.------------------HCOOOH-Assignment Obsd Caled
O — H stretch 3367 3367C — H stretch 2987 2987C = 0 stretch 1739 1739O— O — H bend 1453 1453H — C bend 1340 1340C — O stretch 1243 1243O — O stretch 859 8590 = C — O bend 810 810H ydrogen bond 437
stretch
° R eference 9.
Table V I I I : C alcu lated and O bserved“ Frequenciesfor P eracetic A cid
— CHsCOOOH-Assignment Obsd Caled
O — H stretch 3310 3310C = 0 stretch 1760 1760O — Q — H bend 1450 1450C — O stretch 1248 1249O — O stretch 868 868C — C stretch 861 861O — C — -O bend 656 656C H 3— C bend 513H ydrog en bond 411
stretch
R eference 9.
The agreement between calculated and observed frequencies is satisfactory except for the methyl group rocking and the out-of-plane motion of the carboxyl group in acetic acid. The perfect agreement for the percarboxylic acids is the result of having more force constants to adjust than the number of frequencies. The assignments for formic acid are in general agreement with previous assignments by Miyazawa and Pitzer,1 Millikan and Pitzer,15 and Nakamoto and Kishida.10b The acetic acid assignments differ from Nakamoto and Kishida only in a reversal of the assignments for the 1284- and 1192-cm~1 bands.
The three sets of carboxyl group constants show some significant differences, especially in bending and interaction constants, but the 0 - - - H, C = 0 , C— 0, and 0 — H stretching constants are sufficiently consistent in value that it is appropriate to consider the three molecules together. The 0 • • • H stretching constant is the most obvious measure of hydrogen-bonding forces, and the low values (compared to formic and acetic acid dimers)16 indicate either weak forces or a situation in which opposing forces leave only a small resultant. The small C = 0 • • • H and 0 — H ■ • • 0 bending constants seem to confirm this. The 0 — H stretching constants have values slightly lower than would be expected if there were no hydrogen bonding.17
The C = 0 and C—0 constants are of interest as indicators of the carbon-oxygen bonding. The C = 0 constants are roughly midway in value between single- and double-bond constants. This can be easily ex-
(15) R . C. Millikan and K . S. Pitzer, J. CKm. Phys., 27, 1305 (1957).(16) K . Nakamoto and S. Kishida, ibid., 41, 1558 (1964).(17) G. Herzberg, “ Infrared and Raman Spectra of Polyatom ic M olecules,” D . Van Nostrand Co., Inc., New York, N. Y ., 1951, p 193.
The Journal of Physical Chemistry
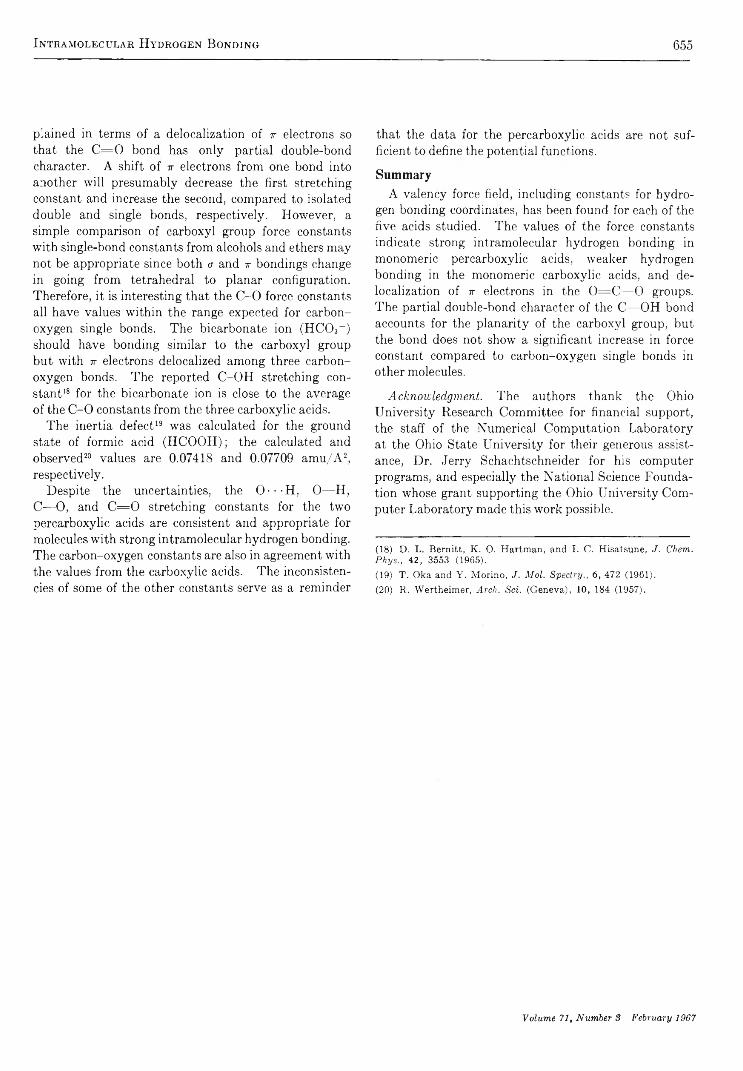
Intramolecular H ydrogen B onding 655
plained in terms of a delocalization of t electrons so that the C = 0 bond has only partial double-bond character. A shift of it electrons from one bond into another will presumably decrease the first stretching constant and increase the second, compared to isolated double and single bonds, respectively. However, a simple comparison of carboxyl group force constants with single-bond constants from alcohols and ethers may not be appropriate since both cr and 7r bondings change in going from tetrahedral to planar configuration. Therefore, it is interesting that the C -0 force constants all have values within the range expected for carbon- oxygen single bonds. The bicarbonate ion (HCO3- ) should have bonding similar to the carboxyl group but with tv electrons delocalized among three carbon- oxygen bonds. The reported C-OH stretching constant18 for the bicarbonate ion is close to the average of the C -0 constants from the three carboxylic acids.
The inertia defect19 was calculated for the ground state of formic acid (HCOOH); the calculated and observed20 values are 0.07418 and 0.07709 amu/A2, respectively.
Despite the uncertainties, the O • • • H, O—H, C— O, and C = 0 stretching constants for the two percarboxylic acids are consistent and appropriate for molecules with strong intramolecular hydrogen bonding. The carbon-oxygen constants are also in agreement with the values from the carboxylic acids. The inconsistencies of some of the other constants serve as a reminder
that the data for the percarboxylic acids are not sufficient to define the potential functions.
S u m m a r y
A valency force field, including constants for hydrogen bonding coordinates, has been found for each of the five acids studied. The values of the force constants indicate strong intramolecular hydrogen bonding in monomeric percarboxylic acids, weaker hydrogen bonding in the monomeric carboxylic acids, and de- localization of tv electrons in the 0 = C — O groups. The partial double-bond character of the C—OH bond accounts for the planarity of the carboxyl group, but the bond does not show a significant increase in force constant compared to carbon-oxygen single bonds in other molecules.
Acknoivledgment. The authors thank the Ohio University Research Committee for financial support, the staff of the Numerical Computation Laboratory at the Ohio State University for their generous assistance, Dr. Jerry Schachtschneider for his computer programs, and especially the National Science Foundation whose grant supporting the Ohio University Computer Laboratory made this work possible.
(18) D. L. Bernitt, K. O. Hartman, and I. C. Hisatsune, J. Chem. P h ys ., 42, 3553 (1965).(19) T. Oka and Y. Morino, J. Mol. S pectry., 6 , 472 (1961).(20) R. Wertheimer, Arch. Sci. (Geneva), 10, 184 (1957).
Volume 71, Number 3 February 1967

656 G. A. V idulich, D. F. Evans, and R . L. K ay
The Dielectric Constant of Water and Heavy Water between 0 and 40°
b y G . A . V i d u l i c h , 1 D . F . E v a n s , a n d R . L . K a y 2
M ellon Institute, P ittsburgh, Pennsylvan ia 15213 {Received A u gu st 29, 1966)
The dielectric constant of H20 and D20 was determined at several temperatures between 0 and 40° using a new design of capacitance cell and a transformer ratio arm bridge in the frequency range 0.5-100 kHz. The electrodes of the cell were completely guarded and shielded and consisted of platinum films fused onto the surfaces of two concentric Pyrex cylinders. Water of extremely low conductance (0.6-0.8 X 10⁻⁷ ohm-1 cm-1 at 25°) was used. The values at 25° for e^o and «d 2o were 78.39 and 78.06, respectively. The equations log ch2o = 1-94404 — 1.991 X 10~3< and log «d2o = 1.94275 — 2.013 X 10_3i fitted the data to better than 0.05% for t between 0 and 40°. A detailed comparison is made with the more recent work reported in the literature.
I n t r o d u c t i o n
The dielectric constants of liquids and their temperature dependence are of considerable importance in the electrochemical investigation of electrolytes. Although dielectric constants generally can be measured with considerable ease, the relatively high conductance of liquids of electrochemical interest introduces a complication that can result in serious errors. We have designed and constructed cells3 for the measurement of absolute dielectric constants in which polar liquids can be maintained at an exceedingly low conductivity. These cells are of the three-terminal or guarded-electrode type, are completely shielded, and are ideally suited for rapid measurements on transformer bridges.
Owing to its importance both as a solvent and as a secondary dielectric standard, the absolute dielectric constant of water was reinvestigated. Recent precise determinations4 5'6 of the dielectric constant of H20 at several temperatures disagree somewhat, particularly at lower temperatures. Both of these results are significantly lower than the generally accepted but older values reported by Wyman and Ingalls.6 Our results are in best agreement with the data of Owen6 and the unpublished data of Lees.7 We have reported preliminary values8 of our results, but here we report our final values after an extensive investigation of bridge errors and the effect of varying the cell design and the cell constant.
Our measurements were extended to D20 at 0, 5, 25, and 40°. The only other extensive investigation of
the absolute dielectric constant of D20 and its temperature dependence was by Malmberg,9 using the same apparatus employed previously for H20 ,4 thereby permitting another comparison with our method. Our data for the ratio «h2o : eD!o are in better agreement with those of Wyman and Ingalls6 than with those of Malmberg.
A p p a r a t u s a n d E x p e r i m e n t a l P r o c e d u r e
Cells. Full particulars concerning the design and construction of the cells have been published elsewhere.3 Essentially, the cells consisted of concentric glass cylinders with platinum-film electrodes fused onto the inner surface of the outer cylinder (the high- potential electrode) and the outer surface of the inner cylinder. The platinum film on the inner cylinder extends from the sealed bottom right through the standard type joint joining the two cylinders. The guarded or low-potential electrode is separated from
(1) Adapted in part from a Ph.D. Thesis submitted to Brown University, 1964.(2) To whom all correspondence should be addressed.(3) G. A. Vidulich and R. L. Kay, Rev. Sci. Instr., 37, 1662 (1966).(4) C. G. Malmberg and A. A. Maryott, J. R es. N atl. B u r. Std., 56, 1 (1956).(5) B. B. Owen, R. C. Miller, C. E. Milner, and H. L. Cogan, J . P hys. Chem., 65, 2065 (1961).(6) J. Wyman, Jr., and E. N. Ingalls, J. A m . Chem. Soc., 60, 1182 (1938).(7) W. L. Lees, Ph.D. Thesis, Harvard University, 1949.(8) G. A. Vidulich and R. L. Kay, J . P h ys. Chem ., 66, 383 (1962).(9) C. G. Malmberg, J. R es. N atl. B ur. Std., 60 , 609 (1958).
The Journal of Physical Chemistry
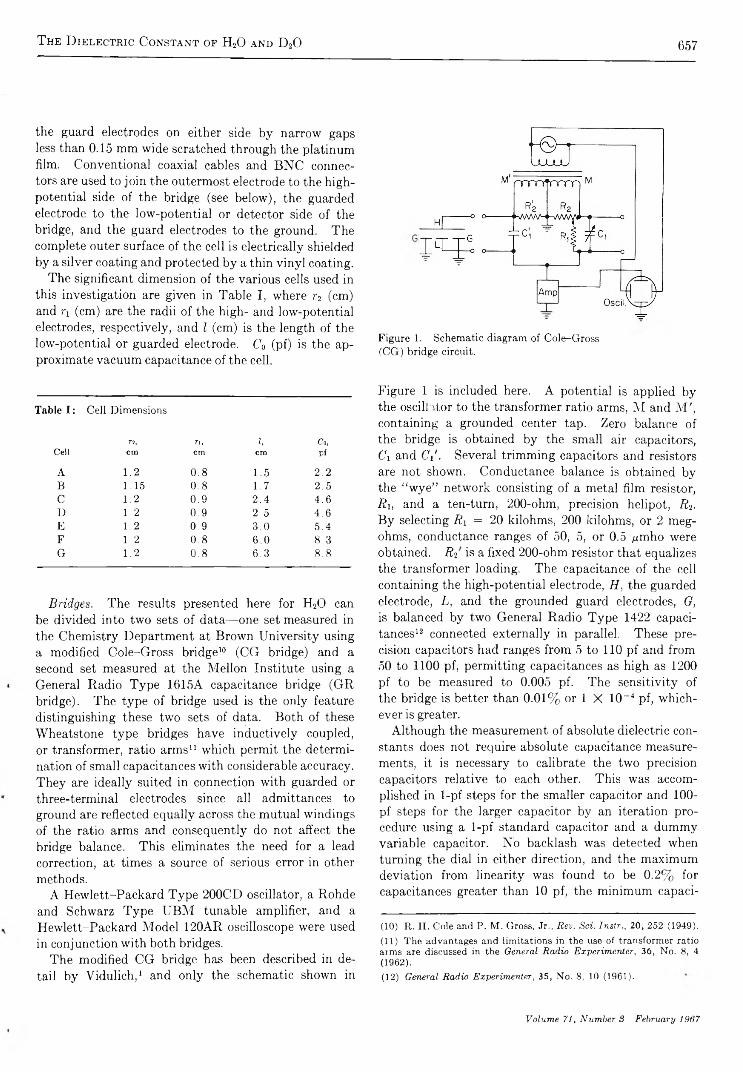
T he D ielectric C onstant of H20 and D 20 657
the guard electrodes on either side by narrow gaps less than 0.15 mm wide scratched through the platinum film. Conventional coaxial cables and BNC connectors are used to join the outermost electrode to the high- potential side of the bridge (see below), the guarded electrode to the low-potential or detector side of the bridge, and the guard electrodes to the ground. The complete outer surface of the cell is electrically shielded by a silver coating and protected by a thin vinyl coating.
The significant dimension of the various cells used in this investigation are given in Table I, where r2 (cm) and fi (cm) are the radii of the high- and low-potential electrodes, respectively, and l (cm) is the length of the low-potential or guarded electrode. C0 (pf) is the approximate vacuum capacitance of the cell.
Table I: Cell Dimensions
Tí, n, l, Co,Cell cm cm cm pfA 1.2 0.8 1.5 2.2B 1.15 0.8 1.7 2.5C 1.2 0.9 2.4 4.6D 1.2 0.9 2.5 4.6E 1.2 0.9 3.0 5.4F 1.2 0.8 6.0 8.3G 1.2 0.8 6.3 8.8
Bridges. The results presented here for H20 can be divided into two sets of data—one set measured in the Chemistry Department at Brown University using a modified Cole-Gross bridge10 (CG bridge) and a second set measured at the Mellon Institute using a General Radio Type 1615A capacitance bridge (GR bridge). The type of bridge used is the only feature distinguishing these two sets of data. Both of these Wheatstone type bridges have inductively coupled, or transformer, ratio arms11 12 which permit the determination of small capacitances with considerable accuracy. They are ideally suited in connection with guarded or three-terminal electrodes since all admittances to ground are reflected equally across the mutual windings of the ratio arms and consequently do not affect the bridge balance. This eliminates the need for a lead correction, at times a source of serious error in other methods.
A Hewlett-Packard Type 200CD oscillator, a Rohde and Schwarz Type UBM tunable amplifier, and a Hewlett-Packard Model 120AR oscilloscope were used in conjunction with both bridges.
The modified CG bridge has been described in detail by Vidulich,1 and only the schematic shown in
Figure 1. Schematic diagram of Cole-Gross (CG) bridge circuit.
Figure 1 is included here. A potential is applied by the oscilUtor to the transformer ratio arms, M and M ', containing a grounded center tap. Zero balance of the bridge is obtained by the small air capacitors, C'i and Ci'. Several trimming capacitors and resistors are not shown. Conductance balance is obtained by the “ wye” network consisting of a metal film resistor, Ri, and a ten-turn, 200-ohm, precision helipot, 7% By selecting Ri = 20 kilohms, 200 kilohms, or 2 megohms, conductance ranges of 50, 5, or 0.5 ¿¡mho were obtained. R% is a fixed 200-ohm resistor that equalizes the transformer loading. The capacitance of the cell containing the high-potential electrode, H, the guarded electrode, L, and the grounded guard electrodes, G, is balanced by two General Radio Type 1422 capacitances12 connected externally in parallel. These precision capacitors had ranges from 5 to 110 pf and from 50 to 1100 pf, permitting capacitances as high as 1200 pf to be measured to 0.005 pf. The sensitivity of the bridge is better than 0.01% or 1 X 10~4 pf, whichever is greater.
Although the measurement of absolute dielectric constants does not require absolute capacitance measurements, it is necessary to calibrate the two precision capacitors relative to each other. This was accomplished in 1-pf steps for the smaller capacitor and 100- pf steps for the larger capacitor by an iteration procedure using a 1-pf standard capacitor and a dummy variable capacitor. No backlash was detected when turning the dial in either direction, and the maximum deviation from linearity was found to be 0.2% for capacitances greater than 10 pf, the minimum capaci-
(10) R. H. Cole and P. M. Gross, Jr., Rev. S ci. Instr., 20, 252 (1949).(11) The advantages and limitations in the use of transformer ratio arms are discussed in the General R adio E xperim enter, 36, No. 8, 4 (1962).(12) General R adio E xperim enter, 35, No. 8, 10 (1961).
Volume 71, Number 3 February 1967
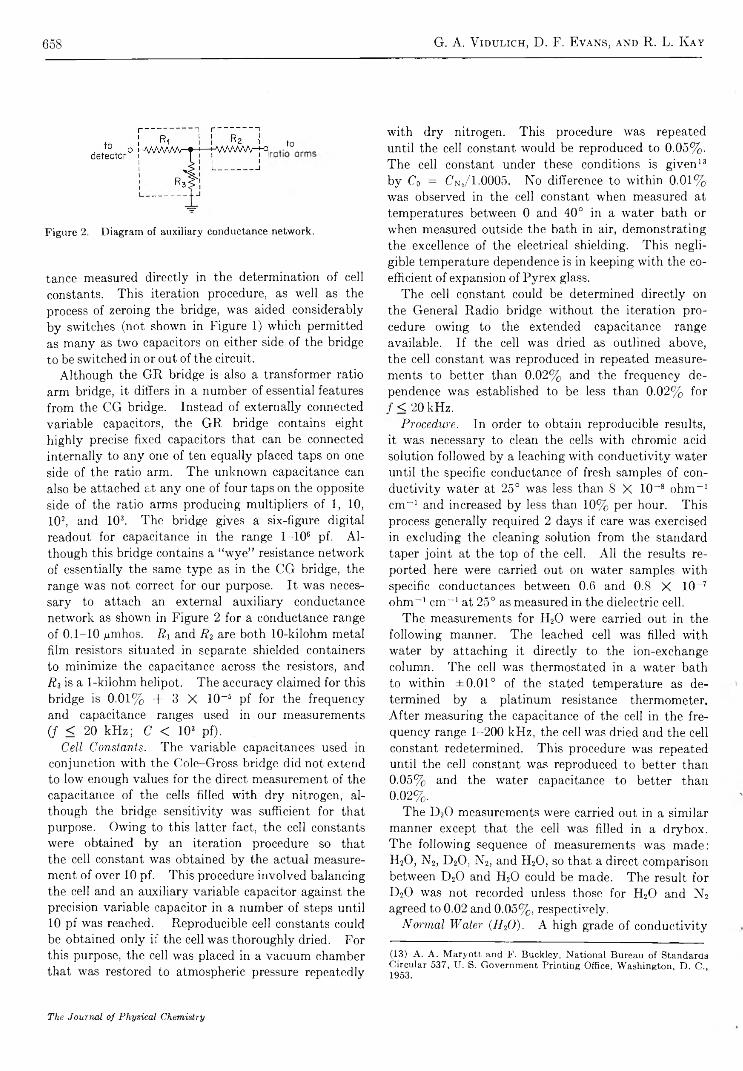
658 G. A. V idulich, D. F. Evans, and R. L. K ay
to
Figure 2. Diagram of auxiliary conductance network.
tance measured directly in the determination of cell constants. This iteration procedure, as well as the process of zeroing the bridge, was aided considerably by switches (not shown in Figure 1) which permitted as many as two capacitors on either side of the bridge to be switched in or out of the circuit.
Although the GR bridge is also a transformer ratio arm bridge, it differs in a number of essential features from the CG bridge. Instead of externally connected variable capacitors, the GR bridge contains eight highly precise fixed capacitors that can be connected internally to any one of ten equally placed taps on one side of the ratio arm. The unknown capacitance can also be attached at any one of four taps on the opposite side of the ratio arms producing multipliers of 1, 10, 102, and 103. The bridge gives a six-figure digital readout for capacitance in the range 1-106 pf. Although this bridge contains a “ wye” resistance network of essentially the same type as in the CG bridge, the range was not correct for our purpose. It was necessary to attach an external auxiliary conductance network as shown in Figure 2 for a conductance range of 0.1-10 jumhos. Ri and R2 are both 10-kilohm metal film resistors situated in separate shielded containers to minimize the capacitance across the resistors, and Rz is a 1-kilohm helipot. The accuracy claimed for this bridge is 0.01% + 3 X 10⁻⁵ pf for the frequency and capacitance ranges used in our measurements (f < 20 kHz; C < 103 pf).
Cell Constants. The variable capacitances used in conjunction with the Cole-Gross bridge did not extend to low enough values for the direct measurement of the capacitance of the cells filled with dry nitrogen, although the bridge sensitivity was sufficient for that purpose. Owing to this latter fact, the cell constants were obtained by an iteration procedure so that the cell constant was obtained by the actual measurement of over 10 pf. This procedure involved balancing the cell and an auxiliary variable capacitor against the precision variable capacitor in a number of steps until 10 pf was reached. Reproducible cell constants could be obtained only if the cell was thoroughly dried. For this purpose, the cell was placed in a vacuum chamber that was restored to atmospheric pressure repeatedly
with dry nitrogen. This procedure was repeated until the cell constant would be reproduced to 0.05%. The cell constant under these conditions is given13 by C0 = Cn , /1 .0 0 0 5 . N o difference to within 0.01% was observed in the cell constant when measured at temperatures between 0 and 40° in a water bath or when measured outside the bath in air, demonstrating the excellence of the electrical shielding. This negligible temperature dependence is in keeping with the coefficient of expansion of Pyrex glass.
The cell constant could be determined directly on the General Radio bridge without the iteration procedure owing to the extended capacitance range available. If the cell was dried as outlined above, the cell constant was reproduced in repeated measurements to better than 0.02% and the frequency dependence was established to be less than 0.02% for / < 20 kHz.
Procedure. In order to obtain reproducible results, it was necessary to clean the cells with chromic acid solution followed by a leaching with conductivity water until the specific conductance of fresh samples of conductivity water at 25° was less than 8 X 10~8 ohm-1 cm-1 and increased by less than 10% per hour. This process generally required 2 days if care was exercised in excluding the cleaning solution from the standard taper joint at the top of the cell. All the results reported here were carried out on water samples with specific conductances between 0.6 and 0.8 X 10⁻⁷ ohm-1 cm“ 1 at 25° as measured in the dielectric cell.
The measurements for H20 were carried out in the following manner. The leached cell was filled with water by attaching it directly to the ion-exchange column. The cell was thermostated in a water bath to within ±0.01° of the stated temperature as determined by a platinum resistance thermometer. After measuring the capacitance of the cell in the frequency range 1-200 kHz, the cell was dried and the cell constant redetermined. This procedure was repeated until the cell constant was reproduced to better than 0.05% and the water capacitance to better than 0.02%.
The D20 measurements were carried out in a similar manner except that the cell was filled in a dry box. The following sequence of measurements was made: H20, N „ D 20, N2, and H20, so that a direct comparison between D20 and H20 could be made. The result for D20 was not recorded unless those for H20 and N2 agreed to 0.02 and 0.05%, respectively.
Normal Water (H20 ). A high grade of conductivity
(13) A. A. Maryott and F. Buckley, National Bureau of Standards Circular 537, U. S. Government Printing Office, Washington, D. C., 1953.
The Journal of Physical Chemistry
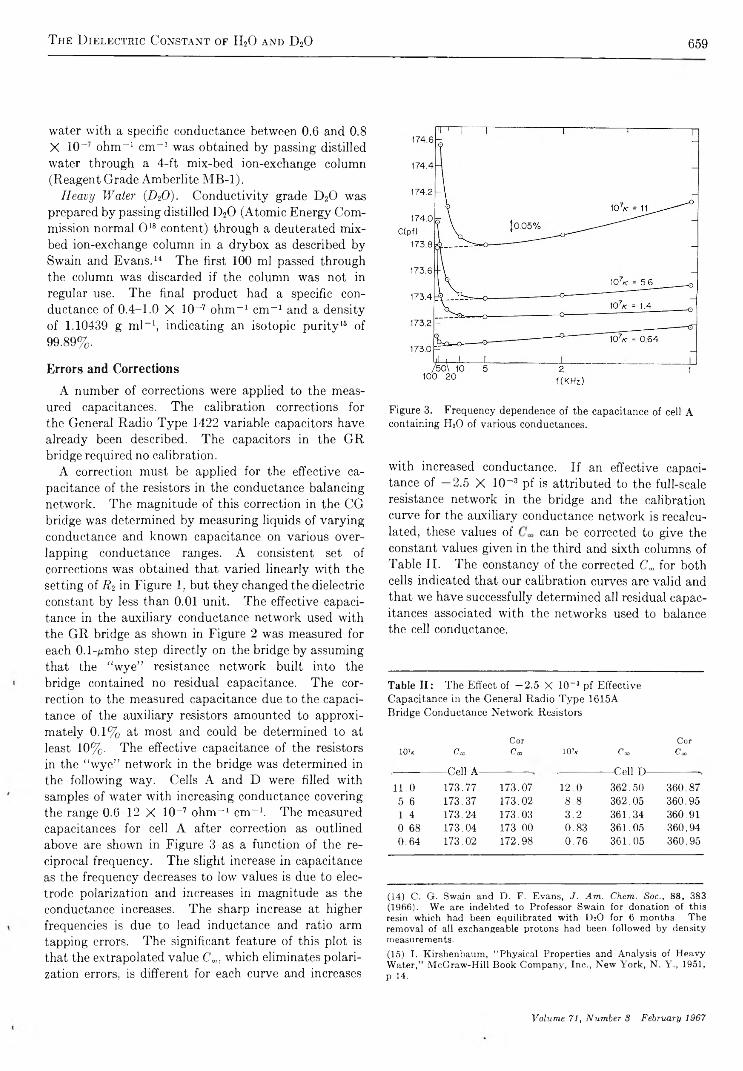
T he D ielectric C onstant of H20 and D 20 659
water with a specific conductance between 0.6 and 0.8 X 10“ 7 ohm“ 1 cm-1 was obtained by passing distilled water through a 4-ft mix-bed ion-exchange column (Reagent Grade Amberlite MB-1).
Heavy Water (D20). Conductivity grade D20 was prepared by passing distilled D20 (Atomic Energy Commission normal O18 content) through a deuterated mix- bed ion-exchange column in a drybox as described by Swain and Evans.14 The first 100 ml passed through the column was discarded if the column was not in regular use. The final product had a specific conductance of 0.4-1.0 X 10“ 7 ohm-1 cm“ 1 and a density of 1.10439 g ml“ 1, indicating an isotopic purity15 of 99.89%.
E r r o r s a n d C o r r e c t i o n s
A number of corrections were applied to the measured capacitances. The calibration corrections for the General Radio Type 1422 variable capacitors have already been described. The capacitors in the GR bridge required no calibration.
A correction must be applied for the effective capacitance of the resistors in the conductance balancing network. The magnitude of this correction in the CG bridge was determined by measuring liquids of varying conductance and known capacitance on various overlapping conductance ranges. A consistent set of corrections was obtained that varied linearly with the setting of R2 in Figure 1. but they changed the dielectric constant by less than 0.01 unit. The effective capacitance in the auxiliary conductance network used with the GR bridge as shown in Figure 2 was measured for each 0.1-pmho step directly on the bridge by assuming that the "wye” resistance network built into the bridge contained no residual capacitance. The correction to the measured capacitance due to the capacitance of the auxiliary resistors amounted to approximately 0.1% at most and could be determined to at least 10%. The effective capacitance of the resistors in the “ wye” network in the bridge was determined in the following way. Cells A and D were filled with samples of water with increasing conductance covering the range 0.6-12 X 10“ 7 ohm“ 1 cm“ 1. The measured capacitances for cell A after correction as outlined above are shown in Figure 3 as a function of the reciprocal frequency. The slight increase in capacitance as the frequency decreases to low values is due to electrode polarization and increases in magnitude as the conductance increases. The sharp increase at higher frequencies is due to lead inductance and ratio arm tapping errors. The significant feature of this plot is that the extrapolated value Cm, which eliminates polarization errors, is different for each curve and increases
Figure 3. Frequency dependence of the capacitance of cell A containing H20 of various conductances.
with increased conductance. If an effective capacitance of —2.5 X 10~3 pf is attributed to the full-scale resistance network in the bridge and the calibration curve for the auxiliary conductance network is recalculated, these values of can be corrected to give the constant values given in the third and sixth columns of Table II. The constancy of the corrected Ca for both cells indicated that our calibration curves are valid and that we have successfully determined all residual capacitances associated with the networks used to balance the cell conductance.
Table II: The Effect of —2.5 X 10~3 pf Effective Capacitance in the General Radio Type 1615A Bridge Conductance Network Resistors 15
Cor Cor1 0 7* C co C oo 1 0 7k Cœ C co
1 1 .0Cell A
173.77 173.07 12.0— Cell D -
362.50 360.875.6 173.37 173.02 8.8 362.05 360.951.4 173.24 173.03 3.2 361.34 360.910.68 173.04 173.00 0.83 361.05 360.940.64 173.02 172.98 0.76 361.05 360.95
(14) C. G. Swain and D. F. Evans, J. Am. Chem. Soc., 88, 383 (1966). We are indebted to Professor Swain for donation of this resin which had been equilibrated with D2O for 6 months. The removal of all exchangeable protons had been followed by density measurements.(15) I. Kirshenbaum, “ Physical Properties and Analysis of Heavy Water,” McGraw-Hill Book Company, Inc., New York, N. Y., 1951, p 14.
Volume 71, Number 3 February 1967
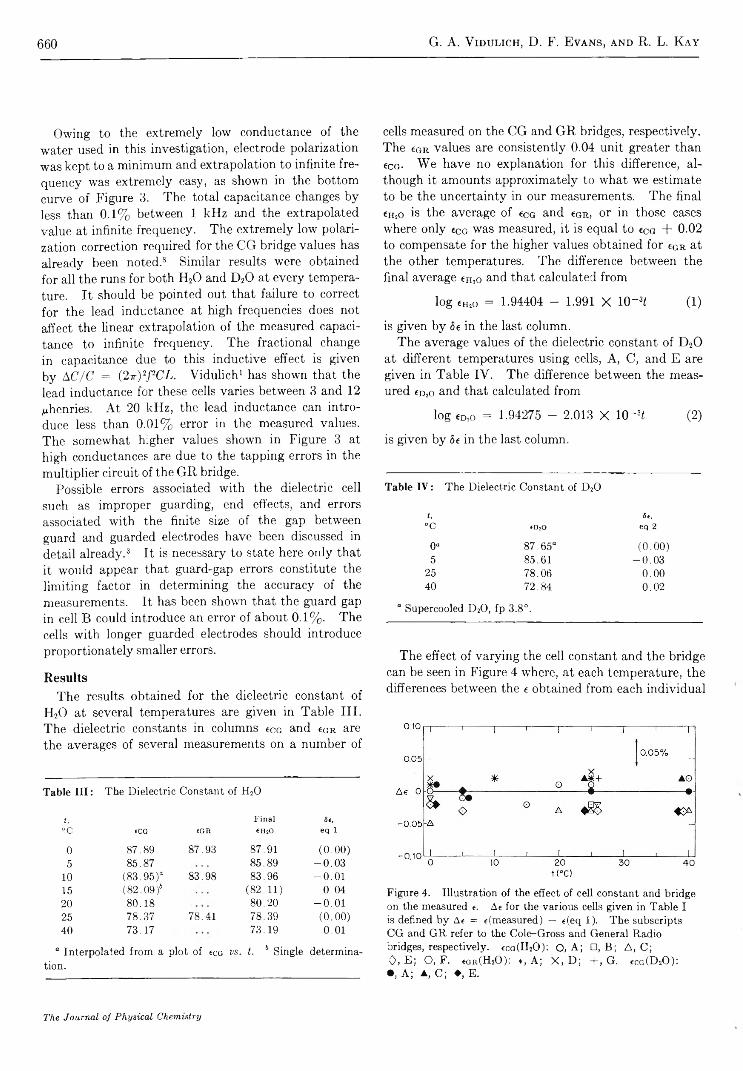
660 G. A. V idiilich, D. F. Evans, and R. L. K ay
Owing to the extremely low conductance of the water used in this investigation, electrode polarization was kept to a minimum and extrapolation to infinite frequency was extremely easy, as shown in the bottom curve of Figure 3. The total capacitance changes by less than 0.1% between 1 kHz and the extrapolated value at infinite frequency. The extremely low polarization correction required for the CG bridge values has already been noted.8 Similar results were obtained for all the runs for both H20 and D20 at every temperature. It should be pointed out that failure to correct for the lead inductance at high frequencies does not affect the linear extrapolation of the measured capacitance to infinite frequency. The fractional change in capacitance due to this inductive effect is given by AC/C = (2ir)2PGL. Vidulich1 has shown that the lead inductance for these cells varies between 3 and 12 yuhenries. At 20 kHz, the lead inductance can introduce less than 0.01% error in the measured values. The somewhat higher values shown in Figure 3 at high conductances are due to the tapping errors in the multiplier circuit of the GR bridge.
Possible errors associated with the dielectric cell such as improper guarding, end effects, and errors associated with the finite size of the gap between guard and guarded electrodes have been discussed in detail already.3 It is necessary to state here only that it would appear that guard-gap errors constitute the limiting factor in determining the accuracy of the measurements. It has been shown that the guard gap in cell B could introduce an error of about 0.1%. The cells with longer guarded electrodes should introduce proportionately smaller errors.
R e s u l t s
The results obtained for the dielectric constant of H20 at several temperatures are given in Table III. The dielectric constants in columns c c g and eG R are the averages of several measurements on a number of
Table III : The Dielectric Constant of H20
t , Final S e ,
"C «CG EGR 6H20 eq 1
0 87.89 87.93 87.91 (0.00)5 85.87 85.89 -0 .0 3
10 (83.95)“ 83.98 83.96 - 0 .0 115 (82.09)6 (82.11) 0.0420 80.18 80.20 - 0 .0 125 78.37 78.41 78.39 (0.00)40 73.17 73.19 0.01
° Interpolated from a plot of ecu vs. t. b Single determination.
cells measured on the CG and GR bridges, respectively. The cgr values are consistently 0.04 unit greater than ecG- We have no explanation for this difference, although it amounts approximately to what we estimate to be the uncertainty in our measurements. The final «HjO is the average of «cg and eGu, or in those cases where only eCG was measured, it is equal to eCG + 0.02 to compensate for the higher values obtained for eGR at the other temperatures. The difference between the final average eH!o and that calculated from
log eHjo = 1.94404 - 1.991 X 10~3< (1)
is given by 56 in the last column.The average values of the dielectric constant of D20
at different temperatures using cells, A, C, and E are given in Table IV. The difference between the measured £d2o and that calculated from
log £D2o = 1.94275 - 2.013 X 10~3f (2)
is given by 5e in the last column.
Table IV : The Dielectric Constant of D20
t , S e ,
"C *D20 eq 2
0° 87.65“ (0.00)5 85.61 -0 .0 3
25 78.06 0.0040 72.84 0.02
“ Supercooled D20, fp 3.8°.
The effect of varying the cell constant and the bridge can be seen in Figure 4 where, at each temperature, the differences between the e obtained from each individual
Figure 4. Illustration of the effect of cell constant and bridge on the measured e. Ae for the various cells given in Table I is defined by Ae = e(measured) — e(eq 1). The subscripts CG and GR refer to the Cole-Gross and General Radio bridges, respectively. ico(H20 ): O, A; □, B; A, C;0 , E; O, F. eGR(H20 ): *, A; X, D; + , G. ecG(D20 ):•, A; A, C; ♦, E.
The Journal of Physical Chemistry
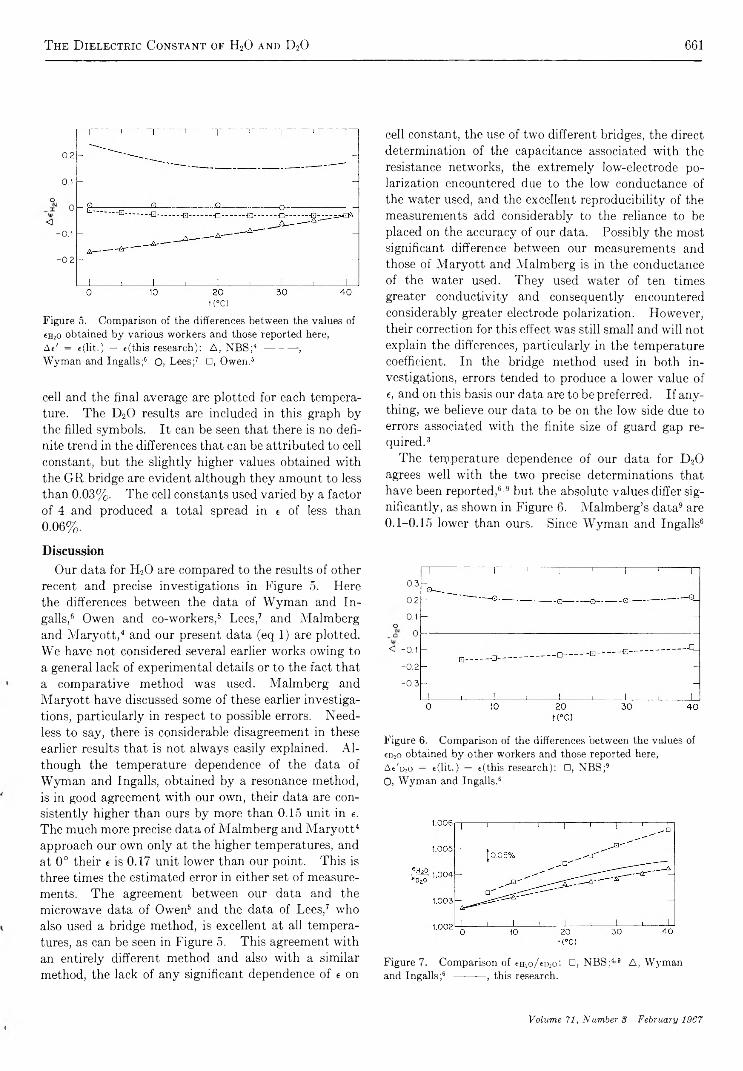
T he D ielectric C onstant op H20 and D 20 661
02
0.1o 0
<1-0.1
-0.2
Figure 5. Comparison of the differences between the values of €h2o obtained by various workers and those reported here,Ae' = e(lit.) — e(this research): A, NBS;4 --------- ,Wyman and Ingalls;6 O, Lees;7 □, Owen.5
cell and the final average are plotted for each temperature. The D20 results are included in this graph by the filled symbols. It can be seen that there is no definite trend in the differences that can be attributed to cell constant, but the slightly higher values obtained with the GR bridge are evident although they amount to less than 0.03%. The cell constants used varied by a factor of 4 and produced a total spread in e of less than 0.06%.
DiscussionOur data for H20 are compared to the results of other
recent and precise investigations in Figure 5. Here the differences between the data of Wyman and Ingalls,6 Owen and co-workers,5 Lees,7 and Malmberg and Maryott,4 and our present data (eq 1) are plotted. We have not considered several earlier works owing to a general lack of experimental details or to the fact that a comparative method was used. Malmberg and Maryott have discussed some of these earlier investigations, particularly in respect to possible errors. Needless to say, there is considerable disagreement in these earlier results that is not always easily explained. Although the temperature dependence of the data of Wyman and Ingalls, obtained by a resonance method, is in good agreement with our own, their data are consistently higher than ours by more than 0.15 unit in e. The much more precise data of Malmberg and Maryott4 approach our own only at the higher temperatures, and at 0° their t is 0.17 unit lower than our point. This is three times the estimated error in either set of measurements. The agreement between our data and the microwave data of Owen6 and the data of Lees,7 who also used a bridge method, is excellent at all temperatures, as can be seen in Figure 5. This agreement with an entirely different method and also with a similar method, the lack of any significant dependence of e on
tec)
cell constant, the use of two different bridges, the direct determination of the capacitance associated with the resistance networks, the extremely low-electrode polarization encountered due to the low conductance of the water used, and the excellent reproducibility of the measurements add considerably to the reliance to be placed on the accuracy of our data. Possibly the most significant difference between our measurements and those of Maryott and Malmberg is in the conductance of the water used. They used water of ten times greater conductivity and consequently encountered considerably greater electrode polarization. However, their correction for this effect was still small and will not explain the differences, particularly in the temperature coefficient. In the bridge method used in both investigations, errors tended to produce a lower value of e, and on this basis our data are to be preferred. If anything, we believe our data to be on the low side due to errors associated with the finite size of guard gap required.3
The temperature dependence of our data for D20 agrees well with the two precise determinations that have been reported,6'9 but the absolute values differ significantly, as shown in Figure 6. Malmberg’s data9 are 0.1-0.15 lower than ours. Since Wyman and Ingalls6
0.30.20.1
o_ Q 0 < -0.1
-0.2 -0.3
Figure 6. Comparison of the differences between the values of €d2o obtained by other workers and those reported here,Ac'd2o = e(lit.) — e(this research): □, NBS;9 O, Wyman and Ingalls.6
Figure 7. Comparison of €h2oA d2o: □, NBS:4 9 A, Wyman and Ingalls;6 --------- , this research.
Volume 71, Number S February 1967
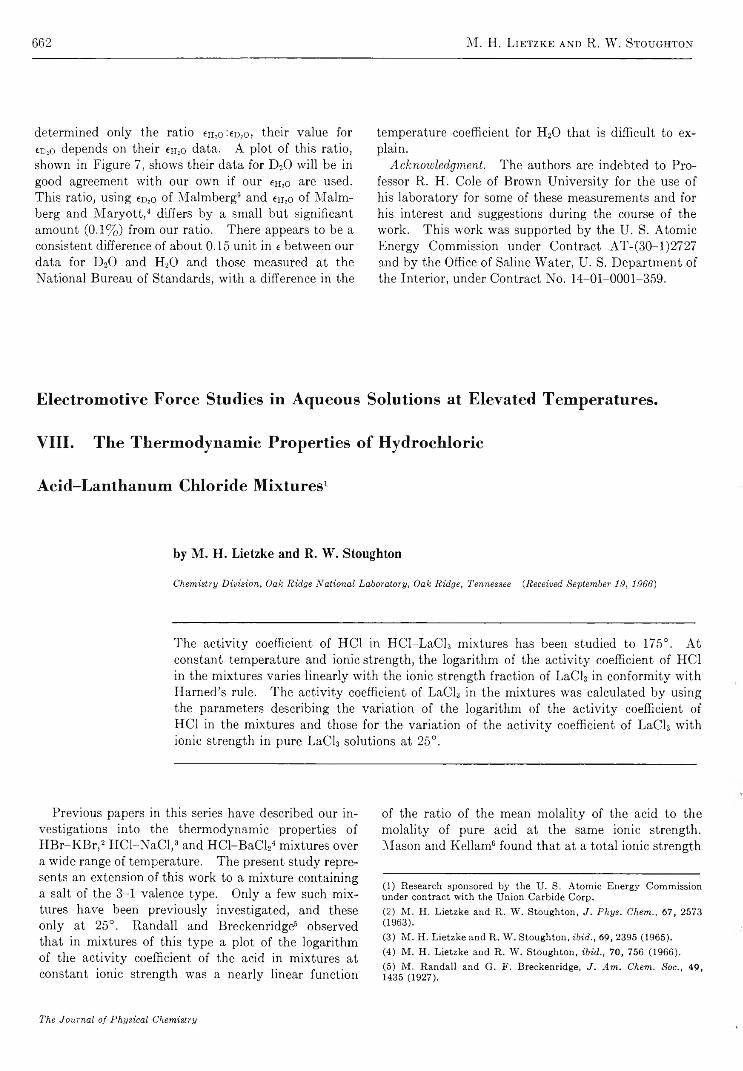
662 M. H. L ietzke and R. W. Stoughton
determined only the ratio em o^ o , their value for eDiO depends on their ch2o data. A plot of this ratio, shown in Figure 7, shows their data for D20 will be in good agreement with our own if our en2o are used. This ratio, using cd2o of Malmberg9 and £h2o of Malm- berg and Maryott,4 differs by a small but significant amount (0.1%) from our ratio. There appears to be a consistent difference of about 0.15 unit in e between our data for D20 and H20 and those measured at the National Bureau of Standards, with a difference in the
temperature coefficient for H20 that is difficult to explain.
Acknowledgment. The authors are indebted to Professor R. H. Cole of Brown University for the use of his laboratory for some of these measurements and for his interest and suggestions during the course of the work. This work was supported by the U. S. Atomic Energy Commission under Contract AT-(30-l)2727 and by the Office of Saline Water, U. S. Department of the Interior, under Contract No. 14-01-0001-359.
Electromotive Force Studies in Aqueous Solutions at Elevated Temperatures.
VIII. The Thermodynamic Properties of Hydrochloric
Acid-Lanthanum Chloride Mixtures1
by M . H. Lietzke and R. W . Stoughton
Chemistry Division, Oak Ridge National Laboratory, Oak Ridge, Tennessee {Received September 19, 1966)
The activity coefficient of HC1 in HCl-LaCl3 mixtures has been studied to 175°. At constant temperature and ionic strength, the logarithm of the activity coefficient of HC1 in the mixtures varies linearly with the ionic strength fraction of LaCl3 in conformity with Harned’s rule. The activity coefficient of LaCl3 in the mixtures was calculated by using the parameters describing the variation of the logarithm of the activity coefficient of HC1 in the mixtures and those for the variation of the activity coefficient of LaCl3 with ionic strength in pure LaCl3 solutions at 25°.
Previous papers in this series have described our investigations into the thermodynamic properties of HBr-KBr,2 HCl-NaCl,3 4 5 and HCl-BaCl24 mixtures over a wide range of temperature. The present study represents an extension of this work to a mixture containing a salt of the 3-1 valence type. Only a few such mixtures have been previously investigated, and these only at 25°. Randall and Breckenridge6 observed that in mixtures of this type a plot of the logarithm of the activity coefficient of the acid in mixtures at constant ionic strength was a nearly linear function
of the ratio of the mean molality of the acid to the molality of pure acid at the same ionic strength. Mason and Kellam6 found that at a total ionic strength
(1) Research sponsored by the U. S. Atomic Energy Commission under contract with the Union Carbide Corp.(2) M. H. Lietzke and R. W. Stoughton, J. Phys. Chem., 67, 2573 (1963).(3) M. H. Lietzke and R. W. Stoughton, ibid., 69, 2395 (1965).(4) M. H. Lietzke and R. W. Stoughton, ibid., 70, 756 (1966).(5) M. Randall and G. F. Breckenridge, J. Am. Chem. Soc., 49, 1435 (1927).
The Journal of Physical Chemistry
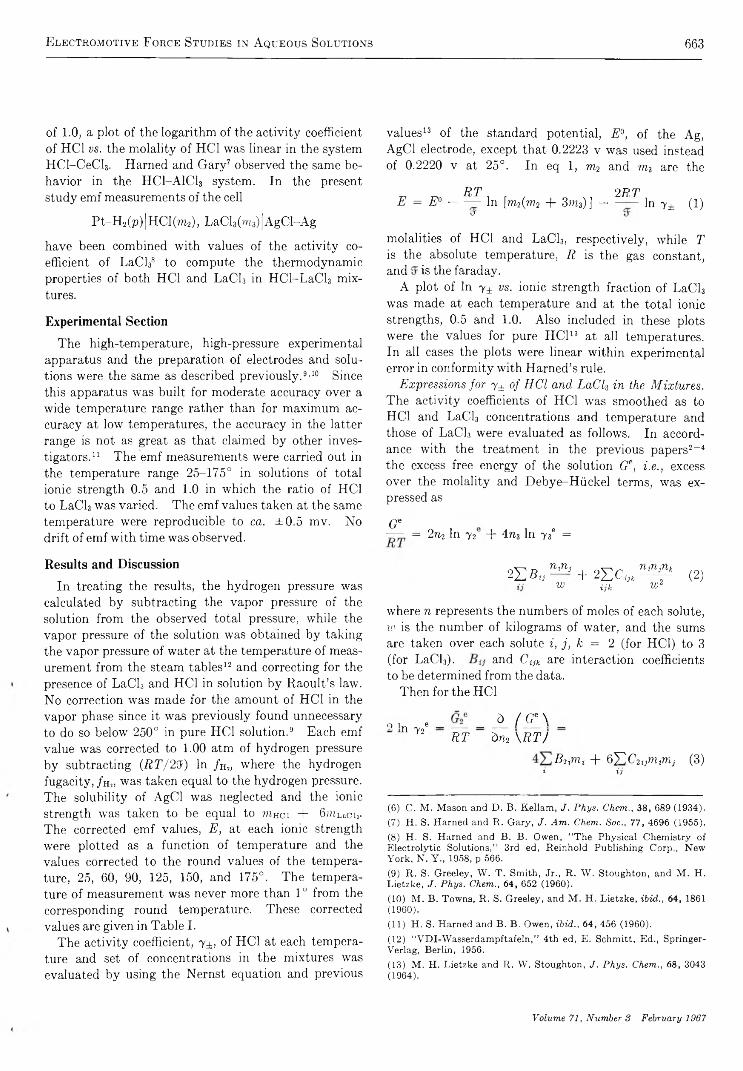
Electromotive Force Studies in A queous Solutions 663
of 1.0, a plot of the logarithm of the activity coefficient of HC1 vs. the molality of HC1 was linear in the system HCl-CeCl3. Harned and Gary6 7 observed the same behavior in the HCI-AICI3 system. In the present study emf measurements of the cell
Pt-H2(p) IHC1 (m2) , LaCl3(m3)|AgCl-Ag
have been combined with values of the activity coefficient of LaCl38 to compute the thermodynamic properties of both HC1 and LaCl3 in HCl-LaCl3 mixtures.
E x p e r i m e n t a l S e c t i o n
The high-temperature, high-pressure experimental apparatus and the preparation of electrodes and solutions were the same as described previously.9,10 Since this apparatus was built for moderate accuracy over a wide temperature range rather than for maximum accuracy at low temperatures, the accuracy in the latter range is not as great as that claimed by other investigators.11 The emf measurements were carried out in the temperature range 25-175° in solutions of total ionic strength 0.5 and 1.0 in which the ratio of HC1 to LaCI3 was varied. The emf values taken at the same temperature were reproducible to ca. ±0.5 mv. No drift of emf with time was observed.
values13 of the standard potential, E°, of the Ag, AgCl electrode, except that 0.2223 v was used instead of 0.2220 v at 25°. In eq 1, m2 and m3 are the
R T 2R TE = E ° ----- — In [m2(m2 + 3?n3) ] ----------In y± (1)
o'
molalities of HC1 and LaCl3, respectively, while T is the absolute temperature, R is the gas constant, and is the faraday.
A plot of In 7± vs. ionic strength fraction of LaCl3 was made at each temperature and at the total ionic strengths, 0.5 and 1.0. Also included in these plots were the values for pure HC113 at all temperatures. In all cases the plots were linear within experimental error in conformity with Harned’s rule.
Expressions for y± of HCl and LaCU in the Mixtures. The activity coefficients of HCl was smoothed as to HCl and LaCl3 concentrations and temperature and those of LaCl3 were evaluated as follows. In accordance with the treatment in the previous papers2-4 the excess free energy of the solution Ge, i.e., excess over the molality and Debye-Hiickel terms, was expressed asg e—- = 2n2 In y2 + 4n3 In 73° =
R e s u l t s a n d D i s c u s s i o n
In treating the results, the hydrogen pressure was calculated by subtracting the vapor pressure of the solution from the observed total pressure, while the vapor pressure of the solution was obtained by taking the vapor pressure of water at the temperature of measurement from the steam tables12 and correcting for the presence of LaCl3 and HCl in solution by Raoult’s law. No correction was made for the amount of HCl in the vapor phase since it was previously found unnecessary to do so below 250° in pure HCl solution.9 10 Each emf value was corrected to 1.00 atm of hydrogen pressure by subtracting (RT/25) In / H„ where the hydrogen fugacity, / h 2, was taken equal to the hydrogen pressure. The solubility of AgCl was neglected and the ionic strength was taken to be equal to mHci + 6??iLacij. The corrected emf values, E, at each ionic strength were plotted as a function of temperature and the values corrected to the round values of the temperature, 25, 60, 90, 125, 150, and 175°. The temperature of measurement was never more than 10 from the corresponding round temperature. These corrected values are given in Table I.
The activity coefficient, y±, of HCl at each temperature and set of concentrations in the mixtures was evaluated by using the Nernst equation and previous
2 X X -UiUjw + 2 2cijk
i jh
71 { i l jT lfrw2 (2)
where n represents the numbers of moles of each solute, ir is the number of kilograms of water, and the sums are taken over each solute i, j, k = 2 (for HCl) to 3 (for LaCl3). and Cm are interaction coefficients to be determined from the data.
Then for the HCl
0 1 e _ _ 0 / G ° \ _
11 72 RT dn2 \RTJBurnt + 6]T C2ijmim,j (3)
i i j
(6) C. M. Mason and D. B. Kellam, J. Phys. Chem., 38, 689 (1934).(7) H. S. Harned and R. Gary, J. Am. Chem. Soc., 77, 4696 (1965).(8) H. S. Harned and B. B. Owen, “ The Physical Chemistry of Electrolytic Solutions,” 3rd ed, Reinhold Publishing Corp., New York, N. Y „ 1958, p 566.(9) R. S. Greeley, W. T. Smith, Jr., R. W. Stoughton, and M. H. Lietzke, J. Phys. Chem., 64, 652 (1960).(10) M. B. Towns, R. S. Greeley, and M. H. Lietzke, ibid., 64, 1861(1960).(11) H. S. Harned and B. B. Owen, ibid., 64, 456 (1960).(12) “ VDI-Wasserdampftafeln,” 4th ed, E. Schmitt, Ed., Springer- Verlag, Berlin, 1956.(13) M. H. Lietzke and R. W. Stoughton, J. Phys. Chem., 68, 3043 (1964).
Volume 71, Number 3 February 1967
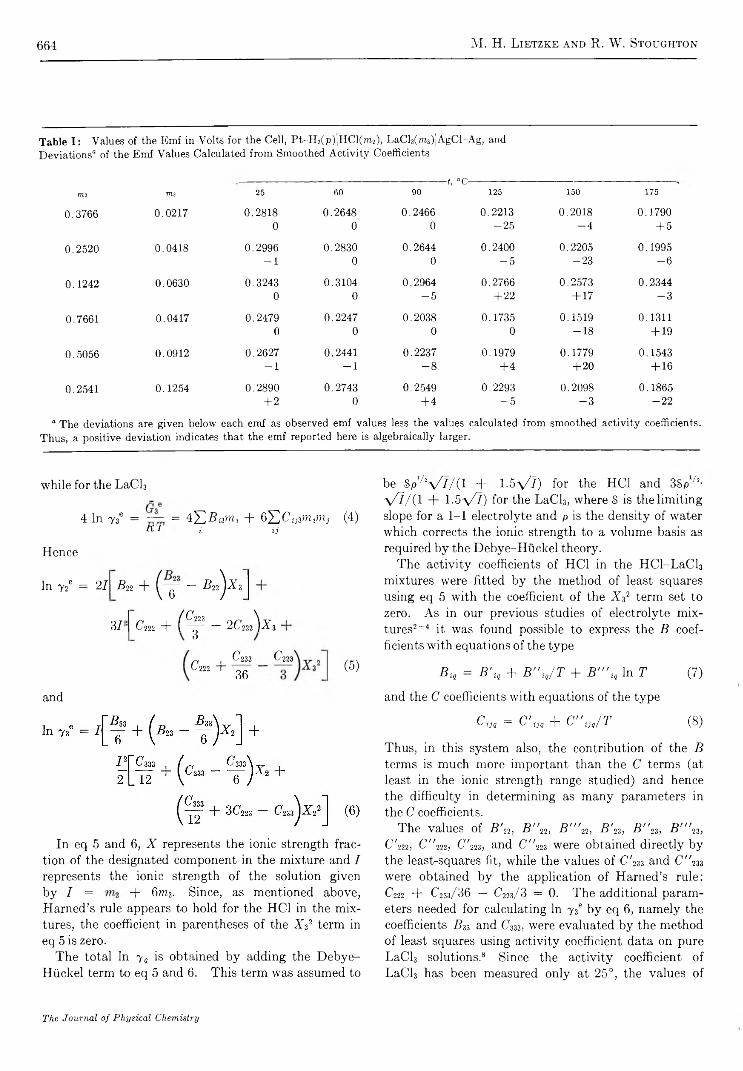
664 M. H. L ietzke and R. W . Stoughton
Table I : Values of the Emf in Volts for the Cell, Pt-H2(p)|HCl(m2), LaCl3(ms)|AgCI-Ag, and Deviations“ of the Emf Values Calculated from Smoothed Activity Coefficients
■t, °C-m 2 mz 25 60 90 125 150 175
0.3766 0.0217 0.28180
0.26480
0.24660
0.2213-2 5
0.2018- 4
0.1790+5
0.2620 0.0418 0.2996-1
0.28300
0.26440
0.2400- 5
0.2205-2 3
0.1995-6
0.1242 0.0630 0.32430
0.31040
0.2964- 5
0.2766 + 22
0.2573 + 17
0.2344- 3
0.7661 0.0417 0.24790
0.22470
0.20380
0.17350
0.1519-1 8
0.1311 + 19
0.5056 0.0912 0.2627-1
0.2441-1
0.2237-8
0.1979+4
0.1779+20
0.1543 + 16
0.2541 0.1254 0.2890 + 2
0.27430
0.2549+4
0.2293- 5
0.2098- 3
0.1865-22
“ The deviations are given below each emf as observed emf values less the values calculated from smoothed activity coefficients. Thus, a positive deviation indicates that the emf reported here is algebraically larger.
while for the LaCl3
4 In 73e = “ = 4 ^ B i3nn + 6^ (7 ii3mmi (4)til i ij
Hence
In 72e = 2 /
3 /:
R22 + ( y - ^ ) x 3
/ 223 \~~ ^ 222 UCm + ( Y — 2C222 )X 3
C222 +c 23 3 C/2 2 3c,,36 (5)
be SpVV / / ( l + 1.5V ! ) for the HC1 and 3Sph- \/7/( 1 + 1.5y/l) for the LaCl3, where S is the limiting slope for a 1-1 electrolyte and p is the density of water which corrects the ionic strength to a volume basis as required by the Debye-Hiickel theory.
The activity coefficients of HC1 in the HCl-LaCl3 mixtures were fitted by the method of least squares using eq 5 with the coefficient of the X32 term set to zero. As in our previous studies of electrolyte mixtures2*4 it was found possible to express the B coefficients with equations of the type
Bia = B'iq + B " i J T + B '" tl In T (7)
and and the C coefficients with equations of the type
In eq 5 and 6, X represents the ionic strength fraction of the designated component in the mixture and I represents the ionic strength of the solution given by I = + &ma. Since, as mentioned above,Harned’s rule appears to hold for the HC1 in the mixtures, the coefficient in parentheses of the X 32 term in eq 5 is zero.
The total In yQ is obtained by adding the Debye- Hiickel term to eq 5 and 6. This term was assumed to
Cm = C'm + C "m/T (8)
Thus, in this system also, the contribution of the B terms is much more important than the C terms (at least in the ionic strength range studied) and hence the difficulty in determining as many parameters in the C coefficients.
The values of B'n, B" 22, B "'n, B'n, B "23, B '"n, C'm, C"m, C'm, and C'm were obtained directly by the least-squares fit, while the values of C'm and C"'233 were obtained by the application of Harned’s rule: Cm + C233/36 — (7228/3 = 0. The additional parameters needed for calculating In 73® by eq 6, namely the coefficients B3S and Czi3, were evaluated by the method of least squares using activity coefficient data on pure LaCl3 solutions.8 Since the activity coefficient of LaCl3 has been measured only at 25°, the values of
The Journal of Physical Chemistry

Electromotive F orce Studies in A queous Solutions 665
Table II: Parameters of B and C Coefficients (Eq 7 and 8) for the HCl-LaCh System over the Range 25-175°
B ' n = 2.52103 B " 22 = -87.0994 D /// _JD 22 — -0.380853B ’ 23 = 29.1766 B " 23 = -1596.85 B " ' 23 = -4.17835Cf222 = 0.0303565 C" 222 — -9.44179C ' 223 = -0.0602743 C " 223 = 19.8402C ' 233 ~ -1.816124 C " 233 = 577.98684
At 25°R33 = 0.0484593 C333 = 0.00128873
Figure 1. Log yHci vs. ArLaci3 in HCl-LaCl3 mixtures.
.B33 and Cm were determined at this temperature only. Hence it was possible to compute the activity coefficient of LaCl3 in the HCl-LaCl3 mixtures at this temperature only.
The parameters for calculating the various B and C coefficients (on a common log basis) are given in Table II. Activity coefficients of HC1 and LaCl3 in the mixtures at I = 0.5 and 1.0 calculated using these parameters are shown plotted in Figures 1 and 2. Since the experimental solutions used were not at exactly I = 0.5 and 1.0, the activity coefficient values calculated from the observed emf values are not shown in the figure. However, values of the emf E were calculated using the previously determined E° values and the B and C values for the smoothed activity coefficients (Table II) for each experimental point. The algebraic difference between the observed E values and those calculated are given below the observed E values in Table I.
/1'hci
Figure 2. Log yi,aci3 vs. X Hci in HCl-LaCl3 mixtures.
The relationship between the B and C coefficients as defined by eq 7 and 8 and the a coefficient of Harned’s rule is given by eq 9. In this equation, « 23
«23 = 2( b ^ - + 3 /^ 222 - y ) (9)
is the coefficient designated by Harned as an. When eq 9 is solved at 25° using the parameters given in Table II, then a value of a23 = 0.1061 is obtained at I = 0.5 and «23 = 0.0991 at I — 1.0. This latter value may be compared with a23 = 0.0614 for HC1 in HC1- A1C13 mixtures and with an = 0.0870 for HC1 in HC1- CeCl3 mixtures, both at I = 1.0.
It is interesting to compare the activity coefficient behavior observed in the HCl-LaCfi system with that obtained in the previous mixtures studied. The plots of log 7 h c i v s . A l g o l s (Figure 1 ) are very similar to the corresponding plots in the HCl-BaCl2 mixtures except that at both I = 0.5 and 1.0, the activity coefficient of HC1 at 25° decreases even more rapidly as X 3 increases relative to the plots at the higher temperatures than it does in the HCl-BaCl2 mixtures. In
Volume 71, Number 8 February 1967
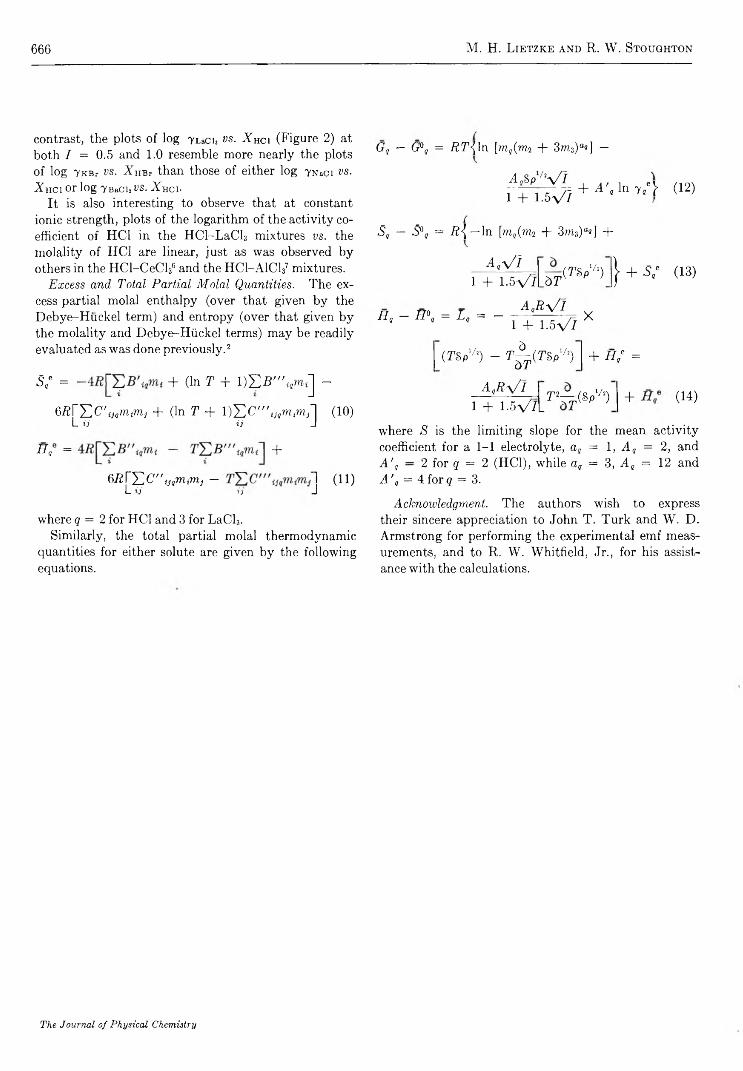
666 M. H. L ietzke and R . W. Stoughton
contrast, the plots of log 7Lacii vs. X Hci (Figure 2) at both I = 0.5 and 1.0 resemble more nearly the plots of log 7KBr vs. X HBr than those of either log ynuci vs. ■XhCI Or log YBaCli vs. .Xhci.
It is also interesting to observe that at constant ionic strength, plots of the logarithm of the activity coefficient of HC1 in the HCl-LaCl3 mixtures vs. the molality of HC1 are linear, just as was observed by others in the HCl-CeCl36 and the HC1-A1C137 mixtures.
Excess and Total Partial Molal Quantities. The excess partial molal enthalpy (over that given by the Debye-Hiickel term) and entropy (over that given by the molality and Debye-Hiickel terms) may be readily evaluated as was done previously.2
5 ; = + (In T + 1 ) E B " '# i ] -
§R[YjC'uaUiim] + (In T + l ) 2 C " " W5mim/| (10)L a ij J
Hq = +
6RrYlC"iJ1mimj — 1 (11)L ij ij J
where q = 2 for HC1 and 3 for LaCl3.Similarly, the total partial molal thermodynamic
quantities for either solute are given by the following equations.
Gq — G°g = ffT-^ln [mg(m2 + 3m3)ai] —
AaS p W l1 + 1.5 V ?
St — S% = R{ —In [me(m2 + 3m3)a«] +
+ A \ l n 7le} (12)
A .V 'I1 + 1.5 V / bT
(TSp‘/!) }+ 5 / (13)
A QRy/lHq - H \ = La = - , 7= X
1 + 1.5 V i
( / V A) - T ^ ( r s P1/!) + h ; =
AgRy/l1 + 1.5 V /L
T2V,(Sp'/!) + (14)
where S is the limiting slope for the mean activity coefficient for a 1-1 electrolyte, aq = 1, A q = 2, and A\ — 2 for q = 2 (HC1), while a„ = 3, A s = 12 and A \ = 4 for q = 3.
Acknowledgment. The authors wish to express their sincere appreciation to John T. Turk and W. D. Armstrong for performing the experimental emf measurements, and to R. W. Whitfield, Jr., for his assistance with the calculations.
The Journal of Physical Chemistry
Structure and Electrolyte P roperties in Bolaform Electrolytes 667
Structure and Electrolyte Properties in Bolaform Electrolytes. II.
The Conductance of Potassium Salts of Several Rigid Bolaform
Disulfonic Acids in Dioxane-Water Mixtures at 25°
b y B e r t R . S t a p l e s 1 a n d G o r d o n A t k i n s o n
Department of Chemistry, University of Maryland, College Park, Maryland 20740 (.Received August 23, 1966)
The conductances of potassium benzenesulfonate, potassium p-benzenedisulfonate, potassium 4,4'-biphenyldisulfonate, and potassium 4,4"-terphenyldisulfonate in dioxane-water mixtures of 0-70% dioxane content were measured at 25°. The data have been interpreted by means of the Fuoss-Onsager equation using the Fuoss-Edelson technique. The Fuoss-Edelson method for unsymmetrical charge type (bolaform) electrolytes was tested using this series of salts in which the charge separation on the divalent anion increased so that the ion deviated further and further from spherical symmetry. The distances of closest approach which were determined were compared with those found using the Fuoss association model.
I n t r o d u c t i o n
The application of strong polyvalent electrolytes such as the benzenesulfonates2 to conductance measurements established a somewhat unique base line, from which further and more meaningful comparisons of conductance data could be made.
It has been demonstrated that alkali metal and alkaline earth salts of p-benzenedisulfonic acid, H2- BDS, are unassociated in water.3 It was also shown that the Fuoss-Onsager equation can be applied to 2-2 and 1-2 salts of this type. Some of the effects of higher terms in the equation were also examined using these salts. The salts have also formed a basis for comparing association of 2-2 electrolytes in mixed solvents having dielectric constants lower than that of water.4 5
An understanding of ion-ion interaction is important, since it determines the validity of any conclusions drawn concerning the interaction of the ion with the solvent. The interaction between a pair of ions depends on the charge, size, structure, and sometimes the dipole moment of the ions as well as the solvent properties. Further dependence lies in the interaction of the solvent molecules with the ions. This investigation deals more closely with the effects of size and
structure on ion association and related electrolyte properties.
Atkinson and co-workers have investigated aryl- polysulfonates, including potassium p-benzenedisulfo- nate (K2BDS) and 4,4'-biphenyldisulfonate (K2BPDS), illustrating a systematic size increase of the anion. These aryldisulfonates are much to be preferred over alkyldisulfonates, since they possess a certain rigidity with little tendency to bend or coil as do long-chain alkyldisulfonates. This rigidity allows a more meaningful interpretation of results, since the distance separating the sulfonate groups is well defined. A study of this very useful systematic increase in the size, and at the same time, the charge separation, of an anion produced fruitful results.
Rice6 has examined models for a theoretical treat
(1) Taken in part from an M.S. Thesis submitted to the Graduate School of the University of Maryland.(2) C. J. Hallada and G. Atkinson, J. Am. Chem. Soc., 83, 3759(1961) .(3) G. Atkinson and S. Pétrucci, J. Phys. Chem., 67, 337 (1963).(4) G. Atkinson and C. J. Hallada, J. Am. Chem. Soc., 84, 721(1962) .(5) S. A. Rice, ibid., 80, 3207 (1958).
Volume 71, Number 3 February 1967

668 B ert R. Staples and G ordon A tkinson
ment of bolaform salts to obtain transport properties, and Atkinson6 has applied these models to bolaform salts in water. Since the treatment of such a model has been presented in previous papers, it need not be repeated here.
For the diquaternary ammonium bolaform ions investigated by Fuoss,7 Rice found that the Peterlin8 model of beads separated by massless rods was superior to the rigid ellipsoid model. Using the rigid bolaform ions such as the 4,4'-biphenyldisulfonate ion, BPDS2-, Atkinson found that the rigid ellipsoid model enabled one to calculate accurately the frictional coefficient of BPDS2~ from the parameters of the benzenesulfo- nate ion, BS~. Both of these results seem valid since, in the case of the diquaternary ammonium salts, a nonrigid polymethylene chain separates the charge sites, but a rigid aryl framework lies between the charge sites of the BPDS2~ ion.
Thompson, Rice, and Nagasawa9 10 have measured the diffusion coefficients of Iv2BDS, K2BPDS, and potassium 4,4,,-terphenyldisulfonate, K2TPDS. They find that the Perrin rigid ellipsoid gives a very accurate description of that property.
Starting with a relatively simple 1-1 salt, potassium benzenesulfonate (KBS), a base line is established to describe the behavior of this type of salt in dioxane- water mixtures. Using the KBS as a foundation, the effect of charge separation on the conductance, association, and the distance of closest approach, aj, of the ions is determined. Other potassium salts of aryldisulfonates representing a systematic increase in size and charge separation, a sort of “ polymeric series,” are investigated. The salts which form this series of rigid, charge-separated anions are potassium benzenesulfonate (KBS), potassium p-benzenedisulfo- nate (Iv2BDS), potassium 4,4'-biphenyldisulfonate (K2BPDS), and potassium dA^-terphenyldisulfonate (K2TPDS).
The conductances of this series of salts are measured in dioxane-water mixtures to force association due to the decreasing dielectric constant of the solvent mixtures. This enables one to observe the effect on association of the separation of charge on the anion.
From the distance of closest approach obtained through the Fuoss-Onsager equation, one should be able to tell whether the cation has any preference of position with respect to the anion when an ion pair of the type (K X )- is formed. The cation might prefer to associate with the anion at a 4 (or 4') para position, immediately in contact with the sulfonate group (Figure la), or it might prefer to take up a position somewhat between the two sulfonate groups, at a sort of an “ electrostatic equilibrium position” (Figure lb).
< Q > so3- k+
K+
- O 3 S 0
(a) (b)
Figure 1. Position of the potassium ion in (a) the associated species 1, and (b) the associated species 2.
Experimental SectionAll salts with one exception were prepared as pre
viously described.3i 10Potassium -Terphenyldisulfonate (K 2TPDS).
Exhaustive sulfonation of p-terphenyl (Eastman Organic Chemicals, Rochester, N. Y., Item 2103) produced H2TPDS which was then converted to the K2- TPDS. The K2TPDS was recrystallized three times from conductivity water.
These salts were analyzed for total cation (anion) content by converting the potassium salt to the acid using a Dowex-50 cation-exchange resin, then titrating the acid with a standard solution of NaOH. A Met- rohm potentiograph, E336, and automatic titrator were used to obtain an automatic differential plot for the equivalence point. The NaOH was standardized using a stock solution of conductance-quality KC1, which was converted to HC1 by the same cation- exchange resins.
All salts were dried at 110° to the anhydrous form and stored over CaCl2 and under vacuum, even though there was no indication that they were very hygroscopic.
Purification of Solvents. The conductivity water for the first half of the measurements was prepared by passing distilled water through two Barnstead Bantam mixed-bed ion-exchange cartridges (Type 0808) yielding water with a specific conductivity of about 0.7 X 10⁻⁶ ohm-1 cm-1 at 25°. The water for the remaining measurements was obtained by distilling distilled water in a Barnstead water still, Catalog No. EPR 1/2, Barnstead Still and Sterilizer Co., Boston, Mass. Conductivity water was then obtained with a specific conductivity of about 0.9 X 10⁻⁶ ohm-1 cm-1 at 25°.
The Union Carbide p-dioxane was purified by standard techniques11 and had a boiling point of 101.5- 101.7° and a melting point of 11.65° which compared quite well with the literature values,12 bp 101.5° and mp 11.7°.
(6) G. Atkinson and S. Pétrucci, J. Phys. Chem., 67, 1880 (1963).(7) O. V. Brody and R. M. Fuoss, ibid., 60, 156 (1956).(8) A. Peterlin, J. Chim. Phys., 47, 6, 699 (1950).(9) G. Thomson, S. A. Rice, and M. Nagasawa, J. Am. Chem. Soc., 85, 2537 (1963).(10) M. Yokoi and G. Atkinson, ibid., 83, 4367 (1961).(11) C. A. Kraus and R. A. Vingee, ibid., 56, 513 (1934).
The Journal of Physical Chemistry
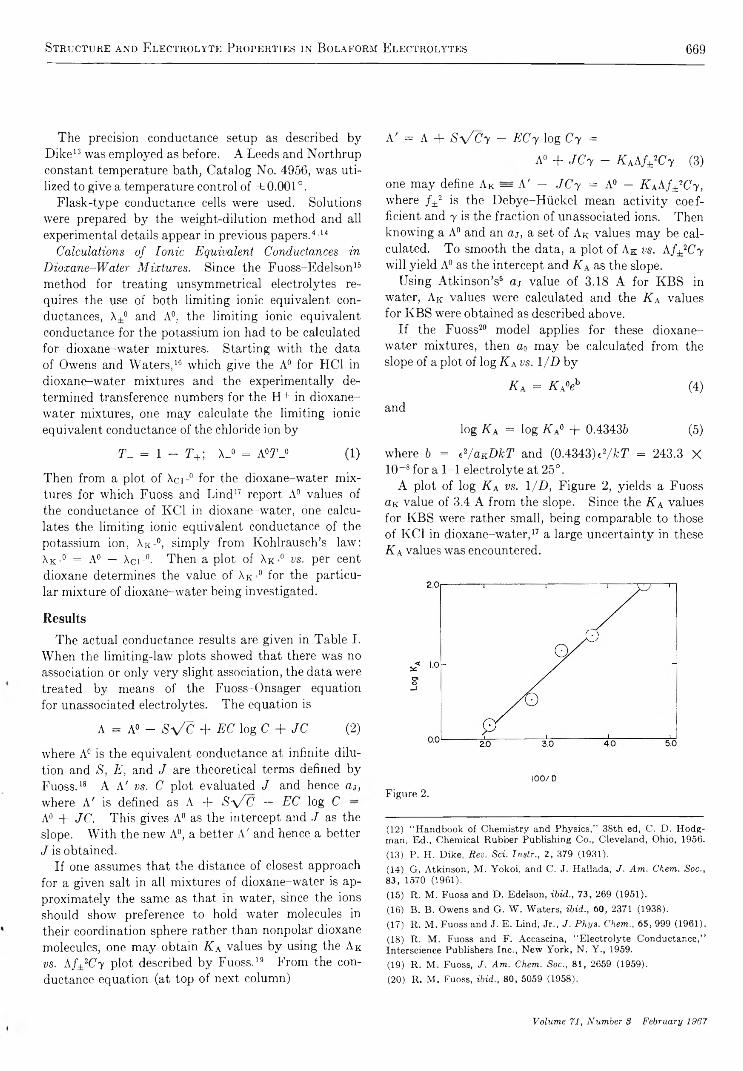
Structure and E lectrolyte P roperties in B olaform Electrolytes 669
The precision conductance setup as described by Dike12 13 was employed as before. A Leeds and Northrup constant temperature bath, Catalog No. 4956, was utilized to give a temperature control of ±0.001°.
Flask-type conductance cells were used. Solutions were prepared by the weight-dilution method and all experimental details appear in previous papers.4’14 15
Calculations of Ionic Equivalent Conductances in Dioxane-Water Mixtures. Since the Fuoss-Edelson16 method for treating unsymmetrical electrolytes requires the use of both limiting ionic equivalent conductances, X±° and A0, the limiting ionic equivalent conductance for the potassium ion had to be calculated for dioxane-water mixtures. Starting with the data of Owens and Waters,16 which give the A° for HC1 in dioxane-water mixtures and the experimentally determined transference numbers for the H+ in dioxane- water mixtures, one may calculate the limiting ionic equivalent conductance of the chloride ion by
T - = 1 - T+; X_° = A .TJ (1)
Then from a plot of Xci-° for the dioxane-water mixtures for which Fuoss and Lind17 report A° values of the conductance of KC1 in dioxane-water, one calculates the limiting ionic equivalent conductance of the potassium ion, Xk+°, simply from Kohlrausch’s law: XK+° = A° — Xci-°. Then a plot of XK+° vs. per cent dioxane determines the value of Xk +° for the particular mixture of dioxane-water being investigated.
R e s u l t s
The actual conductance results are given in Table I. When the limiting-law plots showed that there was no association or only very slight association, the data were treated by means of the Fuoss-Onsager equation for unassociated electrolytes. The equation is
A = A° — S'VC + EC log C + JC (2)
where A° is the equivalent conductance at infinite dilution and S, E, and J are theoretical terms defined by Fuoss.18 A A' vs. C plot evaluated J and hence aj, where A' is defined as A + Sy/C — EC log C — A° + JC, This gives A° as the intercept and J as the slope. With the new A°, a better A' and hence a better J is obtained.
If one assumes that the distance of closest approach for a given salt in all mixtures of dioxane-water is approximately the same as that in water, since the ions should show preference to hold water molecules in their coordination sphere rather than nonpolar dioxane molecules, one may obtain K A values by using the AK vs. Af±2Cy plot described by Fuoss.19 From the conductance equation (at top of next column)
A' = A + Sy/Cy - ECy log Cy =A° + J Cy - K AAf±2Cy (3)
one may define AK = A' — JCy = A° — K AAf±2Cy, where / ±2 is the Debye-Hückel mean activity coefficient and y is the fraction of unassociated ions. Then knowing a A° and an aj, a set of AK values may be calculated. To smooth the data, a plot of AK vs. Af±2Cy will yield A° as the intercept and K A as the slope.
Using Atkinson’s6 aj value of 3.18 A for KBS in water, AK values were calculated and the K a values for KBS were obtained as described above.
If the Fuoss20 model applies for these dioxane- water mixtures, then a0 may be calculated from the slope of a plot of log K A vs. l/D by
K a = K A°eh (4)and
log Ka = log K a° + 0.43436 (5)
where 6 = C/arJIIT and (0.4343) e2/kT = 243.3 X 10” 8 for a 1-1 electrolyte at 25°.
A plot of log K a vs. l/D, Figure 2, yields a Fuoss aK value of 3.4 A from the slope. Since the K A values for KBS were rather small, being comparable to those of KC1 in dioxane-water,17 a large uncertainty in these K a values was encountered.
100/DFigure 2.
(12) “ Handbook of Chemistry and Physics,” 38th ed, C. D. Hodg- man, Ed., Chemical Rubber Publishing Co., Cleveland, Ohio, 1956.(13) P. H. Dike, Rev. Sci. Instr., 2, 379 (1931).(14) G. Atkinson, M. Yokoi, and C. J. Hallada, J. Am. Chem. Soc., 83, 1570 (1961).(15) R. M. Fuoss and D. Edelson, ibid., 73, 269 (1951).(16) B. B. Owens and G. W. Waters, ibid., 60, 2371 (1938).(17) R. M. Fuoss and J. E. Lind, Jr., J. Phys. Chem., 65, 999 (1961).(18) R. M. Fuoss and F. Accascina, “ Electrolyte Conductance,” Interscience Publishers Inc., New York, N. Y., 1959.(19) R. M. Fuoss, J. Am. Chem. Soc., 81, 2659 (1959).(20) R. M. Fuoss, ibid., 80, 5059 (1958).
Volume 71, Number 3 February 1967
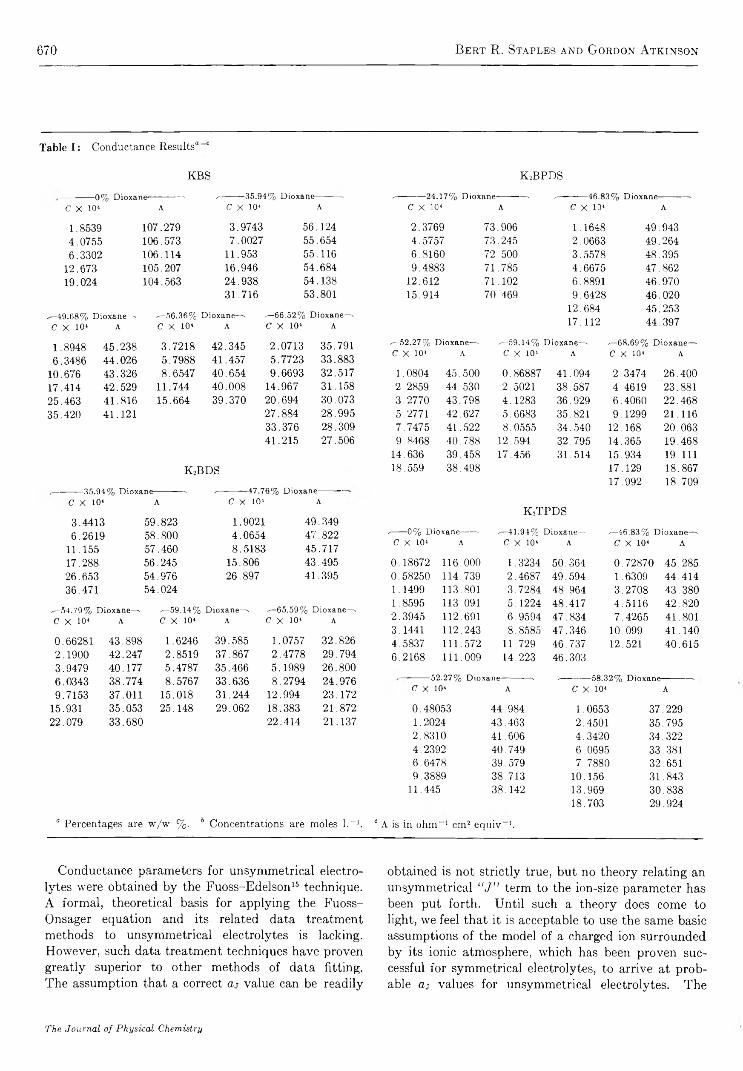
670 B ert R. Staples and G ordon A tkinson
Table I : Conductance Results“ c
KBS K2BPDS-0% D ioxan e----------------»-----------------------3 5 .9 4 % D ioxane-
C X io* A c X io< A
1 .8 5 3 9 1 0 7 .2 7 9 3 . 9 7 4 3 5 6 . 1 2 4
4 .0 7 5 5 1 0 6 .5 7 3 7 . 0 0 2 7 5 5 . 6 5 4
6 .3 3 0 2 1 0 6 .1 1 4 1 1 .9 5 3 5 5 .1 1 6
1 2 .6 7 3 1 0 5 .2 0 7 1 6 .9 4 6 5 4 . 6 8 4
1 9 .0 2 4 1 0 4 .5 6 3 2 4 . 9 3 83 1 . 7 1 6
5 4 .1 3 85 3 .8 0 1
x—49 .68% D ioxan e—* ^ 5 6 .3 6 % D ioxan e—* ✓—6 6 .5 2 % D ioxan e—^C X 10* A C X 10* A C X 10* A
1 .8 9 4 8 4 5 . 2 3 8 3 .7 2 1 8 4 2 . 3 4 5 2 .0 7 1 3 3 5 . 7 9 1
6 .3 4 8 6 4 4 . 0 2 6 5 .7 9 8 8 4 1 . 4 5 7 5 .7 7 2 3 3 3 . 8 8 3
1 0 .6 7 6 4 3 . 3 2 6 8 .6 5 4 7 4 0 . 6 5 4 9 .6 6 9 3 3 2 . 5 1 7
1 7 . 4 1 4 4 2 . 5 2 9 1 1 .7 4 4 4 0 . 0 0 8 1 4 . 9 6 7 3 1 . 1 5 8
2 5 . 4 6 3 4 1 . 8 1 6 1 5 .6 6 4 3 9 . 3 7 0 2 0 . 6 9 4 3 0 . 0 7 3
3 5 . 4 2 0 4 1 . 1 2 1 2 7 . 8 8 4 2 8 . 9 9 53 3 . 3 7 6 2 8 . 3 0 94 1 . 2 1 5 2 7 . 5 0 6
K2BDS-35 .94% D ioxan e------------- - .----------—4 7 .7 6 % D ioxane-
,-------------24 .1 7 % Dioxiane-------------■* ✓-------------46 .8 3 % D ioxan e------------- *C X 10* A C X 19* A
2.3769 73.906 1 . 1648 49.9434.5757 73 . 245 2.0663 49.2646.8160 72.500 3.5578 48.3959.4883 71.785 4.6675 47.862
12.612 71.102 6.8891 46.97015.914 70.469 9.6428 46.020
12.684 45.25317.112 44.397
^ -5 2 .2 7 % D ioxan e—* ✓—59 .14% D ioxan e—* ✓—6 8 .6 9 % D ioxan e—*C X 10* A C X 10* A C X 10* A
1 . 0804 45.500 0.86887 41. 094 2.3474 26.4002.2859 44.530 2.5021 38.587 4.4619 23.8813.2770 43.798 4.1283 36.929 6.4060 22.4685.2771 42.627 5.6683 35.821 9.1299 21.1167.7475 41.522 8.0555 34.540 12.168 20.0639.8468 40.788 12.594 32.795 14.365 19.468
14.636 39.458 17.456 31.514 15.934 19.11118.559 38.498 17.129 18.867
17.992 18.709
C X 10* A C X io* A
3 . 4 4 1 3 5 9 .8 2 3 1 .9 0 2 1 4 9 . 3 4 9
6 .2 6 1 9 5 8 . 8 0 0 4 . 0 6 5 4 4 7 . 8 2 2
1 1 .1 5 5 5 7 . 4 6 0 8 .5 1 8 3 4 5 . 7 1 7
1 7 .2 8 8 5 6 .2 4 5 1 5 .8 0 6 4 3 . 4 9 5
2 6 . 6 5 3 5 4 .9 7 6 2 6 . 8 9 7 4 1 . 3 9 5
3 6 .4 7 1 5 4 .0 2 4
*—54 .79% D ioxan e—* -— 59 .14% D ioxan e—> -—65 .5 9 % D ioxan e—sC X 10* A C X 10* A C X 10* A
0 .6 6 2 8 1 4 3 . 8 9 8 1 .6 2 4 6 3 9 .5 8 5 1 .0 7 5 7 3 2 . 8 2 6
2 . 1 9 0 0 4 2 . 2 4 7 2 .8 5 1 9 3 7 . 8 6 7 2 .4 7 7 8 2 9 . 7 9 4
3 .9 4 7 9 4 0 . 1 7 7 5 .4 7 8 7 3 5 . 4 6 6 5 . 1 9 8 9 2 6 . 8 0 0
6 .0 3 4 3 3 8 . 7 7 4 8 .5 7 6 7 3 3 . 6 3 6 8 .2 7 9 4 2 4 . 9 7 6
9 .7 1 5 3 3 7 .0 1 1 1 5 .0 1 8 3 1 . 2 4 4 1 2 .9 9 4 2 3 . 1 7 2
1 5 .9 3 1 3 5 . 0 5 3 2 5 . 1 4 8 2 9 . 0 6 2 1 8 . 3 8 3 2 1 . 8 7 2
2 2 . 0 7 9 3 3 . 6 8 0 2 2 . 4 1 4 2 1 . 1 3 7
“ Percentages are w/w % . b Concentrations are moles l.-1.
K2TPDS,-------0 % Dioxane------- • .— 41.94% Dioxane— ✓—4 6 .8 3 % Dioxane—>C X 10* A C X 10* A C X 10* A
0.18672 116.000 1.3234 50 .364 0.72870 45 .2850.58250 114.739 2.4687 49 .594 1.6309 44 .4141.1499 113.801 3.7284 48 .964 3.2708 43 .3801.8595 113.091 5.1224 48 .417 4.5116 42 .8202.3945 112.691 6.9594 47 .834 7.4265 41.8013.1441 112.243 8.8585 4 7 . 346 10.099 41 .1404.5837 111.572 11.729 46 .737 12.521 40 .6156.2168 111.009 14.223 46.303
-52 .27% D ioxan e------------- . .-------------58 .32% D ioxane-C X 10* A C X 10* A
0 . 4 8 0 5 3 4 4 . 9 8 4 1 .0 6 5 3 3 7 . 2 2 91 .2 0 2 4 4 3 . 4 6 3 2 .4 5 0 1 3 5 . 7 9 52 .8 3 1 0 4 1 . 6 0 6 4 . 3 4 2 0 3 4 . 3 2 24 .2 3 9 2 4 0 . 7 4 9 6 .0 6 9 5 3 3 . 3 8 16 .6 4 7 8 3 9 .5 7 9 7 . 7 8 8 0 3 2 .6 5 19 .3 8 8 9 3 8 . 7 1 3 1 0 .1 5 6 3 1 . 8 4 3
1 1 .4 4 5 3 8 . 1 4 2 1 3 .9 6 91 8 .7 0 3
3 0 . 8 3 82 9 . 9 2 4
° A is in ohm 1 cm2 equiv *.
Conductance parameters for unsymmetrical electrolytes were obtained by the Fuoss-Edelson15 technique. A formal, theoretical basis for applying the Fuoss- Onsager equation and its related data treatment methods to unsymmetrical electrolytes is lacking. However, such data treatment techniques have proven greatly superior to other methods of data fitting. The assumption that a correct aj value can be readily
obtained is not strictly true, but no theory relating an unsymmetrical “J” term to the ion-size parameter has been put forth. Until such a theory does come to light, we feel that it is acceptable to use the same basic assumptions of the model of a charged ion surrounded by its ionic atmosphere, which has been proven successful for symmetrical electrolytes, to arrive at probable aj values for unsymmetrical electrolytes. The
The Journal of Physical Chemistry

Structure and Electrolyte P roperties in B olaform Electrolytes 671
Table I I : Conductance Parameters
%Dioxane A0 x_° J aj K a A°tjo D
0.0 1 0 8 . 5 1 7 3 . 5 2 “ 3 4 . 9 9
KBS( 3 . 1 8 ) ‘ 0 . 9 7 1 7 8 . 5 4
3 5 . 9 4 5 7 . 5 1 3 8 . 6 5 1 8 . 8 6 3 1 8 . 2 4 . 1 1 1.6 0 . 9 4 2 4 8 . 0 64 9 . 6 8 4 6 . 4 5 3 0 . 2 8 1 6 . 1 7 ~ 3 0 7 ~ 2 . 2 3 . 5 0.886 3 6 . 2 55 6 . 3 6 4 3 . 3 5 2 7 . 9 5 1 5 . 4 0 ~ 4 5 0 ~ 2 .1 1 4 . 3 0 . 8 5 4 3 0 . 5 16 6 . 5 2 3 8 . 1 2 2 4 . 5 0 1 3 . 6 2 2 0 9 7 5 . 1 6 9 5 . 4 0 . 7 4 4 2 1 . 7 8
0.0 1 3 1 . 9 5 7 3 . 5 2 “ 5 8 . 4 3
K2BDS( 2 1 1 8 ) ' ' ( 4 . 5 8 y 1 . 1 8 1 7 8 . 5 4
3 5 . 9 4 6 4 . 0 0 3 8 . 6 5 2 5 . 3 5 3 6 2 5 4 . 1 3 1 . 0 4 7 4 8 . 0 64 7 . 7 6 5 2 . 9 2 3 1 . 1 9 2 1 . 7 3 5 4 0 5 3.33 3 6 . 0 0 . 9 9 3 3 7 . 9 05 4 . 7 9 4 6 . 2 0 2 8 . 4 8 1 7 . 7 2 7 7 4 0 3 . 1 1 1 1 8 . 6 0 . 9 0 6 3 1 . 8 65 9 . 1 4 4 3 . 6 0 2 7 . 0 3 1 6 . 5 7 1 0 8 0 3 3 . 1 2 2 9 2 . 8 0 . 8 6 4 2 8 . 1 26 5 . 5 9 3 6 . 3 5 2 4 . 7 7 1 1 . 5 8 1 8 3 6 0 3 . 2 8 1 0 6 3 . 0 0 . 7 1 0 2 2 . 5 8
0.0 1 2 2 . 5 1 7 3 . 5 2 “ 4 8 . 9 9
K2BPDS(4. so y 1 . 0 9 6 7 8 . 5 4
2 4 . 1 7 7 7 . 1 8 4 9 . 2 9 2 7 . 8 9 3 1 0 4 5 . 4 6 1 . 0 6 5 5 8 . 1 84 6 . 8 3 5 2 . 9 1 3 1 . 6 4 2 1 . 2 7 5 8 4 5 4 . 2 7 2 3 . 1 0 . 9 8 5 3 8 . 7 15 2 . 2 7 4 8 . 5 1 2 9 . 3 9 1 9 . 1 2 7 4 1 8 3 . 7 9 5 2 . 2 0 . 9 4 3 3 4 . 0 25 9 . 1 4 4 3 . 8 3 2 7 . 0 3 1 6 . 8 0 1 1 3 2 4 3 . 3 2 2 5 6 . 0 0.868 2 8 . 1 26 8 . 6 9 3 3 . 6 0 2 3 . 6 7 9 . 9 3 2 5 8 3 6 3 . 5 2 9 8 0 . 0 0 . 6 4 9 1 9 . 9 2
0.0 1 1 6 . 0 8 7 3 . 5 2 “ 4 2 . 4 6
K2TPDS2 6 5 4 7 . 1 0 — 1 1 .6 1 . 0 3 9 7 8 . 5 4
4 1 . 9 4 5 2 . 7 7 3 4 . 1 9 1 8 . 5 8 4 6 8 7 4 . 9 4 4 . 1 2 0 . 9 3 2 4 2 . 9 44 6 . 8 3 4 7 . 1 3 3 1 . 6 2 1 5 . 5 1 5 4 6 0 4 . 6 4 5 1 . 2 0 . 8 8 4 3 8 . 7 15 2 . 2 7 4 5 . 8 2 2 9 . 3 9 1 6 . 4 3 7 3 6 0 4 . 1 5 2 1 4 . 0 0 . 8 9 0 3 4 . 0 25 8 . 3 2 4 0 . 2 8 2 7 . 2 9 1 2 . 9 9 1 0 1 6 3 3 . 7 7 ~ 1 3 9 . 4 0 . 7 9 7 2 8 . 8 3
0.0 9 2 . 0 6 5 0 . 1 1 “ 4 1 . 9 5
NA2TPDS1 8 9 0 6.0 4 . 1 0 . 8 2 4 7 8 . 5 4
“ Limiting ionic conductance of K + in water taken from H. S. Harned and B. B. Owens, “The Physical Chemistry of Electrolyte Solutions,” 3rd ed, Reinhold Publishing Corp., New York, N. Y., 1958, Chapters 4 and 8. b Values in parentheses are taken from previous investigations.3’6’10
major wrong assumption which is made is that the ion is spherical, but the ion is most probably ellipsoidal, as borne out by the good agreement with Rice’s treatment.
A good approximation for the association constant was obtained from the Fuoss-Edelson technique for unsymmetrical electrolytes. This K A was then used in the Fuoss-Onsager equation to obtain an estimatedaj. In most cases, the A'-C method was used to obtain an aj value. Data for all salts are presented in Table II.
Associated Symmetrical Electrolytes. When the limiting-law plots indicated association, the data were treated by means of the Fuoss-Onsager19 equation for associated electrolytes
A = A° — Sy/Cy + ECy log Cy +JCy - ICjJ^ACy (6)
The Fuoss “ Y—X ” method of determining the three parameters, A°, aj, and K A, was used and has been presented in other works.19 A series of successive approximations was programmed for an IBM 7090/ 7094 computer and the “ best” A°, aj, and K A values were found. The details of the computer program are available from the authors.
Associated Unsymmetrical Electrolytes. The problem of treating unsymmetrical electrolytes lies in the fact that the associated species MA~ still conducts. The Fuoss-Edelson technique was used in the data analysis for the unsymmetrical electrolytes. The basic assumptions made were (1) the second association to form the nonconducting species as M + + MA~ = M2A was negligible at such low concentrations; (2) the limiting ionic conductance of the associated species, M A_, is approximately equal to one-half the limiting ionic conductance of the anion, A 2-, since the
Volume 71, Number 3 February 1967
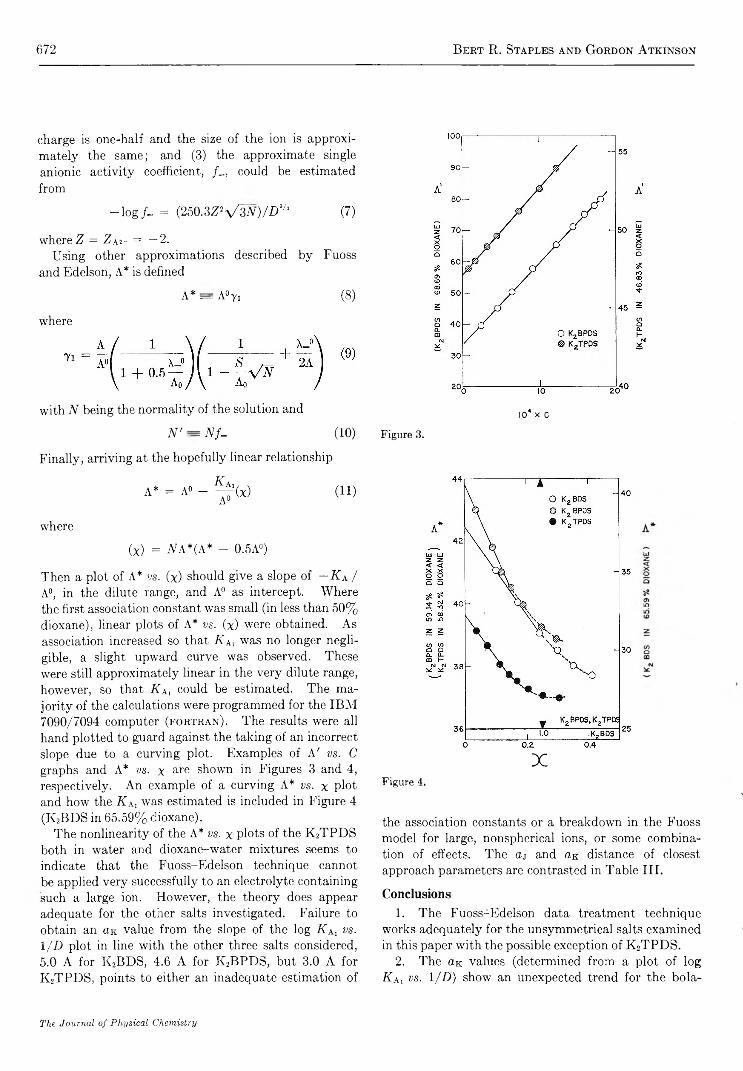
672 B eet R. Staples and G ordon A tkinson
charge is one-half and the size of the ion is approximately the same; and (3) the approximate single anionic activity coefficient, f=, could be estimated from
- l o g /_ = (250.3ZV3AO/-D!/2 (7)
where Z = Z as- = —2.Using other approximations described by Fuoss
and Edelson, A* is defined
A* = A°yi (8)
where
with N being the normality of the solution and
N' = N f- (10)
Finally, arriving at the hopefully linear relationship
A* = A» - % ( x ) (11)A0
where
(x) = NA*(A* - 0.5A0)
Then a plot of A* vs. (x) should give a slope of — K aJ A0, in the dilute range, and A0 as intercept. Where the first association constant was small (in less than 50% dioxane), linear plots of A* vs. (x) were obtained. As association increased so that K a2 was no longer negligible, a slight upward curve was observed. These were still approximately linear in the very dilute range, however, so that K Al could be estimated. The majority of the calculations were programmed for the IBM 7090/7094 computer (f o r t r a n ) . The results were all hand plotted to guard against the taking of an incorrect slope due to a curving plot. Examples of A' vs. C graphs and A* vs. x are shown in Figures 3 and 4, respectively. An example of a curving A* vs. x plot and how the K Al was estimated is included in Figure 4 (IGBDS in 65.59% dioxane).
The nonlinearity of the A* vs. x plots of the K2TPDS both in water and dioxane-water mixtures seems to indicate that the Fuoss-Edelson technique cannot be applied very successfully to an electrolyte containing such a large ion. However, the theory does appear adequate for the other salts investigated. Failure to obtain an a-a value from the slope of the log K Al vs. 1/D plot in line with the other three salts considered,5.0 A for K*BDS, 4.6 A for K2BPDS, but 3.0 A for K2TPDS, points to either an inadequate estimation of
io4 x cFigure 3.
XFigure 4.
the association constants or a breakdown in the Fuoss model for large, nonspherical ions, or some combination of effects. The aj and <Ik distance of closest approach parameters are contrasted in Table III.
C o n c l u s i o n s
1. The Fuoss-Edelson data treatment technique works adequately for the unsymmetrical salts examined in this paper with the possible exception of K2TPDS.
2. The aK values (determined from a plot of log Kai v s . 1 /D) show an unexpected trend for the bola-
The Journal of Physical Chemistry
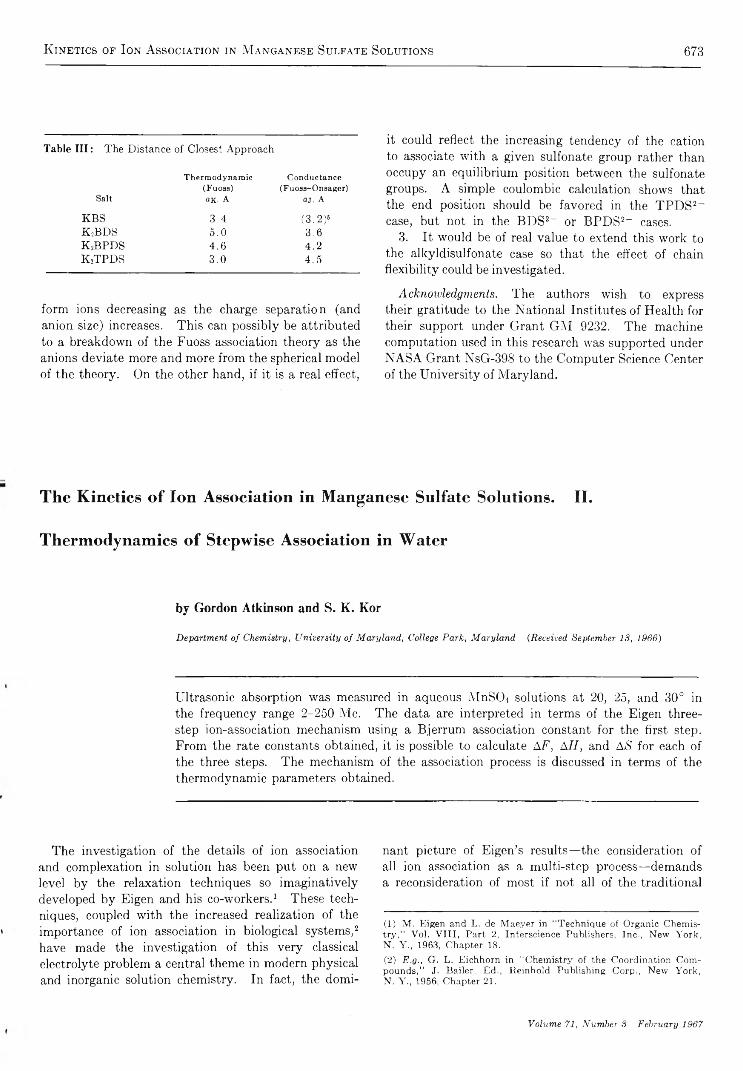
K inetics of Ion A ssociation in M anganese Sulfate Solutions 673
Table III : The Distance of Closest Approach
Salt
Thermodynamic (Fuoss)
o k , A
Conductance (Fuoss-Onsager)
aj, A
KBS 3.4 (3 .2)6K 2BDS 5.0 3.6KjBPDS 4.6 4.2K îTPDS 3.0 4.5
form ions decreasing as the charge separation (and anion size) increases. This can possibly be attributed to a breakdown of the Fuoss association theory as the anions deviate more and more from the spherical model of the theory. On the other hand, if it is a real effect,
it could reflect the increasing tendency of the cation to associate with a given sulfonate group rather than occupy an equilibrium position between the sulfonate groups. A simple coulombic calculation shows that the end position should be favored in the TPDS2- case, but not in the BDS2- or BPDS1 2“ cases.
3. It would be of real value to extend this work to the alkyldisulfonate case so that the effect of chain flexibility could be investigated.
Acknowledgments. The authors wish to express their gratitude to the National Institutes of Health for their support under Grant GM 9232. The machine computation used in this research was supported under NASA Grant NsG-398 to the Computer Science Center of the University of Maryland.
The Kinetics of Ion Association in Manganese Sulfate Solutions. II.
Thermodynamics of Stepwise Association in Water
by Gordon Atkinson and S. K. Kor
Department of Chemistry, University of Maryland, College Park, Maryland {Received September 13, 1966)
Ultrasonic absorption was measured in aqueous MnSCh solutions at 20, 25, and 30° in the frequency range 2-250 Me. The data are interpreted in terms of the Eigen three- step ion-association mechanism using a Bjerrum association constant for the first step. From the rate constants obtained, it is possible to calculate AF, AH, and AS for each of the three steps. The mechanism of the association process is discussed in terms of the thermodynamic parameters obtained.
The investigation of the details of ion association and complexation in solution has been put on a new level by the relaxation techniques so imaginatively developed by Eigen and his co-workers.1 These techniques, coupled with the increased realization of the importance of ion association in biological systems,2 have made the investigation of this very classical electrolyte problem a central theme in modern physical and inorganic solution chemistry. In fact, the domi
nant picture of Eigen’s results—the consideration of all ion association as a multi-step process—demands a reconsideration of most if not all of the traditional
(1) M . Eigen and L. de M aeyer in “ Technique of Organic Chemistry ,” Vol. V III , Part 2, Interscience Publishers, Inc., New Y ork, N. Y ., 1963, Chapter 18.(2) E.g., G. L. Eichhorn in “ Chemistry o f the Coordination Com pounds,” J. Bailer, Ed., Reinhold Publishing Corp., New York, N. Y ., 1956, Chapter 21.
Volume 71, Number 3 February 1967
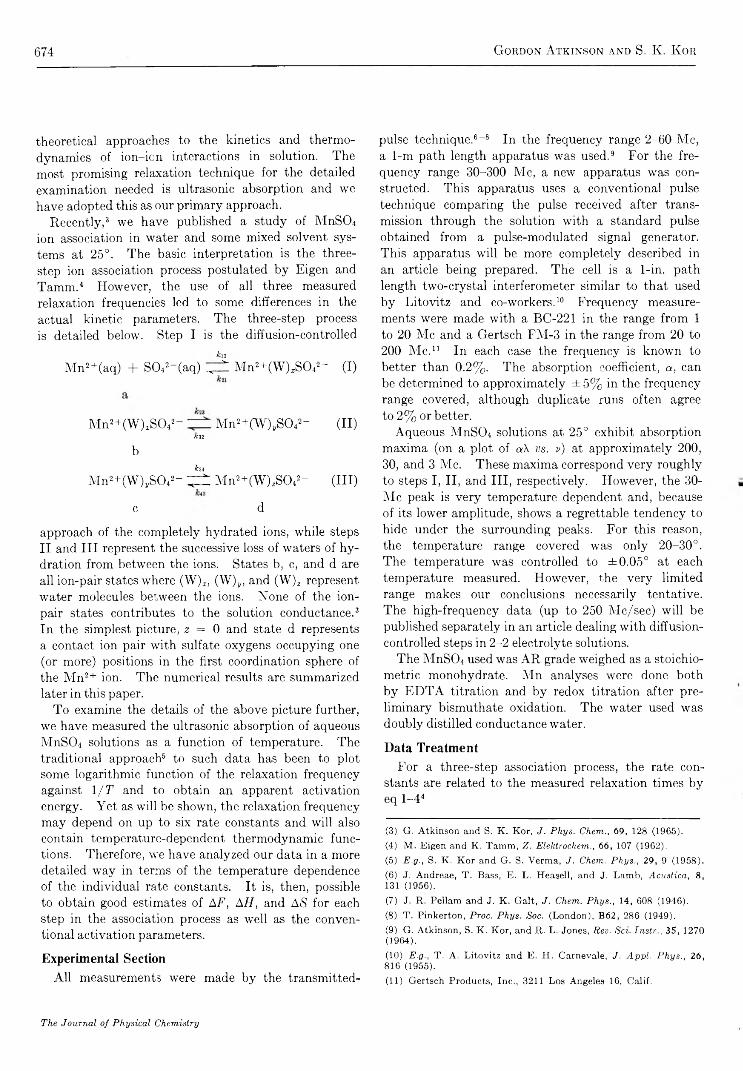
674 G ordon A tkinson and S. K. K or
theoretical approaches to the kinetics and thermodynamics of ion-ion interactions in solution. The most promising relaxation technique for the detailed examination needed is ultrasonic absorption and we have adopted this as our primary approach.
Recently,3 we have published a study of MnS04 ion association in water and some mixed solvent systems at 25°. The basic interpretation is the three- step ion association process postulated by Eigen and Tamm.4 5 However, the use of all three measured relaxation frequencies led to some differences in the actual kinetic parameters. The three-step process is detailed below. Step I is the diffusion-controlled
¿12Mn2+(aq) + S042-(aq) v. 1 Mn2+(W)zS042- (I)
Mn2+(W )1S042_ Mn2+(W )i/S042_ (II)kz2
b& 3 4
M n^W ^SC h2- ^ Mn2+(W ),S042- (III)
c d
approach of the completely hydrated ions, while steps II and III represent the successive loss of waters of hydration from between the ions. States b, c, and d are all ion-pair states where ('W)x, (W)„, and (W )2 represent water molecules between the ions. None of the ion- pair states contributes to the solution conductance.3 In the simplest picture, z = 0 and state d represents a contact ion pair with sulfate oxygens occupying one (or more) positions in the first coordination sphere of the Mn2+ ion. The numerical results are summarized later in this paper.
To examine the details of the above picture further, we have measured the ultrasonic absorption of aqueous MnS04 solutions as a function of temperature. The traditional approach6 7 8 to such data has been to plot some logarithmic function of the relaxation frequency against 1/T and to obtain an apparent activation energy. Yet as will be shown, the relaxation frequency may depend on up to six rate constants and will also contain temperature-dependent thermodynamic functions. Therefore, we have analyzed our data in a more detailed way in terms of the temperature dependence of the individual rate constants. It is, then, possible to obtain good estimates of AF, AH, and AS for each step in the association process as well as the conventional activation parameters.
E x p e r i m e n t a l S e c t i o n
All measurements were made by the transmitted-
pulse technique.6-8 In the frequency range 2-60 Me, a 1-m path length apparatus was used.9 For the frequency range 30-300 Me, a new apparatus was constructed. This apparatus uses a conventional pulse technique comparing the pulse received after transmission through the solution with a standard pulse obtained from a pulse-modulated signal generator. This apparatus will be more completely described in an article being prepared. The cell is a 1-in. path length two-crystal interferometer similar to that used by Litovitz and co-workers.10 Frequency measurements were made with a BC-221 in the range from 1 to 20 Me and a Gertsch FM-3 in the range from 20 to 200 Me.11 In each case the frequency is known to better than 0.2%. The absorption coefficient, a, can be determined to approximately ± 5% in the frequency range covered, although duplicate runs often agree to 2% or better.
Aqueous MnS04 solutions at 25° exhibit absorption maxima (on a plot of a\ vs. v) at approximately 200, 30, and 3 Ale. These maxima correspond very roughly to steps I, II, and III, respectively. However, the 30- Mc peak is very temperature dependent and, because of its lower amplitude, shows a regrettable tendency to hide under the surrounding peaks. For this reason, the temperature range covered was only 20-30°. The temperature was controlled to ±0.05° at each temperature measured. However, the very limited range makes our conclusions necessarily tentative. The high-frequency data (up to 250 Alc/sec) will be published separately in an article dealing with diffusion- controlled steps in 2-2 electrolyte solutions.
The MnS04 used was AR grade weighed as a stoichiometric monohydrate. Mn analyses were done both by EDTA titration and by redox titration after preliminary bismuthate oxidation. The water used was doubly distilled conductance water.
D a t a T r e a t m e n t
For a three-step association process, the rate constants are related to the measured relaxation times by eq 1-44
(3) G. Atkinson and S. K. Kor, J. Phys. Chem., 69, 128 (1965).(4) M. Eigen and K. Tamm, Z. Elektrochem., 66, 107 (1962).(5) E.g., S. K. Kor and G. S. Verma, J. Chem. Phys., 29, 9 (1958).(6) J. Andreae, T. Bass, E. L. Heasell, and J. Lamb, Acustica, 8, 131 (1956).(7) J. R. Pellam and J. K. Galt, J. Chem. Phys., 14, 608 (1946).(8) T. Pinkerton, Proe. Phys. Soc. (London), B62, 286 (1949).(9) G. Atkinson, S. K. Kor, and R. L. Jones, Rev. Sci. Instr., 35, 1270 (1964).(10) E.g., T. A. Litovitz and E. H. Carnevale, J. Appl. Phys., 26, 816 (1955).(11) Gertsch Products, Inc., 3211 Los Angeles 16, Calif.
The Journal of Physical Chemistry
K inetics of Ion Association in M anganese Sulfate Solutions 675
( 1 / t i ) = 2 ir v mi = h i + h i ' ( 1 )
where
klv = k n v C lJ f + ^ 7 “) (2)
(1 /Xu) = 27Ti'mII =
hi + ( ; ----- :—T i^ 23 = ^32 23' (^)\ h r + h i )
(1 /tiii) = 27rrmiu =
hz + ( ------:—— ^ 34 = hz + hi' (4)\ k n ' ~ r h i /
where a is the degree of association in step I at C, C is concentration of MnS04, y± the mean activity coefficient of ions in state a at concentration C, rmi the frequency of maximum absorption for concentration C, and r4 the relaxation time for step i. In the data analysis, we have made the following assumptions.
1. Step I can be described using the Fuoss-Bjerrum association model.12 An equilibrium constant can be calculated for a given temperature with the Fuoss equation and a distance parameter equal to the sum of the ionic radii plus the diameter of two water molecules. The calculations of the rate constant are not very sensitive to the actual distance chosen.
2. The activity coefficient, y±, can be calculated using the extended Debye-Hiickel equation. Brubaker has demonstrated the excellence of this for an unassociated 2-2 salt.13 The measured activity coefficients for MnSCh include a contribution from association and cannot be used.
3. Activity coefficients can be ignored for states b, c, and d. Rice has shown that the activity of dipoles is not very sensitive to changes in the charge separation.
With these assumptions, we can define a quantity 6(C) as
/ d In 7±2\ ...m - (»)
and write
Kn = CaW±2Ch (9)
A small computer program is used to calculate 8(C) for a given Ku. Plots of 2irvmi vs. the quantities in brackets in eq 6, 7, and 8 are straight lines yielding the rate constants as slope and intercept. This method is very useful for smoothing the (Vmj, C) data.
The amplitudes of the relaxation maxima can be used to calculate approximate values for AV for each step of the ion-association process. The equations are derived and discussed by Eigen and Tamm.14 Unfortunately, for reactions involving a AH, it is difficult to be certain of the A7 values. The problem is further exacerbated by the occurrence of AV in a squared term and the fact that the thermodynamic parameters are coupled in the same way that is indicated by the rate-constant expression.
R e s u l t s
At least two different concentrations (0.01, 0.05, and 0.10 M) were run at each of the three temperatures,20.0, 25.0, and 30.0°. Figure 1 shows a typical relaxation spectrum for a given temperature and concentration. At least two duplicate runs were always made. For single relaxations, the Mikhailov technique16 can be used for data analysis to obtain the relaxation frequencies. However, in the case of multiple relaxations, the following approach has proved necessary. The measured excess absorption per wavelength, a'X, can be written as
(MAjexpti = (a /X)x + (a'X)n + (a'X)in
where
(a'X)i = 2(a'X)i,maxíor¿
In the case of MnS04, the peaks for steps I and III are large and can be evaluated using a graphical technique to give n , (a'X)i.max, Tin, and Then, m ,(a ,X)n,max is obtained from
2(ûi X)llimaxcorn
1 + c o W
27rx'mix = hi +
2Tri'mi = hi + h i [0(C)} 6(C)
lK 12 + 8(C). h\
27rymin — ki 3 + _kzi + &(C)h3_ks.
(6)
hi + $(C)/c23 (7)
HC)hz(8)
where d is defined in eq 9.
(MX)exptl — [(a'X)l + (a'X)ni]calcd
The parameters found for steps II and III are given in Table I. The relaxation frequencies are then treated
(12) R. M. Fuoss and C. A. Kraus, J. Am. Chem. Soc., 79, 3304 (1957).(13) C. H. Brubaker, Jr., and P. G. Rasmussen. J. Phys. Chem., 67, 330 (1963).(14) M. Eigen and K. Tamm, Z. Elektrochem., 66, 93 (1962).(15) I. G. Mikhailov, Dokl. Akad. Nauk SSSR, 89, 991 (1953).
Volume 71, Number 3 February 1967
676 G ordon A tkinson and S. K. K or
FREQUENCY (M H z)
Figure 1.
as described under the data treatment section above to yield the rate constants. These results are summarized in Table II together with the individual step equilibrium constants.
Table I : Relaxation Parameters for MnS04 in H20
Concn, I'm,■Step III--------------«
104 (a'x),/--------------Step II
10< (a'X)c M c/seo nepers M c/sec nepers
0.01
to o.
o
0.05 2.4 10.1 38.0 2.00.10 2.5 19.6 39.0 3.8
0.01 2.725°3.2 32.0 0.6
0.05 3.1 10.1 34.0 2.10.10 3.3 18.4 35.0 3.7
0.01
OOCO
0.05 4.1 10.1 38.0 2.00.10 4.5 17.3 39.0 3.6
With the present high-frequency apparatus it was not possible to go high enough in frequency to completely define the step I relaxation frequency. The estimated value at 25° was in good agreement with the assumption of a diffusion-controlled step. For the 20 and 30° data, only the calculated Kn is necessary for further data treatment.
The derived activation parameters are given in Table III. Step II is distinctly exothermic while step III is definitely endothermic. We can now calculate approximate thermodynamic functions for the
Table II: Rate Constants for MnS04 Ion Association“
20.0° 25 .0° 30.0°
10-w X kn, M ~' sec“ 1 4.2IO-8 X ka, sec-1 8.0Ku, M (Bjerrum) 0.02022 0.01920 0.01856
IO-7 X kn, sec-1 6.52 6.73 6.94IO“8 X kii, sec“ 1 I .64 I .87 2 .12Kn 2.52 2.7g 3.05IO-7 X fc34, sec-1 3.46 4.75 6.62IO-7 X ki3, sec-1 I.O3 1.35 1.73K , 4 0.297 0.284 0.261
“ More figures are carried than is justified by the accuracy of the data so that rounding off errors are not propagated.
three steps by the following straightforward approach. All parameters are given for the process written as association, not dissociation: (a) AF4° from — RT InK; (b) AHt° from (AHn°* - A a n d (c) ASi° from (AH ° — AF°)/T. The derived values are presented in Table IV.
Table III: MnS04 Association in Water, < \ H ° 4= Values (kcal/mole)
Forward Reverse
Step II o.68 3.9lStep III 10.4 8.72
I 11 III
“ free” ions a ^ pair b !< > pair c _ pair d(solvent
separated)(solvent
separated)(contact)
Table IV : Stepwise Thermodynamic Functions
Step I Step II Step III
s(this
work)s
(thermo)
AF ° , kcal/mole“ -2 .3 0.6 - 0 .7 - 2 .9 -3 .0 7A H 0 , kcal/mole“ 1.5 - 3 .2 1.6 3.2 3.37AiS°, eu/mole“ 13 -1 3 8 21 22.6
“ AF s ° , AiSz°, AH s ° (thermo) from G. H. Nancollas, J . C h e m .
S o c . , 3934 (1959). The estimated errors in AF ° and AH ° are ±30% and the error in AS ° is ±40% .
The S values refer to the over-all process, that is, is defined by
P] + [3] + [4]
The Journal of Physical Chemistry

K inetics of I on A ssociation in M anganese Sulfate Solutions 677
The last column contrasts the 2 values with those found by classical thermodynamic methods. It should be noted that the step I values are from the calculated Bjerrum association constants and that the 2 values are calculated from the K z values, not from the weighted average of the three steps. This causes a discrepancy that is not outside the error of the method.
D i s c u s s i o n o f R e s u l t s
As Eigen has previously stated, step I is very definitely the diffusion-controlled approach of the two ions. Our “ measured” rate, based on an assumed Bjerrum K n, is 4.2 X 10¹⁰ M -1 sec-1, while Eigen’s assumed rate based on the diffusion coefficients was 4 X 10¹⁰ M~l sec-1. This very adequate agreement is good support for the essential correctness of the Debye approach to the diffusion step.16 This has implications beyond the immediate scope of this paper since the same model is used for the basis of the classical equations governing salt and solvent effects on ion-ion processes in solutions. It encourages us in our belief that processes like step I can be adequately described using the conventional solution parameters: solvent dielectric constant, solvent viscosity, ion charges, and ionic strength. It should be noted that step I is the only step involving a substantial AF°. As has been pointed out,17'18 the various bivalent metal ions should behave almost identically in this step since they are still completely hydrated. A synthesis of the two previous statements shows the basic reason why the various 2-2 sulfates have almost identical activity coefficients in water.19 Step I is definitely endothermic (as is the over-all process) with a substantial positive AS° overriding the positive AH° to give a negative AF°. One can further examine the entropy term along the lines suggested by Gurney.20 Gurney divides the entropy change into cratic and unitary terms with the cratic term depending only on a change in the number of particles.
AS0 = ASU° + ASC° = 13 eu
For An = — 1 (two ions going to one ion pair), AiSc° = —8.0 eu/mole. Therefore
AiSu° = 13 eu + 8 eu = 21 eu
It is apparent that we have a strong net disordering
effect in spite of the cratic, ordering term. At the present time, it is only possible to attribute this to rather profound changes in the solvent shell surrounding the ion pair and/or a possible release of first-shell coordinated water.21 Steps II and III represent the expulsion of water molecules from between the Mn2 + and S042- ions. From the close correspondence between ks4 and the rate of exchange of H20 on the M n2+ ion, step III seems primarily dependent on cation properties. Presumably then, step II depends more on the anion. Both steps are small free energies caused by counterbalancing of enthalpy and entropy effects. Unfortunately, the AH° and AiS° terms are small enough that many possible mechanisms could be proposed to account for them. It should be pointed out that the most probable source for the entropy changes is rearrangement of the solvent shell immediately around the ion pair. What effect changes in symmetry of the SO42- ion have on the terms is very hard to discuss quantitatively. In fact, a definitive statement of how many of the S042- oxygens can and will coordinate to the Mn2+ does not seem possible.
In view of the very limited temperature range and limited accuracy of ultrasonic data, further speculation seems fruitless at this point. Work is in progress on other salt systems and on direct evaluation of the thermodynamic parameters of the diffusion-controlled step. When these data become available, we hope that a more definitive discussion of the problem will be possible.
Acknowledgment. We wish to acknowledge the support of the Army Research Office (Durham) through Grant No. DA-ARO(D)-31-124-G502. We also wish to express our gratitude to Dr. H. Tsubota for his aid in the analytical chemistry.
(16) P. Debye, Trans. Electrochem . Soc., 82, 265 (1942).(17) J. E. Prue in “ Chemical Physics of Ionic Solutions,” B. E. Conway and R. G. Barradas, Ed., John W iley and Sons, Inc., New York, N. Y ., 1966, Chapter 9.(18) G. Atkinson, see ref 17, p 281.(19) R . A. Robinson and R. H. Stokes, “ Electrolyte Solutions,” Butterworth and Co., Ltd., London, 1954, Appendix 8.10.(20) R. W . Gurney, “ Ionic Processes in Solution,” M cGraw-Hill Book Co., Inc., New York, N. Y ., 1953.(21) J. F. Duncan and D. L. Kepert in “ The Structure of Electrolytic Solutions,” W . J. Hamer, Ed., John W iley and Sons, Inc., New York, N. Y ., 1959, Chapter 25.
Volume 71, Number 3 February 1967
678 E. A. T h . Y erdurmen
Mechanism of Oxygen Isotopic Exchange in Mixtures of Carbon
Monoxide and Oxygen in a Quartz Vessel
by E. A. Th. Yerdurmen
F.O.M.—Jnstituut voor Atoom, en Molecuulfysica, Amsterdam, The Netherlands (Received October 3, 1966)
The mechanism of the oxygen isotopic exchange processes occurring in a thermally reacting dry mixture of natural CO and 0 2, predominantly enriched in the 180 180 species, has been studied between 500 and 580° and within the pressure range 28-144 torr, in a quartz reaction vessel. Three independent processes occur: (1) formation of C 02; (2) oxygen isotopic exchange between CO and 0 2; and (3) scrambling of oxygen isotopes in 0 2. Scrambling and C 0 -0 2 isotopic exchange are retarded practically equally by the addition of considerable amounts of foreign gases, He, Ar, Xe, N2, C 02, and SFG, whereas the rate of C 02 formation remains practically constant. Relative efficiencies of the various foreign gases for retardation of the exchange processes have been obtained. Both scrambling and C 0 -0 2 isotopic exchange are completely inhibited by the addition of small amounts of NO. The processes involved show similar apparent activation energies between 30 and 35 kcal/mole. The formation of C 02 is mainly a surface process. Scrambling and C 0 -0 2 isotopic exchange are interpreted in terms of gas-phase chain reactions. The chain carriers are oxygen atoms, originating from a wall reaction between CO and 0 2, and excited C 02 (singlet) molecules formed by radiationless transition from the C 02 (triplet) association complex of CO and 0. Chain termination occurs both by wall recombination of oxygen atoms and by gas-phase third-order reactions. The C O -02 isotopic exchange is determined by the reactions O + CO — C 02* (triplet) —► CO + O, and scrambling is ascribed to O + 0 2 -»■ 0 3* -*■ 0 2 + O and C 02** (singlet) + 0 2 -*■ C 02* (triplet) +0 2. No marked deactivation of excited C 02 has been observed. Addition of foreign gases favors third-order gas-phase termination and consequently reduces the O atom partial pressure. The inhibitory effect of NO is ascribed to very small amounts of N 02, formed by slow reaction of NO with the 0 2 reactant, and acting as an O atom scavenger. The ratio of the rate constant fc25 of O + 0 2 -*■ 0 3* and the rate constant /c28 of O + CO -> C 02* (triplet) has been obtained at 500°, /c26/&28 = 7.1 ± 0.2.
IntroductionGenerally, the study of isotopic exchange reactions
can demonstrate the existence of otherwise nondetect- able processes, or can provide information on the elementary steps of a known but complicated chemical process. Such a complicated system is a thermally reacting dry mixture of CO and 0 2. It exhibits the phenomenon of the first and second explosion limits.1'2 The explosion is of the chain-branching type. Oxygen atoms and excited C 02 (triplet) molecules3 next to the carbon suboxides,4 5 C20 and C30 2, are proposed as the chain carriers or as important intermediates. The
explosion peninsula starts above 600°.6 Below that temperature, a slow formation of C 02 is observed. In a previous paper,6 it has been reported that in addition,
(1) G. J. M inkoff and C. F. H. Tipper, “ Chemistry of Com bustion Reactions,” Butterworth and Co. (Publishers) Ltd., London, 1962, p 58.(2) B. Lewis and G. von Elbe, “ Combustion, Flames and Explosions of Gases,” Academ ic Press Inc., New York, N. Y ., 1961, p 71.(3) S. W . Benson, "T h e Foundations of Chemical K inetics,” M cGraw-Hill B ook Co., Inc., New York, N. Y ., 1960, p 460.(4) P. Harteck and S. Dondes, J. Chem. Phys., 27, 1419 (1957).(5) P. G. Dickens, J. E. Dove, and J. W . Linnett, Trans. FaradaySoc., 60, 539 (1964).
The Journal of Physical Chemistry
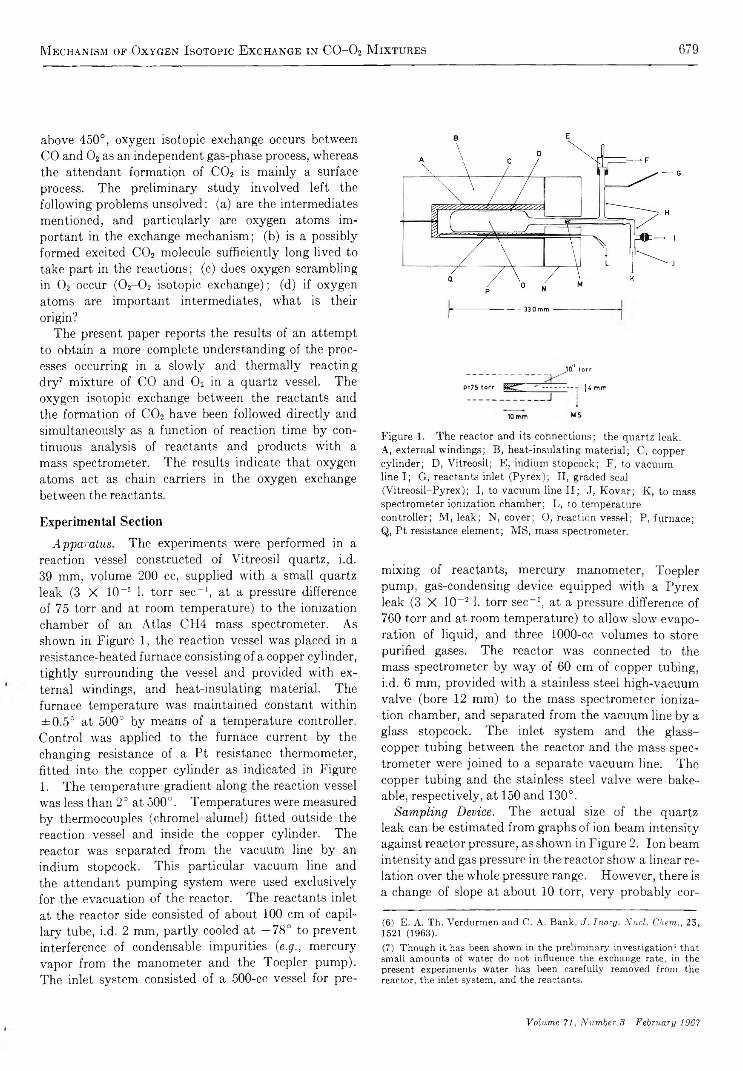
M echanism of Oxygen Isotopic Exchange in C 0 - 0 2 M ixtures 679
above 450°, oxygen isotopic exchange occurs between CO and 0 2 as an independent gas-phase process, whereas the attendant formation of C 02 is mainly a surface process. The preliminary study involved left the following problems unsolved: (a) are the intermediates mentioned, and particularly are oxygen atoms important in the exchange mechanism; (b) is a possibly formed excited C 02 molecule sufficiently long lived to take part in the reactions; (c) does oxygen scrambling in 0 2 occur (0 2- 0 2 isotopic exchange); (d) if oxygen atoms are important intermediates, what is their origin?
The present paper reports the results of an attempt to obtain a more complete understanding of the processes occurring in a slowly and thermally reacting dry6 7 mixture of CO and 0 2 in a quartz vessel. The oxygen isotopic exchange between the reactants and the formation of C 02 have been followed directly and simultaneously as a function of reaction time by continuous analysis of reactants and products with a mass spectrometer. The results indicate that oxygen atoms act as chain carriers in the oxygen exchange between the reactants.
Experimental SectionApparatus. The experiments were performed in a
reaction vessel constructed of Vitreosil quartz, i.d. 39 mm, volume 200 cc, supplied with a small quartz leak (3 X 10⁻⁶ 1. torr sec-1, at a pressure difference of 75 torr and at room temperature) to the ionization chamber of an Atlas CH4 mass spectrometer. As shown in Figure 1, the reaction vessel was placed in a resistance-heated furnace consisting of a copper cylinder, tightly surrounding the vessel and provided with external windings, and heat-insulating material. The furnace temperature was maintained constant within ±0.5° at 500° by means of a temperature controller. Control was applied to the furnace current by the changing resistance of a Pt resistance thermometer, fitted into the copper cylinder as indicated in Figure 1. The temperature gradient along the reaction vessel was less than 2° at 500°. Temperatures were measured by thermocouples (chromel-alumel) fitted outside the reaction vessel and inside the copper cylinder. The reactor was separated from the vacuum line by an indium stopcock. This particular vacuum line and the attendant pumping system were used exclusively for the evacuation of the reactor. The reactants inlet at the reactor side consisted of about 100 cm of capillary tube, i.d. 2 mm, partly cooled at —78° to prevent interference of condensable impurities (e.g., mercury vapor from the manometer and the Toepler pump). The inlet system consisted of a 500-cc vessel for pre-
3 3 0 m m
1 0 ° t o r r-------------------------------- - H Z '"
p = 7 5 t o r r W Z L | 4 m m
10 m m M S
Figure 1. The reactor and its connections; the quartz leak.A, external windings; B, heat-insulating material; C, copper cylinder; D, Vitreosil; E, indium stopcock; F, to vacuum line I; G, reactants inlet (Pyrex); H, graded seal (Vitreosil-Pyrex); I, to vacuum line II; J, Kovar; K, to mass spectrometer ionization chamber; L, to temperature controller; M, leak; N, cover; O, reaction vessel; P, furnace; Q, Pt resistance element; MS, mass spectrometer.
mixing of reactants, mercury manometer, Toepler pump, gas-condensing device equipped with a Pyrex leak (3 X 10- 2 1. torr sec-1, at a pressure difference of 760 torr and at room temperature) to allow slow evaporation of liquid, and three 1000-cc volumes to store purified gases. The reactor was connected to the mass spectrometer by way of 60 cm of copper tubing, i.d. 6 mm, provided with a stainless steel high-vacuum valve (bore 12 mm) to the mass spectrometer ionization chamber, and separated from the vacuum line by a glass stopcock. The inlet system and the glass- copper tubing between the reactor and the mass spectrometer were joined to a separate vacuum line. The copper tubing and the stainless steel valve were bake- able, respectively, at 150 and 130°.
Sampling Device. The actual size of the quartz leak can be estimated from graphs of ion beam intensity against reactor pressure, as shown in Figure 2. Ion beam intensity and gas pressure in the reactor show a linear relation over the whole pressure range. However, there is a change of slope at about 10 torr, very probably cor-
(6) E. A. Th. Verdurmen and C. A. Bank, J. Inorg. Nacl. Chern., 25, 1521 (1963).(7) Though it has been shown in the preliminary investigation6 that small amounts of water do not influence the exchange rate, in the present experiments water has been carefully removed from the reactor, the inlet system, and the reactants.
Volume 71, Number 3 February 1967
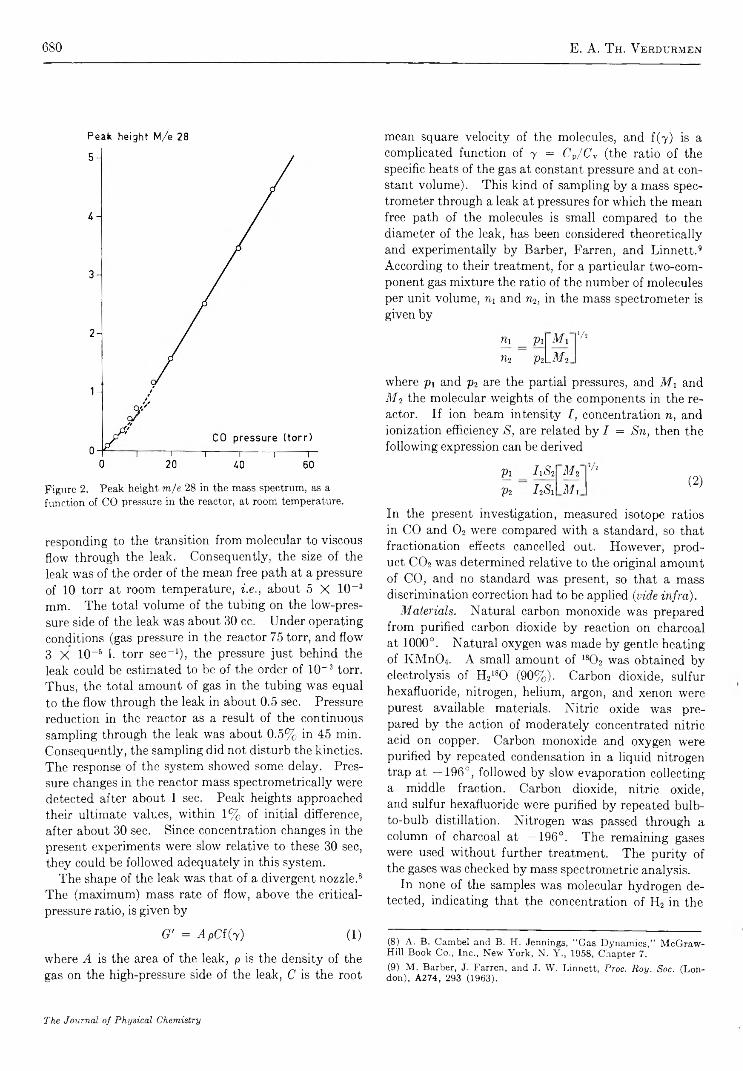
680 E. A. T h . V erdurmen
Peak height M/e 28
Figure 2. Peak height m/e 28 in the mass spectrum, as a function of CO pressure in the reactor, at room temperature.
responding to the transition from molecular to viscous flow through the leak. Consequently, the size of the leak was of the order of the mean free path at a pressure of 10 torr at room temperature, i.e., about 5 X 10“ 3 mm. The total volume of the tubing on the low-pressure side of the leak was about 30 cc. Under operating conditions (gas pressure in the reactor 75 torr, and flow 3 X 10⁻⁶ 1. torr sec“ 1), the pressure just behind the leak could be estimated to be of the order of 10“ 3 torr. Thus, the total amount of gas in the tubing was equal to the flow through the leak in about 0.5 sec. Pressure reduction in the reactor as a result of the continuous sampling through the leak was about 0.5% in 45 min. Consequently, the sampling did not disturb the kinetics. The response of the system showed some delay. Pressure changes in the reactor mass spectrometrically were detected after about 1 sec. Peak heights approached their ultimate values, within 1% of initial difference, after about 30 sec. Since concentration changes in the present experiments were slow relative to these 30 sec, they could be followed adequately in this system.
The shape of the leak was that of a divergent nozzle.8 The (maximum) mass rate of flow, above the critical- pressure ratio, is given by
G' = A pC f(y) (1)
where A is the area of the leak, p is the density of the gas on the high-pressure side of the leak, C is the root
mean square velocity of the molecules, and f(y) is a complicated function of y = Cp/Cv (the ratio of the specific heats of the gas at constant pressure and at constant volume). This kind of sampling by a mass spectrometer through a leak at pressures for which the mean free path of the molecules is small compared to the diameter of the leak, has been considered theoretically and experimentally by Barber, Farren, and Linnett.9 According to their treatment, for a particular two-component gas mixture the ratio of the number of molecules per unit volume, ni and n2, in the mass spectrometer is given by
niih
PiP2
MiL M i.
'A
where pi and p2 are the partial pressures, and Mi and Mi the molecular weights of the components in the reactor. If ion beam intensity I, concentration n, and ionization efficiency S, are related by I = Sn, then the following expression can be derived
Pi _ IiS2p2 I 2S1
MiM il
Vs
(2)
In the present investigation, measured isotope ratios in CO and 0 2 were compared with a standard, so that fractionation effects cancelled out. However, product C 02 was determined relative to the original amount of CO, and no standard was present, so that a mass discrimination correction had to be applied (vide infra).
Materials. Natural carbon monoxide was prepared from purified carbon dioxide by reaction on charcoal at 1000°. Natural oxygen was made by gentle heating of K M n04. A small amount of 180 2 was obtained by electrolysis of H2180 (90%). Carbon dioxide, sulfur hexafluoride, nitrogen, helium, argon, and xenon were purest available materials. Nitric oxide was prepared by the action of moderately concentrated nitric acid on copper. Carbon monoxide and oxygen were purified by repeated condensation in a liquid nitrogen trap at —196°, followed by slow evaporation collecting a middle fraction. Carbon dioxide, nitric oxide, and sulfur hexafluoride were purified by repeated bulb- to-bulb distillation. Nitrogen was passed through a column of charcoal at —196°. The remaining gases were used without further treatment. The purity of the gases was checked by mass spectrometric analysis.
In none of the samples was molecular hydrogen detected, indicating that the concentration of H2 in the
(8) A. B. Cambel and B. H. Jennings, “ Gas Dynamics,” McGraw- Hill Book Co., Inc., New York, N. Y., 1958, Chapter 7.(9) M. Barber, J. Farren, and J. W. Linnett, Proc. Roy. Soc. (London), A274, 293 (1963).
The Journal of Physical Chemistry

M echanism of Oxygen Isotopic Exchange in C 0 - 0 2 M ixtures 681
samples was below 3 X 10⁻⁵. The mass spectrum of the residual gas in the ionization chamber always showed a rather small peak of H20+. Thus the mass spectrometric analysis was not suitable for the detection of traces of H20 in the samples. The present drying method is similar to that of Gordon and Knipe.10 These investigators observed that addition of 0.004% H20 to their dried C 0 -0 2 mixtures had a marked effect upon the position of the second explosion limit. Consequently, the concentration of H20 in their dried mixtures must have been smaller than 1 X 10⁻⁴. It seems fairly safe to conclude that the present drying method provides samples containing less than 0.01% H20. Other impurities (mainly nitrogen) did not exceed 0.1%.
Treatment of Vessel. Formation of carbon dioxide in this system (below 600°) appears to be mainly a surface process.11 At room temperature, the silica surface is believed to be covered with OH groups and possibly with physically adsorbed water molecules.12'13 Heating at 120° during some hours removes completely the physically adsorbed water, but the OH groups are retained. When the temperature is raised, water begins to be lost by formation of oxygen bridges between two adjacent hydroxyl groups. According to Zhadanov14 and de Boer, et al.,u these oxygen bridges can be converted back to OH groups by exposure to liquid water. It has been observed that the catalytic formation of C 02 from CO and 0 2 at a quartz surface is the higher the less the number of hydroxyl groups attached to the silica surface.11 Therefore, to suppress the C 02 formation, before mounting, the reaction vessel was treated with water at 95° during 5 hr. Thus, total and partial pressure changes due to conversion of CO and 0 2 into C 02 and interference of product C 02 were reduced as far as possible. At 500° generally not more than a few per cent of the maximum possible conversion into C 02 was measured after 45 min of reaction time. The crushed silica (Yitreosil), used in a number of experiments, was treated in a similar way.
Procedure. The water-treated reaction vessel, mounted into the furnace and connected to the vacuum line and the inlet system, was baked for 3 hr at 120° under vacuum. Then the temperature was raised to 500° and the vessel was evacuated for at least 10 Into below 1 X 10~6 torr, measured by an ionization gauge. Before admitting a gas mixture, the vessel was evacuated for 2 hr to below 1 X 10⁻⁶ torr at the reaction temperature (between 500 and 580°). The reactants were premixed, except in the experiments with nitric oxide. This gas was admitted before or simultaneously with the remaining reactants, or it was added to a reacting mixture as indicated in the ex
periments involved. Admission of reactants occurred by expansion from the premixing vessel. The gas pressure in the reactor was measured by a mercury manometer connected to the premixing vessel. The experiments were performed with natural CO and enriched 0 2. The oxygen sample used (180 content about 3%) was obtained by mixing natural oxygen and oxygen containing 90% I80 isotope. The enrichment of the 0 2 thus predominantly was in the 180 130 species, so that next to isotopic exchange between CO and 0 2 the rate of attainment of statistical equilibrium of the 180 in 0 2 (scrambling) could be measured. Recording of peak heights, corresponding to concentrations of isotopic CO, isotopic 0 2, and isotopic C 02 molecules, generally was started about 40 sec after admission of reactants to the reactor. The range m/e 28-46 was continuously scanned during 45 min, so that the corresponding concentrations were measured directly as a function of time. Before each series of experiments, pure oxygen gas was passed through the ionization chamber, by way of the conventional mass spectrometer inlet system, for 2 hr to condition the ion source. After that time, the ratios of the peak heights m/e 28 to m/e 32, and m/e 44 to m/e 32, appeared to be practically constant and relatively small (see Reduction of Data).
Applied Rate Expressions. In this study it is assumed that the isotopic, exchanges are ideal; thus isotope effects are not considered. The well-known first-order rate expression for isotopic exchange of the general type
A X „ + B X m- i X * A X „ - i X * + B X m
where X * and X are isotopes of a particular element, is given by
1 nmab t na + mb
In (1 - F) (3)
S is the gross rate of exchange; a and b are the partial pressures of the reactants A X „ and BX„,; F = (x, — x0)/(x„ — Xo) is the exchange fraction; xt is the fractional content of tracer in A X n or B X m at time t, and x0 and x«, are the values for this fraction at t = 0 and t. = oo. The kinetics of the present isotopic exchange reactions are complicated by a nonrandom distribution of isotopes in one of the reactants. However, it is
(10) A. S. Gordon and R. H. Knipe, J. Phys. Chem., 59, 1160 (1955).(11) C. A. Bank and E. A. Th. Verdurmen, ibid., 67, 2869 (1963).(12) J. C. Greaves and J. W. Linnett, Trans. Faraday Soc., 55, 1355 (1959).(13) J. H. de Boer, M. E. A. Hermans, and J. M. Vleeskens, Proc. Konirikl. Ned. Akad. Wetenschap., B60, 45 (1957); B61, 85 (1958).(14) S. P. Zhadanov, Dokl. Akad. Naak SSSR, 68, 99 (1949).
Volume 71, Number 3 February 1967
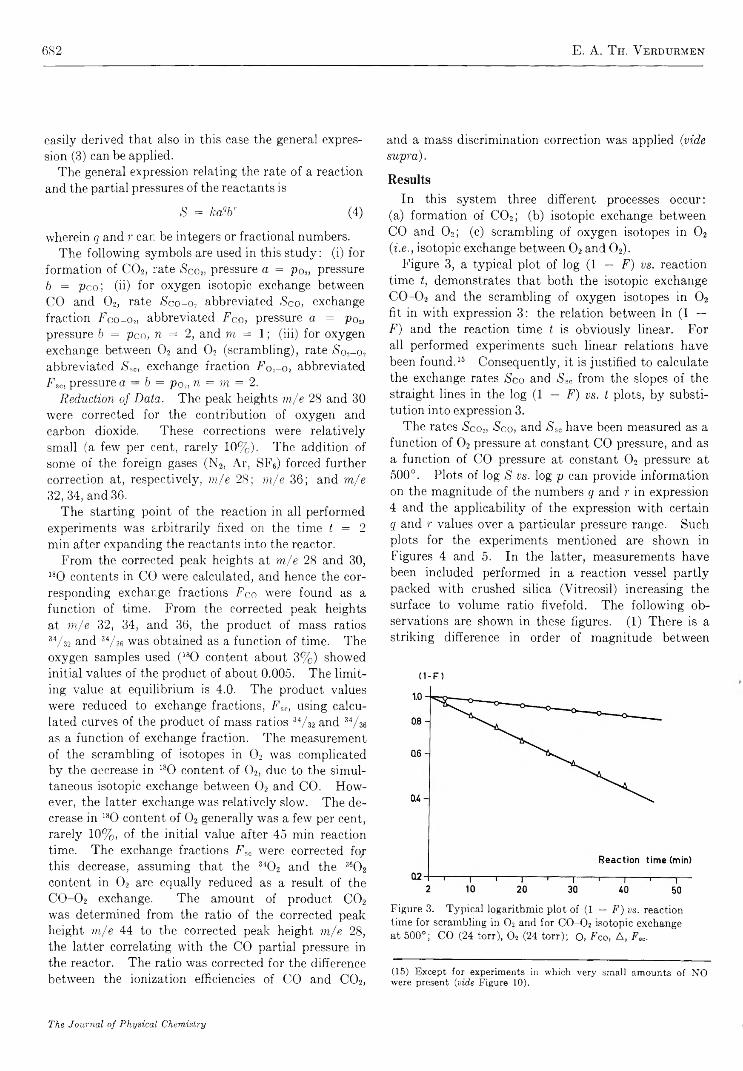
682 E. A. T h . V erdtjrmen
easily derived that also in this case the general expression (3) can be applied.
The general expression relating the rate of a reaction and the partial pressures of the reactants is
5 = kaqbr (4)
wherein q and r can be integers or fractional numbers.The following symbols are used in this study: (i) for
formation of C 02, rate >Sco2, pressure a = p0„ pressure 5 = pc0 j (ii) for oxygen isotopic exchange between CO and 0 2, rate Sco-o, abbreviated Sco, exchange fraction Fco-o,, abbreviated Fco, pressure a = po„, pressure 6 = pco, n = 2, and m = 1; (iii) for oxygen exchange between 0 2 and 0 2 (scrambling), rate So,-o2 abbreviated <3'sc, exchange fraction F0,~o2 abbreviated Fsc, pressure a — b = po2, n = m = 2.
Reduction of Data. The peak heights m/e 28 and 30 were corrected for the contribution of oxygen and carbon dioxide. These corrections were relatively small (a few per cent, rarely 10%). The addition of some of the foreign gases (N2, Ar, SF6) forced further correction at, respectively, m/e 28; m/e 36; and m/e 32, 34, and 36.
The starting point of the reaction in all performed experiments was arbitrarily fixed on the time t = 2 min after expanding the reactants into the reactor.
From the corrected peak heights at m/e 28 and 30, 180 contents in CO were calculated, and hence the corresponding exchange fractions Fco were found as a function of time. From the corrected peak heights at m/e 32, 34, and 36, the product of mass ratios 34/ 32 and 34/ 36 was obtained as a function of time. The oxygen samples used (l80 content about 3%) showed initial values of the product of about 0.005. The limiting value at equilibrium is 4.0. The product values were reduced to exchange fractions, /%, using calculated curves of the product of mass ratios 34/ 32 and 34/ 36 as a function of exchange fraction. The measurement of the scrambling of isotopes in 0 2 was complicated by the decrease in 180 content of 0 2, due to the simultaneous isotopic exchange between 0 2 and CO. However, the latter exchange was relatively slow. The decrease in 180 content of 0 2 generally was a few per cent, rarely 10%, of the initial value after 45 min reaction time. The exchange fractions /% were corrected for this decrease, assuming that the 340 2 and the 360 2 content in 0 2 are equally reduced as a result of the C O -02 exchange. The amount of product C 02 was determined from the ratio of the corrected peak height m/e 44 to the corrected peak height m/e 28, the latter correlating with the CO partial pressure in the reactor. The ratio was corrected for the difference between the ionization efficiencies of CO and C 02,
and a mass discrimination correction was applied (vide supra).
ResultsIn this system three different processes occur:
(a) formation of C 02; (b) isotopic exchange between CO and 0 2; (c) scrambling of oxygen isotopes in 0 2 (•i.e., isotopic exchange between 0 2 and 0 2).
Figure 3, a typical plot of log (1 — F) vs. reaction time t, demonstrates that both the isotopic exchange C 0 -0 2 and the scrambling of oxygen isotopes in 0 2 fit in with expression 3: the relation between ln (1 —F) and the reaction time t is obviously linear. For all performed experiments such linear relations have been found.15 Consequently, it is justified to calculate the exchange rates Sco and Ssc from the slopes of the straight lines in the log (1 — F) vs. t plots, by substitution into expression 3.
The rates Sco2, Sco, and Ssc have been measured as a function of 0 2 pressure at constant CO pressure, and as a function of CO pressure at constant 0 2 pressure at 500°. Plots of log S vs. log p can provide information on the magnitude of the numbers q and r in expression 4 and the applicability of the expression with certain q and r values over a particular pressure range. Such plots for the experiments mentioned are shown in Figures 4 and 5. In the latter, measurements have been included performed in a reaction vessel partly packed with crushed silica (Yitreosil) increasing the surface to volume ratio fivefold. The following observations are shown in these figures. (1) There is a striking difference in order of magnitude between
(1 - F)
Figure 3. Typical logarithmic plot of (1 — F ) v s . reaction time for scrambling in 0 2 and for CO-02 isotopic exchange at 500°; CO (24 torr), 0 2 (24 torr); O, F c o , A, F s c .
(15) Except for experiments in which very small amounts of NO were present (vide Figure 10).
The Journal of Physical Chemistry

M echanism of Oxygen Isotopic Exchange in C 0 - 0 2 M ixtures 683
S(torr min'1)
Figure 4. Log-log plot of reaction rate S v s . 0 2 pressure at constant pressure of CO (24 torr) at 500°;A, S soj O, Sco; n, Sco2.
Sco2, Sco, and Ssc, at each applied pressure. (2) It is obvious that none of the curves shown, except that of iS'co2 in Figure 5, can be described by a particular expression (4) with constant numbers q and r over the whole pressure range. (3) Increasing the surface to volume ratio fivefold results in a roughly fivefold increase of Sco2, whereas Sco and Ssc remain virtually constant. (4) The observed maxima in the curves »Sco and (Ssc (Figure 5) are shifted to higher partial pressures of CO, if the surface to volume ratio is increased.
Considering the nature of the occurring processes, observation 1 is a strong indication that these processes are independent. At each particular pressure in Figures 4 and 5, the number of C 02 molecules formed per unit of time is much smaller than the number of exchanges C 0 -0 2 per unit of time, the latter number being much smaller than the number of exchanges 0 2- 0 2 per unit of time. So the measured scrambling of oxygen isotopes in 0 2 cannot occur as a result of oxygen isotopic exchange between CO and 0 2, nor can the latter exchange occur as a result of C 02 formation. Observation 3 confirms the conclusion of the preliminary study6 that the C 02 formation is mainly a surface
S ( torr min'1)
Figure 5. Log-log plot of reaction rate S v s . CO pressure at constant pressure of 0 2 (24 torr) at 500°; A and A, S3C;O and •, Sco; □ and ■, Sco2; shaded marks: surface to volume ratio increased fivefold.
process, whereas the isotopic exchange reactions occur in the gas phase. From the shape of the curves, observation 2, it can be concluded that the isotopic exchange processes do not occur by the simple gas- phase reactions
C 160 + 180 160 — C 180 + 160 160 (5)
160 160 + 18Q1SO ----> 16()180 + 160 180 (6)
Some experiments have been performed studying scrambling of oxygen isotopes in pure oxygen. Even at 600°, practically no scrambling was measured within the reaction time (45 min). However, as is clearly shown in Figure 6, addition of a small amount (2%) of CO immediately starts scrambling at a considerable rate at 500°. This observation indicates that the reactive species in the scrambling process is formed in a reaction in which CO is involved.
The temperature dependence of the three processes has been determined by performing experiments at various temperatures between 500 and 580°. The measured rates of both isotopic exchange reactions and the measured rate of C 02 formation are logarithmically plotted as a function of reciprocal temperature, for two different mixtures, in Figure 7. The straight lines are a least-squares fit to experimental data. From
Volume 71, Number S February 1067
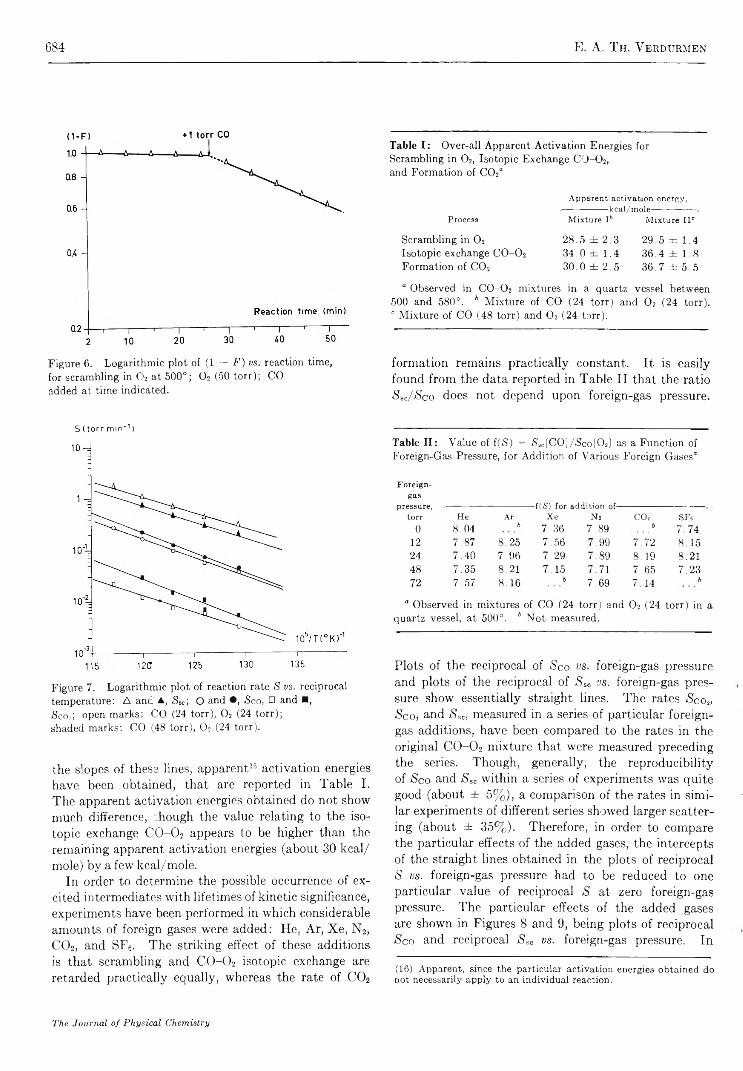
684 E. A. T h. V erdurmen
Figure 6. Logarithmic plot of (1 — F ) v s . reaction time, for scrambling in O2 at 500°; O2 (50 torr); CO added at time indicated.
Table I : Over-all Apparent Activation Energies for Scrambling in 0 2, Isotopic Exchange CO-O2, and Formation of C02“
Apparent activation energy,------------------ kcal/m ole-----------------
Process Mixture I b Mixture I Ie
Scrambling in 0 2 Isotopic exchange C 0 -0 2 Formation of C 02
28.5 ± 2.334.0 ± 1.430.0 ± 2.5
29.5 ± 1.4 36.4 ± 1.8 36.7 ± 5 . 5
“ Observed in CO-02 mixtures in a quartz vessel between 500 and 580°. 6 Mixture of CO (24 torr) and 0 2 (24 torr). c Mixture of CO (48 torr) and O2 (24 torr).
formation remains practically constant. It is easily found from the data reported in Table II that the ratio SSc/Sco does not depend upon foreign-gas pressure.
S(torr min'1)
Figure 7. Logarithmic plot of reaction rate S v s . reciprocal temperature: A and A, <S6C; O and •, <Sco, □ and ■,S c o , ; open marks: CO (24 torr), 0 2 (24 torr); shaded marks: CO (48 torr), O2 (24 torr).
the slopes of these lines, apparent16 activation energies have been obtained, that are reported in Table I. The apparent activation energies obtained do not show much difference, though the value relating to the isotopic exchange C 0 -0 2 appears to be higher than the remaining apparent activation energies (about 30 kcal/ mole) by a few kcal/mole.
In order to determine the possible occurrence of excited intermediates with lifetimes of kinetic significance, experiments have been performed in which considerable amounts of foreign gases wrere added: He, Ar, Xe, N2, C 02, and SF6. The striking effect of these additions is that scrambling and C 0 -0 2 isotopic exchange are retarded practically equally, whereas the rate of C 02
Table II: Value of f(<S) = Ss,:[CO]/>Sco[02] as a Function of Foreign-Gas Pressure, for Addition of Various Foreign Gases“
F oreign- gas
pressure, ----------------------------------f (S) for addition of-torr He Ar Xe Ni CO2 SFs
0 8.04 b 7.36 7.89 b 7.7412 7.87 8.25 7.56 7.99 7.72 8.1524 7.40 7.96 7.29 7.89 8.19 8.2148 7.35 8.21 7.15 7.71 7.65 7.2372 7.57 8.16 b 7.69 7.14 b
° Observed in mixtures of CO (24 torr) and 0 2 (24 torr) in a quartz vessel, at 500°. b Not measured.
Plots of the reciprocal of »Sco vs. foreign-gas pressure and plots of the reciprocal of fSso vs. foreign-gas pressure show essentially straight lines. The rates SCo2, Sco, and Ssc, measured in a series of particular foreign- gas additions, have been compared to the rates in the original C O -02 mixture that were measured preceding the series. Though, generally, the reproducibility of Sco and Sso within a series of experiments was quite good (about ± 5%), a comparison of the rates in similar experiments of different series showed larger scattering (about ± 35%). Therefore, in order to compare the particular effects of the added gases, the intercepts of the straight lines obtained in the plots of reciprocal iS vs. foreign-gas pressure had to be reduced to one particular value of reciprocal S at zero foreign-gas pressure. The particular effects of the added gases are shown in Figures 8 and 9, being plots of reciprocal Sco and reciprocal Sso vs. foreign-gas pressure. In
(16) Apparent, since the particular activation energies obtained do not necessarily apply to an individual reaction.
The Journal of Physical Chemistry
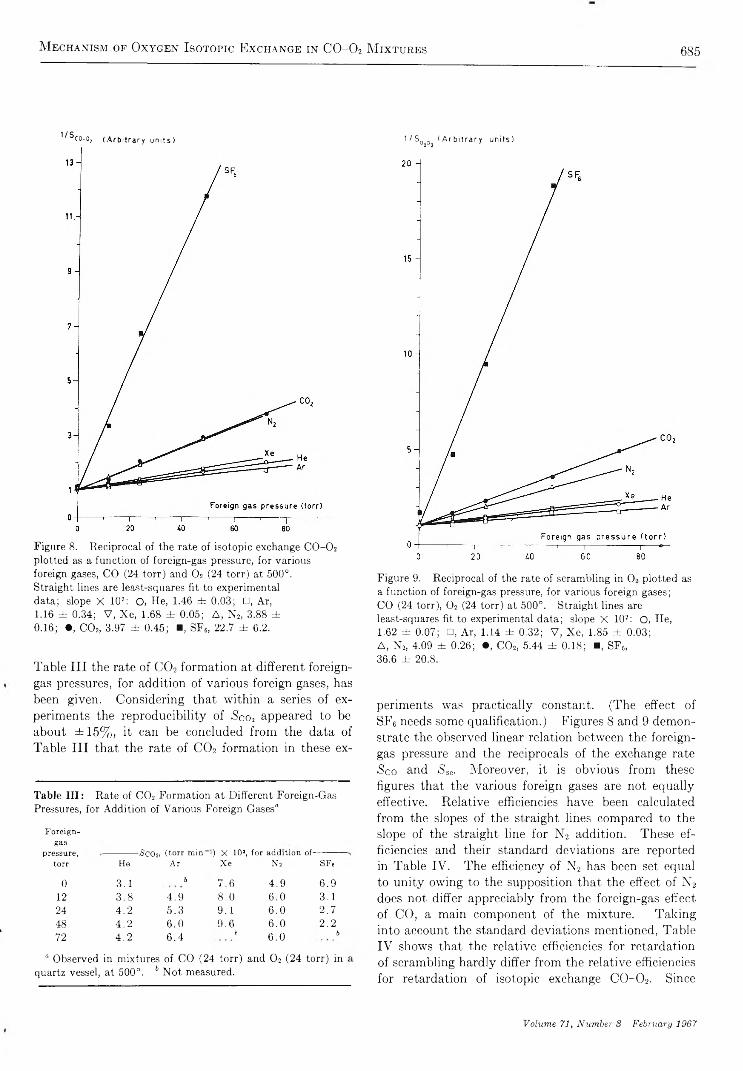
M echanism of Oxygen Isotopic Exchange in C 0 - 0 2 M ixtures 685
'^ co -o ; (Arbitrary units)
Figure 8. Reciprocal of the rate of isotopic exchange CO-O2 plotted as a function of foreign-gas pressure, for various foreign gases, CO (24 torr) and O2 (24 torr) at 500°.Straight lines are least-squares fit to experimental data; slope X 102: O, He, 1.46 ± 0.03; □, Ar,1.16 ± 0.34; V, Xe, 1.68 ± 0.05; A, N2, 3.88 ±0.16; •, C02, 3.97 ± 0.45; ■, SF6, 22.7 ± 6.2.
Table III the rate of C 02 formation at different foreign- gas pressures, for addition of various foreign gases, has been given. Considering that within a series of experiments the reproducibility of $co2 appeared to be about ±15% , it can be concluded from the data of Table III that the rate of C 02 formation in these ex-
Table III: Rate of C02 Formation at Different Foreign-GasPressures, for Addition of Various Foreign Gases“
Foreign-gas
pressure, -&CO2» (torr min *) X 10", for addition of-torr He Ar Xe N2 SFe
0 3 .1 b 7 . 6 4 . 9 6 . 9
12 3 .8 4 . 9 8 . 0 6 . 0 3 . 1
24 4.2 5 . 3 9 . 1 6 . 0 2 . 7
48 4.2 6 . 0 9 . 6 6 . 0 2 . 2
72 4.2 6 . 4b
6 . 0b
“ Observed in mixtures of CO (24 torr) and O2 (24 torr) inquartz vessel, at 500°. b Not measured.
1 / S0 o3 ( Arbitrary units)
Figure 9. Reciprocal of the rate of scrambling in O» plotted as a function of foreign-gas pressure, for various foreign gases;CO (24 torr), O2 (24 torr) at 500°. Straight lines are least-squares fit to experimental data; slope X 102: O, He,1.62 ± 0.07; □, Ar, 1.14 ± 0.32; V, Xe, 1.85 ± 0.03;A, N2, 4.09 ± 0.26; •, CO2, 5.44 ± 0.18; ■, SF6,36.6 ± 20.8.
periments was practically constant. (The effect of SF6 needs some qualification.) Figures 8 and 9 demonstrate the observed linear relation between the foreign- gas pressure and the reciprocals of the exchange rate iSco and Ssa. Moreover, it is obvious from these figures that the various foreign gases are not equally effective. Relative efficiencies have been calculated from the slopes of the straight lines compared to the slope of the straight line for N2 addition. These efficiencies and their standard deviations are reported in Table IV. The efficiency of N2 has been set equal to unity owing to the supposition that the effect of N2 does not differ appreciably from the foreign-gas effect of CO, a main component of the mixture. Taking into account the standard deviations mentioned, Table IV shows that the relative efficiencies for retardation of scrambling hardly differ from the relative efficiencies for retardation of isotopic exchange C O -02. Since
Volume 71, Number S February 1967

686 E. A. Th. V erdurmen
Table IV : Relative Efficiencies of Various Foreign Gasesin the Retardation of the Scrambling in 0 2 and the Isotopic Exchange C 0 -0 2o,i>
Foreigngas Scrambling in 0 2
Isotopic exchange CO-O2
He 0 .4 0 ± 0 .0 3 0 .3 8 ± 0 .0 2Ar 0 .2 8 ± 0 .0 8 0 .3 0 ± 0 .0 9Xe 0 .4 5 ± 0 .0 3 0 .4 3 ± 0 .0 2n 2 1 .0 0 ± 0 .0 9 1 .0 0 ± 0 .0 6C02 1 .3 3 ± 0 .1 0 1 .0 2 ± 0 .1 2s f 6 8 .9 ± 5 . 1 5 . 8 ± 1 . 6
“ Observed in mixtures of CO (24 torr) and 0 2 (24 torr) in a quartz vessel at 500°. 6 The efficiency of N2 has been set equalto unity.
the slope of the N2 line in Figure 8 practically equals the slope of the N2 line in Figure 9, respectively (3.88 ± 0.16) X 10-2 and (4.09 ± 0.26) X 10-2, the former observation further illustrates the conclusion that the scrambling in 0 2 and the isotopic exchange C O -02 are retarded practically equally by addition of foreign gases.
If the retardation of exchange rates, as a result of added foreign gases, is produced by deactivation of excited intermediates, it is not probable that these gases will have quite the same effect on different intermediates. Therefore, it is more likely that the main effect of addition of foreign gases is reducing the partial pressure of a common intermediate of both scrambling and C O -02 isotopic exchange. The almost equal efficiencies of He and Xe, and generally the order and relative magnitude of the efficiencies of the particular foreign gases, clearly suggest that neither adsorption nor diffusion in this system are rate-controlling processes.
If oxygen atoms are an intermediate in this system, the addition of an O atom scavenger should inhibit the otherwise occurring processes in which O atoms are involved. In order to test this hypothesis, some experiments have been performed in which small amounts of NO were added. The third-order reaction of NO with O atoms is a fast and consequently efficient reaction. Therefore, NO is considered to be an efficient O atom scavenger. Generally, NO retards all chain reactions in which paramagnetic radicals propagate the reaction chains. Figures 10 and 11 are combined plots of log (1 — F) vs. reaction time and of pressure of product C 02 vs. reaction time. In the experiments shown in Figure 10, the reactants, CO, 0 2, and NO, were admitted to the reactor simultaneously. In the experiments of Figure 11, NO was added to a reacting mixture roughly at t = 21 min and t = 30 min. Both figures illustrate the following significant observations.
(1-F ) C02 Pressure
Figure 10. Logarithmic plot of (1 — F ) v s . reaction time and plot of pressure of product C02 v s . reaction time for mixtures of CO (48 torr) and 0 2 (24 torr) and various amounts of NO at 500°; O, F c o ' , A, F sc; □, p c o 2 .
Figure 11. Logarithmic plot of (1 — F ) v s . reaction time and plot of pressure of product C02 v s . reaction time for mixtures of CO (48 torr) and 0 2 (24 torr) at 500°. NO added at times indicated. O, F c o ; A, F s c ; □, p co2.
(1) Small amounts of NO (concentrations roughly 3%) suffice to inhibit both scrambling and C O -02 isotopic exchange completely. (2) Very small amounts of NO (concentration roughly 0.3%) markedly accelerate both scrambling and C O -02 isotopic exchange. (3) The rate of C 02 production remains constant by the addition of very small amounts of NO, but at higher NO concentrations it is considerably enhanced.
Regarding Figure 11, it has to be considered that the nitric oxide was introduced through the reactants inlet
The Journal of Physical Chemistry

M echanism of Oxygen Isotopic Exchange in C 0 -0 2 M ixtures 687
so that it took some time before mixing was complete. Hence, after addition of the second amount of NO, at i = 30 min, the ultimate inhibition is preceded by acceleration of both isotopic exchange processes. Figure 10 clearly demonstrates that at very small NO concentrations no linear relation is found between In (1 — F ) and the reaction time t, for both scrambling and C 0 -0 2
isotopic exchange. Obviously, there is no difference in the effect of NO whether it is added simultaneously with the remaining reactants or is introduced to a reacting mixture. Therefore, NO does not act upon the initiating reactions, but rather interferes in the propagating steps of the reaction process. 17 Apart from its accelerating effect at very small concentrations, the general behavior of NO in this system—complete inhibition of exchange processes by a relatively small amount of NO—is that of chain breaking by the inhibitor. As will be argued in the Discussion section, the inhibitory effect of NO addition should be ascribed to very small amounts of N 0 2, produced by slow reaction of the added NO and the 0 2 reactant.
centrations. On the contrary, the observation that a relatively small amount of NO completely inhibits the exchange processes is a strong argument for occurrence of a chain mechanism involving free atoms in very small concentrations. Since, additionally, oxygen atoms are generally believed to occur as important intermediates in this system at slightly higher temperatures1 ~ 3 (above 600°), it seems justified to assume that oxygen atoms act as the common intermediate in the present processes too.
The scrambling of oxygen isotopes in 0 2 and the CO- 0 2 isotopic exchange observed in this system thus are ascribed to the independent processes
0 + 0 2 > 0 2 + 0 (7)
0 + CO —> CO + 0 (8 )
Term ination and In itia tion . Termination of chains involving oxygen atoms can occur by wall recombination of 0 atoms, reaction 9, or by the gas-phase third- order reactions 1 0 and 1 1
Discussion
Reactive S pecies. The main information about the nature of the reactive species is obtained from the effect of the added inert foreign gases and the effect of NO addition. It has been concluded that the main foreign- gas effect is reducing the partial pressure of a common intermediate of both scrambling and CO -02 isotopic exchange. Considering the nature of both isotopic exchange processes, it is likely that this intermediate will be one of the species 0 2, 0 3, 0 2*, and O. 18
The shape of the curves in Figures 4 and 5 eliminates 0 2 as the common intermediate: reactions 5 and 6 have been rejected. 0 3 shows rapid reaction with NO , 19 20 21 22 23 24 25
but it has the disadvantage that its concentration is not expected to be reduced by the addition of inert gases. Recently, some chemical reactions of the metastable lowest-lying known excited states of oxygen, 0 2(1 Ag) and 0 2(1 2 g+), have been studied. 20-22 No rapid reaction with NO was observed. 2 1-24 Apart from their long radiative lifetime, these states appear to be very stable with respect to molecular collisions. Winer and Bayes26 observed at 23° and at a pressure of 10 torr, in a 2 0 -mm i.d. reaction tube, that wall deactivation of 0 2(1 Ag) completely predominates gas-phase deactivation. It has been found in the present investigation that the concentration of the intermediate is considerably reduced by the addition of foreign gas at pressures below 100 torr. Vibrationally excited 0 2 in the electronic ground state at 500° probably will be easily deactivated by collision. 26 Thus it cannot set up long chains and, therefore, should occur in rather high con-
O -f- O T W -- > 0 2 + W (9)
O -f- 0 2 T M -—> 0 3 + M (1 0 )
O + CO + M - > C 0 2 -f- M (1 1 )The direct recombination in the gas phase is too slowto be of importance. Indicating the rate of O atom formation by R o, a steady-state treatment yields the following expression for the O atom concentration in the stationary state
/cio[02][M] + ku [CO ] [M ] + h
(17) V . N . Kondratev, “ Chemical K inetics of Gas Reactions,” Pergamon Press L td ,, Oxford and London, 1964, p 606.(18) The intermediates CO 2 *, C 20 , and C 3 O2 , probably occurring in this system at slightly higher temperatures,3’4 are all produced by reactions involving O atoms.(19) H . S. Johnson and H . J . Crosby, J. Chem. P h ys., 22, 689 (1954).(20) R . E . M arch, S, G . Fu rn iva l, and H . 1. Schiff, Photochem. P hoto- biol., 4 , 971 (1965).(21) M . A . A . Clyne, B . A . Thrush, and R . P . Wayne, ibid.., 4 , 957 (1965).(22) L . W . Bader and E . A . Ogryzlo, D iscussions Faraday Soc., 37, 46 (1964).(23) S. J . Arnold, E . A . Ogryzlo, and H . W itzke, J. Chem. P h ys., 40, 1769 (1964).(24) L . E lia s , E . A . Ogryzlo, and H . 1. Schiff, Can. J. Chem., 37, 1680 (1959).(25) A . M . W iner and K . D . Bayes, J. P h ys. Chem., 70, 302 (1966).(26) Lipscomb, et. al., measured at room temperature very different efficiencies for deactivation of vibrationally excited O2 (v = 8) in the electronic ground state: C O 2 , one in 7000 collisions; A r and N 2 , one in more than 107 collisions. In the present study, the efficiencies of the various foreign gases are relative ly in the same order of magnitude (the efficiencies of N 2 and CO 2 are almost equal), F . J . Lipscomb, R . G . W . Norrish, and B . A . Thrush, P roc. R oy. Soc. (London), A233, 455 (1956).
Volume 71, Number S February 1967
688 E. A. T h. Verdurmen
wherein wall recombination of oxygen atoms has been regarded as a first-order process, according to Greaves and Linnett. 12 The rate constant fc9 can be calculated from the recombination coefficient of oxygen atoms on Vitreosil, 12 y (500°) = 1.4 X ICG2, and the vessel dimensions: fc9 (at 500°) = 355 sec- 1 . The rate constant fcio[M = 0 2] can be obtained from data by Benson and Axworthy, 27 h o = 2.96 X 10⁷ exp(890/ R T ) l . 2 mole- 2 sec- 1 , at 500° reduced to fci0 = 1.5 X 10 -3 4 cm6 molecule- 2 sec- 1 . The rate constant kn can be calculated from data by Kondratev and Ptich- kin, 28 h i (at 428°K) = 2.96 X 10 13 cm6 mole- 2 sec- 1 , and data by Clyne and Thrush29 regarding the activation energy of the reaction: 3.7 kcal/mole; h i (at 500°) = 5.6 X 10 -3 4 cm6 molecule- 2 sec- 1 . Thus, at 500° ho and h i are in the same order of magnitude.
In order to determine the order of magnitude of the O atom concentration in the present experiments, it is assumed that the measured rate of scrambling is given by the rate of the isotopic exchange reaction
O T 0 2 0 2 -f- O (7 a)
The rate constant of this reaction has been determined by Herron and Klein30 and by Brennen and Niki. 31
Assuming the reaction has the same small negative activation energy as reaction 1 0 , the rate constant at 500° is given by ha = 0.4 X 10 - 1 2 cm3 molecule- 1 sec- 1
The rate of reaction 7a is represented by
Sin = fc7a[02][0] (13)
In a mixture of CO(24 torr) and 0 2 (24 torr) at 500°, a scrambling rate fSsc = 0.379 torr min- 1 , i.e., 8 .8 X 10 13 molecules cm- 3 sec- 1 has been measured. B y substitution into expression 13, the concentration of O atoms is found to be [O] = 6.3 X 10⁶ atoms cm-3. Then the rate of O atom formation, R 0 , required to maintain this concentration is calculated from express io n ^ : R o = 3.2 X 1 0 1 1 atoms cm- 3 sec- 1 .
As is shown in Figure 6 , scrambling of oxygen isotopes in 0 2 occurs under condition that CO is present, so that obviously the reactive intermediates, O atoms, are formed in a reaction in which CO is involved. This reaction might be
CO -f- O2 ■ ^ C 0 2 -f- O (14)
Sulzmann, et a l,,32 determined the rate constant of this reaction in the temperature range 2400-3000°K , in a shock-wave experiment
ku = (3.5 ± 1.6) X 10 12 exp[-(5 10 0 0 ±
7000)/RT] cm3 mole- 1 sec- 1
Hence, it is expected that the over-all apparent activa
tion energies in the present system will exceed 44 kcal/ mole. The actual apparent activation energies reported in Table I evidently are much smaller than the 51 ± 7 kcal/mole observed by Sulzman in reaction 14. Consequently, the gas-phase reaction 14 can be rejected as an important source of O atoms in this system.
The most likely alternative is a similar process (15) occurring at the wall of the reaction vessel
wallCO + 0 2 — > CO2 + O (15)
It is shown in Figure 5 that the rate of C 0 2 formation is proportional to the surface to volume ratio of the vessel. Consequently, the C 0 2 production is mainly a surface process, and it is not unlikely that the process(15) is involved. In the mixture of CO (24 torr) and 0 2 (24 torr) at 500°, a C 0 2 formation rate iSCo2 = 0 . 0 1 2
torr min- 1 , i.e., 2.8 X 10 12 molecules cm- 3 sec- 1 , has been measured. If the C 0 2 formation is attended with the simultaneous production of an O atom, the experimentally determined value of S co2 should equal the rate of O atom formation. However, it can be expected that only part of the produced O atoms actually will escape from the wall into the gas phase. In the mixture of CO (24 torr) and 0 2 (24 torr), the deduced value of R o is about 1 1 % of the measured rate S co2-
If chains are started at the wall of the vessel, the observation that the isotopic exchange rates S sc and S co remain virtually constant in spite of the enhancement of the surface to volume ratio demonstrates that chain breaking at the wall should be important too. Considering expression 1 2 , both R 0 and h are proportional to the surface to volume ratio. B y substitution of the rate constants fc9, ho, and h i , it is found that, in a mixture of CO (24 torr) and 0 2 (24 torr), a fivefold enhancement of the surface to volume ratio will increase the O atom concentration by a factor of 1.3. Actually, this effect had to be measured by comparison of experiments in a reaction vessel partly packed with crushed silica, with similar experiments in an unpacked vessel. Since the reproducibility of <Ssc and S Co in such experiments of different series appeared to be about ± 35% , the expected small enhancement of the O
(27) S . W . Benson and A . E . Axworthy, J . Chem. P h y s ., 42, 2614 (1965).(28) V . N . Kondratev and I . I . Ptiohkin, K in etika i K ata liz, 2, 492 (1961).(29) M . A . A . C lyne and B . A . Th rush , P roc . R oy . Soc. (London), A269, 404 (1962).(30) J . T . Herron and F . S. K le in , J . Chem. P h y s ., 40, 2731 (1964); 41, 1285 (1964); 44, 3645 (1966).(31) W . Brennen and H . N ik i, ibid., 42, 3725 (1965).(32) K . G . P . Sulzmann, B . F . M yers, and E . R . Bartle , ibid., 42, 3969 (1965).
The Journal o f P hysica l Chem istry
Mechanism of Oxygen Isotopic Exchange in C 0 -0 2 M ixtures 689
atom concentration could not be measured. The observed experimental scattering should have its origin in the activity of the surface that obviously is not invariable. The condition of the wall, e.g., the number of OH groups at the silica surface, will determine not only the rate of C 0 2 production, 1 1 and consequently the rate of 0 atom formation, but also the fraction of 0 atoms that leaves the wall. Moreover, the less OH groups at the silica surface the higher will be the recombination coefficient for oxygen atoms on the wall. 12 Thus the dependence of the 0 atom concentration in the gas phase upon the surface conditions is rather complicated.
Summarizing, the initiation and wall termination of chains in this system is interpreted in terms of the reactions
wallCO + 0 2 >■ CO2 + Owall (16)
Owall ”b Owall (02)wall (17)
Owall ---> Ogas (18)
surface-O* + Ogas •— > surface- + (02)gas (19)_ rapid _ . „
surface- + Ogas — > surface-O* (2 0 )
The mechanism of wall recombination of oxygen atoms on Vitreosil, reactions 19 and 2 0 , has been discussed by Greaves and Linnett. 12 Oxygen atoms from the gas phase recombine with loosely bound oxygen atoms, 0 *, that have been adsorbed from the gas phase.
Propagation . Isotopic exchange of oxygen atoms with O2 has been studied by Herron and Klein . 30
Their results have been interpreted in terms of the mechanism
0 + 0 2
0 8* + M - 0 3 + IVI
(21, 2 1')
(22)
The rate constants k21' and fc22 were found to be at room temperature, /c21 = 1.8 X 10⁹ sec' 1 and &22 = 4 X 10 u cm3 mole- 1 sec- 1 ; i.e ., 0.7 X 10 -12 cm3 molecule- 1
sec- 1 . The stationary-state concentration of 0 3
is given by
MOsHO]kii + fc22[M]
and the rate of exchange by
S u ' — fei'ICh*]
(23)
(24)
Assuming that no temperature corrections in k2l' and k-a have to be applied, it is easily calculated that at 500° and total pressures below 1 0 0 torr, holds:
fc22[M]//c21' < 5 X 10 -4. Consequently, in the exchange mechanism, deactivation of the excited association complex 0 3* is not a predominant process.
Direct isotopic exchange of oxygen atoms with CO has not been studied so far. In the present investigation the observation that SCo 2 is proportional to the surface to volume ratio demonstrates that at most, very small amounts of C 0 2 are formed in the gas phase. The observation that even the total rate of C 0 2 formation, SCo2, is small with regard to the related SCo and S sc, and the fact that S c o, is practically not influenced by addition of foreign gases, suggest that C 0 2 formation by deactivation of an eventual excited complex C 02* is not an important process in the exchange mechanism. The rate of C 0 2 formation by the third-order gas-phase reaction (1 1 ) is given by »811 = &n[CO][0][M]. Substitution of [O] = 6.3 X 10⁸ atoms cm- 3 (vide supra) yields, for a mixture of CO (24 torr) and 0 2 (24 torr) at 500°, a rate S n = 7.7 X 10 10 molecules cm- 3 sec- 1 , i.e ., about 3% of the measured value of SCo 2 = 2 .8 X 1 0 12 molecules cm- 3 sec- 1 . The conclusion that the main effect of foreign-gas addition is reducing the partial pressure of the atomic oxygen intermediate is another argument against marked deactivation of a possibly formed association complex C 02* in the gas phase.
Thus far it is likely that the propagation reactions for scrambling in 0 2 and for CO -02 isotopic exchange actually are represented by
O -j- 0 2 O3* 0 2 O (25)
O + CO — > (C02* — >) CO + O (26)
The rate of reaction 25 should equal the measured scrambling rate. The CO -02 isotopic exchange will occur successively by reaction 26 and reaction 25. Since it has been observed that the scrambling rate uniformly exceeds the rate of CO -02 isotopic exchange, the latter should equal the rate of reaction 26. Then the following relation is easily found
Ssc _ 7C25 [O2 ] ,9_,ScO ^26 [CO]
Consequently, the experimentally determined value of SSc[CO]/»Sco[02] should be constant for all performed experiments at a particular temperature. Tables V and II show that f (S ) = $ Sc[CO]/$co[02] does not depend on total pressure as it does not on foreign-gas pressure. On the contrary, it is clearly shown in Figure 12 that f(»S) as a function of the mixing ratio is not constant. It is found that f(S) is proportional to the mixing ratio [CO]/[02], It appears that the individual measurements at constant 0 2 pressure (open
Volume 71, Number 3 February 1967
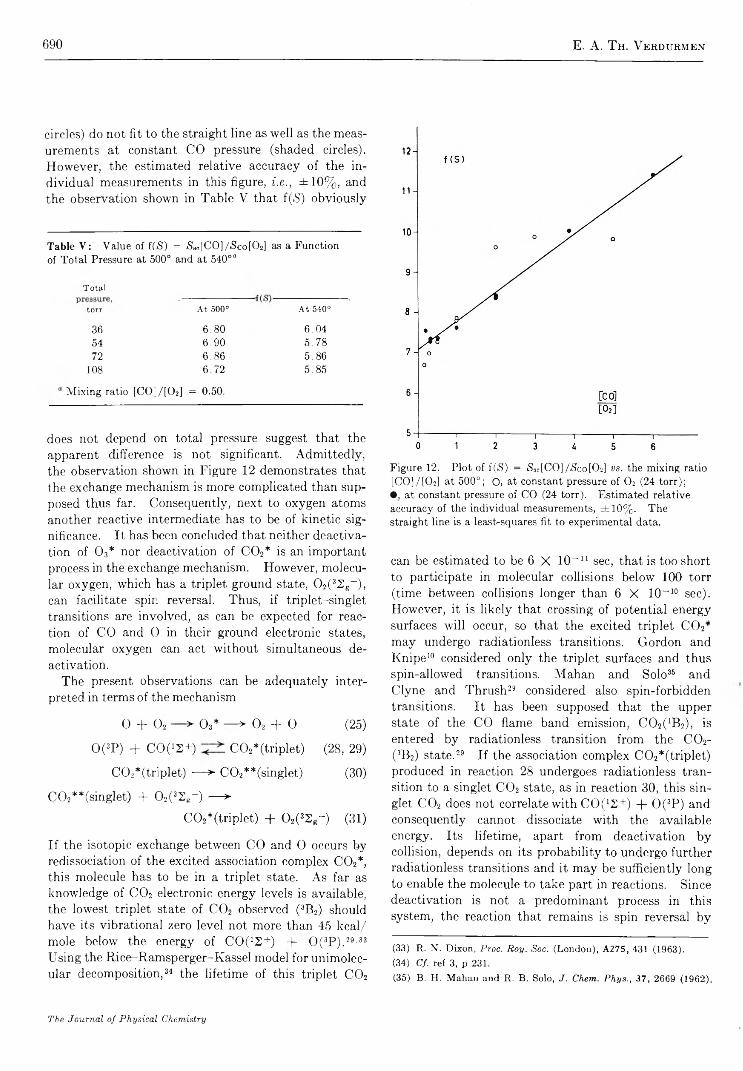
690 E. A. T h. Verdurmen
circles) do not fit to the straight line as well as the measurements at constant CO pressure (shaded circles). However, the estimated relative accuracy of the individual measurements in this figure, i.e ., ± 10 % , and the observation shown in Table V that f (S ) obviously
Table V : V alue of US) = fSsc[C0]/iSco[O2] as a F u n ctionof T o ta l Pressure at 500° and at 540°“
Total
torr At 500° At 540°
36 6 .8 0 6 .0 454 6 .9 0 5 .7 872 6 .8 6 5 .8 6
108 6 .7 2 5 .8 5
M ix in g ratio [ C O ( / [ 0 2] = 0.50.
does not depend on total pressure suggest that the apparent difference is not significant. Admittedly, the observation shown in Figure 12 demonstrates that the exchange mechanism is more complicated than supposed thus far. Consequently, next to oxygen atoms another reactive intermediate has to be of kinetic significance. It has been concluded that neither deactivation of 0 3* nor deactivation of C 0 2* is an important process in the exchange mechanism. However, molecular oxygen, which has a triplet ground state, 0 2(32 g~), can facilitate spin reversal. Thus, if triplet-singlet transitions are involved, as can be expected for reaction of CO and O in their ground electronic states, molecular oxygen can act without simultaneous deactivation.
The present observations can be adequately interpreted in terms of the mechanism
O -f- 0 2 ■ >■ 0 3* > 0 2 -f- O (25)
0 (3P) + C 0 (‘ 2+) C 02* (triplet) (28, 29)
C 0 2*(triplet) — > C 0 2**(singlet) (30)
C 0 2** (singlet) + 0 2(32 g-) — >
C 0 2*(triplet) + 0 2(32 g~) (31)
If the isotopic exchange between CO and O occurs by redissociation of the excited association complex C 0 2*, this molecule has to be in a triplet state. As far as knowledge of C 0 2 electronic energy levels is available, the lowest triplet state of C 0 2 observed (3B 2) should have its vibrational zero level not more than 45 kcal/ mole below the energy of C 0 (12+) + 0 (3P).29'33 Using the Rice-Ramsperger-Kassel model for unimolec- ular decomposition,34 35 the lifetime of this triplet C 0 2
Figure 12. P lo t o f f (S) = <SSo[C O ]/<Sco[02] vs. the m ixing ratio [C O ]/ [O2] a t 5 0 0 ° ; O, at con stant pressure o f O2 (24 to rr );• , at constant pressure o f C O (24 torr). E stim ated relative accu racy o f the individual m easurem ents, ± 1 0 % . T h e straight line is a least-squares fit to experim ental data.
can be estimated to be 6 X 10 “ 11 sec, that is too short to participate in molecular collisions below 100 torr (time between collisions longer than 6 X 10 “ 10 sec). However, it is likely that crossing of potential energy surfaces will occur, so that the excited triplet C 0 2* may undergo radiationless transitions. Gordon and Knipe10 considered only the triplet surfaces and thus spin-allowed transitions. Mahan and Solo36 and Clyne and Thrush29 considered also spin-forbidden transitions. It has been supposed that the upper state of the CO flame band emission, COî ^ B ü), is entered by radiationless transition from the C 0 2- (3B 2) state.29 If the association complex C 0 2*(triplet) produced in reaction 28 undergoes radiationless transition to a singlet C 0 2 state, as in reaction 30, this singlet C 0 2 does not correlate with C 0 (12+) + 0 ( 3P) and consequently cannot dissociate with the available energy. Its lifetime, apart from deactivation by collision, depends on its probability to undergo further radiationless transitions and it may be sufficiently long to enable the molecule to take part in reactions. Since deactivation is not a predominant process in this system, the reaction that remains is spin reversal by
(33) R . N . Dixon, P roc. R oy . Soc. (London), A275, 431 (1963).(34) Cf. ref 3, p 231.(35) B . H . Mahan and R . B . Solo, J. Chem. P h ys ., 37, 2669 (1962).
The Journal o f P h ysica l Chem istry

Mechanism of Oxygen Isotopic Exchange in C 0 -0 2 M ixtures 691
reaction with 0 2, reaction 31. It is not unlikely that scrambling of oxygen isotopes in 0 2 occurs simultaneously in this reaction.
Stationary-state concentrations of C 0 2*(triplet) and C 0 2** (singlet) are easily derived to be
m n M C 0 ] [0 ] + M 0 2][C02**][UU2 J - - —K29 + Kzo
[CO,**] ,kzi [O2 ]
B y elimination of [C02**], an expression for [C02*] is obtained
1f (S )
Figure 13. L ogarithm ic p lo t o f reciprocal f (S) vs. reciprocal tem perature. O pen circles: CO (24 torr), O2 (24 torr); shaded circles: C O (48 to rr ); 0 2 (24 torr).
[C02*] = ~ [C 0 ] 10 ]k 29
If the C 0 -0 2 isotopic exchange is determined by reaction 29 and the scrambling in 0 2 by reactions 25 and 31, the following rate expressions can be derived
S co = fesICOHO] (32)
and
S se = k25 [0* ] [0 ] + ~ k 2s [CO ] [0 ] (33)29
Thus it has been assumed that there are two paths for scrambling in 0 2: the direct reaction (25), and that by way of the CO-O exchange mechanism, reaction 31. The ratio of iSsc and S co then is given by
<S3C _ 25 [O2 ] &30 .-Sco “ M C O ] + { }
and consequently
m-Ssc[CO] = fes h o [CO]-Sco[02] fc28 k29 [02]
(35)
Expression 35 is consistent with the observation that f(iS) is proportional to the mixing ratio [CO]/ [02]. The slope and intercept of the plot in Figure 12 thus can be interpreted, respectively, as kzo/k22 and k23/k2S. B y the method of least squares it is found that k30/kM = 0.7 ± 0.1 andfes/fes = 7 .1 ± 0 .2 , at 500°.
The temperature dependence of f(<S) is shown in Figure 13, a logarithmic plot of reciprocal f($) vs. reciprocal temperature, for two different mixtures. The straight lines are least-squares fits to experimental data. Both lines show the same slope, corresponding with an apparent activation energy 6.9 ± 0.9 kcal/ mole. This number actually is the difference in the apparent activation energies of the C 0 -0 2 isotopic exchange and the scrambling process. Its interpretation in relation to rate constants of individual reactions is
rather difficult in consequence of the nature of expression 35. Since, for the mixtures involved, the term (k3o/k22) ([CO ]/ [02 ]) is a few times smaller than k2i/k2%, and possibly kM and k30 will not depend on temperature, the observed 6.9 ± 0.9 kcal/mole approximately equals the difference in activation energies between reaction 28 and reaction 25. This conclusion, however, needs some qualification. Provided reactions 25 and 28 have the same activation energies as observed for third- order formation of 0 3 and C 02, respectively, about — 1 kcal/mole27 and about 4 kcal/mole,29 the expected difference in activation energies is 5 kcal/mole, in rather good agreement with the observed 6.9 ± 0.9 kcal/mole.
Regarding the nature of the C 0 2** (singlet) formed in reaction 30, it can be stated that its lifetime, r, has to be long enough to undergo molecular collisions: r >10 - 9 sec. Since no important deactivation of excited C 02 has been observed, reaction 3 1 has to be effective and C 0 2** (singlet) should be relatively stable with respect to collisional deactivation, also by C 0 2. Generally, an electronically excited molecule in one of its higher vibrational levels has a high probability of transfer of vibrational energy into translational energy of a colliding particle, in contrast with a vibrationally excited molecule in the electronic ground state.36 Moreover, to assure a sufficiently long lifetime of C 0 2**- (singlet) with respect to radiationless transition, the excited singlet molecule should have a rather large amount of energy to relocalize before it can pass into another state by radiationless transition. Therefore, it is not unlikely that the C 0 2** (singlet) actually is vibrationally excited C 0 2 in its electronic ground state.
E ffect o f Reactant Concentrations. B y substitution of expression 12 into 32 and 33, the following expressions for S co and Sso are obtained: eq 36
-Sco = ^ C(\ o[()2][M] + fcn [CO ] [M ] + k§ (36)
(36) Cf. ref 17, p 390.
Volum e 71, N um ber 3 F ebruary 1967

692 E. A. T h. Y erdurmen
and eq 37 respectively.
Sso — "jfeolCh] + 28 [CO X
i u M M ] + ftu[CO][M] + fc,
I f the rate of 0 atom formation, R 0, is determined by reaction 16, its dependence upon reactant concentrations will equal the reactant-concentration dependence of the rate of CO2 formation in reaction 16. Provided that the C 02 is practically exclusively produced by reaction 16, the rate dependence involved is shown by S co , in Figures 4 and 5. At constant CO pressure (Figure 4), S co , is proportional to [02] at low pressures, and is increasing less and less than proportional at higher 0 2 pressures. At constant 0 2 pressure (Figure5), S co 2 is roughly proportional to [CO]'/! over the whole pressure range. Considering that [M ] = [CO ] + [02], and that at 500° holds /c25/fc28 = 7.1, kz<>/kw = 0.7, and kn/ho = 3.7, from expressions 36 and 37 the following shape of the curves in Figures 4 and 5 can be expected. At low partial pressures of 0 2 or CO, the predominant term in the denominator of (36) and (37) is fc9. At relatively high partial pressures of 0 2 or CO, respectively, the terms ftio[02][M] and fcn [CO]- [M] will be predominant. Considering in addition the deduced pressure dependence of R 0 , in Figure 4 the 3 c o will increase roughly proportional with [02] at low 0 2 pressures. At relatively high 0 2 pressures, the rapid increase of the denominator (becoming quadratic in [02]) ultimately results in a decrease of S co for increasing [02]. In a similar way, it is expected that S 3C at low 0 2 pressures will increase with somewhat less than [02]2, and at relatively high 0 2 pressures will pass through a maximum. The tSec maximum should occur at a higher 0 2 partial pressure than the S co maximum as a consequence of the fact that the numerator of (36) is less dependent upon [02] than the numerator of (37) is. It is easily seen that Sco and S sc in Figure 5 should show similar curves. At low CO pressures, Sco should increase roughly with [CO]!/2, and S sc roughly with [CO]‘/!. The rate constant for wall recombination of oxygen atoms, ft9, is proportional to the surface to volume ratio. Therefore, for experiments performed in a vessel with enlarged surface to volume ratio, the term fc9 in the denominator of (36) and (37) is relatively more important. Consequently, the maxima in »Sco and S sc should be shifted to higher partial pressures (Figure 5). The observations shown in Figures 4 and 5 are in good agreement with all these considerations.
Expressions for the reciprocals of S co and S ao as a func
tion of foreign-gas pressure can easily be obtained from (36) and (37). For a mixture of CO (24 torr) and 0 2 (24 torr)
1M M ] + M M ] + —
(38)
and
S co kîsRo
1M M ] + M M ] +
(39)Ssc
|fc26 + ^ ] r o
Consequently, a plot of reciprocal S co and of reciprocal <Sac vs. foreign-gas pressure should yield straight lines. The slopes of these lines are given, respectively, by a co and aac
Ucofcio + k\i '
kisRo&SC
fcjo + fen
kzs +kzo., kigVRoe29 1
(40)
Actually, these linear relations between the reciprocals of the exchange rates and the foreign-gas pressure have been observed, as shown in Figures 8 and 9. The various slopes for different foreign gases obviously relate to the values of (fc10 + kn) for the particular foreign gases. The relative efficiencies of the different foreign gases for retardation of /Sco should equal the corresponding relative efficiencies for retardation of S sc, as it actually has been observed (Table IV). It has been calculated that at 500°, kn/kw = 3.7. Therefore, the relative efficiencies of the different foreign gases practically may be considered equal to the relative efficiencies of the particular third bodies, M, in the third-order37 reaction 11 . Some qualification is required regarding the fact that kw and kn have been obtained by extrapolation from other temperatures. Considering expressions 38 and 39, the retarding effect of a particular amount of foreign gas should be smaller the higher the value of fc9. In Figure 14, the retarding effect of C 0 2 addition is compared for experiments in which &9, proportional to the surface to volume ratio, has different values. Obviously, the retardation of both S co and S sc is considerably smaller in the packed vessel, in agreement with the expectations.
(37) A t total pressures below 1 torr, second-order formation of CCU has been observed . 3 5 The present data: the shape and positionof the curves in Figures 4 and 5 and the difference between the observed foreign-gas efficiencies and the known 2 7 efficiencies of M in reaction 10, suggest that the gas-phase CO 2 formation in the present system, reaction 1 1 , is a third-order process.
The Journal of Physical Chemistry

Mechanism of Oxygen Isotopic Exchange in C 0 -0 2 M ixtures 693
Figure 14. Plot of the reciprocal of the rate of scrambling in O2 and of the reciprocal of the rate of CO-O2 isotopic exchange v s .
the pressure of added CO2 for two different surface to volume ratios, CO (48 torr) and 0 2 (24 torr), at 500°; open marks, unpacked vessel; shaded marks, packed vessel, surface to volume ratio increased fivefold. Straight lines are least-squares fit to experimental data; slope X 102; A, 4.56 ±0.26; A, 1.84 ± 0.18; O, 4.40 ± 0.16; •, 2.48 ± 0.25.
E ffect o f N O . I f the O atom concentration is reduced as a result of the fast reaction
NO + O + M — > N 0 2 + M (41)
the stationary-state concentration of oxygen atoms is given by
1 J k10 [Oa ] [M ] + fcn [CO] [M ] + h + ka LNO ] [M ]
(42)
The rate constant h i can be obtained from data by Klein and Herron, 30 h i = 1.44 X 10 15 exp(1930/I2T) cm6 mole- 2 sec- 1 (M = N 2) at 500°, reduced to ka =1.4 X 10 - 3 2 cm6 molecule- 2 sec- 1 . B y substitution of the rate constants ho, h i , h , and ka into expression 42, it is easily calculated, for a mixture of CO (48 torr) and 0 2 (24 torr), that the amount of NO required to reduce the O atom concentration to 0 . 1 of its original value should exceed 35 torr. Actually, 0.1 of this amount suffices to inhibit the exchange processes com
pletely. Consequently, reaction 41 cannot explain the observed effect of NO. However, it is not unlikely that the oxygen atoms actually are removed by the very fast reaction with N 0 2, produced in the slow reaction of NO and the 0 2 reactant.
O + N 0 2 NO + 0 2 (43)
The rate constant ki3 can be obtained from data by Klein and Herron, 30 ki3 = 1.95 X 10 13 exp(—1060/ R T ) cm3 mole- 1 sec- 1 at 500° reduced to h z = 1.7 X 10 - 1 1 cm3 molecule- 1 sec- 1 . Thus in expression 42, the term fc4i[NO][M] should be replaced by &43[N0 2]. It is easily calculated that, in the mixture involved, an amount of 0.03 torr N 0 2 will reduce the O atom concentration to 0.1 of its initial value. The slow reaction of NO and 0 2 is a third-order process
2NO + 0 2 —■> 2N 0 2 (44)
The rate constant ku has been determined by Ashmore, Burnett, and Tyler* 42 38 at 500°: fc44 = 1.6 X 10 -38 cm6
molecule- 2 sec- 1 . The rate of N 0 2 formation in a mixture of CO (48 torr), 0 2 (24 torr), and NO (3 torr) is found to be $44 = 6.5 X 10 - 4 torr sec- 1 . Thus, the required amount of 0.03 torr N 0 2 is formed in about 45 sec. This time is sufficiently short to allow the conclusion that the inhibitory effect of NO in this system can be ascribed to very small amounts of N 0 2 produced by slow reaction of NO and 0 2.
The considerably enhanced C 0 2 formation observed after addition of not too small amounts of NO then can be ascribed to the reaction
CO -f- N 0 2 >■ C 0 2 T NO (45)
The rate constant h& has been measured between 500 and 800°K by Brown and Crist, 39 h o = 0.48 X 10⁹
exp(—27800/ R T ) 1. mole- 1 sec- 1 , at 500° reduced to h s = 1.2 X 10 -2 0 cm3 molecule- 1 sec- 1 . The rate of C 0 2 formation by reaction 45 in a mixture of CO (48 torr), 0 2 (24 torr), NO (3 torr), and NO-2 (0.1 torr) is found to be <S4b = A46[C 0][N 02] = 1 .1 X 10 13
molecules cm- 3 sec- 1 , i.e., 4.9 X 10 - 2 torr min- 1 . This rate is in good agreement with the observed rates. Thus, it appears that in the mixture involved, the rate of N 0 2 formation, <S44, practically equals the rate of N 0 2 removal, *845, so that the estimated partial pressure of N 0 2 (i.e., 0.1 torr) actually corresponds to the steady-state concentration of N 0 2 in the mixture.
Experimental information regarding the remarkable acceleration of both isotopic exchange processes
(38) P . G . Ashmore, M . G . Burnett, and B . J . T y le r , Trans. Faraday Soc., 58, 685 (1962).(39) F . B . Brown and R . H . C rist, J. Chem. P hys., 9 , 840 (1941).
Volume 71, Number 3 February 1967
694 E. A. T h. V erdtjrmen
by addition of very small amounts of NO, unfortunately, is rather limited. Since at higher concentrations of NO the exchange processes are completely inhibited, it is unlikely that NO itself, either in the gas phase or by a wall reaction, can act as the extremely reactive intermediate. The data rather suggest that as long as sufficient oxygen atoms are available, NO addition will give rise to the occurrence of another reactive intermediate. If the C 0 2**(singlet) intermediate is preferentially deactivated by NO, the induced intermediate might be excited nitric oxide, NO*, formed by energy transfer in the reaction
C 0 2**(singlet) + NO(2n) —>
C 0 2(1S g+) + N O * ( 2n ) (46)
Vibrationally excited NO in its electronic ground state probably can set up sufficiently long chains. Thus, the accelerated exchange processes should be ascribed to
NO* + 0 2 —■> 0 2 + NO* (47)
NO* + CO — ■> CO + NO* (48)
and NO* should be a more efficient chain carrier than 0 is. In case of increasing NO partial pressure, the concentration of 0 atoms, and consequently of C 0 2**- (singlet) and NO* molecules, is reduced as a result of reaction 43, and ultimately all exchange processes are inhibited. It has to be remarked that this interpretation of the accelerating effect is-only tentative.
Even in a mixture of very small amounts of NO with CO and 0 2, slow formation of N 0 2 by reaction 44 will occur. Therefore, it is expected that the accelerated exchange processes in such a mixture will show decreasing rates as a function of reaction time. As shown in Figure 10, this effect actually has been measured: the slopes of the log (1 — F ) vs. reaction time curves for the mixture with NO (0.1 torr) are continuously decreasing with reaction time, and so, consequently, do the exchange rates. This observation underlines the conclusion that the inhibitory effect of NO can be ascribed to very small amounts of N 0 2 formed by slow reaction of NO with the 0 2 reactant.
Rem ark on H ydrogen-C ontaining Im purities. It is supposed that no hydrogen-containing intermediates take part in the reactions. As mentioned, the concentration of H2 in the samples was below 3 X 10~5 and that of H20 very probably below 1 X 10~4. A pos
sible source of H20 in the samples might be the formation of H20 by reaction of two adjacent OH groups at the silica surface. It is easily calculated from the known12’13 number of hydroxyl groups at the surface (8/100 A 2) and the inner surface of the reaction vessel (180 cm2) that the process involved yields at most 7 X 10 16 molecules of H20. However, this formation of H20 is a relatively slow process, so that in the particular experiments only a very small part of this number actually will enter the gas phase during the reaction time. Moreover, after several series of experiments at 500°, the rate of C 0 2 formation, under otherwise comparable conditions, was virtually unchanged, indicating that the number of OH groups at the surface was not considerably reduced.11 Thus, the introduction of H20 by reaction of OH groups at the surface is certainly sufficiently small to maintain the H20 concentration in the samples below 1 X 10⁻⁴. It has been observed in the preliminary investigation6 that the addition of small amounts of water (0.3%) does not influence the CO -02 exchange. However, in this case the H20 concentration in the samples possibly was higher than in the present experiments as a result of a less thorough drying method. Consequently, the former observation does not exclude an effect of water that is measurable only in very low concentrations. The formation of reactive hydrogen-containing intermediates from H2 or H20 probably occurs by reaction with O atoms.40 It has been found in the present study that the concentration of O atoms at the temperatures involved is extremely small. Therefore, it is not expected that traces of H2 or H20 will influence the exchange rates.
Acknowledgm ents. The author wishes to thank Professor Dr. J . A. A. Ketelaar and Professor Dr. J . Kistemaker and Dr. A. E. de Vries for helpful discussions and suggestions. A considerable part of the experiments and of the reduction of data has been performed by Miss A. Tom, whose reliable assistance is gratefully acknowledged. This work was part of the research program of the Stichting voor Fundamenteel Onderzoek der Materie (Foundation for Fundamental Research on Matter) and was made possible by financial support from the Nederlandse Organisatie voor Zuiver-Wetenschappelijk Onderzoek (Netherlands Organization for the Advancement of Pure Research).
(40) Cf. ref 1, p 79.
The Journal of Physical Chemistry

Structure and Properties of Amorphous Silicoaluminas 695
Structure and Properties of Amorphous Silicoaluminas. III.
Hydrated Aluminas and Transition Aluminas
by A. J. Leonard,la F. Van Cauwelaert,lb and J. J. Fripiat10
Laboratoire de P hysico-C h im ie M in éra le, A gronom ie Institute o f the U niversity o f Louvain , H éverlé-Louvain, B elgium (R eceived October 17, 1966)
The structure of amorphous aluminas and of some transition aluminas has been studied using the generalized Fourier synthesis. The comparison of electron density distribution functions obtained for hydrated gels and gels calcined at various temperatures up to 700° with similar distribution functions computed from structure models has led to interesting conclusions. Amorphous hydrated gels obtained in acid or alkaline solutions behave differently on dehydration. Gels obtained in acid solutions evolve at 300° toward a partially hydrated phase in which a spinel-like structure is realized in contrast with those precipitated in alkaline solution which acquire a boehmite-like structure at 300°. At higher temperature, both series have a spinel-like structure but with an excess of tetrahedral aluminum cations in the case of the samples obtained initially in acid conditions. This suggests a differentiation between the tj and y transition forms. The structural characteristics of hydrated alumina gels reveal a disorganization in the distribution of aluminum cations, the degree of disorganization being higher for the samples obtained by acid precipitation. This and the thermal behavior mentioned above are believed to result from the prolonged presence of aquo groups. The significance of the estimation of the relative content of tetrahedral aluminum cations from the shift of the A1 K a fluorescence line has been checked with respect to the Al(IV) content in spinel-like structures. The agreement between both sets of measurements was reasonable when gibbsite and sodium zeolite were used as reference materials.
I. Introduction
Transition aluminas are obtained from the dehydration of aluminum trihydrates (gibbsite, bayerite, and nordstrandite) or monohydrate (boehmite) according to various decomposition sequences. A great deal of effort has been devoted to the study of these sequences as shown in Table I .2-14 More details may be found in the excellent review published by Newsome, Heiser, Russell, and Stumpf.15 For the sake of clarity, the Alcoa nomenclature will be used in this paper.
Among the reasons for the broad interest in this field are the high surface areas and the catalytic properties displayed by transition aluminas. Activation is produced by heating aluminum trihydrates or monohydrate (boehmite) at rather high temperatures (500-900°). The two main transition aluminas used in catalysis are the ?; and y species. Maciver, et a l.,16
have studied particularly their surface properties and have concluded that tj alumina differs from y 1 2 3 4 5 6 7 8 9 10
(1) (a) T h e U niversity o f L ou v a in ; (b ) A sp irant van h et N .F .W .O .; (c) T h e U n iversity o f L ou v a in and M .R .A .C . (T ervu ren t).(2) (a) G . W . B rin d ley and J. O . C hoe, A m . M ineralogist, 4 6 , 771 (1961 ); (b ) J. F . B row n , D . C lark , and W . W . E llio tt , J . Chem. Soc., 84 (1953).(3) H . C . S tu m pf, A . S. R ussell, J. W . N ew som e, and C . M . T u ck er, In d . Eng. Chem ., B 42, 1398 (1950).(4) H . Saalfeld , Clay M inerals B ull., 3 , 249 (1958).(5) B . C . L ippens, D o cto ra l T hesis, T ech n isch e H ogesch oo l, D elft , T h e N etherlands, 1961.(6) U . H ausch ild , Z . Anorg . A llgem . Chem ., 324 , 15 (1963).(7) E . J. W . V erw ey and E . L . H eilm ann , J . Chem. P h ys ., 15, 174 (1947).(8) E . K ordes, Z . K rist ., 91, 193 (1935).(9) H . G insberg, W . H ü ttig , and G . S trunk -L ich ten berg , Z . Anorg . Allgem . Chem., 293, 204 (1957).(10) H . P . R o o k sb y and C . J. M . R o o y m a n s , C lay M in era ls B ull., 4 , 234 (1961).
Volume 71, Number 3 February 1967
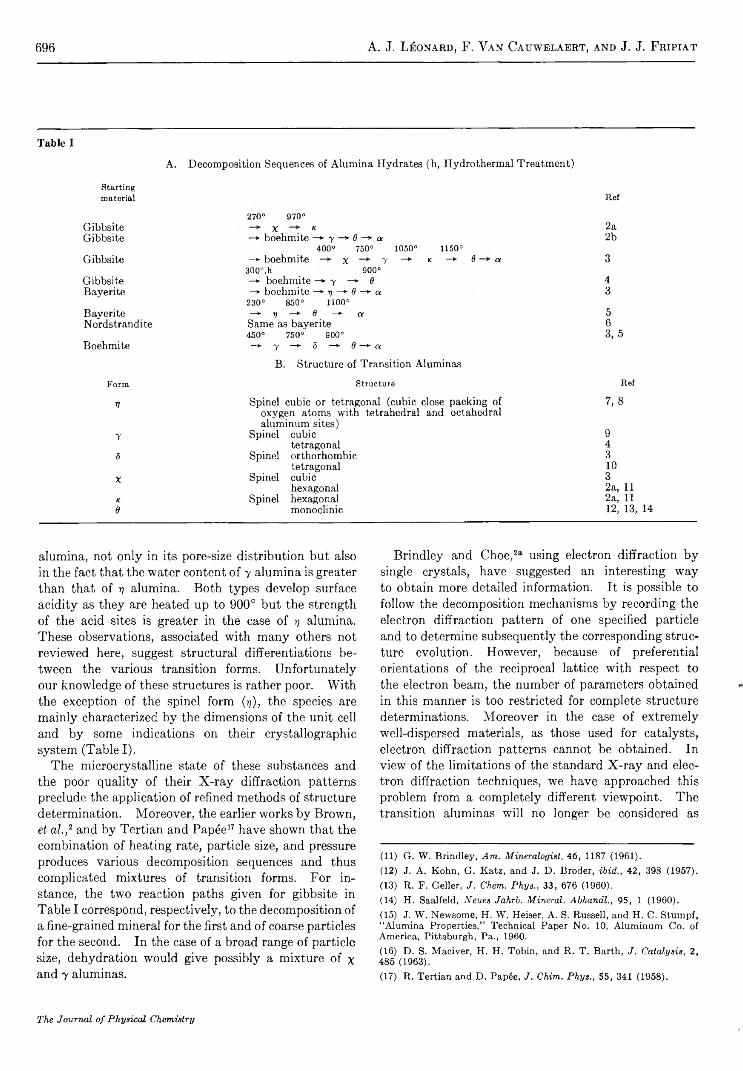
696 A. J. Léonard, F. Van Cauwelaert, and J. J. Fripiat
Table IA. Decomposition Sequences of Alumina Hydrates (h, Hydrothermal Treatment)
Startingmaterial
270° 970°Ref
Gibbsite X * 2aGibbsite —*• boehmite —<■ y —* 9 —* a
400° 750° 1050° 1150°2b
Gibbsite —► boehmite x 7 —► K —► 6 a
300°,h 900°3
Gibbsite - * ■ boehmite —* 7 — *■ 8 4Bayerite -> boehmite —► 77 —► 9 — *■ a
230° 850° 1100°3
Bayerite —*■ t ] —► 6 —► a 5Nordstrandite Same as bayerite 6
450° 750° 900° 3, 5Boehmite —>■ y —>• 5 —*- 0 “*> cl
B. Structure of Transition AluminasForm Structure Ref
V Spinel cubic or tetragonal (cubic close packing of oxygen atoms with tetrahedral and octahedral aluminum sites)
7 ,8
y Spinel cubic 9tetragonal 4
5 Spinel orthorhombic 3tetragonal 10
X Spinel cubic 3hexagonal 2a, 11
K Spinel hexagonal 2a, 119 monoclinic 12, 13, 14
alumina, not only in its pore-size distribution but also in the fact that the water content of 7 alumina is greater than that of tj alumina. Both types develop surface acidity as they are heated up to 900° but the strength of the acid sites is greater in the case of 17 alumina. These observations, associated with many others not reviewed here, suggest structural differentiations between the various transition forms. Unfortunately our knowledge of these structures is rather poor. With the exception of the spinel form (77), the species are mainly characterized by the dimensions of the unit cell and by some indications on their crystallographic system (Table I).
The microcrystalline state of these substances and the poor quality of their X-ray diffraction patterns preclude the application of refined methods of structure determination. Moreover, the earlier works by Brown, et a l.,2 and by Tertian and Papce11 12 13 14 15 16 17 have shown that the combination of heating rate, particle size, and pressure produces various decomposition sequences and thus complicated mixtures of transition forms. For instance, the two reaction paths given for gibbsite in Table I correspond, respectively, to the decomposition of a fine-grained mineral for the first and of coarse particles for the second. In the case of a broad range of particle size, dehydration would give possibly a mixture of x and 7 aluminas.
Brindley and Choe,2a using electron diffraction by single crystals, have suggested an interesting way to obtain more detailed information. It is possible to follow the decomposition mechanisms by recording the electron diffraction pattern of one specified particle and to determine subsequently the corresponding structure evolution. However, because of preferential orientations of the reciprocal lattice with respect to the electron beam, the number of parameters obtained in this manner is too restricted for complete structure determinations. Moreover in the case of extremely well-dispersed materials, as those used for catalysts, electron diffraction patterns cannot be obtained. In view of the limitations of the standard X-ray and electron diffraction techniques, we have approached this problem from a completely different viewpoint. The transition aluminas will no longer be considered as
(11) G. W. Brindley, A m . M ineralogist, 46, 1187 (1961).(12) J. A. Kohn, G. Katz, and J. D. Broder, ib id ., 42, 398 (1957).(13) R. F. Geller, J. Chem. P h ys ., 33, 676 (1960).(14) H. Saalfeld, N eues Jahrb. M ineral. Abhandl., 95, 1 (1960).(15) J. W. Newsome, H. W. Heiser, A. S. Russell, and H. C. Stumpf, “ Alumina Properties,” Technical Paper No. 10, Aluminum Co. of America, Pittsburgh, Pa., 1960.(16) D. S. Maciver, H. H. Tobin, and R. T. Barth, J. C atalysis, 2, 485 (1963).(17) R. Tertian and D. Papée, J. Chim. P h ys ., 55, 341 (1958).
The Journal o f P hysica l Chem istry

Structure and Properties of Amorphous Silicoaluminas 697
crystalline but as amorphous materials and a method especially suited for amorphous substances will be applied. From the diffuse scattering of a monochroma- tized X-ray beam, the radial electron density is computed with respect to an arbitrarily chosen origin. The successive maxima in this distribution correspond to the various interatomic vectors. This technique, initially proposed by Warren18-20 for studying the structure of glasses, gives the mutual arrangements of atoms within a sphere of about a 5-A radius; for longer distances from the center, the successive maxima corresponding to various interatomic distances overlap. Fripiat, Leonard, and Baraké21 have applied such a method to hydrated silica gels, but as far as we know, neither the amorphous alumina hydrates nor the transition aluminas obtained from their dehydration process have been studied in that manner. This will be the main topic of this contribution. To obtain detailed information, reference data are required: these will be obtained by computing the electron density distribution from known comparable structures, namely, gibbsite, bayerite, boehmite, or the y spinel structure. As in the latter type of oxygen atom arrangement, the distribution of aluminum in tetrahedral or octahedral sites is an important feature; the method used previously22 and based on the shift of the aluminum K a emission line will also be applied. Infrared spectra in the range where the A1 octahedra and tetrahedra vibrations are observed will also give some useful information.
where 70 is the intensity of the radiation reaching the sample and /A the atomic scattering factor. R , e, m, and c are the distances from the scattering electron, the electron charge and mass, and the light velocity, respectively. For a substance containing more than one atomic species, eq 1 becomes
X }X m47lT2pm = Y ^ K rtA ^ P ü +m m
J * COsi'(s) sin srds (4)
o
the summation being extended to all the atoms contained in the stoichiometric unit. K m is the effective electron number of atomic species m defined as the ratio fm / fa where f m and /e are the atomic scattering coefficient and the mean electron scattering coefficient, respectively. The latter is equal to E/m /E^m where
m mZ m is the atomic number. The electron density, pm, is thus a function of the mean electron density (po) per cubic angstrom, of s, and of i (s ) . Hence
N d X 10 -24I > ' m
where d is the specific weight and M the molecular weight. In eq 4, i (s ) has the same meaning as in eq 2 and becomes
f(s)E/m 2
(6)
II. Procedures
(a) Generalized F ourier Synthesis. The method, developed originally by Warren for studying structures of amorphous materials, is based on the relationship between the radial electron density and the length of interatomic vectors. In the simplest case of a mono- atomic substance the basic relationship is
/» co47rr2p(r) = 47rr2p0 + (2r/?r) I s i(s ) sin srds (1)
Jo
where p is the electron density, r the distance from an arbitrary atom taken as origin, and s = (4x sin 6)/\. In eq 1
i (s ) = I (s )/ N f(s ) - 1 (2)
where J(s) is the intensity of the X-ray radiation diffracted by an indifferently oriented lattice, N is the effective number of atoms in the sample, and /(s) is a function of the diffraction angle 6 such that
*•> - + C“ ! 2#) (3)
where
1 coh exp J- incoh \ < )
In this work the atomic scattering coefficients and the contribution of the incoherent intensity were taken from the “ International Tables for Crystallography.” 23 The calculations were made as shown previously for silica gels by Fripiat, Léonard, and Baraké,21 using an IBM 1620 computer. In the calculation of K m, 16 electrons were attributed to aluminum and 7 electrons to oxygen. This mathematical artifice has no influence on the final results provided that the total number of electrons is constant in the stochiometric unit, but it 18 19 20 21 22 23
(18) B . E . W arren and N . S. G ingrich , P h ys . R ev., 46, 368 (1934).(19) B . E . W arren , H . K n itte r , and O . M orn in gstar , J . A m . Ceram. Soc., 1 9 , 202 (1936).(20) B . E . W arren , J. A p p l. P h ys., 8 , 645 (1937).(21) J. J. F rip ia t, A . L éon a rd , and N . B arak é, B ull. Soc. Chim. France, 122 (1963).(22) A . L éon ard , S. Suzuki, J. J. F rip ia t, and C . D e K im p e , J. P hys. Chem ., 68, 2608 (1964).(23) ‘ ‘ In ternational T a b les fo r X -R a y C ry s ta llo g r a p h y /' V o l. I l l , T h e K y n o ch Press, B irm ingham , E ngland , 1962, p 202, 250.
Volume 71, Number 3 February 1967

698 A. J. Léonard, F. Van Cauwelaert, and J. J. Fripiat
Figure 1. Instrument used for recording X-ray scattering curve and to compute the radial distribution of electron density.
produces a better resolution in the electron density distribution.
The instrument used in this work is shown in Figure 1 ; the X-ray beam was first monochromatized by means of a curved asymmetrical quartz crystal (1), the goniometer (2) being adjusted for fitting the localization conditions; the distance between the monochromator and the sample (3) was 325 mm and the distance between the sample and the scintillation detector (4) was 180 mm. A molybdenum (X 0.709 A) “ fine-focus” target was used at 54 kv and 14 ma. The K « 2:K<2i intensity ratio has been reduced from one-half to one-eighth. As proposed by McKinstry and Short,24 the contribution of the harmonics was suppressed by discriminating at 44 ± 12 v. In the diffracted beam the number of pulses was between 150 and 1500 counts/sec; this is appreciably below the maximum speed of discrimination, i.e ., 4500 pulses/ sec.
The diffraction spectra were recorded by scanning the 29 domain between 4 and 162° by steps of 29 = 1° , using the technique of fixed counts (16 X 103 pulses). The maintenance of a correct geometry was checked before and after every determination by recording the
diffraction spectrum of a thin sheet of muscovite, using a narrow receiving slit of 0.8 mm (5 of Figure 1) as compared with the 6-mm asymmetrical aperture used for the amorphous substances.
The following corrections were made on the experimental data. Let x be the sample thickness and x the “ infinite thickness” defined by Cukity25
exp( —2yua;co/sin 9) — exp( — 2/ux/sin 9)
1 — exp( — 2jux,/sin 9)
(8)
where yt is the linear absorption coefficient. The important contribution of the X-ray scattering by the air has been measured and subtracted from / exP, as proposed by Zarzycki.26 The experimental values have also been corrected for the double polarization effect undergone by the diffracted beam according to Azaroff.27
It is well known that neglecting the end terms of a Fourier series creates a perturbation28 and raises a series of oscillations in the electron density distribution.29 30 31 Taking into account the wavelength of the Mo Ken radiation, the upper limit of the Fourier integral in eq 4 was s = 17.5 for 29 = 162°. These oscillations have the strongest intensity near the origin of the radial distribution. Their amplitude decreases progressively as the radius increases and finally disappears at about 4 A. These so-called “ ghosts” were observed mainly below 2.0 A. They modify the shape of the band appearing in the electron density distribution for radii between 1.5 and 2 .1A (band I) , which is obviously due to the A l-0 interatomic vectors. Above 2 A, the ■ weak peak at 2.3 A, which appears in some cases, is probably a ghost too. Moreover, according to Becherer, et a l.,x if the limit of the Fourier integral is extended to higher s values as by Richter, et a l.,n the lack of convergence of / coh and Xl/m2 in eq 6 may also
mmodify the relative intensities of the electron density maxima since /<, —■► 0 for s — . It is believed that the limit adopted in this work represents a compromise which minimizes the errors due to the end terms of the
(24) H . A . M cK in s try and M . A . Short, Z . K r is t ., 114, 278 (1960).(25) B . D . C u llity , “ E lem ents o f X -R a y D iffra c t io n ,” A d d ison - W esley , L on d on , 1959, p 188.(26) J. Zarzyck i, J . P h ys . R adium , 175, 4 4A (1956).(27) L . V . A zaroff, A cta Cryst., 8 , 701 (1955).(28) H . K rebs and F . S chu ltze-G ebhardt, ibid., 8 , 412 (1955).(29) H . L ip son and W . C ochran , “ T h e D eterm in a tion o f C rysta l S tructures,” B ell and Sons, L on d on , 1953, p 291.(30) G . B echerer, O . B rüm m er, and G . H erm s, S ilikat Tech., 13, 339 (1962).
(31) H . R ich ter, G . B reitling , and F . H erre, Z . N aturforsch ., 9 , 390 (1954).
The Journal o f P hysica l Chem istry

Structure and Properties of Amorphous Silicoaluminas 699
Fourier integral and the effect of the lack of convergence o f/Coh and Xlfm2-
m(b) X -R a y Fluorescence S pectroscopy and In frared
Spectroscopy. The method for determining the coordination numbers of aluminum and silicon from the shift of the A1 K a and Si K a fluorescence lines has been described previously.22 The samples prepared for recording the diffraction spectra and computing the radial electron density distribution were also used for X-ray fluorescence. The X-ray spectrometer was equipped with a chromium target, a pentaerythritol analyzer, and a flow counter, the settings being as follows: X-ray generator, 50 kv, 20 ma; collimator aperture, 160 y ; discrimination, 39 ± 12 v; scanning speed, 1/s° min- 1 .
K B r pellets (5°/00) were used for recording the infrared spectra in the 400-1200-cm-1 region with a Beckman IR 12 spectrometer.
III. MaterialsThe hydrated alumina gels were prepared from a
0.25 N A1C13-6H20 solution by precipitation with a 4 N NaOH solution.
Two series of gels were studied according to the pH at which the precipitation was carried out. The G series was obtained from gels precipitated at pH 4.5 and purified by dialysis at 50° for 3 (Gi), 4 (Gn), 5 (Gm), and 7 (Giv) days, respectively. The B series was prepared from gels precipitated at pH S and purified by dialysis at the same temperature and for the same periods of time (Br, Bn, Bm , and Biv).
The samples were then dried under vacuum at 20°
Table II: Number of Water Molecules per AI2O3Unit (WC) and Specific Surface Area (So, m2/g)
Pre-treatmenttemp,
°CG
series I II ill IV
20 WC 3.67 3.04 3.23 3.68So 4 9 4 5
300 WC 2.00 1.39 1.38 1 .5 1So 7 8 8 107
550 WC 1.18 0.86 1.02 0.99So 27 37 29 305
20
Bseries
WC 3.39 3 .14 3 .41 2.72So 158 235 224 243
300 WC 0.91 1.39 1.48 1 .14S„ 301 286 296 287
550 WC 0.50 0.09 0.40 0.14S„ 247 208 276 240
Figure 2. Some examples of radial distribution functions of electron density.
(Gi ,2o~Griv,2o or B if2o~Biv,20) or heated at 300 or 550° to constant weight (G i ,3oo~G iv ,55o and B i ,3oo—Biv,550)- In summary, four different samples of each series, dried or calcined at 20, 300, and 550°, were studied. Their water contents, obtained by measuring the weight loss at 1000°, and their B E T (N 2 at —196°) surface areas are shown in Table II. In addition, two samples belonging to the G and B series were calcined at 700° (G700 and B 700).
For the X-ray diffraction and fluorescence methods, the samples were prepared by molding a pellet of 5-mm thickness and 30-mm diameter under a pressure of 500 kg/ cm2.
As shown by Gastuche and Herbillon,32 the con- * 1404
(32) M . C . G astu ch e and A . H erb illon , Bull. Soc. Chim . F rance,1404 (1962).
Volume 71, Number 3 February 1967
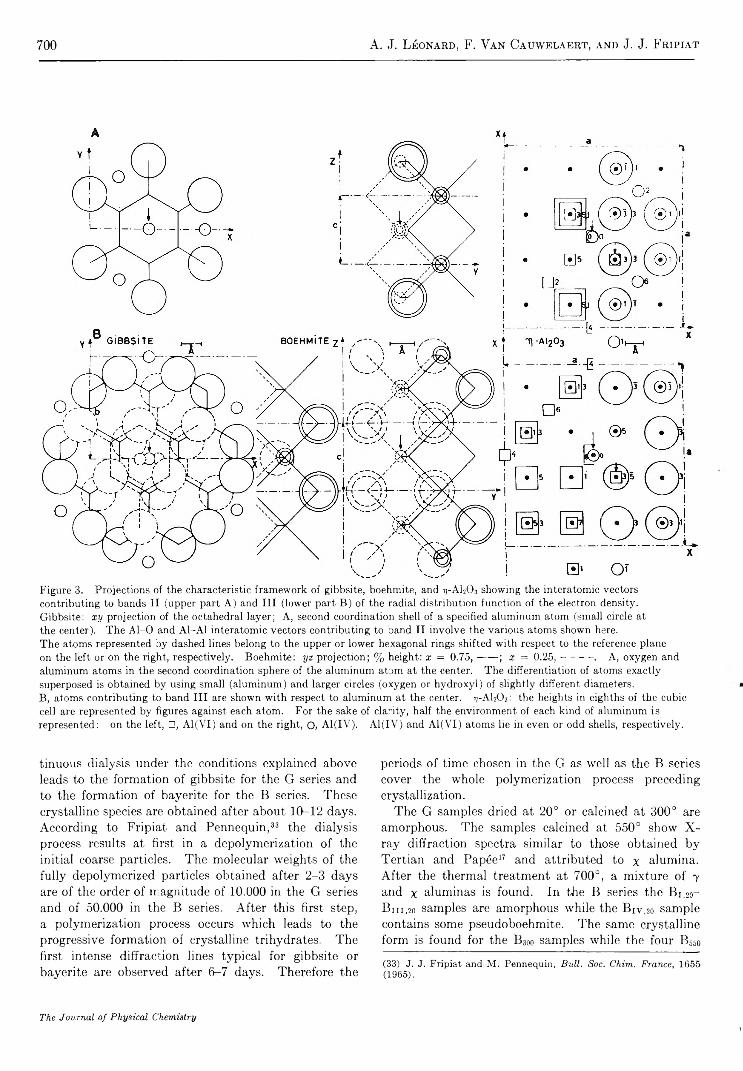
700 A. J. Léonard, F. Van Cauwelaert, and J. J. Fripiat
Figure 3. Projections of the characteristic framework of gibbsite, boehmite, and ij-ALOa showing the interatomic vectors contributing to bands II (upper part A) and III (lower part B) of the radial distribution function of the electron density.Gibbsite: x y projection of the octahedral layer; A, second coordination shell of a specified aluminum atom (small circle at the center). The A l-0 and Al-Al interatomic vectors contributing to band II involve the various atoms shown here.The atoms represented by dashed lines belong to the upper or lower hexagonal rings shifted with respect to the reference planeon the left or on the right, respectively. Boehmite: y z projection; % height: x = 0.75,----- ; x = 0.25,--------- . A, oxygen andaluminum atoms in the second coordination sphere of the aluminum atom at the center. The differentiation of atoms exactly superposed is obtained by using small (aluminum) and larger circles (oxygen or hydroxyl) of slightly different diameters.B, atoms contributing to band III are shown with respect to aluminum at the center. jj-AhOs: the heights in eighths of the cubic cell are represented by figures against each atom. For the sake of clarity, half the environment of each kind of aluminum is represented: on the left, □, Al(VI) and on the right, O, Al(IV). Al(IV) and Al(VI) atoms lie in even or odd shells, respectively.
tinuous dialysis under the conditions explained above leads to the formation of gibbsite for the G series and to the formation of bayerite for the B series. These crystalline species are obtained after about 10 -12 days. According to Fripiat and Pennequin,33 the dialysis process results at first in a depolymerization of the initial coarse particles. The molecular weights of the fully depolymerized particles obtained after 2-3 days are of the order of magnitude of 10.000 in the G series and of 50.000 in the B series. After this first step, a polymerization process occurs which leads to the progressive formation of crystalline trihydrates. The first intense diffraction lines typical for gibbsite or bayerite are observed after 6-7 days. Therefore the
periods of time chosen in the G as well as the B series cover the whole polymerization process preceding crystallization.
The G samples dried at 20° or calcined at 300° are amorphous. The samples calcined at 550° show X - ray diffraction spectra similar to those obtained by Tertian and Papée17 and attributed to x alumina. After the thermal treatment at 700°, a mixture of y and x aluminas is found. In the B series the B j,2o- Bn i,2o samples are amorphous while the B iv ,2o sample contains some pseudoboehmite. The same crystalline form is found for the B 30o samples while the four B 550
(33) J. J. F rip iat and M . Pennequ in , B ull. Soc. Chim. France, 1655 (1965).
The Journal of Physical Chemistry

Structure and Properties of Amorphous Silicoaluminas 701
samples exhibit diffraction patterns similar to that of r; alumina. B 70o contains the same transition species.
IV. Results of the Generalized Fourier Analysis
As shown by some examples in Figure 2, the radial distribution functions obtained for the various samples may be split into three main “ bands,” i.e ., band I from 1.5 to 2.1 A, band II from 2.4 to 3.7 A, and band I I I from 3.9 to 5.2 A. They will be discussed separately. This division is founded on the distribution of the interatomic Al-O, O-O, or Al-Al vectors in gibbsite,34 35 bayerite,36 boehmite,36 and y alumina.7
In order to decompose one band into its various components and to compute the respective contributions of the corresponding interatomic vectors, a gaussian distribution of the electron density is assumed. The amplitude “ y ” of a component is related to the distance x from the maximum of the peak by the relation
V = k e ~ h v (9)
where k is the maximum amplitude; h is related to half band width, hw, by the relationship h = y / 7r/hw. The surface of such a peak (which is comparable to a Patterson peak for crystalline substances) is equal to Z Z ' e2 A, where Z and Z ' are the atomic numbers of the opposite atoms at both ends of the vector under consideration. Since the position of the maximum of each peak can be foreseen from the various reference structures, half-widths are the experimental data required to compute the gaussian distributions. The half-width of an 0 - 0 vector was obtained from the data published previously on silica gels.21 The halfwidth for the A l-0 vector was computed from the A l-0 peak perfectly resolved in Bi,20 at 3.5 A while hw for the Al-Al vector was obtained from the Al-Al peak in the G 2o series after the weighted contributions of 0 - 0 and A l-0 have been subtracted. In summary, the hw values were, respectively, 0.187 A for Al-Al, 0.26 A for Al-O, and 0.39 A for 0 -0 . These half-widths were considered as independent of the coordination state and used indiscriminently for the resolution of bands I, II, and III. Such a procedure is justified by the good fit between the band shape computed from the experimental data and those obtained from the combination of the various components.
In order to give an idea about the various interatomic vectors involved in bands II and III, we have reproduced in Figure 3A and B the respective environments of an aluminum atom in the main structures.
The study of band I which contains the A l-0 contribution has been quite deceiving; it has been impossible to observe any significant modification for the various treatments. A reason for this is probably to
Figure 4. Radial electron distribution in gibbsite, bayerite, boehmite, and rç-AfiCh in the band I I domain.
be found in the perturbation arising from unoccupied octahedral holes. The dispersion of A l-0 distances in trihydrates provokes a distribution of the A l-0 vectors similar to that obtained for the species where both Al(IV) and Al(VI) cations are present. On the contrary, a great deal of information has been obtained from band II which shows the most drastic modifications when the samples are progressively dehydrated at increasing temperature.
(a) Band I I (8 .4 S .7 A). Taking into account the various vectors which are possibly involved in band II according to the model structures, the calculated profiles shown in Figure 4 were obtained. The bands computed from gibbsite and bayerite result from the superimposition of 0 - 0 and A l-0 distributions (dotted or broken lines), respectively, and from the A1(VI)~A1(VI) contributions (not shown). Likewise, for boehmite and7)-Al20 3, the band is made from the 0 - 0 and A l-0 contributions (broken lines) and of the Al-Al contributions (not shown). In 77-AI2O3, the peak centered on2.8 A represents the A1(VI)-A1(VI) vectors while the peak at 3.3 A is mainly due to the A1(IV)-A1(VI) vectors. The A1(IY)-A1(IV) vectors contribute to the deformation of the right wing of the peak centered on 3.3 A. The electron density distributions of Figure
(34) H . Saalfeld , see ref 14.(35) H . B osn ians, personal com m u n ica tion , to be published.
Volume 71, Number 3 February 1967

702 A. J. Leonard, F. Van Cauwelaert, and J. J. Fripiat
Figure 5. Band II: —•—, experimental radial distributions; --------- , computed radial distributions for the specified models.
4 may then be compared to the experimental profiles of band II.
For the low-temperature samples, G i ,2o, G iv ,2o, and B i ,2o, it is observed in Figure 5A that the second peak at 3.45-3.5 A fits the position well and even the intensity of the peak computed either for gibbsite or baye- rite while the first peak at 2.85 A is appreciably shifted toward a lower radius and is less intense than expected. The electron distribution curve obtained for B iv ,2o is more comparable to the band computed for boehmite. This is in agreement with the presence of some pseudo- boehmite detected in this sample by the usual X-ray diffraction procedure.
The small peak at 2.3 A in G iv ,2o and B IV,2o originates from a ghost, as already explained. The rather intense peak at 3.05 A in G j v ,2o is weaker in Gm ,2o and Gn,2o
and it appears as a weak shoulder in G i ,2o- It might thus represent a significant feature in the aging of hydrated alumina gels in acid medium. Since the first peak at 2.85 A in gibbsite, bayerite, and boehmite represents mainly A1(VI)-A1(VI) contributions while the second is almost entirely due to A l-0 or 0 - 0 contributions, the comparison between the observed and computed radial electron distributions for the low- temperature samples suggests that the organization of the oxygen layers is more readily achieved than the adequate distribution of the aluminum cations. From this respect the lack of organization seems to be still higher in the G series than in the B series. This may be correlated with the prolonged presence of aquo groups36 in the former since the dialysis process at low pH (G series) tends to maintain more of these aquo groups as shown by the measurement of the molecular weights in the course of the polymerization process, 33
by infrared spectroscopy, 37 and also by the higher water contents (Table II).
Let us consider the samples heated at 550°. The bands obtained for Gi.sso, Giv.sso, B i ,55o, and Biv.sso, are shown in Figure 5C where they are compared to the band computed from the structure of 17-AI2O3 (Figure 4). It is obvious that the contribution of the Al(VI)- Al(VI) vectors around 2.8 A fits almost exactly the position of the first peak of band II. The situation for the second component is different. The experimental band between 3 and 3.5 A is much broader than that computed for 77-AI2O3, especially for the G series. As this second component contains mainly the contributions of the A1(VI)-A1(IY) and of the Al(IV)- Al(IV) vectors (the latter on the right wing of the band), it is concluded that structural disorganization in transition aluminas may be mainly attributed to a disorganization in the distribution of fourfold coordinated aluminum cations.
When the 0 - 0 and A l-0 contributions, normalized for the intensity obtained from the experimental distributions, are subtracted, the contributions of the A1(VI)-A1(VI) vectors may be distinguished from those of A1(IV)-A1(YI) or A1(IV)-A1(IV) vectors as shown in Figure 6 A.
The situation for the G and B samples heated at 300° is more complex. According to their constitutional water contents, and especially for the B series, a “ boeh- mite-like” structure could be expected in agreement with Stumpf, et a l.3 However according to Saalfeld4
(36) J. C . B aylar, “ T h e C hem istry o f the C oord in a tion C o m p ou n ds,” R e in h old P ublish in g C orp ., N ew Y o rk , N . Y . , 1956, p 451.(37) J. J. F rip iat, F . V an C auw elaert, and H . B osm ans, J . P h y s . Chem., 69, 2458 (1965).
The Journal of Physical Chemistry

Structure and Properties of Amorphous Silicoaluminas 703
A
Figure 6. A: radial distribution obtained after subtractionof the A l-0 and 0 -0 contributions. Enclosed figures represent the R values defined by eq 12. B: upper curve,variation of R with respect to X calculated according to eq 12 for Ai = 11; lower line, relationship between the shift of the Al Ka line and X . The two extreme values are those observed for gibbsite ( X = 0) and a sodium zeolite { X = 1).
and Brindley and Choe2a the yield of boehmite from gibbsite on atmospheric heating is appreciable only when large parent crystals are used. As the theoretical electron distribution of boehmite and those obtained for the B3oo samples (Figure 5B) show a well-marked similarity, it may be assumed that a boehmite-like structure is formed. The same conclusion, however, does not hold for the G series ; a third peak is observed approximately at 3 .1 A, i.e ., in the region where the mixed A1(VI)-A1(IV) contributions appear in the high-temperature G and B samples (Figure 5C). In order to check this observation, the A l-0 and 0 - 0
contributions for boehmite, normalized as usual, have been subtracted from the distribution functions.. The two peaks assigned previously to the Al(VI) and Al(IV) contributions appear very distinctly, as shown in Figure 6 A.
The G and B series heated at 550° and the G series heated at 300° should then contain appreciable amounts of fourfold coordinated aluminum. The same situation exists for the G70o and B 70o samples which shows electron distribution functions very similar to those obtained at 550°.
(ib) The A l ( I V ) Contents and the S pinel-like Structures. Let JV6 and Ni be the number of sixfold and fourfold coordinated aluminum cations, respectively, and let N be the number of aluminum cations in one “ structure unit.” The numbers of A1(IV)-A1(IV) and A1(VI)-A1(VI) vectors in this unit are 0.5AT ( N t — 1 ) and 0.5 N e ( N e — 1 ), respectively, if the volume of the unit is chosen in such a way that it contains the aluminum cations present in the second coordination sphere of only one specified Al. The number of A1(IV)-A1(VI) vectors is then NiNs- If s is the electron density associated with one vector, the contributions of each of the A1(IV)-A1(IV) and of the Al(VI)- Al(IV) vectors to the peak area of band II, corrected for A l-0 and O-O, are
»V i = 0 . 5 N i ( N t - l)s £ 4-6 = N i N 6s (10)
The ratio of the area of these vectors to that of band II is then
^ _ S i—4 + $ 4-6 _Si-4 + Si-6 + $6-6
N j ( N 4 - 1 ) + 2N j N 6 _N ç(N q - 1) + 2NiN * + N i(N i - 1) ( }
Let X be N t/ N and (1 — X ) be N ç / N , then
« - ~ 1 1 m
It may be easily shown that N ranges approximately between 8 and 14 in oxide structures, according to their organization. Between these limits, R does not change appreciably with N for one given value of X .
Consequently, the variation of R with respect to X
has been plotted as shown in Figure 6 B, assuming N to be equal to 11 . In order to estimate R , band II, from which the contributions of A l-0 and 0 - 0 have been subtracted, has been divided into two regions, the first corresponding to the contribution of Al(VI)- Al(VI), the second to the contributions of Al(IV)- Al(VI) or A1(IV)-A1(IV) (Figure 6 A). The area under the curve for the latter has been determined be
V olum e 71, N um ber 8 F ebruary 1967

704 A. J. Léonard, F. Van Cauwelaert, and J. J. Fripiat
tween 2.9 and 3.4 A and it was divided by the total surface area of band II. This ratio was considered as a measurement of R and the corresponding X values were derived from eq 12. These results are given in Table III. The values obtained for X may be checked as follows. The shift (A) of the A1 I(a fluorescence line observed between the positions of this line for both bayerite and gibbsite on the one hand and for a sodium zeolite on the other hand is measured. A linear relationship is assumed to exist between A and X , considering X = 0 for the crystalline aluminum trihydrate and X = 1 for the sodium zeolite, as shown in Figure 6B. The shifts obtained for the G and B samples are measured and reported with respect to X . As shown in Figure 6B, they fit the straight line reasonably well. This agreement between two sets of completely independent results supports the interpretation of band II for the calcined samples but it raises an important question above the number of tetrahedral A1 cations which may be accomodated in spinel-like structures.
In a true spinel, one-third of the aluminum cations
Table III: R , R e la t iv e C o n tr ib u t io n s o f th e A 1 (I V ) -A 1 (V I ) an d A 1 (I V ) -A 1 (I V ) V e c to r s to B a n d I I ; X , R e la t iv e C o n te n t in F o u r fo ld C o o rd in a te d A lu m in u m O b ta in e d fr o m E q 12, an d A, S h ift o f th e A l K a L in e ( 1 0 -3 d e g )
A y
Sample Gl,300 Gi i ,300 GlII.300 GIV, 300 values
R 0 .5 5 0 .5 4 0 .5 3 0 .5 4X 0 .3 3 0 .3 2 0 .3 1 0 .3 2A 13 16 13 13 14
Gl,660 Gll,550 Gin,680 GIV, 660
R 0 .7 4 0 .7 7 0 .7 5 0 .7 7 0 .7 6X 0 .4 4 0 .5 0 0 .4 6 0 .4 4 0 .4 6A 22 (29) 23 22 22
GiV,700
R 0 .7 3 0 .7 3X 0 .4 5 0 .4 5A 23 23
Bi .bso Bll,560 B ill,660 BIV, 660
R 0 .6 3 0 .6 5 0 .6 5 0 .6 5 0 .6 5X 0 .3 7 0 .3 9 0 .3 9 0 .3 9 0 .3 9A 18 16 16 21 18
BIV, 700R 0 .4 9 0 .4 9X 0 .3 3 0 .3 3A 14 14
Gl,20 Gll,20 Gin,2o GlV,20 A = - 1Bl,20 Bh ,20 Bui,so BlV.20 A = + 1Bl,300 Bh .300 Bm,3oo B IV, 300 À = ~b 3
are on the tetrahedral sites, as proposed by Verwey38 according to the composition [AL.i[3 >.9](IV)[Ali4.2- □ 1.8](VI)032; such a structure is very unstable unless some cations, Na, Li, or H, substitute the lattice defects. In particular, Kordes8 has proposed for Li or H samples the composition A18(IV)A1i2H4(V I)032, for which X = 0.40, while the structure A1S(IV)- Ali4Na2(V I)032 with X = 0.36 was assigned to /3 alumina by Bragg, et ah39 Datta and Roy40 have expressed the view that the normal and inverse spinel structures may form a continuous sequence and that the cation distribution is essentially a function of the temperature and the pressure of formation. A structure in which there is a random distribution of the cations in the tetrahedral and octahedral sites appears possible. In such a case, X should reach 0.5 as reported by Rooksby10 for 9 alumina. It is particularly striking (1) that the maximum value of X , derived from the measurement of R , has never exceeded 0.50 (TableIII) and (2) that all the samples studied here always have a water content which is much above that required for the stabilization of a spinel structure.
The thermal evolution up to 300° of the B and G series is very different, although the hydrated samples dried at 20° under vacuum or the samples treated at 550° or above have comparable structures. The G series is characterized by low surface areas as compared with the B series (Table II). This observation is in contradiction with the conclusions of Lippens,5 since a boehmite-like structure seems to appear in the B samples treated at 300° in spite of the fact that the high values of the surface area suggest the existence of very fine-grained materials.
(c) Band I I I (3 .9 -5 .2 A ) . The contributions of the various interatomic vectors to this band were computed from the structure models, as shown in Figure 7. In each case band III contains three peaks, but their relative intensities and their positions are different. The most intense peak in gibbsite (5.05 A) is mainly due to the contribution of A1(VI)-A1(VI) vectors (dashed line) while the A l-0 vectors are mainly responsible for the weaker components at 4.15 and 4.45 A (dotted-dashed line). In boehmite, A1(VI)-A1(VI) vectors account almost completely for the sharp peak at 4.97 A and for a large proportion of the peak at4.69 A. In ?}-Al20 3, the second and the third peaks are also almost entirely due to A1(VI)-A1(VI) and A l(YI)-
(38) E . J. W . V erw ey , Z . K rist ., 91, 65 (1935).(39) W . L . B ragg, C . G ottfried , and J. W est, ib id ., 77 , 255 (1931).(40) R . K . D a tta and R . R o y , N ature , 191, 169 (1961).
The Journal o f P hysica l Chem istry
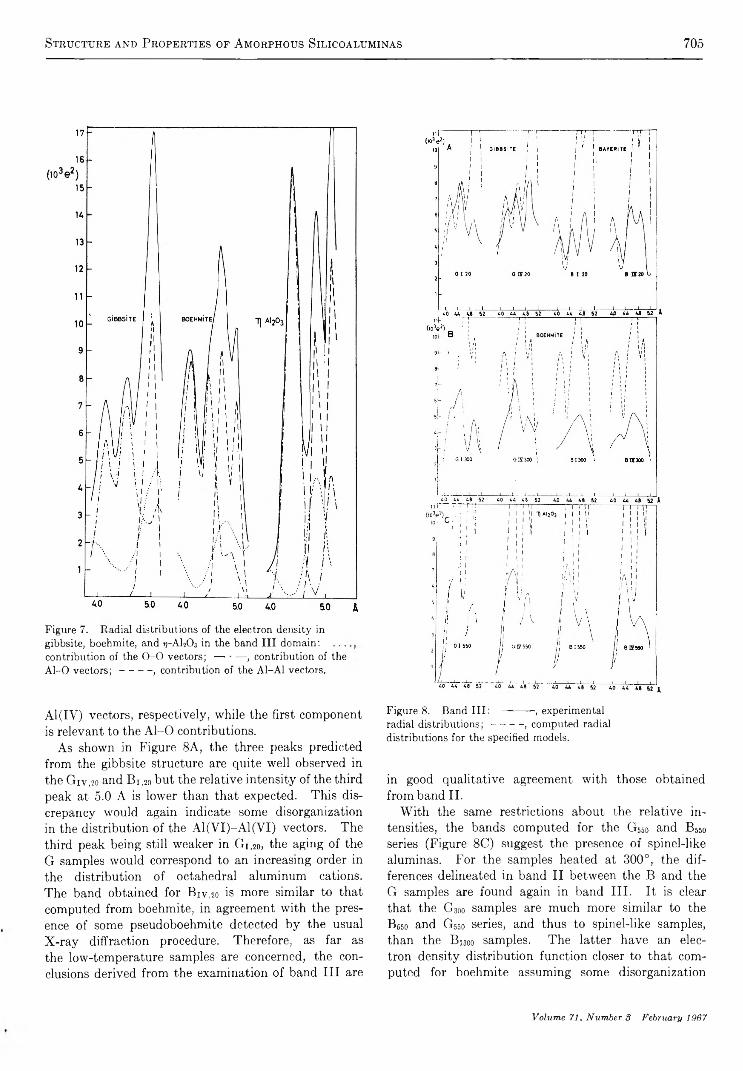
Structure and Properties of Amorphous Silicoaluminas 705
Figure 7. Radial distributions of the electron density in gibbsite, boehmite, and rç-AUOa in the band III domain: . ..contribution of the 0 -0 vectors; —■ • —, contribution of the A l-0 vectors;--------- , contribution of the Al-Al vectors.
Al(IV) vectors, respectively, while the first component is relevant to the A l-0 contributions.
As shown in Figure 8 A, the three peaks predicted from the gibbsite structure are quite well observed in the G iv ,2o and B i ,2o but the relative intensity of the third peak at 5.0 A is lower than that expected. This discrepancy would again indicate some disorganization in the distribution of the A1(VI)-A1(VI) vectors. The third peak being still weaker in G i .2o, the aging of the G samples would correspond to an increasing order in the distribution of octahedral aluminum cations. The band obtained for B iv ,20 is more similar to that computed from boehmite, in agreement with the presence of some pseudoboehmite detected by the usual X-ray diffraction procedure. Therefore, as far as the low-temperature samples are concerned, the conclusions derived from the examination of band I II are
Figure 8. Band III: —------ , experimentalradial distributions;--------- , computed radialdistributions for the specified models.
in good qualitative agreement with those obtained from band II.
With the same restrictions about the relative intensities, the bands computed for the G 550 and B 550
series (Figure 8 C) suggest the presence of spinel-like aluminas. For the samples heated at 300°, the differences delineated in band II between the B and the G samples are found again in band III. It is clear that the G 300 samples are much more similar to the B 550 and G 550 series, and thus to spinel-like samples, than the B^oo samples. The latter have an electron density distribution function closer to that computed for boehmite assuming some disorganization
Volume 71, Number 3 February 1967
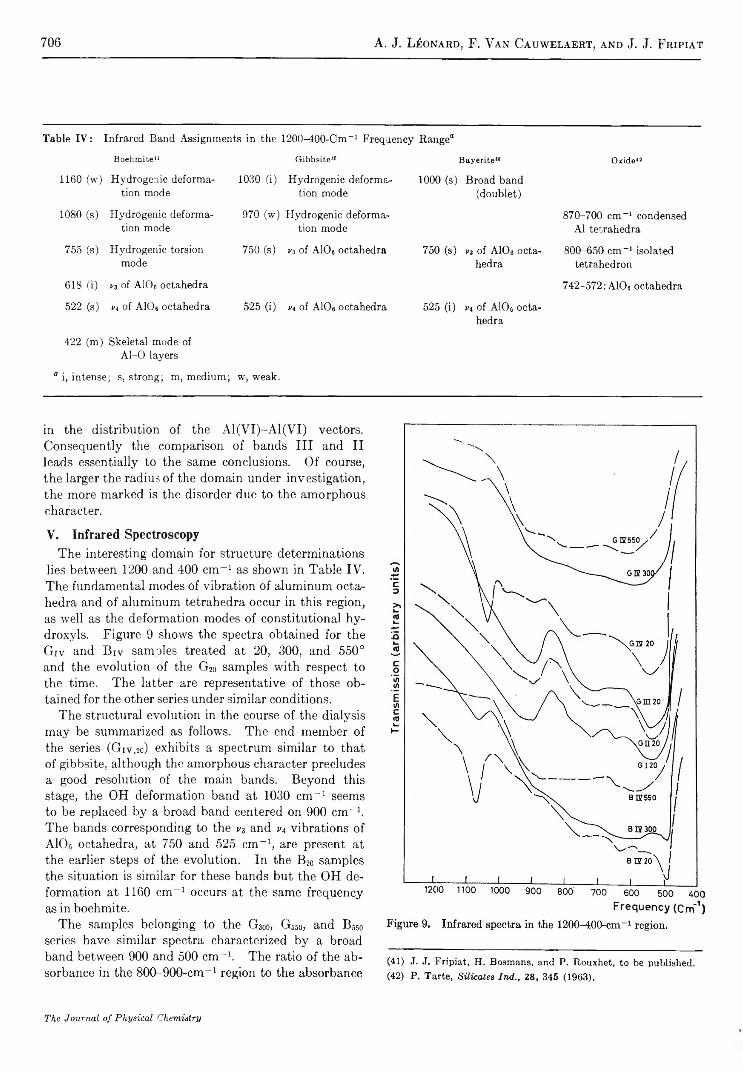
706 A. J. Léonard, F. Van Cauwelaert, and J. J. Fripiat
Table IV : Infrared Band Assignments in the 1200-400-Cm_1 Frequency Range8Boehmite41 Gibbsite35 Bayerite35 Oxide42
1160 (w) Hydrogenic deformation mode
1030 (i) Hydrogenic deformation mode
1000 (s) Broad band (doublet)
1080 (s) Hydrogenic deformation mode
970 (w) Hydrogenic deformation mode
870-700 cm-1 condensed A1 tetrahedra
755 (s) Hydrogenic torsion mode
750 (s) v z of AIO« octahedra 750 (s) V3 of A106 octahedra
800-650 cm-1 isolated tetrahedron
618 (i) v s of AIO« octahedra 742-572: AlO« octahedra
522 (s) V i of A106 octahedra 525 (i) V i of AIO« octahedra 525 (i) v i of A106 octahedra
422 (m) Skeletal mode of A l-0 layers
8 i, intense; s, strong; m, medium; w, weak.
in the distribution of the A1(VI)-A1(VI) vectors. Consequently the comparison of bands I II and II leads essentially to the same conclusions. Of course, the larger the radius of the domain under investigation, the more marked is the disorder due to the amorphous character.
V. Infrared SpectroscopyThe interesting domain for structure determinations
lies between 1200 and 400 cm-1 as shown in Table IV. The fundamental modes of vibration of aluminum octa- hedra and of aluminum tetrahedra occur in this region, as well as the deformation modes of constitutional hydroxyls. Figure 9 shows the spectra obtained for the Giv and B iv samples treated at 20, 300, and 550° and the evolution of the G20 samples with respect to the time. The latter are representative of those obtained for the other series under similar conditions.
The structural evolution in the course of the dialysis may be summarized as follows. The end member of the series (Giv.20) exhibits a spectrum similar to that of gibbsite, although the amorphous character precludes a good resolution of the main bands. Beyond this stage, the OH deformation band at 1030 cm- 1 seems to be replaced by a broad band centered on 900 cm- 1 . The bands corresponding to the v3 and vi vibrations of AlOe octahedra, at 750 and 525 cm- 1 , are present at the earlier steps of the evolution. In the B 20 samples the situation is similar for these bands but the OH deformation at 1160 cm-1 occurs at the same frequency as in boehmite.
The samples belonging to the G 300, G550, and B 550
series have similar spectra characterized by a broad band between 900 and 500 cm- 1 . The ratio of the absorbance in the 800-900-cm- 1 region to the absorbance
(41) J. J. F rip ia t, H . B osn ians, and P . R ou xh et, t o be published .(42) P . T a rte , Süicates In d ., 28, 345 (1963).
The Journal of Physical Chemistry

Structure and Properties op Amorphous Silicoaluminas 707
Table V : Structure Evolution with Respect to Temperature
■Temp, °C-
G series RD
20Gibbsite-like
300
Spinel-like
550
Spinel-like
700
Spinel-likeXRD Amorphous Amorphous X alumina x + y alumina
X 0.32 0.46 0.45
B series RD Gibbsite-like Boehmite-like Spinel-like Spinel-likeXRD Amorphous Amorphous r ¡ alumina r; alumina
X
(Brv, some ps.bh)“
0.39 0.33
“ ps.bh, pseudoboehmite.
in the 500-600-cm"1 region follows roughly the contents in tetrahedral aluminum. It may thus be concluded that this broad band contains on its high frequency side the vibrations of aluminum tetrahedra and on its low frequency side the vibrations of aluminum octahedra. This is in agreement with observations made previously on silicoaluminas.22
The structural organization revealed by the electron density distribution is thus reflected by the infrared spectra. It is, however, important to point out that an appreciable degree of organization achieved within a sphere of 5-A radius restores to only a limited extent the spectral characteristics of crystalline substances.
VI. Discussion
Table V summarizes the structure evolution deduced from the radial distribution of electron density (RD) from the X-ray diffraction (XRD) data and shows the average relative content in fourfold coordinated aluminum (X).
The terms gibbsite-like, boehmite-like, and spinellike are used to express the similarity of the observed radial distribution functions with those computed from the known models; they mean that within a sphere of an approximately 5-A radius and centered either on an aluminum or an oxygen atom, the structural organization displayed by these models is achieved approximately. The main differences between the G and the B series obtained by precipitating aluminum cations in acid or alkaline solutions are (1) the boehmite- like and spinel-like structures observed after partial dehydration at 300° of the B and G series, respectively, (2) the higher content in fourfold coordinated aluminum in the G series, and (3) the presence of a well-defined transition species in the B 660 and in the B 70o samples (i) alumina). In order to understand these remarks, it is of interest to consider the possible mechanisms of transformation of gibbsite into boehmite and of
boehmite into tj-ARCR A s emphasized by Ervin,43 the basic principle consists of a migration of A1 cations within relatively fixed arrangements of oxygen anions. The possible tetrahedral and octahedral coordinations of aluminum facilitate this movement and these transformation processes belong, therefore, to the class of ordered solid-state reactions. Brindley44 has reviewed the mechanisms proposed by Saalfeld and Rooksby in order to interpret these reactions and has shown that the apparently complex relations between the lattices of gibbsite, boehmite, and ??-Al20 3 turn out to have rather simple structural interpretations, namely, the maintenance of a nearly constant oxygen framework.
It has been shown several times in the presentation of the experimental results that the main discrepancy observed at the various pretreatment temperatures between the observed electron density distributions and those computed for gibbsite (or bayerite), boehmite, and 7?-Al20 3 was mainly due to a disorganization of the Al-Al vectors. This seems in perfect agreement with the basic assumption that it is the occasional migration paths followed by the aluminum cations in the course of dehydration or their distribution in the hydrated samples which are mainly responsible for the lack of crystalline organization.
Moreover the difference observed in the thermal behavior of the G2o and of the B 2o samples when heated at 300° depends probably to some extent on a higher concentration of aquo groups in the gels obtained in acid medium. The persistence of randomly distributed H20 ligands probably inhibits the ordered dehydration process. Oxygen vacancies are created by removing H20 molecules, leaving a less organized structure. Accordingly, protons still present behave as stabilizing
(43) G . E rvin , A cta C ryst., 5 , 103 (1952).(44) G . W . B rind ley , P rogr. Ceram. S ci., 3 , 1 (1963).
Volume 71, Number 3 February 1967

708 A. J. Leonard, F. Van Cauwelaert, and J. J. Fripiat
agents of the spinel structure and this would explain higher contents in fourfold coordinated aluminum in the G 550 and G 700 than in the B 550 and B 70o samples. A somewhat similar mechanism has been invoked by Peri45 for the formation of 7 alumina surfaces from hydrated alumina gels. From an application of the Monte Carlo method, Peri has shown that the removal of hydroxyl pairs from ideal OH surface would amount to a maximum of 67% of the original content insofar as no defects are formed. With defect formation, OH removal may reach 91% , while to obtain complete dehydration, migration of surface atoms is necessary. In the rather well-organized structure of the B 2o samples, removing OH to obtain a boehmite-like structure is achieved readily. In the less organized structure of the G2o samples the same process leads to the formation of a spinel-like structure. Heating above 550° produces similar spinel-like structures in both series but with a higher content of defects in the G series.
Assuming that the evolution observed for the G and B series is due to the more or less marked persistence of aquo groups, the thermal behavior of crystalline species according to their particle-size distribution may be explained. Small-grained materials are usually obtained by a fast precipitation process under conditions less favorable to achieve a good structural organization. These conditions may maintain more aquo groups and thus orient the thermal evolution up to 300° toward highly defective species.
In order to correlate the bulk structures to catalytic properties, it would be necessary to know to what extent the surface is an image of the atomic arrangement within the solid. From the statistical study made by Peri45 on the surface dehydroxylation process, such a connection is not obvious. However it seems highly probable that the less organized the starting materials, the more defective will be the surface. A spinel-like structure which contains an excess of tetrahedral aluminum with respect to the spinel composition is less stable and thus richer in defects. For samples with surface areas of the same order of magnitude, such as B iv ,55o and Giv.eso (Table II), the latter would have a more energetic surface than the former since the Al(IV) relative contents in the bulk is 10% higher. This would explain why transition aluminas characterized by similar structures may have different catalytic properties as observed for the 7 and 77 forms.
Acknowledgynents. We want to express our appreciation to Professor Meinguet and Miss Leboutte of the Computer Center of the university for their helpful cooperation in the numerical calculation of the electron density distribution. The part taken by Dr. Bosmans in the discussion has also been very fruitful.
(45) J. B. Peri, / . Phy8. Chem., 69, 220 (1965).
The Journal of Physical Chemistry
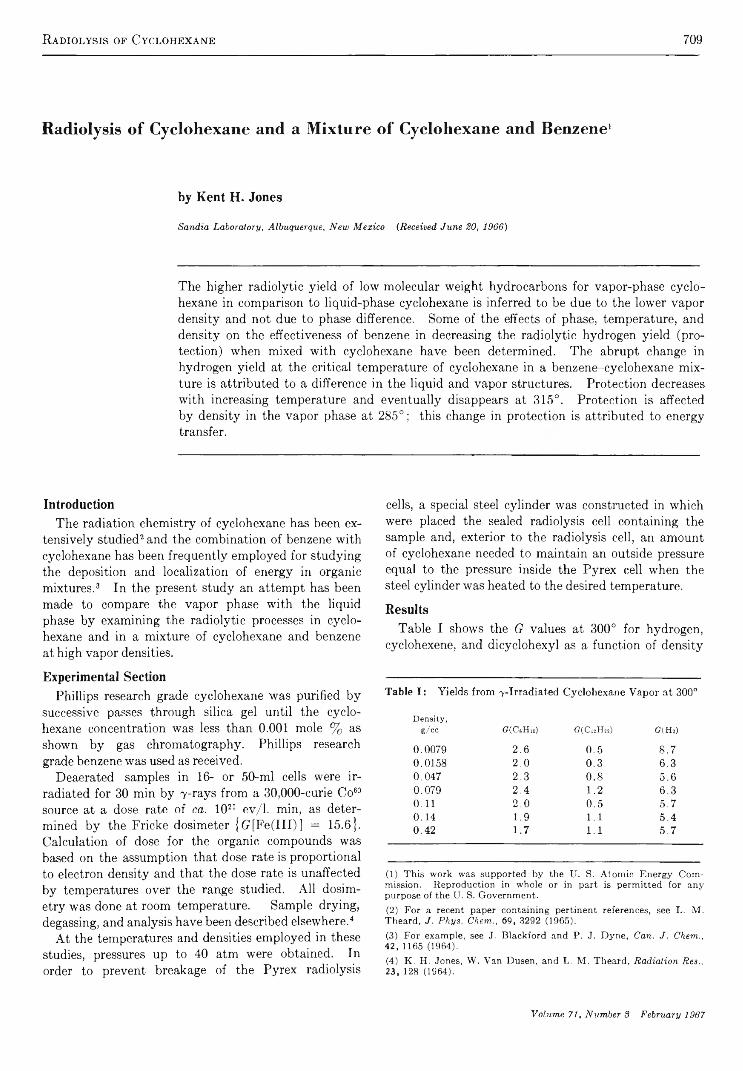
R adiolysis of Cyclohexane 709
Radioly sis of Cyclohexane and a Mixture of Cyclohexane and Benzene1
by Kent H. Jones
Sandia Laboratory , Albuquerque, N ew M ex ico (.Received June 20, 1966)
The higher radiolytic yield of low molecular weight hydrocarbons for vapor-phase cyclohexane in comparison to liquid-phase cyclohexane is inferred to be due to the lower vapor density and not due to phase difference. Some of the effects of phase, temperature, and density on the effectiveness of benzene in decreasing the radiolytic hydrogen yield (protection) when mixed with cyclohexane have been determined. The abrupt change in hydrogen yield at the critical temperature of cyclohexane in a benzene-cyclohexane mixture is attributed to a difference in the liquid and vapor structures. Protection decreases with increasing temperature and eventually disappears at 3 15 °. Protection is affected by density in the vapor phase at 285°; this change in protection is attributed to energy transfer.
IntroductionThe radiation chemistry of cyclohexane has been ex
tensively studied2 and the combination of benzene with cyclohexane has been frequently employed for studying the deposition and localization of energy in organic mixtures.3 In the present study an attempt has been made to compare the vapor phase with the liquid phase by examining the radiolytic processes in cyclohexane and in a mixture of cyclohexane and benzene at high vapor densities.
Experimental SectionPhillips research grade cyclohexane was purified by
successive passes through silica gel until the cyclohexane concentration was less than 0.001 mole % as shown by gas chromatography. Phillips research grade benzene was used as received.
Deaerated samples in 16- or 50-ml cells were irradiated for 30 min by y-rays from a 30,000-curie Co60 source at a dose rate of ca. 1021 ev/1. min, as determined by the Fricke dosimeter {(7[Fe(III)] = 15.6}. Calculation of dose for the organic compounds was based on the assumption that dose rate is proportional to electron density and that the dose rate is unaffected by temperatures over the range studied. All dosimetry was done at room temperature. Sample drying, degassing, and analysis have been described elsewhere.4
At the temperatures and densities employed in these studies, pressures up to 40 atm were obtained. In order to prevent breakage of the Pyrex radiolysis
cells, a special steel cylinder was constructed in which were placed the sealed radiolysis cell containing the sample and, exterior to the radiolysis cell, an amount of cyclohexane needed to maintain an outside pressure equal to the pressure inside the Pyrex cell when the steel cylinder was heated to the desired temperature.
ResultsTable I shows the G values at 300° for hydrogen,
cyclohexene, and dicyclohexyl as a function of density
Table I: Yields from 7-Irradiated Cyclohexane Vapor at 300°
Density,g/co G(C6H,o) G(Cl2H22) G(Hî)
0.0079 2.6 0.5 8.70.0158 2,0 0.3 6.30.047 2.3 0.8 5.60.079 2.4 1 .2 6.30. 1 1 2.0 0.5 5.70.14 1.9 1 . 1 5.40.42 1.7 1 . 1 5.7
(1) T h is w ork w as sup p orted b y th e U . S. A to m ic E n ergy C om m ission . R e p rod u ction in w h ole or in part is p erm itted fo r any purpose o f th e U . S. G overn m en t.(2 ) F or a recent paper con ta in ing pertinent references, see L . M . T h eard , J . P h y s . Chem ., 69, 3292 (1965).(3 ) F o r exam ple, see J. B la ck ford and P . J. D y n e , Can. J . Chem., 42, 1165 (1964).(4 ) K . H . Jones, W . V an D usen, and L . M . T h ea rd , R adiation Res., 2 3 , 128 (1964).
Volume 71, Number 3 February 1967
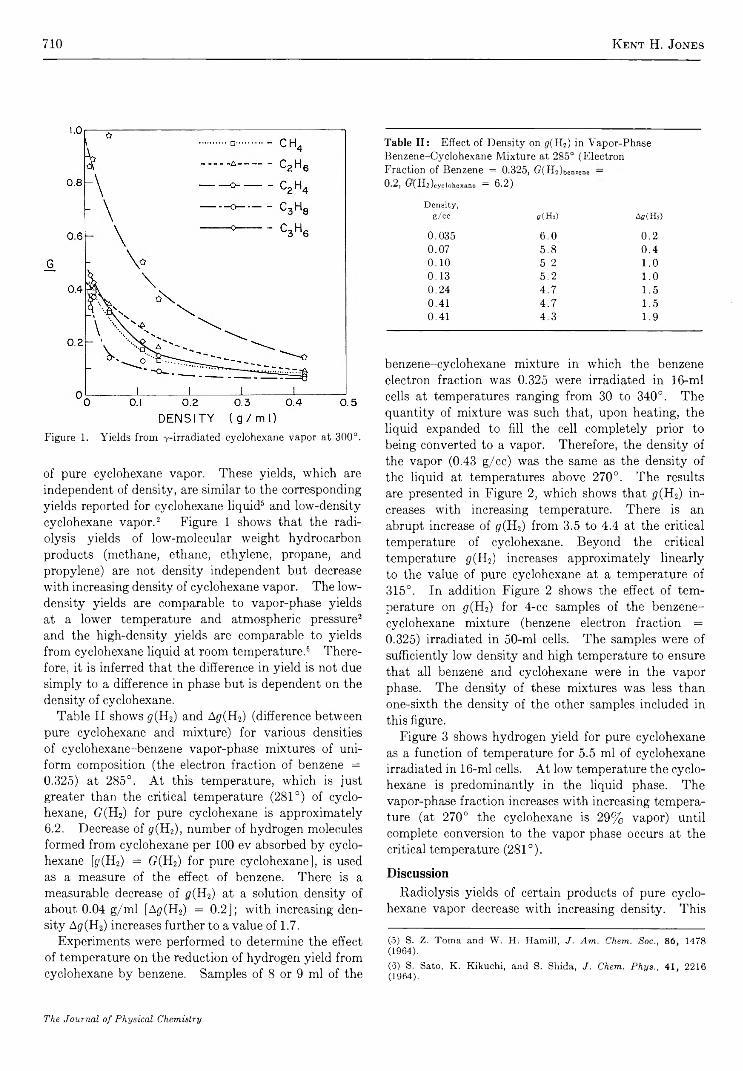
710 K ent H. Jones
Figure 1. Yields from y-irradiated cyclohexane vapor at 300°.
of pure cyclohexane vapor. These yields, which are independent of density, are similar to the corresponding yields reported for cyclohexane liquid5 and low-density cyclohexane vapor.2 Figure 1 shows that the radiolysis yields of low-molecular weight hydrocarbon products (methane, ethane, ethylene, propane, and propylene) are not density independent but decrease with increasing density of cyclohexane vapor. The low- density yields are comparable to vapor-phase yields at a lower temperature and atmospheric pressure2 and the high-density yields are comparable to yields from cyclohexane liquid at room temperature.6 Therefore, it is inferred that the difference in yield is not due simply to a difference in phase but is dependent on the density of cyclohexane.
Table II shows g,(H2) and Ag(H2) (difference between pure cyclohexane and mixture) for various densities of cyclohexane-benzene vapor-phase mixtures of uniform composition (the electron fraction of benzene = 0.325) at 285°. At this temperature, which is just greater than the critical temperature (281°) of cyclohexane, (7(H2) for pure cyclohexane is approximately6.2. Decrease of y(H2), number of hydrogen molecules formed from cyclohexane per 100 ev absorbed by cyclohexane [jf(H2) = (7(H2) for pure cyclohexane], is used as a measure of the effect of benzene. There is a measurable decrease of <7(H2) at a solution density of about 0.04 g/ml [A^(H2) = 0.2]; with increasing density Agf(H2) increases further to a value of 1.7.
Experiments were performed to determine the effect of temperature on the reduction of hydrogen yield from cyclohexane by benzene. Samples of 8 or 9 ml of the
Table II: Effect of Density on <?(H2) in Vapor-Phase Benzene-Cyclohexane Mixture at 2 8 5 ° (Electron Fraction of Benzene = 0 . 3 2 5 , G(H2)b enzene —0 .2, fj(H 2)cyclohexane = 6.2)
Density,g / c c 5 (H 2) Aff(Hî)
0 . 0 3 5 6 . 0 0 . 20 . 0 7 5 . 8 0 . 40 . 1 0 5 . 2 1.00 . 1 3 5 . 2 1.00 . 2 4 4 . 7 1 . 50 . 4 1 4 . 7 1 . 50 . 4 1 4 . 3 1 . 9
benzene-cyclohexane mixture in which the benzene electron fraction was 0.325 were irradiated in 16-ml cells at temperatures ranging from 30 to 340°. The quantity of mixture was such that, upon heating, the liquid expanded to fill the cell completely prior to being converted to a vapor. Therefore, the density of the vapor (0.43 g/cc) was the same as the density of the liquid at temperatures above 270°. The results are presented in Figure 2, which shows that <?(H2) increases with increasing temperature. There is an abrupt increase of gf(H2) from 3.5 to 4.4 at the critical temperature of cyclohexane. Beyond the critical temperature g,(II2) increases approximately linearly to the value of pure cyclohexane at a temperature of 315°. In addition Figure 2 shows the effect of temperature on gr(H2) for 4-cc samples of the benzene- cyclohexane mixture (benzene electron fraction = 0.325) irradiated in 50-ml cells. The samples were of sufficiently low density and high temperature to ensure that all benzene and cyclohexane were in the vapor phase. The density of these mixtures was less than one-sixth the density of the other samples included in this figure.
Figure 3 shows hydrogen yield for pure cyclohexane as a function of temperature for 5.5 ml of cyclohexane irradiated in 16-ml cells. At low temperature the cyclohexane is predominantly in the liquid phase. The vapor-phase fraction increases with increasing temperature (at 270° the cyclohexane is 29% vapor) until complete conversion to the vapor phase occurs at the critical temperature (281°).
DiscussionRadiolysis yields of certain products of pure cyclo
hexane vapor decrease with increasing density. This
(5) S. Z. T o m a and W . H . H am ill, J . A m . Chem. Soc., 8 6 , 1478 (1964).
(0 ) S. Sato, K . K ikuehi, and S. Shida, J. Chem. P h ys ., 41 , 2216 (1964).
The Journal of Physical Chemistry
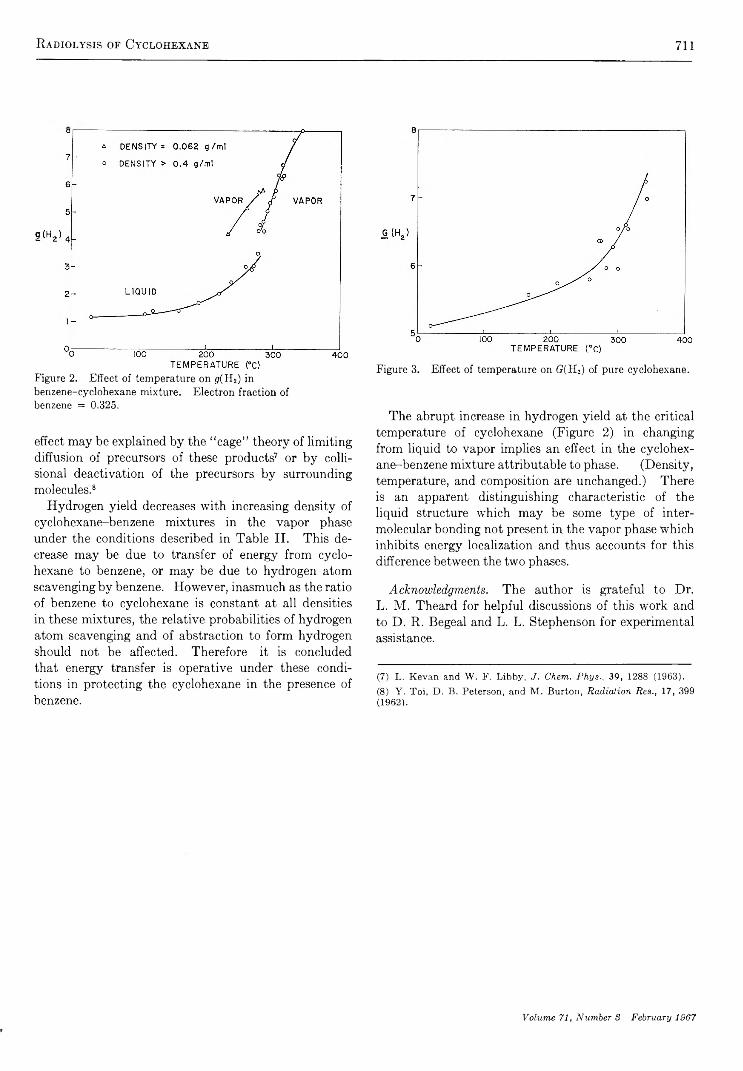
Radiolysis op Cyclohexane 711
Figure 2. Effect of temperature on ¡7(H2) in benzene-cyclohexane mixture. Electron fraction of benzene = 0.325.
effect may be explained by the “ cage” theory of limiting diffusion of precursors of these products7 or by colli- sional deactivation of the precursors by surrounding molecules.8
Hydrogen yield decreases with increasing density of cyclohexane-benzene mixtures in the vapor phase under the conditions described in Table II. This decrease may be due to transfer of energy from cyclohexane to benzene, or may be due to hydrogen atom scavenging by benzene. However, inasmuch as the ratio of benzene to cyclohexane is constant at all densities in these mixtures, the relative probabilities of hydrogen atom scavenging and of abstraction to form hydrogen should not be affected. Therefore it is concluded that energy transfer is operative under these conditions in protecting the cyclohexane in the presence of benzene.
Figure 3. Effect of temperature on G(H2) of pure cyclohexane.
The abrupt increase in hydrogen yield at the critical temperature of cyclohexane (Figure 2) in changing from liquid to vapor implies an effect in the cyclohexane-benzene mixture attributable to phase. (Density, temperature, and composition are unchanged.) There is an apparent distinguishing characteristic of the liquid structure which may be some type of inter- molecular bonding not present in the vapor phase which inhibits energy localization and thus accounts for this difference between the two phases.
Acknowledgm ents. The author is grateful to Dr.L. M. Theard for helpful discussions of this work and to D. R. Begeal and L. L. Stephenson for experimental assistance.
(7 ) L . K ev a n and W . F . L ib b y , J . Chem. P hys., 3 9 , 1288 (1963).(8 ) Y . T o i, D . B . P eterson , and M . B urton , R adialion R es., 17, 399 (1962).
Volume 71, Number S February 1967
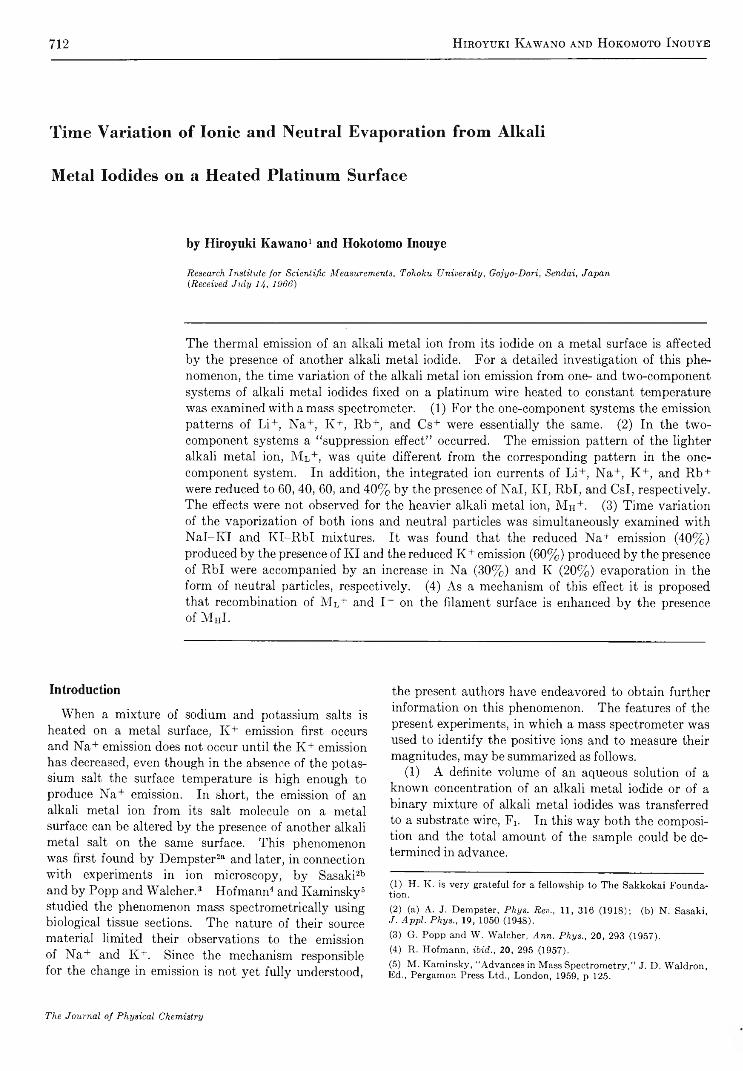
712 Hiroyuki Kawano and Hokomoto Inouye
Time Variation of Ionic and Neutral Evaporation from Alkali
Metal Iodides on a Heated Platinum Surface
by Hiroyuki Kawano1 2 and Hokotomo Inouye
Research Institu te fo r Scientific M easurem ents , Tohoku U niversity , G ojyo-D ori, Sendai, Japan ( Received Ju ly 14, 1966)
The thermal emission of an alkali metal ion from its iodide on a metal surface is affected by the presence of another alkali metal iodide. For a detailed investigation of this phenomenon, the time variation of the alkali metal ion emission from one- and two-component systems of alkali metal iodides fixed on a platinum wire heated to constant temperature was examined with a mass spectrometer. (1) For the one-component systems the emission patterns of Li+, N a+, K+, Rb+, and Cs+ were essentially the same. (2) In the two- component systems a “ suppression effect” occurred. The emission pattern of the lighter alkali metal ion, M l + , was quite different from the corresponding pattern in the one- component system. In addition, the integrated ion currents of Li+, Na+, K +, and Rb+ were reduced to 60, 40, 60, and 40% by the presence of Nal, K I, R b l, and Csl, respectively. The effects were not observed for the heavier alkali metal ion, M H+. (3) Time variation of the vaporization of both ions and neutral particles was simultaneously examined with N al-IvI and K I-R b I mixtures. It was found that the reduced Na+ emission (40%) produced by the presence of K I and the reduced K + emission (60%) produced by the presence of R b l were accompanied by an increase in Na (30%) and K (20%) evaporation in the form of neutral particles, respectively. (4) As a mechanism of this effect it is proposed that recombination of M l+ and I - on the filament surface is enhanced by the presence of M h I .
Introduction
When a mixture of sodium and potassium salts is heated on a metal surface, K + emission first occurs and Na+ emission does not occur until the K + emission has decreased, even though in the absence of the potassium salt the surface temperature is high enough to produce N a+ emission. In short, the emission of an alkali metal ion from its salt molecule on a metal surface can be altered by the presence of another alkali metal salt on the same surface. This phenomenon was first found by Dempster2a and later, in connection with experiments in ion microscopy, by Sasaki2b and by Popp and Walcher.3 Hofmann4 and Kaminsky5 studied the phenomenon mass spectrometrically using biological tissue sections. The nature of their source material limited their observations to the emission of N a+ and K +. Since the mechanism responsible for the change in emission is not yet fully understood,
the present authors have endeavored to obtain further information on this phenomenon. The features of the present experiments, in which a mass spectrometer was used to identify the positive ions and to measure their magnitudes, may be summarized as follows.
(1) A definite volume of an aqueous solution of a known concentration of an alkali metal iodide or of a binary mixture of alkali metal iodides was transferred to a substrate wire, Fi. In this way both the composition and the total amount of the sample could be determined in advance.
(1 ) H . K . is very gratefu l fo r a fellow sh ip to T h e S ak k ok ai F ou n d a - tion .
(2) (a) A . J. D em pster, P h ys. B e»., 11, 316 (1 91 8 ); (b ) N . Sasaki, J. A p p l. P h ys ., 19, 1050 (1948).(3) G . P o p p and W . W alcher, A n n . P h ys ., 2 0 , 293 (1957).(4) R . H ofm an n , ibid., 20, 295 (1957).
(5) M . K am insk y, “ A d van ces in M ass S p e c tro m e try ,” J. D . W ald ron , E d ., P ergam on Press L td ., L on d on , 1959, p 125.
The Journal of Physical Chemistry
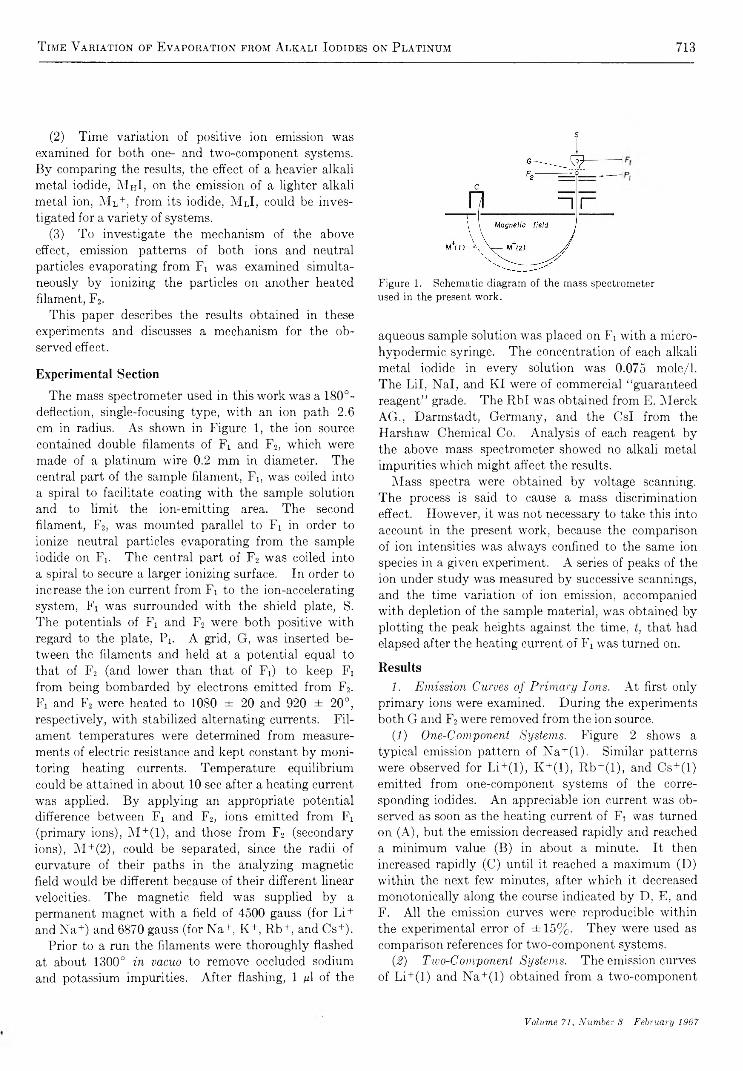
T ime Variation of Evaporation from Alkali Iodides on P latinum 713
(2) Time variation of positive ion emission was examined for both one- and two-component systems. B y comparing the results, the effect of a heavier alkali metal iodide, M HI, on the emission of a lighter alkali metal ion, M L+, from its iodide, M lI, could be investigated for a variety of systems.
(3) To investigate the mechanism of the above effect, emission patterns of both ions and neutral particles evaporating from Fi was examined simultaneously by ionizing the particles on another heated filament, F 2.
This paper describes the results obtained in these experiments and discusses a mechanism for the observed effect.
Experimental Section
The mass spectrometer used in this work was a 180°- deflection, single-focusing type, with an ion path 2.6 cm in radius. As shown in Figure 1, the ion source contained double filaments of Fi and F 2, which were made of a platinum wire 0.2 mm in diameter. The central part of the sample filament, Fi, was coiled into a spiral to facilitate coating with the sample solution and to limit the ion-emitting area. The second filament, F2, was mounted parallel to Ft in order to ionize neutral particles evaporating from the sample iodide on Fi. The central part of F 2 was coiled into a spiral to secure a larger ionizing surface. In order to increase the ion current from Fi to the ion-accelerating system, Fi was surrounded with the shield plate, S. The potentials of Fi and F 2 were both positive with regard to the plate, Pi. A grid, G, was inserted between the filaments and held at a potential equal to that of F2 (and lower than that of Fi) to keep Fi from being bombarded by electrons emitted from F 2. Fi and F2 were heated to 1080 ± 20 and 920 ± 20°, respectively, with stabilized alternating currents. Filament temperatures were determined from measurements of electric resistance and kept constant by monitoring heating currents. Temperature equilibrium could be attained in about 10 sec after a heating current was applied. B y applying an appropriate potential difference between Fi and F 2, ions emitted from F x (primary ions), M +(l), and those from F 2 (secondary ions), M +(2), could be separated, since the radii of curvature of their paths in the analyzing magnetic field would be different because of their different linear velocities. The magnetic field was supplied by a permanent magnet with a field of 4500 gauss (for Li+ and Na+) and 6870 gauss (for Na+, K+, Rb+, and Cs+).
Prior to a run the filaments were thoroughly flashed at about 1300° in vacuo to remove occluded sodium and potassium impurities. After flashing, 1 gl of the
s
Figure 1. Schematic diagram of the mass spectrometer used in the present work.
aqueous sample solution was placed on Fi with a microhypodermic syringe. The concentration of each alkali metal iodide in every solution was 0.075 mole/1. The Lil, Nal, and K I were of commercial “ guaranteed reagent” grade. The R b l was obtained from E. MerckAG., Darmstadt, Germany, and the Csl from the Harshaw Chemical Co. Analysis of each reagent by the above mass spectrometer showed no alkali metal impurities which might affect the results.
Mass spectra were obtained by voltage scanning. The process is said to cause a mass discrimination effect. However, it was not necessary to take this into account in the present work, because the comparison of ion intensities was always confined to the same ion species in a given experiment. A series of peaks of the ion under study was measured by successive scannings, and the time variation of ion emission, accompanied with depletion of the sample material, was obtained by plotting the peak heights against the time, t, that had elapsed after the heating current of Fi was turned on.
Results1. E m ission Curves o f P rim a ry Ion s. At first only
primary ions were examined. During the experiments both G and F 2 were removed from the ion source.
(1) One-Com'ponent &ly stems. Figure 2 shows a typical emission pattern of N a+(1). Similar patterns were observed for Li+(1), K + (l), Rb+(1), and Cs+(1) emitted from one-component systems of the corresponding iodides. An appreciable ion current was observed as soon as the heating current of Fi was turned on (A), but the emission decreased rapidly and reached a minimum value (B) in about a minute. It then increased rapidly (C) until it reached a maximum (D) within the next few minutes, after which it decreased monotonically along the course indicated by D, E, andF. All the emission curves were reproducible within the experimental error of ± 15 % . They were used as comparison references for two-component systems.
(2 ) T w o-C om ponent System s. The emission curves of Li+(1) and Na+(1) obtained from a two-component
Volume 71, Number 3 February 1967
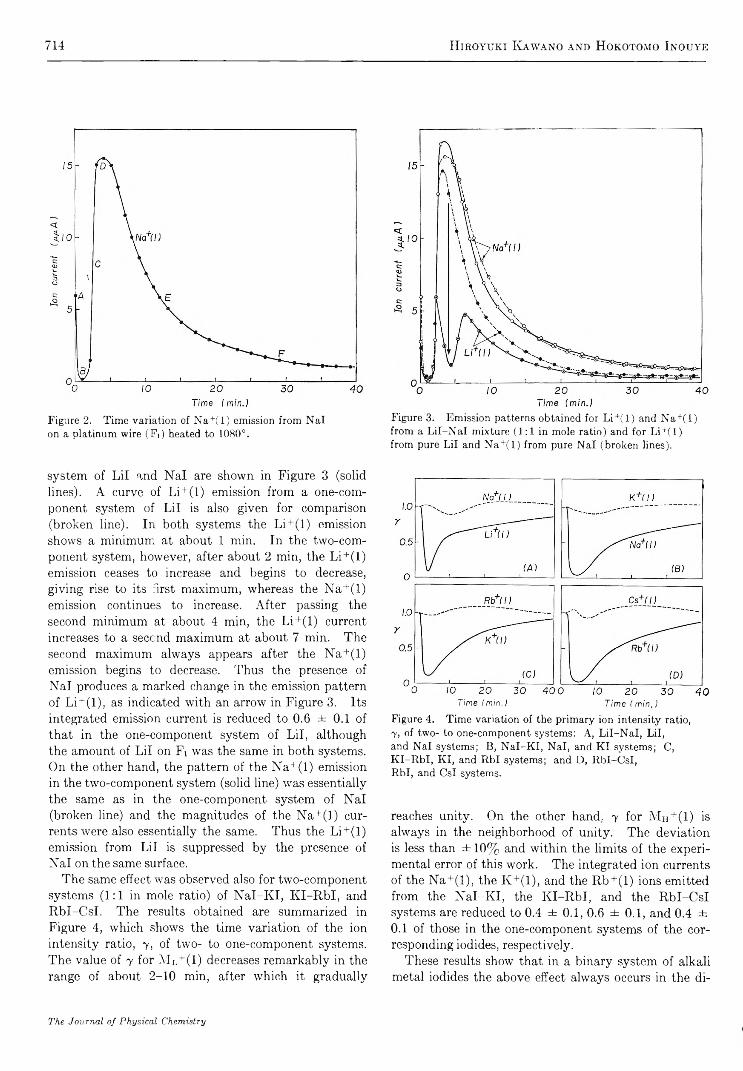
714 H iroyuki Kawano and Hokotomo Inouye
Figure 2. Time variation of Na+(1) emission from Nal on a platinum wire (Fi) heated to 1080°.
Figure 3. Emission patterns obtained for Li+(1) and Na+(1) from a Lil-Nal mixture (1:1 in mole ratio) and for Li+(1) from pure Lil and Na+(1) from pure Nal (broken lines).
system of L il and N al are shown in Figure 3 (solid lines). A curve of Li+(1) emission from a one-component system of L il is also given for comparison (broken line). In both systems the Li+(1) emission shows a minimum at about 1 min. In the two-component system, however, after about 2 min, the Li+(1) emission ceases to increase and begins to decrease, giving rise to its first maximum, whereas the Na+(1) emission continues to increase. After passing the second minimum at about 4 min, the Li+(1) current increases to a second maximum at about 7 min. The second maximum always appears after the Na+(1) emission begins to decrease. Thus the presence of N al produces a marked change in the emission pattern of Li+(1), as indicated with an arrow in Figure 3. Its integrated emission current is reduced to 0.6 ± 0.1 of that in the one-component system of L il, although the amount of L il on Fi was the same in both systems. On the other hand, the pattern of the N a+(1) emission in the two-component system (solid line) was essentially the same as in the one-component system of Nal (broken line) and the magnitudes of the N a +(1) currents were also essentially the same. Thus the Li+(1) emission from L il is suppressed by the presence of N al on the same surface.
The same effect was observed also for two-component systems ( 1 : 1 in mole ratio) of N a l-K I, K I-R b I, and R bl-C sI. The results obtained are summarized in Figure 4, which shows the time variation of the ion intensity ratio, y , of two- to one-component systems. The value of y for M l +(1) decreases remarkably in the range of about 2-10 min, after which it gradually
Time (min.) Time (min.)Figure 4. Time variation of the primary ion intensity ratio,7 , of two- to one-component systems: A, Lil-Nal, Lil, and Nal systems; B, Nal-KI, Nal, and KI systems; C, KI-RbI, KI, and Rbl systems; and D, Rbl-CsI,Rbl, and Csl systems.
reaches unity. On the other hand, y for Mh+(1) is always in the neighborhood of unity. The deviation is less than ± 10% and within the limits of the experimental error of this work. The integrated ion currents of the Na+(1), the K + (l), and the Rb+(1) ions emitted from the N a l-K I, the K I-R b I, and the R b l-C sI systems are reduced to 0.4 ± 0.1, 0.6 ± 0.1, and 0.4 ± 0.1 of those in the one-component systems of the corresponding iodides, respectively.
These results show that in a binary system of alkali metal iodides the above effect always occurs in the di
The Journal o f P h ysica l Chem istry

Time Variation of Evaporation from Alkali Iodides on Platinum 715
rection of decreasing atomic number, as in the series, Cs —► Rb -*■ K —► Na — Li. Namely, the emission pattern of a primary ion on the right in this series is changed and the magnitude of its current is reduced by the presence of an element (in the form of the iodide) on the left. The reverse effect does not occur. The observed effect, which will be referred to hereafter as the “ suppression effect,” shows the following characteristics.
(1) When the emission curve of M H+(1) begins to rise at about 2 min, the emission curve of M l+(1) ceases to rise and begins to fall, thereby producing a maximum.
(2) After passing its first maximum the M l +(1) emission does not begin to increase until the M H+(1) emission has passed its own maximum.
(3) Not only are the individual values of the M L+(1) emission from the M LI-M HI systems reduced, but the total integrated currents are also distinctly smaller, ranging from 40 to 60%. There is no evidence that the M l +(1) emission in the two-component systems persists longer than in the one-component systems of M J .
2. E m ission Curves o f P rim ary and Secondary Ions. Since the above results made the authors feel that the reduced M l+ emission might be associated with an increase in the quantity of M l evaporating in the form of neutral particles from Fi, evaporation of the neutral particles also was studied by ionizing them on F 2.
(1) One-Com ponent System s. Figure 5 is the emission curves of K +(l) and K +(2) obtained from a K I system. As in Figures 2 and 3, the peak heights in the mass spectra were plotted against t. (F2 was at temperature at all times.) As shown in the figure, the emission pattern of K+(2) is the same as that of K +(l). Quite similar results were obtained for one- component systems of N al and Rbl.
(2) Tw o-C om ponent System s. The emission curves for a binary system of NaL-KI are shown in Figure 6. As described above, the pattern of K + (l) is the same as that in the one-component system (Figure 5), whereas that of Na+(1) is much changed and depends on the emission of K + (l). This change in pattern, however, is found for neither Na+(2) nor K +(2).
Little change was found in the emission currents of Iv+(1) and K +(2) from the N a l-K I system relative to those from the K I system. On the other hand, the presence of K I gave rise to changes in the ion currents of both Na+(2) and Na+(1), as indicated by the open and the solid arrows, respectively, in Figure 7. The integrated emission current of Na+(2) in the N a l-K I system increases to 1.3 ± 0.1 of that in the N al system, while that of Na+(1) decreases to 0.4 ± 0 .1 .
Similar changes were observed for the K + emission
Figure 5. Emission patterns of K +(l) and K +(2) obtained for a KI system.
Figure 6. Emission patterns of the primary and the secondary ions obtained from a Nal-KI mixture (1:1 in mole ratio).
from a K I-R b l mixture (Figure 8). The integrated emission current of K+(2) in the mixture increases to1.2 ± 0.1, while that of K +(l) decreases to 0.6 ± 0.1 of that from the K I system. These changes, however, were not found for the Rb+ emission.
DiscussionThe results obtained in this work show that in the
MlI-M hI system the emission current of ML+(1) decreases, unlike that of Ml+(2) which increases, and that both changes take place in the same time interval. The authors conclude that the reduced Ml+(1) emission is caused by an increase in the vaporization of neutral particles due to the presence of the iodide, MhI. They will discuss the mechanism of this suppression effect.
1. Change o f W ork Function . Kaminsky5 suggested that the observed effect of K on Na+ emission might be due to change in work function of the metal surface. The change, however, could not explain the present
Volum e 71, N um ber 8 February 1967
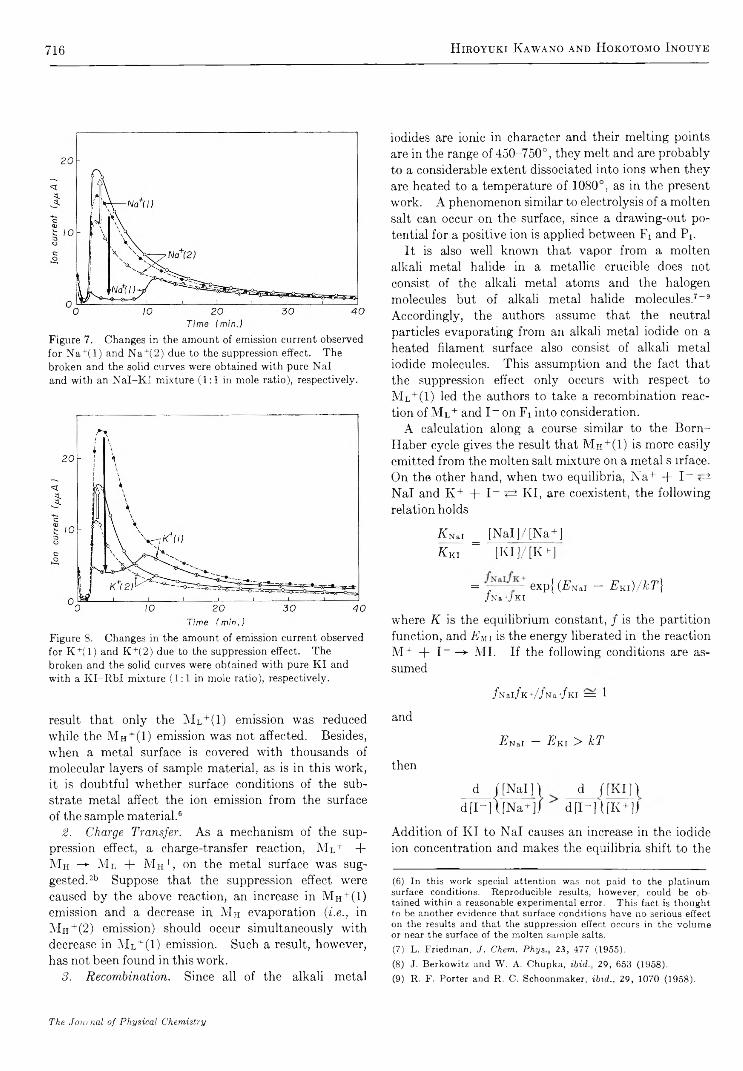
716 Hiroyuki K awano and Hokotomo Inouye
Figure 7. Changes in the amount of emission current observed for Na+(1) and Na+(2) due to the suppression effect. The broken and the solid curves were obtained with pure Nal and with an Nal-KI mixture (1:1 in mole ratio), respectively.
Figure 8. Changes in the amount of emission current observed for K +(l) and K +(2) due to the suppression effect. The broken and the solid curves were obtained with pure KI and with a KI-RbI mixture (1:1 in mole ratio), respectively.
result that only the Ml+(1) emission was reduced while the M H+(1) emission was not affected. Besides, when a metal surface is covered with thousands of molecular layers of sample material, as is in this work, it is doubtful whether surface conditions of the substrate metal affect the ion emission from the surface of the sample material.6
2. Charge Transfer. As a mechanism of the suppression effect, a charge-transfer reaction, M i+ + Mh -*• Ml + Mh+, on the metal surface was suggested.21’ Suppose that the suppression effect were caused by the above reaction, an increase in Mh+(1) emission and a decrease in M h evaporation (i.e., in Mh+(2) emission) should occur simultaneously with decrease in Ml+(1) emission. Such a result, however, has not been found in this work.
3. R ecom bination. Since all of the alkali metal
iodides are ionic in character and their melting points are in the range of 450-750°, they melt and are probably to a considerable extent dissociated into ions when they are heated to a temperature of 1080°, as in the present work. A phenomenon similar to electrolysis of a molten salt can occur on the surface, since a drawing-out potential for a positive ion is applied between Fi and Pi.
It is also well known that vapor from a molten alkali metal halide in a metallic crucible does not consist of the alkali metal atoms and the halogen molecules but of alkali metal halide molecules.7 8“ 9 Accordingly, the authors assume that the neutral particles evaporating from an alkali metal iodide on a heated filament surface also consist of alkali metal iodide molecules. This assumption and the fact that the suppression effect only occurs with respect to Ml+(1) led the authors to take a recombination reaction of M l+ and I - on Fi into consideration.
A calculation along a course similar to the Born- Haber cycle gives the result that M H+(1) is more easily emitted from the molten salt mixture on a metal s rrface. On the other hand, when two equilibria, Na+ + 1 “ <=± N al and K+ + 1 “ <= K I, are coexistent, the following relation holds
K n, i = [NaI]/[Na+] K m _ [KI]/[K+]
= y exp{ (AW - E Kl)/ k T ]/Na+jKI
where K is the equilibrium constant, / is the partition function, and A mi is the energy liberated in the reaction M+ + I - -*■ MI. If the following conditions are assumed
/Nal/K+//Na+/KI = 1
and
E N a l — A k I > k T
then
d ( [N al]) d ([K IH d [I-]\[N a + ]f d [I“ ]([K + ]J
Addition of K I to N al causes an increase in the iodide ion concentration and makes the equilibria shift to the
(6) In this w ork special atten tion was n ot pa id to the p latinum surface con ditions. R ep rod u cib le results, how ever, cou ld be o b tained w ithin a reasonable experim ental error. T h is fa ct is th ou g h t to be another ev idence that surface con d ition s h a ve n o serious e ffect on the results and that the suppression effect o ccu rs in th e vo lu m e or near th e surface o f the m olten sam ple salts.(7) L . F riedm an , J. Chem. P h y s 2 3 , 477 (1955).(8) J. B erk ow itz and W . A . C hupka, ibid., 29, 653 (1958).(9) R . F . P orter and R . C. S choonm aker, ibid., 29, 1070 (1958).
The Journal o f P hysica l Chem istry
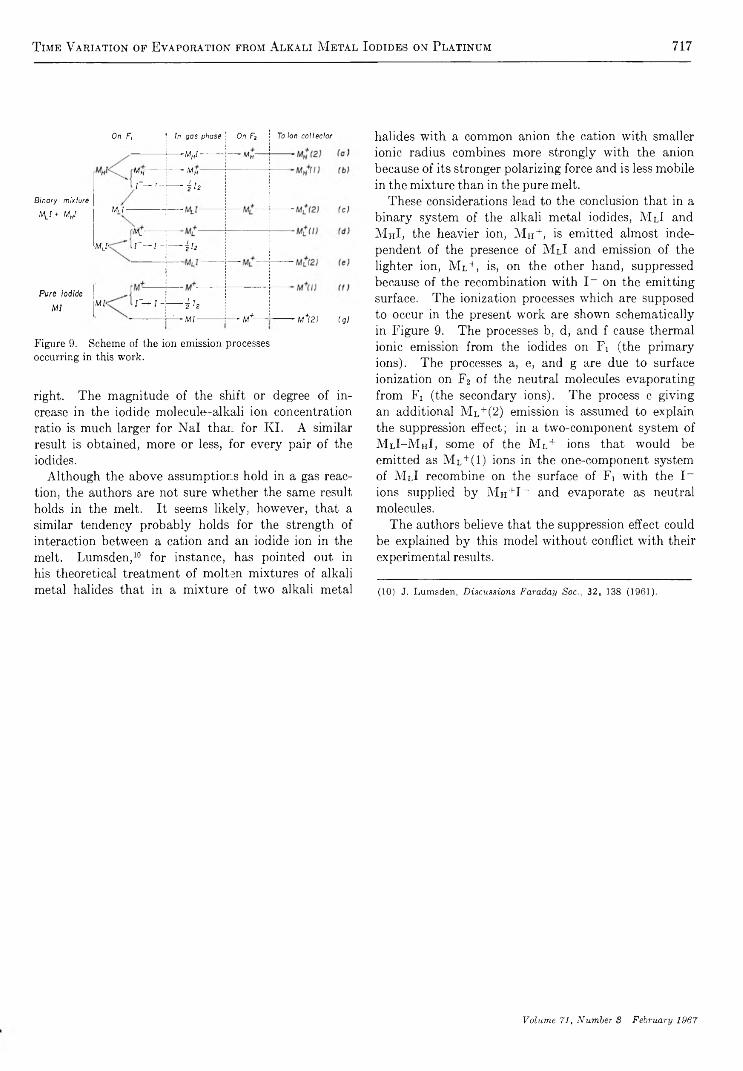
T ime Variation of Evaporation from Alkali M etal Iodides on Platinum 717
On F,
B inary m ixture
MJ+ Mrf
Pure iodide MI
'■MJ-
M l-
M , I -
In g a s p h a s e O n Fz To Ion c o l l e c t o r
- m h i • m h
m h
r— r -
■ - m h
— i h
m l
r — i - — i l e
r — i - __»J. T2 L2
--- -M I -------- —- M+---- -------M+(2J 1 g ì
Figure 9. Scheme of the ion emission processes occurring in this work.
right. The magnitude of the shift or degree of increase in the iodide molecule-alkali ion concentration ratio is much larger for N al than for K I. A similar result is obtained, more or less, for every pair of the iodides.
Although the above assumptions hold in a gas reaction, the authors are not sure whether the same result holds in the melt. It seems likely, however, that a similar tendency probably holds for the strength of interaction between a cation and an iodide ion in the melt. Lumsden,10 for instance, has pointed out in his theoretical treatment of molten mixtures of alkali metal halides that in a mixture of two alkali metal
halides with a common anion the cation with smaller ionic radius combines more strongly with the anion because of its stronger polarizing force and is less mobile in the mixture than in the pure melt.
These considerations lead to the conclusion that in a binary system of the alkali metal iodides, MlI and M hI, the heavier ion, M H+, is emitted almost independent of the presence of MlI and emission of the lighter ion, M i+, is, on the other hand, suppressed because of the recombination with I- on the emitting surface. The ionization processes which are supposed to occur in the present work are shown schematically in Figure 9. The processes b, d, and f cause thermal ionic emission from the iodides on F x (the primary ions). The processes a, e, and g are due to surface ionization on F 2 of the neutral molecules evaporating from Fi (the secondary ions). The process c giving an additional Ml+(2) emission is assumed to explain the suppression effect; in a two-component system of MlI-M hI, some of the Ml+ ions that would be emitted as Ml+(1) ions in the one-component system of MlI recombine on the surface of Fi with the I~ ions supplied by Mh+I_ and evaporate as neutral molecules.
The authors believe that the suppression effect could be explained by this model without conflict with their experimental results.
(10) J. Lum sden , D iscussions Faraday Soc., 32 , 138 (1961).
Volume 71, Number 8 February 1967
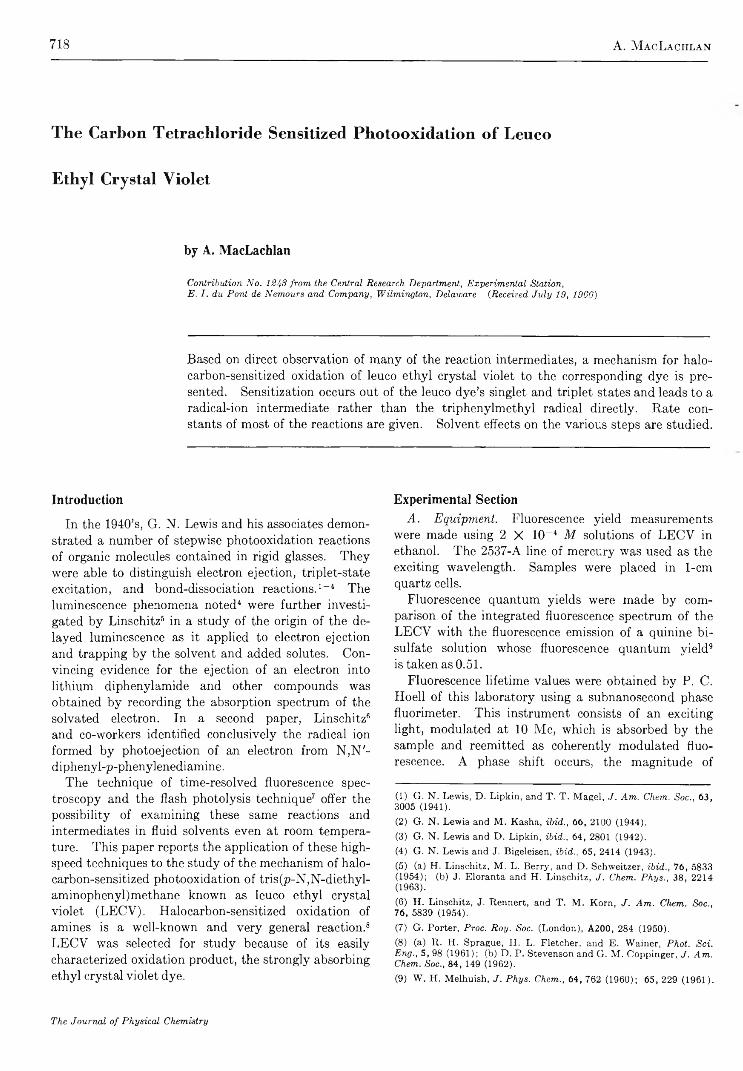
718 A. MacLachlan
The Carbon Tetrachloride Sensitized Photooxidation of Leuco
Ethyl Crystal Violet
by A. MacLachlan
Contribution N o . 124-8 from the Central Research D epartm ent, E xperim ental Station,E . I . du P on t de N em ours and Com pany, W ilm ington, Delaw are {Received Ju ly 19, 1966)
Based on direct observation of many of the reaction intermediates, a mechanism for halo- carbon-sensitized oxidation of leuco ethyl crystal violet to the corresponding dye is presented. Sensitization occurs out of the leuco dye’s singlet and triplet states and leads to a radical-ion intermediate rather than the triphenylmethyl radical directly. Rate constants of most of the reactions are given. Solvent effects on the various steps are studied.
Introduction
In the 1940’s, G. N. Lewis and his associates demonstrated a number of stepwise photooxidation reactions of organic molecules contained in rigid glasses. They were able to distinguish electron ejection, triplet-state excitation, and bond-dissociation reactions.1-4 The luminescence phenomena noted4 were further investigated by Linschitz8 in a study of the origin of the delayed luminescence as it applied to electron ejection and trapping by the solvent and added solutes. Convincing evidence for the ejection of an electron into lithium diphenylamide and other compounds was obtained by recording the absorption spectrum of the solvated electron. In a second paper, Linschitz6 and co-workers identified conclusively the radical ion formed by photoejection of an electron from N,N'- diphenyl-p-phenylenediamine.
The technique of time-resolved fluorescence spectroscopy and the flash photolysis technique7 offer the possibility of examining these same reactions and intermediates in fluid solvents even at room temperature. This paper reports the application of these highspeed techniques to the study of the mechanism of halo- carbon-sensitized photooxidation of tris(p-N,N-diethyl- aminophenyl) methane known as leuco ethyl crystal violet (LECV). Halocarbon-sensitized oxidation of amines is a well-known and very general reaction.8 LEC V was selected for study because of its easily characterized oxidation product, the strongly absorbing ethyl crystal violet dye.
Experimental SectionA . Equipm ent. Fluorescence yield measurements
were made using 2 X 10⁻⁴ M solutions of LEC V in ethanol. The 2537-A line of mercury was used as the exciting wavelength. Samples were placed in 1-cm quartz cells.
Fluorescence quantum yields were made by comparison of the integrated fluorescence spectrum of the LEC V with the fluorescence emission of a quinine bisulfate solution whose fluorescence quantum yield9 is taken as 0.51.
Fluorescence lifetime values were obtained by P. C. Hoell of this laboratory using a subnanosecond phase fluorimeter. This instrument consists of an exciting light, modulated at 10 Me, which is absorbed by the sample and reemitted as coherently modulated fluorescence. A phase shift occurs, the magnitude of
(1) G . N . Lewis, D . L ipkin , and T . T . M a gel, J . A m . Chem. Soc., 63, 3005 (1941).(2) G . N . L ew is and M . K asha, ibid,., 66, 2100 (1944).(3) G . N . L ew is and D . L ipk in , ibid., 64, 2801 (1942).(4) G . N . Lew is and J. B igeleisen, ibid., 65, 2414 (1943).(5) (a) H . L insch itz, M . L . B erry , and D . S chw eitzer, ibid., 76, 5833 (1954); (b ) J. E loran ta and H . L insch itz, J. Chem. P h ys ., 38, 2214 (1963).
(6) H . L insch itz, J. R ennert, and T . M . K orn , J . A m . Chem. Soc., 76, 5839 (1954).
(7 ) G . P orter, P roc. R oy . Soc. (L on d on ), A 200, 284 (1950).(8) (a) R . H . Sprague, H . L . F letcher, and E . W ainer, P hot. S ci. E ng., 5 , 98 (1961 ); (b ) D . P . S tevenson and G . M . C op p in ger, J . A m . Chem. Soc., 84, 149 (1962).
(9) W . H . M elhuish , J . P h ys . Chem., 64, 762 (1 96 0 ); 65, 229 (1 96 1 ).
The Journal of Physical Chemistry

P h o t o o x i d a t i o n o f L e u c o E t h y l C r y s t a l V i o l e t 719
Figure 1. Photolyzing monochromator with continuous analysis.
which can be related to the lifetime of the fluorescence state by the expression
tan (ait') = cor
where t' is the phase delay, co is 2trf ( / = 10 Me), and r is the lifetime of the fluorescing state. At small angles, the phase delay is equal to the lifetime.
Quantum yield measurements of color (<bc) were made on an apparatus designed by P. C. Hoell. Figure 1 presents a block diagram of the experimental arrangement. The sample to be irradiated is placed in a 1- cm path length quartz cell, the photolyzing wavelength is selected by adjustment of the monochromator, and then the shutter is opened. Optical density is followed by a double-beam spectrometer wherein OD is presented to the x axis of an x -y recorder. The total dose is monitored by deflecting a small fraction of the light leaving the monochromator to a phototube and integrating circuit. Integrated dose is then fed to the y axis of the recorder. Graphs of OD vs. dose are obtained, the slopes of which are directly proportional to the quantum yield, $c- Quantum yields were placed on an absolute basis by taking advantage of the known quantum yield of crystal violet leuco nitrile ($ = 1 in ethanol).10 The color produced is the same species as the oxidized LECV and thus it is merely a matter of comparing slopes.
B. Flash Photolysis. The flash photolysis apparatus was similar to that described by Porter.7 The flash duration has a half-width of 4 /nsec. The analyzing lamp was operated from a 6-v storage battery.
Samples are deoxygenated by flushing for 10 min with purified argon. Argon pressure was used to drive the sample through the flash photolysis cell.
ResultsA. Quantum Yields. It is readily demonstrated
that LECV photooxidizes in the presence of a wide variety of materials (halocarbons, quinones, and other electron-deficient molecules) and yields the intensely colored cationic dye (Amax 5900 A, e 110,000 l./mole-cm). Halocarbons are an especially convenient series of sensitizers since they may be obtained pure and their structures may be varied. The major part of this study will be concerned with CC14 as a sensitizer.
The absorption spectrum of a 2 X 10⁻⁴ M solution of LECV in ethanol, in the presence of 0.1 M CC14, is given in Figure 2. No obvious effects of CC14 were observed on the LECV spectrum. However, photolysis with 3200-A light, thus photolyzing into the leuco dye, yields the dye cation only when CC14 is present. Quantum yields (4>c) are given in Table I. There is a marked effect of CC14 concentration when oxygen is present and a negligible effect over the range studied when it is absent.
Table I : Effect of CC14 Concentration and Oxygen and the Color Quantum Yield in Ethanol
LECV, ecu, 0 2M M present? 3>C
2 X 10~4 0.005 Yes 0.362 X 10-“ 0.01 Yes 0.522 X 10~4 0.03 Yes 0.612 X IO“ 4 0.05 Yes 0.652 X 10⁻⁴ 0 .1 Yes 0.682 X 10“ 4 0.001 No 1.092 X IO"4 0.005 No 1.142 X IO“ 4 0.03 No 1.172 X 10“ 4 0.1 No 1.16
An important clue to the reason for the variation in $ , values can be obtained by examining the singlet- state reactions of LECV. The reactions to be considered are
rate
DH + hv — >• DH* (1)DH* — > hv' + heat + DH kt (DH*) (2)
DH* — > heat + DH h(D H *) (3)
DH* — > T fcT(DH*) (4)
DH* + Q — > product fcQ(DH*)(Q) (5)where DH is LECV, with D representing the complete
(10) A . H. Sporer, Trans. Faraday Soc., 57, 983 (1961).
Volume 71, Number 3 February 1967
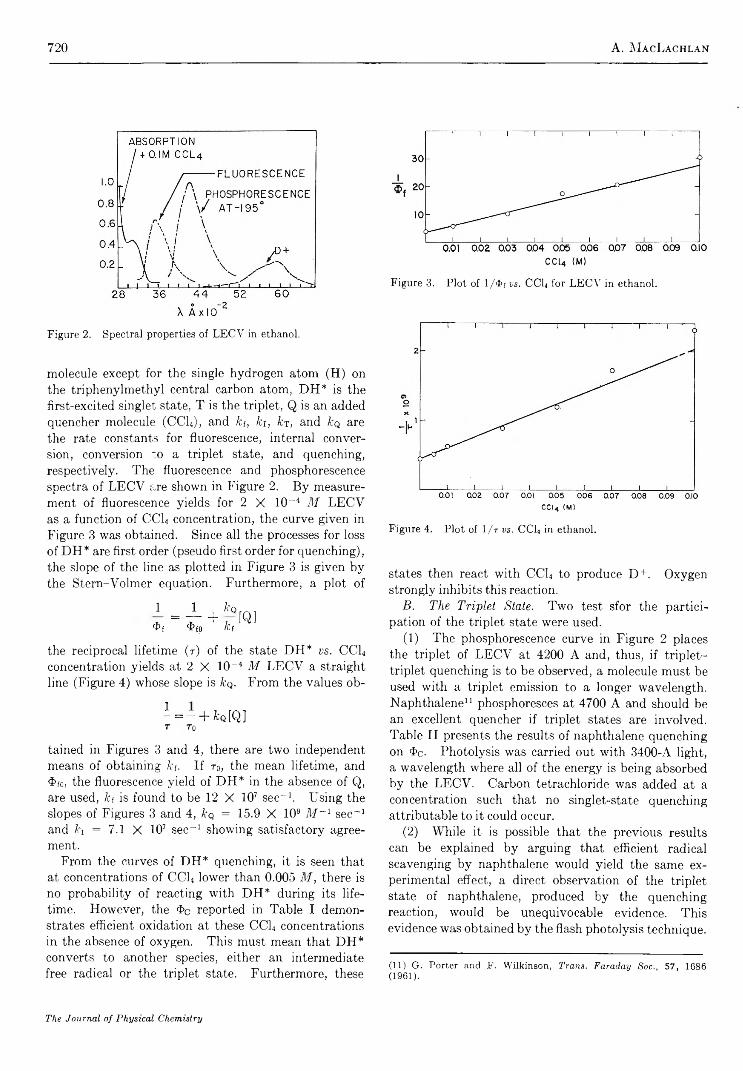
720 A. M a c L a c h l a n
Figure 2. Spectral properties of LECV in ethanol.
molecule except for the single hydrogen atom (H) on the triphenylmethyl central carbon atom, DH* is the first-excited singlet state, T is the triplet, Q is an added quencher molecule (CC14), and kt, ki, kr, and &q are the rate constants for fluorescence, internal conversion, conversion to a triplet state, and quenching, respectively. The fluorescence and phosphorescence spectra of LECV are shown in Figure 2. By measurement of fluorescence yields for 2 X 10” 4 M LECV as a function of CC14 concentration, the curve given in Figure 3 was obtained. Since all the processes for loss of DH* are first order (pseudo first order for quenching), the slope of the line as plotted in Figure 3 is given by the Stern-Volmer equation. Furthermore, a plot of
1Lf
kçi kt [Q]
the reciprocal lifetime (r) of the state DH* vs. CC14 concentration yields at 2 X 10” 4 M LECV a straight line (Figure 4) whose slope is kq. From the values ob-
1 = - + fcQ[Q]T T0
tained in Figures 3 and 4, there are two independent means of obtaining ku If t 0, the mean lifetime, and 4>fo, the fluorescence yield of DH* in the absence of Q, are used, kt is found to be 12 X 107 sec” 1. Using the slopes of Figures 3 and 4, kq = 15.9 X 10⁹ M ” 1 sec-1 and A’i = 7.1 X 10⁷ sec” 1 showing satisfactory agreement.
From the curves of DH* quenching, it is seen that at concentrations of CC14 lower than 0.005 M, there is no probability of reacting with DH* during its lifetime. However, the 4>c reported in Table I demonstrates efficient oxidation at these CC14 concentrations in the absence of oxygen. This must mean that DH* converts to another species, either an intermediate free radical or the triplet state. Furthermore, these
cci4 (M)Figure 3. Plot of l / i t v s . CC14 for LECV in ethanol.
C C I 4 ( M )
Figure 4. Plot of 1 / t v s . CC14 in ethanol.
states then react with CC14 to produce D+. Oxygen strongly inhibits this reaction.
B. The Triplet State. Two test sfor the participation of the triplet state were used.
(1) The phosphorescence curve in Figure 2 places the triplet of LECV at 4200 A and, thus, if triplet- triplet quenching is to be observed, a molecule must be used with a triplet emission to a longer wavelength. Naphthalene11 phosphoresces at 4700 A and should be an excellent quencher if triplet states are involved. Table II presents the results of naphthalene quenching on 4>c. Photolysis was carried out with 3400-A light, a wavelength where all of the energy is being absorbed by the LECV. Carbon tetrachloride was added at a concentration such that no singlet-state quenching attributable to it could occur.
(2) While it is possible that the previous results can be explained by arguing that efficient radical scavenging by naphthalene would yield the same experimental effect, a direct observation of the triplet state of naphthalene, produced by the quenching reaction, would be unequivocable evidence. This evidence was obtained by the flash photolysis technique.
(11) G. Porter and F. Wilkinson, Trans. Faraday Soc., 57, 1086 (1961).
The Journal of Physical Chemistry

P h o t o o x i d a t i o n o f L e u c o E t h y l C r y s t a l V i o l e t 721
Table II : Naphthalene Quenching of 4>c“
N aph- R e la tiveL E C V , C C L , thalene, quantum
M M M yield
10~3 10 -3 110“ 3 10 -3 10-3 0.8IO“ 3 10 -3 3 X 10“ 3 0.35
All runs were made in the absence of oxygen.
Filters and concentration were adjusted so that practically all the photolyzing light was absorbed by the LECV. In the absence of LECV, 0.003 M naphthalene in ethanol yields only an indication of the triplet- triplet absorption at 4100 A. When 2 X 10 ~4 M LECV is added, the 4100-A transient increases markedly in intensity. Combining this direct observation with the quantum yield data in Table II serves to identify the triplet state of LECV as the major product of the unquenched singlet state.
C. Reaction Intermediates. Investigation of the rate of D + formation with flash photolysis revealed some interesting solvent effects. Observation of D + at 5900 A as a function of time after the photolysis flash (half-width 4 ¿isee) demonstrated that in non- viscous polar solvents (methanol, ethanol) the D+ is formed with appreciable delay, while in viscous (glycerol) or nonpolar solvents (CCL, cyclohexane), the D+ formation is instantaneous.
Examination of the kinetics of D+ formation reveals that good first-order kinetics are obeyed over the entire range of the slow part of the traces. Table III presents the first-order rate constants determined for a number of runs and sensitizers.
Table III : Slow Rate of D ' Formation
Sensitizer M Solventk ,
se c " 1
Carbon tetrachloride 10 -3 Ethanol 29Carbon tetrachloride 2 x 1 er3 Methanol 34Carbon tetrachloride 5 x 10 -3 Ethanol 24Hexachloroethane 10 -3 Ethanol 19 (1)Chloroform 29 (1)Carbon tetrachloride (20%) Ethanol 23Cardon tetrachloride 0.04 Ethanol 20, 20,22
The transient curves in ethanol and methanol are always composed of two distinct parts. A fraction of the D+ is formed with a rate that follows the flash and the remainder is generated in the slow first-order
process. Solvent viscosity is not the sole characteristic feature that determines the presence or absence of the two reactions because glycerol also suppresses the slow part. The mechanism below is consistent with all of the data.
DH* + CCL — > DH+ + CCi4- (6)
DH+ + CCL“ — ► D+ + HC1 + :CC12 + C l- (7)
DH + CC14- (-CCL + CD) — >DH+ + CCL" + C l- (8)
D H + ^ i : D - + H + (9)
DH+ + D ’ ■—> D+ + DH (10)
Reaction 6 is an electron-exchange reaction from either singlet or triplet DH, which yields the Wiirster- type ion radical, DH+. The CCL- formed is still capable of oxidizing DH+ to D+ and does so to the extent dictated by its proximity to DH+ and the rate of reaction. Reaction 7 will be favored by an increase in viscosity as was observed with glycerol. The prior formation of the ion radical DH+ is favored over a direct formation of D because of the dramatic solvent effect. At high dielectric constants, as in ethanol and methanol, the ion would be expected to have greater stability than in a solvent of lower dielectric constant, like CCL or cyclohexane. The intermediate DH + formed from the sensitized oxidation of DH was easily observed at —85° in methanol through the employment of esr spectroscopy. The single-line spectrum observed by photolysis of a 5% CCL-95% MeOH solution of 10-4 M DH could not be resolved to obtain hy- perfine structure. On warming, in the absence of further photolysis, the radical disappeared and the characteristic 5900-A absorption of D+ appeared.
Reaction 8 expresses the further possible reactions of the reduced CCL, either in the form of CCL- or •CCL- It is necessary to invoke these additional oxidizing species because of the quantum yield data in Table I. It can be seen from the reactions leading to D + that a quantum yield of one would be expected.
The precursor to D+ can be observed at 4800 A. Because of its much lower extinction coefficient, meaningful kinetics could not be obtained; however, the lifetime for decay corresponded to the lifetime for D + formation. There are no protonated forms of D + that have an absorption maximum at 4800 A. The intermediate DH+ must attain the final oxidation state, D+, at the rate and kinetic order found for the slow part of the D+ formation. Reactions 9 and 10 represent the most probable manner in which this is accom
Volume 71, Number 8 February 1967

722 A . M a c L a c h l a n
plished. The first-order kinetics observed for D+ formation dictate a prior equilibrium process as in (9) and furthermore make the D • formation the rate-determining step. Addition of 10~4 M HC1 to the solution increased the lifetime of DH + to 100 msec in agreement with the equilibrium nature of reaction 9. However, with all the other potentially protonating sites on LECV, this cannot be taken as proof for reaction 9.
S u m m a r y
Reactions 1-9 represent a plausible reaction scheme for the halocarbon-sensitized oxidation of LECV. The identity of the actual sensitizing steps in the reaction with the processes studied by Lewis and coworkers1-4 and Linschitz6'8 in the solid state at low temperatures suggests that many of these previously studied reactions can be examined at room temperature using the flash photolysis technique.
This work also supplies direct proof that both the singlet state and triplet state can interact with the sensitizers. Whether the singlet state is converted first to the triplet state by the sensitizer and then reacts cannot be ascertained from these data.
Acknowledgments. The author is deeply indebted to P. C. Hoell for his measurement of the fluorescence lifetimes of LECV and for all the instruments he has made available to our research staff, a number of which are mentioned in the Experimental Section. Thanks are also due to R. G. Bennett for many helpful discussions concerning fluorescence lifetimes, to V. F. Hanson for providing the flash photolysis apparatus, to C. Yembrick and R. Dessauer for getting the author interested in the problem, and finally to J . M. White for his assistance in carrying out many of the experiments.
The Journal of Physical Chemistry

P r o t o n R e s o n a n c e S p e c t r a o f M o n o - , D i - , a n d T r is u b s t it u t e d S il a n e s 723
Proton Resonance Spectra of Selected Mono-, Di-, and Trisubstituted Silanes1
by H. J. Campbell-Ferguson, E. A. V. Ebsworth, A. G. MacDiarmid, and T. Yoshioka
U n i v e r s i t y C h e m ic a l L a b o r a t o r y , C a m b r i d g e , E n g l a n d , a n d D e p a r t m e n t o f C h e m i s t r y a n d th e
L a b o r a t o r y f o r R e s e a r c h o n th e S t r u c t u r e o f M a t t e r , U n i v e r s i t y o f P e n n s y lv a n ia ,
P h i l a d e l p h i a , P e n n s y l v a n i a 1 9 1 0 4 ( R e c e iv e d J u n e 2 0 , 1 9 6 6 )
The proton nuclear magnetic resonance spectra of H2Si(OCH3)2, H2Si(OSiH3)2, H2Si[N- (CH3)2]2, HSi(OCH3)3, HSi(OSiH3)3, HSi[N(CH3)2]3, HSiBr3, and HSiI3 have been examined and proton chemical shift and J2»SiH data for these compounds are presented. The values are compared with analogous data for HMSiX4_„ (X = F, Cl, Br) compounds and with values for the corresponding methane derivatives where available. In all cases, the chemical shifts of the protons attached directly to the central silicon or carbon move downfield with increasing substitution, with the exception of the series H„SiX4_„ (X = F, N(CH3)2, OCH3, OSiH3), where an unexpected upheld shift is observed. Possible reasons for the different trends in chemical shift values and certain relationships between </2sSiH values are discussed.
In the course of some investigations into the reactions of silyl compounds, we have measured the proton resonance spectra of SiHBr3, SiHI3, and compounds of formula SiHKX 4_„, where X = OCH3, OSiH3, or N(CH3)2. The chemical shifts are presented in Table I and coupling constants in Table II, together with the corresponding parameters for the other halomono- silanes. Long-range H -H coupling was not detected.
The way in which the chemical shifts change with increasing substitution depends on the substituent in an interesting way. In the chloro-, bromo-, and iodosilanes, r(SiH) decreases with increasing substitution (Table I), as does r(CH) in the analogous series of halomethanes, including the fluorides.2 * * This is the direction in which the chemical shifts would be expected to change if they were determined by changes in (r-electron density at carbon and silicon, respectively.
In marked contrast, it has previously been noticed that in the fluorosilanes, r(SiH) actually increases with increasing substitution; the data in Table I show that a similar over-all upheld shift occurs with increasing oxygen and nitrogen substitution at a silicon atom. Since the factors that determine the SiH chemical shift are still ill defined, it is at present impossible to offer an explanation for the effect of fluorine, oxygen, or nitrogen substitution; but it is interesting that these three elements are commonly believed to form the
Table Is Chemical Shift Values for SiHnX4-m°
Com pound r(S iH ) Com pound r(S iH ) r(CH a) r(OSiH a)
SiHsCl6 5.41 SiHaF6 5.24SiHiCls6 4.60 SiTLF 2 5.29SiHCR 3.93 SiHFa6 5.49SiH3Br6 5.83 SiHiN(CH3).2c 5.64 7.51SiiLBr^ 4.83 SiHs[N(CH3)2]2 5.62 7.49SiHBra 3.70 SiH[N(CH3)2]3 5.87 7.56SiHaT 6.56 SiH3OCH3 5.51 6.58SifLR' 5.97 SiH2(0CH3)2 5.58 6.48SiHIa 5.51 SiH (OCH3)3 5.91 6.51
SiHaOSiH/ 5.39 5.39SiH2(OSiH3)2 5.46 5.33SiH(0SiH3)3 5.82 5.34
“ All measurements carried out in cyclohexane solutions. Values given are extrapolated to infinite dilution except for the methoxy- and siloxysilanes, which were all measured at 25% (vol.) concentration. Conversions to r scale based on CeBh being 1.44 ppm downfield from (CHafiSi. Error in values quoted is < ±0.01 ppm. b E. A. V. Ebsworth and J . J . Turner, J . P h y s . C hem ., 6 7 , 805 (1963). c J . C. Thompson, private communication.
(1) A portion of this study was supported by the Advanced Research Projects Agency, Office of the Secretary of Defense, Washington, D. C.(2) A. A. Bothner-by and C. Naar-Colin, J . A m . C h e m . S o c . , 80,1728 (1958); E. A. V. Ebsworth, “Volatile Silicon Compounds,”Pergamon Press Inc., New York, N. Y., 1963, p 23.
Volume 71, Number S February 1967
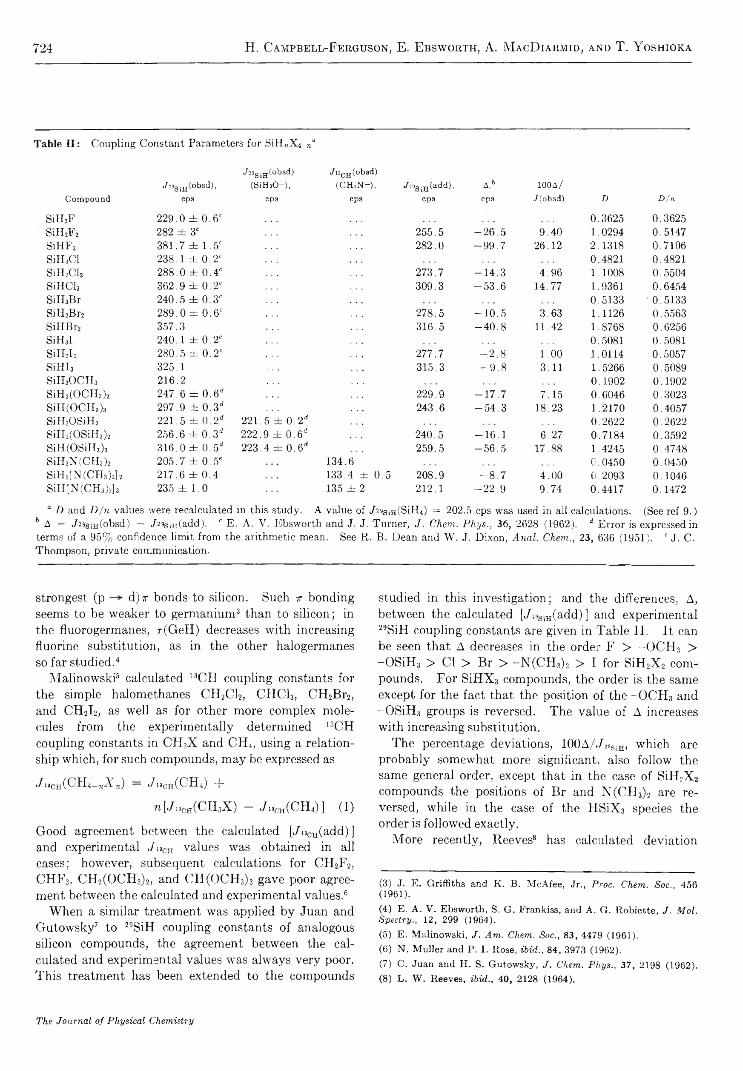
724 H. C a m p b e l l - F e r g u s o n , E. E b s w o r t h , A. M a c D i a r m i d , a n d T. Y o s h io k a
Table II : Coupling Constant Parameters for SiHKX 4- M°
/29giH(°bsd) Jj3CH(obsd)J 29gjjj(obsd), (SiHaO-), ( G H 3n - ) , J29SiH(add), A,6 100 a /
Compound cps cps cps cps cps J(obsd) D D/nSiH3F 2 2 9 . 0 ± 0 . 6 e 0 . 3 6 2 5 0 . 3 6 2 5
S1H2F2 2 8 2 ± 3 e 2 5 5 . 5 - 2 6 . 5 9 . 4 0 1 . 0 2 9 4 0 . 5 1 4 7SiHFs 3 8 1 . 7 ± 1 . 5 e 2 8 2 . 0 - 9 9 . 7 2 6 . 1 2 2 . 1 3 1 8 0 . 7 1 0 6SiH3Cl 2 3 8 . 1 ± 0 . 2 e 0 . 4 8 2 1 0 . 4 8 2 1SiH2Cl2 2 8 8 . 0 ± 0 . 4 C 2 7 3 . 7 - 1 4 . 3 4 . 9 6 1 . 1 0 0 8 0 . 5 5 0 4
SiHCh 3 6 2 . 9 ± 0 . 2 e 3 0 9 . 3 - 5 3 . 6 1 4 . 7 7 1 . 9 3 6 1 0 . 6 4 5 4SiHsBr 2 4 0 . 5 ± 0 . 3 C 0 . 5 1 3 3 ' 0 . 5 1 3 3SiH2Br2 2 8 9 . 0 ± 0 . 6 C 2 7 8 . 5 - 1 0 . 5 3 . 6 3 1 . 1 1 2 6 0 . 5 5 6 3SiHBra 3 5 7 . 3 3 1 6 . 5 - 4 0 . 8 1 1 . 4 2 1 . 8 7 6 8 0 . 6 2 5 6SÌH3I 2 4 0 . 1 ± 0 . 2 C 0 . 5 0 8 1 0 . 5 0 8 1SiH2I2 2 8 0 . 5 ± 0 . 2 e 2 7 7 . 7 - 2 . 8 1.00 1 . 0 1 1 4 0 . 5 0 5 7SÌHI3 3 2 5 . 1 3 1 5 . 3 - 9 . 8 3 . 1 1 1 . 5 2 6 6 0 . 5 0 8 9SiH3OCH3 2 1 6 . 2 0 . 1 9 0 2 0 . 1 9 0 2SiH2(OCH3)2 2 4 7 . 6 ± 0 . 6 d 2 2 9 . 9 - 1 7 . 7 7 . 1 5 0 . 6 0 4 6 0 . 3 0 2 3SiH(OCH3)3 2 9 7 . 9 ± 0 . 3 d 2 4 3 . 6 - 5 4 . 3 1 8 . 2 3 1 . 2 1 7 0 0 . 4 0 5 7SiHaOSiHs 2 2 1 . 5 ± 0 . 2 d 2 2 1 . 5 ± 0 . 2 d 0 . 2 6 2 2 0.2622SiH2(OSiH3)2 256.6 ± 0.3d 222.9 ± 0 .6d 240.5 -16 .1 6.27 0.7184 0.3592SiH(OSiH3)3 316.0 ± 0 .5d 223.4 ± 0.6d 259.5 -5 6 .5 17.88 1.4245 0.4748SiH3N(CH3)2 205.7 ± 0.5' 134.6 0.0450 0.0450SiH2[N (CH3)2] 2 217.6 ± 0.4 133.4 ± 0.5 208.9 -8 .7 4.00 0.2093 0.1046SiH[N(CH3)2]3 235 ± 1.0 135 ± 2 212.1 -2 2 .9 9.74 0.4417 0.1472
“ D and D / n values were recalculated in this study. A value of j 293m(SiH4) = 202.5 cps was used in all calculations. (See ref 9.) * A = / 2ssiH(obsd) — ^29SiH(add). 17 E. A. V. Ebsworth and J. J. Turner, J . C hem . P h y s ., 36, 2628 (1962). d Error is expressed in terms of a 95% confidence limit from the arithmetic mean. See R. B. Dean and W. J. Dixon, A n a l. C hem ., 23, 636 (1951). * J. C. Thompson, private communication.
strongest (p d)7t bonds to silicon. Such ir bonding seems to be weaker to germanium3 than to silicon; in the fluorogermanes, r(GeH) decreases with increasing fluorine substitution, as in the other halogermanes so far studied.4 5 6 7 8
Malinowski6 calculated I3CFI coupling constants for the simple halomethanes CH2C12, CHC13, CH2Br2, and CH2I2, as well as for other more complex molecules from the experimentally determined 13CH coupling constants in CH3X and CH4, using a relationship which, for such compounds, may be expressed as
*7i3ch (CU4—7iA 0 J,3CH(CH4) +n[./nCH(CII3X ) - J liCH(CH4)] (1)
Good agreement between the calculated [Jia0H(add)] and experimental J isCH values was obtained in all cases; however, subsequent calculations for CH2F2, CHF3, CH2(OCH3)2, and CH(OCH3)3 gave poor agreement between the calculated and experimental values.6
When a similar treatment was applied by Juan and Gutowsky7 to 29SiH coupling constants of analogous silicon compounds, the agreement between the calculated and experimental values was always very poor. This treatment has been extended to the compounds
studied in this investigation; and the differences, A, between the calculated [,/2sSlH(add)] and experimental 29SiH coupling constants are given in Table II. It can be seen that A decreases in the order F > -O CH 3 > -OSiH3 > Cl > Br > -N (C H 3)2 > I for SiH2X 2 compounds. For SiHX3 compounds, the order is the same except for the fact that the position of the -O CH 3 and -OSiH3 groups is reversed. The value of A increases with increasing substitution.
The percentage deviations, 100A //29giH, which are probably somewhat more significant, also follow the same general order, except that in the case of SiFI2X 2 compounds the positions of Br and N(CH3)2 are reversed, while in the case of the HSiX3 species the order is followed exactly.
More recently, Reeves8 has calculated deviation
(3) J. E. Griffiths and K. B. McAfee, Jr., P roc. Chem. Soc., 456 (1961).(4) E. A. V. Ebsworth, S. G. Frankiss, and A. G. Robiette, J . M o l. S pectry., 12, 299 (1964).(5) E. Malinowski, J . A m . Chem. Soc., 83, 4479 (1961).(6) N. Muller and P. I. Rose, ibid., 84, 3973 (1962).(7) G. Juan and H. S. Gutowsky, J . Chem. P h ys ., 37, 2198 (1962).(8) L. W. Reeves, ibid., 40, 2128 (1964).
The Journal of Physical Chemistry
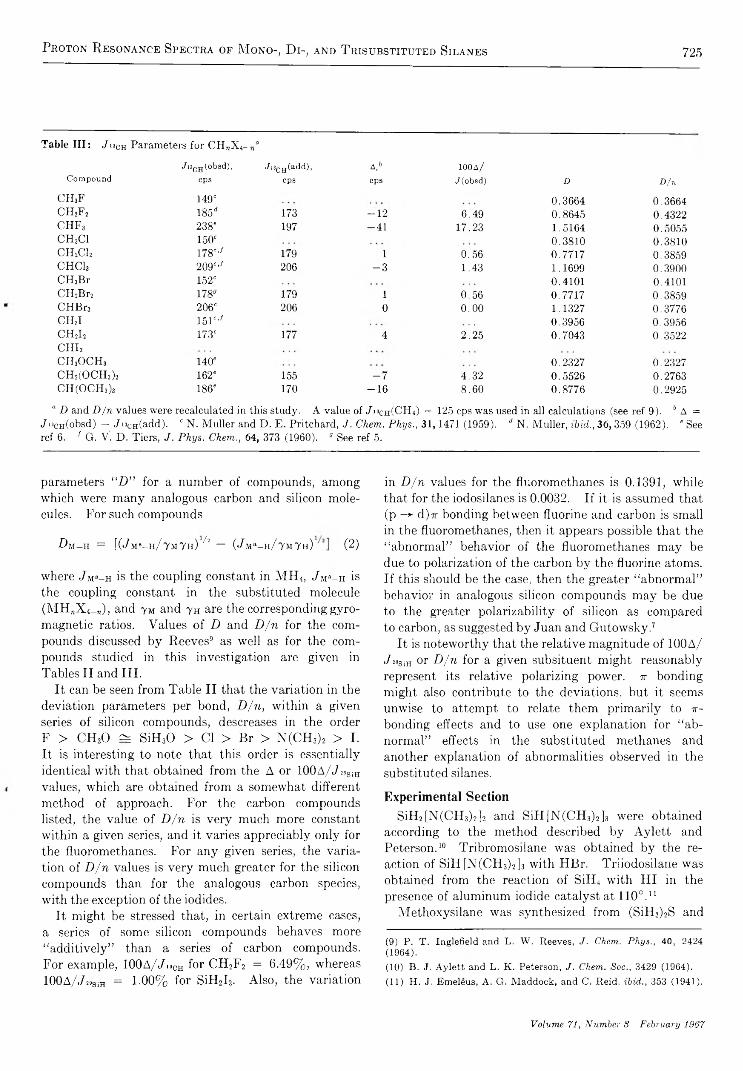
P r o t o n R e s o n a n c e S p e c t r a o f M o n o -, D i -, a n d T r is u b s t it u t e d S il a n e s 725
Table III : J uCH Parameters for CH„X4- an
^13CH*'Cd)SC0’ ./¡3CIi(tt(ld), A,6 IOOA /Compound ops cps cps J(obsd) D D/n
c h 3f 149c 0 .3 66 4 0 .3 66 4c h 2f 2 185d 173 -1 2 6 .4 9 0 .8 64 5 0 .4322CHF3 238" 197 - 4 1 17 .23 1 .5164 0 .5 05 5CHsCl 150° 0 .3 81 0 0 .3 8 1 0CH2C12 178c,/ 179 1 0 .5 6 0 .7 71 7 0 .3859CHCls 209c,/ 206 - 3 1 .4 3 1 .1699 0 .3 9 0 0CHsBr 152° 0 .4101 0 .4101CH2Br2 178" 179 1 0 .5 6 0 .7 71 7 0 .3 85 9CHBr3 206" 206 0 0.00 1 .1327 0 .3 77 6CHal 151cJ 0 .3956 0 .3 95 6CH2I2 173° 177 4 2 .2 5 0 .7043 0 .3 52 2CHECH3OCH3 140" 0 .2 32 7 0 .2 3 2 7CH2(OCH3)2 162" 155 - 7 4 .3 2 0 .5 5 2 6 0 .2763CH(OCH3)3 186" 170 - 1 6 8 .6 0 0 .8 7 7 6 0 .2925
° D and D / n values were recalculated in this study. A value of JAchCCHU) = 125 cps was used in all calculations (see ref 9). b A = J »cH(obsd) — Ji30H(add). " N. Muller and D. E. Pritchard, ./. C h e m . P h y s . , 3 1 , 1471 (1959). d N. Muller, i b i d . , 3 6 , 359 (1962). " Seeref 6. ’ G. V. D. Tiers, J . P h y s . C h e m . , 6 4 , 373 (1960). " See ref 5.
parameters “D” for a number of compounds, among which were many analogous carbon and silicon molecules. For such compounds
D m - h = [ ( < / m 8~ h / 7 m Y h ) ^ — ( « / m “ - h / 7 m Y h ) ( 2 )
where J m » - h is the coupling constant in MH4, Jm s- h is the coupling constant in the substituted molecule (M H„X4- h), and 7m and 7h are the corresponding gyro- magnetic ratios. Values of D and D/n for the compounds discussed by Reeves9 as well as for the compounds studied in this investigation are given in Tables II and III.
It can be seen from Table II that the variation in the deviation parameters per bond, D/n, within a given series of silicon compounds, descreases in the order F > CH30 =7 SiH30 > Cl > Br > N(CH3)2 > I. It is interesting to note that this order is essentially identical with that obtained from the A or 100A/J»giH values, which are obtained from a somewhat different method of approach. For the carbon compounds listed, the value of D/n is very much more constant within a given series, and it varies appreciably only for the fluoromethanes. For any given series, the variation of D/n values is very much greater for the silicon compounds than for the analogous carbon species, with the exception of the iodides.
It might be stressed that, in certain extreme cases, a series of some silicon compounds behaves more “ additively” than a series of carbon compounds. For example, 100A//uOH for CH2F2 = 6.49%, whereas 100A/J29SiH = 1.00% for SiH2I2. Also, the variation
in D/n values for the fluoromethanes is 0.1391, while that for the iodosilanes is 0.0032. If it is assumed that (p -*■ d)7r bonding between fluorine and carbon is small in the fluoromethanes, then it appears possible that the “ abnormal” behavior of the fluoromethanes may be due to polarization of the carbon by the fluorine atoms. If this should be the case, then the greater “ abnormal” behavior in analogous silicon compounds may be due to the greater polarizability of silicon as compared to carbon, as suggested by Juan and Gutowsky.7
It is noteworthy that the relative magnitude of 100A/ JiaSiH or D/n for a given subsituent might reasonably represent its relative polarizing power. t bonding might also contribute to the deviations, but it seems unwise to attempt to relate them primarily to -k- bonding effects and to use one explanation for “ abnormal” effects in the substituted methanes and another explanation of abnormalities observed in the substituted silanes.
Experimental SectionSiH2[N(CH3)2]2 and SiH[N(CH3)2]3 were obtained
according to the method described by Aylett. and Peterson.10 Tribromosilane was obtained by the reaction of SiH[N(CH3)2]3 with HBr. Triiodosilane was obtained from the reaction of SiH4 with HI in the presence of aluminum iodide catalyst at 110°.11
Methoxysilane was synthesized from (SiH3)2S and
(9) P. T. Inglefield and L. W. Reeves, J . C h e m . P h y s . , 40, 2424 (1964).(10) B. J. Aylett and L. K. Peterson, J . C h e m . S o c . , 3429 (1964).(11) H. J. Emeleus, A. G. Haddock, and C. Reid, i b i d . , 353 (1941).
Volume 71, Number S February 1967

726 L. W. N ic h o l , A. G. O g s t o n , a n d D. J. W in z o r
CH3OH.12 The compounds (CH30 )2SiH2 and (CH30 )3- SiH were prepared by the base-catalyzed condensation of CH3OSiH3.13 The compounds (SiH30 )2SiH2 and (SiH30 )3SiH were obtained by the base-catalyzed condensation of (SiH3)20 .13 The nmr spectra of SiHBr3 and SiHI3 were measured using a Perkin-Elmer HR10 spectrometer operating at 60 Mc/sec. The dimethyl- aminosilanes were recorded using a Yarian Associates V4300B spectrometer operating at 40 M c/sec; and the methoxy- and siloxysilanes were measured with a
Varian Associates HR60 spectrometer, Model 4300D, with flux stabilizer, operated at 60 Me/sec.
Acknowledgment. H. J. C.-F. wishes to acknowledge the receipt of a maintenance grant from the D.S.I.R. during the time that these experiments were being performed.
(12) G. S. Weiss and E. R . Nixon, Spectrochim . A cta , 21, 903 (1965).(13) T . Yoshioka and A . G. M acDiarm id, Abstracts o f 149th National M eeting, American Chemical Society, Detroit, M ich., Sept 1964, p 5M .
Reaction Boundaries and Elution Profiles in Column Chromatography
by L. W. Nichol, A. G. Ogston, and D. J. Winzor
R ussell Grimwade School o f B iochem istry, U niversity o f M elbourne, V ictoria , A u stralia , Departm ent o f Physica l B iochem istry, John C urtin School o f M edical Research, Australian ^National U niversity, Canberra, Australian Capital T erritory, Australia , and C .S J .R .O . W heat Research U nit, N orth R yde, N ew South W ales, Australia {Received Ju ne 27, 1966)
The relationships between the forms of migration boundaries within a chromatographic column and the forms of the elution profiles are examined by a method which makes use of constituent concepts of concentration and velocity of migration. The treatment applies to any procedure of column chromatography in which a plateau of all solute concentrations is ensured throughout the experiment. It is shown that the constituent concentration of any solute species in the effluent fluid is at any moment identical with that in the mobile solution within the column which reaches the exit plane at that time. In addition, equations are derived in both differential and integrated form describing essential features of the elution profiles obtained with systems affected by chemical or physical interaction. It is concluded that the equations are formally identical with those obtained previously to describe migration patterns obtained in moving boundary experiments not involving a stationary phase, provided elution volumes are substituted directly for velocity terms. The conclusion is in agreement with other workers who considered the case of chemically reacting systems subjected to column chromatography.
Theoretical discussion of the forms of migration boundaries in interacting systems has been along two lines. Gilbert1’2 and Gilbert and Jenkins3 did pioneer work in describing boundaries in freely migrating, chemically interacting systems; Ackers and Thompson4 * have applied their method to the behavior of a polymerizing system in gel filtration. A later alternative
l
approach uses “ constituent” concepts of velocity and concentration:6'6 this approach has been developed in
(1) G. A. Gilbert, D iscussions F araday Soc., 2 0 , 68 (1955).(2) G. A . Gilbert, P roc . R oy . Soc. (London), A250, 377 (1959).(3) G. A . Gilbert and R . C. L . Jenkins, ibid., A253, 420 (1959).(4) G . K . Ackers and T . E . Thom pson, P roc . N atl. A cad . S ci. U . S .,53, 342 (1965).
The Journal of Physical Chemistry
R e a c t io n B o u n d a r ie s a n d E l u t io n P r o f il e s in C o l u m n C h r o m a t o g r a p h y 727
detail for freely migrating systems7-11 and has certain advantages.11 It has also been applied (in one form) both theoretically and experimentally to gel filtration.7-9 Recently Gilbert12 has examined the relationships of velocities and concentrations within a gel filtration column to the elution volumes and concentrations in the eluate; he pointed out an error made by Nichol and Winzor8'9 (who used the constituent approach) through simply replacing velocities in the column by reciprocal elution volumes in their version of the Johnston-Ogston equation9'13 and the moving-boundary equation6 applied to a hypersharp boundary.3,8
Although we agree with Gilbert’s conclusions,12 we have undertaken a further and more general examination of the application of the constituent approach to column chromatography, hoping to eliminate any confusion caused by his use of constituent quantities, as well as to establish more clearly the relationship between the effluent profile and the situation within the column. To conflate the treatment of freely migrating with that of chromatographic systems, we choose to regard the latter as a special aspect of the former.
Special Features of Chromatographic Migration. Chromatographic systems differ from freely migrating systems in the following ways.
(i) In addition to the mobile components (solvent and solutes), the chromatographic system contains a component or phase (which we term G), which is uniformly distributed between two limiting planes which define the ends of the column. The velocity of G is zero, and it vanishes across a sharp boundary at each limiting plane.
(ii) When a solution is applied to the column, which was originally filled with solvent, a sharp initial boundary of all mobile solutes is formed at the entry plane. This boundary then migrates down the column as an “ ascending” boundary system, followed by a plateau of uniform composition. After establishment of the plateau, replacement of inflowing solution by solvent similarly creates an initially sharp “ descending” boundary at the entry plane.
(iii) Both the solvent (S) and solutes (X = A, B, etc.) interact with G. These interactions may be represented by
S + G SG
X + G XG(1)
without specifying the natures of the interactions; they could, for example, be partitions, adsorptions, or chemical interactions. Components SG and all XG have
zero velocity; the constituent velocities of S and each X are therefore determined by the positions of the equilibria represented by eq 1.
(iv) Interactions between mobile solutes in solution of the type
A + B C (2)
may also occur. Although all components A, B, and C migrate at the same velocity as that of free solvent, the constituent velocities of A and B are not identical, since interactions of the type expressed in eq 2 affect the interactions with G (eq 1).
(v) Although it is convenient in the first place to describe migration in terms of concentrations and velocities within the column, the experimental observation is a relationship between composition and volume of eluate.
Assumptions, Definitions, and Symbols. As usual3'11 we assume that all equilibria (of both types represented by eq 1 and 2) are established at rates infinitely great compared with that of migration, and that diffusion is negligible.
The positions of the equilibria represented by eq 1 are defined by ^x, the fraction of each X which is free. The values of yx will always depend on the nature of X and G and on the amount of G per unit volume of column. According to the nature of the interactions, they may be dependent on or independent of composition with respect to mobile components. Equilibria in free solution (eq 2) are assumed to be governed by the simple mass action law.
The column is of unit total cross-sectional area; a fraction, <h, is occupied by mobile solvent or solution and a fraction x by G itself ; the remaining fraction is occupied by immobile S and X (in stales represented by SG and XG).
Concentrations are defined as follows: (i) cx is the concentration of X and cx its constituent concentration in the mobile solution in the column; (ii) cx and cx are 5 6 7 8 9 10 11 12 13
(5) A . Tiselius, N ova A cta R egiae Soc. S ei., U psaliensis, 7, No. 4, 1 (1930).(6) L. G. Longsworth in “ Electrophoresis, Theory, M ethods and Applications,” M . Bier, Ed., Academ ic Press Inc., New Y ork , N . Y ., 1959, p 91.(7) L. W . N ichol and D . J. W inzor, J . P h ys . Chem ., 68, 2455 (1964).(8) L . W . N ichol and D . J. W inzor, B ioch im . B iop h ys. A cta , 94, 591 (1965).(9) D . J. W inzor and L. W . N ichol, ibid.., 104, 1 (1965).(10) L . W . N ichol and A . G. Ogston, J . P h ys. Chem,., 69, 1754 (1965).(11) L . W . N ichol and A. G. Ogston, P roc . R oy . Soc. (London), B163, 343 (1965).(12) G. A . Gilbert, N ature, 210, 299 (1966).(13) J. P . Johnston and A . G. Ogston, Trans. F araday Soc., 42, 789 (1946).
Volum e 71, N um ber 3 February 1967
728 L. W. N ic h o l , A. G. O g s t o n , a n d D. J. W i n z o r
the corresponding quantities in the inflowing solution. In addition to these definitions it is also convenient to define (iii) cx1 as the constituent concentration of X itself within the column (he., including forms X and X G but not including products of X resulting from chemical equilibria in the mobile solution) and (iv) cx as the constituent concentration of X in all forms within the column (in the absence of chemical equilibria in the mobile solution cx1 and cx are identical). The following relationships for the system A + B <=± C (X = A, B, and C) follow from these definitions
Ca 'C b ' Ca Cb t .
ca — ca + Cc — ca + (4)
Ca 0Ca/ ma (5)
to traverse the column is l/v and the volume that has flowed during this time is
V0 = Vl/v = 1 4 (8)
which is the void volume of the column. Similarly, a lamina moving at velocity u emerges after a volume flow
Vu = Vl/u (9)
There is thus a reciprocal relationship between velocities within the column and corresponding elution volumes.
Consider now the conservation of constituent X across the entry plane of the column; this demands that
Vex = vxix (10)
Since the velocity of XG is zero, we may write
¿ a = c a 1 + c c 1 (6a)
L m a Mc J(6b)
Ca ^ CaCb a Uc K _
(6c)
(Of the definitions given ¿a corresponds with Gilbert’s12 W; it is not clear to us whether his w represents c\ or c a . )
v is the linear velocity of solvent within the column. The values of vx (the linear velocity of mobile X ) and of vx (the constituent velocity of X in the mobile phase) are necessarily the same as v. Sx1 and vx are constituent velocities corresponding to the definitions of cx1 and cx- u is the linear velocity, within the reaction boundary system in the column, of a lamina of constant composition, all forms of all components being taken into consideration.11 wx is the median velocity of a boundary of constituent X between two neighboring plateaus.
V is the rate of inflow of solvent or solution, l is the length of the column between limiting planes, Vu is the volume that has flowed into (or out of) the column between the time of establishment of a sharp initial boundary at the entry plane and the time at which a lamina of velocity u reaches the exit plane, and F0 is the volume of mobile solution between entry and exit planes.
Relationships betioeen Velocities, Volumes, and Concentrations. From the definitions given, it is immediately obvious that
Ÿ = <pv (7)The time taken for a lamina moving with velocity v
4>vx c x <t}vcx ......vx = —— = —— (ll)
Cx Cx
From eq 7, 10, and l l it follows that
Cx = cx' (12)
Equation 12 applies to each constituent (X = A, B, C). Moreover, the same conservation equations apply across the exit plane, and it therefore follows that all constituent concentrations in the effluent fluid are at any moment identical with those in the mobile solution which reaches the exit plane at that time. Since the same conditions of chemical equilibrium hold for both, the two fluids are at every moment identical in allrespects. The profile of composition of the effluenttherefore exactly reproduces the profile of composition in the mobile phase of a moving-boundary system; it does not reproduce, through it corresponds to, the profile of composition of the boundary as a whole; neglect of this fact was responsible for the mistaken use of the reciprocals of elution volumes by Nichol and Winzor,8’9 to which reference has been made.
Relationships between the Equations for Boundary and Elution Profiles. The equations of conservation, which lead to the boundary equations, may be stated generally in terms of the inclusive constituent quantities c and i). One such equation can be written for each constituent. In differential form these equations are
u = d(ÿxcx)/dcx (13)
In principle, solution of this set of equations describes uniquely the whole reaction boundary profile in terms of the relationship between u and the various concentrations. However, to arrive at practical solutions it is necessary to specify each vx as a function of composition,
The Journal of Physical Chemistry
R e a c t i o n B o u n d a r i e s a n d E l u t i o n P r o f i l e s i n C o l u m n C h r o m a t o g r a p h y 729
which in the type of case considered requires definition both of the equilibria occurring in solution and their equilibrium constants, and of the composition dependence of each mx- By use of eq 8, 9, and 11, eq 13 can be rewritten in terms of elution volumes instead of velocities
F u Vo dcx <t> dcx
(14)
and solution of this set of equations gives, with the same limitations, a description of the elution profile.
The correspondence between eq 13 and 14 may be illustrated by simplified examples.
(i) With no interactions in solution, cx and cx can be replaced by cx and cx1, respectively, and, from eq 5, eq 14 becomes
lr d(cx/Mx) / l r ^Vu = Vo— ------- (15)dcx
which is the analog, in our terms, of Gilbert’s12 eq 3. The boundary and elution profiles depend on the composition dependence of yux . If these are independent of composition, eq 15 reduces to
Vu = Po/ mx (16)
showing that there is an independent, sharp elution front for each component of the solution.
(h) fix is composition independent, but there is an equilibrium A + B <=± C in solution. From eq 4 and 6c eq 14 can be written, for constituents A and B
{ ( FK
— )~ d c B = 0 (17a)Me/A
Fo\ca) Me JKj
dcB +
— )^ d c A = 0 (17b)Me/A
These equations are of exactly the same forms as eq 21a and 21b of Nichol and Ogston11 for free migration of the system A + B ^ C, with replacement of u, vk, vb, and vG in the latter equations by Vu, F0/ ma> Fo/ mb, and F0/ mc, respectively; they can be handled in exactly the same way.
Integral Forms of Equations for Elution Profiles. Integration of each eq 13 across a boundary between two adjacent plateaus gives
fudex A vxcx nQsUx = f = ■ .z - (IS)Jdcx A cx
which is the integrated form of the Johnston-Ogston equation. Integration of eq 14 likewise gives
Fx =Fo Acx <t> Acx
(19)
It should be noted that the values of u and V for different constituents are in general not identical, but each corresponds to the median10 of the boundary with respect to a particular constituent. Again, we apply this to two cases: (i) There is no chemical interaction in solution. If integration is performed between two phases a and ¡3 across a boundary where X does not vanish, by use of eq 4, 5, and 6c, eq 19 becomes
- £ ■ > * " (20)
which is Winzor and Nichol’s9 equation, as corrected by Gilbert,12 with X = B and F0/ mx“ and F0/ mx3 replacing Fx“ and Fx3, respectively.
(ii) ,ux is composition independent, but there is an equilibrium A + B C in solution. Equation 19 can be written for (say) the A constituent, with the use of eq 4 and 6c
Equation 21 may be rearranged to give an expression similar to eq 20, but with elution volume and concentration terms written as constituent quantities. In this form it is recognized as the moving boundary (or flux) equation used by Nichol and Winzor to determine K for migrating systems of the type A + B C in which both sharp7 and hypersharp8 boundaries are predicted theoretically (c/. Figure la and 2b of ref 11). However, in the latter treatment8 eq 21 was incorrectly applied in that reciprocals of elution volumes were employed; the corrected data have been presented by Gilbert.12
D i s c u s s i o n
In summary, it may be concluded that eq 16, 17a, 17b, 20, and 21 find direct analogs with equations presented earlier to describe the effects of physical11’13 or chemical11'3 interactions on migration patterns obtained by moving-boundary methods not involving a stationary phase. The relationship between the constituent concentration of any solute species in the effluent from a chromatographic column and mobile phase within the column shown in the discussion of eq 12 and the recognition that elution volumes
Volum e 71, N um ber 3 February 1967

730 M. J. D. Low a n d N. R a m a s u b r a m a n ia n
must replace velocity terms in earlier equations11'13 permit direct application of previous theory to the chromatographic case. Ackers and Thompson4 and Gilbert12 in their treatments of chemically reacting systems have also stressed the necessity of direct substitution of elution volumes for velocity terms. It is hoped that the generalized approach based on the concept that essential features of migration patterns
are determined by the dependence of constituent velocities of each constituent species on total composition may lead to a clearer understanding of elution profiles obtained in frontal analysis and affected by either chemical or physical interaction.
Acknowledgment. We are grateful to Dr. G. A. Gilbert for drawing our attention to the error mentioned, in advance of the publication of his paper.12
The Dehydration of Porous Glass
b y M . J . D . L o w a n d N . R a m a s u b r a m a n i a n
S c h o o l o f C h e m is t r y , R u t g e r s , T h e S ta te U n i v e r s i t y , N e w B r u n s w i c k , N e w J e r s e y ( R e c e iv e d A x ig u s t 2 8 , 1 9 6 6 )
A microbalance was used to follow the kinetics of dehydration of porous glass in vacuo at constant temperatures from 25 to 800°. The kinetics of water sorption and desorption by the degassed surfaces was measured. Infrared spectra of degassed specimens were obtained. Physically adsorbed water as well as some tightly bound water could be removed at 25°. Degassing above 600° produces surfaces containing isolated hydroxyls. The amount of water retained after a sorption-desorption cycle is a maximum with samples degassed near 300°. It is proposed that geminal hydroxyls responsible for this maximum are destroyed. The percentage of the sorbed water which is retained increases with samples degassed above 600°. This effect is produced by boron migrating to the surface of the glass.
Recent infrared spectroscopic studies of the dehydration and hydration of porous glass surfaces provided evidence for the existence of B-OH structures on the surface of highly degassed specimens.1-3 The intensity of the absorption band at 3703 cm-1 attributed to B-OH groups was higher than would be expected if the boron were evenly distributed, the results indicating the boron concentration to be higher at the surface than within the bulk of the glass. However, it was not possible to detect surface B-OH groups on specimens which had been degassed under mild conditions. These effects thus raised some doubt about the stability of the surface of these adsorbents, because it was not clear if the boron enrichment at the surface occurred during the manufacture of the glass or came about as a
result of the high-temperature degassing. The present experiments were performed to provide some information on this topic as well as on dehydration and rehydration of porous glass surfaces.
E x p e r i m e n t a l S e c t i o n
The general procedures described elsewhere were employed.1 2 3 Pressures of approximately 10-6 torr were produced with conventional high-vacuum systems. Spectroscopic measurements were made with a Perkin-
(1) M . J. D . Low and N. Ramasubramanian, C h e m . C o m m u n . , in press.(2) M . J. D . Low and N. Ramasubramanian, J . P h y s . C h e m ., 70, 2740 (1966).(3) N. Ramasubramanian and M . J. D . Low, submitted.
The Journal of Physical Chemistry

D e h y d r a t i o n o p P o r o u s G l a s s 731
Elmer Model 521 spectrophotometer. Samples of Corning Code 7930 porous glass were purchased from Corning Glass Co. in the form of 1-mm thick plates.
Gravimetric Procedure. The kinetics of dehydration and of wa'ter sorption and desorption were measured with a Gulbransen-type vacuum microbalance having a sensitivity of 10“ 4 5 6 g /10-4 cm.4 It was desirable to observe the dehydration over a wide temperature range and to avoid any potential changes which might be caused by heating. Consequently, the specimens used for gravimetric work were used without subjecting them to the procedure of heating in oxygen that is sometimes necessary to remove the impurities which can be adsorbed from the air and give the glass a yellowish color. The glass as received was clear and colorless. Some duplicate sets of experiments established that identical infrared results were obtained with untreated specimens and with specimens that had been treated in oxygen at 650°.
Specimens weighing about 100 mg were used, all taken from one batch of glass. After a specimen had been suspended in the balance, the balance case was evacuated. After about 2 min, when the pressure had fallen to 10“ 3 torr, a preheated furnace was brought up around the balance leg containing the specimen. Weight-loss measurements were then made.
A fresh specimen was used at each constant temperature. At the end of a series of dehydration measurements at one particular temperature the specimen was cooled to room temperature in vacuo. The specimen was then exposed to H20 vapor at room temperature at pressures near 4 torr (P /P 0 ~ 0.25), and the weight increase caused by H20 sorption was followed for some time. The balance chamber was then opened to the pumps, and the desorption of H20 in a dynamic vacuum of 10-3 to 10-6 torr was followed. Each weight change-time plot obtained in this manner shows an abrupt change in slope at the beginning of the desorption portion.
The initial dehydration weight loss was calculated on the basis of the weight of the fresh specimen in dry air. The subsequent water sorption and desorption on the same specimen were calculated on the basis of the weight of the specimen at the end of the initial dehydration process.
R e s u l t s a n d D i s c u s s i o n
Initial Dehydration. The weight losses produced by heating fresh specimens in vacuo at various constant temperatures are shown by the plots of Figure 1. The general behavior observed during the first few minutes was identical with that described by Rand,6 who degassed porous glass at temperatures up to 300°. Ap-
Figure 1. Initial dehydration, A fresh specimen was used to follow the weight loss i n v a c u o at each of the constant temperatures shown beside each plot. Infrared spectra were obtained with specimens degassed to stages corresponding to the points A-D. The degassing temperature is indicated beside each plot.
preciable weight decreases occurred within a few minutes at degassing temperatures of 200° and higher. Approximately 90% of the total weight decrease to be found at any one temperature occurred within the first hour of degassing. After the initial, quasi-explosive desorption had occurred, weight loss was continuous at each temperature.
The plots of Figure 1 indicate that two over-all processes and three temperature regions are involved in the vacuum activation of porous glass. The plots fall into three groups of degassing temperatures, i.e., below 200, 200-600, and above 600°. Below 200° the initial desorption was relatively small and was followed by a rapid but decelerating weight decrease. The latter abruptly changed after some time, the rate of weight decrease then approximating the slow rates observed at 200° and above.
The initial desorption and the rapid process occurring below 200° are ascribed to the desorption of physically adsorbed water, in general concurrence with the conclusions reached by others.6“ 7 However, the abrupt changes in slope of the 25 and 100° plots are considered
(4) E. A. Gulbrausen, A d r ia n . C a t a ly s is , 5, 119 (1953).(5) M. J. Rand, J . E le c tr o c h e m . S o c ., 109, 402 (1962).(6) L. H. Little and M. V. Mathieu, A c te s C o n g r . I n t e r n . C a t a l y s e , g°, P a r i s , 1, 771 (1961).(7) T. H. Elmer, I. D. Chapman, and M. E. Nordberg, J . P h y s .
C h e m ., 6 6 , 1517 (1962).
Volum e 71, N um ber 3 February 1967

732 M. J. D. Low a n d N. R a m a s u b r a m a n i a n
to mark the end of the desorption of physically adsorbed water (taken as approximately 35 mg/g near the “ break” in the two plots) and the beginning of the removal of more tightly bound species. This would mean that all of the physically adsorbed water can be removed from porous glass at room temperature. This conclusion agrees with those of Young,8 Benesi and Jones,9 and Kiselev and Lygin,10 who believe that physically adsorbed water was completely removed from silica by room-temperature evacuation.
Benesi and Jones based their conclusion on the disappearance of a band near 1640 cm” 1 ascribed to the v2 fundamental of water. However, as pointed out by Elmer, Chapman, and Nordberg,7 the presence of a band near 1640 cm-1 which decreased sharply in intensity up to 200° was reported by Little and Mathieu.6 Elmer, Chapman, and Nordberg stated that, from studies in their and other laboratories, activation temperatures of about 180° are needed to obtain maximum water vapor adsorption on porous glass at relatively low pressures, that it is difficult to see why this should be so if all the physically adsorbed water has been driven off at room temperature and no condensation reaction is postulated below 180°, and that infrared bands in the region around 3600 cm-1 are decreasing in width below 200° and above room temperature. They consequently conclude that physically adsorbed water is present in porous glass at temperatures up to 200°. This discrepancy becomes much less important if due account is taken of the fact that various workers have used widely varying techniques. Infrared spectra of porous glass pumped for 1 hr were recorded after the specimen had cooled to room temperature at a pressure of 0.2 torr, for example.7 Differences in sample thickness, pumping speed, degassing time, and the like could readily lead to the spectral observation of physically adsorbed water after a short 200° degassing. Also as will be shown later, room-temperature degassing or “ activation” was as effective as activation at 200° for the sorption of H20 at room temperature, again indicating that physically adsorbed water was removed below 200°.
The initial desorption which occurs at 200° and above is greater than the weight loss of approximately 35 m g/g ascribed to physical adsorption, so that some tightly bonded species must also be rapidly removed during the first few minutes of degassing. The slow processes subsequent to these initial, rapid desorptions are ascribed solely to the removal of tightly bound species.
As shown by the 25 and 100° plots of Figure 1, slow weight losses occurred subsequent to the occurrence of the breaks which are taken to mean the end of the
desorption of physically adsorbed water. The rates of the slow weight decrease are similar to those observed at higher temperatures. This similarity, the plausibility of the removal of physically adsorbed water below 200°, and the retention of some water after the sorption-desorption cycles described later lead to the conclusion that the slow processes below and above 200° are similar in nature, i.e., that the removal of species more tightly bound than physically adsorbed water is involved. However, it is not necessary that only a dehydroxylation is involved. As the slow process at 100 and 25° occurred below the temperature of 180° at which Young found silanol groups to begin to condense,8 a desorption of molecular water strongly bound to the hydroxylated surface could account for all or most of the slow weight loss below 200°. A combination of such a desorption with dehydroxylation could occur at higher temperatures or, at least, at the lower temperatures of the range of 200-600°. Dehydroxylation proper could occur in the highest temperature range above 600°.
Water is given off continuously, at all temperatures, as shown by the plots of Figure 1 and also by the detailed infrared spectra described elsewhere.2 In contrast to the statement by Elmer, Chapman, and Nordberg, whose spectra indicated that there was a finite amount of water which could be removed at a given temperature and that a steady state could be achieved in 1 hr,7 a steady state was not observed in the present work. Significant changes occurred even after long periods of degassing.
Some infrared spectra of specimens at various stages of degassing are shown in Figure 2. Individual specimens were degassed within an infrared cell, because it was not feasible to make simultaneous infrared and gravimetric measurements. The temperatures and periods of degassing used to bring the specimens to the stages of dehydration shown by the spectra A -D of Figure 2 are those used to cause the weight losses indicated by the points marked A -D of Figure 1.
The weight loss required to reach stages A or C in Figure 1 is 20-40 times greater than that needed to go from stages A or C to stages B or D, respectively. The spectra corresponding to these stages of weight loss show, however, that significant changes occurred when small amounts of water were desorbed. These and other spectra2 show that not only are long pumping periods at high temperatures required in order to remove the majority of the hydrogen-bonded hydroxyl
(8) G. J. Young, J . Colloid Sci., 13, 67 (1958).(9) H . A. Benesi and A . C. Jones, J. P h ys . Chem., 63, 179 (1959).(10) A . V . Kiselev and V . I. Lygin, Colloid J . (U .S .S .R .), 21, 561 (1960).
The Journal of Physical Chemistry
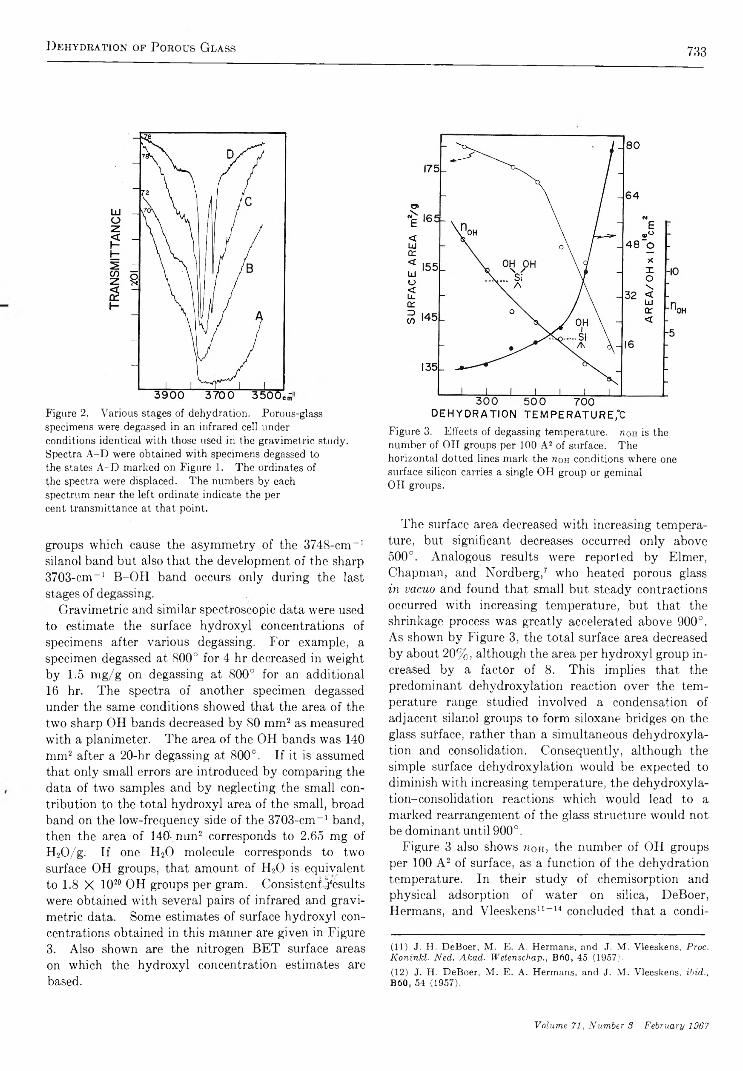
D e h y d r a t io n o f P o r o u s G l a s s 733
Figure 2. Various stages of dehydration. Porous-glass specimens were degassed in an infrared cell under conditions identical with those used in the gravimetric study. Spectra A-D were obtained with specimens degassed to the states A-D marked on Figure 1. The ordinates of the spectra were displaced. The numbers by each spectrum near the left ordinate indicate the per cent transmittance at that point.
groups which cause the asymmetry of the 3748-cm~1 silanol band but also that the development of the sharp 3703-cm_1 B-OH band occurs only during the last st ages of degassing.
Gravimetric and similar spectroscopic data were used to estimate the surface hydroxyl concentrations of specimens after various degassing. For example, a specimen degassed at 800° for 4 hr decreased in weight by 1.5 mg/g on degassing at 800° for an additional 16 hr. The spectra of another specimen degassed under the same conditions showed that the area of the two sharp OH bands decreased by 80 mm2 as measured with a planimeter. The area of the OH bands was 140 mm2 after a 20-hr degassing at 800°. If it is assumed that only small errors are introduced by comparing the data of two samples and by neglecting the small contribution to the total hydroxyl area of the small, broad band on the low-frequency side of the 3703-cm_1 band, then the area of 140- nun2 corresponds to 2.65 mg of H20 /g . If one H20 molecule corresponds to two surface OH groups, that amount of H20 is equivalent to 1.8 X 10²⁰ OH groups per gram. Consistent Results were obtained with several pairs of infrared and gravimetric data. Some estimates of surface hydroxyl concentrations obtained in this manner are given in Figure3. Also shown are the nitrogen BET surface areas on which the hydroxyl concentration estimates are based.
Figure 3. Effects of degassing temperature. noH is the number of OH groups per 100 A2 of surface. The horizontal dotted lines mark the n o h conditions where one surface silicon carries a single OH group or geminai OH groups.
The surface area decreased with increasing temperature, but significant decreases occurred only above 500°. Analogous results were reported by Elmer, Chapman, and Nordberg,7 who heated porous glass in vacuo and found that small but steady contractions occurred with increasing temperature, but that the shrinkage process was greatly accelerated above 900°. As shown by Figure 3, the total surface area decreased by about 20%, although the area per hydroxyl group increased by a factor of S. This implies that the predominant dehydroxylation reaction over the temperature range studied involved a condensation of adjacent silanol groups to form siloxane bridges on the glass surface, rather than a simultaneous dehydroxylation and consolidation. Consequently, although the simple surface dehydroxylation would be expected to diminish with increasing temperature, the dehydroxyla- tion-consolidation reactions which would lead to a marked rearrangement of the glass structure would not be dominant until 900°.
Figure 3 also shows non, the number of OH groups per 100 A 2 of surface, as a function of the dehydration temperature. In their study of chemisorption and physical adsorption of water on silica, DeBoer, Hermans, and Vleeskens11-14 concluded that a condi- 11 12
(11) J. H. DeBoer, M . E. A. Hermans, and J. M . Vleeskens, P roc. K on in kl. N ed. A kad . W etenschap., B60, 45 (1957).(12) J. H . DeBoer, M . E . A . Hermans, and J. M . Vleeskens, ibid., B60, 54 (1957).
Volume 71, Number 3 February 1967

734 M. J. D. Low AND N. Ramasubramanian
tion of tioh = 4.6 corresponded to a surface where all silicon atoms were covered with one hydroxyl group.13 14 Conditions of non > 4.6 would mean the bonding of more than one hydroxyl group per silicon atom.
Assuming that a comparison of silica and porous glass is valid, the decline of the value of non to below4.6 at temperatures above 600° implies that the surface hydroxyl concentration of the porous glass had fallen well below the “ monolayer” coverage where every surface silicon atom carried one hydroxyl group. Under such conditions at least some of the surface hydroxyl groups would be isolated and not interact with their neighbors. Similar information can be deduced from the shapes and positions of the bands of the two sharp hydroxyl groups. Both the silanol band and the B-OH band, such as those of spectrum D of Figure 2, become sharper and lose most of the asymmetry of the low-wavenumber sides of the bands after prolonged high-temperature degassing. The band positions simultaneously shift to higher wavenumbers at 3745 cm-1 for the silanol band and 3703 cm“ 1 for the B-OH band.2 Such effects indicate that isolated hydroxyl groups which do not interact with their environment to any great extent are produced by degassing at temperatures above 600°, i.e., in the highest of the three temperature regions suggested by the kinetics of Figure 1.
The kinetics of the slow weight losses can be represented by an Elovich type of equation,16 as shown by the plots of Figure 1. The kinetic representation is of a practical rather than theoretical interest, because the over-all weighs-loss mechanism is very complex and incorporates various steps of surface migration, reaction, desorption, and mass transport within the pore system of the solid. However, although the observed weight loss is a summation of several simultaneous processes, the kinetics can be used in a limited, qualitative manner to indicate changes or trends, such as the division of the 200-800° region near 600°. This division is more clearly shown by the plots of Figure 4, which are derived from the data of Figure 1. A correction was made, based on the reasonable assumption that the rate of removal of tightly bound species is a function of the amount of tightly bound species remaining on the surface, as follows. Infrared and gravimetric data were used to estimate that the amount of water removable after point D in Figure 1 was approximately 2.6 mg/g. A total of 75.4 mg/g was removed up to point D, so that a complete dehydration would involve the removal of 78 mg/g of water. Taking the amount of physically adsorbed water as 35 mg/g, the maximum amount of tightly bound water is approximately 43 mg/g. The ratio of the amounts of tightly bound water removed to that
Figure 4. Corrected dehydration kinetics. R is the ratio of amounts of tightly bonded water removed and on the surface. The insert shows the variation of k , the slope of the plots (up to 100 min) as a function of degassing temperature, T d. The degasking temperature is shown beside each plot.
remaining, R, was then computed, R = (W t — 35)/ (78 — W t), to result in the plot of Figure 4. W t is the weight loss occurring after t min, from Figure 1. A comparison of rates can be made in terms of the slopes, k, of the plots.15 As shown by the insert of Figure 4, the value of k of the first linear segment of each plot (up to about 100 min) increases slowly up to 600° with increasing degassing temperature, To- Above 600° there is a marked increase in k, suggesting the division of the temperature range near 600°.
The various data thus suggest that the initial dehydration produced porous-glass surfaces (a) freed from physically adsorbed water at all temperatures, (b) fully hydroxylated below about 600°, some surface silicon atoms possibly carrying more than one hydroxyl group, (c) on which some molecular water was strongly bound to the hydroxylated surface at the lower temperatures, and (d) incompletely hydroxylated above about 600°, an appreciable fraction of the hydroxyls being “ free.” Water sorption experiments were then carried out with such surfaces.
Water Sorption and Desorption. The weight changes observed on the sorption and desorption of water at room temperature are shown in Figure 5. The sorption rates may be compared in terms of the slopes of the plots, k'. The insert of Figure 5 shows k' to decline above 300°. The average value of 15.8 of the
(13) J. H . DeBoer and J. M . Vleeskens, P r o c . K o n i n k l . N e d . A k a d .
W e t e n s c h a p B60, 234 (1957).(14) J. H. DeBoer and J. M . Vleeskens, i b i d . , B61, 2 (1958).(15) M . J. D . Low, C h e m . R e v . , 60, 267 (1960).
The Journal of Physical Chemistry
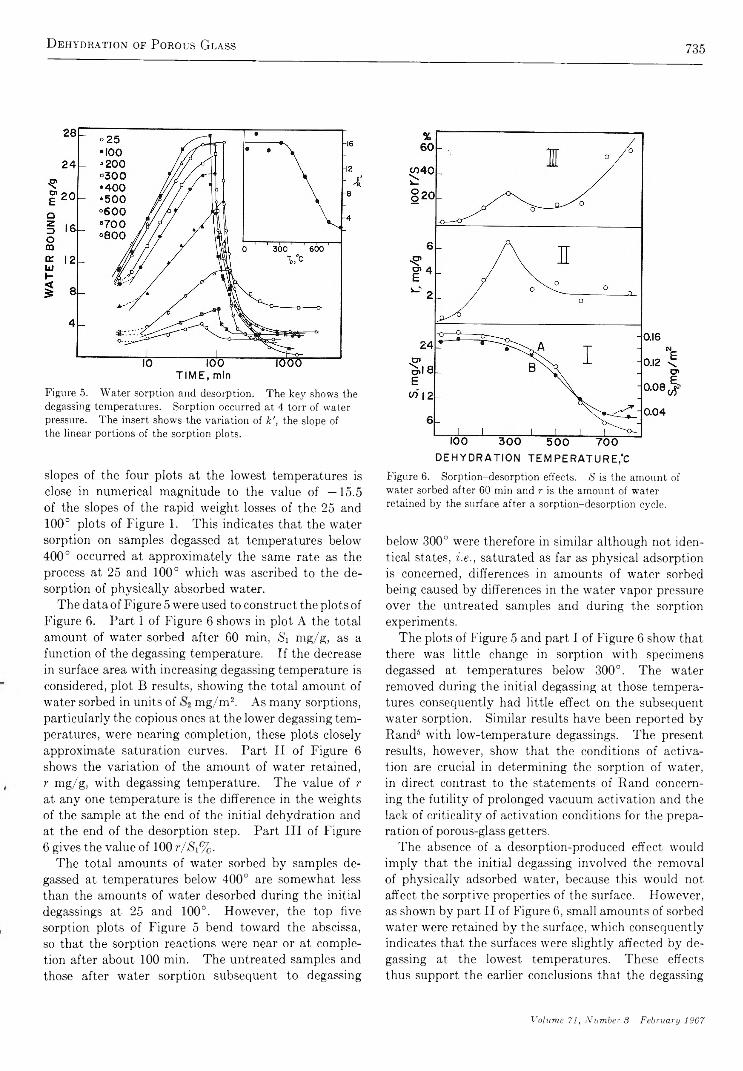
D ehydration of Porous Glass 735
T IM E , minFigure 5. Water sorption and desorption. The key shows the degassing temperatures. Sorption occurred at 4 torr of water pressure. The insert shows the variation of k', the slope of the linear portions of the sorption plots.
slopes of the four plots at the lowest temperatures is close in numerical magnitude to the value of —15.5 of the slopes of the rapid weight losses of the 25 and 100° plots of Figure 1. This indicates that the water sorption on samples degassed at temperatures below 400° occurred at approximately the same rate as the process at 25 and 100° which was ascribed to the desorption of physically absorbed water.
The data of Figure 5 were used to construct the plots of Figure 6. Part I of Figure 6 shows in plot A the total amount of water sorbed after 60 min, Si mg/g, as a function of the degassing temperature. If the decrease in surface area with increasing degassing temperature is considered, plot B results, showing the total amount of water sorbed in units of mg/m 2. As many sorptions,particularly the copious ones at the lower degassing temperatures, were nearing completion, these plots closely approximate saturation curves. Part II of Figure 6 shows the variation of the amount of water retained, r mg/g, with degassing temperature. The value of r at any one temperature is the difference in the weights of the sample at the end of the initial dehydration and at the end of the desorption step. Part III of Figure 6 gives the value of 100 r /S\%.
The total amounts of water sorbed by samples degassed at temperatures below 400° are somewhat less than the amounts of water desorbed during the initial degassings at 25 and 100°. However, the top five sorption plots of Figure 5 bend toward the abscissa, so that the sorption reactions were near or at completion after about 100 min. The untreated samples and those after water sorption subsequent to degassing
DEHYDRATION T E M P E R A T U R E /CFigure 6. Sorption-desorption effects. S is the amount of water sorbed after 60 min and r is the amount of water retained by the surface after a sorption-desorption cycle.
below 300° were therefore in similar although not identical states, i.e., saturated as far as physical adsorption is concerned, differences in amounts of water sorbed being caused by differences in the water vapor pressure over the untreated samples and during the sorption experiments.
The plots of Figure 5 and part I of Figure 6 show that there was little change in sorption with specimens degassed at temperatures below 300°. The water removed during the initial degassing at those temperatures consequently had little effect on the subsequent water sorption. Similar results have been reported by Rand6 with low-temperature degassings. The present results, however, show that the conditions of activation are crucial in determining the sorption of water, in direct contrast to the statements of Rand concerning the futility of prolonged vacuum activation and the lack of criticality of activation conditions for the preparation of porous-glass getters.
The absence of a desorption-produced effect would imply that the initial degassing involved the removal of physically adsorbed water, because this would not affect the sorptive properties of the surface. However, as shown by part II of Figure 6, small amounts of sorbed water were retained by the surface, which consequently indicates that the surfaces were slightly affected by degassing at the lowest temperatures. These effects thus support the earlier conclusions that the degassing
Volum e 71, N um ber 3 F ebruary 1967
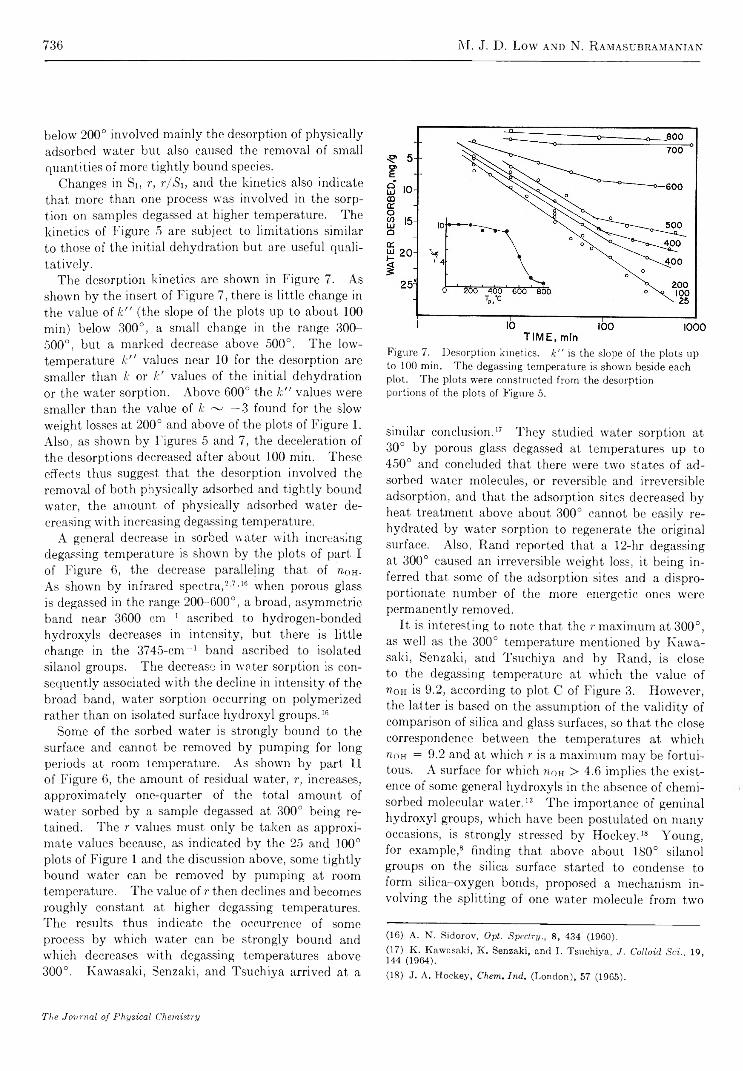
736 M. J. D. Low AND N. Ramasubramanian
below 200° involved mainly the desorption of physically adsorbed water but also caused the removal of small quantities of more tightly bound species.
Changes in Si, r, r/S\, and the kinetics also indicate that more than one process was involved in the sorption on samples degassed at higher temperature. The kinetics of Figure 5 are subject to limitations similar to those of the initial dehydration but are useful qualitatively.
The desorption kinetics are shown in Figure 7. As shown by the insert of Figure 7, there is little change in the value of k" (the slope of the plots up to about 100 min) below 300°, a small change in the range 300- 500°, but a marked decrease above 500°. The low- temperature k " values near 10 for the desorption are smaller than k or k ' values of the initial dehydration or the water sorption. Above 600° the k " values were smaller than the value of k ~ —3 found for the slow weight losses at 200° and above of the plots of Figure 1. Also, as shown by Figures 5 and 7, the deceleration of the desorptions decreased after about 100 min. These effects thus suggest that the desorption involved the removal of both physically adsorbed and tightly bound water, the amount of physically adsorbed water decreasing with increasing degassing temperature.
A general decrease in sorbed water with increasing degassing temperature is shown by the plots of part I of Figure 6, the decrease paralleling that of r0h- As shown by infrared spectra,2'7'16 when porous glass is degassed in the range 200-600°, a broad, asymmetric band near 3600 cm-1 ascribed to hydrogen-bonded hydroxyls decreases in intensity, but there is little change in the 3745-cm-1 band ascribed to isolated silanol groups. The decrease in water sorption is consequently associated with the decline in intensity of the broad band, water sorption occurring on polymerized rather than on isolated surface hydroxyl groups.16
Some of the sorbed water is strongly bound to the surface and cannot be removed by pumping for long periods at room temperature. As shown by part II of Figure 6, the amount of residual water, r, increases, approximately one-quarter of the total amount of water sorbed by a sample degassed at 300° being retained. The r values must only be taken as approximate values because, as indicated by the 25 and 100° plots of Figure 1 and the discussion above, some tightly bound water can be removed by pumping at room temperature. The value of r then declines and becomes roughly constant at higher degassing temperatures. The results thus indicate the occurrence of some process by which water can be strongly bound and which decreases with degassing temperatures above 300°. Kawasaki, Senzaki, and Tsuchiya arrived at a
Figure 7. D esorption kinetics, k " is the slope o f the p lots up to 100 m in. T h e degassing tem perature is show n beside each p lot. T h e p lots were constructed from the desorption portions o f the p lots o f Figure 5.
similar conclusion.17 They studied water sorption at 30° by porous glass degassed at temperatures up to 450° and concluded that there were two states of adsorbed water molecules, or reversible and irreversible adsorption, and that the adsorption sites decreased by heat treatment above about 300° cannot be easily rehydrated by water sorption to regenerate the original surface. Also, Rand reported that a 12-hr degassing at 300° caused an irreversible weight loss, it being inferred that some of the adsorption sites and a disproportionate number of the more energetic ones were permanently removed.
It is interesting to note that the r maximum at 300°, as well as the 300° temperature mentioned by Kawasaki, Senzaki, and Tsuchiya and by Rand, is close to the degassing temperature at which the value of n0H is 9.2, according to plot C of Figure 3. However, the latter is based on the assumption of the validity of comparison of silica and glass surfaces, so that the close correspondence between the temperatures at which nos = 9.2 and at which r is a maximum may be fortuitous. A surface for which non > 4.6 implies the existence of some general hydroxyls in the absence of chemisorbed molecular water.13 The importance of geminal hydroxyl groups, which have been postulated on many occasions, is strongly stressed by Hockey.16 17 18 Young, for example,8 finding that above about 180° silanol groups on the silica surface started to condense to form silica-oxygen bonds, proposed a mechanism involving the splitting of one water molecule from two
(16) A. N. Sidorov, Opt. Spectry., 8, 434 (1960).(17) K . Kawasaki, K . Senzaki, and I. Tsuchiya, J. Colloid Sci., 19, 144 (1964).(18) J. A . H ockey, C h em .In d . (London), 57 (1965).
The J o v rra l o f P hysica l Chem istry
D e h y d r a t i o n o f P o r o u s G l a s s 737
neighboring pairs of geminal hydroxyls as alternative to the formation of strained siloxane bridges. Such a mechanism may account for the 300° maximum in r
and for the results of Kawasaki, Sensaki, and Tsuchiya and of Rand. This would imply that dehydration at low temperatures would cause the formation of a half- dehydroxylated surface grouping which, after adsorbing water, would be restored to form a pair of adjacent silicon atoms each having geminal hydroxyl groups. The sorbed wrater would thus be relatively strongly bound. Degassing at temperatures above 300° would cause further, irreversible dehydroxylation of the half- dehydroxylated state, so that the amount of tightly bound wrater would diminish.
Alternately, geminal hydroxyl groups might be adsorption sites having stericand energetic characteristics suitable for the bonding of molecular water in a stronger manner than physical adsorption. This could imply that, after physically adsorbed water had been removed near room temperature, degassing at low temperatures caused the desorption of such strongly bonded molecular water. The adsorption sites would then be freed and active for subsequent adsorption. Heating above 300° could destroy the geminal configuration and cause a decrease in the amount of strongly bound molecular wrater, as with Young’s mechanism.
According to either mechanism, the amount of tightly bound v'ater should decrease with increasing degassing temperature. How'ever, although a general decline in water sorption wras found, shown by part I of Figure 6, the amount of wTater retained remains approximately constant, as shown by part II of Figure 6. The ratio r/Si or the percentage of the sorbed water which was retained, 100r/<Si, increases at degassing temperatures above 600°. Similarly, the decline with increasing degassing temperatures of the amount of wrater sorbed falls off above 600°, as showm by plot B of part I of Figure 6. These effects indicate that some mechanism by which water can be strongly bonded became important above 600°. Silanols cannot be connected with these effects, because the number of silanols decreases with increasing degassing temperature, as showm by the present results and by infrared spectroscopic data described elsewhere.2 It has been shown, however, that the 3703-cm-1 band ascribed to surface B-OH groups is developed only after degassing under severe conditions2 and that boron on the porous-glass surface can act as adsorption center and permit the reaction of
water with the otherwise hydrophobic glass surface.3 These results furnish strong support for the conclusion that the migration of boron to the glass surface is responsible for the effects observed with samples degassed at temperatures above 600°. Further support for this mechanism comes from experiments in which the degassing time was varied.
For example, wyater sorption and desorption were measured after degassing a specimen for periods of 0.5 and 9 hr. The total welter sorption decreased by 50%, whereas the r decreased by 20%, after the additional 8.5-hr period. The value of 100%% consequently increased from 40 to 70%. Similarly, with a specimen degassed at 800° for 0.5 and 14 hr, the value of 100r/jSi increased from 50 to 70%. Such results show7 that increased severity of degassing increased the reactivity of the surface. In terms of the boron-migration mechanism, the increased degassing period permitted an increase in the surface boron concentration to occur.
According to Sidorov,16 the adsorption of water by porous glass is determined by perturbed hydroxyl groups in the case of hydrated surfaces and by “ centers of the second kind,” i.e., silicon or oxygen atoms,19-21 in the case of highly degassed surfaces; after heating porous glass at temperatures above 550°, the w7ater adsorption takes place predominantly on centers of the second kind. The state of water bonded to the latter was considered to be intermediate between the physisorbed and chemisorbed states. In view of the present results it seems likely that the centers of the second kind can be equated with surface sites formed from boron atoms. These sites could adsorb a portion of the sorbed water and permit a portion to react with the siloxane groups of the surface and consequently become quite strongly bonded. The over-all binding effect could then be “ intermediate.”
Acknowledgment. This work was supported by the Office of Naval Research through Contract Nonr 404 (19) and, in part, by NSF Grant GP 1434. We are grateful to Dr. F. Ciapetta for making possible the loan of a cathetometer from W. R. Grace and Co. 19 20 21
(19) A . N. Sidorov, Zh. F iz. K h im ., 30, 995 (1956).(20) M . Folman and D . J. C. Yates, P roc. R oy. Soc. (London), A246, 32 (1958); Trans. Faraday Soc., 54, 1684 (1958); J. P hys. Chem., 63, 183 (1959).(21) N. Sheppard, Spectrochim . A cta , 14, 249 (1959).
Volume 71, Number 3 February 1967

738 Selwyn J. Rehfeld
Adsorption of Sodium Dodecyl Sulfate at Various Hydrocarbon-Water Interfaces
b y S e l w y n J . R e h f e l d
Shell Developm ent C om pany , E m eryville, C alifornia (Received September 1966)
This paper presents interfacial tension data for the adsorption of highly purified sodium dodecyl sulfate from aqueous solutions at the air-water and water -n-hexane, n-octane, n-nonane, n-decane, n-heptadecane, 1-hexene, 1-octene, cyclohexane, cyclohexene, benzene, n-butylbenzene, or carbon tetrachloride interfaces. The influence of these organic liquids upon the critical micelle concentration and the adsorption isotherms is described. Also, it is demonstrated that plots of interfacial tension vs. the logarithms of surfactant concentration can be fitted by a polynomial of second degree below the critical micelle concentration. The derivative of this empirical equation is substituted into the Gibbs adsorption equation and an adsorption isotherm of the form T_ = (zi/2RT) + (z2/RT) In m± is obtained for all the interfaces, where z, and z2 are constants.
I n t r o d u c t i o n
Although a number of investigations1 ~4 5 have been reported in the literature concerning the adsorption of sodium dodecyl sulfate (NaDDS) at hydrocarbon- water interfaces, only w-decane,2 w-heptane (at 50°),3 and petroleum ether4 have been used as the hydrocarbons. The critical micelle concentration (cmc) of the NaDDS used in these experiments was 7.95,28.1 (at 50°),3 and 8.04 mM. The adsorption isotherms computed for the n-decane- and petroleum ether-water interfaces were similar, and when the bulk concentration of NaDDS reached the cmc, the area occupied per adsorbed NaDDS molecule at these surfaces was 48 A2.2,4 Interfacial tension data for the adsorption of an impure NaDDS (cmc ~ 7 mM) at selected organic liquid-water interfaces1 (benzene, cyclohexane, and chlorobenzene and nitrobenzene) suggested that the adsorbed film was considerably more expanded at benzene- and cyclohexane-water interfaces than at the air- water interface. For the chlorobenzene-water interface the film properties were closely similar to those on water and at the nitrobenzene-water interface the surface film appeared to be more condensed. The cmc of NaDDS in the presence of these organic liquids was not reported.
The present investigation represents an extension of these earlier studies in an attempt to explore further the dependence of the cmc and adsorption isotherms upon the addition of various organic liquids.
E x p e r i m e n t a l S e c t i o n
Materials. The organic liquids were research grade and exceeded a purity of 99.5 mole %. All the organic liquids were doubly distilled before using. The n- alkanes, cyclohexane, and cyclohexene were passed repeatedly through columns of silica gel until no absorption occurred in the spectral region of 220-350 nyi as measured by a Cary 14 spectrophotometer. The water used in these experiments was triply distilled.
Interfacial Tension Measurements. Interfacial tension measurements were made at 25.0 ± 0 .1 ° employing the drop-volume method;6 the equilibrium drop volume was obtained within 5 min. The volumes of at least 10-15 drops were measured for each determination. The surface tension of the various bottles of triply distilled water used was 71.8 ± 0.1 dynes cm-1. Interfacial tensions of the purified organic liquids vs. water are given in Table I. These interfacial tension values were found to be in excellent agreement with those given in the literature, ±0.5 dyne cm-1
(1) E . J. Hutchinson, J . Colloid S c i ., 3 , 531 (1948).(2) E. G . Cockbain, Trans. F araday S oc., 50, 874 (1954).(3) W . Kling and H . Lange, P roc . In tern . Congr. S urface A ctivity , 2nd, L ondon, 1957, 1, 295 (1957).(4) D . A . H aydon and J. N . Phillips, Trans. Faraday Soc., 54, 698 (1958).(5) W . D . Harkins, “ Physical M ethods o f Organic Chem istry,”Vol. I , A . Weissberger, Ed., Interscience Publishers, Inc., New Y ork, N. Y ., 1949.
The Journal o f P hysica l Chem istry
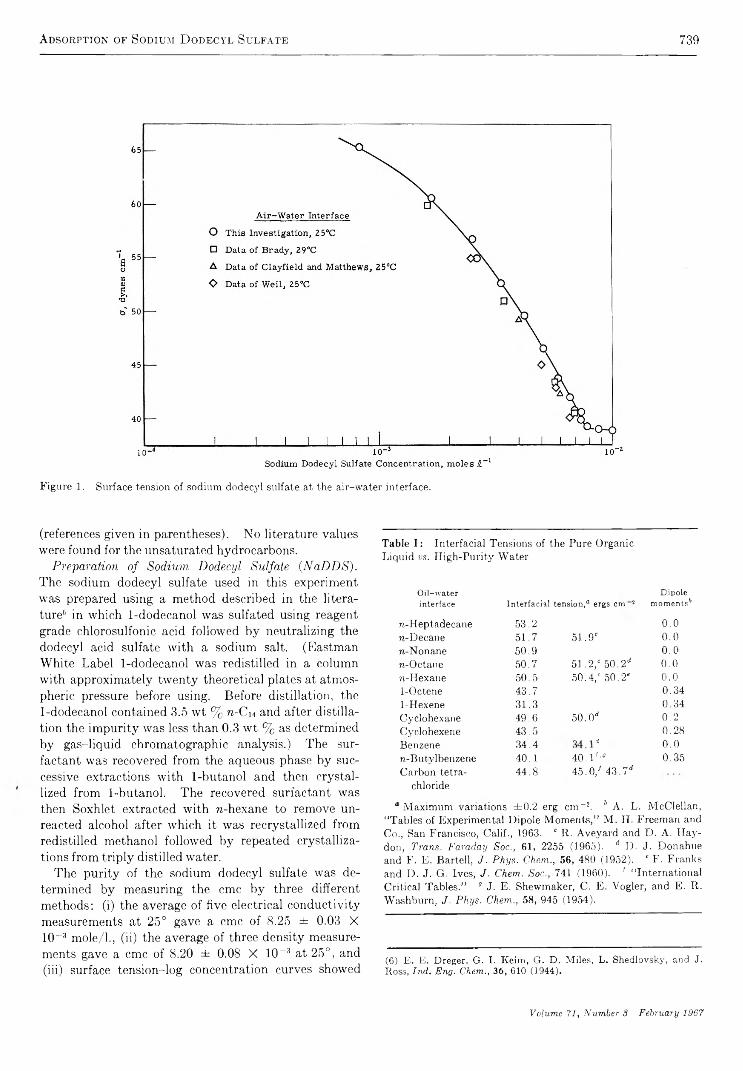
Adsorption of Sodium D odecyl Sulfate 739
Figure 1. Surface tension of sodium dodecyl sulfate at the air-water interface.
(references given in parentheses). No literature values were found for the unsaturated hydrocarbons.
Preparation of Sodium Dodecyl Sulfate (NaDDS). The sodium dodecyl sulfate used in this experiment was prepared using a method described in the literature6 in which 1-dodecanol was sulfated using reagent grade chlorosulfonic acid followed by neutralizing the dodecyl acid sulfate with a sodium salt. (Eastman White Label 1-dodecanol was redistilled in a column with approximately twenty theoretical plates at atmospheric pressure before using. Before distillation, the 1-dodecanol contained 3.5 wt % n-Cu and after distillation the impurity was less than 0.3 wt % as determined by gas-liquid chromatographic analysis.) The surfactant was recovered from the aqueous phase by successive extractions with 1-butanol and then crystallized from 1-butanol. The recovered surfactant was then Soxhlet extracted with w-hexane to remove unreacted alcohol after which it was recrystallized from redistilled methanol followed by repeated crystallizations from triply distilled water.
The purity of the sodium dodecyl sulfate was determined by measuring the cmc by three different methods: (i) the average of five electrical conductivity measurements at 25° gave a cmc of 8.25 ± 0.03 X 10“ 3 mole/1., (ii) the average of three density measurements gave a cmc of 8.20 ± 0.08 X 10⁻³ at 25°, and(iii) surface tension-log concentration curves showed
Table I: Interfacial Tensions of the Pure Organic Liquid v s . High-Purity Water
O il-w ater Dipoleinterface In terfacia l tension ,0 ergs cm 2 moments^
n-Heptadecane 53.2 0.0n-Deeane 51.7 51.9° 0.0n-Nonane 50.9 0.071-Octane 50.7 51.2,° 50.2d 0.0?i-Hexane 50.5 50.4,° 50.2e 0.01-Octene 43.7 0.341-Hexene 31.3 0.34Cyclohexane 49.6 50. O'* 0.2Cyclohexene 43.5 0.28Benzene 34.4
■ÖCO 0.0n-Butvlbenzene 40.1 40. W" 0.35Carbon tetra- 44. S 45 .0/ 43 . 7 d
chloride
° Maximum variations ±0.2 erg cm-2. b A. L. McClellan, “Tables of Experimental Dipole Moments,” M. H. Freeman and Co., San Francisco, Calif., 1963. ° R. Aveyard and D. A. Hay-don, T r a n s . F a r a d a y S o c . , 61, 2255 (1965). d D. J. Donahue and F. E. Bartell, J . P h y s . C h e m , . , 56, 480 (1952). 6 F. Franks and D. J. G. Ives, J . C h e m . S o c . , 741 (1960). f “ International Crit.ieal Tables.” ° J. E. Shewmaker, C. E. Vogler, and E. R. Washburn, J . P h y s . C h e m . , 58, 945 (1954).
(6) E. E. Dreger, G. I. Keim, G. D . Miles, L . Shedlovsky, and J. Ross, In d . E ng. Chem., 36, 610 (1944).
Volum e 71, N um ber S February 1967

740 S e l w y n J. R e h f e l d
O n-Heptadecane - Water
Q n-Decane - Water
□ n-Octane - Water
O 1-Octene-W ater
A n-Hexane - Water
O 1-Hexene - Water
Concentration o f Sodium Dodecyl Sulfate, m oles /liter
Figure 2. Interfacial tension at the hydrocarbon-water interface as a function of sodium dodecyl sulfate concentration.
no minimum and gave a cmc of S.10 ± 0.05 X 10~3 mole/1. at 25°. These values are in agreement with the average of the values reported in the literature for the cmc of “ pure” sodium dodecyl sulfate, 8.10 ± 0.10 X 10” 3 mole/1. at 25°.
Results and DiscussionInterfacial Tension Measurements of Surfactant Solu
tions. A plot of the measured interfacial tension at the air-water interface as a function of NaDDS concentration. is shown in Figure 1; these values are compared with those given in the literature for “ pure” NaDDS.7 8“ 9 The literature values were ^ 1 .5 dynes cm“ 1 lower than those obtained in this investigation, suggesting that the NaDDS used in our study was of a higher purity. Plots of the interfacial tension at the various organic liquid-water interfaces as a function of NaDDS concentration are shown in Figures 2 and 3. (Note: The average standard deviation was ±0.3 dyne cm“ 1.) Interfacial tension data given in the literature for the adsorption of NaDDS at the n- decane-water interface2 were also ~1 .5 dynes cm-1 lower, undoubtedly due to the impurities in the NaDDS.
Interfacial tension/ln concentration data were fitted to the Taylor series using multiple regression analysis; a polynomial of second degree was found to be adequate; thus
v = + 2i In to± + zi In2 m± (1)
where ni± is the surfactant concentration in moles per liter. All calculated values of a fell within the limits of error of the measurements and the sum of the residual squares was considerably less than the values computed for the coefficients. Further terms (cubic, etc.) did not improve the fit; i.e., the sum of the squares exceeded the values computed for the coefficients. Values computed for z0, z\, and and the standard error are given in Table II.
(Note: Literature data for surface or interfacial tension of aqueous nonelectrolytes, weak electrolytes, and strong electrolytes vs. natural logarithm of activity also were found to be adequately fitted by a polynomial of a second degree. Examples are given in Table III.)
The interfacial tension measurements were used to determine the cmc of the aqueous NaDDS solutions as well as to compute the amounts of surfactant adsorbed at the various interfaces. First, we will present the data on the effect of the dissolved organic liquids upon the cmc followed by a section on the computations of the adsorption isotherms.
It is of some interest to note that the organic molecules which have ir electrons gave much lower interfacial
(7) A. P. Brady, J . P h y s . C h e m . , 53, 56 (1949).(8) E. J. Cîayfield and J. B. Matthews, P r o c . I n t e r n . C o n g r . S u r f a c e
A c t i v i t y , 2 n d , L o n d o n , 1 9 5 7 , 1, 172 (1957).(9) I. WeiJ, J . P h y s . C h e m . , 70, 133 (1966).
The Journal o f P hysical Chem istry

A d s o r p t io n o f S o d iu m D o d e c y l S u l f a t e 741
Figure 3. Interfacial tension at various hydrocarbon-water interfaces as a function of sodium dodecyl sulfate concentration.
Table II : Coefficients Computed from Fitting Eq 3
Type of interface ZO, Zl, 22,v s . water dynes cm -1 dynes cm -1 dynes cm -1
ra-Heptadecane -102 .3 ± 3 .7 -3 1 .5 ± 1.2 -1 .6 2 ± 0.09n-Decane -108 .6 ± 5.2 -3 2 .5 ± 1.8 -1 .6 5 ± 0.15?i-Nonane -120 .4 ± 3 .6 -3 6 .4 ± 1.2 -1 .9 9 ± 0.09«-Octane -114 .8 ± 3.3 -3 4 .1 ± 1 .1 -1 .7 8 ± 0.08«-Hexane -139 .3 ± 5.0 -4 1 .7 ± 1.7 -2 .3 7 ± 0.14Cyclohexane -121.3 ± 6.2 -3 5 .5 ± 2.1 -1 .9 0 ± 0.18Cyclohexene -124 .2 ± 4 .9 -3 6 .1 ± 1.6 -2 .0 1 ± 0.14Octene-1 -115.9 ± 4.2 -3 4 .3 ± 1.4 -1 .8 5 ± 0.12Hexene-1 -133.3 ± 7.1 -4 0 .0 ± 2.3 -2 .5 1 ± 0.19Benzene -100 .0 ± 3.3 -2 8 .4 ± 1.0 -1 .5 4 ± 0.08n-Butylbenzene -115 .8 ± 6.5 -3 4 .8 ± 2.2 -2 .0 2 ± 0.18Carbon tetrachloride -113 .3 ± 2.6 -3 2 .3 ± 0.8 -1 .6 9 ± 0.06Air -118 .0 ± 6.7 -4 6 .6 ± 2.3 -2 .9 2 ± 0.20
tensions than the n-alkanes whereas molecules with dipoles had only slightly lower interfacial tensions.
The decrease in the interfacial tension is probably due to the strong interaction of the water molecules with the 7r-electron orbitals,10'11 i.e., an induced dipole by polarization of the organic molecule by the water molecule.
Critical Micelle Concentrations. The concentrations at the inflection points in the interfacial tension curves, the cmc, in the presence of the various organic liquids are given in Table IV, column 1. (Note:
Substituting the minimum value of a into the empirical expression 1 gave the cmc; see column 2 in Table IV.) For the case of dissolved n-alkanes, the cmc decreases as the chain length is decreased. The introduction of unsaturation into n-C6 and n-Cg reduces the cmc relative to the saturated compounds. A decrease in the cmc due to the presence of unsaturation in the hydrocarbon is illustrated also by the lower cmc
(10) I. M . Goldm an and R . O. Crisler, J . Org. Chem., 2 3 ,751 (1958).(11) M . Oki and H. Iwamura, B u ll. Chem . Soc. J a p a n . , 33,717(1960).
Volume 71, Number 8 February 1967
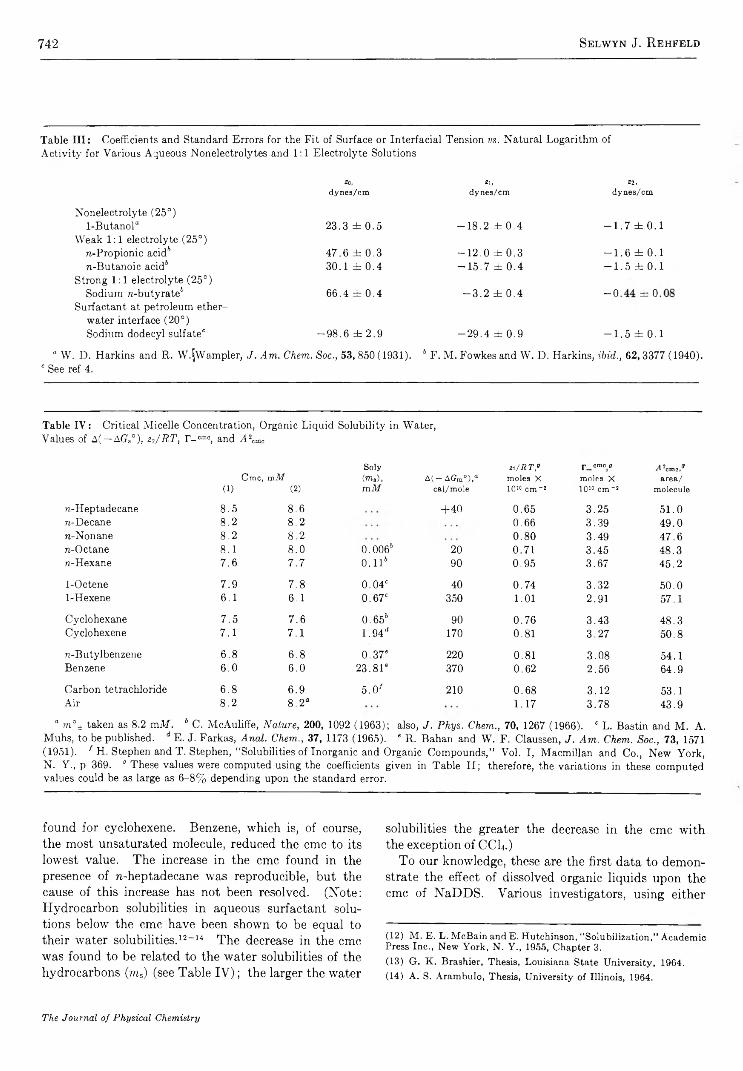
742 S e l w y n J. R e h f e l d
Table III: Coefficients and Standard Errors for the Fit of Surface or Interfacial Tension v s . Natural Logarithm ofActivity for Various Aqueous Nonelectrolytes and 1:1 Electrolyte Solutions
Nonelectrolyte (25°)
20,dynes/cm
21,dynes/cm
Z2,dynes/cm
1-Butanol“Weak 1:1 electrolyte (25°)
23.3 ± 0.5 -1 8 .2 ± 0 .4 — 1.7 ± 0 .1
n-Propionic acid6 47.6 ± 0.3 -1 2 .0 ± 0.3 - 1 .6 ± 0.1w-Butanoic acid6
Strong 1:1 electrolyte (25°)30.1 ± 0.4 — 15.7 ± 0.4 - 1 .5 ± 0.1
Sodium re-butyrate6 Surfactant at petroleum ether-
water interface (20°)
66.4 ± 0.4 - 3 .2 ± 0.4
O410I
Sodium dodecyl sulfate0 -9 8 .6 ± 2.9 -2 9 .4 ± 0.9 - 1 .5 ± 0 .1
“ W. D. Harkins and R. W.^Wampler, J . A m . C h e m . S o c . , 53,850 (1931). 6 F. M. Fowkes and W. D. Harkins, i b i d . , 62,3377 (1940). 0 See ref 4.
Table IV: Critical Micelle Concentration, Organic Liquid Solubility in Water, Values of A( —AG»°), z ^ > / R T , r - omo, and A 2cmo
Soly zi/RT? ji omo g X !cmc,“Cmc, m M (»re»), A (— AGm°),“ moles X moles X area/
(1) (2) m .M cal/mole 1010 cm -2 1010 cm -2 molecule
re-Heptadecane 8.5 8.6 +40 0.65 3.25 51.0re-Decane 8.2 8.2 0.66 3.39 49.0n-Nonane 8.2 S .2 0.80 3.49 47.6re-Octane 8.1 8.0 0.0066 20 0.71 3.45 48.3re-Hexane 7.6 7.7 0.116 90 0.95 3.67 45.2
1-Octene 7.9 7.8 0.04° 40 0.74 3.32 50.01-Hexene 6.1 6.1 0.67° 350 1.01 2.91 57.1
Cyclohexane 7.5 7.6 0.656 90 0.76 3.43 48.3Cyclohexene 7.1 7.1 1 .9 4 11 170 0.81 3.27 50.8re-Butylbenzene 6.8 6.8 0.37“ 220 0.81 3.08 54.1Benzene 6.0 6.0 23.81e 370 0.62 2.56 64.9Carbon tetrachloride 6.8 6.9 5.0/ 210 0.68 3.12 53.1Air 8.2 8.2“ 1.17 3.78 43.9
“ m ° ± taken as 8.2 mM . b C. McAuliffe, N a t u r e , 200, 1092 (1963); also, J . P h y s . C h e m . , 70, 1267 (1966). 0 L. Bastin and M. A. Muhs, to be published. d E. J. Farkas, A n a l . C h e m . , 37, 1173 (1965). 6 R. Bahan and W. F. Claussen, J . A m . C h e m . S o c . , 73, 1571 (1951). 1 H. Stephen and T. Stephen, “ Solubilities of Inorganic and Organic Compounds,” Vol. I, Macmillan and Co., New York, N. Y., p 369. ' These values were computed using the coefficients given in Table II; therefore, the variations in these computed values could be as large as 6-8% depending upon the standard error.
found for cyclohexene. Benzene, which is, of course, the most unsaturated molecule, reduced the cmc to its lowest value. The increase in the cmc found in the presence of n-heptadecane was reproducible, but the cause of this increase has not been resolved. (Note: Hydrocarbon solubilities in aqueous surfactant solutions below the cmc have been shown to be equal to their water solubilities.12-14 The decrease in the cmc was found to be related to the water solubilities of the hydrocarbons (ms) (see Table IV) ; the larger the water
solubilities the greater the decrease in the cmc with the exception of CCh.)
To our knowledge, these are the first data to demonstrate the effect of dissolved organic liquids upon the cmc of NaDDS. Various investigators, using either 12 13 14
(12) M . E. L. M cBain and E. Hutchinson, "Solubilization ,” A cadem ic Press Inc., New Y ork, N. Y ., 1955, Chapter 3.(13) G . K . Brashier, Thesis, Louisiana State University, 1964.(14) A . S. Arambulo, Thesis, University o f Illinois, 1964.
The Journal of Physical Chemistry

A d s o r p t io n o p S o d iu m D o d e c y l S u l f a t e 743
the electrical conductivity or dye method, have found that the presence of dissolved benzene, toluene, cyclohexane, n-hexane, w-octane, n-dodecane, n-heptadecane, and n-octadecane in the aqueous solutions of dodecyl- ammonium chloride,15 16'16 potassium carboxylate,17 sodium alkyl sulfonates,18 and potassium dodecyl sulfonates18 caused a decrease in the cmc with the exception of n-heptadecane and n-octadecane. The presence of these two hydrocarbons had no detectable effect upon the cmc. The critical micelle concentrations of these surfactants were also reduced to their lowest values in the presence of benzene. Recently Nakagawa and Tori,19 using nuclear magnetic resonance spectroscopy, measured the chemical shift of the benzene signal as a function of NaDDS concentration in deuterium oxide solutions of NaDDS saturated with benzene. These investigators found that no shift of the benzene proton position occurred below the cmc, but when the surfactant concentration reached the cmc, some of the benzene molecules were incorporated into the micelles; thus the benzene signal shifted.19 The cmc found by this measurement, ^6.9 mM, was also lower than the cmc in the absence of benzene.
Two different models have been used in attempts to describe the micellization process
n (monomer) < > (micelle) n (2)
One is an equilibrium process obeying the laws of mass action20 and the other is a pseudo-phase separation.15 Both of these models were reported to give the same semiempirical thermodynamic expression for the standard free energies of micellization,21-24 namely, at constant temperature and pressure
AGm° = 2RT In x±y± (3)
where x± and y± are the mole fraction and activity co
Hydrated Monomer Hydrated Monomer
Figure 4. Diagram of micellization process in presence of organic liquids.
efficient of the monomer just at the cmc (as defined by Phillips).26 As previously pointed out by Herrmann and Benjamin,21 22 23 24 25 the standard free energies of micellization obtained according to expression 3 depend on the concentration units used and on the choice of standard state. The solvated monomer standard state w’as taken as the hypothetical state of mole fraction unit; the micelle standard state was taken as the solvated micelle at mole fraction unit.21 This process was presented diagrammatically by Herrmann and Benjamin21 as
hydrated monomer ——> micelle (hydrated) (hypothetical) x (micelle) = 1
l A(?m = o (4)
hydrated monomer x (monomer) = just at the cmc
At the cmc in the ternary system—1:1 electrolyte, dissolved hydrocarbon, and water—the hydrocarbons are solubilized in the micelle-water interface26 and the hydrocarbon core of the micelle.12 This process may be described by the diagram shown in Figure 4. This model assumes that the hydrocarbon liquid in the micelle interior has the same activity as the excess hydrocarbon liquid at the oil-water interface and that the hydrocarbon dissolved in water is in the same state as the hydrocarbon dissolved in the surface of the hydrated micelle. Thus the standard free energy changes for these processes are zero. The standard free energy of micellization in the presence of organic liquids, ACrm°, represents in part the change in free energy due to the incorporation of the organic liquid into the micelle. The difference between the standard free energies of micellization in the presence of hydrocarbons
(15) E . Hutchinson, A. Inaba, and L. G . Bailey, Z . P h y s i k . C h e m
(Frankfurt), 5, 344 (1955).(16) A. W. Ralston and R . N. Eggenberger, J . A m . C h e m . S o c . , 70, 983 (1948).(17) H . B. Elevens, J . P h y s . C o l l o i d C h e m . , 54, 1012 (1950).(18) W . Lim, B u l l . C h e m . S o c . J a p a n , 28, 227 (1955).(19) T . Nakagawa and K . Tori, K o l l o i d - Z . , 194, 143 (1964).(20) R . C. M urray and G . S. Hartley, T r a n s . F a r a d a y S o c . , 31, 183 (1935).(21) K . W . Herrmann, J . P h y s . C h e m . , 66, 295 (1962); L . Benjam in, i b i d . , 68, 3575 (1964).(22) J. M . Corkill, J. F . Goodman, and S. P . Harrold, T r a n s . F a r a d a y
S o c . , 60, 202 (1964).(23) P . M olyneux, C. T . Rhodes, and J. Swarbrick, i b i d . , 61, 1043 (1965).(24) H . F. Huisman, V e r h a n d e l . K o n i n k l . N e d . A k a d . W e t e n s c h a p .
A f d e l . N a t u u r k . , P r o c . S e r . B , 67, 407 (1964).(25) J. N . Phillips, T r a n s . F a r a d a y S o c . , 51, 561 (1955).(26) J. E. Eriksson, A c t a C h e m . S c a n d . , 17, 1478 (1963).
Volume 71, Number 3 February 1967

744 S e l w y n J. R e h f e l d
(AGm°) and in the absence of hydrocarbons (AGm°), the reference state in this case, was computed using the expression
A ( - A ( ? . ° ) = AGm° - AGm° =
2RT In x±y±/x°±y°± (5)
where A ( — ACS°) is the change in free energy due to solubilizing the organic liquid in the micelle and x°± and 7°± are the mole fraction and activity coefficient at the cmc in the absence of organic liquids (see TableIV). (Note: The ratio of the activity coefficients, y±/y°±, since the' change in concentration is small, was assumed to be unity.) The values of A( —AGs°) increased as the »-alkane chain length decreased. Solubilities of the »-alkanes, in micelles increase as the »-alkane chain length decreases12 (or as the hydrocarbon solubility in water increases); thus, the greater the »-alkane solubility in the micelle the larger the decrease in the value of. A( — AG„°) (see Table IV). This was also true of the other homologous series; e.g., benzene has the largest solubility in micelles12 and had the largest value for A( — AGS°); whereas n-butylbenzene is less soluble in micelles12 and had a corresponding smaller value for A (A Gs°). We believe that these changes in the standard free energy arise from structural changes when these organic-liquids are solubilized in the hydrated micelle surface and in the micelle interior. Before making any further speculations the adsorption isotherms were computed to determine if a correlation existed between the cmc and the concentration of NaDDS at the organic liquid-water interface when the bulk concentration is at the cmc.
Calculated Adsorption Isotherms. The surface “ concentrations” of NaDDS asca function of the equilibrium concentration of surfactant in the bulk phase are calculated from interfacial tension data using the Gibbs adsorption equation. The equation for variations in composition in the surface of a 1:1 aqueous electrolyte solution, considering the surface layer as having a thickness of molecular dimensions at constant temperature, was derived by Guggenheim27 as
—do/2RT = r_d In a± (6)
where IN is the surface “ concentration” of NaDDS (anion), cr is the iriterfacial or surface fension, and a± is the mean activity of the ions Na+ and DDS- .
The term dv/d In a± was evaluated by differentiating the empirical expression 1, assuming a± = m±, and substituting the derivative into expression 6; thus an expression for the adsorption isotherm is obtained., namely
— dv/d/Cfc = da/2RT d In a± =(zi/2RT) + (zi/RT) In m± = IN (7)
The area per molecule is defined as (IN/Vo)-1; thus expression 8 has the following form for changes in area per molecule vs. In m±
—da/2kT d In a± —(z1/2kT) + (z2/kT) In m± = 1 /A2 (8)
Values of the slope, z2/RT, the amounts adsorbed at the cmc, INcmc, and the corresponding areas occupied per molecule of NaDDS, A 2cmc, are given in Table IV. The value of A 2CmC computed for the air-water interface of 43.9 A 2 is within the range of values reported in the literature of 45 ± 5 A2.7-9 The value obtained for the »-decane-water interface of 49.3 A2 was in good agreement with the literature value of 48.8 A 2.2 The surface films at the benzene-water interface are more expanded (65 A2) suggesting penetration or dissolving of benzene in the surface film.1 Surface films of NaDDS were more closely packed at the n-alkane- water interface and the area per molecule at the cmc increased as a function of »-alkane chain length, 45- 51 A2. The surface films of NaDDS at the unsaturated hydrocarbon-water interface were more expanded than those at the saturated hydrocarbon- water interfaces. Also, note the expanded surface film in the presence of carbon tetrachloride.
Variations of the area per adsorbed NaDDS molecule at the various interfaces at the cmc are not easily explained without independent data concerning interactions between NaDDS, water, and the organic liquids. The fact that the presence of » -Ce hardly changes the area per adsorbed NaDDS molecule at the interface while the benzene expands the area from 44 to 65 A 2 per molecule is interpreted as indicating far larger amounts of benzene are dissolved in the surface film as compared with n-Ce.
A correlation between the concentration of NaDDS at the oil-water interface and the cmc is observed for each homologous series (see Table IV). For example, as the solubility of the »-alkane decreased, the cmc increased and the concentration of NaDDS at the oil- water interface decreased. In the presence of the other organic liquids, the cmc increased with decreasing solubility, but the concentration of NaDDS at the oil- water interface increased. This implies that the surfactant film at the micelle-water interface becomes
(27) E. A . Guggenheim, “ Therm odynam ics,” Interscience Publishers, Inc., New York, N . Y ., 1957.
The Jou rnal o f P h ysica l Chem istry

A c id - B a s e P r o p e r t ie s o f Q u a r t z S u s p e n s io n s 745
more expanded as the n-alkane solubility in the micelle decreases, whereas the direct opposite is implied for the other organic liquids. As the organic liquid solubilities in the micelle decrease, the micelle-water interface would be less expanded.
Acknowledgments. The author profoundly expresses his gratitude to Drs. J. W. Otvos, W. C. Simpson, and J. N. Wilson for helpful discussions and encouragement, and to G. V. Seastrom, Jr., for assistance in making duplicate interfacial tension measurements.
Acid-Base Properties of Quartz Suspensions1
b y S . S t o r g a a r d J 0 r g e n s e n a n d A . T o v b o r g J e n s e n
Chem ical Laboratory, R oya l Veterinary and Agricu ltural College, Copenhagen, D enm ark (.Received October 17, 1966)
Narrow particle-size fractions of quartz, vitreous silica, and flint <20 n, prepared by elutria- tion, were titrated back and forth several times with NaOH and HC1 in the pH range3-11. The titration curves of quartz were S shaped and showed hysteresis. It was shown that the major part of the protolysis capacity in the alkaline region was caused by silicic acid dissolving during titration. The protolysis capacity in the pH range 3-5 was unexpectedly high. It was shown to be due to a small iron impurity (0.03% Fe). The major part of the protolysis capacity in the range 5-9 was shown to be due to the quartz surface as such. The surface density of acid sites in the whole pH range 3-11 was estimated to 2.6 acid sites/100 A 2. As the protolysis capacity of HF-washed quartz was much lower than that of untreated quartz, it was concluded that the latter had a reactive surface layer different from that of the perfect crystal. Titration curves of vitreous silica were similar to those of quartz. The protolysis capacity of flint was higher than that of quartz and vitreous silica but increased only slightly with decreasing particle size. Hence it was concluded that flint has some kind of protolytically reactive inner surfaces in addition to outer surfaces. This was substantiated by X-ray investigation.
I n t r o d u c t i o n
It is reasonable to assume that the acid-base properties of suspensions of quartz and vitreous silica are confined to outer particle surfaces. If the acid- base sites are equally distributed over all surfaces, the protolysis capacity2 must be proportional to the specific surface area of the particles. This assumption has, however, never been proved. It may also be assumed that suspended particles can both split off hydrogen ions instantaneously and reversibly and neutralize base at a slow rate; i.e., they may exert “ manifest” as well as “ latent” acidity, in the terms of Bjer- rum.3
The manifest acidity is assumed to be caused by ionization of hydrogen ions from surface hydroxyl groups. The nature and properties of these groups have been discussed by Boehm.4 On amorphous silica,
(1) Taken in part from an unpublished thesis submitted by S. S. J. to the Veterinary and Agricultural College in partial fulfillment of the requirements for the L. Agro. degree.(2) B y “ protolysis capacity” is understood equivalents of acid or base consumed in titration of 100 g of powder between definite pH values.(3) N. Bjerrum, “ Selected Papers,” E jnar Munksgaard, Copenhagen, Denmark, 1949, p 286.(4) H . P. Boehm, Angew . Chem., 7 8 , 617 (1966); Angew . Chem. L itern . Ed. E ngl., 5, 533 (1966).
Volume 71, Number 3 February 1967
746 S . S t ORGAARD J0RGENSEN AND A . TOVBORG JENSEN
hydroxyl densities ranging from 2 to 5 O H /100 A2 have been found by various methods.4 From structural considerations, Stöber5 6 calculated a surface hydroxyl density of about 5 OH/100 A2 on crushed quartz. Experimentally (thermal dehydration), he estimated a density of about 3.6 OH/100 A 2 9.
The latent acidity is attributed to the acid-base properties of silicic acid formed by dissolution. Concentrations of monosilicic acid in “ equilibrium” with different forms of amorphous silica have been found to lie within the range of 110-140 mg of Si02/1. in acid and neutral solutions at room temperature.6-9 The solubility of quartz in water at 25° has been estimated to about 10 mg of Si02/1. by extrapolation from high- temperature experiments.10'11 12 In alkaline solutions the solubility of silica is much larger than in acid and neutral solutions due to ionization of silicic acid.6
The dissolution of silica is slow, but only in the case of HF-washed quar*z is it too slow to be recognized in titration curves of suspensions. It was noted by Holt and King12a that in water, silica dissolves rapidly at first, and later much more slowly. This has also been found by one of us12b in the case of precipitated amorphous silica. The dissolution rate increases with increasing alkalinity. It is therefore not possible to titrate the manifest acidity of any kind of silica without also titrating a part of the latent acidity. The combination of the two kinds of acidity causes the shape of a titration curve to depend on titration velocity. It also gives rise to hysteresis when a basetitrated suspension is titrated back with acid.
In the present investigation, protolysis capacities of four particle-size fractions <20 p have been compared with specific surface areas calculated from sedimentation analysis. In the case of quartz, a semiquantita- tive separation of the manifest and the latent acidity has also been made.
Experimental SectionSamples. Quartz is an already powdered sample,
99% a quartz as shown by X-ray diffractometry. After volatilization with HF + H2S04, 0.3% was left. In this residue aluminum and iron were detected. By boiling the fraction <2 p with 4 N HC1, 0.03% Fe was brought into solution. The iron may originate from steel balls used for crushing the quartz. Its presence caused some trouble in the evaluation of titration curves as will be shown later. Unless otherwise stated, the iron impurity was not removed before titration.
Vitreous silica is clear “ Vitreosil,” completely amorphous to X-rays and completely volatile with HF + H2S04.
Flint is a dark, Senonian specimen, uniform and free
from calcium carbonate. By the X-ray diffractometry methods of Jensen, et al.,13 the flint was compared with standard quartz (Riedel-de Haën). The area of the 1011 quartz peak was 90% that of the standard. By comparing the half-width of the same peak with that of the standard quartz, an average crystal size of 312 A was estimated. After volatilization with HF + H2S04, 0.3% was left.
Vitreous silica and flint were crushed in a steel mortar and then ground under methanol in a boron- carbide mortar. The powdered samples were separated at 20, 10, 4, and 2 p by élutriation in 0.002 M sodium pyrophosphate by the method of Jensen and Hansen.14 15 After élutriation, the fractions >2 p rvere washed three times with water and dried at 110°. The particles <2 p were flocculated by sodium chloride, washed Cl-free, and dried at 110°. On the quartz fractions4-10, 2-4, and <2 p , sedimentation analyses were carried out. Assuming spherical particles, the following specific surfaces were calculated from the size distributions found: 4-10 p, 0.385; 2-4 p, 0.93; and <2 p , 3.16 m2/g.
Cation-exchange capacities of the fractions <2 p were determined by means of sodium ions at pH 7.65 as described by Jackson.16 The following values were found: quartz, 4.9; flint, 6.3; and vitreous silica, 5.5 mequiv/100 g.
Titration Experiments. Acid-base titrations were performed by means of a Radiometer “ Titrigraph.” Powder (0.10-1.00 g) was suspended in 10 ml of deionized water or 1 M NaCl, titrated with 0.100 N HC1, and back-titrated with 0.100 N NaOH (carbonate- free) . Suspensions were titrated back and forth several times. Titrations were either performed in the same liquid throughout or the suspension was centrifuged and the particles suspended in water after the first
(5) W . Stöber, K o l l o i d - Z . , 145, 17 (1956).(6) G. B. Alexander, W . M . Heston, and R . K . Iler, J. P h y s . C h e m . , 58, 453 (1954).(7) K . B. Krauskopf, G e o c h i m . C o s m o c h i m , A cta , 10, 1 (1956).(8) S. A. Greenberg and E. W . Price, .7. P hys. Cham., 61, 1539 (1957).(9) R . Siever, J. G e o l . , 70, 127 (1962).(10) J. A. van Lier, P. L. de Bruyn, and J. T . G. Overbeek, J . P h y s . C h e m . , 64 , 1675 (1960).(11) G. W . M orey, R . O. Fournier, and J. J. Rowe, G e o c h i m . C o s m o c h i m . A c t a , 26, 1029 (1962).(12) (a) P. F. H olt and D . T. King, J. C h e m . S o c . , 773 (1955); (b) S. S. J0rgensen, to be published.(13) A. T . Jensen, C. J. Wphlk, K . Drenck, and E. K . Andersen, D a n i s h N a t l . I n s t . B l d g . R e s . A c a d . T e c h . S e i . C o m m . A l k a l i R e a c t i o n s C o n c r e t e , P r o g r . R e p t . , D l , 37 (1957).(14) E. Jensen and H. M . Hansen, S o i l S e i . , 92, 94 (1961).(15) M . L. Jackson, “ Soil Chemical Analysis," Prentice-HallInc., Englewood Cliffs, N. J., 1958, p 65.
The Journal of Physical Chemistry
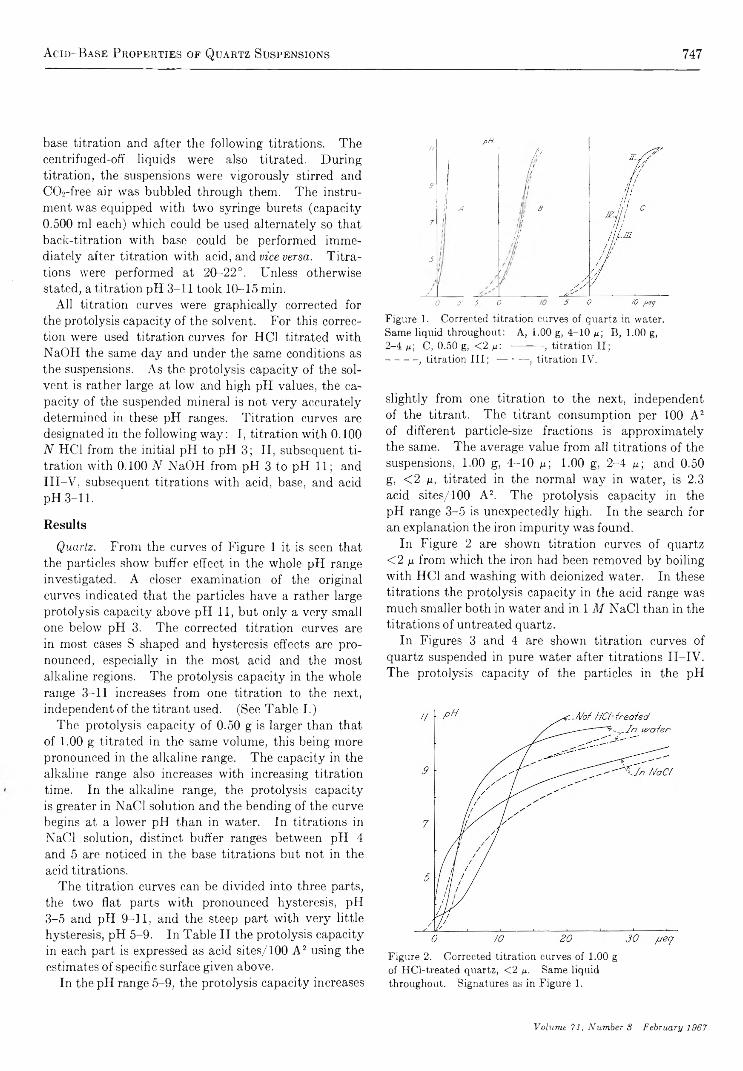
A c id - B a s e P r o p e r t ie s o f Q u a r t z S u s p e n s io n s 747
base titration and after the following titrations. The centrifuged-off liquids were also titrated. During titration, the suspensions were vigorously stirred and C 02-free air was bubbled through them. The instrument was equipped with two syringe burets (capacity 0.500 ml each) which could be used alternately so that back-titration with base could be performed immediately after titration with acid, and vice versa. Titrations were performed at 20-22°. Unless otherwise stated, a titration pH 3-11 took 10-15 min.
All titration curves were graphically corrected for the protolysis capacity of the solvent. For this correction were used titration curves for HC1 titrated with NaOH the same day and under the same conditions as the suspensions. As the protolysis capacity of the solvent is rather large at low and high pH values, the capacity of the suspended mineral is not very accurately determined in these pH ranges. Titration curves are designated in the following way: I, titration with 0.100 N HC1 from the initial pH to pH 3; II, subsequent titration with 0.100 N NaOH from pH 3 to pH 11; andIII-V , subsequent titrations with acid, base, and acid pH 3-11.
ResultsQuartz. From the curves of Figure 1 it is seen that
the particles show buffer effect in the whole pH range investigated. A closer examination of the original curves indicated that the particles have a rather large protolysis capacity above pH 11, but only a very small one below pH 3. The corrected titration curves are in most cases S shaped and hysteresis effects are pronounced, especially in the most acid and the most alkaline regions. The pro to lysis capacity in the whole range 3-11 increases from one titration to the next, independent of the titrant used. (See Table I.)
The protolysis capacity of 0.50 g is larger than that of 1.00 g titrated in the same volume, this being more pronounced in the alkaline range. The capacity in the alkaline range also increases with increasing titration time. In the alkaline range, the protolysis capacity is greater in NaCl solution and the bending of the curve begins at a lower pH than in water. In titrations in NaCl solution, distinct buffer ranges between pH 4 and 5 are noticed in the base titrations but not in the acid titrations.
The titration curves can be divided into three parts, the two flat parts with pronounced hysteresis, pH3-5 and pH 9-11, and the steep part with very little hysteresis, pH 5-9. In Table II the protolysis capacity in each part is expressed as acid sites/100 A 2 using the estimates of specific surface given above.
In the pH range 5-9, the protolysis capacity increases
upH
/ ¡fr
h9 In
4 ! e7
l1
ill
i f
5 / hi !
/0 5 5 0
Figure 1. Corrected titration curves of quartz in water. Same liquid throughout: A, 1.00 g, 4-10 n ; B, 1.00 g,2-4 m; C, 0.50 g, <2 y . : --------- , titration II;--------- , titration III ; ■— • —■, titration IV.
slightly from one titration to the next, independent of the titrant. The titrant consumption per 100 A2 of different particle-size fractions is approximately the same. The average value from all titrations of the suspensions, 1.00 g, 4-10 \x; 1-00 g, 2-4 /x; and 0.50 g, <2 tx, titrated in the normal way in water, is 2.3 acid sites/100 A2. The protolysis capacity in the pH range 3-5 is unexpectedly high. In the search for an explanation the iron impurity was found.
In Figure 2 are shown titration curves of quartz <2 ix from which the iron had been removed by boiling with HC1 and washing with deionized water. In these titrations the protolysis capacity in the acid range was much smaller both in water and in 1 M NaCl than in the titrations of untreated quartz.
In Figures 3 and 4 are shown titration curves of quartz suspended in pure water after titrations II-IV. The protolysis capacity of the particles in the pH
Figure 2. Corrected titration curves of 1.00 g of HCl-treated quartz, <2 p . Same liquid throughout. Signatures as in Figure 1.
Volum e 71 f N um ber 3 February 1967

748 S. STORGAARD J0RGENSEN AND À . TOVBORG JENSEN
Table I: Titration of Quartz Suspensions. Same Liquid Throughout. Acid-Base Properties in the pH Range 3-11
Acid/base consumption (cor)Initial ---------- mequiv/100 g in titrations------- -—
pH I II III IV
1.00 g, 10-20 ft, in water 5.65 0.17 0.321.00 g, 4-10 ft, in water 5.30 0.06 0.27 0.561.00 g, 2-4 ft, in water 6.02 0.38 0.95 1.35 1.480.50 g, <2 ft, in water 7.10 0.50 3 13 4.40 4.451.00 g, <2 ft, in water 6.93 1.25 2.05 2.651.00 g, <2 ft, in water, 1.5 hr 6.85 0.91 3.501.00 g, 2-4 ft, in 1 M NaCl 4.62 0.16 1.35 1.75 1.90
Table II: Protolysis Capacity of Quartz Suspensions in Relation to Estimated Surface Areas
-Acid sites/100 A2-
II—pH 3-5------
III IV II— pH 5-9----
III IV II—pH 9-11—
III IV
1.00 g, 4-10 ft, in water 1.9 5 . 9 1 . 7 2 . 5 0 .6 0 . 5
1.00 g, 2-4 n, in water 1.7 4 . 9 4 . 2 2 . 3 2 . 6 2.8 2.2 1 . 3 2.50.50 g, <2 n, in water 1.4 3 . 6 3 . 1 1 . 9 2 . 3 2.3 2 .6 2 . 5 3.11.00 g, <2 n, in water 1.1 2 . 6 1 . 3 1 . 3 1.5 1 . 1
1.00 g, < 2 ft, in water, 1.5 hr 0.8 (?) 1 . 6 4.31.00 g, 2-4 ft, in 1 M NaCl 1.3 3 . 4 2 . 7 3 . 2 3 . 6 3.8 4.3 4 . 3 5.8
Figure 3. Corrected titration curves of 1.00 g of quartz, 2-4 f t , in water. Liquid centrifuged off and particles suspended in fresh water after each titration.
range 5-9 is equivalent to 1.3 acid sites/100 A 2. In the alkaline range, all the particle suspensions and all the liquids have a high protolysis capacity. In the acid range (pH 3-5), the protolysis capacity is “ brought into solution” during titrations.
In the titration of quartz from which a surface layer of approximately 1100 A had been removed by treatment with HF, the protolysis capacity in titration II was about 40% of that of untreated quartz. In subsequent
Figure 4. Corrected titration curves of centrifuged-off liquids: A, after titration II; B, after titration III; C, after titrationIV ; --------- , base titration (in the cases A and C afteracid titration and removal of absorbed CO2) ; --------- ,back-titration with acid; — • —, subsequent base titration.
titrations of suspensions and centrifuged-off liquids there was no significant acid or base consumption.
Vitreous Silica. Titration data are given in Table III and Figure 5. Protolysis capacities are of the same magnitude as those of the corresponding quartz fractions, and the curves are very similar to those of HCl-treated quartz. The only appreciable difference is found in the most alkaline range, where the acid
The Journal of Physical Chemistry

A c id - B a s e P r o p e r t ie s o f Q u a r t z S u s p e n s io n s 749
Table III: Titration of Suspensions of Vitreous Silica. Same Liquid Throughout. Acid-Base Properties in the pH Range 3-11
A cid—base consum ption (cor)In itia l --------m eq u iv/10 0 g in titrations--------
pH I h I I I IV
1.00 g, 11.7-23.4 m, in water 5.30 — -—-—-—Not detectable——;——-1.00 g, 4.7-11.7 ix , in water 5.17 0 0.291.00 g, 2.34-4.7 i x , in water 5.10 0 0.70 0.900.75 g, <2.34 ix , in water 5.88 0.12 2.53 3.05 3.60“1.00 g, 2.34-4.7 ix , in 1 M NaCl 5.33 0 1.00 1.53 1.80
“ Titrated to pH 10.7 only.
Table IV: Titration of Suspensions of Flint. Same Liquid Throughout. Acid-Base Properties in the pH Range 3-11
A cid—base consum ption (cor)In itia l
pH I—------- mequiv/100 g m
I Ititrations----------
I I I IV
1.00 g, 10.2-20.3 i x , in water 6.08 0.14 2.25 2.620.30 g, 4.1-10.2 i x , in water 4.85 0.30 2.30 3.16 3.500.15 g, 2.03-4.1 i x , in water 5.04 0.67 2.40 5.000.15 g, <2.03 i x , in water 5.78 0.73 5.16 6.60 7.260.15 g, 2.03-4.1 i x , in water, 1.5 hr 6.12 0.40 5.330.15 g, 2.03-4.1 a , in 1 M NaCl 5.28 0 9.0 9.0
Figure S. Corrected titration curves of vitreous silica in water: Same liquid throughout: A, 1.00 g, 2.34-4.7 ¡ x ;
B, 0.75 g, <2.34 ix . Signatures as in Figure 1.
titration curves of vitreous silica have an inflection point with maximum buffer capacity just below pH10. In the titrations in NaCl solution, this inflection is also seen in the base titrations.
Flint. Titration data are given in Table IV and Figure 6. The protolysis capacity of this flint is much larger than those of the corresponding quartz and vitreous silica fractions and there is only a small increase in protolysis capacity with decreasing particle size. The general shape of the titration curves of different fractions is the same, but there are smaller differences between the curves obtained in water and 1 M NaCl than in the case of quartz and vitreous silica. In all flint titrations, the protolysis capacity in the
Figure 6. Corrected titration curves of flint. Same liquid throughout: A, 0.15 g, <2.03 /x, in water: B, 0.15 g,2.03-4.1 n , in 1 M NaCl. Signatures as in Figure 1.
acid range was low; in titration II there was no base consumption at all below pH 4.5.
D i s c u s s i o n
The protolysis capacity of quartz and of vitreous silica was shown to be confined to outer particle surfaces. The flint titrations indicated the presence of some kind of inner surfaces too. From X-ray line broadening, the total specific surface of the crystals is estimated to
Volume 71 f Number 3 February 1967

750 S . S t ORGAARD J0RGENSEN AND A . TOVBORG JENSEN
be 70 m2/g , which is 22 times that of the finest quartz fraction. This whole surface cannot be accessible to the solution in these fast titrations. The protolysis capacity is at most only nine times that of the corresponding quartz fraction. The smaller the particles, however, the greater the part of the inner surfaces coming into contact with the solution. This explains the increase in protolysis capacity with decreasing particle size.
The protolysis capacity of quartz is due partly to the surface as such and partly to material dissolving during titration. If the titration curve of the surface as such is linear in the whole pH range 3-11 with the same slope as in the range 5-9, the density of acid sites on the surface is 2.6/100 A 2. This figure, which is within the range of surface hydroxyl densities found on silica, is only a rough estimate. The particles are not spherical as assumed in the calculation of specific surface areas, and the protolysis capacity of the surface might be larger in the alkaline range.16
The major part of the protolysis capacity in the alkaline range is assumed to be due to dissolution of the surface layer as monosilicic acid, H4SiC>4. The titrated solutions are very far from saturation, both with respect to amorphous silica and quartz. Therefore, the dissolution is going on during all titrations. The protolysis capacity in the pH range 3-5 was ascribed to the iron impurity. This might be present either as iron adsorbed on the quartz surface or as soluble silica-
iron oxide complexes. The existence of such complexes was indicated by the experiments of Hazel, et al.17
From the titrations of HF-treated quartz, it is concluded that the untreated quartz had a surface layer much more reactive toward acids and bases than a “ pure” quartz surface. It has been found9'10 that crushed quartz has a surface layer a few hundred angstroms thick which is not completely amorphous but has a somewhat “ loosened” quartz structure. This layer can be removed by hydrofluoric acid. What has been reported on in the present paper is not the acid- base properties of the surface of a perfect quartz crystal but those of a disturbed quartz surface. This kind of surface might well be much more common in nature than the perfect crystal surface.
Acknowledgments. The authors are deeply indebted to Dr. K. J. Pedersen for helpful discussions during the preparation of the manuscript. A research grant toS. S. J. from The Danish Government Fund for Scientific and Industrial Research is gratefully acknowledged. The titration equipment was placed at our disposal by The Carlsberg Foundation Grant to the Royal Veterinary and Agricultural College, Copenhagen. 16 17
(16) W . M . Heston, R . K . Her, and G. W . Sears, P h ys. Chem., 64, 147 (1960).(17) F. Hazel, R . TJ. Schock, and M . Gordon, J . A m . Chem. Soc. 71, 2256 (1949).
The Journal of Physical Chemistry

Ionization of D iketocyclobutenediol 751
Ionization of Diketocyclobutenediol and Its Metal Complexes
b y D . T . I r e l a n d 1 a n d H . F . W a l t o n
U niversity o f Colorado, Boulder, Colorado 80302 (Received J u ly 21, 1966)
The second ionization constant of diketocyclobutenediol was measured by potentiometric titration and found to be 6.2 X 10⁻⁴ in 0.1 M KC1; it decreased slightly with rising temperature. The value of Ki is about 2 X 10~2. Ultraviolet absorption spectra confirmed the value of Ki. They did not permit determining Ki, but gave evidence of protonated species at high acidities. Preliminary measurements of the solubility of the iron(III) and copper(II) complexes were made. They indicate the formation of soluble anionic complexes of Fe(III).
The compound diketocyclobutenediol, C4H2O4
0 = C — C— OHI I
0 = C — C— OH
also known as “ squaric acid,” was first prepared by Cohen, Lâcher, and Park,2 who noted that it was a dibasic acid with pKi about 3. They also noted the colored complexes formed with certain metal ions, especially Fe(III).
We have now determined the second ionization constant, Ki, with fair accuracy and made an estimate of K\. We have studied the ultraviolet absorption spectrum at various acidities and made preliminary measurements of the solubilities of its compounds with iron(III) and copper(II).
E x p e r i m e n t a l S e c t i o n
Preparation of Diketocyclobutenediol. We used the procedure of Park, Cohen, and Lâcher,3 starting with trifluorochloroethylene, converting it to 1,2-diethoxy-3,3,4,4-tetrafluorocyclobutene4 5'6 and hydrolyzing this with 50% sulfuric acid at 100°. The acid crystallized as a white solid. It was impure. Repeated recrystallization from hot water was only moderately effective in purifying it. Recrystallization of the potassium salt from aqueous methanol, followed by reconversion to the acid by cation exchange, was somewhat more efficient, but the best method of purification was absorption of the squarate ion from aqueous solution on a strong-base quaternary anion-exchange resin, Dowex- 1, in the chloride form. The acid was eluted by warm 0.5 M hydrochloric acid and crystallized by evaporating
the solution. One recrystallization from water, followed by drying in a vacuum desiccator, gave a product which assayed 99% purity or better by titration with standard base. The titration curve and absorbance curves here presented were obtained with acid purified in this way.
Potentiometric Titration. To determine the ionization constants, quantities of 0.5-1 mmole of squaric acid were dissolved in 50 ml of 0.10 M potassium chloride solution and titrated with carbonate-free potassium hydroxide using glass and calomel electrodes and a Beckman Model G pH meter. The titration was done in a three-necked 200-ml flask immersed in a constant temperature bath. A stream of nitrogen was passed in some tests to exclude atmospheric carbon dioxide. The standard of pH used to calibrate the cell was 0.050 M potassium acid phthalate, whose pH has been established by Bates6 over a wide temperature range. Potassium tetroxalate was used as a secondary standard. Titrations were done at 0, 25, and 50°. Three different samples of acid, purified in the three different ways described above, gave pK2 values agreeing to 0.05 unit (see Table I).
(1) Based on the M.S. Thesis of D. T. Ireland, University of Colorado, Boulder, Colo., 1963.(2) S. Cohen, J. R. Lacher, and J. D. Park, J. A m . Chem. Soc., 81, 3480 (1959).(3) J. D. Park, S. Cohen, and J. R. Lacher, ibid.. 84, 2919 (1962).(4) J. D. Park, M. L. Sharrah, and J. R. Lacher, ibid., 71, 2337 (1949).(5) S. Cohen, Thesis, University of Colorado, Boulder, Colo., 1959.(6) R. G. Bates, ''Determination of pH: Theory and Practice,”John Wiley and Sons, Inc., New York, N. Y., 1964.
Volume 71, Number S February 1967
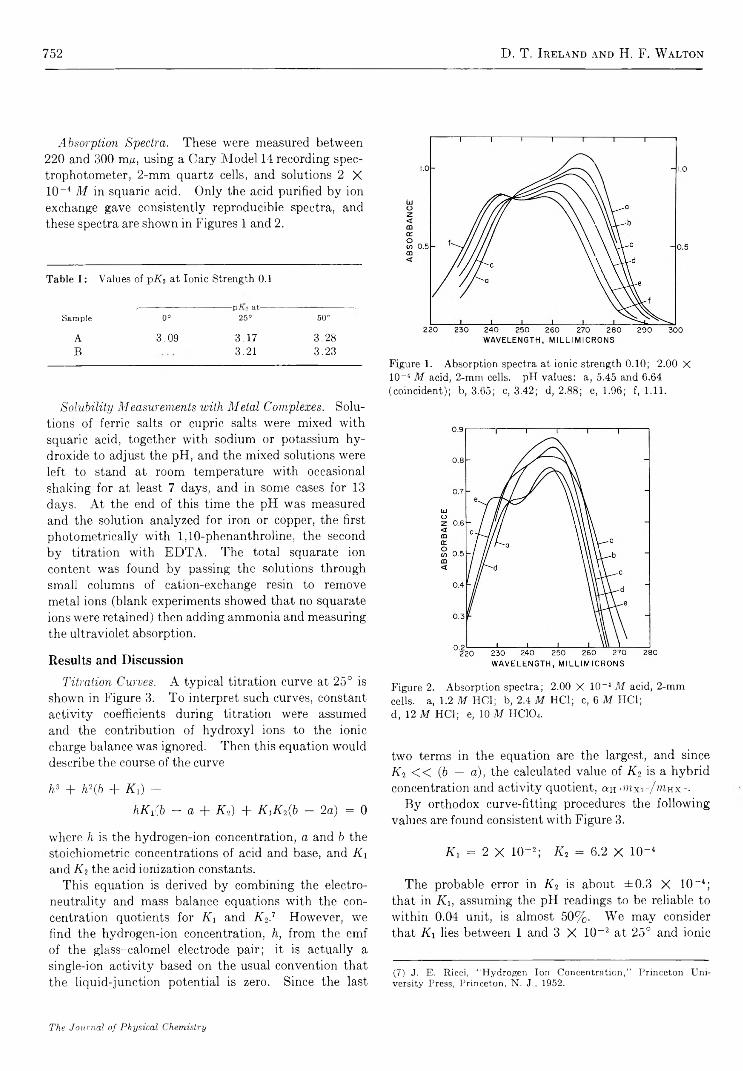
752 D. T. Ireland and H. F. Walton
Absorption Spectra. These were measured between 220 and 300 m/x, using a Cary Model 14 recording spectrophotometer, 2-mm quartz cells, and solutions 2 X 10⁻⁴ M in squaric acid. Only the acid purified by ion exchange gave consistently reproducible spectra, and these spectra are shown in Figures 1 and 2.
Table I: Values of p K i at Ionic Strength 0.1
-----------------------------pivo a t---------Sam ple 0° 25° 50°
A 3.09 3.17 3.28B 3.21 3.23
Solubility Measurements with Metal Complexes. Solutions of ferric salts or cupric salts were mixed with squaric acid, together with sodium or potassium hydroxide to adjust the pH, and the mixed solutions were left to stand at room temperature with occasional shaking for at least 7 days, and in some cases for 13 days. At the end of this time the pH was measured and the solution analyzed for iron or copper, the first photometrically with 1,10-phenanthroline, the second by titration with EDTA. The total squarate ion content was found by passing the solutions through small columns of cation-exchange resin to remove metal ions (blank experiments showed that no squarate ions were retained) then adding anrmonia and measuring the ultraviolet absorption.
R e s u l t s a n d D i s c u s s i o n
Titration Curves. A typical titration curve at 25° is shown in Figure 3. To interpret such curves, constant activity coefficients during titration were assumed and the contribution of hydroxyl ions to the ionic charge balance was ignored. Then this equation would describe the course of the curve
h3 + h2(b + K{] -hKi'fi - a + K t) + K xK2{b - 2a) = 0
where h is the hydrogen-ion concentration, a and b the stoichiometric concentrations of acid and base, and K x and K2 the acid ionization constants.
This equation is derived by combining the electroneutrality and mass balance equations with the concentration quotients for K x and K i.7 However, we find the hydrogen-ion concentration, h, from the emf of the glass-calomel electrode pair; it is actually a single-ion activity based on the usual convention that the liquid-junction potential is zero. Since the last
Figure 1. Absorption spectra at ionic strength 0.10; 2.00 X 10⁻⁴ M acid, 2-mm cells. pH values: a, 5.45 and 6.64 (coincident); b, 3.65; c, 3.42; d, 2.88; e, 1.96; f, 1.11.
Figure 2. Absorption spectra; 2.00 X 10~4 M acid, 2-mm cells, a, 1.2 M HC1; b, 2.4 M IIC1; c, 6 M HC1; d, 12 M HC1; e, 10 M HC104.
two terms in the equation are the largest, and since K i « (b — a), the calculated value of K 2 is a hybrid concentration and activity quotient, an«xi--/m H x-.
By orthodox curve-fitting procedures the following values are found consistent with Figure 3.
K x = 2 X 10⁻²; K i = 6.2 X 10“ 4
The probable error in K2 is about ±0.3 X 10~4; that in Ki, assuming the pH readings to be reliable to within 0.04 unit, is almost 50%. We may consider that Ki lies between 1 and 3 X 10⁻² at 25° and ionic
(7) J. E. Ricci, “ Hydrogen Ion Concentration,” Princeton University Press, Princeton, N. J., 1952.
The Journal of Physical Chemistry
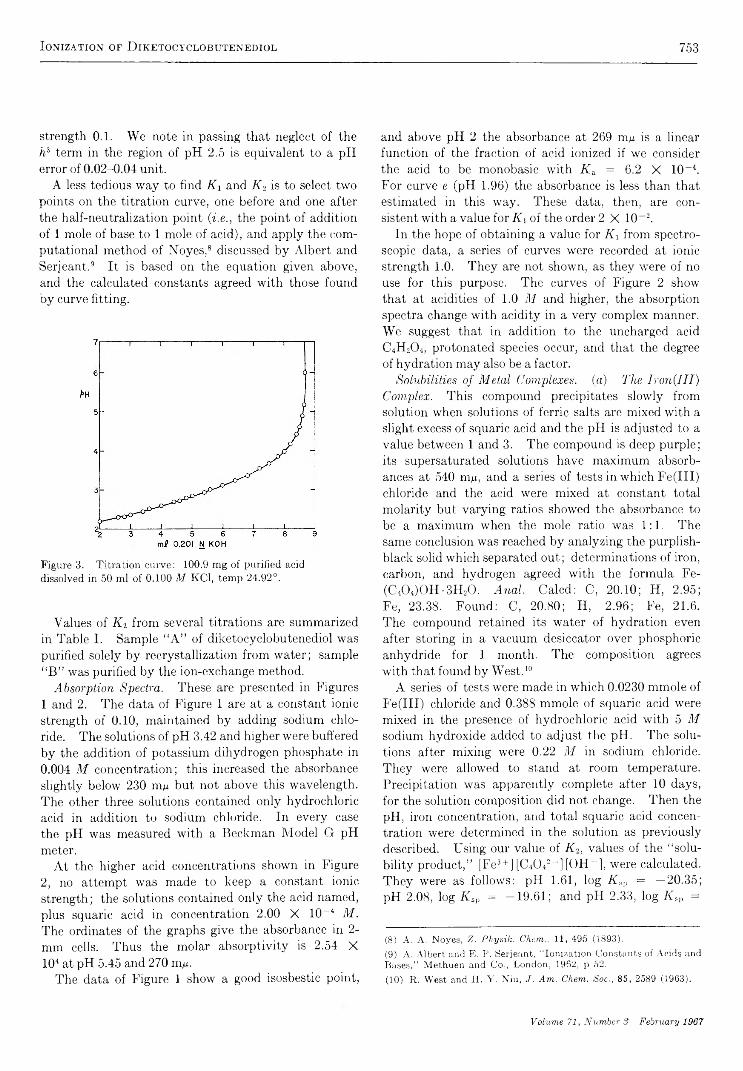
Ionization of D iketocyclobutenediol 753
strength 0.1. We note in passing that neglect of the h3 term in the region of pH 2.5 is equivalent to a pH error of 0.02-0.04 unit.
A less tedious way to find K\ and K2 is to select two points on the titration curve, one before and one after the half-neutralization point (be., the point of addition of 1 mole of base to 1 mole of acid), and apply the computational method of Noyes,8 discussed by Albert and Serjeant.9 It is based on the equation given above, and the calculated constants agreed with those found by curve fitting.
Figure 3. Titration curve: 100.9 mg of purified acid dissolved in 50 ml of 0.100 M KC1, temp 24.92°.
Values of K 2 from several titrations are summarized in Table I. Sample “ A” of diketocyclobutenediol was purified solely by recrystallization from water; sample “ B” was purified by the ion-exchange method.
Absorption Spectra. These are presented in Figures 1 and 2. The data of Figure 1 are at a constant ionic strength of 0.10, maintained by adding sodium chloride. The solutions of pH 3.42 and higher were buffered by the addition of potassium dihydrogen phosphate in 0.004 M concentration; this increased the absorbance slightly below 230 m,u but not above this wavelength. The other three solutions contained only hydrochloric acid in addition to sodium chloride. In every case the pH was measured with a Beckman Model G pH meter.
At the higher acid concentrations shown in Figure 2, no attempt was made to keep a constant ionic strength; the solutions contained only the acid named, plus squaric acid in concentration 2.00 X 10 " 4 M. The ordinates of the graphs give the absorbance in 2- mm cells. Thus the molar absorptivity is 2.54 X 10⁴ at pH 5.45 and 270 m/i.
The data of Figure 1 show a good isosbestic point,
and above pH 2 the absorbance at 269 m/i is a linear function of the fraction of acid ionized if we consider the acid to be monobasic with K & = 6.2 X 10"4. For curve e (pH 1.96) the absorbance is less than that estimated in this way. These data, then, are consistent with a value for K\ of the order 2 X 10"2.
In the hope of obtaining a value for Ki from spectroscopic data, a series of curves were recorded at ionic strength 1.0. They are not shown, as they were of no use for this purpose. The curves of Figure 2 show that at acidities of 1.0 M and higher, the absorption spectra change with acidity in a very complex manner. We suggest that in addition to the uncharged acid C4H2O4, protonated species occur, and that the degree of hydration may also be a factor.
Solubilities of Metal Complexes, (a) The Iron{III) Complex. This compound precipitates slowly from solution when solutions of ferric salts are mixed with a slight excess of squaric acid and the pH is adjusted to a value between 1 and 3. The compound is deep purple; its supersaturated solutions have maximum absorbances at 540 mji, and a series of tests in which Fe(III) chloride and the acid were mixed at constant total molarity but varying ratios showed the absorbance to be a maximum when the mole ratio was 1:1. The same conclusion was reached by analyzing the purplish- black solid which separated out; determinations of iron, carbon, and hydrogen agreed with the formula Fe- (C404)0H -3H 20. Anal. Calcd: C, 20.10; H, 2.95; Fe, 23.38. Found: C, 20.80; H, 2.96; Fe, 21.6. The compound retained its water of hydration even after storing in a vacuum desiccator over phosphoric anhydride for 1 month. The composition agrees with that found by West.10
A series of tests were made in which 0.0230 mmole of Fe(III) chloride and 0.388 mmole of squaric acid were mixed in the presence of hydrochloric acid with 5 M sodium hydroxide added to adjust the pH. The solutions after mixing were 0.22 M in sodium chloride. They were allowed to stand at room temperature. Precipitation was apparently complete after 10 days, for the solution composition did not change. Then the pH, iron concentration, and total squaric acid concentration were determined in the solution as previously described. Using our value of K 2, values of the “ solubility product,” [Fe3 + ] [C4042"] [OH~], were calculated. They were as follows: pH 1.61, log K sp = —20.35; pH 2.08, log K sp = —19.61; and pH 2.33, log K sp =
(8) A. A. Noyes, Z. Physilc. Chem., 11, 495 (1893).(9) A. Albert and E. P. Serjeant, “ Ionization Constants of Acids and Bases,” Methuen and Co., London, 1962, p 52.(10) It. West and H. Y. Niu, J . Am. Chem. Soc., 85, 2589 (1963).
Volume 71, Number 3 February 1967
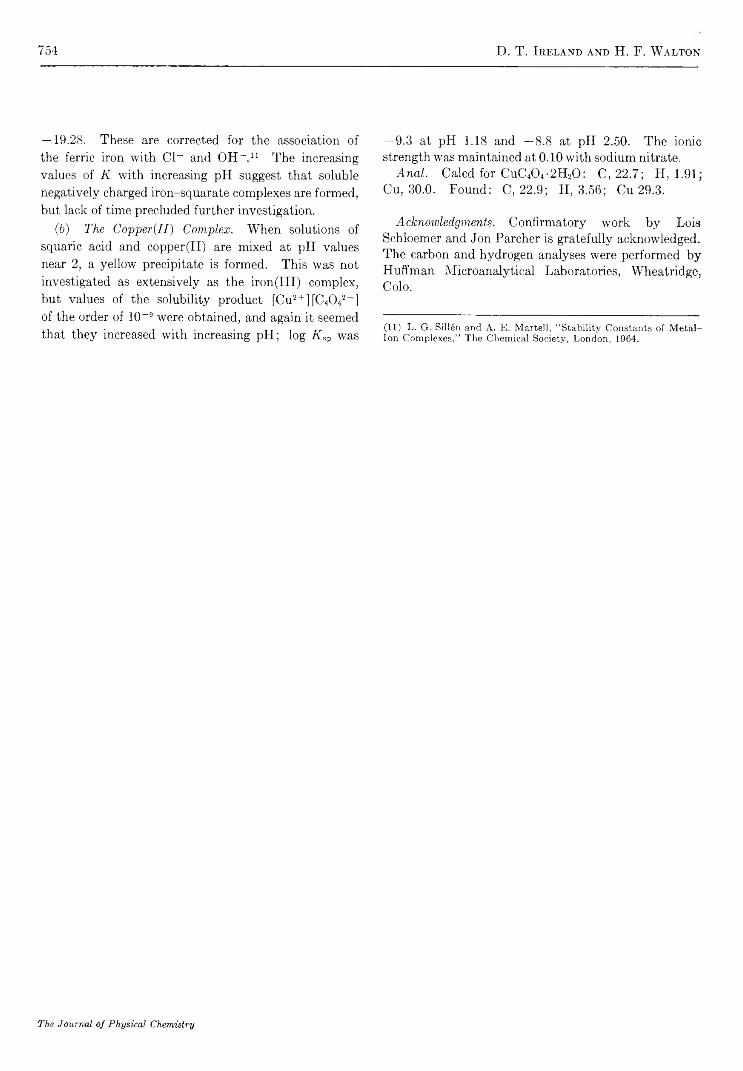
754 D. T. Ireland and H. F. W alton
— 19.28. These are corrected for the association of the ferric iron with Cl- and OH- .11 The increasing values of K with increasing pH suggest that soluble negatively charged iron-squarate complexes are formed, but lack of time precluded further investigation.
(b) The Copper{II) Complex. When solutions of squaric acid and copper(II) are mixed at pH values near 2, a yellow precipitate is formed. This was not investigated as extensively as the iron(III) complex, but values of the solubility product [Cu2+][C4(V~] of the order of 10-9 were obtained, and again it seemed that they increased with increasing pH; log K sp was
— 9.3 at pH 1.18 and —8.8 at pH 2.50. . The ionic strength was maintained at 0.10 with sodium nitrate.
Anal. Calcd for CuC404-2H20 : C, 22.7; H, 1.91; Cu, 30.0. Found: C, 22.9; H, 3.56; Cu 29.3.
Acknowledgments. Confirmatory work by Lois Schloemer and Jon Parcher is gratefully acknowledged. The carbon and hydrogen analyses were performed by Huffman Microanalytical Laboratories, Wheatridge, Colo.
(11) L. G. Sill6n and A. E. Martel 1, “ Stability Constants of Metal- Ion Complexes,” The Chemical Society, London, 1964.
The Journal of Physical Chemistry

R adiolysis of Ethanol 755
The Radiolysis of Ethanol. V. Reactions of the Primary
Reducing Species in the Liquid Phase1 2
b y J . C . R u s s e l l a n d G . R . F r e e m a n
Chem istry Departm ent, U niversity o f Alberta, Edm onton, Alberta, Canada (Received Ju ne ¡27, 1966)
A study has been made of the effects of temperature, acid, and nitrous oxide on the yields of the hydrogen precursors in the y radiolysis of liquid ethanol. The yields of the free-ion solvated electrons and of those that undergo geminate recombination have been calculated and compared to the experimental results. The yields of the various reducing species at 25° were (?(H) = 2.0, G(e_soiv)fi = 1-2, ^(geminate recombination) = 1.9, (t(X) = 0.8, and (r(Y) = 1.0. Species X reacts with acid to form hydrogen, but its identity is unknown. Species Y forms hydrogen at high temperatures and it might be an excited molecule.
I n t r o d u c t i o n
Recent studies of the radiolysis of liquid ethanol have shown that there are at least three precursors of hydrogen.2,3 Furthermore, the hydrogen yield is increased by the addition of an inorganic acid to the ethanol before radiolysis.2a This effect has been attributed to scavenging of solvated electrons by the acid.2a The yield of solvated electrons (free ions) in ethanol has been estimated to be G(e- soiv)fi = 0.8.2b In another study3 4 5 it was estimated that G(e“ soiv)fi = 0.9 plus (7(e- )sp = 0.75 for electrons scavenged in the spur.
Nitrous oxide in water is known to react with hydrated electrons with a high specific rate (fce-+N2o = 7 X 10⁹ M~x sec-1).4,6 Nitrous oxide reacts with hydrogen atoms at a much slower rate (/ch+n2o = 2 X 10⁶ M~x sec-1).6 Thus in a medium such as ethanol, where the bulk of the medium reacts rapidly with hydrogen atoms (feH+c.HiOH = 1-5 X 10⁷ M~l sec-1),7 the reaction of hydrogen atoms with nitrous oxide is probably of no consequence.
The great advantage of nitrous oxide as a scavenger is that reaction with an electron gives rise to nitrogen which is easily measured and provides a direct measure of the extent of reaction.
Changing the temperature of ethanol over a wide range drastically alters the internal characteristics, such as the viscosity and dielectric constant, of the liquid. These changes might be expected to cause some
variation in the yields or reactions of the hydrogen precursors.
The present study was initiated in order to obtain a more accurate measure of the yields of the hydrogen precursors, and in particular to compare the calculated and experimental yields of free-ion solvated electrons.
E x p e r i m e n t a l S e c t i o n
Apparatus. The 10-ml samples were irradiated in Pyrex glass cells with a 38-mm o.d. bulb and a bulbous, easily cleaned break-seal. They were filled through a side arm which was sealed off after filling. Such cells, if strain free, will contain a pressure of 16 atm. The total volume of each cell was approximately 30 ml. The cells were cleaned with permanganic acid, rinsed with a dilute solution of H N 03 and H2O2, and rinsed repeatedly with triply distilled water. They were then
(1) This work received financial support from the National Research Council of Canada.(2) (a) G. E. Adams and R. D. Sedgewick, Trans. F araday Soc., 60, 865 (1964); (b) J. J. Myron and G. R. Freeman, Can. J . Chem ., 43, 381 (1965).(3) E. Hayon and M. Moreau, J. P hys. Chem ., 69, 4053 (1965).(4) F. S. Dainton and D. B. Peterson, P roc. R oy . Soc. (London), A267, 443 (1962).(5) S. Gordon, E. J. Hart, M. S. Matheson, J. Rabani, and J. K. Thomas, D iscassioris Faraday Soc., 36, 193 (1963).(6) F. S. Dainton and D. C. Walker, P roc . R oy. Soc. (London), A285, 339 (1965).(7) J. P. Sweet and J. Thomas, J . P h ys . Chem ., 68, 1363 (1964).
Volume 71, Number 3 February 1967

756 J. C. R ussell and G. R. Freeman
evacuated, heated with a flame, and pumped under vacuum for 1 hr before filling.
Irradiations were performed in a Gammacell 220 (Atomic Energy of Canada Ltd.) containing 60Co. A glass dewar vessel fixed with epoxy resin to a metal positioning plate was used to hold the samples, which were fixed in a metal jig. All irradiations were performed with a liquid thermostating agent in the dewar; water was used for temperatures between 0 and 90°, ethanol was used for temperatures below 0°, and glycerol was used for temperatures above 90°. The temperature of the sample during any given irradiation was constant within ±1°.
The dose rate was adjusted for the slight difference caused by the differing electron densities of the baths at the various temperatures. The dose rate was approximately 5 X 10¹⁷ ev/ml min in ethanol and the total dose was 1.5 X 10¹⁷ ev/ml.
The yield of gaseous products was determined by refluxing the sample in a vacuum line and passing the gases so obtained through two traps cooled by liquid nitrogen. The pressure and volume were then measured in a Teopler-McLeod gauge and the gases analyzed by gas chromatography. A 2.5-m molecular sieve column, helium carrier gas, and a thermal conductivity detector were used.
The dielectric constant of ethanol was measured at different temperatures using a variable capacitor mounted in a stainless steel cell which held the liquid under measurement. The variable capacitor permitted the measurement of the stray capacitance of the system. A modified General Radio Type 1304-B beat frequency audio generator, with the experimental cell as an external frequency-determining capacitor, was used as an oscillator. The change in capacitance of the experimental cell was determined with a General Radio Type 1422-D standard variable capacitor connected in parallel. The oscillator frequency was maintained at 60 cps and monitored with an oscilloscope. The temperature of the cell was measured with an iron-con- stantan thermocouple in contact with the liquid.
Materials and Sample Preparation. Benzene-free absolute ethanol from the Reliance Chemical Co. was used. In order to remove the trace amounts of acetaldehyde present, 2 1. of the alcohol was refluxed for 2 hr with 3 g of 2,4-dinitrophenylhydrazine and 2 ml of concentrated sulfuric acid. It was then distilled through a column packed with glass helices into a reservoir attached to a vacuum line. During the refluxing and distillation, the alcohol and distillation system were protected from atmospheric oxygen and moisture by a stream of dry nitrogen. The purified ethanol was degassed and stored under vacuum in a Pyrex vessel.
Samples were prepared by vacuum distilling ethanol from the reservoir into a measuring tube and then redistilling it into the sample cell through the side arm. Nitrous oxide and/or hydrogen chloride were added by condensation onto the frozen sample, if required, and the cell was sealed off with the sample maintained at -1 9 6 °.
Nitrous oxide was purified by trap-to-trap sublimation in a vacuum line, discarding the first and last portions, and stored in a Pyrex reservoir. It was always recondensed and pumped upon at —196° before use. Hydrogen chloride was subjected to a similar procedure and also stored in a Pyrex bulb.
ResultsThe yield of hydrogen at 25° and 1.5 X 10¹⁷ ev/ml
was found to be (?(H2) = 5.1 ± 0.1.Figures 1-4 show the effect of the concentration of
nitrous oxide on the yields of nitrogen and hydrogen. Those results marked “ acidic” refer to experiments in which a low concentration (between 5 X 10“ 6 and 5 X 15-4 M) of hydrogen chloride was also added. The values for G{N2) have been corrected by a method which will be discussed later. The lines through the nitrogen yields were calculated theoretically following a method published elsewhere8 and will be discussed later. The other lines were drawn to suit the experimental points.
A correction to the nitrogen yield was made for the direct radiolysis of nitrous oxide in the high concentration solutions. It was assumed that the amount of energy absorbed by the nitrous oxide was proportional to its electron fraction in the solution and that G(N2) = 10 for direct radiolysis.9
The concentration of nitrous oxide in samples at — 112° was calculated assuming that all the nitrous oxide dissolved at that temperature. At 25° data available10 give a = 2.57, where a = (273.1/T)(C'iiq/ Cgas), and Cnq and Cgas are the concentrations of nitrous oxide in the liquid and gas phases, respectively. This permits the calculation of the concentration of nitrous oxide in the sample if the volume of the cell is known. The cell volumes were measured at the conclusion of each analysis. The available data on the solubility of nitrous oxide in ethanol only extend from 18 to 36°. However, it was found that a plot of a vs. 1/T gives a straight line, and this was extrapolated to give estimates for a at 90 and 145°. The values used were a9o° = 1.0 and «145° = 0.55. An error in these
(8) G. R. Freeman, J. Chem. Phys., in press.(9) F. T. Jones and T. J. Sworski, J. Phys. Chem., 70, 1546 (1966).(10) “ International Critical Tables,” McGraw-Hill Book Co., New York, N. Y., 1926.
The Journal of Physical Chemistry
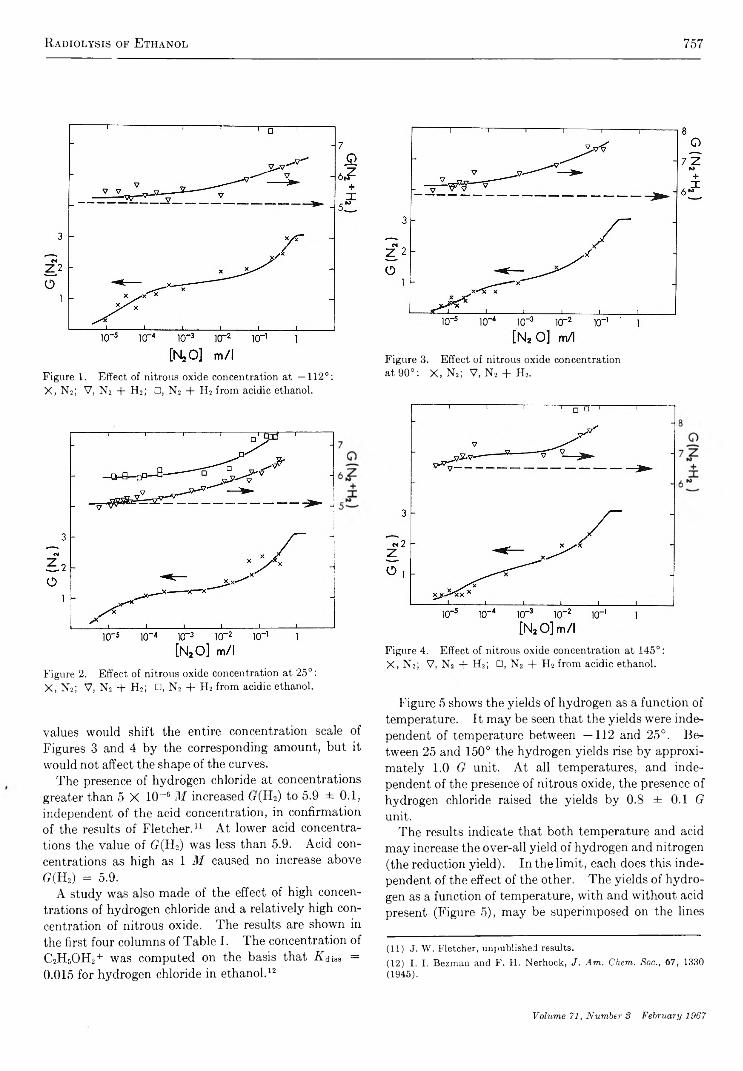
R adiolysis of Ethanol 757
Figure 1. Effect of nitrous oxide concentration at —112°: X, N2; V, N2 + H2; □, N2 + H2 from acidic ethanol.
Figure 2. Effect of nitrous oxide concentration at 25°: X, N2; V, N2 + H2; □, N2 + H2 from acidic ethanol.
values would shift the entire concentration scale of Figures 3 and 4 by the corresponding amount, but it would not affect the shape of the curves.
The presence of hydrogen chloride at concentrations greater than 5 X 10~6 M increased (j (H2) to 5.9 ± 0.1, independent of the acid concentration, in confirmation of the results of Fletcher.11 At lower acid concentrations the value of G(H2) was less than 5.9. Acid concentrations as high as 1 M caused no increase above G(H2) = 5.9.
A study was also made of the effect of high concentrations of hydrogen chloride and a relatively high concentration of nitrous oxide. The results are shown in the first four columns of Table I. The concentration of C2H5OEF+ was computed on the basis that K diS3 = 0.015 for hydrogen chloride in ethanol.12
Figure 3. Effect of nitrous oxide concentration at 90°: X, N2; V, N2 + H2.
Figure 4. Effect of nitrous oxide concentration at 145°: X , N2; V, N» + H2; □, N2 + H2 from acidic ethanol.
Figure 5 shows the yields of hydrogen as a function of temperature. It may be seen that the yields were independent of temperature between —112 and 25°. Between 25 and 150° the hydrogen yields rise by approximately 1.0 (? unit. At all temperatures, and independent of the presence of nitrous oxide, the presence of hydrogen chloride raised the yields by 0.8 ± 0.1 G unit.
The results indicate that both temperature and acid may increase the over-all yield of hydrogen and nitrogen (the reduction yield). In the limit, each does this independent of the effect of the other. The yields of hydrogen as a function of temperature, with and without acid present (Figure 5), may be superimposed on the lines
(11) J. W. Fletcher, unpublished results.(12) I. I. Bezman and F. H. Nerhock, J. Am. Chem. Soc., 67, 1330 (1945).
Volume 71, Number S February 1967
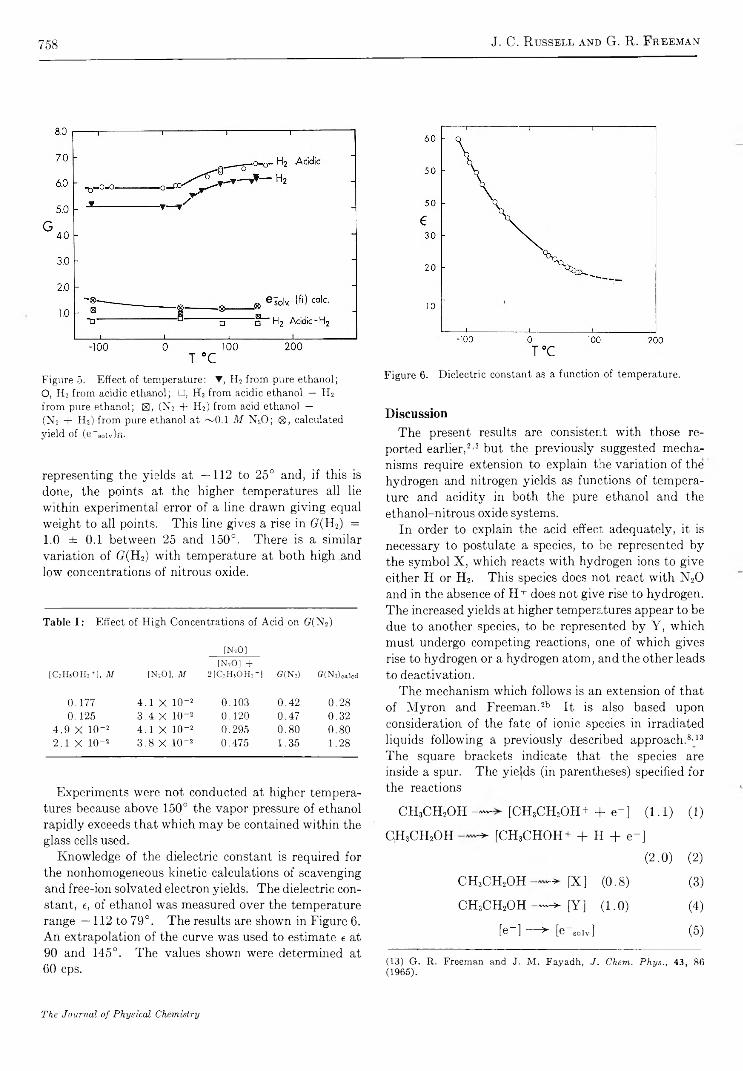
758 J. C. R ussell and G. R. Freeman
Figure 5. Effect of temperature: T, H2 from pure ethanol;O, FIs from acidic ethanol; □, H2 from acidic ethanol — H2 from pure ethanol; E3, (N2 + H2) from acid ethanol —(N2 + H2) from pure ethanol at ~ 0 .1 M N20 ; ®, calculatedyield of (e~ 80lv)f 1*
representing the yields at —112 to 25° and, if this is done, the points at the higher temperatures all lie within experimental error of a line drawn giving equal weight to all points. This line gives a rise in G(H2) =1.0 ± 0.1 between 25 and 150°. There is a similar variation of (7(H2) with temperature at both high and low concentrations of nitrous oxide.
Table I : Effect of High Concentrations of Acid on (?(N2)
[NüO][N2 0 ] +
[C2HbOH2+], m [N2O], M 2[C2HSOH2+] G(N:) G ( N2) calcd
0.177 4 .1 X 10-2 0.103 0.42 0.280.125 3.4 X 10⁻² 0.120 0.47 0.32
4.9 X 10⁻² 4 . 1 X 10⁻² 0.295 0.80 0.802 . 1 X IQ"2 3.8 X IQ-2 0.475 1.35 1.28
Experiments were not conducted at higher temperatures because above 150° the vapor pressure of ethanol rapidly exceeds that which may be contained within the glass cells used.
Knowledge of the dielectric constant is required for the nonhomogeneous kinetic calculations of scavenging and free-ion solvated electron yields. The dielectric constant, e, of ethanol was measured over the temperature range —112 to 79°. The results are shown in Figure 6. An extrapolation of the curve was used to estimate e at 90 and 145°. The values shown were determined at 60 cps.
Figure 6. Dielectric constant as a function of temperature.
D i s c u s s i o n
The present results are consistent with those reported earlier,2'3 but the previously suggested mechanisms require extension to explain the variation of the hydrogen and nitrogen yields as functions of temperature and acidity in both the pure ethanol and the ethanol-nitrous oxide systems.
In order to explain the acid effect adequately, it is necessary to postulate a species, to be represented by the symbol X , which reacts with hydrogen ions to give either H or H2. This species does not react with N20 and in the absence of H+ does not give rise to hydrogen. The increased yields at higher temperatures appear to be due to another species, to be represented by Y, which must undergo competing reactions, one of which gives rise to hydrogen or a hydrogen atom, and the other leads to deactivation.
The mechanism which follows is an extension of that of Myron and Freeman.2b It is also based upon consideration of the fate of ionic species in irradiated liquids following a previously described approach.8,13 The square brackets indicate that the species are inside a spur. The yields (in parentheses) specified for the reactions
CH3CH2OH — [ CH3CH2OH+ + e -] (1.1) (1)
CH3CH2OH > [CH3CHOH+ + H + e -](2.0) (2)
CH3CH2OH -»• [X] (0.8) (3)
CH3CH2OH — ^ [Y] (1.0) (4)
[e- ] — > [e- soiv] (5) 13
(13) G. R. Freeman and J. M. Fayadh, J. Chem. Phys., 43, 86 (1965).
The Journal of Physical Chemistry
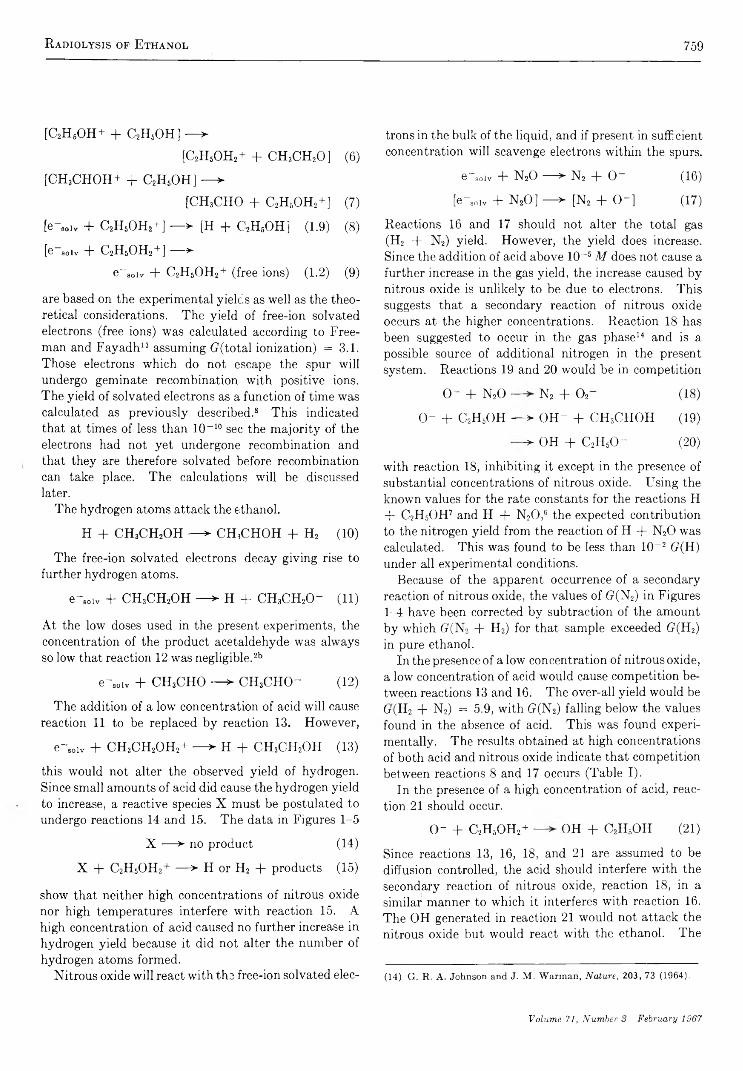
R adiolysis of Ethanol 759
[C2H6OH+ + C2H6OH] — ►
[C2H6OH2+ + CH3CH20 ] (6)
[CH3CHOH+ + C2H6OH] — >[CH3CHO + C2H6OH2+] (7)
[e-8„iv + C2H6OH2+] — ► [H + C2H6OH] (1.9) (8)
[e-.„iv + C2H6OH2+] — ►e~soiv + C2H6OH2+ (free ions) (1.2) (9)
are based on the experimental yields as well as the theoretical considerations. The yield of free-ion solvated electrons (free ions) was calculated according to Freeman and Fayadh13 assuming (7(total ionization) = 3.1. Those electrons which do not escape the spur will undergo geminate recombination with positive ions. The yield of solvated electrons as a function of time was calculated as previously described.8 This indicated that at times of less than 10-10 sec the majority of the electrons had not yet undergone recombination and that they are therefore solvated before recombination can take place. The calculations will be discussed later.
The hydrogen atoms attack the ethanol.
H + CH3CH2OH — > CHjCHOH + H2 (10)
The free-ion solvated electrons decay giving rise to further hydrogen atoms.
e -8„iv + CHsCH2OH — > H + CH3CH20 - (11)
At the low doses used in the present experiments, the concentration of the product acetaldehyde was always so low that reaction 12 was negligible.2b
e -80lv + CH3CHO — > CH3CHO- (12)
The addition of a low concentration of acid will cause reaction 11 to be replaced by reaction 13. However,
e -solv + CH3CH2OH2+ — > H + CH3CH2OH (13)
this would not alter the observed yield of hydrogen. Since small amounts of acid did cause the hydrogen yield to increase, a reactive species X must be postulated to undergo reactions 14 and 15. The data in Figures 1-5
X — > no product (14)
X + C2H6OH2+ — > H or H2 + products (15)
show that neither high concentrations of nitrous oxide nor high temperatures interfere with reaction 15. A high concentration of acid caused no further increase in hydrogen yield because it did not alter the number of hydrogen atoms formed.
Nitrous oxide will react with the free-ion solvated elec
trons in the bulk of the liquid, and if present in sufficient concentration will scavenge electrons within the spurs.
e~80iv + N20 — > N2 + 0~ (16)
[e-80iv + N20 ] — > [N2 + 0 - ] (17)
Reactions 16 and 17 should not alter the total gas (H2 + N2) yield. However, the yield does increase. Since the addition of acid above 1(H5 M does not cause a further increase in the gas yield, the increase caused by nitrous oxide is unlikely to be due to electrons. This suggests that a secondary reaction of nitrous oxide occurs at the higher concentrations. Reaction 18 has been suggested to occur in the gas phase14 and is a possible source of additional nitrogen in the present system. Reactions 19 and 20 would be in competition
o - + n 2o — N, + 0 2 (18)
0 - + C2H3OH - -► O H - + CH3CHOH (19)
-> OH + C2H50 - (20)
with reaction 18, inhibiting it except in the presence of substantial concentrations of nitrous oxide. Using the known values for the rate constants for the reactions H + C2H5OH7 and H + N20 ,6 the expected contribution to the nitrogen yield from the reaction of H + N20 was calculated. This was found to be less than 10-2 (?(H) under all experimental conditions.
Because of the apparent occurrence of a secondary reaction of nitrous oxide, the values of G(N2) in Figures 1-4 have been corrected by subtraction of the amount by which G(N2 + H2) for that sample exceeded (?(H2) in pure ethanol.
In the presence of a low concentration of nitrous oxide, a low concentration of acid would cause competition between reactions 13 and 16. The over-all yield would be (r(H2 + N2) = 5.9, with (?(N2) falling below the values found in the absence of acid. This was found experimentally. The results obtained at high concentrations of both acid and nitrous oxide indicate that competition between reactions 8 and 17 occurs (Table I).
In the presence of a high concentration of acid, reaction 21 should occur.
O - + C2H5OH2+ — OH + C2H5OH (21)
Since reactions 13, 16, 18, and 21 are assumed to be diffusion controlled, the acid should interfere with the secondary reaction of nitrous oxide, reaction 18, in a similar manner to which it interferes with reaction 16. The OH generated in reaction 21 would not attack the nitrous oxide but would react with the ethanol. The
(14) G. R. A. Johnson and J. M. Warman, Nature, 203, 73 (1964).
Volume 71, Number 3 February 1967

760 J. C. R ussell and G. R. Freeman
value of fc(e~soiv + H30 +)/fc(e- 8Otv + N20) = 3 found in water15 is probably due to the abnormally high diffusion coefficient of protons in water. The diffusion coefficient of protons in ethanol is probably also abnormally high, although less so than in water, so for the lack of a better value it is assumed that ku/ku — 2. Similarly, it is assumed that ka/kn = kn/hs = 2. The calculated nitrogen yields were therefore obtained using eq i.
G (N 2) caicd = 2 .7 [N 20] + 2 [C 2H 5O H 2+] (l)
At [N20 ] = 4.0 X 10⁻³ M, in the absence of acid, G(N2) = 2.7, uncorrected for secondary reaction. Within the uncertainties in the effective acid concentrations and the rate constant ratios, the results indicate that nitrous oxide and acid compete for the same species. Although nitrous oxide does not compete with acid for species X , acid competes for all of the species with which nitrous oxide reacts.
The results in Figures 1-5 show that there is a species, to be represented as Y, which is sensitive to temperature but not to nitrous oxide or acid. At temperatures above 25°, reaction 23 proceeds at the expense of reaction 22.
low tempY ----------- >■ deactivation (22)
high tempY ----------- > H or Ii2 + products (23)
It is not possible to identify unambiguously the species Y. However, there are several definite requirements for any description of the species. It must undergo two competing reactions such as reactions 22 and 23. The relative rates of the two reactions change rapidly over the temperature range 25 to 90°. If the assumption is made that the rate of reaction 22 is temperature independent, then a crude estimate may be made of the energy of activation for reaction 23. This is of the order of 10 kcal/mole. Furthermore, the yield of species Y is unaffected by the addition of either hydrogen chloride or nitrous oxide. Species Y might be an excited molecule that is deactivated at low temperatures, but with the additional increment of thermal energy acquired at high temperatures it can decompose to yield H2 or H.
The identity of the species X which reacts in the presence of acid to give hydrogen is elusive. The entity responsible for the observed effects must undergo reactions similar to (14) and (15). The suggestion of Adams and Sedgewick2a that the increased yield on addition of acid is due to scavenging of solvated electrons is not compatible with the present results. In the presence of low concentrations of acid, the free-ion solvated electrons
do react to form hydrogen atoms. However, nuless the experiments are carried out at high doses, where acetaldehyde scavenging of the electrons is important, this would have no effect on the yield of hydrogen. The results indicate that there is competition between the acid and nitrous oxide for the solvated electrons. In addition to this, however, acid increases the over-all reduction yield by 0.8 G unit, and this is true even under conditions where the solvated electrons, including those which normally undergo geminate recombination, are scavenged by nitrous oxide.
The effect of acid on the radiolysis of ethanol will be the subject of another publication from this laboratory11 and will be treated in greater detail there.
The yield of free-ion solvated electrons was computed using the nonhomogeneous kinetics of Freeman and Fayadh.13 This approach takes into account the spectrum of initial ion separations and allows an approximate computation of the proportion which escape gemmate recombination. If (7(total ionization) is known or assumed, then the approximate yield of free ions may be calculated.
A spectrum of N(y) vs. y, the number of ion pairs formed with an initial separation distance y, was computed for ethanol at each temperature.13 The probability of escape, <j>{i = e~r/y, was computed for each value of y in the step function N (y) vs. y, where r = £2 3/ ekT and £ is the charge on an ion (4.80 X 10⁻¹⁰ esu), e is the dielectric constant, k is the Boltzmann constant, and T is the absolute temperature. G(free ion) is then given by the summation equation
(7(free ion) = G(total ionization)Z N (y)
fi(ii)
The same general theory8 permits an approximate calculation of the effect of a scavenger such as nitrous oxide which can interfere with the geminate recombination of the electrons. If is the probability of reaction with the scavenger before geminate recombination takes place, then
4>_ = <f> fi + 4>-{ 1 — <p fi) (iii)
where
0 - = 1 - (1 - (iv)
and
0 - =1
(u+ + U-)'bJD- bsDs
+ X *v /cm 2 (v)
(15) L. M. Dorfman and M. S. Matheson, Progr. Reaction Kinetics,3, 237 (1965).
The Journal of Physical Chemistry
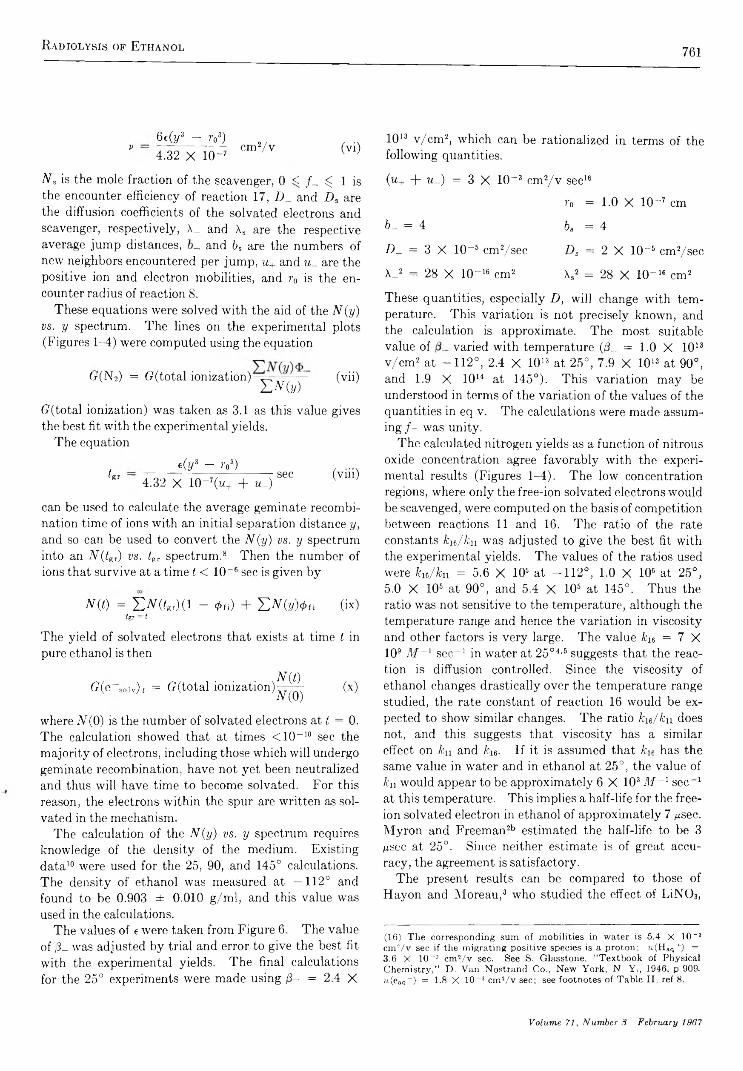
Radiolysis of Ethanol 761
V6e(y3 — r03) 4.32 X 10⁻⁷
cm 2/v (vi) 1013 v /cm 2, which can be rationalized in terms of the following quantities.
Ns is the mole fraction of the scavenger, 0 <C /_ ^ 1 is the encounter efficiency of reaction 17, D_ and Z)s are the diffusion coefficients of the solvated electrons and scavenger, respectively, A_ and \s are the respective average jump distances, and bs are the numbers of new neighbors encountered per jump, u+ and w_ are the positive ion and electron mobilities, and r0 is the encounter radius of reaction 8.
These equations were solved with the aid of the N(y) vs. y spectrum. The lines on the experimental plots (Figures 1-4) were computed using the equation
(t(N2) = (7 (total ionization)Z N (y)
(vii)
(7(total ionization) was taken as 3.1 as this value gives the best fit with the experimental yields.
The equation
fgre(yz - ?’03)
4.32 X 10” 7(w+ + «_)sec (viii)
can be used to calculate the average geminate recombination time of ions with an initial separation distance y, and so can be used to convert the N(y) vs. y spectrum into an N(tgr) vs. tgT spectrum.8 Then the number of ions that survive at a time t < 10~6 sec is given by
W ) = 5 > & r ) ( l - 4>n) + ZN (yW n (ix)tgT ~ t
The yield of solvated electrons that exists at time t in pure ethanol is then
G(c s o l v ) t = (7(total ionization) Njt) N{ 0)
(x)
where N (0) is the number of solvated electrons at t = 0. The calculation showed that at times <10-10 sec the majority of electrons, including those which will undergo geminate recombination, have not yet been neutralized and thus will have time to become solvated. For this reason, the electrons within the spur are written as solvated in the mechanism.
The calculation of the Niy) vs. y spectrum requires knowledge of the density of the medium. Existing data10 were used for the 25, 90, and 145° calculations. The density of ethanol was measured at —112° and found to be 0.903 ± 0.010 g/ml, and this value was used in the calculations.
The values o f « were taken from Figure 6. The value of /3_ was adjusted by trial and error to give the best fit with the experimental yields. The final calculations for the 25° experiments were made using ¡3- = 2.4 X
(w+ + uJ) = 3 X 10 ~3 cm2/v sec16
r0 = 1.0 X 10~7 cm
b- = 4 bs = 4
D_ = 3 X 10” 5 cm2/sec Ds = 2 X 10~6 cm2/sec
A_2 = 28 X 10~16 cm2 \s2 = 28 X 10“ 16 cm2
These quantities, especially D, will change with temperature. This variation is not precisely known, and the calculation is approximate. The most suitable value of varied with temperature (/8_ = 1.0 X 10¹³ v /cm 2 at -1 1 2 °, 2.4 X 10¹³ at 25°, 7.9 X 10¹³ at 90°, and 1.9 X 10u at 145°). . This variation may be understood in terms of the variation of the values of the quantities in eq v. The calculations were made assuming / - was unity.
The calculated nitrogen yields as a function of nitrous oxide concentration agree favorably with the experimental results (Figures 1-4). The low concentration regions, where only the free-ion solvated electrons would be scavenged, were computed on the basis of competition between reactions 11 and 16. The ratio of the rate constants ku/kn was adjusted to give the best fit with the experimental yields. The values of the ratios used were k16/kn = 5.6 X 10⁶ at —112°, 1.0 X 10⁶ at 25°, 5.0 X 10⁶ at 90°, and 5.4 X 10⁵ at 145°. Thus the ratio was not sensitive to the temperature, although the temperature range and hence the variation in viscosity and other factors is very large. The value ku = 7 X 10⁹ M~x sec-1 in water at 25°4,8 suggests that the reaction is diffusion controlled. Since the viscosity of ethanol changes drastically over the temperature range studied, the rate constant of reaction 16 would be expected to show similar changes. The ratio kw/kn does not, and this suggests that viscosity has a similar effect on kn and lc16. If it is assumed that k16 has the same value in water and in ethanol at 25°, the value of kn would appear to be approximately 6 X 10³ M ~x sec-1 at this temperature. This implies a half-life for the free- ion solvated electron in ethanol of approximately 7 /xsec. Myron and Freeman2b estimated the half-life to be 3 /¿sec at 25°. Since neither estimate is of great accuracy, the agreement is satisfactory.
The present results can be compared to those of Hayon and Moreau,3 who studied the effect of LiN03,
(16) The corresponding sum of mobilities in water is 5.4 X 10_3 cm2/v sec if the migrating positive species is a proton; u(Haq+) = 3.6 X 10 “ 3 cm2/v sec. See S. Glasstone, “ Textbook of Physical Chemistry,” D. Van Nostrand Co., New York, N. Y., 1946, p 909. w(eaq~) = 1.8 X 10⁻³ cm2/v sec; see footnotes of Table II, ref 8.
Volume 71, Number 3 February 1967

762 Notes
NiCl2, and chloroacetic acid on the H2 yield in ethanol. Their results show curves which are similar to those in Figures 1-4. They interpreted these in terms of ir(e- Boiv)fi = 0.90 ± 0.10 and the scavenging of electrons in the spurs togive(?(e~)Sp = 0.75 ± 0.10. Thus they found a total of G(e_)T = 1-65 ± 0.2. The present results and calculations are consistent with t?(e soiv) fi = 1.2, G(e soiv)gr = 1.9, and (7(e so1v)t3.1. The fact that a much higher value for the total yield of solvated electrons was found in the present work may indicate that the rates of reaction of the solutes used by Hayon and Moreau with the solvated electrons in ethanol are lower than they presumed. By comparison with the results of Adams and Sedgewick for the effect of acid,2a they concluded that increases in over-all yield on addition of some of the scavengers were due to scavenging of solvated electrons in the spurs. It is felt that an incomplete understanding of the true effects of acid on the radiolysis may have resulted in an incorrect comparison.
There is an apparent disagreement between the proposed mechanism and the previously accepted2,3’17 yield of free-ion solvated electrons in y irradiated ethanol. [(7(free ion) = 0.9 ± 0 .1 , compared to the present estimate of 1.2.] Although the present estimate might be too high, it is quite possible that the previous estimates are too low because of the lack of good plateaus in the scavenger plots (see Figure 2 as well as ref 2 and3). In effect, the concentration of scavenger required to react with all free-ion solvated electrons is not radically different from that which will begin to react in the
spurs. In comparison, the case of water is quite different. A value of /ce,,q- + h 2o = 16 A i-1 sec-1 has been quoted.18 This corresponds to a half-life of the order of 1 msec. Thus in very pure water the solvated electron has a long lifetime and may be scavenged efficiently by a low concentration of scavenger. This suggests why very good scavenger plots may be obtained in aqueous systems and not in ethanolic ones.
Taub, et ah,17 estimated that G (e _ soiv)fi = 1-0 ± 0.3, which is consistent with the present value of 1.2.
In conclusion, the reaction mechanism advanced may be used to explain the yields of primary reducing species and their variation under differing conditions. The simple mechanism for nonhomogeneous kinetics is as successful in treating the results as the limitations of the method could permit. This agreement must be considered further evidence in favor of the theory.8 The shape of the scaveng' ” curves is a function of the lifetime of the free-ion solvated electrons in the medium. The lifetime of free-ion solvated electrons in ethanol appears to be approximately 3-7 /¿sec compared to 1 msec in water. The existence of four distinguishable hydrogen precursors has been demonstrated. Species Y might be an excited molecule, but the identity of species X is unknown.
(17) I. A. Taub, D. A. Harter, M. C. Sauer, and L. M. Dorfman, J. Chem. Phys., 41, 979 (1964).(18) E. I. Hart, quoted by J. Rabani in “ Solvated Electron,” Advances in Chemistry Series, No. 50, American Chemical Society, Washington, D. C., 1965, p 251.
N O T E S
Disproportionation and Combination Reactions of Isopropoxy Radicals with Nitric Oxide
by Barbara E. Ludwig and G. R. McMillan
Department of Chemistry, Western Reserve University,Cleveland, Ohio Jf.Jj.106 (Received August 1, 1966)
Meager information is available about the temperature dependence of disproportionation and combination reactions of simple radicals other than the alkyls.
For the isopropoxy-nitric oxide pair, ki/k2 was found to be 0.15 at 26° and 0.20 at 77° from results of photoly-
(CH3)2CHO + NO — > CH3COCH3 + HNO (1)
— > (CH3)2CHONO (2)
sis of diisopropyl peroxide in the presence of nitric oxide.1 The data showed considerable scatter, especially at 77°, and we agree with Arden, Phillips, and Shaw2
(1) G. R. McMillan, J. Am. Chem. Soc., 83, 3018 (1961).(2) E. A. Arden, L. Phillips, and R. Shaw, J. Chem. Soc., 5126(1964).
The Journal of Physical Chemistry
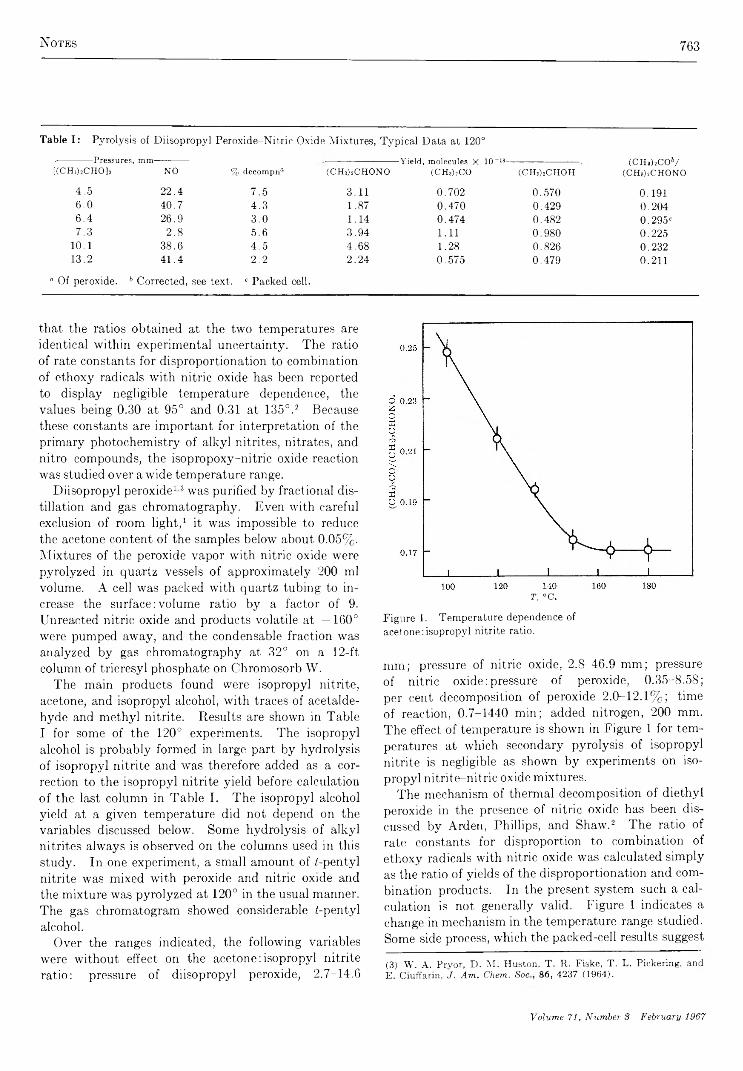
Notes 763
Table I: Pyrolysis of Diisopropyl Peroxide-Nitric Oxide Mixtures, Typical Data at 120°-------------- Pressures, mm-[(C H ,)2CHO]s NO % decompn0 (CH a)2CHONO
-Y ield , molecules X 10 ~18— (C H a) 2CO (C H a)2CHOH
(CHsUCOV(CH îUCHONO
4.5 22.4 7.5 3.11 0.702 0.570 0.1916.0 40.7 4.3 1.87 0.470 0.429 0.2046.4 26.9 3.0 1.14 0.474 0.482 0.295'7.3 2.8 5.6 3.94 1.11 0.980 0.225
10.1 38.6 4.5 4.68 1.28 0.826 0.23213.2 41.4 2.2 2.24 0.575 0.479 0.211
0 Of peroxide. 6 Corrected, see text. c Packed cell.
that the ratios obtained at the two temperatures are identical within experimental uncertainty. The ratio of rate constants for disproportionation to combination of ethoxy radicals with nitric oxide has been reported to display negligible temperature dependence, the values being 0.30 at 95° and 0.31 at 135°.2 Because these constants are important for interpretation of the primary photochemistry of alkyl nitrites, nitrates, and nitro compounds, the isopropoxy-nitric oxide reaction was studied over a wide temperature range.
Diisopropyl peroxide13 was purified by fractional distillation and gas chromatography. Even with careful exclusion of room light,1 it was impossible to reduce the acetone content of the samples below about 0.05%. Mixtures of the peroxide vapor with nitric oxide were pyrolyzed in quartz vessels of approximately 200 ml volume. A cell was packed with quartz tubing to increase the surface : volume ratio by a factor of 9. Unreacted nitric oxide and products volatile at —160° were pumped away, and the condensable fraction was analyzed by gas chromatography at 32° on a 12-ft column of tricresyl phosphate on Chromosorb W.
The main products found were isopropyl nitrite, acetone, and isopropyl alcohol, with traces of acetaldehyde and methyl nitrite. Results are shown in Table I for some of the 120° experiments. The isopropyl alcohol is probably formed in large part by hydrolysis of isopropyl nitrite and was therefore added as a correction to the isopropyl nitrite yield before calculation of the last column in Table I. The isopropyl alcohol yield at a given temperature did not depend on the variables discussed below. Some hydrolysis of alkyl nitrites always is observed on the columns used in this study. In one experiment, a small amount of ¿-pentyl nitrite was mixed with peroxide and nitric oxide and the mixture was pyrolyzed at 120° in the usual manner. The gas chromatogram showed considerable ¿-pentyl alcohol.
Over the ranges indicated, the following variables were without effect on the acetone : isopropyl nitrite ratio: pressure of diisopropyl peroxide, 2.7-14.6
T, °C .
Figure 1. Temperature dependence of acetone:isopropyl nitrite ratio.
mm; pressure of nitric oxide, 2.8-46.9 mm; pressure of nitric oxide: pressure of peroxide, 0.35-8.58; per cent decomposition of peroxide 2.0-12.1%; time of reaction, 0.7-1440 min; added nitrogen, 200 mm. The effect of temperature is shown in Figure 1 for temperatures at which secondary pyrolysis of isopropyl nitrite is negligible as shown by experiments on isopropyl nitrite-nitric oxide mixtures.
The mechanism of thermal decomposition of diethyl peroxide in the presence of nitric oxide has been discussed by Arden, Phillips, and Shaw.2 The ratio of rate constants for disproportion to combination of ethoxy radicals with nitric oxide was calculated simply as the ratio of yields of the disproportionation and combination products. In the present system such a calculation is not generally valid. Figure 1 indicates a change in mechanism in the temperature range studied. Some side process, which the packed-cell results suggest
(3) W. A. Pryor, D. M. Huston, T. It. Fiske, T. L. Pickering, and E. Ciuffarin, J . A m . C h e m . S o c 86, 4237 (1964).
V olum e 71, N tim ber 8 F ebru ary 1967

764 N otes
to be a surface reaction, makes a temperature-dependent contribution to the product ratio below 150°. At higher temperatures, this process is apparently overwhelmed, for the acetone to isopropyl nitrite ratio becomes temperature independent above about 160°. This constancy together with independence of the ratio of the other variables suggests the ratio be identified with ki/ki. The value thus obtained, 0.17, is the same as the grand average of low-temperature results (26- 79°).1 The disproportionation : combination ratio may therefore be taken as 0.17 over the range 26-180°. The isopropoxy-nitric oxide pair is evidently similar to alkyl-alkyl reactions in showing an inappreciable difference in activation energies between the two processes.
As has been pointed out,2 a value of 0.17 for fci//c2 at 120° would fit well with a correlation showing the disproportionation to combination ratios for alkoxy radicals and nitric oxide to be proportional to the number of available hydrogen atoms, in contrast to results on alkyl-alkyl reactions. Such a correlation would not be expected from data on reactions of alkoxy radicals with methyl radicals, which indicate that isopropoxy disproportionates with methyl about twice as fast relative to combination as does methoxy.4 * Furthermore, a referee has pointed out that the correlation would be significant only if all the alkoxy- nitric oxide disproportionation combination ratios were temperature independent, and this must be considered questionable in view of the apparent absence of disproportionation at 25° in the reaction of methoxy and ethoxy radicals with nitric oxide 6
Acknowledgment. Grateful acknowledgment is made of support of this work by the Div's;on of Air Pollution, Bureau of State Services, U. S. Public Health Service.
(4) Summarized in G. R. McMillan and J. G. Calvert, “ Oxidation and Combustion Reviews,” Vol. I, C. F. H. Tipper, Ed., Elsevier Publishing Co., Amsterdam, 1965, p 123.(5) A. R. Knight and H. E. Gunning, Can. J. Chem., 39, 1231, 2466 (1961).
Miscibility of Metals with Salts. VII. The Potassium-Potassium Sulfide System1
by A. S. Dworkin and M. A. Bredig
Oak Ridge National Laboratory, Oak Ridge, Tennessee (Received September 8, 1966)
Our previous studies of metal-metal salt solutions2 have dealt with systems of the type M -M X , M -M X j,
and M -M X j, where M represents alkali, alkaline earth and rare earth metals, and X represents halide ions. This report on the phase equilibria in the K2S-K system deals with an extension of the work to the first representative of systems M -M 2Y, where Y is a doubly charged chalcogenide ion, and where the anion-to- cation ratio is as much as a factor of 6 smaller than in the previous other extreme, the M -M X 3 systems. The significance of the stoichiometry for the electrical conductivity, i.e., for the mobility of the metal electrons, was discussed earlier.3
The K2S was prepared by slowly adding triply sublimed, carbon-free sulfur to excess potassium in an inert atmosphere at a controlled temperature of 180- 200°. The excess potassium was then removed by distillation at 300-350° under high vacuum. The final product was analyzed for K, S, and O and found to be better than 99% K2S with the major impurities being K and lv20 . The potassium contained less than 0.02% of other cations. All handling operations were performed under helium in a drybox.
The phase diagram was determined by thermal analysis (cooling curves). Inconel capsules with thermocouple wells were used as cortainers and a Pt— Pt-10% Rh thermocouple was used in conjunction with a Rubicon potentiometer and a Brown recorder to measure temperatures. The Inconel capsules were sealed under helium in a welding drybox. A rocking furnace permitted mixing of the components before each cooling curve was run.
The K -K 2S phase diagram is shown in Figure 1. The melting point Tm of 948° is considerably higher than the value of 912° reported in the literature.4 However, the latter value was determined with Iv2S which contained at least 5% impurity. The critical solution temperature Tc lies at about 900°, or about 50° below the melting point of the K2S. The monotectic temperature Tmon is 883° and the monotectic concentration is 21 mole % K. The K2S-K system thus resembles the KBr-K system except that Tc for the former lies about 180° higher.
The end of the miscibility gap at 63 mole % K is somewhat uncertain due to the very rapid increase in the sulfide solubility in the liquid metal just below the monotectic temperature. This rapid increase is, of
(1) Research sponsored by the U. S. Atomic Energy Commission under contract with the Union Carbide Corp.(2) M. A. Bredig, “ Mixtures of Metals with Molten Salts,” in “ Molten Salt Chemistry,” M. Blander, Ed., Interscience Publishers, Inc., New York, N. Y., 1964.(3) M. A. Bredig, J. Chem. Phys., 37, 914 (1962),(4) J. Goubeau, H. Kolb, and H. G. Krall, Z. Anorg. Allgem. Chem..236, 45 (1938).
The Journal of Physical Chemistry
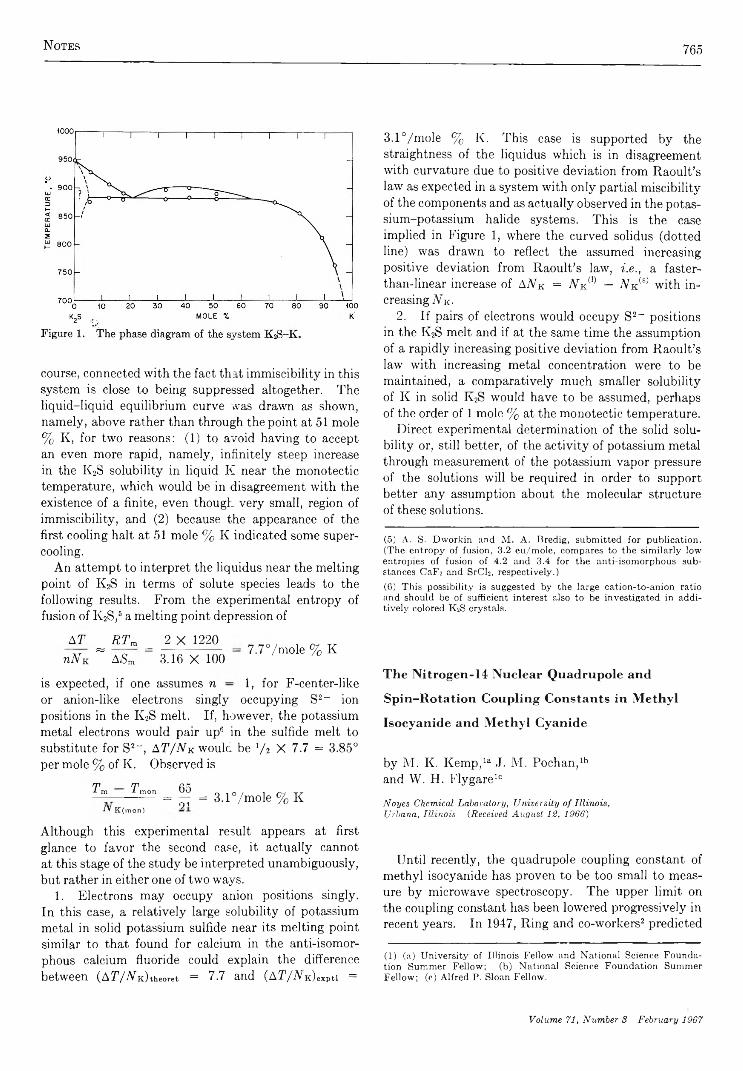
Notes 765
course, connected with the fact that immiscibility in this system is close to being suppressed altogether. The liquid-liquid equilibrium curve was drawn as shown, namely, above rather than through the point at 51 mole % K, for two reasons: (1) to avoid having to accept an even more rapid, namely, infinitely steep increase in the K2S solubility in liquid K near the monotectic temperature, which would be in disagreement with the existence of a finite, even though very small, region of immiscibility, and (2) because the appearance of the first cooling halt at 51 mole % K indicated some supercooling.
An attempt to interpret the liquidus near the melting point of K2S in terms of solute species leads to the following results. From the experimental entropy of fusion of K2S,6 a melting point depression of
AT _ RTm _ 2 X 1220 uNk ~ ASm ~ 3.16 X 100
7.7°/mole % K
is expected, if one assumes n — 1, for F-center-like or anion-like electrons singly occupying S2~ ion positions in the K2S melt. If, however, the potassium metal electrons would pair up6 in the sulfide melt to substitute for S2“ , AT/Nk would be y 2 X 7.7 = 3.85° per mole % of K. Observed is
Tm Tm o n 65 0 1 0 / 1 rri -rr--------------- = 91 = 3.1 /mole % K•/V K(mon)
Although this experimental result appears at first glance to favor the second case, it actually cannot at this stage of the study be interpreted unambiguously, but rather in either one of two ways.
1. Electrons may occupy anion positions singly. In this case, a relatively large solubility of potassium metal in solid potassium sulfide near its melting point similar to that found for calcium in the anti-isomor- phous calcium fluoride could explain the difference between (AT/iViOtheoret = 7.7 and (A T /A kW p« =
3.1°/mole % K. This case is supported by the straightness of the liquidus which is in disagreement with curvature due to positive deviation from Raoult’s law as expected in a system with only partial miscibility of the components and as actually observed in the potassium-potassium halide systems. This is the case implied in Figure 1, where the curved solidus (dotted line) was drawn to reflect the assumed increasing positive deviation from Raoult’s law, i.e., a faster- than-linear increase of AAk = Nk(I) — A k(s) with increasing N K.
2. If pairs of electrons would occupy S2~ positions in the K2S melt and if at the same time the assumption of a rapidly increasing positive deviation from Raoult’s law with increasing metal concentration were to be maintained, a comparatively much smaller solubility of K in solid Iv2S would have to be assumed, perhaps of the order of 1 mole % at the monotectic temperature.
Direct experimental determination of the solid solubility or, still better, of the activity of potassium metal through measurement of the potassium vapor pressure of the solutions will be required in order to support better any assumption about the molecular structure of these solutions.
(5) A. S. Dworkin and M. A. Bredig, submitted for publication. (The entropy of fusion, 3.2 eu/mole, compares to the similarly low entropies of fusion of 4.2 and 3.4 for the anti-isomorphous substances CaF2 and SrCb, respectively.)(6) This possibility is suggested by the large cation-to-anion ratio and should be of sufficient interest also to be investigated in addi- tively colored K2S crystals.
The Nitrogen-14 Nuclear Quadrupole and
Spin-Rotation Coupling Constants in Methyl
Isocyanide and Methyl Cyanide
by M. K. Kemp,la J. M. Pochan,lb and W. H. Flygarelc
Noyes Chemical Laboratory, University of Illinois, Urbana, Illinois (.Received August 12, 1966)
Until recently, the quadrupole coupling constant of methyl isocyanide has proven to be too small to measure by microwave spectroscopy. The upper limit on the coupling constant has been lowered progressively in recent years. In 1947, Ring and co-workers2 predicted
(1) (a) University of Illinois Fellow and National Science Foundation Summer Fellow; (b) National Science Foundation Summer Fellow; (c) Alfred P. Sloan Fellow.
Volume 71, Number 3 February 1967
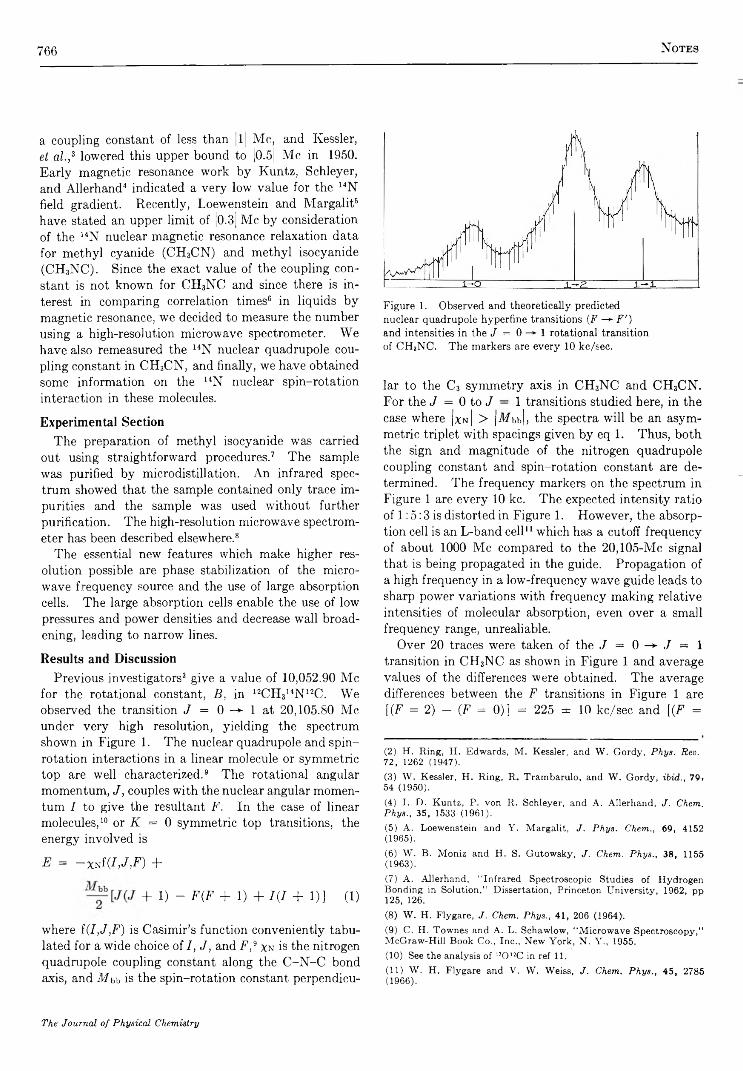
766 N o t e s
a coupling constant of less than |l| Me, and Kessler, et a l . ,2 3 lowered this upper bound to |0.5| Me in 1950. Early magnetic resonance work by Kuntz, Schleyer, and Allerhand4 5 indicated a very low value for the 14N field gradient. Recently, Loewenstein and Margalit6 have stated an upper limit of [0.3[ Me by consideration of the 14N nuclear magnetic resonance relaxation data for methyl cyanide (CH3CN) and methyl isocyanide (CH3NC). Since the exact value of the coupling constant is not known for CH3NC and since there is interest in comparing correlation times6 in liquids by magnetic resonance, we decided to measure the number using a high-resolution microwave spectrometer. We have also remeasured the 14N nuclear quadruple coupling constant in CH3CN, and finally, we have obtained some information on the 14N nuclear spin-rotation interaction in these molecules.
Experimental SectionThe preparation of methyl isocyanide was carried
out using straightforward procedures.7 8 9 10 11 The sample was purified by microdistillation. An infrared spectrum showed that the sample contained only trace impurities and the sample was used without further purification. The high-resolution microwave spectrometer has been described elsewhere.8
The essential new features which make higher resolution possible are phase stabilization of the micro- wave frequency source and the use of large absorption cells. The large absorption cells enable the use of low pressures and power densities and decrease wall broadening, leading to narrow lines.
Results and DiscussionPrevious investigators3 give a value of 10,052.90 Me
for the rotational constant, B, in 12CH314N 12C. We observed the transition J = 0 —► 1 at 20,105.80 Me under very high resolution, yielding the spectrum shown in Figure 1. The nuclear quadrupole and spin- rotation interactions in a linear molecule or symmetric top are well characterized.9 The rotational angular momentum, J, couples with the nuclear angular momentum 7 to give the resultant F. In the case of linear molecules,10 or K = 0 symmetric top transitions, the energy involved is
E = - XNf (I,J,F) +
+ 1) - F(F + 1) + 7(7 + 1)] (1)
where f(I,J,F) is Casimir’s function conveniently tabulated for a wide choice of 7, J, and F,9 xn is the nitrogen quadrupole coupling constant along the C -N -C bond axis, and Mbb is the spin-rotation constant perpendicu-
Figure 1. Observed and theoretically predicted nuclear quadrupole hyperfine transitions ( F —*■ F ' ) and intensities in the J = 0 -*■ 1 rotational transition of CH3NC. The markers are every 10 kc/sec.
lar to the C3 symmetry axis in CH3NC and CH3CN. For the J = 0 to J - 1 transitions studied here, in the case where |x n | > \Mhh\, the spectra will be an asymmetric triplet with spacings given by eq 1. Thus, both the sign and magnitude of the nitrogen quadrupole coupling constant and spin-rotation constant are determined. The frequency markers on the spectrum in Figure 1 are every 10 kc. The expected intensity ratio of 1 :5:3 is distorted in Figure 1. However, the absorption cell is an L-band cell11 which has a cutoff frequency of about 1000 Me compared to the 20,105-Mc signal that is being propagated in the guide. Propagation of a high frequency in a low-frequency wave guide leads to sharp power variations with frequency making relative intensities of molecular absorption, even over a small frequency range, unrealiable.
Over 20 traces were taken of the J = 0 -*■ J = 1 transition in CH3NC as shown in Figure 1 and average values of the differences were obtained. The average differences between the F transitions in Figure 1 are [(F = 2) — (F = 0)] = 225 ± 10 kc/sec and [(F =
(2) H. Ring, H. Edwards, M. Kessler, and W. Gordy, Phys. Rev. 72, 1262 (1947).(3) W. Kessler, H. Ring, R. Trambarulo, and W. Gordy, ibid., 79> 54 (1950).(4) I. D. Kuntz, P. von R. Schleyer, and A. Allerhand, J. Chem. Phys., 35, 1533 (1961).(5) A. Loewenstein and Y. Margalit, J. Phys. Chem., 69, 4152(1965) .(6) AV. B. Moniz and H. S. Gutowsky, J. Chem, Phys., 38, 1155 (1963).(7) A. Allerhand, “ Infrared Spectroscopic Studies of Hydrogen Bonding in Solution,” Dissertation, Princeton University, 1962, pp 125, 126.(8) W. H. Flygare, J. Chem. Phys., 41, 206 (1964).(9) C. H. Townes and A. L. Schawlow, “ Microwave Spectroscopy,” McGraw-Hill Book Co., Inc., New York, N. Y., 1955.(10) See the analysis of I70 12C in ref 11.(11) W. H. Flygare and V. W. Weiss, J. Chem. Phys., 45, 2785(1966) .
The Journal of Physical Chemistry

N o t e s 767
2) — (F = 1) ] = —140 ± 5 kc/'sec. Solving the two- parameter equations from eq 1 gives xn = 483 ± 17 kc/sec and M bb = —3.0 ± 2.0 kc/sec.
Our value of xn is not in agreement with the value of |300| kc given by Loewenstein and Margalit.6 Their value is an upper limit obtained from the ratio of the 14N magnetic resonance line widths observed in liquid CH3NC and CH3CN at room temperature. In their analysis, they used the relation6
1 /Ti = \{e\Q/hY rq (2)
where Ti is the 14N relaxation time and rq is the effective correlation time for quadrupolar relaxation of the 14N. They assumed that J\ < 2V, where 1/ttT2* is the total apparent line width, and also made the reasonable approximation that rq is the same in the two liquids. However, less approximate determinations of the 14N Ti give 4.9 ± 0.8 msec for CH3CN,12 and 0.35 ± 0.1 sec for CH3NC,13 both liquids at room temperature. These T, values, when combined in eq 2 with an 14N coupling constant of —4.21 M c/sec (see below) for gaseous CH3CN, and with the rc values assumed to be equal, lead to a predicted coupling constant of 500 ± 50 kc for CH3NC in the gas phase. This is in agreement with the directly determined microwave value of 483 ± 17 kc/sec.
For the sake of completeness and interest in the 14N spin-rotation interaction, we have remeasured the J = 0 -► J = 1 triplet in CH3CN.9 The results are [(F = 2) — (F = 0)] = —1896 ± 8 kc/sec and [(F = 2) — (F = 1)] = 1264 ± 4 kc/sec. Salving again the two- parameter equations from eq 1 gives xn = —4214 ± 16 kc/sec and Mbb = 0.0 ± 2.0 kc/sec.
Acknowledgment. We are indebted to Professor H. S. Gutowsky for communicating to us the Tin determinations in CH3NC and CE3CN prior to publication. The support of the National Science Foundation is gratefully acknowledged.
(12) N. Boden, J. Deck, E. Gore, and H. S. Gutowsky, J. Chem. Phys., 45, 3875 (1966).(13) E. Gore and H. S. Gutowsky, to be published.
Photosensitized Reactions of Cinnamate Esters
by H. G. Curme, C. C. Natale, and D. J. KelleyResearch Laboratories, Eastman Kodak Company, Rochester,New York 14-650 (Received June 27, 1366)
In 1959, Minsk, Smith, Van Deusen, Wright, and Robertson1'2 described the preparation of the cinnamic
acid ester of poly(vinyl alcohol) and showed that, after exposure to light, it becomes insoluble in solvents in which the unexposed polymer is soluble. Although the inherent absorption and sensitivity of the cinnamate esters lie well into the ultraviolet region of the spectrum, these authors found that the esters can be sensitized to longer wavelengths with certain compounds that absorb farther toward the red than the cinnamate. Other authors have shown that infrared absorption3 and sensitometric behavior4 5 of the polymer are consistent with formation of cross-links through dimerization of the cinnamate groups during irradiation and that triplet energy levels6 of sensitizers are such that sensitizers may reasonably be postulated to transfer triplet energy to cinnamate groups.
In this communication we present chemical evidence that the model compound, ethyl cinnamate, dimerizes when irradiated in the absorption bands of added sensitizers, and that irradiation of poly(vinyl cinnamate) produces spectral changes in the ultraviolet region similar to those shown by the model compound. Spectroscopic evidence is also presented to show that the triplet states of some of the sensitizers are involved in the reactions.
C o m p a r i s o n o f t h e P h o t o l y s i s o f P o l y ( v i n y l
c i n n a m a t e ) a n d o f E t h y l C i n n a m a t e
The sensitized cinnamate reactions are easily followed by changes in ultraviolet absorption. Figure 1 shows a typical absorption spectrum of a thin film of poly(vinyl cinnamate) (PVC) containing about 10 wt % of the sensitizer, Michler’s ketone, henceforth referred to as MK. Samples were coated on a quartz plate and exposed to filtered light of 350-m/t wavelength and longer from a General Electric A-H4 mercury arc under vacuum at room temperature. The light was not absorbed by the polymer itself and produced no reaction in unsensitized films. In this particular experiment, the large decreases in the cinnamate absorption peak at 274 nipt were accompanied by very much smaller changes in the spectrum of the sensitizer (see the right side of the figure).
Table I shows the yields of disappearance of the cinnamate group for thin polymer films (<0.1 pi) containing three different sensitizers: Michler’s ketone (MK), p-nitroaniline (PNA), and picramide (P).
(1) L. M. Minsk, J. G. Smith, W. P. Van Deusen, and J. F. Wright, J. Appl. Polymer Sei., 2, 302 (1959).(2) E. M. Robertson, W. P. Van Deusen, and L. M. Minsk, ibid., 2, 308 (1959).(3) A. Inami and K. Morimoto, Kogyo Kagaku Zasshi, 65, 293 (1962).(4) M. Tsuda, J. Polymer Sei., A2, 2907 (1964).(5) M. Tsuda, Polymer Letters, 2, 1143 (1964).
V olum e 71, N um ber 8 February 1967

768 Notes
Table I : Yields on Irradiation of Cinnamate Esters
,■------------------------------- 1 nitial---------------------------------'Moles of
cinnam ate/ --------------------------------After long exposure--------mole of /— Quantum yield of loss-—• <~% decrease in absorption-^
sensitizer of cin of sensi Time, of cin of sensi- W t %Sensitizer Atm present namate tizer hr namate® tizerb product
Substrate: poljr(vinyl cinnamate)
MK Vac 29.8 0.25 17 80 10MK Air 29.8 0.16 16 79 21
PNA N2 7.8 0.08 17 69 64PNA Air 7.8 0.1 10 68 84
P n 2 4.0 0.06 1 19 10P Air 4.0 0.06 6 36 28
Substrate: ethyl cinnamate
PNA A ir 190 0.1 20 46 41°P Air 190 0.03 20 20 0 1 4 d
“ At the peak at 274 m y for polymer films and at 277 m for ethyl cinnamate, the latter after subsequent dilution with methanol- 6 At the first peak in the visible or near-ultraviolet region. c Mol wt of product = 335; that of ethyl cinnamate dimer = 352. d Mol wt of product = 317.
Figure 1. Optical densities of an MK-sensitized poly(vinyl cinnamate) layer irradiated at room temperature undervacuum: --------- , no exposure;---------, 5-min exposure;--------- , 15-min exposure; --------- , 120-min exposure;----------------- -—-, MK in poly(vinyl acetate), no exposure.
Quantum yields were calculated from initial rates of decrease of the cinnamate absorption at 274 m¡i, coupled with measurements of light intensity by uranyl oxalate actinometry. In making these calculations, products of the reaction were assumed to show little absorption at 274 my, relative to the cinnamate; results of experiments on ethyl cinnamate, given in the next paragraph, indicate that this assumption is justified. The sensitizers acted repeatedly in the process,
as shown by the fact that several cinnamate groups reacted per original molecule of sensitizer originally present. This suggests that, in cases where sensitizers decompose, their decomposition may be a side reaction. As the graph shows, the rates of reaction decreased very rapidly during exposure, but the reactions could be driven to 70-80% decrease in peak height by long exposure. The spectra of the sensitizer, MK, showed relatively little change during irradiation in PVC if exposures were made in nonoxidizing atmospheres. However, PNA and P decomposed in the films even under nitrogen.
Solutions 0.03 M in sensitizer of PNA and P in liquid ethyl cinnamate (5.9 M) were exposed as 1-mm layers under air to the same wavelength radiation as the polymer films, except that a General Electric A-H6 mercury arc was used as source. The temperature in these experiments was held at 25°. As in the case of the polymer films, light was absorbed only by the sensitizers, and unsensitized ethyl cinnamate showed no reaction on irradiation. On subsequent dilution of the sensitized samples with methanol, spectral changes similar to those shown for poly (vinyl cinnamate) in the figure were found to have occurred. After irradiation, the unreacted ethyl cinnamate was pumped off and nonvolatile products were obtained. Their molecular weights, as determined by the boiling-point elevation of benzene, showed them to be predominantly dimers. Although the peak extinction coefficient of ethyl cinnamate in methanol is 22,400 l./mole cm, ab-
The Journal of Physical Chemistry

Notes 769
Table II : Emission of Sensitizers
— In P M M A at 77° K--------------F luorescence P hosphorescence
Sensitizer m ax, niju max, mu
MK 3 8 8 4 6 0PNA No fluorescence 5 1 7P 4 6 7 No phosphorescence
in PVC/
‘ÊP/S’F In PVC at 77°K
/-----3?F m
77°K
P M M A —Roomtemp
0 . 8 3 No phosphorescence 0 . 9 0.8No phosphorescenceNo phosphorescence 1 . 5 1 . 7
sorbances of the products in this region were very low («max ~500 l./mole cm at 260 m^), consistent with the loss of conjugation of the carbonyl with the phenyl group. Infrared absorption similar to that reported by Inami and Morimoto3 was also observed. No attempt was made to resolve the mixture of truxillic and truxinic esters which are presumed to be the products.
Exposure of dilute solutions of ethyl cinnamate in methanol in the cinnamate absorption band produced a very different effect; the spectra rotated around an isosbestic point at 248 m/u, characteristic of isomerization of the trans form to the cz's.6 However, relative decreases of the absorption of both undiluted liquid ethyl cinnamate and poly(vinyl cinnamate) upon sensitized exposure were nearly the same at 248 m i as at the peak. This indicates that very little permanent trans-cis isomerization occurred in the sensitized undiluted systems.
The spectra indicate slow photolysis of the sensitizers in solution in air.
Table I shows the yields of two of the irradiation experiments with ethyl cinnamate in air. The per cent reaction, as calculated from the gravimetric data, is seen to agree fairly well with the per cent drop of the cinnamate peak at 277 mp. As with poly(vinyl cinnamate), the large number of dimer molecules produced per molecule of sensitizer initially present is clear evidence that the sensitizers are not destroyed during sensitizing.
The close similarity between the spectral changes in liquid ethyl cinnamate, which has been shown to produce dimer, and those in the PVC system is good evidence that the polymer is insolubilized by the formation of dimer-type cross-links. The quantum yields of reaction are of the same order of magnitude in both systems. The higher yields in the polymer films may actually be due to more favorable photochemical conditions; only a fraction of the exciting light was absorbed by the polymer films, but all of it was absorbed by the liquid samples. Inner filter effects from photolysis products of the sensitizers may have decreased the observed yields in the liquid.
E f f e c t o f P o l y ( v i n y l c i n n a m a t e ) o n t h e L u m i n e s c e n c e
o f S e n s i t i z e r s
The mechanism of sensitization was investigated by comparing the luminescence of sensitizers in PVC and in poly (methyl methacrylate) (PMMA). Polymer films were from 3 X 10~3 to 1 X 10_I M in the sensitizer in order to ensure that a large fraction of the exciting light was absorbed by the samples, which were a few thousandths of an inch thick. Light from a Bausch and Lomb SP-200 superpressure mercury arc was passed through a Bausch and Lomb high-intensity grating monochromator set at 365 mix and through a 365-mju interference filter onto the sample. The half band width of the monochromator was 10 m/i and of the interference filter approximately 20 m i. Emitted light was analyzed by a 500-mm Bausch and Lomb grating monochromator and detected by an EMI 9558-R phototube. The output signal was recorded as a function of monochromator wavelength setting. In addition to measuring total luminescence, we could identify and observe bands due to luminescence with a lifetime of 5 X 10 sec or longer by means of a pair of rotating sector disks placed on either side of the sample. For the purpose of rough calculation, relative quantum yields (4>) of short- and long-lived emissions (fluorescence and phosphorescence, respectively) were assumed to be proportional to peak heights on the traces of the total luminescent emission. A correction was made for the spectral response of the photometer by measuring its response to light from a lamp of known color temperature. In comparing fluorescence in PM MA to that of the same sensitizer in PVC, coatings with nearly the same sensitizer concentration and absorption were used. No phosphorescence was observed with any of the samples at room temperature. Results are summarized in Table II.
The two sensitizers which phosphoresce in PMMA (M K and PNA) have this emission quenched com
(6) A. Smakula and A. Wassermann, Z . Physik. Chem., A155, 353 (1931).
Volume 71, Number 8 February 1967
770 N otes
pletely in poly (vinyl cinnamate). At the same time, the two which fluoresce in PMMA show as much or more fluorescence in PVC. Borgman, et al,,7 have reported that Michler’s ketone does not fluoresce in methanol. The emission observed in our work persisted after several recrystallizations, but may be due to an impurity.
These experiments indicate that cinnamate does not remove energy from the excited singlet states of M K or P, but it does interact with the excited triplet states of MK, and probably of PNA, at least at 77°K. The transfer of triplet energy from sensitizer to cinnamate, followed by dimerization, is a likely mechanism of the reaction at room temperature. Liu, Turro, and Hammond8 have shown that the dimerizations of isoprene and of butadiene photosensitized by M K and by a number of other compounds proceed by a similar mechanism.
(7) V. A. Borgman, I. A. Zhmyreva, V. V. Zelinskii, and V. P. Kolobkov, Dokl. Akad. Nauk SSSR, 131, 781 (1960).(8) R. S. H. Liu, N. J. Turro, and G. S. Hammond, J. Am. Chem. Soc., 87, 3406 (1965).
Magnetic Susceptibility Changes in Silver
Powders during Oxidation-Reduction Cycling
by A. W. Czandema1
Union Carbide Corporation, Chemicals Division,Research and Development Department,South Charleston, West Virginia (Received August 11, 1966)
A limited number of magnetic susceptibility measurements have been made when a paramagnetic gas is chemisorbed on a diamagnetic solid. These include the adsorption of oxygen or nitric oxide on alumina,2-4 silica gel,6 chromia,6 and cuprous oxide.7 These oxides all have relatively high surface areas compared with metal powders, and therefore it is not surprising that little if any work has been done on the latter.
The existence of 0 2~, which should be paramagnetic, on silver metal has been postulated,8 and indirect evidence has been obtained that supports this hypothesis.9 In recent studies,10'11 it was demonstrated that silver powder may be cleaned satisfactorily by OAOR cycling.12 * The cleaned silver surface not only exhibited a constant surface area and reproducible chemisorption but also was not poisoned by bulk diffusion of soluble oxygen and did not adsorb hydrogen, carbon monoxide, carbon dioxide, or water.11,13 Thus, thè silver-oxygen
system is of special interest because a detailed quantitative study of the magnetic susceptibility of adsorbed species appears to be feasible experimentally. The results of this type of study would be important for elucidating the nature of chemisorbed species.
For the method used in this study, the sample must not only retain the reproducible chemisorption characteristics as reported,11 but also be suspended easily into a magnetic field of a Faraday apparatus14 1 2 3 4 5 6 7 8 9 10 11 12 13 14 and be free of ferromagnetic contamination on the surface. It has been suggested that iron contamination on a silver surface can be removed by use of carbon monoxide;9 therefore, this study was carried out to determine the efficiency of this treatment and to determine the effect of the necessary OAOR cycling in hydrogen at an elevated temperature on the ferromagnetic contamination of silver powder.
E x p e r i m e n t a l S e c t i o n
To satisfy the geometry requirements of the susceptibility apparatus14 and to maximize the sample to container ratio, the silver powder was pressed into cylinders 5 mm high and 2 mm in diameter about a coaxially positioned quartz fiber 0.2 mm in diameter. A special case-hardened iron mold was used to minimize introducing ferromagnetic contamination to the silver. The cylinders were compressed to about one-third of the bulk density of silver. Fourteen cylinders of the same mass (50 mg) were prepared. Three were kept as blanks and the remaining eleven were suspended in a vacuum system for purification treatment. For this, the samples were subjected to OAOR cycling at 400° using hydrogen as the reducing gas to reduce the silver surface and iron oxide present on the surface. The
(1) Clarkson College of Technology, Potsdam, N. Y. 13676.(2) L. N. Mulay and L. K. Keys, J. Am. Chem. Soc., 86, 4489 (1964).(3) A, Solbakken and L. H. Reyerson, J. Phys. Chem., 64, 1903 (1960),(4) A. Solbakken and L. H. Reyerson, ibid., 63, 1622 (1959).(5) R. W. Zuehlke, Dissertation Abstr., 22, 1432 (1961).(6) K. Tarama, S. Teranishi, and K. Hattori, Nippon Kagaku Zasshi, 81, 1665 (1960).(7) J. D. Cotton and P. J. Fenshaw, J. Phys. Chem., 68, 1052 (1964).(8) J. H. de Boer, Advan. Catalysis, 8, 76 (1956).(9) J. T. Kummer, J. Phys. Chem., 63, 460 (1959).(10) A. W. Czanderna, ibid., 68, 2765 (1964).(11) A. W. Czanderna, ibid., 70, 2120 (1966).(12) OAOR cycling is repeated exposure of the sample to outgassing, oxygen adsorption, outgassing, and chemical reduction at a constant elevated temperature using the same ambient pressure in each adsorption and reduction step.(13) A. W. Czanderna, J. Colloid Interface Sci., in press.(14) D. E. Soule, C. W. Nezbeda, and A. W. Czanderna, Rev. Sci. Instr., 35, 1504 (1964).
The Journal o f Physical Chemistry
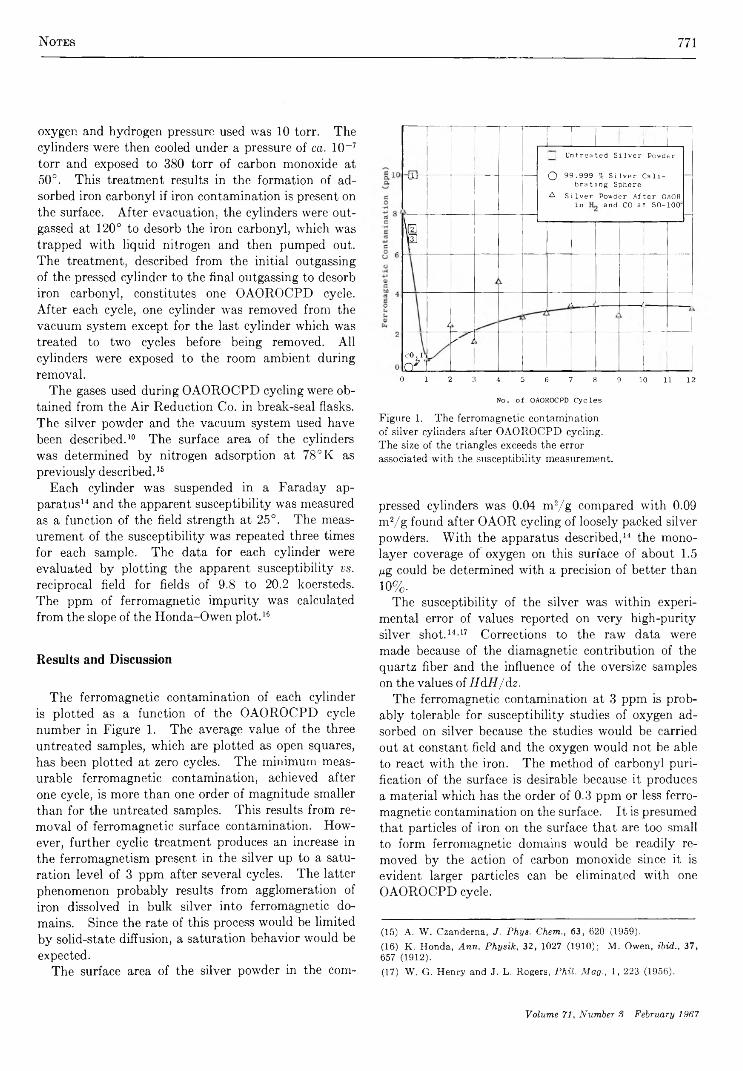
Notes 771
oxygen and hydrogen pressure used was 10 torr. The cylinders were then cooled under a pressure of ca. 10-7 torr and exposed to 380 torr of carbon monoxide at 50°. This treatment results in the formation of adsorbed iron carbonyl if iron contamination is present on the surface. After evacuation, the cylinders were out- gassed at 120° to desorb the iron carbonyl, which was trapped with liquid nitrogen and then pumped out. The treatment, described from the initial outgassing of the pressed cylinder to the final outgassing to desorb iron carbonyl, constitutes one OAOROCPD cycle. After each cycle, one cylinder was removed from the vacuum system except for the last cylinder which was treated to two cycles before being removed. All cylinders were exposed to the room ambient during removal.
The gases used during OAOROCPD cycling were obtained from the Air Reduction Co. in break-seal flasks. The silver powder and the vacuum system used have been described.10 The surface area of the cylinders was determined by nitrogen adsorption at 78 °K as previously described.15 16 17
Each cylinder was suspended in a Faraday apparatus14 and the apparent susceptibility was measured as a function of the field strength at 25°. The measurement of the susceptibility was repeated three times for each sample. The data for each cylinder were evaluated by plotting the apparent susceptibility vs. reciprocal field for fields of 9.8 to 20.2 koersteds. The ppm of ferromagnetic impurity was calculated from the slope of the Honda-Owen plot.16
R e s u l t s a n d D i s c u s s i o n
The ferromagnetic contamination of each cylinder is plotted as a function of the OAOROCPD cycle number in Figure 1. The average value of the three untreated samples, which are plotted as open squares, has been plotted at zero cycles. The minimum measurable ferromagnetic contamination, achieved after one cycle, is more than one order of magnitude smaller than for the untreated samples. This results from removal of ferromagnetic surface contamination. However, further cyclic treatment produces an increase in the ferromagnetism present in the silver up to a saturation level of 3 ppm after several cycles. The latter phenomenon probably results from agglomeration of iron dissolved in bulk silver into ferromagnetic domains. Since the rate of this process would be limited by solid-state diffusion, a saturation behavior would be expected.
The surface area of the silver powder in the com-
1 | Untreated Silver PowderO 99.999 % Silver Calibrating Sphere A Silver Powder After OAOR in and CO at 50-100°
lLi
\mpD
L
— ---- 1—
< vû l.
/ L
0 1 2 3 4 5 6 7 8 9 10 11 12No. of OAOROCPD Cycles
Figure 1. The ferromagnetic contamination of silver cylinders after OAOROCPD cycling. The size of the triangles exceeds the error associated with the susceptibility measurement.
pressed cylinders was 0.04 m2/g compared with 0.09 m2/ g found after OAOR cycling of loosely packed silver powders. With the apparatus described,14 the mono- layer coverage of oxygen on this surface of about 1.5 /rg could be determined with a precision of better than 10%.
The susceptibility of the silver was within experimental error of values reported on very high-purity silver shot.14,17 Corrections to the raw data were made because of the diamagnetic contribution of the quartz fiber and the influence of the oversize samples on the values of HdH/dz.
The ferromagnetic contamination at 3 ppm is probably tolerable for susceptibility studies of oxygen adsorbed on silver because the studies would be carried out at constant field and the oxygen would not be able to react with the iron. The method of carbonyl purification of the surface is desirable because it produces a material which has the order of 0.3 ppm or less ferromagnetic contamination on the surface. It is presumed that particles of iron on the surface that are too small to form ferromagnetic domains would be readily removed by the action of carbon monoxide since it is evident larger particles can be eliminated with one OAOROCPD cycle.
(15) A. W. Czanderna, J. Phys. Chem., 63, 620 (1959).(16) K. Honda, Ann. Physik, 32, 1027 (1910); M. Owen, ïbid., 37, 657 (1912).(17) W. G. Henry and J. L. Rogers, Phil. Mag., 1, 223 (1956).
Volume 71, Number S February 1967

772 Notes
Acknoivledgments. The author is grateful to Dr.D. E. Soule and Dr. F. G. Young for discussions. The assistance of Miss L. I. Forrest and C. W. Nezbeda in carrying out the experimental work is appreciated.
The Radiation-Induced Oxidation of
Peptides in Aqueous Solutions1
by Harriette L. Atkins, Winifred Bennett-Corniea, and Warren M. Garrison
Lawrence Radiation Laboratory, University of California,Berkeley, California {Received August 12, 1966)
Radiolysis of certain compounds of the type RCON- HCHR2 in dilute aqueous solution containing 0 2 leads to formation of labile peptide derivatives which are readily degraded on mild hydrolysis to give ammonia and carbonyl compounds as characteristic products.2 It has been proposed2’3 that such oxidation in the case of peptides derived from the simpler amino acids, glycine and alanine, is initiated by a preferential attack of the OH radical at the carbon-hydrogen position a to the nitrogen function. The over-all reaction scheme includes the radiation-induced step4 5
H20 > H20 2, H2, OH, H, e .,- , H+ (1)
followed by
OH + RCONHCHR2 — > H20 + RCONHCR2 (2)
0 2 + RCONHCR2 — > R C 0N H C (02)R 2 (3)
The reducing species, eaq~ and H, are scavenged quantitatively by 0 2 to form 0 2~ and H 02, which are related by the equilibrium6 H 02 «=* 0 2~ + H+. Proposed reaction modes for removal of the intermediate peroxy radicals include
RC0N H C (02)R2 — > R C O N =C R 2 + H 02 (4)
H 02 + RC0N H C (02)R2 — >RCONHC(OOH)R2 + 0 2 (5)
H20 + RCONHC(OOH)R2 — >RC0N H C(0H )R2 + H20 2 (6)
where R C O N =C R 2 represents a dehydropeptide and RCONHC(OH)R2 the corresponding hydrate. Such compounds readily decompose on hydrolysis6
R C O N =C R 2 + 2H20 — >RCOOH + NHS + R2CO (7)
RCONHC(OH)R2 + H20 — >RCOOH + NH3 + R2CO (8)
The above reaction scheme requires that the ammonia and carbonyl yields be in the relationship G(NH3) = (?(R2CO) = Cron where the latter term represents the 100-ev yield for OH production in the radiation-induced step 1. We have measured ammonia and carbonyl yields in the 7-ray-induced oxidation of N- acetylglycine,30 glycine anhydride,3d N-acetylalanine, and alanine anhydride in oxygenated 0.1 I solution and we find for each system G(NHS) ~ 3, which value is consistent with recent measurements7 of the maximal yield of OH radical in the 7 radiolysis of water containing reactive solutes. On the other hand, we also find that carbonyl production in these simple peptide systems is not in accord with the quantitative requirements of the proposed oxidation scheme; the initial carbonyl yields are uniformly low with (?(R2CO) < 0.8. There is then the question as to whether this apparent discrepancy arises from (a) an incorrect formulation of the locus of initial OH attack or from (b) unspecified complexities in the chemistry of removal of the peroxy radicals RC0N H C(02)R2.
To obtain specific information on this point, we have employed Fe(III) instead of 0 2 as the scavenger of intermediate radicals formed in the radiolysis of N- acetylalanine and N-acetylglycine. Heavy metal ions such as Fe(III) and Cu(II) oxidize organic free radicals in aqueous solution by electron transfer and by ligand transfer.8 Such reactions in the case of the peptide radical RCONHCR2 would correspond to
RCONHCR2 + Fe(III) — >R C O N =C R 2 + Fe(II) + H+ (9)
RCONHCR2 + Fe(III) + H20 — ►RCONHC(OH)R2 + Fe(II) + H+ (10)
(1) This work was performed under the auspices of the U. S. Atomic Energy Commission, AEC Contract No. W-7405-eng-48.(2) M. E. Jayko, B. M. Weeks, and W. M. Garrison, Proc. Intern. Con}. Peaceful Uses At. Energy, Geneva, 2nd, 29, 30 (1958).(3) (a) W. M. Garrison, M. E. Jayko, and W. Bennett-Corniea, Radiation Res., 16, 483 (1962) ; (b) W. M. Garrison and B. M. Weeks, ibid., 17, 341 (1962); (c) W. M. Garrison, Radiation Res., Suppl., 4, 148 (1964); (d) W. Bennett-Corniea and W. M. Garrison, UCRL- 8988, Dec 1959.(4) (a) A. O. Allen, Radiation Res., Suppl., 4, 54 (1964); (b) E. J. Hart, Science, 146, 19 (1964).(5) G. Czapski and H. J. Bielski, J. Phys. Chem., 67, 2180 (1963).(6) J. P. Greenstein and M. Winitz, “ Chemistry of the Amino Acids,” John Wiley and Sons, Inc., New York, N. Y., 1961, p 843.(7) E. Hayon, Trans. Faraday Soc., 61, 723 (1965).(8) J. H. Baxendale and D. H. Smithies, Z. Physik. Chem,., 7, 242 (1956); H. E. DeLaMare, J. K. Kochi, and F. F. Rust, J. Am. Chem. Soc., 85, 1437 (1963).
The Journal of Physical Chemistry

Notes 773
respectively. We note that the organic products of reactions 9 and 10 are identical with the postulated products of reactions 4 and 6.
Experimental SectionSolutions containing the acetylamino acid (Nutri
tional Biochemicals, twice recrystallized) plus ferric sulfate (CP) were adjusted to pH 3 with sulfuric acid to retain Fe(III) in solution, evacuated, and then irradiated with Co60 y rays to a dose of not more than ■~5 X 10¹⁸ ev/ml. Above this value the dose-yield curves were no longer linear. Dose was determined with the Fricke dosimeter, (7(Fe(III)) = 15.5, eFectin 2130 at 305 m/u and 22°. Immediately after irradiation, an aliquot was passed through a Dowex-50 column (1 cm X 10 cm), acid form, to remove iron. The eluent was made 2 A in hydrochloric acid, heated to 100° for 60 min, cooled, and assayed for a-keto acid and aldehyde through use of the 2,4-dinitrophenylhy- drazine reagent.9 A second aliquot was made 2 A in sodium hydroxide, allowed to stand 24 hr in the outer compartment of a Conway diffusion cell to liberate ammonia which was collected in 0.1 A sulfuric acid in the inner compartment, and assayed by the standard Tollen procedure. Control runs established that product hydrolysis and ammonia transfer were quantitative under these experimental conditions.
Results and DiscussionAmmonia production (Figure 1) in 0.1 M acetyl-
alanine increases abruptly from t?(NH3) = 0.7 to G (NH3) = 4.3 with increasing concentrations of Fe(III) up to ^ 10~ 3 M. The ammonia yield then falls gradually to a limiting value of (?(NH3) = 3.3 at the higher Fe(III) concentrations. We also find under these conditions that pyruvic acid and ammonia are formed in equal molar yields. Yields of glyoxylic acid and ammonia from acetylglycine show this same quantitative relationship. Aldehyde yields from these systems are low, G ~ 0.1.
At the higher (Fe(III))/(peptide) ratios of Figure 1, the reducing species, eaq~ and H, are preferentially scavenged by Fe(III)
eaq- + Fe(III) — > Fe(II) (11)
H + Fe(III) — ■> Fe(II) + H+ (12)
and under these conditions the yield for peptide oxidation via reaction 2 followed by reactions 9 and 10 is in accord with
—G(peptide) = C(NHS) =G(RCOCOOH) csi 3 .2 G qh + (jh 2o2
Figure 1. Effect of Fe(III) concentration on the yields of ammonia (•) and pyruvic acid (A) from 0.1 M
acetylalanine and of ammonia (O) and glyoxylic acid (A ) from 0.1 M acetylglycine.
Figure 2. Effect of acetylalanine concentration on yields of ammonia (•) and of pyruvic acid (A) from solutions containing 0.05 M Fe(III).
Hydrogen peroxide formed in the radiation-induced step 1 reacts rapidly with Fe(II) to give an additional yield of OH radicals.10 The maximum in the yield curve shown in Figure 1 is attributed to the onset of the reaction
H + RCONHCHR2 — ^ RCONHCR2 + H2 (13)
in competition with reaction 12 as the Fe(III) concentration is reduced below 0.05 M. The RCONHCR2 radicals from both reactions 2 and 13 are then available for oxidation by Fe(III) via steps 9 and 10. The H
(9) G. R. A. Johnson and G. Scholes, Analyst, 79, 217 (1954); T. E. Friedemann and G. E. Haugen, ./. Biol. Chem., 147, 415 (1943).(10) F. Haber and J. Weiss, Proc. Roy. Soc. (London), A147, 333 (1934).
Volume 71, Number 3 February 1967

774 Communications to the Editor
atoms involved in reaction 13 are derived from the radiation-induced step 1 and the conversion reaction
eaq~ + H+ - > H (14)
which at pH 3 is in competition with reaction 11 at the lower Fe(III) concentrations. At Fe(III) concentrations below ^ ÌO -3 M, the dimerization of RCONHCR2 radicals3b becomes competitive with reactions 9 and 10 and the ammonia yield is depressed accordingly.
If now the Fe(III) concentration is kept constant at 0.05 M and the acetylalanine concentration is increased over the range 10“ 3 to 1.5 M, it is found (Figure2) that the ammonia and pyruvic acid yields are essentially equivalent and approach a limiting value of G ~ 3.9 at acetylalanine concentrations above 0.25M. At these higher (peptide)/(Fe(III)) ratios, the H atoms formed in the radiation-induced step 1 are not scavenged by Fe(III) but are preferentially removed via reaction 13. (The conversion reaction 14 at pH 3 is wholly quenched by 0.05 M Fe(III).) Hence we have the higher limiting oxidation yield which is in accord with the stoichiometry
-G(peptide) = G(NH3) = G(R2CO) ~4.0 ~ (j o h + f r H s O j + ( ? H
We conclude that the reaction of OH and H radicals with these peptide derivatives of the simpler amino acids, glycine and alanine, occurs essentially quanti
tatively at the a position as formulated in reactions 2 and 3.11 The present data also establish the quantitative oxidation of RCONHCR2 radicals by Fe(III) via reactions 9 and 10. In the case of acetylalanine such oxidation appears to occur almost exclusively through ligand transfer (reaction 10) since measurements of the optical absorption of the irradiated solutions (after removal of Fe(III)) reveal negligible absorption above 230 m/u when read differentially against unirradiated control solution. Absorption by control solutions containing authentic acetyldehydroalanine12 1 2 3 4 5 6 7 (e24o 6050) show that G values of >0.1 for reaction 9 would be detectable. To our knowledge the optical properties of acetyldehydroglycine have not been described.
The low carbonyl yields obtained when 0 2 is used in place of Fe(III) as the radical scavenger are interpreted here as evidence that other more complex degradation reactions occur in parallel with the dehydrogenation and hydroxylation reactions 4-6. The nature of these more complex branching reactions of the peroxy radical RC0N H C(02)2 is presently under study.
(11) We refer to radical attack at the C-H linkage a to the nitrogen function as the characteristic peptide reaction. With the more complicated amino acid residues, attack may occur in parallel or exclusively at side-chain loci. See ref 3 and H. A. Sokol, W. Bennett- Corniea, and W. M. Garrison, J. Am. Chem. Soc., 87, 1391 (1965).(12) We are indebted to Dr. B. M. Weeks for the sample of authentic acetyldehydroalanine which was prepared after the method of V. E. Price and J. P. Greenstein, Arch. Biochem., 10, 383 (1948).
C O M M U N I C A T I O N S T O T H E E D I T O R
The Absorption Spectrum of the Allyl Radical
by Pulse Radiolysis1
Sir: The identification of the optical absorption spectrum of the allyl radical has been the subject of much discussion and various investigators have suggested widely different values for its absorption maxima.2“ 7
We have observed the absorption spectrum of the transient allyl radical in the pulse radiolysis of dilute solutions of allyl bromide in cyclohexane and have obtained a preliminary value for its absolute rate constant for termination.
All of the pulse radiolysis experiments were performed using the linear electron accelerator at
Argonne National Laboratory. A typical run consisted in introducing a several-joule pulse of 13.5-Mv electrons into a 15-ml sample at 22°. Transient optical absorption analysis over a 16.0-cm optical path length was carried out in a manner similar to previous work.8,9
(1) Based on work performed under the auspices of the TJ. S. Atomic Energy Commission.(2) D. M. Bodily and M. Dole, J. Chem. Phys., 44, 2821 (1966).(3) M. B. Fallgatter and M. Dole, J. Phys. Chem., 68,1988 (1964).(4) D. A. Ramsay, J. Chem. Phys., 43, S18 (1965).(5) C. L. Currie and D. A. Ramsay, ibid., 45,438 (1966).(6) S. Ohnishi, S. Sugimoto, and I. Nitta, ibid., 39, 2647 (1963).(7) H. C. Longuet-Higgins and J. A. Pople, Proc. Phys. Soc. (London), A68, 591 (1955).
The Journal o f P hysica l Chem istry

Communications to the Editor 775
Figure 1 shows the absorption spectrum observed when a deoxygenated cyclohexane solution containing5.0 X 10~2 M allyl bromide was irradiated. The following additional facts serve to characterize this absorption spectrum as that due to the allyl radical.
(a) No absorption in this region is observed when deoxygenated pure cyclohexane is irradiated, although the well-known cyclohexyl peroxy spectrum10 is observed when oxygen is present. The rate constant for the second-order termination of cyclohexyl peroxy radicals is much smaller than the rate constant we measure; viz., k = 1.6 X 10⁶ M ~1 sec-1.
Figure 1. The absorption spectrum of the allyl radical.
(b) No absorption is observed when either allyl chloride or allyl alcohol, present at 5.0 X 10⁻² M in deoxygenated cyclohexane, is irradiated.
(c) When the allyl bromide-cyclohexane solution is concentrated after irradiation, cyclohexyl bromide is Observed as a final product by nmr, by mass spectrometry, and by gas-liquid partition chromatography, together with a smaller amount of an as yet unidentified product.
From (a) it is concluded that the transient spectrum is due to the presence of allyl bromide in the irradiated solution. Since the transient absorption is observed in allyl bromide solution, but not in allyl chloride or allyl alcohol solution, the 3100-A absorption appears to be due to the CH2—CH—CH2 radical formed by bromine atom abstraction by cyclohexyl radicals. If the absorption were due to a radical formed by abstraction of a hydrogen atom from allyl bromide, a similar result would be expected in the allyl chloride and allyl alcohol solutions. This is not observed. Furthermore, the presence of an appreciable percentage of cyclohexyl bromide among the final products sub
stantiates a mechanism involving bromine atom abstraction from the allyl bromide.
The 3100-A absorption due to the allyl radical disappears by a second-order process. A rate constant for this reaction, k = (7.7 X 10⁵)e M~x sec“ 1, was obtained by a computer analysis of the absorption as a function of time^ using an adaptation11 of the chloe system at Argonne. This value of k is good to about 20% when the correct value of e is used. A tentative value for e was calculated by means of end-product analysis: e = 2.6 X 10³ M~l c m '1. An exact evaluation of e will be made based on the detailed examination of the reaction mechanism and a more precise determination of end products which is now in progress.
Acknowledgment. The authors gratefully acknowledge the assistance of Mr. E. Backstrom and Mr. B. E. Clifft in operating the Linac.
(8) J. Rabani, W. A. Mulao, and M. S. Matheson, J. Phys. Chem„ 69, 53 (1965).(9) E. J. Burrell, Jr., ibid., 66,401 (1962).(10) R. L. McCarthy and A. MacLachlan, J. Chem. Phys., 35, 1625 (1961).(11) M. Sauer, “A Method for Automatic Analysis of Data on the Kinetics of Fast Chemical Reactions in the Form of Pictures of Oscilloscope Traces,” Argonne National Laboratory Report ANL-7113, Oct 1965.(12) Summer Resident Research Associate, Argonne National Laboratory.(13) Resident Student Associate, Argonne National Laboratory.
C h e m i s t r y D e p a r t m e n t E. J. B u r r e l l , Jr .12L o y o l a U n i v e r s i t y
C h i c a g o , I l l i n o i s 6 0 6 2 6
C h e m i s t r y D i v i s i o n P. K . B h a t t a c h a r y y a 13
A r g o n n e N a t i o n a l L a b o r a t o r y
A r g o n n e , I l l i n o i s
R e c e i v e d O c t o b e r 2 6 , 1 9 6 6
Reply to Bond Lengths in Iron Pentacarbonyl
Sir: We wish to comment upon a recent communication to this journal by Donohue and Caron1 concerning our investigation of iron pentacarbonyl by the gas- phase electron diffraction technique.2
The most significant question posed by Donohue and Caron is “ whether the electron diffraction data are capable of detecting a difference of only 0.045 A between the two kinds of Fe-C bonds because of the high correlation between that difference and the vibrational amplitudes.” This statement is mainly meaningful in the context of attempting to resolve two closely 1 2
(1) J. Donohue and A. Caron, J. Phys. Chern... 70, 603 (1966).(2) M. 1. Davis and H. P. Hanson, ibid., 69, 3405 (1965).
V olum e 71, N um ber 3 February 1967
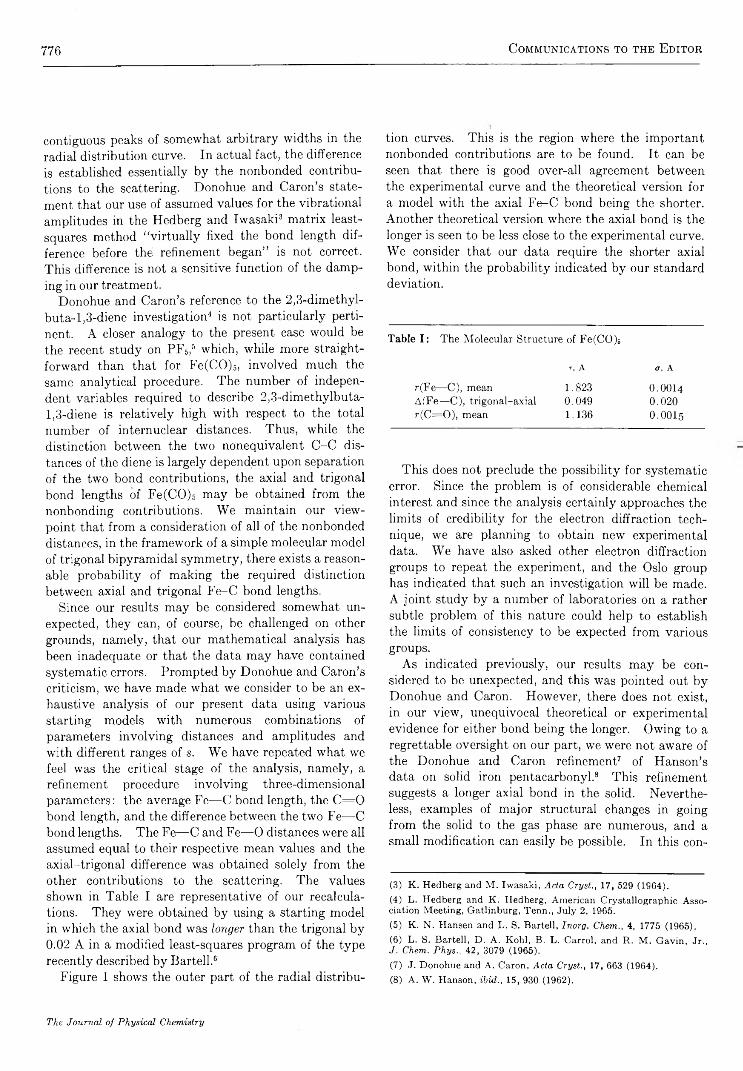
776 Communications to the Editor
contiguous peaks of somewhat arbitrary widths in the radial distribution curve. In actual fact, the difference is established essentially by the nonbonded contributions to the scattering. Donohue and Caron’s statement that our use of assumed values for the vibrational amplitudes in the Hedberg and Iwasaki3 matrix least- squares method “ virtually fixed the bond length difference before the refinement began” is not correct. This difference is not a sensitive function of the damping in our treatment.
Donohue and Caron’s reference to the 2,3-dimethyl- buta-1,3-diene investigation4 is not particularly pertinent. A closer analogy to the present case would be the recent study on PF5,5 which, while more straightforward than that for Fe(CO)5, involved much the same analytical procedure. The number of independent variables required to describe 2,3-dimethylbuta-1,3-diene is relatively high with respect to the total number of internuclear distances. Thus, while the distinction between the two nonequivalent C-C distances of the diene is largely dependent upon separation of the two bond contributions, the axial and trigonal bond lengths of Fe(CO)5 may be obtained from the nonbonding contributions. We maintain our viewpoint that from a consideration of all of the nonbonded distances, in the framework of a simple molecular model of trigonal bipyramidal symmetry, there exists a reasonable probability of making the required distinction between axial and trigonal Fe-C bond lengths.
Since our results may be considered somewhat unexpected, they can, of course, be challenged on other grounds, namely, that our mathematical analysis has been inadequate or that the data may have contained systematic errors. Prompted by Donohue and Caron’s criticism, we have made what we consider to be an exhaustive analysis of our present data using various starting models with numerous combinations of parameters involving distances and amplitudes and with different ranges of s. We have repeated what we feel was the critical stage of the analysis, namely, a refinement procedure involving three-dimensional parameters: the average Fe— C bond length, the C = 0 bond length, and the difference between the two Fe— C bond lengths. The Fe— C and Fe— 0 distances were all assumed equal to their respective mean values and the axial-trigonal difference was obtained solely from the other contributions to the scattering. The values shown in Table I are representative of our recalculations. They were obtained by using a starting model in which the axial bond was longer than the trigonal by 0.02 A in a modified least-squares program of the type recently described by Bartell.6
Figure 1 shows the outer part of the radial distribu
tion curves. This is the region where the important nonbonded contributions are to be found. It can be seen that there is good over-all agreement between the experimental curve and the theoretical version for a model with the axial Fe-C bond being the shorter. Another theoretical version where the axial bond is the longer is seen to be less close to the experimental curve. We consider that our data require the shorter axial bond, within the probability indicated by our standard deviation.
Table I: The Molecular Structure of Fe(CO)5
r , A a , A
r(Fe—C), mean 1.823 0.0014A(Fe—C), trigonal-axial 0.049 0.020r(C = 0), mean 1.136 0.0015
This does not preclude the possibility for systematic error. Since the problem is of considerable chemical interest and since the analysis certainly approaches the limits of credibility for the electron diffraction technique, we are planning to obtain new experimental data. We have also asked other electron diffraction groups to repeat the experiment, and the Oslo group has indicated that such an investigation will be made. A joint study by a number of laboratories on a rather subtle problem of this nature could help to establish the limits of consistency to be expected from various groups.
As indicated previously, our results may be considered to be unexpected, and this was pointed out by Donohue and Caron. However, there does not exist, in our view, unequivocal theoretical or experimental evidence for either bond being the longer. Owing to a regrettable oversight on our part, we were not aware of the Donohue and Caron refinement7 of Hanson’s data on solid iron pentacarbonyl.8 This refinement suggests a longer axial bond in the solid. Nevertheless, examples of major structural changes in going from the solid to the gas phase are numerous, and a small modification can easily be possible. In this con-
(3) K. Hedberg and M. Iwasaki, Acta Cryst., 17, 529 (1964).(4) L. Hedberg and K. Hedberg, American Crystallographic Association Meeting, Gatlinburg, Tenn., July 2, 1965.(5) K. N. Hansen and L. S. Bartell, Inorg. Chem., 4, 1775 (1965).(6) L. S. Bartell, D. A. Kohl, B. L. Carrol, and R. M. Gavin, Jr., J. Chem. Phys., 42, 3079 (1965).(7) J. Donohue and A. Caron, Acta Cryst., 17, 663 (1964).(8) A. W. Hanson, ibid., 15, 930 (1962).
The Journal o f P h ysica l Chem istry

Communications to the Editor 777
Figure 1. The radial distribution curve of Fe(CO)s in the region 3 .2 -6 .5 A: □, experimental curve; *, r(Fe-C)tr — r(Fe-C)as = 0.048 A; --------- , r(Fe-C)ax — r(Fe-C)tr = 0.020 A. Damping factor = exp( —0.008s2).
text, it is interesting to note that Donohue and Caron’s value for the average Fe-C bond length differs by 0.03 A from ours.
From the point of view of theory, if one compares the orbital description of PF5, in which the axial bonds are longer by 0.05 A, and Fe(CO)5, a number of important differences are encountered. In PF5 the d orbitals which might be used to stabilize the axial bonds are higher in energy than the s or p orbitals. Bartell has expressed doubts that the d-orbital contribution to bonding is at all significant, formulating his arguments in the context of the Rundle approach. In Fe(CO)6, on the other hand, the d orbitals are of lower energy than the p and may consequently be expected to add to the stability of the axial bonds. There is the further factor of back-donation in Fe(CO)5. A consideration of the respective symmetries of the occupied Fe orbitals and the antibonding CO orbitals show that multiple bonding is more favorable in the axial direction. On the basis of these considerations, a model in which the
axial Fe-C bond is shorter does not appear unreasonable.D epartm ent of C hem istry T he U n iversity of T e x a s A u stin , T e x a s 78712
D epartm ent of Physics T he U niver sity of T e x a s A u stin , T e x a s 78712
R eceived Septem ber 6, 1966
The Iron Pentacarbonyl Problem
Sir: The preceding letter by Davis and Hanson1 contains a number of points which we feel deserve comment.
First, we beg to disagree that the most significant question posed by us2 was whether the electron dif
(1) M. I. Davis and H. P. Hanson, J. Phys. Chem., 71, 775 (1967).
M . I. D avis
H . P. H anson
Volume 71, Number 3 February 1967

778 Communications to the Editor
fraction data were detecting a difference of only 0.045 A between the two kinds of Fe-C bonds. Our principal point was (and is) that the crystal structure results3 did not provide confirmation of the structure with shorter (Fe-C)axiai bond lengths proposed by them.4
Davis and Hanson now1 call attention to the fact that our average Fe-C bond length differs from theirs by 0.03 A, with the implication that the molecular structures in the gas and the solid may not be the same. Perhaps so, but the evidence now available does not support this view: in the gas,1 (Fe-C) m ean 1 • 823 ±O.OOI4 A, and in the solid,3 (F&-C)mean = 1.795 ± 0.020 A. The difference of 0.028 A, with a <7 of 0.020 A, is significant at the 8% level, or clearly in the “ not- significant” range, as defined by Cruickshank.6
Regarding the two closely contiguous and therefore unresolved peaks in the radial distribution function, no one can argue that there is not a high correlation between the separation between them and the vibrational amplitudes, as we have already pointed out.2 This difficulty may be obviated in certain special cases, such as the example of PF56 cited by Davis and Hanson. We are, however, unable to understand why they consider that the electron diffraction investigation of this molecule is germane to the present problem: the radial distribution function of PF5 consists of four rather sharp, well-separated peaks, only one of which is composite, and it was accordingly a simple matter for Hansen and Bartell to determine, with a high degree of precision, the two variables which characterize the molecule and to conclude that the (P -F )axiai bond distance was greater than the (P -F )equatoriai bond distance by 0.043 ± 0.008 A. This situation is in sharp contrast to that in Fe'CO)», the radial distribution function of which has six peaks, two of which are rather well-defined shoulders and one of which, the outermost, is a rather ill-defined smear at about 5.9 A. Of these, five are composite and the position of the sixth, the outermost, does not depend directly on whether or not the two kinds of Fe-C bonds are equal in length. There is, accordingly, a serious resolution problem and the assumed vibration amplitudes, which have a marked effect not only on the width of the peaks but also on the positions of the shoulders, should be included as parameters in the refinement, together with the bond length difference.
We agree that other electron diffraction groups should repeat the experiment and for that reason see no point in making detailed comments on some rather curious features of the radial distribution functions presented by Davis and Hanson.1
Finally, we feel that a quantum mechanical discussion of this molecule is premature. Given a correct
molecular structure, an MO description which “ explains” that structure can usually be found.7 In the present case, it would seem more prudent to wait until the structure is firmly established.
(2) J. Donohue and A. Caron, J. Phys. Chem., 70, 603 (1966).(3) J. Donohue and A. Caron, Acta Cryst., 17, 663 (1964).(4) M. 1. Davis and H. P. Hanson, J. Phys. Chem., 69, 3405 (1965).(5) D. W. J. Cruickshank, Acta Cryst., 2, 65 (1949).(6) K. N. Hansen and L. S. Bartell, Inorg. Chem., 4, 1775 (1965).(7) See, for example, A. G. Turner and F. S. Mortimer, ibid., 5, 906 (1966).
D epabtm ent of C hem istry J. D on o h u e
U niver sity of Pen n sylv a n ia Ph ilad elph ia , Pe n n sy l v a n ia
D epartm ent of Chem istry A . C aron
U niver sity of M assachusetts A m herst , M assach usetts
R eceived D ecem ber 1, 1966
Comments on the Paper,
“ Cation Exclusion from Gels,” by R. A. Horne
Sir: Horne1 disagrees with us concerning our interpretation2 of the exclusion of aqueous ions from part of the pore volume of high surface area materials. The fact of exclusion has been known for a long time, but up until recently there has been very little discussion as to its explanation. Redfern and Patrick3 were unable to explain it. Plank4 observed it for certain ions, referring to “ negative adsorption” in certain cases, and Konyushka5 reported it for aqueous nonelectrolytes in the pores of silica gel. We reported that when a silica gel adsorption column is just filled with aqueous hexa- chloroplatinic acid there is a depletion of the acid in the first part of the column with a corresponding enrichment in the latter part.6
We later made several studies of ion exclusion,7 usually with silica gel, and we concluded2 that the principal if not the only reason is a geometric one and that we consequently are measuring ion hydrate size
(1) R. A. Horne, J. Phys. Chem., 70, 1335 (1966).(2) B. L. McConnell, K. C. Williams, J. L. Daniel, J. H. Stanton, B. N. Irby, D. L. Dugger, and R. W. Maatman, ibid., 68, 2941 (1964).(3) S. Redfern and W. A. Patrick, ibid., 42, 497 (1938).(4) C. J. Plank, ibid., 57, 584 (1953).(5) (a) I. M. Konyushka, Uch. Zap. Belorussk. Gos. Univ., 140 (1953); (b) ibid., 282 (1956); (c) Vestsi Akad. Navuk Belarusk. SSR, Ser. Fiz-Tekhn. Navuk, 111 (1956).(6) R, W. Maatman and C. D. Prater, Ind. Eng. Chem., 49, 253 (1957).(7) See ref 2 and our earlier papers referred to therein.
The Journal of Physical Chemistry
Communications to the Editor 779
when we observe exclusion. On the other hand, Horne, Ivonyushka, Plank, and others ascribe at least part of the effect to a preferential adsorption of water; some refer also to the exclusion from the smallest pores of the solute, but not of water molecules.
Unfortunately, Horne, Konyushka, and Plank do not take into account the geometric effect, an effect which by its nature must always be considered. If there is in addition preferential water adsorption or ion reaction, these effects are superimposed upon the geometric effect. The geometric effect arises when there is a difference between the sizes of the solute and solvent species. The larger species is effectively more dilute near the solution-solid interface. It is more dilute because, for species touching the interface, the distance between an average point (for a sphere, the center) of the geometric shape representing the larger species and the interface is greater than the corresponding distance for the smaller species. There is therefore a compensating enrichment of the larger species in the bulk phase. This effect becomes important where the interface area is several hundred square meters per milliliter of solution.
Horne states quite correctly that ion reaction with the surface must be included in any analysis of these systems; we have either repressed reaction or calculated its amount in all of our work.7 He suggests that a correlation between our sizes and the viscosity B coefficient indicates we are really observing water structure at the interface, not ion hydrate size. We had, however, earlier shown8 that correlation with the B coefficient is about as good as the B coefficient correlation with sizes determined in other ways.9
Our sizes scatter around those of Nightingale9 and others and there is no doubt that our method, involving as it does an assumption of the size of the “ average” water cluster and a knowledge of the pore size distribution, is less accurate than most other methods. These sources of error are not relevant to the discussion of the question of the reason for ion exclusion, since ion hydrates are of different sizes, and therefore the geometric argument given earlier must apply to at least some ions. One must make at least approximate calculations for each solution-solid experiment to determine whether or not the exclusion factor is important.
Is there on hydrated silica gel a water layer impermeable to ions? Our sizes, similar to those of others, calculated on the assumption there is no such layer, seem to be consistent with that assumption. However, the meaning of “ size” varies from one method of determination to another and our experimental error is large. Yet it is interesting to note that the ions of CsN03 “ see” exactly the same pore volume of silica gel as does water
and the ions of R bN 03 “ see” almost as much. Even though some of these ions are structure breakers, it is generally true that the less an ion is able to hydrate, the more easily it penetrates all of the pore volume water penetrates. It is difficult to explain this fact on the basis of a hydration layer and it is easily explainable on the basis of ion hydrate size.
(8) R. W. Maatman, J. Netterville, H. Hubbert, and B. Irby, J. Miss. Acad. Sei., 8, 201 (1962).(9) E. R. Nightingale, Jr., J. Phys. Chem., 63, 1381 (1959).
D epartm ent op C hem istry R ussell W. M aatm an
D ordt C ollege
Sio u x Ce n te r , I o w a 51250R eceived O ctober 24, 1966
Double-Layer Perturbation without Equilibrium
between Concentrations and Potential
Sir: In the application of the three recently proposed general equations1,2 for the treatment of nonsteady- state electrode processes without a priori separation of charging and faradaic currents, one needs explicit forms of the time derivatives (dr/di) of the surface excesses of reactant and product. An explicit form of the dr/d i, based on equilibrium considerations, was proposed1 2 and applied to impedance studies.3 This relationship does not take into account the nonequilibrium between potential and the concentrations of reactant and product at the electrode for a finite exchange current i0 different from zero. This concept of nonequilibrium is new in double-layer studies, to our knowledge, and is believed to be essential to the interpretation of nonsteady-state and periodic electrode processes. Application is made to the amalgam electrode Mz+ + ze = M(Hg), but ideas carry over to other processes.
The value of d r /d i for nonequilibrium can be expressed either directly in terms of the variables involved or by correcting for nonequilibrium the dr/d i corresponding to equilibrium. The two approaches are discussed and lead to the same final form of dr/di. For the model previously1,2 used, one has for a small perturbation and a finite i0 different from zero
d r +/d i = (ò r +/ò c s+)c»5I,i5(dc+/d0j:=o +(òr +/ òcsm) cs+, £ (dcM/ di) I=0 +
(ò r +/òE)c%,c»M(dE/di) (1)
(1) P. Delahay, J. Phys. Chem., 70, 2067 (1966).(2) P. Delahay, ibid., 70, 2373 (1966).(3) P. Delahay and G. G. Susbielles, ibid., 70, 3150 (1966).
Volume 71, Number 8 February 1967

780 Communications to the Editor
where r + is the surface excess of M z+; c, the concentration; c8, the bulk concentration; E, potential; x, distance from the electrode; t, time. When i0 -*■ ca , only two variables need be considered, instead of three in the writing of dr+ /d f; i.e., it is not possible to vary E when both cs+ and csM are constant; likewise one cannot vary one of the c8’s while keeping constant the other cs and E. However, this is not the case when io is finite. Finally, only the last term on the right-hand side of eq 1 has to be retained when i0 = 0 for the model used here.
In the other, intuitive approach we express d r +/d i as the sum of two components corresponding to equilibrium and nonequilibrium conditions. Thus one has for a finite io different from zero
dT+/dt = (dr + / dc8 +) C»M (dc + /di) x=a +
(dr+/dcSM)cs+ (dcm/di)I=o +(bV+/bE)cs+,csM(dr,ct/dt) (2)
where qet is the charge-transfer overvoltage. The first two terms on the right-hand side of eq 2 correspond to the behavior of a reversible electrode for which T+ at equilibrium is solely a function of the two independent variables c8+ and c V These terms in eq 2 account for the change of T+ resulting from the variation of c+ from c8+ to (c+)x=o and the variation of E from the equilibrium value Ee to that corresponding to (c+)z=0 and (cM)z=o, namely, Ee + qd, Vd being the diffusion overvoltage. The last term on the right- hand side of eq 2 accounts for the variation of P + when E varies from Ee + q d to Ee + va + Vet- Note that (dV+/dca+)c ,E in eq 1 is not the same as (d r+/ 5 c s + ) csm and that the same remark applies to (d r+/ c) c 8m ) c3+ ,a and (dr +/dcSM)cs+.
Equation 2 can be written in the same form as eq 1 as follows. One has dE/dt = dq/dt, q = qd + qct, and qd is given by the Nernst equation. Hence one has for a small perturbation
dr+ /d f = [(dr+/dcs+)c»M - (RT/zF) X( l /c s+) (dr +/dE) cb+,c.m ] (dc+/di)x_o +
[(dr+/d csM)cV + (RT/zF) X(1/ csm) (dr +/d E )c»+iCsM](dcM/dt)x=0 +
(dr +/dE)C‘+,cau(dE/dt) (3)
This result is of the same form as eq 1, and correlations between the different coefficients of the time derivatives are immediate. One could also derive eq 3 directly from eq 1 without splitting dP+/d i as was done in eq2.
Expressions for drii/d i and d(g + zFT+)/dt are
similar to eq 1. These results ought to be used, rather than the forms previously written,8 in the analysis of nonsteady-state and periodic electrode processes. Revised calculations have been completed for the electrode impedance and will soon be carried out for other relaxation processes.
Acknowledgment. This work was supported by the National Science Foundation and the Office of Naval Research. We thank Dr. J. E. B. Randles, University of Birmingham, and Dr. G. C. Barker, Atomic Energy Research Establishment, Harwell, for most valuable comments.
D epartm ent of Chem istry P. D e l a h a y
N e w Y or k U n iver sity K. H olub
N e w Y ork , N e w Y or k 10003 G. Susbielles
G. T essari
R eceived N o vem ber 14, 1966
Barium Ion Exchange of Linde 13-X
Sir: Recent articles1-2 3 present data on alkaline earth ion exchange of the synthetic zeolite Linde 13-X (NaX). In ref 2 the data were presented as equilibrium data and the free energies for the complete conversion of NaX into the alkaline earth forms were computed from them. In both ref 1 and 2 the data indicate that a maximum of 74% of all the sodium ions in NaX can be replaced by Ba2+ ions. We began a study of alkaline earth exchange of NaX prior to the publication of the works cited above and are in essential disagreement with portions of them. The purpose of this communication is to report our Ba2+ ion-exchange data.
The contents of the anhydrous unit cell of the NaX crystals used in ref 1 and 2 and in our work are
Na86 [ (AIO2) 86 (SI02) 106 ]
Na87 [(AIO2) 87 (Si02) 106 ]and
Na85 [(A102)85(Si02)io7]
We have discussed lattice structure and cation locations in a previous paper.3 For our present purpose it is sufficient to note that there are exchangeable cations located in two independent but interconnecting three
(1) L. V. C. Rees and C. J. Williams, Trans. Faraday Soc., 61, 1481 (1965).(2) R. M. Barrer, L. V. C. Rees, and M. Shamsuzzoha, Inorg. Nucl. Chem., 28, 629 (1966).(3) H. S. Sherry, J. Phys. Chem., 70, 1158 (1966).
The Journal of Physical Chemistry

Communications to the Editor 781
dimensional networks of cavities. One network of cavities contains 69-71 Na+ ions per unit cell (depending on whether the crystal contains 85, 86, or 87 cations per unit cell) and has ports of 9-A free diameter. The other network of cavities contains 16 Na+ ions per unit cell and has ports that are 2.5 A in free diameter.
Barium ions must diffuse through these windows in order to replace all the Na+ ions. The Ba2+ ion has a Pauling radius of 1.35 A and a Goldschmidt radius of1.43 A and should not be able to pass through the 2.5-A diameter ports. If this expectation is realized, an ion- exchange isotherm for this system based on an ion- exchange capacity of 85-87 Na+ per unit cell should terminate at Z Ba = 7%6 or about 0.82, where Z represents the equivalent ionic fractional loading of Ba2+ ions. In Figure 1 we present the ion-exchange isotherm for the BaNaX system at 25° and 0.1 total normality. The experimental technique has been described in a previous publication.4 The important point to note is that we have carefully allowed the reaction to reach equilibrium and find that the isotherm terminates at the point ZBa = 0.82 ± 0.02. We can thus conclude with some confidence that Ba2+ cannot replace the 16 Na+ per unit cell in the network of small cages, commonly called sodalite cages. This result is to be compared with termination point of Z Ba = 0.74 shown by the authors of ref 1 and 2 in their Figures5-C and 1-G, respectively. They could not conclude that the exclusion of Ba2+ ions from the network of small cavities is responsible for the low ion-exchange capacity of NaX for these ions because of the low value for maximum Ba2+ loading which was obtained.
We have very carefully determined whether or not our data are equilibrium data by tracing the Ba2+ with 133Ba2+ and have found that the system takes about 4 days to reach the equilibrium state, especially at low Ba2+ loadings. At high loadings the reaction is faster. In this respect it resembles the BaNaA system.4 In Figure 2 we have plotted the logarithm of the corrected selectivity coefficient, nK c na, defined by the equations
_ ^B iM N a2 /Ba 7+N a2
■ZNa2WlBa/Na2 7+Ba
where K is the thermodynamic equilibrium constant, Z represents equivalent ionic fractions in the zeolite, m represents ionic molalities in solution, / represents rational activity coefficients for the ions in the zeolite phase, and y represents single-ion molal activity coefficients in the solution phase. The ratio of the latter
Figure 1. The ion-exchange isotherm for the BaNaA system at 0.1 total normality and 25°.
Figure 2. The corrected rational selectivity coefficient for the BaNaA system at 0.1 total normality and 25° as a function of zeolite composition.
are thermodynamically determinable from mean molal activity coefficients because the salts of the cations have a common anion, Cl“ . Again, our data must be compared with the data reported by the authors of ref 1 and 2 in their Figures 5-D and 2-G, respectively. Their data show that log ^X cB“Na continuously increases with Ba2+ loading—if true, it is a very unique system—whereas our data show log ArX cBaNa to be continuously decreasing with increasing Ba2+ loading— a result normally expected in ion-exchange systems. We have reason to suspect that the data on alkaline earth ion exchange reported in ref 1 and 2 do not represent equilibrium data because we have previously found4
(4) H. S. Sherry and H F. Walton, J. Phys. Chem., in press,
Volume 71, Number 3 February 1967

782 Communications to the Editor
that in the alkaline earth-NaA systems maxima in selectivity plots reported by two of these authors5 6 disappeared when the systems were allowed to reach equilibrium.
If 99% of the equilibrium Ba2+ loading is achieved, only a 1% error or less occurs in the heat of reaction reported in ref 2; however, because of the shape of the ion-exchange isotherm in Figure 1, a very great error results in the solution composition and, hence, in nK c s0- Thus the standard free energy of reactionreported in ref 2 is in error. If we assume our selectivity plot (Figure 2) is correct, the standard free energy of complete exchange (replacement of 69 Na+ per unit cell), calculated using the method of Gaines and Thomas,6 is —1290 ± 10 cal/equiv of NaXat 25°. Using Barrer and co-workers’ value for the standard enthalpy of complete exchange of —110 cal/ equiv of NaX, we calculated a standard entropy change of +3.96 eu/equiv of NaX. These results should be compared to the values of —1168 cal, 0 ± 200 cal, and 3.9 ± 0.8 eu reported by Sherry and Walton4 for the BaNaA system. For both the X and the A type of zeolite crystals, we believe that the small enthalpy of reaction indicates that there are no strong interactions between the Ba2+ ions and the anionic aluminosilicate framework; that is, the ions are “ dissolved” in the zeolitic water.
(5) R. M. Barrer, L. V. C. Rees, and D. J. Ward, Proc. Roy. Soc. (London), A273, 180 (1963).(6) G. L. Gaines and H. C. Thomas, J. Chem. Phys., 21, 714 (1953).
R esearch Department Howard S. SherryCentral Research Division Laboratory M obil Oil Corporation Princeton, New Jersey
Received November 18, 1966
Simultaneous Yoltammetric Generation of
U(III) and Spectrophotometric Observation of
the U(III)-U(IV) System in Molten
Lithium Fluoride-Beryllium
Fluoride-Zirconium Fluoride1
Sir: We wish to report a technique for the generation and characterization of small amounts of unusual oxidation states in molten salts and other solvents. In this technique the species are produced by linear-sweep voltammetry (or some other controlled-potential electrochemical method) at a microelectrode located in the
Figure 1. Combination voltammetric-spectrophotometric cell.
optical path of a spectrophotometer and absorption spectra of the solution layer immediately surrounding the electrode are obtained a short time (<30 sec) after the beginning of electrolysis. The experimental setup employed for the generation and observation of U(III) in molten LiF-BeF2-ZrF4 (66:29:5 mole % ) containing 2 wt % uranium (as UF4) at 540° is shown in Figure 1. The platinum wire working electrode (A = 0.1 cm2) is visible in the optical aperture. The cell is a 3 4/ 8-in.o.d. captive liquid cell2a which fits into a furnace especially designed for spectrophotometric studies of molten salts.2“ Helium atmosphere is maintained within the furnace. The platinum wire auxiliary and quasireference electrodes are introduced below the working electrode using boron nitride insulating plugs. The position of the working electrode, which is insulated from the cell by means of a Teflon spacer, may be easily adjusted to the desired level from outside the furnace. The absorption spectra were obtained with a Cary Model 14-M spectrophotometer. The linear- sweep voltammograms were obtained with a controlled- potential voltammeter previously described.3 Current-voltage curves similar to those reported by Mamantov and Manning4 were obtained. The general
(1) Research sponsored by the U. S. Atomic Energy Commission under contract with Union Carbide Corp.(2) (a) J. P. Young, Anal. Chem., 36, 390 (1964); (b) J. P. Young and J. C. White, ibid., 31, 1892 (1959), and modified in Analytical Chemistry Division Annual Progress Report ORNL-3537, Nov 15, 1963, p 26.(3) D. J. Fisher, M. T. Kelley, W. L. Maddox, and R. W. Stelzner, USAEC Reprint ORNL-3537, p 16, 1963.(4) G. Mamantov and D. L. Manning, Anal. Chern., 38, 1494 (1966).
The Journal of Physical Chemistry

Communications to the Editor 783
spectra of U(IV) and U (III) in molten fluoride salts have recently been investigated in detail;6 however, the resultant spectra of various mixtures of these two oxidation states have not been studied. Such results are shown in Figure 2. Initially the spectrum of U(IY) is observed (curve I) ; the spectra after successive periods of electrolysis are shown as curves II and III.
Figure 2. Spectra o f U ( I V ) -U ( I I I ) m ixtures in m olten L iF -B e F 2-Z r F 4 at 540°.
Mathematical subtraction of I from II or III yields spectra of U (III).8 At 360 nm, a pronounced increase in absorbance due to U (III) was obtained within 20 sec after reaching the limiting-current plateau. The absorbance decreased as soon as some of the U(III) was removed by the anodic sweep. The technique has been shown to be quite sensitive since only ^ 0 .7 5 /requiv was generated in an average run and much less ('~0.4 juequiv) was required for spectral observation.
Previous work in aqueous or organic solutions involved either large-scale electrolysis in which the solutions were contained in normal spectrophotometric cells6’7 or the use of specialized techniques such as internal reflection spectroscopy using an optically transparent glass electrode8 in order to observe the products of an electrochemical reaction. Our success in applying conventional spectrophotometry to the study of the solution in the vicinity of a microelectrode is due to the use of a small spectral port. The technique may be made more versatile by the use of a second working electrode, for example, a ring configuration,9 which would be used for the electrochemical characterization of the reaction products.
Acknowledgment. We wish to acknowledge the help of Mr. D. L. Manning in this work.
(5) J. P. Young, to be published.(6 ) I. Bergman, “ Polarography 1964,” Vol. II, G. J. Hills, Ed., Macmillan and Co., New York, N. Y., 1966, p 925.(7) D. Cohen and IV. T. Carnall, J. Phys. Chem., 64, 1933 (1960).(8 ) W. N. Hansen, R. A. Osteryoung, and T. Kuwana, J. Am. Chem. Soc., 8 8 , 1062 (1966).(9) A. N. Frumkin and L. N. Nekrasov, Dokl. Akad. Nauk SSSR, 126, 115 (1959).
O a k R i d g e N a t i o n a l L a b o r a t o r y J . p . Y o u n g
O a k R i d g e , T e n n e s s e e
D e p a r t m e n t o f C h e m i s t r y G l e b M a m a n t o v
U n i v e r s i t y o f T e n n e s s e e F . L . W h i t i n g
K n o x v i l l e , T e n n e s s e e
R e c e i v e d N o v e m b e r 21, 1966
Reactions o f Thiyl Radicals. I. M ethylthiyl
Recom bination and Thionitrite Form ation
in the Photolysis o f M ethanethiol1
Sir: Current investigations in this laboratory indicatethat recombination rather than disproportionation results from reaction of two RS radicals— the exact opposite of the known behavior of alkoxy radicals where recombination has been observed only for high molecular weight radicals.2
To establish the relative contribution of these reactions and that the presence of RS radicals in general can be unequivocally demonstrated by observing thionitrite formation when NO is present, we have reinvestigated the photolysis of gaseous CHsSH. This system has been studied previously3’4 and the main products are H2 and methyl disulfide. The latter has not been determined quantitatively.
The photolysis with added NO was studied in a grease- and mercury-free vacuum system using an Hg resonance lamp. At P ch3sh = 100-200 torr and P N0 = 10-20 torr, no disulfide was found and the principal product recovered was CH3SNO, identified by comparison of its gas-phase infrared spectrum, with
(1) From the Ph.D. thesis of R. P. Steer to be submitted to the University of Saskatchewan, Saskatoon, Saskatchewan, Canada. The authors express their thanks to Mr. J. A. Copeck, who performed some of the preliminary experiments, and to the National Research Council and Imperial Oil Ltd. for financial support.(2) P. Gray and A. Williams, Chem. Rev., 59, 239 (1959).(3) N. P. Skerrett and N. W. Thompson, Trans. Faraday Soc., 37, 81 (1941).(4) T. Inaba and B. deB. Darwent, J. Phys. Chem., 64, 1431 (1960).
Volume 71, Number S February 1967
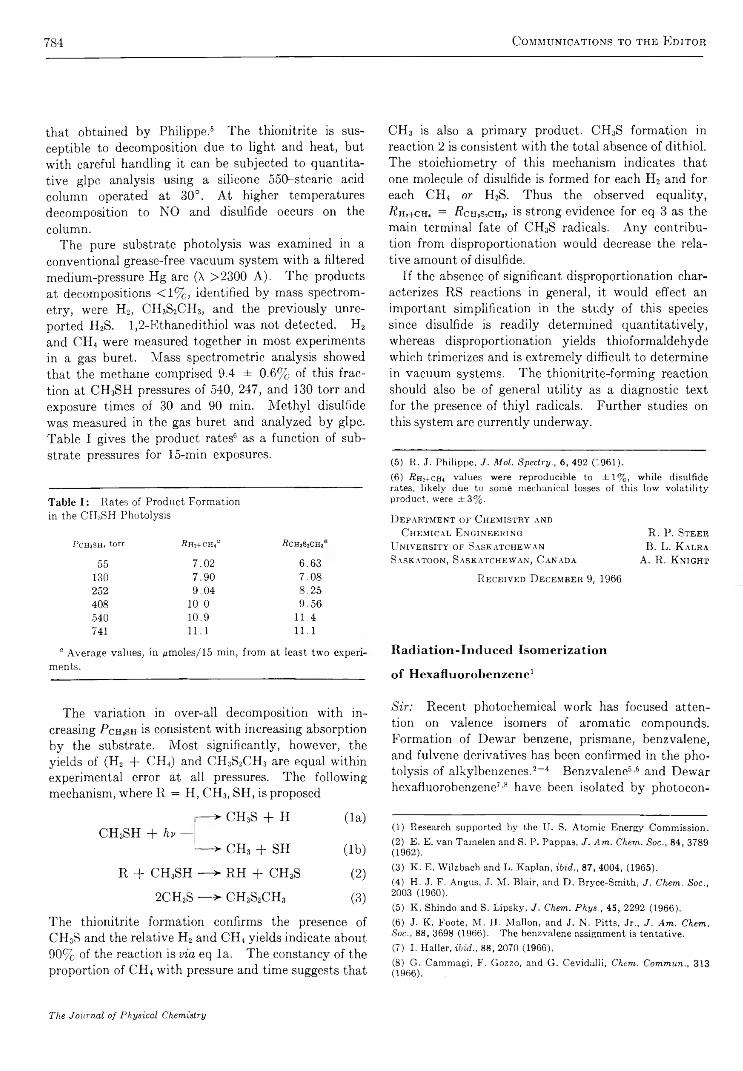
784 Communications to the Editor
that obtained by Philippe.1 2 3 4 5 6 The thionitrite is susceptible to decomposition due to light and heat, but with careful handling it can be subjected to quantitative glpc analysis using a silicone 550-stearic acid column operated at 30°. At higher temperatures decomposition to NO and disulfide occurs on the column.
The pure substrate photolysis was examined in a conventional grease-free vacuum system with a filtered medium-pressure Hg arc (X >2300 A). The products at decompositions < 1 % , identified by mass spectrometry, were H2, CH3S2CH3, and the previously unreported H 2S. 1,2-Ethanedithiol was not detected. H2 and CH4 were measured together in most experiments in a gas buret. Mass spectrometric analysis showed that the methane comprised 9.4 ± 0 .6% of this fraction at CH3SH pressures of 540, 247, and 130 torr and exposure times of 30 and 90 min. Methyl disulfide was measured in the gas buret and analyzed by glpc. Table I gives the product rates6 as a function of substrate pressures for 15-min exposures.
Table I: R ates of P rod u ct F orm ationin the C H 3SH Photolysis
P0H3SH, to rr RH2+CH4“ ■Rc h jSîCHj'
5 5 7 . 0 2 6 . 6 3
1 3 0 7 . 9 0 7 . 0 8
2 5 2 9 . 0 4 8 . 2 5
4 0 8 1 0 . 0 9 . 5 6
5 4 0 1 0 . 9 1 1 . 4
7 4 1 1 1 . 1 1 1 . 1
“ A verage values, in /m io les/15 m in, from a t least tw o experiments.
The variation in over-all decomposition with increasing P cHaSH is consistent with increasing absorption by the substrate. Most significantly, however, the yields of (H2 + CH4) and CH3S2CH3 are equal within experimental error at all pressures. The following mechanism, where R = H, CH3, SH, is proposed
CH3SH + hv —— ^ CH3S + H (la)
— > CH3 + SH (lb)
R + CH3SH — > RH + CH3S (2)
2CH3S — > CH3S2CH3 (3)
The thionitrite formation confirms the presence of CH 3S and the relative H 2 and CH4 yields indicate about 90% of the reaction is v ia eq la. The constancy of the proportion of CH4 with pressure and time suggests that
CH 3 is also a primary product. CH3S formation in reaction 2 is consistent with the total absence of dithiol. The stoichiometry of this mechanism indicates that one molecule of disulfide is formed for each H 2 and for each CH4 or H2S. Thus the observed equality, -Rm+cm = -RcHas^m, is strong evidence for eq 3 as the main terminal fate of CH3S radicals. Any contribution from disproportionation would decrease the relative amount of disulfide.
If the absence of significant disproportionation characterizes RS reactions in general, it would effect an important simplification in the study of this species since disulfide is readily determined quantitatively, whereas disproportionation yields thioformaldehyde which trimerizes and is extremely difficult to determine in vacuum systems. The thionitrite-forming reaction should also be of general utility as a diagnostic text for the presence of thiyl radicals. Further studies on this system are currently underway.
(5) R. J. Philippe, J. Mol. Spectry., 6, 492 (.961).(6 ) AH2+CH4 values were reproducible to ±1% , while disulfide rates, likely due to some mechanical losses of this low volatility product, were ±3% .
D e p a r t m e n t o f C h e m i s t r y a n d
C h e m i c a l E n g i n e e r i n g R . P . S t e e r
U n i v e r s i t y o f S a s k a t c h e w a n B. L . K a l r a
S a s k a t o o n , S a s k a t c h e w a n , C a n a d a A. R . K n i g h t
R e c e i v e d D e c e m b e r 9 , 1 9 6 6
Radiation-Induced Isomerization
of Hexafluorobenzene1
S ir : Recent photochemical work has focused attention on valence isomers of aromatic compounds. Formation of Dewar benzene, prismane, benzvalene, and fulvene derivatives has been confirmed in the photolysis of alkylbenzenes.2-4 Benzvalene6’6 and Dewar hexafluorobenzene7’8 have been isolated by photocon
(1) Research supported by the U. S. Atomic Energy Commission.(2) E. E. van Tamelen and S. P. Pappas, J. Am. Chem. Soc., 84, 3789 (1962).(3) K. E. Wilzbach and L. Kaplan, ibid., 87, 4004, (1965).(4) H. J. F. Angus, J. M. Blair, and D. Bryce-Smith, J. Chem. Soc., 2003 (1960).(5) K. Shindo and S. Lipsky, J. Chem. Phys., 45, 2292 (1966).(6) J. K. Foote, M. H. Mallon, and J. N. Pitts, Jr., J. Am. Chem. Soc., 88, 3698 (1966). The benzvalene assignment is tentative.(7) I. Haller, ibid., 88, 2070 (1966).(8) G. Cammagi, F. Gozzo, and G. Cevidalli, Chem. Commun., 313 (1966).
The Journal of Physical Chemistry

Communications to the Editor 785
version of benzene and the fluorocarbon vapor, respectively. Since photolysis often yields products closely related to those obtained by radiolysis,9 the work cited above suggested that similar valence isomerization might occur in radiolysis. (Radiation- induced cis-trcm s isomerization is well established.9) Results on the y irradiation of hexafluorobenzene (I) are reported here.
Radiolysis of liquid or gaseous I 10 in a Co60 source at ambient temperature and at a dose rate of 7 X 10⁶ rads/hr yielded several products. These were separated by gas chromatography using diisodecyl phthalate and/or Ivel-F oil columns.7 Liquid-phase irradiation yielded a fraction which had the same retention time as Dewar C6F6, hexafluorobicyclo[2.2.0]hexa-2,5-diene(II). This assignment was verified: the collected fraction showed the same infrared and mass spectra as authentic II obtained by photolysis.7'11 Gas-phase radiolysis yielded two compounds with retention times similar to II. Upon infrared and mass spectral analyses, these were identified as C6F8, perfluorocyclohexa- diene, and I. Since I and II have significantly different retention times, the C6F6 observed must be due to conversion of II at the thermal conductivity detector.12 This was confirmed by chromatography of small amounts of authentic I I ; conversion to I also occurred. The valence isomer II was thus almost certainly produced in the gas phase and was unequivocally present in the liquid-phase irradiations.
Vapor-phase photoisomerization to II requires <115 kcal8 (2537 A). We suggest therefore that isomer formation in radiolysis occurs largely by conversion from low-lying excited states. These may be formed by direct excitation, by ion-electron neutralization, or even by radical-fluorine recombination (the ionization potential of I is given as 230 kcal,13 estimates of the C -F bond energy range from 14513 to 108 kcal14).
We have established that valence isomerization occurs in the radiation chemistry of C6Fe. The question now arises whether similar isomerization occurs in hydrocarbon radiolysis. Valence isomers of benzene and its derivatives have been isolated.2-6 However, prismane, Dewar benzene, and benzvalene have not been obtained by liquid-phase photolysis of CeH6. In their study of benzvalene, Pitts, et oZ.,6 have suggested that rapid collisional quenching of excited states prevents conversion to the isomer in condensed-phase photochemistry. The same processes which prevent photoisomerization may also apply to radiolysis. On the other hand, a greater range of excited states is obtained in radiolysis compared to photolysis. Collisional deexcitation may still leave states with sufficient energy to convert to the isomers which go unde
tected because of further reaction. In view of our results with C6F6, valence isomerization should at least be considered in the radiation chemistry of aromatic hydrocarbons.
(9) See, for example, R. A. Caldwell, D. G. Whitten, and G. S. Hammond, J. Am. Chem. Soc., 88, 2659 (1966).(10) CeFe, Imperial Smelting, was purified by preparative glpe and contacted with a sodium mirror. Samples were degassed to better than 10 "6 torr.(11) In the course of this work, we found that photolysis of liquid CeFe with an unfiltered AH-6 mercury lamp also yielded II.(12) II is heat sensitive.8 If isomerization back to I occurred on the glpc column, the retention time would change.(13) J. R. Majer, Advan. Fluorine Chem., 2, 84 (1961).(14) C. R. Patrick, cited by D. Bryce-Smith, B. E. Connett, and A. Gilbert, Chem. Ind. (London), 855 (1966).
Acknowledgments. We are indebted to Messrs. R. Smol and J. Forrest for their assistance.
B r o o k h a v e n N a t i o n a l L a b o r a t o r y J . F a j e r
U p t o n , N e w Y o r k 11973 D. R . M a c k e n z i e
R e c e i v e d D e c e m b e r 8 , 1966
Corrections o f Schlieren Data
S ir : In their articles,1’2 Ford and Ford have claimed that important corrections should be applied to the data obtained from schlieren patterns.
The first correction, called “ refraction correction 5X,” was deduced from geometrical constructions (Figures 1, 2, 3, ref 1).
It appears however, as explained below, that this correction Sx is due to an error made in these constructions and that 5X is actually nonexistent.
In their first article (see Figure 1, ref 1, to which we refer for the following discussion) Ford and Ford consider two rays passing through a cell in which there is a refractive index gradient. If the path of the bent ray through the solution is a parabola, the backward extension of its exit tangent intersects the center of the cell at the entry level, as described in ref 1.
The optical system, consisting of many refracting surfaces, starting with the cell window surfaces, is focused on a plane through the center of the cell, filled with solvent or solution. In other words, this plane and the plane of the photographic plate are conjugate image planes. So two rays coming (or appearing to come) from the same point in the center of the cell (point b)
(1) T. F. Ford and E. F. Ford, J. Phys. Chem., 68, 2843 (1964).(2) T. F. Ford and E. F. Ford, ibid., 68, 2849 (1964).
Volume 71, Number 3 February 1967
786 C o m m u n i c a t i o n s t o t h e E d i t o r
intersect the plate at the same level in accordance with the definition of imaging and not at different levels b0' and bs'.
The error in the constructions resulting in the different levels can be seen if one considers the contribution of the optical elements of the system to the imaging separately. The cell window (with solution to the left and air to the right of it) forms a virtual image of the center of the cell in a plane (plane I) somewhere between the window and this center. The collimating lens, in turn, forms a virtual image of plane I in a plane (plane II) situated to the left of the center of the cell, because the distance from plane I to the collimating lens is appreciably shorter than the focal distance of this lens. Plane II is the object plane “ seen” by the optical elements following the collimating lens.
The two dashed lines in Figure 1, ref 1, being the rays traced backwards after their refraction by the collimating lens, intersect the center line of the cell at different levels b0 and bs. However, they should have been traced backward further to plane II where they intersect.
In the second article2 distortion and tilting of the schlieren curves was computed numerically. In connection with this the excellent and definitive work on this subject by Svensson,3-5 which is not cited by Ford and Ford, should be mentioned. Since this
work became known, workers with schlieren and interference optics have adopted the practice of focusing on a plane in the cell which is separated from the window nearest the camera by a distance equal to one-third (not one-half) of the thickness of the cell. By doing so, the tilting of the schlieren curves (Wiener skewness) is corrected for and the corrections of the sedimentation coefficients and the lag times, as given in ref 2, become negligible.
Furthermore, Svensson gives two equations (eq 63 and 110, ref 5) which give the distortion of a schlieren curve as a function of a number of parameters such as cell thickness, refractive index, and its derivatives. It might be interesting to see whether numerical calculations of the type done by Ford and Ford for an optical system focused on the one-third plane would give results in agreement with the equations given by Svensson.
(3) H. Svensson, Opt. Acta, 1, 25 (1954).(4) H. Svensson, ibid., 1, 90 (1954).(5) H. Svensson, ibid., 3, 164 (1956).
v a n ’ t H o f f L a b o r a t o r y
S t a t e U n i v e r s i t y H . J . V r e e m a n
U t r e c h t , T h e N e t h e r l a n d s Y . W i e r s e m a
R e c e i v e d D e c e m b e r 1 5 , 1 9 6 6
The Journal of Physical Chemistry

![Gohisca [1967] - Internet Archive](https://static.fdokumen.com/doc/165x107/6337f08d1ef10984f505036d/gohisca-1967-internet-archive.jpg)