The Influence of Leadership Behavior to the Teachers Performance
177
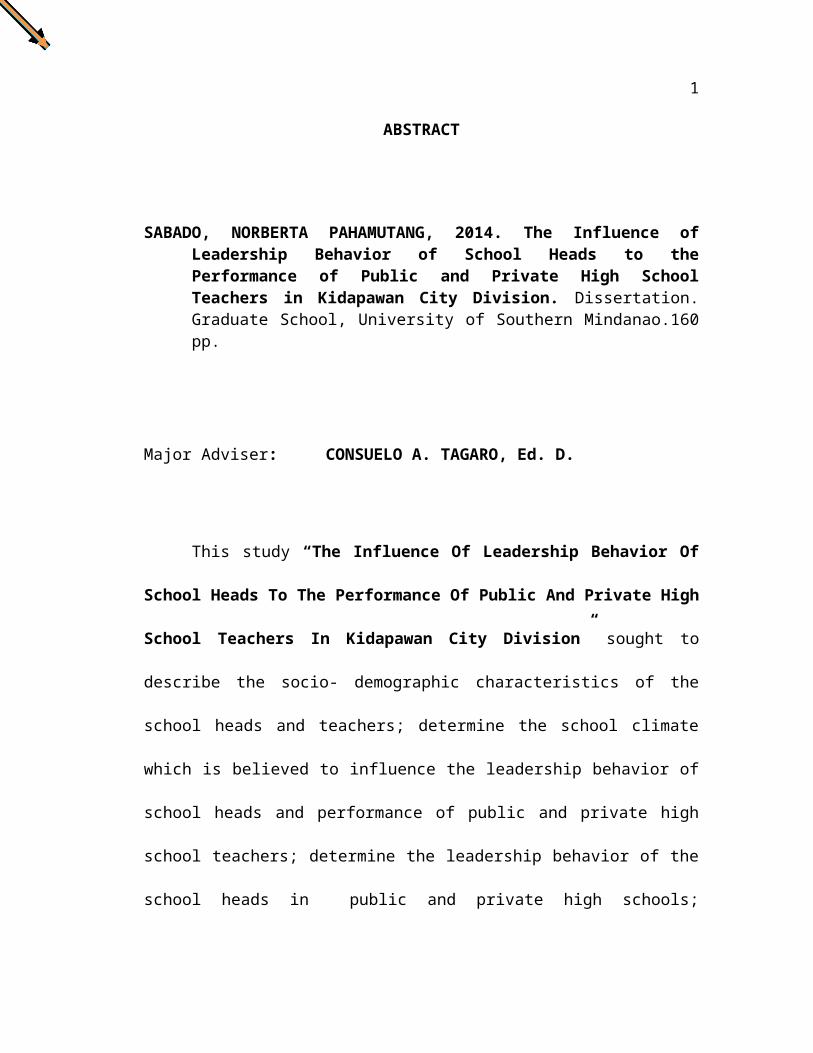
1 ABSTRACT SABADO, NORBERTA PAHAMUTANG, 2014. The Influence of Leadership Behavior of School Heads to the Performance of Public and Private High School Teachers in Kidapawan City Division. Dissertation. Graduate School, University of Southern Mindanao.160 pp. Major Adviser: CONSUELO A. TAGARO, Ed. D. This study “The Influence Of Leadership Behavior Of School Heads To The Performance Of Public And Private High School Teachers In Kidapawan City Division” sought to describe the socio- demographic characteristics of the school heads and teachers; determine the school climate which is believed to influence the leadership behavior of school heads and performance of public and private high school teachers; determine the leadership behavior of the school heads in public and private high schools;
Transcript of The Influence of Leadership Behavior to the Teachers Performance
1
ABSTRACT
SABADO, NORBERTA PAHAMUTANG, 2014. The Influence ofLeadership Behavior of School Heads to thePerformance of Public and Private High SchoolTeachers in Kidapawan City Division. Dissertation.Graduate School, University of Southern Mindanao.160pp.
Major Adviser: CONSUELO A. TAGARO, Ed. D.
This study “The Influence Of Leadership Behavior Of
School Heads To The Performance Of Public And Private High
School Teachers In Kidapawan City Division” sought to
describe the socio- demographic characteristics of the
school heads and teachers; determine the school climate
which is believed to influence the leadership behavior of
school heads and performance of public and private high
school teachers; determine the leadership behavior of the
school heads in public and private high schools;
2
determine the performance of the teachers in public and
private high schools; find out whether the school heads’
socio- demographic characteristics significantly influence
the school climate, leadership behavior and performance
of the teachers; determine whether the school climate
significantly influence school heads leadership behavior,
performance of teachers, determine whether the school
heads’ behavior significantly influence the performance
of the teachers in public and private high schools in
Kidapawan City Division. Thirty-four (34) school heads and
130 teachers from public schools and 8 school heads and
40 teachers from private high schools in Kidapawan City
Division served as respondents of the study.
Frequency, percentage, and means were used to
summarize the socio demographic characteristics, school
climate and leadership behavior of public and private high
school teachers and school heads. Multiple regression
analysis was used to determine if there was a significant
3
relationship between socio- demographic characteristics,
school climate and leadership behavior.
Results of the study showed that socio –demographic
characteristics and, tenureship affect the school climate
in terms of student-teacher relationship; civil status and
type of school influence school climate in terms of
student’s activities.
Position influenced the leadership behavior in terms
of trust and decision making; age and type of school
influenced leadership behavior in terms of control.
The school climate significantly influenced the
school heads’ leadership behavior. However, the socio-
demographic characteristics, school climate and leadership
behavior did not significantly influence the job
performance of the teachers.
4
THE INFLUENCE OF LEADERSHIP BEHAVIOR OF SCHOOL
HEADS TO THE PERFORMANCE OF PUBLIC
AND PRIVATE HIGH SCHOOL TEACHERS
IN KIDAPAWAN CITY DIVISION
NORBERTA P. SABADO
5
A DISSERTATION SUBMITTED TO THE FACULTY
OF THEGRADUATE SCHOOL, UNIVERSITY OF SOUTHERN
MINDANAO, KABACAN, NORTH COTABATO IN PARTIAL
FULFILLMENT OF THE REQUIREMENTS
FOR THE DEGREE OF
DOCTOR OF EDUCATION
(Educational Management) CHAPTER 1
INTRODUCTION
6
The success of any school critically begins with the
school head that is responsible for ensuring that all
teachers and students meet challenging task and the
desired standard level in education.
As manager of the school, school head can play a
vital role in the development of the school by enhancing
the learning of the students and by developing teacher’s
performance. He/she seeks to promote the stability and
smooth operation of the school. School heads, directly
affect the morale of the school through clear school rules
and policies that tend to improve the general disciplinary
climate of the school.
According to Fullan (2001) the more complex a society
gets, the more sophisticated leadership must become. Thus,
Lewis, Goodman and Fandt (1998) assert that school
administrators are expected to cope with a rapidly
changing world of work to be effective at their schools.
7
Furthermore, the related research of Bulach and
Peterson, (2001) claim that the most successful managers
in the future should be transformational leaders comprised
of strengths, weaknesses and also characteristic
behaviors. If leadership is accepted as a process of
interaction between leaders and subordinates where a
leader attempts to influence the others’ behaviors to
accomplish organizational goals (Yukl, 2005), then,
leaders must foster strong community support for the
change by creating a vision for the organization and
stimulating them at school (Bass, 1985; 1997), according
to Montero (2010), school heads must be team-oriented,
strong communicators, team players, problem solvers,
change-makers and transformational leaders.
As educators continue to restructure schools to
better meet the needs of our ever- changing society, the
school head’s effective leadership practices become
paramount as we enter the next generation of research into
school effectiveness. This study of school head’s
8
endeavored to analyze the influence of the leadership
behavior of school head to the teachers’ performance in
public and private high schools in the Kidapawan City
Division.
Objectives of the Study
This study was conducted to find out the factors that
influenced the leadership behavior of school heads and
performance of public and private high school teachers in
Kidapawan City Division. Specifically, it aimed to:
1. describe the socio-demographic characteristics of the
school heads and teachers in terms of; a) age,
b)gender, c) Civil Status, d) Position, e)
educational attainment, d) tenure ship, e) type of
school;
2. determine the school climate which are believed to
have influence in the leadership behavior of school
9
heads and performance of public and private high
school teachers in Kidapawan City Division.
3. determine the leadership behavior of the school heads
in public and private high schoosl;
4. determine the performance of the teachers in public
and private high schools in Kidapawan City Division.
5. find out whether the school heads’ socio-
demographic characteristics such as age, gender,
civil status, position, educational attainment,
tenureship and type of school significantly
influence the following;
a. school climate.
b. Leadership behavior
c. performance of the teachers
6. determine whether the school climate significantly
influence
a. school heads’ leadership behavior
b. performance of teachers
10
7. determine whether the school heads’ behavior
significantly influence the performance of the
teachers in public and private high schools in
Kidapawan City Division.
Scope and Delimitation of the Study
This study was delimited only on the teachers’ and
principals’ perceptions of the school heads’ leadership
behavior and performance of the teachers in public and
private high school in Kidapawan City Division in relation
to the socio- demographic characteristics and school
climate. The performance of the teachers’ of this study
11
was assessed based on the CB-PAST of the teacher in the
recent year.
The socio-demographic characteristics was included in
the study were: age, gender, civil status, position,
educational attainment, tenureship, and type of school and
residency of the school principals.
The school climate included teacher-student
relations, security and maintenance, pupil’s academic
orientation, guidance, pupil-peer relationships,
instructional management and student activities.
The behavior of the school head as influenced by the
leadership behavior included human relations, trust and
decision making, instructional leadership, control and
conflict.
The performance of the teachers was assessed based on
the CB-PAST of the recent year. All 17 regular public high
schools, 2 extension high schools, 7 integrated schools,
and 8 private high schools in Kidapawan City Division were
included in the study. The respondents were given a chance

12
to answer the questionnaires and conducted from January to
February, 2014.
Significance of the Study
Findings of this study will be beneficial to the
following:
Teachers: Findings of this study will create an avenue
for the teachers to evaluate their performance as well as
to evaluate their administrators’ leadership behavior and
the climate of the school.
School Administrators: School administrators will have the
knowledge of their teachers’ tenureship, leadership
behaviors as well as their school climate, teachers’
performance. With such knowledge, they will have all the
opportunities to improve their levels in their leadership
behavior and hopefully will become better managers in the
future.
DepEd officials: Findings of this study will provide DepEd
officials the data as basis in the transferring the
13
school head providing public high school can determine the
opportunities to make them effective in administering and
supervising their schools and improve teachers’ classroom
instructions.
Policy Makers. Findings of this study will provide the
policy makers the guidelines in transferring the school
head in their assignments with information on the level
of leadership behavior and teachers performance as
influenced by the socio demographic profile and school
climate of public and private high school administrators.
With this information, new policies may be formulated for
the improvement of school management.
Definition of Terms
Age. Refers to the number of years of the respondents
since birth.
Civil Status. Refers to single, married, widow/er or
separated state of the respondents. In the study, it
14
is categorized as follows: single; married;
widow/er; and, separated.
Conflict – Refers to the interpersonal process
that arises from
disagreement over a goal to attain or the method to
be used to accomplish those goals.
Controlling. Refers to the checking progress against
plans, which may need modification based on
feedbacks. It involves evaluation activities
performed by managers to determine if the
organization’s goals and objectives are being met.
Division of Kidapawan City. Refers to means the City
Division of Kidapawan
as a separate division from the mother division –
Cotabato Division
after the approval of the city hood in 1998.
Educational Attainment. Refers to the highest academic
degree attained by a school head. In the study, it is
categorized as follows: bachelor’s degree; BS with
15
MA/MS units, Master’s degree; Master’s degree with
Ed. D/ Ph. D. units; Ed. D./ Ph. D.
Gender. Refers to sex. In the study, it is categorized as
follows: male; and, female.
Guidance – Refers to advice or counseling given to
students on academic
and non academic matters.
High School. Refers to an educational institution
primarily devoted to
imparting fundamental knowledge and skills in the
level after the elementary education.
Human Relations –Refers to the formal and informal
interactions that
Occur between teacher and principal, principal and
students, teacher and student, parents and teachers
and parents and principal.
Instructional Leadership –Refers to the actions that a
principal takes or
16
delegates to others to promote growth in students
learning.
Instructional Management –Refers to the actions made by
the teacher inside the classroom to effect learning
to his/her students.
Leadership Behavior – Refers to the behavior display by
the principal in managing the school. In this study,
the leadership behavior includes human relations,
trust and decision making, instructional leadership,
control and conflict.
Length of Service. Refers to the number of years of
experience in the teaching profession, regardless of
status or position.
Openness: Refers to the interpersonal condition that
exists between people when: (1) facts, ideas, values,
beliefs, and feelings are readily transmitted; and
(2) the recipient of a transmission is willing to
listen to that transmission (Bulach,1993).
17
Position- Refers to first step salary grade as the
employee given chance to serve in the Department of
Education. After 5 consecutive years in service,
he/she can file for promotion and be given Teacher II
position. Such employee is given again another
promotion depending on the achievement during his/
her service. Master teacher II is the highest
position in horizontal promotion, while in vertical
promotion, administrator is the most.
Students’ Academic Orientation – Refers to the activity
that informs the students on the schools’ academic
policies /guidelines implemented in
the school which is usually done at the beginning of
the school year.
Students – Peer Relationships – Refers to the personal
relationship between the students and their peers in
the school where they are enrolled.
School Climate – Refers as the social atmosphere of
a setting or “learning environment in which
18
students have different experiences depending upon
the protocol set – up by the teachers and
administrators.
School head. Refers to the heads of complete schools who
have duly attested appointments and who are skilled
in the art of administering, management or direction
of affairs.
Security and Maintenance – Refers to the school conditions
that keep the children in school safe from any danger
brought about by violence or unattended school
buildings and grounds.
Teacher. Refers to all persons engaged in classroom
teaching in any level of instruction, on a full-time
basis, including guidance counselors, school
librarians, industrial arts or vocational
instructors.
Teachers’ Performance – Refers to the assessment of the
performance of teachers basing on his/her
instructional competence, professional and personal
19
characteristics and quality/attendance. The
Performance Competency Based Appraisal System for
Teachers is the instrument used in assessing the
teachers’ performance.
Teacher – Student Relation – Refers to the personal
relationship between the teacher and the student.
Tenure ship. Refers to the number of years in the service
as principal/school head.
Trust: Refers to the interpersonal condition that exists
when interpersonal relationships are characterized by
an assured reliance or confident dependence on the
character, ability, truthfulness, confidentiality and
predictability of others in the group (Bulach,1993).
Acronym
CBPAST – (Competency Based Performance Appraisal System) –
Refers to
20
the evaluation instrument used by the school head,
teacher and peer in
assessing the performance of the teacher at the end
of the school year.
ARQ- (Administrator Respondent Questionnaires) - Refers to
the socio- demographic characteristic instrument
administered the by school head/ administrator
respondents.
TRQ- (Teacher Respondent Questionnaires) - Refers to the
socio- demographic characteristic instrument administered
by teacher respondents.
21
CHAPTER II
REVIEW OF RELATED LITERATURE
School head
“The Learning Captain and the model”, that’s the
other name of school head. He or she is the manager and
hold the most important position in any of educational
institution.
22
According to Chavez (2002), school heads perceived
themselves as highly effective in all managerial functions
while teachers perceived school heads highly effective
only in planning and moderately effective for the rest,
and least effective in leading. There was a significant
difference on how school heads and teachers perceived
managerial effectiveness in the performance of functions,
and the length of service as school head and their
educational attainment contributed to the level of
effectiveness in performing managerial functions.
Factors affecting the performance of school heads and
teachers were contributed much by the socio demographic
characteristics and the school climate of the school. The
relationships of principals, as the school leader,
strongly and directly affect teachers’ attitudes, which
define the school climate.
Demographic Profile
23
Age
Age is considered as one of the factors that affect
the performance of school heads management. The Findings
revealed that growing old gives wisdom, profound knowledge
and deeper understanding of people, events and other
happenings around them (Balawag as mentioned by Bulusan
2002 as cited by Montero (2010).
Age matters in management and that older manager
tends to perform better than younger managers because the
older manager had acquired skills and experience through
the years of their long government or non-government
service (Whitesitt as cited by Piguerra 2005 and mentioned
by Montero 2012). Hence, Piguerra (2005) recommended in
his study that age must be considered in designating
people for administrative positions in public elementary
schools. His study showed that age was related to the
management capabilities of public elementary school
administrators. As the school administrator gets older, he
24
tends to become more capable in doing school management
roles.
In teaching, performance increases with age. As
teachers grow older they tend to be more satisfied with
their profession because they have lower expectations and
better adjustment to their work situation (Rodes as cited
by Butuan, 1997).
The age of the teacher-respondent influences his
teaching performance (Gagabi 1999). As a teacher grows
older, one gains wisdom and thus tends to perform better
as one acquires profound knowledge and deeper
understanding of his job responsibilities. Similar finding
has been found in the study of Barrientos (2008). She
concluded that there exists a significant relationship
between the school administrators’ age and teachers’ job
performance in terms of punctuality and attendance. The
result indicates that the older the school administrators
get, the higher is their influence on the teachers’ job
performance in terms of punctuality and attendance.
25
Gender
Gender plays a vital role in different job
performances whether in offices or in field works. Various
researches provided results how males and females vary in
terms of their job performances. Women were found to
score higher than men on the interpersonal dimension
(Stone 2009). However, no differences in EQ-i scales were
found between individuals working in an elementary school
versus a secondary school; the same was true when EQ-i
scales were compared for principals and vice-principals.
Men and women were also compared on each of the leadership
ratings (task-oriented leadership, relationship-oriented
leadership, and total leadership). Men and women did not
differ on any of the leadership ratings (regardless of
whether supervisor or staff ratings were used).
In terms of planning skills, both male and female
administrators performed very satisfactorily; in
26
organizing, female administrators performed their
organizing skills outstandingly while male administrators
performed such skills very satisfactorily; in terms of
staffing, female administrators were outstanding while
male administrators were very satisfactory and in terms of
directing, both male and female administrators were very
satisfactory; in terms of controlling, both male and
female administrators were very satisfactory (Macaya,
2008).
Civil Status
Widowed school administrators performed well in their
jobs to keep themselves busy. Arce as cited by Barrientos
(2008) mentioned by Montero 2010, posited that widowed
principals focus their time and attention on their work.
Consequently, they become productive and influence good
performance from their teachers. Rivera (2008) as cited
by Barrientos (2008), however, disclosed that being
27
widowed has positive and negative influence on one’s
performance. If the widowed administrator is penniless, it
would affect his performance for there might be financial
difficulties but for the administrator who has the money,
he may not find much difficulty.
Barrientos (2008) found out in her study that there
exists a significant relationship between the school
administrators’ civil status and teachers’ overall job
performance and in terms of professional and personal
characteristics, and punctuality and attendance. The
school administrators were grouped into two, the widowed
and married ones. The result indicates that widowed school
administrators have better influence on the job
performance of teachers.
In the study conducted by Gagabi (1999) as cited by
Montero (2010) civil status was not a significant
predictor of teaching performance. Regardless of
marital/civil status, the study found out that the
respondents had the same teaching performance. Thus, she
28
concluded that the teacher’s teaching performance was not
influenced nor affected by civil status.
Position/ Designation
When the teacher is given the chance to serve in the
Department of Education, her/his government service starts
and is given a Teacher I position. After 5 consecutive
years in service, he/she can file for promotion and be
given Teacher II position. Such employee is given again
another promotion depending on his/her achievement during
his/ her service.
Educational Qualification
There is a double challenge of increasing both the
number and the quality of teachers. States are creating
more rigorous licensure standards at the same time seek to
hire more teachers. The need to find and to keep good
29
teachers is especially critical if states and local
districts are to meet rigorous education goals aimed at
raising student achievement levels. Recent studies in
Tennessee, Boston, and Texas confirm that students taught
by the most qualified and effective teachers achieve at
higher levels (Hirsch, 2000).
Hammond (2000) claimed that quantitative analyses
indicate that measures of teacher preparation and
certification are by far the strongest correlates of
student achievement in reading and mathematics, both
before and after controlling student poverty and language
status. However, Rice (2003) as cited by Goe (2007) found
out that teacher certification seems to matter for high
school mathematics, but there is little indication of its
relationship to student achievement in lower grades. There
was no indication of a difference in student outcomes for
teachers who gained certification through an alternate
route.
30
Correlation among teachers’ qualifications and
student achievement varied substantially across subjects.
Teachers with master’s degrees contributed marginally more
to increase mathematics scores than teachers with only
bachelor’s degrees. In middle school, gains in reading
were correlated with teachers holding Ph. D.s in any
subject (for English teachers). Students’ scores in middle
school and high school were negatively impacted by having
a teacher who holds only an emergency credential. In
middle and high school mathematics, a teacher’s
mathematics authorization (a proxy for subject-area
knowledge) was the best teacher level predictor of student
achievement (Betts et. al as cited by Goe 2007).
Knowledge was positively related to educational
attainment (Balawag citing De Villa, 1999). The higher the
educational attainment, the higher the knowledge. Peralta
(2009) also concluded in her study that educational
attainment surfaced as a significant variable that
31
positively affected the perceptions of school
administrators on the level of their effectiveness.
Tenureship
Refers to the number of years in the service as
principal/school head. The study on the “THE WIDGET EFFECT
Our National Failure to Acknowledge and Act on Differences
in Teacher Effectiveness by Daniel Weisberg, (2009), he
reported that and administrators recognized ineffective
teaching in their schools. In fact, 81 percent of
administrators and 58 percent of teachers say there was a
tenured teacher in their school who performed poorly, and
43 percent of teachers say there was a tenured teacher who
should be dismissed for poor performance. Teacher tenure
has long been an interesting problem and much research
work has been devoted to this subject in the interests of
tenure laws in the various states. Teacher motivation
naturally has to do with teacher's attitude to work. It
32
has to do with teachers' desire to participate in the
pedagogical processes within the school environment and
his interest in student discipline and control
particularly in the classroom. Therefore, it could
underlie their involvement or non-volvement in academic
and non-academic activities, which operates in schools
(Ofoegbu, 2004).
Type of school
Schools in the Philippines are categorized into two:
public schools which are funded by the government and
private schools which are not. Private schools and public
schools follow a similar academic calendar where classes
start in June and end in March. Universities and colleges
differ slightly with their academic calendar with classes
running from June to October and then November to
March.http://www.allprivateschools.net/countries/philippin
es.php
33
School Climate
The attitudes of school heads and teachers create an
atmosphere for learning, often referred to as school
climate that influences school effectiveness and
leadership. Atmospheres of trust, shared vision, and
openness create positive school climate conditions. Little
is known, however, about how these climates emerge in some
schools and not in others. There is good theoretical
reason to suspect that interpersonal relationships between
school heads and their teachers influence students’
performance and attitudes that define the broader school
climate. (Reuters, 2013).
Teacher- students’ Relations
34
Rogers as cited by White (2009) held that "certain
attitudinal qualities which exist in the personal
relationship between the facilitator and the learner"
yield significant learning. Facilitation requires at least
an initial genuine trust in learners by the facilitator,
followed by the creation of an acceptant and empathic
climate.
Teacher-student climate is a factor which covers a
wide range of questions focused on whether students
believe teachers treat them with fairness and respect and
whether they help them when they struggle with their
school work. . Results find that teacher-student climate
does have a significant effect, even after controlling for
individual race, gender, poverty, and prior achievement,
as well as the school level average achievement of the
entering cohort. Researchers found a much smaller effect
when looking at the effect of teacher-student climate on
achievement on a standardized test and a nonsignificant
effect on student absences. Because being on-track is
35
significantly correlated with graduating within 5 years,
researchers believe focusing on improving the climate of
teacher-student relationships in the schools might be an
important component in reducing school failure (Rafiullah,
2000).
Security and Maintenance
In an effective school, there is an orderly,
purposeful, business-like atmosphere, which is free from
the threat of physical harm. The school climate is not
oppressive and is conducive to teaching and learning.
For many years, parents have said that the safety and
disciplinary climate of the school was their first concern
when judging schools. School shootings, bomb scares, and
other senseless violent acts had only served to deepen
parental concerns. “We obviously want the learning
environment to be a safe and secure place for its own
sake”
36
“We also want schools to be safe and secure because
the presence or absence of a safe learning environment
enhances or impedes learning”. Even if the environment
does not sink to the level of shootings or bomb scares,
the extent to which student learning is interrupted by
routine disciplinary problems serves to diminish learning
to some degree. Therefore, the goal of the effective
school is to minimize, if not totally eliminate, such
incidents ( Lezotte, 2009).
If schools are to be good and safe places, the agenda
for school safety must be combined with other efforts to
address the variety of factors that interfere with a
school accomplishing its mission (Adelman, 2007). And, all
such efforts must be embedded in the larger agenda for
school improvement. Unfortunately, this generally is not
the case. To place school safety back into proper context,
four fundamental concerns must be brought to school
improvement planning tables. These concerns stress the
need to:
37
1. Expand policy – broadening policy for school
improvement to fully integrate, as primary and essential,
a comprehensive, multifaceted, and cohesive system for
addressing barriers to learning and teaching, with school
safety embedded in natural ways,
2. Reframe interventions in-classrooms and school-
wide – unifying the fragmented interventions used to
address barriers to learning and teaching and promote
healthy development under a framework that can guide
development of a comprehensive system at every school, 3.
Reconceive infrastructure – reworking the operational and
organizational infrastructure for a school, a family of
schools, the district, and for school-family-community
collaboration with a view to weaving resources together to
develop a comprehensive system,
4. Rethink the implementation problem – framing the
phases and tasks involved in "getting from here to there"
in terms of widespread diffusion of innovations in
38
organized settings that have well-established
institutional cultures and systems.
Discipline is also a factor in creating the learning
environment of a school. A survey on behaviors in high
schools revealed that a study by Rutter et al. as cited by
Carroll (2009) reports that school-level performance was
correlated with delinquency, attendance, and misbehavior
in school, but did not report the magnitude of the
association. School-level policies like “welfare” or
“discipline” based approaches and the use of corporal
punishment did affect the rates of misbehavior.
Bullying is the common misbehavior shown by
adolescence. Adolescent girl-to-girl bullying is a
pervasive concern in schools across the United States.
Adolescent girl-to-girl bullying, or relational
aggression, includes behavior that harms others through
damaging relationships or feelings of acceptance,
friendships or group inclusion, and most often occurs
among girls compared to boys (Crick et al., 2001 as cited
39
by Rayle 2009). The consequences to female perpetrators
and victims of relational aggression are well documented
and include immediate and future potential problems for
personal, academic, and career development including
increased stress, eating disorders psychological
disturbances self-destructive behaviors social
maladjustment, deficiencies in physical wellness, lower
self-esteem, and higher rates of school absenteeism (Rayle
et. al., 2009).
Effect of criminal and violent acts in North Carolina
public middle schools on the academic performance levels
of 8th graders, confirms that these incidents lower
academic achievement, as measured by the percentage of
students at or above grade level on N.C. 8th Grade Math
and Reading End-of-Grade tests. The first incidents were
more disruptive to achievement than later incidents; and
the relationship was small in magnitude but statistically
significant. Specifically, the average marginal influence
of one more incident of crime or violence was a 0.138
40
decrease in Math scores and a 0.143 decrease in Verbal
scores; these findings were also strongly inelastic
( Carrol, 2009).
Mandell et. Al (2002) conducted a study on the
associations among substance use, violent/delinquent
behavior, and academic achievement (as indicated by test
scores) in groups of high school and middle school
children. The study found that groups of middle and high
school students with even moderate involvement with
substance use and violence/delinquency had poorer overall
test scores than groups of students with little or no
involvement in these behaviors. The study recommends that
if schools and communities are concerned about improving
achievement, they must address both attitudes and
behaviors related to substance use and
violence/delinquency.
Students Academic Orientation
41
The benefits of orientation to students were so very
evident in incoming college freshmen in some schools.
Reynolds (2006) study found out that there were three
major, salient themes in the data that provided some
insight into the impact of orientation on the
participants: students’ self-efficacy, the “personal
touch,” and orientation as “the start.” The students
experienced and expressed an increased confidence and
awareness that they attributed in some part to their
attendance at orientation. They reported, for example,
that the program “helped me not to be so scared, and they
showed you what [college] was about.” Another stated, “It
gave me the confidence just to know what I was doing.”
Knowing what it was about gave them the courage to return
to Ivy Tech when classes started. It demystified and
personalized their start at college, whether they were
fresh out of high school or returning to college to
retrain after being laid off. Orientation gave them
knowledge of things they did not know, and students talked
42
of using the things they had learned. Some were
enthusiastic about the computer training they received,
others with financial aid information. Most were checking
their grades on e-learning and using other resources they
had been exposed to such as the learning resources center.
As demonstrated by the following interaction between two
students, most important was the confidence that “Maybe
there were still questions, but if I had a
question . . . .” “You know who to go to.”
Reynolds (2006) further noted in his study that the
faculty also reported some differences with their first-
year students in comparison with past years. Some believed
that attendance had improved and that their students
seemed more informed. Faculty had a sense that their
first-year students were taking more initiative, as
demonstrated in the increased use of online resources by
students. Many faculties said they had noticed students
using the e-learning resources far more than any previous
year to check grades and assignments. Their evidence of
43
this came through students’ reminders to post things on
the site and by the log-in sheet. One faculty member
commented that he used to get “hammered” with questions on
how to use e-learning, but this academic year he had
noticeably fewer questions.
Orientation seems to have shaped the way students
were negotiating college. After starting classes they
seemed to be doing things for themselves rather than
asking staff, taking the initiative to keep on top of
their class progress, and using services more than new
students had in the past. Of huge importance to students
is what may be called the “personal touch.”
Guidance
Quality of education is reflected through academic
achievement which is a function of study habits and study
attitude of the students. Thus, to enhance the quality of
education, it is necessary to improve the study habits and
study attitudes of the students. To improve study habits
and study attitude, those factors are needed to be
44
identified which affect these characteristics adversely.
Identification of these factors may lead towards remedial
measures. To identify factors having negative effect on
study habits and study attitudes, to propose remedial
measures and to employ strategies for the development of
good study habits and study attitudes, well organized
guidance services are needed in schools (Hussain, 2006).
Guidance and counseling should be encouraged in the
schools to meet pupils’ needs. Pupils need someone to talk
to since parents do not have time for their wards at home
and teachers do not show much interest in the pupils
(Etsey, 2005). Once each person's individuality and
aptitudes have been identified the school must nourish
them and encourage the child realise his/her future
potential. For that reason it is necessary for guidance
to begin early, wheras we note this not to be the case
(Gabbianelli, 2001). It is essential to emphasize the
strong points, especially where less positive
characteristics prevail. By highlighting the talents on
45
which the student can build, he will be guided towards
goals that he can reach, thereby identifying elements for
his self-achievement.
Guidance programmers foster positive attitude towards
school learning and work: hence, improve academic
achievement. A study was conducted by Hudesman et al., as
cited by Hussain (2006) which compared the impact of
structured and non-directive counseling styles on academic
performance of high-risk students. Results indicated that
students in structured counseling condition had higher
GPAs than those in non-directive counseling condition at
the end of semester. Hussain (2006) made similar findings
when he conducted effects of guidance services on
students’ study attitudes, study habits and academic
achievement. The experiment revealed that guidance
services have significant positive effect on student’s
study attitudes and study habits. Improvement in study
attitudes and study habits resulted in improvement of
students’ academic achievement. Significantly better
46
performance of experimental group in the subjects of
Physics, Mathematics, Biology, Chemistry and English text
is an evidence that study attitude and study habits do
affect students’ achievement.
Students – Peer Relationships
The role of social interaction in modifying
individual behavior is central in many fields in social
science and social psychologists have been conducting
related experiments for half a century. Economists too
have a long standing theoretical interest (Becker 1974, as
cited by Gibbon 2008), and the past two decades have seen
rapid growth in applied work that has attempted to
investigate both the existence and functional structure of
peer group influence. The range of outcomes that have
interested researchers is diverse, including smoking
(Alexander et al. 2001; Ellickson, Bird et al. 2003 as
cited by Gibbons), joke-telling, sexual behavior purchase
47
of a retirement plan, fruit picking, check-out throughput,
routine tasks and performance in professional golf
tournaments. Introspection does suggest that many
decisions are linked to similar decisions by a friend or
other associate (in some cases fairly explicitly, like the
decision to have sex, be in a gang or play tennis), and
many consumption decisions rely on other consumers
participating (e.g. video phones). However, the more
interesting possibility is that group behavior or
attributes can modify individual actions in relation to
important social and economic decisions that will affect
their life chances –especially achievement in education
( Gibbons, 2008).
Some very bold claims have been made about the
potency of peers in child development (Rich Harris 1999 as
cited by Gibbons, 2008), yet the results of numerous
studies are very mixed, finding strong, weak or non-
existent effects across a wide range of outcomes. Most
empirical work in education was the study of Lavy (2009)
48
which investigates which segments of the peer ability
distribution drive the impact of average peer quality on
students’ achievements. The study claimed that there was a
significant and sizeable ability peer effects that mainly
reflect the positive impact of the very academically
bright peers and the negative impact of the very worst
pupils. Moreover, we find some interesting and policy
relevant heterogeneity along the dimensions of pupils’
ability and gender. Finally, we show that our results are
driven by peers’ academic ability, and not related to
their family background.
Gibbons (2008) study used year-to-year changes in
school composition to identify the impact of school mates
on pupil progress at age 14. Traditional ‘linear-in-means’
specifications conclude that prior achievements of a
child’s schoolmates are, on average, unrelated to his/her
academic progress. However, this masks evidence that lower
achieving pupils are disadvantaged by higher achieving
schoolmates, whereas upper-middle ranking pupils benefit.
49
Sass (2008) study also revealed that under linear-in-
means specifications, estimated peer effects are small to
nonexistent, but he finds some sizable and significant
peer effects within nonlinear models. For example, he
finds that peer effects depend on an individual student’s
own ability and on the ability level of the peers under
consideration, results that suggest Pareto-improving
redistributions of students across classrooms and/or
schools. Estimated peer effects tend to be smaller when
teacher fixed effects are included than when they are
omitted, a result that suggests co-movement of peer and
teacher quality within a student over time. We also find
that peer effects tend to be stronger at the classroom
level than the grade level.
Instructional Management
Leitner (2000) conducted a study on principal’s role
in instructional management. This study used an

50
organizational perspective to investigate three questions
regarding the principal’s role in instructional management
such as (1) Do instructional management behaviors predict
student achievement? (2) What specific instructional
management behaviors are indentified with principals in
effective schools? and (3) Are the linkages that
principals use to influence teacher behavior and
instruction relate to student achievement? An
Instructional Management Questionanaire (IMQ) was used to
collect data on the principal’s role in instructional
management from the teachers at 29 participating
elementary schools from February to April 1987. Findings,
state that there is little evidence to suggest a strong
relationship between principals’ instructional management
behavior and student achievement.
A curriculum-based instructional management system
was used to enhance the mathematics instruction of 3rd
through 6th grade Title I and non-Title I students.
Improvements in math achievement for Title I students who
51
were and were not participants in this curriculum
enhancement were also compared. Title I students who
participated in the instructional management system
significantly outperformed those who did not. There were
also important qualitative differences on how the
instructional management system worked for Title I and
non-Title I students. Implications for managing math
instruction were specified ( Ysseldyke et. Al, 2004).
Student Activities
Research indicates that participation in
extracurricular activities affects students’ academic
performance. Rombokas as cited by Hollrah (2009) performed
a study of college-aged students who were involved in
extracurricular activities in high school to discover if
there was in fact a correlation between involvement in
activities and academic achievement. She concluded after
52
questioning two hundred ninety-two college students that
"participation in extracurricular activities enhances both
the intellectual and social development of students".
Through her own research, she discovered that athletes
attained higher grade point averages than those students
not in athletics. Activities are not solely about what the
score is, how many wins or losses are attained during a
season, or what place is won at a competition. They
provide and instruct students with lessons that will last
them a lifetime (Hollrah, 2009).
Fujita’s (2009) study also revealed that, according
to the students surveyed, playing sports, watching
television, and participating in community service
improves academic performance, while playing a musical
instrument does not improve academic performance.
Therefore, it was concluded that extracurricular
activities affect academic performance and that the effect
depends on the specific activities in which the student is
involved.
53
Reading performance can also be associated with
student’s involvement in extracurricular activities. Clark
(2009) found out in his study that high achievers
generally were involved at a higher-quality level in the
five constructive out-of-school activities more often than
lower achievers. Students' quality of active engagement
while doing high-yield activities was statistically
significant for the set of activities.
Variations in allotment of time for nonacademic
activities (e.g. athletics, socializing, job) may affect
students’ grade point average (GPA). Studies have
consistently reported a negative relationship between
students’ participation rate in nonacademic activities and
their academic achievement. Purdy, Eitzen, and Hufnagel as
cited by Ock (2008) examined the academic achievements of
over 2,900 student-athletes at Colorado State University
from 1970 to 1980. The results showed that student-
athletes achieved less academically compared to the
general student body. The mean GPA for the student-
54
athletes, for example, was considerably lower than that of
the general student population.
Leadership Behavior
Human Relation
School head-teacher relationships vary greatly among
schools and even among teachers at the same school.
Furthermore, those relationships affected student
achievement (Wash, 2005 as cited by Edgerson et. al.,
2006). This phenomenon occurs because teachers who see
principals as facilitators, supporters, and reinforces for
the jointly determined school mission rather than as
55
guides, directors, and leaders of their own personal
agenda are far more likely to feel personally accountable
for student learning (McEwan, 2003 as cited by Edgerson
et. al., 2006)
Human relations are defined as those formal and
informal interactions that occur between people. Bulach
(1998), based on his assessment of the leadership skills
of 51 aspiring school leaders, concluded that more than
50% have weaknesses in the human relations area. In other
words, their interactions with others tended to produce a
negative situation. Bulach, Boothe, and Pickett (1998)
surveyed 375 teachers to identify those behaviors their
principals practiced that were mistakes. An analysis of
the data produced 14 categories of perceived mistakes or
harmful behaviors that principals practiced. Perceived
mistakes in human relations and interpersonal
communications were the most frequently reported.
Specific behaviors in the human relations area were a lack
of trust and an uncaring attitude. The most frequently
56
perceived behavior in the area of interpersonal
communications was failure to listen or a lack of
openness. Clearly, openness and trust are essential for
human relations.
Byrd (2002) examined the human relations skills of
principals who have been successful in retaining classroom
teachers. The study was guided by two research questions:
a) what are the human relations skills of principals in
urban schools with low teacher turnover rates as perceived
by teachers and assistant principals and b) what are the
human relations skills as perceived by principals
themselves related to their own school's teacher turnover
rate?
The results of the questionnaires and the interviews
of the principals and assistant principals were coded and
organized into themes. The themes revealed a specific list
of human relations skills of urban principals who are
successful in retaining teachers.
57
The Human Relation Skills of Urban Principals with
Low Teacher Turnover Rates were: Sincerity: The principal
cared about the teacher's family. Mentorship: The principal
mentored the teachers through professional and personal
experiences. Encouraging: The principal empowered the
teachers with new ideas.
Open Minded: The principal listened to criticisms or
suggestions.
Understanding: The principal listened and understood where
the teachers were coming from.
Accessibility: The principal had an open door policy.
Mutual Trust: The principal trusted the teachers and the
teachers trusted the principal.
Effective Communicator: The principal was a positive
communicator.
Positive Outlook: The principal believed the teachers would
succeed.
Compassionate: The principal loved the teachers.
58
Human relations are significantly important to
maintain harmonious work relationship between
administration and teachers (Alcaide, 1994). Furthermore,
her study found out that good human relations of the
school administrators had significant contribution to the
performance of teacher. Strategies and techniques are
therefore needed to work relationship between the school
administrator and the teacher.
Trust
Trust has been called the foundation of school
effectiveness (Cunningham & Gresso,1993) due to its
pivotal role in fostering those attributes by which
schools are most often judged to be effective. Defined as
“an individual’s or group’s willingness to be vulnerable
to another party based on the confidence that the latter
party is benevolent, reliable, competent, honest, and
59
open”, trust relationships are the common thread
interwoven through the fabric of effective schools.
The need for trust is an essential element of
motivational theory. Psychologists have long recognized
that an individual’s actions are driven by motivation that
results from the satisfaction of trust and other similar
needs (Rebore, 2004). One of the best known examples is
Maslow’s (1954) hierarchy, in which the satisfaction of
fourth level, esteem needs, is prerequisite to the
development of self-directed and growth motivated
educators. At this level, the presence of trust
relationships assists in building educators’ esteem so
that their professional efforts focus on educating
students rather than the fulfillment of personal needs
(Hoy & Miskel, 2001; Wilson, Robeck, & Michael, 1974), as
mentioned by Montero (2010).
There are a number of things principals can do to
improve levels of openness and trust. Principals need to
spend more time listening to their teachers and
60
encouraging them to give him/her feedback on a wide
variety of items, e.g., allow teachers to evaluate the
principal, have group meetings where faculty and
administration can share how things are going and how they
can be improved.
Leaders have to stay open to others and that “Trust
is maintained when people see that we are not ‘know-it-
alls’ and are interested in learning from others”.
Listening is an openness dimension that is a building
block for trust. When a person listens to someone, a
message is conveyed that you value that person, and that
you have time for them because they are important. In
other words, you care about them. When people believe
that you care, the process of trusting is under way
(http://www.westga.edu/~cbulach/sclimate/ihrtopen.htm)
Seltzer and Roxbury (2009) found out that another
skill which the status leader may choose to explore is
that of developing the feeling among the staff that
everyone is getting a fair deal. This feeling can do much
61
toward building trust among the faculty. In the process
of developing this trust, the administrator needs a deep
perspective and understanding because justice to the
individual is only what he thinks is justice. The human
relations that take place in this determination are
sometimes quite complex. Compromise may be possible in the
administration of justice, but, above all, the principal,
in an attempt to satisfy all parties concerned, will be
guided by the desire to be fair and to do the right
thing. The mature school executive administers justice
tempered with mercy. Some may call this sympathy, but
whatever term is used to describe the situation, it will
certainly be recognized that the sympathetic approach is a
restorer and preserver of confidence.
The findings of Bulach et al. (2001) reinforce the
previous research that human relations are a crucial area
for effective leadership. While there are no definitions
of human relations, the words trust, communications, and
listening skills are recurring themes. It seems logical
62
that trust would be at the heart of human relations. In a
marriage, which should epitomize successful human
relations, trust is essential. Closely related to trust
is a construct called openness. When people trust, they
leave themselves open, and this can subject them to risk
being hurt by the person they trust. As a result, there is
a tendency for teachers and principals to be closed rather
than open.
While there is little disagreement that levels of
openness and trust are important for an effective
organization, there is little agreement that they are
present in the schools of Georgia. The data from this
research clearly indicate that improvement is needed on
these two constructs that affect an organization’s culture
and productivity. According to Cherniss (1998),
emotionally intelligent educational leaders possess people
skills. Openness and trust are two basic people skills. It
is time to stop talking about how important openness and
trust are for an organization and do something about it.
63
It is “Time to walk the talk!” Principals need to listen
to their teachers! If principals become open and trusting
role models, perhaps a culture can be created where
teachers will start being open and trusting with each
other. A process for creating such a culture is described
by Bulach (2001).
Instructional Leadership
Research has consistently shown that principals play
a significant role in school reform efforts. As the
developing concept of management, it is by communication
that managers’ behavior will change Chang (2009). These
studies consistently found that the school head was the
key to an effective school. Research found that the unique
position principals hold, as the one person in a school
who is responsible for and empowered to oversee the entire
school, places them in a powerful position to coordinate
the entire school operation and move it forward. The
64
research further revealed that the most effective
principals had a clear vision of how the school could
serve its students; had aligned resources and priorities
with the vision; and could engage other key players,
within and outside the school, in achieving the goals
embedded in the vision.
Chang, (2009), added that the role of the principal
continues to be key to the improvement of schools.
Instructional leadership was also noted as the most
significant leadership dimension. This dimension has
altered the role of the principal by shifting the focus of
the principal’s responsibilities from operational
management to instructional leadership.
Instructional leadership can be defined as "those
actions that a principal takes, or delegates to others, to
promote growth in student learning." In practice, this
means that the principal encourages educational
achievement by making instructional quality the top
65
priority of the school and brings that vision to
realization.
The result of instructional leadership is a
collaborative learning environment where learning is not
confined to the classroom and is the objective of all
educators. Instructional leadership is an important
departure from the ancient model of administrator as
authoritarian. Inherent in the concept is the idea that
learning should be a top-down process. If those in charge
of the school are excited about learning, then they will
share their enthusiasm throughout the community.
Those who learn to be instructional leaders acquire
many characteristics that are beneficial to their schools
and communities. Instructional leaders exhibit a clear
sense of direction for their schools and prioritize and
focus attention on the things that really matter in terms
of the work of students. Furthermore, instructional
leaders know what is happening in their classrooms and
develop the capacities of staff by building on their

66
strengths and reducing their weaknesses. These leaders
also attempt to sustain improvement and change in their
schools by anticipating and overcoming the obstacles that
inevitably will emerge along the way. (http://www.e-
leadlead.org/resources/resources.asp?ResourceID=14)
Jenkins (2009) stated that instructional leadership
differs from that of a school administrator or manager in
a number of ways. Principals who pride themselves as
administrators usually are too preoccupied in dealing with
strictly managerial duties, while principals who are
instructional leaders involve themselves in setting clear
goals, allocating resources to instruction, managing the
curriculum, monitoring lesson plans, and evaluating
teachers. In short, instructional leadership reflects
those actions a school head takes to promote growth in
student learning. The instructional leader makes
instructional quality the top priority of the school and
attempts to bring that vision to realization.
67
Instructional leaders need to work closely with
students, developing teaching techniques and methods as a
means for understanding teacher perspectives and for
establishing a base on which to make curricular decisions.
“If principals are to take the role of instructional
leader seriously, they will have to free themselves from
bureaucratic tasks and focus their efforts toward
improving teaching and learning.”
Effective instructional leaders need to be resource
providers. It is not enough for principals to know the
strengths and weaknesses of their faculties; they must
also recognize teachers’ desires to be acknowledged and
appreciated for a job well done. Teachers seek only tiny
morsels of praise and the assurance to support them as a
resource provider. Effective instructional leaders need to
be instructional resources. Teachers count on their
principals as resources of information on current trends
and effective instructional practices. Instructional

68
leaders are tuned in to issues relating to curriculum,
effective pedagogical strategies, and assessment.
All schools need effective instructional leaders who
are well prepared and capable of leading the changes in
curriculum and instruction that will result in higher
levels of learning for all students. Effective
instructional leaders create a school culture of high
expectations conducive to the success of all students.
Effective instructional leaders ensure that school
programs, procedures, and practices focus on the learning
and achievement of all students and support the social and
emotional development
necessary for students to attain academic success.
http://74.6.146.127/search/cache?ei=UTF-
8&p=school+principal+as+instructional+leader&fr=yfp-t-
Conrtrol
Viewing leadership as the process of selecting an
appropriate means (or control strategy) to reach a desired
69
goal, this paper investigates the underlying structure of
supervisory control. Using a multidimensional scaling
procedure, four leader behavior dimensions were extracted
and identified: obtrusive vs. unobtrusive control,
situational vs. personal control, professional vs.
paternalistic control, and process vs. output control.
The implications of the findings for past and future
research are then considered. Analyzing the Leadership
Behavior of School Principals, other methodologies for
investigating leadership behavior involve leadership style
inventories that would speak the leadership control in
behavior.
Conflict
Almost every working relationship produces some
degree of conflict across time Newstrom and Davies as
cited by Tubat, 2009. Whether the conflicts are
destructive or constructive depends on the attitudes and
70
skills, the participants, pressure and resource shortage.
Conflict according to Taguri as cited by Tubat (2009) is
inherent in social life. It occurs in any situation in
which two or more parties feel themselves in opposition
and in compatible goals, attitudes, emotions or behavior
which lead to disagreement or opposition between two or
more parties. It is an interpersonal process that arises
from disagreement over the goal to attain or the method to
be used to accomplish those goals.
The study submitted by fgatabu 2012, on Head
Teachers’ Conflict Management Styles And Their Effect On
Discipline In Secondary Schools In Central Division,
Machakos District, Kenya found out that head teachers
conflict management styles have an effect on the
discipline of students. These findings have important
implications on school management with respect to training
of head teachers on conflict management styles in order to
enhance student’s discipline.
Teachers Performance
71
In all education system, the performance of teachers
is one of the handful of factors determining school
effectiveness and learning outcomes. Mohanty (2000)
explains that teacher performance is the most crucial
input in the field of education. Teachers are perhaps the
most critical component of any system of education.
Teachers must be seen as part of the solution, not
part of the problem. Poor pay, low status and morale are
key causes of poor performance and corrupt behavior in the
public sector Teaching is noble, but demanding occupation.
In order for teachers to maintain a high level of
professional performance under these conditions, they must
assume personal responsibility for their own performance,
growth, and development.
One of the D.C. teachers was fired because of a low
rating according to Anderson (2009). It is added student
achievement in the last school year was low because of the
erroneous performance evaluations for 44 teachers in Ben
72
Tankersley - Jason Kamras, chief of human capital for D.C.
public school in D. C. Teachers with an effective rating
became subject to dismissal. The same was true for those
rated “minimally effective” two years in a row or
“developing” three years in a row.
At present in the Philippines, there is a need to
evaluate the process of evaluating teacher performance.
The processes and practice is called Competency- Based
Performance Appraisal System for Teachers.
The leadership behavior and style of the school heads
is demonstrated in his activities which makes him
recognized as a leader of a group, performing the
leadership roles in schools as expected of them. However,
teacher expected leadership roles of the principal may be
different from the actual leadership style or role
performance they observe in their schools.
73
Conceptual and Theoretical Framework of the Study
Schools are multi-faceted organizations. Achieving
and sustaining high quality institutions within a complex
environment demands that the school head, as a school
leader, possess a wide range of leadership capabilities
and strong relationship in and out the school.
The issue of teachers as a part of these professional
communities must be addressed by principals who wish to
improve their supervisory skill in building a more
supportive climate that allows teachers to develop to
their full potential. The collaborative culture described
by Gruenert (2005) has to be created.
Evidence supports that school heads’ leadership
behavior strongly affects teachers’ performance. Teachers
motivated if the school head is quite good. (Liethwood,
Seashore-Louis, Aderson, & Wahlstrom ,2004 as cited by Orr
2006).
74
The school heads’ leadership behavior also is
influenced by the tenureship because it is believed that
the longer the tenure, one’s is true behavior can be seen
by the teachers. Socio-demographic characteristics
influence school climate (Korir & Karr-Kidwell, 200 as
cited by Halawah, 2005). Villa, (1992) as cited by Halawah
(2005) concluded that effective principals also promote
instructional climate that strongly values and reinforces
good performance and achievement of the teachers.
This study is anchored in the leader behavior theory
which holds that leaders are made, not born; it stands in
contrast to leadership trait theory, which argues the
opposite ( Kuchler, 2009). Consequently, Kouzes and Posner
(1987) and Clark and Clark (1990) as cited by Halawah
(2005) and mentioned by Montero (2010), who proposed that
leadership behavior can be taught.
The Conceptual Framework
75
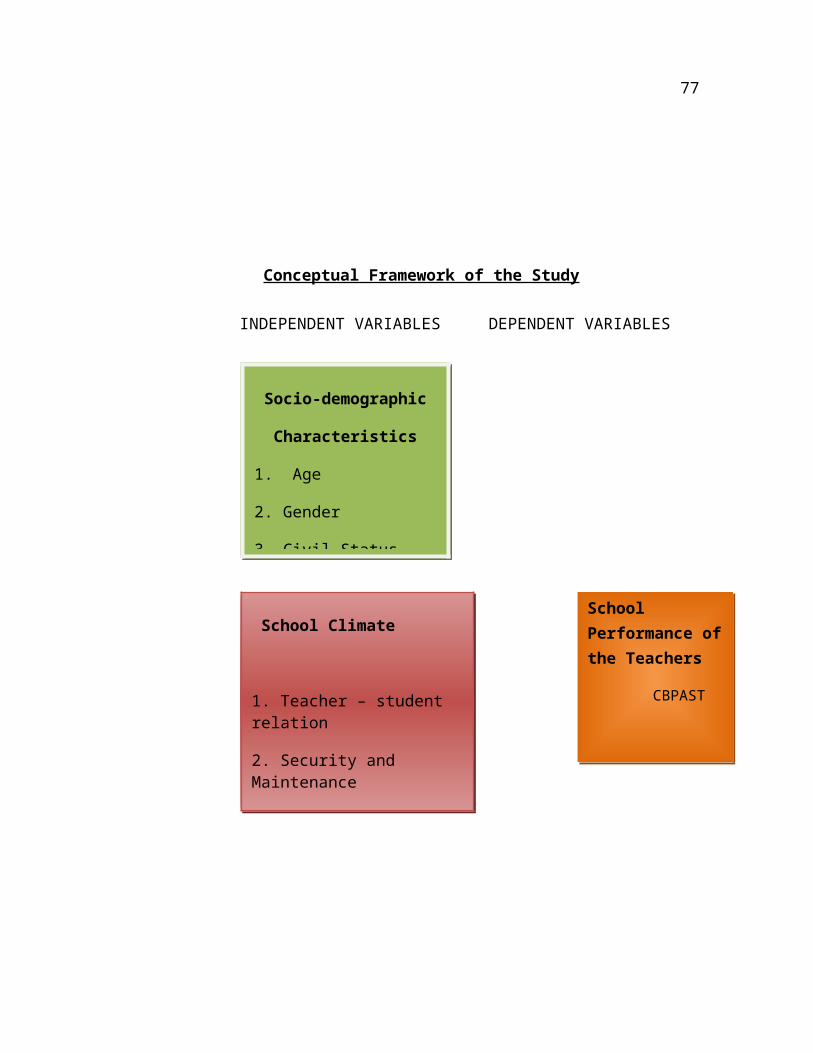
The conceptual framework of the study is shown in
Figure 1. In the figure, the socio-demographic
characteristics of school head are the independent
variables which can influence school climate, leadership
behavior and the dependent variables in the right is the
teachers’ school performance.
School climate influences leadership behavior of
school heads and teachers’ school performance. The
leadership behavior can influence school performance of
the teacher. The independent variables of the study are
the socio- demographic characteristics such as age,
gender, civil status, position, educational attainment,
and type of the school. The school climate includes
teacher- student relation, security and maintenance,
students academic orientation, guidance, students – peer
relationships instructional management and student
activities. The school heads’ leadership behavior as human
relations, trust and decision making, instructional
76
leadership, control and conflict while the dependent
variable is the teachers’ school performance form the CB-
PAST rating in the recent year.
77
Conceptual Framework of the Study
INDEPENDENT VARIABLES DEPENDENT VARIABLES
Socio-demographic
Characteristics
1. Age
2. Gender
3. Civil Status
School Climate
1. Teacher – student relation
2. Security and Maintenance
School Performance ofthe Teachers
CBPAST
78
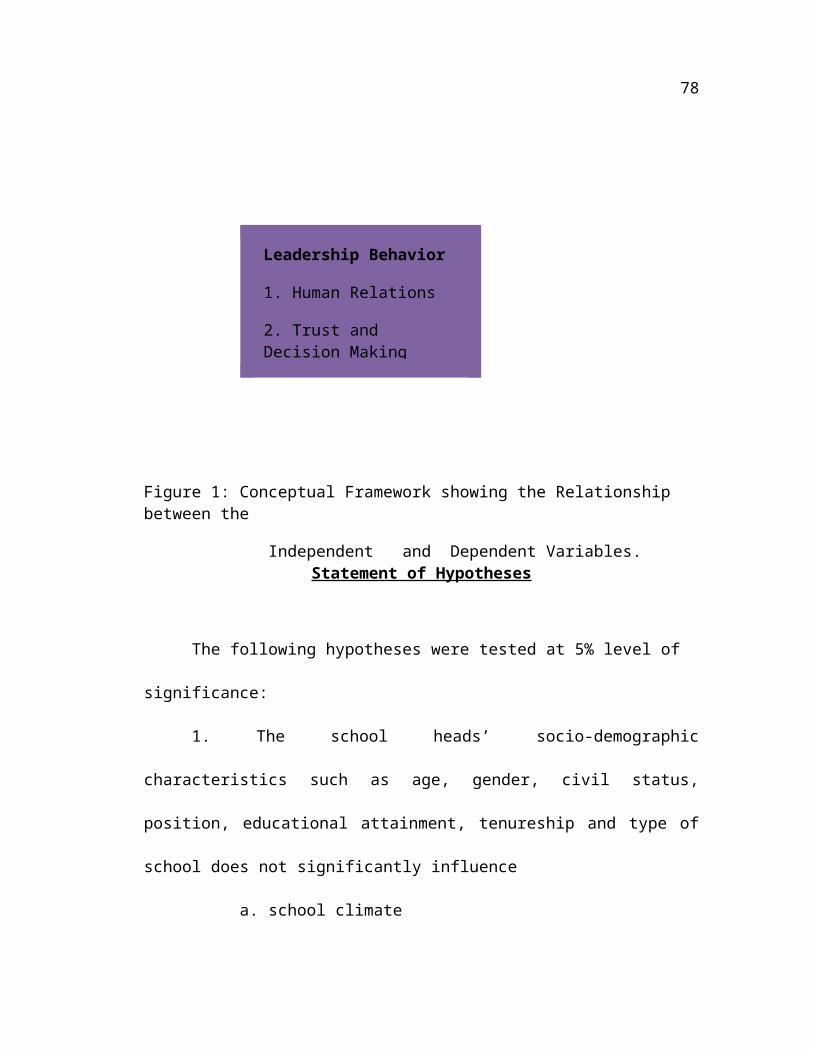
Figure 1: Conceptual Framework showing the Relationship between the
Independent and Dependent Variables. Statement of Hypotheses
The following hypotheses were tested at 5% level of
significance:
1. The school heads’ socio-demographic
characteristics such as age, gender, civil status,
position, educational attainment, tenureship and type of
school does not significantly influence
a. school climate
Leadership Behavior
1. Human Relations
2. Trust and Decision Making
79
b. leadership behavior
c. performance of the teacher
2. The school climate does not significantly
influence;
a. school heads’ leadership behavior
b. performance of the teachers
3. The school heads’ behavior does not significantly
influence the performance of the teachers in public and
private high schools in Kidapawan City Division.
CHAPTER III
METHODOLOGY
80
This chapter includes the following sections; namely:
1.locale of the study 2.design, respondents of the study,
4. sampling procedure, 5. survey instrument and 6.
Statistical analyses.
Locale of the Study
This study was conducted in 34 public and private
high schools in the Kidapawan City Division particularly
17 regular public high schools, 2 extension high schools,
7 integrated schools and 8 private high schools in
Kidapawan City Division.
The 17 regular high schools are Amas National High
School, Gayola National High School, Ginatilan National
High School, Kidapawan City National High School, Juan P.
Gantuangco School of Arts and Trades, Juan P. Jalipa
Memorial High School, Kalaisan National High School,
Kidapawan City National High School, Linangkob National
81
High School, Manongol National High School, Mt. Apo
National High School, Onica National High School, Paco
National High School, Patadon National High School, Perez
National High School, Saniel Cruz National High School,
Spottswood National High School.
The 2 extension high schools included Marbel High
School Juan P Jalipa extension and Lanao High School
Kidapawan City National High School extension.
The 7 integrated schools were the, Binoligan
Integrated School, Lake Agco Integrated School, Macebolig
Integrated School, Muan Integrated School, Nuangan
Integrated School, Puasinda Integrated School, and Singao
Integrated School.
The 8 Private schools were ABC Educational
Development Center , Central Mindanao Colleges, Collegio
de Kidapawan, Kidapawan Technical School and Security
Training Center Inc, New Life Academy of Kidapawan, Inc.
Notre Dame of Kidapawan College-High School Department,
82
School for Life, Inc. and St. Marys Academy of Kidapawan
High School Department.
The Research Design
The descriptive correlation research design was used
in this study to find out the influence of the socio-
demographic characteristics and school climate on the
school heads behavior and teachers’ performance.
It is descriptive correlational since it involves
description, analysis of data needed to determine the
relationships that exist between the variables identified
in the study.
Kidapawan City Locale Map

83
Figure 2. The Map of Kidapawan City that shows thedifferent barangays where the schools of publicand private high schools are located
Population of the Study
84
The respondents of this study were all public and
private school heads, and the 5 random teachers of the
public and private high schools of the Kidapawan City
Division
Sampling Procedure
Stratified sampling by equal allocation was employed
in this study. The school served as the strata. From each
of the schools, one (1) school head was purposively
selected with the total of 34, while and 5 teachers were
randomly selected from each school with the total of 170.
85
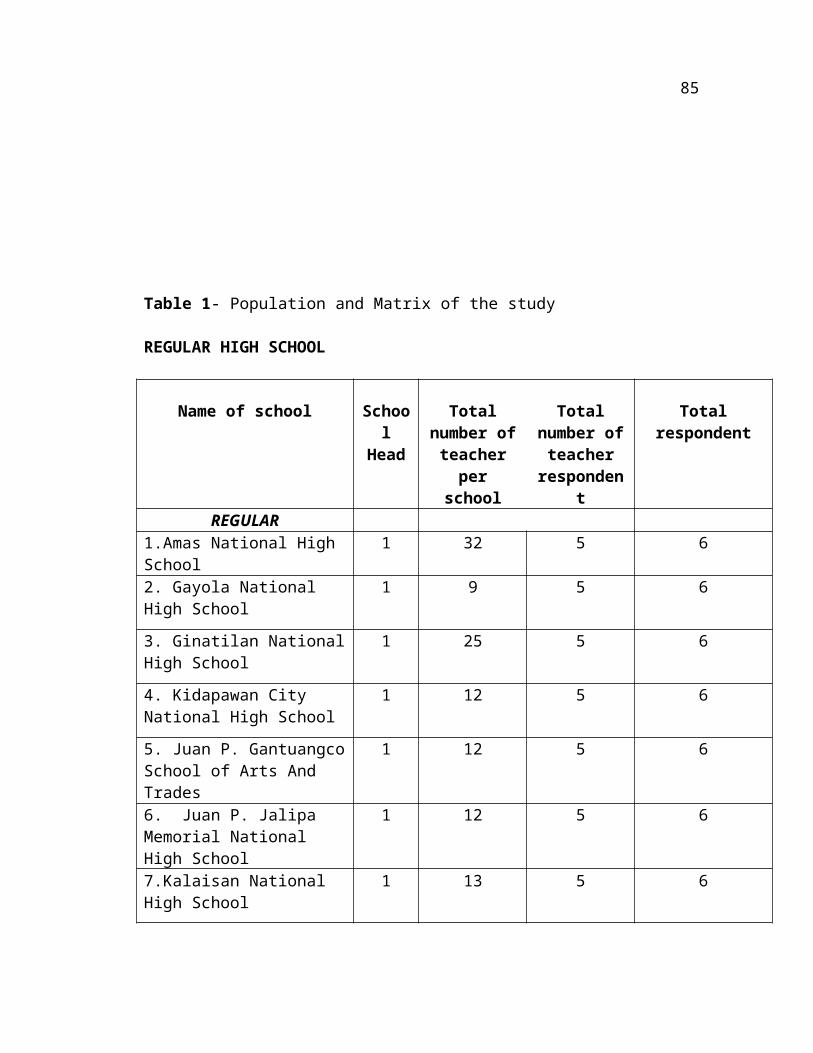
Table 1- Population and Matrix of the study
REGULAR HIGH SCHOOL
Name of school School
Head
Totalnumber ofteacherper
school
Totalnumber ofteacherresponden
t
Totalrespondent
REGULAR1.Amas National High School
1 32 5 6
2. Gayola National High School
1 9 5 6
3. Ginatilan NationalHigh School
1 25 5 6
4. Kidapawan City National High School
1 12 5 6
5. Juan P. GantuangcoSchool of Arts And Trades
1 12 5 6
6. Juan P. Jalipa Memorial National High School
1 12 5 6
7.Kalaisan National High School
1 13 5 6
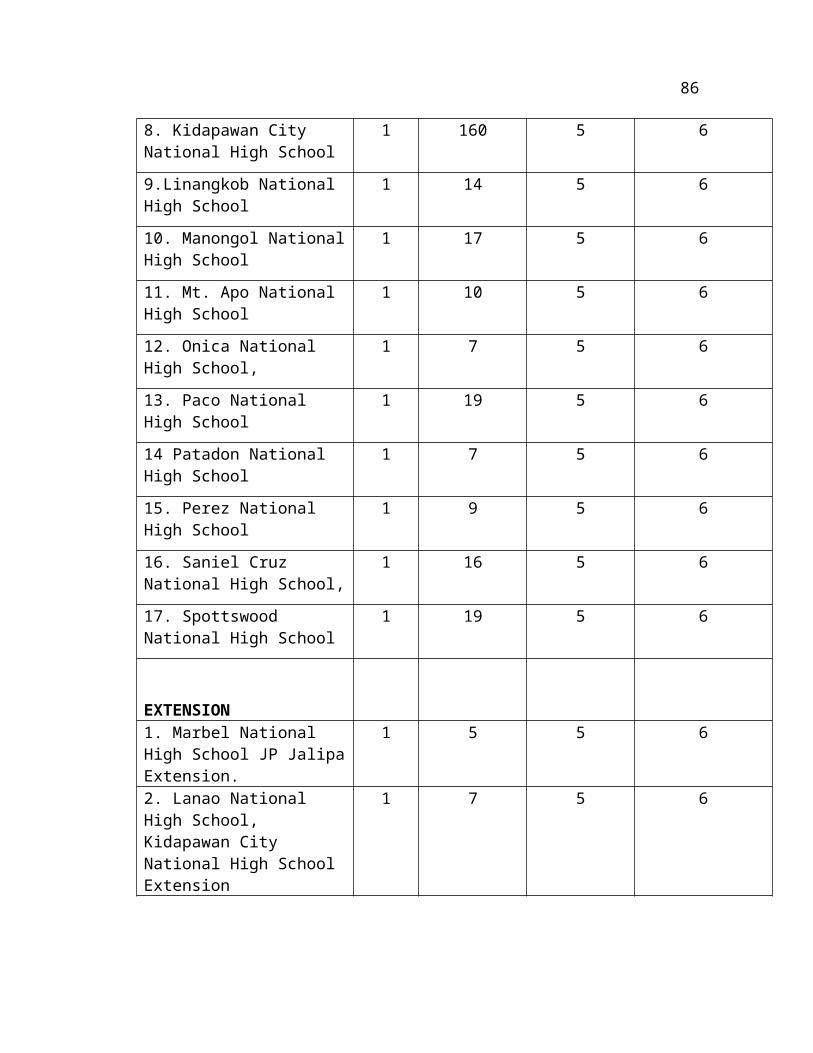
86
8. Kidapawan City National High School
1 160 5 6
9.Linangkob National High School
1 14 5 6
10. Manongol NationalHigh School
1 17 5 6
11. Mt. Apo National High School
1 10 5 6
12. Onica National High School,
1 7 5 6
13. Paco National High School
1 19 5 6
14 Patadon National High School
1 7 5 6
15. Perez National High School
1 9 5 6
16. Saniel Cruz National High School,
1 16 5 6
17. Spottswood National High School
1 19 5 6
EXTENSION1. Marbel National High School JP JalipaExtension.
1 5 5 6
2. Lanao National High School, Kidapawan City National High School Extension
1 7 5 6
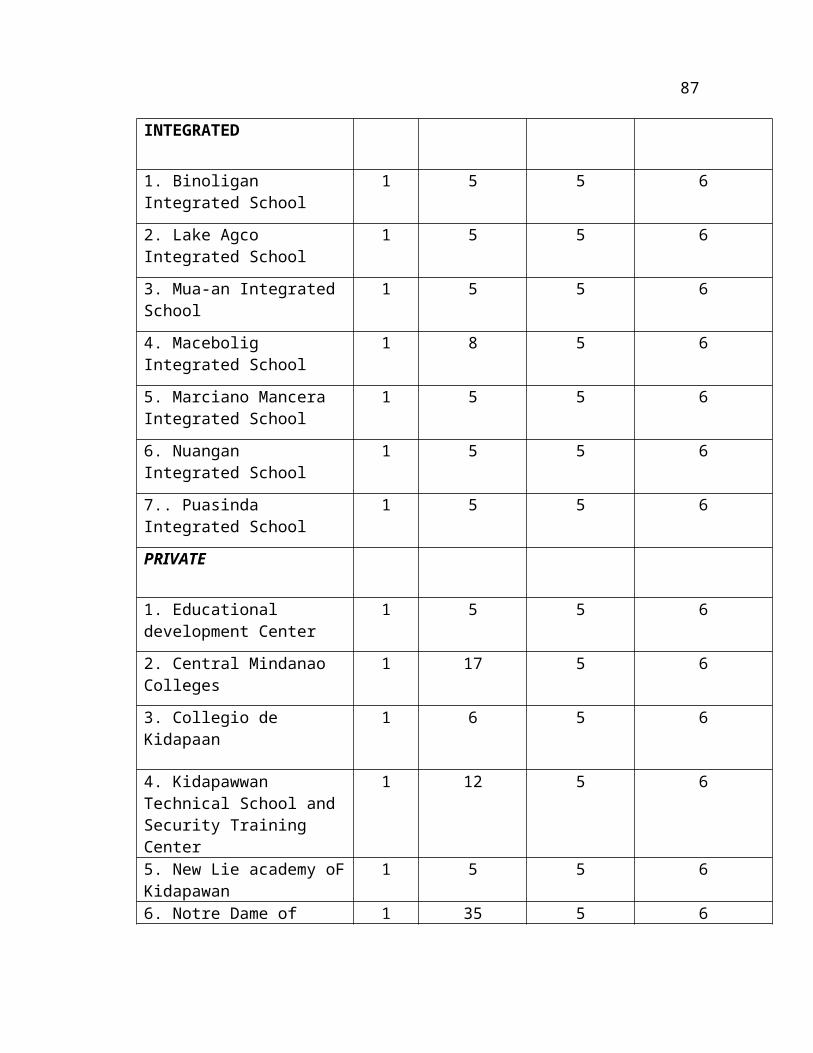
87
INTEGRATED
1. Binoligan Integrated School
1 5 5 6
2. Lake Agco Integrated School
1 5 5 6
3. Mua-an Integrated School
1 5 5 6
4. Macebolig Integrated School
1 8 5 6
5. Marciano Mancera Integrated School
1 5 5 6
6. Nuangan Integrated School
1 5 5 6
7.. Puasinda Integrated School
1 5 5 6
PRIVATE
1. Educational development Center
1 5 5 6
2. Central Mindanao Colleges
1 17 5 6
3. Collegio de Kidapaan
1 6 5 6
4. Kidapawwan Technical School and Security Training Center
1 12 5 6
5. New Lie academy oFKidapawan
1 5 5 6
6. Notre Dame of 1 35 5 6
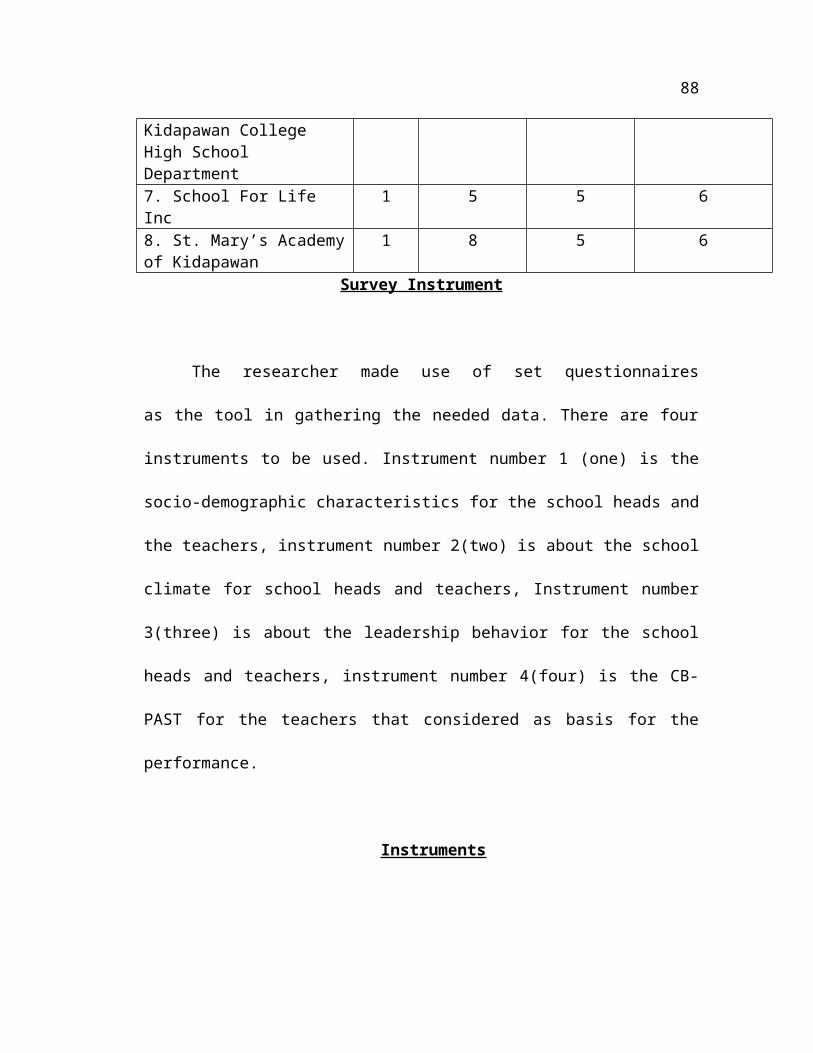
88
Kidapawan College High School Department7. School For Life Inc
1 5 5 6
8. St. Mary’s Academyof Kidapawan
1 8 5 6
Survey Instrument
The researcher made use of set questionnaires
as the tool in gathering the needed data. There are four
instruments to be used. Instrument number 1 (one) is the
socio-demographic characteristics for the school heads and
the teachers, instrument number 2(two) is about the school
climate for school heads and teachers, Instrument number
3(three) is about the leadership behavior for the school
heads and teachers, instrument number 4(four) is the CB-
PAST for the teachers that considered as basis for the
performance.
Instruments
89
A. Instrument I
This is an Administrator Respondent Questionnaires
(ARQ) and Teachers Respondent Questionnaires (TRQ). This
is to gather data on the socio-demographic characteristics
of the public and private high school on school heads and
teachers in terms of school like age, gender, position ,
educational attainment, tenure ship and type of school.
B. Instrument II
This third instrument will be used to assess the
climate of the school as perceived by the teachers and
school principals. This instrument was developed by
Evaluation Center, 2005 and also adapted by Halawah (2005)
With point eighty five (.85) validity using Cronbach
alpha, this instrument is considered internally reliable,
as cited by Montero (2010)
C. Instrument III
This instrument which was developed by Bulach et. al.
(2006) as cited by Montero 2010. It is use to analyze the
leadership behavior/style of a principal. The instrument
90
consists of 49 positive and negative behaviors that
measure how principal interacts with staff. A correlation
coefficient of +.95, as measured by the Cronbach alpha, as
mentioned by Montero as obtained indicating the instrument
has excellent reliability.
D. Instrument IV
The fourth instrument was used to gather the necessary
information on the teachers’ performance as rated by
teacher themselves, the school heads and their peers using
the Competency Based Performance Appraisal System (CB-
PAST).
Statistical Analyses
Collection of data was done by distributing the
questionnaires to the teacher- respondents, school heads
as to assess the effect of socio-demographic
characteristic and the school climate. When the
questionnaires will be retrieved, the responses are to be
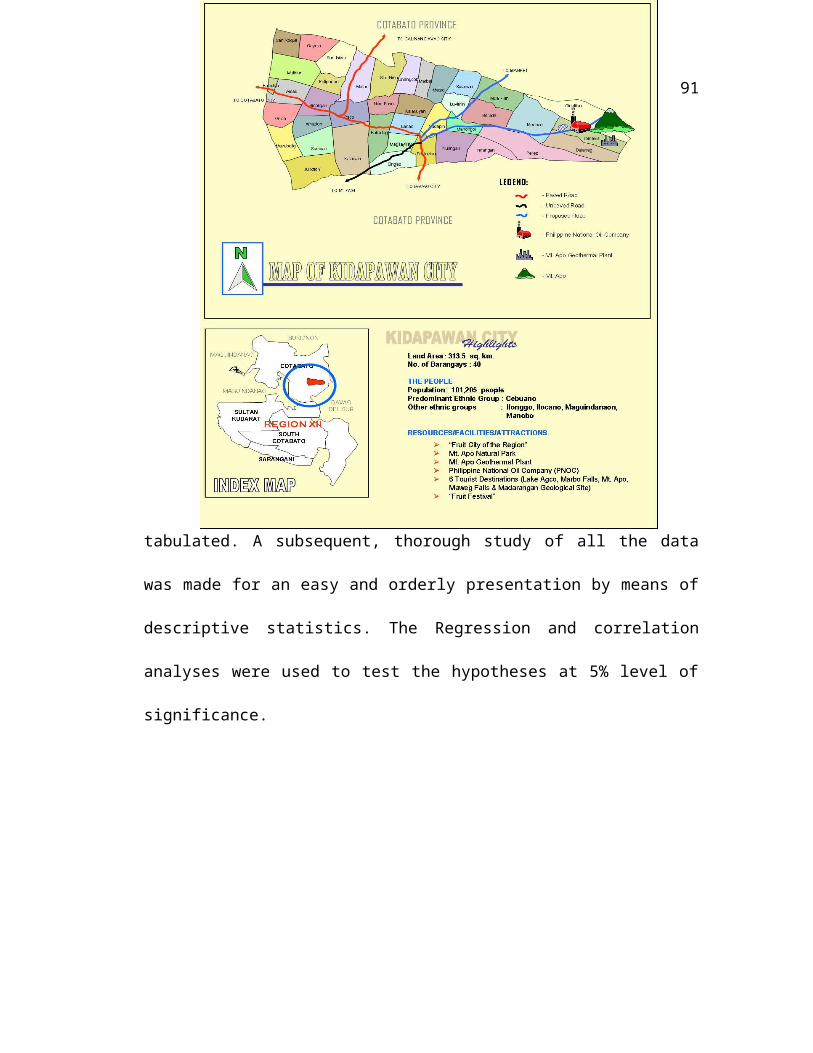
91
tabulated. A subsequent, thorough study of all the data
was made for an easy and orderly presentation by means of
descriptive statistics. The Regression and correlation
analyses were used to test the hypotheses at 5% level of
significance.
92
CHAPTER IV
RESULT AND DISCUSSIONS
This chapter presents the organized statistical
analyses and interpretation of data. The answers to the
specific question in Chapter I are presented and discussed
thoroughly.
93
Socio-demographic Characteristics’ of school-head
respondents
As shown in Table 1, the socio-demographic
characteristics of the school heads include the age,
gender, civil status, position and educational attainment,
tenure ship as school administrator and type of school.
Age
Out of the 34 school heads, 13 ( 38.2%) belonged to
age bracket 50-56 years of age; 8 (23.5%) were within the
age bracket 36-42 years, 4 ( 11.8%) belonged to age
bracket 29-35 years, 43-49 years, and 57-63 years and only
1 ( 2.9%) was in the age bracket 64 years and above. This
implies that majority of the school heads were heading
towards late 50’s meaning they’re almost in the last lap
of service.
The data conform to the findings of Isla (2004) as
cited by Montero (2010) that the age range of 35 – 50
years is the most productive years when teachers have
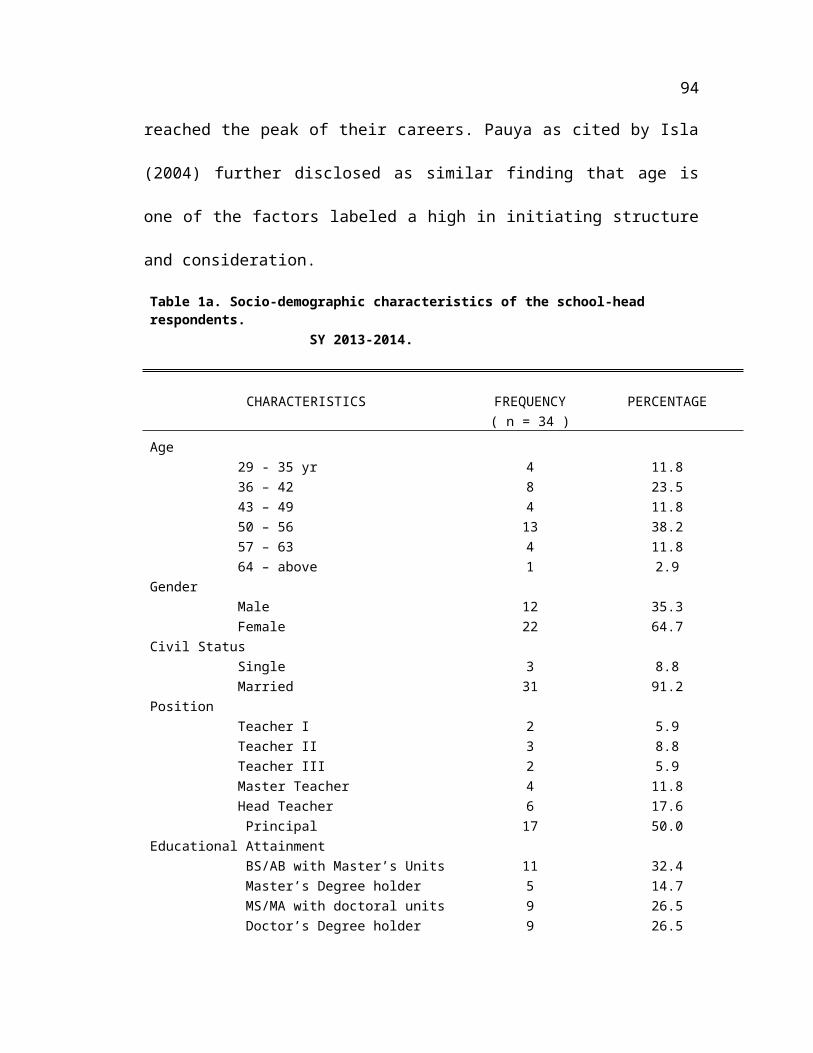
94
reached the peak of their careers. Pauya as cited by Isla
(2004) further disclosed as similar finding that age is
one of the factors labeled a high in initiating structure
and consideration.
Table 1a. Socio-demographic characteristics of the school-head respondents. SY 2013-2014.
CHARACTERISTICS FREQUENCY PERCENTAGE ( n = 34 ) Age 29 - 35 yr 4 11.8 36 – 42 8 23.5 43 – 49 4 11.8 50 – 56 13 38.2 57 – 63 4 11.8 64 – above 1 2.9Gender Male 12 35.3 Female 22 64.7Civil Status Single 3 8.8 Married 31 91.2Position Teacher I 2 5.9 Teacher II 3 8.8 Teacher III 2 5.9 Master Teacher 4 11.8 Head Teacher 6 17.6 Principal 17 50.0Educational Attainment BS/AB with Master’s Units 11 32.4 Master’s Degree holder 5 14.7 MS/MA with doctoral units 9 26.5 Doctor’s Degree holder 9 26.5
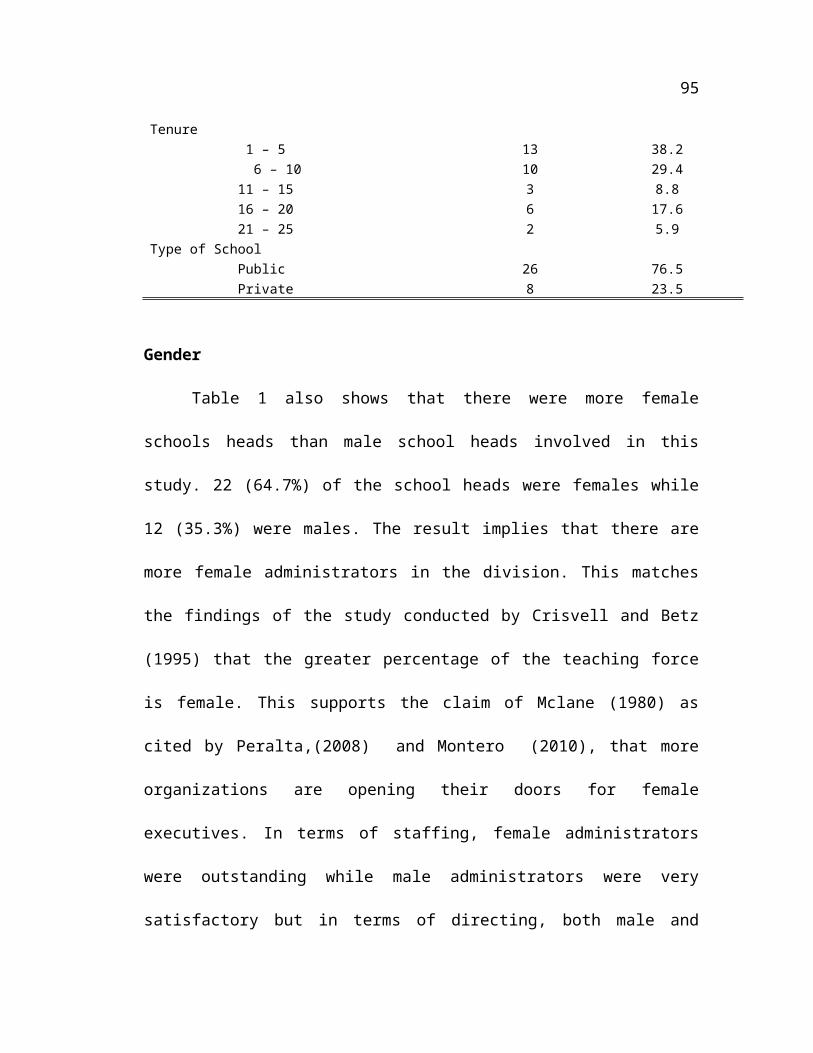
95
Tenure 1 – 5 13 38.2 6 – 10 10 29.4 11 – 15 3 8.8 16 – 20 6 17.6 21 – 25 2 5.9Type of School Public 26 76.5 Private 8 23.5
Gender
Table 1 also shows that there were more female
schools heads than male school heads involved in this
study. 22 (64.7%) of the school heads were females while
12 (35.3%) were males. The result implies that there are
more female administrators in the division. This matches
the findings of the study conducted by Crisvell and Betz
(1995) that the greater percentage of the teaching force
is female. This supports the claim of Mclane (1980) as
cited by Peralta,(2008) and Montero (2010), that more
organizations are opening their doors for female
executives. In terms of staffing, female administrators
were outstanding while male administrators were very
satisfactory but in terms of directing, both male and
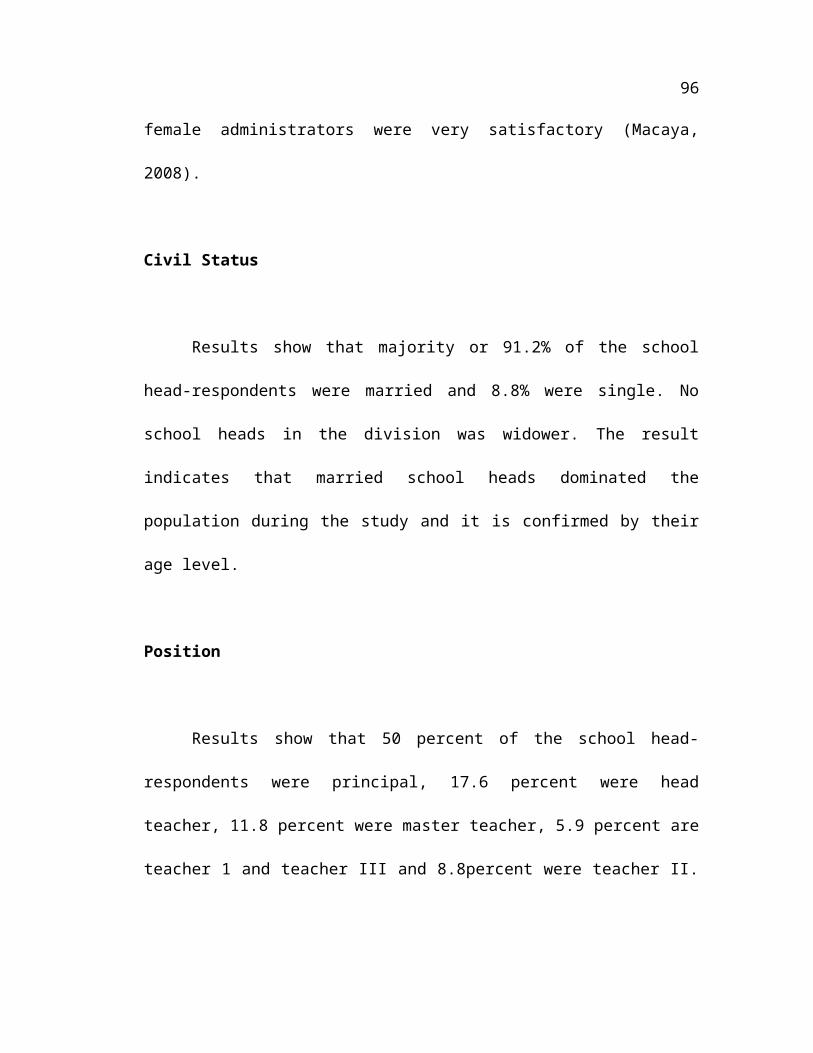
96
female administrators were very satisfactory (Macaya,
2008).
Civil Status
Results show that majority or 91.2% of the school
head-respondents were married and 8.8% were single. No
school heads in the division was widower. The result
indicates that married school heads dominated the
population during the study and it is confirmed by their
age level.
Position
Results show that 50 percent of the school head-
respondents were principal, 17.6 percent were head
teacher, 11.8 percent were master teacher, 5.9 percent are
teacher 1 and teacher III and 8.8percent were teacher II.
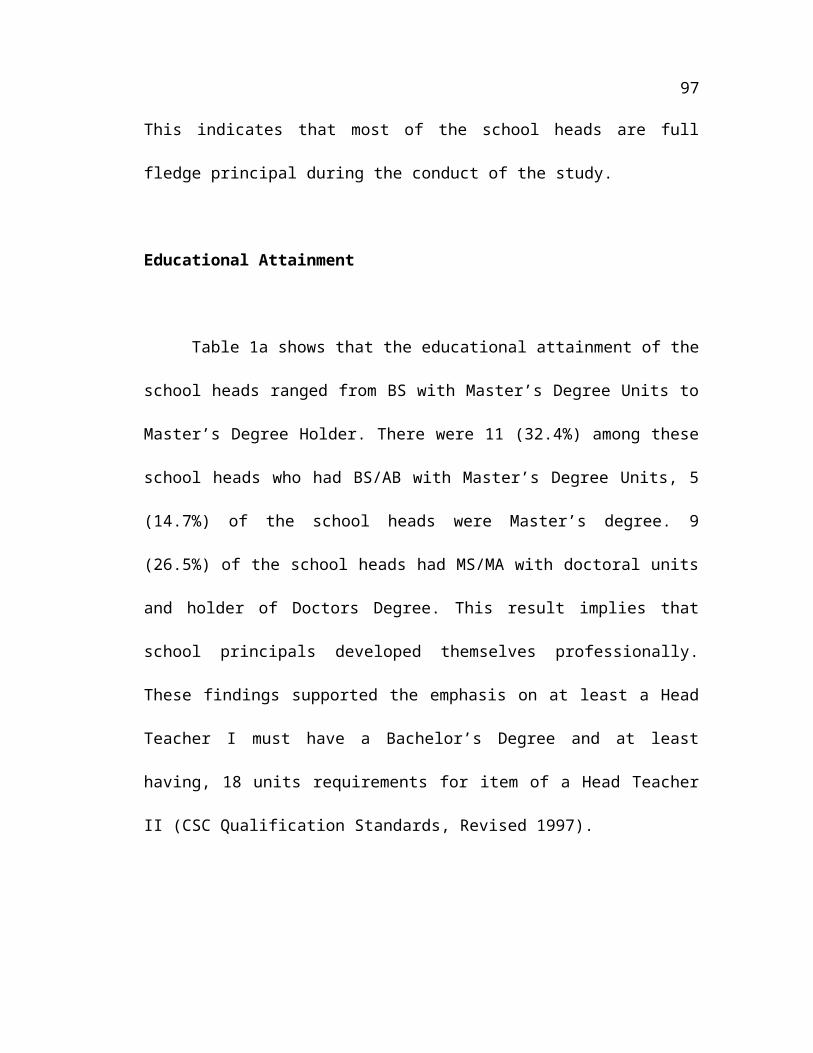
97
This indicates that most of the school heads are full
fledge principal during the conduct of the study.
Educational Attainment
Table 1a shows that the educational attainment of the
school heads ranged from BS with Master’s Degree Units to
Master’s Degree Holder. There were 11 (32.4%) among these
school heads who had BS/AB with Master’s Degree Units, 5
(14.7%) of the school heads were Master’s degree. 9
(26.5%) of the school heads had MS/MA with doctoral units
and holder of Doctors Degree. This result implies that
school principals developed themselves professionally.
These findings supported the emphasis on at least a Head
Teacher I must have a Bachelor’s Degree and at least
having, 18 units requirements for item of a Head Teacher
II (CSC Qualification Standards, Revised 1997).
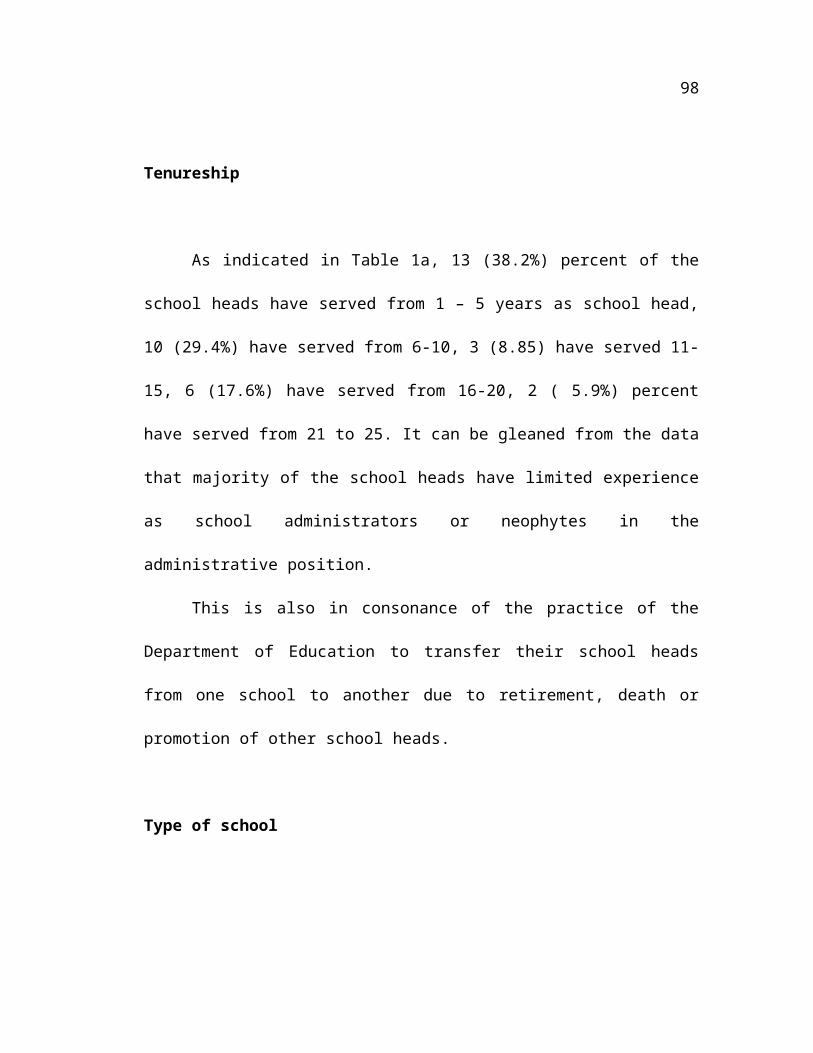
98
Tenureship
As indicated in Table 1a, 13 (38.2%) percent of the
school heads have served from 1 – 5 years as school head,
10 (29.4%) have served from 6-10, 3 (8.85) have served 11-
15, 6 (17.6%) have served from 16-20, 2 ( 5.9%) percent
have served from 21 to 25. It can be gleaned from the data
that majority of the school heads have limited experience
as school administrators or neophytes in the
administrative position.
This is also in consonance of the practice of the
Department of Education to transfer their school heads
from one school to another due to retirement, death or
promotion of other school heads.
Type of school
99
Result show that 26 (76.5%)of school heads were in
the public and 8 ( 23.5%) were in the private, this
implies that in Kidapawan City , public high school were
dominant and private high schools were limited. In
Kidapawan City Division there were only 8 private schools
having high school.
Socio-demographic Characteristics of teacher respondents
As shown in Table 1b, the socio-demographic
characteristics of the teachers include the age, gender,
civil status, position and educational attainment,
tenureship in government service and type of school.
Age
100
Out of the 170 teacher- respondents, 73 (42.9%) were
in the age bracket 29- 35 years, 46 (27.1%) belonged to
less than 29 years of age, 27 (15.9%) belonged to age
bracket 36-42 years, 12 (7.1%) were in the age bracket of
43-49 years, 11 or 6.5(%) belonged to the age bracket 50-
56 years, and only 1(0.6%) were in the age bracket 57-63
years of age.
This implies that majority of the teacher
respondents were heading towards late 50’s on in their
golden years. When teachers have reached the peak of their
career they would consider themselve as fulfilled. Pauya
as cited by Isla (2004) further disclosed similar finding
that age is one of the factors labeled as high in
initiating structure and consideration.
Gender
101
Table 1b also shows that there were more female
teacher respondents than male teacher respondents involved
in this study. 130 (76.5%) of the teacher respondents were
female while 40 (23.5%) of the teacher-respondents were
male. In Kidapawan City Division, there were more female
teachers. This matches the findings of the study conducted
by Crisvell and Betz (1995) that the greater percentage of
the teaching force was female. This supports the claim of
Mclane (1980) as cited by Peralta, (2008) and Montero
(2010) that more organizations are opening their doors for
female executives.
Civil Status
As shown in Table 1, 119 (70%) were married 49
(28.8%) of the respondents were single, and 2 (1.2%) were
widower. The result indicates that more of the teacher
respondents are married.
102
Position
Most of the teacher respondents were teacher I since
there were 129 (75.9%) teacher I, 27 (5.9%) were Teacher
II, 13 (7.6%) of the teacher respondents held the position
of Teacher III and only 1 (0.6%) were Master teacher.
Promotion is not easy in the public school since it
requires experience and educational attainment as well.
Educational Attainment
Table 1b shows that the highest educational
attainment of the teachers ranged from BS with Master’s
Degree Units to Doctoral Degree Holder. There are 75
(44.1%) of the teacher-respondents who were BS/AB, 69
(40.6%) graduated BS/AB with Master’s Degree Units, 17
(10%) of the teacher- respondents finished MS/MA with
doctoral units, 6 (3.5%) of the teacher- respondents were
103
Master’s degree holders and 3 (1.8%) teacher- respondents
were of Doctoral Degree holders.
Teacher needs to educate themselves to compete
globally. Teachers in today’s generation must be updated
always through higher or post graduate education.
Tenureship
As indicated in Table 1b, 91 (53.5%) of the teacher-
respondents have served from 1 – 5 years in service.
51( 30%) have served from 6-10 years, 11 (6.5%) have
served 11-15 years, 9 (5.3%) have served from 16-20
years, 8 (4.7%) have served from 21 years and above. It
can be gleaned that teacher respondents are neophytes in
teaching. After gaining or earning experiences in private
schools they had been accepted in the public schools.
Type of school
104
As shown in Table 1b, 130 (76.5%) of teacher-
respondents came from the public schools while 40 (23.5%)
came from the private schools.This implies that in
Kidapawan City, high schools and only 8 private high
schools.
School Climate
The school climate of the private and public high
schools in Kidapawan City Division consists of seven
domains such as teacher-student relation, security and
maintenance, student academic orientation, guidance,
student peer relationship, instructional managements and
student activities.
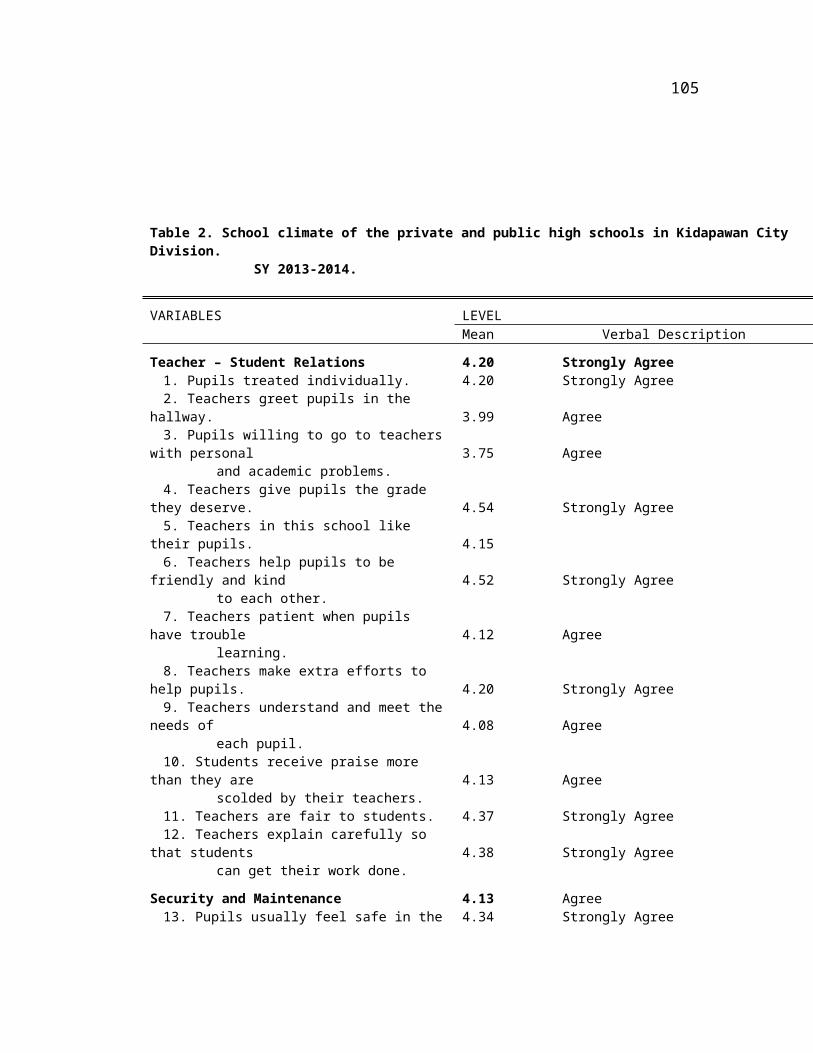
105
Table 2. School climate of the private and public high schools in Kidapawan City Division. SY 2013-2014.
VARIABLES LEVEL Mean Verbal Description
Teacher – Student Relations 4.20 Strongly Agree1. Pupils treated individually. 4.20 Strongly Agree2. Teachers greet pupils in the
hallway. 3.99 Agree3. Pupils willing to go to teachers
with personal 3.75 Agreeand academic problems.
4. Teachers give pupils the grade they deserve. 4.54 Strongly Agree5. Teachers in this school like
their pupils. 4.156. Teachers help pupils to be
friendly and kind 4.52 Strongly Agreeto each other.
7. Teachers patient when pupils have trouble 4.12 Agree
learning.8. Teachers make extra efforts to
help pupils. 4.20 Strongly Agree9. Teachers understand and meet the
needs of 4.08 Agreeeach pupil.
10. Students receive praise more than they are 4.13 Agree
scolded by their teachers.11. Teachers are fair to students. 4.37 Strongly Agree12. Teachers explain carefully so
that students 4.38 Strongly Agreecan get their work done.
Security and Maintenance 4.13 Agree13. Pupils usually feel safe in the 4.34 Strongly Agree
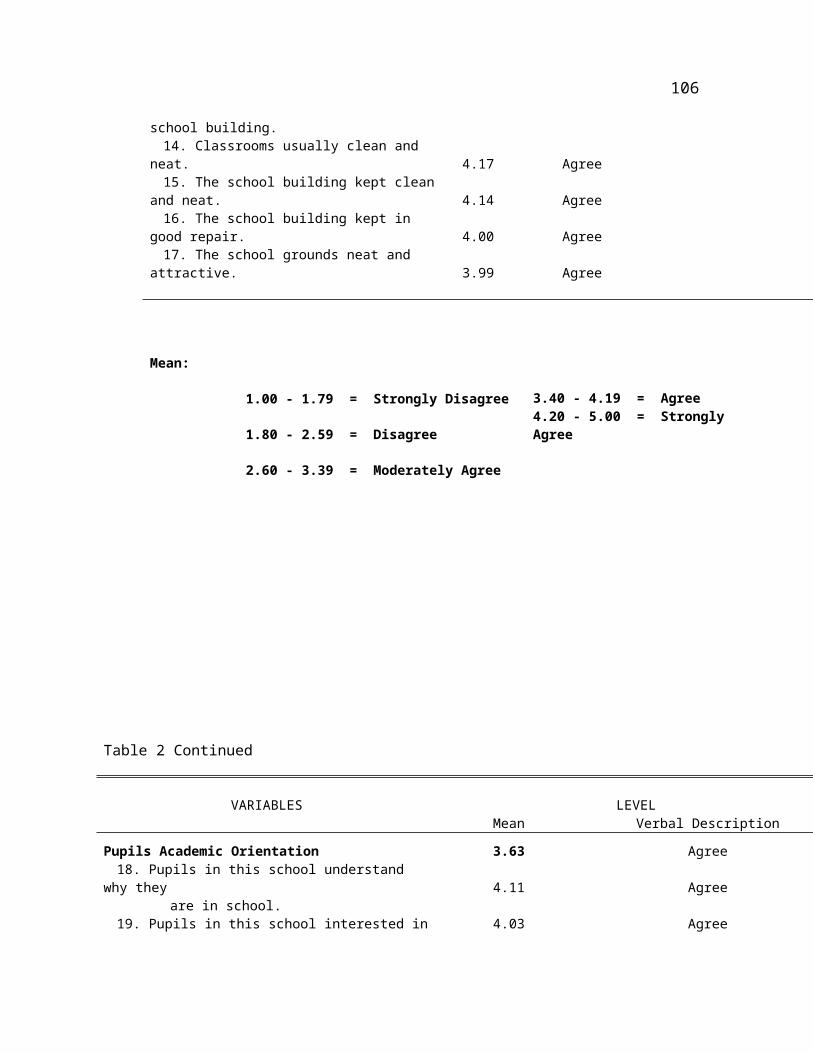
106
school building.14. Classrooms usually clean and
neat. 4.17 Agree15. The school building kept clean
and neat. 4.14 Agree16. The school building kept in
good repair. 4.00 Agree17. The school grounds neat and
attractive. 3.99 Agree
Mean:
1.00 - 1.79 = Strongly Disagree 3.40 - 4.19 = Agree4.20 - 5.00 = Strongly Agree 1.80 - 2.59 = Disagree
2.60 - 3.39 = Moderately Agree
Table 2 Continued
VARIABLES LEVEL Mean Verbal Description
Pupils Academic Orientation 3.63 Agree18. Pupils in this school understand
why they 4.11 Agreeare in school.
19. Pupils in this school interested in 4.03 Agree
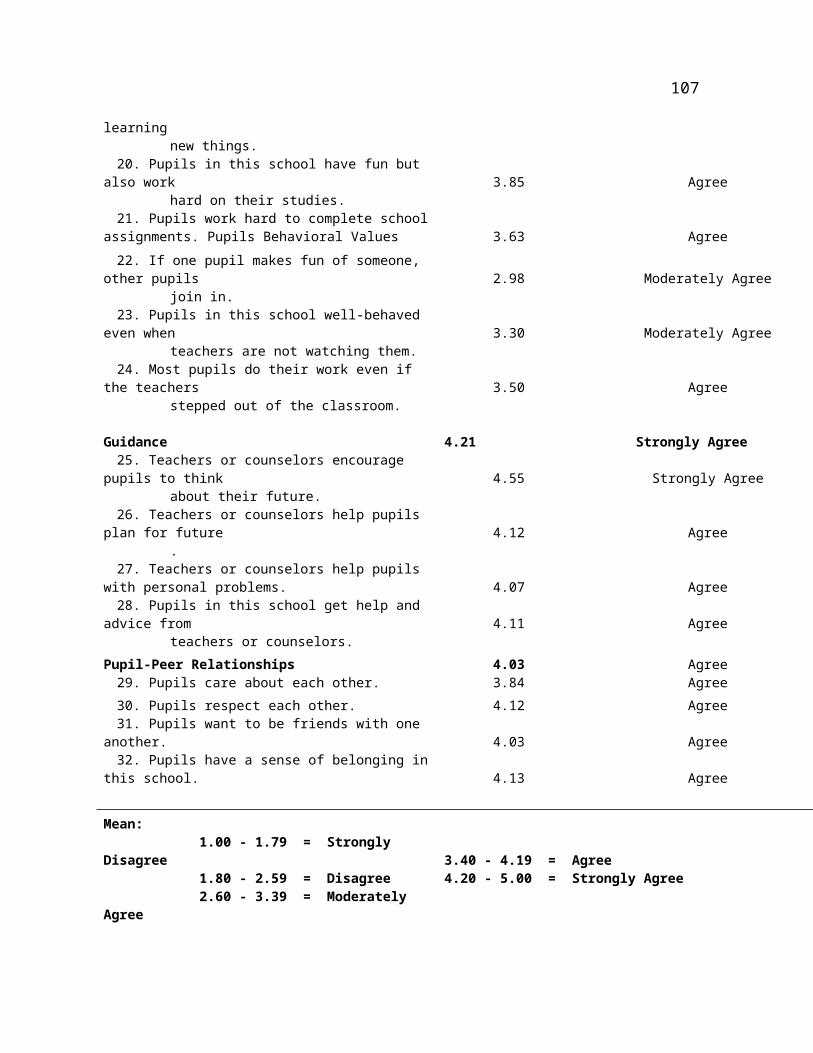
107
learningnew things.
20. Pupils in this school have fun but also work 3.85 Agree
hard on their studies.21. Pupils work hard to complete school
assignments. Pupils Behavioral Values 3.63 Agree22. If one pupil makes fun of someone,
other pupils 2.98 Moderately Agreejoin in.
23. Pupils in this school well-behaved even when 3.30 Moderately Agree
teachers are not watching them. 24. Most pupils do their work even if
the teachers 3.50 Agreestepped out of the classroom.
Guidance 4.21 Strongly Agree25. Teachers or counselors encourage
pupils to think 4.55 Strongly Agreeabout their future.
26. Teachers or counselors help pupils plan for future 4.12 Agree
.27. Teachers or counselors help pupils
with personal problems. 4.07 Agree28. Pupils in this school get help and
advice from 4.11 Agreeteachers or counselors.
Pupil-Peer Relationships 4.03 Agree29. Pupils care about each other. 3.84 Agree30. Pupils respect each other. 4.12 Agree31. Pupils want to be friends with one
another. 4.03 Agree32. Pupils have a sense of belonging in
this school. 4.13 Agree
Mean: 1.00 - 1.79 = Strongly Disagree 3.40 - 4.19 = Agree 1.80 - 2.59 = Disagree 4.20 - 5.00 = Strongly Agree 2.60 - 3.39 = Moderately Agree
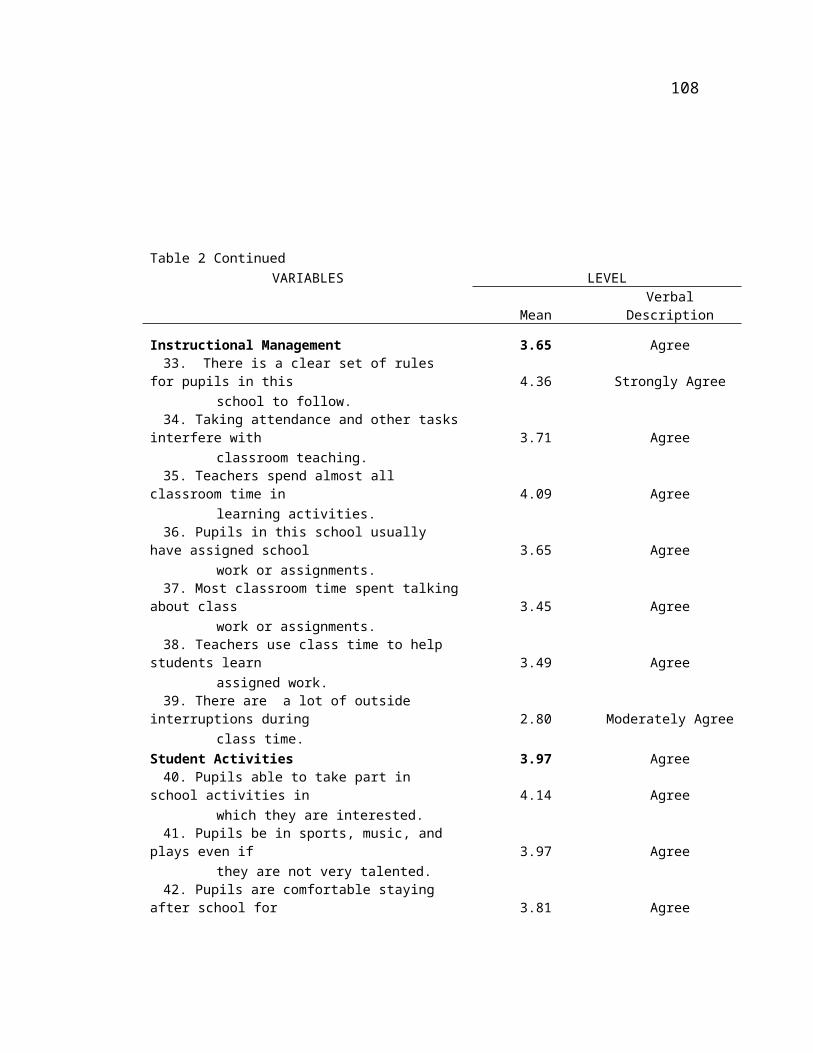
108
Table 2 ContinuedVARIABLES LEVEL
MeanVerbal
Description
Instructional Management 3.65 Agree33. There is a clear set of rules
for pupils in this 4.36 Strongly Agreeschool to follow.
34. Taking attendance and other tasksinterfere with 3.71 Agree
classroom teaching. 35. Teachers spend almost all
classroom time in 4.09 Agreelearning activities.
36. Pupils in this school usually have assigned school 3.65 Agree
work or assignments.37. Most classroom time spent talking
about class 3.45 Agreework or assignments.
38. Teachers use class time to help students learn 3.49 Agree
assigned work. 39. There are a lot of outside
interruptions during 2.80 Moderately Agreeclass time.
Student Activities 3.97 Agree40. Pupils able to take part in
school activities in 4.14 Agreewhich they are interested.
41. Pupils be in sports, music, and plays even if 3.97 Agree
they are not very talented.42. Pupils are comfortable staying
after school for 3.81 Agree
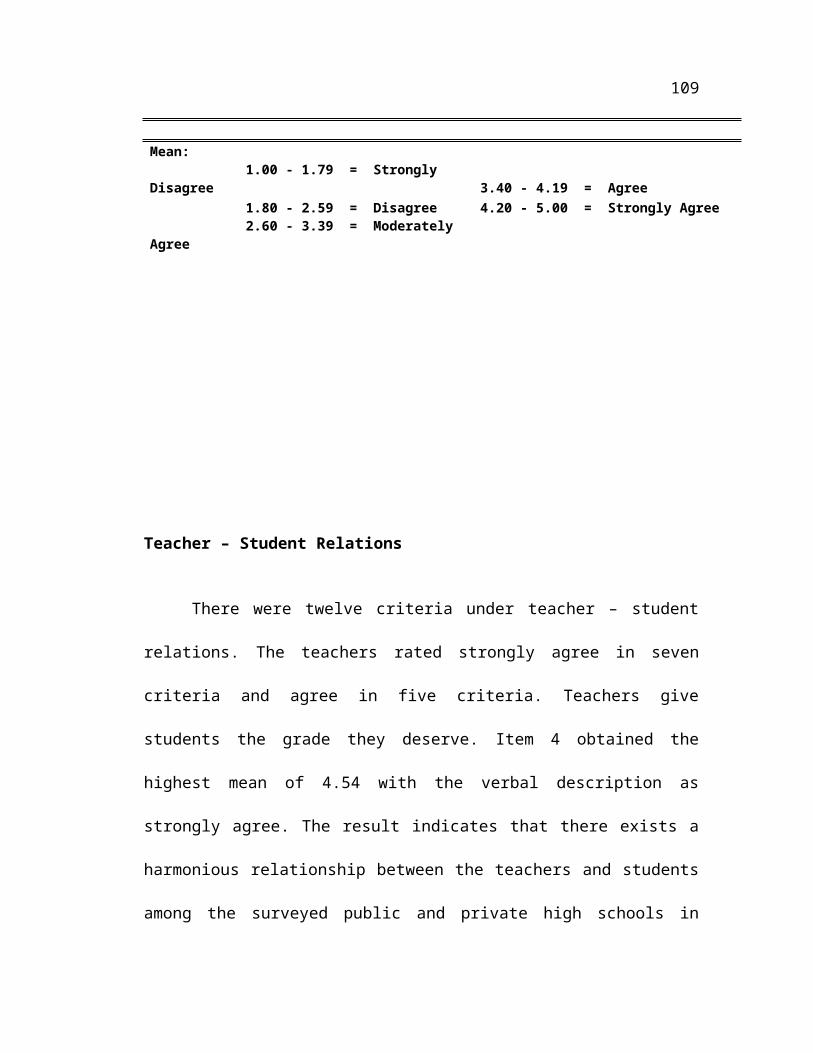
109
Mean: 1.00 - 1.79 = Strongly Disagree 3.40 - 4.19 = Agree 1.80 - 2.59 = Disagree 4.20 - 5.00 = Strongly Agree 2.60 - 3.39 = Moderately Agree
Teacher – Student Relations
There were twelve criteria under teacher – student
relations. The teachers rated strongly agree in seven
criteria and agree in five criteria. Teachers give
students the grade they deserve. Item 4 obtained the
highest mean of 4.54 with the verbal description as
strongly agree. The result indicates that there exists a
harmonious relationship between the teachers and students
among the surveyed public and private high schools in
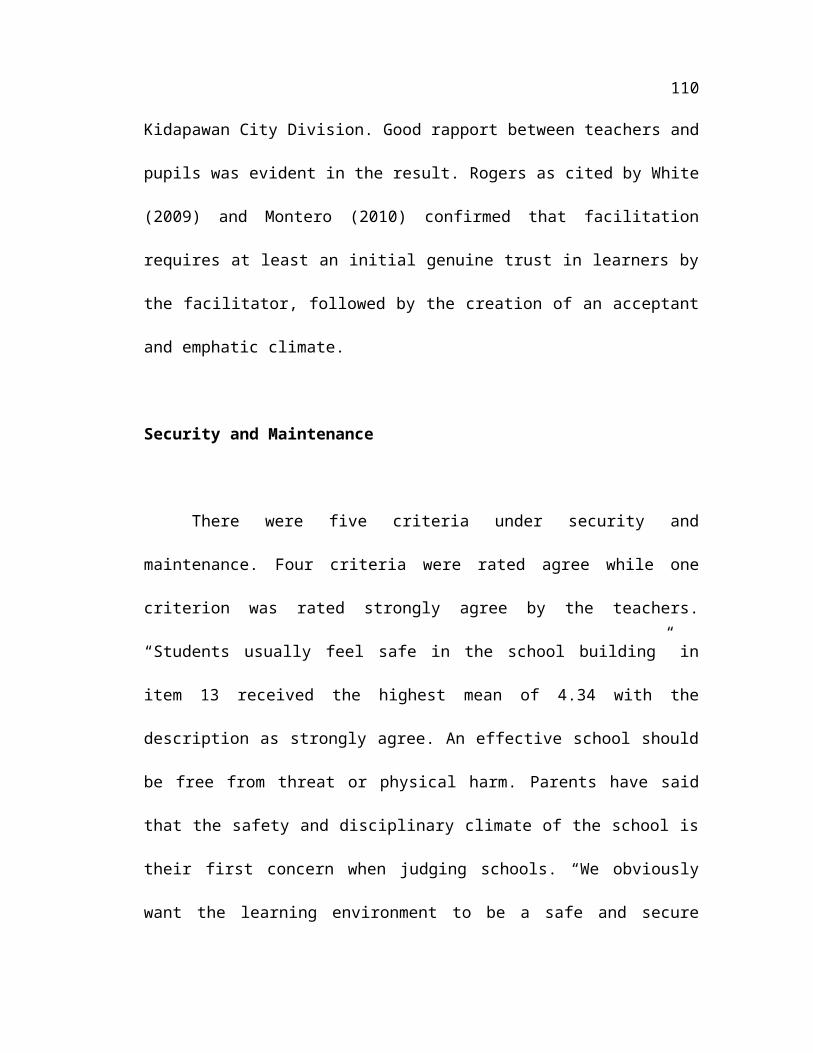
110
Kidapawan City Division. Good rapport between teachers and
pupils was evident in the result. Rogers as cited by White
(2009) and Montero (2010) confirmed that facilitation
requires at least an initial genuine trust in learners by
the facilitator, followed by the creation of an acceptant
and emphatic climate.
Security and Maintenance
There were five criteria under security and
maintenance. Four criteria were rated agree while one
criterion was rated strongly agree by the teachers.
“Students usually feel safe in the school building” in
item 13 received the highest mean of 4.34 with the
description as strongly agree. An effective school should
be free from threat or physical harm. Parents have said
that the safety and disciplinary climate of the school is
their first concern when judging schools. “We obviously
want the learning environment to be a safe and secure
111
place for its own sake”. “We also want schools to be safe
and secure because the presence or absence of a safe
learning environment enhances or impedes learning”
(Lezotte, 2009) as mentioned by Montero (2010).
Pupils Academic Orientation
Seven criteria are under pupils’ academic
orientation. Five of these seven criteria were rated agree
by the teachers. Students in school understand why they
are in school obtained the highest mean of 4.11 with a
verbal description of agree. The result implied that the
pupils understand well the reasons why they are in
school. Making pupils aware of why they are in school is
part and parcel of teachers’ function to conduct pupils’
orientation. Reynolds (2006) claimed that orientation
seems to have shaped the way students were negotiating
college. After starting classes, they seemed to be doing
things for themselves rather than asking staff, taking the
112
initiative to keep on top of their class progress, and
using services more than new students had in the past. Of
huge importance to students is what may be called the
“personal touch” (Montero, 2010).
Guidance
There were four criteria under guidance. Out of these
four, three criteria were rated agree by the teachers
while one criterion was rated strongly agree. “Teachers or
counselors encourage pupils to think about their future
obtained the highest mean of 4.55 with the description of
strongly agree. The result implied that teachers or
guidance counselors provide proper guidance to their
pupils especially on their future”. Montero (2010) had
said that the school must nourish and encourage the child
to realise his/her future potential and for that reason,
it is necessary for guidance to begin early.

113
Student –Peer Relationships
There were four criteria under pupil – peer
relationships. The teachers rated agree in all criteria.
“Pupils have a sense of belonging in this schools obtained
the highest mean of 4.13 with the description of agree.
The result implies that the pupils feel at ease and at
home when they are in their school. Edgerson (2006) as
mentioned by Montero (2010), claimed that when positive
climates and cultures of family exist on school campuses
across this great land of ours, synergy occurs,
productivity increases, and students excel.
Instructional Management
There were seven criteria under instructional
management. The teachers rated agree in five criteria and
one criterion each for strongly agree, and moderately
agree. “There is clear set of rules for pupils in this
114
school to follow” obtained the highest mean of 4.36 with
the description of strongly agree. The result implies that
the schools have clear school policies and guidelines for
the pupils and teachers to follow. These guidelines make
the pupils be guided of the things to be done in the
school. School rules are important to all of us because
they tell us how to act, give us directions, set standards
for everyone, and provide a safe climate. Every rule has a
reason for being and should be followed consistently
(http://lombard.baltimorecityschools.org/Info/School_Rules
.asp).
Besides the school rules, there are also rules to be
followed by both teachers and pupils in the class. These
are called classroom rules. Buchaman (2006) as mentioned
by Montero (2010), emphasized that classroom rules are
very important to have a well-managed and safe learning
environment. At the beginning of the school year, students
can help come up with these classroom rules. Or, simply
the students brainstorm exactly what these classroom rules
115
mean. It is important to involve the students in classroom
rule-making. They are more likely to follow rules that
they themselves have created.
Student Activities
There were three criteria under student activities.
The teachers rated these three criteria as agree.
“Students are able to take part in school activities in
which they are interested” obtained the highest mean of
4.14 with the description of agree. The result implies
that the school provided opportunity for pupils to develop
their talents and skills through various school activities
as perceived by the teachers. This further implies that
pupils were given opportunity by the teachers to choose
the school activities they like to join in.
Leadership Behavior
116
Leadership behavior consists of human relations,
trust/decision making, instructional leadership, control
and conflict.
Human Relations Domain
There were thirteen criteria indicators under
behaviors in the human relations domain of school heads.
The teachers rated them strongly agree in six criteria,
agree in five criteria, moderately agree in two criteria
and 1 criterion for strongly disagree. “The school heads
involves the teacher in decisions”, in item 4, obtained
the highest mean of 4.29 with the description of strongly
agree. The result implies that there is a healthy human
relationship that occurs between the school heads and
their teachers because character is everything ( Maxwell,
2007).
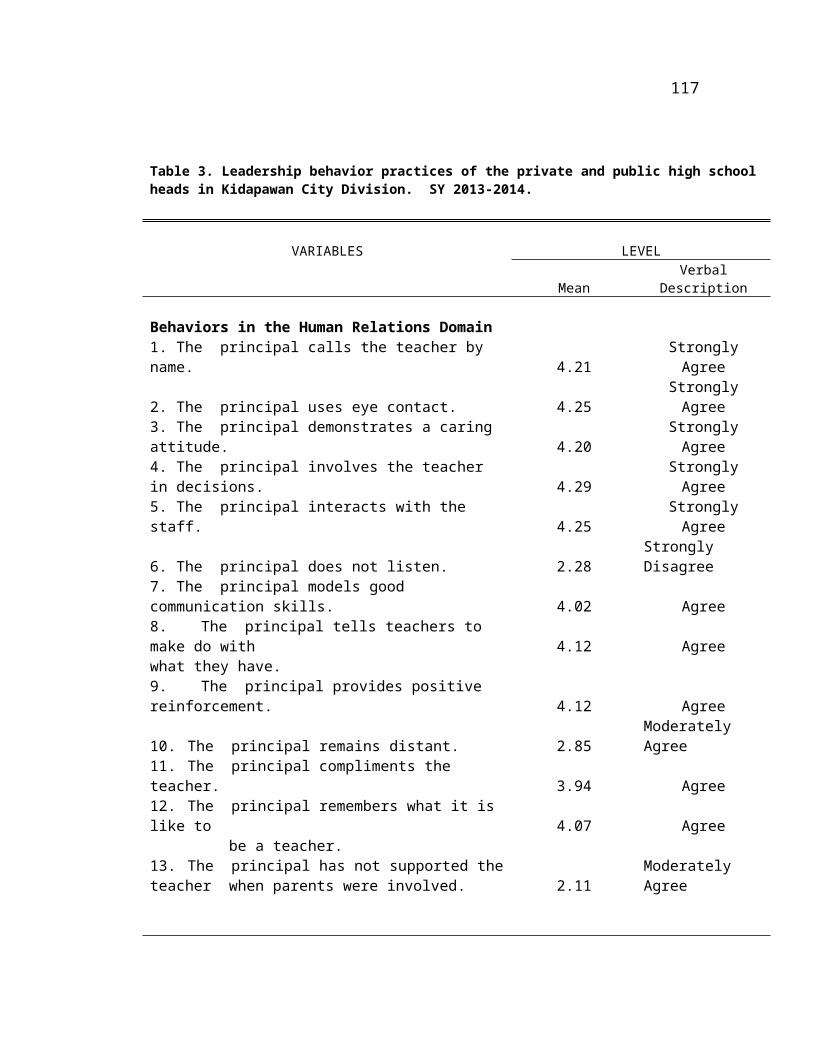
117
Table 3. Leadership behavior practices of the private and public high schoolheads in Kidapawan City Division. SY 2013-2014.
VARIABLES LEVEL
MeanVerbal
Description
Behaviors in the Human Relations Domain1. The principal calls the teacher by name. 4.21
StronglyAgree
2. The principal uses eye contact. 4.25StronglyAgree
3. The principal demonstrates a caring attitude. 4.20
StronglyAgree
4. The principal involves the teacher in decisions. 4.29
StronglyAgree
5. The principal interacts with the staff. 4.25
StronglyAgree
6. The principal does not listen. 2.28Strongly Disagree
7. The principal models good communication skills. 4.02 Agree8. The principal tells teachers to make do with 4.12 Agreewhat they have. 9. The principal provides positive reinforcement. 4.12 Agree
10. The principal remains distant. 2.85Moderately Agree
11. The principal compliments the teacher. 3.94 Agree12. The principal remembers what it is like to 4.07 Agree be a teacher.13. The principal has not supported theteacher when parents were involved. 2.11
Moderately Agree
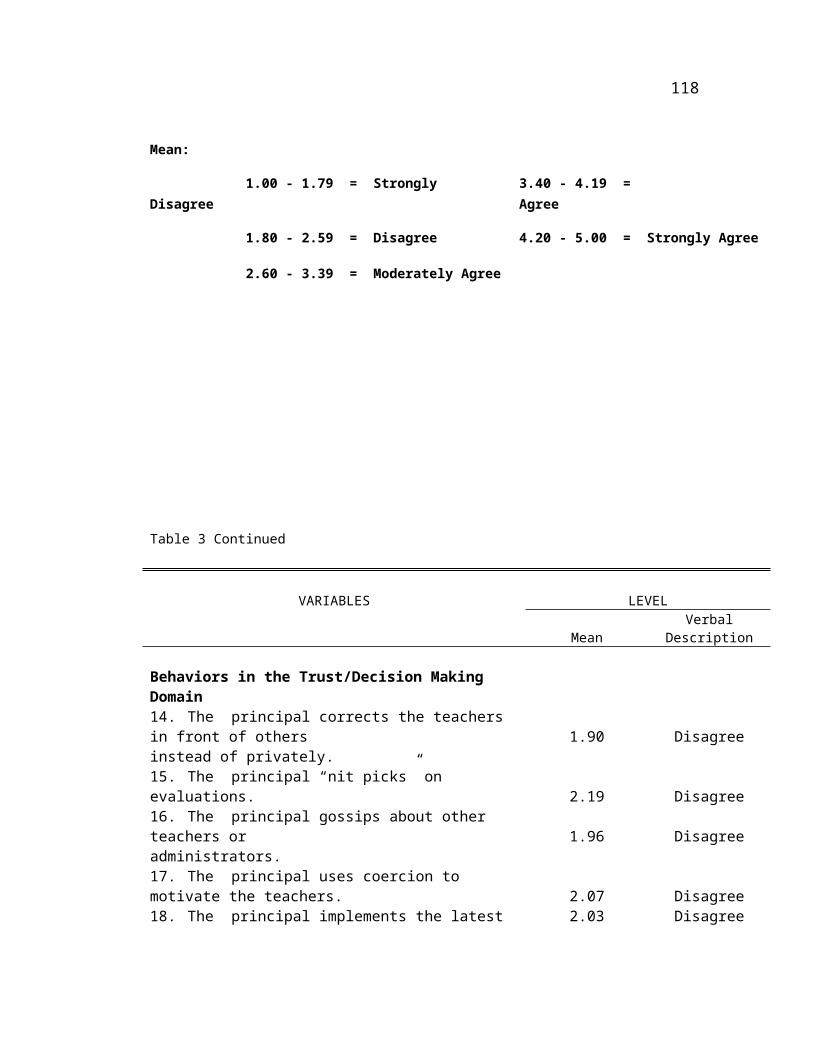
118
Mean:
1.00 - 1.79 = Strongly Disagree
3.40 - 4.19 = Agree
1.80 - 2.59 = Disagree 4.20 - 5.00 = Strongly Agree
2.60 - 3.39 = Moderately Agree
Table 3 Continued
VARIABLES LEVEL
MeanVerbal
Description
Behaviors in the Trust/Decision Making Domain14. The principal corrects the teachers in front of others 1.90 Disagreeinstead of privately. 15. The principal “nit picks” on evaluations. 2.19 Disagree16. The principal gossips about other teachers or 1.96 Disagreeadministrators. 17. The principal uses coercion to motivate the teachers. 2.07 Disagree18. The principal implements the latest 2.03 Disagree
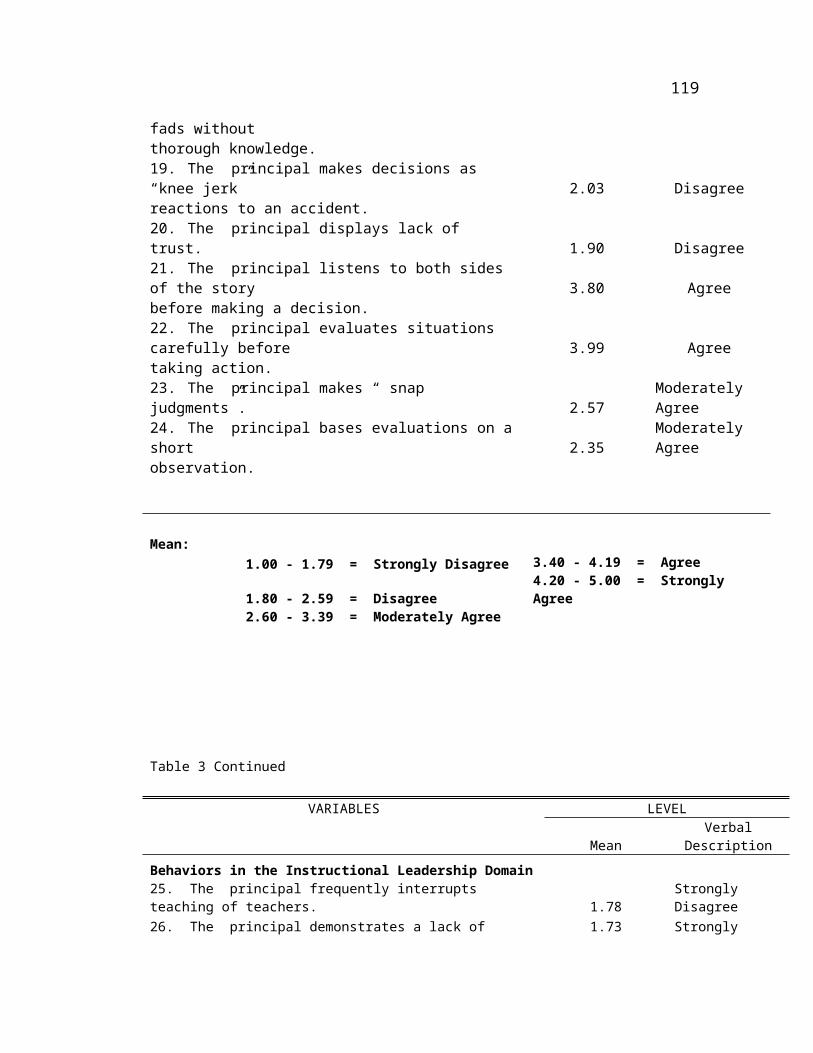
119
fads withoutthorough knowledge. 19. The principal makes decisions as “knee jerk” 2.03 Disagreereactions to an accident. 20. The principal displays lack of trust. 1.90 Disagree21. The principal listens to both sides of the story 3.80 Agreebefore making a decision. 22. The principal evaluates situations carefully before 3.99 Agreetaking action. 23. The principal makes “ snap judgments”. 2.57
Moderately Agree
24. The principal bases evaluations on ashort 2.35
Moderately Agree
observation.
Mean: 1.00 - 1.79 = Strongly Disagree 3.40 - 4.19 = Agree
4.20 - 5.00 = Strongly Agree 1.80 - 2.59 = Disagree
2.60 - 3.39 = Moderately Agree
Table 3 Continued
VARIABLES LEVEL
MeanVerbal
DescriptionBehaviors in the Instructional Leadership Domain25. The principal frequently interrupts teaching of teachers. 1.78
Strongly Disagree
26. The principal demonstrates a lack of 1.73 Strongly
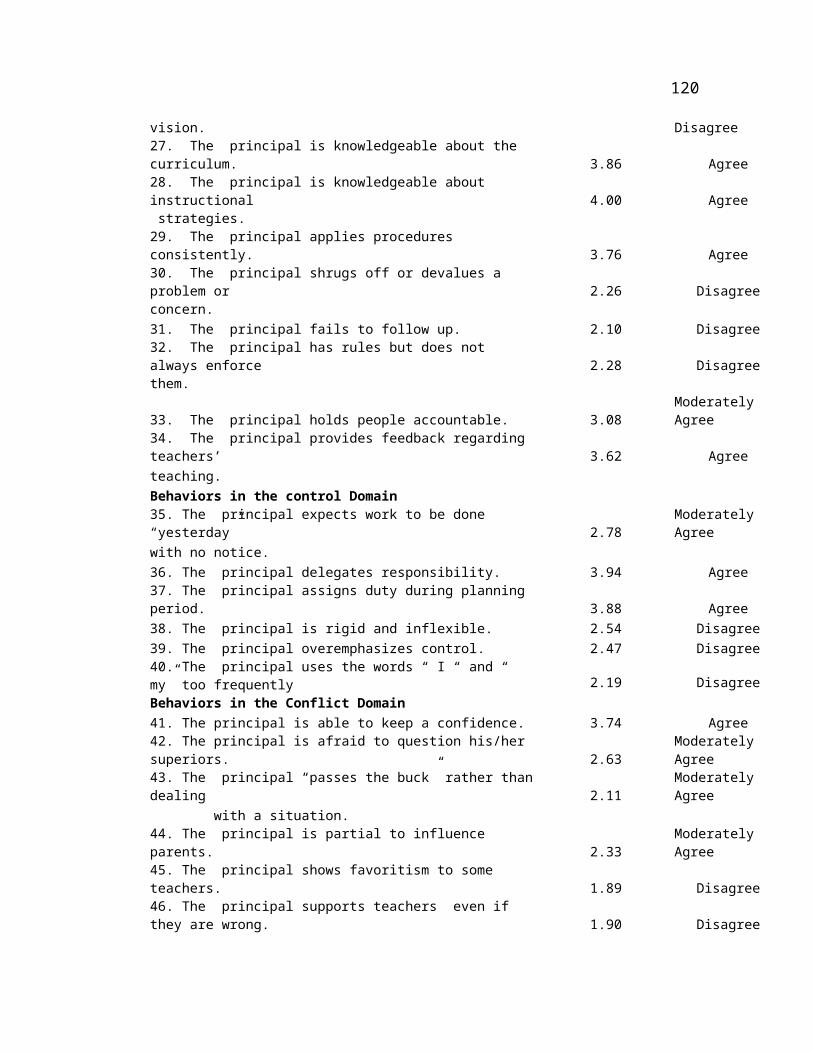
120
vision. Disagree27. The principal is knowledgeable about the curriculum. 3.86 Agree28. The principal is knowledgeable about instructional 4.00 Agree strategies. 29. The principal applies procedures consistently. 3.76 Agree30. The principal shrugs off or devalues a problem or 2.26 Disagreeconcern. 31. The principal fails to follow up. 2.10 Disagree32. The principal has rules but does not always enforce 2.28 Disagreethem.
33. The principal holds people accountable. 3.08Moderately Agree
34. The principal provides feedback regarding teachers’ 3.62 Agreeteaching. Behaviors in the control Domain35. The principal expects work to be done “yesterday” 2.78
Moderately Agree
with no notice. 36. The principal delegates responsibility. 3.94 Agree37. The principal assigns duty during planning period. 3.88 Agree38. The principal is rigid and inflexible. 2.54 Disagree39. The principal overemphasizes control. 2.47 Disagree40. The principal uses the words “ I “ and “ my” too frequently 2.19 DisagreeBehaviors in the Conflict Domain41. The principal is able to keep a confidence. 3.74 Agree42. The principal is afraid to question his/her superiors. 2.63
Moderately Agree
43. The principal “passes the buck” rather thandealing 2.11
Moderately Agree
with a situation. 44. The principal is partial to influence parents. 2.33
Moderately Agree
45. The principal shows favoritism to some teachers. 1.89 Disagree46. The principal supports teachers even if they are wrong. 1.90 Disagree
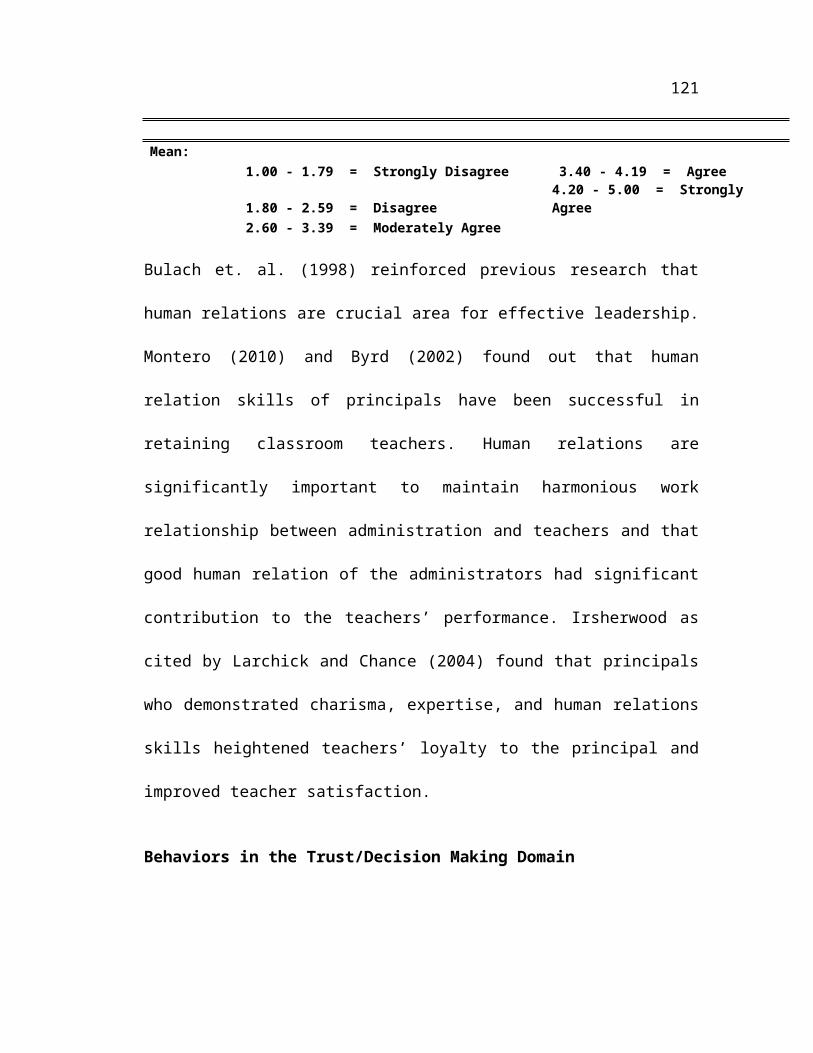
121
Mean: 1.00 - 1.79 = Strongly Disagree 3.40 - 4.19 = Agree
1.80 - 2.59 = Disagree4.20 - 5.00 = Strongly Agree
2.60 - 3.39 = Moderately Agree
Bulach et. al. (1998) reinforced previous research that
human relations are crucial area for effective leadership.
Montero (2010) and Byrd (2002) found out that human
relation skills of principals have been successful in
retaining classroom teachers. Human relations are
significantly important to maintain harmonious work
relationship between administration and teachers and that
good human relation of the administrators had significant
contribution to the teachers’ performance. Irsherwood as
cited by Larchick and Chance (2004) found that principals
who demonstrated charisma, expertise, and human relations
skills heightened teachers’ loyalty to the principal and
improved teacher satisfaction.
Behaviors in the Trust/Decision Making Domain
122
For behaviors in the Trust/Decision Making
domain, the teachers rated them disagree in nine of the
criteria while two of the criteria were rated agree and
moderately agree. “The school heads evaluate situations
carefully before taking action in item 22 obtained the
highest mean of 3.99 with the verbal description as agree.
This finding implies that the school heads weigh
things properly before taking actions. Cherniss (1998)
emphasized that emotionally intelligent educational
leaders possess people skills. According to Thomas and
Vornberg (1990), as mentioned by Montero (2010), Effective
school heads demonstrate the ability to recognize and deal
with the needs, concerns, and problems of others. The
interpersonal competence of the school heads includes the
skill to be perceptive, to evaluate situations, to be
emphatic and to resolve conflicts. These skills were
important for the school head to care for the personal
welfare and provide emotional support to teachers.
123
Behaviors in the Instructional Leadership Domain
There were ten criteria under behavior in the
Instructional Leadership Domain. The teachers rated agree
in four criteria, disagree in three criteria and two in
each strongly disagree and moderately agree criteria. “The
school head is knowledgeable about the curriculum” in item
27, obtained the highest mean of 3.86 with the verbal
description as agree.
The result indicates that the school heads
demonstrate competence in curriculum which school heads
should possess. Instructional leaders should exhibit a
clear sense of direction for their schools and prioritize
and focus attention on the things that really matter in
terms of the work of students (http:
www.e-leadlead.org/resources/resources.asp?ResourceID=14).
124
Behaviors in the control Domain
Among the six criteria of behaviors in the control
domain, their teachers rated their school heads disagree
in four criteria, two criteria for agree and one in
moderately agree in one criterion. “The school heads
assign duty during planning period”, in item 37, obtained
the highest mean of 3.94 with the verbal description of
agree.
The result implies that the school heads involve
their teachers in school activities they do through
assigning their teachers to different committees. This is
a very healthy sign of good leadership as Dublin (1973)
contends as cited by Peralta as mentioned by Montero
(2010), Teachers need the leadership of the school heads
and the principal in turn needs the cooperation of the
teachers in order to attain the desired goals of the
school. School heads should encourage involvement of the
125
teachers in any schools’ undertakings. As teachers feel
better about themselves and what their collective missions
are as a result of significant interactions with their
school heads, they become more effective in the classroom
(Edgerson, et al. 2006) and Montero ( 2010).
Behaviors in the Conflict Domain
There were six criteria in behavior in the conflict
domain and were rated moderately agree by the teachers in
three criteria, and disagree in two criteria and one in a
criterion. Item 41, “the school head is able to keep a
confidence” obtained the highest mean of 4.12 with the
description as frequent.
The result implies that the school heads are able to
manage, to keep important and sensitive issues within
themselves.
Performance of the Teachers
126
Table 4 shows the public and private school heads-
teacher’s performance. Results show that 82.4% of the
teachers had very satisfactory performance while 17.6 5 %
of them had outstanding performance. It can be gleaned
from the result that majority of the teachers in Kidapawan
City Division had very satisfactory performance which was
also expected of them.
Hamzah (2008) pointed out that to be an effective
teacher is a continuous process that stretches from the
teachers’ pre-service experiences in the undergraduate
years to the end of their professional career path.
Teachers will need ongoing opportunities to develop their
knowledge, understanding, skills and abilities to keep
pace with the continuously increasing and changing
national education agenda. To be an excellent teacher, one
not only has to have a full command of the subject but
also full knowledge of the course structure and
examination system.
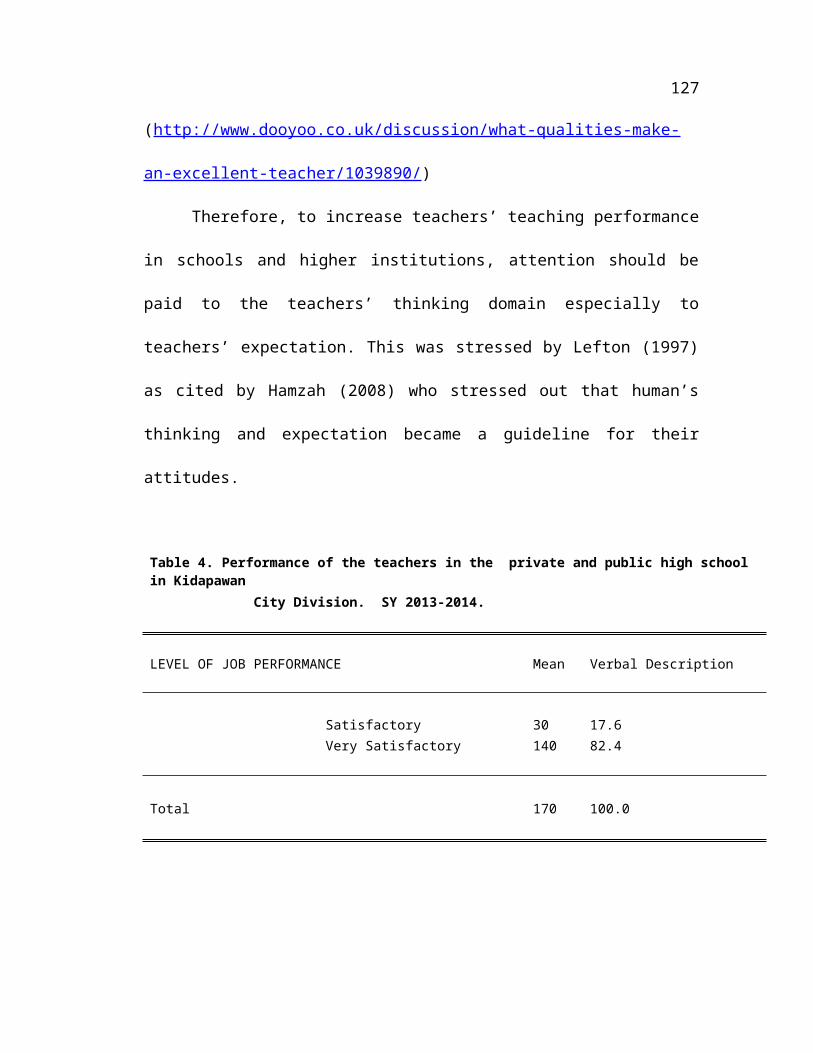
127
(http://www.dooyoo.co.uk/discussion/what-qualities-make-
an-excellent-teacher/1039890/)
Therefore, to increase teachers’ teaching performance
in schools and higher institutions, attention should be
paid to the teachers’ thinking domain especially to
teachers’ expectation. This was stressed by Lefton (1997)
as cited by Hamzah (2008) who stressed out that human’s
thinking and expectation became a guideline for their
attitudes.
Table 4. Performance of the teachers in the private and public high school in Kidapawan City Division. SY 2013-2014.
LEVEL OF JOB PERFORMANCE Mean Verbal Description
Satisfactory 30 17.6 Very Satisfactory 140 82.4
Total 170 100.0
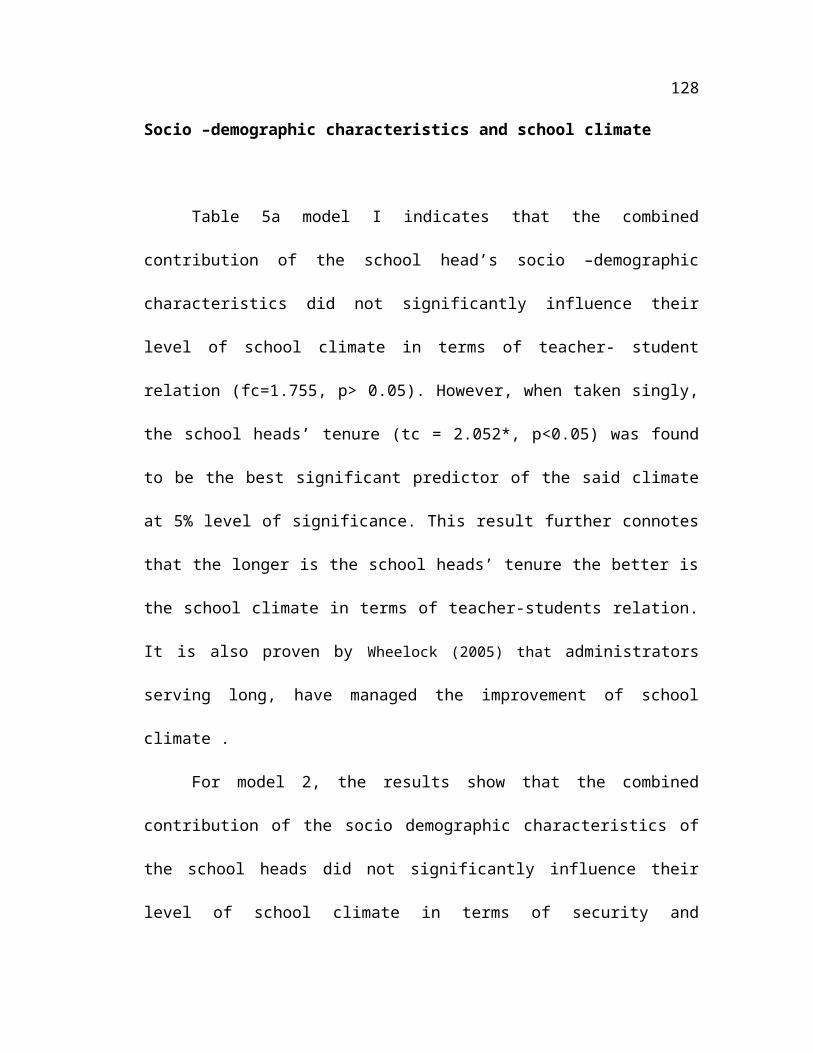
128
Socio –demographic characteristics and school climate
Table 5a model I indicates that the combined
contribution of the school head’s socio –demographic
characteristics did not significantly influence their
level of school climate in terms of teacher- student
relation (fc=1.755, p> 0.05). However, when taken singly,
the school heads’ tenure (tc = 2.052*, p<0.05) was found
to be the best significant predictor of the said climate
at 5% level of significance. This result further connotes
that the longer is the school heads’ tenure the better is
the school climate in terms of teacher-students relation.
It is also proven by Wheelock (2005) that administrators
serving long, have managed the improvement of school
climate .
For model 2, the results show that the combined
contribution of the socio demographic characteristics of
the school heads did not significantly influence their
level of school climate in terms of security and
129
maintenance (Fc = 1.169, p70.05). Taken singly, none of
these independent variables is a significant predictor of
the school climate.
With the resulting model 3, the combined contribution
of the school heads’ socio- demographic factors did not
significantly influence their school climate in terms of
students academic orientation (Fc = 0.664, p>0.05). None
of these socio – demographic characteristics is a
significant predictor of the said climate.
Table 5a. Regression Analysis on the relationship of the school heads' socio-demographic characteristics and their school climate. SY 2013-2014.
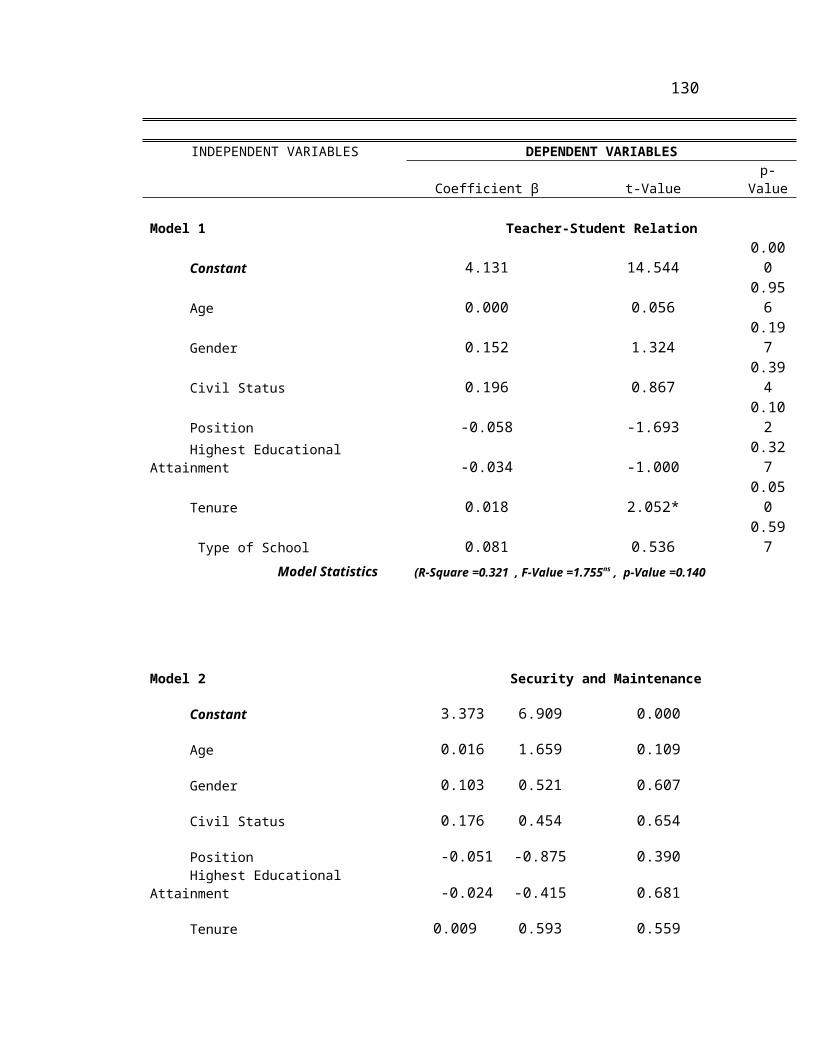
130
INDEPENDENT VARIABLES DEPENDENT VARIABLES
Coefficient β t-Valuep-
Value
Model 1 Teacher-Student Relation
Constant 4.131 14.5440.000
Age 0.000 0.0560.956
Gender 0.152 1.3240.197
Civil Status 0.196 0.8670.394
Position -0.058 -1.6930.102
Highest Educational Attainment -0.034 -1.000
0.327
Tenure 0.018 2.052*0.050
Type of School 0.081 0.5360.597
Model Statistics (R-Square =0.321 , F-Value =1.755ns , p-Value =0.140
Model 2 Security and Maintenance
Constant 3.373 6.909 0.000
Age 0.016 1.659 0.109
Gender 0.103 0.521 0.607
Civil Status 0.176 0.454 0.654
Position -0.051 -0.875 0.390 Highest Educational Attainment -0.024 -0.415 0.681
Tenure 0.009 0.593 0.559
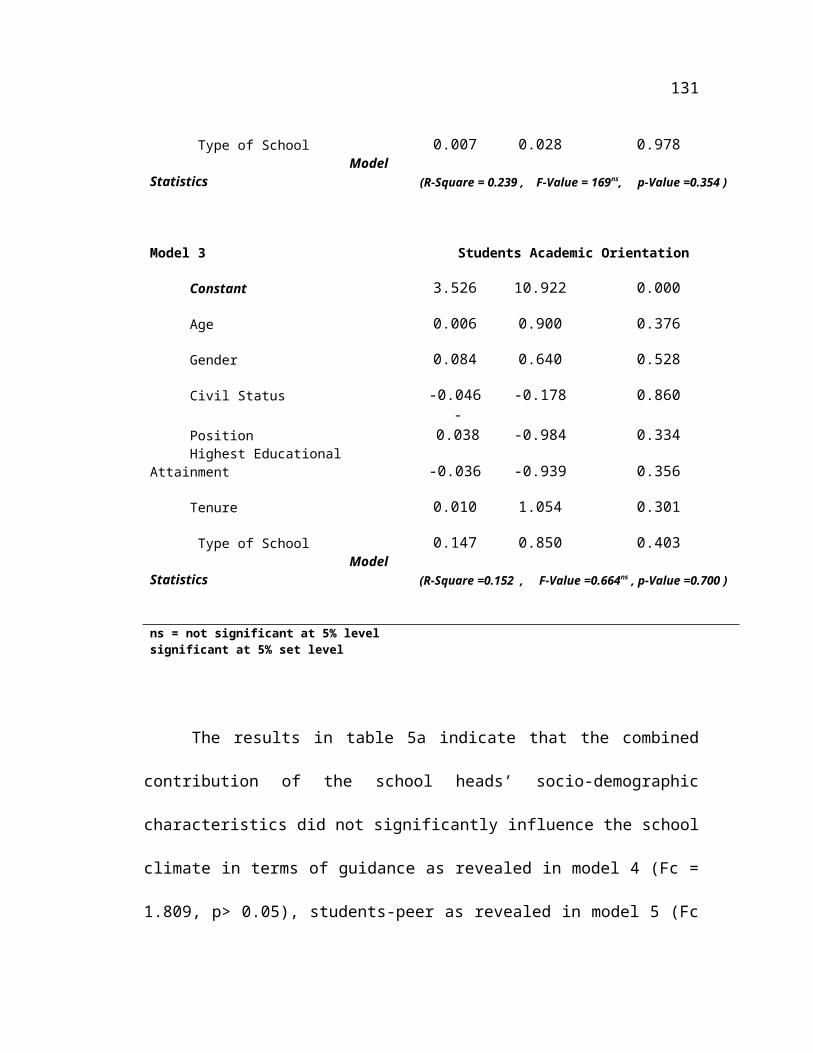
131
Type of School 0.007 0.028 0.978 Model Statistics (R-Square = 0.239 , F-Value = 169ns, p-Value =0.354 )
Model 3 Students Academic Orientation
Constant 3.526 10.922 0.000
Age 0.006 0.900 0.376
Gender 0.084 0.640 0.528
Civil Status -0.046 -0.178 0.860
Position-
0.038 -0.984 0.334 Highest Educational Attainment -0.036 -0.939 0.356
Tenure 0.010 1.054 0.301
Type of School 0.147 0.850 0.403 Model Statistics (R-Square =0.152 , F-Value =0.664ns , p-Value =0.700 )
ns = not significant at 5% levelsignificant at 5% set level
The results in table 5a indicate that the combined
contribution of the school heads’ socio-demographic
characteristics did not significantly influence the school
climate in terms of guidance as revealed in model 4 (Fc =
1.809, p> 0.05), students-peer as revealed in model 5 (Fc

132
= 0.447, p> 0. 05), and instructional management as
revealed in model 6 (Fc =0.537, p> 0.05). Not one of the
independent variables, taken singly, posted as significant
predictor of each of school climate factors.
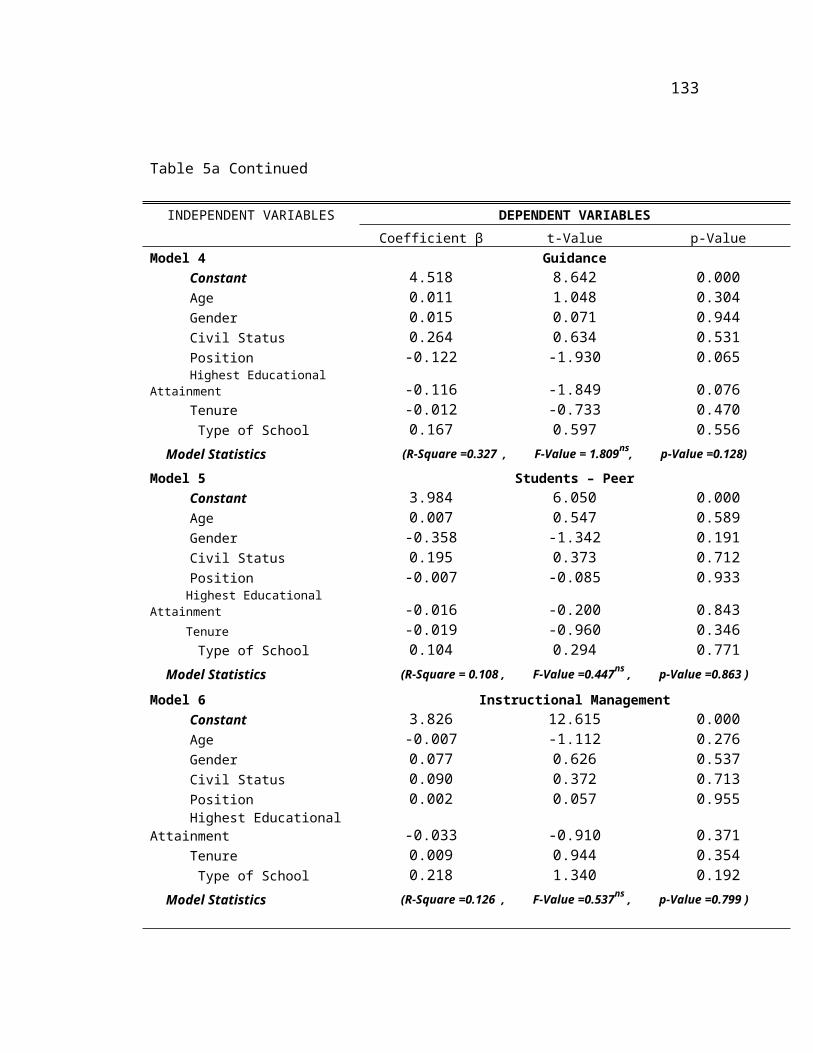
133
Table 5a Continued
INDEPENDENT VARIABLES DEPENDENT VARIABLES Coefficient β t-Value p-ValueModel 4 Guidance Constant 4.518 8.642 0.000 Age 0.011 1.048 0.304 Gender 0.015 0.071 0.944 Civil Status 0.264 0.634 0.531 Position -0.122 -1.930 0.065 Highest Educational Attainment -0.116 -1.849 0.076 Tenure -0.012 -0.733 0.470 Type of School 0.167 0.597 0.556 Model Statistics (R-Square =0.327 , F-Value = 1.809ns, p-Value =0.128)
Model 5 Students – Peer Constant 3.984 6.050 0.000 Age 0.007 0.547 0.589 Gender -0.358 -1.342 0.191 Civil Status 0.195 0.373 0.712 Position -0.007 -0.085 0.933 Highest Educational Attainment -0.016 -0.200 0.843 Tenure -0.019 -0.960 0.346 Type of School 0.104 0.294 0.771 Model Statistics (R-Square = 0.108 , F-Value =0.447ns , p-Value =0.863 )
Model 6 Instructional Management Constant 3.826 12.615 0.000 Age -0.007 -1.112 0.276 Gender 0.077 0.626 0.537 Civil Status 0.090 0.372 0.713 Position 0.002 0.057 0.955 Highest Educational Attainment -0.033 -0.910 0.371 Tenure 0.009 0.944 0.354 Type of School 0.218 1.340 0.192 Model Statistics (R-Square =0.126 , F-Value =0.537ns , p-Value =0.799 )
134
ns = not significant at 5% level* = significant at 5% setlevel
As indicated in model 7, school heads’ civil status
(tc = 2.081*, p< 0.05) and type of school (tc = 2.634*, p<
0.05) were best significant predictors of school climate
in terms of students activities. This result further
denotes that in the public schools whose heads were
married, the students are more able to take part in school
activities in which they were interested and they were
more comfortable staying after school for activities.
Children and parents felt guided and safe if the school
head is matured and experienced compared to singles.
Cortez (2013)
In type of school, public schools today supported a
lot of student-activities, collaborative learning in
classroom activities, the BAKODA (Barkada Kontra Druga).
This program be implemented through Dep Ed Order that
every Friday afternoon, the students had to gather and
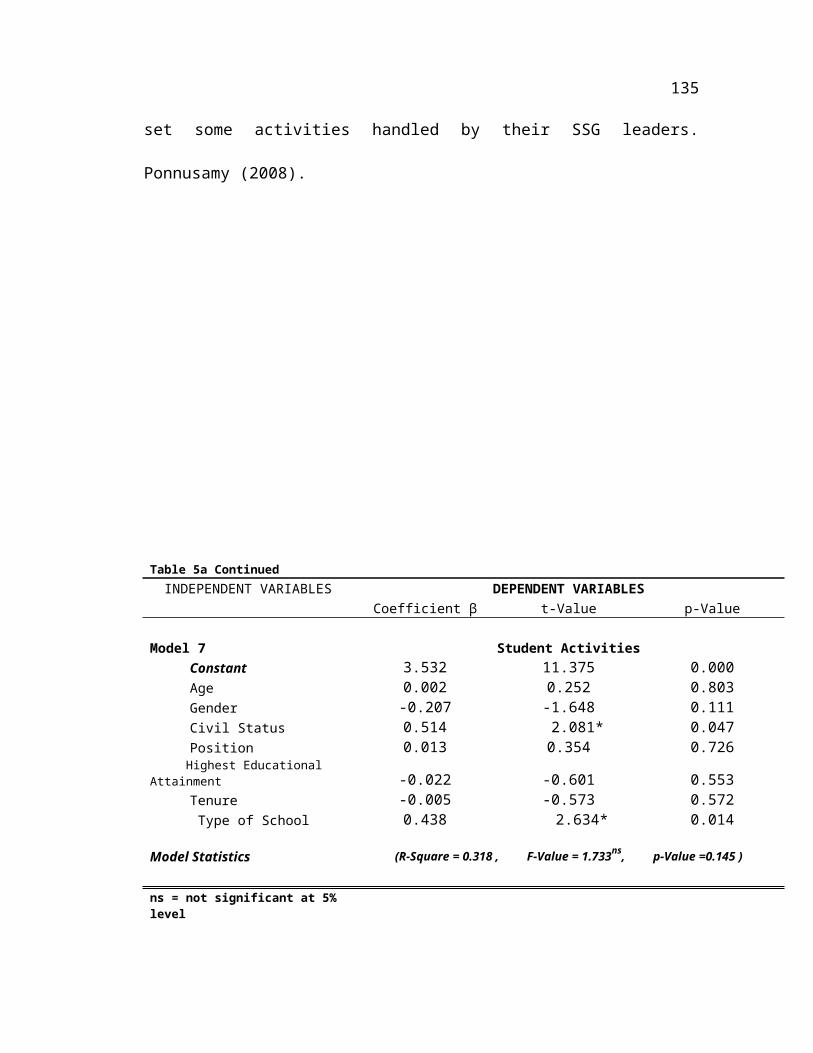
135
set some activities handled by their SSG leaders.
Ponnusamy (2008).
Table 5a ContinuedINDEPENDENT VARIABLES DEPENDENT VARIABLES
Coefficient β t-Value p-Value
Model 7 Student Activities Constant 3.532 11.375 0.000 Age 0.002 0.252 0.803 Gender -0.207 -1.648 0.111 Civil Status 0.514 2.081* 0.047 Position 0.013 0.354 0.726 Highest Educational Attainment -0.022 -0.601 0.553 Tenure -0.005 -0.573 0.572 Type of School 0.438 2.634* 0.014 Model Statistics (R-Square = 0.318 , F-Value = 1.733ns, p-Value =0.145 ) ns = not significant at 5% level
136
* = significant at 5% set level
As indicated in model 8, school heads socio-
demographic characteristics combined contribution did not
significantly influence the leadership behavior in terms
of human relations ( Fc = 0.309, p> 0.05). As indicated in
model 9 in terms of trust and decision making, the socio –
demographic characteristics of school heads did not
significantly influence their level of leadership behavior
(Fc = 1.488, p>0.05). However, position was the best
predictor of leadership behavior in terms of trust and
decision making (t =2.125*, p< 0.05). This result further
reveals that the higher the school heads position, the
higher was their level of leadership behavior practices in
terms of trust and decision making. Decision is a part of
leaders’ success.
Shared decision making and collaboration of a leader
depends on the position he/she has.
Table 5b. Regression Analysis on the relationship of the school heads'
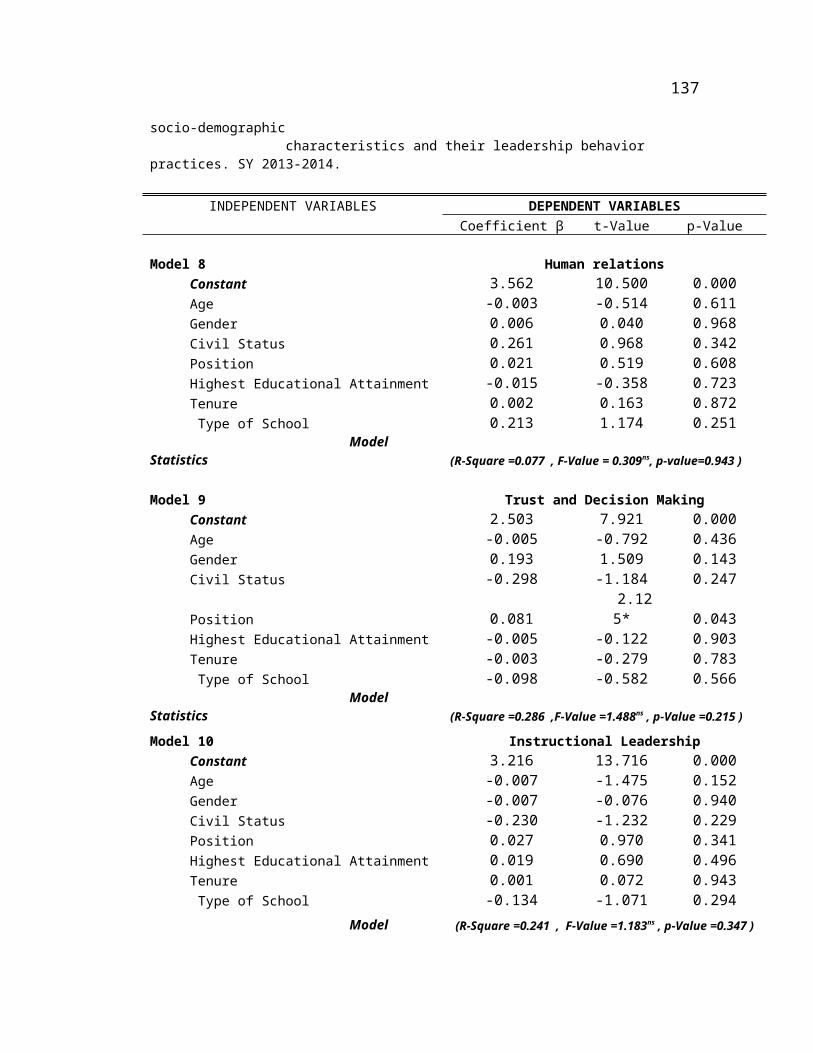
137
socio-demographic characteristics and their leadership behavior practices. SY 2013-2014.
INDEPENDENT VARIABLES DEPENDENT VARIABLES
Coefficient β t-Value p-Value
Model 8 Human relations Constant 3.562 10.500 0.000 Age -0.003 -0.514 0.611 Gender 0.006 0.040 0.968 Civil Status 0.261 0.968 0.342 Position 0.021 0.519 0.608 Highest Educational Attainment -0.015 -0.358 0.723 Tenure 0.002 0.163 0.872 Type of School 0.213 1.174 0.251 Model Statistics (R-Square =0.077 , F-Value = 0.309ns, p-value=0.943 )
Model 9 Trust and Decision Making Constant 2.503 7.921 0.000 Age -0.005 -0.792 0.436 Gender 0.193 1.509 0.143 Civil Status -0.298 -1.184 0.247
Position 0.081 2.12
5* 0.043 Highest Educational Attainment -0.005 -0.122 0.903 Tenure -0.003 -0.279 0.783 Type of School -0.098 -0.582 0.566 Model Statistics (R-Square =0.286 ,F-Value =1.488ns , p-Value =0.215 )
Model 10 Instructional Leadership Constant 3.216 13.716 0.000 Age -0.007 -1.475 0.152 Gender -0.007 -0.076 0.940 Civil Status -0.230 -1.232 0.229 Position 0.027 0.970 0.341 Highest Educational Attainment 0.019 0.690 0.496 Tenure 0.001 0.072 0.943 Type of School -0.134 -1.071 0.294 Model (R-Square =0.241 , F-Value =1.183ns , p-Value =0.347 )
138
Statistics ns = not significant at 5% level* = significant at 5% set level
139
Model 11 indicates that school heads’ leadership
behavior was significantly influenced by their socio –
demographic characteristics in terms of control (Fc =
2.572, p< 0.05). The age (tc = -3.255*, p< 0.05) and type
of school (tc = 2.151, p> 0.05) were the best predictors.
The result further denotes that the younger were the
school heads, the greater was their tendency to delegate
responsibility, assign duty during planning period, rigid
and inflexible, overemphasize control and use the words
“I” and “My” too fluently. On the other hand the result
also implies that the school heads who were in the public
schools were found to have the tendency to practice higher
level of leadership behavior in terms of control. (Rowald,
2011). Dr Prisciliano Bauzon, one of the professors of the
University of Southern Mindanao, graduate school in
Kabacan, Cotabato, said, “The true leader and experts are
the youth”. This was also proven by the director of young
leaders, Forester (2013) by saying “Give chance to the
youth”.
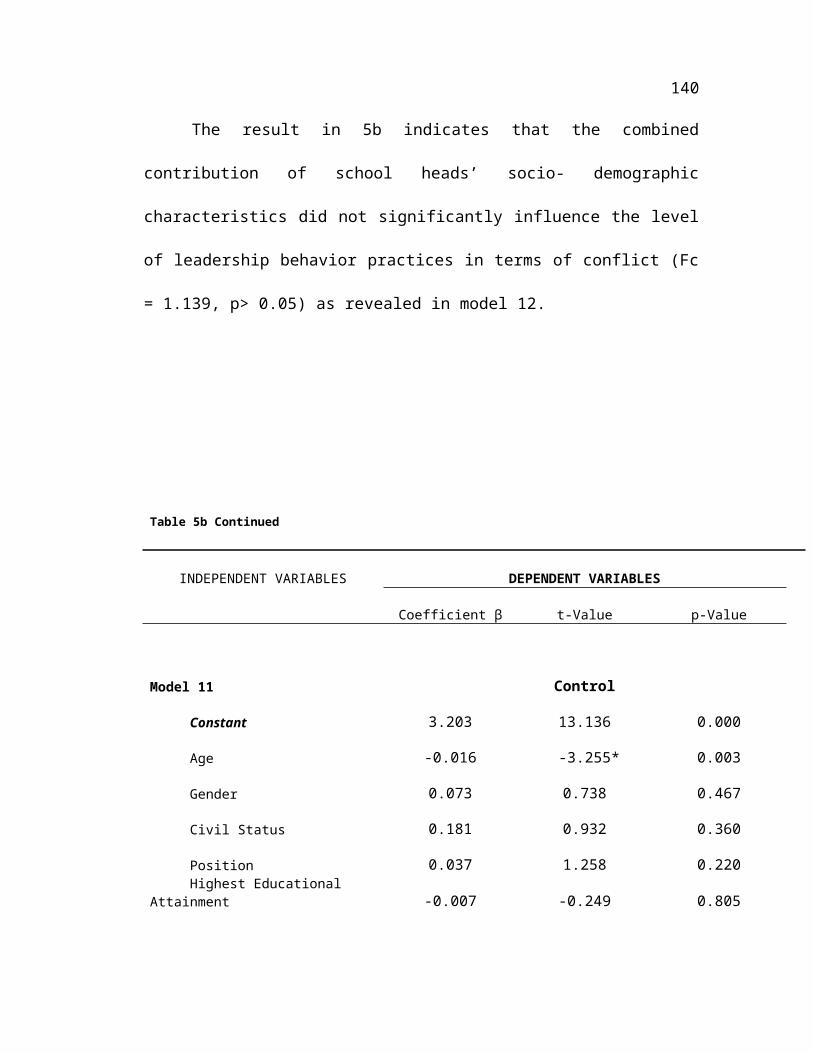
140
The result in 5b indicates that the combined
contribution of school heads’ socio- demographic
characteristics did not significantly influence the level
of leadership behavior practices in terms of conflict (Fc
= 1.139, p> 0.05) as revealed in model 12.
Table 5b Continued
INDEPENDENT VARIABLES DEPENDENT VARIABLES
Coefficient β t-Value p-Value
Model 11 Control
Constant 3.203 13.136 0.000
Age -0.016 -3.255* 0.003
Gender 0.073 0.738 0.467
Civil Status 0.181 0.932 0.360
Position 0.037 1.258 0.220 Highest Educational Attainment -0.007 -0.249 0.805
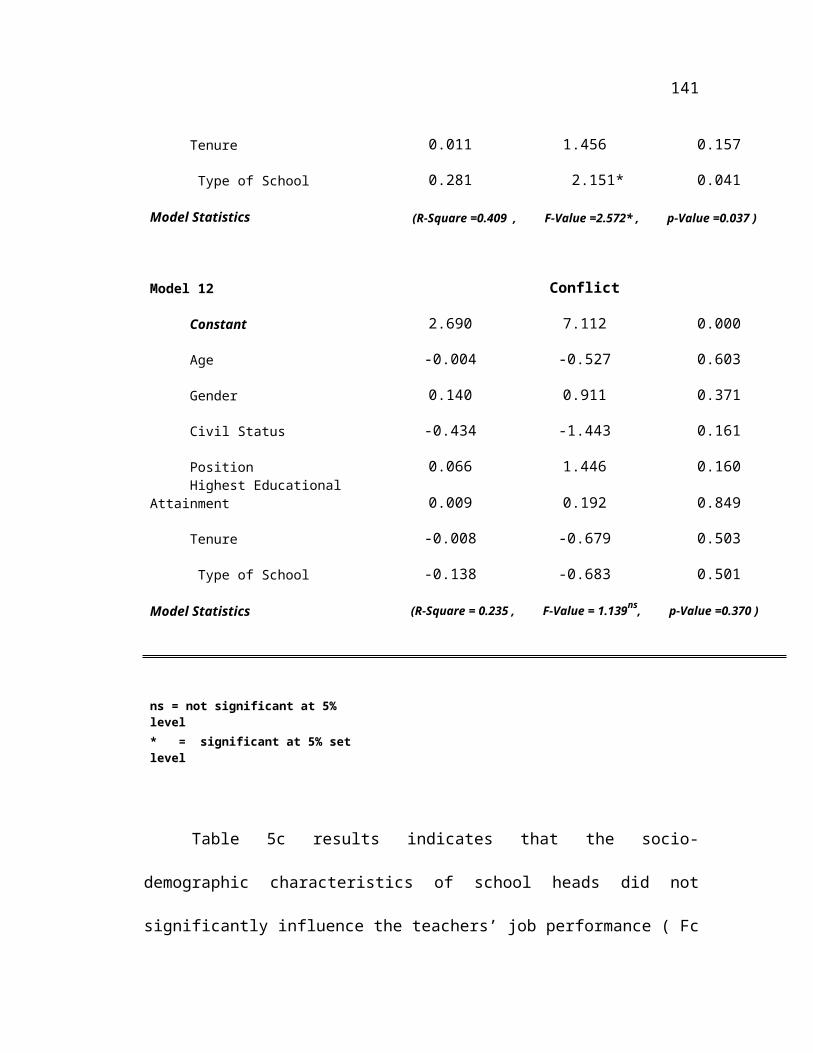
141
Tenure 0.011 1.456 0.157
Type of School 0.281 2.151* 0.041 Model Statistics (R-Square =0.409 , F-Value =2.572* , p-Value =0.037 )
Model 12 Conflict
Constant 2.690 7.112 0.000
Age -0.004 -0.527 0.603
Gender 0.140 0.911 0.371
Civil Status -0.434 -1.443 0.161
Position 0.066 1.446 0.160 Highest Educational Attainment 0.009 0.192 0.849
Tenure -0.008 -0.679 0.503
Type of School -0.138 -0.683 0.501 Model Statistics (R-Square = 0.235 , F-Value = 1.139ns, p-Value =0.370 )
ns = not significant at 5% level* = significant at 5% set level
Table 5c results indicates that the socio-
demographic characteristics of school heads did not
significantly influence the teachers’ job performance ( Fc
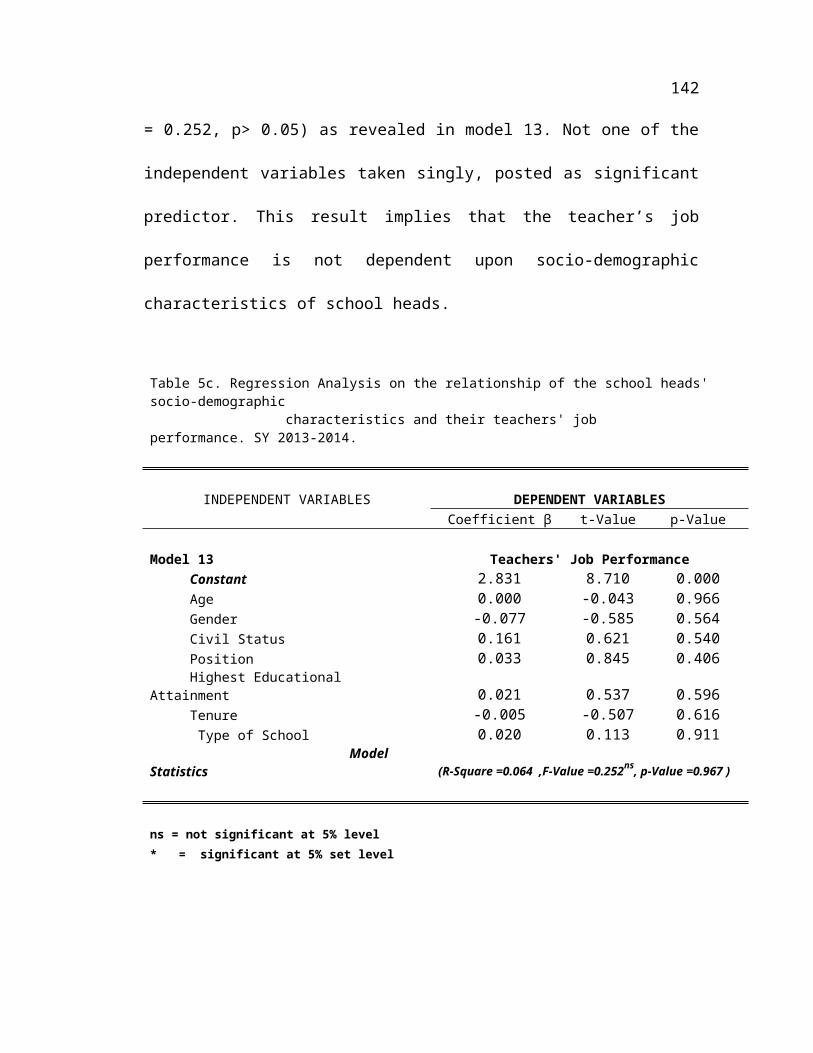
142
= 0.252, p> 0.05) as revealed in model 13. Not one of the
independent variables taken singly, posted as significant
predictor. This result implies that the teacher’s job
performance is not dependent upon socio-demographic
characteristics of school heads.
Table 5c. Regression Analysis on the relationship of the school heads' socio-demographic characteristics and their teachers' job performance. SY 2013-2014.
INDEPENDENT VARIABLES DEPENDENT VARIABLES Coefficient β t-Value p-Value
Model 13 Teachers' Job Performance Constant 2.831 8.710 0.000 Age 0.000 -0.043 0.966 Gender -0.077 -0.585 0.564 Civil Status 0.161 0.621 0.540 Position 0.033 0.845 0.406 Highest Educational Attainment 0.021 0.537 0.596 Tenure -0.005 -0.507 0.616 Type of School 0.020 0.113 0.911 Model Statistics (R-Square =0.064 ,F-Value =0.252ns, p-Value =0.967 )
ns = not significant at 5% level* = significant at 5% set level
143
Table 6a indicates that the school climate
significantly influence the leadership behavior of the
school head in terms of human relation (Fc = 4.989,
p<0.05). Instructional management was the best predictor (
tc = 3.173, p<0.05) as revealed in model 14. This result
implies that the better was the school climate; the better
was the school heads’ leadership behavior practices in
terms of human relations. The person most influential in
determining or altering the climate of a school was the
principal (Ellis, 1988). The contribution of effective
leadership is largest when it was needed the most; there
were virtually no documented instances of troubled schools
being turned around in the absence of an intervention by
talented leaders (Leithwood, Seashore, Anderson, &
Wahlstrom, 2004).
Model 15 revealed that there was a significant
relationship between the school climate and leadership
behavior of the school heads in terms of trust and
decision making (Fc= 2.463, p<0.05). The best predictor
144
was the teacher and student relation (Fc = 2.493*,
p<0.05).
The result further indicates that the school heads
level of trust and decision making was significantly
increased the moment that the teacher-student relation
level was low. Even though climates were variable, they
were still resistant to change. Peterson and Deal (2002)
There was no significant relationship between school
climate and leadership behavior in terms of instructional
leadership (Fc = 0.225, p> 0.05) as revealed in model 16
in table 6a. Taken, singly none of the school climate
indicators was a significant predictor of instructional
leadership.
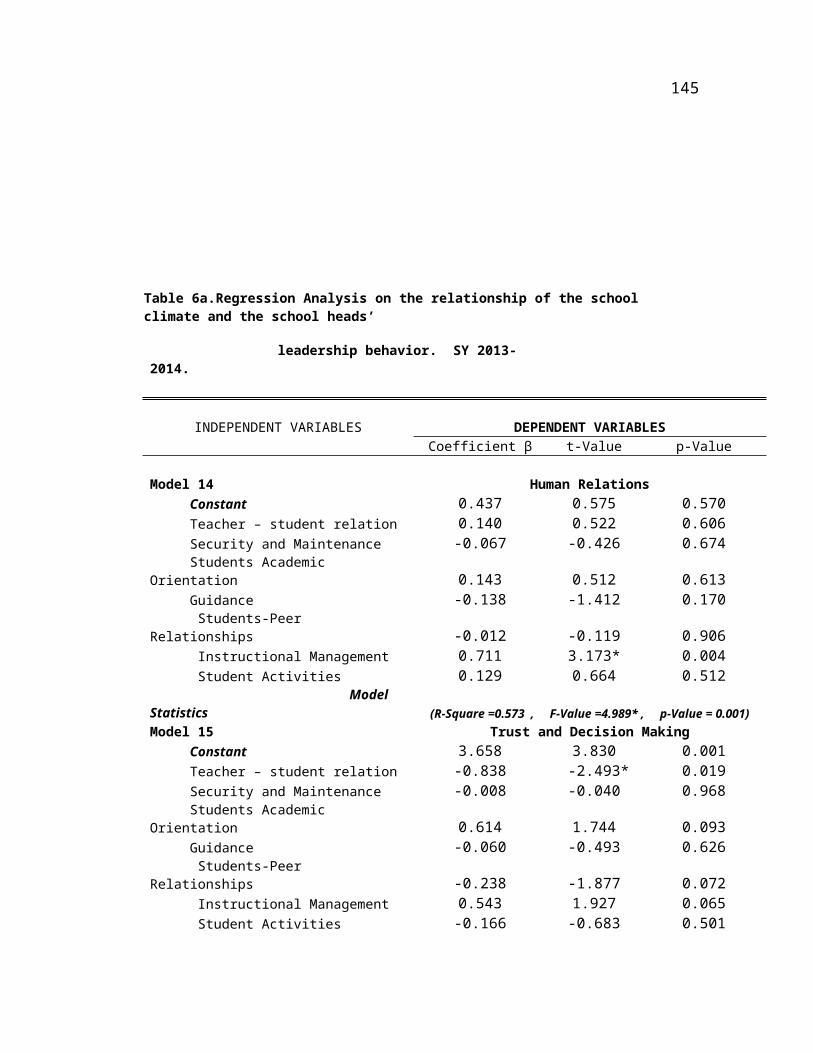
145
Table 6a.Regression Analysis on the relationship of the school climate and the school heads’
leadership behavior. SY 2013-2014.
INDEPENDENT VARIABLES DEPENDENT VARIABLES Coefficient β t-Value p-Value
Model 14 Human Relations Constant 0.437 0.575 0.570 Teacher – student relation 0.140 0.522 0.606 Security and Maintenance -0.067 -0.426 0.674 Students Academic Orientation 0.143 0.512 0.613 Guidance -0.138 -1.412 0.170 Students-Peer Relationships -0.012 -0.119 0.906 Instructional Management 0.711 3.173* 0.004 Student Activities 0.129 0.664 0.512 Model Statistics (R-Square =0.573 , F-Value =4.989* , p-Value = 0.001)Model 15 Trust and Decision Making Constant 3.658 3.830 0.001 Teacher – student relation -0.838 -2.493* 0.019 Security and Maintenance -0.008 -0.040 0.968 Students Academic Orientation 0.614 1.744 0.093 Guidance -0.060 -0.493 0.626 Students-Peer Relationships -0.238 -1.877 0.072 Instructional Management 0.543 1.927 0.065 Student Activities -0.166 -0.683 0.501
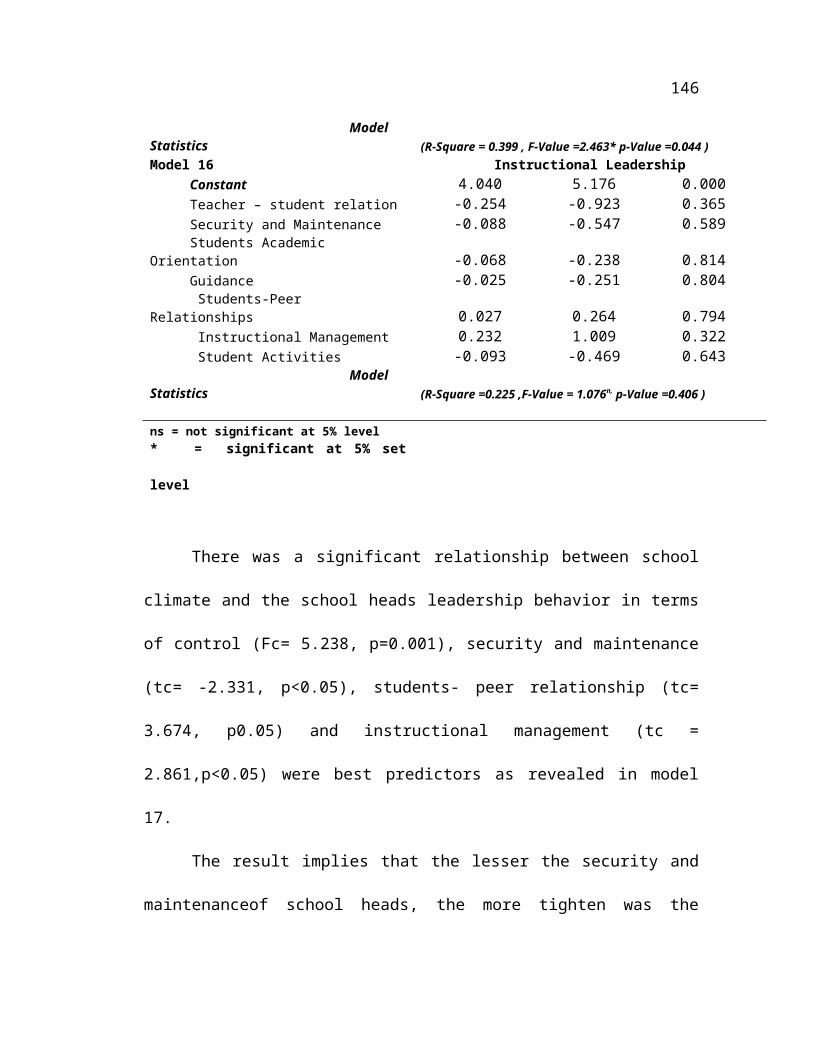
146
Model Statistics (R-Square = 0.399 , F-Value =2.463* p-Value =0.044 )Model 16 Instructional Leadership Constant 4.040 5.176 0.000 Teacher – student relation -0.254 -0.923 0.365 Security and Maintenance -0.088 -0.547 0.589 Students Academic Orientation -0.068 -0.238 0.814 Guidance -0.025 -0.251 0.804 Students-Peer Relationships 0.027 0.264 0.794 Instructional Management 0.232 1.009 0.322 Student Activities -0.093 -0.469 0.643 Model Statistics (R-Square =0.225 ,F-Value = 1.076n, p-Value =0.406 ) ns = not significant at 5% level* = significant at 5% set
level
There was a significant relationship between school
climate and the school heads leadership behavior in terms
of control (Fc= 5.238, p=0.001), security and maintenance
(tc= -2.331, p<0.05), students- peer relationship (tc=
3.674, p0.05) and instructional management (tc =
2.861,p<0.05) were best predictors as revealed in model
17.
The result implies that the lesser the security and
maintenanceof school heads, the more tighten was the
147
control by school head as control can affect the school
climate and proper monitoring was a part of school
management.
The school heads’ leadership behavior in terms of
conflict was significantly influenced by school climate as
shown in model 18 (Fc= 4.008*, p< 0.05) Teacher- student
relation (Fc = -2.810) and students academic orientation
(tc = 2.810*,p<o.05) were the best predictors to prove
that the teacher –student relationship had nothing to do
with school head behavior for no one can dominate a
leaders principle (Montero, 2010).
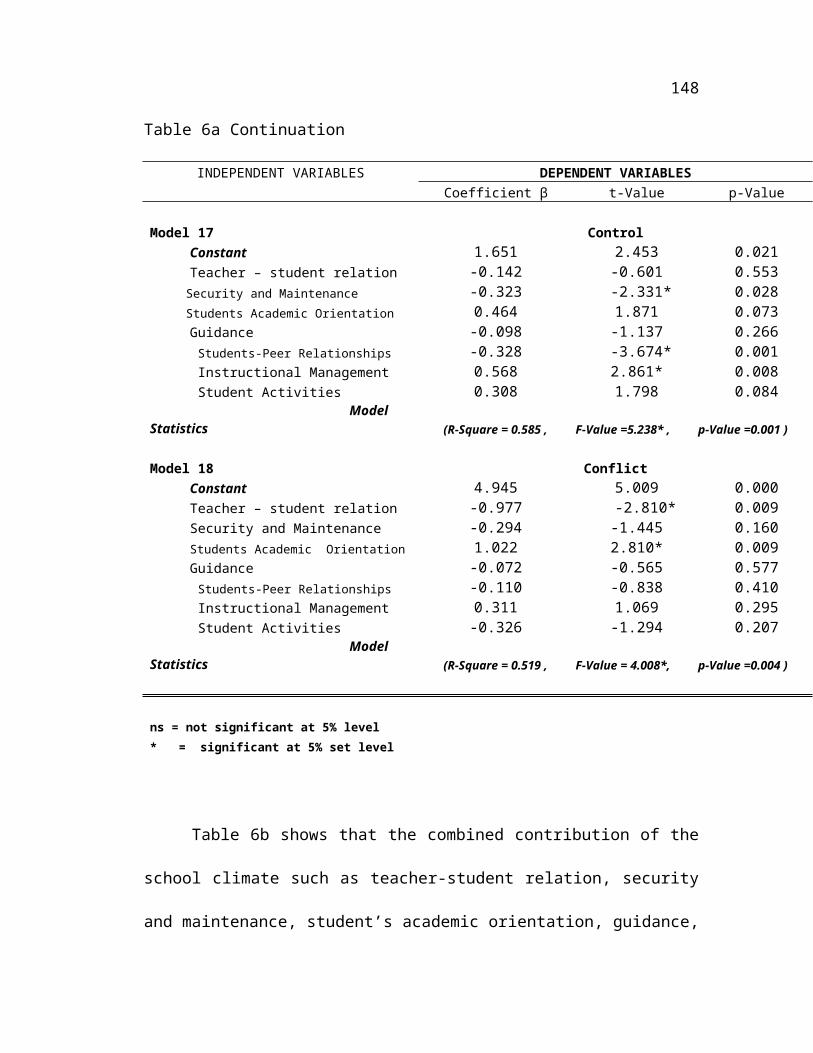
148
Table 6a Continuation
INDEPENDENT VARIABLES DEPENDENT VARIABLES Coefficient β t-Value p-Value
Model 17 Control Constant 1.651 2.453 0.021 Teacher – student relation -0.142 -0.601 0.553 Security and Maintenance -0.323 -2.331* 0.028 Students Academic Orientation 0.464 1.871 0.073 Guidance -0.098 -1.137 0.266 Students-Peer Relationships -0.328 -3.674* 0.001 Instructional Management 0.568 2.861* 0.008 Student Activities 0.308 1.798 0.084 Model Statistics (R-Square = 0.585 , F-Value =5.238* , p-Value =0.001 )
Model 18 Conflict Constant 4.945 5.009 0.000 Teacher – student relation -0.977 -2.810* 0.009 Security and Maintenance -0.294 -1.445 0.160 Students Academic Orientation 1.022 2.810* 0.009 Guidance -0.072 -0.565 0.577 Students-Peer Relationships -0.110 -0.838 0.410 Instructional Management 0.311 1.069 0.295 Student Activities -0.326 -1.294 0.207 Model Statistics (R-Square = 0.519 , F-Value = 4.008*, p-Value =0.004 )
ns = not significant at 5% level* = significant at 5% set level
Table 6b shows that the combined contribution of the
school climate such as teacher-student relation, security
and maintenance, student’s academic orientation, guidance,
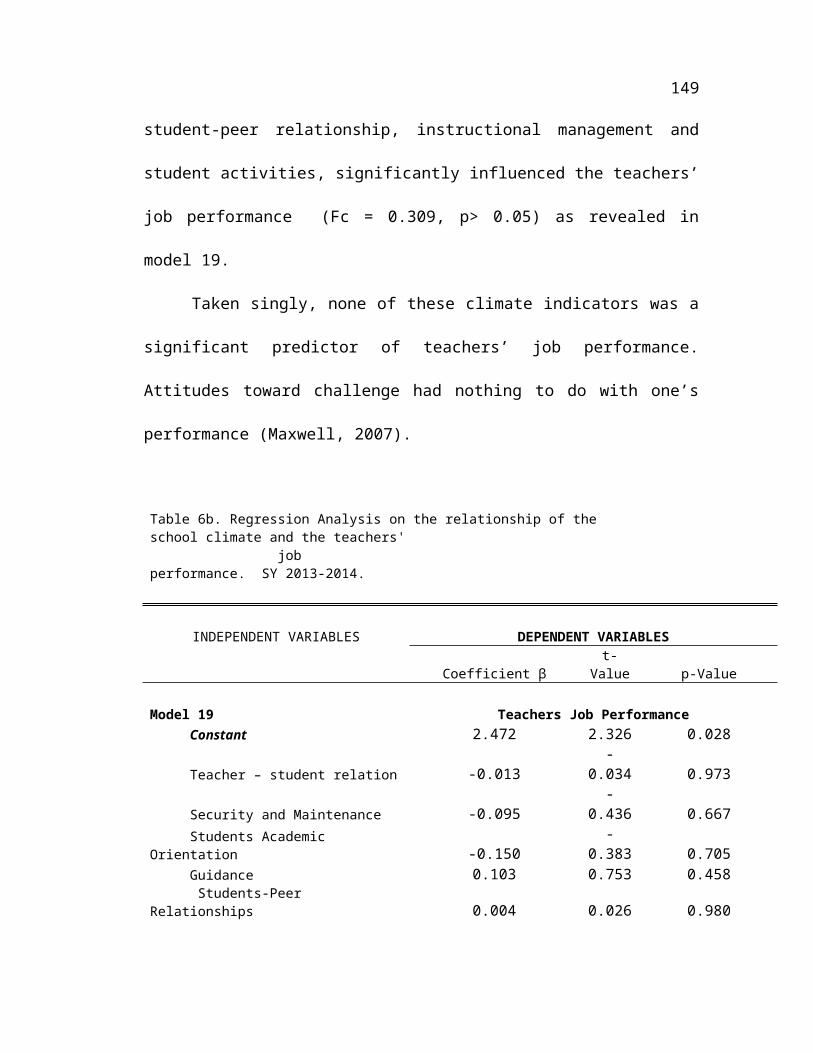
149
student-peer relationship, instructional management and
student activities, significantly influenced the teachers’
job performance (Fc = 0.309, p> 0.05) as revealed in
model 19.
Taken singly, none of these climate indicators was a
significant predictor of teachers’ job performance.
Attitudes toward challenge had nothing to do with one’s
performance (Maxwell, 2007).
Table 6b. Regression Analysis on the relationship of the school climate and the teachers' job performance. SY 2013-2014.
INDEPENDENT VARIABLES DEPENDENT VARIABLES
Coefficient βt-
Value p-Value
Model 19 Teachers Job Performance Constant 2.472 2.326 0.028
Teacher – student relation -0.013-
0.034 0.973
Security and Maintenance -0.095-
0.436 0.667 Students Academic Orientation -0.150
-0.383 0.705
Guidance 0.103 0.753 0.458 Students-Peer Relationships 0.004 0.026 0.980
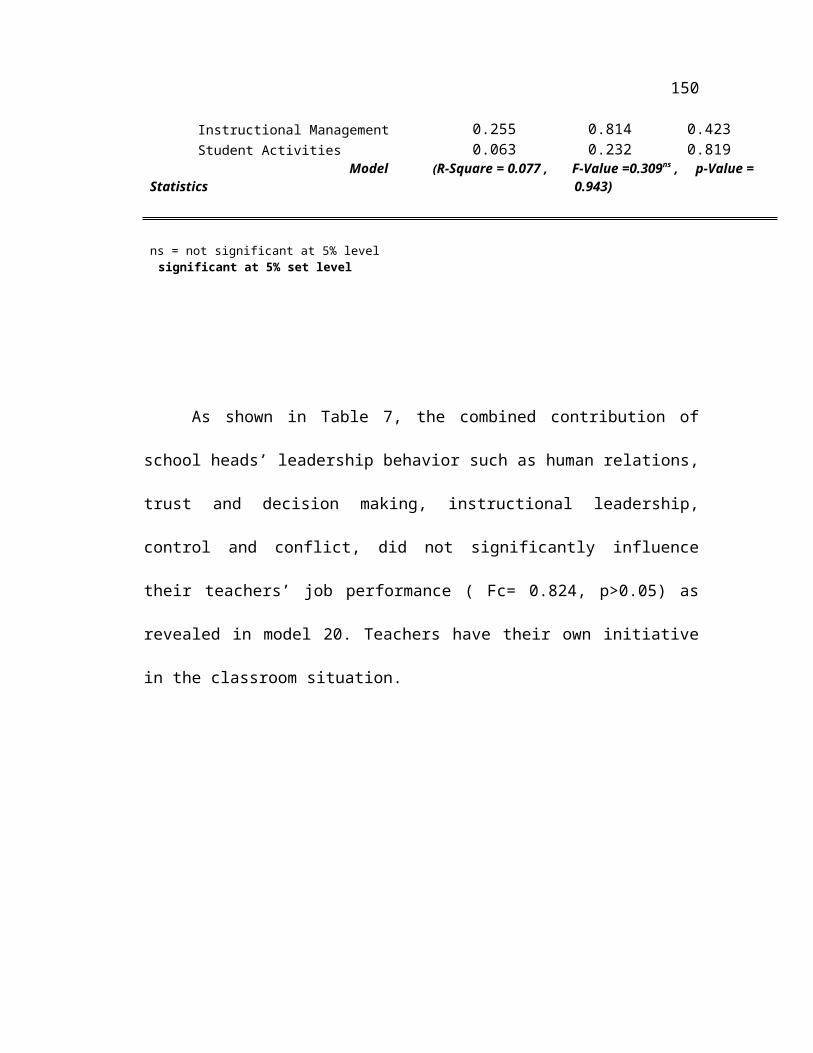
150
Instructional Management 0.255 0.814 0.423 Student Activities 0.063 0.232 0.819 Model Statistics
(R-Square = 0.077 , F-Value =0.309ns , p-Value =0.943)
ns = not significant at 5% level significant at 5% set level
As shown in Table 7, the combined contribution of
school heads’ leadership behavior such as human relations,
trust and decision making, instructional leadership,
control and conflict, did not significantly influence
their teachers’ job performance ( Fc= 0.824, p>0.05) as
revealed in model 20. Teachers have their own initiative
in the classroom situation.
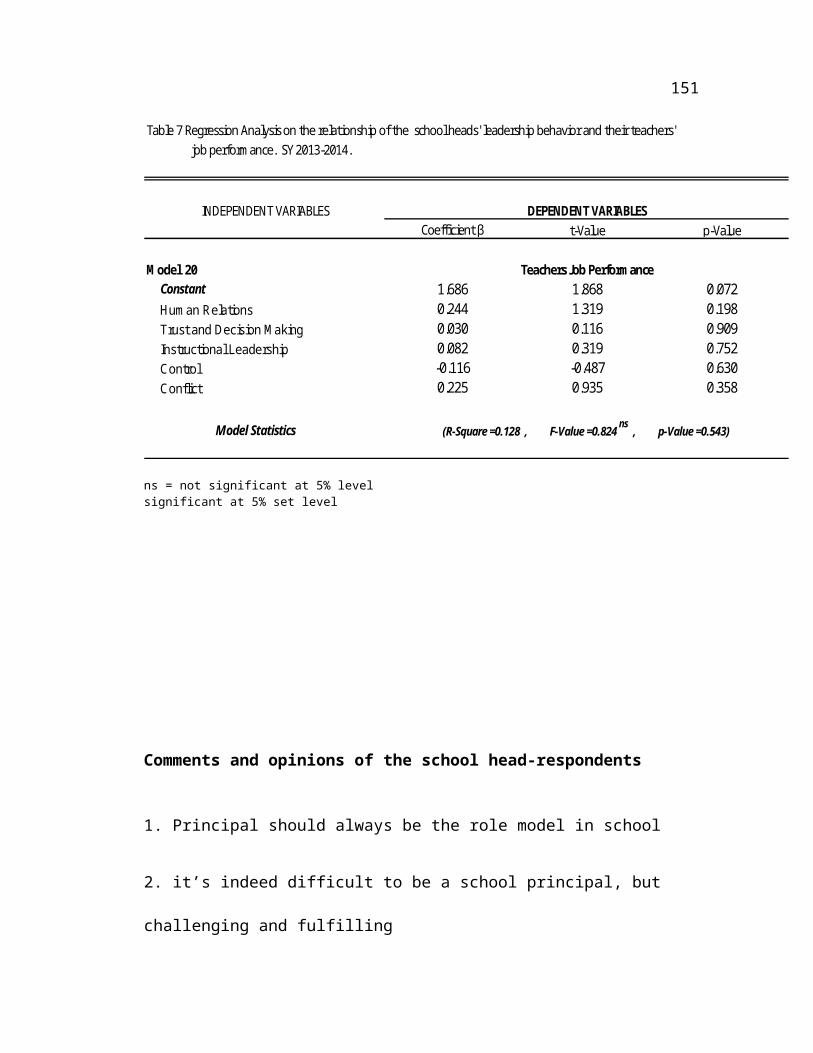
151
Table 7 Regression Analysis on the relationship of the school heads' leadership behavior and their teachers' job perform ance. SY 2013-2014.
INDEPENDENT VARIABLESCoefficient β t-Value p-Value
M odel 20 Constant 1.686 1.868 0.072 Hum an Relations 0.244 1.319 0.198 Trust and Decision M aking 0.030 0.116 0.909 Instructional Leadership 0.082 0.319 0.752 Control -0.116 -0.487 0.630 Conflict 0.225 0.935 0.358
Model Statistics
DEPENDENT VARIABLES
Teachers Job Perform ance
(R-Square =0.128 , F-Value =0.824 ns , p-Value =0.543)
ns = not significant at 5% levelsignificant at 5% set level
Comments and opinions of the school head-respondents
1. Principal should always be the role model in school
2. it’s indeed difficult to be a school principal, but
challenging and fulfilling
152
3. The principal should do their duties and
responsibilities religiously in order to assist teachers
in the deliberations of competence
4. As principal, it is very important to let go the old
practices (unlearned) in order to give space or re –
learning new things.
5. Instructional leadership is a system in which teachers
learn from their principal while the principal is also
learning from their teachers, hence there is a need for
principal to do the cycle of Learn-unlearn-relearn
6. Treat teachers and students with love and compassion
but in control.
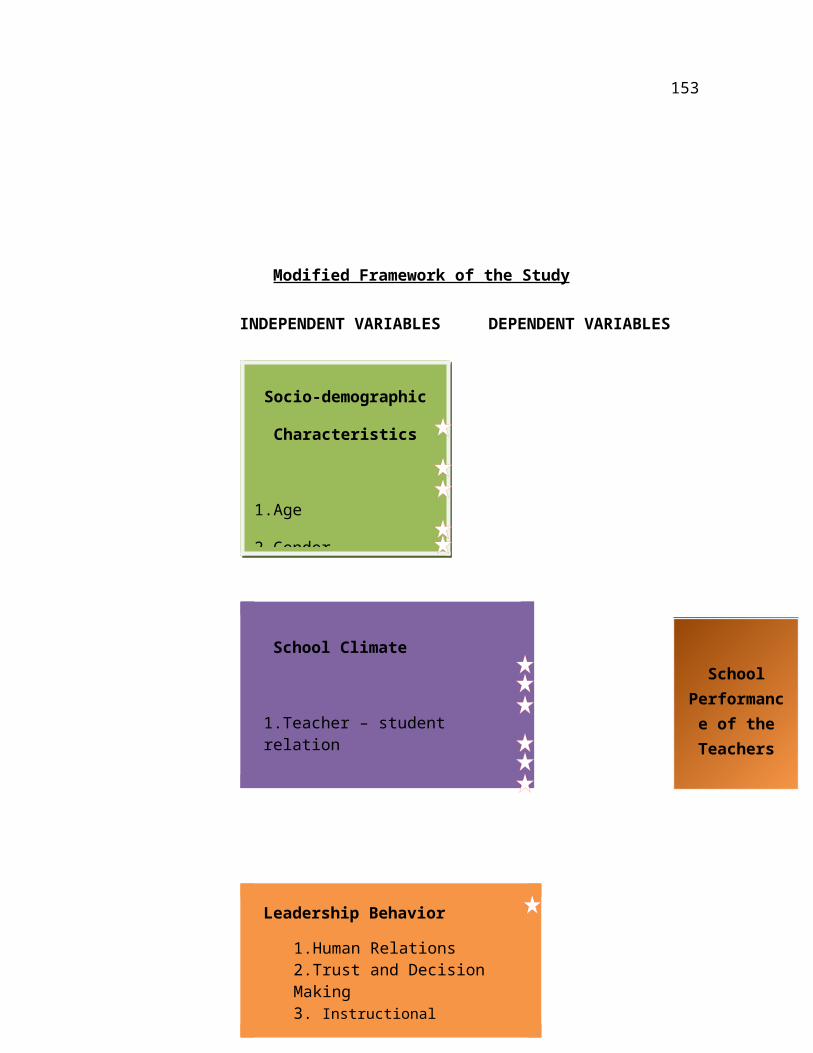
153
Modified Framework of the Study
INDEPENDENT VARIABLES DEPENDENT VARIABLES
Socio-demographic
Characteristics
1.Age
2.Gender
School Climate
1.Teacher – student relation
Leadership Behavior
1.Human Relations2.Trust and Decision Making3. Instructional
SchoolPerformance of theTeachers
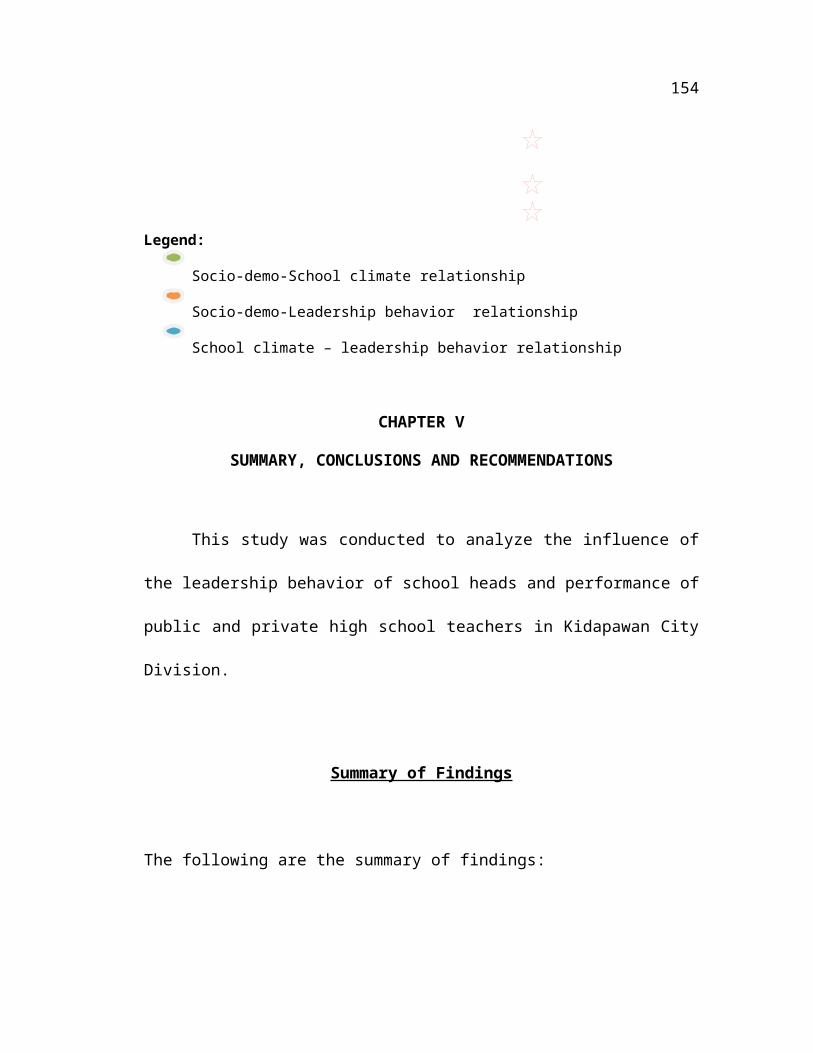
154
Legend:
Socio-demo-School climate relationship
Socio-demo-Leadership behavior relationship
School climate – leadership behavior relationship
CHAPTER V
SUMMARY, CONCLUSIONS AND RECOMMENDATIONS
This study was conducted to analyze the influence of
the leadership behavior of school heads and performance of
public and private high school teachers in Kidapawan City
Division.
Summary of Findings
The following are the summary of findings:
155
1. Majority of the school heads were from 50-56 years of
age, female, married, with principal position and
have BS with Master’s Degree. Most of them have been
in the service as administrator for 1-5 years and
mostly employed in public schools.
2. In school climate, majority rated strongly agree in
terms of teacher-students’ relation, agree in terms
of security maintenance, student academic
orientation, guidance, student- peer relationships,
instructional management and student activities.
3. The school heads’ leadership behavior practices of
public and private high schools in Kidapawan City
Division were rated strongly agree in terms of human
relation, agree in terms of instructional leadership,
moderately agree in conflict and disagree in terms of
decision making and control domain.
4. Majority of the teachers in public and private high
schools in Kidapawan City Division were found to
have very satisfactory performance.
156
5. The school heads’ socio-demographic characteristics
such as age, gender, civil status, position,
educational attainment, tenureship and type of school
did not significantly influence the:
a. School Climate
Tenureship was found the best predictor in socio-
demographic characteristics that significantly
influenced the school climate in terms of teacher-
student relationship, civil status and type of
school in terms of student’s activities.
b. Leadership behavior
-position was best predictor in socio-demographic
characteristics that significantly influenced the
leadership behavior in terms of trust and decision
making, age and type of school to the leadership
behavior in terms of control.
c. Teachers’ Performance
-The socio demographic of school heads did not
influence the teachers’ job performance of the

157
public and private teachers in Kidapawan City
Division.
6. a. The school climate significantly influenced the
school heads’ leadership behavior. The instructional
management domain of school climate significantly
influenced the leadership behavior in terms of human
relation. The teacher-student relation domain in
school climate significantly influence in terms of
trust and decision making in leadership behavior; the
school climate domains like security maintenance,
students-peer relationship and instructional
management significantly influenced the leadership
behavior in terms of control. Teacher-student
relation and student academic orientation domain in
school climate significantly influenced the
leadership behavior in terms of conflict.
b. The school climate did not significantly influence
the performance of public and private teachers in
Kidapawan City Division.
158
7. School heads’ behaviors’ did not significantly
influence the performance of the public and private
teachers in Kidapawan City Division.
Conclusions
Based on the given findings, the following are the
drawn conclusions:
1. The school climate was affected by teachers’
tenureship.
2. Position influences the leadership behavior in
terms of trust and decision making; age and type
of school influence leadership behavior in terms
of control.
3. The school heads’ leadership behavior influences
the school climate.
4. The socio- demographic characteristics, school
climate and leadership behavior did not

159
significantly influence the job performance of the
teachers.
Recommendations
Based on the aforementioned summary and conclusions,
the following recommendations are made:
1. Trainings seminars workshops such as team building
activities, involvement in curriculum planning,
and the organization of school events should be
given to intensify the camaraderie and healthy
relationship among teachers.
2. The school heads should possess good leadership
behavior since they are the leaders of their
schools who are looked up to by the teachers,
pupils and stake holders. Their good leadership is
one of the factors that will create a positive
school climate which can contribute to teachers
160
job satisfaction thereby motivate them to work
better.
3. The school heads must maximize their efforts in
creating a positive school climate in their school
to produce teachers’ quality performance
4. Teachers must also be encouraged to pursue higher
education by allowing them to enroll in graduate
programs to enhance their competence in
instruction and personal characteristics to
maintain good school climate and understand
leadership behavior of their school heads .
5. A further study can be conducted to include other
factors that may influence teacher’s performance
and comparing the school climate and leadership
behavior of public and private institutions.
161
REFERENCES
162
REFERENCES
Books
Byrd, Margaret R.Human Relations Skills of Principals in UrbanSchools with
Low Teacher Turnover Rates. Sam Houston State University,Huntsville, Texas. August 2002.
Maxwell, John C. (2007) Maximize Your Day,365 Days of Insightto Develop the
Leader Within You and Influence Those Around You: ThomasNelson, inc, 501 Nashville Tennessee
163
Newstrom, J.W. Davis, K. (2002) Organizational Behavior: human behavior at
work. New York: McGraw-Hill Book Co.
Article
Alcaide, Felisa. Human Relations Practices of School Administrators in
Pozorrubio District I and II, Pangasinan II. Modern Teacher. July 1994. Vol. 4. No. 3.
Internet
Adelman, Howard S. and Taylor, Linda. SAFE SCHOOLS IN THECONTEXT
OF SCHOOL IMPROVEMENT . Center for Mental Health inSchool, UCLAhttp://gwired.gwu.edu/hamfish/AnnualConference/2007/
Berkowitz, Marvin W. Measuring School Climate. July 24, 2009.
http://www.schoolclimate.org/climate/practice.php
Butchanan, Matt. Classroom Rules. January 3, 2006.
164
http://www.childdrama.com/rules.html
Bulach, C. R. , Boothe, D., & Pickett, W. "Should nots" for school principals:
Teachers share their views. ERS SPECTRUM: Journal ofSchool Research and Information. August, 2006.
(http://www.westga.educ/cubulach/sclimate/opentrust_article2.htm.)
Bulach, C. R. A four step process for identifying and reshapingschool culture.
Principal Leadership. 2001.
http://www.westga.edu/~cbulach/sclimate/ihrtopen.htm
Carroll, B. The Effects of School Violence and Crime on Academic
Achievement. November 1, 2009.
http://www.davidson.edu/academic/economics/Student%20Research%20Papers/Brandon%20Carroll%20paper.pdf
Chang, Juvenna. Instructional Leadership in a Pacific Context.July 1, 2009.
http://www.prel.org/products/re_/instruc-lead.htm
Cherniss, C. Social and Emotional Learning for leaders.Educational Leadership. 2008.
http://www.social.emotion./leaders.htm.
http://www.davidson.edu/academic/economics/Student%20Research%20Papers/Brandon%20Carroll%20paper.pdf
165
Clark, R. Building Student Achievement: In-School andOut-of-School
Factors. Retrieved November 1, 2009.http://www.ncrel.org/policy/pubs/html/pivol13/dec2002c.htm
Edgerson, David. E. , Kritsonis, William Allan. Analysis of theInfluence of
Principal Teacher Relationships on Student AcademicAchievement: A National Focus. 2006.
http: //www.principal/rel./pubs/html/2006c.html.
Educational Encyclopedia State University.com.school.Principal - The Role of
Elementary and Secondary School Principals, PrincipalDuties and Responsibilities, PrincipalQualifications. July 1. 2009. http://74.6.146.127/search/cache?ei=UTF-p=school+principal+as+instructional+leader&xa=MiYfnaHXaDNLAu_JL3fgiw
Edgerson, David E. et al. Analysis of the Influence ofPrincipal – Teacher Relationships on Student AcademicAchievement: a National Focus. November 1, 2006.
http://www.nationalforum.com/Electronic%20Journal%20Volumes/Edgerson, %20David%20Analysis%20of%20the %20Influence%20of%20Principal.pdf
166
E-Lead. Leadership for Student Success. InstructionalLeadership. July 1,
2009.http://www.e-lead.org/resources/resources.asp?
ResourceID=14Erikson, Erik . School Climate – Measuring SchoolClimate, School Climate Outcomes, Issues Trends andControversies
http://education.stateuniversity.com/pages/2392/School-Climate.html
Etsey, Kafui. Causes of low academic performance of primaryschool pupils in
the Shama Sub-Metro of Shama Ahanta East MetropolitanAssembly (SAEMA) in Ghana. November, 2005.
http://www.saga.cornell.edu/saga/educconf/etsey.pdf
Fujita, K. The Effects of Extracurricular Activities on the Academic Performance of Junior High Students. November 1, 2009.
http://www.kon.org/urc/v5/fujita.html
Gabbianelli. Cristina. Graphology for Academic Guidance: the performance of
a project . 2001.http://www.graphology.ws/2169gabeng.htm
Gibbons, S. , Telhaj, S. Peers and achievement in England’ssecondary
schools. February 2008.
http://www.peers.achieve.sec./34html.
167
Goe, Laura. “ Link Between Teacher Quality and Student Outcomes: A
Research Synthesis”. October 2007.http://74.6.146.127/search/cache?ei=UTF-
Halawah, Ibtesam. The relationship between effective communications of high
school principal and school climate. 2005. http://findarticles.com/p/articles/mi_qa3673/is_2_126/ai_n29236024/?...
Hammond, Linda Darling. “ Teacher Quality and StudentAchievement: A
Review of State Policy Evidence”. January 1, 2000.http://www.epaa.-edu./epaa/vxn1/
Hamzah, Mohd. Sahandri Gani et. Al. Excellent Teachers’Thinking Model: Implications For Effective Teaching. August ,2008.
http://ajte.education.ecu.edu.au/issues/PDF/334/Hamzah.pdf
Hollrah, R. Extracurricular Activities. November 1, 2009.
http://www.public.iastate.edu/~rhetoric/105H17/rhollrah/cof.html
Hussain, Abid. Effect of Guidance Services on Study Attitudes, Study Habits
and Academic Achievement of Secondary School Students. June 2006
http://www.pu.edu.pk/ier/ber/previous_pdf/3_Effect%20of%20Guidance%20Services_F.pdf
168
Jenkins, Billy. What It Takes To Be an Instructional Leader? February 2009.
http://74.6.146.127/search/cache?ei=UTF8&p=school+principal+as+instructional+leader&
Kuchler, William J. Perceived Leadership Behavior and Subordinates’ Job
Satisfaction in Midwestern NCAA Division III Athletic Departments.
2009.
http://www.pa.perceived./leaderbehavior/cache?ie+job.pdf.
Lavy, V., et. al. 2009. The Good, The Bad and The Average:Evidence on the
Scale and Nature of Ability Peer Effects in Schools.March 2009.
http://www.eief.it/it/f9/03/lavy-silva-einhardt_abilitypeereffects_.pdf
Larchick, Ron and Chance Edward W. . Teacher Performance andPersonal Life Stressors: Implications for Urban SchoolAdministrators. November 3, 2004.
http://www.nationalforum.com/Electronic%20Journal%20Volumes/Larchick, %20Ron%20Teacher%20Performance%20and%20Personal%20Life%20Stess ors%20Implications%20for%20Urban%20School%20Administrators.pdf ct
169
Leitner, David. Principal Instructional Management Behavior andSchool
Effectiveness: An Organizational Perspective. 2000.
http://www.eric.ed.gove/ERICWebProtal/cutom/portlets/recordDetails/d
etailmini.jsp?_nfpb=true&ERICExtSearch_SearchValue_0ED302934.
Luo, Mingchu and Najjar, Lotfollah. The Chinese PrincipalLeadership Capacities as Perceived by Master Teachers.February 12, 2007.
http://www.academicleadership.org/emprical_research/The_Chinese_Principal _Leadership_Capacities_as_Perceived_by_Master_Teachers.shtml
Lezotte, Lawrence W. Effective Schools: Past, Present, and Future. November
10, 2009.
http://www.aepweb.org/summit/09_Presentations/Effective_Schools_Lezotte.pdf
Mandell, D. et.all. The Impact of Substance Use andViolence/Delinquency on
Academic Achievement for Groups of Middle and High SchoolStudents in Washington State. May, 2002.
170
http://hspc.org/publications/pdf/DASA_full_2002.pdf
Miller, Shaizs Rafiullah. Falling Off Track: How Teacher-Student Relationships
Predict Early High School Failure Rates. April 2004. http://www.eric.ed.gov/ERICWebPortal/custom/portlets/recordDetails/detailmini
Ock, J. . Influence of Nonacademic Activities on CollegeStudents’ Academic
Performance. Spring 2008.
http://www.psych.umn.edu/sentience/files/Ock_2008.pdf
Orr, Margaret Terry. Innovative Leadership Preparation andEffective
Leadership Practices: Making A Difference in SchoolImprovement. Bank Street College. www. Seli.stanford.edu.2006.
Rayle, A. Moorhead, H. et. al. Adolescent Girl-to-Girl Bullying: Wellness-Based.
November 1, 2009.
http://www.jsc.montana.edu/articles/v5n6.pdf
Reynolds, Pauline. Evaluation of the pilot Orientation at Ivy Tech Richmond.
171
May 2006.
http://www.indiana.edu/~ipas1/documents/IvyTechRichmondFINAL.pdf
Sass, Mary Burke. Classroom Peer Effects and StudentAchievement. June
2008 http://www.urban.org/UploadedPDF/1001190_peer_effects.pdf
Santiago, I. 2006. School climate is the variable withthe strongest impact on achievement among LatinAmerican students
http://portal.unesco.org/geography/en/ev.php-URL_ID=9076&URL_DO=DO_TOPIC&URL_SECTION=201.html
School Rules. Lombard Middle school. January 18, 2009.
http://lombard.baltimorecityschools.org/Info/School_Rules.asp
Seltzer, Richard, Sr., Roxbury, West. Lessons for Would-BePrincipals --Case
Studies from High School Administration. July 2009. http://www.samizdat.com/humanrelations.html
School Climate a Connectedness and Student Achievement.September 18, 2007.
http://www.alaskaice.org/files/070918_SCCSandAchievement_AIRTechPaper. pdf
School Improvement in MaryLand. Indicators for EffectivePrincipal Leadership
172
in Improving Student Achievement. July 2009.
http://www.mdk12.org/process/leading/p_indicators.html
Southern Regional Council on Educational Administration:Investigating Level
of Openness and Trust Between Principals and theirTeachers. 2001.
http://www.westga.edu/~cbulach/sclimate/ihrtopen.htm
Southern Regional Council on Educational Administration: 2001Yearbook.
Investigating Levels of Openness and Trust BetweenPrincipals and their Teachers. 2001.
http://www.westga.edu/~cbulach/sclimate/opentrust_article2.htm
Stone, Howard, Parker, James and Wood, Laura M. Report on theOntario
Principals’ Council Leadership Study. 2009.
http://www.eiconsortium.org/
Tableman, Betty. School Climate and Learning. December, 2004.2004.
http://outreach.msu.edu/bpbriefs/issues/brief31.pdf
Tennessee Instructional Leadership Standards. January 25, 2008.
173
http://74.6.146.127/search/cache?ei=UTF-p=school+principleader&fr=yft-t-
White, Jeffrey Cornelius. Learner-Centered Teacher-StudentRelationships Are
Effective: A Meta-Analysis. November 1, 2009. http://rer.sagepub.com/cgi/content/full/77/1/113
Ysseldyke, Jim, Betts, Joe; Thill, Teri; Hannigan, Eileen. Use of Instructinal
Management System to Improve Mathematics Skills for Students in Title I Programs. June 22, 2004.
http://www.highbeam.com/doc/1G-121714076.html.
B. Unpublished Thesis/Dissertation
BALAWAG, L.A. 2005. Management Practices of PublicSecondary School
Administrators in Relation to the Job Performance ofTeachers. (Unpublished Dissertation, USM, Kabacan,Cotabato).
174
BARRIENTOS, M. A. 2008. The Public Elementary SchoolAdministrators’
Managerial Practices and Teacher’s Job Performance inCotabato Province. (Unpublished Dissertation, USM,Kabacan, Cotabato).
BULOSAN, S.S. 2002. Emotional Intelligence and Job Performanceof Public
School Teachers in Region XII. (Unpublished Dissertation,USM, Kabacan, Cotabato).
BUTUAN, N.N. 1997. Determinants of Job Satisfactionamong Faculty
Members in College of Cotabato Province. (UnpublishedDissertation, USM, Kabacan, Cotabato).
DOONG, W.L. 1997. Variables Affecting Teaching Efficiency ofthe Instruction
of Trade Technical and Vacational Institutions inMindanao. (Unpublished Dissertation, USM, Kabacan,Cotabato).
GAGABI, M.S. 1991. Variables Influencing Teaching Performanceof Master
Teachers of DECS Pilot Central Elementary School, RegionXII. (Unpublished Dissertation, USM, Kabacan, Cotabato).

175
GANAD, R. T. 2008. Team Building Practices of Administratorsand School
Effectivess: Basis for a Five Year Development Plan.(Unpublished Dissertation, University of SoutheasternPhilippines, Obrero, Davao City).
MACAYA, D. J. B. 2008. Personality and Performance ofAdministrators of Aleosan Districts. (UnpublishedMaster’s Thesis. USM, Kabacan, Cotabato).
MONTERO, R. J. 2010. The influence of school principals’leadership
behavior and school climate on teachers’ andschools’ Performance of the public Elementary schools. (Unpublished Master’s Thesis. USM, Kabacan,Cotabato).
PIGUERRA, A.L. 2005. Personal and ProfessionalAttributes and
Management Capabilities of Public Elementary School Headsin the Division of Panabo City. (Unpublished Master’sThesis, NDU, Cotabato City).
PERALTA, P. 2009. The Effectiveness of Elementary SchoolAdministrators
in Educational Management. (Unpublished Master’s Thesis.Graduate School, University of Southern Mindanao,Kabacan, Cotabato),
176
SURITA, FLOYD C. 2009. Leadership Behavior of SchoolAdministrators in
Relation to Organizational Climate as Perceived by theSubordinates of Kidapawan City Division . (UnpublishedMaster’s Thesis. Graduate School, Central MindanaoColleges,Kidapawan City
APPENDICES
177