The influence of adopting different strategies when answering TOEIC(R) listening items
11
JLTA Journal No.13 2010 B The Japan Language Testing Association The Influence of Adopting Different Strategies When Answering Listening Items Shizuka, Tetsuhito (Saitama University) Abstract This paper investigated the effects of the choice between two different strategies for solving TOEIC@ listening test part 4 type questions on item difficulties. The strategies focused were the preview-questions and answer-while-listening strategy and the Iisten-without-question-preview and answer-after-listening strategies. A group of 64 Japanese EFL under- or post-graduate solved 30 TOEIC part 4 type listening problems using either of the strategies. Rasch-based common item equating located these items on a single difficulty dimension with measurement error information. Even though a I test indicated no significant difference between the means, correlational analyses and 95% control line analyses suggested that the choice of different strategies did make a cJifference in the difficulty of each item as well as the exact nature of the construct tapped. Test-takers' perception of these strategies were also explored by examining their verbal comments, which indicated unanimous preference for question preview but divided opinions regarding while-listening answering. Based on these results, we argue that the current structure of TOEIC listening test part 4 poses a serious threat to its own test validity. Key Words: Test-taking strategies, Listening, TOEIC, Item difficulties, Rasch analyses 1. Introduction 1.1 The Beginning The conception of this study was prompted by a personal experience. Thirty-one years after its humble beginning in 1979 when only 2,773 took it (Trew, 2006). by 2007, the Test of English for International Communication (TOEIC@) had become something few university stuclents could afford to ignore. According to the Institute for International Business Communication, TOEIC Steering Committee, the number of applicants throughout Japan was larger than 1.630,000 in that year. Under the circumstances, it was difficult for the author, a university EFL teacher. not to feel slightly guifty about never having taken the test that he was expected to coach his students to prepare for. That sense of duty to experience firsthand what many of his students were going through pushed the author to sign up for the TOEIC March 2008 administration. Solving problems in a preparation book by Pifer and Takahashi (2006), the author had a sinking feeling to find out that the listening test part 4 posed an unexpected challenge. In that part, a test-taker reeds to listen, without taking any notes, to talks each of which sometimes lasts for almost a minute, and then answer multiple-choice questions about them. The problem was that it seemed impossible to memorize every minute detail delivered in those talks. Doing less than satisfactorily in a test meant for those who are leaming the langu[ ge that he -71-
Transcript of The influence of adopting different strategies when answering TOEIC(R) listening items

JLTA Journal No.13
2010
B 7.I-\~~gT ~ ,,~~ The Japan Language Testing Association
The Influence of Adopting Different Strategies When Answering TOEIC~ Listening Items
Shizuka, Tetsuhito (Saitama University)
Abstract
This paper investigated the effects of the choice between two different strategies for solving
TOEIC@ listening test part 4 type questions on item difficulties. The strategies focused were the
preview-questions and answer-while-listening strategy and the Iisten-without-question-preview and
answer-after-listening strategies. A group of 64 Japanese EFL under- or post-graduate lea~ners
solved 30 TOEIC part 4 type listening problems using either of the strategies. Rasch-based
common item equating located these items on a single difficulty dimension with measurement error
information. Even though a I test indicated no significant difference between the means,
correlational analyses and 95% control line analyses suggested that the choice of different strategies
did make a cJifference in the difficulty of each item as well as the exact nature of the construct
tapped. Test-takers' perception of these strategies were also explored by examining their verbal
comments, which indicated unanimous preference for question preview but divided opinions
regarding while-listening answering. Based on these results, we argue that the current structure of
TOEIC listening test part 4 poses a serious threat to its own test validity.
Key Words: Test-taking strategies, Listening, TOEIC, Item difficulties, Rasch analyses
1. Introduction
1.1 The Beginning
The conception of this study was prompted by a personal experience. Thirty-one years after
its humble beginning in 1979 when only 2,773 ~eople took it (Trew, 2006). by 2007, the Test of
English for International Communication (TOEIC@) had become something few university stuclents
could afford to ignore. According to the Institute for International Business Communication,
TOEIC Steering Committee, the number of applicants throughout Japan was larger than 1.630,000
in that year. Under the circumstances, it was difficult for the author, a university EFL teacher. not to
feel slightly guifty about never having taken the test that he was expected to coach his students to
prepare for. That sense of duty to experience firsthand what many of his students were going
through pushed the author to sign up for the TOEIC March 2008 administration.
Solving problems in a preparation book by Pifer and Takahashi (2006), the author had a
sinking feeling to find out that the listening test part 4 posed an unexpected challenge. In that part, a
test-taker reeds to listen, without taking any notes, to talks each of which sometimes lasts for
almost a minute, and then answer multiple-choice questions about them. The problem was that it
seemed impossible to memorize every minute detail delivered in those talks.
Doing less than satisfactorily in a test meant for those who are leaming the langu[ ge that he
-71-

was paid to teach would pose a serious threat to a non-native teacher's ego. After the disheartening
experience of missing several listening part 4 items, the author decided to seek expert advice. There
happened to be a perfect person to ask, sitting in a postgraduate Rasch measurement theory course
the author was teaching at that time: a then PhD student who had already achieved the maximum
score in the TOEIC and had authored a couple ofTOEIC preparation books.
The expert advice given by the doctoral student was rather surprising. He said that one
should not wait for a talk to finish before starting to answer the questions about it but answer them
as one listens to the talk. That means, ideally, by the time the talk is finished, all the questions about
it should have been answered. Therefore, while the questions about the talk that has just been
, delivered are being read aloud, one should be previewing the questions and answer options for the
next talk.
From then on, the author began trying the recommended strategy, which unfortunately did
not solve his problem. He found it confusing to skim the options and listen to the talk
simultaneously. When he was choosing from among the options to one question, he could not help
missing some bits of information that were being delivered at those moments, which were
sometimes crucial in correctly answering the next question. He seemed to get wrong even f!lore
items using this novel strategy than when he was not. Before long, therefore, the author gave up on
the recommended strategy, which did not seem to suit him for some reason, and reverted to the
listen-and-then-answer tactics.
This decision, after all, tuned out to be a wise one at least for the author. Having got used to
paying attention to the right parts of the talks, he succeeded in scoring in the top band of990 in that
administration. Thus, the author's case suggested that it is also possible to score hi~h using the
traditional strategy. The question was: Should he recommend the listen-and-then-answer strategy or
the answer-while-you-listen strategy to his students?
1.2 TOE!C Listening Test Part 4
In order to fully understand the point at issue, one needs to be aware of the exact structure of
the TOEIC listening test part 4. It consists of 30 multiple-choice questions, which constitllte the last
component of the 100-item listening test, which is combined with the 100-item reading test to
constitute the 200-item test. The 30 items in part 4 can be divided into ten groups of three items; ten
talks are delivered followed by three questions each. Table I illustrates the detailed structure and
timing of the part-initial directions, the first talk, and the three questions about it.
Seg
Tsk
Drtn
PO
30
2
p
3
Ref
5
4
p
5
talk
28-42
6
P
2
7
QI
5
8
P
8
9
Q2
5
10
P 8
II
<.)3
5
P 8
Seg: Segment, Tsk: Task, Drtn: duration, PO: Part Directions, p: pause, Ref: Referentidl statement,
Q I: the I sl question, Q2: the 2nd question, Q3: the 3rd question
-72-
The top row gives, for the ease of reference, the sequential number for each segment from 1
to 12; the middle row labels each segment; the bottom row specifies the duration of each segment
in rounded seconds. The duration figures are based on "otlicial" Practice Test 1 by Trew (2007),
which is "authorized by ETS®." At the beginning of part 4 (Segment I), general directions are
given as to what test-takers should do in this part, spending 30 seconds. After a I-second pause
(Segment 2), serial numbers of the questions regarding the talk that is about to begin an~ specified
("Questions XX to YY refer to the following talk."; Segment 3) using 5 seconds. After a I-second
pause (Segment 4), a talk (Segment 5) is delivered, the duration for which varies from 28 to 42
seconds. After the talk come three que5tions, each of which takes 5 seconds to be spoken (Segments
7, 9, and II). After each question, an 8-second pause is provided (Segments 8, 10, and 12). This
completes the segments related to the first talk, and after this come the Segments 3-12 related t? the
next talk. It should be noted that Segments 1-'2 in Table I are for the general directions for part 4 as
a whole, which are given only once at the beginning of the part. Therefore, the cycle 3-12 is
repeated ten times, giving a total often talks, before the listening test is completed.
1.3 Tactics Authorized by ETS®
The expert advice above turns out to be fully endorsed by the makers of the TOEIC
themselves. On the front cover of Tactics for TOEIC Listening and Reading Test (Trew, 2007) is a
statement that its "content is authorized by ETS®." The book gives the following "tips" (underlines
are by the author of the present paper) for taking listening parts: "Before each question is played,
preview the answer choices ... , and try to predict as much as you can about what you are going to
hear and what you need to listen."(p. 8). Specifically as to part 4, the book goes on to say, "The
questions and answer choices in this part of the test can help you predict what you are going to hear.
Using the time available to skim them before tistening will help you to identify the key parts of the
talk"(p. 20) "Do not wait for the voice to tell you. Answer quickly, then use the 35-40 seconds
between conversations to skim the neAt questions." "Focus on the answer choices ... as you listen.
Mark the best answer. Guess if you aren't sure, and move on to the next question." (p. 21)
What is suggested here is that, in terms of the segmental reference numbers in Table I .. the
test-takers should ignore the recorded directions and instead skim the questions and options
regarding the first talk, while Segments 1-3 are playing (a total of 36 seconds), and then mark the
answers for the S~gment 5 talk while it is being played. Then during Segments 6-12 (a total of 4 J
seconds) the testee should skim the questions and options regarding the next talk, before it is
played.
The tactics taught here clearly belong to what Cohen (2006) calls test-wiseness strategies as
opposed to test management strategies. Advice to ignore recorded directions and to preview
questions and options is quite commonly found in locally published TOEIC preparation books as
well (e.g., Miyazaki & Broukal, 2006; Ishii et aI., 2007; Calcote et aI., 2008).
-73-

1.4 Question Preview in Listening Comprehension Tests
It would seem obvious that those who listen to a talk knowing what specific points to listen
for are at an advantageous position over those who simply listen without any exvectations.
Research indicates that test-takers indeed do believe that is the case, but that whether or not that
actually is the case is open to question. Buck (1991) compared three test-takers wh'J previewed
questions with another three who did not. Introspections indicated that the testees generally agreed
that previewing the questions made it easier to answer questions. In Sherman's (1997) study on the
effect of changing the timing of presenting questions with Italian EFL undergraduate students, the
questions-before version produced almost exactly the same results as the questioris-after version,
even though subjective impressions in the questionnaires showed a fondness for pre-questions and
an aversion to post-questions, particularly so among less advanced students. Yanagawa (2004)
compared three conditions: previewing questions accompanied by answer options, answer options
without questions, and options without questions. He found that the participants, Japanese EFL
listeners, benefitted from the first condition significantly more than the third. Chang and Read
(2006) found in their study with Taiwanese EFL undergraduate students that question preview had a
powerful effect of facilitating listening comprehension. This effect, however, was moderated b~ the
learners' level of proficiency such that low listening proficiency participants could not benefit as
much. Shirane (2007) reported that presenting questions before a talk in an EFL multiple-choice
test did 1I0t necessarily result in higher performance than presenting them after the talk. He also
found that less able learners were more likely to benefit from reading the questions befort:hand.
1.5 The Price of While-Listening Answering
In the pre-question treatment in all the above studies, test-takers were allowed to answer
questions after the talk was finished. just like those in the post-question treatment were. That is. in
the pre-question treatment, the participants (I) previewed the questions, (2) listened to the talk; and
(3) answered the questions. consecutively. However, as illustrated above. what is endorsed
directly by Trew (2007) and indirectly by ETS is executing (2) and (3) simultaneously. rather than
consecutively. Because the TOEIC recording does not provide time for phase (I), one necessarily
needs to combine (2) and (3) if one wants to squeeze phase (I) in.
Thus. pragmatically, what needs to be compared with regard to TOEIC listening test part 4 is
not pre-question and post-question strategies by themselves. It is "pre-listening question-reading
followed by while-listening option-choosing" and "listening without question preview followed by
post-listening option-choosing." Even if previewing questions itself is beneficial for understan.ding
the talk better. answering questions while the talk is being delivered may well damage
comprehension and thus offset the benefit of qllestion preview. That was exactly what the author
felt was happening when he tried the recommended strategy, and there would be no reason to
believe 'that he was the only person to experience that. As Heaton (1988) points out. it can be
confusing to listen to the talk while rea~ing carefully through all the options and making their
selection (p, 85). To the best of the author's knowledge, no study has ever been conducted to
investigate the effect of question preview coupled with while-listening answering.
-74-
The purpose of this study was to examine possible performance differences that derive from
using two different strategies when answering TOEIC-part-4-type listening questions: the
after-listening strategy in which one listens to a talk and then answer questions at timings
designated by the recorded cues, and the while-listening strategy in which one previews questions
accompanied by answer choices and then listen to a talk, simultaneously marking answers. In
reality, relatively few test-takers would or could adopt the genuine form of either of these
strategies; most would likely preview questions to a certain extent, answer some questions while
listening. and answer some after listening. In this study. however. genuine forms of these strategies
were compelled on the participants in order to amplify potential differences between these two.
Specifically. the following research questions were addressed:
(I) Are the difficulties of TOEIC-part-4-type listening items affected by the choice between the
two after-listening !'trategy and the while-listening strategy? Does the proficiency level of the
test-takers moderate the relationship? If it does, in what way?
(2) What are test-takers' perception about relative effectiveness of the two strategies? Does the
proficiency level of the test-takers moderate their perception? If it does. in what way?
It was reasoned that the proficiency level could be a relevant factor because the picture is
emerging that proficiency plays a part in determining the degree to which the test-takers prefer
previewing questions (Sherman, 1997) and the extent to which they can actually benefit from that
strategy (Chang & Read, 2006; Shirane, 2007). A possibility was that more proficient learners
would not need the while-listening strategy as much as less proficient counterparts do. because they
can deal with questions and options well within the time frame provided after a talk.
2. Method
2.1 Participants
The participants of this study were a total of 64 post- and undergraduate EFL students at a
private university in western Japan. They were students enrolled in Advanced English II (a skills
course for sophomores). EFL Methodology" (a content course for sophomores). or Measurement
and Evaluation (a content course for MA students), all taught by the author. All of them participated
in the study as a course requirement. They were allotted to either Group A or Group W (see the
Data Collection section below) in such a way that the numbers of students in the two groups would
be as close as possible to equal.
Those taking EFL Methodology II (n = 26) were allotted to Group A. The 26 students in this
class included two graduate students who were also taking Measurement and Evaluation. Those
taking Advanced English" (n = 31) were allotted to Group W. The 31 students taking this course
also included two graduate students who were also taking Measurement and Evaluation. (The two
students in Advanced English \I and the two in EFL Methodology were different individuals.)
Graduate students enrolled in Measurement and Evaluation (n = 12) were divided; nine were
allotted to Group A and three to Group W. As mentioned above, of these 12 students. two w'ere
sitting in Advanced English II and another two were sitting in EFL Methodology II. 'i'hese four
took the test once in the respective undergraduate classes, and took the same test in Measurement
-75-

and Evaluation for the second time. The two who had taken the test as Group A members in EFL
Methodology II were allotted to Group W in Measurement and Evaluation and, conversely, the two
who had tak~n the test as Group W members in Advanced English II were allotted to Group A in
Measurement and Evaluation. The re<;ponse data of these students taking the test for the sf'cond
time were excluded from the main analysis. Their second-time data were used only to be compared
against their own first-time data. One student in Measurement and Evaluation was a native speaker
of English, who~e data were excluded from the analysis. As a result, the number of participants in
Group A was 32 (24 undergraduates and 8 graduates) and that in Group W was also 32 (29
undergraduates and 3 graduates).
2.2 Instruments
Simulated TOEIC-part-4-type items were taken from a practice book written by Pifer and
Takahashi (2006). Selected were 15 talks, each followed by three multiple-choice questions,
resulting in a total of 45 items. Talks were delivered aurally (in recording). Questions were
presented aurally (in recording) as well as visually (in writing). Options were visually presented
without any aural information. Rather than being printed in booklets as in a real TOEIC-taking
situation, questions and options were projected onto the center screen. This made it possible to
control the duration for which and the timing at which they could be read by the test-takers. This
arrangement was crucial to make sure that participants allotted to each strategy group would indeed
take the desiBnated strategy, not confounded with the other one.
2.3 Test-taking Conditions
The participants were made to answer the items under either of the following conditions:
After-listening (AFT) Condition This simulated a situation where a test-taker followed the
TOEIC directions at face value, by listening when a talk was being delivered and answering when
questions were being del ivered (see Table 2). Test-takers in this condition were allowed, first (I) to
skim, for five seconds, the three questions (without their answer options) related to the talk they
were going to listen to, and then, (2) just to listen to the talk without looking at anything or doing
anything else, and when the talk was finished, (3) to answer the multiple-choice questions as the
questions were read aloud with pauses in between. Test-takers in this condition had no choice but to
focus on listening when the talk was being delivered because questions and options were not being
displayed then.
Table 2. Structures of the WHL and AFT Conditions
AFT Condition
Recording Talk k delivered Qs for Talk k
de.livered
Test-taker Listen Listen/read and
choose answers
-76-
Talk k+1
delivered
Listen
Qs for Talk k +1
delivered
Listen/read and
choose answers
WHL Condition
Recording Talk k delivered Qs for Talk k Talk k +1 Qs for Talk k + I
delivered delivered delivered
Test-taker Listen and choose Pre-read Qs and Listen and choose Pre-read Qs and
answers about options for Talk k answers for Talk options for Talk k
Talkk +1 k+1 +2
While-listening (WHL) Condition This simulated a situation where the test-taker read the
questions and options before the talk started, and then, listened to the talk and answered the
questions simultaneously (see Table 2). Test-takers in this condition (I) read the questions and the
options for Talk k while the questions for Talk k -I were being read aloud, and (2) answered the
questions about Talk k as Talk k was being delivered. They had to finish answering all the questions
about Talk k by the time the Talk k finished, because the questions and options were displayed only
while the talk was being delivered. The moment Talk k finished, the test-takers needed to begin
pre-reading the questions and options for Talk k + I, ignoring the questions about Talk k being read
aloud.
2.4 Data Collection Procedures
Groups A and W both answered the first 15 items (Items 1-15) in the AFT condition.
Answered by both groups using the same strategy, these 15 items were expected to serve as the link.
Group A answered the remaining 30 items (ItemsI6-45) in the AFT condition, while Group W
answered them in the WHL condition. Table 3 illustrates these arrangements. After the completion
of the test, 29 undergraduate participants in Group W, who had just experienced both conditions,
were asked to very briefly write on the back of the answer sheet in their L I which strategy they
preferred and why. The test administration took place in one of the regular class sessions in
respective courses. The four graduate students who took the test twice, once as a Group A member
and once as a Group W member, were asked, within a week after their second sitting, to write some
reflections in their L I on the experience of taking the same test using the two different strategies.
For ease of reference, the data set produced by Group A answering Items 1-15 (using the AFT
strategy) will hereafter be referred to as data set A 15; that produced by Group W answering Items
1-15 (also u~ing the AFT strategy) as data set W15; that produced by Group A answering Items
16-45 using the AFT strategy will be referred to as data set A30; and that produced by Group W
answering the same 30 items as data set W30.
Table 3.
Participants, Items, and the Strategies Adopted
Items 1-15
Group A (n = 32)
Group W (n = 32)
AI5(AFT)
WI5 (AFT)
- -77-
Items 16-45 Items 16-45
A30 (AFT)
W30 (WHL)

2.5 Analysis
Our primary question was whether the same items (Items 16-45) would yield different
difficulties when different strategies were adopted to answer them. However, since Group A and
Group W mayor may not have been comparable in ability in the first place, direct comparison of
the raw scores produced by data sets A30 and W30 would not have answered our question. In order
to make person-free item calibration possible, applying the Rasch model (Rasch, 1960; Bond &
Fox, 2007) to joint-calibrate Items 1-45, with Items 1-15 serving as the link, was attempted using
Winsteps ver. 3.55 (Linacre, 2005).
Specifically, the following steps were taken.
( 1) Data sets A 15 and W IS were Rasch analyzed together to check for and, if necessary, delete
person or item misfits.
(2) With misfit persons or items, if any, removed, data sets A 15 and W 15 were Rasch analyzed
separately, which produced two sets of item difficulties that should be invariant if the items fit
the model. To check if this assumption was met, item difficulties from A 15 were plotted against
those from WIS. Any items outside the 95-percent control lines (Bond & Fox, 2007, p 86-90)
were scrutinized and, when judged appropriate, removed from the link.
(3) Data sets A 15, A30, W15, and W30 were joint analyzed to locate all the items on the same
difficulty dimension.
(4) With the secured link, item difficulties derived from data set A30, which represented difficulties
of the items when answered using the AFT strategy, and those computed based on uata set W30,
which were difficulties of the same items when the WHL strategy was adopted, were compared
using a paired I test and the 95-percent control line approach.
(5) A30 item difficulties and W30 item difficulties derived based on the responses by a higher
profi..:iency subgroup were compared in the same way. A30 item difficulties and W30 item
difficulties derived based on the responses by a lower proficiency subgroup were compared in
the same way.
(7) Strategy preferences expressed by undergraduate students and verbal comments by four
graduates students were qualitatively examined.
3. Results
3.1 Joint-analysis of A15 and W15
Table 4 shows part of the item statistics produced in the joint-analysis of data sets A 15 and
WIS. Items are arranged by outfit mean square values in the descending order. According to Smith,
Shumacker, and Bush's (1998) criterion, for sample size n = 64, the critical value for infit is 1.25
and that for {1utfit is \.75. The highest infit (Item 5; I. J 6) and the highest outfit (Item 4; 1.29) were
lower than these respective values. This means that none of these items met Smith et aI's criterion
to be judged misfit. However, it should ~e noted that Item 4 had a point-measure correlation
(PTMEA CORR.), which is the Rasch equivalent of point-biserial correlation, of .00, and that Item
-78-
5 had .07, both of which were rather low. We flagged these two items as possible problems, and
proceeded to the next analysis.
Table 4.
Part of the Item Statistics for A15 and W15 in Misfit Order
+-----------------------------------------------------------------------+
I ENTRY RAW MODEL I I NF IT I OUTF IT I PTMEA I I INUMBER SCORE COUNT MEASURE S.E. IMNSQ ZSTDIMNSQ ZSTDICORR. I Item I 1------------------------------------+----------+----------+-----+------1
I 4 12 64 1.00 .3311.14 .711.29 LIlA .001100041 I 5 27 64 -.24 .2711.16 2.011.20 1.BIB .071 100P51 I B 18 64 .44 .2911.05 .511.07 .51C .191 IOOOBI I 11 33 64 -.66 .2611.05 .711.06 .610 .251100111 I 14 25 64 -.10 .2711.04 .511.02 .21E .261100141 I 15 31 64 -.52 .2611.02 .311.02 .31F .291 100151
3.2 Separate Analyses of A15 and W15
To check for item invariance, data sets A 15 and W 15 were analyzed separately to produce
two sets of item difficulties. Part of the item statistics for set A 15 are shown in Table 5.
Table 5.
Part of the Items Statistics for A15 in Misfit Order
+-----------------------------------------------------------------------+
I ENTRY RAW MODEL I I NF IT I OUTF IT I PTMEA I I I NUMBER SCORE COUNT MEASURE S. E. I MNSQ ZSTD I MNSQ ZSTD I CORR. I It em I 1------------------------------------+----------+----------+-----+------1
I 4 7 32 .83 .4411.22 1.011.44 1.3IA-.llI100041 I 5 10 32 .31 .40 11. 19 1. 2 11. 22 1. 0 lB. 02 I 10005 I I 11 16 32 -.56 .3711.11 1.011.15 1.11C .161100111 I 4 32 1.54 .5411.05 .311.13 .410 .091100011 I 11 32 .16 .3911.07 .511.06 .41E .201100081 I 12 13 32 -.14 .3811.06 .511.03 .21F .241100121
In this analysis, Items 4 and 5 again appeared at the top of the misfit list. For the sample size n = 32,
the critical values for infit and outfit are 1.35 and 2.06, respectively. Even though these two items
did not quite meet this criterion for misfit, their point-measure correlations were again very low.
Particularly, Item 4 had a negative value of -.11.
Part of the item statistics from set WI5 is shown in Table 6. In this analysis, at the top of the
misfit list appeared Item 6 and, again, Item 5. Even though neither of these items met the above
mentioned criterion to be judged misfi~, Item 6's point-measure correlation was in the negative.
Thus, in terms of fit statistics, possible problem items were Items 4, 5, and 6. With these
three items flagged as candidates for removal, we then proceeded to difficulty-invariance analysis.
. -79-
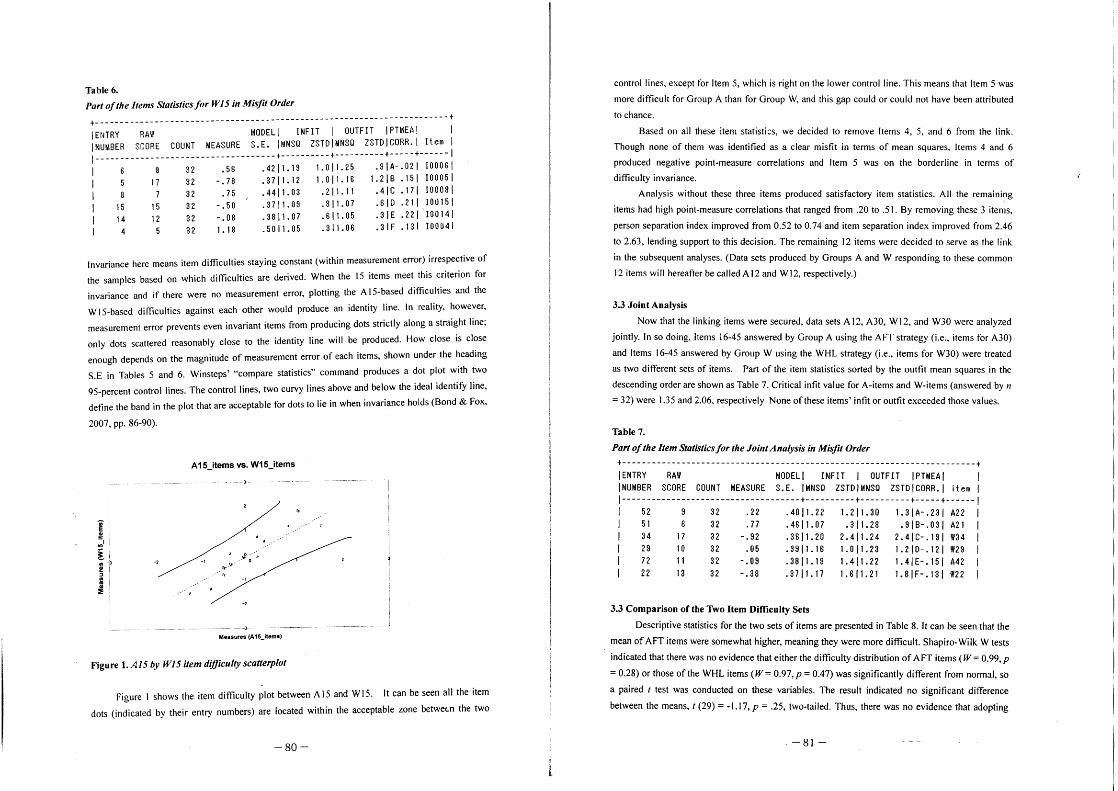
Table 6.
Part of the Items Statistics for W15 in Misfit Order
+-----------------------------------------------------------------------+ IENTRY RAW MODELl INFIT I OUTFIT IPTMEA! I I NUMBER SCORE COUNT MEASURE S. E. I MNSQ ZSTD I MNSQ ZSTD I CORR. I It em I 1------------------------------------+----------+----------+-----+------1 I 8 32 .56 .42 11. 19 1. 0 11. 25 .9 I A- .02 I 10006 I I 17 32 -.78 .3711.12 1.011.16 1.218 .151100051 I 7 32 .75 .4411.03 .211.11 .41C .171100081 I 15 15 32 -.50 .3711.09 .811.07 .61D .211.100151 I 14 12 32 -.08 .3811.07 .611.05 .31E .221 100141 I 4 5 32 1.18 .5011.05 .311.06 .31F .131100041
lnvariance here means item difficulties staying constant (within measurement error) irrespective of
the samples based on which difficulties are derived. When the 15 items meet this criterion for
invariance and if there were no measurement error, plotting the A IS-based difficulties and the
W IS-based difficulties against each other would produce an identity line. In reality. however.
measurement error prevents even invariant items from producing dots strictly along a straight line;
only dots scattered reasonably close to the identity line will be produced. How close is close
enough depends on the magnitude of measurement error of each items, shown under the heading
S.E in Tables 5 and 6. Winsteps' "compare statistics" command produces a dot plot with two
95-percent control lines. The control lines. two curvy lines above and below the ideal identify line,
define the band in the plot that are acceptable for dots to lie in when invariance holds (Bond & Fox,
2007. pp. 86-90).
A15_items vs. W15Jtems
J .,J.~.'~ .,#".I~'·
. "
Measures (A15_ltemst
Figure 1. A15 by W15 item difficulty scatter plot
Figure I shows the item difficulty plot between A 15 and W 15. It can be seen all the item
dots (indicated by their entry numbers) are located within the acceptable zone betwew the two
-80-
control lines, except for Item 5, which is right on the lower control line. This means that Item 5 was
more difficult for Group A than for Group W, and this gap could or could not have been attributed
to chance.
Based on all these item statisti::s, we decided to remove Items 4, 5, and 6 from the link.
Though none of them was identified as a clear misfit in terms of mean squares. Items 4 and 6
produced negative point-measure correlations and Item 5 was on the borderline in terms of
difficulty invariance.
Analysis without these three items produced satisfactory item statistics. All the remaining
items had high point-measure correlations that ranged from .20 to .51. By removing these 3 items,
person separation index improved from 0.52 to 0.74 and item separation index improved from 2.46
to 2.63, lending support to this decision. The remaining 12 items were decided to serve as the link
in the subsequent analyses. (Data sets produced by Groups A and W responding to these common
12 items will hereafter be called A 12 and W12, respectively.)
3.3 Joint Analysis
Now that the I inking items were secured. data sets A 12, A30, W 12, and W30 were analyzed
jointly. In so doing, Items 16-45 answered by Group A using the AFT strategy (i.e .• items for A30)
and Items 16-45 answered by Group W using the WHL strategy (i.e., items for W30) were treated
as two different sets of items. Part of the item statistics sorted by the outfit mean squares in the
descending order are shown as Table 7. Critical infit value for A-items and W-items (answered by n
= 32) were 1.35 and 2.06. respectively None of these items' infit or outfit exceeded those values.
Table 7.
Part of the Item Statistics for the Joint Ana(vsis in Misfit Order
+-----------------------------------------------------------------------+
IENTRY RAW MODELl INFIT I OUTFIT IPTMEAI I INUMBER SCORE COUNT MEASURE S.E. IMNSQ ZSTDIMNSQ ZSTDICORR. I item I 1------------------------------------+----------+----------+-----+------1
I 52 9 32 .22 .4011.22 1.211.30 1.3IA-.231 A22 I I 51 32.77.46 11. 07 .3 11. 28 • 9 I B- .03 I A2 1 I I 34 17 32 -.92 .3611.20 2.411.24 2.4IC-.191 W34 I I 29 10 32 .05 .3911.16 1.011.23 1.2ID-.121 W29 I I 72 11 32 -.09 .3811.19 1.411.22 1.4IE-.151 A42 I I 22 13 32 - • 38 • 37 11. 17 1. 6 11. 2 1 1. 8 I F - • 1 3 I W22 I
3.3 Comparison of the Two Item Difficulty Sets
Descriptive statistics for the two sets of items are presented in Table 8. It can be seen that the
mean of AFT items were somewhat higher, meaning they were more difficult. Shapiro-Wilk W tests
indicated that there was no evidence that either the difficulty distribution of AFT items (W = 0.99, p
= 0.28) or those of the WHL items (W= 0.97,p = 0.47) was significantly different from normal, so a paired t test was conducted on these variables. The result indicated no significant difference
between the means, t (29) = -1.17, p = .25, two-tailed. Thus, there was no evidence that adopting
. -81-

different strategies changed the mean item difficulty; the AFT items and the WHL items were of
comparabk: difficulty, as a whole.
Table 8.
Descriptive Statistics of Difficulty Estimates for AFT and WHL Items
k Mean SD Max Min
AFT items 30
WHL items 30
2.0
r I
1.5
I 1.0
0.5 I~ I
0.0 I,· -0.5 I -1.0 ,--1.5
0.14
-0.02
0.59
0.60
1.60
1.25
Figure 2. A30 versus W30 item difficulty plot by item
-0.91
-1.05
Skewness Kurtosis
0.47 -0.24
0.31 -0.58
However, it would be premature to conclude that the adoption of different strategies did not
meaningfully affect item difficulties, because examination of the behavior of each item revealed a
different picture. Figure 2 shows the two sets of difficulty values by item arranged in the entry
order. It appears to the naked eye that the relationship between the two sets was not very systematic.
In fact, Pearson correlation between the two sets of item difficulties was quite low at r = 0.18.
Figure 3 "hows the scattergram that plots AFT values against WHL values with 95% control lines.
Even when the "true" item difficulties are perfectly correlated at r = 1.00, measurement error
prevents the dots from falling along the identify line. The two control lines in Figure 3 indicate the
upper and lower boundaries between which items should fall when the "true" difficulties are the
same. When the invariance holds, 95% of, or 28-29 items should be between the boundaries. It can
be seen that only 25 items are inside the accepted zone; one (Item 16) is below the lower boundary,
three (Items 20, 24, 38) are above the upper boundary and one (Item 42) is right on the upper
boundary. This means that even when allowing for measurement error, Item 16 was "truly" more
difficult (p < .05) when answered in the AFT condition, and Items 20, 24, 38 (and possibly 42)
were "truly" more difficult (p < .05) when answered in the WHL condition.
Combined with the very low Pearson :' this boundary line analysis indicates that even though
the mean item difficulty was not significantly higher or lower as suggested by the / test result, there
were some significant changes in the difficulties of individual items.
-82-
A" ... ... ... .
.... . ... o q ... ~{
o· ",.f,Jo ,,' ~
'"' .. ... " ... ",'
Measures (A30_items)
Figure 3. A30 by W30 item difficulty scatterplot
3.4 Proficiency Levels
Next, we turned to analysis taking proficiency levels into consideration. Based on the number
right score on the common 12 items, the "high" proficiency group and the "low" proficiency group
were extracted from among the 64 participants as follows. It happened that there were 12 persons
who scored 7, 8, or 9 (9 was the highest). Six of them belonged to Group A and the other six to
Group H. These 12 persons were classified as the "high" group. On the lower end of the scale, there
were eight persons who scored I or 2 (I was the lowest), and II persons who scored 3. Out of these
II persons, four were selected quasi-randomly such that the same number of persons would
constitute the low-proficiency group. That is, six persons from Group A and six persons from
Group H who scored 1, 2, or 3 were chosen as the "low" group.
The same item analyses as wert! applied to the whole group data were carried out on the
responses from these low and high groups, separately. Descriptive statistics of item difficulties for
high and low proficiency groups adopting the AFT or the WHL strategies are presented in Table 9.
In each Rasch calibration run, the mean person ability was set at zero logits so that item difficulties
could float relative to the person abilities. This means the mean item difficulties In Table 9 are all
on the same scale in that they represent the difficulties of items when attempted by groups of the
same ability. It can be seen that both for High and Low groups, the same items tended to be easier
when the WHL strategy was adopted than when the AFT strategy was. This tendency was the same
as when all the participants were analyzed above.
A multivariate approach to the repeated-measures problem was taken, treating the strategy as
a within-observation variable and the proficiency as a between-observation variable. The results of
a MANOVA indicated that the main effect of proficiency was significant (F = 4.83, I, 58, p = .03),
while the main effect of strategy (F = 3.46, I, 58, P = .07) and the interaction (F = 0.0 I, I, 58, P
-83-

= .93) were not. This simply confirmed the obvious tendency that the same items were more
difficult for lower proficiency test-takers, irrespective of the strategy adopted.
Table 9. Descriptive Statistics for Item DifJicultiesfor High and Low Proficiency Groups
AFT Strategy WHL Strategy -------
Mean SD Mean SD
High Group
Low Group
0.88
1.37
lAO
0.92
0044
0.98
1.24
1.39
The scatterplot between difficulties of A30 items and W30 items as computed from the high
proficiency group data is shown in ~igure 4. As was the case with the whole group, Item 16 was t~r
below the lower contidence line, indicating that that this item was more difficult for test-takers m
the AFT condition, even when allowing for measurement error. On the other hand, Items 2G, 37,
and 44 were barely above the upper confidence line, meaning that these items were more difficult
for while-listening test-takers. The Pearson correlation was very low at r = .10.
The scatterplot derived from the low proficiency subgroup data is shown in Figure 5. For
these test-takers, it can be seen that no item was more difficult in the AFT condition. Two items
(Items 20 and 42) were more difficult in the WHL condition. The Pearson correlation was even
lower at r =.01.
Thus, among high proficiency and low proficiency groups, the picture seems to be similar to
when all the participants were analyzed. That is, even though the mean item difficility was not
significantly affected by changing test-taking strategies, the difficulties of individual items were, to
the extent that some items fell outside the 95% control zone.
A30_items vs. W30_items (High Proficiency)
J "~;.~ .... ····'''''.''5 ",.... .- .I,
.. -,
Measures (A30_items)
Figure 4. A30 by W30 difficulty scatterpl.ots for high proficiency test-takers
-84-
A30_items vs. W30_items (Low Proficiency)
J. ... ........
00 .....•• ; I ", ;'
-t.} ... ··.,., ..
...
Measures (A30_items)
Figure 5. A30 by W30 difficulty scatterplots for low proficiency test-takers
3.5 Preferences and Verbal Comments by Undergraduate Participants
Of the 29 undergraduate participants in Group W, who had experienced the AFT strategy to
solve items 1-15 and the WHL strategy to tackle items 15-40, eight students (28%) wrote that they
preferred the AFT strategy and 21 students (72%) answered that they liked the WHL strategy better.
The mean ability in logits of the AFT-preferring group (mean = -0.86 logits, sd = 0.63) and that of
the WHL-preferring grcup (mean = -0.82 logits, sd = 0045) were very close to each other, and a t
test revealed no significant difference, t (27) = O.20,p = .84, two-tailed.
Table 10.
Reasons Cited for Preferring One Stro1tegy over the Other
Reasons cited for preferring the WHL strategy
#1 Knowing in advance roughly what to expect is advantageous in listening.
#2 There b ample/little time to read options in the WHLlAFT condition.
Count
6
5
#3 It is easier to understand incoming information when looking at questions and options. 4
#4 It is difficult to skim questions within the five seconds before a talk starts. 3
#5 I cannot retain all the information I have understood until I answer questions.
#6 I can be more relaxed because I know roughly what to expect.
#7 I am just more used to this strategy.
Reasons cited for preferring the AFT strategy
#8 It is better to concentrate on listening when listening; it is confusing to listen and read
at the same time. 8
#9 I am just more used to this strategy.
·-85-

Reasons cited for their preference were analyzed by first identifying expressions that could
be classified as expressing the same or very similar propositions, and then counting the frequency
of each. Table 10 shows the results.
The reason cited most frequently for supporting the WHL strategy was that it helps them
understand the talk to know roughly what to expect (#1). This perception relates to the advantage of
previewing questions and answer options. The second most frequently expressed idea for preferring
the WHL strategy was that in the AFT condition the 8-second pause after each question was too
short for them to process four options and choose one of them (#2). Apparently muny of the
test-takers in this study felt that their reading rate was not fast enough to depend soiely on the AFT
strategy. The third most frequent comment was that looking at the questions and o!Jtions while
listening to the talk helped them understand the talk better (#3). Four students who preferred the
WHL strategy wrote to that effect. However, it is noteworthy that twice as many students, who
preferred the AFT strategy, expressed a contrasting view on that point. Eight students wrote that
they wanted to do one thing at one time, listening or reading, and that looking at the questions and
options disrupted, rather than helped, their listening comprehension.
3.6 Four graduate students who took both versions
As explained above, there were four post graduate participants who ended up taking part in
the experiment twice, once in the AFT condition and once in the WHL condition. This happened
because the data collection was conducted as an activity in regular courses, in which they happened
to be sitting. As mentioned above, their second-time responses were not included in the quantitative
analyses. I-:ere, just as a case study, their second-time data are compared with their first-time data
and their verbal comments on the experience are examined.
Two of them, students A and B first took the test in the WHL condition and then in the AFT
condition; the other two, students C and D experienced the test the other way round. Thdr number
right scores on items 16-40, for which strategies were differentiated, are shown in Table II.
Self-reported TOEIC scores indicated that the four students could be divided into two tiistinct pairs
(students A and C in 850-950 range; students Band D in 650-700 range), which was indeed
reflected in their number right scores. Student A's score improved from 13 (WHL) to 16 (AFT);
Student B's score did not change; Student C's score improved from 13 (AFT) to 15 (WHL); Student
D's score decreased by 2 points (9 in AFT to 7 in WHL).
Table 11.
Scores on items 16-40 by those who answered them both in AFT and WHL conditions
AFT
WHL
Student A Student B Student C Student D
16
13
9
9
13
15
9
7
Theil" comments clearly reflected their ability bands. More proficient A and C commented
that each strategy had their strong and weak points, which made it difficult to choose between them.
-86-
They were both for previewing questions, but both were against while-listening answering. Student
C wrote that, when taking real TOEIC listening part 4, she would try to preview questions
whenever possible but once the talk starts she would concentrate on listening, not looking at
questions or options. The while-listening question answering, she wrote, would do more harm than
good by causing her to miss important information. This comment was in a sharp contrast to those
made by students Band D, who categorically preferred the WHL strategy. Student D wrote that
listening to the talk while viewing questions and options helped her understand the talk better
because the words and phrases in v;ew compensated for her not-high-enough listening ability.
However, it should be noted that her score actually worsened from 9 (AFT) to 7 (WHL).
Apparently she was not aware of the price of while-listening answering to the same extent that
student C was. Another perception that was common to less proficient Band D but not shared by
more proficient A and C was that the 8-second pause provided after each question was not long
enough for them to read and understand all the four options and choose from among them. Here,
one deciding factor seemed to be reading proficiency. Less proficient students wanted to read the
questions and options before and while the talk was delivered in order to compensate for their
poorer reading proficiency. Student D herself was aware of the compensatory nature of her
preference, since she wrote that if her reading speed were much higher her preference might be
different.
4. Discus§ion
The first research question was: Are the difficulties of TOEIC-part-4-type listening items
affected by the choice between the after-listening strategy and the while-listening strategy? The
results of the present study did not produce a categorical answer to this question. First, the paired t
test conductt:d on the mean difficulty estimates for the same items attempted in two different
conditions indicated no significant difierence between them. Even though there was a tendency for
item difficulty values to be somewhat lower when answered in the WHL condition, statistical
significance was not reached. This might tempt us to conclude that item difficulties are not affected.
However, it seems misguided to jump to that conclusion based solely upon this t test result;
there were at least two pieces of evidence that suggested otherwise. One was the very low
non-significant Pearson correlation between the two sets of items, r = .18, P = .34. This,
corroborated by visual inspection of the scatter plots, suggests that there was practically no
systematic relationship between the two sets of item difficulties. What this means is that the
difficulty of an item answered in one condition is unpredictable from that of the same item
attempted in the other condition. This could be interpreted as implying that the same items taken
using two different strategies were no longer the "same" items that tapped the same construct.
The other was the fact that more than 5 percent of the item points lay outside the accepted
zone spedfied by the 95% control lines in the scattergram. One item was significantly more
difficult under the AFT condition while three or four items were significantly more difficult under
the WHL condition. (What about these items made them substantially change their difficulties are
possibly some features specific to these items, which were not of our primary interest and therefore
. -87-

not explored here.) Taken together, it seems more reasonable to conclude that which strategy to use
does affe~t the difficulty of each item, in directions that are difficult to predict, sometimes to the
extent that it becomes significantly more difficult, or less.
Regarding the effects of proficiency factor upon item difficulty fluctuation, the q Jantitative
data of this study did not suggest any clear pattern. Both at the higher and lower proficiency levels,
the mean difficulty value was slightly higher in the AFT condition, but it was only so to a
non-significant extent. Examination of Pearson correlations and the scatterplots suggested that at
both levels, the AFT-WHL difficulty relationships were practically random.
The second research question was: What are test-takers' perception about relative
effectiveness of the two strategies? The que:;tionnaire results suggested that the majority of the
test-takers preferred the WHL strategy, which is in line with the studies in the literature (Buck,
199 I; Sherman, 1997). At a closer look, this preference turned out to be not so much because the
learners could be looking at questions and options while listening as because they were allowed
time to preview questions and options and make some mental preparation for the talk to come. No
participants commented unfavorably about the opportunity to preview questions and options. On
the other halld, being allowed or compelled to read questions and choose options while listening to
the talk elicited polarized reactions, and it was rather unpopular than popular. More students wrote
that while-listening option-viewing damaged, rather than facilitated, their comprehension.
Proticien.:y level might have been at play in this regard: postgraduate students who explicitly
commented against option-viewing listening were clearly more proficient than those who
commented they embraced it.
To summarize, the results of this study suggest that the choice between the two test-taking
strategies seem to exert an influence that should not be disregarded on the difficulty of each item
and possibly on the type of construct each item taps. While test-takers seem to unanimously
perceive question previewing to be beneficial and advantageous, their perception of while-listening
option-viewing/choosing is divided, with less advanced learners considering it helpful and more
advanced counterparts tending to regard it as t;nnecessary or even distracting.
Before concluding this section, a limitation of this study needs to be mentioned. The degree to
which the while-listening answering strategy works for or against the listener should depend very
much on how the relevant information pieces are sequenced in the talk relative to the questions. If
a series of questions are laid out such that the answers are provided in the talk in the same order as
the questions are asked, and if those answers are spaced far enough apart from each other in the talk,
then the while-listening answering may not harm that much. On the other hand, if the order in
which the questions are asked and that in which the answers are provided do not match or if one
answer is provided immediately after another, then the while-listening answering is likely to fail. In
that sense, a closer look at specific items is essential in examining the relative influences of taking
the two strategies in question, which was outside the scope of this study. A further research in this
direction should be fruitful.
-88-
5. Implications and Conclusion
Based on the results of this study, the present author argues that the current structure of
TOEIC listening test part 4 poses a serious threat to its own test validity (Messick, 1995). Needless
to say, claims of test validity require attention to how the respondents arrive at their answers
(Cohen, 2006). Even when the test-takers aoopt the same strategy and choose the same answer
option to a multiple-ch0ice question, the processes involved can vary from test-taker to test-taker,
which makes it difficult to determine exactly what ability is being measured by that question (Wu,
1998). If there is room to adopt two (or more) clearly different strategies to answer a
multiple-choice question, the meanings of resultant responses will be even more opaque.
It is well possible that listening to a talk after previewing questions/options likely involves
somewhat different kind of cognitive processes than listening without any of such aides does, as
participants in Buck's (1991) study reported. The former may be more like selective
answer-sea:ching while the latter will involve exhaustive information gathering. In addition, it is
highly probable that listening to a talk while looking at and choosing from among answer options
involves a very different cognitive behavior than simply listening to the talk. The former has to do
with visual word-searching and decision making in addition to selective listening whik the latter
has to do with constructing and maintaining the mental representation of as many pieces of
information conveyed as one's memory capacity permits. Whether or not questions ancl options are
previewed, whether or not options are being looked at while the talk is being delivered. and
whether answer options are chosen during the talk or after the talk can combine to produce eight (2
x 2 x 2) different strategies. If an item can be answered through such a large number of different
cognitive processes, the correct answer arrived at by one person may well reflect different abilities
than that produced by another person.
There is absolutely nothing to blame individual test-takers for when they preview questions
and choose options while listening. They have every right to attempt whatever they believe will
boost their scores. as long as it is not prohibited. But one cannot help wondering if it is fair when
test constructors on the one hand prcduce a test in which the recorded directions on the surface
invite test-takers to do one thing (e.g., listen to the directions) and on the other hand endorse a
strategy to do something else (e.g., ignore the recording and preview questions instead).
If the test constructors deem question previewing desirable, then should they not make sure
that every test-taker has an equal chance to do so? If, on the contrary, they do not want test-takers to
preview questions or options, should they not see to it that no test-taker can? If they desire to
measure test-takers' ability to listen and read options simultaneously, should they not forcefully
make every test-taker to follow that procedure? If, on the contrary, they want test-takers to listen to
the whole talk and then answer, should they not prescribe a rule that prohibits while-listening
marking? We conclude this paper by arguing that establishing such rules to standardize test taking
conditions across all test-takers as strictly as is feasible would make TOEIC listening part 4 type
tests not only fairer but also more valid in the sense that what is being measured would then be
more transparent and hence interpretable.
--89-

References
Bond. T. G. & Fox. C. M. (2007). Applying the Rasch model. (2nd ed.). Mahwah. NJ: Lawrence
Erlbaum Associates.
Buck, G. (1991.). The testing of listening comprehension: An introspective study. Language Testing
8,67-91.
Calcote, A .• Sakikawa. N., Daito, S. Iwasaki, K .• & Daito, M. Strategic approaches to the TDEIC
test. Tokyo: Asahi Press.
Chang, A. e. & Read. J. (2006). The effects of listening support on the listening performance of
EFL learners. TESDL Quarterly, 40. 375-397.
Cohen, A. (2006). The coming of age of research on test-taking strategies. Language /~ssessment
Quarterly, 3, 307-331.
Heaton, J. B. (1988). Writing English language Tests. (2nd ed.). London: Longman
Ishii, T .• Yamaguchi, 0., Mawatari. H., Eidswick, J., & Koch, T. (2007). Complete tactics for the
TDEle test. Tokyo: Seibido
Linacre, J. M. (2005). WINSTEP$ (Version 3.55) [Computer software].
http://www.winsteps.com/winsteps.htm.
Messick, S. (1995). Validity of psychological assessment: Validation of inferences from persons'
responses and performance as scientific inquiry into score meaning. The American Psychologist.
50,741-749.
Miyazaki. M. & Broukal. M. (2006). Intensive trainingfor the TDEIC test. Tokyo: Seibido.
Pifer. G W. & Takahashi, M. (2006). Shin TDEIC tesuto supaI' moshi 600 man (New TOEIC 600
super mock questions). Tokyo: ALe.
Rasch, G (1960). Probabilistic models for some intelligence and attainment tests. Copenhagen:
Denma~k Institute for Educational Research (Expanded edition, 1980. Chicago: University of
Chicago)
Sherman, J. (1997). The effect of question preview in listening comprehension tests. Language
Testing. 14, 185-213.
Shirane, H. (2007). The effects of presenting questions before passages in listening tests of various
text characters on test takers of different levels. Unpublished MA thesis. Saitama University.
Japan.
The Institute for International Business Communication, TOEIC Steering Committee 2008 (2008).
TOEIC test data and analysis 2008.
Trew, G (2006). A teacher's guide to TDEle Hstening and reading test: PreparinR your students for
success. Tokyo: OUP Japan.
Trew, G (2007). Tactics for TDEIC listening and reading test. Oxford: Oxford University Press.
Wu, Y. (1998). What do tests of listening comprehension test? - A retrospection study of EFL
test-takers performing a multiple-choice task. Language Testing, 15.21-44.
Yanagawa, K. (2004). Tac;hi sentaku shiki risuningu tesuto no mondaibun to sentakushl no teiji jiki
ga tesuto pafoomansu ni ataeru eikyo (The effects of changing question-option-preview timings
in a multiple-choice listening test). STEP Bulletin, 16,30-42.
-90-