Preoperative incentive spirometry for preventing postoperative ...
Upload
independentCategory
view
1download
0
The Incentive Effects of Affirmative Action in a Real-Effort Tournament
Caterina Calsamiglia Jörg Franke1 Pedro Rey-Biel U. Autònoma de Barcelona TU Dortmund U. Autònoma de Barcelona
First draft: June 17, 2009
This version: July 20, 2009
Abstract
Affirmative-action policies bias tournament rules in order to provide equal opportunities to a group of competitors who have a disadvantage they cannot be held responsible for. Critics argue that they distort incentives, resulting in lower individual performance, and that the selected pool of tournament winners may be inefficient. In this paper, we study the empirical validity of such claims in a real-effort pair-wise tournament between children from two similar schools who systematically differ in how much training they received ex-ante in the task at hand. Our results show that performance was not reduced for either advantaged or disadvantaged subjects and that it was in fact enhanced. Additionally, while affirmative action balanced the proportion of disadvantaged individuals winning their respective tournament, the average performance of the pool of winners only decreased slightly. Keywords: Affirmative action, tournament, real-effort, experiment, sudoku. JEL classification: C72; C91; J78; M52
We are especially grateful to Antoni Calvó-Armengol for his support and encouragement on this project. We thank Jose Apesteguia, Miguel A. Ballester, Carmen Beviá, Jeanette Brosig, Antonio Cabrales, Marta García-Matos, Maureen Gleeson, Uri Gneezy, Guillaume Haeringer, Nagore Iriberri, Inés Macho-Stadler, Muriel Niederle, Carmit Segal, Tom Palfrey, Neslihan Uler and seminar audiences at Rady School of Management, UC San Diego, Yale University, Universidad Pablo de Olavide, Università di Padova, Universidad de Navarra, Universität Trier, Universitat Autònoma de Barcelona, IMEBE (Alicante), ESA Tucson 2008, IESA Washington 2009 and the Conference in Memoriam of Antoni Calvó-Armengol for their comments. We are deeply grateful to the directors, faculty and administrative personnel at Agora, Aula, Colegio Alemán, Emili Juncadella, Pegaso and Sagrado Corazón for their understanding, permission and help with the experiments. We thank Pau Balart, Julen Berasaluce, Ignacio Fernández, Markus Kinateder, Tomasso Majer, Luca Merlino and Natalia Montinari for their help in running the experiments. Caterina Calsamiglia acknowledges financial support by a Ramón y Cajal contract of the Spanish Ministerio de Ciencia y Tecnología, through the Spanish Plan Nacional I+D+I (SEJ2005-01481, SEJ2005-01690 and FEDER), and through the “Grupo Consolidado de tipo C” (ECO2008-04756), the Generalitat de Catalunya (SGR2005-00626 and the Barcelona Economics Program of XREA), and the Consolider-Ingenio 2010 (CSD2006-00016) program. Jörg Franke acknowledges financial support from Ministerio de Educación y Ciencia (SEJ2005-01481/ECON) and FEDER, from Generalitat de Catalunya (2005SGR00454) and from Universitat Autònoma de Barcelona. Pedro Rey-Biel acknowledges financial support from Ministerio de Educacion y Ciencia (SEJ2006-00538 and Consolider-Ingenio CSD2006-00016), Barcelona GSE Research Network and of the Government of Catalonia (2005SGR-00836). Caterina Calsamiglia. Universitat Autònoma de Barcelona. Department d´Economia i d´Historia Econòmica. 08193, Bellaterra. Barcelona (Spain). E-mail: [email protected]. 1 Jörg Franke, Department of Economics and Social Science, TU Dortmund, 44227 Dortmund, Germany. Tel.: (+49) 231 755 3246. E-mail: [email protected]. Pedro Rey-Biel. Universitat Autònoma de Barcelona. Department d´Economia i d´Historia Econòmica. 08193, Bellaterra. Barcelona (Spain). Tel: (+34) 935812113. E-mail: [email protected].
2
1. Introduction
In many selection processes such as university admissions, job promotions and
procurement auctions the competition generated serves the important purpose of
identifying the highest-ability individuals and facilitating the correct allocation of talent
in society. This objective may not be achieved if some talented individuals are
discriminated against and do not have the same capacities to compete. For example,
talented students from poor economic backgrounds may have attended high schools that
receive less funding, which may affect their SAT performance and hence their
university admission. Likewise, some individuals may belong to historically
discriminated groups, and have to overcome major obstacles in order to be on an equal
footing to compete.
Affirmative Action policies (AA) have two main objectives: to guarantee that
positions are fairly allocated in society and to allow for the correct identification of
talent. AA policies take proactive steps to provide equal opportunities to discriminated
groups that have a potential disadvantage.2 They are often implemented by biasing
tournament rules in order to increase the probability of success of a disadvantaged
group. For example, a fixed lump-sum bonus of 20 (out of 150) points was added to the
score of minority applicants to the undergraduate program at the University of Michigan
and a similar but “unofficial lift” scheme is used at many top universities.3 In public
procurement auctions bid preferences are granted in a multiplicative way. For example,
road construction contracts in California are auctioned off by granting a 5% reduction of
the submitted bid to small business enterprises.
The implementation of AA is usually accompanied by intense public debate
focusing on whether such policies satisfy certain fairness criteria and on the possible
incentive distortions they may create. Abstracting from fairness considerations,
opponents of AA base their criticism on two grounds. First, advantaged individuals may
be discouraged by the preferential treatment of their (disadvantaged) rivals, leading to
lower performance. Consequently, disadvantaged individuals may anticipate this
reaction by their opponents or perceive AA as a substitute for their own effort, also
2 Merriam-Webster Online defines affirmative action as “an active effort to promote the rights or progress of minority groups or other disadvantaged persons”. 3 This procedure was recently ruled to be unconstitutional by the Supreme Court, due in part to alleged distortionary effects on incentives that such compensation may create. State funded universities such as California, Florida and Texas have also applied similar measures in the past.
3
leading to lower performance.4 Second, opponents argue that the pool of selected
individuals, that is, the pool of winners, may be of poorer quality since lower-
performing individuals may now be selected. On the other hand, advocates of AA argue
that leveling the playing field in a competitive environment may have positive effects
on performance because AA reduces the asymmetry in capacities to compete, which
increases competitive pressure and therefore enhances performance.
Surprisingly, both positions fail to base their views on solid empirical findings since
very little research in economics provides empirical evidence on whether AA improves
or worsens performance or on how it affects the pool of selected individuals.5 In this
paper, we present results from a pair-wise real-effort tournament in which there exists a
naturally induced source of disadvantage for one group of competitors, and where two
different types of AA policies are implemented to compensate for it.6
We designed pair-wise tournaments among children from two similar schools which
differ in how experienced their students are in the real-effort task on which the
competition is based, i.e., solving simple numerical puzzles known as “sudokus.”7
Students in one school (“experienced”) are taught how to solve sudokus as part of their
regular math classes, while students in the other school (“non-experienced”) are not.8
The schools are very similar in other relevant respects: both are private, fully bilingual
and have good records in national math and science competitions. Therefore, the
difference in experience can be regarded as an exogenous source of disadvantage since
it is most likely not the reason why parents chose one particular school over the other.
First, we study whether knowing that such an asymmetry in experience exists affects the
performance of both experienced and non-experienced individuals. To study this
question we adopt a baseline treatment where no AA is implemented and where subjects
were unaware of the existence of an asymmetry in experience. We compare the
4 See, for example, the introductory remarks in Sowell (2004) and the discussion in Fryer and Loury (2005b) of “Myth No. 3: Affirmative action undercuts investment incentives”. 5 One exception is Schotter and Weigelt (1992), which we discuss below. Also, see Holzer and Neumark (2000) for a survey. 6 We chose pair-wise tournaments versus multiple-prize tournaments with N players for several reasons. First, and most importantly, the schools involved did not want us to establish intra-school competitions. Second, we wanted all subjects to be equally uninformed about the possible performance of their rivals. Finally, it allows us to relate our results to the existing theoretical models on pair-wise tournaments using AA. 7 Sudoku is a logic-based number-placement puzzle. The objective is to fill a 9x9 grid so that each column, each row and each of the nine 3x3 boxes contains one-digit numbers from 1 to 9 only once. The puzzle setter provides a partially completed grid. We use a simplified 4x4 grid version in order to obtain sufficient variability in performance. 8 Coate and Loury (1993) show how discrimination may arise in two symmetric groups as a self-fulfilling prophecy. In our case the asymmetry is exogenously given.
4
respective results with an alternative treatment where the difference in experience is
made salient. Second, in treatments where subjects are aware of the asymmetry in
experience, we implement two types of compensation—lump-sum and proportional
bonuses—designed to equalize on average the probability of non-experienced students
beating their experienced rivals.9 We then study how performance by students from
both schools is affected by the implementation of AA and whether the output of the new
pool of tournament winners differs from the one obtained without any form of
compensation.
The closest theoretical papers that explicitly address the incentive effects of
affirmative action are Fu (2006), Franke (2008), Balart (2009) and Hickman (2009).
They model affirmative action as a bias in favor of ex-ante disadvantaged players in an
all-pay auction or contest set-up. Except for Hickman (2009), and in line with the
simple model we present in Section 3, the conclusion that can be drawn from these
papers is that reducing asymmetry in competitive advantage tends to enhance individual
performance.10 Also, Fryer and Loury (2005a) show that optimal affirmative action in
winner-take-all tournaments should involve handicapping. This result is not restricted to
the affirmative action framework since similar results were first established for rank-
order tournaments in Lazear and Rosen (1981), or for optimal auctions in Myerson
(1981), where it is shown that favoring weak players might induce efficient allocations
or maximization of expected revenue, respectively.11
There is a large empirical literature on tournaments and specifically on how the size
of prizes affects competition (see Prendergast (1999) for a survey). With respect to
affirmative action in tournaments, Niederle et al. (2008) study the effects of quotas on
tournament participation of women. Miller and Segal (2008) analyze the long-term
effects of affirmative action on the pool of hired law enforcement officers in the US.
Finally, in the context of road construction contracts, Krasnokutskaya and Seim (2007)
and Marion (2007) show that bid preferences for small businesses, in addition to
balancing the asymmetry of entrants, induce higher procurement costs because the entry
decisions of large low-cost firms are distorted.
9 Calsamiglia (2009) shows that an appropriately designed AA policy should equalize rewards to effort whenever the set-up affects one of many factors determining individual final welfare. 10 Hickman (2009) introduces an adapted equilibrium concept to conclude that lump-sum AA measures worsen performance in the context of an asymmetric all-pay auction with infinite players and prizes. 11 Che and Gale (1998) study how in an all-pay auction with asymmetric players the inclusion of a cap on the size of bids may increase both players’ bids.
5
Schotter and Weigelt (1992) study the incentive effects of AA in experimental
tournaments in a laboratory set-up where effort exertion is modeled as an individual
decision problem based on monetary costs. Subjects’ exogenous disadvantage is
induced by assigning different cost parameters for which individuals are later
compensated by affirmative action. This procedure makes it possible to vary the size of
the asymmetry and tailor the compensations in order to exactly level the playing field.
In line with the theoretical predictions in Section 3, the results obtained indicate that AA
can either boost or worsen performance depending on the sizes of the cost disadvantage
and the compensation implemented. In our study, the incentive effects of AA policies
are analyzed in a real-effort tournament where the asymmetry between subjects existed
ex-ante and was not induced by the experimentalist. Since we did not have an exact ex-
ante measure of the size of the asymmetry, we relied on results from pilot experiments
to roughly calculate two different types (and sizes) of compensations, which on average
level the playing field.12
The subjects in our experiment were school children. They were unaware that their
choices were the object of a study since the experiment was presented as an extra-
curricular activity of a type not uncommon in the schools we selected. Using children as
subjects has additional advantages: they react very spontaneously in competitive
situations; their performance is not affected by them questioning the underlying
motivation of the experimentalist; and it is relatively easy to provide them with
incentives. It has also been shown that children react rationally and in line with
economic theory (see Harbaugh et al. (2001) and Harbaugh and Krause (2000)). Finally,
studying how children react to affirmative action is important since many social
asymmetries may be ideally resolved at these early ages, before they are exacerbated.13
The experimental results of our study suggest that the implementation of AA
policies does not necessarily have an adverse effect on the performance of affected
individuals. First, we find that knowledge of the existence of an asymmetry in ability in
fact increases performance. Most importantly, when such asymmetry is corrected
through AA policies, performance by both advantaged (experienced) and disadvantaged
(non-experienced) individuals increases even more. We show that increases in
12 Several recent experimental studies employ similar strategies based on naturally occurring differences in characteristics among social groups. Examples are Hoff and Pandey (2006), where social caste differences are exploited, as well as Gneezy et al. (2003), and Niederle and Vesterlund (2007), where the performance of women versus men and their respective propensity to compete in mixed-gender tournaments is analyzed. Niederle et al. (2008) combine this insight on gender differences with participation decisions by individuals in an affirmative-action framework based on gender quotas. 13 Gneezy and Rustichini (2004) show that boys and girls react differently to competition at a young age.
6
performance differ depending on individual level of ability. In particular, non-
experienced individuals with relatively higher ability and experienced individuals with
relatively lower ability exhibit the largest increases in performance, which may be
explained by the fact that they are the ones most directly affected by the implementation
of AA. We also find that AA affects boys and girls differently depending on their
ability, and that it positively increases the confidence in winning of non-experienced
subjects, while that of experienced subjects is unaffected. Finally, we show that the
average performance of tournament winners selected through AA is only marginally
lower than the average performance of the winners who would have been selected
without it.
The rest of the paper is organized as follows. Experimental design and
procedures are explained in Section 2. Section 3 describes a theoretical model that
illustrates the effects that the type and extent of affirmative-action policies may have on
performance. Section 4 presents the results. Section 5 sums up our conclusions. The
Appendix contains the instructions used in the experiment.
2. Experimental Design and Procedures
We conducted pair-wise tournaments among 337 school children, aged 10-13,
from two similar non-religious, bilingual private schools located in the same upper-class
neighborhood of Barcelona. Students at both schools have a systematic difference in
experience of a specific real-effort task consisting in solving simple “sudokus”. This ex-
ante difference in experience is due to the fact that during regular math classes, students
in the “experienced” school (E) are trained in solving sudokus (and in fact have to solve
sudokus as part of their regular homework) while students at the “non-experienced”
school (NE) are not.14
Each student from E was randomly and anonymously matched with a student
from NE in his or her same school year (4th or 6th grade). Each pair competed in a
tournament that lasted 30 minutes. Subjects had to solve as many simple 4x4 sudokus as
possible correctly in order to beat their matched rival. To do so, a whole grid had to be
filled in with numbers from 1 to 4 in such a way that the same number could only
appear once in each column, row or box in the grid. We chose this task because the 14 An ex-post experimental questionnaire showed that some students from both schools were familiar with sudokus due to private experience. In fact, results from pilot experiments, in addition to the present one, show that subjects from NE were in fact disadvantaged in the competition (see section 4.1). The task was defined as “filling in a grid” and the word “sudoku” was never mentioned.
7
rules are simple, yet it requires substantive logical reasoning and concentration by the
subjects. Additionally, performance is easy to measure and, crucially, depends on effort.
Most importantly, both effort and ability play a role, so that non-experienced subjects
still have a chance of winning, independently of whether they are favored by an
affirmative action policy or not.15
All subjects were handed the same answer sheet containing 96 sudokus
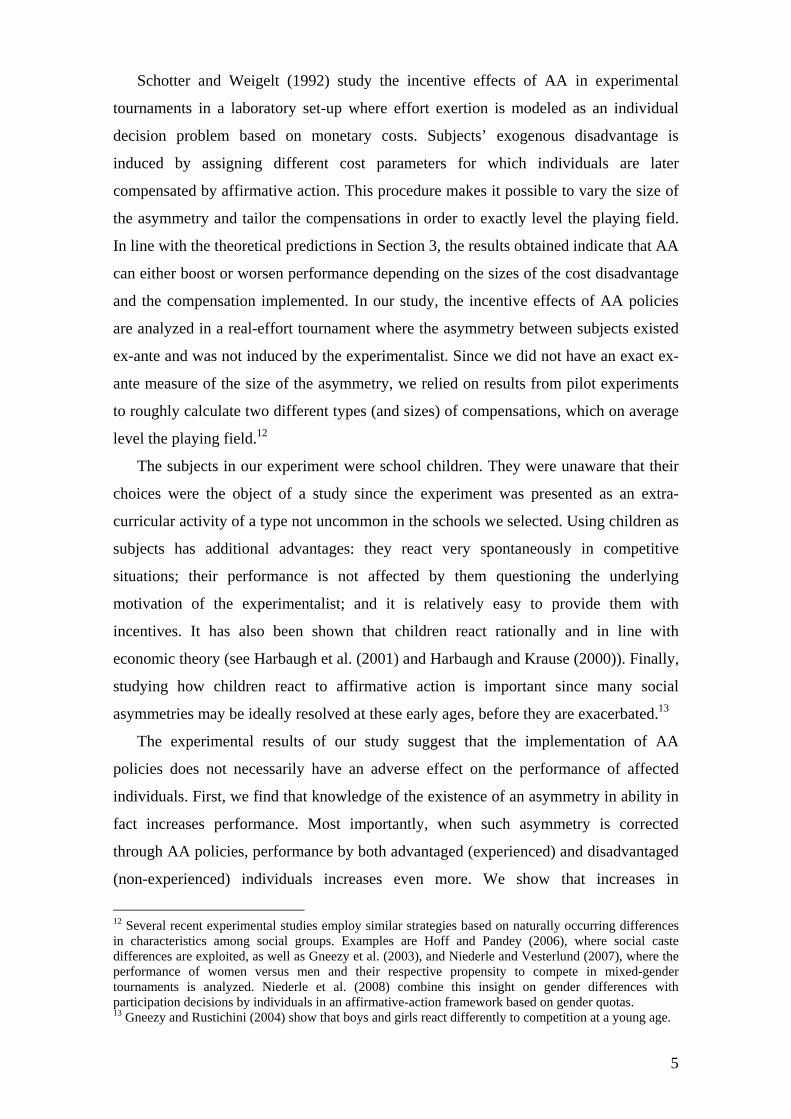
randomly generated with the same level of difficulty by a computer program.16 Figure 1
below shows one of the sudokus used in the experiment (a) and its solution (b).
(a) Unsolved Sudoku (b) Correctly Solved Sudoku
Figure 1: An example of the real-effort task (sudoku).
Each pair of subjects was competing for a 7€ (euro) voucher from a bookshop
located in Barcelona.17 In each pair, the student who had correctly solved more sudokus
during a 30 minute period won the voucher. In the case of ties, the winner was decided
randomly.
Our objective was to study: 1) the effect of providing information on
competitors’ previous experience with the task and 2) the effect of implementing
affirmative action policies on subjects’ performance and as a result, on the output
generated by subjects selected as tournament winners. Thus we randomly assigned
similar numbers of subjects from each school to each of six treatments. In treatment NK
no subject was informed about whether subjects from the other school were experienced
or not in solving sudokus. In treatment K students at the NE school were told that
15 In fact, the percentage of NE winners in their respective tournament was at least 13.3% (for experimental treatment “K” and 4th year students, where no affirmative action was implemented). 16 The software used was “SuDoku Pro” by Dualogy Systems. The proportion of mistakes across all solved sudokus was similar. No subject was able to complete all 96 sudokus provided. 17 Subjects were explicitly told that the voucher was redeemable for “books, collector’s cards, toys, music or comics”. Experiments took place at approximately the time the final Harry Potter book was published in Spain.

8
students in the E school had previous experience in solving sudokus. Similarly, students
in the E school were told that students at the NE school were not taught how to solve
sudokus. In the remaining four treatments all subjects were informed about the
difference in experience across schools and about the particular affirmative action
policy applied to NE subjects. In treatments LH (Lump-sum High) and LL (Lump-sum
Low), NE subjects were given a predetermined number of solved sudokus ex-ante: 20 in
LH and 8 in LL. In treatments PH (Proportional High) and PL (Proportional Low), NE
subjects were given a number of solved sudokus proportional to the number of sudokus
they correctly solved, one for every correctly solved one in the case of PH, and one for
every two correctly solved ones in the case of PL. Comparisons across treatments NK
and K allow us to study the effects of information when no affirmative action policies
are implemented. Since, contrary to our expectations and as we shall show below, we
did not find significant differences across all treatments where affirmative action is
implemented (LL, LH, PL, PH), we shall pool the data from such treatments and refer to
them generically as the “AA treatment”. Table 1 summarizes our treatment design.
Comparisons across treatments K and AA allow us to study the effect on performance
of applying affirmative action policies once the asymmetry in experience is known.
The sizes of the affirmative action policies were determined using results from
pilot experiments. Since we were unaware of the exact size of the asymmetry between
groups, we opted to choose two different sizes of each AA policy so that we could
potentially observe how different sizes affect performance. At the same time, the
objective was to design compensations that would on average equalize the chances of
winning once the subjects reacted to the applied affirmative action policies. As shown
below, on average the implemented policies roughly induced a “level playing field” ex-
post (49% of subjects from the NE school actually won their respective tournaments).
Table 1: Description of Treatments
Not Know NK Subjects unaware of others’ experience
Know K Subjects aware of others’ experience
Lump-sum High LH Subjects aware of experience and NE subjects receive a bonus of 20 correct sudokus bonus
Lump-sum Low LL Subjects aware of experience and NE subjects receive a bonus of 8 correct sudokus bonus
Proportional High PH Subjects aware of experience and NE subjects receive 1 correct sudoku bonus for every 1 correct
Proportional Low PL Subjects aware of experience and NE subjects receive 1 correct sudoku bonus for every 2 correct
Prior to conducting the experiments, we repeatedly met with faculty from both
schools in order to guarantee their collaboration and pedagogical interest in the project.
During these meetings we obtained information on subjects’ gender, birth date, teaching
9
group and school grades. We later assigned subjects to treatments in such a way that the
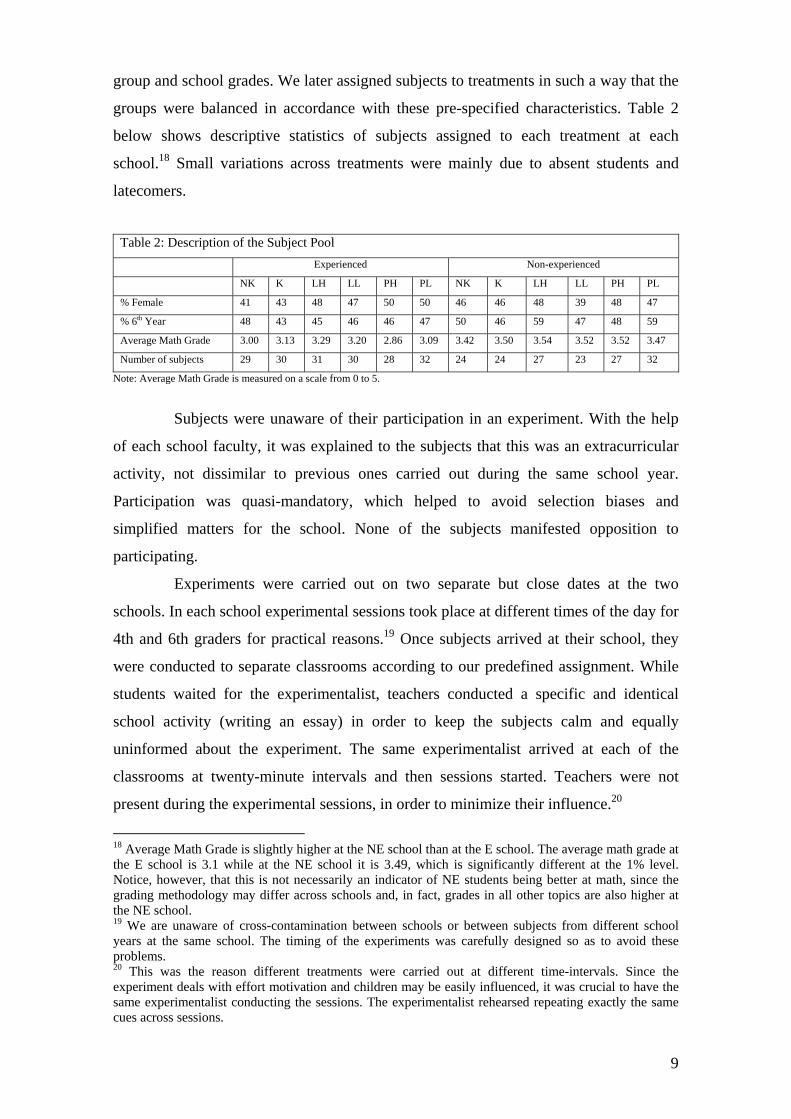
groups were balanced in accordance with these pre-specified characteristics. Table 2
below shows descriptive statistics of subjects assigned to each treatment at each
school.18 Small variations across treatments were mainly due to absent students and
latecomers.
Table 2: Description of the Subject Pool
Experienced Non-experienced
NK K LH LL PH PL NK K LH LL PH PL
% Female 41 43 48 47 50 50 46 46 48 39 48 47
% 6th Year 48 43 45 46 46 47 50 46 59 47 48 59
Average Math Grade 3.00 3.13 3.29 3.20 2.86 3.09 3.42 3.50 3.54 3.52 3.52 3.47
Number of subjects 29 30 31 30 28 32 24 24 27 23 27 32
Note: Average Math Grade is measured on a scale from 0 to 5.
Subjects were unaware of their participation in an experiment. With the help
of each school faculty, it was explained to the subjects that this was an extracurricular
activity, not dissimilar to previous ones carried out during the same school year.
Participation was quasi-mandatory, which helped to avoid selection biases and
simplified matters for the school. None of the subjects manifested opposition to
participating.
Experiments were carried out on two separate but close dates at the two
schools. In each school experimental sessions took place at different times of the day for
4th and 6th graders for practical reasons.19 Once subjects arrived at their school, they
were conducted to separate classrooms according to our predefined assignment. While
students waited for the experimentalist, teachers conducted a specific and identical
school activity (writing an essay) in order to keep the subjects calm and equally
uninformed about the experiment. The same experimentalist arrived at each of the
classrooms at twenty-minute intervals and then sessions started. Teachers were not
present during the experimental sessions, in order to minimize their influence.20
18 Average Math Grade is slightly higher at the NE school than at the E school. The average math grade at the E school is 3.1 while at the NE school it is 3.49, which is significantly different at the 1% level. Notice, however, that this is not necessarily an indicator of NE students being better at math, since the grading methodology may differ across schools and, in fact, grades in all other topics are also higher at the NE school. 19 We are unaware of cross-contamination between schools or between subjects from different school years at the same school. The timing of the experiments was carefully designed so as to avoid these problems. 20 This was the reason different treatments were carried out at different time-intervals. Since the experiment deals with effort motivation and children may be easily influenced, it was crucial to have the same experimentalist conducting the sessions. The experimentalist rehearsed repeating exactly the same cues across sessions.
10
The experimental sessions lasted one hour. First, the experimentalist read out
general instructions on how to solve sudokus (see “Pre-instructions” in the Appendix).
Then, subjects had a five-minute practice round to solve sudokus. After this period, the
experimentalist solved one of the practice sudokus in front of the students. Once
questions were clarified, instructions for each of the treatments were read out. The
instructions made it clear that each student was competing against an anonymous
student from another comparable school and that students at the other school were
systematically experienced (or not) in solving sudokus (for treatment NK this
information was omitted). This difference in ex-ante experience was explicitly
mentioned and was used to justify the implementation of the affirmative action bias in
favour of the non-experienced group in treatments LL, LH, PL, and PH (see the
Appendix for the instructions for one of these treatments). Tournament rules were
explained giving numerical examples (specific to each treatment) for all potential
outcomes of the tournament, i.e., losing, winning, and tying. Moreover, aggregate
information with respect to the number of sudokus (i.e., mean, minimum and
maximum) that had been correctly solved by a comparable subject pool was provided.
This information, identical for all subjects, was based on the results of our pilot
experiments. The experimentalist also held up a 7€ voucher to increase the credibility of
the prize offered to tournament winners. After that, subjects had thirty minutes in which
to solve the sudokus in two separate handouts. After the first fifteen minutes, subjects
were instructed to start working on the second handout, so that we could measure
whether there were intra-session learning effects or whether these were over-ruled by
fatigue.21 Subjects were explicitly told that they could stop solving sudokus and start
any other activity, such as drawing, so long as they kept quiet and did not bother others.
After the thirty minutes had passed, the handouts were collected and a questionnaire
about previous experience in solving sudokus, self-confidence measures and the
perceived justice behind affirmative action policies was distributed. Once the
questionnaires had been filled in, subjects continued with their regular classes. The
experimentalists then randomly matched participants from both schools, determined the
winners and deposited the vouchers at the schools, to be distributed by school faculty.
21 We did not find important differences in performance between the two parts of the test, indicating that the effects of learning and fatigue possibly cancel out. Experienced subjects completed one more sudoku in the second part (significant at the 1% level). Non-experienced subjects did not solve a significantly different number of sudokus in the two parts.
11
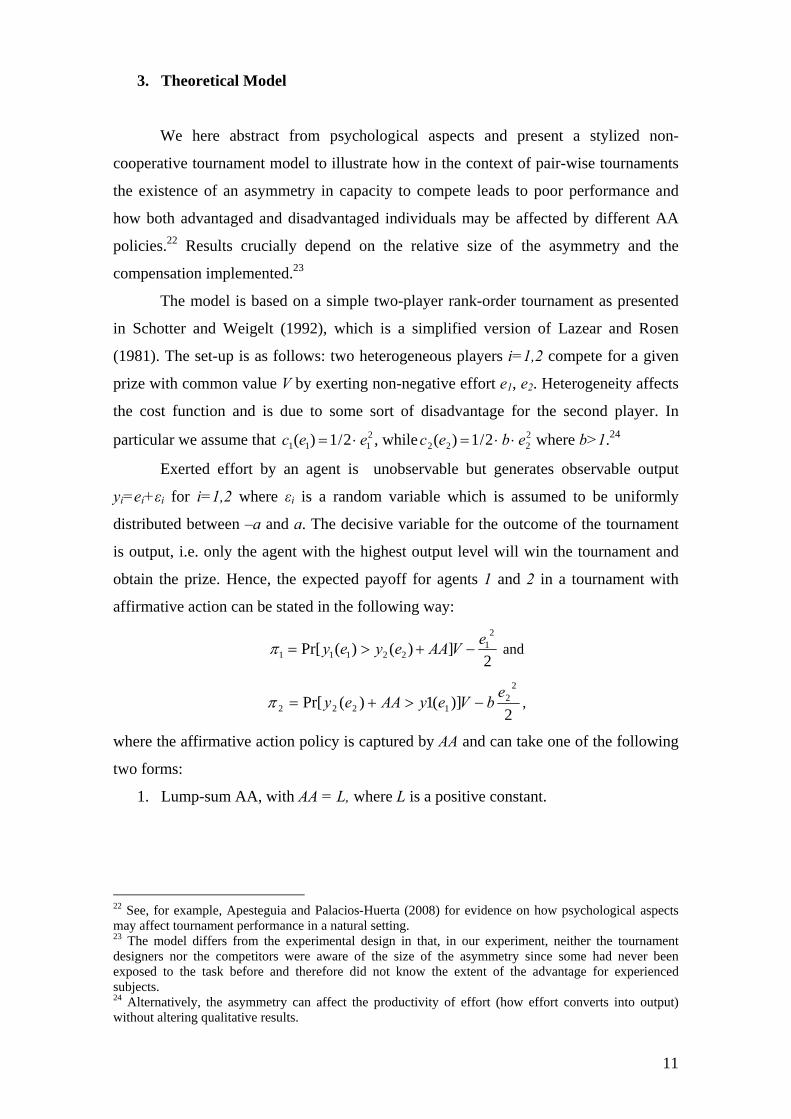
3. Theoretical Model
We here abstract from psychological aspects and present a stylized non-
cooperative tournament model to illustrate how in the context of pair-wise tournaments
the existence of an asymmetry in capacity to compete leads to poor performance and
how both advantaged and disadvantaged individuals may be affected by different AA
policies.22 Results crucially depend on the relative size of the asymmetry and the
compensation implemented.23
The model is based on a simple two-player rank-order tournament as presented
in Schotter and Weigelt (1992), which is a simplified version of Lazear and Rosen
(1981). The set-up is as follows: two heterogeneous players i=1,2 compete for a given
prize with common value V by exerting non-negative effort e1, e2. Heterogeneity affects
the cost function and is due to some sort of disadvantage for the second player. In
particular we assume that c1(e1) 1/2 e12 , whilec2(e2) 1/2 b e2
2 where b>1.24
Exerted effort by an agent is unobservable but generates observable output
yi=ei+εi for i=1,2 where εi is a random variable which is assumed to be uniformly
distributed between –a and a. The decisive variable for the outcome of the tournament
is output, i.e. only the agent with the highest output level will win the tournament and
obtain the prize. Hence, the expected payoff for agents 1 and 2 in a tournament with
affirmative action can be stated in the following way:
2])()(Pr[
21
22111
eVAAeyey and
2)](1)(Pr[
22
1222
ebVeyAAey ,
where the affirmative action policy is captured by AA and can take one of the following
two forms:
1. Lump-sum AA, with AA = L, where L is a positive constant.
22 See, for example, Apesteguia and Palacios-Huerta (2008) for evidence on how psychological aspects may affect tournament performance in a natural setting. 23 The model differs from the experimental design in that, in our experiment, neither the tournament designers nor the competitors were aware of the size of the asymmetry since some had never been exposed to the task before and therefore did not know the extent of the advantage for experienced subjects. 24 Alternatively, the asymmetry can affect the productivity of effort (how effort converts into output) without altering qualitative results.
12
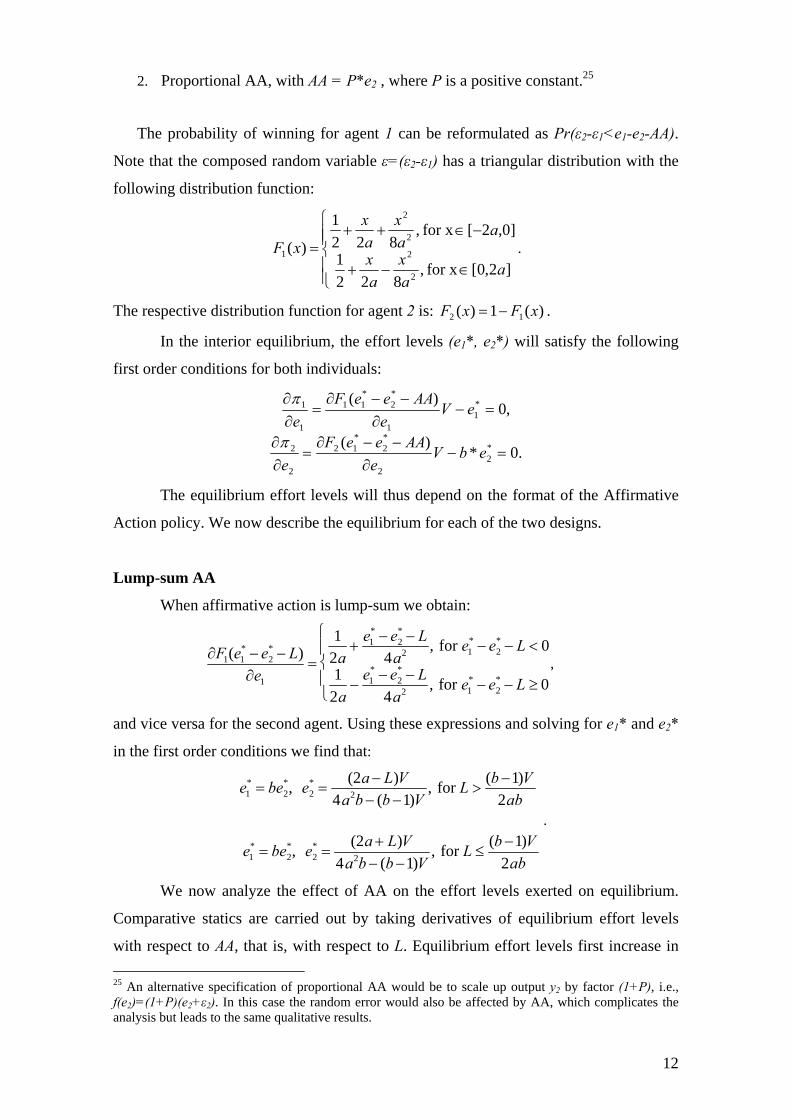
2. Proportional AA, with AA = P*e2 , where P is a positive constant.25
The probability of winning for agent 1 can be reformulated as Pr(ε2-ε1<e1-e2-AA).
Note that the composed random variable ε=(ε2-ε1) has a triangular distribution with the
following distribution function:
]2,0[for x ,822
1
]0,2[for x ,822
1
)(
2
2
2
2
1
aa
x
a
x
aa
x
a
x
xF .
The respective distribution function for agent 2 is: )(1)( 12 xFxF .
In the interior equilibrium, the effort levels (e1*, e2*) will satisfy the following
first order conditions for both individuals:
.0*)(
,0)(
*2
2
*2
*12
2
2
*1
1
*2
*11
1
1
ebVe
AAeeF
e
eVe
AAeeF
e
The equilibrium effort levels will thus depend on the format of the Affirmative
Action policy. We now describe the equilibrium for each of the two designs.
Lump-sum AA
When affirmative action is lump-sum we obtain:
F1(e1
* e2* L)
e1
12a
e1* e2
* L4a2
, for e1* e2
* L 0
1
2a
e1* e2
* L
4a2, for e1
* e2* L 0
,
and vice versa for the second agent. Using these expressions and solving for e1* and e2*
in the first order conditions we find that:
e1* be2
*, e2*
(2a L)V
4a2b (b 1)V, for L
(b 1)V
2ab
e1* be2
*, e2*
(2a L)V
4a2b (b 1)V, for L
(b 1)V
2ab
.
We now analyze the effect of AA on the effort levels exerted on equilibrium.
Comparative statics are carried out by taking derivatives of equilibrium effort levels
with respect to AA, that is, with respect to L. Equilibrium effort levels first increase in
25 An alternative specification of proportional AA would be to scale up output y2 by factor (1+P), i.e., f(e2)=(1+P)(e2+ε2). In this case the random error would also be affected by AA, which complicates the analysis but leads to the same qualitative results.
13
the size of the bonus, until a maximum is reached when L (b 1)V
2ab, and then
decrease.26 This implies that the implementation of AA provides incentives to both
agents so long as the bonus is not too high, in which case the advantage is reversed and
incentives are reduced. That is, if the bonus helps to reduce the asymmetry then it
increases incentives, but if it is too large it can reverse the advantage and reduce
incentives again.27
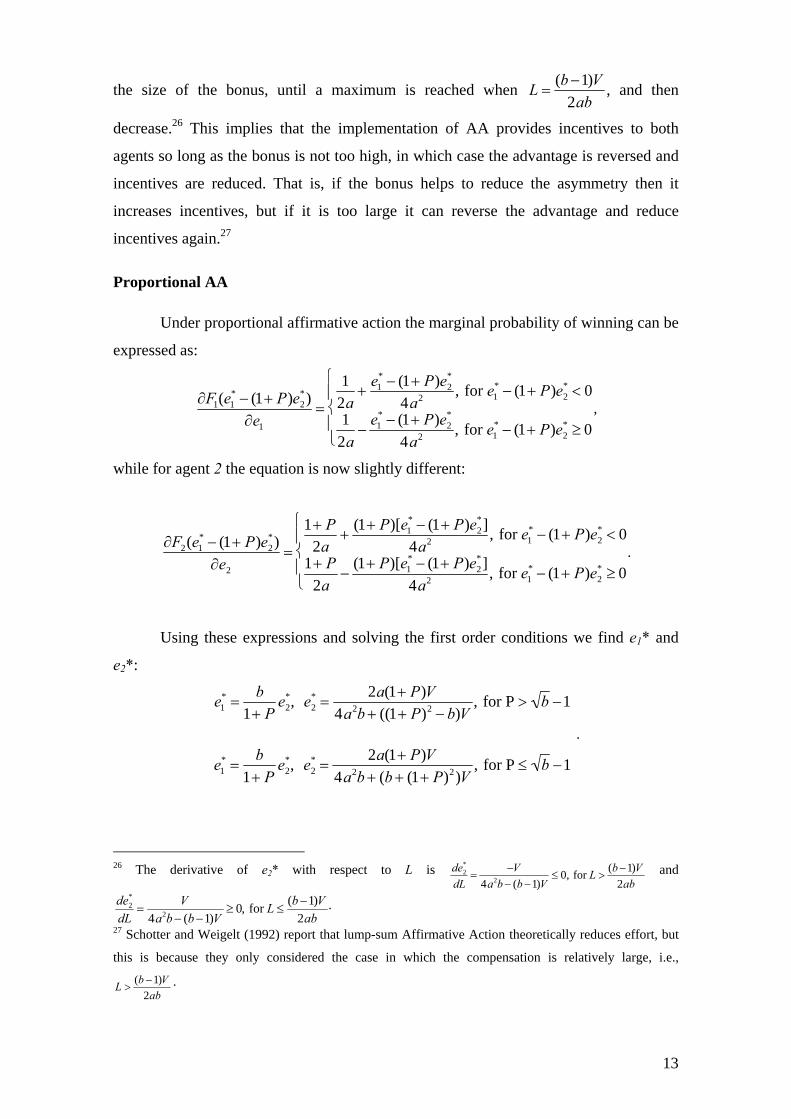
Proportional AA
Under proportional affirmative action the marginal probability of winning can be
expressed as:
F1(e1* (1 P)e2
*)
e1
12a
e1* (1 P)e2
*
4a2, for e1
* (1 P)e2* 0
1
2a
e1* (1 P)e2
*
4a2, for e1
* (1 P)e2* 0
,
while for agent 2 the equation is now slightly different:
F2(e1* (1 P)e2
*)
e2
1 P2a
(1 P)[e1* (1 P)e2
*]4a2
, for e1* (1 P)e2
* 0
1 P
2a
(1 P)[e1* (1 P)e2
*]
4a2, for e1
* (1 P)e2* 0
.
Using these expressions and solving the first order conditions we find e1* and
e2*:
e1*
b
1 Pe2
*, e2*
2a(1 P)V
4a2b ((1 P)2 b)V, for P b 1
e1*
b
1 Pe2
*, e2*
2a(1 P)V
4a2b (b (1 P)2)V, for P b 1
.
26 The derivative of e2* with respect to L is de2
*
dL
V
4a2b (b 1)V 0, for L
(b1)V
2ab and
de2*
dL
V
4a2b (b1)V 0, for L
(b1)V
2ab.
27 Schotter and Weigelt (1992) report that lump-sum Affirmative Action theoretically reduces effort, but
this is because they only considered the case in which the compensation is relatively large, i.e.,
ab
VbL
2
)1( .

14
Again, carrying out comparative statics of equilibrium effort levels on the size of
the AA policy, P, we find that for low levels of proportional bonus, 1P b , the
equilibrium effort levels increase with the size of the bonus. But if the bonus is
high,P b 1, increasing it further will decrease e1* and have ambiguous effects on
e2*. 28 As before, there exists a threshold value of P b 1 which maximizes total
effort and corresponds to the P which makes the competition exactly level.
To summarize, we find that affirmative action should increase the subjects’
performance, no matter whether the compensation is lump-sum or proportional to
performance, as long as the bonus reduces the asymmetry, that is, if it is not too large to
induce reversed discrimination. Our experiment should not be understood as an attempt
to test the predictive power of this simple and stylized theoretical model empirically.
Rather, the model serves as an illustration of the potential effects which different types
and sizes of affirmative action policies might possibly have.
4. Results
4.1 Descriptive Statistics
We start by taking a descriptive look at the data. Table 3 records the average number
of correct sudokus by treatment and school year (4th or 6th grade) in each of the schools
(E and NE). Note that there is high heterogeneity in performance in all treatments and
thus, standard deviations are large. Table 3 provides a first indication that subjects from
the experienced school (E) solve, on average, more sudokus, a key hypothesis justifying
our experimental design. It also shows that subjects in more advanced grades perform
better. Note that the average performance of 4th grade experienced subjects in all
treatments is similar to that of 6th grade non-experienced subjects.
28 For P b 1, e1
*
P
4ab(1 P)V 2
(4a2b (b (1 P)2)V )2 0 and e2*
P
1
b(1 P)
e1*
P
1
be1
*, which has an
ambiguous sign. For P b 1, e1*
P
4ab(1 P)V 2
(4a2b (b (1 P)2)V )2 0, and e2*
P
1
b(1 P)
e1*
P
1
be1
* 0 .

15
Table 3: Average Number (and Standard Deviations) of Correct Sudokus by Treatment and School Year 4th Grade 6th Grade Overall
E NE E NE E NE NK 28
(15.43) 16.98 (8.01))
38.92 (16.10)
24.66 (15.43)
33.27 (16.44)
20.38 (12.80)
K 29.94 (12.45)
17.69 (10.70)
43 (17.97)
29.09 (13.43)
35.60 (16.21)
22.92 (13.13)
AA 29.18 (13.74)
19.26 (9.48)
45.47 (12.06)
28.08 (12.12)
36.59 (15.29)
24.03 (11.80)
LH 28.47 (11.89)
23.36 (9.19)
44.29 (11.86)
29.50 (14.43)
35.67 (14.19)
27 (12.73)
LL 27.47 (12.21)
19.41 (11.79)
51.38 (11.19)
26 (9.01)
37.83 (16.71)
22.56 (10.85)
PH 29.60 (12.45)
17.92 (9.05)
44.69 (11.09)
26.53 (11.15)
37.54 (14.50)
22.07 (10.84)
PL 31.23 (18.22)
17.07 (7.59)
40.27 (12.38)
29.16 (12.83)
35.47 (16.17)
24.25 (12.42)
Figure 2 below shows the cumulative distribution function (CDF) of the number
of correct sudokus solved by students in the E and NE school for the two treatments
where AA measures are not implemented (NK and K). Note that the distributions have a
large spread and range from 0 sudokus solved to more than 70. Stochastic dominance of
the CDFs for the E school clearly shows that the lower level of experience in solving
sudokus is in fact a disadvantage for the NE subjects. Mann-Whitney tests comparing
the inter-school number of correct sudokus in both of these treatments show significant
differences at the 1% level (p-values of 0.002 for NK and of 0.003 for K).
CDF: Correctly Solved Sudokus (NK)
0%
10%
20%
30%
40%
50%
60%
70%
80%
90%
100%
0-5
6-1
0
11
-15
16
-20
21
-25
26
-30
31
-35
36
-40
41
-45
46
-50
51
-55
56
-60
61
-65
66
-70
>7
0
No. of Correctly Solved Sudokus
Re
l. C
um
. Fre
qu
en
cy
Non-Experienced Subjects Experienced Subjects
CDF: Correctly Solved Sudokus (K)
0%10%20%30%40%50%60%70%80%90%
100%
0-5
6-1
0
11
-15
16
-20
21
-25
26
-30
31
-35
36
-40
41
-45
46
-50
51
-55
56
-60
61
-65
66
-70
>7
0
No. of Correctly Solved Sudokus
Rel
. Cu
m. F
req
uen
cy
Non-Experienced Subjects Experienced Subjects
Figure 2: CDFs of the number of correct sudokus by E and NE in the NK and K treatments.
Intra-school comparisons across treatments are less clear-cut. Table 3 records the
number of correctly solved sudokus both for the unpooled data for the treatments where
affirmative action is implemented (LH, LL, PH and PL), and for the pooled data
included under the AA label. Figure 3 depicts the CDFs for the number of correct
sudokus for the NK, K and AA treatments in each of the two schools. Visually, the CDF
for the K treatment “almost stochastically dominates” the CDF for the NK treatment in
both graphs, suggesting that the provision of information on the existence of a
disadvantaged group does not decrease performance, and in fact it may enhance it.
Similarly, the CDFs for the AA treatment also lies below the CDFs for the NK
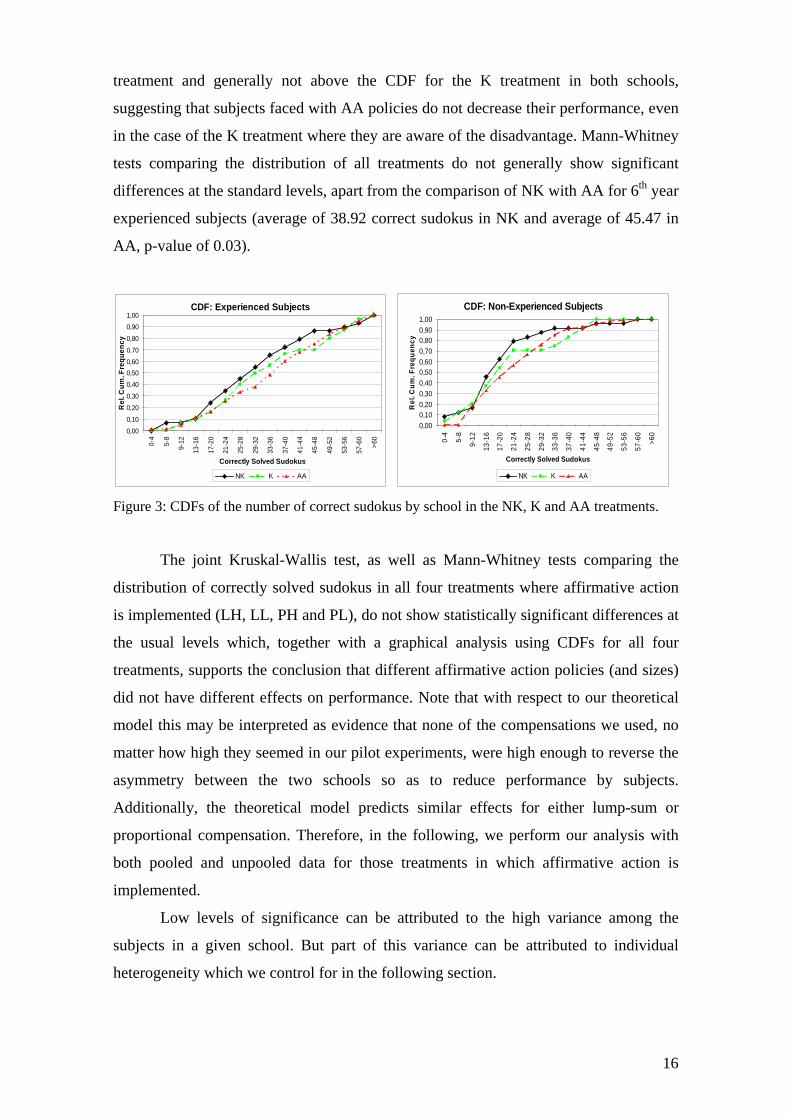
16
treatment and generally not above the CDF for the K treatment in both schools,
suggesting that subjects faced with AA policies do not decrease their performance, even
in the case of the K treatment where they are aware of the disadvantage. Mann-Whitney
tests comparing the distribution of all treatments do not generally show significant
differences at the standard levels, apart from the comparison of NK with AA for 6th year
experienced subjects (average of 38.92 correct sudokus in NK and average of 45.47 in
AA, p-value of 0.03).
CDF: Experienced Subjects
0,00
0,10
0,20
0,30
0,40
0,50
0,60
0,70
0,80
0,90
1,00
0-4
5-8
9-12
13-1
6
17-2
0
21-2
4
25-2
8
29-3
2
33-3
6
37-4
0
41-4
4
45-4
8
49-5
2
53-5
6
57-6
0
>60
Correctly Solved Sudokus
Re
l. C
um
. Fre
qu
en
cy
NK K AA
CDF: Non-Experienced Subjects
0,00
0,100,20
0,30
0,40
0,500,60
0,70
0,800,90
1,00
0-4
5-8
9-1
2
13-1
6
17-2
0
21-2
4
25-2
8
29-3
2
33-3
6
37-4
0
41-4
4
45-4
8
49-5
2
53-5
6
57-6
0
>60
Correctly Solved Sudokus
Re
l. C
um
. Fre
qu
en
cy
NK K AA
Figure 3: CDFs of the number of correct sudokus by school in the NK, K and AA treatments.
The joint Kruskal-Wallis test, as well as Mann-Whitney tests comparing the
distribution of correctly solved sudokus in all four treatments where affirmative action
is implemented (LH, LL, PH and PL), do not show statistically significant differences at
the usual levels which, together with a graphical analysis using CDFs for all four
treatments, supports the conclusion that different affirmative action policies (and sizes)
did not have different effects on performance. Note that with respect to our theoretical
model this may be interpreted as evidence that none of the compensations we used, no
matter how high they seemed in our pilot experiments, were high enough to reverse the
asymmetry between the two schools so as to reduce performance by subjects.
Additionally, the theoretical model predicts similar effects for either lump-sum or
proportional compensation. Therefore, in the following, we perform our analysis with
both pooled and unpooled data for those treatments in which affirmative action is
implemented.
Low levels of significance can be attributed to the high variance among the
subjects in a given school. But part of this variance can be attributed to individual
heterogeneity which we control for in the following section.
17
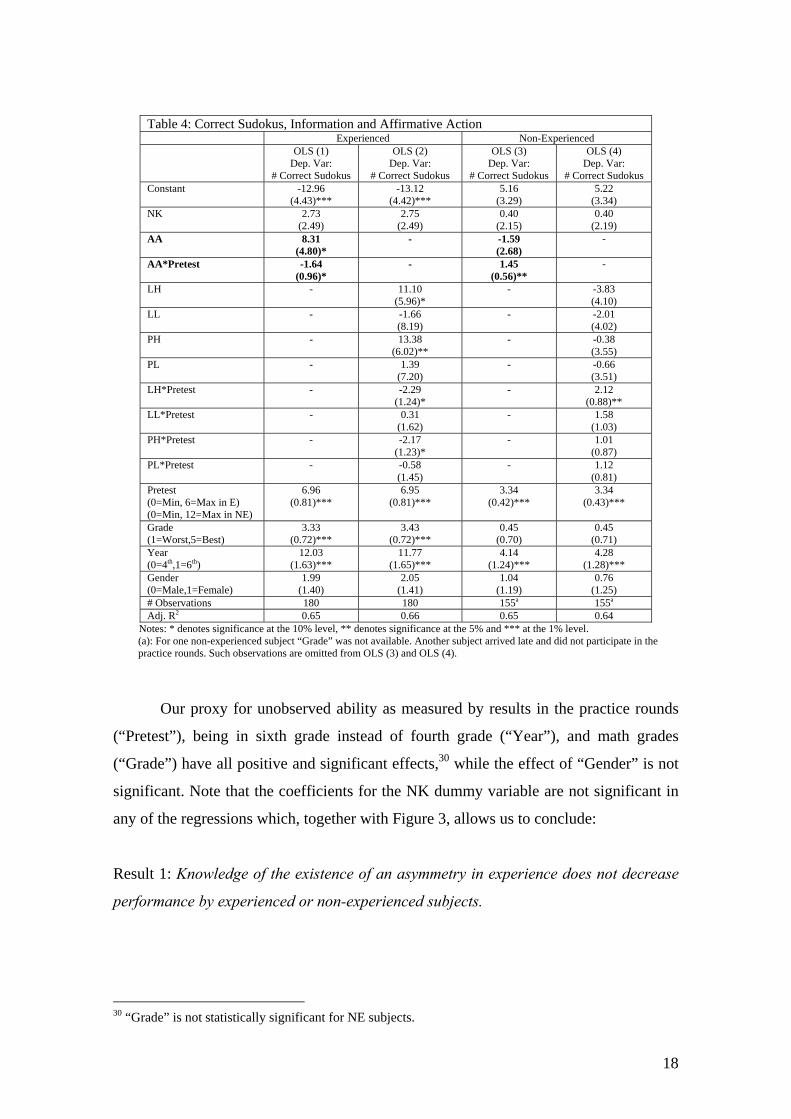
4.2 The Effects of Information and Affirmative Action on Performance
In this section we study the effects of providing information on the ex-ante
difference in experience between subjects and how performance in the tournament is
affected by the implementation of AA policies, using suitable controls for individual
heterogeneity. We run separate linear regressions for each school with the number of
correctly solved sudokus as a dependent variable (Table 4). Our baseline treatment is K,
where subjects are aware of the existing disadvantage but no AA policy is implemented.
Explanatory variables are the AA treatment dummies (both unpooled and pooled in two
separate regressions) and a dummy variable for treatment NK in order to control for the
effect of not providing information on the asymmetry in experience. From the
theoretical model presented above, differences in ability to compete should affect
performance, independently of their potential source. Therefore, an important variable
we need to control for is unobserved “ability”. For a proxy we used the number of
correct sudokus solved by subjects in a “Pretest”, i.e., the five minute practice rounds
that subjects performed before the competition was introduced. Additional regressors
include several other individual characteristics such as “Gender”, year of schooling
(“Year”), and the math grade obtained by students in the previous term (“Grade”).29
Since we anticipated that AA may affect subjects differently depending on their level of
ability, we included an interaction term (“AA*Pretest”). The inclusion of the interaction
term implies that a representative subject of the base group under K has low ability
(zero correct sudokus in the five minute trials). The regressions presented in table 4
show the results for both E and NE schools when controlling for the different AA
treatments, pooled in the case of OLS (1) and (3) and unpooled in OLS (2) and (4).
29 Since “Pretest” and “Grade” may be interpreted as different but correlated measures of individual ability, we run separate regressions using just one variable as regressor. Qualitative results are maintained and statistical levels of significance are slightly improved.
18
Table 4: Correct Sudokus, Information and Affirmative Action Experienced Non-Experienced OLS (1)
Dep. Var: # Correct Sudokus
OLS (2) Dep. Var:
# Correct Sudokus
OLS (3) Dep. Var:
# Correct Sudokus
OLS (4) Dep. Var:
# Correct Sudokus Constant -12.96
(4.43)*** -13.12
(4.42)*** 5.16
(3.29) 5.22
(3.34) NK 2.73
(2.49) 2.75
(2.49) 0.40
(2.15) 0.40
(2.19) AA 8.31
(4.80)* - -1.59
(2.68) -
AA*Pretest -1.64 (0.96)*
- 1.45 (0.56)**
-
LH - 11.10 (5.96)*
- -3.83 (4.10)
LL - -1.66 (8.19)
- -2.01 (4.02)
PH - 13.38 (6.02)**
- -0.38 (3.55)
PL - 1.39 (7.20)
- -0.66 (3.51)
LH*Pretest - -2.29 (1.24)*
- 2.12 (0.88)**
LL*Pretest - 0.31 (1.62)
- 1.58 (1.03)
PH*Pretest - -2.17 (1.23)*
- 1.01 (0.87)
PL*Pretest - -0.58 (1.45)
- 1.12 (0.81)
Pretest (0=Min, 6=Max in E) (0=Min, 12=Max in NE)
6.96 (0.81)***
6.95 (0.81)***
3.34 (0.42)***
3.34 (0.43)***
Grade (1=Worst,5=Best)
3.33 (0.72)***
3.43 (0.72)***
0.45 (0.70)
0.45 (0.71)
Year (0=4th,1=6th)
12.03 (1.63)***
11.77 (1.65)***
4.14 (1.24)***
4.28 (1.28)***
Gender (0=Male,1=Female)
1.99 (1.40)
2.05 (1.41)
1.04 (1.19)
0.76 (1.25)
# Observations 180 180 155a 155a
Adj. R2 0.65 0.66 0.65 0.64 Notes: * denotes significance at the 10% level, ** denotes significance at the 5% and *** at the 1% level.
(a): For one non-experienced subject “Grade” was not available. Another subject arrived late and did not participate in the practice rounds. Such observations are omitted from OLS (3) and OLS (4).
Our proxy for unobserved ability as measured by results in the practice rounds
(“Pretest”), being in sixth grade instead of fourth grade (“Year”), and math grades
(“Grade”) have all positive and significant effects,30 while the effect of “Gender” is not
significant. Note that the coefficients for the NK dummy variable are not significant in
any of the regressions which, together with Figure 3, allows us to conclude:
Result 1: Knowledge of the existence of an asymmetry in experience does not decrease
performance by experienced or non-experienced subjects.
30 “Grade” is not statistically significant for NE subjects.
19
We now focus on the effect of affirmative action on performance, starting with
the experienced subjects (E). OLS (1) shows that when pooling all affirmative action
treatments, the coefficient for AA has a positive and significant impact (at the 10%
level), i.e., experienced subjects in the base group (with low ability) statistically solve
8.31 sudokus more if they compete with subjects favored by an affirmative action
policy. However, the higher the ability of the experienced subject (measured by
“Pretest”), the lower the increase in AA performance, since the interaction term
(“AA*Pretest”) is negative and significant (at the 10% level).31 For subjects with the
highest ability the performance-enhancing effects of AA are nullified or even slightly
negative.32 This result suggests that those experienced subjects who realize that they
may now not win their respective tournament once non-experienced subjects are
receiving help, are precisely the ones who react most strongly to competitive pressure.
On the other hand, experienced subjects with high ability may have fewer reasons to
react, since they may win their respective tournament anyway. The unpooled analysis of
the AA treatments in OLS (2) generally shows the same signs (apart from the highly
non-significant LL treatment) although significance is low, which may partially be due
to the lower sample size. In any case, the more intensive AA treatments, i.e. LH and
PH, are the main contributors to the described incentive effects. We thus conclude:
Result 2: Affirmative Action policies enhance the performance of experienced subjects.
The lower the individual ability of the experienced subject, the higher this effect.
We now focus on the non-experienced subjects (NE). Note that as before, the
inclusion of the interaction term (“AA*Pretest”) implies that a subject in the base group
has low ability. For the pooled data (OLS (3)) the coefficient of “AA” for low ability
subjects is negative although not statistically significant from zero. Hence, low ability
subjects do not react to AA, i.e. AA on its own does not reduce the performance of non-
31 The statistical effect of AA on subjects with higher ability can therefore be calculated as “AA”+“AA*Pretest”. 32 We did not anticipate that experienced subjects would solve more than 6 sudokus in their 5 minute practice rounds. Thus, experienced subjects were provided with only 6 sudokus as part of their trial. Forty percent of the subjects solved all 6 correctly. For this reason our measure of ability for experienced subjects is cut off at 6, since it includes individuals who would possibly have solved more than 6 sudokus. We thus expect that our estimated parameters are smaller and less significant (due to higher variance) in comparison to properly specified trials with a larger number of sudokus. For the subsequently run experimental sessions with non-experienced subjects, we extended the number of trial sudokus to 12. By truncating these data artificially in the same manner as for experienced subjects, we were able to verify the conjecture that results become slightly less significant and weaker in absolute size without altering the qualitative results when there are fewer sudokus in practice rounds.

20
experienced subjects with low ability. This result is substantively different for subjects
with higher abilities as shown by the positive and significant coefficient at the 5% level
of the interaction term (“AA*Pretest”): subjects with higher ability solve significantly
more sudokus with AA than without it, i.e. each extra correct sudoku in the practice
round implies 1.45 more correct sudokus in the tournament if AA is implemented.33 We
thus conclude:
Result 3: Affirmative Action policies do not decrease the performance of non-
experienced subjects. In fact, AA increases the performance of these subjects with the
exception of those of lowest ability. The higher the ability of the non-experienced
subject, the greater the impact of this performance-enhancing effect.
The results obtained for the non-experienced subjects are in contrast to those for
experienced subjects. While low ability subjects without experience are not affected by
AA, high ability subjects without experience tend to react very positively to AA. For
experienced subjects this relation is reversed. This difference in behavior is intuitive
because non-experienced subjects with high ability and experienced subjects with low
ability are those most affected by the implementation of AA. They are at the margin of
competition and thus they are most directly affected by the level playing field imposed
through AA. The results for the separate AA treatments in OLS (4) are similar in
direction but mainly non-significant.34 For non-experienced subjects this conclusion is
also verified by analyzing the results of a similar linear regression where the dependent
variable is the number of wrongly solved sudokus. Here, low ability students have a
significantly lower number of wrongly solved sudokus under AA. This effect decreases
for students with higher abilities.35
There exists an important literature analyzing how male and female individuals
react differently to competition (see Gneezy et al. (2003), Gneezy and Rustichini (2004)
and Niederle and Vesterlund (2007)). We here run regressions that control for gender
33 Note that non-experienced subjects were able to solve up to 12 sudokus in the pretest, which implies that the performance-enhancing effect of AA, as expressed by the interaction term “AA*Pretest”, is important. For instance, a subject with 11 correct sudokus in the pretest (the highest observed value in the experiment) would statistically solve 14.4 (=-1.59+11*1.45) more sudokus in the tournament with AA than without it. 34 Again, the reason for the low significance of the AA-treatment dummies in OLS (4) in comparison to the pooled treatment AA in OLS (3) may be due to the small sample size for each treatment. 35 The linear regression results for ex-ante experienced subjects are less clear and mainly non-significant. Regressions where the number of wrongly solved sudokus is the dependent variable are available upon request.
21
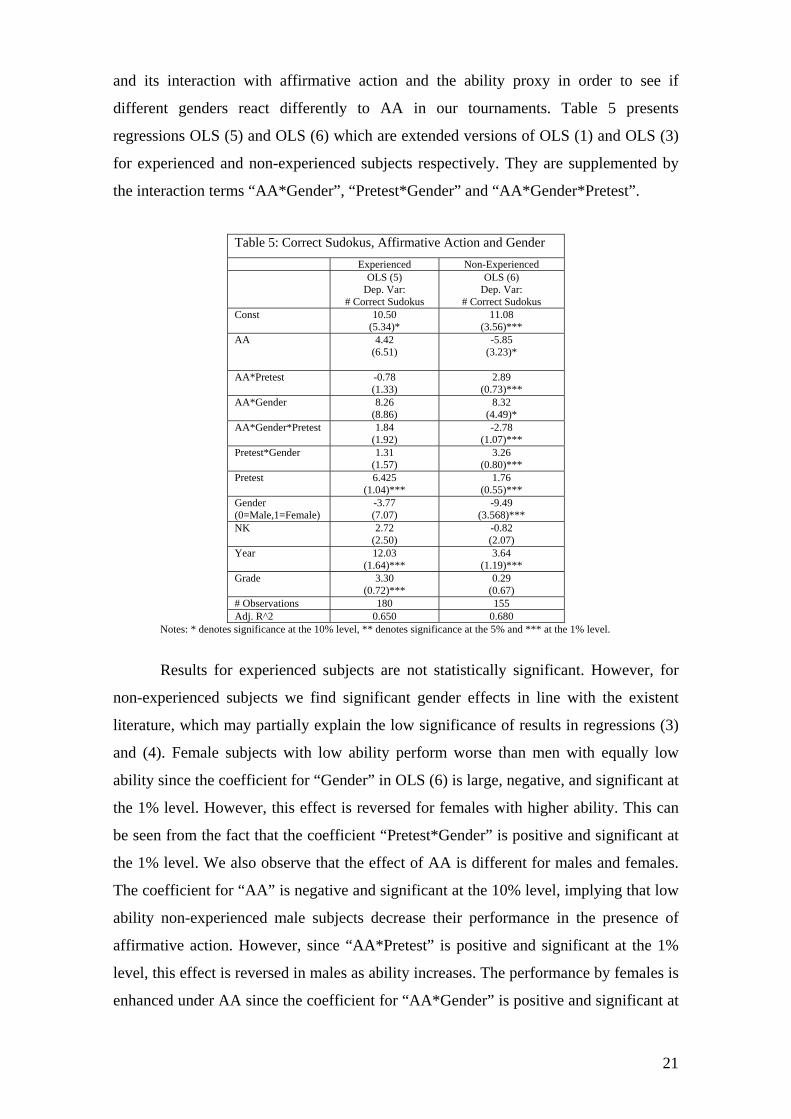
and its interaction with affirmative action and the ability proxy in order to see if
different genders react differently to AA in our tournaments. Table 5 presents
regressions OLS (5) and OLS (6) which are extended versions of OLS (1) and OLS (3)
for experienced and non-experienced subjects respectively. They are supplemented by
the interaction terms “AA*Gender”, “Pretest*Gender” and “AA*Gender*Pretest”.
Table 5: Correct Sudokus, Affirmative Action and Gender
Experienced Non-Experienced OLS (5)
Dep. Var: # Correct Sudokus
OLS (6) Dep. Var:
# Correct Sudokus Const 10.50
(5.34)* 11.08
(3.56)*** AA 4.42
(6.51)
-5.85 (3.23)*
AA*Pretest -0.78 (1.33)
2.89 (0.73)***
AA*Gender 8.26 (8.86)
8.32 (4.49)*
AA*Gender*Pretest 1.84 (1.92)
-2.78 (1.07)***
Pretest*Gender 1.31 (1.57)
3.26 (0.80)***
Pretest 6.425 (1.04)***
1.76 (0.55)***
Gender (0=Male,1=Female)
-3.77 (7.07)
-9.49 (3.568)***
NK 2.72 (2.50)
-0.82 (2.07)
Year 12.03 (1.64)***
3.64 (1.19)***
Grade 3.30 (0.72)***
0.29 (0.67)
# Observations 180 155 Adj. R^2 0.650 0.680
Notes: * denotes significance at the 10% level, ** denotes significance at the 5% and *** at the 1% level.
Results for experienced subjects are not statistically significant. However, for
non-experienced subjects we find significant gender effects in line with the existent
literature, which may partially explain the low significance of results in regressions (3)
and (4). Female subjects with low ability perform worse than men with equally low
ability since the coefficient for “Gender” in OLS (6) is large, negative, and significant at
the 1% level. However, this effect is reversed for females with higher ability. This can
be seen from the fact that the coefficient “Pretest*Gender” is positive and significant at
the 1% level. We also observe that the effect of AA is different for males and females.
The coefficient for “AA” is negative and significant at the 10% level, implying that low
ability non-experienced male subjects decrease their performance in the presence of
affirmative action. However, since “AA*Pretest” is positive and significant at the 1%
level, this effect is reversed in males as ability increases. The performance by females is
enhanced under AA since the coefficient for “AA*Gender” is positive and significant at
22
the 10% level, independently of the ability level since the significant coefficients at the
1% level on “AA*Pretest” and “AA*Pretest*Gender” practically cancel out.36 Thus, we
conclude:
Result 4: Non-experienced females of low ability perform less well than comparable
males as long as the asymmetry in experience is not corrected through affirmative
action. High ability females perform better than comparable males. Once the
disadvantage has been corrected, females improve their performance more than the
males.
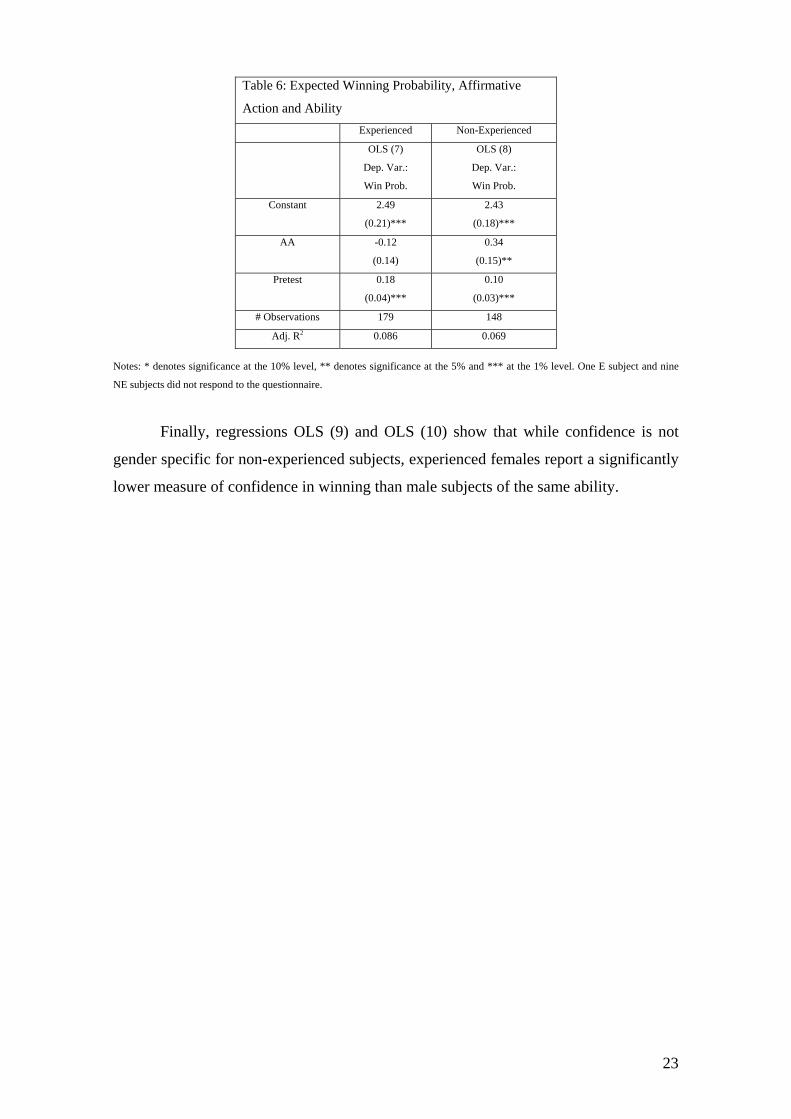
Finally we look at how subjects’ expectations about winning their respective
tournament are affected by affirmative action. After the tournament ended but before
the participants knew the results, subjects answered a voluntary questionnaire which
included questions about their individual perception of the probability of winning their
respective tournament.37 As there was no information about the identity and
characteristics of the respective opponent (with the exception of ex-ante experience in
the AA treatments and in treatment K) we use these answers as a measure of confidence
in winning. OLS (7) and (8) in Table 6 regress our measure of confidence in winning on
“Pretest” and the treatment dummy for affirmative action (“AA”). Understandably, we
find that high ability subjects have higher confidence in winning their respective
tournament as “Pretest” has a positive and significant coefficient at the 1% level. More
importantly, we find that while for experienced subjects the presence of AA does not
significantly affect reported confidence, it significantly increases the confidence of non-
experienced subjects at the 5% level. These results are consistent with the experienced
subjects not feeling frustrated by the introduction of affirmative action while, at the
same time, AA correctly increases the expectations of the non-experienced subjects of
winning their respective tournament.
36 Similar regressions for separate AA treatments confirmed these results in the sense that all AA treatments had similar effects. The results for those regressions are available upon request. 37 In the relevant question 6 (see Appendix) students could rank their expectation of winning the tournament against their respective rival on an ordinal scale from 1 (“Definitely”) to 5 (“Definitely Not”).
23
Notes: * denotes significance at the 10% level, ** denotes significance at the 5% and *** at the 1% level. One E subject and nine
NE subjects did not respond to the questionnaire.
Finally, regressions OLS (9) and OLS (10) show that while confidence is not
gender specific for non-experienced subjects, experienced females report a significantly
lower measure of confidence in winning than male subjects of the same ability.
Table 6: Expected Winning Probability, Affirmative
Action and Ability
Experienced Non-Experienced
OLS (7)
Dep. Var.:
Win Prob.
OLS (8)
Dep. Var.:
Win Prob.
Constant 2.49
(0.21)***
2.43
(0.18)***
AA -0.12
(0.14)
0.34
(0.15)**
Pretest 0.18
(0.04)***
0.10
(0.03)***
# Observations 179 148
Adj. R2 0.086 0.069
24
Notes: * denotes significance at the 10% level, ** denotes significance at the 5% and *** at the 1% level. One E subject and nine
NE subjects did not respond to the questionnaire.
4.3 The Effects of Affirmative Action on the Selection of Tournament Winners
In the previous subsection we have shown that affirmative action has
performance-enhancing effects on both experienced and non-experienced subjects.
However, a question remains regarding the efficiency of implementing such policies
from an ex-post point of view. As we have seen, AA increases the probability of
winning for subjects who have an inherent disadvantage. Thus, those disadvantaged
subjects who win their respective tournament may do so not because they perform better
than their respective advantaged competitor but because now they receive
compensation. As a result, the average performance of those subjects selected as
tournament winners may be lower than the one we would have obtained had affirmative
action not been implemented. However, given that in our tournament affirmative action
had performance-enhancing effects, it is still possible that the comparisons with and
without AA may not be clear cut.
Table 7: Expected Winning Probability, Affirmative
Action and Gender
Experienced Non-Experienced
OLS (9)
Dep. Var.:
Win Prob.
OLS (10)
Dep. Var.:
Win Prob.
Constant 2.00
(0.31) ***
2.37
(0.23)***
AA -0.24
(0.19)
0.50
(0.21)**
Gender 0.69
(0.43)
0.16
(0.36)
AA*Gender 0.24
(0.29)
-0.34
(0.31)
Pretest 0.29
(0.06)***
0.11
(0.04)**
Pretest*
Gender
-0.20
(0.08)**
-0.02
(0.07)
# Observations 179 148
Adj. R^2 0.100 0.066
25
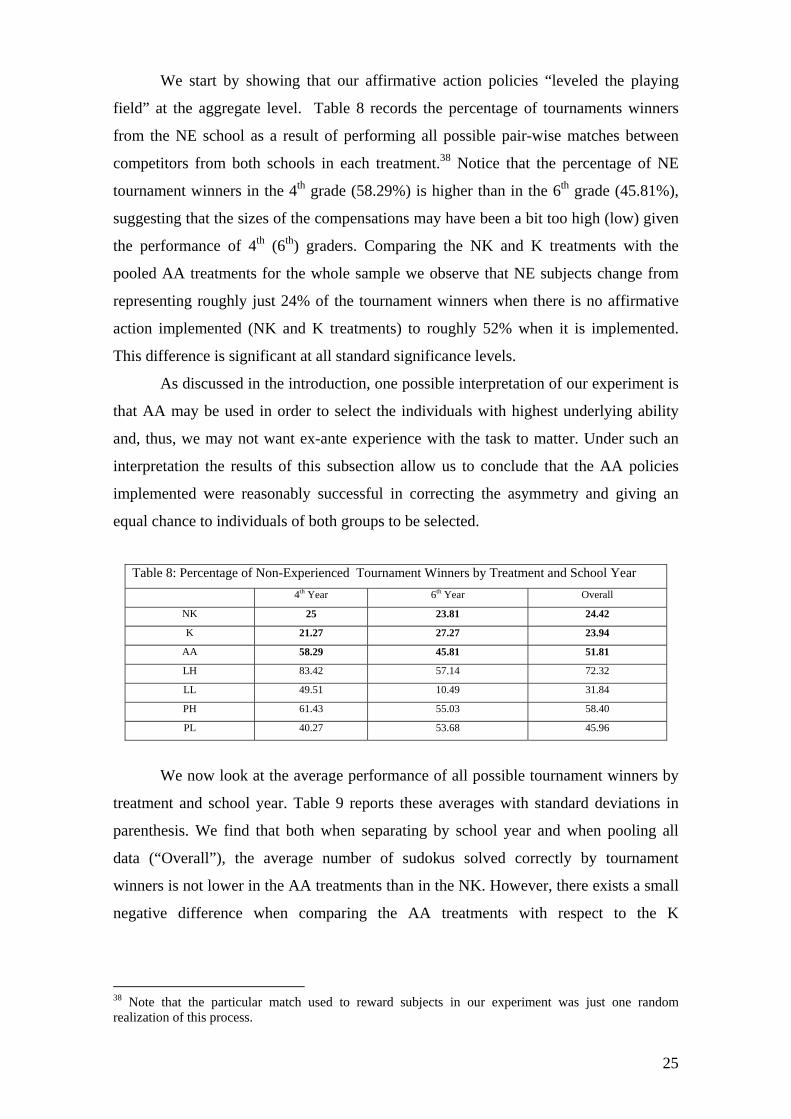
We start by showing that our affirmative action policies “leveled the playing
field” at the aggregate level. Table 8 records the percentage of tournaments winners
from the NE school as a result of performing all possible pair-wise matches between
competitors from both schools in each treatment.38 Notice that the percentage of NE
tournament winners in the 4th grade (58.29%) is higher than in the 6th grade (45.81%),
suggesting that the sizes of the compensations may have been a bit too high (low) given
the performance of 4th (6th) graders. Comparing the NK and K treatments with the
pooled AA treatments for the whole sample we observe that NE subjects change from
representing roughly just 24% of the tournament winners when there is no affirmative
action implemented (NK and K treatments) to roughly 52% when it is implemented.
This difference is significant at all standard significance levels.
As discussed in the introduction, one possible interpretation of our experiment is
that AA may be used in order to select the individuals with highest underlying ability
and, thus, we may not want ex-ante experience with the task to matter. Under such an
interpretation the results of this subsection allow us to conclude that the AA policies
implemented were reasonably successful in correcting the asymmetry and giving an
equal chance to individuals of both groups to be selected.
Table 8: Percentage of Non-Experienced Tournament Winners by Treatment and School Year
4th Year 6th Year Overall
NK 25 23.81 24.42
K 21.27 27.27 23.94
AA 58.29 45.81 51.81
LH 83.42 57.14 72.32
LL 49.51 10.49 31.84
PH 61.43 55.03 58.40
PL 40.27 53.68 45.96
We now look at the average performance of all possible tournament winners by
treatment and school year. Table 9 reports these averages with standard deviations in
parenthesis. We find that both when separating by school year and when pooling all
data (“Overall”), the average number of sudokus solved correctly by tournament
winners is not lower in the AA treatments than in the NK. However, there exists a small
negative difference when comparing the AA treatments with respect to the K
38 Note that the particular match used to reward subjects in our experiment was just one random realization of this process.
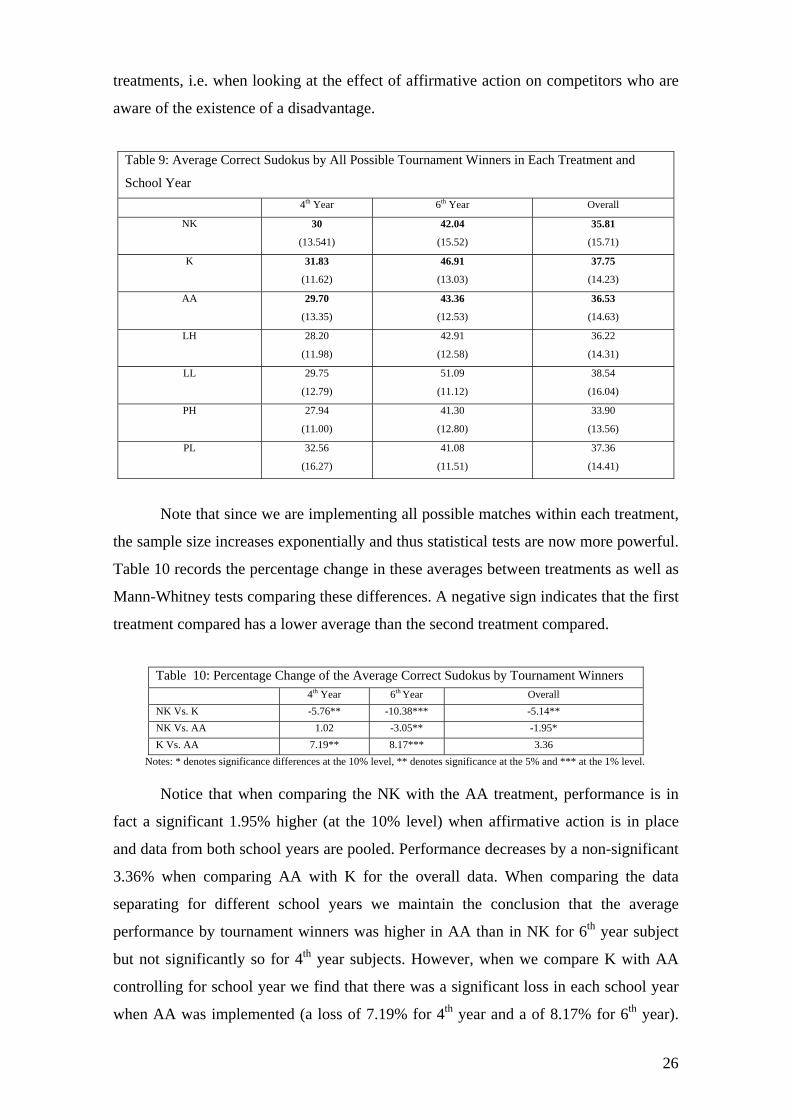
26
treatments, i.e. when looking at the effect of affirmative action on competitors who are
aware of the existence of a disadvantage.
Table 9: Average Correct Sudokus by All Possible Tournament Winners in Each Treatment and
School Year
4th Year 6th Year Overall
NK 30
(13.541)
42.04
(15.52)
35.81
(15.71)
K 31.83
(11.62)
46.91
(13.03)
37.75
(14.23)
AA 29.70
(13.35)
43.36
(12.53)
36.53
(14.63)
LH 28.20
(11.98)
42.91
(12.58)
36.22
(14.31)
LL 29.75
(12.79)
51.09
(11.12)
38.54
(16.04)
PH 27.94
(11.00)
41.30
(12.80)
33.90
(13.56)
PL 32.56
(16.27)
41.08
(11.51)
37.36
(14.41)
Note that since we are implementing all possible matches within each treatment,
the sample size increases exponentially and thus statistical tests are now more powerful.
Table 10 records the percentage change in these averages between treatments as well as
Mann-Whitney tests comparing these differences. A negative sign indicates that the first
treatment compared has a lower average than the second treatment compared.
Table 10: Percentage Change of the Average Correct Sudokus by Tournament Winners 4th Year 6th Year Overall
NK Vs. K -5.76** -10.38*** -5.14**
NK Vs. AA 1.02 -3.05** -1.95*
K Vs. AA 7.19** 8.17*** 3.36
Notes: * denotes significance differences at the 10% level, ** denotes significance at the 5% and *** at the 1% level.
Notice that when comparing the NK with the AA treatment, performance is in
fact a significant 1.95% higher (at the 10% level) when affirmative action is in place
and data from both school years are pooled. Performance decreases by a non-significant
3.36% when comparing AA with K for the overall data. When comparing the data
separating for different school years we maintain the conclusion that the average
performance by tournament winners was higher in AA than in NK for 6th year subject
but not significantly so for 4th year subjects. However, when we compare K with AA
controlling for school year we find that there was a significant loss in each school year
when AA was implemented (a loss of 7.19% for 4th year and a of 8.17% for 6th year).
27
This indicates that there was a loss in average performance although it was not large.39
Thus we conclude:
Result 5: While affirmative action policies induced a level playing field, they did not do
so at the expense of a large loss in average performance by subjects selected as
tournament winners.
5. Conclusion
This paper contributes to the debate on the adequacy of affirmative action
policies by presenting evidence on the effects in individual performance of
implementing these policies in a tournament where capacities to compete are
asymmetric. In particular, it shows that levelling the playing field by implementing AA
leads to performance improvements by almost all participants and to a small decline in
the average performance of selected winners.
Our results thus imply that there are circumstances under which affirmative
action policies are beneficial with respect to the incentives provided to all participants.
Additionally, the negative effects of selecting worse performing but disadvantaged
subjects are minimal.
There are several issues that our design does not allow us to discuss. For
example it is important to study how other relevant disadvantages not directly affecting
capacities to compete may be affected by affirmative action. Similarly, the long term
effects of using affirmative action have not been analyzed here. These issues are
important and are left for future research.
39 Notice that performance is a significantly lower 7% when comparing the performance by tournament winners under AA with respect to the hypothetical situation in which affirmative action was announced (such that the performance inducing effects are present) but then not used to select tournament winners. Notice that such policy, although more efficient from a performance point of view, may be difficult to justify and not credible in the long term.
28
6. References
Apesteguia, J., and Palacios-Huerta, I., (2008). “Psychological Pressure in
Competitive Environments: Evidence from a Randomized Natural Experiment”. Universitat Pompeu Fabra. Mimeo.
Balart, P., (2009). “Equality of Opportunities and Welfare in a Model of Job
Allocation”. Universitat Autònoma de Barcelona. Mimeo. Calsamiglia, C., (2009). “Decentralizing Equality of Opportunity”. International
Economic Review 50(1): 273-290. Coate, S., and Loury, S., (1993), “Will Affirmative-Action Policies Eliminate
Negative Stereotypes?”. American Economic Review 83(5): 1355-1360.
Che, Y., and Gale, I., (1998). “Caps on Political Lobbying”. American Economic Review (88): 643-651
Franke, J., (2008). “Does Affirmative Action Reduce Effort Incentives? A Contest Game Analysis”. UAB and IAE Working Paper Series 711.07.
Fryer, R. G. J., and G. C. Loury, (2005a). “Affirmative Action in Winner-Take-All
Markets.” Journal of Economic Inequality 3(3): 263-280. Fryer, R. G. J., and G. C. Loury, (2005b). “Affirmative Action and Its Mythology”.
Journal of Economic Perspectives 19(3): 147-162. Fu, Q., (2006). “A Theory of Affirmative Action in College Admissions”. Economic
Inquiry 44: 420-428.
Gneezy, U., Niederle M., and A. Rustichini, (2003). “Performance in Competitive Environments: Gender Differences”. Quarterly Journal of Economics 118(3): 1049-1074.
Gneezy, U., and A. Rustichini, (2004). “Gender and Competition at a Young Age,” American Economic Review Papers and Proceedings: 377-381.
Harbaugh, W., and Krause, K., (2000). “Children's Altruism in Public Good and Dictator Experiments,” Economic Inquiry 38(1): 95-109.
Harbaugh, W., Krause, K. and T. R. Berry, (2001). “GARP for Kids. On the Development of Rational Choice Behavior”. American Economic Review 91(5): 1539-1545.
Hickman, B. R., (2009). “Effort, Achievement Gaps and Affirmative Action: A New Look at College Admissions”. University of Iowa. Mimeo.
Hoff, K., and P. Pandey, (2006). “Discrimination, Social Identity, and Durable Inequalities”. American Economic Review 96(2): 206-211.
29
Holzer, H., and D. Neumark, (2000) “Assessing Affirmative Action”. Journal of Economic Literature 38(3): 483-568.
Krasnokutskaya, E., and K. Seim, (2007). “Determinants of the Participation
Decision in Highway Procurement Auctions”. University of Pennsyilvania. Mimeo.
Lazear, E..P., and S. Rosen, (1981). “Rank-Order Tournaments as Optimum Labor Contracts”. Journal of Political Economy 1989(5): 841-864.
Marion, J., (2007). “Are Bid Preferences Benign? The Effect of Small Business Subsidies in Highway Procurement Auctions”. Journal of Public Economics 91: 1591-1624.
Miller, A., and Segal, C., (2008). “Do Temporary Affirmative Action Programs
Produce Permanent Effects? A Study of Minority and Female Employment in Law Enforcement Agencies”. Universitat Pompeu Fabra. Mimeo.
Myerson, R., (1981): “Optimal auction design”, Mathematics of Operations
Research 6: 58-73.
Niederle, M., C. Segal and L. Vesterlund, (2008). “How Costly is Diversity? Affirmative Action in Competitive Environments”. Universitat Pompeu Fabra. Mimeo.
Niederle, M., and L. Vesterlund, (2007). “Do Women Shy Away From
Competition? Do Men Compete Too Much?”. Quarterly Journal of Economics 122(3): 1067-1101.
Prendergast, C., (1999). “The Provision of Incentives in Firms”. Journal of
Economic Literature 37(1): 7-63. Schotter, A., and K. Weigelt, (1992). “Asymmetric Tournaments, Equal
Opportunity Laws, and Affirmative Action: Some Experimental Results”. Quarterly Journal of Economics 107(2): 511-39.
Sowell, T., (2004). Affirmative Action around the World: An Empirical Study. New
Haven, Conn: Yale University Press.
30
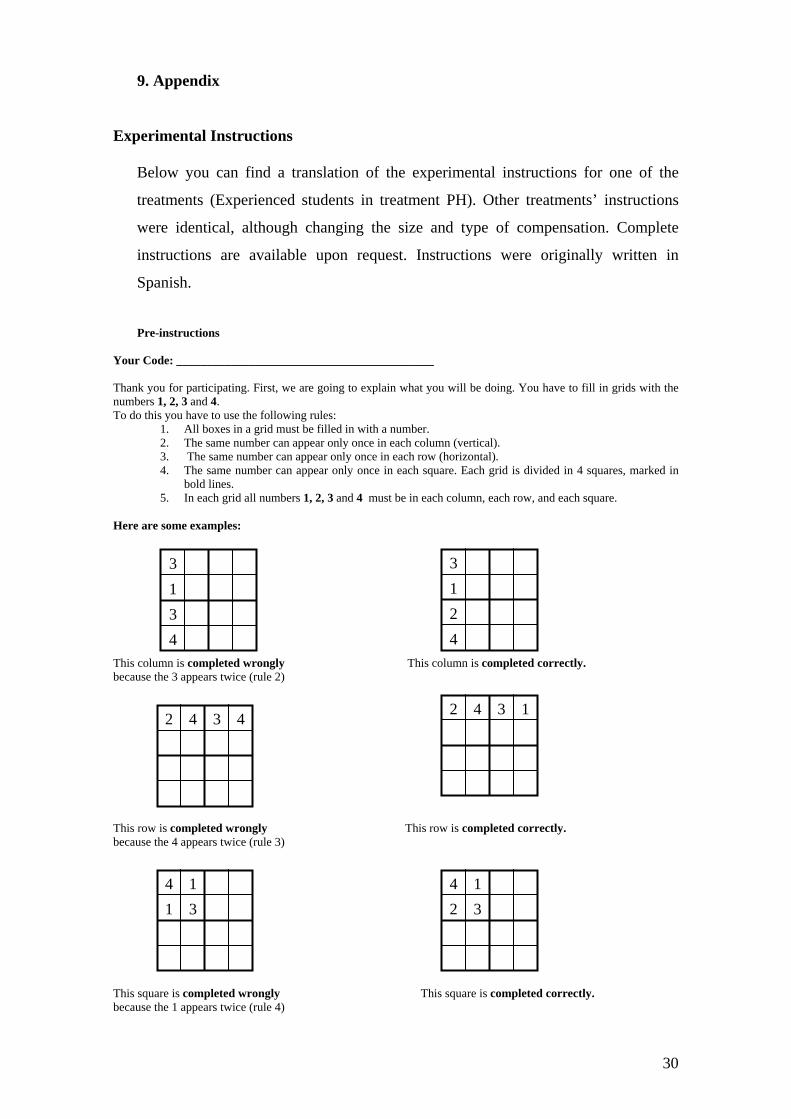
9. Appendix
Experimental Instructions
Below you can find a translation of the experimental instructions for one of the
treatments (Experienced students in treatment PH). Other treatments’ instructions
were identical, although changing the size and type of compensation. Complete
instructions are available upon request. Instructions were originally written in
Spanish.
Pre-instructions
Your Code: ___________________________________________ Thank you for participating. First, we are going to explain what you will be doing. You have to fill in grids with the numbers 1, 2, 3 and 4. To do this you have to use the following rules:
1. All boxes in a grid must be filled in with a number. 2. The same number can appear only once in each column (vertical). 3. The same number can appear only once in each row (horizontal). 4. The same number can appear only once in each square. Each grid is divided in 4 squares, marked in
bold lines. 5. In each grid all numbers 1, 2, 3 and 4 must be in each column, each row, and each square.
Here are some examples: This column is completed wrongly This column is completed correctly. because the 3 appears twice (rule 2) This row is completed wrongly This row is completed correctly. because the 4 appears twice (rule 3) This square is completed wrongly This square is completed correctly. because the 1 appears twice (rule 4)
3
1
3
4
3
1
2
4
2
4 3 4
2 4 3 1
4
1
1
3
4
2
1
3
31
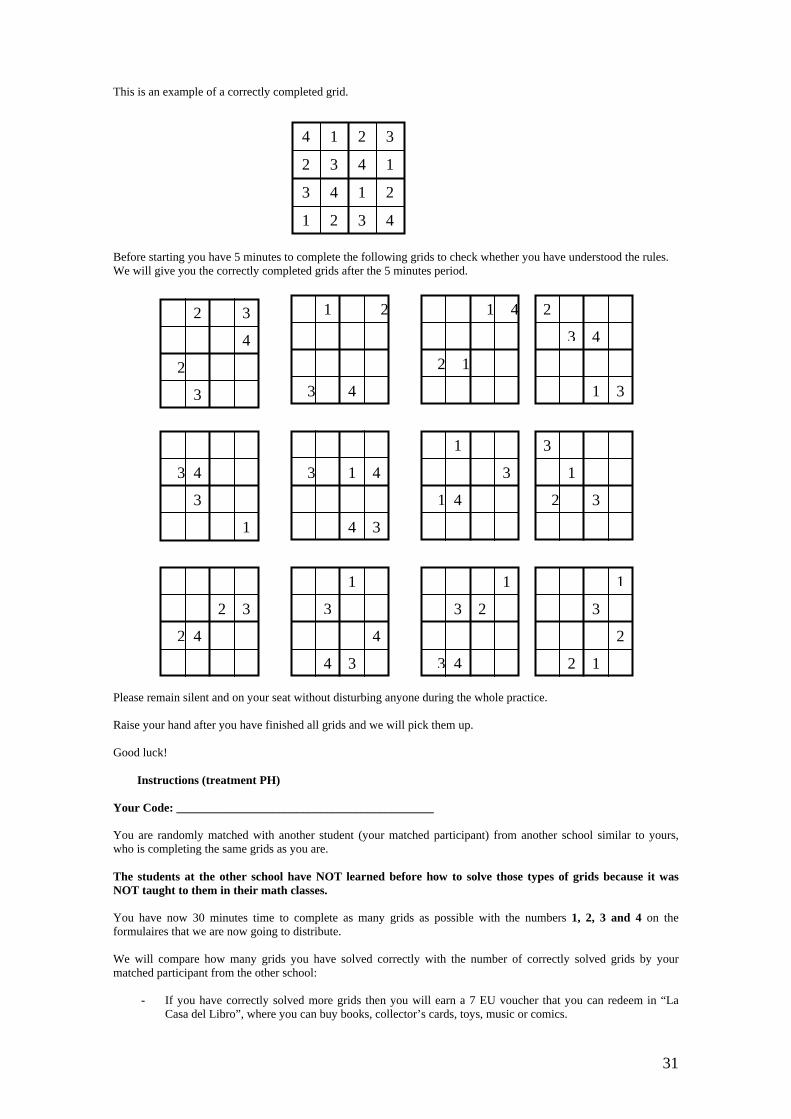
This is an example of a correctly completed grid. Before starting you have 5 minutes to complete the following grids to check whether you have understood the rules. We will give you the correctly completed grids after the 5 minutes period. Please remain silent and on your seat without disturbing anyone during the whole practice. Raise your hand after you have finished all grids and we will pick them up. Good luck!
Instructions (treatment PH) Your Code: ___________________________________________
You are randomly matched with another student (your matched participant) from another school similar to yours, who is completing the same grids as you are. The students at the other school have NOT learned before how to solve those types of grids because it was NOT taught to them in their math classes. You have now 30 minutes time to complete as many grids as possible with the numbers 1, 2, 3 and 4 on the formulaires that we are now going to distribute. We will compare how many grids you have solved correctly with the number of correctly solved grids by your matched participant from the other school:
- If you have correctly solved more grids then you will earn a 7 EU voucher that you can redeem in “La Casa del Libro”, where you can buy books, collector’s cards, toys, music or comics.
4
2
3
1
1 2 3
3 4 1
4 1 2
2 3 4
3
4
2
3
1
4
2
2
3
1 4
2 1
3
1
4 3 1 4 3
1
43
4 3
1
2
3
1
1
3
1
2
1
2
4 3
3 2
1
3
4
1
4
33 2
4 2
3
3
4 2 3
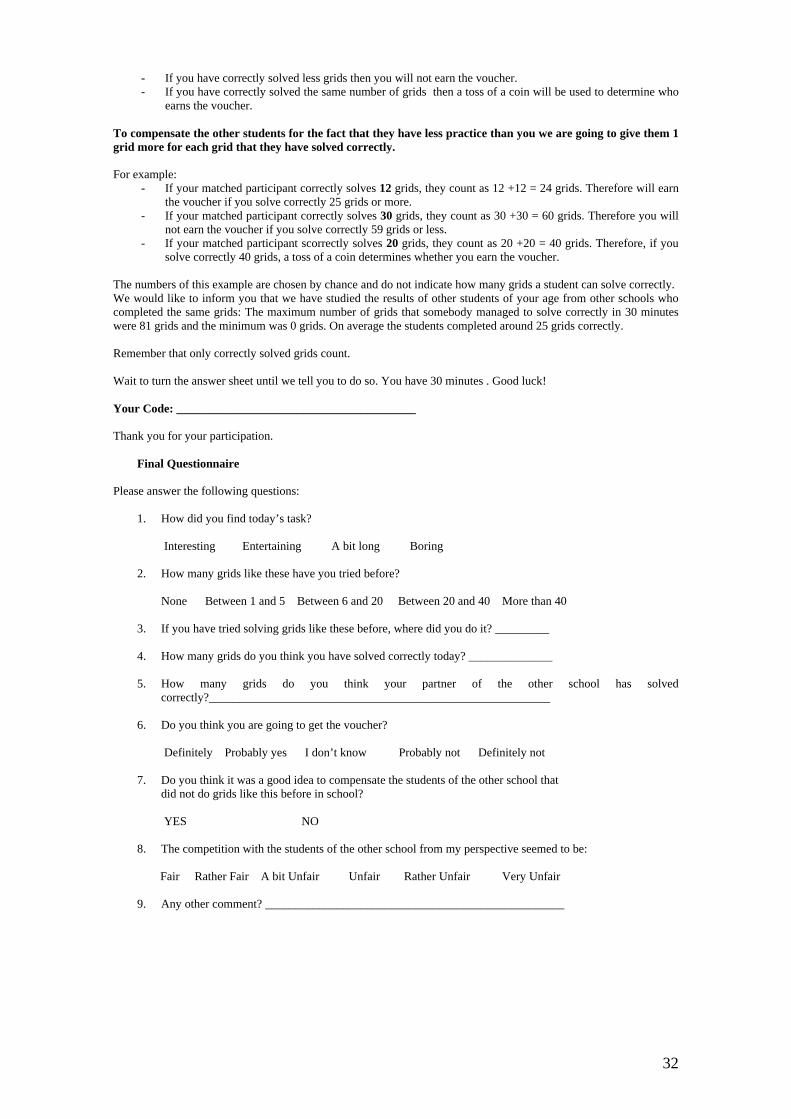
32
- If you have correctly solved less grids then you will not earn the voucher. - If you have correctly solved the same number of grids then a toss of a coin will be used to determine who
earns the voucher. To compensate the other students for the fact that they have less practice than you we are going to give them 1 grid more for each grid that they have solved correctly. For example:
- If your matched participant correctly solves 12 grids, they count as 12 +12 = 24 grids. Therefore will earn the voucher if you solve correctly 25 grids or more.
- If your matched participant correctly solves 30 grids, they count as 30 +30 = 60 grids. Therefore you will not earn the voucher if you solve correctly 59 grids or less.
- If your matched participant scorrectly solves 20 grids, they count as 20 +20 = 40 grids. Therefore, if you solve correctly 40 grids, a toss of a coin determines whether you earn the voucher.
The numbers of this example are chosen by chance and do not indicate how many grids a student can solve correctly. We would like to inform you that we have studied the results of other students of your age from other schools who completed the same grids: The maximum number of grids that somebody managed to solve correctly in 30 minutes were 81 grids and the minimum was 0 grids. On average the students completed around 25 grids correctly. Remember that only correctly solved grids count. Wait to turn the answer sheet until we tell you to do so. You have 30 minutes . Good luck! Your Code: ________________________________________ Thank you for your participation.
Final Questionnaire
Please answer the following questions:
1. How did you find today’s task?
Interesting Entertaining A bit long Boring
2. How many grids like these have you tried before? None Between 1 and 5 Between 6 and 20 Between 20 and 40 More than 40 3. If you have tried solving grids like these before, where did you do it? _________
4. How many grids do you think you have solved correctly today? ______________
5. How many grids do you think your partner of the other school has solved
correctly?_________________________________________________________
6. Do you think you are going to get the voucher?
Definitely Probably yes I don’t know Probably not Definitely not
7. Do you think it was a good idea to compensate the students of the other school that did not do grids like this before in school?
YES NO 8. The competition with the students of the other school from my perspective seemed to be:
Fair Rather Fair A bit Unfair Unfair Rather Unfair Very Unfair 9. Any other comment? __________________________________________________
Copyright © 2022 FDOKUMEN