The impact of origin community characteristics on rural-urban out-migration in a developing country
20
DEMOGRAPHY© Volume 24, Number 2 May 1987 THE IMPACT OF ORIGIN COMMUNITY CHARACTERISTICS ON RURAL-URBAN OUT-MIGRATION IN A DEVELOPING COUNTRY Richard E. Bilsborrow Carolina Population Center and Department of Biostatistics, University of North Carolina, Chapel Hili, North Carolina 27514-3997 Thomas M. McDevitt International Statistical Programs Center, U.S. Bureau of the Census, Suitland, Maryland Sherrie Kossoudji Population Studies Center, University of Michigan, Ann Arbor, Michigan 48109 Richard Fuller Carolina Population Center and Department of Sociology, University of North Carolina, Chapel Hili, North Carolina 27514-3997 INTRODUCTION AND PURPOSE Considerable evidenee has aeeumulated during the past two deeades indieating that in developing countries, migration from rural areas is influeneed by high rates of rural natural inerease, inequitable land distribution, inadequate rural employment opportunities and ineomes, and large difIerenees in ineome and amenity levels between urban and rural areas (Bilsborrow, Oberai, and Standing, 1984; Firebaugh, 1979; International Development Research Centre, 1977; Peek, 1980; Shaw, 1974). Many households are "pushed" by eeonomie eonditions to leave the rural sector. Others are attracted by better eonditions in urban areas. Although migration deeisions are made in the eontext of prevailing institutional and struetural labor market eonditions, loeal wealth-property relationships, and geographie disparities in eeonomie opportunities and services, the eharaeteristies ofthe potential migrant and his/her household are also important (Bilsborrow, 198Ia,b; Oberai and Bilsborrow, 1984; Wood, 1982).1 As a result, the investigation of faetors influencing migration decisions is best earried out with a model that ineorporates faetors at both the micro, or individual/household, and the areal, or struetural, levels. Omission of either of the subsets of explanatory variables is thus seen as resulting in misspeeified equations and biased estimates of eausal relationships.? Moreover, sinee areal variables often closely approximate poliey instruments and are important for government planning, their omission, eustomary in many previous analyses of the determinants of migration decisions, limits the poliey implieations that ean properly be drawn. Most evidenee to date on the determinants of patterns of rural-urban migration in Latin Ameriea has been derived from macro-level studies based on aggregated eensus data.' Though household surveys have provided the basis for micro-level analyses of the determinants of migration in a few countries (see Balan, Browning, and Jelin, 1973; DaVanzo, 1976; Romero and Flinn, 1976; and others eited in Bilsborrow, Oberai, and Standing, 1984), there has been little systematie analysis ofthe efIeets of miero- and areal-level faetors based on merged household survey and eontextual data. In this paper we illustrate the use of merged miero and aggregate data to investigate the separate efIeets of individual, household, and eontextual faetors on migration. The particular applieation is to individuals moving from the rural Sierra to 191
Transcript of The impact of origin community characteristics on rural-urban out-migration in a developing country

DEMOGRAPHY© Volume 24, Number 2 May 1987
THE IMPACT OF ORIGIN COMMUNITY CHARACTERISTICSON RURAL-URBAN OUT-MIGRATION IN ADEVELOPING COUNTRY
Richard E. BilsborrowCarolina Population Center and Department of Biostatistics, University of North Carolina, ChapelHili, North Carolina 27514-3997
Thomas M. McDevittInternational Statistical Programs Center, U.S. Bureau of the Census, Suitland, Maryland
Sherrie KossoudjiPopulation Studies Center, University of Michigan, Ann Arbor, Michigan 48109
Richard FullerCarolina Population Center and Department of Sociology, University of North Carolina, ChapelHili, North Carolina 27514-3997
INTRODUCTION AND PURPOSE
Considerable evidenee has aeeumulated during the past two deeades indieatingthat in developing countries, migration from rural areas is influeneed by high rates ofrural natural inerease, inequitable land distribution, inadequate rural employmentopportunities and ineomes, and large difIerenees in ineome and amenity levelsbetween urban and rural areas (Bilsborrow, Oberai, and Standing, 1984; Firebaugh,1979; International Development Research Centre, 1977; Peek, 1980; Shaw, 1974).Many households are "pushed" by eeonomie eonditions to leave the rural sector.Others are attracted by better eonditions in urban areas. Although migrationdeeisions are made in the eontext of prevailing institutional and struetural labormarket eonditions, loeal wealth-property relationships, and geographie disparities ineeonomie opportunities and services, the eharaeteristies ofthe potential migrant andhis/her household are also important (Bilsborrow, 198Ia,b; Oberai and Bilsborrow,1984; Wood, 1982).1
As a result, the investigation of faetors influencing migration decisions is bestearried out with a model that ineorporates faetors at both the micro, orindividual/household, and the areal, or struetural, levels. Omission of either of thesubsets of explanatory variables is thus seen as resulting in misspeeified equationsand biased estimates of eausal relationships.? Moreover, sinee areal variables oftenclosely approximate poliey instruments and are important for government planning,their omission, eustomary in many previous analyses of the determinants ofmigration decisions, limits the poliey implieations that ean properly be drawn. Mostevidenee to date on the determinants of patterns of rural-urban migration in LatinAmeriea has been derived from macro-level studies based on aggregated eensusdata.' Though household surveys have provided the basis for micro-level analyses ofthe determinants of migration in a few countries (see Balan, Browning, and Jelin,1973; DaVanzo, 1976; Romero and Flinn, 1976; and others eited in Bilsborrow,Oberai, and Standing, 1984), there has been little systematie analysis ofthe efIeets ofmiero- and areal-level faetors based on merged household survey and eontextualdata.
In this paper we illustrate the use of merged miero and aggregate data toinvestigate the separate efIeets of individual, household, and eontextual faetors onmigration. The particular applieation is to individuals moving from the rural Sierra to
191

192 DEMOGRAPHY, volume 24, number2, May 1987
urban destinations in Ecuador. In this and other papers, we have attempted not onlyto separate and quantify the effects of individual and contextual/structural factors onout-migration in this setting but also to illustrate the value of multi- or cross-levelanalysis for enhancing our understanding of contemporary patterns of urbanizationin developing countries in general.
It is important to clarify at the outset a fundamental characteristie of householdsurveys vis-ä-vis the analysis of the determinants of migration, because the collection and analysis of household survey data appropriate for migration confronts anumber of serious methodological difficulties that do not exist for fertility ormortality. Most migration surveys have been carried out only in destination areas(e.g., the capital city); that is, information is collected on (in-) migrants andnonmigrants in areas to which the migrants have moved (see Bilsborrow, Oberai, andStanding, 1984:ch. 4). The focus here, in contrast, is on the effects of origincharacteristies on out-migration from rural to urban areas, based on survey datacollected in origin areas. In origin areas, one encounters two types of households:those with out-migrants (the head of household and/or other members remainingbehind in the origin) and those without out-rnigrants. This provides data appropriatefor investigating why some households have out-migrants and others do not. Butwhen the whole origin household has migrated, there is no one left in the area toreport details on the circumstances surrounding their departure. Information fromformer neighbors, even propinquitous, is rarely reliable. Therefore, an origin areasurvey can provide reliable information for analyzing the determinants of outmigration only ofindividuals, not households. In future research we hope to combineinformation from origin and destination area data to investigate factors influencingrural-urban migration of complete households. Though the present analysis does notdeal with the determinants of all rural-urban migration in the Sierra, it does deal witha large component and specifically focuses on those individuals most likely tomigrate (sons and daughters aged 12-25 at the time of their migration).
Although the data do not permit an analysis of the determinants of householdmigration, this does not mean that the conceptual approach is individualistic.Migration of individuals is explicitly viewed here as influenced by household factorsand hence to some degree reflects household decisions. The approach draws on thesubstantial body of sociologieal, economic, and demographic literature that viewsmigration decisions-together with other demographie, work, and time allocationdecisions-as resulting from a complex process of interrelated household decisions(e.g., see Becker, 1976; Bilsborrow, 1981b; Burch, 1979; DaVanzo, 1976; David,1974; DeJong and Gardner, 1981; Easterlin, 1980; Mincer, 1978; Nerlove andSchultz, 1971;Oberai and Bilsborrow, 1984; and Schultz, 1981). Migration decisionscan be viewed as part of a household survival-or sustenance strategy (Roberts, 1985;Standing, 1985; Wood, 1982). Relating the migration decision explicitly to otherhousehold decisions is beyond the scope of the present paper, whose focus is on theextent to whieh origin area or contextual factors-reflecting certain aspects ofstructural conditions in areas of origin-affect out-migration tendencies. A broader,multi-equation model may be particularly important in studying the determinants offemale migration, given its more obvious linkages to household size, fertility, andtime allocation and earnings of other household members. Specifically, a betterunderstanding of female migration is sorely needed. Recent references indieatingempirical research needs more than successes are Thadani and Todaro (1984),International Migration Review (1984), and references cited therein.

Origin Impacts on Migration in Ecuador 193
SETTING
As groundwork for discussing the model that folIows, we briefly describe relevantaspects of the rural economy and population movements in the study area. Ecuadorcomprises three regions: the Costa, or tropical coastal lowlands; the Sierra, orhighlands; and the Oriente, largely Amazon jungle. The Sierra region comprises 10of Ecuador's 19 provinces and is inhabited by roughly half of the country'spopulation. Topographie, climatic, cultural, and even linguistic barriers restrict, butdo not eliminate, migration among regions. Population movements within the Sierrainclude daily commuting to work in both urban and rural locales, seasonal andtemporary migration, and more permanent movements, particularly from rural tourban areas (Ecuador, Consejo Nacional de Desarrollo, 1985;Gaude, 1981; Peek andAntolinez, 1980; Preston, 1978).
Patterns ofDevelopment; Patterns of Movement
The character, direction, and volume of rural-urban migration in the Sierra duringthe past two decades has been shaped by patterns of economic growth and declinein the agro-export, oil export, manufacturing, construction, and service sectors andby far-reaching modifications in agrarian structure (Commander and Peek, 1986;Peek, 1981; Peek and Antolinez, 1980; Proafio, 1978). During the 1950s and 1960seconomic growth resulted from expanded production of bananas and other exportcrops and was concentrated in the coastal region, on large plantations, and in theindustrial and maritime center of Guayaquil, the largest city in the country. As aresult, a substantial number of persons relocated from the Sierra to the Costa duringthis period (Commander and Peek, 1986; Middleton, 1979). Patterns of movementwere significantly altered during the latter 1960s and the 1970s, first by aseries ofland reforms, beginning with the 1964 Land Reform Law, and then by the oil-ledexport boom, which began in 1972. Even though the 1964 land reform had only aminor impact on the distribution of land, it contributed to a major shifting ofrelationships linking the agrarian population to the land. Specifically, abolition of thehuasipungo (servant labor) system and increased seasonality of labor needs associated with expansion of certain crops led to some substitution of temporary forpermanent labor on larger farms (Commander and Peek, 1986; Peek and Antolinez,1980). At the same time, the growth ofthe capital, Quito (the main city in the Sierra),and spillover effects associated with the oil boom led to a large increase in labordemand in urban areas, particularly in the construction and service sectors. Theurban population ofthe Sierra has, therefore, continued to grow much faster than therest of the region since the 1960s. This is seen as a rnajor problem in recent nationaldevelopment plans.
To understand rural-urban migration from farm households, it is first necessary tounderstand certain aspects of the Sierran economy. Consider first the processreferred to in the literature as the "rnarginalization of the minifundios. " Commanderand Peek (1986) characterized agriculture in the Ecuadorian Sierra in the 1970s ashaving reached "a stage of involution where little additional agriculturallabor can beabsorbed."4 Land scarcity and population growth had led to high levels of laborintensity on the smaller plots. At the extreme, that is, for the many very smallholdings, less than one-fourth of total available labor time is absorbed on the farm.Peasant households are often forced to enter into sharecropping, temporary laborhiring-out, and other arrangements to supplement on-farm income. Families holdingthe smallest amounts of land [less than 1 hectare (ha.)] participate to a greater extentin the off-farm labor market than minifundia households with slightly larger holdings

194 DEMOGRAPHY, volume 24, number 2, Moy1987
(2-4 ha.; Commander and Peek, 1986). But many peasant households can surviveonly by permanent out-migration of family members who often, in turn, send backremittances.
A second characteristic of the rural economy is the role of urban and rural(off-farm) labor markets in the absorption of this agricultural labor surplus. Large(i.e., over 100 ha.) and medium-sized farms continue to represent a source of labordemand, but only about 15 percent of the estimated labor surplus from small farmsis actually absorbed on these farms (Commander and Peek, 1986). Some is alsoabsorbed by the growing small-farm (2-4 ha.) labor market. Temporary employmentin urban areas (e.g., construction) has, however, increasingly provided an alternativeoutlet, replacing seasonal or temporary employment on medium and larger farms inimportance. The availability of off-farm employment in a given area within andoutside agriculture should, therefore, be included in any model ofrural out-migrationin the Sierra.
A third feature is the special attractiveness of the Quito labor market andconsequently the importance of proximity to Quito as a determinant of the volumeand permanence of movement in the Sierra. The importance of distance in understanding migration is well established. Statements on the relationship betweendistance and migration date back at least as far as Ravenstein (1885), and thisrelationship has been illustrated in Latin America by Thomas and Croner (1975) andothers.
This point is related to a fourth characteristic, the enormous disparities inamenities and facilities between rural and urban areas. Despite the benefits of the oilboom, beginning in 1973, relative deterioration occurred in employment and wageconditions in rural areas during the 1970s, adding to the vast structural disparitiesbetween urban and rural areas (Commander and Peek, 1986). Increasing recognitionof these disparities, as a result of considerable improvements in transportation andcommunications systems and the expansion of education, is undoubtedly alsoimportant in contributing to rural-urban migration. For example, in 1974 (the censusprior to the migration movements to be studied) the percentage of dwellings withelectricity was 84 in urban areas, 12 in rural; the percentage of population with lessthan 6 years of education (completed primary) was 30 in Quito and Guayaquil, 40 inother urban areas, and 70 in rural areas; the percentage of births receiving medicalattendance was 65 in urban areas, 15 in rural; and reported female labor forceparticipation rates (ages 15-49) were nearly twice as high in urban as in rural areas(Bilsborrow and Foley, in press; IBRD, 1979). In its country assessment the WorldBank called sectoral dualism the most serious problem facing Ecuador.
SPECIFICATION OF ESTIMATION MODEL
In the balance of this paper we examine decisions contributing to long-termrural-to-urban migration flows originating in the Sierra, specifying and estimating amodel that includes individual, household-level, and contextual variables andfocuses on economic motivations for moving. Economically motivated migration isundertaken here, as elsewhere in the developing world, in response to perceivedlocation-specific opportunity differentials. For the majority of Sierra farming households, migration is one of several possible responses to household stress resultingfrom a low land-labor ratio. Tbe decision to migrate (or not) is influenced bycontextual factors, such as local off-farmemployment opportunities and proximity tothe Quito labor market, and noneconomic considerations, such as the availability ofamenities in the area of residence.
Migration decisions thus are based on a process whereby an individual in

Origin Impacts on Migration in Ecuador 195
household j in community k takes into account information at all three levels. Thesimplest form of a general multilevel model of individual migration is then of the form
where Mijk refers to the probability of migration of the ith individual in the jthhousehold in the kth community and Xijk, Xj h and X; refer to individual-, household-,and areal-level characteristics, respectively.
The dependent variable is a simple binary choice variable: to migrate or not fromthe rural area.' We choose a probit specification, which implies anormal cumulativeprobability density function for the critical value function. The characteristics andassumptions for a binary probit are weIlknown and need not be reviewed here (Judgeet al. , 1980; Maddala, 1983).6
We specify the (potential) migrant's decision as a function of variables measuredat the following three levels:
Individual-level variables
Age: AGE
Education (years completed, operationalized as a set of dummy variables toallow for possible nonlinearities): EDUCATION
Marital status: MSTAT
Household-level variables
Land owned by the farm household": LAND
Adults in the household (aged 12 and over): ADULTS
Areallcontextual variables
Distance to Quito: DIST-Q
Agriculturallabor absorptive capacity of the area: LABAB
Size of the local urban labor market: URBEMP
Indicator of level of services or amenities in the area: the proportion of ruralhouses without electricity": NOELEC
SOURCES OF DATA
In 1977-1978 a survey of internal migration was carried out in the EcuadorianSierra by the Instituto Nacional de Estadistica y Censos (INEC, 1978), with financialand technical support from the World Population and Employment Programme of theInternational Labour Office in Geneva. The survey was designed to produce a dataset that would support methodologically innovative work on migration. It used aprobability sampie covering a major portion of the country, including both origin anddestination areas (and both rural and urban areas), collected information aboutnonmigrants as weIl as in- and out-migrants, used specialized sampling techniques toselect a large number of recent migrants, and collected detailed information frommigrants about economic and other conditions before and after the move.
The micro-level data used here are from the rural portion of the INEC-ILO

196 DEMOGRAPHY, volume 24, number 2, May 1987
survey, comprising a sample of 3,427 households representative of the rural Sierrapopulation. Earlier analysis documented some of the correlates of households without-migrants and the characteristics of out-migrants (Peek and Antolinez, 1980).However, no multilevel analysis has been undertaken previously on these data.
The areallstructural data are from a wide variety of published sources. Principalamong these are the 1974 Census of Population, the 1974 Census of Agriculture, anda farm labor survey in the Sierra carried out by the Ministry of Agriculture and theFrench Office de Recherche Scientifique et Technique Outre-Mer (ORSTROM).9 Allareallcontextual variables are measured at the level of the canton (the subprovincialadministrative unit in Ecuador)."
OPERATIONALIZATION
Selection of Population
The analysis presented here refers to all sons and daughters aged 14-27 in farminghouseholds in which the eldest son or daughter was aged 12-25 at the time of thesurvey.'! The subset was selected to reduce possible errors in estimating relationships attributable to unmeasured life cycle effects, prior migration experience, andproblems of measuring wealth in a comparable way in farming and nonfarminghouseholds.
More specifically, we choose to study the odds of being an economicallymotivated, rural-to-urban migrant relative to being a nonmigrant. The additionalrestriction of migrants to those moving to an urban destination results in a loss ofabout 9 percent of total cases in the subsample of sons and daughters.F Therestriction to those classifiable as "economic migrants" excludes approximately 40percent of the out-migrants who were declared as moving for other, non-workrelated reasons, such as education, marriage, to accompany other family members,and so forth. It is not our purpose to enter into a debate regarding what is an"econornic" and a "noneconomic" migrant, specifically how "rnigrants for education reasons" should be classified. To the extent that education is sought to improvelong-run earnings potential, migration for education may be considered as motivatedby long-run economic goals. But migration for education may also have otherunderlying motives-to satisfy a parent, for cultural edification, to enhance one'schances of obtaining a better spouse, and so on. The two categories of economicreasons used here are unabashedly and clearly to "improve one's economic situationas soon as possible." The reader may substitute "work-related" for economic ifdesired.P
In table 1 we present reasons for migration of sons and daughters, as indicated ina response by a remaining household member, usually the household head (father).Overall, the percentge of economic migrants is higher among males than females (69percent vs. 54 percent). The difference is not so large, however, and the fact thatmore than half of the daughters are reported as having economic reasons suggeststhat factors influencing female migration in Latin America are not as different fromthose influencing male out-migration as is commonly supposed. Moreover, thepercentages moving for education reasons are the same. The major difference is thelarger percentage offemales reported as moving for personal reasons (15 vs. 2). Wewill see below that in fact, marital status is a far more important determinant ofmigration for females than males even among those reported as migrating foreconomic reasons.
The intent of the INEC-ILO survey was not to measure migration propensities perse but to facilitate analysis of the determinants of differential propensities. There-

Origin Impacts on Migration in Ecuador 197
Table 1.-Classification of Rural to Urban Migrant Sonsand Daughters, by Reason for Moving
Sons Daughters
% % % %Category No. unweighted weighted* No. unweighted weighted
Economic migrants 464 69.2 69.8 271 53.9 52.0Not enough work 376 56.0 56.5 239 47.5 44.4Not enough
income 88 13.1 13.3 32 6.4 7.6Noneconomic
migrants 207 30.8 30.2 232 46.1 48.0To attend school 153 22.8 22.9 116 23.1 22.6To be with
friends/relatives 14 2.1 1.9 76 15.1 17.4Other 40 6.0 5.4 40 8.0 8.0
Reasons missing 3 6Total migrants 674 100.0 100.0 509 100.0 100.0Nonmigrants 1,276 1,081Total 1,950 1,590
*Weighled by lhe inverse probabilily 01 seleclion.
fore, households with out-migrants and those with relatively large landholdings wereboth oversampled to ensure adequate sample sizes for the relevant subgroups, sincethe number of households with less than 5 ha. was many times that with largerholdings in all Sierra provinces (characterized by minifundia). Thus for the stratawith less than 5 ha., all households that had arecent rural-urban out-migrant wereselected (oversampled), whereas all households with more than 5 ha. were selected,whether or not they had arecent out-migrant (Lasprilla, 1978; Bilsborrow, Oberai,and Standing, 1984:ch. 4; see also note 15). Household selection probabilities werethus determined differently for the two landholding strata. The weighted sampledesign effectively led to larger proportions of rural households with (a) quite recentrural-urban out-migrants and (b) more than 5 ha. of land, as is evident in table 1.Therefore, our analyses are carried out separately for the two strata to remove theinfluence of sample design; separate analyses facilitated by the large sample alsoallow the examination of differences in the effects of landholding size on migrationwithin the large and small farm groups.
Construction 01 Variables
Migrants are defined as persons aged 12 and above who had left the ruralparroquiawithin the previous 5 years. The 5-year cutoff was chosen to focus on recentbehavior and to ensure higher quality retrospective data (less memory recall error).Measurement of most of the individual and household-level independent variablesand NOELEC is straightforward; however, some explanation may be useful in thecase of the education variables, the household-level variables, and the othercontextual variables. Recall that the areal variables are measured at the canton level.
EDI and ED2. These dummy variables were created to capture the effect ofeducational attainment on migration propensity. EDI takes a value of 1 if therespondent completed less than 6 years of schooling (less than a primary school

198 DEMOGRAPHY, yolume 24, number 2, May 1987
certificate) and is 0 otherwise. ED2 takes a value of 1 if the respondent completed 7or more years of schooling and is 0 otherwise. The prevailing thought on the subject,particularly that based on empirical tests ofhuman capital migration models, predictsa negative EDI coefficient and a positive ED2 coefficient.
LAND. Though emphasis in the literature is on the distribution of land, anddiscussions of the viability of farming units are couched in terms of farm size," it isclear that the farm household's ability to use its labor efficiently and support itsmembers depends on land held in relation to labor. Thus the measure of householdresources adopted, LAND, is the amount of land owned by the household (inhectares)."
ADULTS. This variable refers to the number ofpersons aged 12and above in thehousehold (before the recent out-migration, in the case of households with outmigrants). ADULTS was created by reconstructing the household at a timeapproximating the migration decision point, adding out-migrants back into thehousehold and subtracting in-migrants (though only about 5 percent ofthis sample ofrural households had in-migrants in the 5 years before the study).
DIST-Q. The relationship between proximity to Quito and propensity to move iscaptured by inclusion of a simple distance variable. We developed a measure of(road) distance in kilometers from the canton capitals that adjusts for the quality ofthe road and topography to obtain a measure more akin to time distance."
LABAB. The agriculturallabor absorption capacity of an area is measured by (a)the actual off-farm temporary and permanent worker days per hectare for each farmsize category at the province level (from Ministry of Agriculture-ORSTROM; seeSources of Data) divided by (b) the number of rural residents over age 15per hectarein each canton of the province, weighted by the land distribution at the canton level(from 1974Census of Agriculture). The variable may be interpreted as an answer tothe question, "How many days on the average might a person expect to work overthe course of a year as an agriculturallaborer in the canton?"
URBEMP. The extent of off-farm employment in a given locale indicatesavailability of opportunities for supplementing farm incomes. The increasing importance of non-farm employment as a source of income for farm families in developingcountries in general was documented by Anderson and Leiserson (1980). Off-farmemployment includes both agricultural (captured by LABAB) and nonagriculturallabor. The less available is off-farm employment relative to the total agriculturallabor surplus, the greater is the likelihood of out-rnigration. Nonagricultural off-farmemployment in the Sierra is almost entirely in urban areas. A relevant specificationfor URBEMP is therefore the ratio of the size of the local urban labor market,measured as urban residents employed in nonagricultural occupations in the canton,to the total economically active canton population aged 15 and above. URBEMP iscalculated separately for males and females.
In table 2 we present the means of the model variables for sons and daughters,comparing economic migrants with nonmigrants. Clear differences between sons anddaughters emerge across various variables. For example, daughters who out-migrateto urban areas are like1y to be slightly younger than sons, are less likely to bemarried, and have significantly lower education (the difference being even greaterthan that between non-migrant daughters and sons).'? We also observe someintriguing differences in household-level variables: economic migrants came fromlarger households (higher numbers of adults). On farms with less than 5 ha. of ownedland, migrants come from relatively larger farms, whereas among farms of more than5 ha., they came from smaller farms. This may imply a bivariate inverted U-shaped
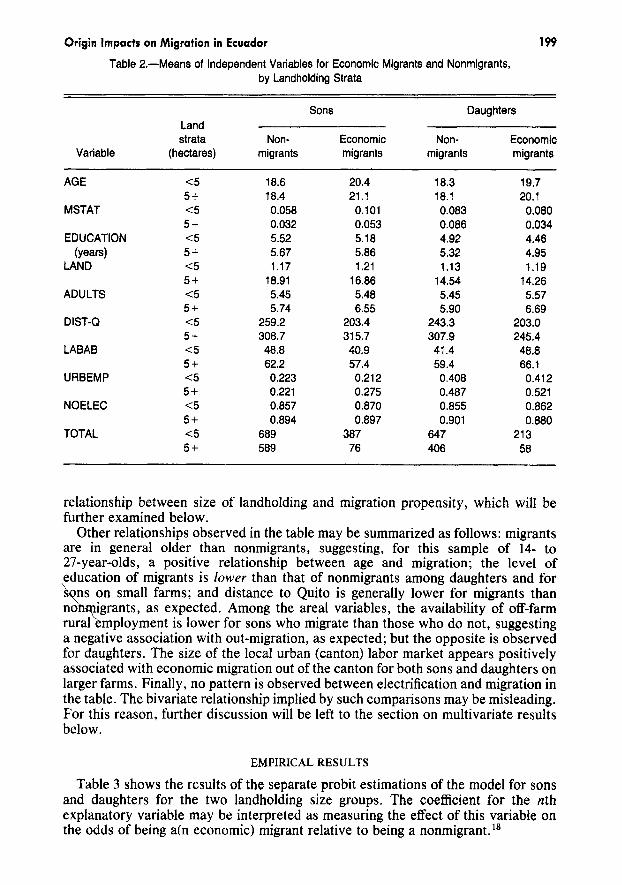
relationship between size of landholding and migration propensity, which will befurther examined below.
Other relationships observed in the table may be summarized as folIows: migrantsare in general older than nonmigrants, suggesting, for this sampie of 14- to27-year-olds, a positive relationship between age and migration; the level ofeducation of migrants is lower than that of nonmigrants among daughters and for
~s on small farms; and distance to Quito is generally lower for migrants than
no igrants, as expected. Among the areal variables, the availability of off-farmrural mployment is lower for sons who migrate than those who do not, suggestinga negative association with out-migration, as expected; but the opposite is observedfor daughters. The size of the local urban (canton) labor market appears positivelyassociated with economic migration out of the canton for both sons and daughters onlarger farms. Finally, no pattern is observed between electrification and migration inthe table. The bivariate relationship implied by such comparisons may be misleading.For this reason, further discussion will be left to the section on multivariate resultsbelow.
EMPIRICAL RESULTS
Table 3 shows the results of the separate probit estimations of the model for sonsand daughters for the two landholding size groups. The coefficient for the nthexplanatory variable may be interpreted as measuring the effect of this variable onthe odds of being a(n economic) migrant relative to being a nonmigrant. 18

200 DEMOGRAPHY, volume 24, number 2, Moy 1987
Table 3.-Factors Inlluencing the Probability 01 Rural-UrbanOut-Migration: Probit Parameter Estimates and t Values
(in parentheses)
Sons Daughters
Less than 5 5 or more Less than 5 or moreVariable hectares hectares 5 hectares hectares
AGE +0.103*** +0.154*** +0.078*** +0.098***(8.033) (6.391) (5.330) (4.023)
EDl -0.234*** -0.741*** +0.186' +0.109(2.625) (3.859) (1.811) (0.623)
ED2 -1.056"* -0.635** -0.754'*' -0.761**(6.389) (2.255) (3.351) (2.322)
MSTAT +0.003 -0.192 -0.378** -0.998'**(0.039) (0.519) (2.059) (2.501)
LAND +0.136** - 0.017*** +0.061 -0.006(2.294) (3.278) (0.861) (0.881)
ADULTS -0.006 +0.137*** +0.026 +0.142***(0.269) (3.323) (0.961) (3.113)
DIST-Q - 0.001*, -0.003"* -0.000 -0.000(2.563) (4.867) (1.025) (0.709)
LABAB -0.003*** -0.004* +0.003** +0.002(3.125) (1.819) (2.288) (1.095)
URBEMP +0.065 +8.070*** -0.066 +0.394(0.263) (6.148) (0.262) (0.588)
NOELEC + 1.480'" +22.883'" +0.638 -1.084(2.574) (5.473) (1.124) (0.440)
LAND x -0.000** +0.000*" -0.000 +0.000DIST-Q (2.478) (3.518) (1.544) (0.964)
-2 x log 01Iikelihood ratio 179.24 126.97 69.98 46.90
DegreesofIreedom 11 11 11 11
Sampie size 1,076 665 860 464Nonmigrants 689 589 647 406
Note: Totals may not exactly rnatch those in table 1 because of missing data. Also,the implied proportions of migrants in the two land-size categories are notcomparable because of the sampling procedures used (see Sources of Datasection).
'Significant at the 0.10 level, two-tailed t test."Significant at the 0.05 level, two-tailed t test.
"'Significant at the 0.01 level, two-tailed t test.
Let us begin with the individual-level variables (AGE, EDI and ED2, and themarital status dummy variable, MSTAT). A number of the signs are different fromwhat one would expect on the basis of standard economic theories of migration.First, the effect of AGE is positive and significant for both sons and daughters, inboth farm size categories. Normally, one expects the effect to be negative, sinceyounger migrants face greater lifetime returns to movement andoften lower costs ofrelocation. The peculiar result here is simply a consequence of our restriction of the

Origin Impacts on Migration in Ecuador 201
sampIes to sons and daughters aged 12-25at the time of the move. Children in theirearly teens migrate less often than older teenagers.
The signs for EDI and ED2 are also not fully consistent with expectations: thecoefficients of both are negative and statistically significant for sons. This impliesthat migration propensity peaks at the primary-certificate level for males, withfurther education associated with lower out-migration. More surprising is thecoefficient pattern for daughters: the least educated daughters were most likely tomove, the opposite of what one would expect from the human capital model. Apartial explanation may be that urban employment opportunities for women areconcentrated at the lower end of the services sector (e.g., domestic service orhousehold servants). This would tend to attract mainly lower socioeconomic status,less educated daughters. A second explanation has to do with the fact that we areinvestigating factors influencing economic migration. The more educated daughters(and sons) may relocate more often for non-work-related reasons (e.g., to furthertheir education), in which case they are excluded from the majority pool of migrantsstudied here. But the fact that education does not have the simple positive effects onrural-urban out-migration suggests a need for reexamination of the applicability ofthe human capital model to developing countries, particularly for females.
Quantitative studies of the determinants of migration have rarely had access to orused data on motives for migration, though its use has been suggested before (e.g.,Shaw, 1975:107ff). Evidence here suggests that the usual selection argument foreducation as a factor positively influencing rural-urban migration, deriving from thehuman capital approach that sees the more educated as having greater employmentopportunities in urban areas, is incorrect. It is the less educated who move almostentirely for economic reasons, because they have to. Those with higher educationcan afford to move for noneconomic reasons. In Ecuador (and other developingcountries) among these other reasons is the desire to obtain more schooling, sincepostprimary schools are concentrated in urban areas. These results for education,however, merit further examination, and the suppositions here will be explored infuture research.
The last individual variable, marital status (MSTAT), is found to influencenegatively the out-migration of daughters but not sons. The effect for daughters issignificant at the 0.05 level for those from small farms and at the 0.01 level for thosefrom large farms. Being married or in a consensual union decreases the likelihood ofmigrating for daughters, although it has no effect for sons. These results are asexpected.
Turning to the household-Ievel variables, we find the effect of LAND on migrantstatus to be significant for sons from large and small farms but not significant fordaughters, although the sign pattern is the same. (The interaction of LAND withDIST-Q is discussed below.) For large farms, the effect of land is negative,supporting the hypothesis that sons tend to remain in the origin household whensufficient land is available to require their labor. For small farms, however, theamount of land owned was found to positively influence the odds of a son's being amigrant. There are two possible interpretations of this positive relationship for smallfarms. Since farms of less than 5 hectares are insufficient to employ the labor of anaverage household in the Andes (see Setting), variations in land owned bv very smallfarmers may simply indicate whether or not the family has any resources. Becausethere are money and information costs of migration, this positive effect may reflectthe relative ability to mobilize the resources necessary for the move of a householdmember. Such a finding paralleis that of Roberts (1985) for Mexico and hastheoretical support in David (1974). An alternative explanation is that those with tiny

202 DEMOGRAPHY, volume 24, number 2, May 1987
landholdings are basically not farm families and derive most of their income fromoff-farm labor earnings. Both explanations probably have some merit. In any case,the findings are quite different from those of Peek and Antolinez (1980), whoobserved a U-shaped relationship between land and out-migration propensities basedon a two-way table. The effect here is more of an inverted U, with low migrationpropensities for those with 0-1 and 50 or more ha. and highest values at around 3-10ha. We return to the land-migration relationship at the end of this section.
The number of adults (ADULTS) in the household appears to be a very significantdeterminant of migration for sons and daughters from large, but not small, farms.Insofar as the amount of land owned is an indicator of household resources and laborabsorptive capacity, ADULTS represents the number of individuals taxing thoseresources and competing for labor opportunities. Other things equal, sons ordaughters in large households are more likely to look elsewhere for work. The lackof significance of the ADULTS variable below 5 ha. is not surprising, inasmuch asmost LAND-to-ADULTS ratios on farms ofthis size are uneconomical in any case.
Of special interest in this paper are the effects of the areal-level variables. All fourcommunity-level variables are found to influence in some fashion the odds of beingan economic migrant. The effect of distance to Quito (DIST-Q) is negative andsignificant, as anticipated, for sons but not significant for daughters. Since Quito isthe main cynosure in the Sierra, we expected that proximity to it would influencemigration of both sexes. The results for daughters may imply that its relative powerof attraction for daughters is so powerful (far greater female employment opportunities than in the small cities in the Sierra, as well as superior amenities, morepersonal freedom, etc.) that even being far away is not a determining barrier.
The rural labor absorptive capacity (LABAB) in the canton appears to act as afactor retaining sons, especially those from small farms: the parameter is significantat the 0.01 and 0.10 levels, respectively, for small and large farms. This is exactlywhat one would expect. Local agricultural labor opportunities should be moreimportant for individuals residing on farms where land is inadequate to use theirlabor. The peculiar positive relationship between LABAB and migrant status fordaughters may reflect that off-farm agricultural labor is not considered sociallyappropriate for daughters, or that the demand is for male workers. In those areascompletely dominated by agriculture, with perhaps few local urban nonagriculturalemployment opportunities, daughters on small farms may have no choice but to lookelsewhere for work.
The ratio of urban nonagricultural jobs (URBEMP) to canton population carriesmixed signs for the four sex-landholding classes. This is not altogether surprising, asthe variable plays a dual role in the model: the availability oflocal urban employmentmay deter movement from the canton to larger urban centers. At the same time, itmay encourage intracanton movement-included in rural-urban movement in thisstudy-and commuting and thus provide employment experience and tastes that leadto future stagewise migration: Experience working in local urban areas may provideboth skills and contacts necessary for moving to larger urban areas. Migrants fromwealthier households (i.e., from larger farms) are more likely to be able to afford andparticipate in such a stagewise migration process.
The proportion ofrural households without electricity (NOELEC) in the canton ispositively related to migration decisions. This is true for sons on both large and smallfarms and, to a lesser extent, daughters on small farms. As an indicator of lack ofamenities or lack of development, NOELEC complements the employment variablesby illustrating another important dimension ofthe "push-pull" mechanism involved

Origin Impacts on Migration in Ecuador
MIG
203
0.23
595
eiSTe
305
15
O. OB
0'151~~~ ass
0.00
Figure l.-LAND x DIST-Q Interaction for Sons From Large Farms.MIG is estimated migrant propensity.
in migration in developing countries, the importance of amenities. No readyexplanation suggests itself for the lack of significant etfects for daughters.
Although the relationships between the dependent and independent variables inour model are not uniform across the four groups, the results clearly indicate thatcornmunity-Ievel factors play a role in migration decisions of rural households inEcuador. To determine the exact form of these relationships, we examined a widerange of theoretically plausible cross-Ievel effects involving model variables. Onlyone interaction term, indicating the interaction of land owned and distance to Quito(LAND x DIST-Q), appeared consistently enough to be included in the final modelpresented in table 3. Tbe presence of this effect requires tbat the main effects forLAND and DIST-Q be reexamined.
The composite relationship between LAND, DIST-Q, and migrant status may bevisualized by substituting mean values for all independent variables in the estimatedregression equations and allowing LAND and DIST-Q to vary (figs. 1 and 2, for sonsfrom large and small farms, respectively). This generates a grid of expectedmigration propensities for all LAND and DIST-Q combinations. In each figure theestimated propensity to migrate is sbown along the vertical axis with the compositerelationship between LAND, DIST-Q, and migration measured by the height of thepropensity surface above the LAND x DIST-Q plane. The relationship of eachindependent variable to the dependent variable is sbown to depend on tbe value ofthe other independent variable.
Thus figure 1 for tbe large farms shows a strongly negative relationship betweendistance and propensity to migrate for the relatively smaller farms of 5-30 ha. (theimplied migration propensity-distance plane at the right side of the graph) but asmall, positive association for the largest farms (a slight upward slope at land = 100).With reference to the LAND baseline (i.e., the migration-land plane), the compositerelationship between land and migration is strongly negative for households close toQuito (indicating a dominant land-labor effect for households proximate to thecapital) but weakly positive for farms farthest from Quito (implying some ability-tofinance-a-move effect). The weakness of the latter relationship may also be attributable to the preferences of migrants in these provinces farthest from Quito (Loja,Azuay, and Caiiar) to migrate to tbe Costa region: Roughly half of the migrants fromthe sampIe households in these provinces chose the Costa rather than Quito as a

204 DEMOGRAPHY, volume 24, number 2, May 1987
MIG
0.64
0.43
0.22
LAND
5.00
0.01 J-__
BB5I. 67
595
DISTIJ305
150.00
Figure 2.-LAND X DIST-Q Interaction for Sons From Small Farms.MIG is estimated migrant propensity.
destination (see also Ecuador, Consejo Nacional de Desarrollo, 1985). The composite picture shows sons from farms nearest to Quito and with little land to be by farthe most likely to move. Conversely, sons on farms farther from Quito or with theleast resources are either unable or unwilling to move. Others (sons from largerlandholding families at varying distances from Quito) exhibit an intermediate butrelatively low likelihood of movement.
Figure 2 represents the LAND x DIST-Q interaction for sons from small farms(less than 5 ha.). The overriding relationship depicted is again the negative onebetween DIST-Q and propensity to migrate: for all land ownership values, sonsliving farther from Quito are less likely to migrate than those from households nearerthe capital. There is a strong, positive relationship between land owned andpropensity to migrate for those close to Quito (the ability-to-finance-a-rnove effect),but the relationship quickly becomes less pronounced with distance from Quito. Forhouseholds located far from Quito, the surface slopes gently downward as landowned increases from 0 to 5 hectares, indicating a weak negative relationshipbetween land and migration propensity. In other words, for farms far from Quito,those with no land are marginally more likely to leave the farm, perhaps for the moreattainable Costa, than those with small amounts of land.
The overall relationships observed in figures 1 and 2 indicate not only the generallynegative relationship between distance and migration propensity, as pervasivelyfound in the literature, but also that this relationship depends on and is attenuated by(increasing) land size. In fact, it disappears above some medium size (30--50 ha.).And the relationship between landholdings and migration propensity is roughly thatof an inverted U, with households having land in the range of 2-20 ha. most likely tohave individual out-migrants. But this relationship also depends on distance. In sum,both relationships, between landholdings and (out-lmigration and between distanceand out-migration, are more complex than is usually supposed and warrant morecareful attention than has been customary.
It is useful to extend the interpretation of the findings for other coefficients as wellto see what they represent in terms of changing the propensity to migrate. The

Origin Impacts on Migration in Ecuador 205
lable 4.-Effects of Simulated Changes in Selected ExplanatoryVariables on the Probability of Recent Out-Migration 01Sons and
Daughters, Sierra Region 01 Ecuador (changes in probability)*
Sons Daughters
Less than 5 or more Less than 5 or moreEffect 01 5 hectares hectares 5 hectares hectares
Increasing age byone year +0.039 +0.016 +0.024 +0.018
Increasing educationfrom less thanprimary to primarycomplete +0.090 +0.064 +0.060 (+0.022)
Increasing educationIrom primarycomplete to morethan primary -0.310 -0.054 -0.157 -0.086
Changing maritalstatus Iromunmarried 10married (+0.001) (-0.014) -0.100 -0.094
Increasing adults inhousehold by one (-0.002) +0.014 (+0.008) +0.026
Increasing demandlor off-Iarmagricultural laborby 5 days -0.005 -0.002 +0.004 (+0.002)
Reducing percentage01 rural dwellingswithout electricityIrom 85 to 80 -0.026 -0.040 (-0.009) (+0.009)
'Numbers in parenlheses are derived trom nonslalislically signiticanl coefficienlsand should Iheretore be ignored.
procedure is first to compute the overall probability of recent migration (i.e., ofhaving a son or daughter migrate from the rural household to an urban area within theprevious 5 years) for each of the four land-sex samples by inserting the mean valuesfor all of the explanatory variables in the four predicted regression equations in table3 and using the cumulative normal density function table to derive the overallprobabilities. Then the effect of a change in each of the significant explanatoryvariables may be estimated by substituting the new, hypothetical value in thepredicted regression equation, keeping all other values at their mean values, andcomputing the new simulated values. This amounts to simulating the effect of achange in the probability (i.e., the marginal probability) of a change in each of theexplanatory variables.
The results are shown in table 4. Evidently, they correspond very closely to thoseof table 3. Again, we observe significant increases in the probability of out-migrationfor economic migrants of increasing education from less than primary (with a meaneducation of about 2 years) to a primary school certificate (6 years) but a decrease forthose with more than 6 years. As the proportion in the latter category is small in rural

206 DEMOGRAPHY, volume24, number 2, May 1987
areas of Ecuador, the overall effect of raising rural education is actually to increaseslightly out-migration for economic reasons. (Less than 8 percent of the ruralpopulation had 7 or more years of education in 1977.) The results for marital statusindicate that getting married has a large effect on reducing the probability ofout-migrating for females, by 10 percentage points (the marginal probability being-0.1). Having one more adult in the household has a small effect, increasingout-migration by about 2 percentage points on large farms. Finally, with respect tothe two significant policy-relevant community variables, an increase of 5 days in thedemand for off-farm labor (from a mean of about 50 days per household per year to55) reduces out-migration of sons, but by a considerably smaller amount thanachieved by increasing the percentage of dwellings with electricity. Despite thepossibility of drawing such specific inferences regarding the effects of simulatingchanges in explanatory variables on probabilities of rural-urban out-migration, webelieve it is stretching the empirical results, for reasons indicated at the end of theconclusions.
SUMMARY AND IMPLICATIONS
Although past quantitative research on the determinants of migration decisions haslargely been limited to investigating the effects offactors captured by variables at theindividual and household levels, a number of theoretical and descriptive studiessuggest that the environment or context of the person also has a profound effect onmigration (and other household) decisions.
A standard model of the individuallhousehold determinants is therefore expandedhere to include the effects of several key areallcontextual factors. A sampIehousehold survey of internal migration in the Sierra region of Ecuador was carriedout in 1977-1978. Data from the rural portion are used in combination withareal-level data to investigate factors influencingrecent rural-urban out-migration ofsons and daughters.
Among the results are the following: First, for the individual and householdvariables, older children (above age 20)are more likely to migrate than younger ones,as expected for the young age groups considered. But the effects of education appearto differ from those of previous studies, perhaps because of failure to take intoaccount the motives for migration in previous studies. Thus the effects on economicmigration (migration for work reasons) are generally positive for education up to thecompleted primary level, then negative beyond that. (Reasons for these unorthodoxeducation findingshave been suggested in the foregoing sections.) On the other hand,results for marital status were as expected: Marriage has no effect on out-migrationof sons but a significant negative effect on out-migration of daughters. In addition,the more adults in the household, the greater the out-migration of sons anddaughters, but only on larger farms. This is consistent with the hypothesis that theirlabor is less needed when there are more adults (potential farm workers) available.Finally, the results for land owned are more complex, having no effect on daughters(consistent with their lower participation in farm work) but significant, complexeffects on sons. Specifically, among very small farms, more land is associated withhigher out-migration, perhaps implying that such families are sufficiently above thepoverty level to afford sending a son off to the city or town. The negative relationbetween land size and out-migration of sons on larger farms is consistent with thegreater labor needs on these farms.
The findings for the community variables-of special interest in this paper-showthat distance to Quito has the expected strong negative effect on out-migration onlyfor sons. The extent of availability of electricity in the community (used as a measure

Origin Impacts on Migration in Ecuador 207
of amenities) appears to have a significant effect on deterring out-migration,particularly of sons, as does the availability of off-farm rural employment. Both ofthese findings have potentially significant policy implications. For example, theysuggest that increased (seasonal or permanent) off-farm rural employment-fromincreased agricultural production, rural road construction, and so forth, or from landredistribution or other policies to increase the utilization of land-and reductions indisparities in the provision of amenities and govemment services between urban andrural areas could reduce rural-urban migration ftows. These results contrast withthose for the availability of local urban employment, which does not appear to deterrural-urban out-migration from the canton (area). Indeed, it appears to have apositive effect for sons on larger farms, suggesting it provides them with a taste forurban life and/or skills that leads them to out-migrate to other areas (presumablylarger cities). This hypothesis will be explored further with the partial occupationalhistory data in the survey on out-migrants.
Despite a number of intriguing findings, the results of this paper should not beconsidered as definitive. First, the analysis covers the determinants of out-migrationof individual household members from rural households. It does not cover thedeterminants of (out-)migration of entire households from rural to urban areas, forreasons indicated in the Introduction and Purpose. Moreover, although it does coverthe bulk of individual migration, it excludes those moving for noneconomic reasons,covers only the Sierra, and does not simultaneously consider short-term or seasonalmigration (because data are not availablej.P Therefore, it does not and cannotpurport to be a comprehensive study of the factors inftuencing all rural-urbanmigration movements in Ecuador. Any policy inferences must be carefully tempered. Moreover, and especially important in this context, many additional arealand household-Ievel variables remain to be investigated, and more complex modelswill also be formulated and tested in the future. The findings clearly indicate,however, that areal/structural factors have significant effects on rural-urban migration ftows in Ecuador and, presumably, other developing countries as weIl.
NOTES
I The standard economic (human capital) model of migration focuses on the individual's owncharacteristics (see Sjaastad, 1962; and Todaro, 1976).
2 For discussions of the importance of incorporating the X; into estimated equations, see Bilsborrow(198Ia), Bilsborrow, Oberai, and Standing (1984),and Findley (1981). For an empirical example, based ona small sampie in a single village in the Philippines, with the dependent variable being intentions tomigrate, mainly to the D.S. (international migration), see Lee et al. (1985).
3 The hazards of relying on conclusions based on analyses of aggregate data for an understanding ofindividual behavior are, of course, weil known. The classic statement is that of Robinson (1950).
4 The historical background is set out in Barraclough and Domike (1966),Commander and Peek (1986),Peek and Antolinez (1980), and Peek (1980, 1981).
5 Rural-rural migrants, constituting 9 percent of sampie migrants aged 12and over, have been combinedwith nonmigrants for the purpose of this analysis. Rural-rural migrants usually do not undergo changes inlife style such as those confronted by rural-urban migrants. A sensitivity analysis based on the effects ofexcluding them from the estimation found no difference in the basic results reported below.
6 The general statistical model underlying the single-equation estimation model here is of the form
where Yij is the migration decision (dichotomous variable) of individual i in origin community j, Xij are thevalues of the independent individuaUhousehold variables, Z, is the value of the community variable forcommunity i, a and ßare the unknown coefficients associated with the individual level variables, and 'Yis the coefficient associated with the community variable. If the eij disturbance terms are independently,identically normally distributed random variables with zero mean and constant variance, then the

208 DEMOGRAPHY, volume 24, number 2, May 1987
estimation procedure will yield unbiased, consistent estimates of a, ß,and y. In practice, this means thatthe community and individuallhousehold variables represent different independent concepts. For exampie, we cannot include in the same single equation whether the household has electricity and whether itexists in the community, or wage levels of household members and community wage levels, because thelatter influence the former in each pair. A simultaneous (recursive) model would then be required. Theseissues are discussed in detail in Bilsborrow and Guilkey (1986).
7 Alternatively, land to which the household has access through either ownership, rental, or asharecropping arrangement might have been used. The percentage of households renting land, however,was less than 3 percent, and the use of a more general land resources variable would introduce additionalmeasurement error.
8 Some literature exists on the effects of electrification on rural development, access to consumergoods, fertility, and so on (e.g., see Fluitman, 1983;Herrin, 1979;and Bilsborrow and DeLargy, 1985).
9 See Ecuador, Ministerio de Agricultura y Ganaderia (MAG) and Office de Recherche Scientifique etTechnique Outre-Mer (ORSTOM) (l978a,b), based on a detailed survey of rural households in 1976.
10 There were 120cantons in the country (52 in the 10Sierran provinces) at the time ofthe survey. Themean population ofthe Sierra cantons excluding Quito was about 50,000, roughly similar to the populationof United States counties. Each canton is composed of a number of smaller administrative districts knownas parroquias. There are usually four to eight parroquias per canton.
11 Because the mean length of time since the move for out-migrants is about 2 years, this correspondsto an expected age range of 12-25 years for the at-risk population at the time of the move.
12 This does not mean 91 percent of rural out-migrants move to urban areas; rather, it reflects theparticular sampling scheme used (see Operationalization, and Bilsborrow, Oberai, and Standing, 1984).
13 Education is thought to have such wide-ranging effects that virtually all of the social sciences wantto claim it as their special domain. For example, sociologists generally consider it a social variable undertheir purview, economists have tried to co-opt it with human capital theory, and pyschologists see it ascrucial in attitude/taste formation.
14 See Basile (1974), Comite Interamericano de Desarrollo Agricola (1965), and Commander and Peek(1986).
15 This variable was obtained by using a phase I screening questionnaire administered to all householdsin the selected rural census sector one week before the survey. Information on land available, along withmigrant status, was obtained in this screening in order to oversample households with out-migrants tourban areas or with more than 5 hectares of land. LAND, representing land owned in hectares, differsfrom the land strata variable in that the latter refers to total land available for use.
16 Though not all rural-urban migration in the Sierra is to Quito, nearly half is. We tested alternativemeasures, including the minimum of the distance to the province capital or Quito and mean distance, butnone performed as weil. It may be that Quito is such a dominant city in the Sierra that people are morelikely to consider migrating (anywhere) the closer they are to Quito.
17 The statistic presented at the bottom of each column, -2 x log of the likelihood ratio, has achi-squared distribution and provides a joint test of significance of all coefficients together (except theconstant term). Since the critical value of the chi-squared statistic for these regressions is 23.21 at the Ipercent significance level, it is evident that each regression is highly significant.
18 Note that the value of URBEMP differs substantially between the sexes. This is because thedenominator for females, all women aged 15and above reported as economically active, does not includemost rural women, who are reported as not working even though they may be helping on family farms.Female economic activity is notoriously underreported in surveys and censuses, in Latin America as weilas elsewhere (see Anker, 1983; Wainerman and Recchini de Lattes, 1981). Sons engaged in the sameactivities are generally reported as unpaid family workers and therefore as economically active.
19 On the importance of short-term and seasonal migration and circulation, see Standing (1985) andarticles and references therein.
ACKNOWLEDGMENTS
This is a considerably revised version of a paper presented at the Annual Meetingsof the Population Association of America, March 27-30, 1985, in Boston, Massachusetts. We are grateful to audience participants in the PAA session, anonymousreviewers, and Peter Peek for helpful suggestions and to the Instituto Nacional deEstadistica y Censos (Ecuador) and the International Labour Officefor permission touse the data. We are also grateful for support from National Institute for ChildHealth and Human Development (NICHD) Grant HDI7276-02, NICHD/NRSAGrant 2 T32 HD07168-06, and the Carolina Population Center. At the time the
Origin Impacts on Migration in Ecuador 209
research was carried out, all authors were associated with the Carolina PopulationCenter.
REFERENCES
Anderson, D., and M. Leiserson. 1980. Rural nonfarm employment in developing countries. EconomicDevelopment and Cultural Change 28(2):227-248.
Anker, R. 1983. Female labour force participation in developing countries: A critique of currentdefinitions and data collection methods. International Labour Review 122:709-723.
Balan, J., H. L. Browning, and E. Jelin. 1973. Men in a Developing Society: Geographie and SocialMobility in Monterrey, Mexico, Austin: University of Texas Press.
Barrac1ough,S. L., and A. L. Domike. 1966. Agrarian structure in seven Latin American countries. LandEconomics 42:391-424.
Basile, D. G. 1974. Tillers of the Andes: Farmers and Farming in the Quito Basin, Studies in GeographyNo. 8. Chapel Hili: University of North Carolina, Dept. of Geography.
Becker, G. 1976. The Economic Approach to Human Behavior. Chicago: University of Chicago Press.Bilsborrow, R. 1981a.Surveys ofInternal Migration in Low-Income Countries: The Needfor and Content
of Community-Level Variables. Geneva: International Labour Office.---. 1981b. Priority areas for future research on demographic-economic interrelationships. Pp. 74-87
in Population and Development Modelling, Proceedings of UNIUNFPP Expert Group Meeting,Population Studies No. 73. New York: United Nations.
Bilsborrow, R., and P. DeLargy (eds.). 1985. Impact of Rural Development Projects on DemographieBehavior, Policy Studies No. 9. New York: United Nations Fund for Population Activities.
Bilsborrow, R., and M. Foley. In press. La Planificacion de la Educacion: Un Modelo Nuevo, con unEstudio deI Caso deI Ecuador (Education Planning: A New Model, with a Case Study of Ecuador).Quito.
Bilsborrow, R., and D. K. Guilkey. 1986. Community and lnstitutional lnfiuences on Fertility: AnalyticalIssues, World Population and Employment Program Working Paper. Geneva: International LabourOffice.
Bilsborrow, R., A. Oberai, and G. Standing. 1984. Migration Surveys in Low-Income Countries:Guidelines for Survey and Questionnaire Design. London: Croom Helm.
Bureh, T. 1979. Households and family demography: A bibliographie essay. Population Index45(2):173-195.
Comite Interamericano de Desarrollo Agricola (CIÜA). 1965. Tenencia de la Tiara y DesarrolloSocio-Economico deI Sector Agricola-Ecuador. Washington, D.C.: Union Panamericana.
Commander, S., and P. Peek. 1986. Oil exports, agrarian change and the rural labour process: TheEcuadorian Sierra in the 1970s. World Development 14(1):79-96.
DaVanzo, J. 1976. Why Families Move: A Model of the Geographie Mobility of Married Couples,Technical Report R-1972-DOL. Santa Monica, Ca1if.: Rand Corp.
David, P. A. 1974. Fortune, risk, and the microeconomics of migration. Pp. 21-88 in D. and M. Reder(eds.), Nations and Households in Economic Growth: Essays in Honor of Moses Abramoritz: NewYork: Academic Press.
De.long, G., and R. Gardner (eds.). 1981. Migration Decision Making: Multidisciplinary Approaches toMicrolevel Studies in Developed and Developing Countries. New York: Pergamon Press.
Easterlin, R. A. (ed.). 1980. Population and Economic Change in Developing Countries. Chicago:University of Chicago Press.
Ecuador, Consejo Naciona1 de Desarrollo (CONADE). 1985. Diagnostico Socio-demografico de 1aPoblacion deI Ecuador, 1950--1982. Unpublished manuscript. CONADE, Quito.
Ecuador, Ministerio de Agricultura y Ganaderia (MAG) and Office de Recherche Scientifique etTechnique Outre-Mer (ORSTOM). 1978a.Diagnostico Socio-economico deI Medio Rural Ecuatoriano.No. 2: Tiara. Quito: MAG.
---. 1978b. Diagnostico Socioeconomico deI Medio Rural Ecuatoriano. No. 3: Poblacion y Empleo.Quito: MAG.
Findley, S. 1981. Methods of Linking Community-Level Variables With Migration Survey Data. Paperpresented to the United National Economic and Social Commission for Asia and the Pacific, TechnicalWorking Group on Migration and Urbanization, December 1-5, Bangkok.
Firebaugh, G. 1979. Structural determinants of urbanization in Asia and Latin America, 1950--1970.American Sociological Review 44:199-215.
F1uitman, F. 1983. The Socio-Economic Impact of Rural Electrification in Developing Countries: AReview of Evidence. World Employment Programme Research Working Papers, WEP 2-22/WPI26.Geneva: International Labour Office.
Gaude, J. 1981. The Temporary Migration Phenomenon in the Sierra 01 Ecuador: A Formalised

210 DEMOGRAPHY, volume 24, number 2, Moy 1987
Approach, Project Report. Rotterdam: Erasmus University, Centre for Development Planning.Herrin, A. N. 1979. Rural electrification and fertility change in the southern Philippines. Population and
Development Review 5:61-86.IBRD. 1979. Ecuador: Development Problems and Prospects. Washington, D.C.: World Bank.Instituto Nacional de Estadistica y Censos (INEC). 1978. II Censo Agropecuario, 1974. Resultados
Definitivos: Resumen Nacional. Quito: INEe.International Development Research Centre (lORC). 1977. Social Change and Internal Migration: A
Review ofResearch Findings From Africa, Asia and Latin America. Ottawa: lORe.International Migration Review. 1984. Women in migration: Special issue. 18:882-1382.Judge, G. G., W. E. Griffiths, R. C. HilI, and T.-C. Lee. 1980. The Theory and Practice ofEconometrics.
New York: Wiley.LasprilIa, E. 1978. Diseno de la Muestra para la Encuesta de Migracion Rural-Urbana en la Region de la
Sierra dei Ecuador. Paper presented at the Conference of Latin American Sampling Statisticians,Mexico City, November.
Lee, S.-H., J. T. Fawcett, R. W. Gardner, and R. G. Abad. 1985. Community, Household, and IndividualInfiuences on Migration: A Test of a Contextual Model in the Philippines. Working Paper No. 37.Honolulu: Bast-West Population Institute.
Maddala, G. S. 1983.Limited-Dependent and Quantitative Variables in Econometrics. Cambridge, U.K.:Cambridge University Press.
Middleton, A. 1979.Distribucion dei Gasto Publico y Migraciones Internas en el Ecuador (mirneo). Quito:FLASCO.
Mincer, J. 1978. Family migration decisions. Journal of Political Economy 86:749--773.Nerlove, M., and T. P. Schultz. 1971. Love and Life Between the Censuses: A Model of Family
Decision-Making in Puerto Rico, 1950-1960. Santa Monica, Calif.: Rand Corp.Oberai, A. S., and R. E. Bilsborrow. 1984. Theoretical perspectives on migration. Pp, 14-,-30 in R. E.
Bilsborrow, A. S. Oberai, and G. Standing (eds.), Migration Surveys in Low-Income Countries.London: Croom Helm.
Peek, P. 1980. Urban Poverty, Migration and Land Reform in Ecuador, Occasional Papers No. 79. TheHague: Institute of Social Studies.
--. 1981. Agrarian change and rural emigration in Latin America. In J. Balan (ed.), Why PeopleMove. Paris: UNESCO.
Peek, P., and P. Antolinez. 1980. Labour Migration in the Sierra of Ecuador: Causes and Incidence,World Employment Programme Research Working Paper WEP 1O-6/WP36. Geneva: InternationalLabour Office.
Preston, D. A. 1978.Rural Emigration and the Destination of Migrants in Highland Ecuador, WorkingPaper No. 224. University of Leeds, School of Geography.
Proaäo, F. 1978. Ecuador: Dinamica dei Sector Agrario. Quito: Junta Nacional de Planificacion yCoordinacion Economica.
Ravenstein, E. G. 1885. The laws of migration, Journal of the Royal Statistical Society 48:167-277.Roberts, K. 1985. Household labour mobility in a modern agrarian economy: Mexico. Pp, 358-381 in G.
Standing (ed.), Labour Circulation and the Labour Process. London: Croom Helm.Robinson, W. S. 1950. Ecological correlations and the behavior of individuals. American Sociological
Review 15:351-357.Romero, L. K., and W. L. Flinn. 1976. The effects of structural and change variables on the selectivity
of migration: The case of a Colombian peasant community. International Economic Affairs 29:35-58.Schultz, T. P. 1981. Economics ofPopulation. Reading, Mass.: Addison-WesIey.Shaw, R. P. 1974. Land tenure and the rural exodus in Latin America. Economic Development and
Cultural Change 23:123-132.--. 1975.Migration Theory and Fact, Bibliography Series No. 5. Philadelphia, Pa.: Regional Science
Research Institute.Sjaastad, L. A. 1962.The costs and returns of human migration. Journal ofPolitical Economy 70:80-93.Standing, G. (ed.). 1985. Labour Circulation and the Labour Process. London: Croom Helm.Thadani, V. N., and M. P. Todaro. 1984. Female migration: A conceptual framework. In J. Fawcett, S.
Khoo, and P. Smith (eds.), Women in the Cities ofAsia: Migration and Urban Adaptation. Boulder,Colo.: Westview Press.
Thomas, R. N., and C. M. Croner. 1975. Migrant paths to Tegucigalpa and San Pedro Sula, Honduras:The role of accessibility. Social and Economic Studies 24:445-457.
Todaro, M. P. 1976. Internal Migration in Developing Countries. Geneva: ILO.Wainerman, C. H., and Z. Recchini de Lattes. 1981. EI Trabajo Femenino en el Banquillo de los
Acusados: La Medicion Censal en America Latina. Mexico City: Population Council and Terra Nova.Wood, C. H. 1982. Equilibrium and historical-structural perspectives on migration. International
Migration Review 16(2):298-319.