The Impact of ESG Ratings on the Systemic Risk of European ...
41
Citation: Eratalay, Mustafa Hakan, and Ariana Paola Cortés Ángel. 2022. The Impact of ESG Ratings on the Systemic Risk of European Blue-Chip Firms. Journal of Risk and Financial Management 15: 153. https://doi.org/10.3390/ jrfm15040153 Academic Editor: Mark Harris Received: 22 February 2022 Accepted: 23 March 2022 Published: 28 March 2022 Publisher’s Note: MDPI stays neutral with regard to jurisdictional claims in published maps and institutional affil- iations. Copyright: © 2022 by the authors. Licensee MDPI, Basel, Switzerland. This article is an open access article distributed under the terms and conditions of the Creative Commons Attribution (CC BY) license (https:// creativecommons.org/licenses/by/ 4.0/). Journal of Risk and Financial Management Article The Impact of ESG Ratings on the Systemic Risk of European Blue-Chip Firms Mustafa Hakan Eratalay * and Ariana Paola Cortés Ángel School of Economics and Business Administration, University of Tartu, Narva Mnt. 18, 51009 Tartu, Estonia; [email protected] * Correspondence: [email protected] Abstract: There are diverging results in the literature on whether engaging in ESG related activities increases or decreases the financial and systemic risks of firms. In this study, we explore whether maintaining higher ESG ratings reduces the systemic risks of firms in a stock market context. For this purpose we analyse the systemic risk indicators of the constituent stocks of S&P Europe 350 for the period of January 2016–September 2020, which also partly covers the COVID-19 period. We apply a VAR-MGARCH model to extract the volatilities and correlations of the return shocks of these stocks. Then, we obtain the systemic risk indicators by applying a principle components approach to the estimated volatilities and correlations. Our focus is on the impact of ESG ratings on systemic risk indicators, while we consider network centralities, volatilities and financial performance ratios as control variables. We use fixed effects and OLS methods for our regressions. Our results indicate that (1) the volatility of a stock’s returns and its centrality measures in the stock network are the main sources contributing to the systemic risk measure, (2) firms with higher ESG ratings face up to 7.3% less systemic risk contribution and exposure compared to firms with lower ESG ratings and (3) COVID-19 augmented the partial effects of volatility, centrality measures and some financial performance ratios. When considering only the COVID-19 period, we find that social and governance factors have statistically significant impacts on systemic risk. Keywords: systemic risk; network centrality; sustainable; ESG; volatility; principal components; COVID-19 JEL Classification: C32; C33; C58; Q56 1. Introduction Since the 2008 financial crisis, there has been ever-growing interest in understanding the systemic risk concept. The term itself refers to the probability or the risk of a large number of financial institutions defaulting simultaneously (Lehar 2005). Many central banks and other institutions, such as the Systemic Risk Council formed in 2012 and the Systemic Risk Centre created in 2013, look into measuring systemic risk locally and globally. There has been an extensive amount of research on the topic. SRISK of Brownlees and Engle (2017) and CoVaR of Tobias and Brunnermeier (2016) are two of the many prominent works in the literature, while survey studies such as De Bandt and Hartmann (2000), Benoit et al. (2017) and Eratalay et al. (2021) cover many of the prevalent approaches. As much as it is important to measure the systemic risk of a certain economy, it is also important to find out the key players in this economy: which firms are “too big to fail”? 1 For example, the works of Billio et al. (2012) and Tobias and Brunnermeier (2016) among many others look into the systemic risk contribution and exposure of firms. One interesting line of research that extends from here is analysing how sustainability influences systemic risk. J. Risk Financial Manag. 2022, 15, 153. https://doi.org/10.3390/jrfm15040153 https://www.mdpi.com/journal/jrfm
-
Upload
khangminh22 -
Category
Documents
-
view
1 -
download
0
Transcript of The Impact of ESG Ratings on the Systemic Risk of European ...

Citation: Eratalay, Mustafa Hakan,
and Ariana Paola Cortés Ángel. 2022.
The Impact of ESG Ratings on the
Systemic Risk of European Blue-Chip
Firms. Journal of Risk and Financial
Management 15: 153.
https://doi.org/10.3390/
jrfm15040153
Academic Editor: Mark Harris
Received: 22 February 2022
Accepted: 23 March 2022
Published: 28 March 2022
Publisher’s Note: MDPI stays neutral
with regard to jurisdictional claims in
published maps and institutional affil-
iations.
Copyright: © 2022 by the authors.
Licensee MDPI, Basel, Switzerland.
This article is an open access article
distributed under the terms and
conditions of the Creative Commons
Attribution (CC BY) license (https://
creativecommons.org/licenses/by/
4.0/).
Journal of
Risk and FinancialManagement
Article
The Impact of ESG Ratings on the Systemic Risk of EuropeanBlue-Chip FirmsMustafa Hakan Eratalay * and Ariana Paola Cortés Ángel
School of Economics and Business Administration, University of Tartu, Narva Mnt. 18, 51009 Tartu, Estonia;[email protected]* Correspondence: [email protected]
Abstract: There are diverging results in the literature on whether engaging in ESG related activitiesincreases or decreases the financial and systemic risks of firms. In this study, we explore whethermaintaining higher ESG ratings reduces the systemic risks of firms in a stock market context. For thispurpose we analyse the systemic risk indicators of the constituent stocks of S&P Europe 350 for theperiod of January 2016–September 2020, which also partly covers the COVID-19 period. We apply aVAR-MGARCH model to extract the volatilities and correlations of the return shocks of these stocks.Then, we obtain the systemic risk indicators by applying a principle components approach to theestimated volatilities and correlations. Our focus is on the impact of ESG ratings on systemic riskindicators, while we consider network centralities, volatilities and financial performance ratios ascontrol variables. We use fixed effects and OLS methods for our regressions. Our results indicatethat (1) the volatility of a stock’s returns and its centrality measures in the stock network are themain sources contributing to the systemic risk measure, (2) firms with higher ESG ratings face upto 7.3% less systemic risk contribution and exposure compared to firms with lower ESG ratingsand (3) COVID-19 augmented the partial effects of volatility, centrality measures and some financialperformance ratios. When considering only the COVID-19 period, we find that social and governancefactors have statistically significant impacts on systemic risk.
Keywords: systemic risk; network centrality; sustainable; ESG; volatility; principal components;COVID-19
JEL Classification: C32; C33; C58; Q56
1. Introduction
Since the 2008 financial crisis, there has been ever-growing interest in understandingthe systemic risk concept. The term itself refers to the probability or the risk of a largenumber of financial institutions defaulting simultaneously (Lehar 2005). Many centralbanks and other institutions, such as the Systemic Risk Council formed in 2012 and theSystemic Risk Centre created in 2013, look into measuring systemic risk locally and globally.There has been an extensive amount of research on the topic. SRISK of Brownlees andEngle (2017) and CoVaR of Tobias and Brunnermeier (2016) are two of the many prominentworks in the literature, while survey studies such as De Bandt and Hartmann (2000), Benoitet al. (2017) and Eratalay et al. (2021) cover many of the prevalent approaches.
As much as it is important to measure the systemic risk of a certain economy, it isalso important to find out the key players in this economy: which firms are “too big tofail”?1 For example, the works of Billio et al. (2012) and Tobias and Brunnermeier (2016)among many others look into the systemic risk contribution and exposure of firms. Oneinteresting line of research that extends from here is analysing how sustainability influencessystemic risk.
J. Risk Financial Manag. 2022, 15, 153. https://doi.org/10.3390/jrfm15040153 https://www.mdpi.com/journal/jrfm

J. Risk Financial Manag. 2022, 15, 153 2 of 41
Sustainable firms exert effort in making their investments better in environmental,social and governance (ESG) terms, under which there are many subcategories. The studyby Cerqueti et al. (2021) mentions that ESG investment could help reduce systemic riskand if firms comply with ESG requirements they would be less vulnerable to systemicshocks. His argument is that the firms with higher ESG ratings have less problems withtheir stakeholders, possibly due to more transparent governance. Second, he mentionsthat ESG-related investments rely on the longer term; therefore, the investors of ESG assetsare not likely to sell off even in crisis periods. Lastly, he states that ESG related assetsare not yet commonly preferred; therefore, they are less vulnerable to shocks. Letermeand Nguyen (2020) found some evidence that ESG factors can be considered systemicrisk factors. There are also studies which found that there may be a negative or neutralrelationship between ESG ratings and the financial performance of firms, while othersfound a positive relationship.2
In this study we aim to investigate the impact of the ESG ratings of firms on theirsystemic risk contribution and exposure. For this analysis we use the daily returns data onthe stocks constituting the S&P Europe 350 index, which represents the blue-chip firms over16 developed European countries and the ESG ratings data from S&P Global. We focuson the period of January 2016–September 2020, which covers days during the COVID-19situation. If a firm’s stock is central and has high volatility and this firm is performingpoorly financially, it is likely that the firm is threatening the financial system it is in orbeing threatened by a shock from this financial system. This is even more true during theCOVID-19 period. Hence, as control variables we consider financial performance ratiosand two network centrality measures of these firms, volatility and a COVID-19 dummyvariable. We would like to investigate whether, after controlling for the effect of the stockvolatilities, financial ratios and the importance of the firms in the S&P Europe 350 network,we can still find statistical evidence that the ESG ratings increase or decrease the systemicrisk contribution or exposure of a firm.
The analysis in this study brings together different tools from several fields. Firstof all, we estimate an econometric model following Eratalay and Vladimirov (2020) toextract the time-varying conditional correlation matrix. Using the Gaussian graphicalmodel, we derive the dynamic partial correlation network of the stocks and calculatethe local and global network parameters as in Cortés Ángel and Eratalay (2021). Then,we proceed to derive the systemic risk contribution and exposure of the stocks via theprincipal components method of Billio et al. (2012). Finally, we conduct a panel dataanalysis regressing systemic risk measures on volatility, ESG ratings, financial ratios andnetwork metrics. The first contribution of this study is empirical, since we find the relationbetween systemic risk and ESG ratings, controlling for other factors that affect systemicrisk, such as financial ratios and network parameters. Omitting these control variablescould have misled previous research results. The second contribution of this study is in itsmethodology in combining different fields to extract these control variables. As mentionedabove, there are many works studying the effect of ESG ratings on financial performanceand some relate it to systemic risk. However, to our knowledge there is no work which hasanalysed the systemic risk contribution and exposures of the stocks in a stock market inrelation to the ESG ratings and network centralities of these stocks.
Our results suggest that ESG ratings have a negative effect on the systemic riskcontribution and exposure. However, this effect is marginal for small improvements in theESG ratings. A firm that has an ESG rating that is 40 points higher benefits by reducingits systemic risk contribution and exposure by about 5%, reaching up to 7.3% for southernEuropean countries.3 We also find that the main factors determining the systemic riskcontribution and exposure of a firm are the volatilities and network centralities. For theyear 2020, we find that while the “social” factor in ESG ratings is positively related tosystemic risk contribution and exposure, the “governance” factor negatively affects it. Wedid not find a significant effect from the “environmental” factor. Finally, during COVID-19,the partial effect of volatilities and network centralities increased.
J. Risk Financial Manag. 2022, 15, 153 3 of 41
This study is structured as follows. Section 2 gives a literature review on systemicrisk and sustainability. Section 3 discusses the econometric model, network extraction andcalculation of the systemic risk measure. Section 4 presents the data used for analysis.Section 5 discusses the results of the OLS and panel data regressions. Section 6 concludes.
2. Literature Review2.1. Systemic Risk
The global financial crisis that occurred in 2007–2008 encouraged researchers to applyan interdisciplinary approach to studying systemic risk in the financial sector, with thepurpose of predicting and controlling it.
In its simplest form, systemic risk can be understood as the risk of fracturing a systemthat can be triggered by the internal failure of any of its components or other externalfactors. It occurs much like a domino effect; if each component of the system representsone domino, it only takes one to fail (or fall in this case) in order to force all the componentsto collapse. In our analysis, the system is a stock market. The assumption that relatessystemic risk in a stock market with the systemic risk in an economy is that the stock marketrepresents a significant part of an economy. This could be the case if the stock market hasmany stocks, large market capitalizations, and large coverage of different industries. Thereare other studies that have used stock markets for systemic risk analysis. For example,Liu et al. (2020) analyse stock market indices of 43 countries to represent global financialmarkets, while Zhao et al. (2019) analyse the systemic risk of the Chinese stock market andEratalay and Vladimirov (2020) focused on the Russian stock market.
Many studies have proposed methods for measuring systemic risk. To start with,Gray et al. (2007) used the risk-adjusted balance sheet and contingent claims analysismethod to gauge the asset–liability mismatches between sovereign, corporate, householdand financial sectors, and through stress-testing they depicted systemic instability due to anexternal factor. Tarashev et al. (2010) use a game-theoretic model, the Shapley value method,where the risk contributed by a bank was measured using the aggregate of the marginalcontributions of the banking system. Additionally, Tobias and Brunnermeier (2016) definethe conditional value-at-risk measures to appraise the individual and cumulative risk thatan entity adds to the system. Similarly, Kritzman et al. (2011) apply the absorption ratio toasset prices to gauge the systemic risk in the US stock market, and Acharya et al. (2017) notonly measure the systemic risk but also propose an optimal taxation policy to manage it.
Some studies go further to distinguish the systemic risk contribution and exposure offirms. Billio et al. (2012) use the principal components method, which uses the covariancematrix of returns (or return shocks) to capture the commonality between the returns, whichwould increase in turbulent times. Their systemic risk measure can identify the systemicrisk contribution and exposure of firms, which are the same by construction. We usethis methodology in our study, since it is straightforward and easily applicable usingstock return shocks derived from our econometric model. Another study which discussessystemic risk contribution and exposure separately is by Tobias and Brunnermeier (2016),who base their methodology on value-at-risk measures.
For further reading we recommend Bougheas and Kirman (2015), which gives adetailed review of more non-network examples. On the other hand, Caccioli et al. (2018)delve into the topic of systemic risk utilizing network analysis as their primary tool. Pleasealso see Bisias et al. (2012), Benoit et al. (2017), Silva et al. (2017) and Eratalay et al. (2021),among others.
2.2. Sustainability and Systemic Risk
One of the main concerns of humanity lies in the uncertainty of our future, due toall the damage caused to the planet. Entrepreneurs, investors and people in general havebegun to become aware of this and have become more sensitive when making decisions.This has also had an impact on investors, who seek to contribute by investing in sociallyresponsible and sustainable firms while being true to their values.

J. Risk Financial Manag. 2022, 15, 153 4 of 41
Socially responsible investing (SRI) and environmental, social and governance (ESG)investing are two of the most usual value-based investing strategies. In the case of the for-mer, investors avoid investing in tobacco, weapons and gambling stocks Capelle-Blancardand Monjon (2012). In the case of the latter, for a firm to be qualified as ESG, its line ofbusiness (excluding tobacco firms, firms involved in any way with chemical or biologicalweapons and thermal coal generating firms) is considered along with the managementof the risk inherent to it, such as management of human capital, business ethics, productand product governance, among others. These characteristics are taken into account toobtain ESG certification (see Drempetic et al. (2020), Dorfleitner et al. (2015), Friede et al.(2015) and Escrig-Olmedo et al. (2019)). It is worth mentioning here that there seems to be aquestion of the reliability of the ESG ratings by different firms. Berg et al. (2019) state thatthe ESG ratings of different sources tend to diverge.
When we search the literature, we find different views on whether investing in ESGrelated activities is beneficial for firms or not. Balcilar et al. (2017) show how sociallyresponsible investment benefits reduce the volatility of conventional equity portfoliosworldwide, using daily data from Dow Jones sustainable and conventional indices fromaround the world—North America, Europe and Asia-Pacific. Cortez et al. (2012) reveal thatthe performance of conventional and sustainable investments is quite similar for the US andEuropean global socially responsible funds. Cortez et al. (2009) examine the performance ofEuropean socially responsible funds in greater depth and establish that their performancematches the performance of conventional and socially responsible standards, agreeing withJain et al. (2019). Lööf et al. (2021) analyse over 5000 stocks from 10 stock markets andshow that stocks with higher ESG ratings experience lower tail risk, while also keeping theupside return potential low. Giese et al. (2019) mentions that the ESG factor could mitigatetail risk and there may be a long-term ESG risk premium. There are also meta-analyseswhich argue in favour of ESG investing. Based on 2000 previous studies, Friede et al. (2015)document that there is evidence that ESG investing has a positive impact on financialperformance. Clark et al. (2015) analyse 200 previous studies and report that 88% of themconclude that ESG practices affect stock prices positively. On the other hand, Revelli andViviani (2015) report, based on 85 studies and 190 experiments, that socially responsibleinvestments do not yield better financial performance than conventional investments. Inline with this study, Lee et al. (2013) use a sample compiled from US stocks to show thatthere is no significant difference in the risk adjusted returns of the portfolios of high andlow sustainability stocks.
From the systemic risk perspective, Cerqueti et al. (2021) show that ESG investmentscould help reduce systemic risk and make the funds that follow ESG requirements lessvulnerable to systemic shocks. Boubaker et al. (2020) suggest that firms with higher ESGratings have lower financial distress risk and are less likely to crash. Supporting this view,Lai et al. (2010) and Michelon (2011) suggest that corporate social responsibility of a firmcreates a better reputation for the firm’s name and therefore reduces the impact of negativenews and the resulting risk. Murè et al. (2021) note that engaging in ESG practices reducesthe probability of receiving sanctions for Italian banks, while Chiaramonte et al. (2021) showfor European banks that ESG strategies enhance bank stability during financial turmoil.Oikonomou et al. (2012) find for the S&P 500 firms that corporate social irresponsibilityis related strongly and positively to market risk, while corporate social responsibility isweakly and negatively related to firms’ own systematic risk. Sun and Cui (2014) reachthe conclusion that corporate social responsibility strongly reduces the firms’ default risk.Klooster (2018) finds evidence that corporate social responsibility reduces a bank’s defaultrisk and reduces a bank’s systemic risk contribution based on the SRISK measure but notbased on the marginal expected shortfall measure. Bae et al. (2021) find that ESG ratingsreduce a firm’s stock price crash risk. However, if firms have larger financial constraints,they may tend to hide unfavourable news and hence this effect is suppressed. Gregory(2022) analyses the S&P 1500 stocks and shows that the non-financial firms which had betterenvironment and governance scores performed better throughout the COVID-19 pandemic.
J. Risk Financial Manag. 2022, 15, 153 5 of 41
Sonnenberger and Weiss (2021) focus on the insurance firms and find that engaging incorporate social responsibility reduces tail risk and short and medium term exposure tosystemic risk.
Notwithstanding the above, Lundgren et al. (2018), using a network approach and theGranger causality test, show that investing in European renewable energy stock is morerisky compared with non-renewable energy stock. By network connectedness analysisusing a wavelet method and a multivariate vector autoregression model, Reboredo et al.(2020) find that green bonds are significantly affected by corporate and treasure bondspillovers, although their transmission is unnoticeable besides the high connectivity amongthem in Europe and the USA. Friede et al. (2015) note that there are portfolio studies whichfind negative or neutral relations between ESG and financial performance. Maiti (2021),Jin (2018) and Leterme and Nguyen (2020) mention ESG related factors as a systematicrisk of mutual funds in the Eurozone. Lopez-de Silanes et al. (2020) find that firms withhigher ESG ratings have better disclosure of information and have less risk, but they findno evidence to support that ESG performance has an impact on risk adjusted financialperformance. Waner (2021) supports this finding that active disclosure of information is akey to reducing systemic risk for China’s ESG listed firms.
Given this diverging view on whether higher ESG ratings could be beneficial for firmsin terms of mitigating systemic risk or not, our study finds a good place in the literatureby providing evidence that ESG related investments could indeed reduce systemic riskcontribution and exposures of firm stocks. Although the focus of the study is similarto that of Cerqueti et al. (2021) and Boubaker et al. (2020), we approach to the problemfrom a different angle, relating ESG ratings with the systemic risk measured in a stockmarket, where we can derive the importance of the firm’s stock in this stock market throughnetwork centrality.
3. Methodology3.1. Econometric Method
In the first step of our methodology, we needed to derive the dynamic volatility anddynamic correlation estimates, which were later used to obtain the systemic risk measureand network characteristics. Since there were many series to consider in this multivariatemodel, there were many parameters to estimate. Assuming normal distribution for theerror term allowed us to estimate the model via quasi-maximum likelihood optimisation inthree steps and avoid this curse of dimensionality. This estimation procedure is discussedin Eratalay and Vladimirov (2020), which is consistent and asymptotically normal (seeBollerslev and Wooldridge (1992) and Carnero and Eratalay (2014)).
3.1.1. Conditional Returns
Following a similar approach as in Eratalay and Vladimirov (2020), we modelled theconditional mean of the stock returns as a vector autoregressive model of order 1, VAR(1),with a common factor4:
rt = µ + βrt−1 + crMSWIt−1 + εt (1)
εt ∼ N(0k, Ht)
where rt is a kx1 vector of returns. µ is a kx1 vector of intercept coefficients. β is a kxknon-diagonal matrix containing the vector autoregressive model coefficients, which allowsfor return spillovers. c is a diagonal vector of coefficients of the common observable factor.The error term, εt is assumed to be normally distributed with zero mean and a conditionalvariance-covariance matrix Ht.
Our approach differed here from Eratalay and Vladimirov (2020), as we considered anobservable common factor, namely rMSWI
t , which is the returns from the Morgan StanleyWorld Index (MSWI).5 Considering MSWI allowed us to take into account the commontrends in the world that may affect all the stocks in a similar manner. As Barigozzi andBrownlees (2019) states, the consideration of a common factor is essential. If ignored, it

J. Risk Financial Manag. 2022, 15, 153 6 of 41
could yield a spuriously connected network. The typical stationarity restrictions apply onthe coefficients β, such that all eigenvalues of the β matrix should be positive.
3.1.2. Conditional Variances
The conditional variance-covariance matrix of the error term εt is denoted by Htsuch that:
εt = H1/2t vt (2)
Ht = DHt RtDH
t
DHt = diag(h1/2
t,1 , h1/2t,2 , ..., h1/2
t,k )
ht+1 = W + Aε(2)t + Bht
In Equation (2), the conditional variance-covariance matrix Ht was constructed bythe diagonal matrix, DH
t , of conditional variances of each error term, multiplied by thecorrelation matrix. Rt. vt denotes the standardized errors, and ht is the vector of conditionalvolatilities. By this construction, each element of the variance-covariance matrix is equal toHt,ij = Rt,ijh
1/2t,i h1/2
t,j , which is the well-known relation between covariance and correlation.W is a kx1 vector and A and B are kxk diagonal matrices of coefficients. This modeltherefore does not allow for volatility spillovers for simplicity. In fact, estimating a modelwith volatility spillovers with the data considered in this study would not be feasible.Under Equation (2), the volatility process for each series is given by:
ht+1,i = wi + aiε(2)t,i + biht,i (3)
The conditional variances, ht,i are stationary under the usual assumption that ai + bi < 1.Moreover, they are positive as long as wi > 0, ai ≥ 0 and bi ≥ 0.
3.1.3. Conditional Correlations
The conditional correlations, Rt, follow the consistent dynamic conditional correlationGARCH model of Aielli (2013):
Rt = PtQtPt (4)
Pt = diag(Qt)−1/2
Qt+1 = (1− δ1 − δ2)Q + δ1ν∗t ν∗′t + δ2Qt
ν∗t = diag(Qt)1/2νt.
νt = [DHt ]−1εt
where Qt is the covariance matrix of the v∗t and Q is the long run covariance matrix. [DHt ]−1
is the inverse of the DHt matrix. We used the correlation targeting approach of Engle (2002),
where we replaced Q with the sample covariance matrix of the v∗t during estimation. Thescalar parameters, δ1 and δ2, of this model are restricted to be non-negative such thatδ1 + δ2 < 1. To avoid the attenuation biases that occur when the cross-sectional dimensionof the data is large, we used the composite likelihood approach of Pakel et al. (2020).
3.2. Partial Correlation Network
Following Anufriev and Panchenko (2015) and Eratalay and Vladimirov (2020), weused the Gaussian graphical model (GGM) algorithm. The GGM algorithm helps calculatethe partial correlation matrices from the correlation matrices, which measure the conditionalrelation between any nodes in a network. We used partial correlations to isolate thecorrelation between two specific series, eliminating the indirect effect of other series and

J. Risk Financial Manag. 2022, 15, 153 7 of 41
obtaining the true relationship between every two series. The matrix of partial correlations,P, can be obtained using the correlation matrix R:
P = −D−1/2K KD−1/2
K . (5)
where K = R−1, and DK = diag(K) is the diagonal matrix that has the same leadingdiagonal as the K matrix. The details for the derivation of this equality can be found inAnufriev and Panchenko (2015).
In the model we constructed, the cDCC-GARCH approach from Section 3.2 providedus with the time varying conditional correlations. Therefore, we were able to construct apartial correlation network for each day in the time interval of our data. This gave us adynamic network which took each firm’s stock as a node. The strength of the connectionsbetween these nodes was obtained using the adjacency matrix, which was derived based onthe partial correlations between the stock returns (see Jackson (2010)). A correlation matrixand the partial correlation matrix it implies are always symmetrical. Therefore, the adja-cency matrix derived from the partial correlation matrix is also symmetrical. Consequently,this network’s connections are bi-directional, meaning that there is no causal relationship.The adjacency matrix is defined as:
A = I + P = I − D−1/2K KD−1/2
K (6)
where I is the identity matrix. The identity matrix is added to the partial correlation matrixP, since the leading diagonal elements of P are equal to -1. Hence, now the leading diagonalelements of A matrix consist of zeros, implying that nodes are connected to each other butnot to themselves. Another interesting point to note about this network is that,when thereis an external shock to this network, all the nodes receive the shock simultaneously and thestrength of the shock is defined through the partial correlations.
In our study, we are interested in two centrality measures that relate to systemic risk.The first is the eigenvector centrality which states that a node’s centrality is proportionalto its neighbours’ centrality. In other words, a node’s eigenvector centrality is high if itsneighbours’ eigenvector centralities are high. As Anufriev and Panchenko (2015) state,eigenvector centrality shows the extent to which a shock can propagate in a system. Second,we are interested in the closeness centrality, which focuses on the relative distance amongnodes. To be more precise, it is the inverse of the total length of the shortest paths fromthis node to the other nodes. In this sense, closeness centrality relates to how fast andstrongly the nodes react to a shock. As Eratalay and Vladimirov (2020) argues, in the GGMapproach some partial correlations may turn out to be negative and this may imply thatsome entries of the adjacency matrix are negative. For this network, eigenvector centralitycan be calculated even with negative partial correlations, although with closeness centralitythis is not possible. (See Section 5.1. More details can be found in Eratalay and Vladimirov(2020) and Cortés Ángel and Eratalay (2021).)
3.3. Systemic Risk Measure
After obtaining the conditional correlation estimates that change over time, we derivedthe systemic risk measure using the principal components method from Billio et al. (2012).This approach detects the commonality between the stock returns through the correlationsbetween them. When the commonality between the stock returns is large, the systemis more connected. In turbulent times, the commonality between the stock returns, andtherefore the connectedness between the stocks, increase. Therefore, there is a one-to-onerelation between the systemic risk and commonality between the returns. The principalcomponents analysis decomposes the original return vectors to orthogonal uncorrelatedfactors. These factors are ordered in decreasing explanatory power. Following the same
J. Risk Financial Manag. 2022, 15, 153 8 of 41
notation above: let rit be kx1 the vector of the returns of stock i. The system’s aggregated
return, rSt , therefore is given by:
rSt = ∑
iri
t (7)
and the variance of the system’s return, σ2t,S is given by:
σ2t,S = ∑
i∑
j
√ht,i
√ht,jE(vt,ivt,j) (8)
where ht,i and vt,i are the volatility and standardized residuals that correspond to stockreturn i as defined in Equations (3) and (4), respectively. The uncorrelated factors of theprincipal components method, ζi, have zero mean and have variance equal to λi, such that:
E(ζkζl) =
λk, if k = l
0, otherwise(9)
In fact, the λk is the k’th eigenvalue of the correlation matrix. In the context of our study,this correlation matrix is the conditional correlation matrix obtained from Equation (4). Theprincipal components approach therefore decomposes the standardized residuals vt,i as:
vt,i = ∑k
Likζk (10)
where Lik is the loading vector which is the eigenvector corresponding to the eigenvalueλk. Hence, the conditional correlation matrix can be written as:
Rt = ∑k
∑l
LikLjlE(ζkζl) (11)
= ∑k
LikLjkλk
and the variance of the system becomes:
σ2t,S = ∑
i∑
j∑k
σiσjLikLjkλk (12)
The principal components approach tries to explain a large percentage of the variationin the system with a few components. Hence, if we have k returns, we have n principalcomponents, such that n < k. In periods of crisis, the n principal components can explain alarge proportion of the total variation, since the commonality or correlation of these periodsis expected to be high. Consequently, if the principal components can explain more thanfraction H of the total variation, this indicates increased connectedness in the system. Ifthe total risk of the system is defined as Ω = ∑N
k=1 λk and the risk captured by the firstn principal components is measured by ωn = ∑n
k=1 λk, then the ratio hn ≡ ωnΩ shows the
cumulative risk fraction. If this fraction is larger than the threshold H, then the system ishighly connected and a few principal components can explain most of the variation in thesystem. Billio et al. (2012) derive the contribution of stock i to the risk of the system, whenhn > H:
PCASi,n =12
σ2i
σ2S
∂σ2S
∂σ2i
∣∣∣∣hn>H
(13)

J. Risk Financial Manag. 2022, 15, 153 9 of 41
The authors also discuss that by construction, systemic risk exposure is the same as thesystemic risk contribution of stock i:
PCASi,n =12
σ2i
σ2S
∂σ2S
∂σ2i
∣∣∣∣hn>H
=n
∑k=1
σ2i
σ2S
L2ikλk
∣∣∣∣hn>H
(14)
In our study, the time varying conditional correlation matrix allows us to extract thesystemic risk exposure of each stock i for each day.
Overall, the flow of the methodology was as follows. First, we applied the econometricmodel to the stock returns and obtained volatilities and dynamic conditional correlations.Then, from the volatilities and correlations we derived the systemic risk measures. From theconditional correlations, we derived the partial correlations which helped to construct thenetwork of the stocks and to obtain network centrality measures. The obtained volatilitiesand network centralities along with financial performance ratios, ESG ratings and theCOVID-19 dummy variable were used as regressors in fixed effects regressions, where thedependent variable was the systemic risk measure.
4. Data4.1. Data Sources
For this study we collected the data from three sources. We collected the historicalstock market data for the constituents of the S&P Europe 350 index6 and for the Morganand Stanley World Index (MSWI) from Yahoo Finance. For the constituents list, we madea formal request to SPGlobal7. We were provided with the list of all 362 constituentsof S&P Europe 350 index as of December 2019. Afterwards, we collected daily closingvalues for these constituent stocks for the period of 5 January 2016–15 September 2020 fromYahoo Finance. Some stocks did not have data for the whole data period; therefore, wehad to refine our data. The final list of stocks we considered is given in Tables A10–A17in Appendix A. After pre-treating the data, we had 1202 observations for the prices of331 stocks and the MSWI index. We detected the outliers following the Hampel filter asdiscussed in Pearson et al. (2015). We replaced the outliers with the local median in the 20working days window. When detecting the outliers, we set the parameters of the Hampelfilter such that the probability of observing an outlier was very small.8
Our second data source was the S&P Global website9. For the constituent stocks, wecollected the yearly overall ESG ratings from 2016 to 2020. Moreover, we collected thedimension scores for environmental, social and governance/economic factors for 2020.Unfortunately, for some of the constituent stocks, the ESG data were not provided. Wewere able to collect the data for 308 stocks.10
Finally, our third dataset was firm level data of financial performance ratios obtainedfrom the Orbis Europe system. We collected the data on current ratios, solvency ratios andprofit margins as indicators of firm level financial performance. The data were annual andfor the years 2016–2020. The stock market performance of the firms not only depends on thetrading behaviour of the investors but also on the firms’ profitability and riskiness. Hence,we can assume that the systemic risk contribution and exposure measures derived from thestock market relations should depend on the financial performance ratios. Unfortunately,the data on all these ratios were available for only 200 of the constituent stocks. Wesummarize the description of these three panels in Table 1 below.

J. Risk Financial Manag. 2022, 15, 153 10 of 41
Table 1. Short description of the panels.
Panels Description Number of Stocks
Panel 1 The stocks for which systemic risk, volatilityand network centralities were calculated.
331
Panel 2 The stocks of Panel 1, for which we could obtainESG ratings data.
308
Panel 3 The stocks of Panel 2, for which we could obtainfinancial performance ratios.
200
Notes: This table gives a summary of the panels used for the fixed effects regressions. For OLS and fixedeffects regressions, we removed Wirecard AG from our samples, as explained in Section 5.2. Source: authors’calculations.
4.2. Descriptive Statistics
In Figure 1, we plot the returns after being processed through the Hampel filter. Thehigh volatility caused by COVID-19 is visible towards the end of the sample. We markedthe date 21 February 2020 with a vertical dashed grid line, which is when a cluster of casesoccurred in Lombardy, Italy.11 It can be seen from the figure that there are many extremereturns which were not eliminated by the Hampel filter. The most extreme negative returnbelongs to the return series of the company Wirecard, which declared insolvency in June2020. We discuss more on this series in Section 5.2.
J. Risk Financial Manag. 2022, 15, 151 10 of 43
Table 1. Short description of the panels.
Panels Description Number of Stocks
Panel 1 The stocks for which systemic risk, volatilityand network centralities were calculated.
331
Panel 2 The stocks of Panel 1, for which we could obtainESG ratings data.
308
Panel 3 The stocks of Panel 2, for which we could obtainfinancial performance ratios.
200
Notes: This table gives a summary of the panels used for the fixed effects regressions. For OLS and fixedeffects regressions, we removed Wirecard AG from our samples, as explained in Section 5.2. Source: authors’calculations.
4.2. Descriptive Statistics
In Figure 1, we plot the returns after being processed through the Hampel filter. Thehigh volatility caused by COVID-19 is visible towards the end of the sample. We markedthe date 21 February 2020 with a vertical dashed grid line, which is when a cluster of casesoccurred in Lombardy, Italy.11 It can be seen from the figure that there are many extremereturns which were not eliminated by the Hampel filter. The most extreme negative returnbelongs to the return series of the company Wirecard, which declared insolvency in June2020. We discuss more on this series in Section 5.2.
Figure 1. Returns of the S&P Europe 350 stocks, calculated as 100 ∗ log(Pt/Pt−1) where Pt is a stockprice. This figure plots the returns of the stocks in the dataset, which contains 331 stocks from S&P350 Europe. Period: 5 January 2016–15 September 2020. Source: authors’ calculations.
Figure 1. Returns of the S&P Europe 350 stocks, calculated as 100 ∗ log(Pt/Pt−1) where Pt is a stockprice. This figure plots the returns of the stocks in the dataset, which contains 331 stocks from S&P350 Europe. Period: 5 January 2016–15 September 2020. Source: authors’ calculations.
J. Risk Financial Manag. 2022, 15, 153 11 of 41
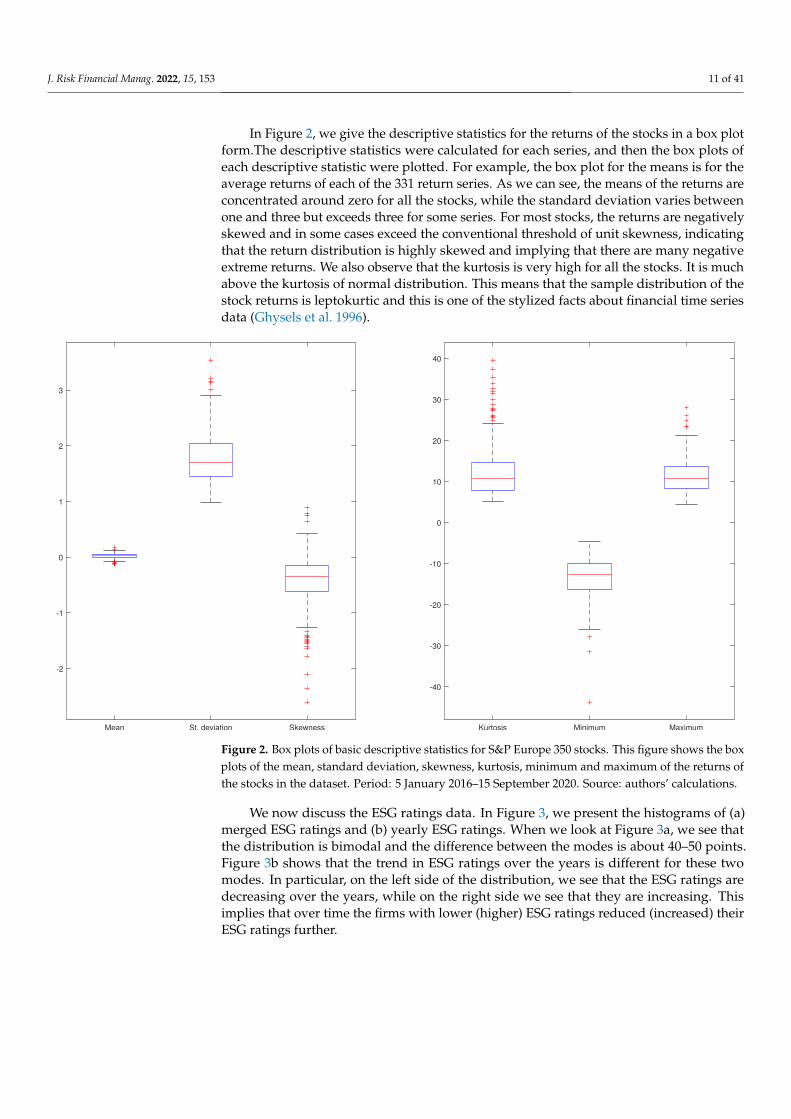
In Figure 2, we give the descriptive statistics for the returns of the stocks in a box plotform.The descriptive statistics were calculated for each series, and then the box plots ofeach descriptive statistic were plotted. For example, the box plot for the means is for theaverage returns of each of the 331 return series. As we can see, the means of the returns areconcentrated around zero for all the stocks, while the standard deviation varies betweenone and three but exceeds three for some series. For most stocks, the returns are negativelyskewed and in some cases exceed the conventional threshold of unit skewness, indicatingthat the return distribution is highly skewed and implying that there are many negativeextreme returns. We also observe that the kurtosis is very high for all the stocks. It is muchabove the kurtosis of normal distribution. This means that the sample distribution of thestock returns is leptokurtic and this is one of the stylized facts about financial time seriesdata (Ghysels et al. 1996).
Mean St. deviation Skewness
-2
-1
0
1
2
3
Kurtosis Minimum Maximum
-40
-30
-20
-10
0
10
20
30
40
Figure 2. Box plots of basic descriptive statistics for S&P Europe 350 stocks. This figure shows the boxplots of the mean, standard deviation, skewness, kurtosis, minimum and maximum of the returns ofthe stocks in the dataset. Period: 5 January 2016–15 September 2020. Source: authors’ calculations.
We now discuss the ESG ratings data. In Figure 3, we present the histograms of (a)merged ESG ratings and (b) yearly ESG ratings. When we look at Figure 3a, we see thatthe distribution is bimodal and the difference between the modes is about 40–50 points.Figure 3b shows that the trend in ESG ratings over the years is different for these twomodes. In particular, on the left side of the distribution, we see that the ESG ratings aredecreasing over the years, while on the right side we see that they are increasing. Thisimplies that over time the firms with lower (higher) ESG ratings reduced (increased) theirESG ratings further.

J. Risk Financial Manag. 2022, 15, 153 12 of 41
In Figure 4 we plot the 5th, 25th, 50th, 75th and 95th quantiles and the mean of theoverall ESG ratings of the stocks from the S&P 350 Europe index. Although perhaps themean and the median have a slightly positive trend, the other quantiles seem stable overtime. What is also interesting is that the median is less than the mean before 2018 and morethan the mean afterwards. This suggests that the ESG ratings distribution before 2018 waspositively skewed, with a few firms with high ESG ratings. After 2018, the distributionbecame negatively skewed, with a few firms with low ESG ratings. This suggests thatoverall there is an increasing trend in the ESG ratings over the years. As we discussed inFigure 3, however, this increase is not for every quantile of the distribution.
0 10 20 30 40 50 60 70 80 90 100
ESG ratings
0
20
40
60
80
100
120
Fre
quency
(a) Merged
0 10 20 30 40 50 60 70 80 90 100
ESG ratings
0
10
20
30
40
50
60
70
Fre
qu
en
cy
2016
2017
2018
2019
2020
(b) Per year
Figure 3. Histograms of merged and yearly ESG ratings. This figure shows the histograms of(a) merged and (b) yearly ESG ratings of the 308 stocks from the S&P 350 Europe index. Period:5 January 2016–15 September 2020. Source: authors’ calculations.
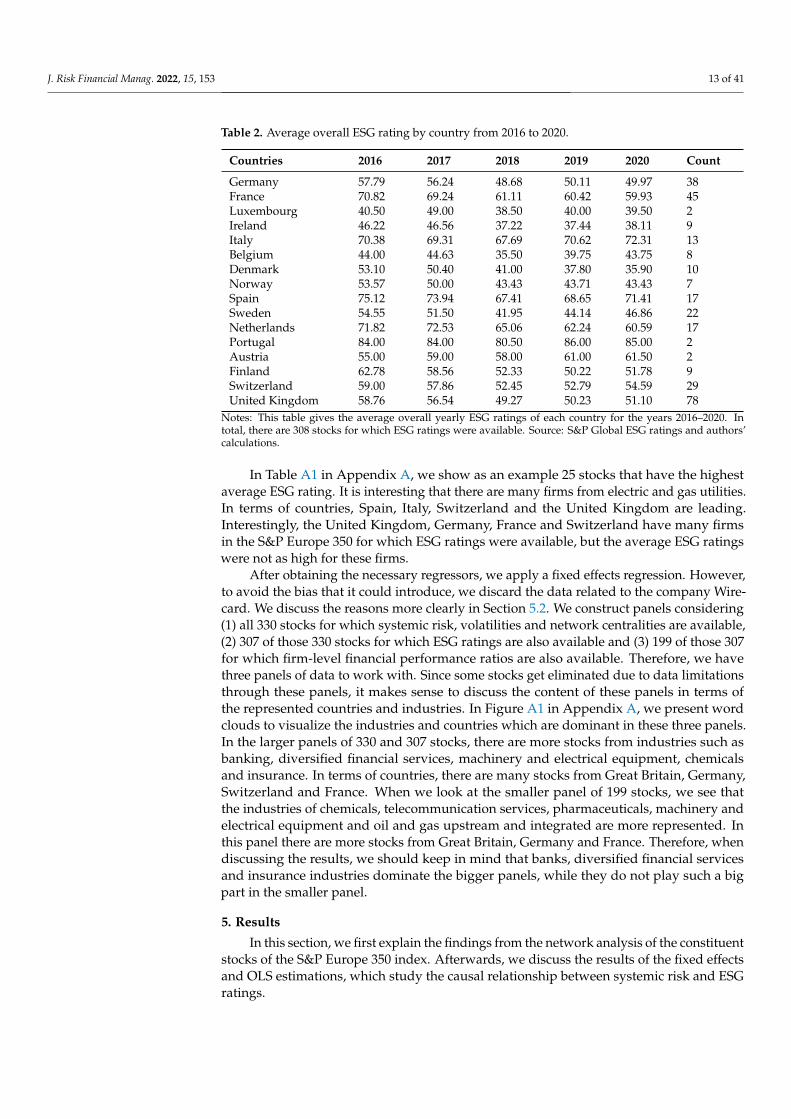
When we look at the averages per country over the years in Table 2, we can seethat for many countries the ESG ratings have been decreasing over time, while for somethey increased after a slight decrease. It is hard to comment on any country’s efforts increating and maintaining sustainable firms from this table, since only certain firms fromeach country are in this list. However, even for those countries where the number of stocksis higher, there is a visible decline of ESG ratings in general. The ESG ratings are higher forthe Southern European countries, namely Italy, Spain, Portugal and to some extent France.These are all countries which can benefit from solar energy. This provides the motivationfor analysing Southern European countries and other countries separately in Section 5.
2016 2017 2018 2019 2020
10
20
30
40
50
60
70
80
90
Q95 Q75 Q50 Mean Q25 Q5
Figure 4. Quantiles and mean of ESG ratings over time. This figure shows the quantiles 0.95, 0.75,0.5, 0.25, 0.05 and the mean of the ESG ratings of 308 stocks from the S&P 350 Europe index. Period:5 January 2016–15 September 2020. Source: authors’ calculations.
J. Risk Financial Manag. 2022, 15, 153 13 of 41
Table 2. Average overall ESG rating by country from 2016 to 2020.
Countries 2016 2017 2018 2019 2020 Count
Germany 57.79 56.24 48.68 50.11 49.97 38France 70.82 69.24 61.11 60.42 59.93 45Luxembourg 40.50 49.00 38.50 40.00 39.50 2Ireland 46.22 46.56 37.22 37.44 38.11 9Italy 70.38 69.31 67.69 70.62 72.31 13Belgium 44.00 44.63 35.50 39.75 43.75 8Denmark 53.10 50.40 41.00 37.80 35.90 10Norway 53.57 50.00 43.43 43.71 43.43 7Spain 75.12 73.94 67.41 68.65 71.41 17Sweden 54.55 51.50 41.95 44.14 46.86 22Netherlands 71.82 72.53 65.06 62.24 60.59 17Portugal 84.00 84.00 80.50 86.00 85.00 2Austria 55.00 59.00 58.00 61.00 61.50 2Finland 62.78 58.56 52.33 50.22 51.78 9Switzerland 59.00 57.86 52.45 52.79 54.59 29United Kingdom 58.76 56.54 49.27 50.23 51.10 78
Notes: This table gives the average overall yearly ESG ratings of each country for the years 2016–2020. Intotal, there are 308 stocks for which ESG ratings were available. Source: S&P Global ESG ratings and authors’calculations.
In Table A1 in Appendix A, we show as an example 25 stocks that have the highestaverage ESG rating. It is interesting that there are many firms from electric and gas utilities.In terms of countries, Spain, Italy, Switzerland and the United Kingdom are leading.Interestingly, the United Kingdom, Germany, France and Switzerland have many firmsin the S&P Europe 350 for which ESG ratings were available, but the average ESG ratingswere not as high for these firms.
After obtaining the necessary regressors, we apply a fixed effects regression. However,to avoid the bias that it could introduce, we discard the data related to the company Wire-card. We discuss the reasons more clearly in Section 5.2. We construct panels considering(1) all 330 stocks for which systemic risk, volatilities and network centralities are available,(2) 307 of those 330 stocks for which ESG ratings are also available and (3) 199 of those 307for which firm-level financial performance ratios are also available. Therefore, we havethree panels of data to work with. Since some stocks get eliminated due to data limitationsthrough these panels, it makes sense to discuss the content of these panels in terms ofthe represented countries and industries. In Figure A1 in Appendix A, we present wordclouds to visualize the industries and countries which are dominant in these three panels.In the larger panels of 330 and 307 stocks, there are more stocks from industries such asbanking, diversified financial services, machinery and electrical equipment, chemicalsand insurance. In terms of countries, there are many stocks from Great Britain, Germany,Switzerland and France. When we look at the smaller panel of 199 stocks, we see thatthe industries of chemicals, telecommunication services, pharmaceuticals, machinery andelectrical equipment and oil and gas upstream and integrated are more represented. Inthis panel there are more stocks from Great Britain, Germany and France. Therefore, whendiscussing the results, we should keep in mind that banks, diversified financial servicesand insurance industries dominate the bigger panels, while they do not play such a bigpart in the smaller panel.
5. Results
In this section, we first explain the findings from the network analysis of the constituentstocks of the S&P Europe 350 index. Afterwards, we discuss the results of the fixed effectsand OLS estimations, which study the causal relationship between systemic risk and ESGratings.
J. Risk Financial Manag. 2022, 15, 153 14 of 41
5.1. Partial Correlations Network
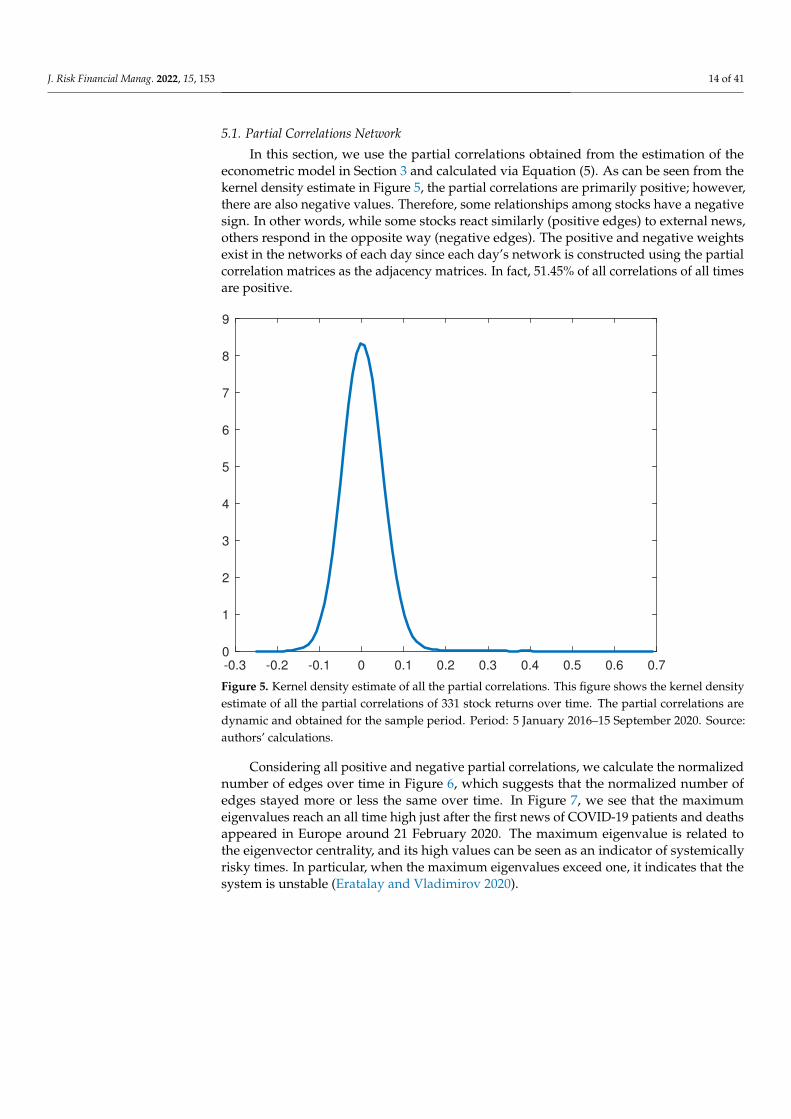
In this section, we use the partial correlations obtained from the estimation of theeconometric model in Section 3 and calculated via Equation (5). As can be seen from thekernel density estimate in Figure 5, the partial correlations are primarily positive; however,there are also negative values. Therefore, some relationships among stocks have a negativesign. In other words, while some stocks react similarly (positive edges) to external news,others respond in the opposite way (negative edges). The positive and negative weightsexist in the networks of each day since each day’s network is constructed using the partialcorrelation matrices as the adjacency matrices. In fact, 51.45% of all correlations of all timesare positive.
-0.3 -0.2 -0.1 0 0.1 0.2 0.3 0.4 0.5 0.6 0.7
0
1
2
3
4
5
6
7
8
9
Figure 5. Kernel density estimate of all the partial correlations. This figure shows the kernel densityestimate of all the partial correlations of 331 stock returns over time. The partial correlations aredynamic and obtained for the sample period. Period: 5 January 2016–15 September 2020. Source:authors’ calculations.
Considering all positive and negative partial correlations, we calculate the normalizednumber of edges over time in Figure 6, which suggests that the normalized number ofedges stayed more or less the same over time. In Figure 7, we see that the maximumeigenvalues reach an all time high just after the first news of COVID-19 patients and deathsappeared in Europe around 21 February 2020. The maximum eigenvalue is related tothe eigenvector centrality, and its high values can be seen as an indicator of systemicallyrisky times. In particular, when the maximum eigenvalues exceed one, it indicates that thesystem is unstable (Eratalay and Vladimirov 2020).

J. Risk Financial Manag. 2022, 15, 153 15 of 41
06/11/2016 12/10/2016 25/07/2017 09/05/2018 18/02/2019 21/02/2020 30/10/2020
0.22
0.225
0.23
0.235
0.24
0.245
0.25
Figure 6. Normalized number of edges over time. This figure shows the normalized number of edgesin the dynamic networks of the stocks in the S&P 350 Europe stock index during the data period 5January 2016–15 September 2020. The normalization is done using the maximum number of possibleedges. Source: authors’ calculations.
06/11/2016 12/10/2016 25/07/2017 09/05/2018 18/02/2019 21/02/2020 30/10/2020
0.998
0.9982
0.9984
0.9986
0.9988
0.999
0.9992
0.9994
0.9996
0.9998
1
Figure 7. Maximum eigenvalues over time. This figure shows the maximum eigenvalue of theadjacency matrices in the dynamic networks of the stocks in the S&P 350 Europe stock index duringthe data period 5 January 2016–15 September 2020. Source: authors’ calculations.
In this study, we calculated the eigenvector and closeness centrality measures basedon the dynamic partial correlations networks of S&P Europe 350 for the years 2016–2020.12
We calculated the eigenvector and closeness centralities considering whole daily partialcorrelation matrices. The eigenvector centrality considers the importance of a node’sneighbours and those neighbours’ connections. A node has a high eigenvector centrality ifits neighbours have a high eigenvector centrality. A node’s closeness centrality measuresits distance to the rest of the nodes on the network. We can say that as a node is closerto the rest of the nodes, it has a higher closeness centrality. Therefore, if the node hasa high closeness centrality, in the case of a shock, the rest of the network will have aquicker response to the shock. In terms of shock propagation, the closeness and eigenvector

J. Risk Financial Manag. 2022, 15, 153 16 of 41
centralities help us measure the impact of a shock by considering the distance among stocksand the possible implications for the neighbouring nodes. This is why we selected thesecentrality measures.
When calculating the distances among nodes, we found negative cycles. Therefore,it was impossible to calculate any relative distance parameter for net partial correlations.Consequently, the closeness centrality was only calculated for absolute and positive partialcorrelations. Independently and additionally, positive and negative weights would offseteach other when calculating closeness centralities. Therefore, we only considered theabsolute value for the closeness centrality.
In Tables A2 and A3 in Appendix A, we present the top 25 central firms for which theESG ratings were available for 2016–2019 and 2020, respectively. The most central firmswere mostly the same in both periods. These most central firms were mostly from Franceand Germany and from the financial sector, namely from banking and insurance industries.We can also note that there is a clear correlation between the centrality measures and ESGratings or systemic risk measures.
5.2. Systemic Risk Measure
Following the methodology in Section 5, we calculate the total systemic risk of the S&PEurope 350 stocks, given by Equation (8). In Figure 8, we plot this PCA-based total systemicrisk along with the composite indicator of systemic stress of the European Systemic RiskBoard and the stress sub-indices for financial and non-financial equities. These latter indicesare calculated from the realized volatilities of the corresponding stock market indices. Thedata were obtained from the Statistical Data Warehouse of the European Central Bank.13
This index is calculated for all the countries in the Euro area and uses the methodology ofHollo et al. (2012), which combines 15 raw mainly market-based financial stress measures.
Jan 2016 Jul 2016 Jan 2017 Jul 2017 Jan 2018 Jul 2018 Jan 2019 Jul 2019 Jan 2020 Jul 2020
0.4
0.6
0.8
1
1.2
1.4
1.6
1.8
2
2.2
105
0
0.05
0.1
0.15
0.2
0.25
0.3
PCA systemic risk (left y axis)
Composite indicator of systemic stress (right y axis)
Stress subindex - equity market - nonfinancial stocks
Stress subindex - equity market - financial stocks
X 11-Nov-2016
Y 0.136
Figure 8. PCA systemic risk of S&P Europe 350 stocks versus the Composite Indicator of SystemicStress of the ESRB. This figure shows the time series plots of the systemic risk index we calculatedusing the PCA method and the composite indicator of systemic stress, as well as the sub-indices forfinancial and non-financial equities of the European Systemic Risk Board. The latter indices are unitfree and normalized to [0,1] interval. The correlation between the PCA based systemic risk and otherseries is 0.6474, 0.7790, 0.7477. The data period was 5 January 2016–15 September 2020. Source: ESRBand authors’ calculations.

J. Risk Financial Manag. 2022, 15, 153 17 of 41
We find that the correlation of PCA-based systemic risk has a medium high correlationof approximately 0.65 with the ESRB composite indicator of systemic stress. Moreover, it ishighly correlated with the stress sub-indices: approximately 0.78 with non-financial stocksand approximately 0.75 with financial stocks. It seems that the PCA systemic risk measurereacted more than the other measures when the systemic risk increased in the market inJuly 2016 and it reacted more clearly in early March 2020.
Tables A6 and A7 in Appendix A show 25 firms for which the systemic risk was veryhigh in 2016–2019 and 2020, respectively. It can be seen that Wirecard AG from Germanyhad the highest risk and this risk was calculated as about nine times higher than the nextcompany in line in 2020. This was probably related to the Wirecard scandal in 2019 andtheir declaration of insolvency in 2020. Interestingly, Wirecard AG’s centrality measureswere not very high.14 In our regression analyses, we removed Wirecard AG from ourdataset. According to Tables A6 and A7, Anglo American Plc, ArcelorMittal Inc, Bank ofIreland Group, Glencore Plc and Unicredit SpA Ord also had high systemic risk measuresfor 2016–2019. In 2020, Anglo American Plc, Glencore Plc and Unicredit SpA Ord improvedtheir systemic risk measures, while Bank of Ireland Group, ArcelorMittal Inc. suffered inthat respect.
Tables A8 and A9 in Appendix A show 25 firms for which the systemic risk was thelowest in 2016–2019 and 2020, respectively. We can easily see that most of these low riskfirms are from Switzerland and there are many firms from the Communication Servicesand Consumer Staples sectors.
5.3. Systemic Risk and ESG Ratings
In this subsection we use the variables we obtained from the previous parts and fromthe datasets. We use the natural logarithm of systemic risk contribution and exposure asthe dependent variable. As regressors, we use the eigenvector and closeness centralities,natural logarithm of volatility, ESG ratings and firm level financial performance ratios. Inour regression analyses, we eliminate Wirecard AG from our list since it was an obviousoutlier in terms of systemic risk.
A preliminary analysis of scatter plots of average systemic risk exposures in logarithmand ESG ratings of the remaining 307 firms for which the ESG data was available are givenin Figure A2 in Appendix A. For each year and for the whole sample, the slope of the linearrelation is negative but small in magnitude. We can also note that in 2018 and 2019, themagnitude of the slope is relatively higher. Hence, in general we can talk about a negativecorrelation between systemic risk exposure (and contribution) and the ESG ratings.
5.3.1. Fixed Effects Regressions
In this subsection, we discuss the fixed effects estimation results. As mentionedabove, we have three panels to consider, with cross-section sizes 330, 307 and 199. In thelarger panels, we have more stocks from many industries. However, in the smallest panel,although we have the variables for firm-level financial performance ratios, we do not haveas many stocks from the banking and insurance industries. We discussed how differentindustries and countries are represented in these panels in Section 4.1.
The dependent variable in all these regressions is the natural logarithm of the systemicrisk. Since it has some outliers and only has positive values, taking a logarithm of thisvariable helps to bring the distribution closer to normal. The main variables in theseregressions are the net eigenvector centrality, absolute value closeness centrality, logarithmof volatility and the dummy variable that takes the value of one for 2020. We also addedcertain interactions of the variables. For example, it made sense to include the interaction ofcentralities with the logarithm of volatility, since a stock’s high volatility becomes dangerousfor the system if that stock is more central. A similar argument follows for the interactionof centralities with financial performance ratios. We also included interactions with thedummy variable since the partial effects might change during COVID-19. In all of thefollowing regressions, we removed some of the interaction terms between regressors due
J. Risk Financial Manag. 2022, 15, 153 18 of 41
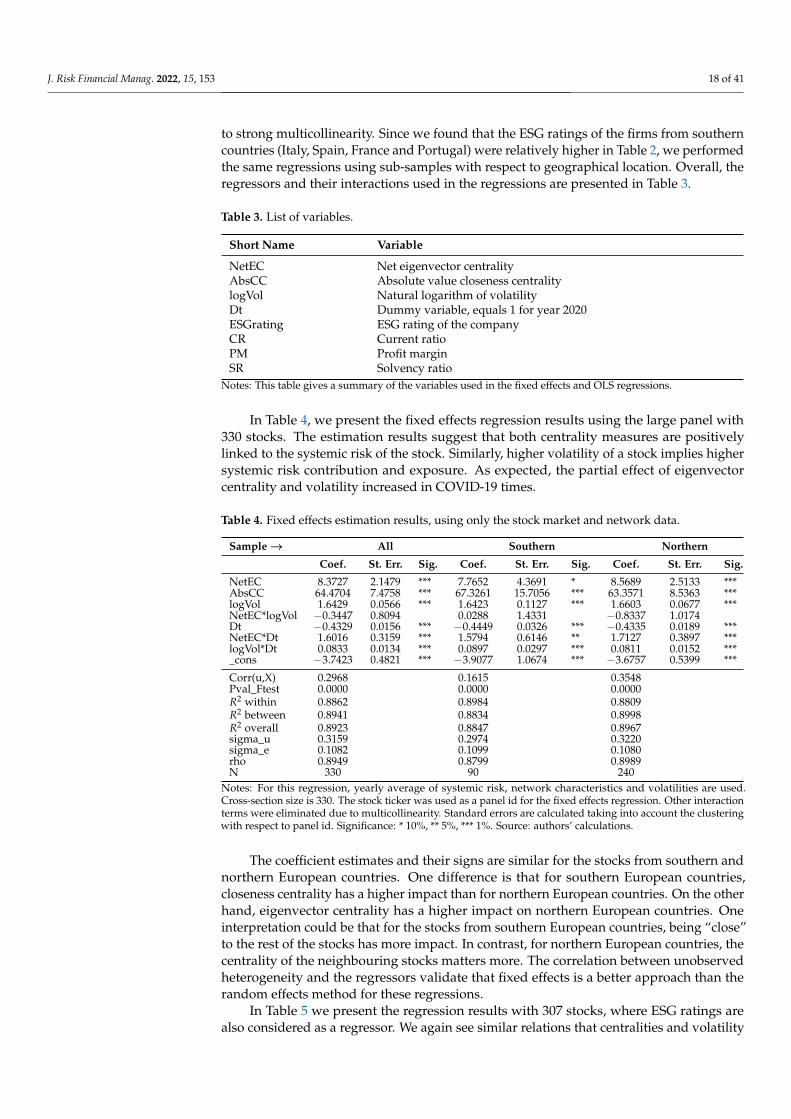
to strong multicollinearity. Since we found that the ESG ratings of the firms from southerncountries (Italy, Spain, France and Portugal) were relatively higher in Table 2, we performedthe same regressions using sub-samples with respect to geographical location. Overall, theregressors and their interactions used in the regressions are presented in Table 3.
Table 3. List of variables.
Short Name Variable
NetEC Net eigenvector centralityAbsCC Absolute value closeness centralitylogVol Natural logarithm of volatilityDt Dummy variable, equals 1 for year 2020ESGrating ESG rating of the companyCR Current ratioPM Profit marginSR Solvency ratio
Notes: This table gives a summary of the variables used in the fixed effects and OLS regressions.
In Table 4, we present the fixed effects regression results using the large panel with330 stocks. The estimation results suggest that both centrality measures are positivelylinked to the systemic risk of the stock. Similarly, higher volatility of a stock implies highersystemic risk contribution and exposure. As expected, the partial effect of eigenvectorcentrality and volatility increased in COVID-19 times.
Table 4. Fixed effects estimation results, using only the stock market and network data.
Sample → All Southern Northern
Coef. St. Err. Sig. Coef. St. Err. Sig. Coef. St. Err. Sig.
NetEC 8.3727 2.1479 *** 7.7652 4.3691 * 8.5689 2.5133 ***AbsCC 64.4704 7.4758 *** 67.3261 15.7056 *** 63.3571 8.5363 ***logVol 1.6429 0.0566 *** 1.6423 0.1127 *** 1.6603 0.0677 ***NetEC*logVol −0.3447 0.8094 0.0288 1.4331 −0.8337 1.0174Dt −0.4329 0.0156 *** −0.4449 0.0326 *** −0.4335 0.0189 ***NetEC*Dt 1.6016 0.3159 *** 1.5794 0.6146 ** 1.7127 0.3897 ***logVol*Dt 0.0833 0.0134 *** 0.0897 0.0297 *** 0.0811 0.0152 ***_cons −3.7423 0.4821 *** −3.9077 1.0674 *** −3.6757 0.5399 ***
Corr(u,X) 0.2968 0.1615 0.3548Pval_Ftest 0.0000 0.0000 0.0000R2 within 0.8862 0.8984 0.8809R2 between 0.8941 0.8834 0.8998R2 overall 0.8923 0.8847 0.8967sigma_u 0.3159 0.2974 0.3220sigma_e 0.1082 0.1099 0.1080rho 0.8949 0.8799 0.8989N 330 90 240
Notes: For this regression, yearly average of systemic risk, network characteristics and volatilities are used.Cross-section size is 330. The stock ticker was used as a panel id for the fixed effects regression. Other interactionterms were eliminated due to multicollinearity. Standard errors are calculated taking into account the clusteringwith respect to panel id. Significance: * 10%, ** 5%, *** 1%. Source: authors’ calculations.
The coefficient estimates and their signs are similar for the stocks from southern andnorthern European countries. One difference is that for southern European countries,closeness centrality has a higher impact than for northern European countries. On the otherhand, eigenvector centrality has a higher impact on northern European countries. Oneinterpretation could be that for the stocks from southern European countries, being “close”to the rest of the stocks has more impact. In contrast, for northern European countries, thecentrality of the neighbouring stocks matters more. The correlation between unobservedheterogeneity and the regressors validate that fixed effects is a better approach than therandom effects method for these regressions.
In Table 5 we present the regression results with 307 stocks, where ESG ratings arealso considered as a regressor. We again see similar relations that centralities and volatility

J. Risk Financial Manag. 2022, 15, 153 19 of 41
are positively linked to systemic risk. Similar to before, we notice the way that the partialeffects of centralities and volatility increase in 2020.
Table 5. Fixed effects estimation results, using the stock market, network and ESG ratings data.
Sample → All Southern Northern
Coef. St. Err. Sig. Coef. St. Err. Sig. Coef. St. Err. Sig.
NetEC 8.7535 2.2502 *** 9.6099 4.7321 ** 8.4713 2.6003 ***AbsCC 68.5705 7.7649 *** 67.5842 17.1712 *** 68.8595 8.6944 ***ESGrating −0.0007 0.0004 * −0.0005 0.0008 −0.0009 0.0005 *logVol 1.6316 0.0568 *** 1.6710 0.1203 *** 1.6373 0.0677 ***NetEC*logVol −0.1281 0.7984 −0.3629 1.5245 −0.4371 0.9981Dt −0.4264 0.0204 *** −0.4501 0.0535 *** −0.4252 0.0242 ***NetEC*Dt 1.5115 0.3464 *** 1.7231 0.8141 ** 1.5537 0.3977 ***logVol*Dt 0.0856 0.0145 *** 0.0908 0.0329 *** 0.0848 0.0164 ***ESGrating*Dt 0.0000 0.0002 −0.0000 0.0006 0.0000 0.0003_cons −3.9823 0.5009 *** −4.0233 1.1596 *** −3.9669 0.5528 ***
Corr(u,X) 0.2382 0.0669 0.3105Pval_Ftest 0.0000 0.0000 0.0000R2 within 0.8896 0.9042 0.8832R2 between 0.8895 0.8729 0.8976R2 overall 0.8888 0.8766 0.8953sigma_u 0.3159 0.3068 0.3179sigma_e 0.1079 0.1102 0.1075rho 0.8955 0.8858 0.8973N 307 81 226
Notes: For this regression, the yearly average of systemic risk, network characteristics, volatilities and ESG ratingsare used. Cross-section size is 307. The stock ticker is used as panel id for the fixed effect regression. Otherinteraction terms are eliminated due to multicollinearity. Standard errors are calculated taking into account theclustering with respect to panel id. Significance: * 10%, ** 5%, *** 1%. Source: authors’ calculations.
What is more in these results is that the ESG rating is negatively linked to systemicrisk. The coefficient is significant at 10% and is small in magnitude. However, if weconsider the approximately 40 point difference between the two modes in the histogramof Figure 3a, we can calculate that a 40-point increase in ESG ratings would decreasesystemic risk contribution and exposure by 2.90%.15 This means that firms with higherESG ratings benefit from a lower systemic risk contribution and exposure compared tofirms with lower ESG ratings. When we compare the results for southern and northernEuropean countries, we see that the ESG ratings have no significant impact on systemicrisk for southern European countries. For stocks from northern European countries, therewas a higher impact, which would imply a 3.41% decline in systemic risk contributionand exposure for a 40-point increase in ESG ratings. Our findings do not support that thepartial effect of ESG ratings was different in the COVID-19 period.
In Table 6, we further include the financial ratios of the firms in the regression. As wesaid before, due to lack of data, we end up with 199 stocks, among which there are fewerbanks and insurance firms. As before, the coefficients of centrality measures are positive. Inaddition, we find that the partial effect of eigenvector centrality decreases as profit marginincreases, but this does not depend on volatility or other financial performance ratios. Thismeans that a stock becomes systemically less risky if the firm’s profit margin is higher. Thecoefficient of log-volatility is positive, but the partial effect of volatility decreases whenprofit margin and solvency ratios are higher. This could mean that a stock’s high volatilityis less of a threat to the market if its profit margin and solvency ratios are higher. Financialperformance ratios are positively linked to systemic risk contribution and exposure, butthe sign of the partial effects quickly change for higher levels of eigenvector centrality andlog-volatility, which implies that having better financial performance reduces systemic riskcontribution and exposure further for central and volatile stocks.
The coefficient of the ESG rating is −0.0012 and it is significant at 5%. Following theprevious discussion, an increase of 40 points in the ESG rating would mean a decrease of4.87% in the systemic risk contribution and exposure. This implies that the high ESG-ratingfirms, in the right mode of the histogram in Figure 3a, are enjoying approximately 5%less systemic risk contribution and exposure compared to the low ESG-rating firms in the

J. Risk Financial Manag. 2022, 15, 153 20 of 41
left mode of the same histogram. In the extreme case, the difference between the left andright tails of the ESG-rating distribution is over 80 points, and this implies about 9.5% lesssystemic risk contribution and exposure for the high ESG-rating firms. Another note is thatthe partial effects of eigenvector centrality and log-volatility are higher in 2020, but no sucheffect is seen for ESG rating and financial ratios.
Comparing the results for southern and northern European countries, we find thatmost coefficients are quantitatively and qualitatively very similar. We observe the differencethat for southern countries the impact is much larger, yielding a 7.27% decrease in systemicrisk contribution and exposure for a 40-point increase in ESG ratings, while for northerncountries this impact is about 4.05%. This is a stronger result than that of the second panel,which has 307 stocks, and this is most likely due to the change in the stocks we considered.In this small panel, banks and insurance firms are not well represented due to lack of data.These results call for further research considering different industries, which we considerin Section 5.3.3.
Table 6. Fixed effects estimation results using the stock market, network, ESG ratings and firm levelfinancial data.
Sample → All Southern Northern
Coef. St. Err. Sig. Coef. St. Err. Sig. Coef. St. Err. Sig.
NetEC 9.8011 4.2693 ** 14.0324 8.0976 * 8.4767 4.8918 *AbsCC 78.7130 9.2521 *** 81.1382 24.4414 *** 79.4319 10.2511 ***ESGrating −0.0012 0.0005 ** −0.0019 0.0010 * −0.0010 0.0006 *CR 0.0639 0.0298 ** 0.0938 0.1230 0.0710 0.0310 **PM 0.0048 0.0013 *** 0.0012 0.0037 0.0044 0.0014 ***SR 0.0005 0.0035 −0.0012 0.0070 0.0003 0.0038logVol 1.7410 0.0815 *** 1.4485 0.2155 *** 1.7312 0.0887 ***NetEC*logVol −0.4065 1.4020 3.0364 3.0377 −0.0675 1.6459NetEC*CR −0.8164 0.6741 −1.5913 2.3496 −1.1342 0.7412NetEC*PM −0.0702 0.0208 *** 0.0059 0.0702 −0.0603 0.0276 **NetEC*SR 0.0405 0.0774 0.0768 0.1223 0.0487 0.0874logVol*CR −0.0198 0.0206 0.1562 0.1043 −0.0245 0.0215logVol*PM −0.0017 0.0006 *** −0.0027 0.0018 −0.0017 0.0006 ***logVol*SR −0.0028 0.0010 *** −0.0081 0.0030 *** −0.0023 0.0011 **Dt −0.3793 0.0320 *** −0.3194 0.1227 ** −0.3573 0.0351 ***NetEC*Dt 2.0518 0.4654 *** 1.7539 1.1584 1.7616 0.5330 ***logVol*Dt 0.0424 0.0196 ** 0.0510 0.0398 0.0442 0.0217 **ESGrating*Dt −0.0002 0.0003 −0.0007 0.0009 −0.0002 0.0003CR*Dt −0.0067 0.0050 −0.0837 0.0465 * −0.0033 0.0044PM*Dt −0.0004 0.0007 −0.0005 0.0011 −0.0003 0.0008SR*Dt −0.0003 0.0004 0.0027 0.0009 *** −0.0008 0.0004 *_cons −4.7024 0.5948 *** −5.0623 1.6964 *** −4.6851 0.6372 ***
Corr(u,X) 0.3076 0.0330 0.3514Pval_Ftest 0.0000 0.0000 0.0000R2 within 0.8673 0.8837 0.8646R2 between 0.8770 0.6809 0.9025R2 overall 0.8750 0.7033 0.8987sigma_u 0.3417 0.4237 0.3277sigma_e 0.1083 0.1053 0.1099rho 0.9087 0.9415 0.8988N 199 52 147
Notes: For this regression, the yearly average of systemic risk, network characteristics, volatilities, ESG ratingsand firm level financial data are used. Cross-section size is 199. The stock ticker was used as panel id for the fixedeffects regression. Other interaction terms were eliminated due to multicollinearity. Standard errors are calculatedtaking into account the clustering with respect to panel id. Significance: * 10%, ** 5%, *** 1%. Source: S&P GlobalESG ratings and authors’ calculations.
Overall, we find that higher ESG ratings can be associated with lower systemic risk con-tribution and exposure, which is in line with the results of Cerqueti et al. (2021), Boubakeret al. (2020) and Oikonomou et al. (2012). We could not find evidence that the partial effectof ESG ratings is different in the pandemic period. This result does not coincide with thefindings of Gregory (2022).
J. Risk Financial Manag. 2022, 15, 153 21 of 41
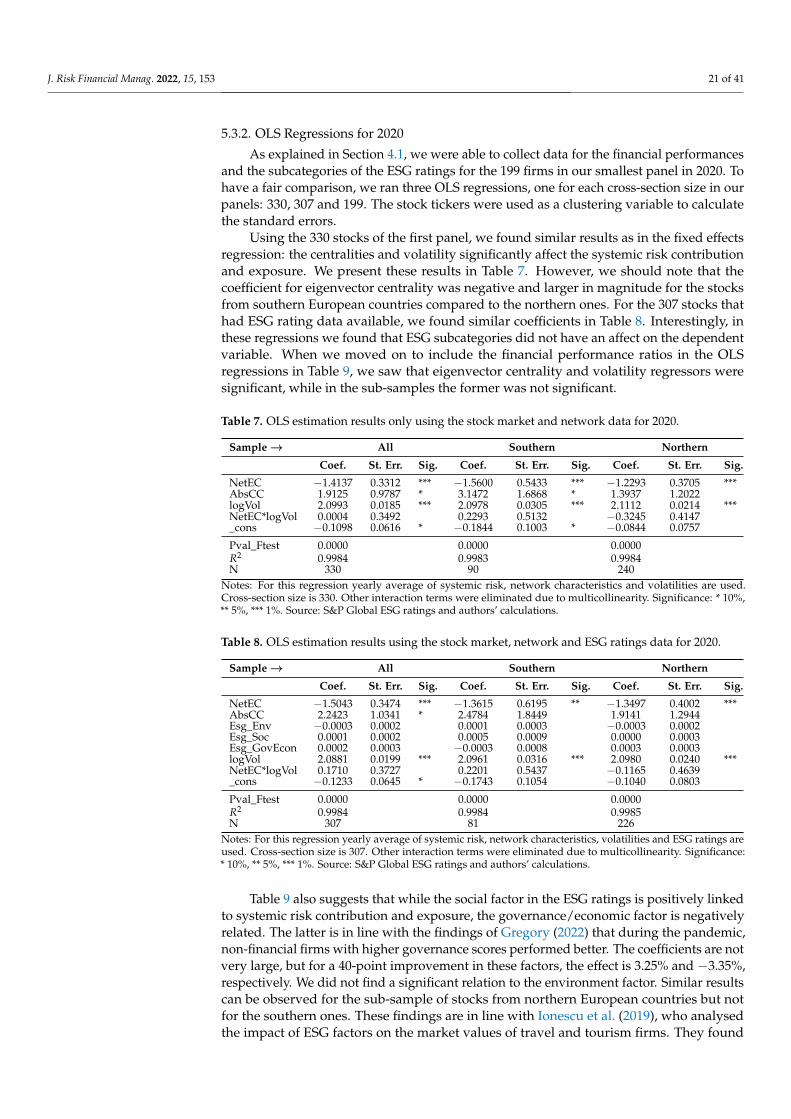
5.3.2. OLS Regressions for 2020
As explained in Section 4.1, we were able to collect data for the financial performancesand the subcategories of the ESG ratings for the 199 firms in our smallest panel in 2020. Tohave a fair comparison, we ran three OLS regressions, one for each cross-section size in ourpanels: 330, 307 and 199. The stock tickers were used as a clustering variable to calculatethe standard errors.
Using the 330 stocks of the first panel, we found similar results as in the fixed effectsregression: the centralities and volatility significantly affect the systemic risk contributionand exposure. We present these results in Table 7. However, we should note that thecoefficient for eigenvector centrality was negative and larger in magnitude for the stocksfrom southern European countries compared to the northern ones. For the 307 stocks thathad ESG rating data available, we found similar coefficients in Table 8. Interestingly, inthese regressions we found that ESG subcategories did not have an affect on the dependentvariable. When we moved on to include the financial performance ratios in the OLSregressions in Table 9, we saw that eigenvector centrality and volatility regressors weresignificant, while in the sub-samples the former was not significant.
Table 7. OLS estimation results only using the stock market and network data for 2020.
Sample → All Southern Northern
Coef. St. Err. Sig. Coef. St. Err. Sig. Coef. St. Err. Sig.
NetEC −1.4137 0.3312 *** −1.5600 0.5433 *** −1.2293 0.3705 ***AbsCC 1.9125 0.9787 * 3.1472 1.6868 * 1.3937 1.2022logVol 2.0993 0.0185 *** 2.0978 0.0305 *** 2.1112 0.0214 ***NetEC*logVol 0.0004 0.3492 0.2293 0.5132 −0.3245 0.4147_cons −0.1098 0.0616 * −0.1844 0.1003 * −0.0844 0.0757
Pval_Ftest 0.0000 0.0000 0.0000R2 0.9984 0.9983 0.9984N 330 90 240
Notes: For this regression yearly average of systemic risk, network characteristics and volatilities are used.Cross-section size is 330. Other interaction terms were eliminated due to multicollinearity. Significance: * 10%,** 5%, *** 1%. Source: S&P Global ESG ratings and authors’ calculations.
Table 8. OLS estimation results using the stock market, network and ESG ratings data for 2020.
Sample → All Southern Northern
Coef. St. Err. Sig. Coef. St. Err. Sig. Coef. St. Err. Sig.
NetEC −1.5043 0.3474 *** −1.3615 0.6195 ** −1.3497 0.4002 ***AbsCC 2.2423 1.0341 * 2.4784 1.8449 1.9141 1.2944Esg_Env −0.0003 0.0002 0.0001 0.0003 −0.0003 0.0002Esg_Soc 0.0001 0.0002 0.0005 0.0009 0.0000 0.0003Esg_GovEcon 0.0002 0.0003 −0.0003 0.0008 0.0003 0.0003logVol 2.0881 0.0199 *** 2.0961 0.0316 *** 2.0980 0.0240 ***NetEC*logVol 0.1710 0.3727 0.2201 0.5437 −0.1165 0.4639_cons −0.1233 0.0645 * −0.1743 0.1054 −0.1040 0.0803
Pval_Ftest 0.0000 0.0000 0.0000R2 0.9984 0.9984 0.9985N 307 81 226
Notes: For this regression yearly average of systemic risk, network characteristics, volatilities and ESG ratings areused. Cross-section size is 307. Other interaction terms were eliminated due to multicollinearity. Significance:* 10%, ** 5%, *** 1%. Source: S&P Global ESG ratings and authors’ calculations.
Table 9 also suggests that while the social factor in the ESG ratings is positively linkedto systemic risk contribution and exposure, the governance/economic factor is negativelyrelated. The latter is in line with the findings of Gregory (2022) that during the pandemic,non-financial firms with higher governance scores performed better. The coefficients are notvery large, but for a 40-point improvement in these factors, the effect is 3.25% and −3.35%,respectively. We did not find a significant relation to the environment factor. Similar resultscan be observed for the sub-sample of stocks from northern European countries but notfor the southern ones. These findings are in line with Ionescu et al. (2019), who analysedthe impact of ESG factors on the market values of travel and tourism firms. They found

J. Risk Financial Manag. 2022, 15, 153 22 of 41
that the governance factor had the highest positive impact on the market values and thesocial factor had a negative impact, while the environment factor had no significant impact.It is very likely that investors value the governance factor since it is a sign of stability forthe firm. As Ionescu et al. (2019) also argue, the investors probably see social investmentsas risky.
Table 9. OLS estimation results using the stock market, network, ESG ratings and firm level financialdata for 2020.
Sample → All Southern Northern
Coef. St. Err. Sig. Coef. St. Err. Sig. Coef. St. Err. Sig.
NetEC −1.4657 0.6431 ** −1.8380 1.1139 −1.2013 0.7311AbsCC 0.2549 1.1934 0.6408 2.8673 −0.2989 1.4799Esg_Env −0.0001 0.0003 −0.0013 0.0012 0.0001 0.0003Esg_Soc 0.0008 0.0004 ** 0.0013 0.0013 0.0007 0.0003 **Esg_GovEcon −0.0009 0.0003 *** −0.0007 0.0006 −0.0008 0.0003 **CR −0.0134 0.0087 −0.1310 0.0444 *** −0.0059 0.0079PM 0.0006 0.0006 0.0014 0.0010 0.0003 0.0007SR 0.0001 0.0007 0.0035 0.0021 0.0002 0.0008logVol 2.1108 0.0234 *** 2.1396 0.0570 *** 2.1115 0.0261 ***NetEC*logVol −0.2389 0.4411 −0.8308 1.0937 −0.3030 0.5026NetEC*CR 0.2170 0.1769 2.0354 0.7527 *** 0.1001 0.1482NetEC*PM −0.0113 0.0109 −0.0314 0.0193 −0.0041 0.0133NetEC*SR −0.0001 0.0115 −0.0534 0.0366 −0.0039 0.0131_cons 0.0079 0.0766 0.0608 0.1744 0.0151 0.0926
Pval_Ftest 0.0000 0.0000 0.0000R2 0.9985 0.9983 0.9988N 199 52 147
Notes: For this regression yearly average of systemic risk, network characteristics, volatilities, ESG ratings andfirm level financial data are used. Cross-section size is 199. Other interaction terms were eliminated due tomulticollinearity. Significance: * 10%, ** 5%, *** 1%. Source: S&P Global ESG ratings and authors’ calculations.
5.3.3. Further Regressions
In Table 10, we present the coefficients of the ESG ratings (ESG Coef) and their in-teraction with the dummy variable (D*ESG Coef) for 2020 in the fixed effects regressionswe ran for each sector. The industries that constitute these sectors are given in Table A20in Appendix A. As Hox et al. (2017) mention, when a panel data has less than 50 groupsand less than five cases for each group, the standard errors for the fixed effects regressionsmight be too small. We need to keep this in mind when interpreting the results of Table 10.This is why we report the number of firms in each sector in the last column of this table.
If we consider the panel of 307 stocks, where the regressors are as in Table 5, wefind significant coefficients for ESG ratings for energy, financial and utilities sectors. Anincrease of 40 points in ESG ratings in these sectors suggests a decrease of 16.60%, 6.07%and 17.56% in systemic risk, respectively. For these sectors, keeping ESG ratings highmight have helped reduce the systemic risk contribution and exposure. Our finding for thefinancial sector is in line with the results of Sonnenberger and Weiss (2021) for insurancefirms and Klooster (2018) and Chiaramonte et al. (2021) for banks. In 2020, this beneficialimpact of the ESG rating was slightly offset for consumer discretionary and informationtechnology sectors, while it was increased for the real estate sector. When we considerthe panel of 199 stocks, where the regressors were as in Table 6, we see that for the healthcare, information technology and utilities sectors the ESG ratings coefficients are significant.For health care, the coefficient is as high in magnitude as to imply a 22.50% reduction insystemic risk contribution and exposure for a 40-point increase in ESG ratings. This impactis reduced to about 14.19% in 2020. For the information technology and utilities sectors, theimpact of a 40-point increase in ESG ratings was about 13.20% and 18.74%.

J. Risk Financial Manag. 2022, 15, 153 23 of 41
Table 10. Fixed effects estimation results by sector.
Panel: 307 Stocks ESG Coef St. Err. Pval D*ESG Coef St. Err. Pval N
Communication Services −0.0025 0.0015 −0.0014 0.0011 19Consumer Discretionary 0.0006 0.0010 0.0014 0.0006 ** 32Consumer Staples 0.0007 0.0013 −0.0006 0.0005 29Energy −0.0045 0.0020 * 0.0048 0.0028 10Financials −0.0016 0.0007 ** −0.0004 0.0005 59Health Care −0.0011 0.0023 0.0001 0.0010 21Industrials −0.0007 0.0009 0.0005 0.0006 64Information Technology −0.0026 0.0016 0.0022 0.0010 * 15Materials −0.0005 0.0008 −0.0006 0.0008 29Real Estate 0.0004 0.0026 −0.0042 0.0021 * 10Utilities −0.0048 0.0012 *** −0.0010 0.0012 19
Panel: 199 Stocks ESG Coef St. Err. Sig. D*ESG Coef St. Err. Sig N
Communication Services −0.0015 0.0028 −0.0033 0.0013 ** 14Consumer Discretionary 0.0009 0.0018 −0.0008 0.0008 22Consumer Staples 0.0013 0.0016 −0.0003 0.0009 23Energy −0.0061 0.0035 0.0102 0.0021 *** 10Financials - - - - - - 1Health Care −0.0064 0.0020 *** 0.0025 0.0011 ** 17Industrials −0.0003 0.0015 −0.0005 0.0009 49Information Technology −0.0035 0.0011 *** 0.0026 0.0016 15Materials −0.0009 0.0008 −0.0004 0.0007 29Real Estate - - - - - - 2Utilities −0.0052 0.0019 ** −0.0007 0.0020 17
Notes: Fixed effects regressions for each sector are presented for the panels with 307 and 199 stocks. N is thenumber of stocks in each sector. The focus is on the coefficients of the ESG-ratings variable and its interactionwith the dummy variable for 2020. The stock ticker was used as panel id for the fixed effects regression. Standarderrors are calculated taking into account the clustering with respect to panel id. Significance: * 10%, ** 5%, *** 1%.Source: S&P Global ESG ratings and authors’ calculations.
Finally, we ran OLS regressions for each sector for 2020 using the panel with 307 stocks,where we used ESG sub-factors as ESG related regressors as in Section 5.3.2. In most cases,there were too few stocks in the sectors we wanted to analyse, which rendered these OLSregressions useless. There were 64 stocks in the Industrial sector and we found that thecoefficient of the environmental factor was −0.0006, significant at 10%, while the otherfactors were not significant. On the other hand, for the financial sector, where there were59 stocks, we found that the coefficients of social and governance/economic factors were−0.0008 and 0.0010, respectively, which were both significant at 1%. Harrell et al. (2001)suggest that for each regressor, one should have 10–20 observations per regressor, whileGreen (1991) suggests having at least 50+8*p number observations where p is the number ofregressors. In these regressions we had seven regressors, which required at least 70 or 106observations based on the suggestions of Harrell et al. (2001) and Green (1991), respectively.Therefore, it is possible that the results of these OLS regressions were suffering from a smallsample size. To save space, we do not present the results of these regressions.
6. Conclusions
The ESG rankings provide us with particular information on the firms. With them, thefirms state how they are in tune with investment preferences, treatment of their employeesand the institution’s financial health, etc. We can certainly imagine how susceptible acompany is to an economic shock with this information. However, we question whathappens when we also have information about the firm’s role within the financial system.How influential is it? Is it likely to trigger a cascade effect if something happens to a specificentity or will bankruptcy not affect more entities? Furthermore, we wonder at what speedthis will occur. We obtain this information from the eigenvector and closeness centralities.
In this study, we explored the effect of the ESG ratings of firms on the systemic riskcontribution and exposure of their stocks. Our aim was to show that keeping ESG ratingshigh would benefit the firms by reducing the systemic risk they face. For this purpose,we used the daily returns of the stocks constituting the S&P Europe 350 index for theperiod 5 January 2016–15 September 2020 and yearly ESG ratings and firm performanceratios for these firms. We employed an interdisciplinary approach that connected financial

J. Risk Financial Manag. 2022, 15, 153 24 of 41
econometrics, panel data econometrics and social networks. To be more precise, we fit arigorous model to estimate the daily volatilities and dynamic correlations, and using theprincipal components method we derived the systemic risk contribution and exposure mea-sures. Subsequently, we obtained dynamic partial correlations using Gaussian graphicalmodelling and constructed the daily partial correlation networks of stocks, which providedus with the network centralities. Finally, we employed panel data and OLS regressions,where the systemic risk contribution and exposure of each firm was the dependent variableand the volatility estimates, network centralities, ESG ratings and firm performance ratioswere the regressors. We also considered a dummy variable for the year 2020 to take accountof the effect of COVID-19.
Our results indicate that volatilities and network centralities are the main determinantsof systemic risk contribution and exposure, and the impact of these variables increasedduring the COVID-19 period. We also found that the systemic risk contribution andexposure could be reduced by almost 5% through a 40-point increase in ESG ratings. Whenwe consider the southern European countries (Italy, France, Spain and Portugal) alone,this effect rises to about 7.3%. This finding could be interpreted such that the firms to thehigher end of the ESG ratings benefit from reduced systemic risk contribution and exposurecompared to those with lower ESG ratings.
We were also able to analyse the effect of ESG subcategory ratings (environmental,social and governance/economic factors) for 2020, and we found no significant impactof the environmental factor. On the other hand, the results suggest a positive coefficientfor the social factors and a negative coefficient for the governance/economic factors onthe systemic risk contribution and exposure. These results may suggest that investors seesocial investments as risky but they value how the firms are governed.
The findings of this study are highly useful for firms. Although firms may find itcostly or risky to engage in ESG related activities, our results show that it pays to keep ESGratings high. In particular, firms should pay attention to governance/economic factors tosatisfy the interests of their shareholders.
This work can be extended in multiple ways. The first would be to expand the datasetfurther, not only in terms of the number of stocks considered but also the ESG ratingsand subcategories. For example, our data did not allow us to estimate regressions persector, although this would have been a valuable analysis. Another interesting pointcould be to explore whether the systemic risk measures and firm performance ratios aresimultaneously determined. Although it could provide a different insight into the possiblerelations between the variables, the firm-specific effects would not be captured by such aregression.
Author Contributions: Conceptualization, M.H.E. and A.P.C.Á.; methodology, M.H.E. and A.P.C.Á.;software, M.H.E. and A.P.C.Á.; validation, M.H.E. and A.P.C.Á.; formal analysis, M.H.E. and A.P.C.Á.;investigation, M.H.E. and A.P.C.Á.; resources, M.H.E.; data curation, M.H.E. and A.P.C.Á.; writing—original draft preparation, M.H.E. and A.P.C.Á.; writing—review and editing, M.H.E. and A.P.C.Á.;visualization, M.H.E. and A.P.C.Á.; supervision, M.H.E.; project administration, M.H.E.; fundingacquisition, M.H.E. All authors have read and agreed to the published version of the manuscript.
Funding: This research was funded by GrowInPro—HORIZON 2020, grant number 822781.
Institutional Review Board Statement: Not applicable.
Informed Consent Statement: Not applicable.
Data Availability Statement: Not applicable.
Acknowledgments: We are very grateful to Urmas Varblane, Priit Vahter, Jaan Masso, Luca Alfieriand three anonymous referees for their very useful comments and suggestions.
Conflicts of Interest: The authors declare no conflict of interest.

J. Risk Financial Manag. 2022, 15, 153 25 of 41
Appendix A
Appendix A.1. Tables and Figures
Table A1. Average overall ESG rating by company for 2016–2020.
Stock Names Countries Industry Average ESG Rating
Unilever NV United Kingdom Personal products 89.6Koninklijke KPN NV Netherlands Telecommunication services 89.4CNH Industrial NV United Kingdom Machinery and Electrical Equipment 88.8Red Electrica Corporacion SA Spain Electric utilities 88.8Energias de Portugal SA Portugal Electric utilities 88.6Iberdrola SA Spain Electric utilities 88.2Roche Hldgs AG Ptg Genus Switzerland Pharmaceuticals 88.2Banco Santander SA Spain Banks 87.2UPM-Kymmene Oyj Finland Paper and forest products 87.2Allianz SE Germany Insurance 87Enagas SA Spain Gas utilities 86.8Enel SpA Italy Electric utilities 86.6GlaxoSmithKline United Kingdom Pharmaceuticals 86.2Telecom Italia SpA Italy Telecommunication services 86.2Diageo Plc United Kingdom Beverages 86Endesa SA Spain Electric utilities 85.4Deutsche Telekom AG Germany Telecommunication services 85.2Koninklijke Philips Electronics NV Netherlands Health Care Equipment & Supplies 84.6Naturgy Energy Group SA Spain Gas utilities 84.6
UBS Group AG Switzerland Diversified Financial Services and Capi-tal Markets 84.6
Clariant AG Reg Switzerland Chemicals 84.4Lanxess AG Germany Chemicals 84.4Schneider Electric SE France Electrical Components and Equipment 84.2Adidas AG Germany Textiles, Apparel & Luxury Goods 84CaixaBank Spain Banks 84
Notes: This table gives the 25 best stocks with the highest average of the yearly ESG ratings for the years2016–2020. In total, there are 308 stocks for which ESG ratings were available. Source: S&P Global ESG ratingsand authors’ calculations.
Table A2. Centralities for 2016–2019, before COVID-19, by net eigenvector centrality.
Stock Tickers Countries Net EC Abs. EC. Abs. CC. Sys.Rk. ESG
BNP Paribas France 0.1028 0.0558 0.063 6.4293 81Investor AB B Sweden 0.0993 0.0588 0.0631 1.3355 40Societe Generale France 0.0965 0.061 0.0645 13.708 79Banco Santander SA Spain 0.0962 0.053 0.0629 9.4054 83Allianz SE Germany 0.0954 0.0583 0.0644 1.6231 87Swiss Life Reg Switzerland 0.0938 0.0578 0.0629 1.5106 51Credit Agricole SA France 0.0937 0.0568 0.062 9.2656 46BASF SE Germany 0.0926 0.0569 0.0631 2.806 37Banco Bilbao V.A. SA Spain 0.0899 0.0623 0.0659 9.592 87Zurich Insurance Gr. AG Switzerland 0.0898 0.0595 0.0627 1.3731 90Industrivarden AB A Sweden 0.0886 0.0527 0.0597 1.3141 30Daimler AG Germany 0.0881 0.0537 0.0603 4.59 25ING Groep NV Netherlands 0.0877 0.0572 0.062 6.3443 52Porsche Automobil H. SE Germany 0.0873 0.0518 0.059 8.0125 19AXA France 0.0865 0.0569 0.0625 3.1282 88Bayer Motoren Werke AG Germany 0.0861 0.0546 0.0601 3.6705 80Sandvik AB Sweden 0.0857 0.0573 0.0626 5.4072 76Credit Suisse Group AG Switzerland 0.0857 0.057 0.0643 10.308 65TOTAL SA France 0.0854 0.0565 0.06 2.7486 75UBS Group AG Switzerland 0.0836 0.0542 0.062 4.7065 84Volkswagen AG Germany 0.0832 0.0546 0.0593 5.4902 62Repsol SA Spain 0.0831 0.0584 0.0618 7.0166 38SEB-Skand Enskilda B. A Sweden 0.0827 0.0569 0.0628 2.7802 48LVMH-Moet Vuitton France 0.0826 0.057 0.0639 3.8778 69BHP Group Plc United Kingdom 0.0825 0.0576 0.0626 17.8649 43
Notes: This table provides the net and absolute eigenvector centralities and absolute value closeness centralities ofthe top 25 central firms, for which the ESG ratings were available, 2016–2019. The ordering was done with respectto net eigenvector centrality. Source: S&P Global ESG ratings and authors’ calculations.
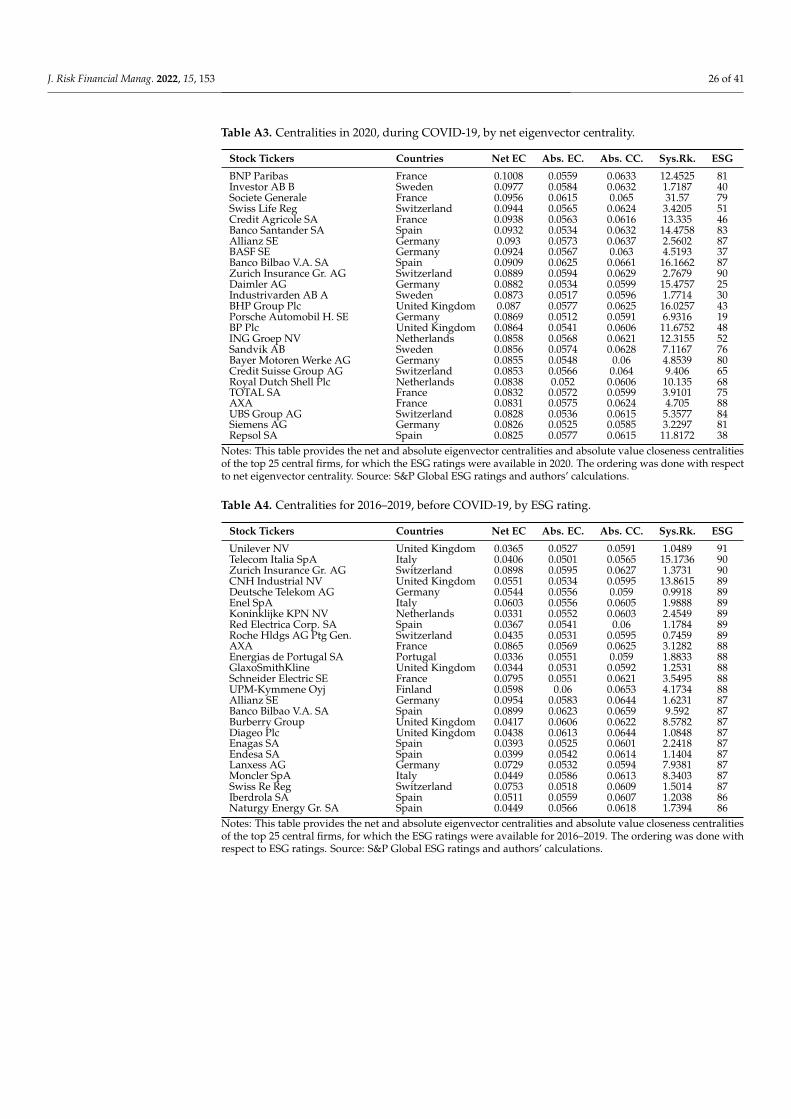
J. Risk Financial Manag. 2022, 15, 153 26 of 41
Table A3. Centralities in 2020, during COVID-19, by net eigenvector centrality.
Stock Tickers Countries Net EC Abs. EC. Abs. CC. Sys.Rk. ESG
BNP Paribas France 0.1008 0.0559 0.0633 12.4525 81Investor AB B Sweden 0.0977 0.0584 0.0632 1.7187 40Societe Generale France 0.0956 0.0615 0.065 31.57 79Swiss Life Reg Switzerland 0.0944 0.0565 0.0624 3.4205 51Credit Agricole SA France 0.0938 0.0563 0.0616 13.335 46Banco Santander SA Spain 0.0932 0.0534 0.0632 14.4758 83Allianz SE Germany 0.093 0.0573 0.0637 2.5602 87BASF SE Germany 0.0924 0.0567 0.063 4.5193 37Banco Bilbao V.A. SA Spain 0.0909 0.0625 0.0661 16.1662 87Zurich Insurance Gr. AG Switzerland 0.0889 0.0594 0.0629 2.7679 90Daimler AG Germany 0.0882 0.0534 0.0599 15.4757 25Industrivarden AB A Sweden 0.0873 0.0517 0.0596 1.7714 30BHP Group Plc United Kingdom 0.087 0.0577 0.0625 16.0257 43Porsche Automobil H. SE Germany 0.0869 0.0512 0.0591 6.9316 19BP Plc United Kingdom 0.0864 0.0541 0.0606 11.6752 48ING Groep NV Netherlands 0.0858 0.0568 0.0621 12.3155 52Sandvik AB Sweden 0.0856 0.0574 0.0628 7.1167 76Bayer Motoren Werke AG Germany 0.0855 0.0548 0.06 4.8539 80Credit Suisse Group AG Switzerland 0.0853 0.0566 0.064 9.406 65Royal Dutch Shell Plc Netherlands 0.0838 0.052 0.0606 10.135 68TOTAL SA France 0.0832 0.0572 0.0599 3.9101 75AXA France 0.0831 0.0575 0.0624 4.705 88UBS Group AG Switzerland 0.0828 0.0536 0.0615 5.3577 84Siemens AG Germany 0.0826 0.0525 0.0585 3.2297 81Repsol SA Spain 0.0825 0.0577 0.0615 11.8172 38
Notes: This table provides the net and absolute eigenvector centralities and absolute value closeness centralitiesof the top 25 central firms, for which the ESG ratings were available in 2020. The ordering was done with respectto net eigenvector centrality. Source: S&P Global ESG ratings and authors’ calculations.
Table A4. Centralities for 2016–2019, before COVID-19, by ESG rating.
Stock Tickers Countries Net EC Abs. EC. Abs. CC. Sys.Rk. ESG
Unilever NV United Kingdom 0.0365 0.0527 0.0591 1.0489 91Telecom Italia SpA Italy 0.0406 0.0501 0.0565 15.1736 90Zurich Insurance Gr. AG Switzerland 0.0898 0.0595 0.0627 1.3731 90CNH Industrial NV United Kingdom 0.0551 0.0534 0.0595 13.8615 89Deutsche Telekom AG Germany 0.0544 0.0556 0.059 0.9918 89Enel SpA Italy 0.0603 0.0556 0.0605 1.9888 89Koninklijke KPN NV Netherlands 0.0331 0.0552 0.0603 2.4549 89Red Electrica Corp. SA Spain 0.0367 0.0541 0.06 1.1784 89Roche Hldgs AG Ptg Gen. Switzerland 0.0435 0.0531 0.0595 0.7459 89AXA France 0.0865 0.0569 0.0625 3.1282 88Energias de Portugal SA Portugal 0.0336 0.0551 0.059 1.8833 88GlaxoSmithKline United Kingdom 0.0344 0.0531 0.0592 1.2531 88Schneider Electric SE France 0.0795 0.0551 0.0621 3.5495 88UPM-Kymmene Oyj Finland 0.0598 0.06 0.0653 4.1734 88Allianz SE Germany 0.0954 0.0583 0.0644 1.6231 87Banco Bilbao V.A. SA Spain 0.0899 0.0623 0.0659 9.592 87Burberry Group United Kingdom 0.0417 0.0606 0.0622 8.5782 87Diageo Plc United Kingdom 0.0438 0.0613 0.0644 1.0848 87Enagas SA Spain 0.0393 0.0525 0.0601 2.2418 87Endesa SA Spain 0.0399 0.0542 0.0614 1.1404 87Lanxess AG Germany 0.0729 0.0532 0.0594 7.9381 87Moncler SpA Italy 0.0449 0.0586 0.0613 8.3403 87Swiss Re Reg Switzerland 0.0753 0.0518 0.0609 1.5014 87Iberdrola SA Spain 0.0511 0.0559 0.0607 1.2038 86Naturgy Energy Gr. SA Spain 0.0449 0.0566 0.0618 1.7394 86
Notes: This table provides the net and absolute eigenvector centralities and absolute value closeness centralitiesof the top 25 central firms, for which the ESG ratings were available for 2016–2019. The ordering was done withrespect to ESG ratings. Source: S&P Global ESG ratings and authors’ calculations.
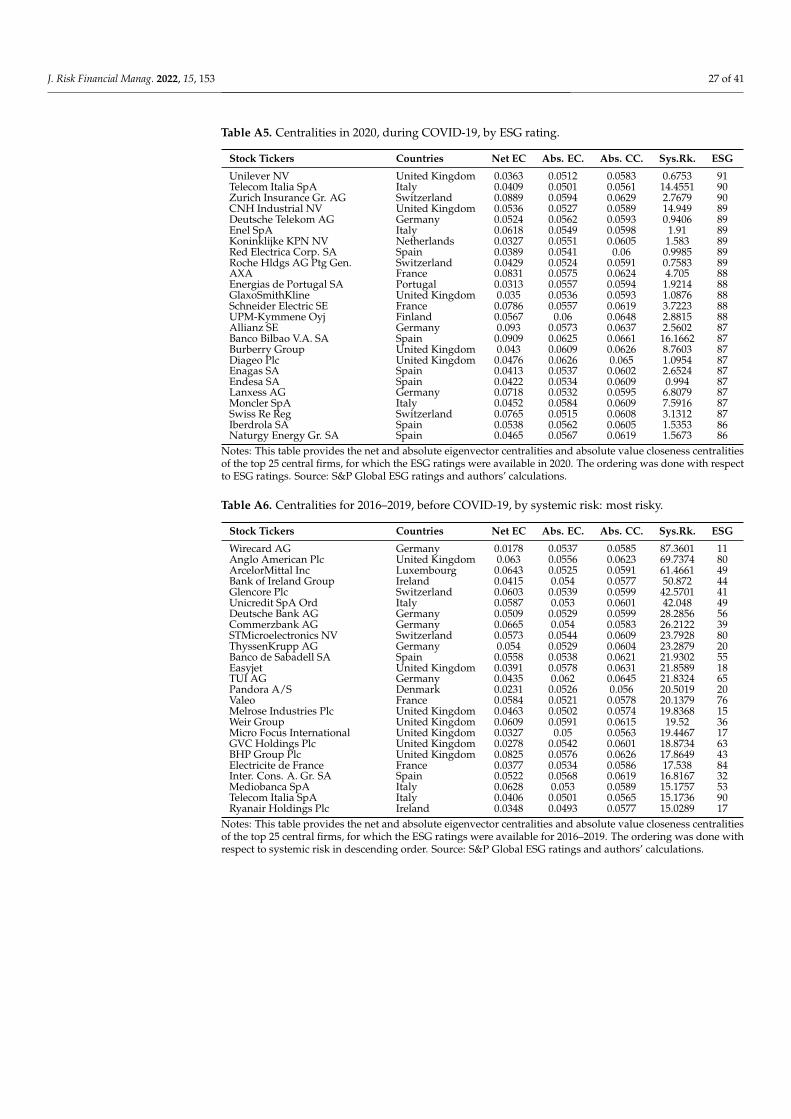
J. Risk Financial Manag. 2022, 15, 153 27 of 41
Table A5. Centralities in 2020, during COVID-19, by ESG rating.
Stock Tickers Countries Net EC Abs. EC. Abs. CC. Sys.Rk. ESG
Unilever NV United Kingdom 0.0363 0.0512 0.0583 0.6753 91Telecom Italia SpA Italy 0.0409 0.0501 0.0561 14.4551 90Zurich Insurance Gr. AG Switzerland 0.0889 0.0594 0.0629 2.7679 90CNH Industrial NV United Kingdom 0.0536 0.0527 0.0589 14.949 89Deutsche Telekom AG Germany 0.0524 0.0562 0.0593 0.9406 89Enel SpA Italy 0.0618 0.0549 0.0598 1.91 89Koninklijke KPN NV Netherlands 0.0327 0.0551 0.0605 1.583 89Red Electrica Corp. SA Spain 0.0389 0.0541 0.06 0.9985 89Roche Hldgs AG Ptg Gen. Switzerland 0.0429 0.0524 0.0591 0.7583 89AXA France 0.0831 0.0575 0.0624 4.705 88Energias de Portugal SA Portugal 0.0313 0.0557 0.0594 1.9214 88GlaxoSmithKline United Kingdom 0.035 0.0536 0.0593 1.0876 88Schneider Electric SE France 0.0786 0.0557 0.0619 3.7223 88UPM-Kymmene Oyj Finland 0.0567 0.06 0.0648 2.8815 88Allianz SE Germany 0.093 0.0573 0.0637 2.5602 87Banco Bilbao V.A. SA Spain 0.0909 0.0625 0.0661 16.1662 87Burberry Group United Kingdom 0.043 0.0609 0.0626 8.7603 87Diageo Plc United Kingdom 0.0476 0.0626 0.065 1.0954 87Enagas SA Spain 0.0413 0.0537 0.0602 2.6524 87Endesa SA Spain 0.0422 0.0534 0.0609 0.994 87Lanxess AG Germany 0.0718 0.0532 0.0595 6.8079 87Moncler SpA Italy 0.0452 0.0584 0.0609 7.5916 87Swiss Re Reg Switzerland 0.0765 0.0515 0.0608 3.1312 87Iberdrola SA Spain 0.0538 0.0562 0.0605 1.5353 86Naturgy Energy Gr. SA Spain 0.0465 0.0567 0.0619 1.5673 86
Notes: This table provides the net and absolute eigenvector centralities and absolute value closeness centralitiesof the top 25 central firms, for which the ESG ratings were available in 2020. The ordering was done with respectto ESG ratings. Source: S&P Global ESG ratings and authors’ calculations.
Table A6. Centralities for 2016–2019, before COVID-19, by systemic risk: most risky.
Stock Tickers Countries Net EC Abs. EC. Abs. CC. Sys.Rk. ESG
Wirecard AG Germany 0.0178 0.0537 0.0585 87.3601 11Anglo American Plc United Kingdom 0.063 0.0556 0.0623 69.7374 80ArcelorMittal Inc Luxembourg 0.0643 0.0525 0.0591 61.4661 49Bank of Ireland Group Ireland 0.0415 0.054 0.0577 50.872 44Glencore Plc Switzerland 0.0603 0.0539 0.0599 42.5701 41Unicredit SpA Ord Italy 0.0587 0.053 0.0601 42.048 49Deutsche Bank AG Germany 0.0509 0.0529 0.0599 28.2856 56Commerzbank AG Germany 0.0665 0.054 0.0583 26.2122 39STMicroelectronics NV Switzerland 0.0573 0.0544 0.0609 23.7928 80ThyssenKrupp AG Germany 0.054 0.0529 0.0604 23.2879 20Banco de Sabadell SA Spain 0.0558 0.0538 0.0621 21.9302 55Easyjet United Kingdom 0.0391 0.0578 0.0631 21.8589 18TUI AG Germany 0.0435 0.062 0.0645 21.8324 65Pandora A/S Denmark 0.0231 0.0526 0.056 20.5019 20Valeo France 0.0584 0.0521 0.0578 20.1379 76Melrose Industries Plc United Kingdom 0.0463 0.0502 0.0574 19.8368 15Weir Group United Kingdom 0.0609 0.0591 0.0615 19.52 36Micro Focus International United Kingdom 0.0327 0.05 0.0563 19.4467 17GVC Holdings Plc United Kingdom 0.0278 0.0542 0.0601 18.8734 63BHP Group Plc United Kingdom 0.0825 0.0576 0.0626 17.8649 43Electricite de France France 0.0377 0.0534 0.0586 17.538 84Inter. Cons. A. Gr. SA Spain 0.0522 0.0568 0.0619 16.8167 32Mediobanca SpA Italy 0.0628 0.053 0.0589 15.1757 53Telecom Italia SpA Italy 0.0406 0.0501 0.0565 15.1736 90Ryanair Holdings Plc Ireland 0.0348 0.0493 0.0577 15.0289 17
Notes: This table provides the net and absolute eigenvector centralities and absolute value closeness centralitiesof the top 25 central firms, for which the ESG ratings were available for 2016–2019. The ordering was done withrespect to systemic risk in descending order. Source: S&P Global ESG ratings and authors’ calculations.

J. Risk Financial Manag. 2022, 15, 153 28 of 41
Table A7. Centralities in 2020, during COVID-19, by systemic risk: most risky.
Stock Tickers Countries Net EC Abs. EC. Abs. CC. Sys.Rk. ESG
Wirecard AG Germany 0.0173 0.0551 0.0592 1050.2487 11TUI AG Germany 0.0445 0.0629 0.0648 138.6509 65Bank of Ireland Group Ireland 0.0424 0.0541 0.0576 96.2661 44Carnival Plc United Kingdom 0.0477 0.0534 0.0582 95.1087 47ArcelorMittal Inc Luxembourg 0.0647 0.0515 0.0587 66.7692 49Inter. Cons. A. Gr. SA Spain 0.0543 0.0573 0.0622 64.9675 32Unibail Rodamco Westfield France 0.0662 0.0565 0.0611 50.7264 41ThyssenKrupp AG Germany 0.0536 0.0531 0.0599 44.1727 20Easyjet United Kingdom 0.0407 0.0569 0.0632 42.9224 18Rolls-Royce Holdings Plc United Kingdom 0.0425 0.0547 0.0588 42.6259 74Renault SA France 0.0625 0.0549 0.0596 41.3718 45Melrose Industries Plc United Kingdom 0.0477 0.05 0.0578 40.107 15Anglo American Plc United Kingdom 0.0668 0.0557 0.0622 36.328 80Commerzbank AG Germany 0.0669 0.0545 0.0586 34.3686 39Societe Generale France 0.0956 0.0615 0.065 31.57 79Micro Focus International United Kingdom 0.0345 0.0505 0.0559 30.9013 17Valeo France 0.0568 0.0522 0.057 30.5707 76Klepierre France 0.0594 0.0581 0.0623 28.5112 40Banco de Sabadell SA Spain 0.0555 0.0546 0.0625 27.3305 55Glencore Plc Switzerland 0.0632 0.0532 0.0595 26.7761 41Deutsche Bank AG Germany 0.0509 0.0534 0.06 25.4111 56GVC Holdings Plc United Kingdom 0.0293 0.0539 0.06 23.5431 63ABN AMRO Group NV Netherlands 0.0577 0.0504 0.0593 22.6387 83Ryanair Holdings Plc Ireland 0.0362 0.0485 0.0573 22.2129 17Unicredit SpA Ord Italy 0.0579 0.052 0.0594 22.0486 49
Notes: This table provides the net and absolute eigenvector centralities and absolute value closeness centralitiesof the top 25 central firms, for which the ESG ratings were available in 2020. The ordering was done with respectto to systemic risk in descending order. Source: S&P Global ESG ratings and authors’ calculations.
Table A8. Centralities for 2016–2019, before COVID-19, by systemic risk: least risky.
Stock Tickers Countries Net EC Abs. EC. Abs. CC. Sys.Rk. ESG
Swiss Prime Site AG Switzerland 0.031 0.0556 0.0612 0.3777 25Swisscom AG Reg Switzerland 0.0521 0.0539 0.0588 0.4423 58Nestle SA Reg Switzerland 0.0456 0.054 0.0578 0.4996 72Beiersdorf AG Germany 0.0438 0.054 0.0617 0.7235 29Roche Hldgs AG Ptg Gen. Switzerland 0.0435 0.0531 0.0595 0.7459 89SGS-Soc Gen Surveil Hldg R. Switzerland 0.0573 0.0521 0.0571 0.7497 85Groupe Bruxelles Lambert Belgium 0.0822 0.0508 0.0581 0.7744 38Geberit AG Reg Switzerland 0.0636 0.0556 0.0594 0.7797 37Givaudan AG Switzerland 0.0475 0.0526 0.0613 0.8175 37Lindt & Sprungli AG R. Switzerland 0.0324 0.0554 0.0584 0.8263 23Heineken NV Netherlands 0.0558 0.0581 0.0631 0.8693 82Orkla AS Norway 0.0222 0.0566 0.0605 0.9364 62Novartis AG Reg Switzerland 0.0506 0.0541 0.0593 0.945 73Kuehne & Nagel Intl. AG R. Switzerland 0.0466 0.0594 0.063 0.9477 48Carlsberg AS B Denmark 0.035 0.0543 0.0608 0.9688 24Henkel AG & Co. K. N. P. Germany 0.0464 0.0562 0.0597 0.9768 37Partners Group Hldg Switzerland 0.0552 0.0594 0.0628 0.9828 55Danone France 0.0468 0.0584 0.0609 0.991 69Deutsche Telekom AG Germany 0.0544 0.0556 0.059 0.9918 89Unilever NV United Kingdom 0.0365 0.0527 0.0591 1.0489 91Telia Company AB Sweden 0.0485 0.0528 0.0592 1.0531 32Diageo Plc United Kingdom 0.0438 0.0613 0.0644 1.0848 87Pernod-Ricard France 0.0472 0.0575 0.0623 1.0926 34SEGRO Plc United Kingdom 0.041 0.0515 0.0609 1.1128 58Endesa SA Spain 0.0399 0.0542 0.0614 1.1404 87
Notes: This table provides the net and absolute eigenvector centralities and absolute value closeness centralitiesof the top 25 central firms, for which the ESG ratings were available for 2016–2019. The ordering was done withrespect to systemic risk in ascending order. Source: S&P Global ESG ratings and authors’ calculations.

J. Risk Financial Manag. 2022, 15, 153 29 of 41
Table A9. Centralities in 2020, during COVID-19, by systemic risk: least risky.
Stock Tickers Countries Net EC Abs. EC. Abs. CC. Sys.Rk. ESG
Nestle SA Reg Switzerland 0.0451 0.054 0.0575 0.3749 72Swisscom AG Reg Switzerland 0.0502 0.0543 0.0593 0.4261 58Swiss Prime Site AG Switzerland 0.0286 0.0558 0.0616 0.555 25Beiersdorf AG Germany 0.0447 0.053 0.0616 0.6034 29SGS-Soc Gen Surveil Hldg R. Switzerland 0.0549 0.0536 0.0573 0.6687 85Unilever NV United Kingdom 0.0363 0.0512 0.0583 0.6753 91Givaudan AG Switzerland 0.047 0.0515 0.061 0.6793 37Lindt & Sprungli AG R. Switzerland 0.0326 0.0552 0.0589 0.709 23Novartis AG Reg Switzerland 0.0494 0.0534 0.0591 0.7266 73Roche Hldgs AG Ptg Gen. Switzerland 0.0429 0.0524 0.0591 0.7583 89Telia Company AB Sweden 0.0472 0.0528 0.0588 0.7846 32Danone France 0.0458 0.0587 0.0611 0.7928 69Orkla AS Norway 0.022 0.0572 0.0601 0.8446 62Schindler-Hldg AG Reg Switzerland 0.0458 0.054 0.0604 0.9048 26Henkel AG & Co. K. N. P. Germany 0.0484 0.0566 0.0598 0.9162 37Deutsche Wohnen AG BR Germany 0.0291 0.0559 0.0613 0.9172 27Deutsche Telekom AG Germany 0.0524 0.0562 0.0593 0.9406 89Ahold Delhaize NV Netherlands 0.0259 0.0571 0.0613 0.9408 83Geberit AG Reg Switzerland 0.0605 0.057 0.06 0.9641 37Endesa SA Spain 0.0422 0.0534 0.0609 0.994 87Kuehne & Nagel Intl. AG R. Switzerland 0.0449 0.0597 0.063 0.9956 48Red Electrica Corp. SA Spain 0.0389 0.0541 0.06 0.9985 89Elisa Corporation Finland 0.0288 0.0536 0.0589 1.0182 31Wolters Kluwer NV Netherlands 0.0436 0.0518 0.0579 1.0284 30Croda Intl United Kingdom 0.0399 0.0554 0.0616 1.031 35
Notes: This table provides the net and absolute eigenvector centralities and absolute value closeness centralitiesof the top 25 central firms, for which the ESG ratings were available in 2020. The ordering was done with respectto systemic risk in ascending order. Source: S&P Global ESG ratings and authors’ calculations.
BNKINS
CHM
FBNIEQ
TLS
DRGPRO
REA
TEX
AUT
ELC
MUW OGXFOA
ARO
PUB
CON
FDR
TRA
BVG
ELQ
MNX
TCD
TRTAIR
BLD
FRP
IDD
MTC
RTS
SOF
TSV
ATX
BTC
COM
COS
GASHOM
ICS
LIF
SEM
TOB
CMT
CNO
CTR
HEA
HOU
ITC
REX
ALU
DHP
IMS
OGR
STL
THQ
(a) 330 firms—industries
GBFR
DE
CHSE
ES
NL
DK
FI
IE
LU
PT
(b) 330 firms—countries
BNKINS
CHM
FBN
IEQ TLS
DRG
REA
MUW
OGX
TEX
FOA
PRO
ARO
AUT
ELC
CON
FDR
PUB
BVG
ELQ
MNX
TCD
TRA
TRT
AIR
BLD
IDD
TSV
ATX
COM
COS
FRP
GAS
HOM
ICS
LIFMTC
SEM
SOF
TOB
BTC
CMT CNO
HEA
HOU
ITCREX
RTSALU
CTR
DHP
OGR
STL
THQ
(c) 307 firms—industries
GBFR
DE
CHSE
ES
NL
DK
FI
IE
PT
LU
(d) 307 firms—countries
Figure A1. Cont.

J. Risk Financial Manag. 2022, 15, 153 30 of 41
CHMDRG
OGX
TLSIEQ
MUW
TEXAROFOA
CON
ELC
BVG
MNX
PUB
TCD
TRA
IDD
PRO
TSVAIR
AUT
COM
ELQ
FDR
FRP
GAS
HOM
MTC
SEM
SOFTRT
ATX
BLD
BTC
CMT
COS
HEA
HOU
ICS
ITC
REA
REX
RTS
TOB
ALU
CNO
CTR
FBN
LIF
OGR
STL
THQ
(e) 199 firms—industries
GBFR
DECH
ES
SE
DK
IEFINL
LUPT
(f) 199 firms—countries
Figure A1. Word clouds to visualize the industries and countries of the firms in our dataset. In ourdataset we have 330 firms, 307 of them have ESG rating data available, and 199 of them have bothESG rating and firm level financial ratios data available. Source: authors’ calculations.
0 10 20 30 40 50 60 70 80 90 100
ESG rating
0
1
2
3
4
5
6
Sys. risk
Linear: y = - 0.001285*x + 1.492
(a) 2016
0 10 20 30 40 50 60 70 80 90 100
ESG rating
0
1
2
3
4
5
6
Sys. risk
Linear: y = - 0.002197*x + 1.369
(b) 2017
0 10 20 30 40 50 60 70 80 90 100
ESG rating
0
1
2
3
4
5
6
Sys. risk
Linear: y = - 0.003353*x + 1.506
(c) 2018
0 10 20 30 40 50 60 70 80 90 100
ESG rating
0
1
2
3
4
5
6
Sys. risk
Linear: y = - 0.002675*x + 1.512
(d) 2019
Figure A2. Cont.

J. Risk Financial Manag. 2022, 15, 153 31 of 41
0 10 20 30 40 50 60 70 80 90 100
ESG rating
0
1
2
3
4
5
6S
ys. risk
Linear: y = - 0.0004368*x + 1.531
(e) 2020
0 10 20 30 40 50 60 70 80 90 100
ESG rating
0
1
2
3
4
5
6
Sys. risk
Linear: y = - 0.001537*x + 1.458
(f) 2016–2020
Figure A2. Scatter plots of average systemic risk per year versus the ESG ratings in that year.
Appendix A.2. Tables Related to Stock Data
Table A10. Firms part I.
ISO Industry ModelTicker Company Market Cap in Billion $ Code Code Inclusion
1COV.DE Covestro AG 7585 DE CHM oooAAL.L Anglo American PLC 35,532 GB MNX oooABBN.SW ABB Ltd 46,631 CH ELQ ooABF.L Associated British Foods 24,306 GB FOA oooABI.BR Anheuser Busch Inbev NV 123,000 BE BVG oooABN.AS ABN AMRO Group NV 15,246 NL BNK ooAC.PA Accor 11,274 FR TRT oooACA.PA Credit Agricole SA 37,284 FR BNK ooACS.MC ACS Actividades de 11,217 ES CON ooo
Construccion y Servicios SAAD.AS Ahold Delhaize NV 26,391 NL FDR ooADP.PA ADP Promesses 17,427 FR PRO oADS.DE Adidas AG 58,080 DE TEX oooAENA.MC Aena SA 25,575 ES TRA oooAGN.AS Aegon NV 8523 NL INS ooAGS.BR AGEAS 10,450 BE INS ooAHT.L Ashtead Group 14,359 GB TCD oooAI.PA L’Air Liquide S.A. 59,445 FR CHM oooAIR.PA Airbus SE 101,000 FR ARO oooAKE.PA Arkema 7242 FR CHM oooAKZA.AS Akzo Nobel NV 20,643 NL CHM oooALFA.ST Alfa Laval AB 9490 SE IEQ oooALO.PA Alstom 9472 FR IEQ oooALV.DE Allianz SE 91,110 DE INS ooAMS.MC Amadeus IT Group SA 31,396 ES TSV oooASML.AS ASML Holding NV 112,000 NL SEM oooASSA-B.ST Assa Abloy B 22,025 SE BLD ooATCO-A.ST Atlas Copco AB A 29,893 SE IEQ ooATL.MI Atlantia SpA 17,153 IT TRA oooATO.PA AtoS SE 8115 FR TSV oooAV.L Aviva 19,478 GB INS ooAZN.L AstraZeneca PLC 118,000 GB DRG oooBA.L BAE Systems PLC 23,152 GB ARO oooBAER.SW Julius Baer Group 10,284 CH FBN ooBALN.SW Baloise Hldg Reg 7859 CH INS oBARC.L Barclays 36,376 GB BNK ooBAS.DE BASF SE 61,859 DE CHM oooBATS.L British American 94,014 GB TOB ooBAYN.DE Bayer AG 67,899 DE DRG ooBBVA.MC Banco Bilbao Vizcaya 33,226 ES BNK oo
Argentaria SANotes: The last column indicates in which panels a stock was included. “o” indicates that the stock was in Panel 1,“oo” indicates that the stock was in Panel 1 and 2, and “ooo” indicates that the stock was in all the panels. Source:S&P Global ESG ratings and authors’ calculations.

J. Risk Financial Manag. 2022, 15, 153 32 of 41
Table A11. Firms part II.
ISO Industry ModelTicker Company Market Cap in Billion $ Code Code Inclusion
BDEV.L Barratt Developments 8981 GB HOM oooTobacco PLC
BEI.DE Beiersdorf AG 26,875 DE COS oooBHP.L BHP Group Plc 44,349 GB MNX oooBIRG.IR Bank of Ireland Group 5270 IE BNK ooBKG.L Berkeley Group 7860 GB HOM ooo
Holdings PlcBLND.L British Land Co 7108 GB REA ooBMW.DE Bayer Motoren Werke 44,029 DE AUT oo
AG (BMW)BN.PA danone 50,625 FR FOA oooBNP.PA BNP Paribas 65,744 FR BNK ooBNR.DE Brenntag AG 7490 DE TCD oooBNZL.L Bunzl 8190 GB TCD oooBOL.ST Boliden AB 6478 SE MNX oooBP.L BP p.l.c 120,000 GB OGX oooBRBY.L Burberry Group 10,719 GB TEX oooBT-A.L BT Group 22,669 GB TLS oooBVI.PA Bureau Veritas SA 10,512 FR PRO ooCA.PA Carrefour SA 12,068 FR FDR ooCABK.MC CaixaBank 16,736 ES BNK ooCAP.PA Capgemini SE 18,218 FR TSV oooCARL-B.CO Carlsberg AS B 15,807 DK BVG oooCBK.DE Commerzbank AG 6909 DE BNK ooCCL.L Carnival Plc 9321 GB TRT ooCFR.SW Richemont, Cie 36,538 CH TEX oo
Financiere A BrCHR.CO Christian Hansen Holding A/S 9341 DK LIF ooCLN.SW Clariant AG Reg 6598 CH CHM oooCLNX.MC Cellnex Telecom S.A. 14,784 ES TLS oCNA.L Centrica 6152 GB MUW oooCNHI.MI CNH Industrial NV 13,325 IT IEQ ooCOLO-B.CO Coloplast AS B 21,897 DK HEA oooCON.DE Continental AG 23,052 DE ATX oooCPG.L Compass Group 35,582 GB REX oooCRDA.L Croda Intl 7981 GB CHM oooCRH CRH Plc 28,198 IE COM oooCS.PA AXA 60,928 FR INS ooCSGN.SW Credit Suisse Group AG 30,826 CH FBN ooDAI.DE Daimler AG 52,817 DE AUT oooDANSKE.CO Danske Bank A/S 12,437 DK BNK ooDASTY Dassault Systemes SA 38,532 FR SOF oooDB Deutsche Bank AG 14,295 DE BNK ooDB1.DE Deutsche Boerse AG 26,628 DE FBN oo
Notes: The last column indicates in which panels a stock was included. “o” indicates that the stock was in Panel 1,“oo” indicates that the stock was in Panel 1 and 2, and “ooo” indicates that the stock was in all the panels. Source:S&P Global ESG ratings and authors’ calculations.
Table A12. Firms part III.
ISO Industry ModelTicker Company Market Cap in Billion $ Code Code Inclusion
DCC.L DCC 7836 IE IDD oooDG.PA Vinci 59,918 FR CON oooDGE.L Diageo Plc 97,310 GB BVG oooDLG.L Direct Line Insurance 5078 GB INS oo
GroupDNB.OL DNB ASA 26,283 NO BNK ooDPW.DE Deutsche Post AG 41,805 DE TRA oooDSM.AS Koninklijke DSM NV 21,063 NL CHM oooDSV.CO Dsv Panalpina A/s 24,146 DK TRA oooDTE.DE Deutsche Telekom AG 69,374 DE TLS ooDWNI.DE Deutsche Wohnen AG BR 13,100 DE REA ooEBS.VI Erste Group Bank AG 14,424 AT BNK ooEDEN.PA Edenred 11,211 FR TSV oooEDF.PA Electricite de France 30,290 FR ELC oooEDP.LS Energias de Portugal SA 11,931 PT ELC ooEL.PA EssilorLuxottica 58,853 FR TEX oooELE.MC Endesa SA 25,187 ES ELC oooELISA.HE Elisa Corporation 8190 FI TLS oooELUX-B.ST Electrolux AB B 6571 SE DHP oo

J. Risk Financial Manag. 2022, 15, 153 33 of 41
Table A12. Cont.
ISO Industry ModelTicker Company Market Cap in Billion $ Code Code Inclusion
EN.PA Bouygues 14,072 FR CON oooENEL.MI Enel SpA 71,827 IT ELC oooENG.MC Enagas SA 5428 ES GAS oooENGI.PA Engie 34,731 FR MUW oooENI.MI ENI SpA 50,318 IT OGX oooEOAN.DE E.ON SE 25,155 DE MUW oooEQNR.OL Equinor ASA 59,422 NO OGX oooERIC-B.ST Ericsson L.M. Telefonaktie B 23,660 SE CMT oooEXO.MI EXOR NV 16,648 IT FBN ooEXPN.L Experian Plc 29,221 GB PRO ooEZJ.L Easyjet 6659 GB AIR ooo
FCA.MIFiat Chrysler AutomobilesNV 20,446 IT AUT o
FER.MC Ferrovial SA 19,942 ES CON oooFERG.L Ferguson PLC 18,780 GB TCD oooFGR.PA Eiffage 9996 FR CON oooFLTR.L Flutter Entertainment plc 8465 IE CNO oooFME.DE Fresenius Medical Care AG 20,259 DE HEA oooFORTUM.HE Fortum Oyj 19,544 FI ELC oooFP.PA TOTAL SA 131,000 FR OGX oooFR.PA Valeo 7546 FR ATX oooG.MI Assicurazioni Generali SpA 28,638 IT INS ooG1A.DE GEA AG 5320 DE IEQ ooGALP.LS Galp Energia SGPS SA 11,490 PT OGX oooGBLB.BR Groupe Bruxelles Lambert 15,161 BE FBN ooGEBN.SW Geberit AG Reg 18,517 CH BLD oooGFC.PA Gecina 12,155 FR REA oo
Notes: The last column indicates in which panels a stock was included. “o” indicates that the stock was in Panel 1,“oo” indicates that the stock was in Panel 1 and 2, and “ooo” indicates that the stock was in all the panels. Source:S&P Global ESG ratings and authors’ calculations.
Table A13. Firms part IV.
ISO Industry ModelTicker Company Market Cap in Billion $ Code Code Inclusion
GFS.L G4S Plc 3997 GB ICS oooGIVN.SW Givaudan AG 25,757 CH DRG oooGLE.PA Societe Generale 26,292 FR INS ooGLEN.L Glencore Plc 40,569 GB MNX oooGLPG.AS Galapagos Genomics NV 12,060 BE BTC oGMAB.CO Genmab AS 12,880 DK BTC oooGRF.MC Grifols SA 13,393 ES BTC oooGSK.L GlaxoSmithKline 113,000 GB DRG oooGVC.L GVC Holdings PLC 6041 GB CNO ooHEI.DE HeidelbergCement AG 12,889 DE COM oooHEIA.AS Heineken NV 54,674 NL BVG oooHEN3.DE Henkel AG & Co. KGaA 16,426 DE HOU ooo
Nvtg-PrefHEXA-B.ST Hexagon AB 17,520 SE ITC oooHL.L Hargreaves Lansdown Plc 10,846 GB FBN oooHLMA.L Halma 9449 GB ITC oooHM-B.ST Hennes & Mauritz AB B 26,521 SE RTS oooHNR1.DE Hannover Ruck SE 20,778 DE INS ooHO.PA Thales 19,586 FR ARO oooHSBA.L HSBC Holdings Plc 144,000 GB BNK ooIAG.L International Consolidated 14,713 GB AIR oo
Airlines Group SAIMB.L Imperial Brands PLC 22,548 GB TOB oooIMI.L IMI 3988 GB PRO oINDU-A.ST Industrivarden AB A 5938 SE FBN ooINF.L Informa PLC 12,676 GB PUB oooINGA.AS ING Groep NV 41,645 NL BNK oo

J. Risk Financial Manag. 2022, 15, 153 34 of 41
Table A13. Cont.
ISO Industry ModelTicker Company Market Cap in Billion $ Code Code Inclusion
IBE.MC Iberdrola SA 58,403 ES ELC oooIFX.DE Infineon Technologies AG 25,391 DE SEM oooIHG.L InterContinental Hotels 11,553 GB TRT ooo
Group PLCIII.L 3I Group 12,602 GB FBN ooINVE-B.ST Investor AB B 22,195 SE FBN ooISP.MI Intesa SanPaolo 41,114 IT BNK ooITRK.L Intertek Group PLC 11,119 GB PRO oooITV.L ITV PLC 7183 GB PUB oooITX.MC Inditex SA 98,018 ES RTS oJMAT.L Johnson, Matthey 7043 GB CHM oooKBC.BR KBC Group NV 27,961 BE BNK ooKER.PA Kering 73,803 FR TEX oooKGP.L Kingspan Group PLC 9888 IE BLD oooKINV-B.ST Kinnevik Investment AB B 5280 SE FBN ooKNEBV.HE Kone Corp B 26,178 FI IEQ oo
Notes: The last column indicates in which panels a stock was included. “o” indicates that the stock was in Panel 1,“oo” indicates that the stock was in Panel 1 and 2, and “ooo” indicates that the stock was in all the panels. Source:S&P Global ESG ratings and authors’ calculations.
Table A14. Firms part V.
ISO Industry ModelTicker Company Market Cap in Billion $ Code Code Inclusion
KNIN.SW KUEHNE & NAGEL 18,023 CH TRA oooINTL AG-REG
KPN.AS Koninklijke KPN NV 11,057 NL TLS ooKYGA.L Kerry Group A 19,531 IE FOA oooLAND.L Land Securities Group PLC 8789 GB REA ooLDO.MI Leonardo S.p.a. 6041 IT ARO oooLEG.DE LEG Immobilien AG 7237 DE REA oLGEN.L Legal & General Group 21,154 GB BNK ooLHA.DE Deutsche Lufthansa AG 7772 DE AIR oooLHN.SW LafargeHolcim Ltd 30,439 CH COM oooLI.PA Klepierre 10,406 FR REA ooLISN.SW Lindt & Sprungli AG Reg 10,701 CH FOA ooLLOY.L Lloyds Banking 51,831 GB BNK oo
Group PLCLOGN.SW Logitech International SA 7301 CH THQ oooLONN.SW Lonza AG 24,206 CH LIF ooLR.PA Legrand Promesses 19,234 FR ELQ ooLSE.L London Stock 32,084 GB FBN oo
Exchange PLCLXS.DE Lanxess AG 5231 DE CHM oooMAERSK-A.CO AP Moller-Maersk AS A 12,997 DK TRA oMB.MI Mediobanca SpA 8648 IT BNK ooMC.PA LVMH-Moet Vuitton 211,000 FR TEX oooMCRO.L Micro Focus International 4561 GB PRO oooMKS.L Marks & Spencer Group 4920 GB FDR ooML.PA Michelin CGDE B Brown 19,645 FR ATX ooMNDI.L Mondi PLC 10,171 GB FRP oooMONC.MI Moncler SpA 10,336 IT TEX oooMOWI.OL Mowi ASA 11,942 NO FOA oooMRK.DE MERCK KGaA 13,615 DE DRG oooMRO.L Melrose Industries PLC 13,785 GB IEQ oooMRW.L Morrison (WM) 5650 GB FDR ooo
SupermarketsMT.AS ArcelorMittal Inc 15,888 LU STL oooMTX.DE MTU Aero Engines AG 13,239 DE ARO oooMUV2.DE Munich Re AG 37,955 DE INS oNDA-FI.HE Nordea Bank Abp 29,111 FI BNK ooNESN.SW Nestle SA Reg 287,000 CH FOA oooNESTE.HE Neste Oyj 23,860 FI OGR oooNG.L National Grid PLC 41,881 GB MUW oooNHY.OL Norsk Hydro AS 6848 NO ALU oooNN.AS NN Group N.V. 11,619 NL INS ooNOKIA.HE Nokia OYJ 18,561 FI CMT oooNOVN.SW Novartis AG Reg 216,000 CH DRG oooNOVO-B.CO Novo Nordisk AS B 96,373 DK DRG oo
Notes: The last column indicates in which panels a stock was included. “o” indicates that the stock was in Panel 1,“oo” indicates that the stock was in Panel 1 and 2, and “ooo” indicates that the stock was in all the panels. Source:S&P Global ESG ratings and authors’ calculations.

J. Risk Financial Manag. 2022, 15, 153 35 of 41
Table A15. Firms part VI.
ISO Industry ModelTicker Company Market Cap in Billion $ Code Code Inclusion
NTGY.MC Naturgy Energy Group SA 22,044 ES GAS oooNXT.L Next 11,049 GB RTS oooNZYM-B.CO Novozymes AS B 10,350 DK CHM oooOCDO.L Ocado Group PLC 10,685 GB RTS oOMV.VI OMV AG 16,389 AT OGX oooOR.PA L’Oreal 147,000 FR COS oooORA.PA Orange 34,750 FR TLS oooORK.OL Orkla AS 9034 NO FOA oooPAH3.DE Porsche Automobil 10,204 DE AUT oo
Holding SEPGHN.SW Partners Group Hldg 21,805 CH REA oooPHIA.AS Koninklijke Philips 39,397 NL MTC ooo
Electronics NVPNDORA.CO Pandora A/S 3878 DK TEX oooPROX.BR Proximus 8626 BE ELQ oooPRU.L Prudential PLC 44,280 GB INS ooPRY.MI Prysmian SpA 5762 IT ELQ oooPSN.L Persimmon 10,114 GB HOM oooPSON.L Pearson 5876 GB PUB oooPUB.PA Publicis Groupe 9701 FR PUB oooQIA.DE QIAGEN NV 6913 DE LIF oooRACE.MI Ferrari NV 28,681 IT AUT oooRAND.AS Randstad NV 9960 NL PRO ooRB.L Reckitt Benckiser 53,348 GB HOU ooo
Group PLCRDSA.L Royal Dutch Shell PLC 110,000 GB OGX oooREE.MC Red Electrica 9698 ES ELC ooo
Corporacion SAREL.L RELX PLC 45,300 GB PRO oooREP.MC Repsol SA 22,271 ES OGX oooRI.PA Pernod-Ricard 42,290 FR BVG oooRIO.L Rio Tinto PLC 67,920 GB MNX oooRMS.PA Hermes Intl 70,330 FR TEX oRNO.PA Renault SA 12,473 FR AUT ooROG.SW Roche Hldgs AG 203,000 CH DRG ooo
Ptg GenusRR.L Rolls-Royce Holdings PLC 15,590 GB ARO oooRSA.L RSA Insurance Group PLC 6861 GB INS ooRTO.L Rentokil Initial 9836 GB ICS oooRWE.DE RWE AG 16,813 DE MUW ooRY4C.IR Ryanair Holdings PLC 15,859 IE AIR oooSAB.MC Banco de Sabadell SA 5840 ES BNK ooSAF.PA Safran SA 56,314 FR ARO oooSAMPO.HE Sampo Oyj A 21,562 FI INS ooSAN.MC Banco Santander SA 61,985 ES BNK oo
Notes: The last column indicates in which panels a stock was included. “o” indicates that the stock was in Panel 1,“oo” indicates that the stock was in Panel 1 and 2, and “ooo” indicates that the stock was in all the panels. Source:S&P Global ESG ratings and authors’ calculations.
Table A16. Firms part VII.
ISO Industry ModelTicker Company Market Cap in Billion $ Code Code Inclusion
SAN.PA Sanofi-Aventis 113,000 FR DRG oooSAND.ST Sandvik AB 21,857 SE IEQ oooSAP.DE SAP SE 148,000 DE SOF oooSBRY.L Sainsbury (J) 6008 GB FDR oooSCA-B.ST SCA-B shares 5774 SE FRP oSCHN.SW Schindler-Hldg AG Reg 14,642 CH IEQ oooSCMN.SW Swisscom AG Reg 24,437 CH TLS ooSCR.PA SCOR SE 6980 FR INS ooSDR.L Schroders PLC 8905 GB FBN ooSEB-A.ST SEB-Skand Enskilda 18,219 SE BNK oo
Banken ASECU-B.ST Securitas AB B 5354 SE ICS ooSESG.PA SES 4793 LU PUB oSEV.PA Suez SA 8406 FR MUW oooSGE.L Sage Group 9912 GB SOF oooSGO.PA Saint-Gobain, Cie de 19,940 FR BLD ooSGRO.L SEGRO PLC 11,627 GB REA ooSGSN.SW SGS-Soc Gen Surveil 18,624 CH PRO ooo
Hldg RegSHB-A.ST Svenska Handelsbanken A 18,699 SE BNK ooSIE.DE Siemens AG 99,059 DE IDD oooSK3.IR Smurfit Kappa Group PLC 8096 IE CTR oooSKA-B.ST SKANSKA AB-B 8072 SE CON oooSKF-B.ST SKF AB B 7588 SE IEQ oo

J. Risk Financial Manag. 2022, 15, 153 36 of 41
Table A16. Cont.
ISO Industry ModelTicker Company Market Cap in Billion $ Code Code Inclusion
SLA.L Standard Life Aberdeen 9100 GB FBN ooSLHN.SW Swiss Life Reg 15,019 CH INS ooSMDS.L DS Smith 6209 GB CTR oSMIN.L Smiths Group 7829 GB IDD oooSN.L Smith & Nephew 19,295 GB MTC oooSOLB.BR Solvay 10,936 BE CHM oooSOON.SW Sonova Holding AG 13,127 CH MTC oooSPSN.SW Swiss Prime Site AG 7821 CH REA oooSPX.L Spirax-Sarco Engineering 7724 GB IEQ oooSREN.SW Swiss Re Reg 32,752 CH INS ooSRG.MI Snam SpA 15,908 IT GAS oooSSE.L Scottish & Southern Energy 17,583 GB ELC oSTAN.L Standard Chartered 26,909 GB BNK ooSTERV.HE Stora Enso OYJ R 7939 FI FRP oooSTJ.L St James’s Place 7280 GB FBN ooSTM.MI STMicroelectronics NV 21,820 IT SEM oooSTMN.SW Straumann AG Reg 13,888 CH MTC oSU.PA Schneider Electric SE 53,251 FR ELQ oooSVT.L Severn Trent 7138 GB MUW oooSW.PA Sodexo 15,578 FR REX ooo
Notes: The last column indicates in which panels a stock was included. “o” indicates that the stock was in Panel 1,“oo” indicates that the stock was in Panel 1 and 2, and “ooo” indicates that the stock was in all the panels. Source:S&P Global ESG ratings and authors’ calculations.
Table A17. Firms part VIII.
ISO Industry ModelTicker Company Market Cap in Billion $ Code Code Inclusion
SWED-A.ST Swedbank AB 15,047 SE BNK ooSWMA.ST Swedish Match AB 7821 SE TOB oooSY1.DE Symrise AG 12,703 DE CHM oooTATE.L Tate & Lyle 4187 GB FOA oooTEF.MC Telefonica SA 32,331 ES TLS oooTEL.OL Telenor ASA 23,032 NO TLS oooTEL2-B.ST Tele2 AB B 8621 SE TLS ooTELIA.ST Telia Company AB 16,151 SE TLS oooTEMN.SW Temenos Group AG 10,213 CH SOF oTEN.MI Tenaris SA 11,864 IT OGX oooTEP.PA Teleperformance 12,735 FR PRO oTIT.MI Telecom Italia SpA 8459 IT TLS oooTKA.DE ThyssenKrupp AG 7495 DE IDD oooTPK.L Travis Perkins 4730 GB TCD oooTRN.MI Terna SpA 11,913 IT ELC oTSCO.L Tesco 29,294 GB FDR oooTUI1.DE TUI AG 6612 DE TRT oooUBI.PA Ubisoft Entertainment SA 6939 FR IMS oUBSG.SW UBS Group AG 43,098 CH FBN ooUCB.BR UCB SA 13,790 BE DRG oooUCG.MI Unicredit SpA Ord 28,956 IT BNK ooUG.PA Peugeot SA 19,272 FR AUT oUHR.SW Swatch Group AG-B 7663 CH TEX oooUMI.BR Umicore 10,683 BE CHM oooUNA.AS Unilever NV 79,136 NL COS ooUPM.HE UPM-Kymmene Oyj 16,448 FI FRP oooURW.AS Unibail Rodamco Westfield 19,358 FR REA ooUTDI.DE United Internet AG Reg 6002 DE TLS oooUU.L United Utilities Group Plc 7602 GB MUW oooVIE.PA Veolia Environnement 13,332 FR MUW oooVIFN.SW Vifor Pharma Group 10,567 CH DRG oooVIV.PA Vivendi SA 30,564 FR PUB ooVNA.DE Vonovia SE 26,029 DE REA ooVOD.L Vodafone Group 49,971 GB TLS oooVOLV-B.ST Volvo AB B 24,537 SE AUT ooVOW.DE Volkswagen AG 51,124 DE AUT oooVWS.CO Vestas Wind Systems AS 17,918 DK IEQ oooWDI.DE Wirecard AG 13,275 DE FBNWEIR.L Weir Group 4631 GB IEQ oooWKL.AS Wolters Kluwer NV 17,751 NL PRO ooWPP.L WPP Plc 16,725 GB PUB oooWRT1V.HE Wartsila Oyj ABP 5828 FI IEQ oWTB.L Whitbread 8407 GB TRT ooYAR.OL Yara International ASA 10,188 NO CHM oooZURN.SW Zurich Insurance Group AG 55,011 CH INS oo
Notes: The last column indicates in which panels a stock was included. “o” indicates that the stock was in Panel 1,“oo” indicates that the stock was in Panel 1 and 2, and “ooo” indicates that the stock was in all the panels. Source:S&P Global ESG ratings and authors’ calculations.
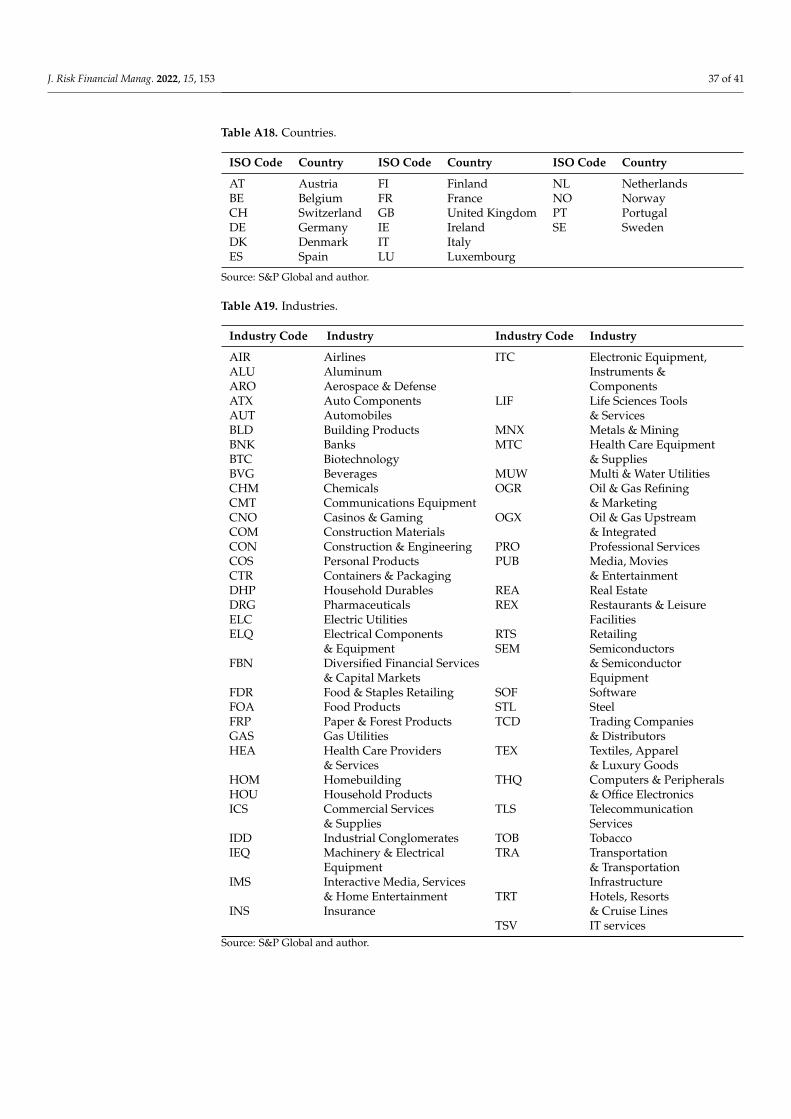
J. Risk Financial Manag. 2022, 15, 153 37 of 41
Table A18. Countries.
ISO Code Country ISO Code Country ISO Code Country
AT Austria FI Finland NL NetherlandsBE Belgium FR France NO NorwayCH Switzerland GB United Kingdom PT PortugalDE Germany IE Ireland SE SwedenDK Denmark IT ItalyES Spain LU Luxembourg
Source: S&P Global and author.
Table A19. Industries.
Industry Code Industry Industry Code Industry
AIR Airlines ITC Electronic Equipment,ALU Aluminum Instruments &ARO Aerospace & Defense ComponentsATX Auto Components LIF Life Sciences ToolsAUT Automobiles & ServicesBLD Building Products MNX Metals & MiningBNK Banks MTC Health Care EquipmentBTC Biotechnology & SuppliesBVG Beverages MUW Multi & Water UtilitiesCHM Chemicals OGR Oil & Gas RefiningCMT Communications Equipment & MarketingCNO Casinos & Gaming OGX Oil & Gas UpstreamCOM Construction Materials & IntegratedCON Construction & Engineering PRO Professional ServicesCOS Personal Products PUB Media, MoviesCTR Containers & Packaging & EntertainmentDHP Household Durables REA Real EstateDRG Pharmaceuticals REX Restaurants & LeisureELC Electric Utilities FacilitiesELQ Electrical Components RTS Retailing
& Equipment SEM SemiconductorsFBN Diversified Financial Services & Semiconductor
& Capital Markets EquipmentFDR Food & Staples Retailing SOF SoftwareFOA Food Products STL SteelFRP Paper & Forest Products TCD Trading CompaniesGAS Gas Utilities & DistributorsHEA Health Care Providers TEX Textiles, Apparel
& Services & Luxury GoodsHOM Homebuilding THQ Computers & PeripheralsHOU Household Products & Office ElectronicsICS Commercial Services TLS Telecommunication
& Supplies ServicesIDD Industrial Conglomerates TOB TobaccoIEQ Machinery & Electrical TRA Transportation
Equipment & TransportationIMS Interactive Media, Services Infrastructure
& Home Entertainment TRT Hotels, ResortsINS Insurance & Cruise Lines
TSV IT servicesSource: S&P Global and author.

J. Risk Financial Manag. 2022, 15, 153 38 of 41
Table A20. Sectors.
Sector -> Industry Num of Firms Sector -> Industry Num of Firms
Communication Services 22 Industrials 69Interactive Media, Services & Home Entertainment 1 Aerospace & Defense 7Media, Movies & Entertainment 7 Airlines 4Telecommunication Services 14 Building Products 4Consumer Discretionary 35 Commercial Services & Supplies 3Auto Components 3 Construction & Engineering 6Automobiles 9 Electrical Components & Equipment 5Casinos & Gaming 2 Industrial Conglomerates 4Homebuilding 3 Machinery and Electrical Equipment 14Hotels, Resorts & Cruise Lines 5 Professional Services 11Household Durables 1 Trading Companies & Distributors 5Restaurants & Leisure Facilities 2 Transportation and Transportation Infrastructure 6Textiles, Apparel & Luxury Goods 10 Information Technology 16Consumer Staples 31 Communications Equipment 2Beverages 5 Computers & Peripherals and Office Electronics 1Food & Staples Retailing 6 Electronic Equipment, Instruments & Components 2Food Products 8 IT services 4Household Products 2 Semiconductors & Semiconductor Equipment 3Personal Products 3 Software 4Retailing 4 Materials 31Tobacco 3 Aluminum 1Energy 10 Chemicals 15Oil & Gas Refining & Marketing 1 Construction Materials 3Oil & Gas Upstream & Integrated 9 Containers & Packaging 2Financials 62 Metals & Mining 5Banks 27 Paper & Forest Products 4Diversified Financial Services and Capital Markets 16 Steel 1Insurance 19 Real Estate 11Health Care 23 Real Estate 11Biotechnology 3 Utilities 21Health Care Equipment & Supplies 4 Electric Utilities 9Health Care Providers & Services 2 Gas Utilities 3Life Sciences Tools & Services 3 Multi and Water Utilities 9Pharmaceuticals 11
Total number of stocks 331Notes: The sector names are indicated in bold font, while the industries that constitute these sectors are listed under with a regular font. Source: S&P Global and author.

J. Risk Financial Manag. 2022, 15, 153 39 of 41
Notes1 “Too big to fail” is a concept that became famous with the systemic risk research. If a firm is too big to fail, then its collapse would
cause a cascading catastrophic effect on the economy. To prevent this, the governments should consider intervening.2 For meta-analyses please see Friede et al. (2015), Clark et al. (2015), Revelli and Viviani (2015).3 40 points is not arbitrarily chosen. The distribution of the ESG ratings, given in Figure 3a, is bimodal with about 40 points
difference between the modes.4 We assumed a VAR model of order 1 for simplicity. VAR order could be chosen based on AIC criterion, although typically low
orders are preferred. Similarly, Anufriev and Panchenko (2015) and Chiang et al. (2007) use ARMA(1,1) and AR(1) models forsimplicity, respectively. Bauwens et al. (2006) note that it is typical that one uses a simple model for conditional mean beforeapplying a multivariate GARCH model.
5 Given the number of series in consideration including an unobservable factor a la Eratalay and Vladimirov (2020) would not befeasible due to the number of parameters to estimate.
6 S&P Dow Jones Indices.7 https://www.spglobal.com/spdji/en/indices/equity/sp-europe-350/#overview (accesed on 05.10.2020).8 On average 0.4% of the returns were identified as outliers.9 https://www.spglobal.com/esg/scores/ (accesed on 25.03.2021).
10 The ESG metrics that different institutions offer weigh these subcategories differently. It is important to obtain ESG ratings datafrom a reputable source. Berg et al. (2019) point towards the divergence of the ESG metrics provided by different institutions.
11 https://en.wikipedia.org/wiki/COVID-19_pandemic_in_Europe (accesed on 19.10.2021).12 Similar networks were analysed in detail in Cortés Ángel and Eratalay (2021), with the difference that an initial cut-off was
used in that study to define a sparse network. In our work, this is not necessary since we are not focusing on finding resilientrelationships over time.
13 Data source: https://sdw.ecb.europa.eu/reports.do?node=1000003285 (accesed on 12.10.2021).14 Wirecard AG’s declaration of insolvency did not cause a cascading effect. This is in support of our model that systemic risk
contribution and exposure of a firm should be thought of together with the network centrality of that firm.15 Given the log-linear relation, we can calculate the exact impact of ∆ increase in the regressor x on the dependent variable as
100 ∗ [exp(β∆x)− 1]. See Chapter 6.2 of Wooldridge (2015) for details.
ReferencesAcharya, Viral V., Lasse H. Pedersen, Thomas Philippon, and Matthew Richardson. 2017. Measuring systemic risk. The Review of
Financial Studies 30: 2–47.Aielli, Gian Piero. 2013. Dynamic conditional correlation: On properties and estimation. Journal of Business & Economic Statistics 31:
282–99.Anufriev, Mikhail, and Valentyn Panchenko. 2015. Connecting the dots: Econometric methods for uncovering networks with an
application to the australian financial institutions. Journal of Banking & Finance 61: S241–S55.Bae, JinCheol, Xiaotong Yang, and Myung-In Kim. 2021. Esg and stock price crash risk: role of financial constraints. Asia-Pacific Journal
of Financial Studies 50: 556–81.Balcilar, Mehmet, Riza Demirer, and Rangan Gupta. 2017. Do sustainable stocks offer diversification benefits for conventional
portfolios? an empirical analysis of risk spillovers and dynamic correlations. Sustainability 9: 1799.Barigozzi, Matteo, and Christian Brownlees. 2019. Nets: Network estimation for time series. Journal of Applied Econometrics 34: 347–64.Bauwens, Luc, Sébastien Laurent, and Jeroen V. K. Rombouts. 2006. Multivariate garch models: A survey. Journal of Applied
Econometrics 21: 79–109.Benoit, Sylvain, Jean-Edouard Colliard, Christophe Hurlin, and Christophe Pérignon. 2017. Where the risks lie: A survey on systemic
risk. Review of Finance 21: 109–52.Berg, Florian, Julian F. Koelbel, and Roberto Rigobon. 2019. Aggregate Confusion: The Divergence of ESG Ratings. Boston: MIT Sloan
School of Management.Billio, Monica, Mila Getmansky, Andrew W. Lo, and Loriana Pelizzon. 2012. Econometric measures of connectedness and systemic risk
in the finance and insurance sectors. Journal of Financial Economics 104: 535–59.Bisias, Dimitrios, Mark Flood, Andrew W. Lo, and Stavros Valavanis. 2012. A survey of systemic risk analytics. Annual Review of
Financial Economics 4: 255–96.Bollerslev, Tim, and Jeffrey M. Wooldridge. 1992. Quasi-maximum likelihood estimation and inference in dynamic models with
time-varying covariances. Econometric Reviews 11: 143–72.Boubaker, Sabri, Alexis Cellier, Riadh Manita, and Asif Saeed. 2020. Does corporate social responsibility reduce financial distress risk?
Economic Modelling 91: 835–51.Bougheas, Spiros, and Alan Kirman. 2015. Complex financial networks and systemic risk: A review. In Complexity and Geographical
Economics. Berlin: Springer, pp. 115–39.
J. Risk Financial Manag. 2022, 15, 153 40 of 41
Brownlees, Christian, and Robert F. Engle. 2017. Srisk: A conditional capital shortfall measure of systemic risk. The Review of FinancialStudies 30: 48–79.
Caccioli, Fabio, Paolo Barucca, and Teruyoshi Kobayashi. 2018. Network models of financial systemic risk: A review. Journal ofComputational Social Science 1: 81–114.
Capelle-Blancard, Gunther, and Stéphanie Monjon. 2012. Trends in the literature on socially responsible investment: Looking for thekeys under the lamppost. Business Ethics: A European Review 21: 239–50.
Carnero, M. Angeles, and M. Hakan Eratalay. 2014. Estimating var-mgarch models in multiple steps. Studies in Nonlinear Dynamics &Econometrics 18: 339–65.
Cerqueti, Roy, Rocco Ciciretti, Ambrogio Dalò, and Marco Nicolosi. 2021. Esg investing: A chance to reduce systemic risk. Journal ofFinancial Stability 54: 100887.
Chiang, Thomas C., Bang Nam Jeon, and Huimin Li. 2007. Dynamic correlation analysis of financial contagion: Evidence from asianmarkets. Journal of International Money and Finance 26: 1206–28.
Chiaramonte, Laura, Alberto Dreassi, Claudia Girardone, and Stefano Piserà. 2021. Do esg strategies enhance bank stability duringfinancial turmoil? Evidence from europe. In The European Journal of Finance. Abingdon: Taylor & Francis, pp. 1–39.
Clark, Gordon L., Andreas Feiner, and Michael Viehs. 2015. From the Stockholder to the Stakeholder: How Sustainability Can DriveFinancial Outperformance. Available online: https://papers.ssrn.com/sol3/papers.cfm?abstract_id=2508281 (accessed on 2January 2022).
Cortés Ángel, Ariana Paola, and Mustafa Hakan Eratalay. 2021. Deep Diving into the s&p Europe 350 Index Network and Its Reactionto COVID-19. Available online: https://papers.ssrn.com/sol3/papers.cfm?abstract_id=3964652 (accessed on 14 December 2021).
Cortez, Maria Ceu, Florinda Silva, and Nelson Areal. 2009. The performance of european socially responsible funds. Journal of BusinessEthics 87: 573–88.
Cortez, Maria Céu, Florinda Silva, and Nelson Areal. 2012. Socially responsible investing in the global market: The performance of usand european funds. International Journal of Finance & Economics 17: 254–71.
De Bandt, Olivier, and Philipp Hartmann. 2000. Systemic Risk: A Survey. Available online: https://papers.ssrn.com/sol3/papers.cfm?abstract_id=258430 (accessed on 5 January 2022).
Dorfleitner, Gregor, Gerhard Halbritter, and Mai Nguyen. 2015. Measuring the level and risk of corporate responsibility—An empiricalcomparison of different esg rating approaches. Journal of Asset Management 16: 450–66.
Drempetic, Samuel, Christian Klein, and Bernhard Zwergel. 2020. The influence of firm size on the esg score: Corporate sustainabilityratings under review. Journal of Business Ethics 167: 333–60.
Engle, Robert. 2002. Dynamic conditional correlation: A simple class of multivariate generalized autoregressive conditionalheteroskedasticity models. Journal of Business & Economic Statistics 20: 339–50.
Eratalay, M. Hakan. 2021. Financial econometrics and systemic risk. In Handbook of Research on Emerging Theories, Models, andApplications of Financial Econometrics. Berlin: Springer, pp. 65–91.
Eratalay, M. Hakan, and Evgenii V. Vladimirov. 2020. Mapping the stocks in micex: Who is central in the moscow stock exchange?Economics of Transition and Institutional Change 28: 581–620.
Escrig-Olmedo, Elena, María Ángeles Fernández-Izquierdo, Idoya Ferrero-Ferrero, Juana María Rivera-Lirio, and María Jesús Muñoz-Torres. 2019. Rating the raters: Evaluating how esg rating agencies integrate sustainability principles. Sustainability 11: 915.
Friede, Gunnar, Timo Busch, and Alexander Bassen. 2015. Esg and financial performance: aggregated evidence from more than 2000empirical studies. Journal of Sustainable Finance & Investment 5: 210–33.
Ghysels, Eric, Andrew C. Harvey, and Eric Renault. 1996. 5 stochastic volatility. Handbook of Statistics 14: 119–91.Giese, Guido, Linda-Eling Lee, Dimitris Melas, Zoltán Nagy, and Laura Nishikawa. 2019. Foundations of esg investing: How esg
affects equity valuation, risk, and performance. The Journal of Portfolio Management 45: 69–83.Gray, Dale F., Robert C. Merton, and Zvi Bodie. 2007. New Framework for Measuring and Managing Macrofinancial Risk and Financial
Stability. Technical Report. Cambridge: National Bureau of Economic Research.Green, Samuel B. 1991. How many subjects does it take to do a regression analysis. Multivariate Behavioral Research 26: 499–510.Gregory, Richard Paul. 2022. Esg scores and the response of the s&p 1500 to monetary and fiscal policy during the COVID-19 pandemic.
International Review of Economics & Finance 78: 446–56.Harrell, Frank E. 2001. Regression Modeling Strategies: With Applications to Linear Models, Logistic Regression, and Survival Analysis. Berlin:
Springer, vol. 608.Hollo, Daniel, Manfred Kremer, and Marco Lo Duca. 2012. Ciss—A Composite Indicator of Systemic Stress in the Financial System.
Frankfurt: European Central Bank.Hox, Joop J., Mirjam Moerbeek, and Rens Van de Schoot. 2017. Multilevel Analysis: Techniques and Applications. Hoboken: Routledge.Ionescu, George H., Daniela Firoiu, Ramona Pirvu, and Ruxandra Dana Vilag. 2019. The impact of esg factors on market value of
companies from travel and tourism industry. Technological and Economic Development of Economy 25: 820–49.Jackson, Matthew O. 2010. Social and Economic Networks. Princeton: Princeton University Press.Jain, Mansi, Gagan Deep Sharma, and Mrinalini Srivastava. 2019. Can sustainable investment yield better financial returns: A
comparative study of esg indices and msci indices. Risks 7: 15.Jin, Ick. 2018. Is esg a systematic risk factor for us equity mutual funds? Journal of Sustainable Finance & Investment 8: 72–93.
J. Risk Financial Manag. 2022, 15, 153 41 of 41
Klooster, Sophie van’t. 2018. The Impact of CSR on Default and Systemic Risk in the European Banking Sector. Ph. D. thesis, Faculty ofEconomics and Business, University of Groningen, Groningen, The Netherlands.
Kritzman, Mark, Yuanzhen Li, Sebastien Page, and Roberto Rigobon. 2011. Principal components as a measure of systemic risk. TheJournal of Portfolio Management 37: 112–26.
Lai, Chi-Shiun, Chih-Jen Chiu, Chin-Fang Yang, and Da-Chang Pai. 2010. The effects of corporate social responsibility on brandperformance: The mediating effect of industrial brand equity and corporate reputation. Journal of Business Ethics 95: 457–69.
Lee, Darren D., Robert W. Faff, and Saphira A. C. Rekker. 2013. Do high and low-ranked sustainability stocks perform differently?International Journal of Accounting & Information Management 21: 116–32.
Lehar, Alfred. 2005. Measuring systemic risk: A risk management approach. Journal of Banking & Finance 29: 2577–603.Leterme, Johan, and Anh Nguyen. 2020. Can Esg Factors Be Considered as a Systematic Risk Factor for Equity Mutual Funds in the
Eurozone? Available online: http://hdl.handle.net/2078.1/thesis:24176 (accessed on 10 January 2022).Liu, Jianxu, Quanrui Song, Yang Qi, Sanzidur Rahman, and Songsak Sriboonchitta. 2020. Measurement of systemic risk in global
financial markets and its application in forecasting trading decisions. Sustainability 12: 4000.Lööf, Hans, Maziar Sahamkhadam, and Andreas Stephan. 2021. Is corporate social responsibility investing a free lunch? the
relationship between esg, tail risk, and upside potential of stocks before and during the covid-19 crisis. Finance Research Letters2021: 102499.
Lopez-de Silanes, Florencio, Joseph A. McCahery, and Paul C. Pudschedl. 2020. Esg performance and disclosure: A cross-countryanalysis. Singapore Journal of Legal Studies 2020: 217–41.
Lundgren, Amanda Ivarsson, Adriana Milicevic, Gazi Salah Uddin, and Sang Hoon Kang. 2018. Connectedness network anddependence structure mechanism in green investments. Energy Economics 72: 145–53.
Maiti, Moinak. 2021. Is esg the succeeding risk factor? Journal of Sustainable Finance & Investment 11: 199–213.Michelon, Giovanna. 2011. Sustainability disclosure and reputation: A comparative study. Corporate Reputation Review 14: 79–96.Murè, Pina, Marco Spallone, Fabiomassimo Mango, Stefano Marzioni, and Lucilla Bittucci. 2021. Esg and reputation: The case of
sanctioned italian banks. Corporate Social Responsibility and Environmental Management 28: 265–77.Oikonomou, Ioannis, Chris Brooks, and Stephen Pavelin. 2012. The impact of corporate social performance on financial risk and utility:
A longitudinal analysis. Financial Management 41: 483–515.Pakel, Cavit, Neil Shephard, Kevin Sheppard, and Robert F. Engle. 2020. Fitting vast dimensional time-varying covariance models.
Journal of Business & Economic Statistics 39: 652–68.Pearson, Ronald K., Yrjö Neuvo, Jaakko Astola, and Moncef Gabbouj. 2015. The class of generalized hampel filters. Paper presented at
the 2015 23rd European Signal Processing Conference (EUSIPCO), Nice, France, August 31–September 4, pp. 2501–5.Reboredo, Juan C., Andrea Ugolini, and Fernando Antonio Lucena Aiube. 2020. Network connectedness of green bonds and asset
classes. Energy Economics 86: 104629.Revelli, Christophe, and Jean-Laurent Viviani. 2015. Financial performance of socially responsible investing (sri): What have we
learned? a meta-analysis. Business Ethics: A European Review 24: 158–85.Silva, Thiago Christiano, Michel Alexandre da Silva, and Benjamin Miranda Tabak. 2017. Systemic risk in financial systems: A feedback
approach. Journal of Economic Behavior & Organization 144: 97–120.Sonnenberger, David, and Gregor N. F. Weiss. 2021. The Impact of Corporate Social Responsibility on Firms’ Exposure to Tail Risk: The
Case of Insurers. Available online: https://papers.ssrn.com/sol3/papers.cfm?abstract_id=3764041 (accessed on 5 January 2022).Sun, Wenbin, and Kexiu Cui. 2014. Linking corporate social responsibility to firm default risk. European Management Journal 32:
275–87.Tarashev, Nikola A., Claudio E. V. Borio, and Kostas Tsatsaronis. 2010. Attributing Systemic Risk to Individual Institutions. Available
online: https://papers.ssrn.com/sol3/papers.cfm?abstract_id=1631761 (accessed on 4 January 2022).Tobias, Adrian, and Markus K. Brunnermeier. 2016. Covar. The American Economic Review 106: 1705.Waner, Zhao. 2021. Research on the relationship between social responsibility and systemic risk. AGE 7: 2321–32.Wooldridge, Jeffrey M. 2015. Introductory Econometrics: A Modern Approach. Boston: Cengage Learning.Zhao, Shangmei, Xinyi Chen, and Junhuan Zhang. 2019. The systemic risk of china’s stock market during the crashes in 2008 and 2015.
Physica A: Statistical Mechanics and its Applications 520: 161–77.