The Impact of Board Structures on Shareholders Returns
6
International Journal of Science and Research (IJSR) ISSN (Online): 2319-7064 Index Copernicus Value (2013): 6.14 | Impact Factor (2013): 4.438 Volume 4 Issue 3, March 2015 www.ijsr.net Licensed Under Creative Commons Attribution CC BY The Impact of Board Structures on Shareholders Returns Vincent Konadu Tawiah 1 , Muhaheranwa Benjamin 2 1 M.Com, University of Mysore, India Chartered Accountant, Ghana 2 Ph.D Scholar, Institute of Management, MMU Mullana-Ambala, Haryana, India Abstract: If joint stock companies and agency problem are twins then board of directors will be their after-birth. As opine by Jesen and Meckling (1976) since the separation of ownership from management through joint stock companies, agency problem has never been eliminated. Various approaches such as laws, trustee, auditing, have been used to arrest the agency problem and protect the benefit of shareholders. But board of directors has emerged as an efficient approach to protect shareholders benefit. This paper has revealed the impact of board size, number of promoter directors and independency of the board on the total benefits a shareholder gets for investing. An unbalance panel data was collected from annual reports of 25 companies through purposive sampling for the accounting years 2009 to 2013.The Hussmann’s test was used to check the appropriate regression method to statistically test the impact of board structures on total shareholder’s return. It was found that, the average board size in companies was 12 members out of which half were independent, 3 are promoters/founders and remaining are other executives. Shareholders also get more than 90% of their returns from changes in share prices. The random effect regression method reports that, all the board variables have a positive relationship with shareholders return with the exception of board size but only board independence is significant @ 5%. Promoter directors have an inverse relationship with capital gain whiles board size and independent directors have positive correlation. Keywords: board structures, independent directors, promoters, shareholders‟ return 1. Introduction Although board of directors plays a very significant role in the determination of dividend and the share price of a company, yet there is little research on their relationship with shareholders returns. Thus, board of directors proposed dividends and their announcements about the company hit share prices. Majority of the research are on the impact of board and general firm performance of the company. Only a hand full, if any has specifically single out the impact of board on investors‟ returns. While it can be said that shareholders returns is part of company performance, it is also true that not all the performance flows to the shareholder until directors decide. It is therefore increasing important to the relationship between board structures influence on shareholders‟ returns. Recent literature on this study was one by Rohana et al (2009) on The Effect of Board Structure on Shareholders‟ Wealth in Small Listed Companies in Malaysia. Although the study shares much light on the topic, it is limited in its content analysis and covers only board composition and remuneration and size. Again the study concentrated on small and medium enterprise which has limited data covering only 2002-2004.This current study attempts to fill these literature gaps by empirically analysing the impact of board size, board independence and promoter directorship on shareholders returns. The research will bring new findings and knowledge by achieving the following objectives; to find the trend of shareholders return over the period; To determine the relationship between shareholders total return and board size, board independence and promoter directorship; To know the contribution of board structures to capital gain. Board structures include all activities of the board such as composition, the size, the committees, remuneration, and appointments of director, ownership and duality of CEO. MCCG 2000) Malaysia Code of Corporate Governance. 2. Literature Review Board composition is the number of directors and its categorization into outsider and insider directors. While Promoters/promoter group, top management, shareholders and employee forms insiders, Outsiders on the other hand are those without direct monetary interest in the company. In an empirical test on agency theory and stewardship, Lex et.al (1991), found that unifying the position of CEO and board chairman into one hand improve the ROE returns to shareholders than the agency theory of separating them. This implies that giving management autonomy without board of directors can improve the stock returns as compared with imposing board of directors to restrict and control the management actions. In this research, shareholders return was measured by ROE (dividend plus capital gain). Board Size and Shareholders Return Various studies on board size have found a negative relationship between increase board size and firm performance (Bhagat and Black 1996, Yermack 1996). Jensen 1993 also argues that as the board size increase, there are problems of coordination and decision process which limit performance. Eisenberg et al 1998 on the other hand failed to agree with Jensen by saying that increase board size ensures better decision control because of their diverse background and profession. Some scholars are of the view that board size positively relates to firm performance. The rationale behind their argument is that, there is diverse knowledge and intellect with large size Paper ID: SUB151989 2310
Transcript of The Impact of Board Structures on Shareholders Returns

International Journal of Science and Research (IJSR) ISSN (Online): 2319-7064
Index Copernicus Value (2013): 6.14 | Impact Factor (2013): 4.438
Volume 4 Issue 3, March 2015
www.ijsr.net Licensed Under Creative Commons Attribution CC BY
The Impact of Board Structures on Shareholders
Returns
Vincent Konadu Tawiah1, Muhaheranwa Benjamin
2
1M.Com, University of Mysore, India
Chartered Accountant, Ghana
2Ph.D Scholar, Institute of Management, MMU
Mullana-Ambala, Haryana, India
Abstract: If joint stock companies and agency problem are twins then board of directors will be their after-birth. As opine by Jesen and
Meckling (1976) since the separation of ownership from management through joint stock companies, agency problem has never been
eliminated. Various approaches such as laws, trustee, auditing, have been used to arrest the agency problem and protect the benefit of
shareholders. But board of directors has emerged as an efficient approach to protect shareholders benefit. This paper has revealed the
impact of board size, number of promoter directors and independency of the board on the total benefits a shareholder gets for investing.
An unbalance panel data was collected from annual reports of 25 companies through purposive sampling for the accounting years 2009
to 2013.The Hussmann’s test was used to check the appropriate regression method to statistically test the impact of board structures on
total shareholder’s return. It was found that, the average board size in companies was 12 members out of which half were independent, 3
are promoters/founders and remaining are other executives. Shareholders also get more than 90% of their returns from changes in
share prices. The random effect regression method reports that, all the board variables have a positive relationship with shareholders
return with the exception of board size but only board independence is significant @ 5%. Promoter directors have an inverse relationship
with capital gain whiles board size and independent directors have positive correlation.
Keywords: board structures, independent directors, promoters, shareholders‟ return
1. Introduction
Although board of directors plays a very significant role in
the determination of dividend and the share price of a
company, yet there is little research on their relationship
with shareholders returns. Thus, board of directors
proposed dividends and their announcements about the
company hit share prices. Majority of the research are on
the impact of board and general firm performance of the
company. Only a hand full, if any has specifically single
out the impact of board on investors‟ returns. While it can
be said that shareholders returns is part of company
performance, it is also true that not all the performance
flows to the shareholder until directors decide. It is
therefore increasing important to the relationship between
board structures influence on shareholders‟ returns. Recent
literature on this study was one by Rohana et al (2009) on
The Effect of Board Structure on Shareholders‟ Wealth in
Small Listed Companies in Malaysia. Although the study
shares much light on the topic, it is limited in its content
analysis and covers only board composition and
remuneration and size. Again the study concentrated on
small and medium enterprise which has limited data
covering only 2002-2004.This current study attempts to fill
these literature gaps by empirically analysing the impact of
board size, board independence and promoter directorship
on shareholders returns. The research will bring new
findings and knowledge by achieving the following
objectives; to find the trend of shareholders return over the
period; To determine the relationship between
shareholders total return and board size, board
independence and promoter directorship; To know the
contribution of board structures to capital gain. Board
structures include all activities of the board such as
composition, the size, the committees, remuneration, and
appointments of director, ownership and duality of CEO.
MCCG 2000) Malaysia Code of Corporate Governance.
2. Literature Review
Board composition is the number of directors and its
categorization into outsider and insider directors. While
Promoters/promoter group, top management, shareholders
and employee forms insiders, Outsiders on the other hand
are those without direct monetary interest in the company.
In an empirical test on agency theory and stewardship, Lex
et.al (1991), found that unifying the position of CEO and
board chairman into one hand improve the ROE returns to
shareholders than the agency theory of separating them.
This implies that giving management autonomy without
board of directors can improve the stock returns as
compared with imposing board of directors to restrict and
control the management actions. In this research,
shareholders return was measured by ROE (dividend plus
capital gain).
Board Size and Shareholders Return
Various studies on board size have found a negative
relationship between increase board size and firm
performance (Bhagat and Black 1996, Yermack 1996).
Jensen 1993 also argues that as the board size increase,
there are problems of coordination and decision process
which limit performance. Eisenberg et al 1998 on the other
hand failed to agree with Jensen by saying that increase
board size ensures better decision control because of their
diverse background and profession. Some scholars are of
the view that board size positively relates to firm
performance. The rationale behind their argument is that,
there is diverse knowledge and intellect with large size
Paper ID: SUB151989 2310

International Journal of Science and Research (IJSR) ISSN (Online): 2319-7064
Index Copernicus Value (2013): 6.14 | Impact Factor (2013): 4.438
Volume 4 Issue 3, March 2015
www.ijsr.net Licensed Under Creative Commons Attribution CC BY
which increase the strategic decision capability of board
(Dhawan (2006), Dwinedi and Jain (2005)). Researchers
who argues of a negative relationship are of the opinion
that by group dynamics and psychology theory, large
board size are less effective due to long decision making
process and coordination. Raleja 2005 and Ghosh 2006
confirms these theories by saying, as board size increase
its associated cost such as remuneration, communication
and coordination also increase.
Notwithstanding the two opposing thoughts, Vetaas (1999)
finds a middle way theory that an optimum board size
which has positive relationship and negative relationship
with performance. This is the “U” theory of board size and
performance relationship. The basic assumption of theory
is minimum number is necessary but if it crosses the
sufficient number, performance is adversely affected.
What is the optimum size is the question which is yet to be
answered by academician and professionals.
The inconsistency of findings between board size and frim
performances means there is possibility of inconclusive
relationship between shareholders return and board size,
since returns depend on performance. The higher the board
size, the better decision results and control. Contrary the
higher the board size, the longer decision process and
inefficiency in performance.
On this background, it can be assume that, board size does
not have significant impact on shareholders return. The
descriptive statistics on total shareholders return shows
that there is wide variation in the capital gains over the
period than dividends. Meaning that, the changes in total
returns over the period can be attributed to capital gain
which amounts to 95%. Therefore it is necessary to test
separate the impact of board structures on capital gain.
Promoters will ensure performance which will attract new
investors, thereby appreciating capital.
H0: there is no significant relationship between board size
and shareholders return and capital gain
Board Independence and Shareholders Return
Clause 49 of the Listing agreement of Securities Exchange
Board of India (SEBI) defines an independent director
as„independent director‟ shall mean a non-executive
director of the company who apart from receiving
director‟s remuneration, does not have any material
pecuniary relationships or transactions with the company,
its promoters, its directors, its senior management or its
holding company, its subsidiaries and associates which
may affect independence of the director”
Legalistic, class, hegemony, resource dependence and
agency theory are the four perspectives about independent
directorship. In all these perspectives independent
directors are inevitable for board effectiveness (Zahra and
Pearce 1989).Till today there has not been any concluding
evidence on the optimum size of independent directors and
their contribution to firm performance.
Perce and Zahra 2002 claims a positive relationship
between firm performance and presence of outside
directors using some fortune 500, companies but Banahar
et al (2005) finds a negative correlation between board
independence and firm performance. Hermalin and
Weishach (2006) also argues that though there is no
relationship between board composition and firm
performance, the presence of independence directors help
CEO to maximise value by bringing in expertise and
unbiased eyes on the board. Independent directors bring
brand credibility and better governance (Prasana 2006).
Although, there is a mix finding on board independence
and performance, recent corporate governance rules and
codes such as Indian Companies Act 2013, Clause 49 and
international standards such as OECD combine Code,
Caburry Report SarbanOxly Act recommends the inclusion
of more independent directors. This indicates the
significance of independent directors on performance.
Independent directors brings transparency and investors
protection which attractive to new investors. New
investors have to paid high share price resulting to capital
gains.
It is therefore expected that independent directors will
have positive significant impact on returns.
H0: There is significant impact of number of independent
directors on shareholders return and capital gain
Promoters on Board and Shareholders Return
In a related research by Rohana et al (1991) on the effect
of board structures on shareholders wealth in Malaysia,
concluded that board size and board composition have
significant influence on shareholders wealth. The research
used content analysis to study three board structures (board
size, composition and remuneration impact on
shareholders wealth. The research also found that big
board size and high proportion of executive directors
ensure good decision making. Shareholders wealth is
measured as ROI and EPS. The results show marginal
significant correlation (0.060) between executive directors
and shareholders wealth. The effect of board size and
shareholders wealth results demonstrate that higher
directors would enhance company‟s performance and ROI.
Every founder or promoter wants the growth and high
performance of its company. But each promoter has
different strategies of influencing performance and growth.
While some promoters would like to plough back profit
and pay lesser dividend, others will pay more dividends to
attract new investment (which is rear case). In both cases
the total returns to a shareholder can be increase in the
short run or long run. Ploughing back profit promise good
returns, which can shoot price for capital gains in the short
run and higher returns in the long run. Paying dividend in
the short-run also sends money directly into shareholders
pocket Again literature has proven that high promoter
directors improve the performance of the company because
of their duality as owners and directors. In owners
managed firms, there is a very high motivation for
managements to work capital gain that is for a long term
share price increase (Business Standard, 29th July).
Paper ID: SUB151989 2311

International Journal of Science and Research (IJSR) ISSN (Online): 2319-7064
Index Copernicus Value (2013): 6.14 | Impact Factor (2013): 4.438
Volume 4 Issue 3, March 2015
www.ijsr.net Licensed Under Creative Commons Attribution CC BY
In this line a hypothesis is developed as:
H0: there is significant impact of promoter directors on
shareholders returns and Capital gain.
3. Data Collection and Method of Analysis
Twenty-five (25) companies were selected from the Nifty
(50) companies for 2009 to 2013 accounting years based
on availability of data and sectorial representation. The
active sectors of India have been represented in the data
with corresponding companies. These samples were used
to generate an unbalanced panel data of 125 observations.
The data is analysed and interpreted by using descriptive
statistics, fixed random effect model and Karl Pearson Co
– efficient of correlation matrix run by E-views statistical
software.
Regression Equations
SRit = α + β1Z + β2P + β3I+
Uit…………………….….Equation 1
CGit = α + β1Z + β2P + β3I+
Uit………..………….…..Equation 2
BIit = α + β1Dv + β2Cg+
Uit……………………………..Equation 3
Where SR – Shareholders Return (dividend + capital gain)
z – Board size
i – Number of Independent Directors
p – Number of promoters on the board
Cg – Capital gain
Bi – Number of Independent Directors as a dependent
variable
Dv – Dividend
4. Results and Discussions
Univariate Analysis
Figure 1 depicts that the average board size of the
companies have been 12 over the period. Out of this, six
(6) members are independent and 3 members of every
board are promoters or founders, with remaining been
executive or professionals. Clause 49 of the listing
agreement recommends that, if the chairperson of the
board is executive or promoter or founder, then there must
be 50% or more board independence. A company should
have 1/3 (33%) independent directors if the board
chairman is an independent director. It can therefore be
inferred from the analysis that, most of the companies have
promoter or founder or executive chairmanship so they
maintain 50% board independence. The promoter board
members that represent 25% of the board size indicate how
active promoters are in control and management of their
companies. Thus, promoters dominate in the company‟s
decision which may be an opportunity or threat to outside
shareholders.
Is an opportunity because, it will be difficult for hostile
takeovers and mergers. At the same time most promoters
are the founders who have the company at heart. This will
ensure better decisions and performance. On the dark side,
these promoter directors may have selfish interest of
building empire for themselves by taking risky as well as
hasty investment. Most of them may not have much
experience to take efficient business decisions.
Figure 1: Board Size, Number of Independent Directors and Promoter Director
Extracted from Annual Reports
Total Returns
It can be seen from figure 2 that on average, shareholders
had a negative return in 2009 by investing in the
companies through fall in share prices. Total returns were
Rs. -105.302 due to high capital loss of Rs. 116.36. The
global economic crisis could have affected the share prices
in 2009. The dividend of mitigated the capital loss
marginally. The share prices picked up in 2010 and 2011
because most investors both foreign and domestic saw that
India was not much affected with the global crisis and was
safe to invest. Companies also attracted investors by
paying high dividends in 2010. Since the share price is
Paper ID: SUB151989 2312

International Journal of Science and Research (IJSR) ISSN (Online): 2319-7064
Index Copernicus Value (2013): 6.14 | Impact Factor (2013): 4.438
Volume 4 Issue 3, March 2015
www.ijsr.net Licensed Under Creative Commons Attribution CC BY
determined by demand and supply which cannot be
predicted easily, the capital gain does not follow any fixed
pattern resulting to fluctuation in the total stock returns.
The dividend on the other hand is demonstrating an
increasing pattern over the period from Rs. 10.834 in 2009
to Rs. 17.078 in 2013 the data also indicates that sample
companies pay less than Rs. 20 dividend per share to
shareholders over the period. Dividend also account for
less than 10% of the total stock returns for the period.
The data shows wide variation within the total shareholder
wealth over the period hence an investor cannot easily
predict his/her earnings on the market.
Figure 2: Trend in Shareholders' Return
Diagram Based On Data from Annual Reports
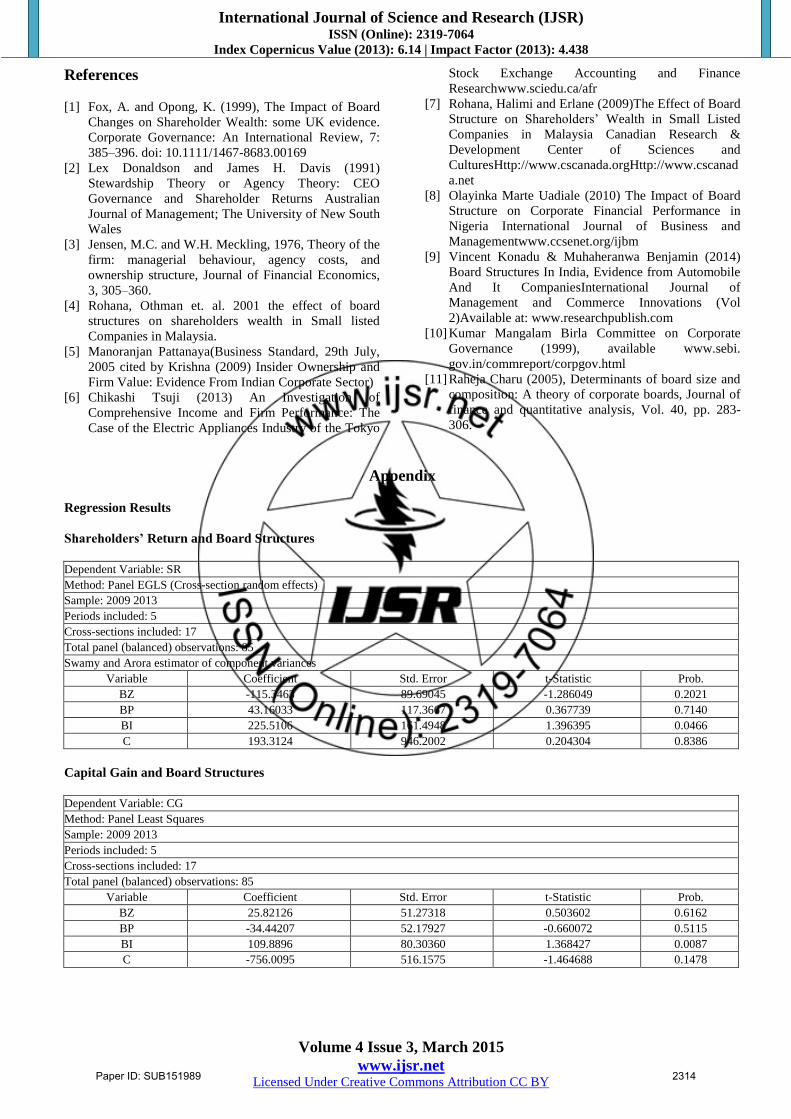
5. Regression Results
Shareholders Returns and Board Structures
The Hussmann‟s test indicated that random effect method
was the best method for this model. With the exception of
board size all the other variables have a positive
relationship with shareholders return but only board
independence is significant @ 5%. Therefore the null
hypothesis is accepted. As board size increases, the returns
to the shareholder may decrease but the board size does
not have significant impact. As stated in early literature
and reports, independent directors improve performances
and returns. This result also confirms this relationship.
Promoter directors have positive relationship but not
significant meaning; promoters may influence
shareholders return but not a strong factor of which
shareholders should be worried about.
Capital Gain and Board Structures
Equation 2 results show a positive coefficient for board
independence @ 10% significant level while board size
has insignificant positive impact on capital gain. Contrary
to equation 1, promoters have inverse relationship with
capital gain and insignificant in this equation. Thus, the
price movement on shares is regardless of the board size of
the company and the number of promoter directors
although they correlate. Number of independent directors
on the board can cause share price movement and capital
appreciation. The positive relationship means that,
increasing independent directors will attract high price and
increase in capital gain. This result leads to the acceptance
of H0 on promoters and capital gain.
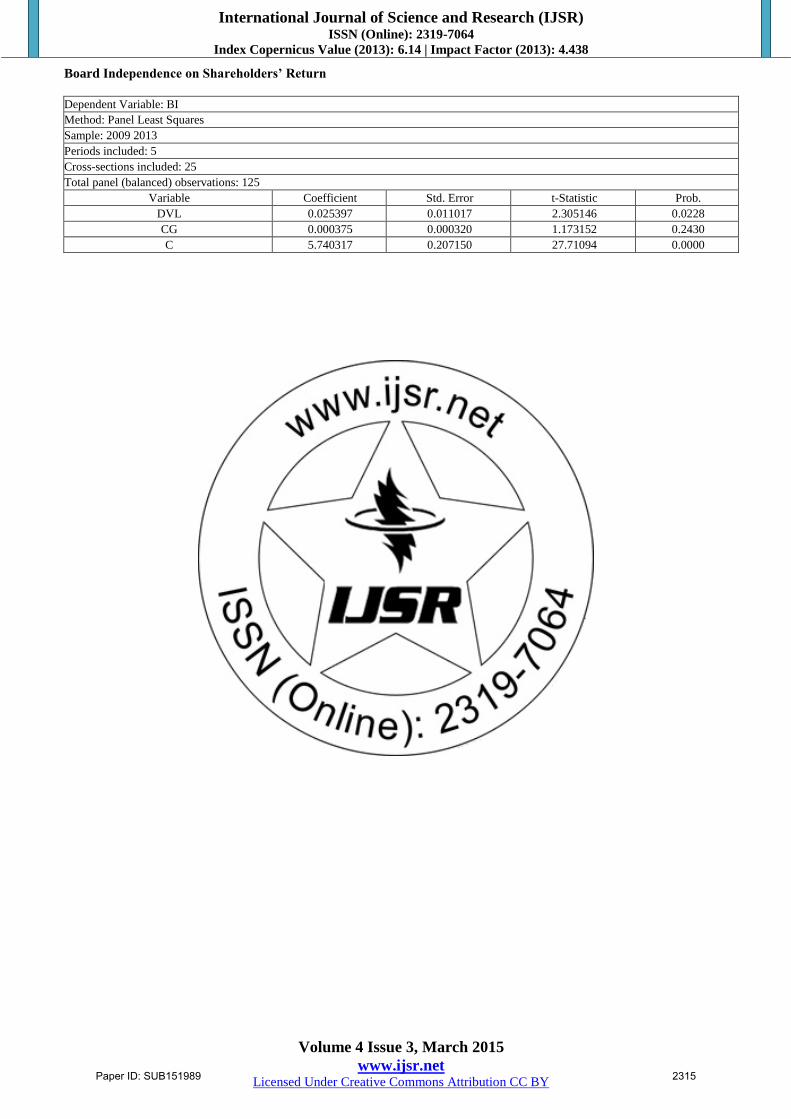
Board Independence and Shareholders Return
Variable
The third regression equation attempts to answer whether
changes in capital gain and dividend can increase or
decrease the number of independent directors on the board.
The result shows that increasing dividend will have
significant positive impact on board independence in terms
of numbers. Capital gain also have marginal positive
relation but insignificant.
6. Conclusion
The study has revealed that, board structures in sample
companies averagely had 12 members from 2009 t0 2013.
The companies also maintained 50% board independence
and 33% promoter director with executive or promoter or
founder as chairperson. This is in fulfilment of Clause 49
the listing agreement by SEBI. The trend analyses also
indicate that the board size and its composition did not
changed significantly over the 5 years study. Most of the
promoter directors are founders who have the company at
heart which ensures performance.
India has a special case as most of the promoter directors
are related through family ties making it very easy for
promoters to control the board. Another interesting feature
is the conglomerate board structures of India. Since most
companies are owned by same family promoters such as
the Tata, Mahindra, Birla, a single person may be the
chairperson for all the companies within the group.
Further, same board composition and directors are
maintained across the companies, making it easy for abuse
of power at the detriment of the outside investor.
The share prices picked up in 2010 and 2011 because most
investors both foreign and domestic saw that India was not
much affected with the global crisis and was safe to invest.
Since the share price is determined by demand and supply
which cannot be predicted easily, the capital gain does not
follow any fixed pattern resulting to fluctuation in the total
stock returns. But the dividend experienced an increasing
pattern over the periods.
The random effect regression method reports that, all the
board variables have a positive relationship with
shareholders return with the exception of board size but
only board independence is significant @ 5%. Promoter
directors have an inverse relationship with capital gain
whiles board size and independent directors have positive
correlation.
Paper ID: SUB151989 2313
International Journal of Science and Research (IJSR) ISSN (Online): 2319-7064
Index Copernicus Value (2013): 6.14 | Impact Factor (2013): 4.438
Volume 4 Issue 3, March 2015
www.ijsr.net Licensed Under Creative Commons Attribution CC BY
References
[1] Fox, A. and Opong, K. (1999), The Impact of Board
Changes on Shareholder Wealth: some UK evidence.
Corporate Governance: An International Review, 7:
385–396. doi: 10.1111/1467-8683.00169
[2] Lex Donaldson and James H. Davis (1991)
Stewardship Theory or Agency Theory: CEO
Governance and Shareholder Returns Australian
Journal of Management; The University of New South
Wales
[3] Jensen, M.C. and W.H. Meckling, 1976, Theory of the
firm: managerial behaviour, agency costs, and
ownership structure, Journal of Financial Economics,
3, 305–360.
[4] Rohana, Othman et. al. 2001 the effect of board
structures on shareholders wealth in Small listed
Companies in Malaysia.
[5] Manoranjan Pattanaya(Business Standard, 29th July,
2005 cited by Krishna (2009) Insider Ownership and
Firm Value: Evidence From Indian Corporate Sector)
[6] Chikashi Tsuji (2013) An Investigation of
Comprehensive Income and Firm Performance: The
Case of the Electric Appliances Industry of the Tokyo
Stock Exchange Accounting and Finance
Researchwww.sciedu.ca/afr
[7] Rohana, Halimi and Erlane (2009)The Effect of Board
Structure on Shareholders‟ Wealth in Small Listed
Companies in Malaysia Canadian Research &
Development Center of Sciences and
CulturesHttp://www.cscanada.orgHttp://www.cscanad
a.net
[8] Olayinka Marte Uadiale (2010) The Impact of Board
Structure on Corporate Financial Performance in
Nigeria International Journal of Business and
Managementwww.ccsenet.org/ijbm
[9] Vincent Konadu & Muhaheranwa Benjamin (2014)
Board Structures In India, Evidence from Automobile
And It CompaniesInternational Journal of
Management and Commerce Innovations (Vol
2)Available at: www.researchpublish.com
[10] Kumar Mangalam Birla Committee on Corporate
Governance (1999), available www.sebi.
gov.in/commreport/corpgov.html
[11] Raheja Charu (2005), Determinants of board size and
composition: A theory of corporate boards, Journal of
finance and quantitative analysis, Vol. 40, pp. 283-
306.
Appendix
Regression Results
Shareholders’ Return and Board Structures
Dependent Variable: SR
Method: Panel EGLS (Cross-section random effects)
Sample: 2009 2013
Periods included: 5
Cross-sections included: 17
Total panel (balanced) observations: 85
Swamy and Arora estimator of component variances
Variable Coefficient Std. Error t-Statistic Prob.
BZ -115.3463 89.69045 -1.286049 0.2021
BP 43.16033 117.3667 0.367739 0.7140
BI 225.5106 161.4948 1.396395 0.0466
C 193.3124 946.2002 0.204304 0.8386
Capital Gain and Board Structures
Dependent Variable: CG
Method: Panel Least Squares
Sample: 2009 2013
Periods included: 5
Cross-sections included: 17
Total panel (balanced) observations: 85
Variable Coefficient Std. Error t-Statistic Prob.
BZ 25.82126 51.27318 0.503602 0.6162
BP -34.44207 52.17927 -0.660072 0.5115
BI 109.8896 80.30360 1.368427 0.0087
C -756.0095 516.1575 -1.464688 0.1478
Paper ID: SUB151989 2314
International Journal of Science and Research (IJSR) ISSN (Online): 2319-7064
Index Copernicus Value (2013): 6.14 | Impact Factor (2013): 4.438
Volume 4 Issue 3, March 2015
www.ijsr.net Licensed Under Creative Commons Attribution CC BY
Board Independence on Shareholders’ Return
Dependent Variable: BI
Method: Panel Least Squares
Sample: 2009 2013
Periods included: 5
Cross-sections included: 25
Total panel (balanced) observations: 125
Variable Coefficient Std. Error t-Statistic Prob.
DVL 0.025397 0.011017 2.305146 0.0228
CG 0.000375 0.000320 1.173152 0.2430
C 5.740317 0.207150 27.71094 0.0000
Paper ID: SUB151989 2315