The HCL-32: Towards a self-assessment tool for hypomanic symptoms in outpatients
17
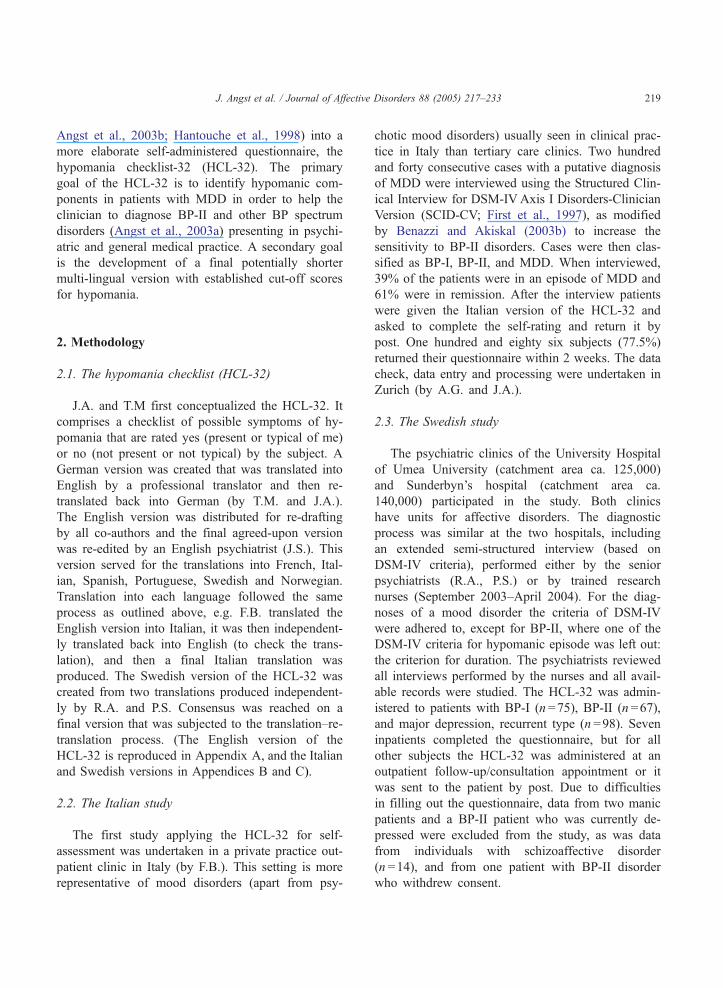
Preliminary communication The HCL-32: Towards a self-assessment tool for hypomanic symptoms in outpatients Jules Angst a, * , Rolf Adolfsson b , Franco Benazzi c , Alex Gamma a , Elie Hantouche d , Thomas D. Meyer e , Peter Skeppar f , Eduard Vieta g , Jan Scott h a Zurich University Psychiatric Hospital, Lenggstrasse 31, P.O. Box 1931, 8032 Zurich, Switzerland b Department of Clinical Sciences, Division of Psychiatry, Umea ˚ Umiversiy, Umea ˚, Sweden c E. Hecker Outpatient Psychiatry Center, Ravenna, and Department of Psychiatry, National Health Service, Forli, Italy d Pitie ´-Salpe ˆtrie `re Hospital, Paris, France e University of Tuebingen, Department of Psychology, Christophstrasse 2, 72072 Tuebingen, Germany f The Psychiatric Clinic, Sunderby Hospital, S-971 80 Lulea ˚, Sweden g Institute of Neuroscience, Hospital Clinic, University of Barcelona, IDIBAPS, Barcelona, Spain h Institute of Psychiatry, PO Box 96, Denmark Hill, London, SE5 8AF, United Kingdom Received 15 November 2004; accepted 20 May 2005 Abstract Background: Bipolar disorders (BP) are frequently diagnosed and treated as pure depression initially; accurate diagnosis often being delayed by 8 to 10 years. In prospective studies, the presence of hypomanic symptoms in adolescence is strongly predictive of later bipolar disorders. As such, an instrument for self-assessment of hypomanic symptoms might increase the detection of suspected and of manifest, but under-treated, cases of bipolar disorders. Methods: The multi-lingual hypomania checklist (HCL-32) has been developed and is being tested internationally. This preliminary paper reports the performance of the scale in distinguishing individuals with BP (N = 266) from those with major depressive disorder (MDD; N = 160). The samples were adult psychiatry patients recruited in Italy (N = 186) and Sweden (N = 240). Results: The samples reported similar clinical profiles and the structure for the HCL-32 demonstrated two main factors identified as bactive/elatedQ hypomania and brisk-taking/irritableQ hypomania. The HCL-32 distinguished between BP and MDD with a sensitivity of 80% and a specificity of 51%. Limitations: Although the HCL-32 is a sensitive instrument for hypomanic symptoms, it does not distinguish between BP-I and BP-II disorders. 0165-0327/$ - see front matter D 2005 Elsevier B.V. All rights reserved. doi:10.1016/j.jad.2005.05.011 * Corresponding author. Tel.: +41 1 384 2611; fax: +41 1 384 2446. E-mail address: [email protected] (J. Angst). Journal of Affective Disorders 88 (2005) 217 – 233 www.elsevier.com/locate/jad
-
Upload
independent -
Category
Documents
-
view
1 -
download
0
Transcript of The HCL-32: Towards a self-assessment tool for hypomanic symptoms in outpatients
www.elsevier.com/locate/jad
Journal of Affective Disord
Preliminary communication
The HCL-32: Towards a self-assessment tool for hypomanic
symptoms in outpatients
Jules Angst a,*, Rolf Adolfsson b, Franco Benazzi c, Alex Gamma a, Elie Hantouche d,
Thomas D. Meyer e, Peter Skeppar f, Eduard Vieta g, Jan Scott h
aZurich University Psychiatric Hospital, Lenggstrasse 31, P.O. Box 1931, 8032 Zurich, SwitzerlandbDepartment of Clinical Sciences, Division of Psychiatry, Umea Umiversiy, Umea, Sweden
cE. Hecker Outpatient Psychiatry Center, Ravenna, and Department of Psychiatry, National Health Service, Forli, ItalydPitie-Salpetriere Hospital, Paris, France
eUniversity of Tuebingen, Department of Psychology, Christophstrasse 2, 72072 Tuebingen, GermanyfThe Psychiatric Clinic, Sunderby Hospital, S-971 80 Lulea, Sweden
gInstitute of Neuroscience, Hospital Clinic, University of Barcelona, IDIBAPS, Barcelona, SpainhInstitute of Psychiatry, PO Box 96, Denmark Hill, London, SE5 8AF, United Kingdom
Received 15 November 2004; accepted 20 May 2005
Abstract
Background: Bipolar disorders (BP) are frequently diagnosed and treated as pure depression initially; accurate diagnosis
often being delayed by 8 to 10 years. In prospective studies, the presence of hypomanic symptoms in adolescence is
strongly predictive of later bipolar disorders. As such, an instrument for self-assessment of hypomanic symptoms might
increase the detection of suspected and of manifest, but under-treated, cases of bipolar disorders.
Methods: The multi-lingual hypomania checklist (HCL-32) has been developed and is being tested internationally. This
preliminary paper reports the performance of the scale in distinguishing individuals with BP (N =266) from those with
major depressive disorder (MDD; N =160). The samples were adult psychiatry patients recruited in Italy (N =186) and
Sweden (N =240).
Results: The samples reported similar clinical profiles and the structure for the HCL-32 demonstrated two main factors
identified as bactive/elatedQ hypomania and brisk-taking/irritableQ hypomania. The HCL-32 distinguished between BP and
MDD with a sensitivity of 80% and a specificity of 51%.
Limitations: Although the HCL-32 is a sensitive instrument for hypomanic symptoms, it does not distinguish between BP-I and
BP-II disorders.
0165-0327/$ - s
doi:10.1016/j.jad
* Correspondi
E-mail addre
ers 88 (2005) 217–233
ee front matter D 2005 Elsevier B.V. All rights reserved.
.2005.05.011
ng author. Tel.: +41 1 384 2611; fax: +41 1 384 2446.
ss: [email protected] (J. Angst).
J. Angst et al. / Journal of Affective Disorders 88 (2005) 217–233218
Conclusions: Future studies should test if different combinations of items, possibly recording the consequences of hypomania,
can distinguish between these BP subtypes.
D 2005 Elsevier B.V. All rights reserved.
Keywords: Hypomania; Major depressive episode; Bipolar disorder; Hypomania checklist; Screening questionnaire
1. Introduction
The APA guidelines on the management of bipolar
disorders (BP) state that bipolar-II disorder (BP-II) is
frequently misdiagnosed as unipolar major depressive
disorder (MDD) and as a result may receive inade-
quate or inappropriate treatment (American Psychiat-
ric Association, 2002).
This notion is compatible with recent work in the
field suggesting several reasons for the under-diagnosis
and under-treatment of BP (Akiskal et al., 2000; Angst,
1998; Angst et al., 2003b; Benazzi, 2004; Ghaemi et
al., 2002; Hirschfeld et al., 2003c; Judd and Akiskal,
2003; Lish et al., 1994; Szadoczky et al., 1998). First,
individuals who experience depression do not always
perceive hypomania as pathological, and as such do not
spontaneously report it to clinicians (Scott, 2002).
Also, the latter do not always make relevant direct
inquiries of patients presenting with MDD (Angst
and Gamma, 2002). The consequences are that the
correct diagnosis and treatment may be delayed by 8–
10 years (Hirschfeld et al., 2003c; Lish et al., 1994).
Furthermore, the recognition of hypomania may re-
quire more subtle inquiry than detailed in the currently
available structured diagnostic interviews (SCID,
CIDI) and the diagnostic criteria in DSM-IV and
ICD-10 may be less reliable and valid than previously
believed. An expert group recently concluded that the
current diagnostic criteria have high specificity but
might have too low a sensitivity and that a greater
focus on certain symptoms (such as activation levels)
or less emphasis on symptom duration may improve
recognition of those at risk of BP episodes (Angst et al.,
2003a; Hantouche et al., 1998). Although not all
researchers agree with these proposals, there is emerg-
ing evidence for a dimensional view of hypomania and
mania (e.g. Angst et al., 2003a). As found previously in
studies of depressive disorders (e.g. Flett et al., 1997;
Haslam and Beck, 1994; Ruscio and Ruscio, 2000),
Meyer and Keller’s (2003) study failed to find evidence
for latent classes for hypomania but did find evidence
for a dimensional structure supporting the idea of an
affective spectrum from dnormalT highs through to
hypomania and mania (Angst, 1999; Korszun et al.,
2004).
The above suggests that a self-assessment screening
instrument for hypomania would be clinically useful
and timesaving as well as aiding epidemiological re-
search. Early attempts to screen for BP focused on the
identification of individuals at risk of developing mood
disorders in non-clinical populations. The measures
targeted personality traits, did not explore the episodic
nature of hypomania and failed to incorporate measures
of the potential negative consequences of any changes
in behavior, affect and cognition (e.g. Alloy et al.,
1999; Depue et al., 1981; Meyer and Hautzinger,
2003). Other self-report measures have not been pro-
moted as screening instruments but assess symptoms,
such as the Self-Report Inventory forMania (SRMI) by
Shugar et al. (1992), the hypomania subscale of the
symptom checklist 90-Revised (SCL-90R; Hunter et
al., 2000) and the Brief Bipolar Disorder Scale (Den-
nehy et al., 2004), or rate the severity of symptoms in
individuals with a diagnosis of BP, e.g. the Altman
Self-Rating Scale (ASRM) and the Internal State
Scale (Bauer et al., 1991; Geiselmann and Bauer,
2000). A specific screening instrument for BP is the
Mood Disorder Questionnaire (MDQ) of Hirschfeld et
al. (2000, 2003b); on the basis of its content it seems to
be sensitive to identify BP-I disorder but probably less
so for BP-II disorder (Benazzi, 2003b; Mago, 2001;
Zimmermann et al., 2004). TheMDQwas tested first in
a tertiary care clinical sample and showed a sensitivity
of 73% and a specificity of 90% (two thirds of the
sample had BP-I); in a population sample (Hirschfeld
et al., 2003a) the sensitivity was 28% and the specific-
ity was 97% for BP.
These results and the demands for a screening
instrument for the spectrum of bipolar manifestations
(Benazzi and Akiskal, 2003b) encouraged us to
transform the previously described hypomania
checklist-20 (Allilaire et al., 2001; Angst, 1992;
J. Angst et al. / Journal of Affective Disorders 88 (2005) 217–233 219
Angst et al., 2003b; Hantouche et al., 1998) into a
more elaborate self-administered questionnaire, the
hypomania checklist-32 (HCL-32). The primary
goal of the HCL-32 is to identify hypomanic com-
ponents in patients with MDD in order to help the
clinician to diagnose BP-II and other BP spectrum
disorders (Angst et al., 2003a) presenting in psychi-
atric and general medical practice. A secondary goal
is the development of a final potentially shorter
multi-lingual version with established cut-off scores
for hypomania.
2. Methodology
2.1. The hypomania checklist (HCL-32)
J.A. and T.M first conceptualized the HCL-32. It
comprises a checklist of possible symptoms of hy-
pomania that are rated yes (present or typical of me)
or no (not present or not typical) by the subject. A
German version was created that was translated into
English by a professional translator and then re-
translated back into German (by T.M. and J.A.).
The English version was distributed for re-drafting
by all co-authors and the final agreed-upon version
was re-edited by an English psychiatrist (J.S.). This
version served for the translations into French, Ital-
ian, Spanish, Portuguese, Swedish and Norwegian.
Translation into each language followed the same
process as outlined above, e.g. F.B. translated the
English version into Italian, it was then independent-
ly translated back into English (to check the trans-
lation), and then a final Italian translation was
produced. The Swedish version of the HCL-32 was
created from two translations produced independent-
ly by R.A. and P.S. Consensus was reached on a
final version that was subjected to the translation–re-
translation process. (The English version of the
HCL-32 is reproduced in Appendix A, and the Italian
and Swedish versions in Appendices B and C).
2.2. The Italian study
The first study applying the HCL-32 for self-
assessment was undertaken in a private practice out-
patient clinic in Italy (by F.B.). This setting is more
representative of mood disorders (apart from psy-
chotic mood disorders) usually seen in clinical prac-
tice in Italy than tertiary care clinics. Two hundred
and forty consecutive cases with a putative diagnosis
of MDD were interviewed using the Structured Clin-
ical Interview for DSM-IVAxis I Disorders-Clinician
Version (SCID-CV; First et al., 1997), as modified
by Benazzi and Akiskal (2003b) to increase the
sensitivity to BP-II disorders. Cases were then clas-
sified as BP-I, BP-II, and MDD. When interviewed,
39% of the patients were in an episode of MDD and
61% were in remission. After the interview patients
were given the Italian version of the HCL-32 and
asked to complete the self-rating and return it by
post. One hundred and eighty six subjects (77.5%)
returned their questionnaire within 2 weeks. The data
check, data entry and processing were undertaken in
Zurich (by A.G. and J.A.).
2.3. The Swedish study
The psychiatric clinics of the University Hospital
of Umea University (catchment area ca. 125,000)
and Sunderbyn’s hospital (catchment area ca.
140,000) participated in the study. Both clinics
have units for affective disorders. The diagnostic
process was similar at the two hospitals, including
an extended semi-structured interview (based on
DSM-IV criteria), performed either by the senior
psychiatrists (R.A., P.S.) or by trained research
nurses (September 2003–April 2004). For the diag-
noses of a mood disorder the criteria of DSM-IV
were adhered to, except for BP-II, where one of the
DSM-IV criteria for hypomanic episode was left out:
the criterion for duration. The psychiatrists reviewed
all interviews performed by the nurses and all avail-
able records were studied. The HCL-32 was admin-
istered to patients with BP-I (n =75), BP-II (n =67),
and major depression, recurrent type (n =98). Seven
inpatients completed the questionnaire, but for all
other subjects the HCL-32 was administered at an
outpatient follow-up/consultation appointment or it
was sent to the patient by post. Due to difficulties
in filling out the questionnaire, data from two manic
patients and a BP-II patient who was currently de-
pressed were excluded from the study, as was data
from individuals with schizoaffective disorder
(n =14), and from one patient with BP-II disorder
who withdrew consent.

J. Angst et al. / Journal of Affective Disorders 88 (2005) 217–233220
2.4. Statistics
The analyses in this paper are restricted to the
checklist of hypomanic items and, with the exception
of a question about current mood state, do not include
analysis of any other questions regarding the HCL-32
(see appendices). All analyses were done in STATA
8.2 for Windows. A bprincipal factorsQ factor analysisand subsequent varimax rotation (Harman, 1976) were
applied to the Italian and Swedish samples separately
and then to both samples combined. Factors with
Eigenvalues greater than 1 were initially retained,
but clinical considerations also decided the final num-
ber of factors. A total score was obtained by summing
all items of the HCL-32. Subscale scores for each
factor were obtained by summing all items that loaded
higher than 0.4 on the corresponding factor. The
reliability of HCL-32 total and subscale scores was
assessed using Cronbach’s alpha. Kruskal–Wallis tests
were applied to continuous data. Gender and profiles
of single (dichotomous) items were compared using
v2 tests. Relative risk (risk or odds ratio) is given as aneffect size measure for age and gender differences.
Since these results are merely descriptive, no correc-
tion for multiple testing was applied. Spearman corre-
lations were used to correlate current mood state
(relative to usual mood state) and HCL-32 total and
subscale scores. A Receiver-Operating-Characteristic
(ROC) analysis yielded the sensitivity and specificity
of the scales to discriminate between MDD and BP.
The area under the ROC curve was also computed as a
composite measure of discriminatory power. Since
there were significant differences in age between the
Table 1
Description of samples
Total MDD BP-I BP-II
Italian sample
N 186 62 27 97
% Women 61.8 56.5 40.7 71.1
Age (mean+S.D.) 43.2 (13.1) 43.9 (14.3) 43.7 (12.6) 42.6 (1
Swedish sample
N 240 98 75 67
% Women 58.8 63.3 54.7 56.7
Age (mean+S.D.) 51.8 (18.3) 59.4 (18.6) 53.0 (14.4) 39.2 (1
a v2 test for sex, Kruskal–Wallis test for age.b Risk ratio for sex, odds ratio for age.
groups in the Swedish sample, we undertook three
linear regressions, one each for the HCL total score
and the two subscale scores, including patient group
and age as predictors, in order to evaluate whether
group differences remained significant when taking
into account the effects of key sociodemographic
variables.
3. Results
3.1. Description of samples
The two samples are described in Table 1. The
Italian sample included 27 patients with BP-I, 97
with BP-II and 62 with MDD. There were significant
gender differences in the sample, with the highest
proportion of women among BP-II, and the lowest
proportion among BP-I patients. The Swedish sample
included 75 patients with BP-I, 67 with BP-II and 98
with MDD. Subjects with BP-II were significantly
younger than those with MDD and BP-I.
3.2. Symptom profiles of diagnostic subgroups
3.2.1. Italian sample
Analysis of the % of BP and MDD patients endors-
ing the individual items of the HCL-32 demonstrated
statistically significant between-group differences on
17 item ratings (see Fig. 1).
3.2.2. Swedish sample
Fig. 2 shows the % of MDD and BP subjects
endorsing the individual items of the HCL-32. In
Significance ( p)a Effect sizeb (relative risk (95% C.I.))
MDD vs. BP-I MDD vs. BP-II
ns
0.009 1.6 (0.82–3.00) 0.77 (0.57–1.03)
2.5) 0.70 1.0 (0.97–1.03) 0.99 (0.97–1.02)
ns
0.48 1.2 (0.87–1.71) 1.2 (0.81–1.70)
4.7) 0.0001 0.98 (0.96–0.99) 0.94 (0.92–0.96)

J. Angst et al. / Journal of Affective Disorders 88 (2005) 217–233 221
this larger sample, statistically significant between-
group differences were recorded for 26 items.
3.3. Current psychological state and HCL-32
self-assessment
3.3.1. Italian sample
There were no significant associations (Spearman’s
correlations, all p-values N0.1) between HCL-32 total
and the subjects’ rating of current mental state (worse
than usual–neither worse nor better than usual–better
than usual). As shown in Table 2, the mean total HCL-
32 scores did not differ between groups defined
according to current mental state ( p =0.80).
3.3.2. Swedish sample
There were no significant Spearman correlations be-
tween total and current mental state (all p-values N0.5).
As with the Italian sample (see Table 2), there was no
significant difference in mean total HCL-32 score in
groups defined by current mental state ( p=0.90).
0
10
20
30
40
50
60
70
80
90
100
* lowsle
ep
* ener
gy
* slfco
nf
funw
ork
* socia
bletra
vel
* fastd
riv
* mon
ey
riskm
oreac
tivepla
ns
* ideas
* lesss
hy
* dres
sm
eetlib
i
%
MDD (N=62
Fig. 1. Item profiles for mood disorder patients in the Italian sam
3.4. Factor structure of the HCL-32
3.4.1. Italian sample
From the original 32 items of the HCL-32 the last
two items asking about drug use and alcohol use had to
be merged into one item, because of a misprint in the
questionnaire that allowed only a single response to the
two questions. A factor analysis of the 31 resulting
items initially yielded 18 factors, the first three factors
each had an Eigenvalue N1. However, a 2-factor so-
lution was preferred, as only two items, related to
sexual desire and activity, loaded substantially on
the third factor. The Eigenvalues of the two factors,
labeled bactive/elatedQ and brisk-taking/irritableQ hy-
pomania were 5.4 and 3.1, respectively, and together
accounted for 27.4% of the total variance (Table 3).
3.4.2. Swedish sample
Factor analysis initially yielded 15 factors, but only
two had an Eigenvalue N1 (factor 1=5.8, factor
2=2.3). The factor structure was very similar to that
do
flirtse
x
talkm
ore
* think
fst
jokem
ore
* distra
ct
* newth
ing
* jumpt
ho
* allfas
t
* impa
t
* bugo
th
argu
men
t
* highm
ood
coffe
e
smok
e
drug
alc
) BP (N=124)
ple. Stars indicate p b0.05, uncorrected for multiple testing.

0
10
20
30
40
50
60
70
80
90
100
* low
sleep
* ene
rgy
* slfc
onf
* fun
work
* soc
iable
* tra
vel
* fas
tdriv
* mon
ey
* risk
mor
eac
tive
* plan
s
* ide
as
* les
sshydr
ess
* mee
t
* libi
do
* flirt
sex
talkm
ore
think
fst
jokem
ore
* dist
ract
* new
thing
* jum
ptho
* allfa
st
* im
pat
* bugo
th
* arg
umen
t
* high
moo
d
* cof
fee
* sm
oke
* alco
hol
drug
s
%
MDD (N=98) BP (N=142)
Fig. 2. Item profiles for mood disorder patients in the Swedish sample. Stars indicate p b0.05, uncorrected for multiple testing.
J. Angst et al. / Journal of Affective Disorders 88 (2005) 217–233222
of the Italian sample, and the two factors received the
same labels of bactive/elatedQ and brisk-taking/irritableQ hypomania (Table 3) and accounted for a
similar proportion of the total variance (25.3%).
3.4.3. Combined sample
As the previous analyses gave similar results we
decided to merge the samples for a further analysis.
As shown in Table 3, the two-factor solution
Table 2
HCL-32 scores (mean (S.D.)) for different levels of current mood state
Current mental state Italian sample
N HCL
Much worse than usual 5 16.0
Worse than usual 19 15.8
A little worse than usual 14 16.6
Neither better nor worse than usual 35 16.6
A little better than usual 22 15.2
Better than usual 32 17.0
Much better than usual 3 15.3
Significance (Kruskal–Wallis test) – 0.8
accounted for 26.8% of the variance and the Eigen-
values for factor 1 and factor 2 were 5.8 and 2.5,
respectively.
3.5. Total and subscale scores of diagnostic subgroups
Subscale scores for each factor were obtained by
summing all items that loaded higher than 0.4 on the
corresponding factor.
Swedish sample
-32 total score N HCL-32 total score
(4.8) 12 17.3 (9.5)
(5.6) 25 15.7 (6.1)
(3.0) 42 16.5 (5.8)
(6.2) 99 15.6 (6.2)
(6.0) 38 16.3 (5.2)
(5.9) 31 16.1 (5.8)
(3.1) 7 16.7 (4.5)
0 – 0.90
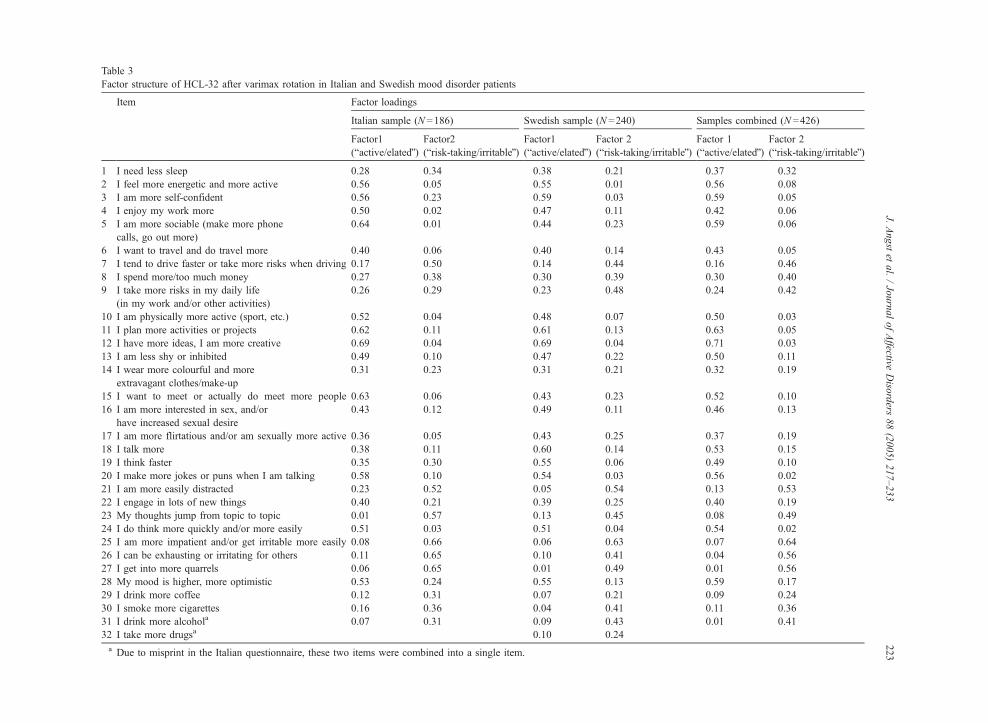
Table 3
Factor structure of HCL-32 after varimax rotation in Italian and Swedish mood disorder patients
Item Factor loadings
Italian sample (N =186) Swedish sample (N =240) Samples combined (N =426)
Factor1
(bactive/elatedQ)Factor2
(brisk-taking/irritableQ)Factor1
(bactive/elatedQ)Factor 2
(brisk-taking/irritableQ)Factor 1
(bactive/elatedQ)Factor 2
(brisk-taking/irritableQ)
1 I need less sleep 0.28 0.34 0.38 0.21 0.37 0.32
2 I feel more energetic and more active 0.56 0.05 0.55 0.01 0.56 0.08
3 I am more self-confident 0.56 0.23 0.59 0.03 0.59 �0.05
4 I enjoy my work more 0.50 0.02 0.47 �0.11 0.42 �0.06
5 I am more sociable (make more phone
calls, go out more)
0.64 0.01 0.44 0.23 0.59 0.06
6 I want to travel and do travel more 0.40 0.06 0.40 0.14 0.43 0.05
7 I tend to drive faster or take more risks when driving 0.17 0.50 0.14 0.44 0.16 0.46
8 I spend more/too much money 0.27 0.38 0.30 0.39 0.30 0.40
9 I take more risks in my daily life
(in my work and/or other activities)
0.26 0.29 0.23 0.48 0.24 0.42
10 I am physically more active (sport, etc.) 0.52 0.04 0.48 �0.07 0.50 �0.03
11 I plan more activities or projects 0.62 0.11 0.61 0.13 0.63 0.05
12 I have more ideas, I am more creative 0.69 0.04 0.69 0.04 0.71 0.03
13 I am less shy or inhibited 0.49 0.10 0.47 0.22 0.50 0.11
14 I wear more colourful and more
extravagant clothes/make-up
0.31 0.23 0.31 0.21 0.32 0.19
15 I want to meet or actually do meet more people 0.63 0.06 0.43 0.23 0.52 0.10
16 I am more interested in sex, and/or
have increased sexual desire
0.43 0.12 0.49 0.11 0.46 0.13
17 I am more flirtatious and/or am sexually more active 0.36 0.05 0.43 0.25 0.37 0.19
18 I talk more 0.38 0.11 0.60 0.14 0.53 0.15
19 I think faster 0.35 0.30 0.55 0.06 0.49 0.10
20 I make more jokes or puns when I am talking 0.58 0.10 0.54 �0.03 0.56 0.02
21 I am more easily distracted 0.23 0.52 �0.05 0.54 �0.13 0.53
22 I engage in lots of new things 0.40 0.21 0.39 0.25 0.40 0.19
23 My thoughts jump from topic to topic 0.01 0.57 0.13 0.45 0.08 0.49
24 I do think more quickly and/or more easily 0.51 0.03 0.51 �0.04 0.54 �0.02
25 I am more impatient and/or get irritable more easily 0.08 0.66 �0.06 0.63 �0.07 0.64
26 I can be exhausting or irritating for others 0.11 0.65 0.10 0.41 0.04 0.56
27 I get into more quarrels 0.06 0.65 0.01 0.49 �0.01 0.56
28 My mood is higher, more optimistic 0.53 0.24 0.55 �0.13 0.59 �0.17
29 I drink more coffee 0.12 0.31 0.07 0.21 0.09 0.24
30 I smoke more cigarettes 0.16 0.36 0.04 0.41 0.11 0.36
31 I drink more alcohola 0.07 0.31 0.09 0.43 0.01 0.41
32 I take more drugsa �0.10 0.24
a Due to misprint in the Italian questionnaire, these two items were combined into a single item.
J.Angstet
al./JournalofAffective
Diso
rders
88(2005)217–233
223
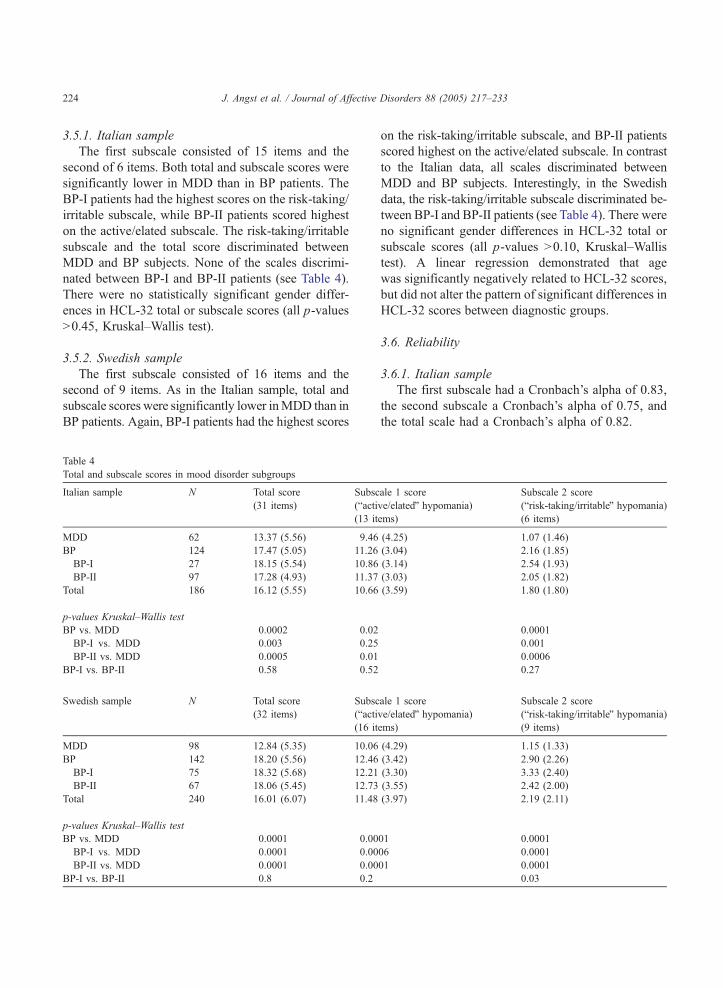
J. Angst et al. / Journal of Affective Disorders 88 (2005) 217–233224
3.5.1. Italian sample
The first subscale consisted of 15 items and the
second of 6 items. Both total and subscale scores were
significantly lower in MDD than in BP patients. The
BP-I patients had the highest scores on the risk-taking/
irritable subscale, while BP-II patients scored highest
on the active/elated subscale. The risk-taking/irritable
subscale and the total score discriminated between
MDD and BP subjects. None of the scales discrimi-
nated between BP-I and BP-II patients (see Table 4).
There were no statistically significant gender differ-
ences in HCL-32 total or subscale scores (all p-values
N0.45, Kruskal–Wallis test).
3.5.2. Swedish sample
The first subscale consisted of 16 items and the
second of 9 items. As in the Italian sample, total and
subscale scores were significantly lower inMDD than in
BP patients. Again, BP-I patients had the highest scores
Table 4
Total and subscale scores in mood disorder subgroups
Italian sample N Total score
(31 items)
Subsc
(bacti(13 it
MDD 62 13.37 (5.56) 9.46
BP 124 17.47 (5.05) 11.26
BP-I 27 18.15 (5.54) 10.86
BP-II 97 17.28 (4.93) 11.37
Total 186 16.12 (5.55) 10.66
p-values Kruskal–Wallis test
BP vs. MDD 0.0002 0.02
BP-I vs. MDD 0.003 0.25
BP-II vs. MDD 0.0005 0.01
BP-I vs. BP-II 0.58 0.52
Swedish sample N Total score
(32 items)
Subsc
(bacti(16 it
MDD 98 12.84 (5.35) 10.06
BP 142 18.20 (5.56) 12.46
BP-I 75 18.32 (5.68) 12.21
BP-II 67 18.06 (5.45) 12.73
Total 240 16.01 (6.07) 11.48
p-values Kruskal–Wallis test
BP vs. MDD 0.0001 0.00
BP-I vs. MDD 0.0001 0.00
BP-II vs. MDD 0.0001 0.00
BP-I vs. BP-II 0.8 0.2
on the risk-taking/irritable subscale, and BP-II patients
scored highest on the active/elated subscale. In contrast
to the Italian data, all scales discriminated between
MDD and BP subjects. Interestingly, in the Swedish
data, the risk-taking/irritable subscale discriminated be-
tween BP-I and BP-II patients (see Table 4). There were
no significant gender differences in HCL-32 total or
subscale scores (all p-values N0.10, Kruskal–Wallis
test). A linear regression demonstrated that age
was significantly negatively related to HCL-32 scores,
but did not alter the pattern of significant differences in
HCL-32 scores between diagnostic groups.
3.6. Reliability
3.6.1. Italian sample
The first subscale had a Cronbach’s alpha of 0.83,
the second subscale a Cronbach’s alpha of 0.75, and
the total scale had a Cronbach’s alpha of 0.82.
ale 1 score
ve/elatedQ hypomania)
ems)
Subscale 2 score
(brisk-taking/irritableQ hypomania)
(6 items)
(4.25) 1.07 (1.46)
(3.04) 2.16 (1.85)
(3.14) 2.54 (1.93)
(3.03) 2.05 (1.82)
(3.59) 1.80 (1.80)
0.0001
0.001
0.0006
0.27
ale 1 score
ve/elatedQ hypomania)
ems)
Subscale 2 score
(brisk-taking/irritableQ hypomania)
(9 items)
(4.29) 1.15 (1.33)
(3.42) 2.90 (2.26)
(3.30) 3.33 (2.40)
(3.55) 2.42 (2.00)
(3.97) 2.19 (2.11)
01 0.0001
06 0.0001
01 0.0001
0.03
J. Angst et al. / Journal of Affective Disorders 88 (2005) 217–233 225
3.6.2. Swedish sample
The first subscale had a Cronbach’s alpha of 0.85,
the second had a Cronbach’s alpha of 0.72, and the
total scale had a Cronbach’s alpha of 0.86.
3.7. Sensitivity and specificity (ROC analysis), and
predictive power
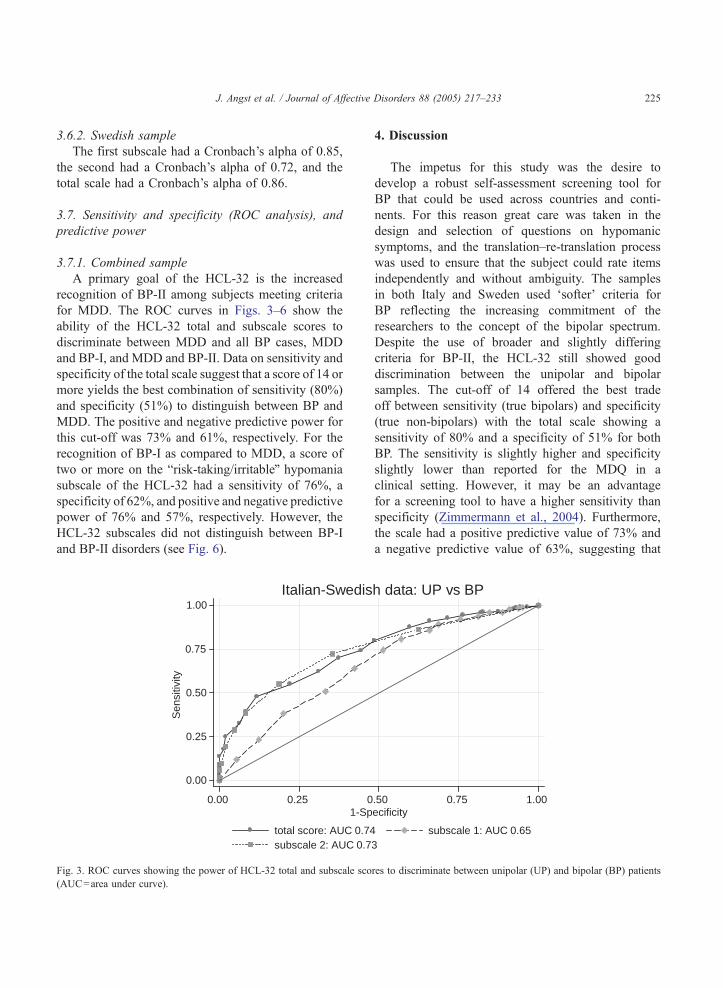
3.7.1. Combined sample
A primary goal of the HCL-32 is the increased
recognition of BP-II among subjects meeting criteria
for MDD. The ROC curves in Figs. 3–6 show the
ability of the HCL-32 total and subscale scores to
discriminate between MDD and all BP cases, MDD
and BP-I, and MDD and BP-II. Data on sensitivity and
specificity of the total scale suggest that a score of 14 or
more yields the best combination of sensitivity (80%)
and specificity (51%) to distinguish between BP and
MDD. The positive and negative predictive power for
this cut-off was 73% and 61%, respectively. For the
recognition of BP-I as compared to MDD, a score of
two or more on the brisk-taking/irritableQ hypomania
subscale of the HCL-32 had a sensitivity of 76%, a
specificity of 62%, and positive and negative predictive
power of 76% and 57%, respectively. However, the
HCL-32 subscales did not distinguish between BP-I
and BP-II disorders (see Fig. 6).
0.00
0.25
0.50
0.75
1.00
Sen
sitiv
ity
0.00 0.25 01-Sp
total score: AUC 0.74subscale 2: AUC 0.7
Italian-Swedis
Fig. 3. ROC curves showing the power of HCL-32 total and subscale sco
(AUC=area under curve).
4. Discussion
The impetus for this study was the desire to
develop a robust self-assessment screening tool for
BP that could be used across countries and conti-
nents. For this reason great care was taken in the
design and selection of questions on hypomanic
symptoms, and the translation–re-translation process
was used to ensure that the subject could rate items
independently and without ambiguity. The samples
in both Italy and Sweden used dsofterT criteria for
BP reflecting the increasing commitment of the
researchers to the concept of the bipolar spectrum.
Despite the use of broader and slightly differing
criteria for BP-II, the HCL-32 still showed good
discrimination between the unipolar and bipolar
samples. The cut-off of 14 offered the best trade
off between sensitivity (true bipolars) and specificity
(true non-bipolars) with the total scale showing a
sensitivity of 80% and a specificity of 51% for both
BP. The sensitivity is slightly higher and specificity
slightly lower than reported for the MDQ in a
clinical setting. However, it may be an advantage
for a screening tool to have a higher sensitivity than
specificity (Zimmermann et al., 2004). Furthermore,
the scale had a positive predictive value of 73% and
a negative predictive value of 63%, suggesting that
.50 0.75 1.00ecificity
subscale 1: AUC 0.653
h data: UP vs BP
res to discriminate between unipolar (UP) and bipolar (BP) patients

0.00
0.25
0.50
0.75
1.00
Sen
sitiv
ity
0.00 0.25 0.50 0.75 1.001-Specificity
total score: AUC 0.75 subscale 1: AUC 0.63subscale 2: AUC 0.76
Italian-Swedish data: UP vs BP-I
Fig. 4. ROC curves showing the power of HCL-32 total and subscale scores to discriminate between unipolar (UP) and bipolar-I (BP-I) patients
(AUC=area under curve).
J. Angst et al. / Journal of Affective Disorders 88 (2005) 217–233226
the discriminatory power of the scale would be
maintained to an acceptable degree if the scale
was applied in community settings where the overall
rates of BP would be lower than in the clinical
settings we report here. Interestingly and impor-
tantly, current mental state (worse than usual–neither
0.00
0.25
0.50
0.75
1.00
Sen
sitiv
ity
0.00 0.25 01-Sp
total score: AUC 0.74subscale 2: AUC 0.7
Italian-Swedish d
Fig. 5. ROC curves showing the power of HCL-32 total and subscale s
patients (AUC=area under curve).
worse nor better–better than usual) had no impact
on the self-assessment of hypomanic symptoms.
This was the case although quite a number of Italian
outpatients were currently depressed. The result sug-
gests that the scale can be used for screening pur-
poses even in currently symptomatic patients
.50 0.75 1.00ecificity
subscale 1: AUC 0.671
ata: UP vs BP-II
cores to discriminate between unipolar (UP) and bipolar-II (BP-II)

0.00
0.25
0.50
0.75
1.00
Sen
sitiv
ity
0.00 0.25 0.50 0.75 1.001-Specificity
total score: AUC 0.46 subscale 1: AUC 0.54subscale 2: AUC 0.41
Italian-Swedish data: BP-I vs BP-II
Fig. 6. ROC curves showing the power of HCL-32 total and subscale scores to discriminate between bipolar-I (BP-I) and bipolar-II (BP-II)
patients (AUC=area under curve).
J. Angst et al. / Journal of Affective Disorders 88 (2005) 217–233 227
(Benazzi, 2003a). The utility in a non-patient com-
munity sample of the HCL-32 will be an important
future test of the questionnaire.
Analyses of the Italian and Swedish samples
independently and together gave similar two-factor
structures of hypomania, an bactive/elatedQ factor
and a brisk-taking/irritableQ factor. The active/elated
factor included mainly overactivity, mood elation
and improved thinking. The risk-taking/irritable fac-
tor included symptoms of risk taking behavior,
anger/irritability, and flight of ideas. This factor
structure is comparable to the one described by
Hantouche et al. (2003) on the basis of the original
shorter version of the hypomania checklist (HCL-20)
used in the French multi-center EPIDEP study. It is
also in line with the factor analysis of hypomania
based on the Mood Disorder Questionnaire (Benazzi
and Akiskal, 2003a). Clinically, it can be seen that the
active/elated subscale measures those at risk for hypo-
mania who may be less likely to recognize the symp-
toms as pathological. The risk-taking/irritable subscale
taps into features more commonly associated with
treated BP disorders. However, the two subscales
used independently and together did not consistently
differentiate the three patient subgroups (MDD, BP-I,
BP-II) so further testing will be required to establish
how useful the scales are in their own right and wheth-
er they can be used as course specifiers within the
diagnostic category.
4.1. Limitations
The work presented here on the HCL-32 has
strengths and weaknesses. The strength lies in the
fact that the HCL-32 has been developed in a way
that will allow its use in different languages, and we
are gathering data on samples in a number of countries
and settings, which will allow further revisions of the
scale. The weakness is that it will take much time to do
all these studies in order to arrive at a final conclusion
about the sensitivity and specificity of this tool, so the
current data must be seen as preliminary. The main
drawback of the current study is that it may not have
adequate power to determine whether the failure of the
HCL-32 to discriminate between different subtypes of
BP is a function of inadequate statistical power or an
inherent characteristic of the structure of the self-as-
sessment scale. A further issue is that differing criteria
and selection methods were used to ascertain the
clinical samples at the different centers. However,
this may be an advantage as it increases the generali-
sability of the results and adds confidence that the two
subscales identified from the factor analysis of the
HCL-32 are meaningful and reproducible.
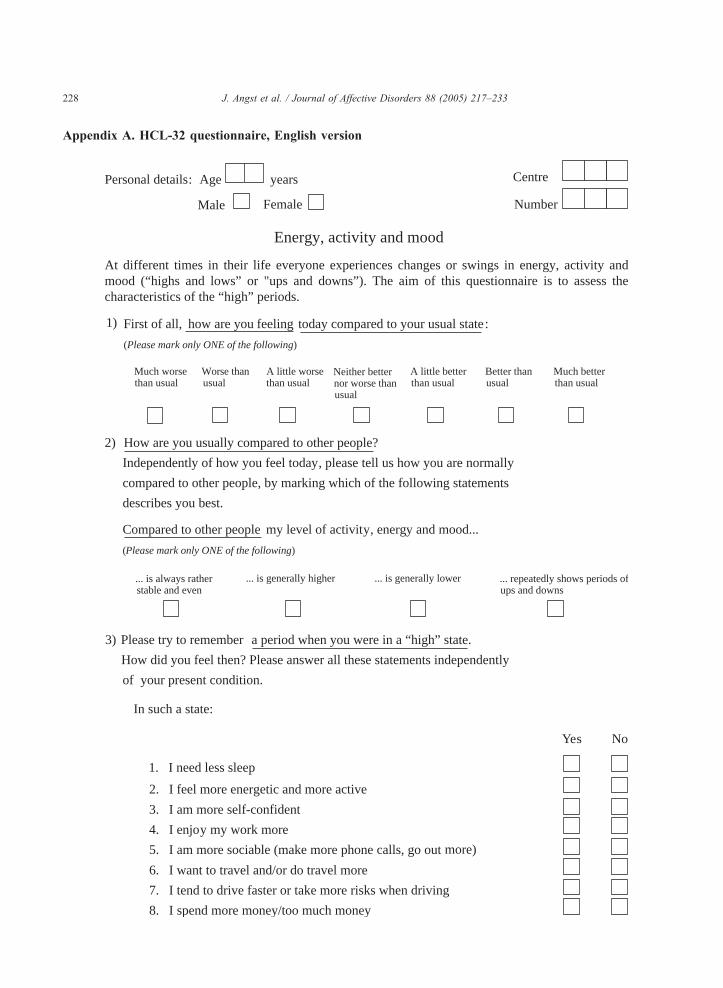
J. Angst et al. / Journal of Affective Disorders 88 (2005) 217–233228
Appendix A. HCL-32 questionnaire, English version
Personal details: Age years Centre
Female Number
Energy, activity and mood
At different times in their life everyone experiences changes or swings in energy, activity andmood (“highs and lows” or "ups and downs”). The aim of this questionnaire is to assess thecharacteristics of the “high” periods.
First of all, how are you feeling today compared to your usual state:
(Please mark only ONE of the following)
Much worsethan usual
Worse thanusual
A little worsethan usual
Neither betternor worse thanusual
A little betterthan usual
Better thanusual
Much betterthan usual
2) How are you usually compared to other people?
Independently of how you feel today, please tell us how you are normally
compared to other people, by marking which of the following statements
describes you best.
Compared to other people my level of activity, energy and mood...
(Please mark only ONE of the following)
... is always ratherstable and even
... is generally higher ... is generally lower ... repeatedly shows periods ofups and downs
Please try to remember a period when you were in a “high” state.
How did you feel then? Please answer all these statements independently
of your present condition.
In such a state:
No
1. I need less sleep
Ye s
Male
1)
3)
2. I feel more energetic and more active
3. I am more self-confident
4. I enjoy my work more
5. I am more sociable (make more phone calls, go out more)
6. I want to travel and/or do travel more
7. I tend to drive faster or take more risks when driving
8. I spend more money/too much money
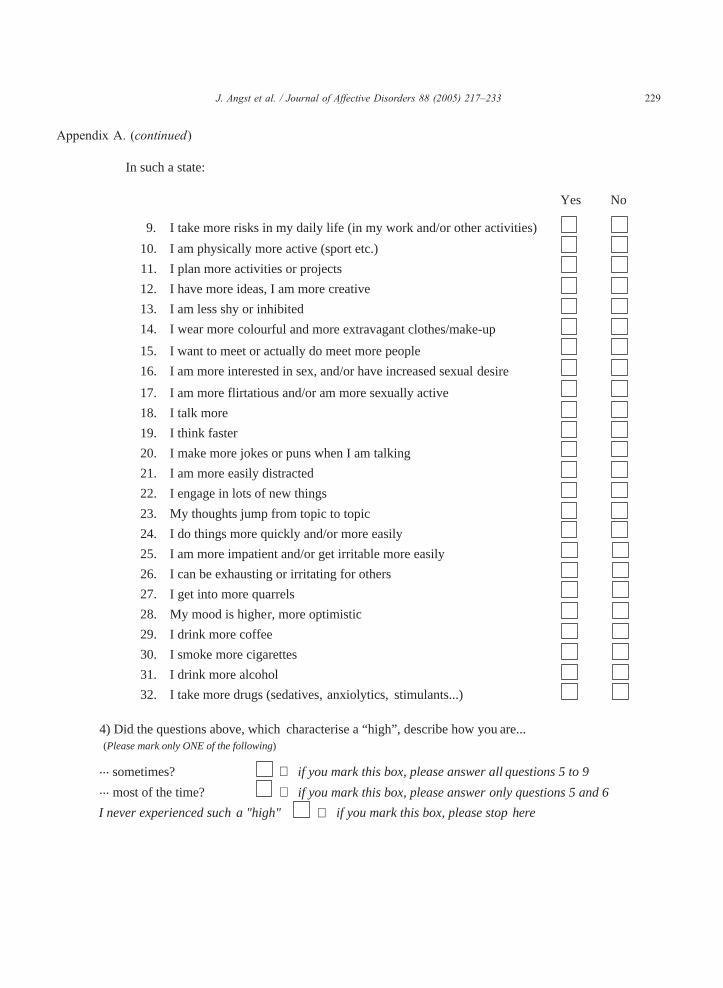
J. Angst et al. / Journal of Affective Disorders 88 (2005) 217–233 229
Appendix A. (continued)
In such a state:
No
9. I take more risks in my daily life (in my work and/or other activities)
10. I am physically more active (sport etc.)
11. I plan more activities or projects
12. I have more ideas, I am more creative
13. I am less shy or inhibited
14. I wear more colourful and more extravagant clothes/make-up
15. I want to meet or actually do meet more people
16. I am more interested in sex, and/or have increased sexual desire
17. I am more flirtatious and/or am more sexually active
18. I talk more
19. I think faster
20. I make more jokes or puns when I am talking
21. I am more easily distracted
22. I engage in lots of new things
23. My thoughts jump from topic to topic
24. I do things more quickly and/or more easily
25. I am more impatient and/or get irritable more easily
26. I can be exhausting or irritating for others
27. I get into more quarrels
28. My mood is higher, more optimistic
29. I drink more coffee
30. I smoke more cigarettes
31. I drink more alcohol
32. I take more drugs (sedatives, anxiolytics, stimulants...)
4) Did the questions above, which characterise a “high”, describe how you are...(Please mark only ONE of the following)
... sometimes? ⇒ if you mark this box, please answer all questions 5 to 9
... most of the time? ⇒ if you mark this box, please answer only questions 5 and 6
I never experienced such a "high" if you mark this box, please stop here⇒
Yes
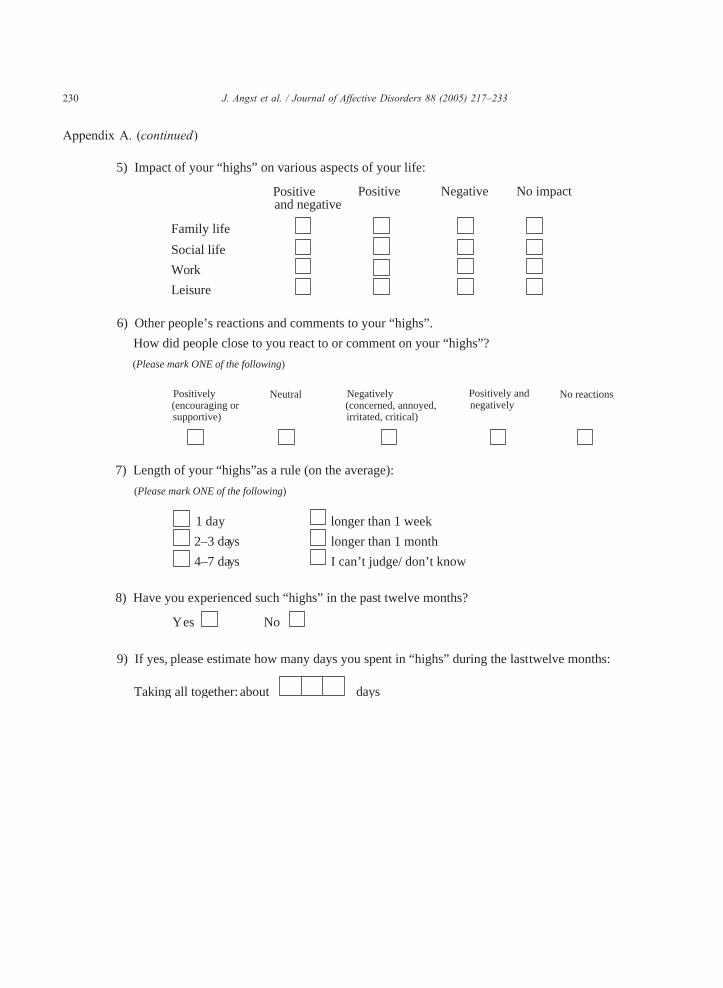
J. Angst et al. / Journal of Affective Disorders 88 (2005) 217–233230
Appendix A. (continued)
6) Other people’s reactions and comments to your “highs”.
How did people close to you react to or comment on your “highs”?
(Please mark ONE of the following)
Positively(encouraging orsupportive)
Neutral Negatively(concerned, annoyed,irritated, critical)
Positively andnegatively
No reactions
7) Length of your “highs”as a rule (on the average):
(Please mark ONE of the following)
1 day longer than 1 week
2–3 days longer than 1 month
4–7 days I can’t judge/ don’t know
8) Have you experienced such “highs” in the past twelve months?
Yes No
9) If yes, please estimate how many days you spent in “highs” during the lasttwelve months:
Taking all together: about
5) Impact of your “highs” on various aspects of your life:
Positiveand negative
Positive Negative No impact
Family life
Social life
Work
Leisure
days
J. Angst et al. / Journal of Affective Disorders 88 (2005) 217–233 231
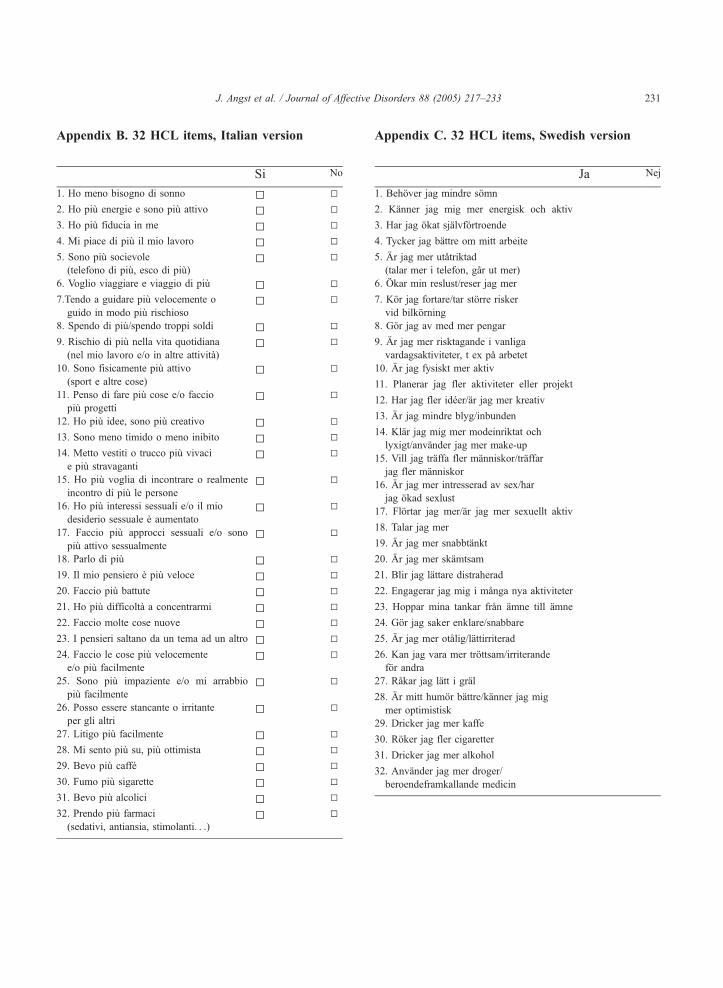
Appendix B. 32 HCL items, Italian version
Si No
1. Ho meno bisogno di sonno 5 5
2. Ho piu energie e sono piu attivo 5 5
3. Ho piu fiducia in me 5 5
4. Mi piace di piu il mio lavoro 5 5
5. Sono piu socievole
(telefono di piu, esco di piu)5 5
6. Voglio viaggiare e viaggio di piu 5 5
7.Tendo a guidare piu velocemente o
guido in modo piu rischioso5 5
8. Spendo di piu/spendo troppi soldi 5 5
9. Rischio di piu nella vita quotidiana
(nel mio lavoro e/o in altre attivita)5 5
10. Sono fisicamente piu attivo
(sport e altre cose)5 5
11. Penso di fare piu cose e/o faccio
piu progetti5 5
12. Ho piu idee, sono piu creativo 5 5
13. Sono meno timido o meno inibito 5 5
14. Metto vestiti o trucco piu vivaci
e piu stravaganti5 5
15. Ho piu voglia di incontrare o realmente
incontro di piu le persone5 5
16. Ho piu interessi sessuali e/o il mio
desiderio sessuale e aumentato5 5
17. Faccio piu approcci sessuali e/o sono
piu attivo sessualmente5 5
18. Parlo di piu 5 5
19. Il mio pensiero e piu veloce 5 5
20. Faccio piu battute 5 5
21. Ho piu difficolta a concentrarmi 5 5
22. Faccio molte cose nuove 5 5
23. I pensieri saltano da un tema ad un altro 5 5
24. Faccio le cose piu velocemente
e/o piu facilmente5 5
25. Sono piu impaziente e/o mi arrabbio
piu facilmente5 5
26. Posso essere stancante o irritante
per gli altri5 5
27. Litigo piu facilmente 5 5
28. Mi sento piu su, piu ottimista 5 5
29. Bevo piu caffe 5 5
30. Fumo piu sigarette 5 5
31. Bevo piu alcolici 5 5
32. Prendo piu farmaci
(sedativi, antiansia, stimolanti. . .)5 5
Appendix C. 32 HCL items, Swedish version
Ja Nej
1. Behover jag mindre somn
2. Kanner jag mig mer energisk och aktiv
3. Har jag okat sjalvfortroende
4. Tycker jag battre om mitt arbeite
5. Ar jag mer utatriktad
(talar mer i telefon, gar ut mer)
6. Okar min reslust/reser jag mer
7. Kor jag fortare/tar storre risker
vid bilkorning
8. Gor jag av med mer pengar
9. Ar jag mer risktagande i vanliga
vardagsaktiviteter, t ex pa arbetet
10. Ar jag fysiskt mer aktiv
11. Planerar jag fler aktiviteter eller projekt
12. Har jag fler ideer/ar jag mer kreativ
13. Ar jag mindre blyg/inbunden
14. Klar jag mig mer modeinriktat och
lyxigt/anvander jag mer make-up
15. Vill jag traffa fler manniskor/traffar
jag fler manniskor
16. Ar jag mer intresserad av sex/har
jag okad sexlust
17. Flortar jag mer/ar jag mer sexuellt aktiv
18. Talar jag mer
19. Ar jag mer snabbtankt
20. Ar jag mer skamtsam
21. Blir jag lattare distraherad
22. Engagerar jag mig i manga nya aktiviteter
23. Hoppar mina tankar fran amne till amne
24. Gor jag saker enklare/snabbare
25. Ar jag mer otalig/lattirriterad
26. Kan jag vara mer trottsam/irriterande
for andra
27. Rakar jag latt i gral
28. Ar mitt humor battre/kanner jag mig
mer optimistisk
29. Dricker jag mer kaffe
30. Roker jag fler cigaretter
31. Dricker jag mer alkohol
32. Anvander jag mer droger/
beroendeframkallande medicin
J. Angst et al. / Journal of Affective Disorders 88 (2005) 217–233232
References
Akiskal, H., Bourgeois, M.L., Angst, J., Post, R., Moller, H.-J.,
Hirschfeld, R., 2000. Re-evaluating the prevalence of and diag-
nostic composition within the broad clinical spectrum of bipolar
disorders. J. Affect. Disord. 59, S5–S30.
Allilaire, J.-F., Hantouche, E.-G., Sechter, D., Bourgeois, M.-L.,
Azorin, J.M., Lancrenon, S., Chatenet-Duchene, L., Akiskal, H.-
S., 2001. Frequence et aspects cliniques du trouble bipolaire II
dans une etude multicentrique francaise: EPIDEP. Encephale
XXVII, 149–158.
Alloy, L.B., Flannery-Schroeder, E.C., Safford, S.M., Floyd, T.D.,
Abramson, L.Y., 1999.
American Psychiatric Association, 2002. Practice guideline for the
treatment of patients with bipolar disorder (revision). Am. J.
Psychiatry 159, S1–S50 (suppl.).
Angst, J., 1992. L’hypomanie. A propos d’une cohorte de jeunes.
Encephale 18, 23–29.
Angst, J., 1998. The emerging epidemiology of hypomania and
bipolar II disorder. J. Affect. Disord. 50, 143–151.
Angst, J., 1999. Categorical and dimensional perspectives of de-
pression. In: Maj, M., Sartorius, N. (Eds.), Depressive Disor-
ders, vol. 1. John Wiley & Sons, Chichester, pp. 54–56.
Angst, J., Gamma, A., 2002. Update on Maintenance Treatments for
Bipolar Disorder. A Data Given Approach, Barcelona Spain, 6th
October 2002, pp. 4–5.
Angst, J., Gamma, A., Benazzi, F., Ajdacic, V., Eich, D., Rossler,
H.W., 2003a. Diagnostic issues in bipolar disorder. Eur. Neu-
ropsychopharmacol. 13, S43–S50.
Angst, J., Gamma, A., Benazzi, F., Ajdacic, V., Eich, D.,
Rossler, W., 2003b. Toward a re-definition of subthreshold
bipolarity: epidemiology and proposed criteria for bipolar-II,
minor bipolar disorders and hypomania. J. Affect. Disord. 73,
133–146.
Bauer, M.S., Crits-Christoph, P., Ball, W.A., Dewees, E., McAllis-
ter, T., Alahi, P., Cacciola, J., Whybrow, P.C., 1991. Independent
assessment of manic and depressive symptoms by self-rating.
Scale characteristics and implications for the study of mania.
Arch. Gen. Psychiatry 48, 807–812.
Benazzi, F., 2003a. Bipolar II disorder and major depressive
disorder: continuity or discontinuity? World J. Biol. Psychiatry
4, 166–171.
Benazzi, F., 2003b. Improving the mood disorder questionnaire to
detect bipolar II disorder (Letter to the editor). Can. J. Psychiatry
48, 770–771.
Benazzi, F., 2004. Toward better probing for hypomania of bipolar
II disorder by using Angst’s checklist. Int. J. Methods Psychiatr.
Res. 13, 1–9.
Benazzi, F., Akiskal, H.S., 2003a. The dual factor structure of self-
rated MDQ hypomania: energized-activity versus irritable-
thought racing. J. Affect. Disord. 73, 59–64.
Benazzi, F., Akiskal, H.S., 2003b. Refining the evaluation of bipolar
II: beyond the strict SCID-CV guidelines for hypomania. J.
Affect. Disord. 73, 33–38.
Dennehy, E.B., Suppes, T., Crismon, M.L., Toprac, M., Carmody,
T.J., Rush, A.J., 2004. Development of the brief bipolar disorder
symptom scale for patients with bipolar disorder. Psychiatry
Res. 127, 137–145.
Depue, R.A., Slater, J.F., Wolfstetter-Kausch, H., Klein, D.,
Goplerud, E., Farr, D., 1981. A behavioral paradigm for iden-
tifying persons at risk for bipolar depressive disorder: a concep-
tual framework and five validation studies. J. Abnorm.
Psychology 90, 381–437.
First, M.B., Spitzer, R.L., Gibbon, M., Williams, J.B.W., 1997.
Structured Clinical Interview for DSM-IV Axis I Disorders-
Clinician Version (SCID-CV). American Psychiatric Press,
Washington, DC.
Flett, G.L., Vredenburg, K., Krames, L., 1997. The continuity of
depression in clinical and nonclinical samples. Psychol. Bull.
121, 395–416.
Geiselmann, B., Bauer, M., 2000. Subthreshold depression in the
elderly: qualitative or quantitative distinction? Compr. Psychia-
try 41, 32–38.
Ghaemi, S.N., Ko, J.Y., Goodwin, F.K., 2002. bCade’s diseaseQ andbeyond: misdiagnosis, antidepressant use, and a proposed def-
inition for bipolar spectrum disorder. W. Can. J. Psychiatry 47,
125–134.
Hantouche, E.G., Akiskal, H.S., Lancrenon, S., Allilaire, J.-F.,
Sechter, D., Azorin, J.-M., Bourgeois, M., Fraud, J.-P., Cha-
tenet-Duchene, L., 1998. Systematic clinical methodology for
validating bipolar-II disorder: data in mid-stream from a
French national multi-site study (EPIDEP). J. Affect. Disord.
50, 163–173.
Hantouche, E.G., Angst, J., Akiskal, H.S., 2003. Factor structure of
hypomania: interrelationships with cyclothymia and the soft
bipolar spectrum. J. Affect. Disord. 73, 39–47.
Harman, H.H., 1976. Modern Factor Analysis. University of Chi-
cago Press, Chicago.
Haslam, N., Beck, A.T., 1994. Subtyping major depression: a taxo-
metric analysis. J. Abnorm. Psychology 103, 686–692.
Hirschfeld, R.M.A., Williams, J.B.W., Spitzer, R.L., Calabrese, J.R.,
Flynn, L., Keck, P., Lewis, L., McElroy, S., Post, R.M., Rapport,
D.J., 2000. Development and validation of a screening instru-
ment for bipolar spectrum disorder: the mood disorder question-
naire. Am. J. Psychiatry 157, 1873–1875.
Hirschfeld, R.M.A., Calabrese, J.R., Weissman, M.M., Reed, M.,
Davies, M.A., Frye, M.A., Keck Jr., P.E., 2003a. Screening
for bipolar disorder in the community. J. Clin. Psychiatry 64,
53–59.
Hirschfeld, R.M.A., Holzer, C., Calabrese, J.R., Weissman, M.,
Reed, M., Davies, M., Frye, M.A., Keck, P., McElroy, S.,
Lewis, L., 2003b. Validity of the mood disorder questionnaire:
a general population study (brief report). Am. J. Psychiatry 160,
178–180.
Hirschfeld, R.M.A., Lewis, L., Vornik, L.A., 2003c. Perceptions
and impact of bipolar disorder: how far have we really come?
Results of the national depressive and manic-depressive associ-
ation 2000 survey of individuals with bipolar disorder. J. Clin.
Psychiatry 64, 161–174.
Hunter, E.E., Powell, B.J., Penick, E.C., Nickel, E.J., Othmer, E.,
DeSouza, C., 2000. Development and validation of a mania
scale for the Symptom Checklist 90. J. Nerv. Ment. Dis. 188,
176–179.
J. Angst et al. / Journal of Affective Disorders 88 (2005) 217–233 233
Judd, L.L., Akiskal, H.S., 2003. The prevalence and disability of
bipolar spectrum disorders in the US population: re-analysis of
the ECA database taking into account subthreshold cases. J.
Affect. Disord. 73, 123–131.
Korszun, A., Moskvina, V., Brewster, S., Craddock, N., Ferrero, F.,
Gill, M., Jones, J.R., Jones, L.A., Maier, W., Mors, O., 2004.
Familiality of symptom dimensions in depression. Arch. Gen.
Psychiatry 61, 468–474.
Lish, J.D., Dime-Meenan, S., Whybrow, P.C., Price, R.A., Hirsch-
feld, R.M.A., 1994. The national depressive and manic-depres-
sive association (DMDA) survey of bipolar members. J. Affect.
Disord. 31, 281–294.
Mago, R., 2001. Bipolar disorder questionnaire (Letter to the edi-
tor). Am. J. Psychiatry 158, 1743.
Meyer, T.D., Hautzinger, M., 2003. Screening for bipolar disorders
using the hypomanic personality scale. J. Affect. Disord. 75,
149–154.
Meyer, T.D., Keller, F., 2003. Is there evidence for a latent class called
bhypomanic temperamentQ? J. Affect. Disord. 75, 259–267.
Ruscio, J., Ruscio, A.M., 2000. Informing the continuity controver-
sy: a taxometric analysis of depression. J. Abnorm. Psychology
109, 473–487.
Scott, J., 2002. Overcoming Mood Swings. Constable Robinson,
London, pp. 21–36.
Shugar, G., Schertzer, S., Toner, B.B., Di Gasbarro, I., 1992.
Development, use, and factor analysis of a self-report inventory
for mania. Compr. Psychiatry 33, 325–331.
Szadoczky, E., Papp, Z., Vitrai, J., Rihmer, Z., Furedi, J., 1998. The
prevalence of major depressive and bipolar disorders in Hun-
gary. Results from a national epidemiologic survey. J. Affect.
Disord. 50, 153–162.
Zimmermann, M., Posternak, M.A., Chelminski, I., Solomon, D.A.,
2004. Using questionnaires to screen for psychiatric disorders: a
comment on a study of screening for bipolar disorder in the
community. J. Clin. Psychiatry 65, 605–610.