The Global Financial Centres Index 29 - China Development ...
64
Financial Centre Futures The Global Financial Centres Index 29 March 2021
-
Upload
khangminh22 -
Category
Documents
-
view
1 -
download
0
Transcript of The Global Financial Centres Index 29 - China Development ...
Financial Centre Futures
The Global Financial Centres Index 29
March 2021
In March 2007, Z/Yen and the City Of London released the first edition of the GFCI, which continues to provide evaluations of competitiveness and rankings for the major financial centres around the world. We are pleased to present the twenty-ninth edition of the Global Financial Centres Index (GFCI 29).
In July 2016, Z/Yen and the China Development Institute (CDI) in Shenzhen established a strategic partnership for research into financial centres. We continue our collaboration in producing the GFCI.
The GFCI is updated every March and September and receives considerable attention from the global financial community. The index serves as a valuable reference for policy and investment decisions.
Z/Yen is the City of London's leading commercial think-tank. Z/Yen was founded in 1994 to promote societal advance through better finance and technology. Z/Yen has built its practice around a core of high-powered project managers, supported by experienced technical specialists so that clients get expertise they need, rather than just resources available.
The CDI is a leading national think-tank that develops solutions to public policy challenges through broad-scope and in-depth research to help advance China’s reform and opening-up to world markets. The CDI has been working on the promotion and development of China’s financial system since its establishment in 1989. Based on rigorous research and objective analysis, CDI is committed to providing innovative and pragmatic reports for governments at different levels in China and corporations at home and abroad.
The authors of this report, Mike Wardle and Professor Michael Mainelli, would like to thank Bikash Kharel, Carol Feng, Peng Yu, and the rest of the GFCI team for their contributions with research, modelling, and ideas.
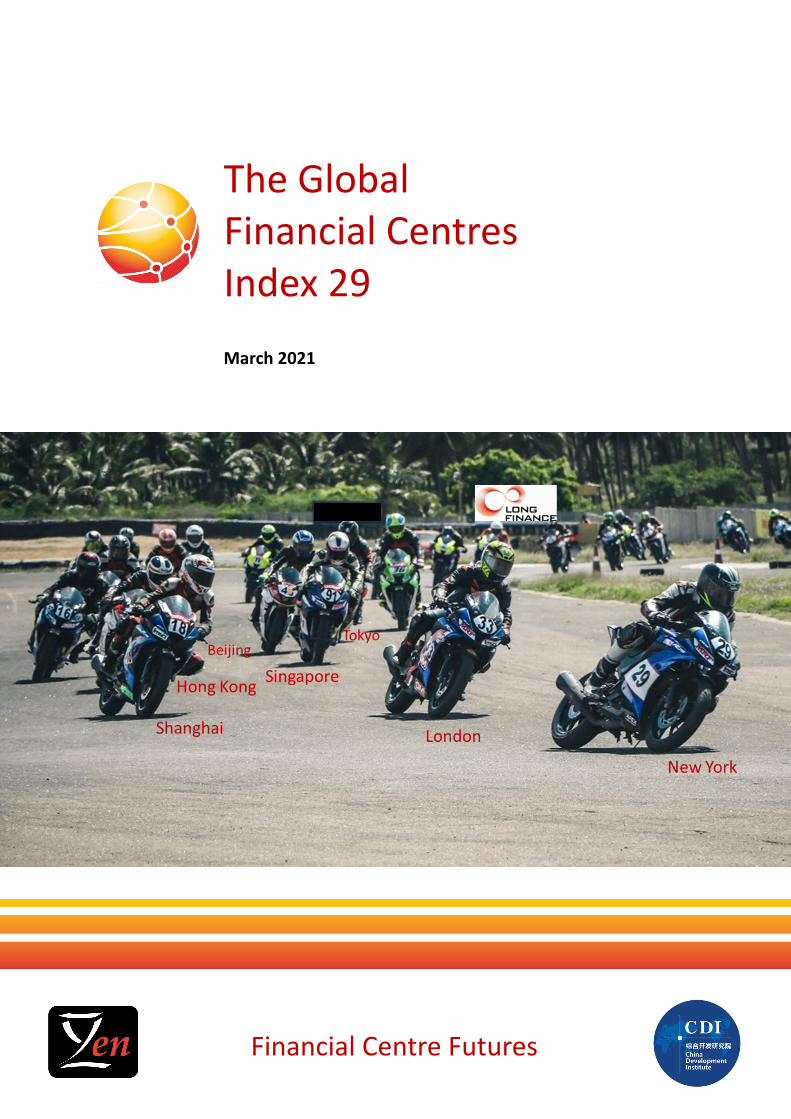
Cover Photo by Vikram Sundaramoorthy on Unsplash
The Global Financial Centres Index 29
1
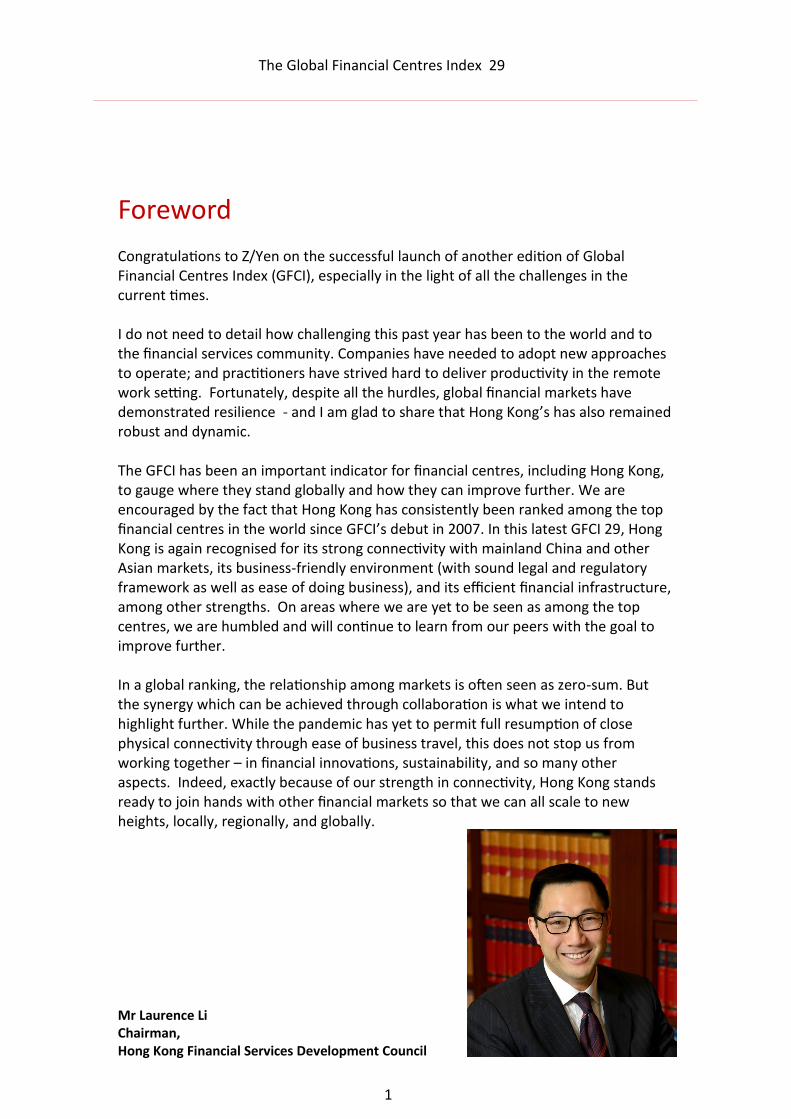
Foreword Congratulations to Z/Yen on the successful launch of another edition of Global Financial Centres Index (GFCI), especially in the light of all the challenges in the current times. I do not need to detail how challenging this past year has been to the world and to the financial services community. Companies have needed to adopt new approaches to operate; and practitioners have strived hard to deliver productivity in the remote work setting. Fortunately, despite all the hurdles, global financial markets have demonstrated resilience - and I am glad to share that Hong Kong’s has also remained robust and dynamic. The GFCI has been an important indicator for financial centres, including Hong Kong, to gauge where they stand globally and how they can improve further. We are encouraged by the fact that Hong Kong has consistently been ranked among the top financial centres in the world since GFCI’s debut in 2007. In this latest GFCI 29, Hong Kong is again recognised for its strong connectivity with mainland China and other Asian markets, its business-friendly environment (with sound legal and regulatory framework as well as ease of doing business), and its efficient financial infrastructure, among other strengths. On areas where we are yet to be seen as among the top centres, we are humbled and will continue to learn from our peers with the goal to improve further. In a global ranking, the relationship among markets is often seen as zero-sum. But the synergy which can be achieved through collaboration is what we intend to highlight further. While the pandemic has yet to permit full resumption of close physical connectivity through ease of business travel, this does not stop us from working together – in financial innovations, sustainability, and so many other aspects. Indeed, exactly because of our strength in connectivity, Hong Kong stands ready to join hands with other financial markets so that we can all scale to new heights, locally, regionally, and globally. Mr Laurence Li Chairman, Hong Kong Financial Services Development Council
The Global Financial Centres Index 29
2
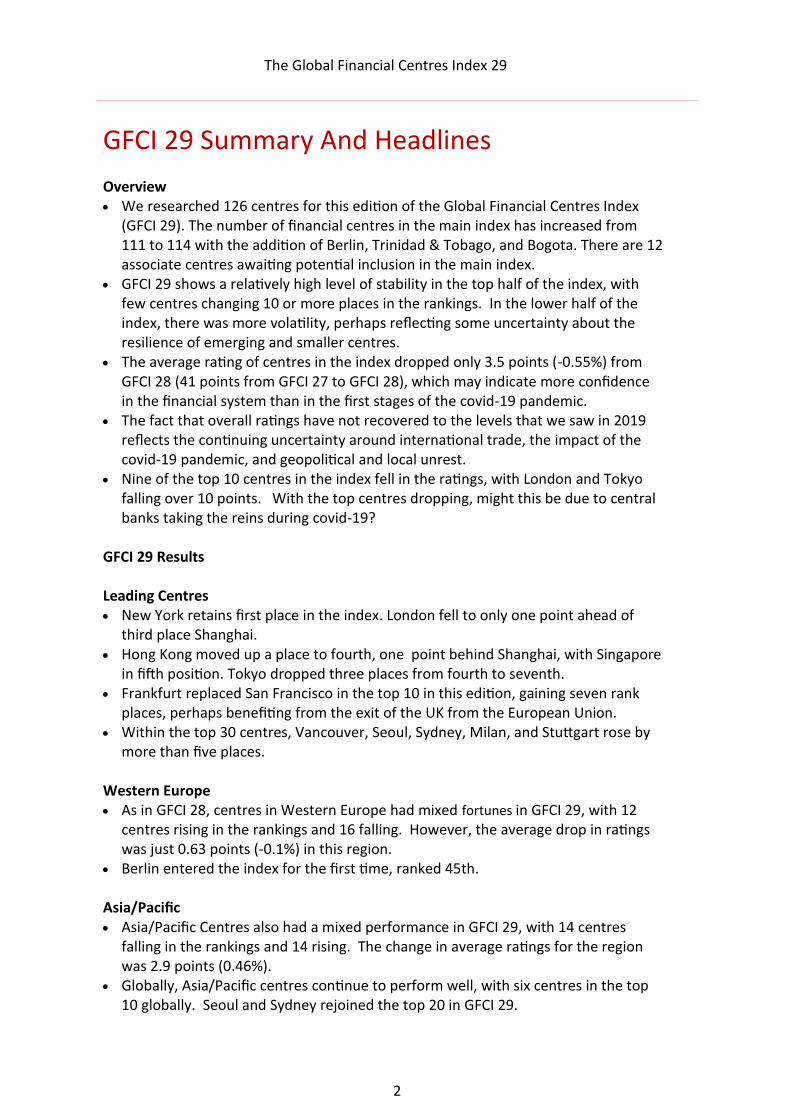
GFCI 29 Summary And Headlines Overview • We researched 126 centres for this edition of the Global Financial Centres Index
(GFCI 29). The number of financial centres in the main index has increased from 111 to 114 with the addition of Berlin, Trinidad & Tobago, and Bogota. There are 12 associate centres awaiting potential inclusion in the main index.
• GFCI 29 shows a relatively high level of stability in the top half of the index, with few centres changing 10 or more places in the rankings. In the lower half of the index, there was more volatility, perhaps reflecting some uncertainty about the resilience of emerging and smaller centres.
• The average rating of centres in the index dropped only 3.5 points (-0.55%) from GFCI 28 (41 points from GFCI 27 to GFCI 28), which may indicate more confidence in the financial system than in the first stages of the covid-19 pandemic.
• The fact that overall ratings have not recovered to the levels that we saw in 2019 reflects the continuing uncertainty around international trade, the impact of the covid-19 pandemic, and geopolitical and local unrest.
• Nine of the top 10 centres in the index fell in the ratings, with London and Tokyo falling over 10 points. With the top centres dropping, might this be due to central banks taking the reins during covid-19?
GFCI 29 Results Leading Centres • New York retains first place in the index. London fell to only one point ahead of
third place Shanghai. • Hong Kong moved up a place to fourth, one point behind Shanghai, with Singapore
in fifth position. Tokyo dropped three places from fourth to seventh. • Frankfurt replaced San Francisco in the top 10 in this edition, gaining seven rank
places, perhaps benefiting from the exit of the UK from the European Union. • Within the top 30 centres, Vancouver, Seoul, Sydney, Milan, and Stuttgart rose by
more than five places. Western Europe • As in GFCI 28, centres in Western Europe had mixed fortunes in GFCI 29, with 12
centres rising in the rankings and 16 falling. However, the average drop in ratings was just 0.63 points (-0.1%) in this region.
• Berlin entered the index for the first time, ranked 45th. Asia/Pacific • Asia/Pacific Centres also had a mixed performance in GFCI 29, with 14 centres
falling in the rankings and 14 rising. The change in average ratings for the region was 2.9 points (0.46%).
• Globally, Asia/Pacific centres continue to perform well, with six centres in the top 10 globally. Seoul and Sydney rejoined the top 20 in GFCI 29.
The Global Financial Centres Index 29
3
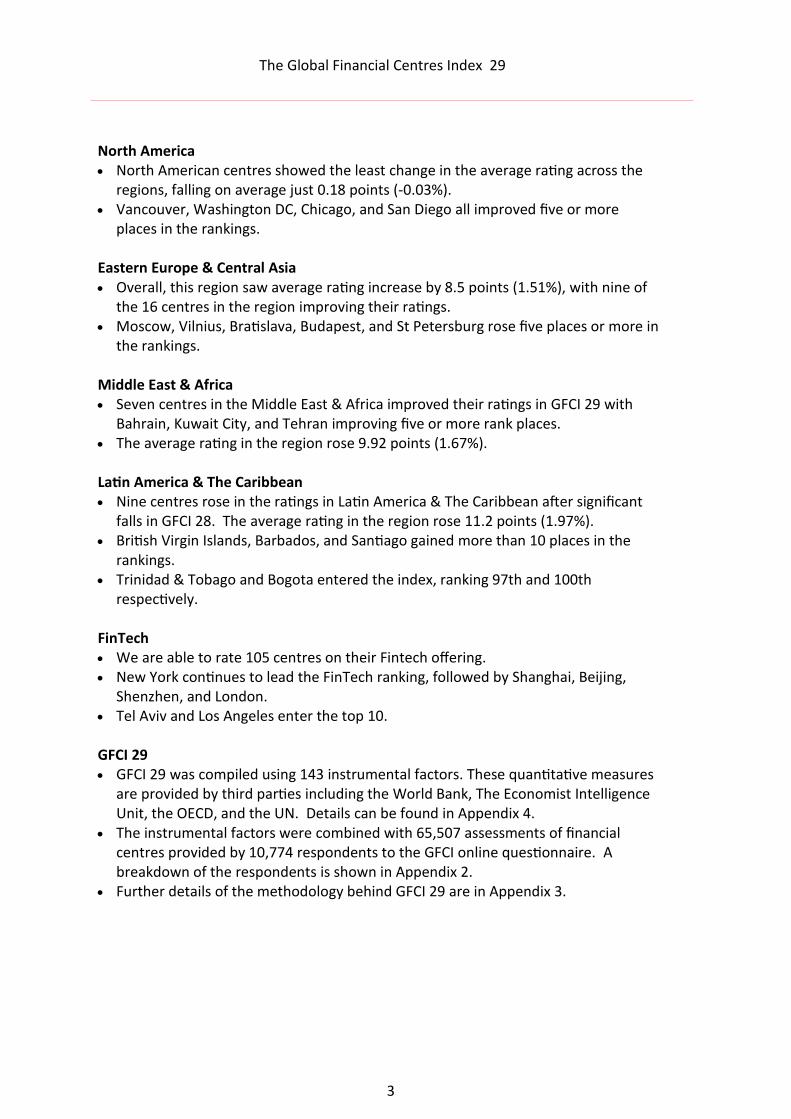
North America • North American centres showed the least change in the average rating across the
regions, falling on average just 0.18 points (-0.03%). • Vancouver, Washington DC, Chicago, and San Diego all improved five or more
places in the rankings. Eastern Europe & Central Asia • Overall, this region saw average rating increase by 8.5 points (1.51%), with nine of
the 16 centres in the region improving their ratings. • Moscow, Vilnius, Bratislava, Budapest, and St Petersburg rose five places or more in
the rankings. Middle East & Africa • Seven centres in the Middle East & Africa improved their ratings in GFCI 29 with
Bahrain, Kuwait City, and Tehran improving five or more rank places. • The average rating in the region rose 9.92 points (1.67%). Latin America & The Caribbean • Nine centres rose in the ratings in Latin America & The Caribbean after significant
falls in GFCI 28. The average rating in the region rose 11.2 points (1.97%). • British Virgin Islands, Barbados, and Santiago gained more than 10 places in the
rankings. • Trinidad & Tobago and Bogota entered the index, ranking 97th and 100th
respectively. FinTech • We are able to rate 105 centres on their Fintech offering. • New York continues to lead the FinTech ranking, followed by Shanghai, Beijing,
Shenzhen, and London. • Tel Aviv and Los Angeles enter the top 10. GFCI 29 • GFCI 29 was compiled using 143 instrumental factors. These quantitative measures
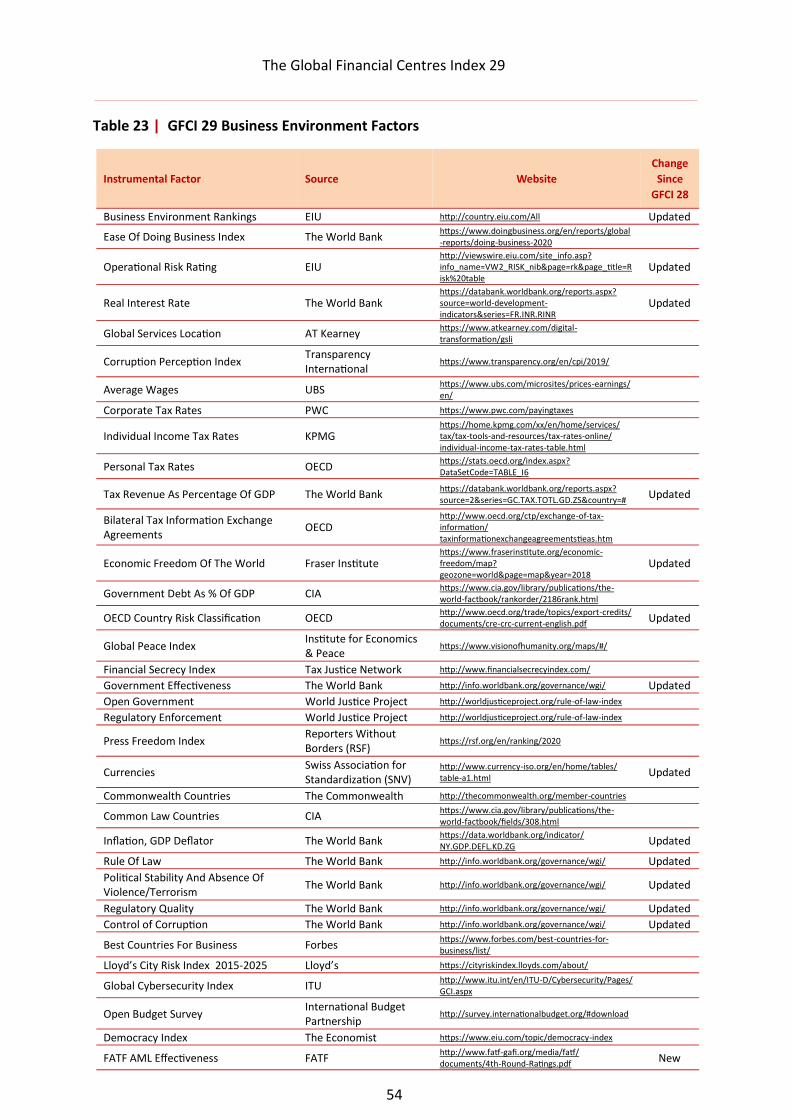
are provided by third parties including the World Bank, The Economist Intelligence Unit, the OECD, and the UN. Details can be found in Appendix 4.
• The instrumental factors were combined with 65,507 assessments of financial centres provided by 10,774 respondents to the GFCI online questionnaire. A breakdown of the respondents is shown in Appendix 2.
• Further details of the methodology behind GFCI 29 are in Appendix 3.
The Global Financial Centres Index 29
4
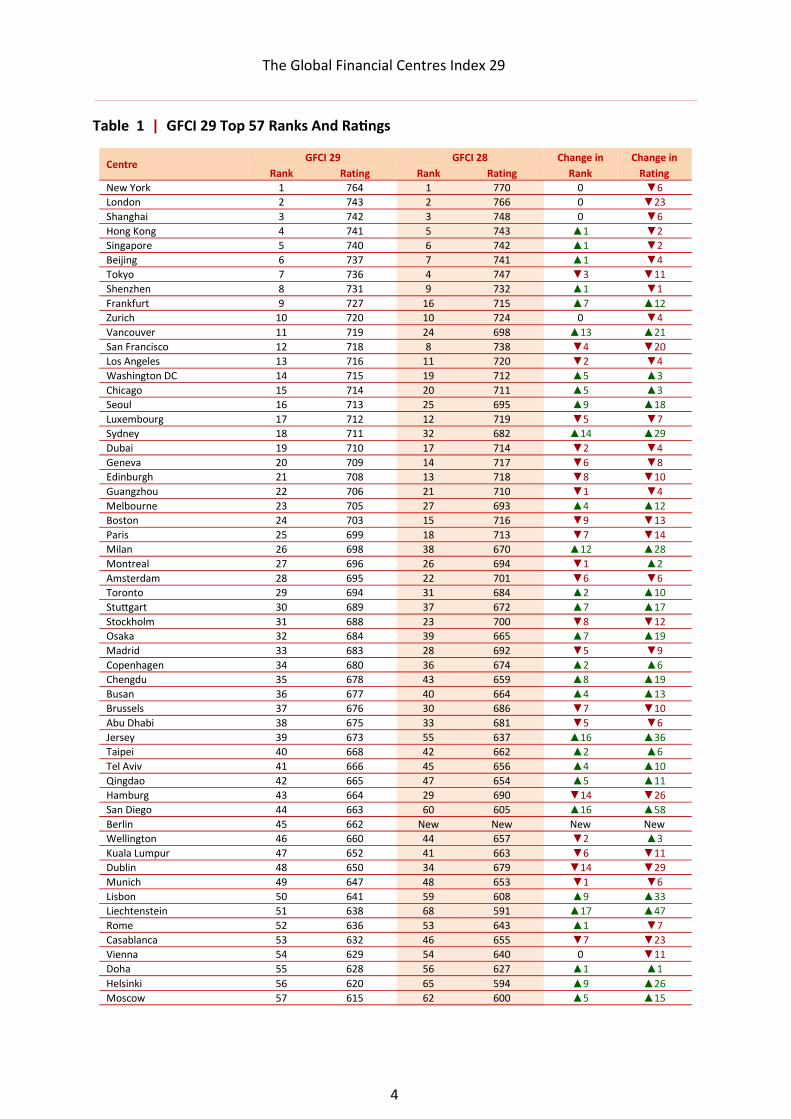
Table 1 | GFCI 29 Top 57 Ranks And Ratings
Centre GFCI 29 GFCI 28 Change in Change in
Rank Rating Rank Rating Rank Rating
New York 1 764 1 770 0 ▼6
London 2 743 2 766 0 ▼23
Shanghai 3 742 3 748 0 ▼6
Hong Kong 4 741 5 743 ▲1 ▼2
Singapore 5 740 6 742 ▲1 ▼2
Beijing 6 737 7 741 ▲1 ▼4
Tokyo 7 736 4 747 ▼3 ▼11
Shenzhen 8 731 9 732 ▲1 ▼1
Frankfurt 9 727 16 715 ▲7 ▲12
Zurich 10 720 10 724 0 ▼4
Vancouver 11 719 24 698 ▲13 ▲21
San Francisco 12 718 8 738 ▼4 ▼20
Los Angeles 13 716 11 720 ▼2 ▼4
Washington DC 14 715 19 712 ▲5 ▲3
Chicago 15 714 20 711 ▲5 ▲3
Seoul 16 713 25 695 ▲9 ▲18
Luxembourg 17 712 12 719 ▼5 ▼7
Sydney 18 711 32 682 ▲14 ▲29
Dubai 19 710 17 714 ▼2 ▼4
Geneva 20 709 14 717 ▼6 ▼8
Edinburgh 21 708 13 718 ▼8 ▼10
Guangzhou 22 706 21 710 ▼1 ▼4
Melbourne 23 705 27 693 ▲4 ▲12
Boston 24 703 15 716 ▼9 ▼13
Paris 25 699 18 713 ▼7 ▼14
Milan 26 698 38 670 ▲12 ▲28
Montreal 27 696 26 694 ▼1 ▲2
Amsterdam 28 695 22 701 ▼6 ▼6
Toronto 29 694 31 684 ▲2 ▲10
Stuttgart 30 689 37 672 ▲7 ▲17
Stockholm 31 688 23 700 ▼8 ▼12
Osaka 32 684 39 665 ▲7 ▲19
Madrid 33 683 28 692 ▼5 ▼9
Copenhagen 34 680 36 674 ▲2 ▲6
Chengdu 35 678 43 659 ▲8 ▲19
Busan 36 677 40 664 ▲4 ▲13
Brussels 37 676 30 686 ▼7 ▼10
Abu Dhabi 38 675 33 681 ▼5 ▼6
Jersey 39 673 55 637 ▲16 ▲36
Taipei 40 668 42 662 ▲2 ▲6
Tel Aviv 41 666 45 656 ▲4 ▲10
Qingdao 42 665 47 654 ▲5 ▲11
Hamburg 43 664 29 690 ▼14 ▼26
San Diego 44 663 60 605 ▲16 ▲58
Berlin 45 662 New New New New
Wellington 46 660 44 657 ▼2 ▲3
Kuala Lumpur 47 652 41 663 ▼6 ▼11
Dublin 48 650 34 679 ▼14 ▼29
Munich 49 647 48 653 ▼1 ▼6
Lisbon 50 641 59 608 ▲9 ▲33
Liechtenstein 51 638 68 591 ▲17 ▲47
Rome 52 636 53 643 ▲1 ▼7
Casablanca 53 632 46 655 ▼7 ▼23
Vienna 54 629 54 640 0 ▼11
Doha 55 628 56 627 ▲1 ▲1
Helsinki 56 620 65 594 ▲9 ▲26
Moscow 57 615 62 600 ▲5 ▲15
The Global Financial Centres Index 29
5
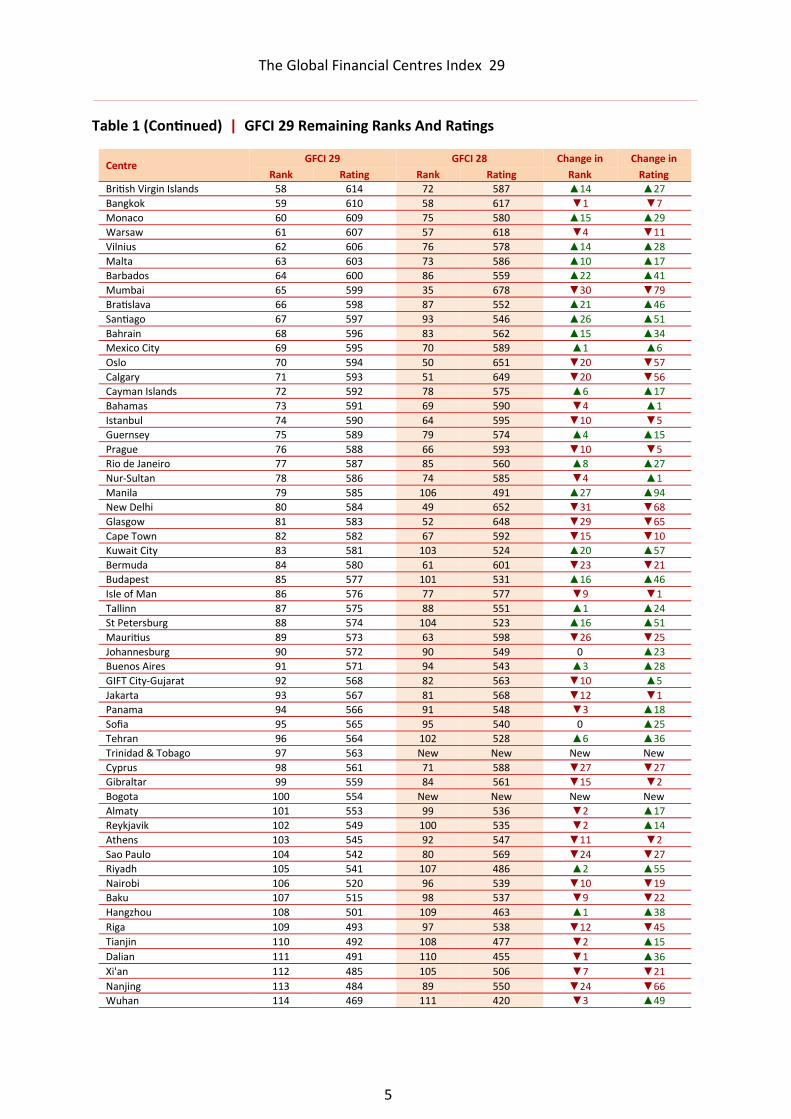
Table 1 (Continued) | GFCI 29 Remaining Ranks And Ratings
Centre GFCI 29 GFCI 28 Change in Change in
Rank Rating Rank Rating Rank Rating
British Virgin Islands 58 614 72 587 ▲14 ▲27
Bangkok 59 610 58 617 ▼1 ▼7
Monaco 60 609 75 580 ▲15 ▲29
Warsaw 61 607 57 618 ▼4 ▼11
Vilnius 62 606 76 578 ▲14 ▲28
Malta 63 603 73 586 ▲10 ▲17
Barbados 64 600 86 559 ▲22 ▲41
Mumbai 65 599 35 678 ▼30 ▼79
Bratislava 66 598 87 552 ▲21 ▲46
Santiago 67 597 93 546 ▲26 ▲51
Bahrain 68 596 83 562 ▲15 ▲34
Mexico City 69 595 70 589 ▲1 ▲6
Oslo 70 594 50 651 ▼20 ▼57
Calgary 71 593 51 649 ▼20 ▼56
Cayman Islands 72 592 78 575 ▲6 ▲17
Bahamas 73 591 69 590 ▼4 ▲1
Istanbul 74 590 64 595 ▼10 ▼5
Guernsey 75 589 79 574 ▲4 ▲15
Prague 76 588 66 593 ▼10 ▼5
Rio de Janeiro 77 587 85 560 ▲8 ▲27
Nur-Sultan 78 586 74 585 ▼4 ▲1
Manila 79 585 106 491 ▲27 ▲94
New Delhi 80 584 49 652 ▼31 ▼68
Glasgow 81 583 52 648 ▼29 ▼65
Cape Town 82 582 67 592 ▼15 ▼10
Kuwait City 83 581 103 524 ▲20 ▲57
Bermuda 84 580 61 601 ▼23 ▼21
Budapest 85 577 101 531 ▲16 ▲46
Isle of Man 86 576 77 577 ▼9 ▼1
Tallinn 87 575 88 551 ▲1 ▲24
St Petersburg 88 574 104 523 ▲16 ▲51
Mauritius 89 573 63 598 ▼26 ▼25
Johannesburg 90 572 90 549 0 ▲23
Buenos Aires 91 571 94 543 ▲3 ▲28
GIFT City-Gujarat 92 568 82 563 ▼10 ▲5
Jakarta 93 567 81 568 ▼12 ▼1
Panama 94 566 91 548 ▼3 ▲18
Sofia 95 565 95 540 0 ▲25
Tehran 96 564 102 528 ▲6 ▲36
Trinidad & Tobago 97 563 New New New New
Cyprus 98 561 71 588 ▼27 ▼27
Gibraltar 99 559 84 561 ▼15 ▼2
Bogota 100 554 New New New New
Almaty 101 553 99 536 ▼2 ▲17
Reykjavik 102 549 100 535 ▼2 ▲14
Athens 103 545 92 547 ▼11 ▼2
Sao Paulo 104 542 80 569 ▼24 ▼27
Riyadh 105 541 107 486 ▲2 ▲55
Nairobi 106 520 96 539 ▼10 ▼19
Baku 107 515 98 537 ▼9 ▼22
Hangzhou 108 501 109 463 ▲1 ▲38
Riga 109 493 97 538 ▼12 ▼45
Tianjin 110 492 108 477 ▼2 ▲15
Dalian 111 491 110 455 ▼1 ▲36
Xi'an 112 485 105 506 ▼7 ▼21
Nanjing 113 484 89 550 ▼24 ▼66
Wuhan 114 469 111 420 ▼3 ▲49
The Global Financial Centres Index 29
6
Table 2 | GFCI 29 Associate Centres
Regional Performance
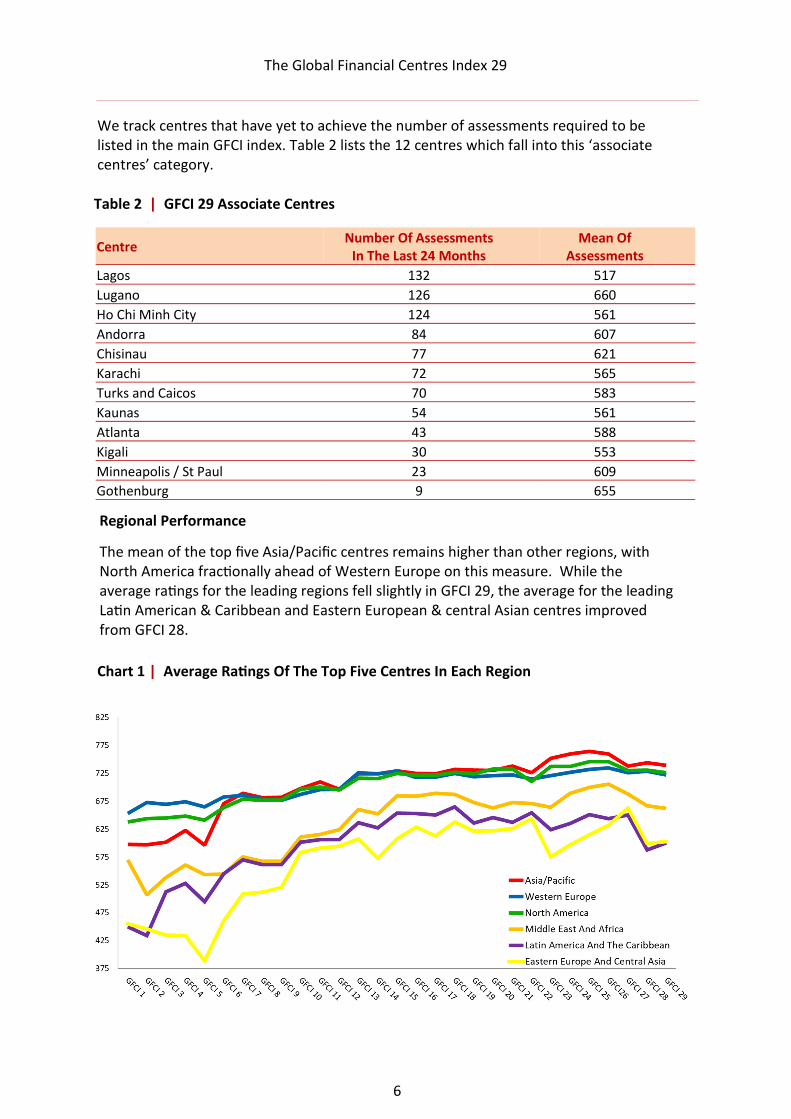
The mean of the top five Asia/Pacific centres remains higher than other regions, with North America fractionally ahead of Western Europe on this measure. While the average ratings for the leading regions fell slightly in GFCI 29, the average for the leading Latin American & Caribbean and Eastern European & central Asian centres improved from GFCI 28.
We track centres that have yet to achieve the number of assessments required to be listed in the main GFCI index. Table 2 lists the 12 centres which fall into this ‘associate centres’ category.
Chart 1 | Average Ratings Of The Top Five Centres In Each Region
Centre Number Of Assessments
In The Last 24 Months Mean Of
Assessments
Lagos 132 517
Lugano 126 660
Ho Chi Minh City 124 561
Andorra 84 607
Chisinau 77 621
Karachi 72 565
Turks and Caicos 70 583
Kaunas 54 561
Atlanta 43 588
Kigali 30 553
Minneapolis / St Paul 23 609
Gothenburg 9 655
The Global Financial Centres Index 29
7
The Top Five Centres
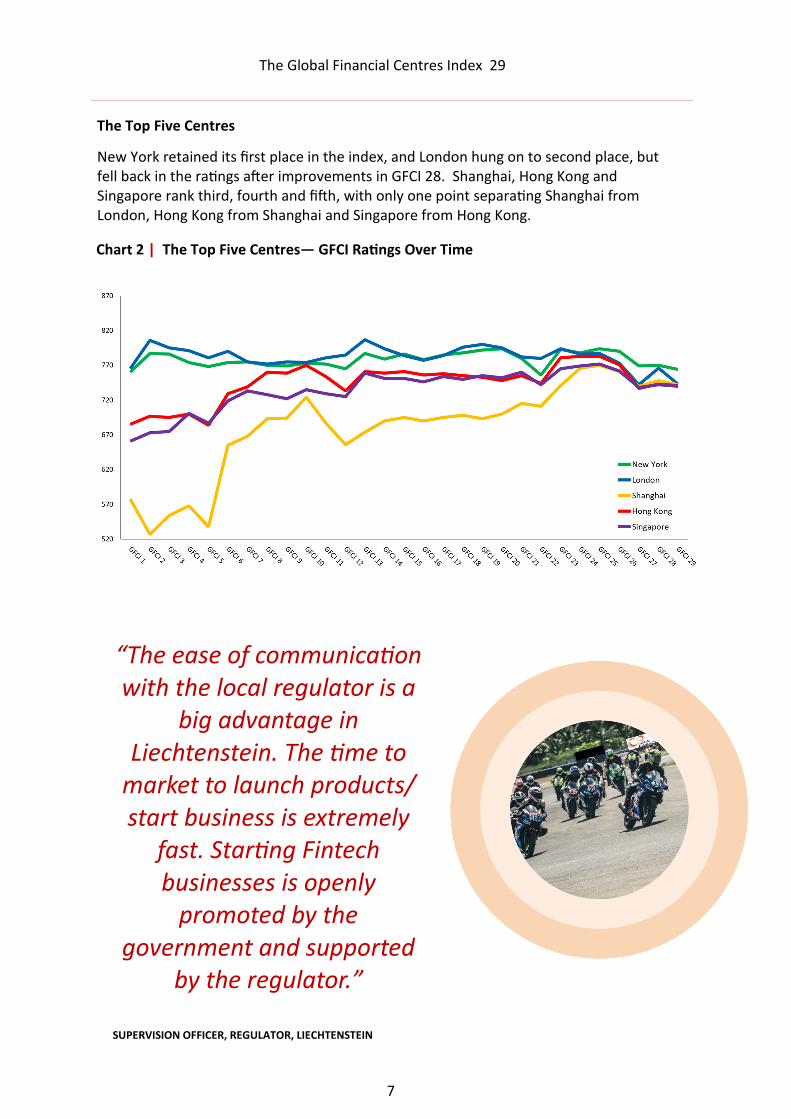
New York retained its first place in the index, and London hung on to second place, but fell back in the ratings after improvements in GFCI 28. Shanghai, Hong Kong and Singapore rank third, fourth and fifth, with only one point separating Shanghai from London, Hong Kong from Shanghai and Singapore from Hong Kong.
Chart 2 | The Top Five Centres— GFCI Ratings Over Time
“The ease of communication with the local regulator is a
big advantage in Liechtenstein. The time to
market to launch products/start business is extremely
fast. Starting Fintech businesses is openly
promoted by the government and supported
by the regulator.”
SUPERVISION OFFICER, REGULATOR, LIECHTENSTEIN
The Global Financial Centres Index 29
8
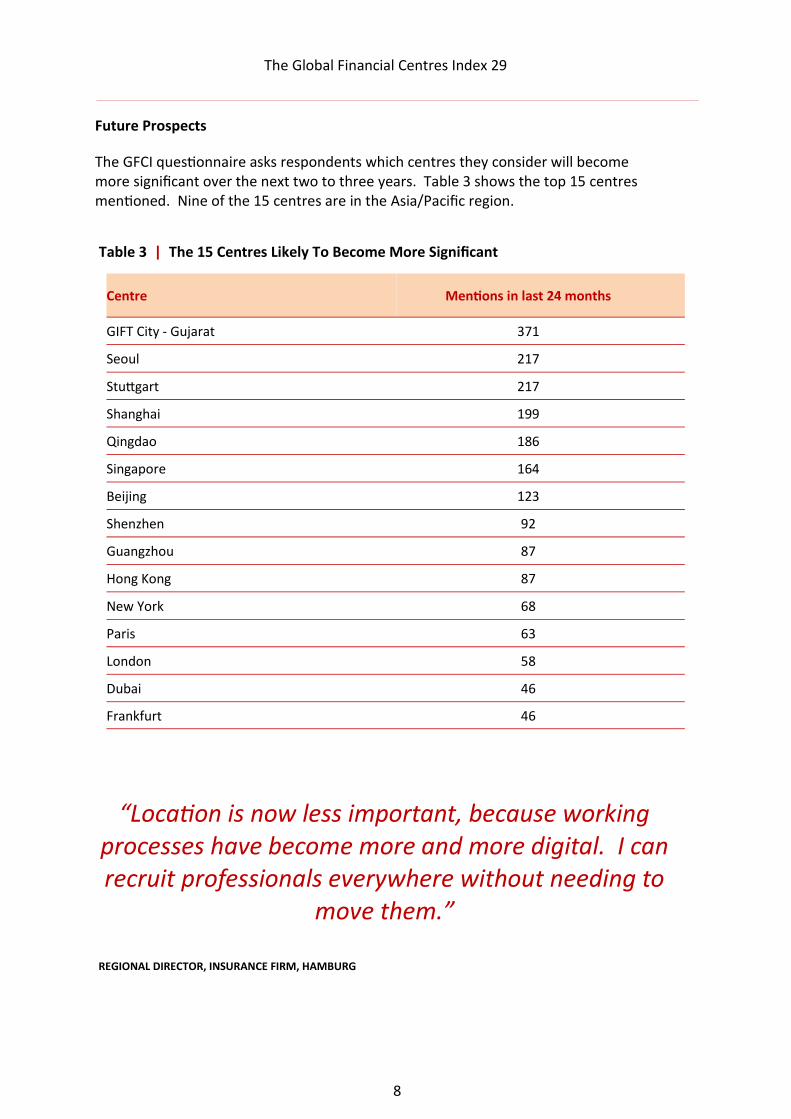
Future Prospects
The GFCI questionnaire asks respondents which centres they consider will become more significant over the next two to three years. Table 3 shows the top 15 centres mentioned. Nine of the 15 centres are in the Asia/Pacific region.
Table 3 | The 15 Centres Likely To Become More Significant
“Location is now less important, because working processes have become more and more digital. I can recruit professionals everywhere without needing to
move them.”
REGIONAL DIRECTOR, INSURANCE FIRM, HAMBURG
Centre Mentions in last 24 months
GIFT City - Gujarat 371
Seoul 217
Stuttgart 217
Shanghai 199
Qingdao 186
Singapore 164
Beijing 123
Shenzhen 92
Guangzhou 87
Hong Kong 87
New York 68
Paris 63
London 58
Dubai 46
Frankfurt 46
The Global Financial Centres Index 29
9
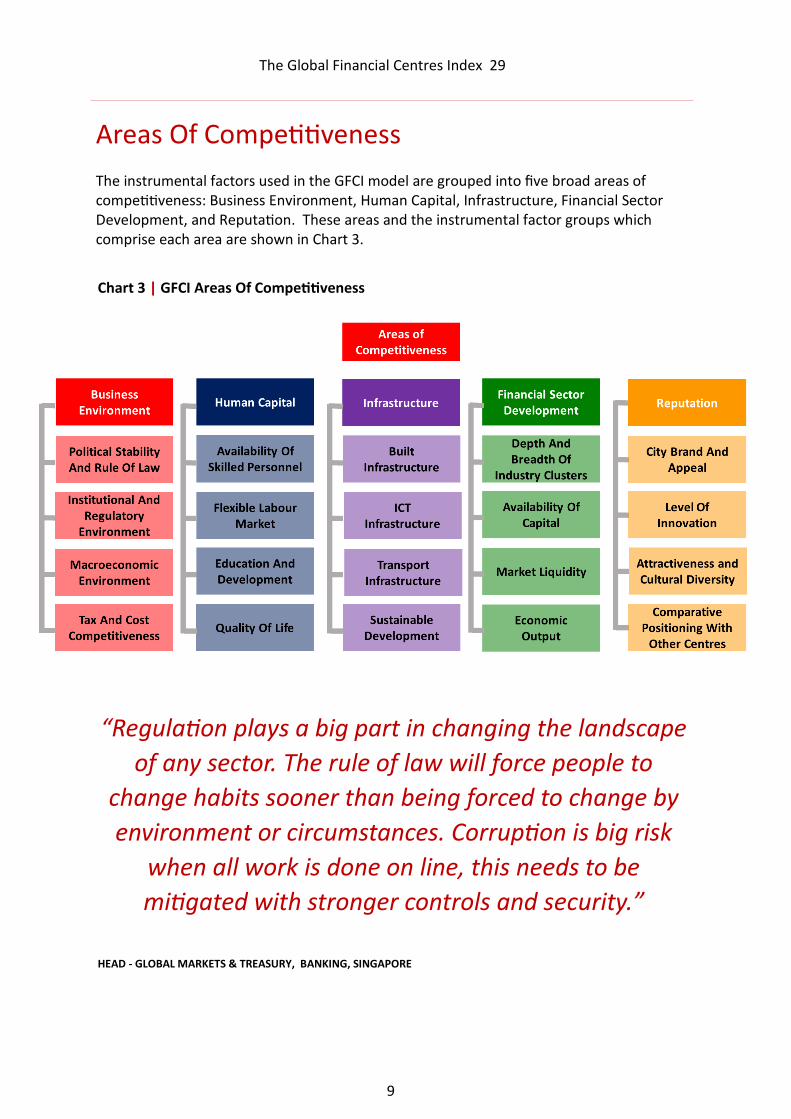
Areas Of Competitiveness The instrumental factors used in the GFCI model are grouped into five broad areas of competitiveness: Business Environment, Human Capital, Infrastructure, Financial Sector Development, and Reputation. These areas and the instrumental factor groups which comprise each area are shown in Chart 3.
Chart 3 | GFCI Areas Of Competitiveness
“Regulation plays a big part in changing the landscape
of any sector. The rule of law will force people to
change habits sooner than being forced to change by
environment or circumstances. Corruption is big risk
when all work is done on line, this needs to be
mitigated with stronger controls and security.”
HEAD - GLOBAL MARKETS & TREASURY, BANKING, SINGAPORE
The Global Financial Centres Index 29
10
Table 4 | GFCI 29 Top 15 Centres By Area Of Competitiveness
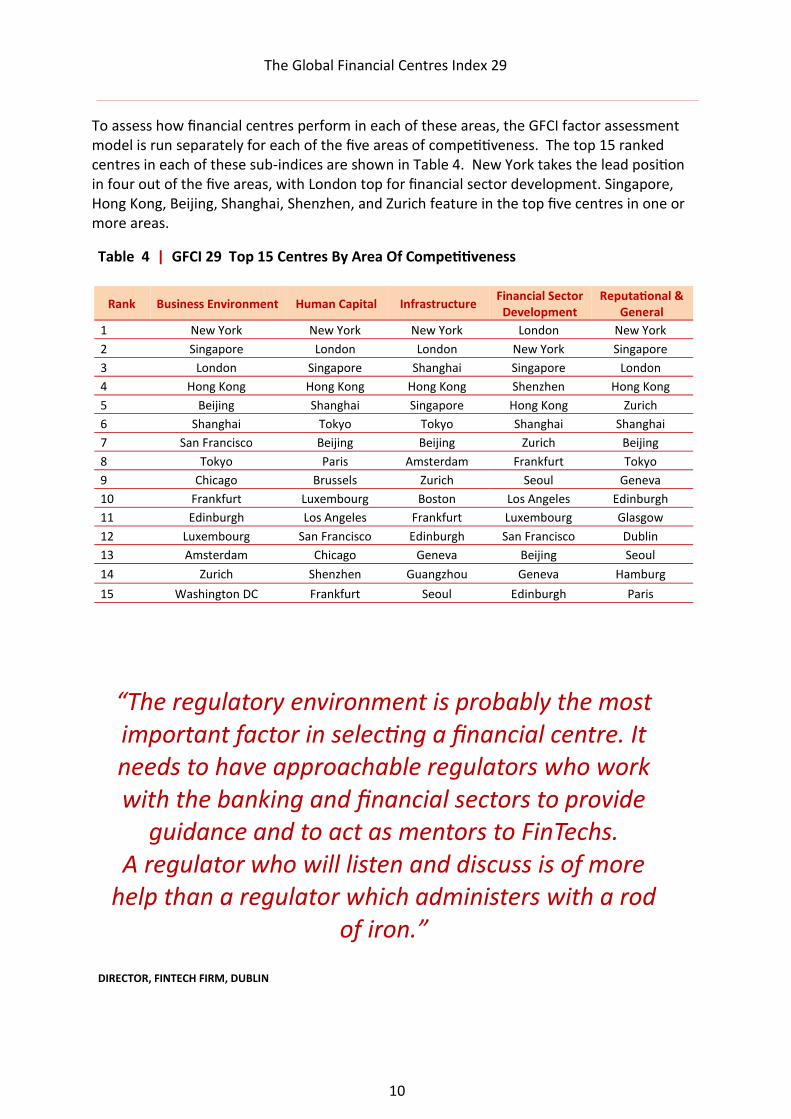
To assess how financial centres perform in each of these areas, the GFCI factor assessment model is run separately for each of the five areas of competitiveness. The top 15 ranked centres in each of these sub-indices are shown in Table 4. New York takes the lead position in four out of the five areas, with London top for financial sector development. Singapore, Hong Kong, Beijing, Shanghai, Shenzhen, and Zurich feature in the top five centres in one or more areas.
“The regulatory environment is probably the most important factor in selecting a financial centre. It needs to have approachable regulators who work with the banking and financial sectors to provide
guidance and to act as mentors to FinTechs. A regulator who will listen and discuss is of more
help than a regulator which administers with a rod of iron.”
DIRECTOR, FINTECH FIRM, DUBLIN
Rank Business Environment Human Capital Infrastructure Financial Sector
Development Reputational &
General
1 New York New York New York London New York
2 Singapore London London New York Singapore
3 London Singapore Shanghai Singapore London
4 Hong Kong Hong Kong Hong Kong Shenzhen Hong Kong
5 Beijing Shanghai Singapore Hong Kong Zurich
6 Shanghai Tokyo Tokyo Shanghai Shanghai
7 San Francisco Beijing Beijing Zurich Beijing
8 Tokyo Paris Amsterdam Frankfurt Tokyo
9 Chicago Brussels Zurich Seoul Geneva
10 Frankfurt Luxembourg Boston Los Angeles Edinburgh
11 Edinburgh Los Angeles Frankfurt Luxembourg Glasgow
12 Luxembourg San Francisco Edinburgh San Francisco Dublin
13 Amsterdam Chicago Geneva Beijing Seoul
14 Zurich Shenzhen Guangzhou Geneva Hamburg
15 Washington DC Frankfurt Seoul Edinburgh Paris
The Global Financial Centres Index 29
11
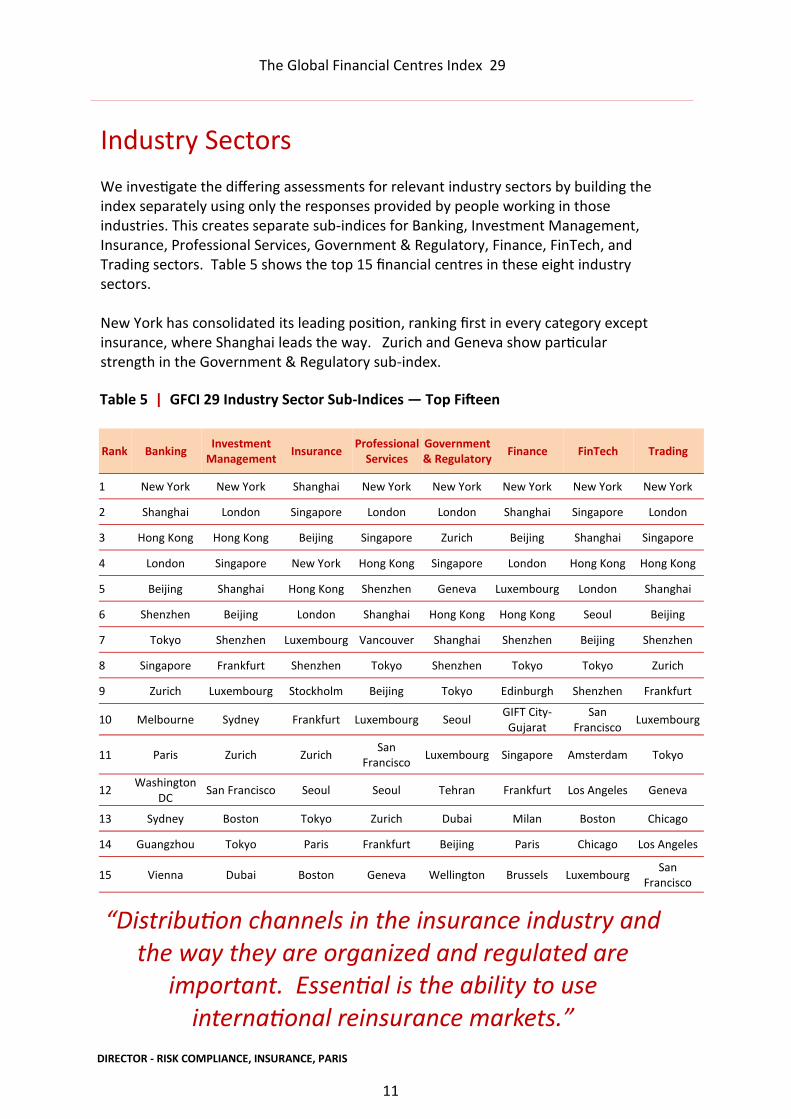
Industry Sectors We investigate the differing assessments for relevant industry sectors by building the index separately using only the responses provided by people working in those industries. This creates separate sub-indices for Banking, Investment Management, Insurance, Professional Services, Government & Regulatory, Finance, FinTech, and Trading sectors. Table 5 shows the top 15 financial centres in these eight industry sectors. New York has consolidated its leading position, ranking first in every category except insurance, where Shanghai leads the way. Zurich and Geneva show particular strength in the Government & Regulatory sub-index.
Table 5 | GFCI 29 Industry Sector Sub-Indices — Top Fifteen
Rank Banking Investment
Management Insurance
Professional Services
Government & Regulatory
Finance FinTech Trading
1 New York New York Shanghai New York New York New York New York New York
2 Shanghai London Singapore London London Shanghai Singapore London
3 Hong Kong Hong Kong Beijing Singapore Zurich Beijing Shanghai Singapore
4 London Singapore New York Hong Kong Singapore London Hong Kong Hong Kong
5 Beijing Shanghai Hong Kong Shenzhen Geneva Luxembourg London Shanghai
6 Shenzhen Beijing London Shanghai Hong Kong Hong Kong Seoul Beijing
7 Tokyo Shenzhen Luxembourg Vancouver Shanghai Shenzhen Beijing Shenzhen
8 Singapore Frankfurt Shenzhen Tokyo Shenzhen Tokyo Tokyo Zurich
9 Zurich Luxembourg Stockholm Beijing Tokyo Edinburgh Shenzhen Frankfurt
10 Melbourne Sydney Frankfurt Luxembourg Seoul GIFT City-Gujarat
San Francisco
Luxembourg
11 Paris Zurich Zurich San
Francisco Luxembourg Singapore Amsterdam Tokyo
12 Washington
DC San Francisco Seoul Seoul Tehran Frankfurt Los Angeles Geneva
13 Sydney Boston Tokyo Zurich Dubai Milan Boston Chicago
14 Guangzhou Tokyo Paris Frankfurt Beijing Paris Chicago Los Angeles
15 Vienna Dubai Boston Geneva Wellington Brussels Luxembourg San
Francisco
“Distribution channels in the insurance industry and the way they are organized and regulated are
important. Essential is the ability to use international reinsurance markets.”
DIRECTOR - RISK COMPLIANCE, INSURANCE, PARIS
The Global Financial Centres Index 29
12
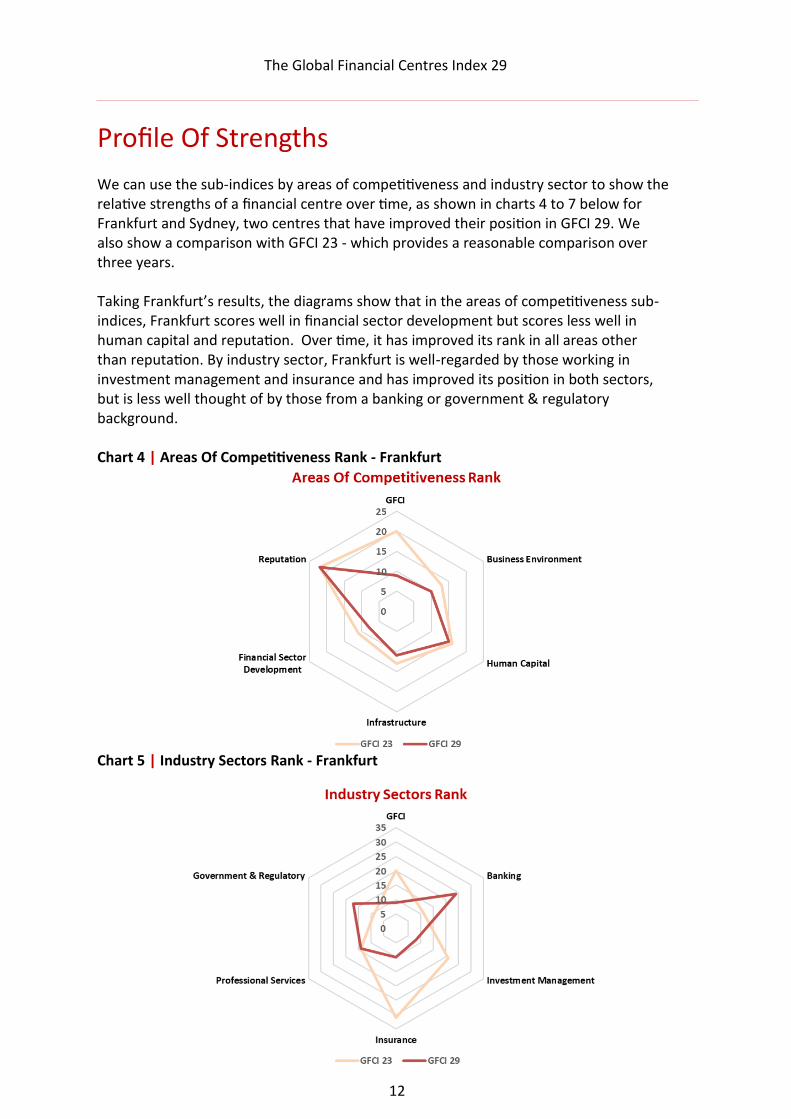
Profile Of Strengths We can use the sub-indices by areas of competitiveness and industry sector to show the relative strengths of a financial centre over time, as shown in charts 4 to 7 below for Frankfurt and Sydney, two centres that have improved their position in GFCI 29. We also show a comparison with GFCI 23 - which provides a reasonable comparison over three years. Taking Frankfurt’s results, the diagrams show that in the areas of competitiveness sub-indices, Frankfurt scores well in financial sector development but scores less well in human capital and reputation. Over time, it has improved its rank in all areas other than reputation. By industry sector, Frankfurt is well-regarded by those working in investment management and insurance and has improved its position in both sectors, but is less well thought of by those from a banking or government & regulatory background. Chart 4 | Areas Of Competitiveness Rank - Frankfurt
Chart 5 | Industry Sectors Rank - Frankfurt
The Global Financial Centres Index 29
13
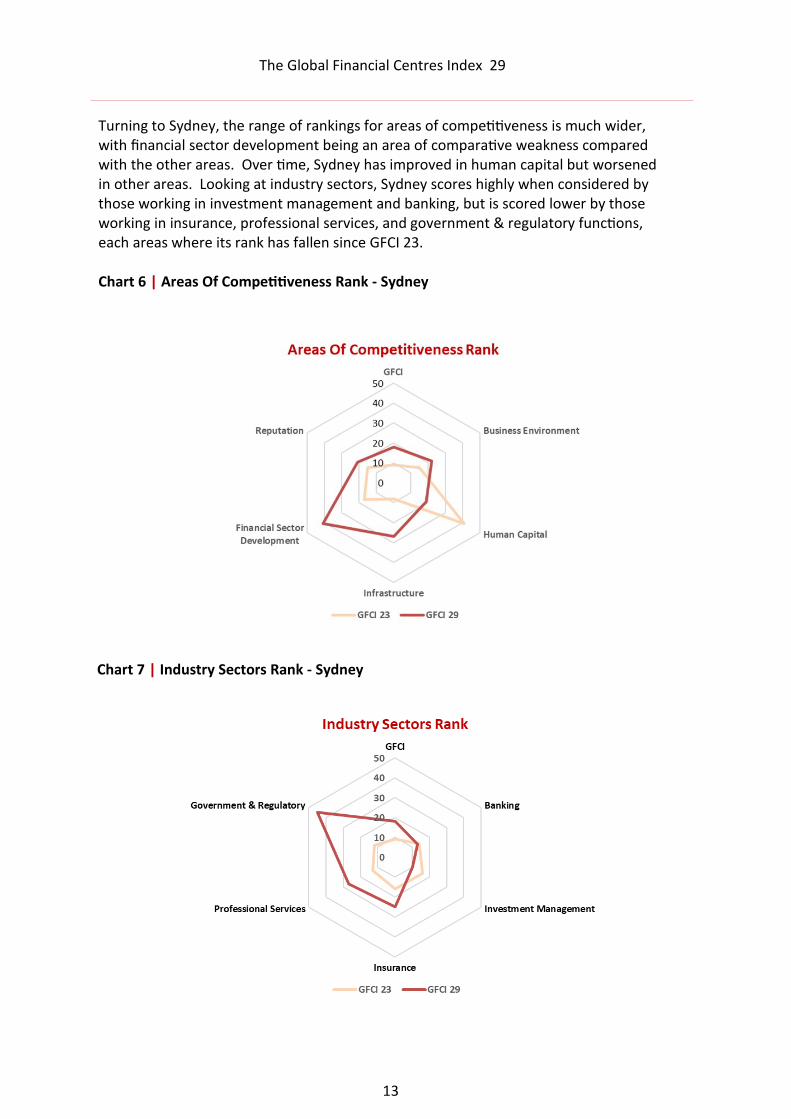
Turning to Sydney, the range of rankings for areas of competitiveness is much wider, with financial sector development being an area of comparative weakness compared with the other areas. Over time, Sydney has improved in human capital but worsened in other areas. Looking at industry sectors, Sydney scores highly when considered by those working in investment management and banking, but is scored lower by those working in insurance, professional services, and government & regulatory functions, each areas where its rank has fallen since GFCI 23. Chart 6 | Areas Of Competitiveness Rank - Sydney
Chart 7 | Industry Sectors Rank - Sydney
The Global Financial Centres Index 29
14
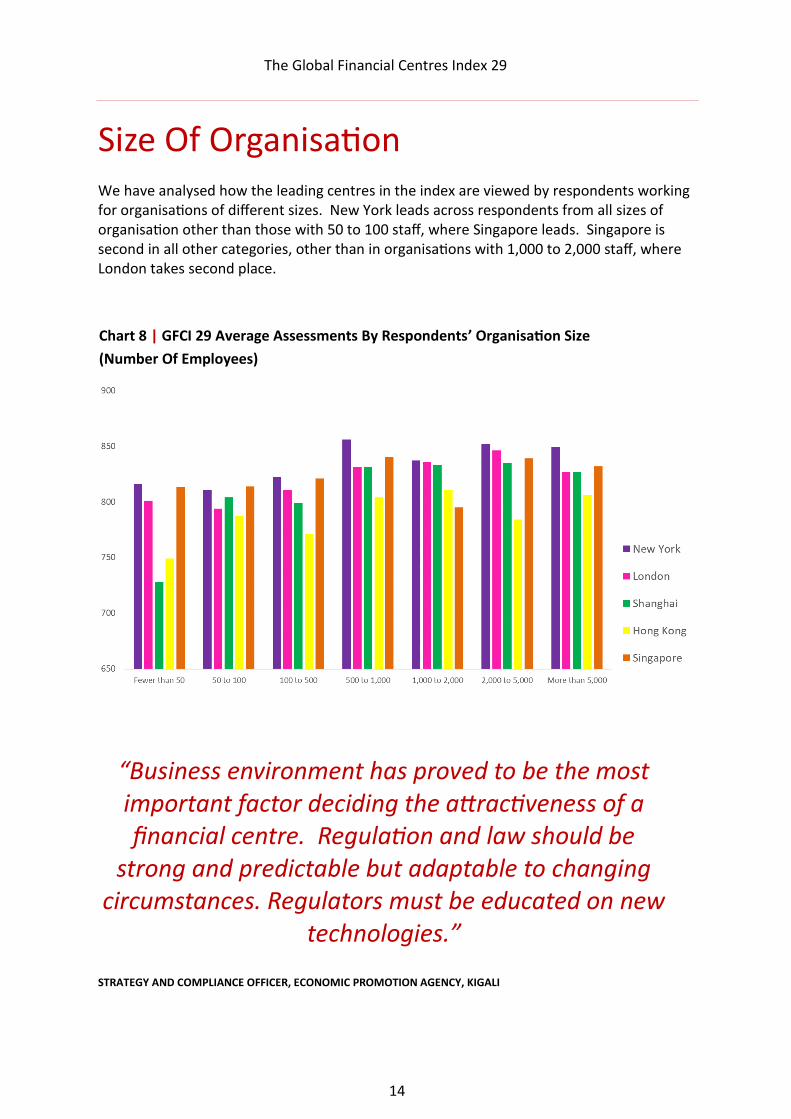
Size Of Organisation We have analysed how the leading centres in the index are viewed by respondents working for organisations of different sizes. New York leads across respondents from all sizes of organisation other than those with 50 to 100 staff, where Singapore leads. Singapore is second in all other categories, other than in organisations with 1,000 to 2,000 staff, where London takes second place.
Chart 8 | GFCI 29 Average Assessments By Respondents’ Organisation Size
(Number Of Employees)
“Business environment has proved to be the most important factor deciding the attractiveness of a financial centre. Regulation and law should be
strong and predictable but adaptable to changing circumstances. Regulators must be educated on new
technologies.”
STRATEGY AND COMPLIANCE OFFICER, ECONOMIC PROMOTION AGENCY, KIGALI
The Global Financial Centres Index 29
15
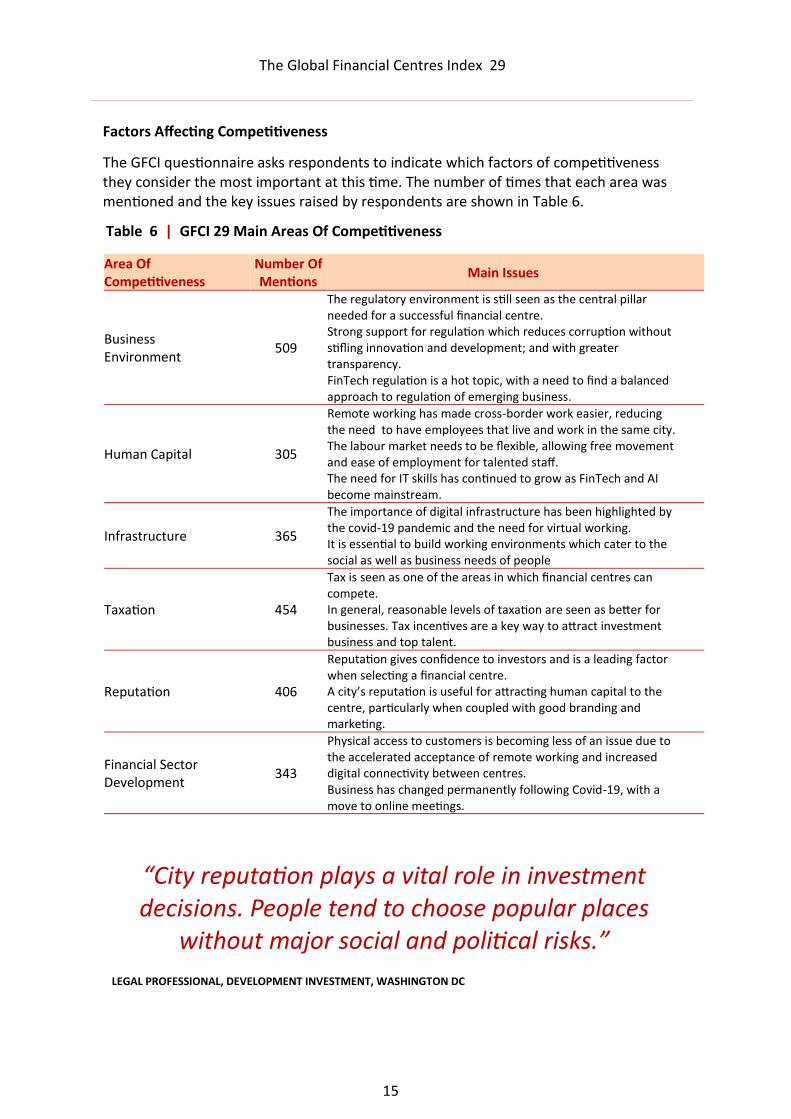
Factors Affecting Competitiveness
The GFCI questionnaire asks respondents to indicate which factors of competitiveness they consider the most important at this time. The number of times that each area was mentioned and the key issues raised by respondents are shown in Table 6.
Table 6 | GFCI 29 Main Areas Of Competitiveness
“City reputation plays a vital role in investment decisions. People tend to choose popular places
without major social and political risks.” LEGAL PROFESSIONAL, DEVELOPMENT INVESTMENT, WASHINGTON DC
Area Of Competitiveness
Number Of Mentions
Main Issues
Business Environment
509
The regulatory environment is still seen as the central pillar needed for a successful financial centre. Strong support for regulation which reduces corruption without stifling innovation and development; and with greater transparency. FinTech regulation is a hot topic, with a need to find a balanced approach to regulation of emerging business.
Human Capital 305
Remote working has made cross-border work easier, reducing the need to have employees that live and work in the same city. The labour market needs to be flexible, allowing free movement and ease of employment for talented staff. The need for IT skills has continued to grow as FinTech and AI become mainstream.
Infrastructure 365
The importance of digital infrastructure has been highlighted by the covid-19 pandemic and the need for virtual working. It is essential to build working environments which cater to the social as well as business needs of people
Taxation 454
Tax is seen as one of the areas in which financial centres can compete. In general, reasonable levels of taxation are seen as better for businesses. Tax incentives are a key way to attract investment business and top talent.
Reputation 406
Reputation gives confidence to investors and is a leading factor when selecting a financial centre. A city’s reputation is useful for attracting human capital to the centre, particularly when coupled with good branding and marketing.
Financial Sector Development
343
Physical access to customers is becoming less of an issue due to the accelerated acceptance of remote working and increased digital connectivity between centres. Business has changed permanently following Covid-19, with a move to online meetings.
The Global Financial Centres Index 29
16
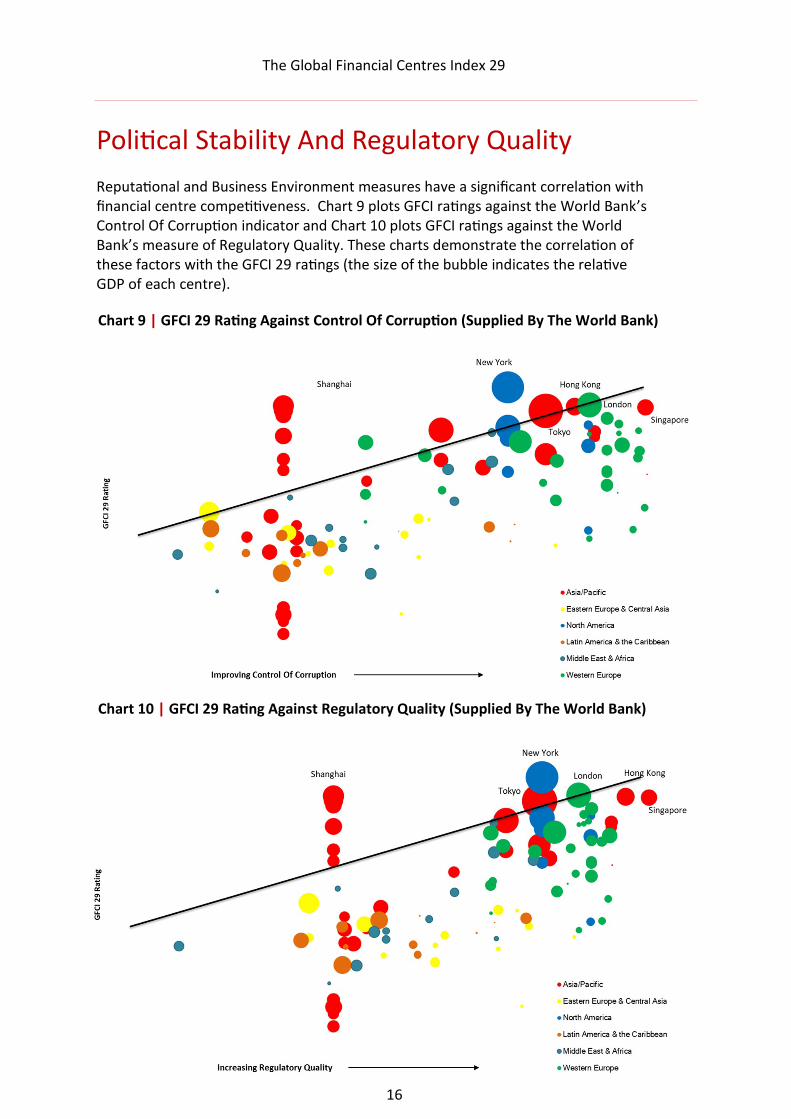
Political Stability And Regulatory Quality Reputational and Business Environment measures have a significant correlation with financial centre competitiveness. Chart 9 plots GFCI ratings against the World Bank’s Control Of Corruption indicator and Chart 10 plots GFCI ratings against the World Bank’s measure of Regulatory Quality. These charts demonstrate the correlation of these factors with the GFCI 29 ratings (the size of the bubble indicates the relative GDP of each centre).
Chart 9 | GFCI 29 Rating Against Control Of Corruption (Supplied By The World Bank)
Chart 10 | GFCI 29 Rating Against Regulatory Quality (Supplied By The World Bank)
The Global Financial Centres Index 29
17
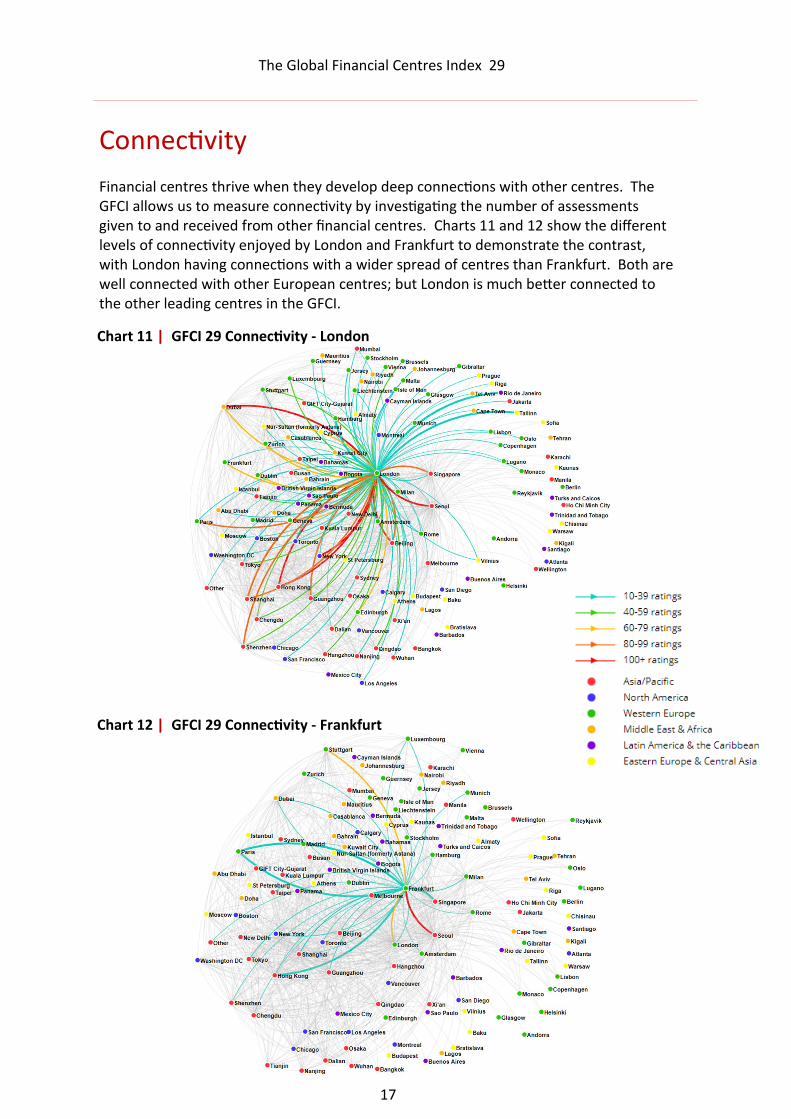
Connectivity Financial centres thrive when they develop deep connections with other centres. The GFCI allows us to measure connectivity by investigating the number of assessments given to and received from other financial centres. Charts 11 and 12 show the different levels of connectivity enjoyed by London and Frankfurt to demonstrate the contrast, with London having connections with a wider spread of centres than Frankfurt. Both are well connected with other European centres; but London is much better connected to the other leading centres in the GFCI.
Chart 11 | GFCI 29 Connectivity - London
Chart 12 | GFCI 29 Connectivity - Frankfurt
The Global Financial Centres Index 29
18
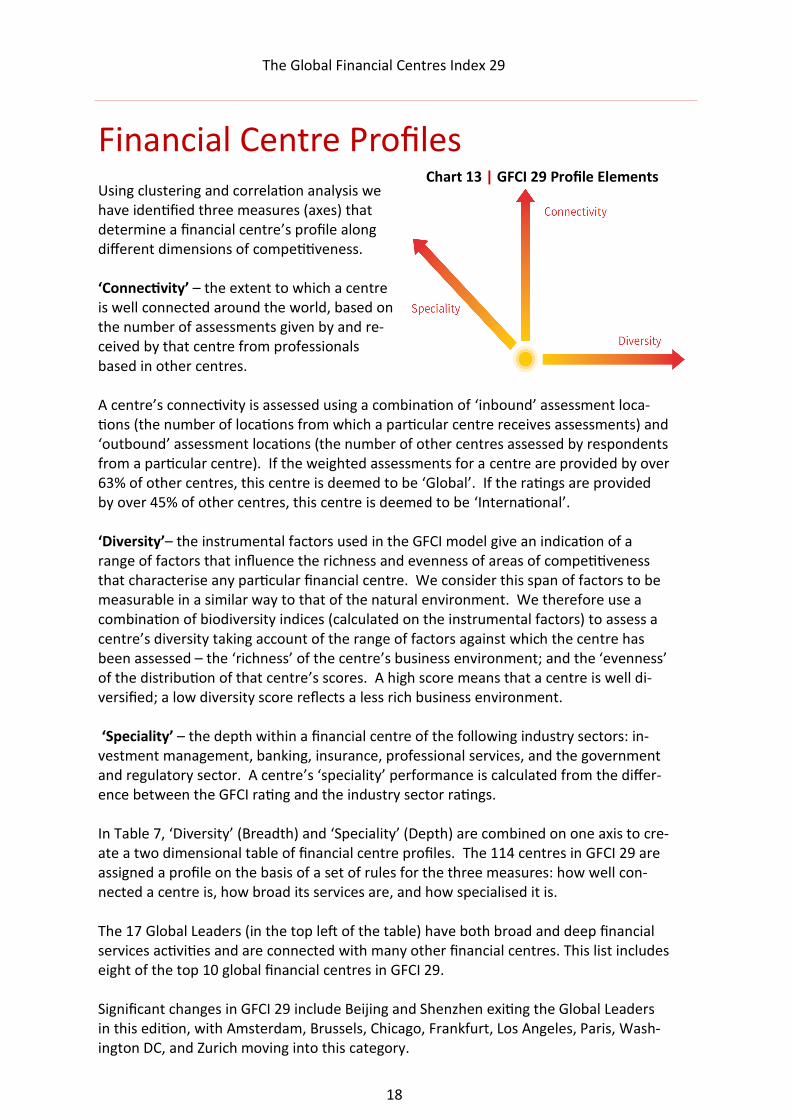
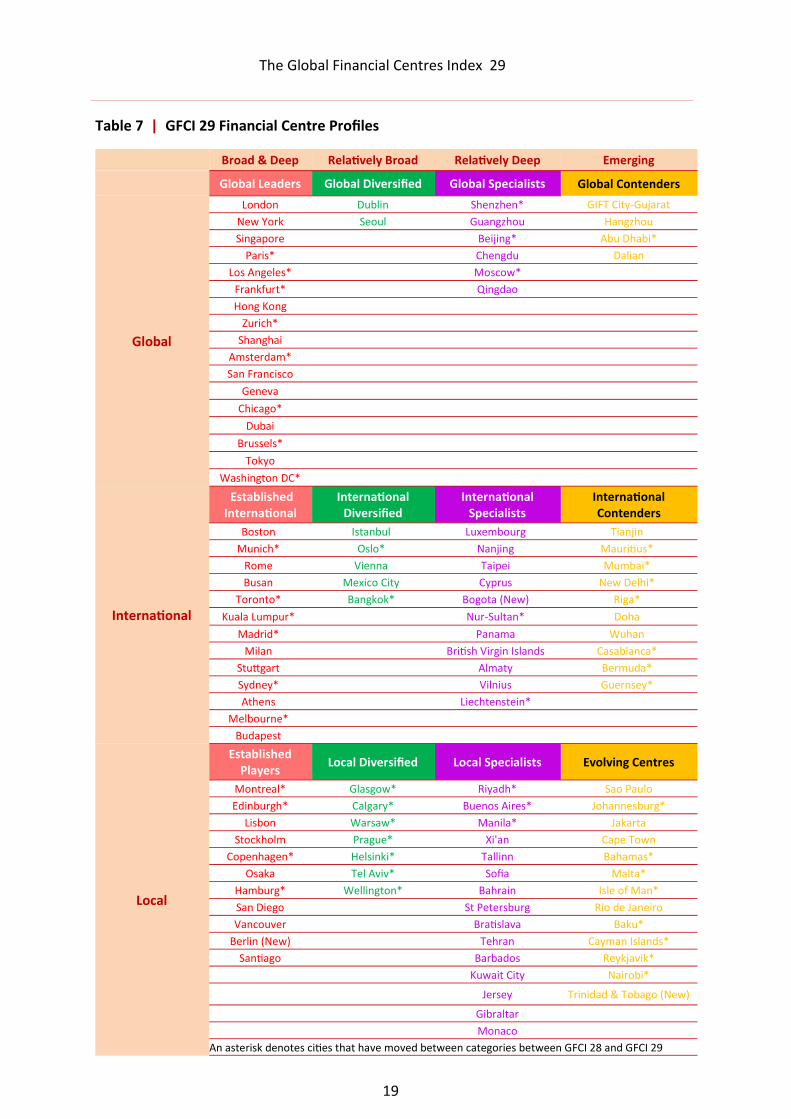
Financial Centre Profiles Using clustering and correlation analysis we have identified three measures (axes) that determine a financial centre’s profile along different dimensions of competitiveness. ‘Connectivity’ – the extent to which a centre is well connected around the world, based on the number of assessments given by and re-ceived by that centre from professionals based in other centres. A centre’s connectivity is assessed using a combination of ‘inbound’ assessment loca-tions (the number of locations from which a particular centre receives assessments) and ‘outbound’ assessment locations (the number of other centres assessed by respondents from a particular centre). If the weighted assessments for a centre are provided by over 63% of other centres, this centre is deemed to be ‘Global’. If the ratings are provided by over 45% of other centres, this centre is deemed to be ‘International’. ‘Diversity’– the instrumental factors used in the GFCI model give an indication of a range of factors that influence the richness and evenness of areas of competitiveness that characterise any particular financial centre. We consider this span of factors to be measurable in a similar way to that of the natural environment. We therefore use a combination of biodiversity indices (calculated on the instrumental factors) to assess a centre’s diversity taking account of the range of factors against which the centre has been assessed – the ‘richness’ of the centre’s business environment; and the ‘evenness’ of the distribution of that centre’s scores. A high score means that a centre is well di-versified; a low diversity score reflects a less rich business environment. ‘Speciality’ – the depth within a financial centre of the following industry sectors: in-vestment management, banking, insurance, professional services, and the government and regulatory sector. A centre’s ‘speciality’ performance is calculated from the differ-ence between the GFCI rating and the industry sector ratings. In Table 7, ‘Diversity’ (Breadth) and ‘Speciality’ (Depth) are combined on one axis to cre-ate a two dimensional table of financial centre profiles. The 114 centres in GFCI 29 are assigned a profile on the basis of a set of rules for the three measures: how well con-nected a centre is, how broad its services are, and how specialised it is. The 17 Global Leaders (in the top left of the table) have both broad and deep financial services activities and are connected with many other financial centres. This list includes eight of the top 10 global financial centres in GFCI 29. Significant changes in GFCI 29 include Beijing and Shenzhen exiting the Global Leaders in this edition, with Amsterdam, Brussels, Chicago, Frankfurt, Los Angeles, Paris, Wash-ington DC, and Zurich moving into this category.
Chart 13 | GFCI 29 Profile Elements
The Global Financial Centres Index 29
19
Table 7 | GFCI 29 Financial Centre Profiles
Broad & Deep Relatively Broad Relatively Deep Emerging
Global Leaders Global Diversified Global Specialists Global Contenders
Global
London Dublin Shenzhen* GIFT City-Gujarat
New York Seoul Guangzhou Hangzhou
Singapore Beijing* Abu Dhabi*
Paris* Chengdu Dalian
Los Angeles* Moscow*
Frankfurt* Qingdao
Hong Kong
Zurich*
Shanghai
Amsterdam*
San Francisco
Geneva
Chicago*
Dubai
Brussels*
Tokyo
Washington DC*
International
Established International
International Diversified
International Specialists
International Contenders
Boston Istanbul Luxembourg Tianjin
Munich* Oslo* Nanjing Mauritius*
Rome Vienna Taipei Mumbai*
Busan Mexico City Cyprus New Delhi*
Toronto* Bangkok* Bogota (New) Riga*
Kuala Lumpur* Nur-Sultan* Doha
Madrid* Panama Wuhan
Milan British Virgin Islands Casablanca*
Stuttgart Almaty Bermuda*
Sydney* Vilnius Guernsey*
Athens Liechtenstein*
Melbourne*
Budapest
Local
Established Players
Local Diversified Local Specialists Evolving Centres
Montreal* Glasgow* Riyadh* Sao Paulo
Edinburgh* Calgary* Buenos Aires* Johannesburg*
Lisbon Warsaw* Manila* Jakarta
Stockholm Prague* Xi'an Cape Town
Copenhagen* Helsinki* Tallinn Bahamas*
Osaka Tel Aviv* Sofia Malta*
Hamburg* Wellington* Bahrain Isle of Man*
San Diego St Petersburg Rio de Janeiro
Vancouver Bratislava Baku*
Berlin (New) Tehran Cayman Islands*
Santiago Barbados Reykjavik*
Kuwait City Nairobi*
Jersey Trinidad & Tobago (New)
Gibraltar
Monaco
An asterisk denotes cities that have moved between categories between GFCI 28 and GFCI 29
The Global Financial Centres Index 29
20
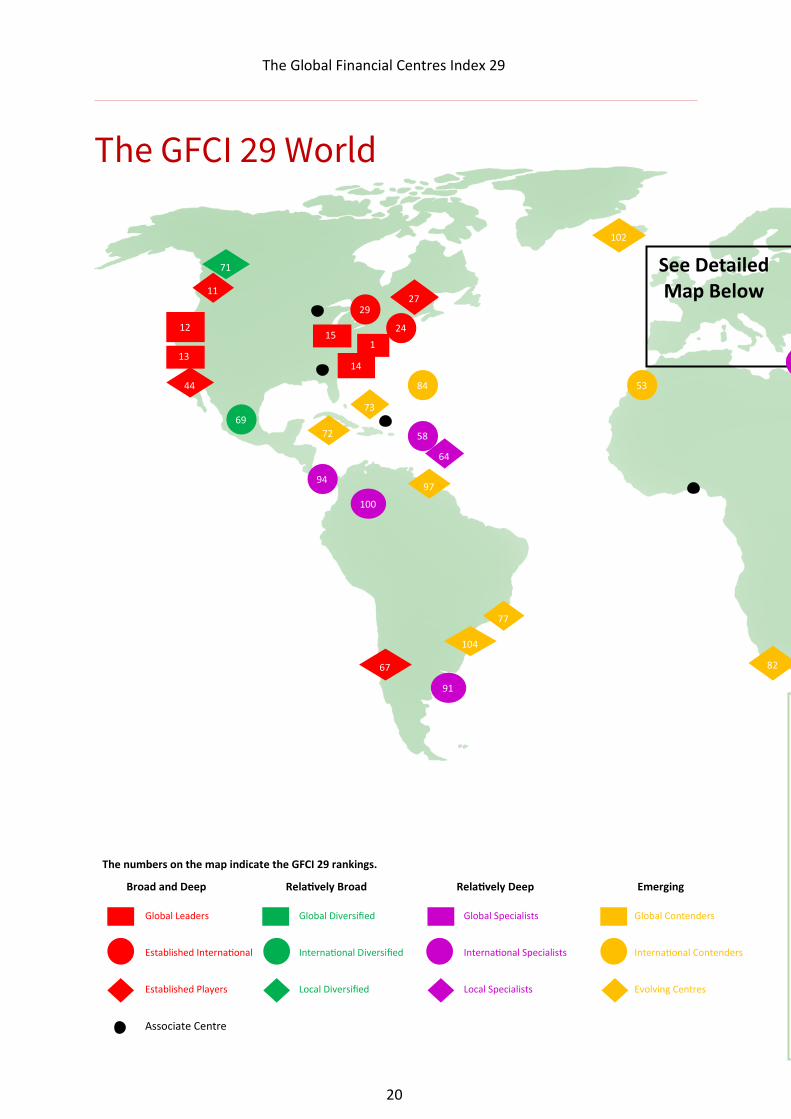
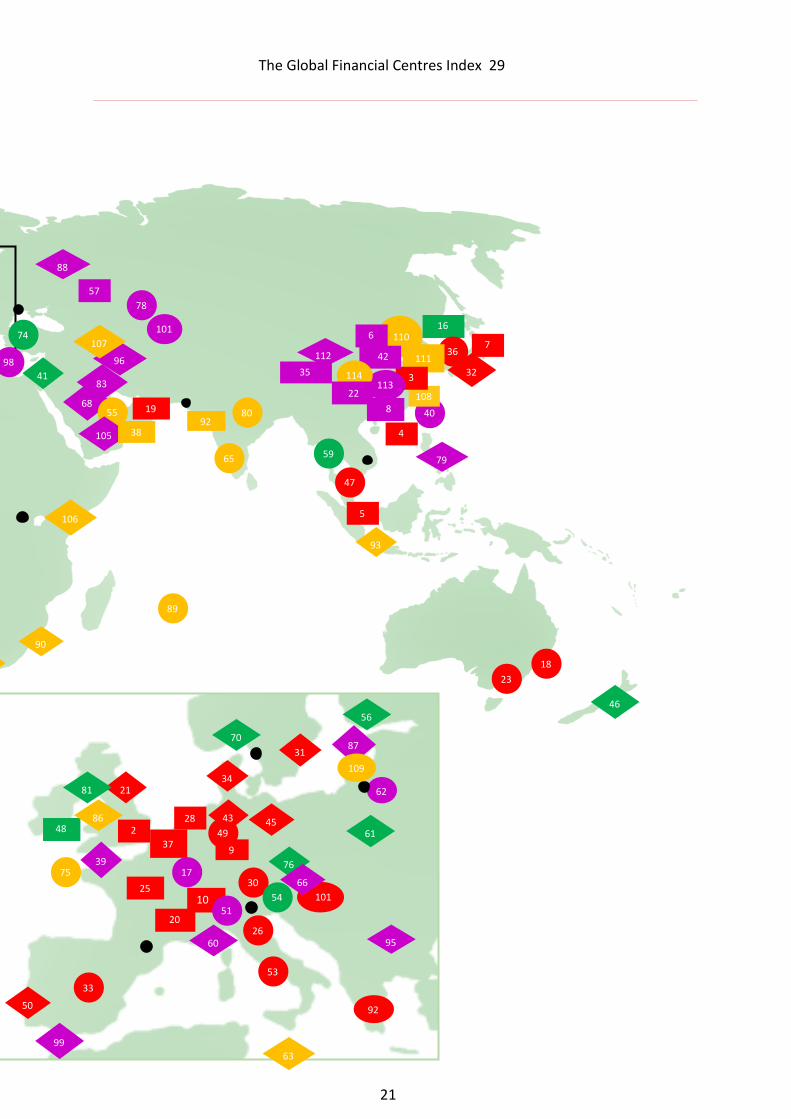
The GFCI 29 World
See Detailed Map Below
The numbers on the map indicate the GFCI 29 rankings.
Broad and Deep Relatively Broad Relatively Deep Emerging
Global Leaders Global Diversified Global Specialists Global Contenders
Established International International Diversified International Specialists International Contenders
Established Players Local Diversified Local Specialists Evolving Centres
Associate Centre
98
1
71
11
58
53
72
84
73 69
82
94
102
12
14
77
104
91
24
27
67
15
13
29
44
100
64
97
The Global Financial Centres Index 29
21
63
8
98
74
10 51
2
4
5
7
19
110 6
28 48
9
47
20
68 55
21
31
90
34
101
101
76
32
50
56
70
86
60 95
93
106
88
75 39
46
49
43
30
16
25
92
59
53
54
81
61
36 111
92
89
83
99
35
105 38
87
109
65
80 40
108
79
3 113
42
17
78
57
23
41
37
33
26
18
62
96
107
66
112
114
22
45
The Global Financial Centres Index 29
22
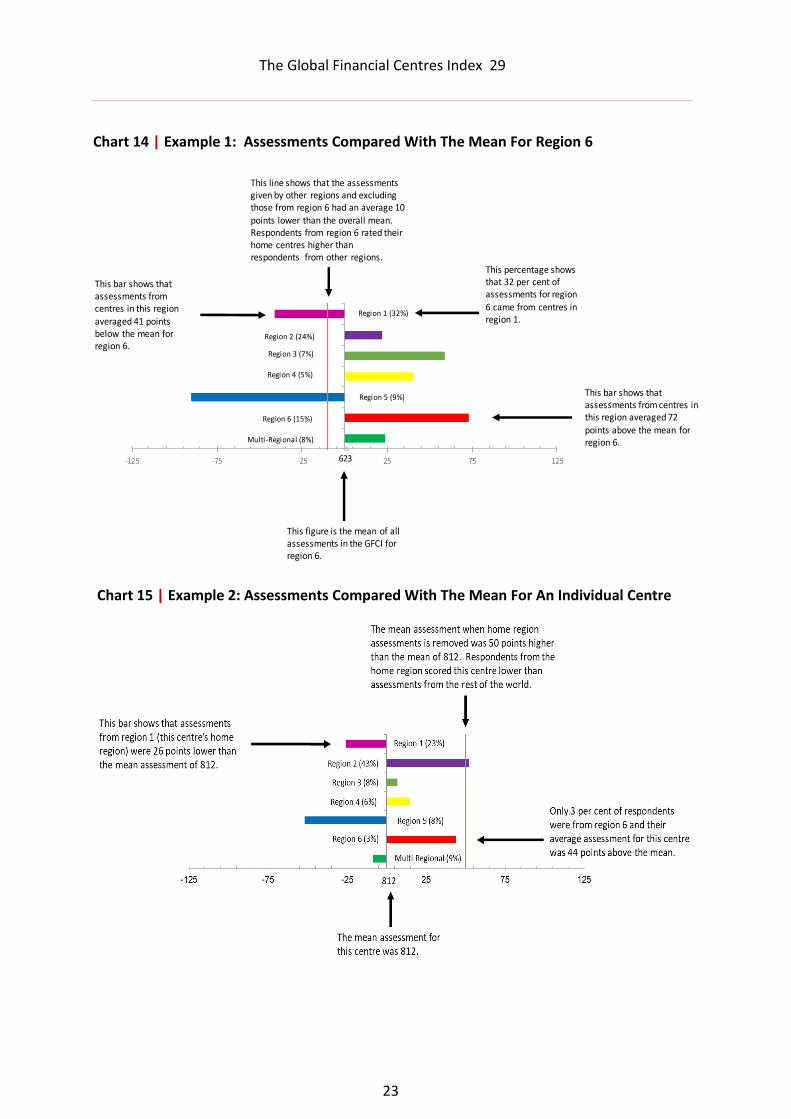
Regional Analysis In our analysis of the GFCI data, we look at six regions of the world to explore the competitiveness of their financial centres. Alongside the ranks and ratings of centres, we look at trends in the leading centres in each region and investigate the average assessments received by regions and centres in more detail. We display this analysis in charts which show: • the mean assessment provided to that region or centre;
• the difference in the mean assessment when home region assessments are removed from the analysis;
• the difference between the mean and the assessments provided by other regions;
• the proportion of assessments provided by each region. Charts 14 and 15 show examples of these analyses. Coloured bars to the left of the vertical axis indicate that respondents from that region gave lower than the average assessments. Bars to the right indicate respondents from that region gave higher than average assessments. It is important to recognise that assessments given to a centre by people based in that centre are excluded to remove ‘home’ bias. The additional vertical axis (in red) shows the mean of assessments when assessments from the home region are removed. The percentage figure noted by each region indicates the percentage of the total number of assessments that are from that region.
“People always travel to a better place for living, not because people want to live in a financial centre.
With the development of many inland cities in China, a number of people have returned to their home town/area to find jobs and opportunities. Skilled
people and flexibility of labour markets are the basic conditions to ensure a competitive financial centre, but how to retain people within the local market is
quite challenging.” SENIOR COMPLIANCE OFFICER, INSURANCE FIRM, SHANGHAI
The Global Financial Centres Index 29
23
Chart 14 | Example 1: Assessments Compared With The Mean For Region 6
Chart 15 | Example 2: Assessments Compared With The Mean For An Individual Centre
Region 1 (32%)
Region 2 (24%)
Region 3 (7%)
Region 4 (5%)
Region 5 (9%)
Region 6 (15%)
Multi-Regional (8%)
623-125 -75 -25 25 75 125
This figure is the mean of all assessments in the GFCI for region 6.
This bar shows that assessments from centres in this region averaged 72 points above the mean for region 6.
This bar shows that assessments from centres in this region averaged 41 points below the mean for region 6.
This percentage shows that 32 per cent of assessments for region
6 came from centres in region 1.
This line shows that the assessments given by other regions and excluding those from region 6 had an average 10 points lower than the overall mean. Respondents from region 6 rated their home centres higher than respondents from other regions.
The Global Financial Centres Index 29
24
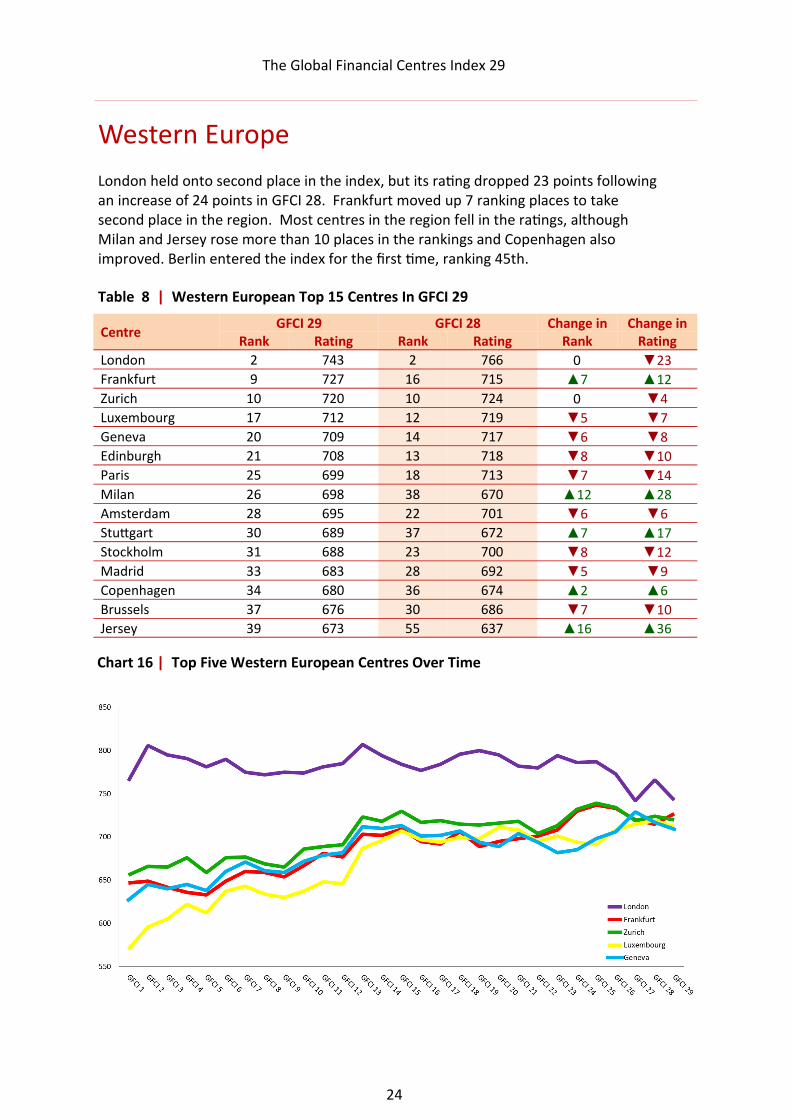
Western Europe London held onto second place in the index, but its rating dropped 23 points following an increase of 24 points in GFCI 28. Frankfurt moved up 7 ranking places to take second place in the region. Most centres in the region fell in the ratings, although Milan and Jersey rose more than 10 places in the rankings and Copenhagen also improved. Berlin entered the index for the first time, ranking 45th.
Table 8 | Western European Top 15 Centres In GFCI 29
Chart 16 | Top Five Western European Centres Over Time
Centre GFCI 29 GFCI 28 Change in Change in
Rank Rating Rank Rating Rank Rating
London 2 743 2 766 0 ▼23
Frankfurt 9 727 16 715 ▲7 ▲12
Zurich 10 720 10 724 0 ▼4
Luxembourg 17 712 12 719 ▼5 ▼7
Geneva 20 709 14 717 ▼6 ▼8
Edinburgh 21 708 13 718 ▼8 ▼10
Paris 25 699 18 713 ▼7 ▼14
Milan 26 698 38 670 ▲12 ▲28
Amsterdam 28 695 22 701 ▼6 ▼6
Stuttgart 30 689 37 672 ▲7 ▲17
Stockholm 31 688 23 700 ▼8 ▼12
Madrid 33 683 28 692 ▼5 ▼9
Copenhagen 34 680 36 674 ▲2 ▲6
Brussels 37 676 30 686 ▼7 ▼10
Jersey 39 673 55 637 ▲16 ▲36
The Global Financial Centres Index 29
25
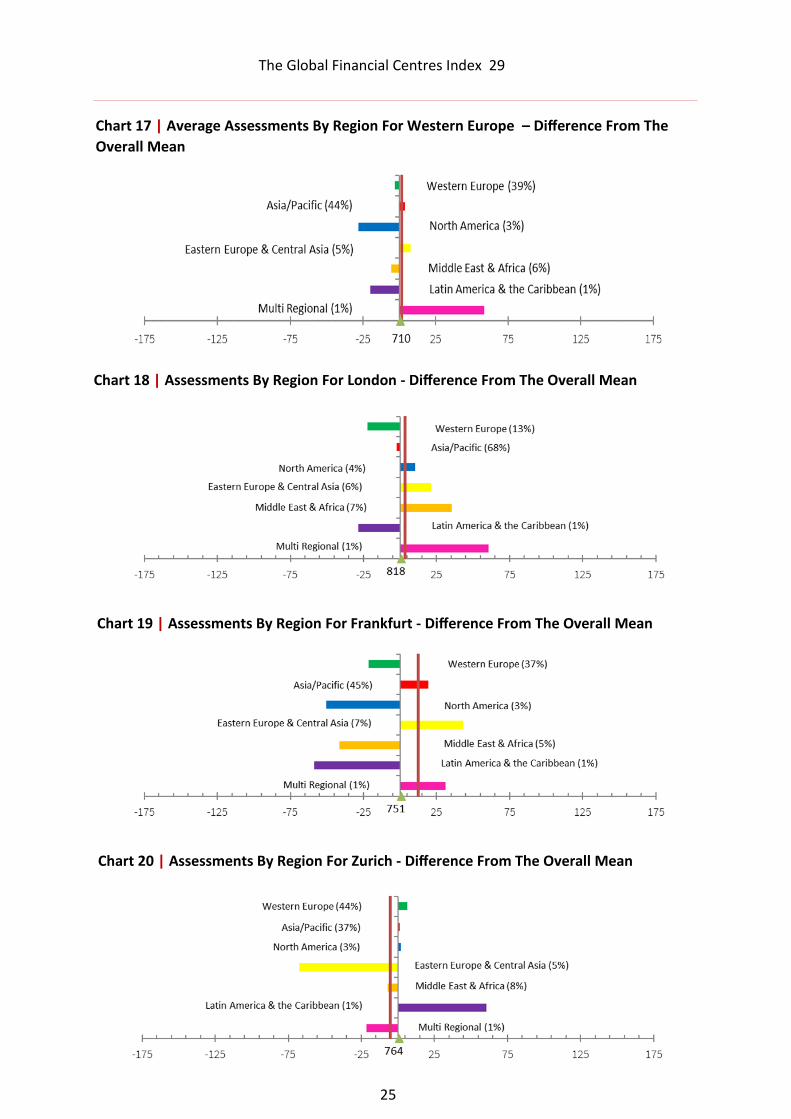
Chart 18 | Assessments By Region For London - Difference From The Overall Mean
Chart 19 | Assessments By Region For Frankfurt - Difference From The Overall Mean
Chart 17 | Average Assessments By Region For Western Europe – Difference From The
Overall Mean
Chart 20 | Assessments By Region For Zurich - Difference From The Overall Mean
The Global Financial Centres Index 29
26
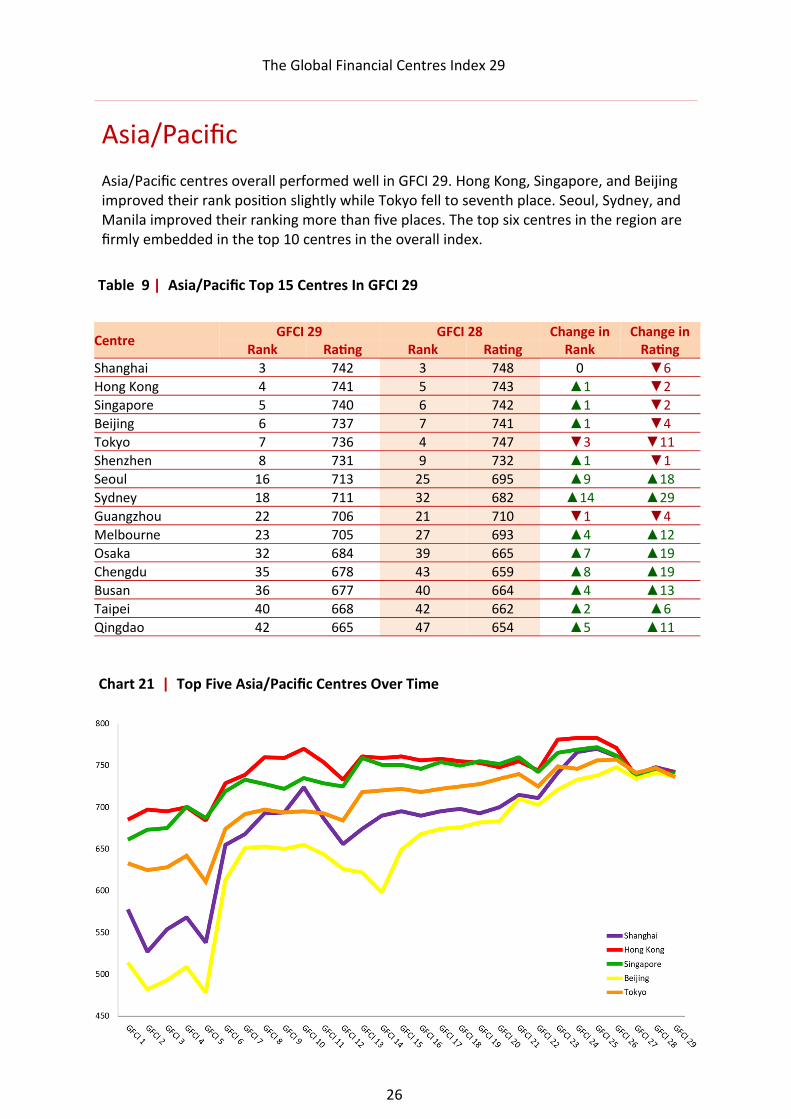
Asia/Pacific Asia/Pacific centres overall performed well in GFCI 29. Hong Kong, Singapore, and Beijing improved their rank position slightly while Tokyo fell to seventh place. Seoul, Sydney, and Manila improved their ranking more than five places. The top six centres in the region are firmly embedded in the top 10 centres in the overall index.
Table 9 | Asia/Pacific Top 15 Centres In GFCI 29
Centre GFCI 29 GFCI 28 Change in Change in
Rank Rating Rank Rating Rank Rating
Shanghai 3 742 3 748 0 ▼6
Hong Kong 4 741 5 743 ▲1 ▼2
Singapore 5 740 6 742 ▲1 ▼2
Beijing 6 737 7 741 ▲1 ▼4
Tokyo 7 736 4 747 ▼3 ▼11
Shenzhen 8 731 9 732 ▲1 ▼1
Seoul 16 713 25 695 ▲9 ▲18
Sydney 18 711 32 682 ▲14 ▲29
Guangzhou 22 706 21 710 ▼1 ▼4
Melbourne 23 705 27 693 ▲4 ▲12
Osaka 32 684 39 665 ▲7 ▲19
Chengdu 35 678 43 659 ▲8 ▲19
Busan 36 677 40 664 ▲4 ▲13
Taipei 40 668 42 662 ▲2 ▲6
Qingdao 42 665 47 654 ▲5 ▲11
Chart 21 | Top Five Asia/Pacific Centres Over Time
The Global Financial Centres Index 29
27
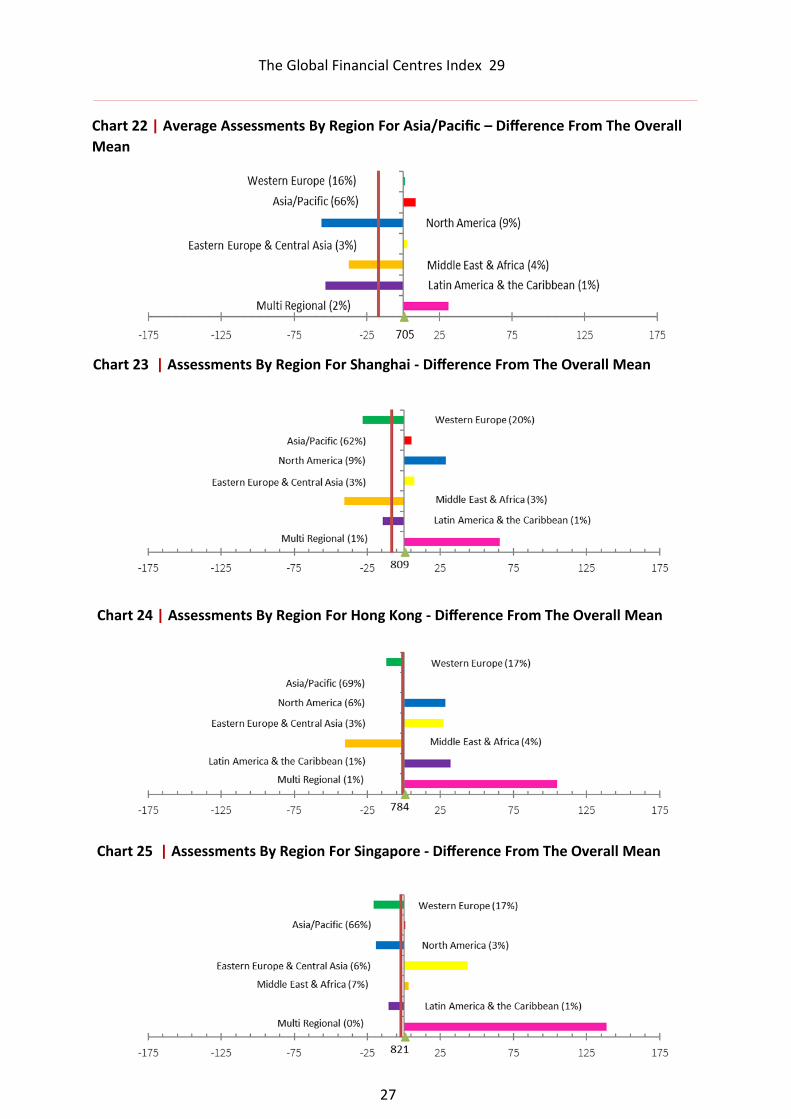
Chart 23 | Assessments By Region For Shanghai - Difference From The Overall Mean
Chart 25 | Assessments By Region For Singapore - Difference From The Overall Mean
Chart 22 | Average Assessments By Region For Asia/Pacific – Difference From The Overall
Mean
Chart 24 | Assessments By Region For Hong Kong - Difference From The Overall Mean
The Global Financial Centres Index 29
28
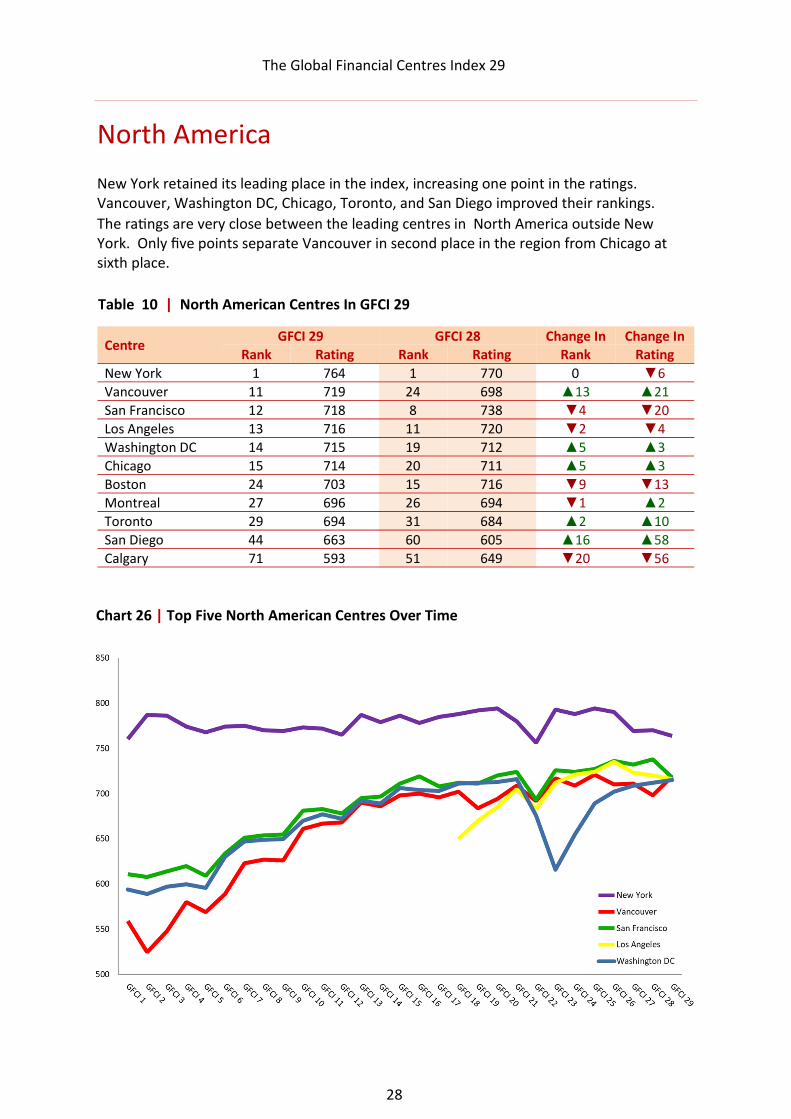
North America
New York retained its leading place in the index, increasing one point in the ratings. Vancouver, Washington DC, Chicago, Toronto, and San Diego improved their rankings.
The ratings are very close between the leading centres in North America outside New York. Only five points separate Vancouver in second place in the region from Chicago at sixth place.
Table 10 | North American Centres In GFCI 29
Chart 26 | Top Five North American Centres Over Time
Centre GFCI 29 GFCI 28 Change In Change In
Rank Rating Rank Rating Rank Rating
New York 1 764 1 770 0 ▼6
Vancouver 11 719 24 698 ▲13 ▲21
San Francisco 12 718 8 738 ▼4 ▼20
Los Angeles 13 716 11 720 ▼2 ▼4
Washington DC 14 715 19 712 ▲5 ▲3
Chicago 15 714 20 711 ▲5 ▲3
Boston 24 703 15 716 ▼9 ▼13
Montreal 27 696 26 694 ▼1 ▲2
Toronto 29 694 31 684 ▲2 ▲10
San Diego 44 663 60 605 ▲16 ▲58
Calgary 71 593 51 649 ▼20 ▼56
The Global Financial Centres Index 29
29
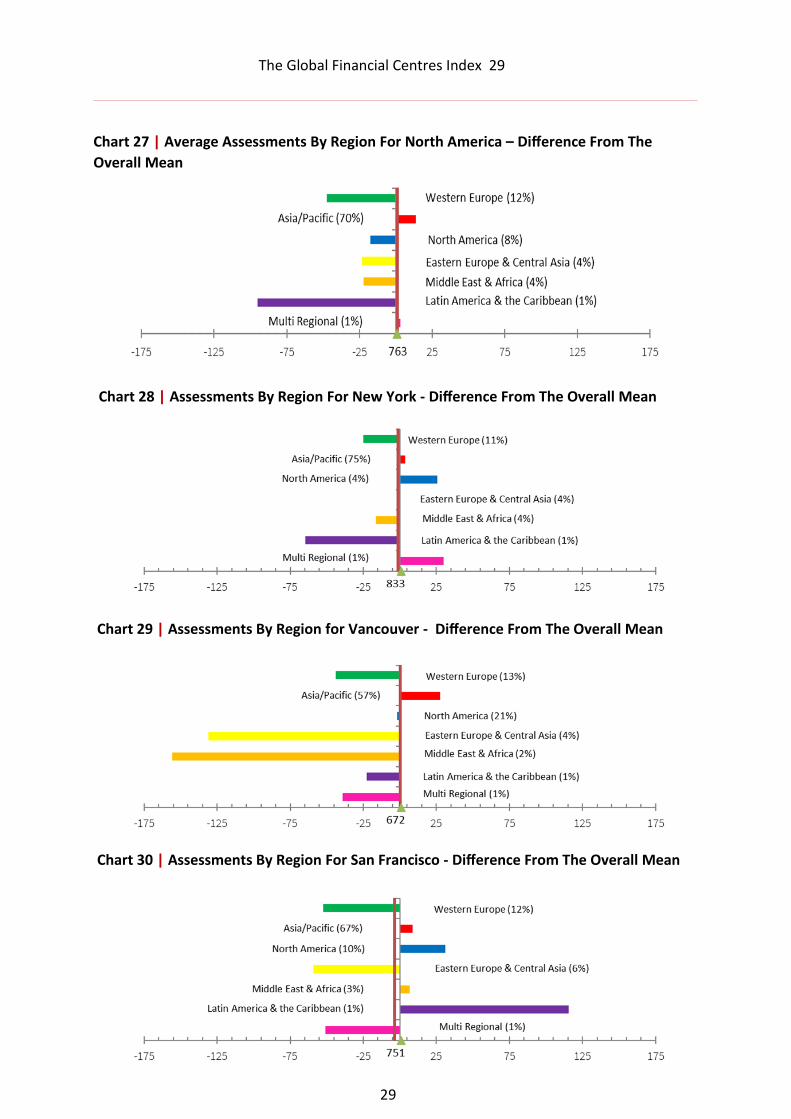
Chart 29 | Assessments By Region for Vancouver - Difference From The Overall Mean
Chart 30 | Assessments By Region For San Francisco - Difference From The Overall Mean
Chart 27 | Average Assessments By Region For North America – Difference From The
Overall Mean
Chart 28 | Assessments By Region For New York - Difference From The Overall Mean
The Global Financial Centres Index 29
30
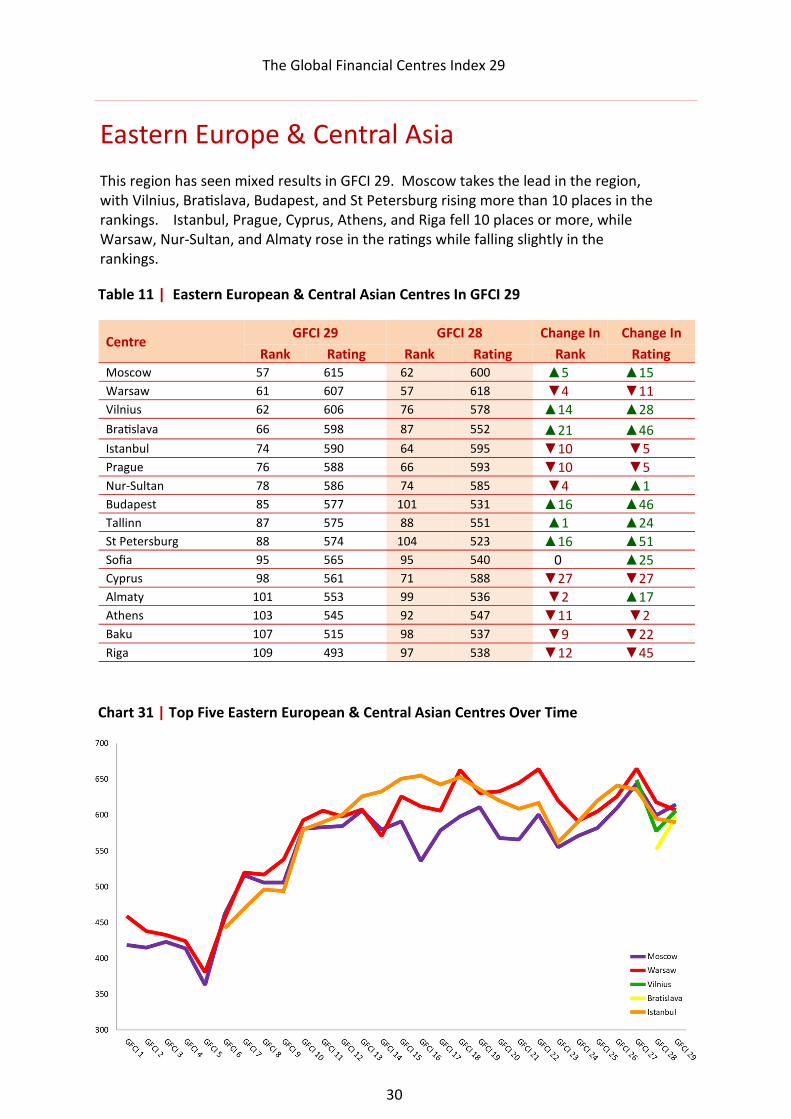
Centre GFCI 29 GFCI 28 Change In Change In
Rank Rating Rank Rating Rank Rating Moscow 57 615 62 600 ▲5 ▲15 Warsaw 61 607 57 618 ▼4 ▼11 Vilnius 62 606 76 578 ▲14 ▲28
Bratislava 66 598 87 552 ▲21 ▲46 Istanbul 74 590 64 595 ▼10 ▼5 Prague 76 588 66 593 ▼10 ▼5 Nur-Sultan 78 586 74 585 ▼4 ▲1 Budapest 85 577 101 531 ▲16 ▲46 Tallinn 87 575 88 551 ▲1 ▲24 St Petersburg 88 574 104 523 ▲16 ▲51 Sofia 95 565 95 540 0 ▲25 Cyprus 98 561 71 588 ▼27 ▼27 Almaty 101 553 99 536 ▼2 ▲17 Athens 103 545 92 547 ▼11 ▼2 Baku 107 515 98 537 ▼9 ▼22 Riga 109 493 97 538 ▼12 ▼45
Table 11 | Eastern European & Central Asian Centres In GFCI 29
Chart 31 | Top Five Eastern European & Central Asian Centres Over Time
Eastern Europe & Central Asia This region has seen mixed results in GFCI 29. Moscow takes the lead in the region, with Vilnius, Bratislava, Budapest, and St Petersburg rising more than 10 places in the rankings. Istanbul, Prague, Cyprus, Athens, and Riga fell 10 places or more, while Warsaw, Nur-Sultan, and Almaty rose in the ratings while falling slightly in the rankings.
The Global Financial Centres Index 29
31
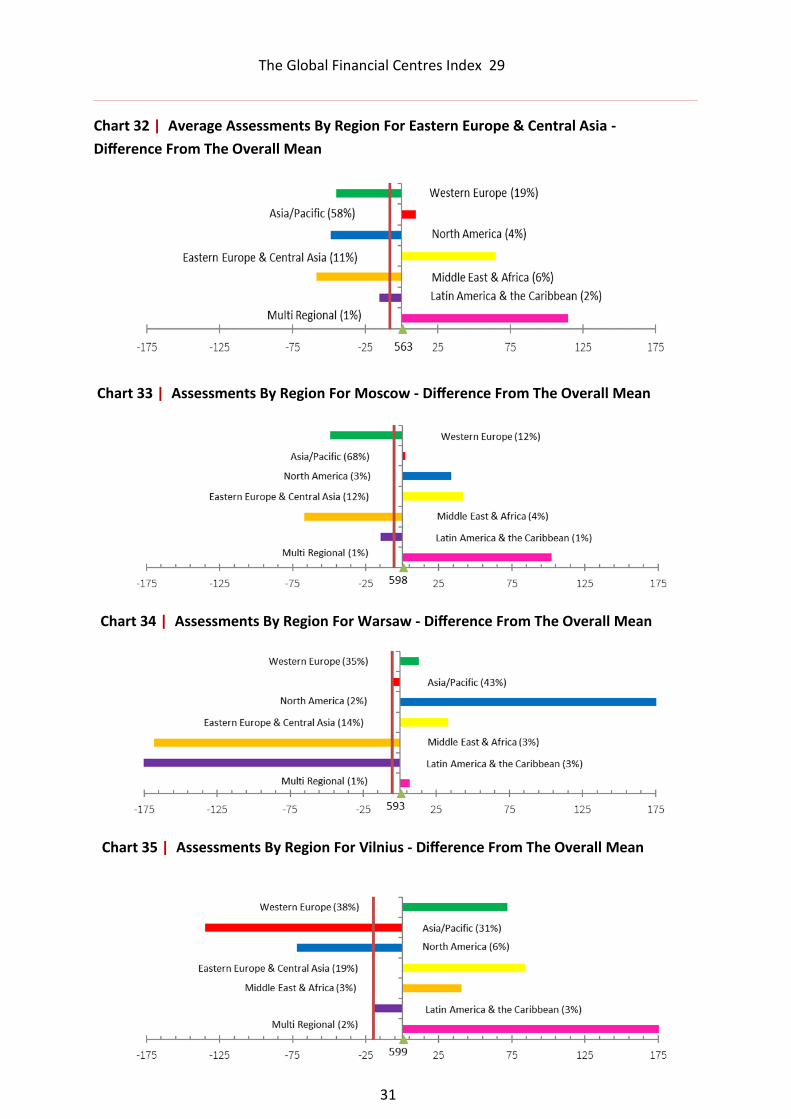
Chart 33 | Assessments By Region For Moscow - Difference From The Overall Mean
Chart 34 | Assessments By Region For Warsaw - Difference From The Overall Mean
Chart 35 | Assessments By Region For Vilnius - Difference From The Overall Mean
-238
Chart 32 | Average Assessments By Region For Eastern Europe & Central Asia -
Difference From The Overall Mean
The Global Financial Centres Index 29
32
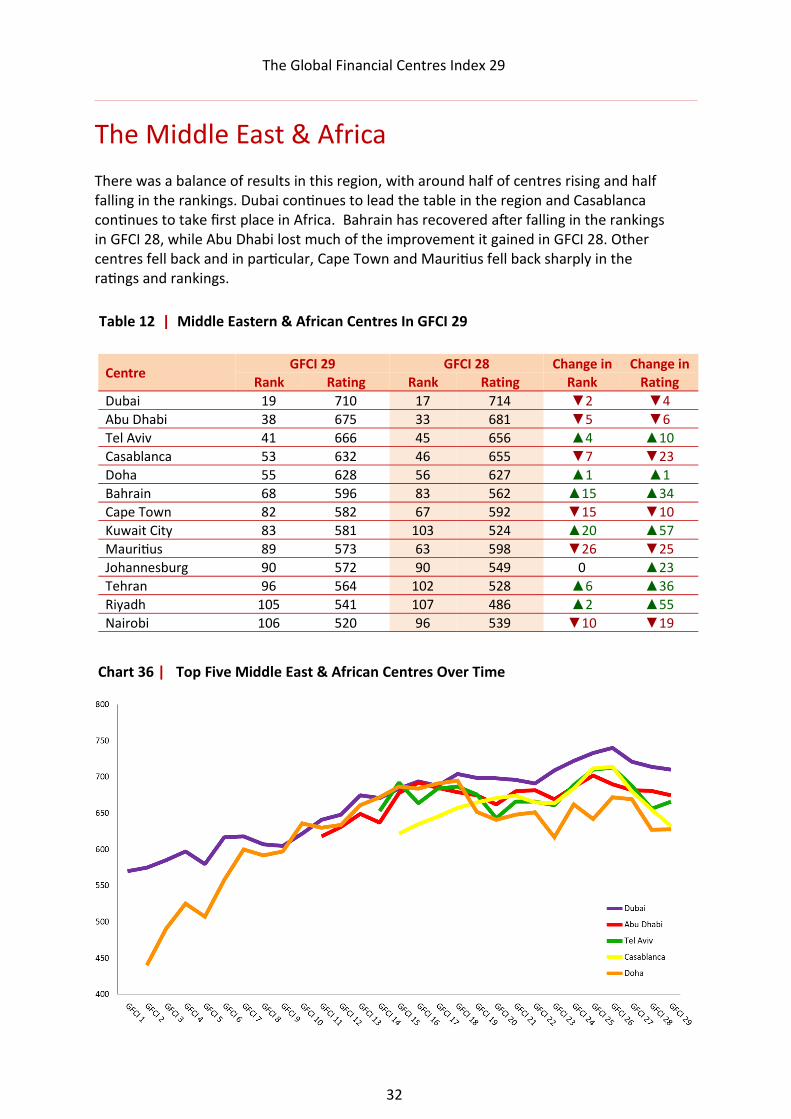
Table 12 | Middle Eastern & African Centres In GFCI 29
Chart 36 | Top Five Middle East & African Centres Over Time
The Middle East & Africa There was a balance of results in this region, with around half of centres rising and half falling in the rankings. Dubai continues to lead the table in the region and Casablanca continues to take first place in Africa. Bahrain has recovered after falling in the rankings in GFCI 28, while Abu Dhabi lost much of the improvement it gained in GFCI 28. Other centres fell back and in particular, Cape Town and Mauritius fell back sharply in the ratings and rankings.
Centre GFCI 29 GFCI 28 Change in Change in
Rank Rating Rank Rating Rank Rating
Dubai 19 710 17 714 ▼2 ▼4
Abu Dhabi 38 675 33 681 ▼5 ▼6
Tel Aviv 41 666 45 656 ▲4 ▲10
Casablanca 53 632 46 655 ▼7 ▼23
Doha 55 628 56 627 ▲1 ▲1
Bahrain 68 596 83 562 ▲15 ▲34
Cape Town 82 582 67 592 ▼15 ▼10
Kuwait City 83 581 103 524 ▲20 ▲57
Mauritius 89 573 63 598 ▼26 ▼25
Johannesburg 90 572 90 549 0 ▲23
Tehran 96 564 102 528 ▲6 ▲36
Riyadh 105 541 107 486 ▲2 ▲55
Nairobi 106 520 96 539 ▼10 ▼19
The Global Financial Centres Index 29
33
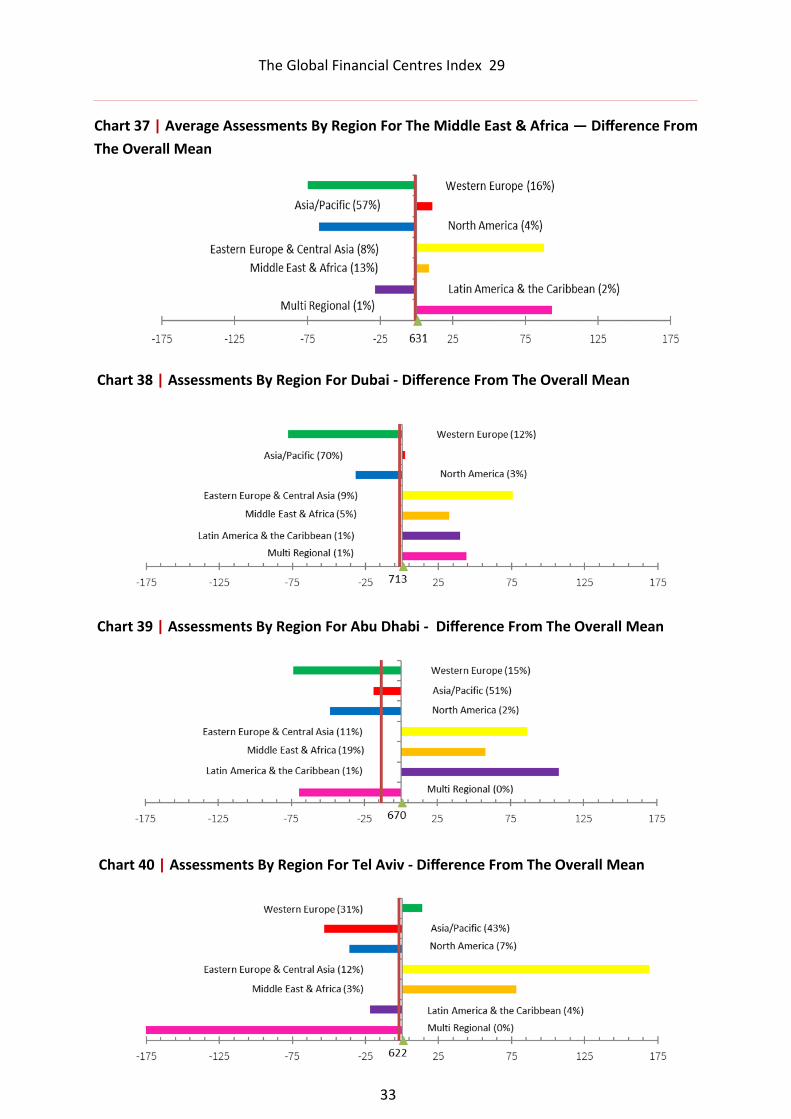
Chart 39 | Assessments By Region For Abu Dhabi - Difference From The Overall Mean
Chart 40 | Assessments By Region For Tel Aviv - Difference From The Overall Mean
Chart 37 | Average Assessments By Region For The Middle East & Africa — Difference From
The Overall Mean
Chart 38 | Assessments By Region For Dubai - Difference From The Overall Mean
The Global Financial Centres Index 29
34
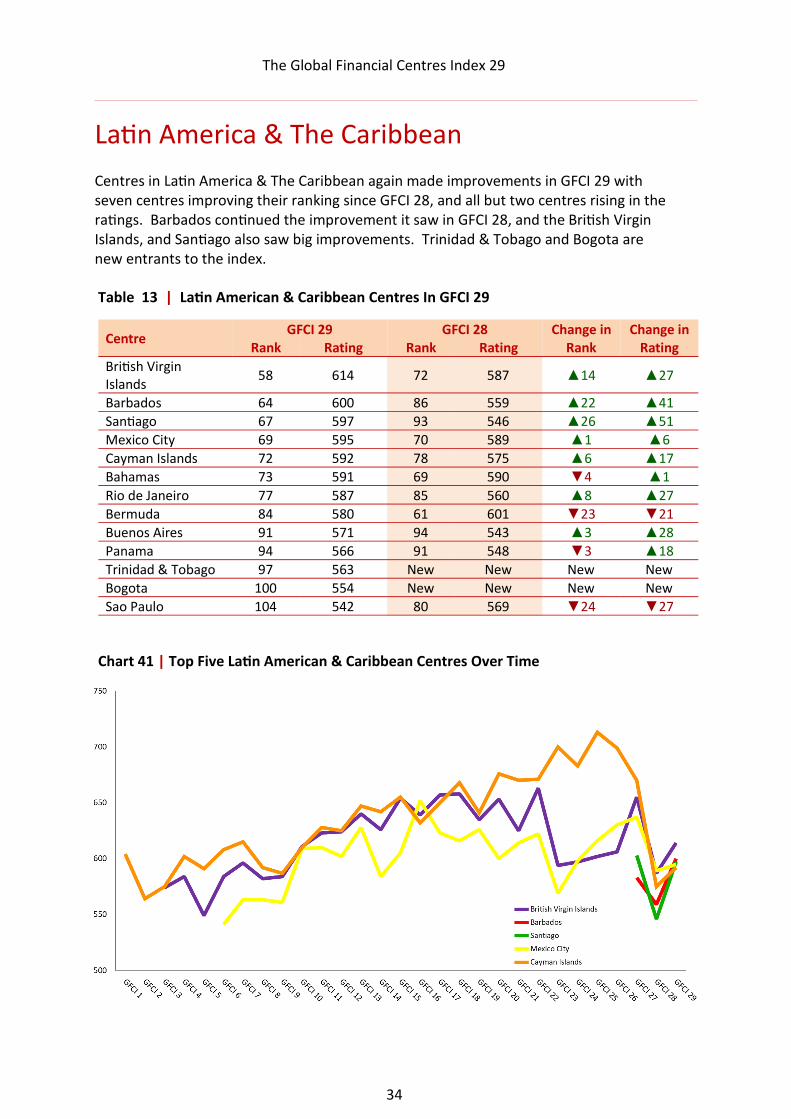
Latin America & The Caribbean Centres in Latin America & The Caribbean again made improvements in GFCI 29 with seven centres improving their ranking since GFCI 28, and all but two centres rising in the ratings. Barbados continued the improvement it saw in GFCI 28, and the British Virgin Islands, and Santiago also saw big improvements. Trinidad & Tobago and Bogota are new entrants to the index.
Table 13 | Latin American & Caribbean Centres In GFCI 29
Centre GFCI 29 GFCI 28 Change in Change in
Rank Rating Rank Rating Rank Rating
British Virgin Islands
58 614 72 587 ▲14 ▲27
Barbados 64 600 86 559 ▲22 ▲41
Santiago 67 597 93 546 ▲26 ▲51
Mexico City 69 595 70 589 ▲1 ▲6
Cayman Islands 72 592 78 575 ▲6 ▲17
Bahamas 73 591 69 590 ▼4 ▲1
Rio de Janeiro 77 587 85 560 ▲8 ▲27
Bermuda 84 580 61 601 ▼23 ▼21
Buenos Aires 91 571 94 543 ▲3 ▲28
Panama 94 566 91 548 ▼3 ▲18
Trinidad & Tobago 97 563 New New New New
Bogota 100 554 New New New New
Sao Paulo 104 542 80 569 ▼24 ▼27
Chart 41 | Top Five Latin American & Caribbean Centres Over Time
The Global Financial Centres Index 29
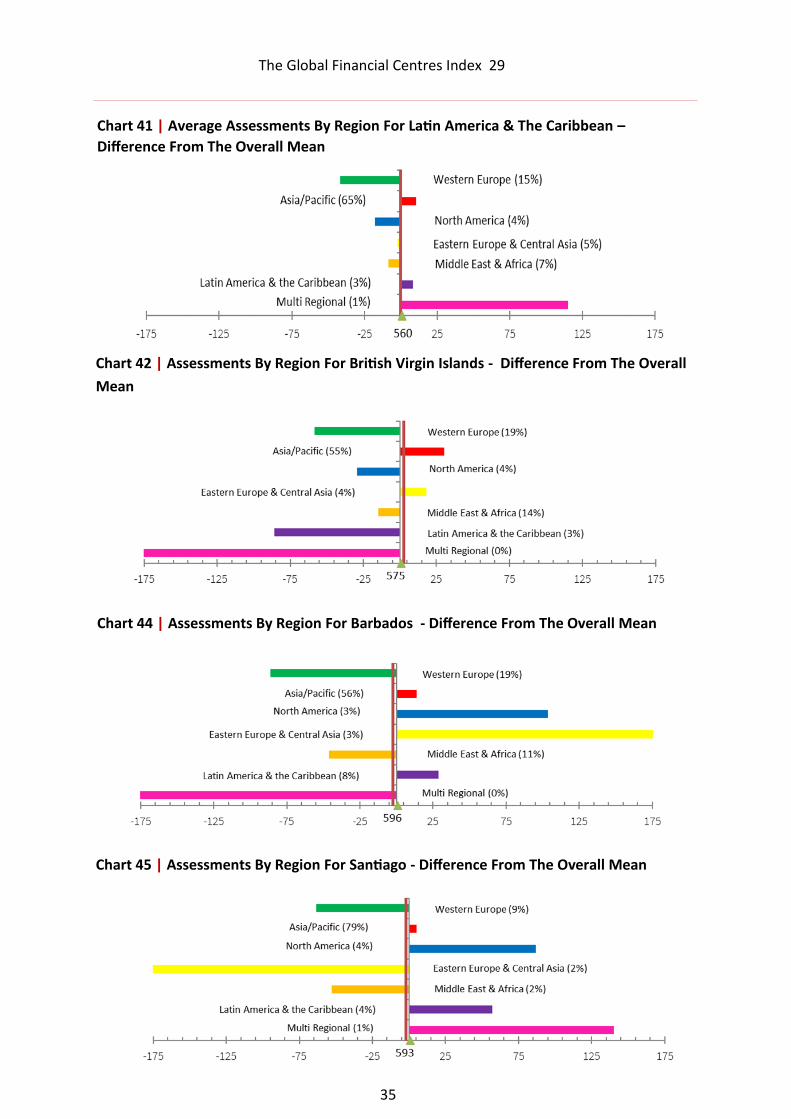
35
Chart 42 | Assessments By Region For British Virgin Islands - Difference From The Overall
Mean
Chart 44 | Assessments By Region For Barbados - Difference From The Overall Mean
Chart 45 | Assessments By Region For Santiago - Difference From The Overall Mean
Chart 41 | Average Assessments By Region For Latin America & The Caribbean –
Difference From The Overall Mean
The Global Financial Centres Index 29
36
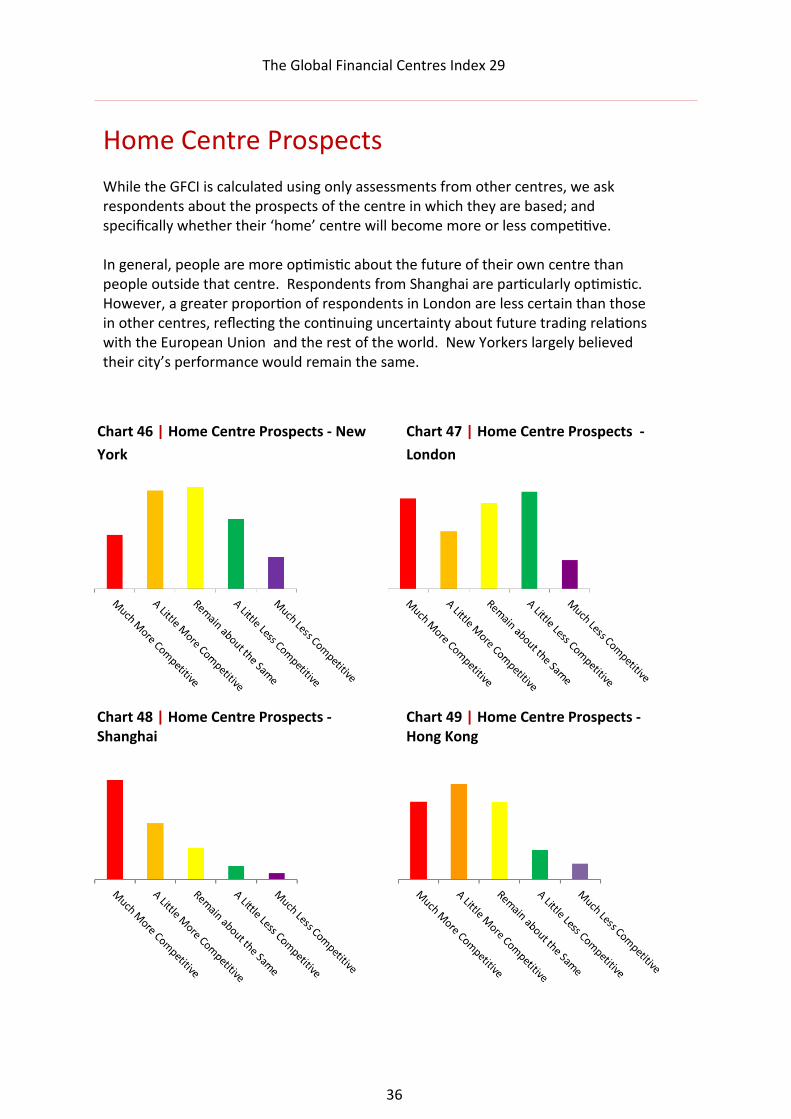
Home Centre Prospects While the GFCI is calculated using only assessments from other centres, we ask respondents about the prospects of the centre in which they are based; and specifically whether their ‘home’ centre will become more or less competitive. In general, people are more optimistic about the future of their own centre than people outside that centre. Respondents from Shanghai are particularly optimistic. However, a greater proportion of respondents in London are less certain than those in other centres, reflecting the continuing uncertainty about future trading relations with the European Union and the rest of the world. New Yorkers largely believed their city’s performance would remain the same.
Chart 46 | Home Centre Prospects - New
York
Chart 47 | Home Centre Prospects -
London
Chart 48 | Home Centre Prospects - Shanghai
Chart 49 | Home Centre Prospects - Hong Kong
The Global Financial Centres Index 29
37
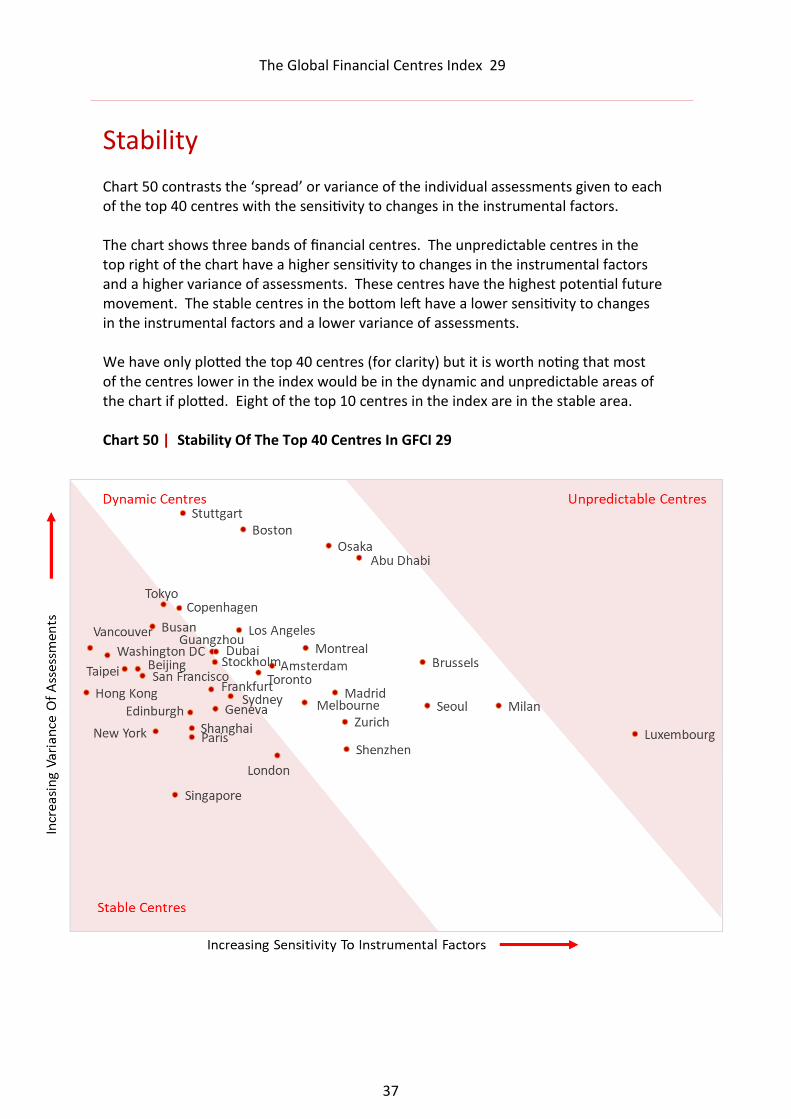
Stability Chart 50 contrasts the ‘spread’ or variance of the individual assessments given to each of the top 40 centres with the sensitivity to changes in the instrumental factors. The chart shows three bands of financial centres. The unpredictable centres in the top right of the chart have a higher sensitivity to changes in the instrumental factors and a higher variance of assessments. These centres have the highest potential future movement. The stable centres in the bottom left have a lower sensitivity to changes in the instrumental factors and a lower variance of assessments. We have only plotted the top 40 centres (for clarity) but it is worth noting that most of the centres lower in the index would be in the dynamic and unpredictable areas of the chart if plotted. Eight of the top 10 centres in the index are in the stable area. Chart 50 | Stability Of The Top 40 Centres In GFCI 29
The Global Financial Centres Index 29
38
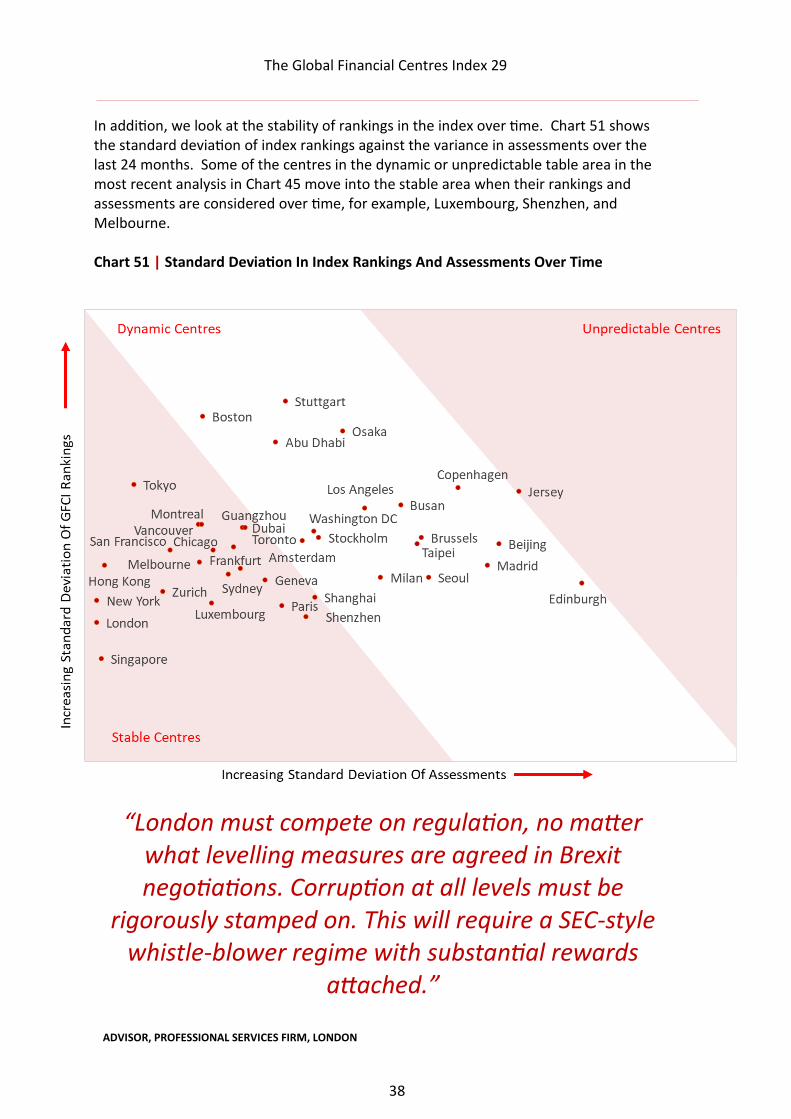
In addition, we look at the stability of rankings in the index over time. Chart 51 shows the standard deviation of index rankings against the variance in assessments over the last 24 months. Some of the centres in the dynamic or unpredictable table area in the most recent analysis in Chart 45 move into the stable area when their rankings and assessments are considered over time, for example, Luxembourg, Shenzhen, and Melbourne. Chart 51 | Standard Deviation In Index Rankings And Assessments Over Time
“London must compete on regulation, no matter what levelling measures are agreed in Brexit negotiations. Corruption at all levels must be
rigorously stamped on. This will require a SEC-style whistle-blower regime with substantial rewards
attached.”
ADVISOR, PROFESSIONAL SERVICES FIRM, LONDON
The Global Financial Centres Index 29
39
Table 14 | GFCI 29 Top 15 Centres Assessments And Ratings — Reputational Advantage
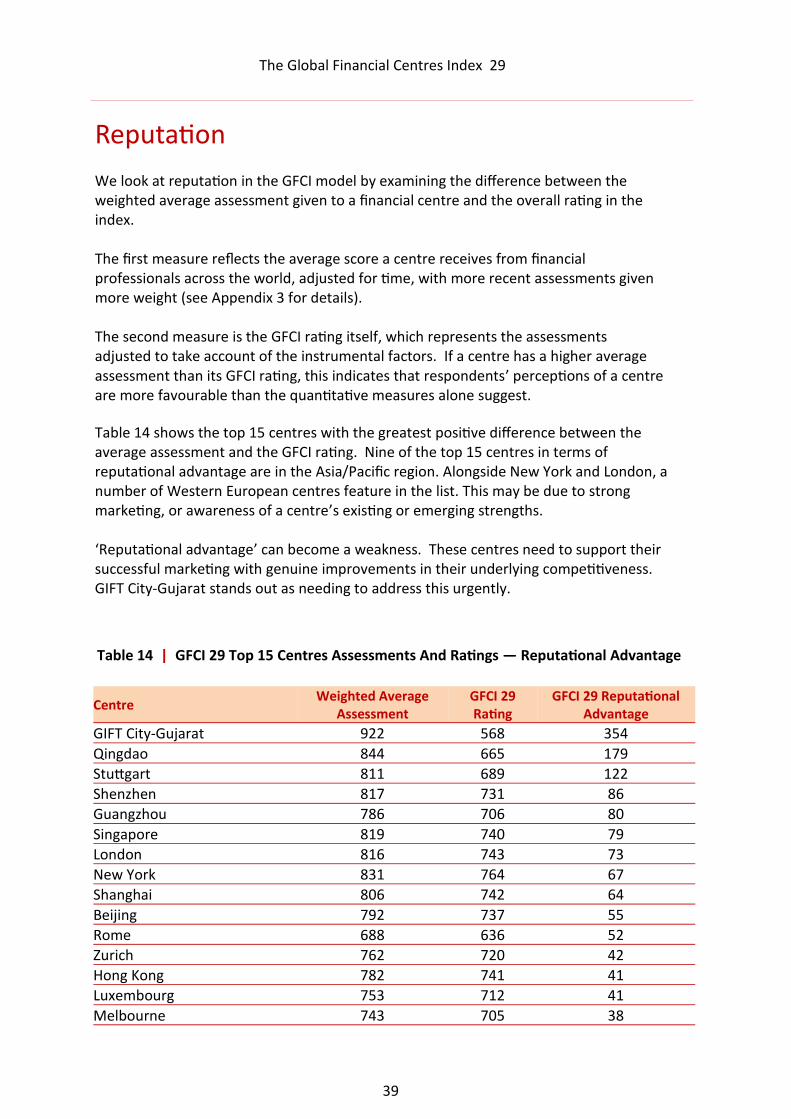
Reputation We look at reputation in the GFCI model by examining the difference between the weighted average assessment given to a financial centre and the overall rating in the index. The first measure reflects the average score a centre receives from financial professionals across the world, adjusted for time, with more recent assessments given more weight (see Appendix 3 for details). The second measure is the GFCI rating itself, which represents the assessments adjusted to take account of the instrumental factors. If a centre has a higher average assessment than its GFCI rating, this indicates that respondents’ perceptions of a centre are more favourable than the quantitative measures alone suggest.
Table 14 shows the top 15 centres with the greatest positive difference between the average assessment and the GFCI rating. Nine of the top 15 centres in terms of reputational advantage are in the Asia/Pacific region. Alongside New York and London, a number of Western European centres feature in the list. This may be due to strong marketing, or awareness of a centre’s existing or emerging strengths. ‘Reputational advantage’ can become a weakness. These centres need to support their successful marketing with genuine improvements in their underlying competitiveness. GIFT City-Gujarat stands out as needing to address this urgently.
Centre Weighted Average
Assessment GFCI 29 Rating
GFCI 29 Reputational Advantage
GIFT City-Gujarat 922 568 354
Qingdao 844 665 179
Stuttgart 811 689 122
Shenzhen 817 731 86
Guangzhou 786 706 80
Singapore 819 740 79
London 816 743 73
New York 831 764 67
Shanghai 806 742 64
Beijing 792 737 55
Rome 688 636 52
Zurich 762 720 42
Hong Kong 782 741 41
Luxembourg 753 712 41
Melbourne 743 705 38
The Global Financial Centres Index 29
40
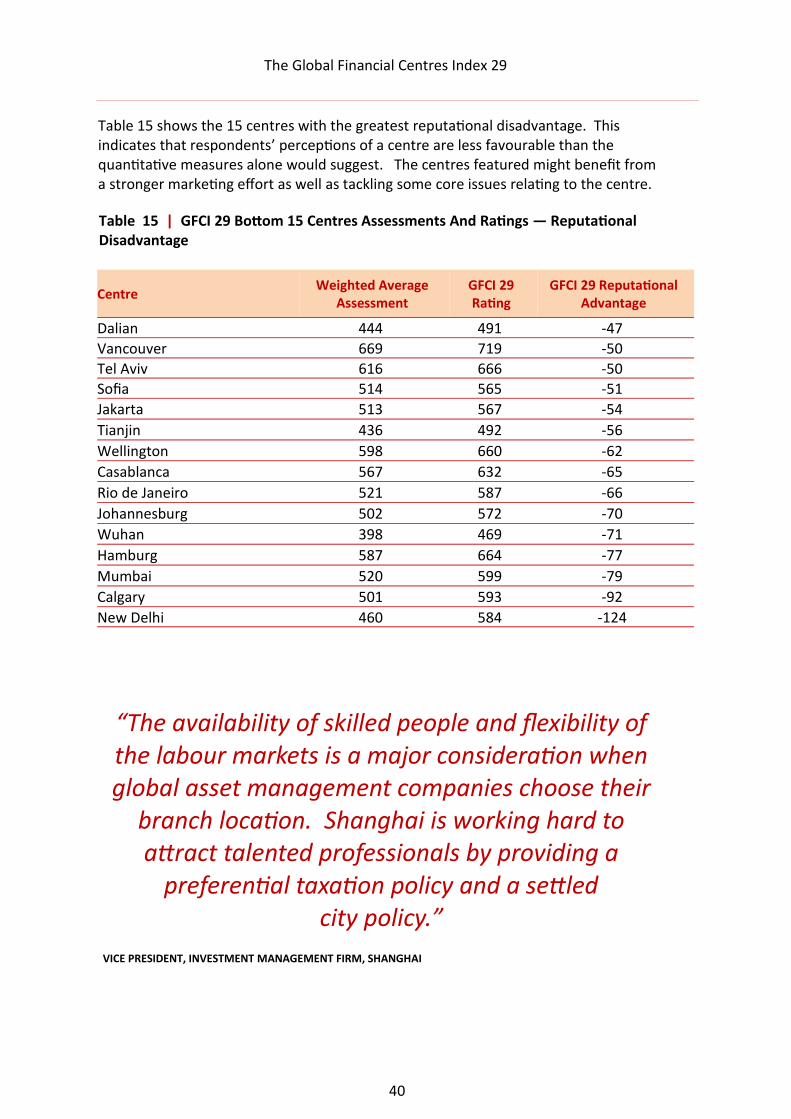
Table 15 shows the 15 centres with the greatest reputational disadvantage. This indicates that respondents’ perceptions of a centre are less favourable than the quantitative measures alone would suggest. The centres featured might benefit from a stronger marketing effort as well as tackling some core issues relating to the centre.
Table 15 | GFCI 29 Bottom 15 Centres Assessments And Ratings — Reputational Disadvantage
“The availability of skilled people and flexibility of the labour markets is a major consideration when global asset management companies choose their
branch location. Shanghai is working hard to attract talented professionals by providing a
preferential taxation policy and a settled city policy.”
VICE PRESIDENT, INVESTMENT MANAGEMENT FIRM, SHANGHAI
Centre Weighted Average
Assessment GFCI 29 Rating
GFCI 29 Reputational Advantage
Dalian 444 491 -47
Vancouver 669 719 -50
Tel Aviv 616 666 -50
Sofia 514 565 -51
Jakarta 513 567 -54
Tianjin 436 492 -56
Wellington 598 660 -62
Casablanca 567 632 -65
Rio de Janeiro 521 587 -66
Johannesburg 502 572 -70
Wuhan 398 469 -71
Hamburg 587 664 -77
Mumbai 520 599 -79
Calgary 501 593 -92
New Delhi 460 584 -124
The Global Financial Centres Index 29
41
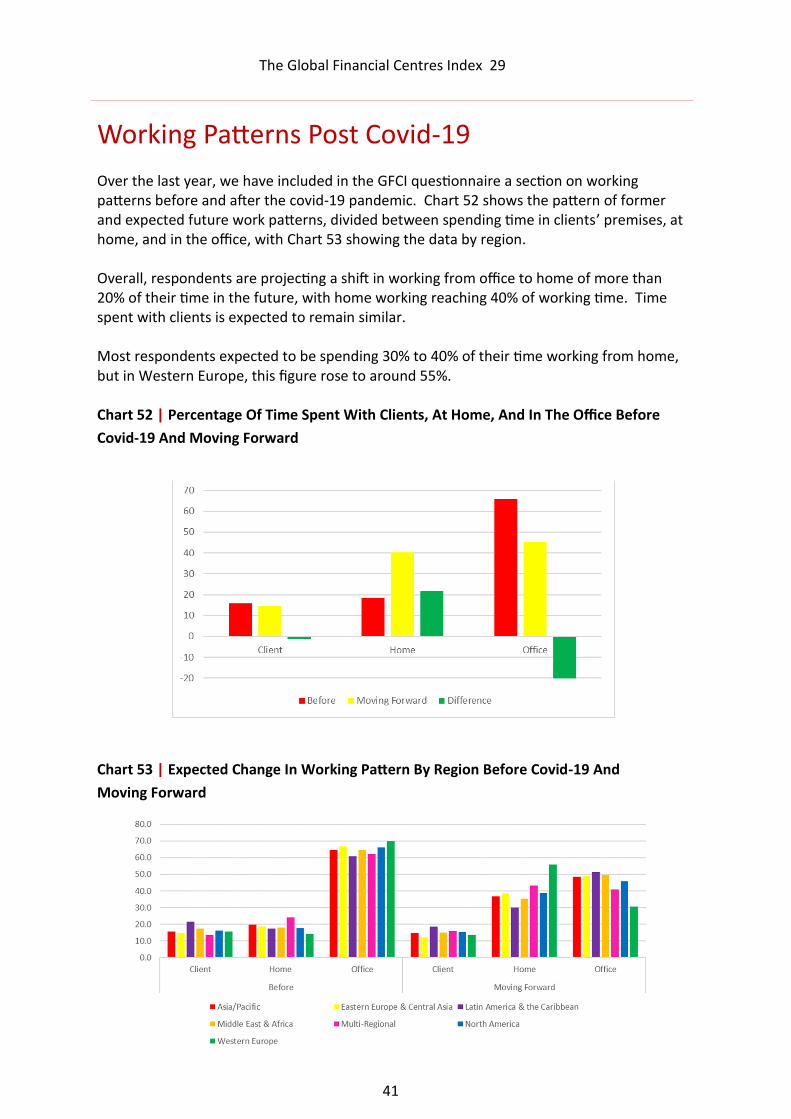
Working Patterns Post Covid-19 Over the last year, we have included in the GFCI questionnaire a section on working patterns before and after the covid-19 pandemic. Chart 52 shows the pattern of former and expected future work patterns, divided between spending time in clients’ premises, at home, and in the office, with Chart 53 showing the data by region. Overall, respondents are projecting a shift in working from office to home of more than 20% of their time in the future, with home working reaching 40% of working time. Time spent with clients is expected to remain similar. Most respondents expected to be spending 30% to 40% of their time working from home, but in Western Europe, this figure rose to around 55%. Chart 52 | Percentage Of Time Spent With Clients, At Home, And In The Office Before
Covid-19 And Moving Forward
Chart 53 | Expected Change In Working Pattern By Region Before Covid-19 And
Moving Forward
The Global Financial Centres Index 29
42
We asked respondents to comment on future working patterns. The main issues raised were: • The shift to online working and video conferencing is set to continue. • Staggered hours will become the norm and employment routines are likely to be
more flexible. • Processes were being digitized at a faster pace than before, with AI and machine
learning applications used more extensively. • Reduction in travel, especially long-haul, but with increased international
connectivity through digital means. • Financial centres will remain important, differentiated by regulatory structures,
ethics and values, although they may be organised as a looser network across a wider geographical area.
There is an expectation in organisations of all sizes that there will be a shift from office to home working. Smaller organisations, with fewer that 50 staff expect to work the most in an office going forward, with an expectation of 50% of time in the office. Chart 54 | Expected Change In Working Pattern By Region Before Covid-19 And Moving Forward
The Global Financial Centres Index 29
43
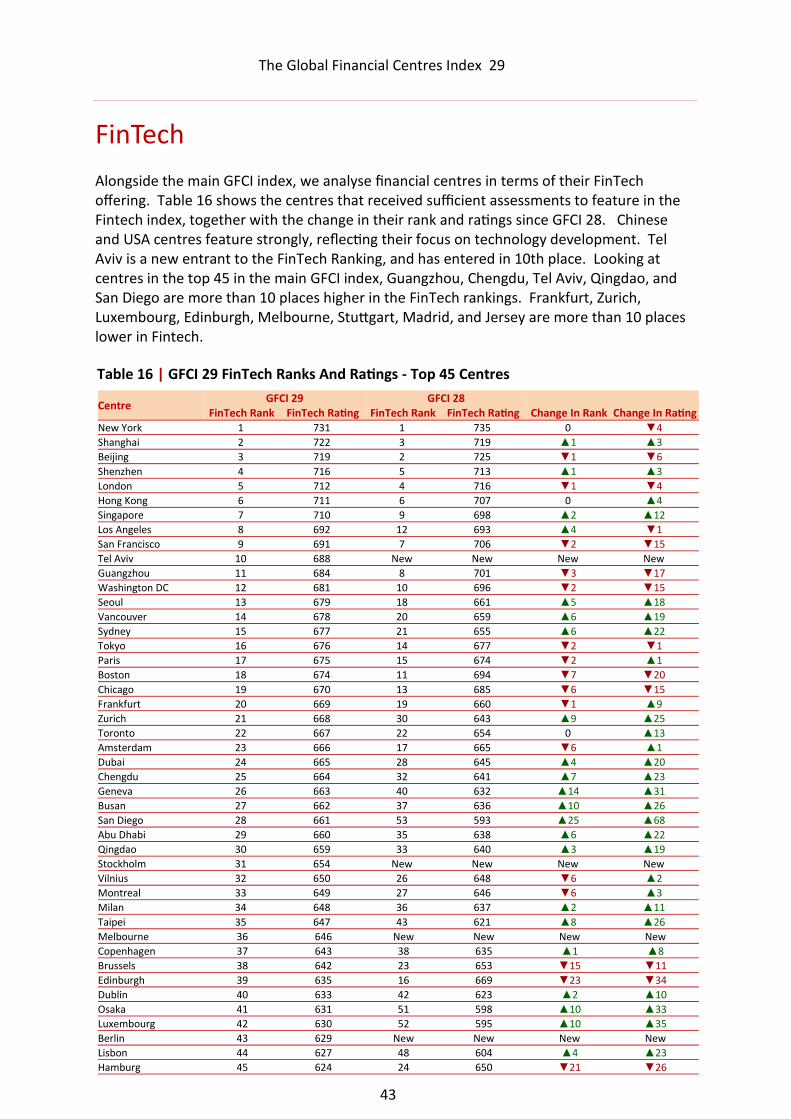
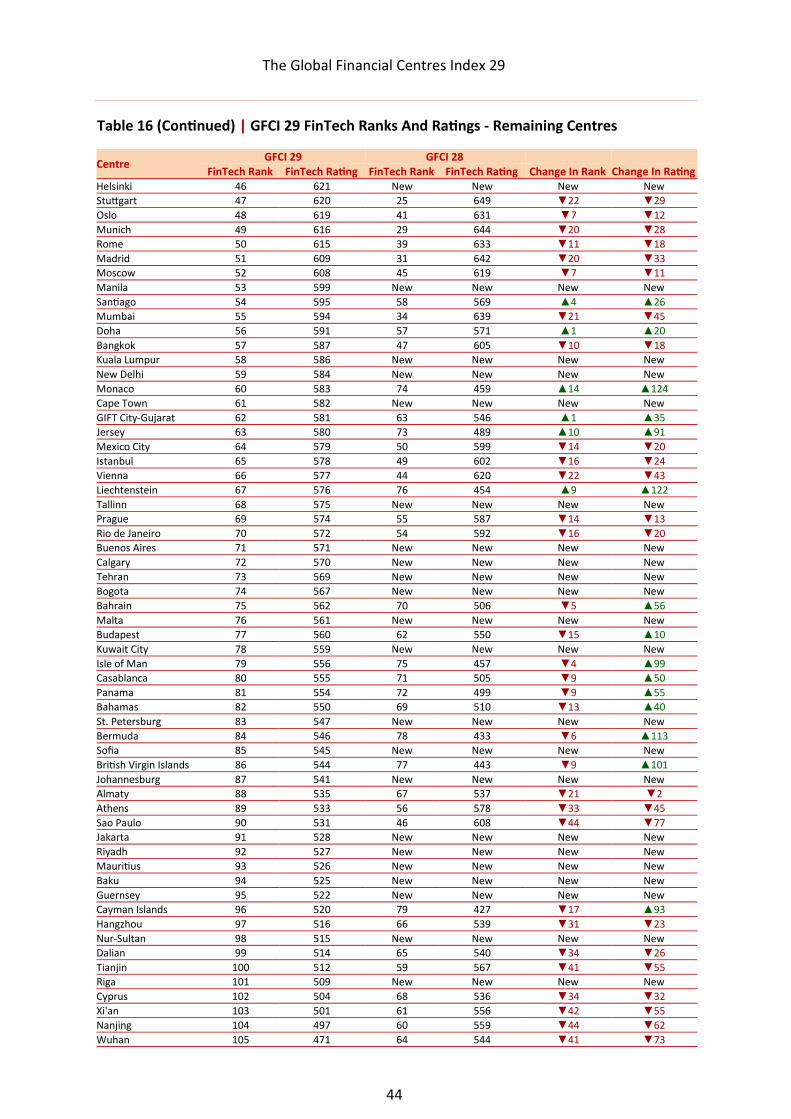
FinTech Alongside the main GFCI index, we analyse financial centres in terms of their FinTech offering. Table 16 shows the centres that received sufficient assessments to feature in the Fintech index, together with the change in their rank and ratings since GFCI 28. Chinese and USA centres feature strongly, reflecting their focus on technology development. Tel Aviv is a new entrant to the FinTech Ranking, and has entered in 10th place. Looking at centres in the top 45 in the main GFCI index, Guangzhou, Chengdu, Tel Aviv, Qingdao, and San Diego are more than 10 places higher in the FinTech rankings. Frankfurt, Zurich, Luxembourg, Edinburgh, Melbourne, Stuttgart, Madrid, and Jersey are more than 10 places lower in Fintech.
Table 16 | GFCI 29 FinTech Ranks And Ratings - Top 45 Centres
Centre GFCI 29 GFCI 28
FinTech Rank FinTech Rating FinTech Rank FinTech Rating Change In Rank Change In Rating New York 1 731 1 735 0 ▼4
Shanghai 2 722 3 719 ▲1 ▲3
Beijing 3 719 2 725 ▼1 ▼6
Shenzhen 4 716 5 713 ▲1 ▲3
London 5 712 4 716 ▼1 ▼4
Hong Kong 6 711 6 707 0 ▲4
Singapore 7 710 9 698 ▲2 ▲12
Los Angeles 8 692 12 693 ▲4 ▼1
San Francisco 9 691 7 706 ▼2 ▼15
Tel Aviv 10 688 New New New New
Guangzhou 11 684 8 701 ▼3 ▼17
Washington DC 12 681 10 696 ▼2 ▼15
Seoul 13 679 18 661 ▲5 ▲18
Vancouver 14 678 20 659 ▲6 ▲19
Sydney 15 677 21 655 ▲6 ▲22
Tokyo 16 676 14 677 ▼2 ▼1
Paris 17 675 15 674 ▼2 ▲1
Boston 18 674 11 694 ▼7 ▼20
Chicago 19 670 13 685 ▼6 ▼15
Frankfurt 20 669 19 660 ▼1 ▲9
Zurich 21 668 30 643 ▲9 ▲25
Toronto 22 667 22 654 0 ▲13
Amsterdam 23 666 17 665 ▼6 ▲1
Dubai 24 665 28 645 ▲4 ▲20
Chengdu 25 664 32 641 ▲7 ▲23
Geneva 26 663 40 632 ▲14 ▲31
Busan 27 662 37 636 ▲10 ▲26
San Diego 28 661 53 593 ▲25 ▲68
Abu Dhabi 29 660 35 638 ▲6 ▲22
Qingdao 30 659 33 640 ▲3 ▲19
Stockholm 31 654 New New New New
Vilnius 32 650 26 648 ▼6 ▲2
Montreal 33 649 27 646 ▼6 ▲3
Milan 34 648 36 637 ▲2 ▲11
Taipei 35 647 43 621 ▲8 ▲26
Melbourne 36 646 New New New New
Copenhagen 37 643 38 635 ▲1 ▲8
Brussels 38 642 23 653 ▼15 ▼11
Edinburgh 39 635 16 669 ▼23 ▼34
Dublin 40 633 42 623 ▲2 ▲10
Osaka 41 631 51 598 ▲10 ▲33
Luxembourg 42 630 52 595 ▲10 ▲35
Berlin 43 629 New New New New
Lisbon 44 627 48 604 ▲4 ▲23
Hamburg 45 624 24 650 ▼21 ▼26
The Global Financial Centres Index 29
44
Centre GFCI 29 GFCI 28
FinTech Rank FinTech Rating FinTech Rank FinTech Rating Change In Rank Change In Rating Helsinki 46 621 New New New New
Stuttgart 47 620 25 649 ▼22 ▼29
Oslo 48 619 41 631 ▼7 ▼12
Munich 49 616 29 644 ▼20 ▼28
Rome 50 615 39 633 ▼11 ▼18
Madrid 51 609 31 642 ▼20 ▼33
Moscow 52 608 45 619 ▼7 ▼11
Manila 53 599 New New New New
Santiago 54 595 58 569 ▲4 ▲26
Mumbai 55 594 34 639 ▼21 ▼45
Doha 56 591 57 571 ▲1 ▲20
Bangkok 57 587 47 605 ▼10 ▼18
Kuala Lumpur 58 586 New New New New
New Delhi 59 584 New New New New
Monaco 60 583 74 459 ▲14 ▲124
Cape Town 61 582 New New New New
GIFT City-Gujarat 62 581 63 546 ▲1 ▲35
Jersey 63 580 73 489 ▲10 ▲91
Mexico City 64 579 50 599 ▼14 ▼20
Istanbul 65 578 49 602 ▼16 ▼24
Vienna 66 577 44 620 ▼22 ▼43
Liechtenstein 67 576 76 454 ▲9 ▲122
Tallinn 68 575 New New New New
Prague 69 574 55 587 ▼14 ▼13
Rio de Janeiro 70 572 54 592 ▼16 ▼20
Buenos Aires 71 571 New New New New
Calgary 72 570 New New New New
Tehran 73 569 New New New New
Bogota 74 567 New New New New
Bahrain 75 562 70 506 ▼5 ▲56
Malta 76 561 New New New New
Budapest 77 560 62 550 ▼15 ▲10
Kuwait City 78 559 New New New New
Isle of Man 79 556 75 457 ▼4 ▲99
Casablanca 80 555 71 505 ▼9 ▲50
Panama 81 554 72 499 ▼9 ▲55
Bahamas 82 550 69 510 ▼13 ▲40
St. Petersburg 83 547 New New New New
Bermuda 84 546 78 433 ▼6 ▲113
Sofia 85 545 New New New New
British Virgin Islands 86 544 77 443 ▼9 ▲101
Johannesburg 87 541 New New New New
Almaty 88 535 67 537 ▼21 ▼2
Athens 89 533 56 578 ▼33 ▼45
Sao Paulo 90 531 46 608 ▼44 ▼77
Jakarta 91 528 New New New New
Riyadh 92 527 New New New New
Mauritius 93 526 New New New New
Baku 94 525 New New New New
Guernsey 95 522 New New New New
Cayman Islands 96 520 79 427 ▼17 ▲93
Hangzhou 97 516 66 539 ▼31 ▼23
Nur-Sultan 98 515 New New New New
Dalian 99 514 65 540 ▼34 ▼26
Tianjin 100 512 59 567 ▼41 ▼55
Riga 101 509 New New New New
Cyprus 102 504 68 536 ▼34 ▼32
Xi'an 103 501 61 556 ▼42 ▼55
Nanjing 104 497 60 559 ▼44 ▼62
Wuhan 105 471 64 544 ▼41 ▼73
Table 16 (Continued) | GFCI 29 FinTech Ranks And Ratings - Remaining Centres
The Global Financial Centres Index 29
45
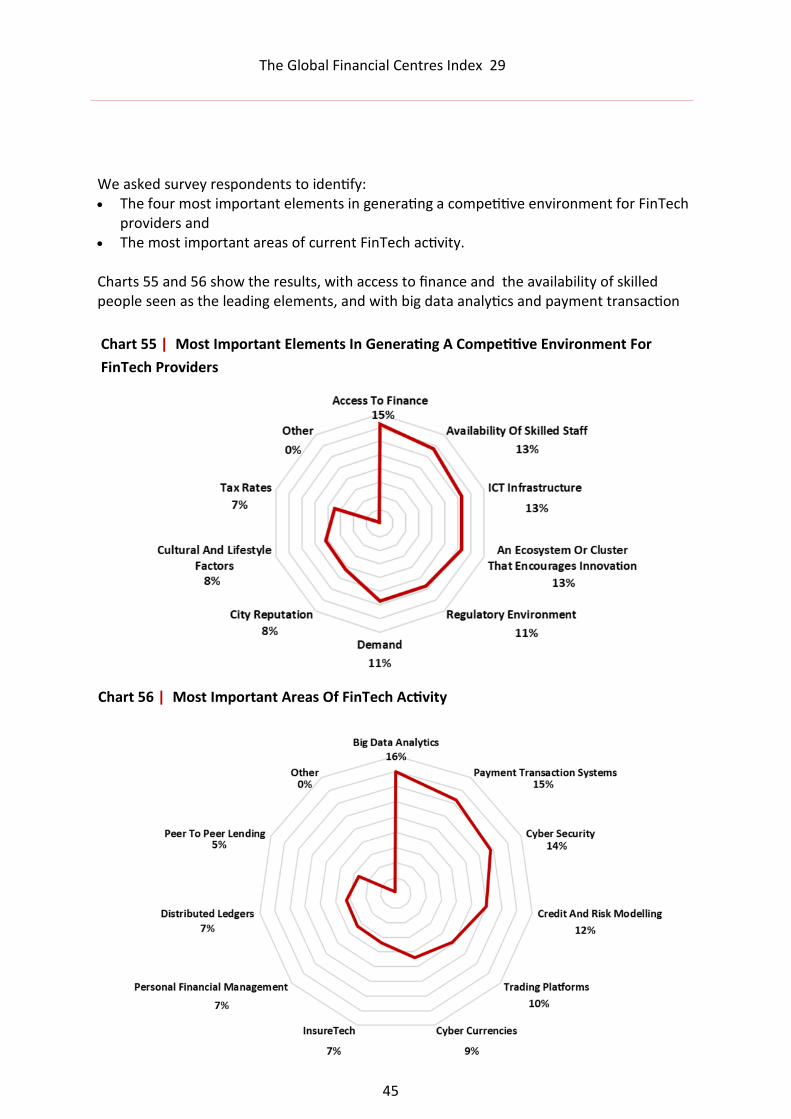
Chart 56 | Most Important Areas Of FinTech Activity
We asked survey respondents to identify: • The four most important elements in generating a competitive environment for FinTech
providers and • The most important areas of current FinTech activity. Charts 55 and 56 show the results, with access to finance and the availability of skilled people seen as the leading elements, and with big data analytics and payment transaction
Chart 55 | Most Important Elements In Generating A Competitive Environment For
FinTech Providers
The Global Financial Centres Index 29
46
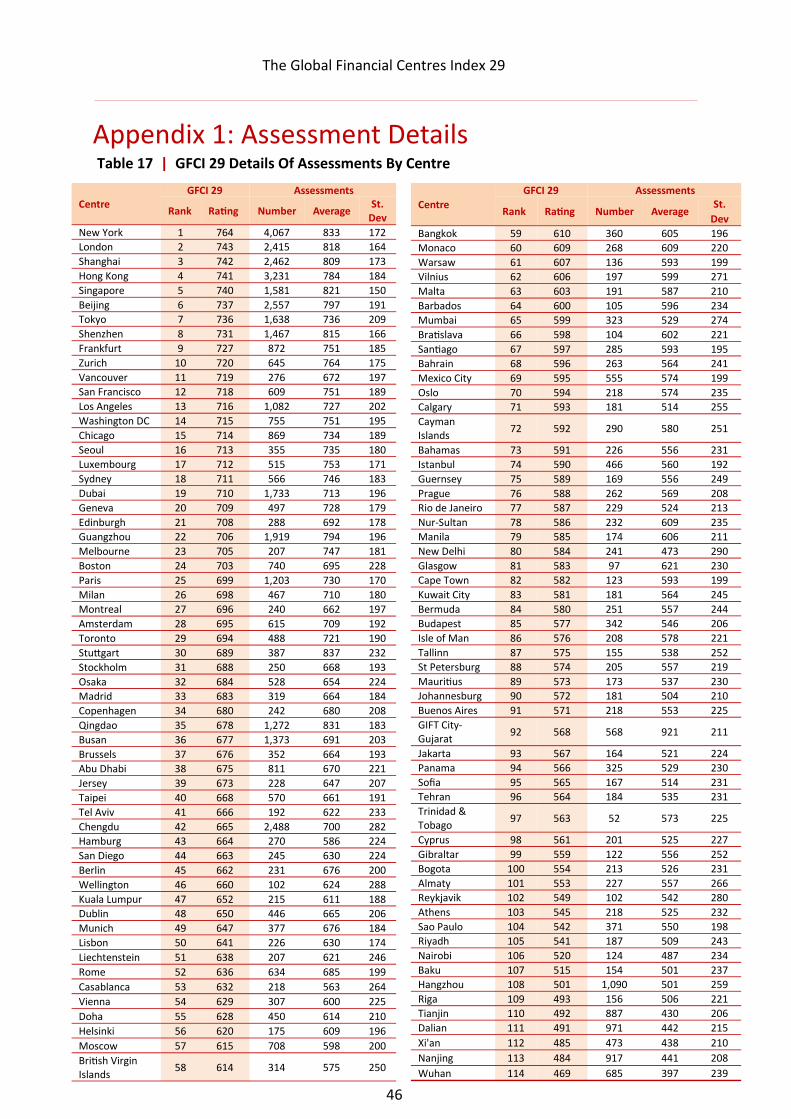
Appendix 1: Assessment Details
Centre GFCI 29 Assessments
Rank Rating Number Average St.
Dev
New York 1 764 4,067 833 172
London 2 743 2,415 818 164
Shanghai 3 742 2,462 809 173
Hong Kong 4 741 3,231 784 184
Singapore 5 740 1,581 821 150
Beijing 6 737 2,557 797 191
Tokyo 7 736 1,638 736 209
Shenzhen 8 731 1,467 815 166
Frankfurt 9 727 872 751 185
Zurich 10 720 645 764 175
Vancouver 11 719 276 672 197
San Francisco 12 718 609 751 189
Los Angeles 13 716 1,082 727 202
Washington DC 14 715 755 751 195
Chicago 15 714 869 734 189
Seoul 16 713 355 735 180
Luxembourg 17 712 515 753 171
Sydney 18 711 566 746 183
Dubai 19 710 1,733 713 196
Geneva 20 709 497 728 179
Edinburgh 21 708 288 692 178
Guangzhou 22 706 1,919 794 196
Melbourne 23 705 207 747 181
Boston 24 703 740 695 228
Paris 25 699 1,203 730 170
Milan 26 698 467 710 180
Montreal 27 696 240 662 197
Amsterdam 28 695 615 709 192
Toronto 29 694 488 721 190
Stuttgart 30 689 387 837 232
Stockholm 31 688 250 668 193
Osaka 32 684 528 654 224
Madrid 33 683 319 664 184
Copenhagen 34 680 242 680 208
Qingdao 35 678 1,272 831 183
Busan 36 677 1,373 691 203
Brussels 37 676 352 664 193
Abu Dhabi 38 675 811 670 221
Jersey 39 673 228 647 207
Taipei 40 668 570 661 191
Tel Aviv 41 666 192 622 233
Chengdu 42 665 2,488 700 282
Hamburg 43 664 270 586 224
San Diego 44 663 245 630 224
Berlin 45 662 231 676 200
Wellington 46 660 102 624 288
Kuala Lumpur 47 652 215 611 188
Dublin 48 650 446 665 206
Munich 49 647 377 676 184
Lisbon 50 641 226 630 174
Liechtenstein 51 638 207 621 246
Rome 52 636 634 685 199
Casablanca 53 632 218 563 264
Vienna 54 629 307 600 225
Doha 55 628 450 614 210
Helsinki 56 620 175 609 196
Moscow 57 615 708 598 200
British Virgin Islands
58 614 314 575 250
Centre
GFCI 29 Assessments
Rank Rating Number Average St.
Dev
Bangkok 59 610 360 605 196
Monaco 60 609 268 609 220
Warsaw 61 607 136 593 199
Vilnius 62 606 197 599 271
Malta 63 603 191 587 210
Barbados 64 600 105 596 234
Mumbai 65 599 323 529 274
Bratislava 66 598 104 602 221
Santiago 67 597 285 593 195
Bahrain 68 596 263 564 241
Mexico City 69 595 555 574 199
Oslo 70 594 218 574 235
Calgary 71 593 181 514 255
Cayman Islands
72 592 290 580 251
Bahamas 73 591 226 556 231
Istanbul 74 590 466 560 192
Guernsey 75 589 169 556 249
Prague 76 588 262 569 208
Rio de Janeiro 77 587 229 524 213
Nur-Sultan 78 586 232 609 235
Manila 79 585 174 606 211
New Delhi 80 584 241 473 290
Glasgow 81 583 97 621 230
Cape Town 82 582 123 593 199
Kuwait City 83 581 181 564 245
Bermuda 84 580 251 557 244
Budapest 85 577 342 546 206
Isle of Man 86 576 208 578 221
Tallinn 87 575 155 538 252
St Petersburg 88 574 205 557 219
Mauritius 89 573 173 537 230
Johannesburg 90 572 181 504 210
Buenos Aires 91 571 218 553 225
GIFT City-Gujarat
92 568 568 921 211
Jakarta 93 567 164 521 224
Panama 94 566 325 529 230
Sofia 95 565 167 514 231
Tehran 96 564 184 535 231
Trinidad & Tobago
97 563 52 573 225
Cyprus 98 561 201 525 227
Gibraltar 99 559 122 556 252
Bogota 100 554 213 526 231
Almaty 101 553 227 557 266
Reykjavik 102 549 102 542 280
Athens 103 545 218 525 232
Sao Paulo 104 542 371 550 198
Riyadh 105 541 187 509 243
Nairobi 106 520 124 487 234
Baku 107 515 154 501 237
Hangzhou 108 501 1,090 501 259
Riga 109 493 156 506 221
Tianjin 110 492 887 430 206
Dalian 111 491 971 442 215
Xi'an 112 485 473 438 210
Nanjing 113 484 917 441 208
Wuhan 114 469 685 397 239
Table 17 | GFCI 29 Details Of Assessments By Centre
The Global Financial Centres Index 29
47
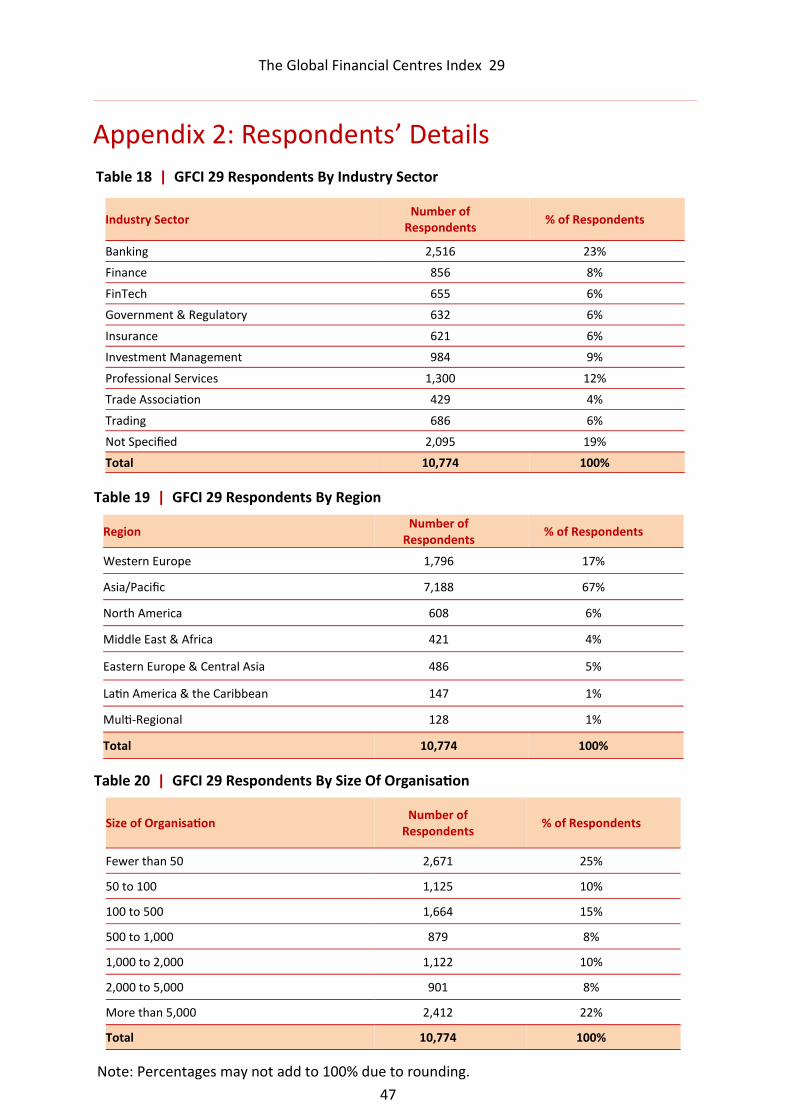
Appendix 2: Respondents’ Details
Table 18 | GFCI 29 Respondents By Industry Sector
Table 19 | GFCI 29 Respondents By Region
Table 20 | GFCI 29 Respondents By Size Of Organisation
Industry Sector Number of
Respondents % of Respondents
Banking 2,516 23%
Finance 856 8%
FinTech 655 6%
Government & Regulatory 632 6%
Insurance 621 6%
Investment Management 984 9%
Professional Services 1,300 12%
Trade Association 429 4%
Trading 686 6%
Not Specified 2,095 19%
Total 10,774 100%
Region Number of
Respondents % of Respondents
Western Europe 1,796 17%
Asia/Pacific 7,188 67%
North America 608 6%
Middle East & Africa 421 4%
Eastern Europe & Central Asia 486 5%
Latin America & the Caribbean 147 1%
Multi-Regional 128 1%
Total 10,774 100%
Size of Organisation Number of
Respondents % of Respondents
Fewer than 50 2,671 25%
50 to 100 1,125 10%
100 to 500 1,664 15%
500 to 1,000 879 8%
1,000 to 2,000 1,122 10%
2,000 to 5,000 901 8%
More than 5,000 2,412 22%
Total 10,774 100%
Note: Percentages may not add to 100% due to rounding.
The Global Financial Centres Index 29
48
Appendix 3: Methodology The GFCI provides ratings for financial centres calculated by a ‘factor assessment model’ that uses two distinct sets of input: Instrumental factors: objective evidence of competitiveness was sought from a wide variety of comparable sources. For example, evidence about the telecommunications infrastructure competitiveness of a financial centre is drawn from the ICT Development Index (supplied by the United Nations), the Networked Readiness Index (supplied by the World Economic Forum), the Telecommunication Infrastructure Index (by the United Nations) and the Web Index (supplied by the World Wide Web Foundation). Evidence about a business-friendly regulatory environment is drawn from the Ease of Doing Business Index (supplied by the World Bank), the Government Effectiveness rating (supplied by the World Bank) and the Corruption Perceptions Index (supplied by Transparency International) amongst others. A total of 143 instrumental factors are used in GFCI 29 of which 53 were updated since GFCI 28 and 9 are new to the GFCI. Not all financial centres are represented in all the external sources, and the statistical model takes account of these gaps. Financial centre assessments: by means of an online questionnaire, running continuously since 2007. We received 11,009 responses to the questionnaire in the 24 months to December 2020. Of these 10,774 respondents provided 65,507 valid assessments of financial centres. Financial centres are added to the GFCI questionnaire when they receive five or more mentions in the online questionnaire in response to the question: ‘Are there any financial centres that might become significantly more important over the next two to three years?’ A centre is only given a GFCI rating and ranking if it receives more than 150 assessments from people based in other centres over time in the online survey. Centres in the GFCI that do not receive 50 assessments in a 24 month period are removed and added to the associate list until the number of assessments increases. At the beginning of our work on the GFCI, a number of guidelines were set out. Additional Instrumental Factors are added to the GFCI model when relevant and meaningful ones are discovered: • indices should come from a reputable body and be derived by a sound
methodology;
• indices should be readily available (ideally in the public domain) and be regularly updated;
• updates to the indices are collected and collated every six months;
• no weightings are applied to indices; • Indices are entered into the GFCI model as directly as possible, whether this is a
rank, a derived score , a value, a distribution around a mean, or a distribution around a benchmark;
• if a factor is at a national level, the score will be used for all centres in that country; nation-based factors will be avoided if financial centre (city) - based factors are available;
The Global Financial Centres Index 29
49
• if an index has multiple values for a city or nation, the most relevant value is used (and the method for judging relevance is noted);
• if an index is at a regional level, the most relevant allocation of scores to each centre is made (and the method for judging relevance is noted);
• if an index does not contain a value for a particular city, a blank is entered against that centre (no average or mean is used).
Creating the GFCI does not involve totalling or averaging scores across instrumental factors. An approach involving totalling and averaging would involve a number of difficulties: • indices are published in a variety of different forms: an average or base point of
100 with scores above and below this; a simple ranking; actual values (e.g. $ per square foot of occupancy costs); a composite ‘score’;
• indices would have to be normalised, e.g. in some indices a high score is positive while in others a low score is positive;
• not all centres are included in all indices;
• the indices would have to be weighted. The guidelines for financial centre assessments by respondents are: • responses are collected via an online questionnaire which runs continuously. A link
to this questionnaire is emailed to the target list of respondents at regular intervals and other interested parties can fill this in by following the link given in the GFCI publications;
• financial centre assessments will be included in the GFCI model for 24 months after they have been received;
• respondents rating fewer than three or more than half of the centres are excluded from the model;
• respondents who do not say where they work are excluded;
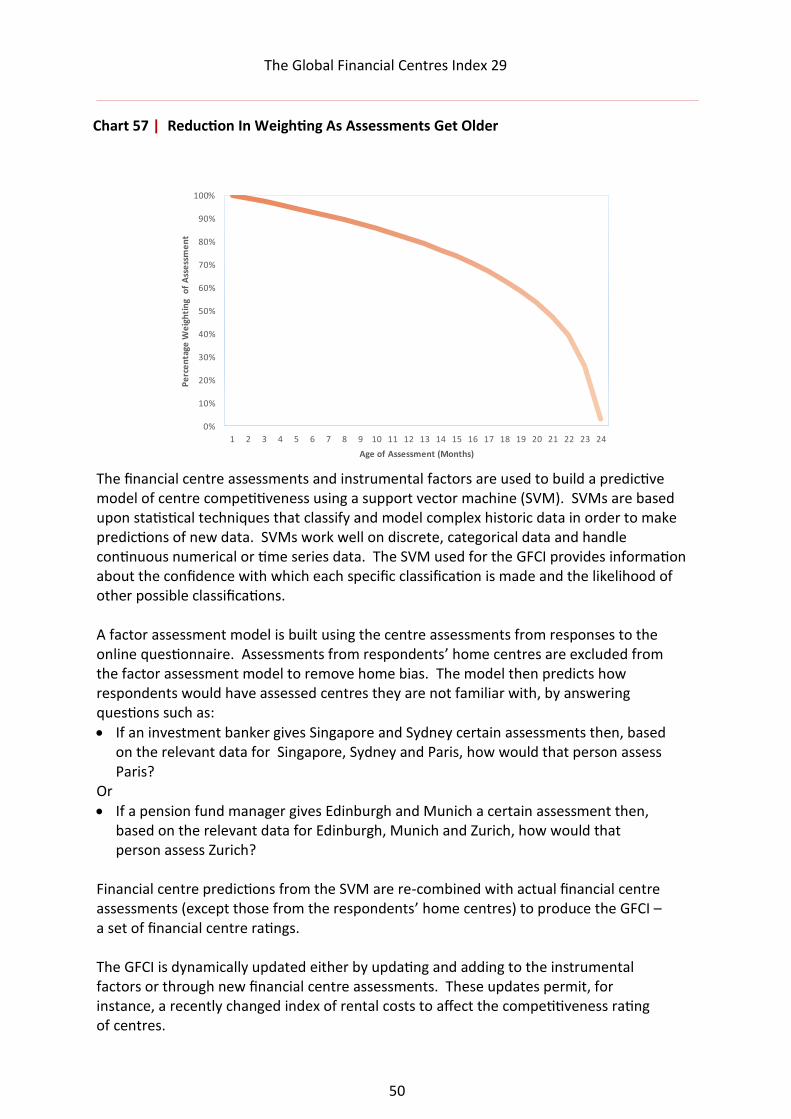
• financial centre assessments from the month when the GFCI is created are given full weighting and earlier responses are given a reduced weighting on a log scale.
The Global Financial Centres Index 29
50
Chart 57 | Reduction In Weighting As Assessments Get Older
0%
10%
20%
30%
40%
50%
60%
70%
80%
90%
100%
1 2 3 4 5 6 7 8 9 10 11 12 13 14 15 16 17 18 19 20 21 22 23 24
Pe
rce
nta
ge W
eig
hti
ng
of
Ass
ess
me
nt
Age of Assessment (Months)
The financial centre assessments and instrumental factors are used to build a predictive model of centre competitiveness using a support vector machine (SVM). SVMs are based upon statistical techniques that classify and model complex historic data in order to make predictions of new data. SVMs work well on discrete, categorical data and handle continuous numerical or time series data. The SVM used for the GFCI provides information about the confidence with which each specific classification is made and the likelihood of other possible classifications. A factor assessment model is built using the centre assessments from responses to the online questionnaire. Assessments from respondents’ home centres are excluded from the factor assessment model to remove home bias. The model then predicts how respondents would have assessed centres they are not familiar with, by answering questions such as: • If an investment banker gives Singapore and Sydney certain assessments then, based
on the relevant data for Singapore, Sydney and Paris, how would that person assess Paris?
Or • If a pension fund manager gives Edinburgh and Munich a certain assessment then,
based on the relevant data for Edinburgh, Munich and Zurich, how would that person assess Zurich?
Financial centre predictions from the SVM are re-combined with actual financial centre assessments (except those from the respondents’ home centres) to produce the GFCI – a set of financial centre ratings. The GFCI is dynamically updated either by updating and adding to the instrumental factors or through new financial centre assessments. These updates permit, for instance, a recently changed index of rental costs to affect the competitiveness rating of centres.
The Global Financial Centres Index 29
51
It is worth drawing attention to a few consequences of basing the GFCI on instrumental factors and questionnaire responses: • several indices can be used for each competitive factor;
• a strong international group of ‘raters’ has developed as the GFCI progresses; • sector-specific ratings are available using the business sectors represented by
questionnaire respondents. This makes it possible to rate Frankfurt as competitive in Banking (for example) while less competitive Insurance (for example);
• the factor assessment model can be queried in a ‘what if’ mode – ‘how much would London rental costs need to fall in order to increase London’s ranking against New York?’
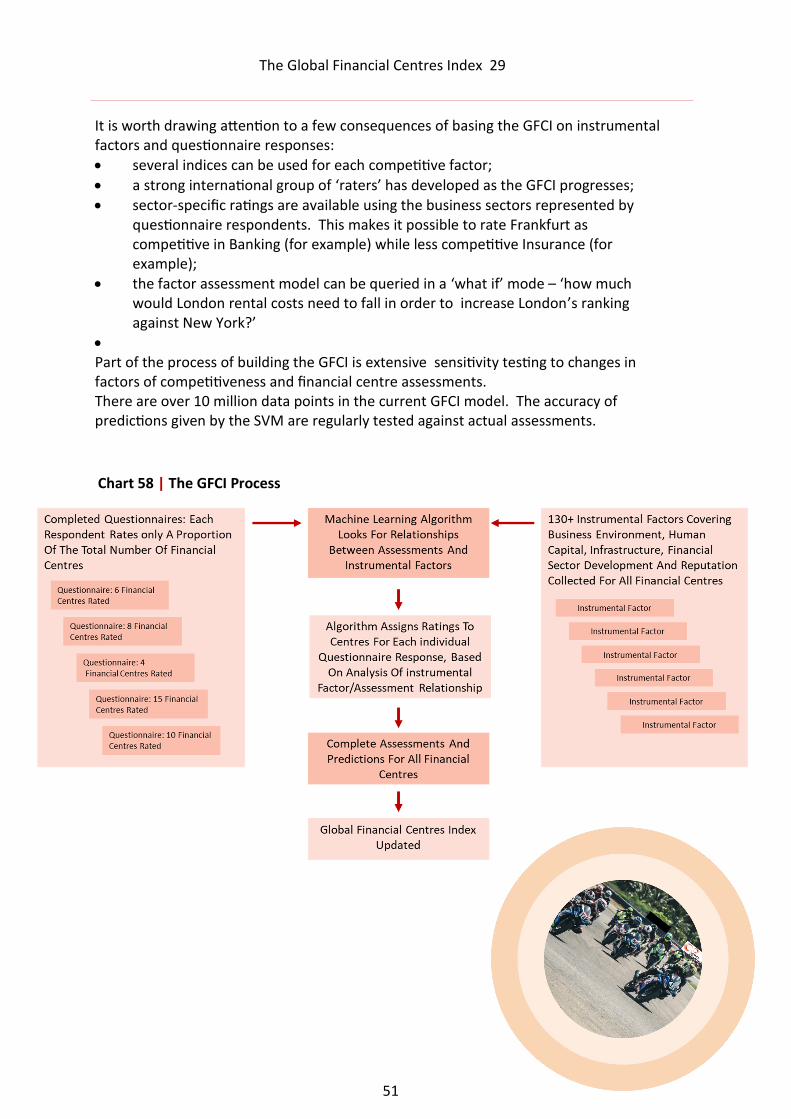
• Part of the process of building the GFCI is extensive sensitivity testing to changes in factors of competitiveness and financial centre assessments. There are over 10 million data points in the current GFCI model. The accuracy of predictions given by the SVM are regularly tested against actual assessments.
Chart 58 | The GFCI Process
The Global Financial Centres Index 29
52
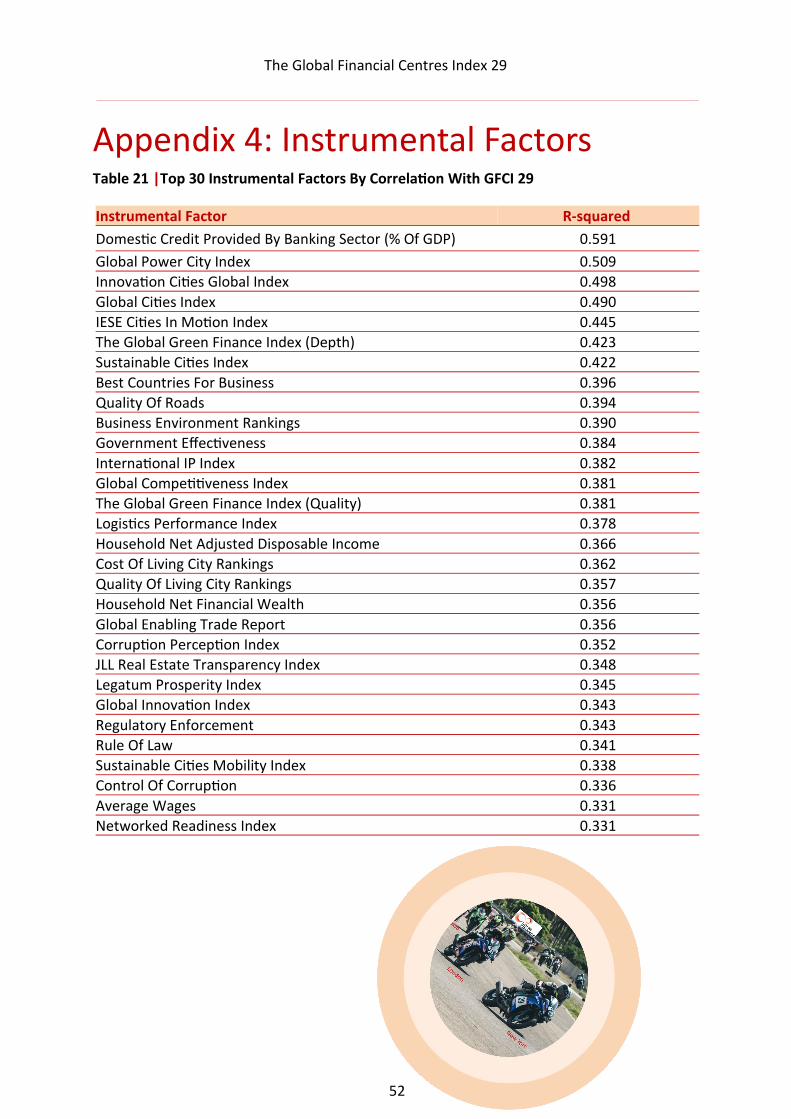
Appendix 4: Instrumental Factors Table 21 |Top 30 Instrumental Factors By Correlation With GFCI 29
Instrumental Factor R-squared
Domestic Credit Provided By Banking Sector (% Of GDP) 0.591
Global Power City Index 0.509
Innovation Cities Global Index 0.498
Global Cities Index 0.490
IESE Cities In Motion Index 0.445
The Global Green Finance Index (Depth) 0.423
Sustainable Cities Index 0.422
Best Countries For Business 0.396
Quality Of Roads 0.394
Business Environment Rankings 0.390
Government Effectiveness 0.384
International IP Index 0.382
Global Competitiveness Index 0.381
The Global Green Finance Index (Quality) 0.381
Logistics Performance Index 0.378
Household Net Adjusted Disposable Income 0.366
Cost Of Living City Rankings 0.362
Quality Of Living City Rankings 0.357
Household Net Financial Wealth 0.356
Global Enabling Trade Report 0.356
Corruption Perception Index 0.352
JLL Real Estate Transparency Index 0.348
Legatum Prosperity Index 0.345
Global Innovation Index 0.343
Regulatory Enforcement 0.343
Rule Of Law 0.341
Sustainable Cities Mobility Index 0.338
Control Of Corruption 0.336
Average Wages 0.331
Networked Readiness Index 0.331
The Global Financial Centres Index 29
53
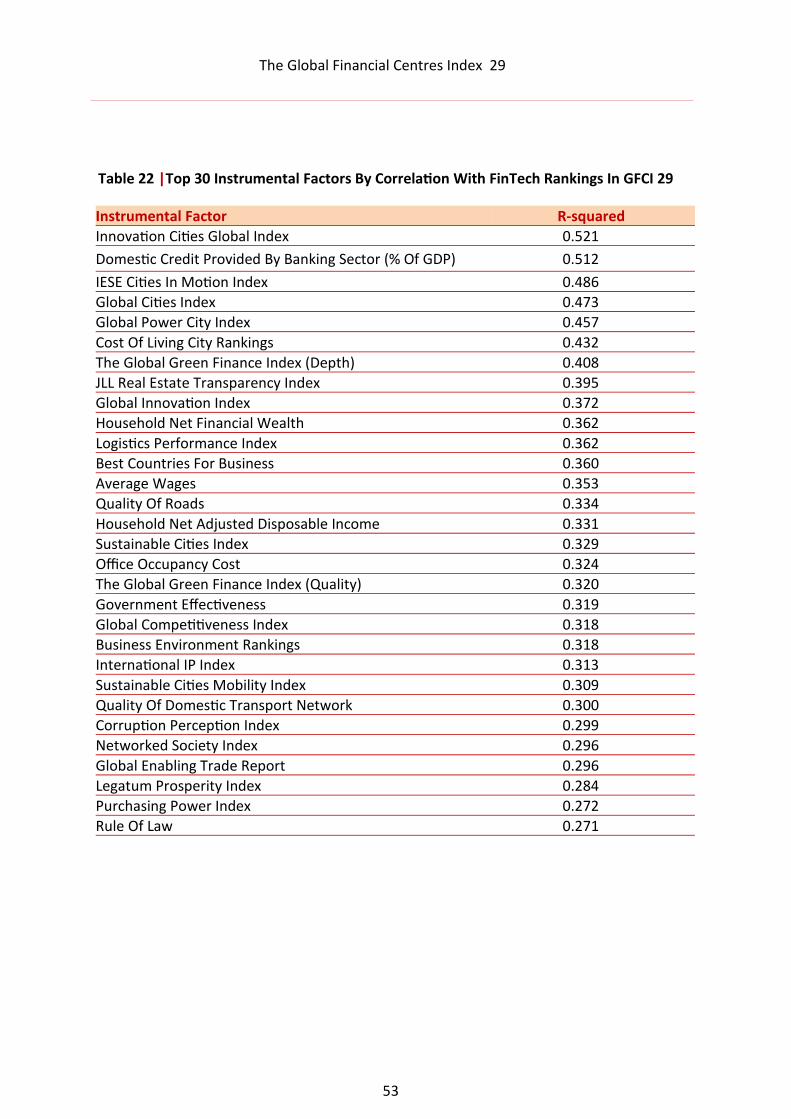
Table 22 |Top 30 Instrumental Factors By Correlation With FinTech Rankings In GFCI 29
Instrumental Factor R-squared
Innovation Cities Global Index 0.521
Domestic Credit Provided By Banking Sector (% Of GDP) 0.512
IESE Cities In Motion Index 0.486
Global Cities Index 0.473
Global Power City Index 0.457
Cost Of Living City Rankings 0.432
The Global Green Finance Index (Depth) 0.408
JLL Real Estate Transparency Index 0.395
Global Innovation Index 0.372
Household Net Financial Wealth 0.362
Logistics Performance Index 0.362
Best Countries For Business 0.360
Average Wages 0.353
Quality Of Roads 0.334
Household Net Adjusted Disposable Income 0.331
Sustainable Cities Index 0.329
Office Occupancy Cost 0.324
The Global Green Finance Index (Quality) 0.320
Government Effectiveness 0.319
Global Competitiveness Index 0.318
Business Environment Rankings 0.318
International IP Index 0.313
Sustainable Cities Mobility Index 0.309
Quality Of Domestic Transport Network 0.300
Corruption Perception Index 0.299
Networked Society Index 0.296
Global Enabling Trade Report 0.296
Legatum Prosperity Index 0.284
Purchasing Power Index 0.272
Rule Of Law 0.271
The Global Financial Centres Index 29
54
Table 23 | GFCI 29 Business Environment Factors
Instrumental Factor Source Website
Change
Since
GFCI 28
Business Environment Rankings EIU http://country.eiu.com/All Updated
Ease Of Doing Business Index The World Bank https://www.doingbusiness.org/en/reports/global-reports/doing-business-2020
Operational Risk Rating EIU http://viewswire.eiu.com/site_info.asp?info_name=VW2_RISK_nib&page=rk&page_title=Risk%20table
Updated
Real Interest Rate The World Bank https://databank.worldbank.org/reports.aspx?source=world-development-indicators&series=FR.INR.RINR
Updated
Global Services Location AT Kearney https://www.atkearney.com/digital-transformation/gsli
Corruption Perception Index Transparency International
https://www.transparency.org/en/cpi/2019/
Average Wages UBS https://www.ubs.com/microsites/prices-earnings/en/
Corporate Tax Rates PWC https://www.pwc.com/payingtaxes
Individual Income Tax Rates KPMG https://home.kpmg.com/xx/en/home/services/tax/tax-tools-and-resources/tax-rates-online/individual-income-tax-rates-table.html
Personal Tax Rates OECD https://stats.oecd.org/index.aspx?DataSetCode=TABLE_I6
Tax Revenue As Percentage Of GDP The World Bank https://databank.worldbank.org/reports.aspx?source=2&series=GC.TAX.TOTL.GD.ZS&country=#
Updated
Bilateral Tax Information Exchange Agreements
OECD http://www.oecd.org/ctp/exchange-of-tax-information/taxinformationexchangeagreementstieas.htm
Economic Freedom Of The World Fraser Institute https://www.fraserinstitute.org/economic-freedom/map?geozone=world&page=map&year=2018
Updated
Government Debt As % Of GDP CIA https://www.cia.gov/library/publications/the-world-factbook/rankorder/2186rank.html
OECD Country Risk Classification OECD http://www.oecd.org/trade/topics/export-credits/documents/cre-crc-current-english.pdf
Updated
Global Peace Index Institute for Economics & Peace
https://www.visionofhumanity.org/maps/#/
Financial Secrecy Index Tax Justice Network http://www.financialsecrecyindex.com/
Government Effectiveness The World Bank http://info.worldbank.org/governance/wgi/ Updated
Open Government World Justice Project http://worldjusticeproject.org/rule-of-law-index
Regulatory Enforcement World Justice Project http://worldjusticeproject.org/rule-of-law-index
Press Freedom Index Reporters Without Borders (RSF)
https://rsf.org/en/ranking/2020
Currencies Swiss Association for Standardization (SNV)
http://www.currency-iso.org/en/home/tables/table-a1.html
Updated
Commonwealth Countries The Commonwealth http://thecommonwealth.org/member-countries
Common Law Countries CIA https://www.cia.gov/library/publications/the-world-factbook/fields/308.html
Inflation, GDP Deflator The World Bank https://data.worldbank.org/indicator/NY.GDP.DEFL.KD.ZG
Updated
Rule Of Law The World Bank http://info.worldbank.org/governance/wgi/ Updated
Political Stability And Absence Of Violence/Terrorism
The World Bank http://info.worldbank.org/governance/wgi/ Updated
Regulatory Quality The World Bank http://info.worldbank.org/governance/wgi/ Updated
Control of Corruption The World Bank http://info.worldbank.org/governance/wgi/ Updated
Best Countries For Business Forbes https://www.forbes.com/best-countries-for-business/list/
Lloyd’s City Risk Index 2015-2025 Lloyd’s https://cityriskindex.lloyds.com/about/
Global Cybersecurity Index ITU http://www.itu.int/en/ITU-D/Cybersecurity/Pages/GCI.aspx
Open Budget Survey International Budget Partnership
http://survey.internationalbudget.org/#download
Democracy Index The Economist https://www.eiu.com/topic/democracy-index
FATF AML Effectiveness FATF http://www.fatf-gafi.org/media/fatf/documents/4th-Round-Ratings.pdf
New
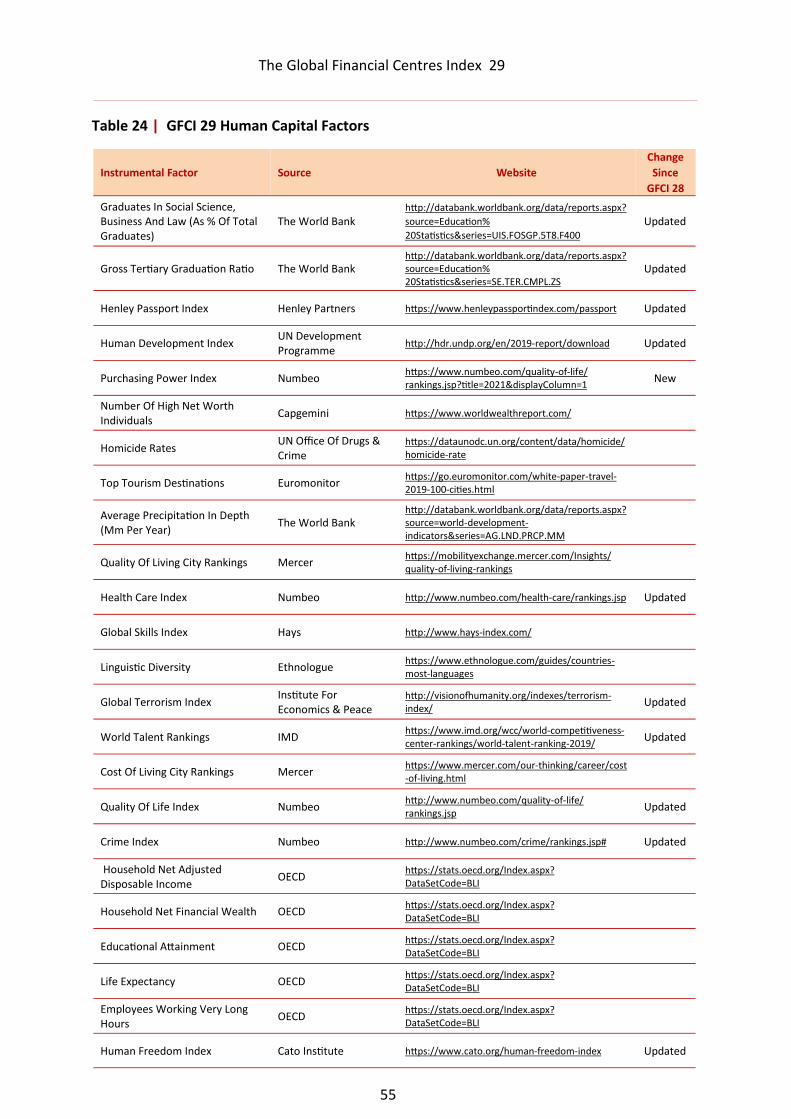
The Global Financial Centres Index 29
55
Table 24 | GFCI 29 Human Capital Factors
Instrumental Factor Source Website
Change
Since
GFCI 28
Graduates In Social Science, Business And Law (As % Of Total Graduates)
The World Bank http://databank.worldbank.org/data/reports.aspx?
source=Education%
20Statistics&series=UIS.FOSGP.5T8.F400 Updated
Gross Tertiary Graduation Ratio The World Bank http://databank.worldbank.org/data/reports.aspx?source=Education%20Statistics&series=SE.TER.CMPL.ZS
Updated
Henley Passport Index Henley Partners https://www.henleypassportindex.com/passport Updated
Human Development Index UN Development Programme
http://hdr.undp.org/en/2019-report/download Updated
Purchasing Power Index Numbeo https://www.numbeo.com/quality-of-life/rankings.jsp?title=2021&displayColumn=1 New
Number Of High Net Worth Individuals Capgemini https://www.worldwealthreport.com/
Homicide Rates UN Office Of Drugs & Crime
https://dataunodc.un.org/content/data/homicide/homicide-rate
Top Tourism Destinations Euromonitor https://go.euromonitor.com/white-paper-travel-2019-100-cities.html
Average Precipitation In Depth (Mm Per Year)
The World Bank http://databank.worldbank.org/data/reports.aspx?source=world-development-indicators&series=AG.LND.PRCP.MM
Quality Of Living City Rankings Mercer https://mobilityexchange.mercer.com/Insights/quality-of-living-rankings
Health Care Index Numbeo http://www.numbeo.com/health-care/rankings.jsp Updated
Global Skills Index Hays http://www.hays-index.com/
Linguistic Diversity Ethnologue https://www.ethnologue.com/guides/countries-most-languages
Global Terrorism Index Institute For Economics & Peace
http://visionofhumanity.org/indexes/terrorism-index/ Updated
World Talent Rankings IMD https://www.imd.org/wcc/world-competitiveness-center-rankings/world-talent-ranking-2019/ Updated
Cost Of Living City Rankings Mercer https://www.mercer.com/our-thinking/career/cost-of-living.html
Quality Of Life Index Numbeo http://www.numbeo.com/quality-of-life/rankings.jsp Updated
Crime Index Numbeo http://www.numbeo.com/crime/rankings.jsp# Updated
Household Net Adjusted Disposable Income OECD https://stats.oecd.org/Index.aspx?
DataSetCode=BLI
Household Net Financial Wealth OECD https://stats.oecd.org/Index.aspx?DataSetCode=BLI
Educational Attainment OECD https://stats.oecd.org/Index.aspx?DataSetCode=BLI
Life Expectancy OECD https://stats.oecd.org/Index.aspx?DataSetCode=BLI
Employees Working Very Long Hours OECD https://stats.oecd.org/Index.aspx?
DataSetCode=BLI
Human Freedom Index Cato Institute https://www.cato.org/human-freedom-index Updated
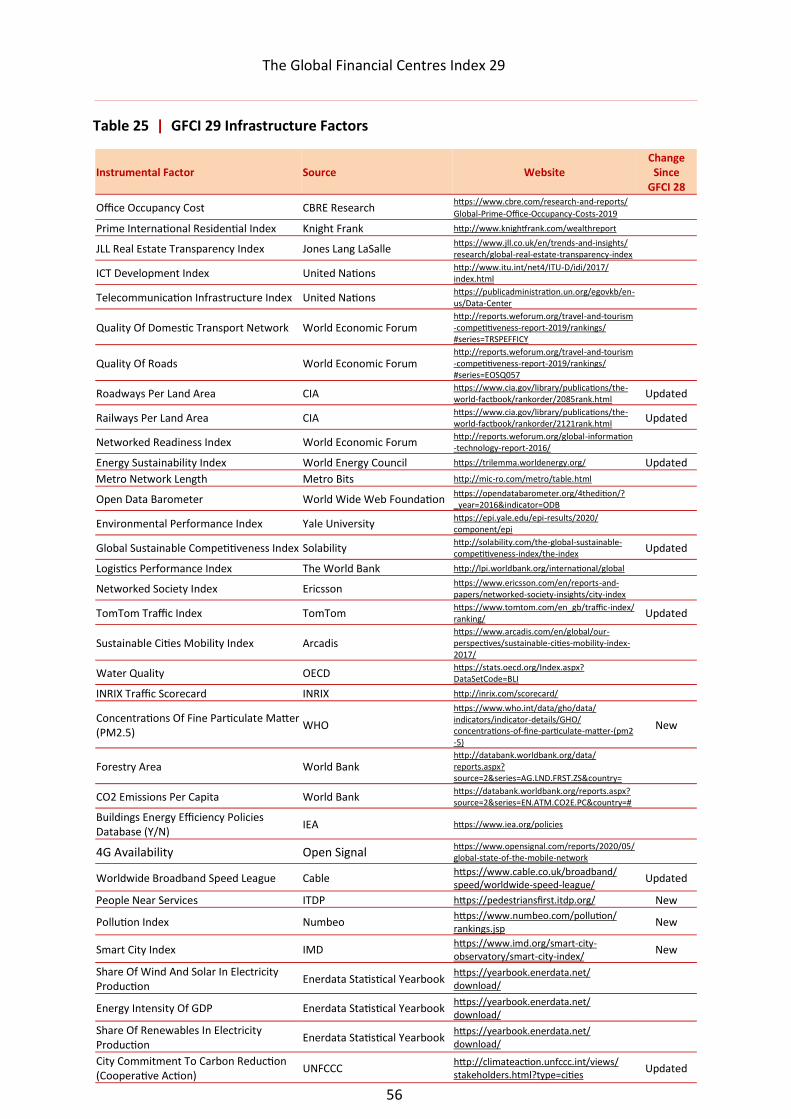
The Global Financial Centres Index 29
56
Table 25 | GFCI 29 Infrastructure Factors
Instrumental Factor Source Website
Change Since
GFCI 28
Office Occupancy Cost CBRE Research https://www.cbre.com/research-and-reports/
Global-Prime-Office-Occupancy-Costs-2019
Prime International Residential Index Knight Frank http://www.knightfrank.com/wealthreport
JLL Real Estate Transparency Index Jones Lang LaSalle https://www.jll.co.uk/en/trends-and-insights/research/global-real-estate-transparency-index
ICT Development Index United Nations http://www.itu.int/net4/ITU-D/idi/2017/index.html
Telecommunication Infrastructure Index United Nations https://publicadministration.un.org/egovkb/en-us/Data-Center
Quality Of Domestic Transport Network World Economic Forum http://reports.weforum.org/travel-and-tourism-competitiveness-report-2019/rankings/#series=TRSPEFFICY
Quality Of Roads World Economic Forum http://reports.weforum.org/travel-and-tourism-competitiveness-report-2019/rankings/#series=EOSQ057
Roadways Per Land Area CIA https://www.cia.gov/library/publications/the-world-factbook/rankorder/2085rank.html Updated
Railways Per Land Area CIA https://www.cia.gov/library/publications/the-world-factbook/rankorder/2121rank.html Updated
Networked Readiness Index World Economic Forum http://reports.weforum.org/global-information-technology-report-2016/
Energy Sustainability Index World Energy Council https://trilemma.worldenergy.org/ Updated Metro Network Length Metro Bits http://mic-ro.com/metro/table.html
Open Data Barometer World Wide Web Foundation https://opendatabarometer.org/4thedition/?_year=2016&indicator=ODB
Environmental Performance Index Yale University https://epi.yale.edu/epi-results/2020/component/epi
Global Sustainable Competitiveness Index Solability http://solability.com/the-global-sustainable-competitiveness-index/the-index Updated
Logistics Performance Index The World Bank http://lpi.worldbank.org/international/global
Networked Society Index Ericsson https://www.ericsson.com/en/reports-and-papers/networked-society-insights/city-index
TomTom Traffic Index TomTom https://www.tomtom.com/en_gb/traffic-index/ranking/ Updated
Sustainable Cities Mobility Index Arcadis https://www.arcadis.com/en/global/our-perspectives/sustainable-cities-mobility-index-2017/
Water Quality OECD https://stats.oecd.org/Index.aspx?DataSetCode=BLI
INRIX Traffic Scorecard INRIX http://inrix.com/scorecard/
Concentrations Of Fine Particulate Matter (PM2.5) WHO
https://www.who.int/data/gho/data/indicators/indicator-details/GHO/concentrations-of-fine-particulate-matter-(pm2-5)
New
Forestry Area World Bank http://databank.worldbank.org/data/reports.aspx?source=2&series=AG.LND.FRST.ZS&country=
CO2 Emissions Per Capita World Bank https://databank.worldbank.org/reports.aspx?source=2&series=EN.ATM.CO2E.PC&country=#
Buildings Energy Efficiency Policies Database (Y/N) IEA https://www.iea.org/policies
4G Availability Open Signal https://www.opensignal.com/reports/2020/05/global-state-of-the-mobile-network
Worldwide Broadband Speed League Cable https://www.cable.co.uk/broadband/speed/worldwide-speed-league/ Updated
People Near Services ITDP https://pedestriansfirst.itdp.org/ New
Pollution Index Numbeo https://www.numbeo.com/pollution/rankings.jsp New
Smart City Index IMD https://www.imd.org/smart-city-observatory/smart-city-index/ New
Share Of Wind And Solar In Electricity Production Enerdata Statistical Yearbook https://yearbook.enerdata.net/
download/
Energy Intensity Of GDP Enerdata Statistical Yearbook https://yearbook.enerdata.net/download/
Share Of Renewables In Electricity Production Enerdata Statistical Yearbook https://yearbook.enerdata.net/
download/
City Commitment To Carbon Reduction (Cooperative Action) UNFCCC http://climateaction.unfccc.int/views/
stakeholders.html?type=cities Updated
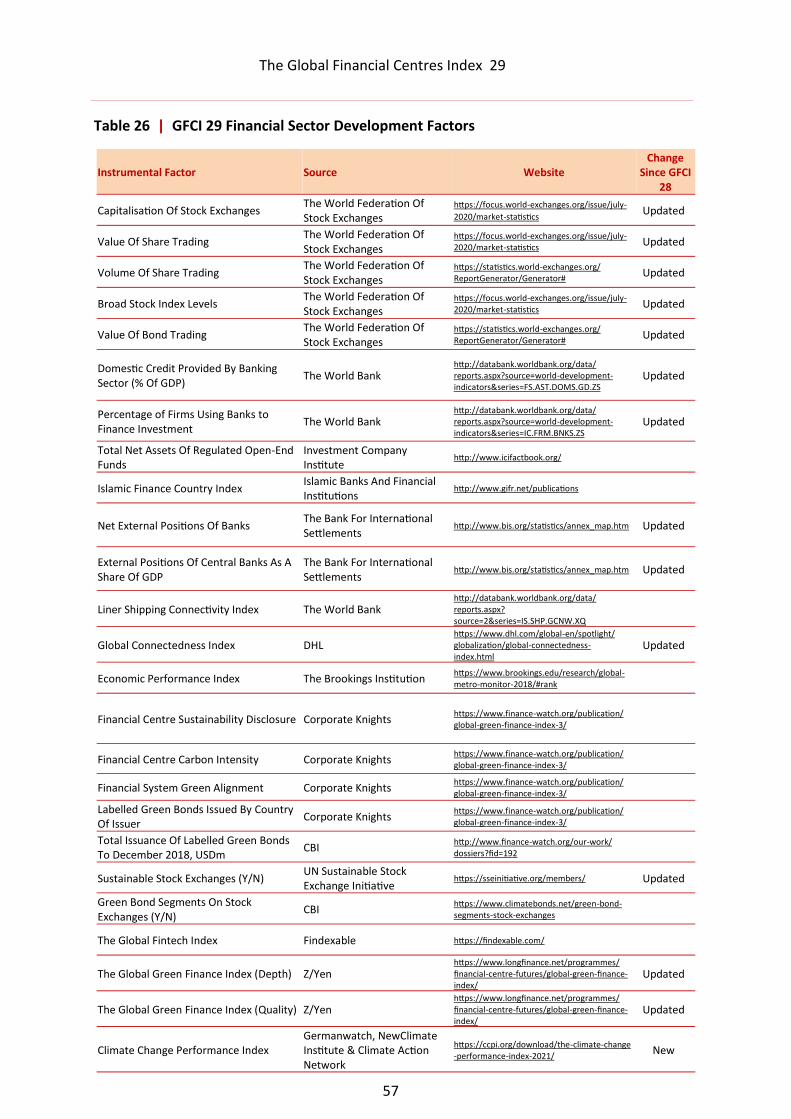
The Global Financial Centres Index 29
57
Table 26 | GFCI 29 Financial Sector Development Factors
Instrumental Factor Source Website
Change Since GFCI
28
Capitalisation Of Stock Exchanges The World Federation Of Stock Exchanges
https://focus.world-exchanges.org/issue/july-
2020/market-statistics Updated
Value Of Share Trading The World Federation Of Stock Exchanges
https://focus.world-exchanges.org/issue/july-2020/market-statistics Updated
Volume Of Share Trading The World Federation Of Stock Exchanges
https://statistics.world-exchanges.org/ReportGenerator/Generator# Updated
Broad Stock Index Levels The World Federation Of Stock Exchanges
https://focus.world-exchanges.org/issue/july-2020/market-statistics Updated
Value Of Bond Trading The World Federation Of Stock Exchanges
https://statistics.world-exchanges.org/ReportGenerator/Generator# Updated
Domestic Credit Provided By Banking Sector (% Of GDP)
The World Bank http://databank.worldbank.org/data/reports.aspx?source=world-development-indicators&series=FS.AST.DOMS.GD.ZS
Updated
Percentage of Firms Using Banks to Finance Investment
The World Bank http://databank.worldbank.org/data/reports.aspx?source=world-development-indicators&series=IC.FRM.BNKS.ZS
Updated
Total Net Assets Of Regulated Open-End Funds
Investment Company Institute
http://www.icifactbook.org/
Islamic Finance Country Index Islamic Banks And Financial Institutions
http://www.gifr.net/publications
Net External Positions Of Banks The Bank For International Settlements
http://www.bis.org/statistics/annex_map.htm Updated
External Positions Of Central Banks As A Share Of GDP
The Bank For International Settlements
http://www.bis.org/statistics/annex_map.htm Updated
Liner Shipping Connectivity Index The World Bank http://databank.worldbank.org/data/reports.aspx?source=2&series=IS.SHP.GCNW.XQ
Global Connectedness Index DHL https://www.dhl.com/global-en/spotlight/globalization/global-connectedness-index.html
Updated
Economic Performance Index The Brookings Institution https://www.brookings.edu/research/global-metro-monitor-2018/#rank
Financial Centre Sustainability Disclosure Corporate Knights https://www.finance-watch.org/publication/global-green-finance-index-3/
Financial Centre Carbon Intensity Corporate Knights https://www.finance-watch.org/publication/global-green-finance-index-3/
Financial System Green Alignment Corporate Knights https://www.finance-watch.org/publication/global-green-finance-index-3/
Labelled Green Bonds Issued By Country Of Issuer Corporate Knights https://www.finance-watch.org/publication/
global-green-finance-index-3/
Total Issuance Of Labelled Green Bonds To December 2018, USDm CBI http://www.finance-watch.org/our-work/
dossiers?fid=192
Sustainable Stock Exchanges (Y/N) UN Sustainable Stock Exchange Initiative
https://sseinitiative.org/members/ Updated
Green Bond Segments On Stock Exchanges (Y/N) CBI https://www.climatebonds.net/green-bond-
segments-stock-exchanges
The Global Fintech Index Findexable https://findexable.com/
The Global Green Finance Index (Depth) Z/Yen https://www.longfinance.net/programmes/financial-centre-futures/global-green-finance-index/
Updated
The Global Green Finance Index (Quality) Z/Yen https://www.longfinance.net/programmes/financial-centre-futures/global-green-finance-index/
Updated
Climate Change Performance Index Germanwatch, NewClimate Institute & Climate Action Network
https://ccpi.org/download/the-climate-change-performance-index-2021/ New
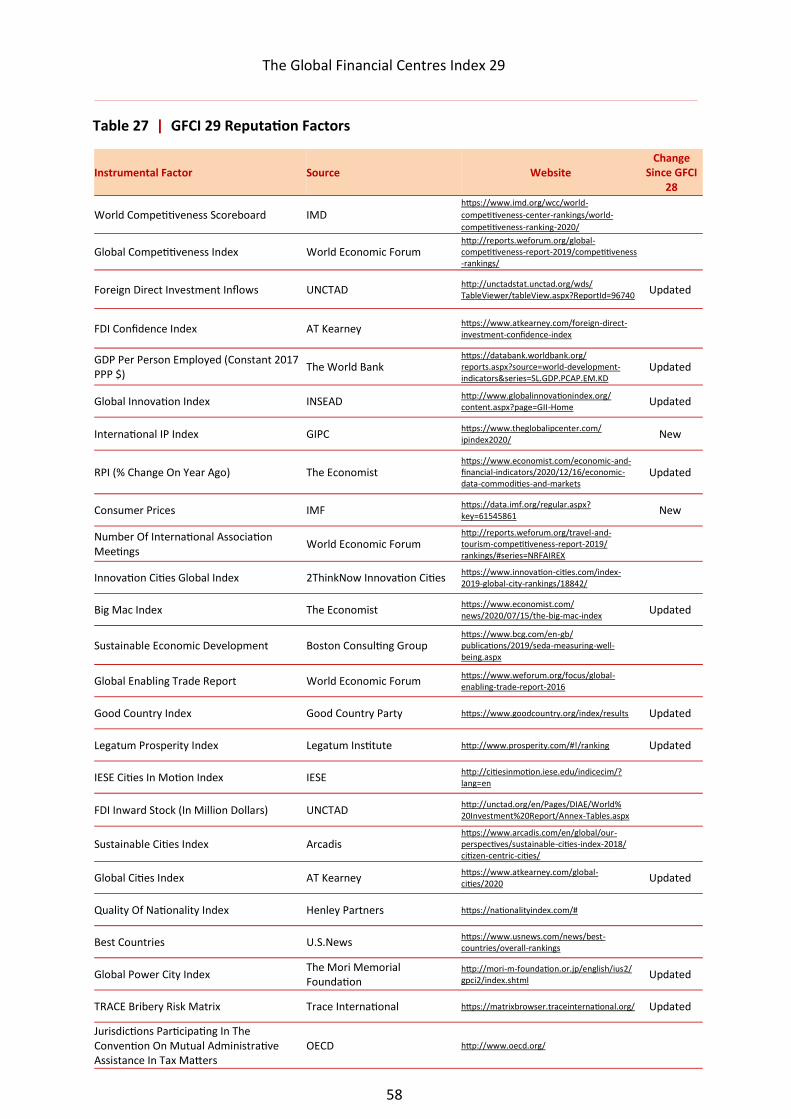
The Global Financial Centres Index 29
58
Table 27 | GFCI 29 Reputation Factors
Instrumental Factor Source Website Change
Since GFCI 28
World Competitiveness Scoreboard IMD https://www.imd.org/wcc/world-
competitiveness-center-rankings/world-
competitiveness-ranking-2020/
Global Competitiveness Index World Economic Forum http://reports.weforum.org/global-competitiveness-report-2019/competitiveness-rankings/
Foreign Direct Investment Inflows UNCTAD http://unctadstat.unctad.org/wds/TableViewer/tableView.aspx?ReportId=96740 Updated
FDI Confidence Index AT Kearney https://www.atkearney.com/foreign-direct-investment-confidence-index
GDP Per Person Employed (Constant 2017 PPP $) The World Bank
https://databank.worldbank.org/reports.aspx?source=world-development-indicators&series=SL.GDP.PCAP.EM.KD
Updated
Global Innovation Index INSEAD http://www.globalinnovationindex.org/content.aspx?page=GII-Home Updated
International IP Index GIPC https://www.theglobalipcenter.com/ipindex2020/ New
RPI (% Change On Year Ago) The Economist https://www.economist.com/economic-and-financial-indicators/2020/12/16/economic-data-commodities-and-markets
Updated
Consumer Prices IMF https://data.imf.org/regular.aspx?key=61545861 New
Number Of International Association Meetings World Economic Forum
http://reports.weforum.org/travel-and-tourism-competitiveness-report-2019/rankings/#series=NRFAIREX
Innovation Cities Global Index 2ThinkNow Innovation Cities https://www.innovation-cities.com/index-2019-global-city-rankings/18842/
Big Mac Index The Economist https://www.economist.com/news/2020/07/15/the-big-mac-index Updated
Sustainable Economic Development Boston Consulting Group https://www.bcg.com/en-gb/publications/2019/seda-measuring-well-being.aspx
Global Enabling Trade Report World Economic Forum https://www.weforum.org/focus/global-enabling-trade-report-2016
Good Country Index Good Country Party https://www.goodcountry.org/index/results Updated
Legatum Prosperity Index Legatum Institute http://www.prosperity.com/#!/ranking Updated
IESE Cities In Motion Index IESE http://citiesinmotion.iese.edu/indicecim/?lang=en
FDI Inward Stock (In Million Dollars) UNCTAD http://unctad.org/en/Pages/DIAE/World%20Investment%20Report/Annex-Tables.aspx
Sustainable Cities Index Arcadis https://www.arcadis.com/en/global/our-perspectives/sustainable-cities-index-2018/citizen-centric-cities/
Global Cities Index AT Kearney https://www.atkearney.com/global-cities/2020 Updated
Quality Of Nationality Index Henley Partners https://nationalityindex.com/#
Best Countries U.S.News https://www.usnews.com/news/best-countries/overall-rankings
Global Power City Index The Mori Memorial Foundation
http://mori-m-foundation.or.jp/english/ius2/gpci2/index.shtml Updated
TRACE Bribery Risk Matrix Trace International https://matrixbrowser.traceinternational.org/ Updated
Jurisdictions Participating In The Convention On Mutual Administrative Assistance In Tax Matters
OECD http://www.oecd.org/
The Global Financial Centres Index 29
59
Vantage Financial Centres is an exclusive network of financial centres around the world run by Z/Yen Partners for organisations looking for a deeper understanding of financial centre competitiveness. Members receive enhanced access to GFCI data, marketing opportunities, and training for centres seeking to enhance their profile and reputation.
Supported by the industry, the Financial Services Development Council (FSDC) is a high-level, cross-sectoral advisory body to the Hong Kong Special Administrative Region Government. FSDC formulates proposals to promote the further development of Hong Kong’s financial services industry and to map out the strategic direction for the development. As of March 2020, 110 of the 137 policy recommendations had been adopted by the Government and relevant regulators since FSDC’s inception in 2013. On top of research, FSDC also carries out market promotion and human capital development functions. Among others, FSDC focuses on topics including Mainland and international connectivity, green and sustainable finance, FinTech, as well as asset and wealth management.
[email protected] https://www.fsdc.org.hk/en
Since 2009 Busan Metropolitan City has been developing a financial hub specialising in maritime finance and derivatives. With its strategic location in the center of the southeast economic block of Korea and the crossroads of a global logistics route, Busan envisions growing into an international financial city in Northeast Asia. Busan Finance Center (BFC) will continue to develop and implement measures to promote Busan as the financial hub and bolster the local financial industry, while working together with various local economic players to pursue sustainable growth of the financial sector including FinTech. These efforts will enable BFC to play a leading role in taking Busan to the next level and become the international financial center and maritime capital of Northeast Asia. BFC offers an attractive incentive package to global financial leaders and cooperation network of Busan Metropolitan City, and Busan Finance Center will support you to identify opportunities in Busan, one of the fastest developing cities in Asia.
[email protected] www.kbfc.or.kr/eng/
The Long Finance initiative grew out of the London Accord, a 2005 agreement among investment researchers to share environmental, social and governance research with policy-makers and the public. Long Finance was established more formally by Z/Yen Group and Gresham College from 2007 with the aim of exploring long-term thinking across a global network of people. We work on researching innovative ways of building a more sustainable financial system. In so doing, we try to operate openly and emulate scientific ideals. At the same time, we are looking to create a supportive and caring community where people can truly question the accepted paradigms of risk and reward.
www.longfinance.net
Global Times Consulting Co. is a strategic consultancy with a focus on China. We help Chinese (local) governments at all levels to build their reputation globally, providing strategic counsel, stakeholder outreach and communications to support their sustainable development. We also partner with multinational companies operating in this dynamic but challenging market, serving as a gateway to China. In addition, we help Chinese companies extend their reach overseas. Global Times Consulting Co. adopts a research and knowledge-based approach. With extensive contacts and deep insights into China’s political and economic landscape, we develop and execute integrated programs for stakeholder relations and reputation management. Our extensive relationship with media and government organizations in China and worldwide helps us successfully execute programs and achieve desired goals.
Daniel Wang at [email protected]
www.globaltimes.com.cn

The Global Financial Centres Index 29
60
Please find out more at: www.vantagefinancialcentres.net
or by contacting Mike Wardle at [email protected]
Dubai International Financial Centre (DIFC) is one of the world’s most advanced financial centres, and the leading financial hub for the Middle East, Africa and South Asia (MEASA) region, which comprises 72 countries with an approximate population of 3 billion and a nominal GDP of US$ 7.7 trillion.
DIFC is home to an internationally recognised, independent regulator and a proven judicial system with an English common law framework, as well as the region’s largest financial ecosystem of more than 24,000 professionals working across over 2,300 active registered companies – making up the largest and most diverse pool of industry talent in the region. The Centre’s vision is to drive the future of finance. Today, it offers one of the region’s most comprehensive FinTech and venture capital environments, including cost-effective licensing solutions, fit-for-purpose regulation, innovative accelerator programmes, and funding for growth-stage start-ups.
Comprising a variety of world-renowned retail and dining venues, a dynamic art and culture scene, residential apartments, hotels and public spaces, DIFC continues to be one of Dubai’s most sought-after business and lifestyle destinations.
www.difc.ae Twitter @DIFC
AIFC is an all-around financial centre located in Nur-Sultan, the capital of Kazakhstan, which offers ample opportunities for businesses to grow. AIFC provides greater access to world-class capital markets and the asset management industry. It also promotes financial technology and drives the development of niche markets such as Islamic and green finance in the region.
AIFC provides unprecedented conditions and opportunities for its participants and investors: legal system based on the principles of English law, independent judicial system, regulatory framework consistent with internationally recognised standards, wide range of financial services and instruments, simplified visa and labour regimes, zero corporate tax rate, and English as a working language.
Located in the heart of Eurasia, AIFC is striving to become the gateway to the Eurasian Economic Union, Central Asia and Caucasus, and play a key role in the Belt and Road Initiative. AIFC is already gaining tremendous recognition as a leading financial hub in the region: recently, Asiamoney Awards recognised it as the best Belt and Road Initiative project of 2019.
Daniyar Kelbetov at [email protected] www.aifc.kz
Seoul is a rising star among the financial cities of the world. It is already one of the top 10 cities in the world based on various indices, and it has many more opportunities to offer as a financial hub and great growth potential. Seoul believes global financial companies are our true partners for growth. There are many incentives provided to global financial companies that enter into Seoul, such as the financial incentives provided when moving into IFC, so that we can all jointly work towards the growth and development of the financial market.
It is sure that Seoul will become a top star of global financial hubs in the near future! Pay close attention to Seoul's potentials and pre-emptively gain a foothold in the Seoul financial hub. Seoul is the gateway to Northeast Asia and the world.
Han Dong-Uk, [email protected] www.seoul.go.kr/main/index.jsp
Luxembourg for Finance (LFF) is the Agency for the Development of the Financial Centre. It is a public-private partnership between the Luxembourg Government and the Luxembourg Financial Industry Federation (PROFIL). Founded in 2008, its objective is to develop Luxembourg’s financial services industry and identify new business opportunities.
LFF connects international investors to the range of financial services provided in Luxembourg, such as investment funds, wealth management, capital market operations or advisory services. In addition to being the first port of call for foreign journalists, LFF cooperates with the various professional associations and monitors global trends in finance, providing the necessary material on products and services available in Luxembourg.
Furthermore, LFF manages multiple communication channels, organises seminars in international business locations, and takes part in selected world-class trade fairs and congresses.
luxembourgforfinance.com
The Global Financial Centres Index 29
61
Vantage Financial Centres is an network of financial centres around the world run by Z/Yen Partners for organisations looking for a deeper understanding of financial centre competitiveness. Members receive enhanced access to GFCI data, marketing opportunities, and training for centres seeking to enhance their profile and reputation.
Approved by the China’s State Council, China Development Institute (CDI) was founded in 1989 with 116 representatives from the government, academia and business in China. Being an independent think tank, CDI is committed to develop policy solutions via research and debates that help to advance China’s reform and opening-up. After years of development, CDI has become one of the leading think tanks in China. CDI focuses on the studies of open economy and innovation-driven development, regional economy and regional development, industrial policies and industrial development, urbanization and urban development, business strategies and investment decision-making. Via conducting research, CDI provides policy recommendations for the Chinese governments at various levels and develops consultation for corporate sectors at home and abroad. CDI organizes events in different formats that evokes dialogue among scholars, government officials, business people and civil society members around the globe. Based in Shenzhen, Southern China, CDI has one hundred and sixty staff, with an affiliated network that consists of renowned experts from different fields. Carol Feng at [email protected] www.cdi.org.cn
Finance Montréal’s mandate is to promote Montréal as a world-class financial hub and foster cooperation among its member institutions to accelerate the industry’s growth. With renowned research capacities in artificial intelligence and a booming fintech sector, Montréal offers an experienced, diversified and innovative pool of talent as well as a stable, low cost and dynamic business environment.
For financial institutions searching for an ideal location to set up an intelligent service centre and operationalize their digital transformation, Finance Montréal can advise on the advantageous tax incentives aimed at facilitating the establishment and development of financial services corporations in the city.
[email protected] www.finance-montreal.com/en
Abu Dhabi Global Market (ADGM), an award-winning financial centre in the capital of the UAE, opened for business in October 2015, consisting of three independent authorities: the Registration Authority (RA); the Financial Services Regulatory Authority (FSRA); and ADGM Courts. Comprised of the three independent authorities where Common English Law is directly applicable, ADGM plays an essential role in the diversification of the economy in the UAE and is committed to providing a comprehensive business ecosystem operating with the highest standards of integrity and is renowned for its ease of doing business.
Strategically situated in Abu Dhabi, home to one of the world’s largest sovereign wealth funds, ADGM plays a vital role in positioning Abu Dhabi as a global trade and business hub and serves as a link between the growing economies of the Middle East, Africa and South Asia to the rest of the world. ADGM has earned industry recognition as the Financial Centre of the Year (MENA) four years in a row as well as being recognized as the leading FinTech Hub in the region.
www.adgm.com/ [email protected]
Z/Yen’s FS Club is the premier global executive knowledge network for technology and finance. News: Access FS Club’s global information service: daily news, bulletins, and the new members area provide tailored content for your professional interests, Events: Access over 200 annual events on the most topical developments affecting technology and finance; providing education, networking opportunities, and exposure to high profile speakers, Partnerships: Access an international community of technology, economics and finance professionals, allowing you to network with key futurists, exchange views with peers, and meet potential clients.
Find out more here: https://fsclub.zyen.com/
sponsors/sponsorship-levels/ or email [email protected]
www.zyen.com Z/Yen helps organisations make better choices – our clients consider us a commercial think-tank that spots, solves and acts. Our name combines Zen and Yen – “a philosophical desire to succeed” – in a ratio, recognising that all decisions are trade-offs. One of Z/Yen’s specialisms is the study of the competitiveness of financial centres around the world. A summary of this work is published every six months as the Global Financial Centres Index. Z/Yen also publishes the Global Green Finance Index that seeks to encourage financial centres to become greener and develop financial services in a way that enables society to live within planetary boundaries. Most recently we have developed the Smart Centres Index, which tracks commercial and financial centres’ offering in technology and innovation.
www.globalfinancialcentres.net Financial Centre Futures is a programme within the Long Finance Initiative that initiates discussion on the changing landscape of global finance. Financial Centre Futures comprises the Global Financial Centres Index, the Global Green Finance Index and other research publications that explore major changes to the way we will live and work in the financial system of the future.
CO-PRODUCED BY CHINA DEVELOPMENT INSITUTE
PRODUCED BY Z/YEN
PUBLISHED BY LONG FINANCE AND FINANCIAL CENTRE FUTURES
en.cdi.org.cn Approved by the China’s State Council, China Development Institute (CDI) was founded in 1989 with one hundred and sixteen representatives from the government, academia and business in China. Being an independent think tank, CDI is committed to develop policy solutions via research and debates that help to advance China’s reform and opening-up. After years of development, CDI has become one of the leading think tanks in China. CDI focuses on the studies of open economy and innovation-driven development, regional economy and regional development, industrial policies and industrial development, urbanization and urban development, business strategies and investment decision-making. Via conducting research, CDI provides policy recommendations for the Chinese governments at various levels and develops consultation for corporate sectors at home and abroad. CDI organizes events in different formats that evokes dialogue among scholars, government officials, business people and civil society members around the globe. Based in Shenzhen, Southern China, CDI has one hundred and sixty staff, with an affiliated network that consists of renowned experts from different fields.
www.longfinance.net Long Finance is a Z/Yen initiative designed to address the question “When would we know our financial system is working?” This question underlies Long Finance’s goal to improve society’s understanding and use of finance over the long-term. In contrast to the short-termism that defines today’s economic views the Long Finance timeframe is roughly 100 years.