The knowledge-based internationalization of italian fashion firms. The chinese market experience
INTERNATIONAL CENTRE FOR ECONOMIC RESEARCH
WORKING PAPER SERIES
A. Melnik, E. Colombatto
THE CAPITAL STRUCTURE OF YOUNG FIRMS AND THE WORKING
EXPERIENCE OF NEW ENTREPRENEURS
Working Paper No. 8/2008
The capital structure of young firms and the working experience of new entrepreneurs
by
Arie Melnik and Enrico Colombatto
July 2008
* This paper has benefited from several interviews conducted with owner-managers of new small firms in Italy. We are particularly grateful to Lino Agrosi, Paola Celentano, Giuseppe Pesenti, Mauro Rossi and Massimo Zanetti for sharing their experience with us ; to Nicola Melone, Stefano Lazar and Alessandro Moroni for their help in the data collection; to our colleagues Mina Baliamoune, Bruno Contini, Marco Da Rin, Giovanna Nicodano and Pietro Terna for insightful comments and valuable suggestions. Chiara Monticone provided outstanding research assistance. We are responsible for the remaining errors. * Arie Melnik is Professor of Economics at the University of Haifa (Israel) and a Senior Fellow at ICER (Turin). Enrico Colombatto is Professor of Economics at the University of Turin (Italy) and Director of ICER (Turin). JEL Classification System: M13, L26, G32
2
The capital structure of young firms and
the working experience of new entrepreneurs
Abstract
We use a simple model to analyze the funding stage of new firms and characterize the
directional causality between the ir capital structure and the length of prior working
experience that entrepreneurs possess. In this light, we test a set of predictions by
considering a sample of firms founded by Italian entrepreneurs in the period 1992-2004.
We obtain three main results. First, we confirm the evidence presented in the literature,
whereby the size of the firm has a significant effect on capital structure. Second, we find
that previous working experiences of entrepreneurs in full-time employment (before
founding a new firm) have a positive impact on the debt-to-asset ratio of newly founded
firms. Third, we show that firms with access to subsidized government debt are able to
increase the ir share of debt in total liabilities, even when the size of the subsidy is small.
3
The capital structure of young firms and the working experience of new entrepreneurs
1. Introduction
Entrepreneurial activities (and the features of the start-up firms they create) have
been a topic of interest to economic researchers for a number of years. Most of the
research focused on the stage when new firms grow and seek to raise capital from
financial investors in general and venture capitalists in particular. Indeed, the
development of existing small firms has been covered extensively in both the
theoretical and empirical literature. In contrast, there is relatively little systematic
understanding of how new firms come to life. For instance, questions such as “how
much work experience do founders of new firms possess?” and “what determines the
capital structure of these firms at birth?” require further investigation.
Our main concern is the capital structure of newly founded firms. New start-ups
typically start small , and their survival depends on the business skills of their owner
managers as well as on the financial resources they can acquire. In this light, we re-
examine the determinants of capital structure by looking at a sample of newly formed
firms. In addition to the standard variables associated with capital structure, such as
company size and profitability, we investigate the role of the working experience of
first time entrepreneurs; and also the consequences of family support, when it applies.
The literature suggests that prior working experience is an important part of the
individual’s human capital and may increase the probability of success (Colombo,
Delmastro and Grilli, 2004). First, it leads to the acquisition and development of
management skills. Second, it affects the ability to identify business opportunities and

4
thus makes search more effective. Third, it enhances visibility within the business
community (including potential providers of funds) and thus facilitates the process of
raising capital for the establishment of a new company.
By capital structure we refer to the compositio n of debt and equity of firms. Debt
includes various types of loans, to be served and reimbursed. Equity represents the
funds invested by the owners. In principle, equity is a permanent source of capital.
Owners of small firms signal their quality by investing a large share of their personal
wealth as equity in their own company, which they frequently control and where they
also serve as active managers1. Since in a privately held firm the owners (insiders) are
expected to have better information than outsiders, their willingness to invest their
own funds is a clear signal of self-confidence and commitment.
The academic literature is rich in contributions on agency problems and their
implications for corporate finance. The empirical research that followed, however,
focused mainly on large public corporations and ignored that corporate governance
and agency issues in small private firms are different, as observed by Coleman and
Cohn (2000) and Lopez-Garcia and Aybar-Arias (2000). For instance, in addition to
the classical agency problems, minority shareholders also suffer from the lack of
liquidity generated by the absence of a ready market for their holdings 2.
1 See Reynolds (1977) and Åstebro and Bernhart (2003). Moskowitz and Vissing-Jørgensen (2002) maintain that the return on private equity is not higher than that on public equities. In their opinion this is surprising, given that entrepreneurial private equity investments are highly concentrated and that households with private equity investments hold over 70% of their private asset holdings in a single company. They conclude that non-pecuniary benefits must compensate for this gap in declared returns and seem to overlook one crucial element: that the benefit for the private investor also includes the spread between debt service without and debt service with private involvement. Put differently, the fact that the returns on private investment are the same as those on debt should not make us forget that debt would be have been more expensive in the absence of private investment/commitment.
2 Of course, the lack of liquidity raises the cost of outside equity for small private firms. Moreover, as argued in Shleifer and Vishny (1997), it favors the expropriation of minority shareholders by majority shareholders. For this reason, most equity in small private firms ends up by being owned by family and friends, who constitute the board and are the active managers. Not surprisingly in this case the board is de facto redundant.
5
The rest of the paper proceeds as follows. In the next section we briefly survey the
literature on the capital structure of small firms. This section is followed by a
description of the small business institutional environment in Italy. Section 4
describes the sample which forms the object of our empirical investigation. Section 5
defines the main variables in the analysis and how they are measured in this study.
Section 6 contains some descriptive statistics. In section 7 we present our empirical
results about the determinants of capital structure, which are then extended in section
8. Section 9 concludes.
2. The literature on the capital structure of small firms
According to the accepted view, the optimal capital structure depends on the cost of
debt compared to its benefits. The former includes two components: agency costs and
financial costs, which may ultimately result in bankruptcy. On the other hand, debt
servicing reduces taxable income.
The trade-off between the cost of the expected financial outlays (including
bankruptcy) and the benefits that emanate from the tax savings related to
indebtedness defines the optimal capital structure of the firm. Modigliani and Miller
(1958) explained how mature, publicly held firms with a large physical and
productive capital. should select the combination of debt and equity that minimizes
the cost of capital in the presence of low transaction costs and efficient capital
markets.
However, when transaction costs and information asymmetries are substantial, the
cost of issuing debt quickly increases, and may well become prohibitive for small
firms. As a result, small firms rely heavily on bank loans, trade credit and in some
cases also government subsidized lending. Equity financing is also expensive; since
potential outside shareholders are relatively poorly informed and tend to underprice
the shares. Therefore, when raising equity, insiders prefer to do so in the forms of
retained earnings rather than looking for new shareholders.
These insights have been analyzed by Berger and Udell (1998), who develop a
life cycle theory of the firm and argue that companies use different mix of financing

6
in different growth stages. When they are small, young companies suffer from a high
informational disadvantage, which makes it hard for them to obtain funds from
external sources. Hence, they tend to rely on “inside financing”. Consistent with
Myers (1984), Berger and Udell also claim that when the owners turn to external
sources, they start with debt rather than equity, because debt implies a smaller loss of
control on ownership. Along the same lines, Chittenden, Hall and Hutchinson (1996)
study some 3,000 British firms and find support for the owners’ reluctance to dilute
ownership (the so-called “pecking order” theory put forward by Myers): profitable
small firms fund their expansion primarily by retained earnings, while less profitable
firms rely more on short-term bank loans 3.
Put differently, smaller firms tend to rely on internal sources of funds, while
larger firms are more likely to use public equity (Cole and Wolken, 1995; Gregory et
al., 2005). And when negotiating their debts, smaller firms react to the information
asymmetry problems by accepting short term loans, which are less risky for the
lender, and thus cheaper for the borrower; while larger firms exploit their higher
credibility to borrow long term.
3. The small business environment in Italy
Compared to many other Western countries, Italy exhibits the largest share of
working population categorized as self-employed or as business owners: 23% of the
labor force is self- employed and another 44.5% works in small firms. Earlier
researchers explained this unique Italian phenomenon by referring to the diminishing
role of scale economies (and the increasing role of non-standardized production).
Others have called attention to the tax advantages that accrue to autonomous workers
and entrepreneurs. Rapiti (1997) added the relative advantage of small firms in
managing turbulent industrial relations.
Italy also exhibits a remarkable stability in the number of newly formed small
businesses. In fact, in Italy all political parties have always been supportive of small
3 See also Michaelas, Chittenden and Poutziouris (1998), who study a sample of small US firms.

7
businesses, artisan production and self-employment. Since the 1950’s self-
employment and small business ownership were encouraged by the provision of
subsidies, tax immunities, assistance in pension payments and also by specific
legislation targeting start-ups, including lenient regulation4.
4. Sample selection
The major source of information on the demography of Italian firms is the ‘Registro
delle Imprese’ (Business Register), managed by the provincial Chambers of
Commerce. It lists all existing firms by legal status and also includes some
information about the owners and the members of their boards of directors. All new
firms are required by law to register and all firms that cease to be active are de-listed.
We use information from a survey conducted in 2005 on a set of companies
contained in the Business Register. This dataset has three advantages compared to
other datasets on entrepreneurs. First, it contains information about the number of
years of work of the founder before he became an entrepreneur. Second, it includes an
easy to understand measure of size and breaking up by industry. Third, it contains
detailed information on seven categories of funds. The categories for equity are
owner’s savings, family funds, family firm equity position and external equity. For
debt we have separate information about bank loans, trade credit and government
loans.
The sample was selected as follows. We gathered information on 828 Northern
Italian5 firms that had entered the Business Register between 1992 and 2004 and that
were still the Register in 2004. Thus, our definition of youth is implicitly “12-year old
4 For instance, part of the ‘Statuto dei Lavoratori’ is not applicable to firms with less than 15 employees, thereby making it easier for them to fire employees in case of redundancies. Another form of privilege in the labor market comes from the 1994 law that created what are currently known as ‘Contratti di Formazione Lavoro’, whereby the cost of hiring apprentices is drastically reduced. Another example is a law from 1982 that provides soft loans that cover between 40 and 50 percent of total investment (of small and medium firms) at rates that are 70 percent lower than the market rates.
5 Three regions were considered: Piedmont, Lombardy and Veneto.

8
or less”. From these 828 firms we retained only those which in 2004 had had at least
5 employees if they belonged to the service or construction sectors and at least 10
employees if they were in manufacturing . We then got in touch with the owner-
manager of these 286 firms and asked them to answer a few questions about his/her
“conversion” from an employee to a business owner6. Only 193 entrepreneurs
responded (a response rate of 67.5 %). Some of them did not provide complete
information about all the variables of interest, so that only 178 observations could be
employed for the purpose of the present analysis.
Survey data have the advantage of covering more precisely the question at the
core of this paper. Nevertheless, like many other surveys, our observations suffer
from a few potential weaknesses. First, we cannot be sure that the respondents
understood all the questions and that, if they did, they answered all of them truthfully.
Second, we cannot rule out the presence of a non-response bias: One can never be
sure whether the answers of those who responded are indeed representative of the
views of the general population. Finally, the information that we have is subject to the
survival bias. The information that we use is drawn from the successful firms, that is,
from firms that existed in 2004. Firms that opened in the 1992-2004 period but closed
before the survey was conducted were not interviewed.
5. Measuring the variables
A list of the variables that we use appears in Appendix 1. The definition of some of
them merits attention.
• Risk is described by the actual rate of failure of firms with five or more
workers during the year before the firm was founded. The presumption is
that the actual average failure rate is known beforehand to those who plan
to found new firms.
6 If the firm had a single owner we directed the questions to the owner-manager. In multi-owner firms (21% of the sample), we identified one person as the primary owner. The primary owner is defined as the one who owns most of the equity. In general he is also the person who runs the business on a day-to-day basis.
9
• Our measure of experience is the number of years that the person worked
full time as an employee before deciding to switch. The numbers were
rounded up or down in the usual way.
• The age of the firm since it was registered and started to operate is also
expressed in years.
• Information about the number of employees is used as a proxy for the size
of the new firm, which on average turns out to be 6-year old 7. Reports on
the number of employees are considered to be more accurate than financial
measures such as sales or size of assets8.
• The new firms themselves are classified into eight different industry
groups: Manufacturing; Construction (including real estate); Business
services (maintenance, cleaning etc.); Hospitality (e.g. lodging, catering
and restaurants); Commerce (retail trade in products such as furniture,
clothing, durable goods and electronics); Personal services (gardening,
education, beauty industry, house repairs); Transportation (shipping,
packaging and storage); Miscellaneous services.
6. Descriptive Statistics
As noted earlier, and unlike what happens among large public firms, small companies
do not usually have access to the public debt market. They resort to personal and
family funds for equity and to loans from banks and suppliers (trade credits). Berger
and Udell (1998) and others noted that small firms often have difficulties even in
obtaining bank loans. Presumably, they establish a reputation only with the passage of
time, so that only at a later stage it eventually becomes easier to borrow and thus
increase financial leverage.
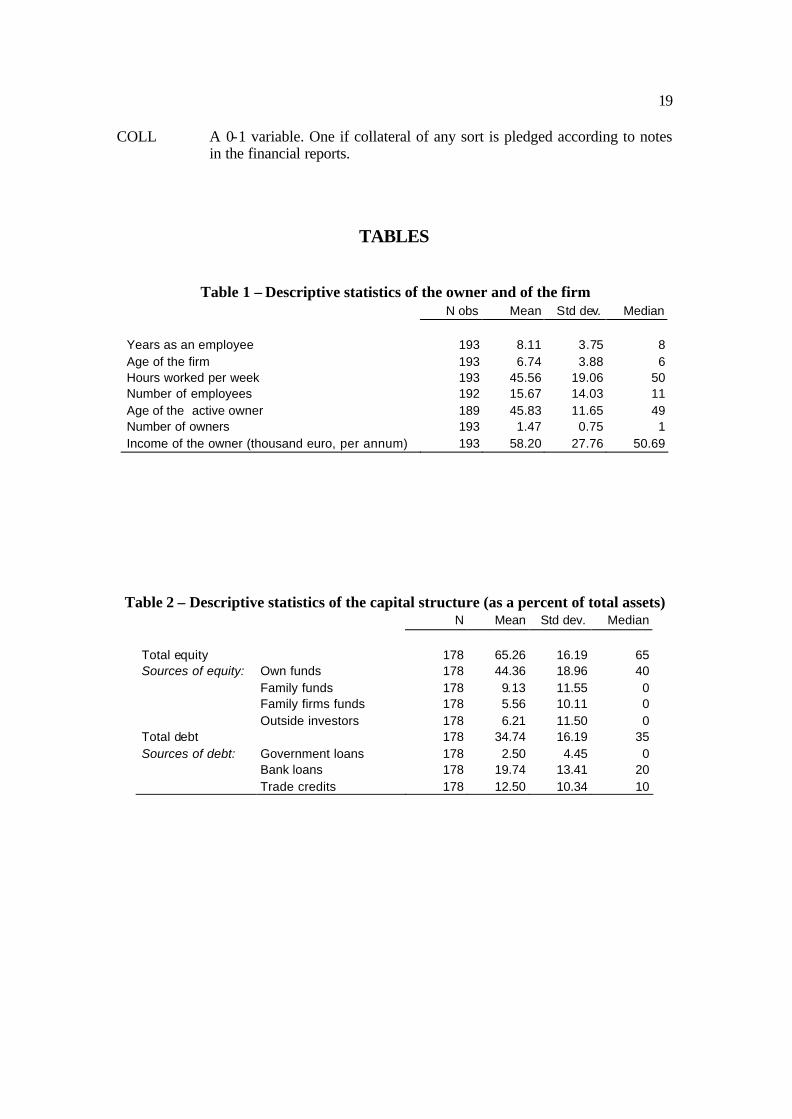
Table 1 presents the descriptive statistics of the companies and the owners
included in the sample. As expected, Italian young companies are fairly small, with
7 As mentioned in the previous section, the sample covers 178 firms aged between 12 and 1 years.
8 In our survey we find that 46.5% of the firms employ a family member for at least 16 hours a week. We do not include them as employees in our measure of firm size.
10
an average number of employees of less than 16 units and a limited number of
owners: The average company has 4.7 owners and only 1.5 owners take an active
management role.
The capital structure is presented in Table 2. Equity constitutes 65% of total
financial resources and debt the remaining 35%. The standard deviation for both is
slightly above 16, indicating that firms are financially diversified, especially when it
comes to debt. Although the median values of overall equity and total debt are close
to the mean, these statistics differ when we examine the components of debt and
equity, as a result of the fact that some firms do not use certain equity or debt sources
at all. Table 2 also provides information about the use of short term credit. It shows
that, like established firms, new firms use trade credit as a fairly large source of
finance9.
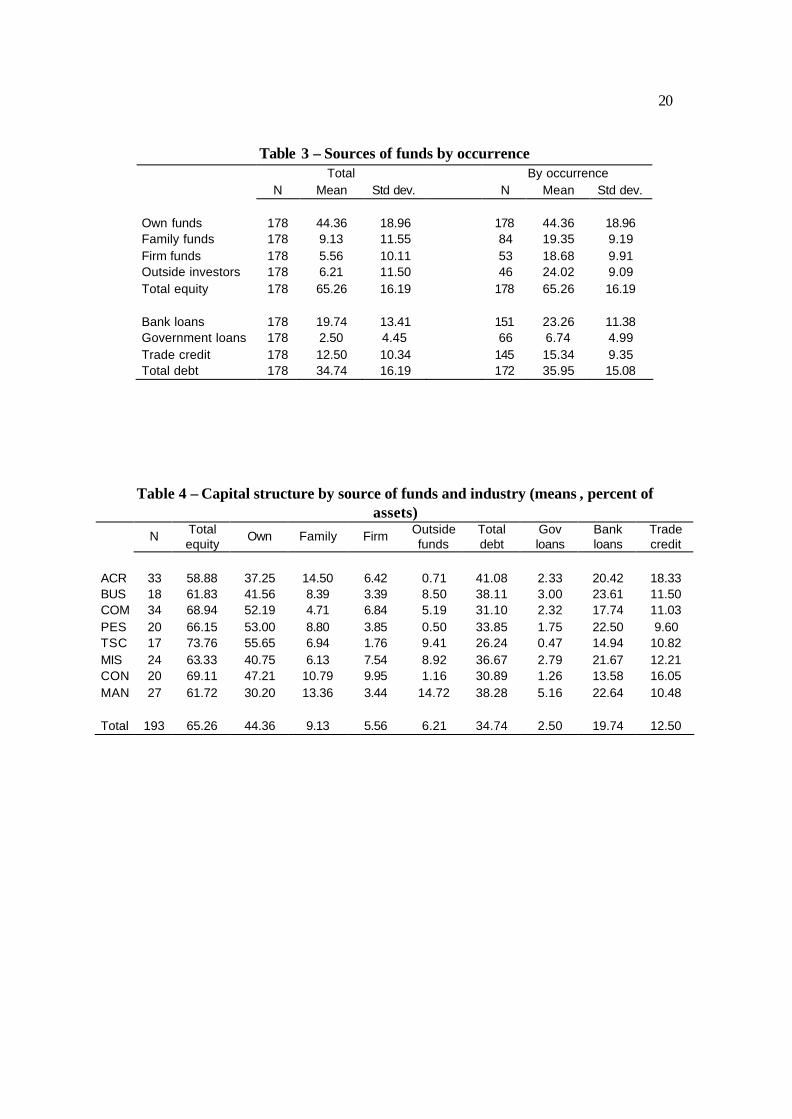
In line with earlier theories we note that the main source of equity is the founder’s
own investment (about 44% of the total), whereas families provide some 9% of the
total funds (about 13% of equity capital). However, as noted in Table 3, less than half
of the entrepreneurs (9.13/19.35) obtain equity contribution from their families.
Another 27% (53 owners out of 193) of equity is contributed by family firms.. Still,
when positive, the contributions of family firms play a substantial role (almost 19%
of overall financial resources). Outside investors such as unrelated industrial groups,
financial institutions and venture capitalists provided a little above 6% of the funds in
total. But when they are involved (46 cases) their contribution is very significant
(24%).
As noted, on average debt constitutes about 35% of total capital, with banks
contributing almost 20% (over half of total debt). As a matter of fact, Italian banks are
major providers of funding across the board. Close to 85% (19.74/23.26) of the
startup firms receive bank loans. Similarly, around 80% of the firms receive trade
9 Trade credit – including factoring – plays an important role in Italy, the first market worldwide in relative terms (with respect to GDP) and the third in absolute terms. In 2001 factoring flows were about 10% of GDP. According to Benvenuti and Gallo (2004) the use of factoring is more common among transportation, mechanics, energy and communications. They also report about the use of “indirect factoring”, another Italian peculiarity whereby firms not only transfer their own credits to factoring companies, but also their suppliers’.

11
credit. An interesting source of fund is government’s loans. About one third of the
firms obtained subsidized loans from the various branches of government.
The capital structure of firms in the various industries is summarized in Table 4.
The highest share of overall equity in total funding appears in the transportation
sector (74%). By contrast, the manager’s own equity position is lowest in
manufacturing, perhaps due to the need for larger amounts of physical capital. It is
interesting to note that manufacturing firms are also more successful in attracting
outside equity funds (almost 15% of total funds). In other European countries only
5%-10% of all start-ups have received capital contributions from third parties.
Manufacturing firms are also different in their debt composition in that they obtain a
larger share of funds from government loans (5% of total resources).
7. Empirical analysis
We try to explain capital structure in terms of characteristics such as age, size, risk,
etc. The variables are defined in the appendix. The general equation takes the
following form:
LEV = a + b1SIZE + b2AGE + b3PRF + b4RISK + e (1)
We use two measurements of leverage. One refers to the ratio of total debt to total
assets (LEV1); the other to the debt/equity ratio (LEV2).
We use the number of employees as a scale variable (see also table 5). This is a
more reliable measure than sales: It is more difficult to under-report the number of
employees than the exact amount of revenues. Consistently with the line of reasoning
presented earlier, the size variable is expected to be positively linked to the capital
structure. This prediction is confirmed in columns 1 and 2 of the Table, which
illustrate that larger new firms do have a higher component of debt in their liability
structure than smaller firms.
According to earlier studies, firm age is another variable that is expected to affect
the capital structure: Older firms supposedly suffer less from opaque information vis -
à-vis lenders and are therefore more likely to enjoy better credit terms. As shown in

12
the first column of Table 5A, however, this variable does not have a significant
impact in our sample and therefore has been dropped in the subsequent equations.
The variable “risk year” in Table 5A is the actual failure rate of firms in the three
regions during the year that preceded registration. We expect the “risk year” variable
to be negatively associated with leverage : More risky firms face fewer debt providers
when they begin operations, which is what the estimates confirm.
As for profitability, simple return measures are not useful in our case. Few firms
in this stage produce positive accounting profits. Instead, we prefer to use the annual
income of the owner-manager as an indicator of profitability. As suggested by earlier
research, we expect profitability to be negatively related to leverage: consistent with
Myers’s “pecking order” hypothesis 10, profitable firms use retained earnings instead
of external resources. In our case (column 2 in table 5A), the variable is indeed
negatively related to the debt/asset ratio, although hardly significant.
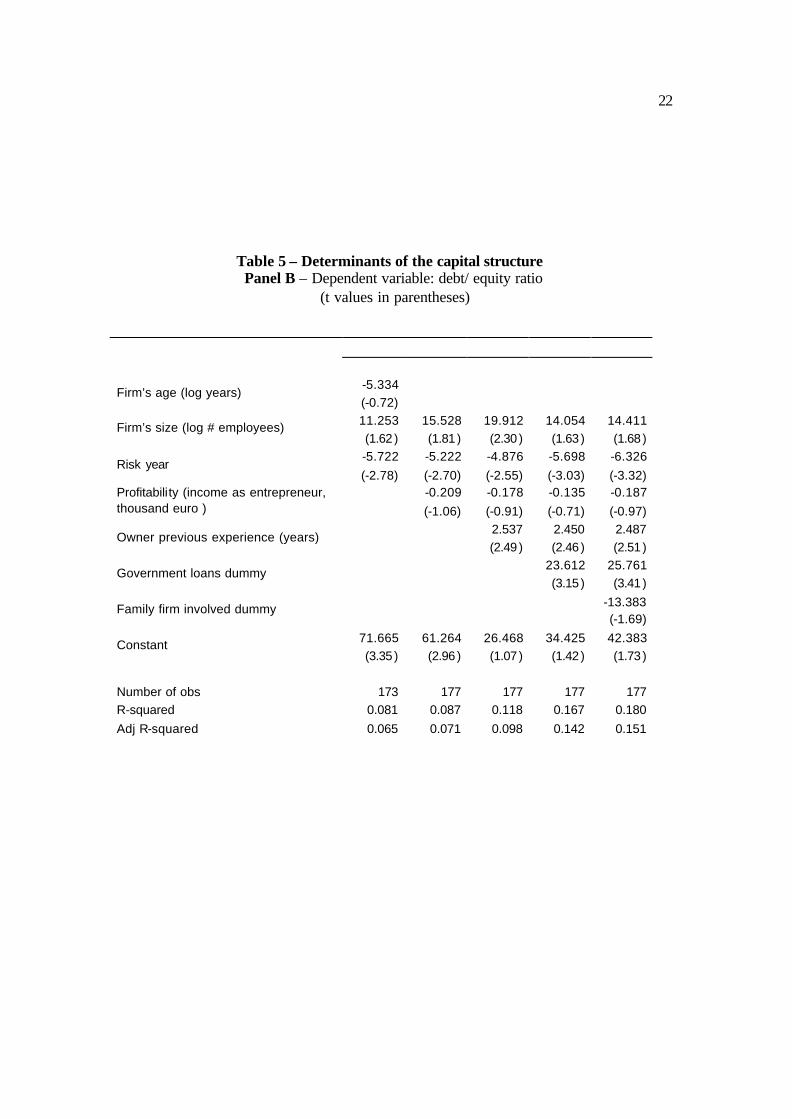
In panel B of Table 5 the independent variables are the same as in panel A, but
leverage is now measured in terms of debt/equity ratio (LEV2). While the absolute
values of the coefficients are different, the directions of causality are the same. That
is, size carries a positive sign, while risk carries a negative sign. Once again, firm age
and profitability do not have a statistically significant impact on leverage.
8. Extension: The Impact of Earlier Work Experience
In order to extend the analysis we add three variables to equation (1):
LEV = a + b1SIZE + b2PRF + b3RISK + b4EXP + b5GOV + b6FF + e (2)
As argued earlier, the previous working experience of the owners is expected to be
positively correlated with leverage. The understanding of market processes and the
web of links that are created before his conversion to entrepreneurship help the
10 As mentioned earlier, this hypothesis suggests that the founders prefer internal over external financing in order to retain ownership and control. Furthermore, by using less debt, owners can reduce the risk of financial distress and avoid the operating restrictions that usually come with higher leverage.

13
founder to identify and obtain debt sources for his new firm. Hence, in column 3 of
tables 5 we take into account the owner’s previous experience (in years). As expected,
its impact is positive and significant: more experienced entrepreneurs obtain more
loans and use higher leverage. Put differently, the effect of previous work experience
is an important way to acquiring human capital (including reputation) that is directly
relevant to the acquisition of the funds needed to start a new company.
In column 4 of Table 5 we add a dummy variable for government loans. If the
firm had used government loans as a source of capital, one was recorded; zero
otherwise. It is worth emphasizing that the weight of government loans in the overall
liability structure is very small, as government loans add only about 6.5 percent to
total liability of the 37 percent of firms who manage to get it11. It appears, however,
that firms that obtain subsidized government loans also get significantly higher
amounts of bank loans.
There are three possible explanations for the high positive effect of government
loans on leverage. First, it could be that the lending bank realizes that firms who
passed a screening process by government agencies have better than average chances
to be successful. Second, maybe the bank views government loans as a signal that the
owner-manager of the firm knows his way around the bureaucratic maize and this will
enhance the probability of success. A third possible explanation is that even though
the government contribution usually amounts to a small share of the assets, it can be
perceived as similar to equity: the government is unlikely to initiate bankruptcy
procedures for firms who fail to repay in time and is more generous in granting
extensions. This, in turn, reduces financial risk, not unlike an addition to equity.
A frequent finding in the literature is that the probability of business ownership is
higher among the sons and daughters of business owners (Lendz and Labland, 1990 ;
Hout and Rosen, 2000). These studies generally maintain that this is due to the
acquisition of general business experience in family-owned businesses or to some
specific experience. However, when looking at the US experience, Dunn and Holtz-
11 Many Italian entrepreneurs seem to know pretty well how to take advantage of the generosity of the Italian government. This is also reflected in the capital structure of start-up firms, some of which include close to 7 percent of their liabilities in the form of government loans.
14
Eakin (2000) not only find that founders’ relatives do not take on a managerial role at
an early age – a phenomenon that is also confirmed but our Italian data – but that self-
employed sons follow their fathers’ occupation in only 32% of the cases. Once again,
our findings seem to support the American experience: only 28% of the business
owners in our sample had worked full time for their family business before they
started their own firm. Most have gained their work experience in unrelated firms. As
a matter of fact, in the course of our interviews we have observed that the owners of
firms frequently encourage younger family members to form their own new company,
rather than to work for the existing family firm and wait for control to be transferred
to them sometime in the future. Nonetheless, older family companies sometime do
contribute some of the equity in the form of a minority share. And parents may assist
younger family entrepreneurs by using their own connections to provide inputs and
ease the access to credit.
In particular, the data contained in our sample emphasize the role played by two
distinct sources of equity. The first is a personal investment carried out by a relative
into the company run by a young family member. The second is an investment made
by a family firm (as long as the family already runs an independent business). Thus,
in column 5 of table 5 we add another dummy variable, FF, equal to one if a family
firm has invested in the new venture; zero otherwise. The coefficient of this variable
is negative but not statistically significant.
9. Conclusions
This paper presents two major findings about newly founded firms. First, it appears
that the ir capital structure is determined by their size, but not by their age: large firms
do receive better terms from the lending banks, but age is vir tually irrelevant as for
the capital structure, contrary to Berger and Udell (1998). Similarly, larger firms also
make larger use of trade credit. The observation that the larger firms are relatively
more indebted than the small ones is in line with earlier research by Cole and Wolken
(1995), as well as by Gregory, Rutherford, Oswald and Gardiner (2005).
Second, the length of the founder’s previous working experience (measured in
years) is positively related to the debt/equity ratio of his newly founded firm: more

15
experienced entrepreneurs obtain more loans from banks and use higher leverage. We
also observe that the mere existence of government loans in the liability structure
contributes positively to the size if the leverage: firms that obtains subsidized
government loans also get larger loans from private financial institutions.

16
References :
Åstebro Thomas, and Irwin Bernhardt (2003). Start-up financing, owner characteristics, and survival, Journal of Economics and Business, 55, pp. 303-319. Bennendsen, Morton and Daniel Wolfenson (2000). The Balance of Power in Closely Held Corporations, Journal of Financial Economics, 58, pp.113-139. Benvenuti, Marco and Marco Gallo (2004). “Perché le Imprese Ricorrono al Factoring? Il Caso dell’Italia”, Temi di Discussione Banca d’Italia, No. 518. Berger, Allen N. and Gregory F. Udell (1998). The economics of small business finance: the roles of private equity and debt markets in the financial growth cycle, Journal of Banking and Finance, 22, pp. 613-673. Berger, Allen N and Gregory F. Udell (2002). Small business credit availability and relationship lending: the importance of bank organisational structure, Economic Journal, 112, F32-F53. Chittenden, Francis, Graham Hall and Patrick Hutchinson (1996). Small firm growth, access to capital markets and financial structure: review of issues and an empirical investigation, Small Business Economics, 8, pp. 59-67. Cole, Rebel A. and John D. Wolken (1995). Financial services used by small businesses: evidence from the 1993 National Survey of Small Business Finances, Federal Reserve Bulletin, July, pp. 629-667. Colombo, Massimo G., Marco Del Mastro and Luca Grilli (2004). Entrepreneurs’ human capital and the start-up size of new technology-based firms, Internationa l Journal of Industrial Organization, 22, pp. 1183-1211. Coleman, Susan and Richard Cohn (2000). Small Firms’ use of financial leverage: evidence from the 1993 National Survey of Small Business Finances, Journal of Business and Entrepreneurship , 12 (3), pp. 81-98. Dunn, Thomas and Douglas Holtz-Eakin (2000). Financial Capital, Human Capital and the Transition to Self-Employment: Evidence from Intergenerational Links, Journal of Labor Economics, 18 (2), pp. 282-300. Gregory, Brian T., Matthew W. Rutherford, Sharon Oswald and Lorraine Gardiner (2005). An empirical investigation of the growth cycle theory of small business financing, Journal of Small Business Management, 43 (4), pp. 382-392. . Hutchinson, Robert W. (1995). The capital structure and investment decisions of the small owner-managed firm: some exploratory issues, Small Business Economics, 7, pp. 231-239.

17
Hout, Michael and Harvey S. Rosen (2000). Self-employment, family background, and race, Journal of Human Resources, 35 (4), pp. 670-692. Lentz, Bernard and David Laband (1990). Entrepreneurial success and occupational inheritance among proprietors, Canadian Journal of Economics, 23 (3), pp. 563-579. Lopez-Gracia, Jose and Cristina Aybar-Arias (2000). An empirical approach to the financial behaviour of small and medium-sized companies, Small Business Economics, 14, pp. 55-66. Michaelas Nicos, Francis Chittenden and Panikkos Poutzioris (1998). A Model of Capital Structure decision Making in Small Firms, Journal of Small Business and Development, 5 (3), pp. 246-260. Modigliani, Franco and Merton H. Miller (1958). The cost of capital, corporate finance and the theory of investment, The American Economic Review, 48 (3), pp. 261-297. Moskowitz Tobias and Annette Vissing-Jørgensen (2002). The return to entrepreneurial investment: a private equity premium puzzle?, The American Economic Review, 92 (4), pp. 745-778. Myers, Stewart C. (1984). The capital structure puzzle, The Journal of Finance, 39 (3), pp. 575-592. Rapiti Fabio (1997). Lavoro Autonomo, Lavoro Dipendente e Mobilità: un Quadro Statistico in S. Bologna and A. Fumagalli (eds.), Il Lavoro Autonomo di Seconda Generazione, Feltrinelli, Milano. Reynolds Paul D. (1997). Who Starts a New Firm? Preliminary Explorations of Firms-in-gestation, Small Business Economics, 9 (5), pp. 449-462. Reuber, Rebecca and Eileen Fischer (1999). Understanding the consequences of founders’ experience, Journal of Small Business Management, 37, pp. 30-45. Shleifer, Andrei and Robert Vishny (1997). A Survey of Corporate Governance, Journal of Finance, 52, pp. 737-783. Westhead, Paul, Deniz Ucbasaran and Mike Wright (2005). Decisions, actions and performance: do novices, serial and portfolio entrepreneur differ?, Journal of Small Business Management, 43, pp. 393-417.

18
Appendix - Definition of the variables
LEV1 A measure of the leverage defined as total debt over total assets.
LEV2 A measure of the leverage defined as total debt over total equity
PRF A proxy for profitability measured as recent, 2004, annual income from ownership and management of the business
EXP Number of years the manager-owner spent as an employee before opening the present firm.
AGE Number of years of ownership and operation of present firm
HRS Number of hours worked per week, on average, as owner-manager.
IND M AN, manufacturing
CON , building and real estate
BUS , business services, maintenance, cleaning, printing, supplies
ACR, hospitality, lodging, catering and restaurants
COM , retail: furniture, food products, clothing, household goods
PES, personal services: education, beauty industry, repairs, etc.
TSC, transportation, shipping, packing and storage
SIZE A measure of scale defined as the number of salaried (non-family) employees in the firm
EAGE The age of the entrepreneur, in years.
RISK Actual failure rate of small firms in the year prior to establishment of the firm.
ONR Number of active owners of the firm.
FUNDS All funding sources are expressed as percentage of total assets, using the first financial documentation following registration.
1. Personal equity out of owners’ own funds
2. Equity investment obtained form other family members
3. Equity investment by a family-related firm
4. External equity from institutions including venture capital
5. Loans made by banks or bank subsidiaries (mortgage, leasing)
6. Government loans and assistance program (all levels of government)
7. Other loans such as trade credits, factoring and customer advances
19
COLL A 0-1 variable. One if collateral of any sort is pledged according to notes in the financial reports.
TABLES
Table 1 – Descriptive statistics of the owner and of the firm N obs Mean Std dev. Median Years as an employee 193 8.11 3.75 8 Age of the firm 193 6.74 3.88 6 Hours worked per week 193 45.56 19.06 50 Number of employees 192 15.67 14.03 11 Age of the active owner 189 45.83 11.65 49 Number of owners 193 1.47 0.75 1 Income of the owner (thousand euro, per annum) 193 58.20 27.76 50.69
Table 2 – Descriptive statistics of the capital structure (as a percent of total assets) N Mean Std dev. Median Total equity 178 65.26 16.19 65 Sources of equity: Own funds 178 44.36 18.96 40 Family funds 178 9.13 11.55 0 Family firms funds 178 5.56 10.11 0 Outside investors 178 6.21 11.50 0 Total debt 178 34.74 16.19 35 Sources of debt: Government loans 178 2.50 4.45 0 Bank loans 178 19.74 13.41 20 Trade credits 178 12.50 10.34 10
20
Table 3 – Sources of funds by occurrence
Total By occurrence N Mean Std dev. N Mean Std dev. Own funds 178 44.36 18.96 178 44.36 18.96 Family funds 178 9.13 11.55 84 19.35 9.19 Firm funds 178 5.56 10.11 53 18.68 9.91 Outside investors 178 6.21 11.50 46 24.02 9.09 Total equity 178 65.26 16.19 178 65.26 16.19 Bank loans 178 19.74 13.41 151 23.26 11.38 Government loans 178 2.50 4.45 66 6.74 4.99 Trade credit 178 12.50 10.34 145 15.34 9.35 Total debt 178 34.74 16.19 172 35.95 15.08
Table 4 – Capital structure by source of funds and industry (means , percent of assets)
N Total
equity Own Family Firm Outside
funds Total debt
Gov loans
Bank loans
Trade credit
ACR 33 58.88 37.25 14.50 6.42 0.71 41.08 2.33 20.42 18.33 BUS 18 61.83 41.56 8.39 3.39 8.50 38.11 3.00 23.61 11.50 COM 34 68.94 52.19 4.71 6.84 5.19 31.10 2.32 17.74 11.03 PES 20 66.15 53.00 8.80 3.85 0.50 33.85 1.75 22.50 9.60 TSC 17 73.76 55.65 6.94 1.76 9.41 26.24 0.47 14.94 10.82 MIS 24 63.33 40.75 6.13 7.54 8.92 36.67 2.79 21.67 12.21 CON 20 69.11 47.21 10.79 9.95 1.16 30.89 1.26 13.58 16.05 MAN 27 61.72 30.20 13.36 3.44 14.72 38.28 5.16 22.64 10.48 Total 193 65.26 44.36 9.13 5.56 6.21 34.74 2.50 19.74 12.50

21
Table 5 – Determinants of the capital structure Panel A – Dependent variable: debt/ assets ratio
(t values in parentheses)
-0.351 Firm’s age (log years) (-0.15) 3.983 6.770 7.860 5.446 5.522 Firm’s size (log # employees) (1. 6) (2.44) (2.79) (1.97) (2.00) -1.094 -1.104 -1.018 -1.357 -1.492 Risk year (-1.64) (-1.77) (-1.64) (-2.25) (-2.43)
-0.089 -0.081 -0.063 -0.075 Profitability (income thousand euro ) (-1.39) (-1.27) (-1.04) (-1.20) 0.631 0.595 0.603 Owner previous experience (years) (1.90) (1.87) (1.89) 9.731 10.192 Government loans dummy (4.05) (4.19) -2.871 Family firm involved dummy (-1.12)
30.125 27.835 19.183 22.462 24.169 Constant (4.34) (4.16) (2.38) (2.89) (3.06)
Number of obs 173 177 177 177 177 R-squared 0.059 0.076 0.095 0.174 0.180 Adj R-squared 0.042 0.060 0.074 0.150 0.151
22
Table 5 – Determinants of the capital structure Panel B – Dependent variable: debt/ equity ratio
(t values in parentheses)
-5.334 Firm’s age (log years)
(-0.72) 11.253 15.528 19.912 14.054 14.411 Firm’s size (log # employees) (1.62 ) (1.81 ) (2.30 ) (1.63 ) (1.68 ) -5.722 -5.222 -4.876 -5.698 -6.326
Risk year (-2.78) (-2.70) (-2.55) (-3.03) (-3.32)
-0.209 -0.178 -0.135 -0.187 Profitability (income as entrepreneur, thousand euro ) (-1.06) (-0.91) (-0.71) (-0.97)
2.537 2.450 2.487 Owner previous experience (years)
(2.49 ) (2.46 ) (2.51 ) 23.612 25.761
Government loans dummy (3.15 ) (3.41 ) -13.383 Family firm involved dummy (-1.69)
71.665 61.264 26.468 34.425 42.383 Constant (3.35 ) (2.96 ) (1.07 ) (1.42 ) (1.73 )
Number of obs 173 177 177 177 177 R-squared 0.081 0.087 0.118 0.167 0.180 Adj R-squared 0.065 0.071 0.098 0.142 0.151
Copyright © 2022 FDOKUMEN