THE EFFECTS OF SPEECH TASKS ON THE PROSODY OF ...
70
THE EFFECTS OF SPEECH TASKS ON THE PROSODY OF PEOPLE WITH PARKINSON DISEASE by Andrew Herbert Exner A Thesis Submitted to the Faculty of Purdue University In Partial Fulfillment of the Requirements for the degree of Master of Science Department of Speech, Language, & Hearing Sciences West Lafayette, Indiana December 2019
-
Upload
khangminh22 -
Category
Documents
-
view
0 -
download
0
Transcript of THE EFFECTS OF SPEECH TASKS ON THE PROSODY OF ...
THE EFFECTS OF SPEECH TASKS ON THE PROSODY OF PEOPLE
WITH PARKINSON DISEASE
by
Andrew Herbert Exner
A Thesis
Submitted to the Faculty of Purdue University
In Partial Fulfillment of the Requirements for the degree of
Master of Science
Department of Speech, Language, & Hearing Sciences
West Lafayette, Indiana
December 2019
2
THE PURDUE UNIVERSITY GRADUATE SCHOOL
STATEMENT OF COMMITTEE APPROVAL
Dr. Jessica Huber, Chair
Department of Speech, Language, & Hearing Sciences
Dr. Alexander Francis
Department of Speech, Language, & Hearing Sciences
Mrs. Barbara Solomon
Department of Speech, Language, & Hearing Sciences
Approved by:
Dr. Preeti Sivasankar
Head of the Graduate Program

3
For all those making their voices heard and those who support them

4
ACKNOWLEDGMENTS
An endeavor of this magnitude is not completed in a vacuum. I stand on the shoulders of giants
as I eke out my place in this field. Faculty and staff members in the department, clinical
supervisors, friends, and family members have all played a huge role in getting me to where I am
today. But the following people bear special mention:
To my chair, Dr. Jessica Huber: thank you for inspiring curiosity in me, encouraging me when I
was struggling to balance my responsibilities, and lighting a fire under me to keep me forging
ahead.
To Mrs. Barbara Solomon: thank you for guiding me to develop both my clinical skills and my
professional skills, and for always telling it to me straight.
To Dr. Alex Francis: thank you for always sparking new ideas with your insightful comments
and for originally teaching me many of the techniques I would need to complete this project.
To my parents, Joy and Allen Exner: thank you for providing me with opportunities to explore
my interests as a child and encouraging me to pursue my passions.
And to my wife, Elisabeth Sharber: thank you for sticking with me through this journey that has
upended our lives for a few years, for believing in me, and for being a rock-solid partner. Neither
of us have stood still during this process, and you continue to inspire me to grow.
I hope that I continue to make you all proud and that, together, we make the world around us a
little brighter.

5
TABLE OF CONTENTS
LIST OF TABLES .......................................................................................................................... 7
ABSTRACT .................................................................................................................................... 8
INTRODUCTION .......................................................................................................................... 9
Prosody and Stress Patterns in Standard American English ....................................................... 9
Overall Profile of Prosodic Insufficiency in Parkinson Disease ............................................... 11
Changes to Lexical Stress in Parkinson Disease ...................................................................... 13
Task Differences in Assessing Dysprosody .............................................................................. 14
Associated Cognitive Changes in Parkinson Disease ............................................................... 18
Naturalistic Assessment of Prosody in Parkinson Disease ....................................................... 19
Hypotheses ................................................................................................................................ 20
METHODS ................................................................................................................................... 21
Participants ................................................................................................................................ 21
Equipment ................................................................................................................................. 22
Stimulus .................................................................................................................................... 23
Acoustic Measurements and Derived Values ........................................................................... 25
Correcting Pitch-Tracking Errors for f0 Measures .................................................................... 26
Correcting Formant-Tracking Errors for F1 and F2 Measures ................................................. 29
RESULTS ..................................................................................................................................... 31
Duration of Vowel .................................................................................................................... 31
Mean Pitch of Vowel ................................................................................................................ 32
Mean Intensity of Vowel .......................................................................................................... 32
Pairwise Variability Index of Duration ..................................................................................... 33
Pairwise Variability Index of Mean Pitch ................................................................................. 33
Pairwise Variability Index of Mean Intensity ........................................................................... 34
Bark Scale F1 (20%, 50%, and 80%) ....................................................................................... 34
Bark Scale F2 20% ................................................................................................................... 35
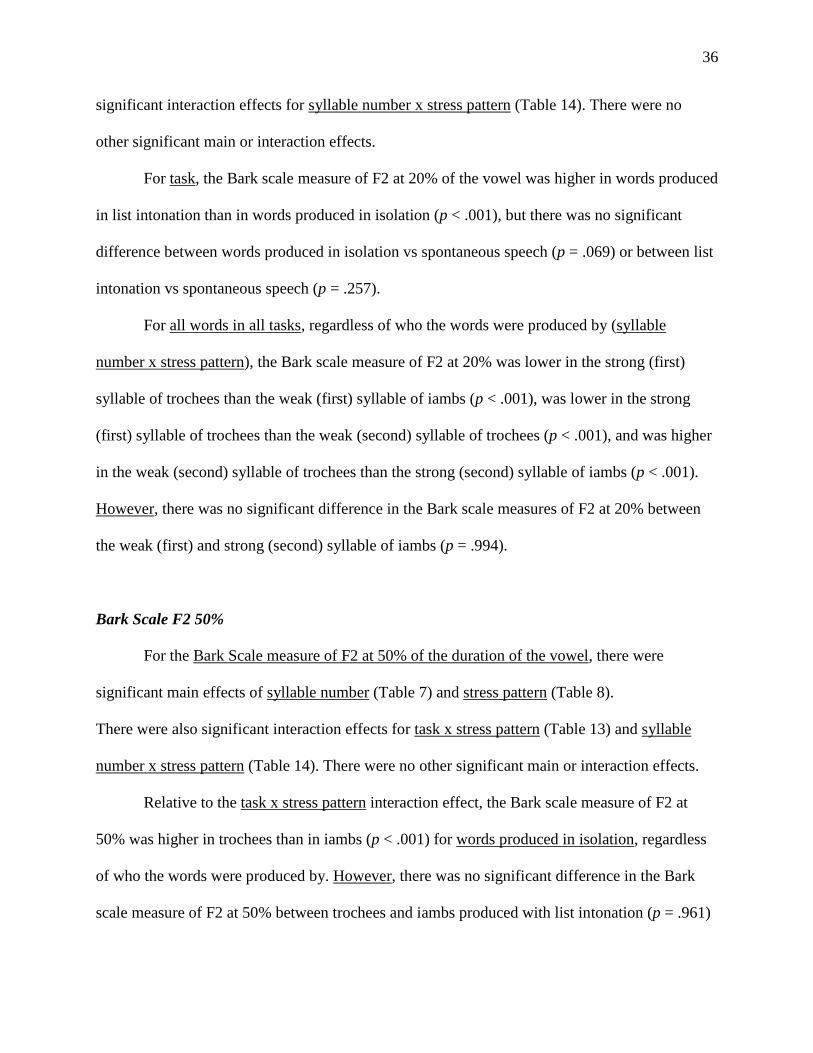
Bark Scale F2 50% ................................................................................................................... 36
Bark Scale F2 80% ................................................................................................................... 37
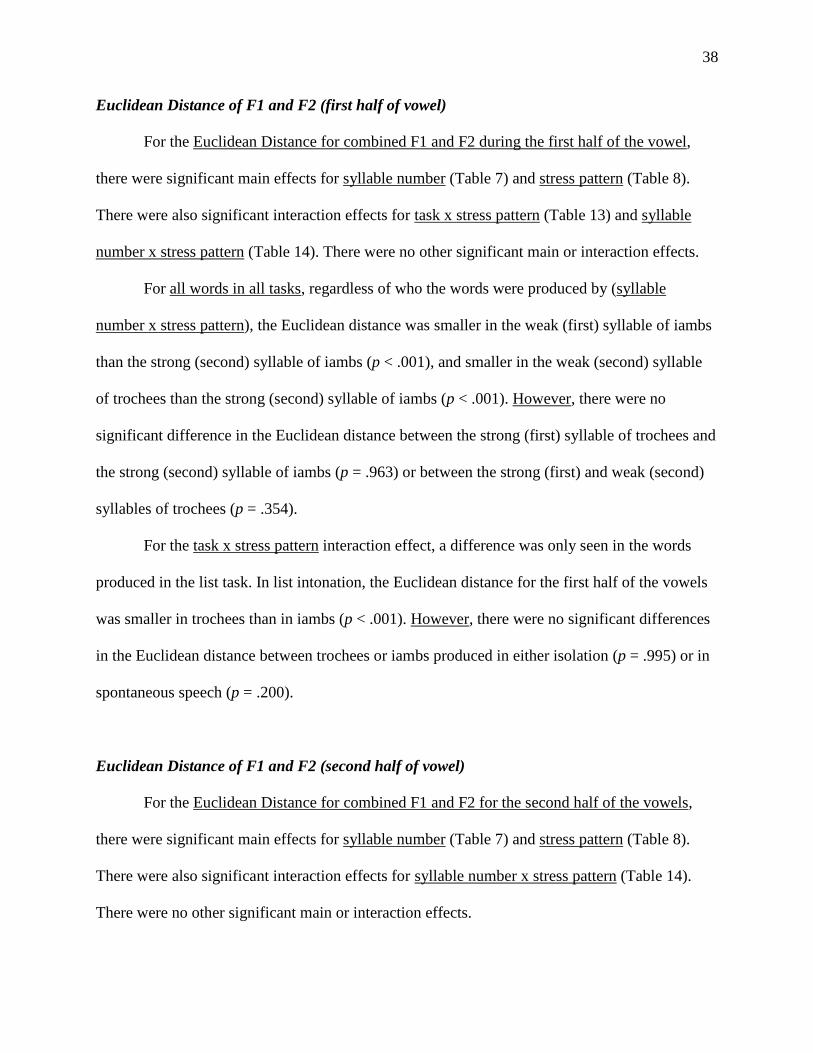
Euclidean Distance of F1 and F2 (first half of vowel) ............................................................. 38

6
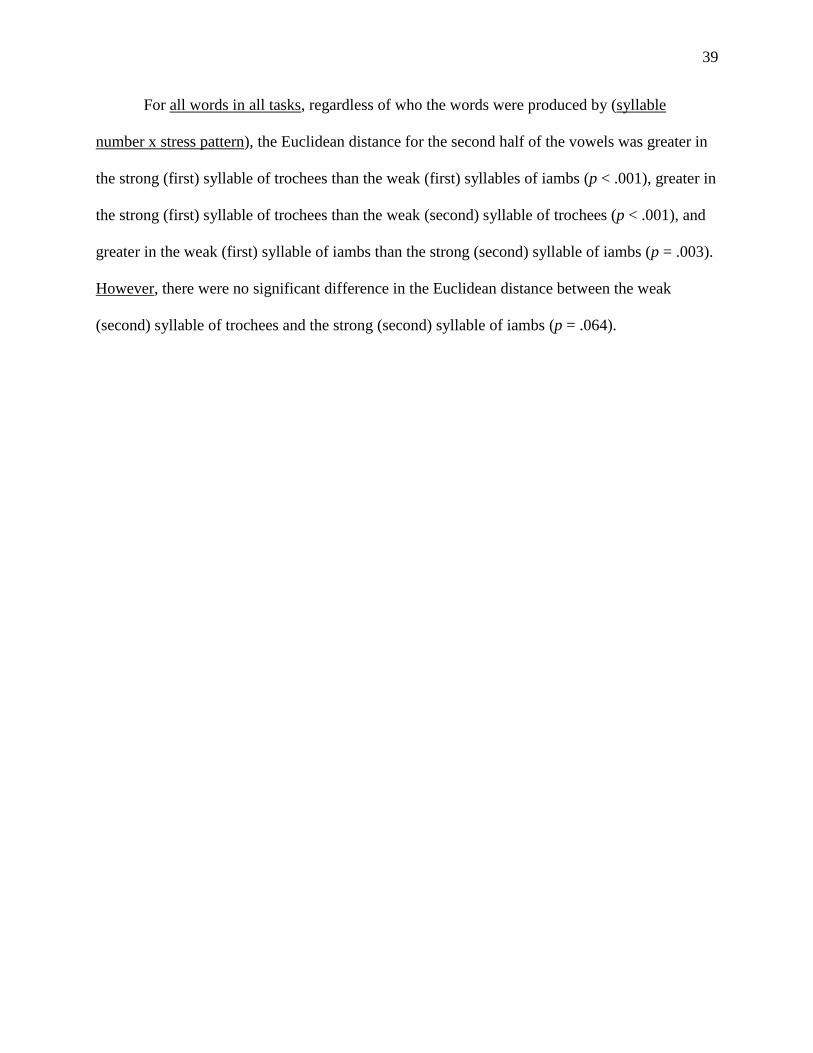
Euclidean Distance of F1 and F2 (second half of vowel) ......................................................... 38
DISCUSSION ............................................................................................................................... 40
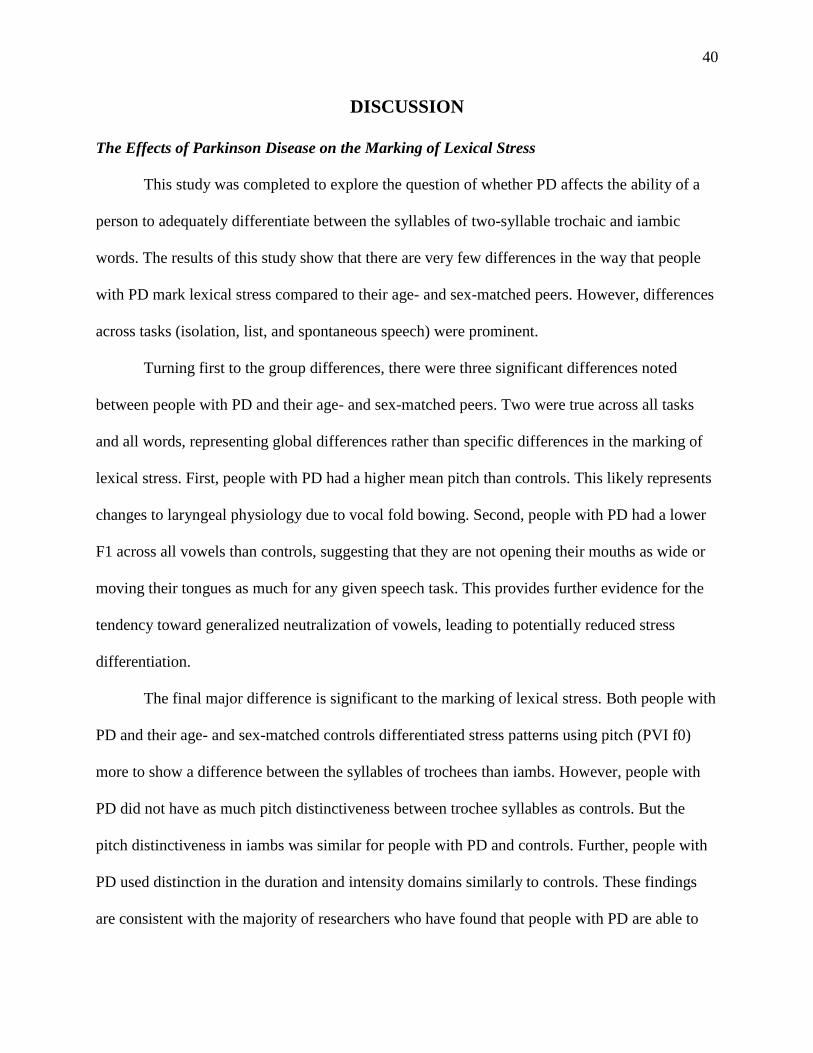
The Effects of Parkinson Disease on the Marking of Lexical Stress ........................................ 40
The Effects of Task on the Marking of Lexical Stress ............................................................. 41
Differences in Marking of Lexical Stress for Trochees and Iambs .......................................... 42
The Significance of Formants in Lexical Stress ....................................................................... 43
Limitations and Future Directions ............................................................................................ 45
Lexical Control of Positional Location in Phrase ................................................................. 45
Lip and Jaw Positioning for Consonants and Vowels .......................................................... 45
Mean Pitch and Mean Intensity vs Min/Max ........................................................................ 46
Vocal Fry .............................................................................................................................. 46
Formant 3 (and Higher) ........................................................................................................ 47
Conclusions ............................................................................................................................... 47
APPENDICES
APPENDIX A. PICTURE LISTING TASK ............................................................................ 60
APPENDIX B. MAP TASK: STREETS .................................................................................. 61
APPENDIX C. MAP TASK: ZOO ........................................................................................... 62
APPENDIX D: VOWEL QUADRILATERALS BY GENDER AND TASK ........................ 63
REFERENCES ............................................................................................................................. 64

7
LIST OF TABLES
Table 1: Overall Profile of Prosodic Insufficiency in Parkinson Disease .................................... 12
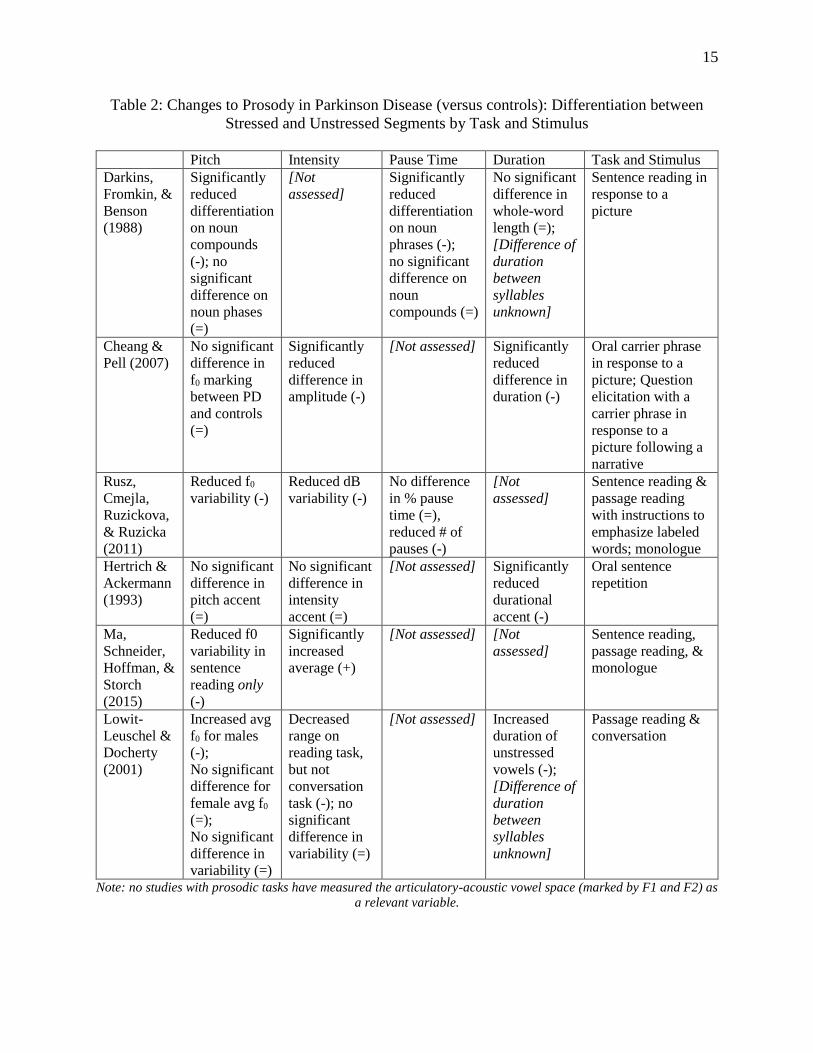
Table 2: Changes to Prosody in Parkinson Disease (versus controls): Differentiation between
Stressed and Unstressed Segments by Task and Stimulus............................................. 15
Table 3: Participant Demographic Information ............................................................................ 23
Table 4: Stimulus Words to be Analyzed by Task ....................................................................... 30
Table 5: Main Effects of Group: Means (standard error in parentheses) ..................................... 48
Table 6: Main Effects of Task: Means (standard error in parentheses) ........................................ 49
Table 7: Main Effects of Syllable Number: Means (standard error in parentheses) .................... 50
Table 8: Main Effects of Stress Pattern: Means (standard error in parentheses) .......................... 51
Table 9: Group x Task Interaction Effects: Means (standard error in parentheses) ..................... 52
Table 10: Group x Syllable Number Interaction Effects: Means (standard error in parentheses) 53
Table 11: Group x Stress Pattern Interaction Effects: Means (standard error in parentheses) ..... 54
Table 12: Task x Syllable Number Interaction Effects: Means (standard error in parentheses) .. 55
Table 13: Task x Stress Pattern Interaction Effects: Means (standard error in parentheses) ....... 56
Table 14: Syllable Number x Stress Pattern Interaction Effects: Means (standard error in
parentheses) .................................................................................................................. 57
Table 15: Task x Syllable Number x Stress Pattern Interaction Effects: Means (standard error in
parentheses) .................................................................................................................. 58

8
ABSTRACT
One of the key features of the hypokinetic dysarthria associated with Parkinson disease is
dysprosody. While there has been ample research into the global characterization of speech in
Parkinson disease, little is known about how people with Parkinson disease mark lexical stress.
This study aimed to determine how people with Parkinson disease modulate pitch, intensity,
duration, and vowel space to differentiate between two common lexical stress patterns in
English: trochees (strong-weak pattern) and iambs (weak-strong pattern), in two syllable words.
Twelve participants with mild to moderate idiopathic Parkinson disease and twelve age- and sex-
matched controls completed a series of speech tasks designed to elicit token words of interest in
prosodically-relevant speech tasks (picture identification (in isolation and lists) and giving
directions (spontaneous speech). Results revealed that people with Parkinson disease produced a
higher overall pitch and a smaller vowel space as compared to controls, though most lexical
marking features were not significantly different. Importantly, the elicitation task had a
significant effect on most dependent measures. Although lexical stress is not significantly
impacted by Parkinson disease, we recommend that future research and clinical practice focus
more on the use of spontaneous speech tasks rather than isolated words or lists of words due to
the differences in the marking of lexical stress in the latter tasks, making them less useful as
ecologically-valid assessments of prosody in everyday communication.

9
INTRODUCTION
During interviews with 37 people with Parkinson disease (PD), Miller, Noble, Jones, and
Burns (2006) asked participants about their major concerns regarding their communication.
Three major themes emerged: the increased effort to communicate, difficulty interacting with
others, and a diminished view of the self. One participant qualified this by saying “I never know
when I start to talk…what tone or pitch is going to come out.” Another participant said, “People
just keep staring at you when you cannot get your words out…so I just avoid the people.”
The hypokinetic dysarthria associated with PD is debilitating on multiple levels, and it
has been well-studied in terms of discerning key symptoms and devising treatment protocols.
While there is widespread agreement that prosodic impairment is one of the key speech
symptoms of hypokinetic dysarthria associated with PD, findings are mixed about the exact
nature and cause of the dysprosody, and therefore how to treat it. To address the social-
communication needs of people with PD, it is important to characterize what they are doing in
prosodic tasks to highlight what remains challenging.
Prosody and Stress Patterns in Standard American English
Prosody serves many linguistic and extralinguistic functions in Standard American
English, including but not limited to lexical stress (syllable differentiation in words), contrastive
stress (emphasizing a specific word in a sentence), sentence mode differentiation (declarative vs
interrogative), emotional expression, and turn-taking. Prosody further serves as a cue to resolve
semantic ambiguities in connected speech, usually coinciding with morphosyntactic cues. All
these functions involve manipulation of the vocal tract, resulting acoustically in modulations of
fundamental frequency (f0), intensity, duration, and formant structure. Impairments in one
10
prosodic function do not necessarily mean that other prosodic functions will be similarly
affected, as many speech-language functions dissociate. Careful task construction is needed to
isolate these functions.
The prototypical pattern of stress in healthy speakers of Standard American English is to
elevate f0, increase intensity, increase duration, and open the mouth wider for the vocalic
segment to be emphasized (Fry, 1955; Fry, 1958; Lieberman, 1960). Stressed syllables are
usually marked using these acoustic cues with non-emphasized vocalic segments being reduced
in each of these aspects. While earlier researchers attempted to establish a hierarchy between
these cues, most now agree that there is not a single dominant acoustic cue. Instead, cue trading
is common for both healthy speakers (Lieberman, 1960) and speakers with dysarthria (Patel &
Campellone, 2009). Cue trading is a useful strategy because while listeners can use redundant
cues additively to recognize words more quickly (Nakatani & Aston, 1978), not all cues are
reliably used, even by healthy speakers. Further, while adult speakers of Standard American
English mark differences between the syllables of both trochees (strong-weak) and iambs (weak-
strong), these modulations tend to be greater in iambs than in trochees (Goffman & Malin, 1999).
English listeners rely on lexical stress cues in some listening situations, such as
differentiating minimally contrastive bisyllabic pairs in connected speech (Gordon-Salant, Yeni-
Komshian, Pickett, & Fitzgibbons, 2016) or rapidly recognizing individual words with
differential stress but identical segmental content (Jesse, Poellmann, & Kong, 2017). There is
also evidence that these listeners may use different cues depending on whether they are listening
to single-word productions (Cutler & Clifton, 1984) or connected speech, especially depending
on where the stressed word is in a sentence (Nakatani & Aston, 1978). Finally, listeners may be
more attuned to one or more cues depending on factors including the size of their vocabulary

11
(McAuliffe, Gibson, Kerr, Anderson, & LaShell, 2013), their communication partner's accent
(Kondaurova & Francis, 2008), and the amount of noise in the communication environment
(Borrie, Baese-Berk, Van Engen, & Bent, 2017). This makes it important for any speaker to have
a flexible command of different cues.
The core features of prosody (f0, amplitude, duration, and articulatory space) are often
significantly affected in people with PD. This can lead to difficulties with lexical stress marking,
increasing the effort required to create meaningful stress differences and making it harder for a
communication partner to understand a person with PD’s speech.
Overall Profile of Prosodic Insufficiency in Parkinson Disease
The overall profile of prosodic insufficiency for people with PD has remained consistent
since the initial description of the cluster by Darley, Aronson, and Brown (1969) (Table 1).
People with PD produce monopitch speech, characterized by reduced f0 variation (Skodda,
Rinsche, & Schlegel, 2009; Rusz, Cmejla, Ruzickova, & Ruzicka, 2011), reduced f0 range (Rusz
et al, 2011; Tykalova, Rusz, Cmejla, Ruzickova, & Ruzicka, 2014), and flat (Tykalova et al.,
2014) or syntactically inappropriate (MacPherson, Huber, & Snow, 2011) f0 contours. People
with PD also tend to have monoloudness consistent with hypophonia and characterized by
reduced intensity, reduced intensity range (Tykalova et al., 2014), and reduced intensity variation
(Rusz et al., 2011). People with PD have variable rate abnormalities characterized by short
rushes of speech in addition to slowed rates (and often shorter utterances) (Kent & Rosenbek,
1982; Bunton & Keintz, 2008). While some researchers have found shorter vowel durations
(Tykalova et al., 2014), others report longer vowel durations (Watson & Munson, 2008). Finally,
people with PD tend to present with a reduced articulatory-acoustic vowel space (Watson &
12
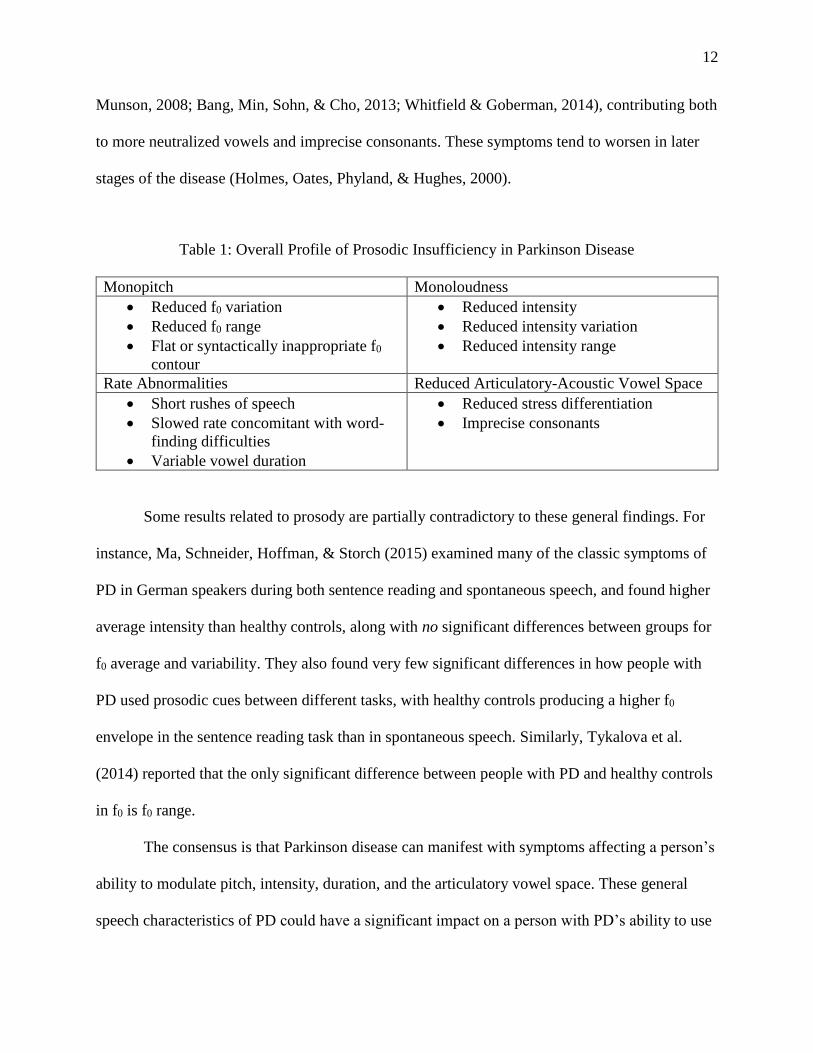
Munson, 2008; Bang, Min, Sohn, & Cho, 2013; Whitfield & Goberman, 2014), contributing both
to more neutralized vowels and imprecise consonants. These symptoms tend to worsen in later
stages of the disease (Holmes, Oates, Phyland, & Hughes, 2000).
Table 1: Overall Profile of Prosodic Insufficiency in Parkinson Disease
Monopitch Monoloudness
Reduced f0 variation
Reduced f0 range
Flat or syntactically inappropriate f0
contour
Reduced intensity
Reduced intensity variation
Reduced intensity range
Rate Abnormalities Reduced Articulatory-Acoustic Vowel Space
Short rushes of speech
Slowed rate concomitant with word-
finding difficulties
Variable vowel duration
Reduced stress differentiation
Imprecise consonants
Some results related to prosody are partially contradictory to these general findings. For
instance, Ma, Schneider, Hoffman, & Storch (2015) examined many of the classic symptoms of
PD in German speakers during both sentence reading and spontaneous speech, and found higher
average intensity than healthy controls, along with no significant differences between groups for
f0 average and variability. They also found very few significant differences in how people with
PD used prosodic cues between different tasks, with healthy controls producing a higher f0
envelope in the sentence reading task than in spontaneous speech. Similarly, Tykalova et al.
(2014) reported that the only significant difference between people with PD and healthy controls
in f0 is f0 range.
The consensus is that Parkinson disease can manifest with symptoms affecting a person’s
ability to modulate pitch, intensity, duration, and the articulatory vowel space. These general
speech characteristics of PD could have a significant impact on a person with PD’s ability to use

13
prosody for some, if not all, prosodic functions. However, there have been limited studies about
how people with PD use prosody in tasks in which prosody matters. In these studies, the findings
are mixed about the presence, absence, and severity of several key features. We review those
studies below.
Changes to Lexical Stress in Parkinson Disease
Darkins, Fromkin, and Benson (1988) examined the ability of people with PD to use
pitch contour and pause times between syllables to distinguish noun phrases from noun
compounds (e.g. black board and blackboard). Participants read sentences to describe a
presented picture. The researchers found that people with PD did not use pitch contour to
distinguish between the syllables of either noun phrases or noun compounds, nor did they
produce a significant difference in the duration of the pause between the syllables of the target.
However, healthy controls marked the noun phrases with a significant difference in the duration
of the pauses between syllables, while they marked noun compounds with a significant
difference in the pitch between syllables. Noun phrases typically have an iamb pattern (weak-
strong), while noun compounds typically have a trochaic pattern (strong-weak), suggesting that
there may be a difference in how people use prosodic cues to mark lexical stress. The results also
suggest that this stress pattern differentiation is affected by PD.
Cheang and Pell (2007) used a similar lexical stress production task but required
participants to respond with a carrier phrase instead of reading a sentence. In contrast to Darkins,
Fromkin, and Benson (1988), Cheang and Pell found that people with PD were as capable of
producing sufficient fundamental frequency changes as healthy controls, but that they were less
able to use duration and intensity cues to differentiate between noun phrases and noun
compounds. They did not assess pause differentiation.
14
Further, an associated listener study (Pell, Cheang, & Leonard, 2006) found that naïve
listeners had a somewhat more difficult time correctly distinguishing between the paired
productions of speakers in the PD group relative to the control group. That is, listeners struggled
to identify the noun compounds (trochees) from the noun phrases (iambs). Listeners had a
difficult time with the task overall, especially struggling to identify noun phrases in both the PD
and control groups, so it is unclear how much the reduced duration and intensity cues affected
identification. It is possible that the prosodic cues were not clear from either group of speakers.
The limited studies on the effects of PD on a person's lexical stress marking indicate that
modulations of frequency may or may not be significantly affected, but that a person's ability to
use intensity and duration may be negatively impacted. It is unclear whether vowel space is
significantly affected in a lexical stress task, as this has not been formally studied in people with
PD. These studies, along with relevant studies focused on the marking of contrastive tress in PD,
are summarized in Table 2 below.
Task Differences in Assessing Dysprosody
One possible reason that the specific prosodic profile of PD has been difficult to
characterize is that each study uses different tasks to measure dysprosody. Because of the many
cognitive-linguistic functions served by prosody, some tasks may be better suited to elicit
specific types of prosody than others. For instance, lexical stress can be elicited in nearly any
context, but it may present differently in a reading task, a sentence repetition task, or a
monologue.
15
Table 2: Changes to Prosody in Parkinson Disease (versus controls): Differentiation between
Stressed and Unstressed Segments by Task and Stimulus
Pitch Intensity Pause Time Duration Task and Stimulus
Darkins,
Fromkin, &
Benson
(1988)
Significantly
reduced
differentiation
on noun
compounds
(-); no
significant
difference on
noun phases
(=)
[Not
assessed]
Significantly
reduced
differentiation
on noun
phrases (-);
no significant
difference on
noun
compounds (=)
No significant
difference in
whole-word
length (=);
[Difference of
duration
between
syllables
unknown]
Sentence reading in
response to a
picture
Cheang &
Pell (2007)
No significant
difference in
f0 marking
between PD
and controls
(=)
Significantly
reduced
difference in
amplitude (-)
[Not assessed] Significantly
reduced
difference in
duration (-)
Oral carrier phrase
in response to a
picture; Question
elicitation with a
carrier phrase in
response to a
picture following a
narrative
Rusz,
Cmejla,
Ruzickova,
& Ruzicka
(2011)
Reduced f0
variability (-)
Reduced dB
variability (-)
No difference
in % pause
time (=),
reduced # of
pauses (-)
[Not
assessed]
Sentence reading &
passage reading
with instructions to
emphasize labeled
words; monologue
Hertrich &
Ackermann
(1993)
No significant
difference in
pitch accent
(=)
No significant
difference in
intensity
accent (=)
[Not assessed] Significantly
reduced
durational
accent (-)
Oral sentence
repetition
Ma,
Schneider,
Hoffman, &
Storch
(2015)
Reduced f0
variability in
sentence
reading only
(-)
Significantly
increased
average (+)
[Not assessed] [Not
assessed]
Sentence reading,
passage reading, &
monologue
Lowit-
Leuschel &
Docherty
(2001)
Increased avg
f0 for males
(-);
No significant
difference for
female avg f0
(=);
No significant
difference in
variability (=)
Decreased
range on
reading task,
but not
conversation
task (-); no
significant
difference in
variability (=)
[Not assessed] Increased
duration of
unstressed
vowels (-);
[Difference of
duration
between
syllables
unknown]
Passage reading &
conversation
Note: no studies with prosodic tasks have measured the articulatory-acoustic vowel space (marked by F1 and F2) as
a relevant variable.
16
Further, some speech tasks have higher cognitive loads, relying on different combinations
of neural coding and decoding mechanisms to produce output. The principles of the linguistic
hierarchy suggest that specific communication deficits are more likely to appear in complex
tasks than in simple tasks. If people with PD have dysprosody simply due to physiologic
dysfunction, then task should not matter significantly in assessment: all productions will be
similarly impaired due to factors such as respiratory or laryngeal changes. However, if there are
cognitive-linguistic components to prosody, then task differences should be observed.
For example, Darkins, Fromkin, & Benson (1988) showed participants a picture and
asked them to read a written sentence (a carrier phrase with the noun phrase and noun compound
pairs) as a descriptor of the picture. However, Cheang & Pell (2007) showed participants the
pictures, paraphrased the meaning for them, and asked them to identify the picture using a carrier
phrase. Although both teams used similar paradigms to assess noun phrase and noun compound
differentiation, the ability of participants to respond may have been affected by the presentation:
reading and identification/repetition are different cognitive-linguistic tasks. This may account for
some of the variation in the results.
Several research teams examining stress in prosody include a sentence reading task in
their protocols. Some present written material for participants to read, label the words to be
stressed, and give participants explicit instructions to emphasize these words (Rusz, Cmejla,
Ruzickova, & Ruzicka, 2011). Others present sentences with only punctuation cues to
differentiate between question and sentence intonation (Ma, Schneider, Hoffman, & Storch,
2015). Hertrich & Ackerman (1993) presented their stimulus sentences orally rather than in
writing and asked participants to verbally repeat the sentence to elicit a specific contrast. In
contrast, Cheang & Pell’s (2007) presented a brief narrative both orally and visually before

17
asking a question to elicit a specific contrast within a carrier phrase. Just as written versus oral
presentation of stimulus material may affect the elicited speech’s prosodic content, the
differences in these studies’ results (Table 2) suggest that the instructions given (e.g. repetition or
question elicitation) could also affect prosodic output.
Ma, Schneider, Hoffman, and Storch (2015) assessed differences in speakers’ prosody
across tasks, eliciting speech in sentence reading, passage reading, and monologue contexts.
Acoustic analysis revealed minimal differences between the way that people with PD and
healthy controls marked stress using pitch, intensity, and overall speech rate, with reduced pitch
variability specifically on the sentence reading task. People with mild PD were also noted to be
louder than both controls and people with moderate-severe PD. Importantly, they found
significant differences across tasks in the use of pitch, intensity, and speech rate.
This is in contrast with an earlier study by Lowit-Leuschel & Docherty (2001) that found
no significant differences between how people with PD used prosodic cues in conversational and
reading tasks. Lowit-Leuschel and Docherty claim that this shows that people with PD do not
respond differently to elicitation tasks. However, while both studies included reading tasks with
varied intonational contrasts, the nature of the spontaneous speech tasks were different: Ma,
Schneider, Hoffman, & Storch (2015) recorded speakers producing a spontaneous monologue,
while Lowit-Leuschel & Docherty recorded a conversation between the participant and the
researcher. Further, the participants with PD in the Lowit-Leuschel & Docherty study were
analyzed together as a single dysarthric group along with other participants with multiple
sclerosis and motor neuron disease, limiting the generalizability of these results to PD. Lowit-
Leuschel & Docherty also found minimal group differences within task: males with dysarthria
had a higher average f0 than controls (with no group difference for females), speakers with

18
dysarthria had a decreased intensity range compared to controls, and the duration of the
unstressed vowels of speakers with dysarthria was longer than the duration of unstressed vowels
spoken by controls (though there was no comparison across syllables).
These results suggest the first of two problems that need to be solved in research about
the stress-marking behavior of people with PD. The variations in prosodic marking behaviors
suggest that people with PD mark stress differently depending on the speech elicitation task, as
do all speakers of Standard American English. However, it is not clear whether people with PD
respond more differently to elicitation tasks. Examining multiple tasks of differing levels of
complexity should allow for the characterization of different stress marking behaviors. The
second problem relates to the cognitive changes observed in people with PD.
Associated Cognitive Changes in Parkinson Disease
One of the reasons that cognitive load is especially significant for people with PD is that
habitual control is diminished compared to healthy adults, likely due to basal ganglia dysfunction
(Zesiewicz, Baker, Wahba, & Hauser, 2003; Ziemssen & Reichmann, 2010; Redgrave et al.,
2010; Jahanshahi, Obeso, Rothwell, & Obeso, 2015). Sapir (2014) suggests that many aspects of
prosody are habitual rather than goal-directed, so that while a person with PD is capable of
producing meaningful contrasts given a sufficient external cue, their internal cueing is
diminished (Sadagopan & Huber, 2007; Lansford, Liss, Caviness, & Utianksi, 2011; Alvar, Lee,
& Huber, 2019), and overall vocal attention, effort, and vigilance are reduced compared to
healthy controls.
Given external cues, people with PD can produce speech that approaches typical speech
(Ramig, Sapir, Fox, & Countryman, 2001; Sadagopan & Huber, 2007; Darling & Huber, 2011).

19
For instance, Whitfield and Goberman (2014) found that, when prompted to read the Rainbow
Passage “clearly” instead of habitually, the vowel space of people with PD increased,
approaching the vowel space of age- and sex-matched healthy controls. Lam & Tjaden (2016)
found similar results in sentence reading tasks with varied speaking condition instructions (e.g.
clear, over-enunciate, & hearing impaired), during which people with PD increased vowel space,
duration, fundamental frequency, and intensity. Neither study focused on prosodic adequacy, but
the enhancement of these features led listeners to rate the speech of the participants as more
intelligible in clear than in habitual speech conditions, suggesting that when directed to, people
with PD can adjust their habitual speech production. These findings support the hypothesis that
more direct elicitation of prosody may lead to more typical productions from people with PD. In
prosodic studies, external cues (e.g. bolded words, being told to speak in a particular way, etc.)
will lead people to produce more emphatic contrasts than internal cues. This is useful, but
external cues are not always available. Naturalistic tasks rely more on internal cues. The most
effective speech tasks for either a research study or a clinical treatment are those that more
closely resemble everyday communication.
Naturalistic Assessment of Prosody in Parkinson Disease
The aim of this study is to describe how people with PD modulate prosodic variables
(i.e., f0, intensity, duration, and acoustic-articulatory vowel space as measured by the first and
second formants) during a natural, prosody-specific task. We will compare the naturalistic task
(map description) to two more commonly used tasks: word production in isolation and word
production in lists. All tasks used pictures to support production. None of the tasks used reading
for elicitation. We will demonstrate the effects of task on the marking of lexical stress, compared

20
to age- and sex-matched controls. The long-term goal of this research program is to understand
the changes to prosody in PD and the effects of task on these assessments.
Hypotheses
The prosody of participants with PD will be reduced relative to age- and sex-matched
peers, trending towards monopitch, monoloudness, monoduration, and neutralized vowels, with
greater declines on tasks with greater cognitive load demands:
Subjects with PD and controls will produce equivalent prosodic contrasts in an isolated
picture naming lexical stress task.
Compared to their own productions in isolation and list intonation, both participants with
PD and controls will produce less emphatic lexical contrasts on a naturalistic map
description task. Further, people with PD will demonstrate a sharper decline in the
marking of lexical stress across target words on the map task than controls.
The variable that will be the most different between people with PD and controls will be
duration, with the reduction of durational contrasts between the syllables of both trochees
and iambs in people with PD.

21
METHODS
Participants
Fourteen individuals with a diagnosis of idiopathic PD and thirteen age- and sex-matched
controls participated in this study. One participant with PD and one control did not complete the
portion of the test protocol analyzed for this study. An additional participant with PD was
excluded from the analysis due a lack of an age- and sex-matched control. Therefore, twelve
individuals with PD were included in the final analyzed sample: six females and six males
between the ages of 68.8 and 85.2 years (mean age 76.3 ± SD 5.13 years). The twelve
participants were closely age- and sex-matched to healthy controls between the ages of 66.7 and
85.5 years (mean age 77.1±5.40 years). A t test on the ages of the participants showed no
significant differences in age between groups (t = -0.3587, p = 0.723).
All participants spoke a North Midland dialect of American English, had no formal vocal
training, had not smoked for at least five years, had no current respiratory infections, had no
history of significant respiratory illness other than allergies or asthma, and had no history of head
and neck cancer or surgery. All participants with a history of allergies or asthma were stable and
had their conditions controlled by medicine. All participants passed a hearing screening at 40 dB
at 0.5, 1, and 2 kHz except F07PD, M04PD, and M07OC. With amplification, these participants’
hearing was considered acceptable for the testing protocol. All participants also had no history of
neurological disease except for PD. Most participants with PD were taking anti-Parkinsonian
medications, and their speech measurements were taken within 1-3 hours of taking their
medications. Additionally, M04PD had a deep brain stimulation implant. Several participants
had enrolled in speech therapy prior to the study. None were currently enrolled. Participants were
given the Cognitive Linguistic Quick Test (CLQT) prior to data collection, though they were not

22
required to receive scores within normal limits to continue the study. History of speech therapy
and CLQT scores are included in Table 3.
Two speech-language pathologists (not involved in the study) with experience diagnosing
and treating adults with motor speech disorders rated the speech severity of all participants. They
listened to a 30-second monologue sample taken from the approximate middle of a 2-minute
monologue. These samples were intensity-normalized and presented once over headphones,
blocked by speaker sex with presentation randomized within sex and raters blinded to diagnosis.
Each rater ranked the sample on a visual analog scale with anchors from normal to very
severe. Their rating mark was measured in millimeters and then converted to a percentage score,
with a higher number indicating greater severity. The average of the two ratings was taken as the
final severity score. However, if there was a greater than 20% difference between the ratings, a
3rd SLP (Huber) also rated the sample. The average of this third rating and the closest of the
original two ratings was used as the final severity score. Three individuals were rated a third
time. Speech severity ratings and demographic information are presented in Table 3.
Equipment
Speech samples were transduced using a condenser microphone with a flat-frequency
response from 50 Hz-20kHz. The microphone was held at a constant distance six inches from the
speaker’s mouth, placed at a 45-degree angle. A sound-level meter coupled to the microphone
was used to calibrate the microphone, and the gain was factored into the calibration of the
acoustic signal. The acoustic signal from the microphone was recorded to a digital audio tape,
and then digitized for computer analysis using the software program Praat. The audio signal was
recorded at 44.1 kHz, resampled at 18 kHz, and then low-pass filtered at 9kHz.

23
Table 3: Participant Demographic Information
Pair Participant Age
(y;m;d)
Years Since
Diagnosis
CLQT Speech
Severity (%)
Hx Speech Tx
1 F02PDL 72;2;11 11 WNL (4.0) 43 Low volume
F13OCL 76;9;0 n/a WNL (4.0) 2.5 n/a
2 F04PDL 76;11;17 7 WNL (4.0) 11.4 No
F05OCL 77;1;11 n/a WNL (4.0) 7.1 n/a
3 F05PDL 82;10;18 15 Mild (2.8) * No
F17OCL 83;3;4 n/a WNL (4.0) * n/a
4 F06PDL 75;4;3 5 WNL (4.0) * No
F02OCL 78;6;20 n/a WNL (4.0) 4.7 n/a
5 F07PDL 75;11;18 1 WNL (4.0) 10 No
F08OCL 77;2;24 n/a WNL (3.6) * n/a
6 F08PDL 68;9;17 3 WNL (4.0) * No
F07OCL 69;7;20 n/a WNL (4.0) 1 n/a
7 M04PDL 73;5;25 9 WNL (4.0) 82 Low volume,
pitch breaks
M07OCL 74;0;23 n/a WNL (4.0) 7.5 n/a
8 M09PDL 76;8;7 13 Moderate (1.8) 73 Speech clarity
M11OCL 77;3;0 n/a WNL (4.0) 3 n/a
9 M10PDL 73;7;14 9 Mild (3.4) 8.9 Word finding
M06OCL 74;1;20 n/a WNL (4.0) 2 n/a
10 M11PDL 85;2;10 7 WNL (3.8) 35.5 No
M09OCL 85;6;13 n/a WNL (4.0) 0.3 n/a
11 M12PDL 69;10;9 4 WNL (3.8) * No
M13OCL 66;8;5 n/a WNL (4.0) * n/a
12 M13PDL 84;2;0 2 WNL (3.6) * No
M10OCL 84;7;9 n/a WNL (4.0) * n/a Abbreviations: n/a, not applicable; * data unavailable; WNL within normal limits; CLQT Cognitive Linguistic
Quick Test
**Data are organized in pairs of participants with PD (participant numbers ending in PDL) and age- and sex-
matched typical older adults (participant numbers ending in OCL). Higher numbers for speech severity indicate
more severe speech ratings.
Stimulus
Three tasks were developed to elicit lexical stress on target words for this study. The first
task was a picture identification task, in which a picture was displayed on a computer monitor
and the participant was asked to name it, eliciting lexical stress for trochaic and iambic stress
patterns in isolation. The second task was a picture identification task (Appendix A), in which
24
four pictures were displayed together and the participant named all four pictures in list format.
This was used to elicit trochaic and iambic word stress in pseudo-connected speech with list
intonation. The targets of interest were always in the second or third position. Participants were
instructed to string the words together as if in a sentence, without pauses between words, to
mimic connected speech and force coarticulation. Participants were prompted to try again if
pauses became subjectively too long. Most participants were able to complete this task with
minimal verbal cues, but some data includes trials that contained longer pauses between words
for those who found the task taxing.
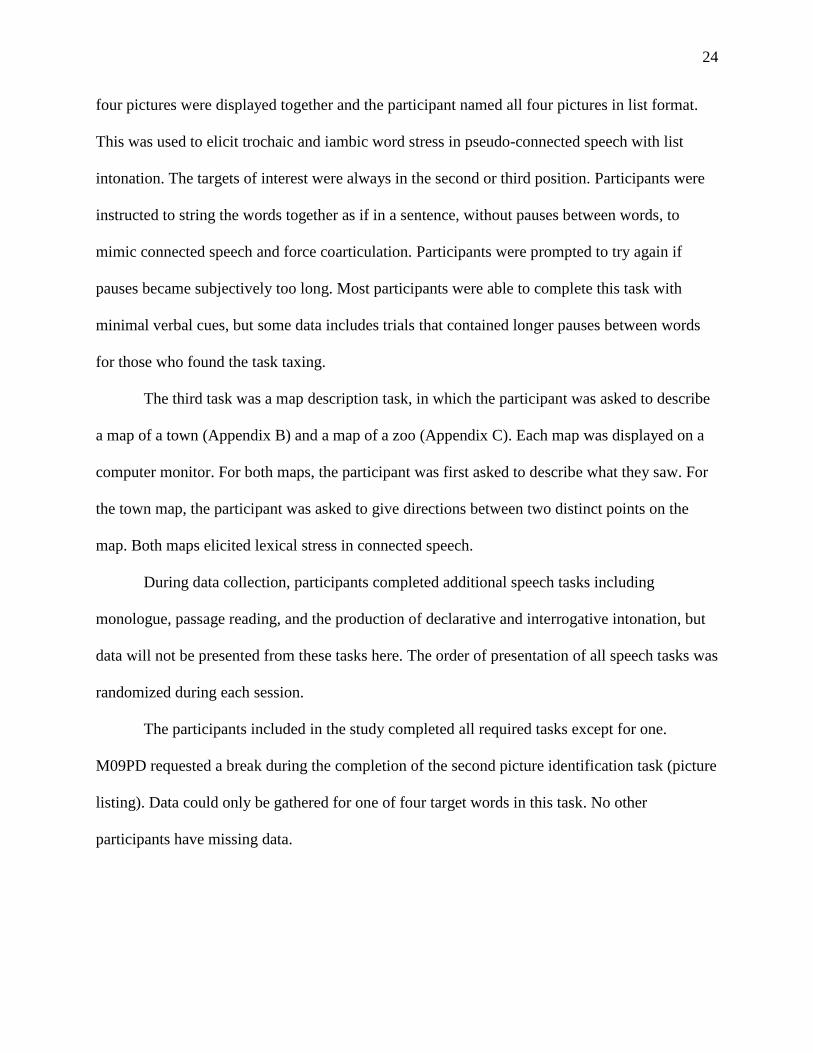
The third task was a map description task, in which the participant was asked to describe
a map of a town (Appendix B) and a map of a zoo (Appendix C). Each map was displayed on a
computer monitor. For both maps, the participant was first asked to describe what they saw. For
the town map, the participant was asked to give directions between two distinct points on the
map. Both maps elicited lexical stress in connected speech.
During data collection, participants completed additional speech tasks including
monologue, passage reading, and the production of declarative and interrogative intonation, but
data will not be presented from these tasks here. The order of presentation of all speech tasks was
randomized during each session.
The participants included in the study completed all required tasks except for one.
M09PD requested a break during the completion of the second picture identification task (picture
listing). Data could only be gathered for one of four target words in this task. No other
participants have missing data.

25
Acoustic Measurements and Derived Values
For all three lexical stress tasks (isolated picture identification, list picture identification,
and map description), the token words of interest were extracted from the corresponding sound
file and clipped to include only the word of interest. Five acoustic measures were taken for each
syllable: mean pitch, mean intensity, vocalic segment duration, and formants 1 and 2 (F1 and F2)
at 20%, 50%, and 80% of the duration of the vocalic segment. The analysis was completed using
Praat software (Boersma & Weenink, 2019). After isolating and highlighting the vocalic segment
of each syllable, the mean pitch and intensity values for each vocalic segment were taken from
Praat’s automatic calculation for “get pitch” and “get intensity” respectively. Duration was taken
from Praat’s automatic display of duration of the selected vocalic segment.
The F1 and F2 were taken from the “get n formant” feature in Praat at the measured 20%,
50%, and 80% total duration times of the vocalic segment. The F1 and F2 frequency (f) measures
were then converted to Bark scale measures using the formula:
13*arctan(0.00076f) + 3.5*arctan((f/7500)2) [1]
While the Bark-scale converted formants were analyzed on their own as response variables, they
were also used to calculate the Euclidean Distance. The Euclidean Distance is a composite
measure of F1 and F2 that shows the distance of any vowel from the relative acoustic center of
gravity. Low Euclidean Distance values are closer to the acoustic center of gravity, while high
values are far from it. It follows that unstressed, neutral vowels ought to have lower Euclidean
Distances, while stressed vowels ought to have higher Euclidean Distances. As formant values
were taken near the beginning (20%), middle (50%), and end (80%) of each vocalic segment, the
Euclidean Distance was calculated twice for each vowel, to represent the first and second halves
of each vowel. The formulas used were:
26
√ (F150% - F120%)2 + (F250% - F220%)2 and √ (F180% - F150%)2 + (F280% - F250%)2 [2]
Finally, the Pairwise Variability Index (PVI) (Grabe & Low, 2002) is a technique used to
quantify the differences in lexical stress as marked by different prosodic factors (i.e. duration,
mean pitch, and mean intensity). Using duration (D) as an example, the formulas used were:
|DSyllable1 – DSyllable2| / |(DSyllable1 + DSyllable2)/2| [3]
This results in values ranging from 0 (no difference in the variable) to 1.99̅̅̅̅ (very high difference
in the variable). This provides an alternative, equalized index of overall differences between
syllables.
Correcting Pitch-Tracking Errors for f0 Measures
While Praat’s “get pitch” function is usually adequate to measure the f0 of words
produced with typical modal voice, words produced with breathy voice, pressed voice, vocal fry,
or other vocal timbres tend to distort Praat’s pitch calculations. The following types of pitch-
tracking errors may occur when the “get pitch” function is selected in Praat:
1. Tracking a subharmonic frequency (2x lower than the perceptual pitch) (Figure 1)
2. Not tracking any fundamental frequency
3. Tracking an overtone frequency (2x higher than the perceptual pitch)
4. Tracking a fundamental frequency in which no voicing occurs (usually during fricatives)
a. Note: This should not be a problem, as only vocalic segments are being analyzed.
Changes in vocal quality are prevalent in all older adults, but are especially common in people
with PD. Rather than discarding this data, strategies were implemented to correct for these pitch-
tracking errors, as follows:
27
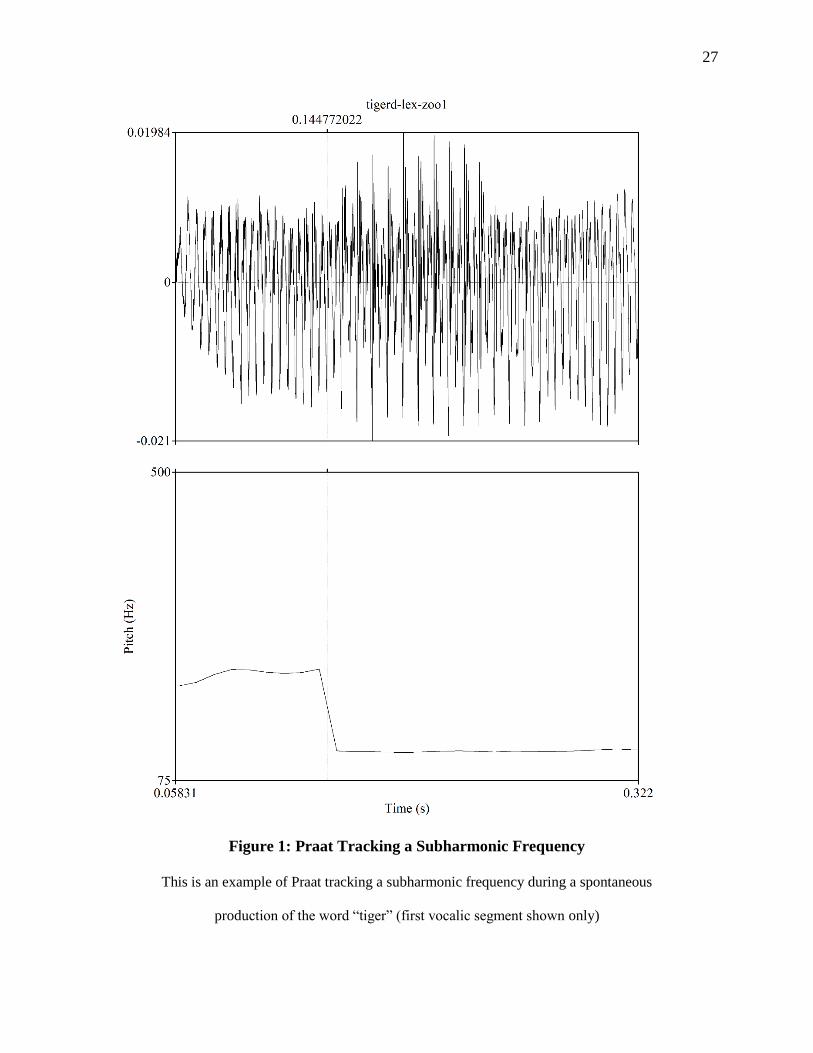
Figure 1: Praat Tracking a Subharmonic Frequency
This is an example of Praat tracking a subharmonic frequency during a spontaneous
production of the word “tiger” (first vocalic segment shown only)
28
1. Error: Praat is tracking a subharmonic frequency (2x lower than the perceptual pitch)
a. Record the total duration of the vocalic segment (dt)
b. If there is any portion of the vocalic segment with normal pitch tracking, measure
this f0 with Praat’s “get pitch” function (f01). Record the duration of this normal
segment (d1).
i. If Praat’s pitch tracking includes a sharp downward slope during which it
begins to track the subharmonic instead of the fundamental frequency (as
in Figure 1), include the first half of the downward slope in the pitch and
duration measures (see the dividing line at 0.144772 s in Figure 1).
ii. The normal segment (d1) in Figure 1 is measured from 0.05831s to
0.144772s.
c. Measure from the end of the previous segment (d1) to either the end of the vocalic
segment (if Praat continues to track the subharmonic) or halfway through a
corresponding sharp upward slope (if Praat begins to track the correct
fundamental frequency again).
i. In the example case of Figure 1, the vocalic segment ends with Praat still
tracking the subharmonic. The subharmonic segment (d2) in Figure 1 is
measured from 0.144772s to 0.322s.
ii. Measure any tracked subharmonic frequency with Praat’s “get pitch”
function (f02) and multiply the subharmonic frequency by 2. Record the
duration of this subharmonic segment (d2).
d. Repeat until the entire vocalic segment has been measured. The formula for the
corrected f0 is:
(f01*(d1/dt)) + ((f02*2)*(d2/dt)) + … + (f0n*(dn/dt)) [4]
29
where only subharmonic segments include a multiplication of f0 by 2.
2. Error: Praat is not tracking any fundamental frequency while voicing is occurring
a. Record the total duration of the vocalic segment (dt)
b. Visually identify an approximate glottal wave pattern (similar repeating
structure).
c. Measure 3-4 cycles (c1) and record the duration of this segment (d1). Divide the
cycles by the duration to derive the frequency (cycles per second), giving you f01.
i. Note: it may be appropriate to multiple the derived frequency by 2 for
similar reasons as strategy #1.
d. Repeat until the entire vocalic segment has been measured.
e. The formula for the corrected f0 is:
(f01*(d1/dt)) + ((f02)*(d2/dt)) + … + (f0n*(dn/dt)) [5]
3. Error: Praat is tracking an overtone frequency (2x higher than the perceptual pitch).
a. This strategy is identical to #1 but involves dividing the tracked frequency by 2
instead of multiplying it.
Correcting Formant-Tracking Errors for F1 and F2 Measures
While Praat’s “get n formant” feature is usually adequate to measure the formants of
words produced with typical modal voice, words produced with breathy voice, pressed voice,
vocal fry, or other vocal timbres tend to distort the formants. These errors were marked visually
as the sudden disappearance or shift of a formant amidst regular tracking. It was not assumed
that just because a value was outside of the typical expected range of a vowel that the formant
was incorrect, although outliers were reexamined. Rather than discarding this data, strategies
were implemented to correct these formant-tracking errors, as follows:

30
1. Spectral Slice
a. Select Spectrum > View Spectral Slice
b. Visually identify the appropriate peaks. The nearest peak in Praat can be quickly
identified with Ctrl+K.
2. Identify nearest effectively tracked formant or formants
a. “Get n formant” for effectively tracked formant before and/or after target.
b. If only one adjacent tracked formant is available, use this as the formant of the
target.
c. Otherwise, take the average of the formants before and after the target (as many
as necessary).
If neither of these methods were successful to produce an accurate formant value, Praat’s
formant-tracking feature was turned off and an approximate value was determined by careful
visual selection of what appeared to be the formant bands. Of the nearly 3,500 formant values
measured, this was done fewer than ten times, and only after the other two options had been
attempted.
Table 4: Stimulus Words to be Analyzed by Task
Token of
Interest
Picture
Identification Task,
Isolated
Picture
Identification Task,
List Intonation
Picture Description
Task, Maps
Balloons (iamb) √ √ √
Coffee (trochee) √ √ √
Giraffe (iamb) √ √ √
Tiger (trochee) √ √ √

31
RESULTS
Mixed model analysis of variance (ANOVA) with repeated measures was used to
determine whether there were significant effects of Group (Parkinson disease, Age- and Sex-
Matched Controls), Task (Isolated, List, Spontaneous Speech), Syllable Number (first, second),
or Stress Pattern (trochaic (strong-weak), iambic (weak-strong)) on the dependent variables.
Interaction effects were also examined among the factors.
There was one significant 3-way interaction effect (Task x Syllable Number x Stress
Pattern) found for duration of the vowel (discussed below). There were no other significant 3-
way interaction effects (Group x Task x Syllable Number, Group x Task x Stress Pattern, Group
x Syllable Number x Stress Pattern) and no significant 4-way interaction effects (Group x Task x
Syllable Number x Stress Pattern) on the dependent variables. Summaries of the statistical
results, along with mean values, are provided in Tables 5 through 16, organized by factor. For
significant main effects of task and all significant interaction effects, the Tukey HSD alpha value
is provided in the text. The alpha level was set at p < .05.
Duration of Vowel
For duration of vowel, there were significant main effects of syllable number (Table 7)
and stress pattern (Table 8). There were also significant interaction effects for task x syllable
number (Table 12), task x stress pattern (Table 13), syllable number x stress pattern (Table 14),
and task x syllable number x stress pattern (Table 15). There were no other significant main or
interaction effects.
Although there was a three-way interaction, the patterns across syllable number and
stress pattern were the same for all tasks. For all words in all tasks, regardless of who the words
32
were produced by (task x syllable number x stress pattern), the strong (first) syllable in trochees
was longer than the weak (first) syllable in iambs (p < .001); the weak (first) syllable in iambs
was shorter than the strong (second) syllable in iambs (p < .001); and the weak (second) syllable
in trochees was shorter than the strong (second) syllable in iambs (p < .001). However, the strong
(first) syllable in trochees was not significantly longer than the weak (second) syllable in
trochees across words produced in isolation, (p = .864), in list intonation (p = .923), or in
spontaneous speech (p = 1.000). There were two significant differences across tasks. The strong
(second) syllable in iambs was longer when produced in isolation than in either the list (p < .001)
or map tasks (p = .013).
Mean Pitch of Vowel
For mean pitch of vowel, there was a significant main effect of group (Table 5). There
were no other significant main effects and no significant interaction effects. Across all syllables
in all words in all tasks, the mean pitch of vowels produced by people with PD was higher than
the mean pitch of vowels produced by controls (p < .001).
Mean Intensity of Vowel
For mean intensity of vowel, there were significant main effects of syllable number
(Table 7) and stress pattern (Table 8). There were also significant interaction effects for syllable
number x stress pattern (Table 14). There were no other significant main or interaction effects.
For all words in all tasks, regardless of who the words were produced by (syllable
number x stress pattern), the mean intensity was higher in the strong (first) syllable of trochees
than the weak (second) syllable of trochees (p < .001), and was lower in the weak (second)
syllable of trochees than the strong (second) syllable of iambs (p < .001). However, there were
33
no significant differences in the mean intensity between the strong (first) syllable of trochees and
the weak (first) syllable of iambs (p = .733) or the strong (second) and weak (first) syllables of
iambs (p = .633).
Pairwise Variability Index of Duration
For the pairwise variability index of duration, there was a significant main effect of stress
pattern (Table 8) and a significant interaction effect for task x stress pattern (Table 13). There
were no other significant main or interaction effects.
For all words produced, regardless of who the words were produced by, the tendencies
across stress pattern were nearly the same for all tasks (task x stress pattern). There was greater
differentiation in duration between the syllables of iambs than trochees (p < .001). There was one
significant difference across tasks. There was greater differentiation in duration between the
syllables of iambs produced in isolation than iambs produced in list intonation (p < .001).
Pairwise Variability Index of Mean Pitch
For the pairwise variability index of pitch, there were significant main effects of group
(Table 5), task (Table 6), and stress pattern (Table 8). There were also significant interaction
effects for group x stress pattern (Table 11) and task x stress pattern (Table 13). There were no
other significant main or interaction effects.
For all words produced, regardless of task (group x stress pattern), there was greater pitch
differentiation between the syllables of trochees than iambs for both people with PD (p = .013)
and older adults (p < .001). Across groups, there was greater pitch differentiation between the
syllables of trochees produced by older adults than the syllables of trochees produced by adults
34
with PD (p < .001). But there was no significant difference across groups in the pitch
differentiation between the syllables of iambs (p = .589).
Relative to the task x stress pattern interaction effect, there was greater pitch
differentiation between the syllables of trochees than iambs (p < .001) in isolation. Similarly, in
spontaneous speech, there was greater pitch differentiation between the syllables of trochees than
iambs (p = .007). However, there was no significant difference in the pitch differentiation
between the syllables of trochees and iambs produced with list intonation (p = .892). There were
also two significant differences across task relative to stress pattern. There was greater pitch
differentiation between the syllables of trochees produced in isolation and spontaneous speech
than the syllables of trochees produced in list intonation (p < .001 for both).
Pairwise Variability Index of Mean Intensity
For the pairwise variability index of intensity, there were significant main effects of task
(Table 6) and stress pattern (Table 8). There were no other significant main effects and no
significant interaction effects. For task, there was overall greater differentiation in intensity in
words produced in isolation than in words produced in list intonation (p = .022), though there
were no significant differences in the differentiation of intensity between words produced in
isolation vs spontaneous speech (p = .552) or between list intonation vs spontaneous speech (p =
.230). For the main effect of stress pattern, there was greater differentiation in intensity in
trochees than iambs (p < .001).
Bark Scale F1 (20%, 50%, and 80%)
For the Bark Scale measure of F1 at the three measured points of the vowel (20%, 50%,
and 80%), there were significant main effects of group (Table 4), syllable number (Table 7), and
35
stress pattern (Table 8). There were significant interaction effects for syllable number x stress
pattern (Table 14) at all three measured points. For the Bark Scale measure of F1 at two of the
three measured points of the vowel (50% and 80%), there was also a significant main effect of
task (Table 6). There were no other significant main or interaction effects.
For the main effect of group, across all syllables in all words in all tasks, the Bark scale
measure of F1 was higher in vowels produced by controls than in the vowels produced by people
with Parkinson disease (p = .018, .004, .004 for 20%, 50%, and 80% respectively).
For the main effect of task, the Bark scale measure of F1 was higher in words produced
in spontaneous speech than in words produced in isolation at the 50% (p = .014) and 80% (p
=.017) measured points, but not at 20% (p = .5657). There were no significant differences in the
Bark scale measure of F1 between words produced in isolation vs list intonation (p = .997, .737,
.709) or between list intonation vs spontaneous speech (p = .566, .102, .129) at any of the three
points.
For the interaction of stress pattern x syllable number, the Bark scale measure of F1 was
higher in the strong (first) syllable of trochees than the weak (first) syllable of iambs (p < .001),
was higher in the strong (first) syllable of trochees than the weak (second) syllable of trochees (p
< .001), was lower in the weak (first) syllable of iambs than the strong (second) syllable of iambs
(p < .001), and was lower in the weak (second) syllable of trochees than the strong (second)
syllable of iambs (p < .001).
Bark Scale F2 20%
For the Bark Scale measure of F2 at 20% of the duration of the vowel, there were
significant main effects of task (Table 6) and syllable number (Table 7). There were also
36
significant interaction effects for syllable number x stress pattern (Table 14). There were no
other significant main or interaction effects.
For task, the Bark scale measure of F2 at 20% of the vowel was higher in words produced
in list intonation than in words produced in isolation (p < .001), but there was no significant
difference between words produced in isolation vs spontaneous speech (p = .069) or between list
intonation vs spontaneous speech (p = .257).
For all words in all tasks, regardless of who the words were produced by (syllable
number x stress pattern), the Bark scale measure of F2 at 20% was lower in the strong (first)
syllable of trochees than the weak (first) syllable of iambs (p < .001), was lower in the strong
(first) syllable of trochees than the weak (second) syllable of trochees (p < .001), and was higher
in the weak (second) syllable of trochees than the strong (second) syllable of iambs (p < .001).
However, there was no significant difference in the Bark scale measures of F2 at 20% between
the weak (first) and strong (second) syllable of iambs (p = .994).
Bark Scale F2 50%
For the Bark Scale measure of F2 at 50% of the duration of the vowel, there were
significant main effects of syllable number (Table 7) and stress pattern (Table 8).
There were also significant interaction effects for task x stress pattern (Table 13) and syllable
number x stress pattern (Table 14). There were no other significant main or interaction effects.
Relative to the task x stress pattern interaction effect, the Bark scale measure of F2 at
50% was higher in trochees than in iambs (p < .001) for words produced in isolation, regardless
of who the words were produced by. However, there was no significant difference in the Bark
scale measure of F2 at 50% between trochees and iambs produced with list intonation (p = .961)

37
or in spontaneous speech (p = 1.000). The Bark scale measure of F2 at 50% was lower in iambs
produced in isolation than in those produced in list intonation (p =.0422) or spontaneous speech
(p = .0441).
For all words in all tasks, regardless of who the words were produced by (syllable
number x stress pattern), the Bark scale measure of F2 at 50% was lower in the strong (first)
syllable of trochees than the weak (second) syllable of trochees (p < .001), was lower in the weak
(first) syllable of iambs than the strong (second) syllable of iambs (p < .001), and was higher in
the weak (second) syllable of trochees than the strong (second) syllable of iambs (p < .001).
However, there was no significant difference in the Bark scale measure of F2 at 50% between
the strong (first) syllable of trochees and the weak (first) syllable of iambs (p = .970).
Bark Scale F2 80%
For the Bark Scale measure of F2 at 80% of the duration of the vowel, there were
significant main effects of syllable number (Table 7) and stress pattern (Table 8). There was also
a significant interaction effect for task x stress pattern (Table 13). There were no other significant
main or interaction effects.
For the main effect of syllable number (all words in all tasks, regardless of who the words
produced by or the stress pattern of the word), the Bark scale measure of F2 at 80% was higher
in the second syllable than the first syllable (p < .001). For the task by stress pattern effect, the
Bark scale measure of F2 at 80% was higher in trochees than in iambs in all tasks (isolation: p <
.001; list intonation: p = .003; spontaneous speech: p = .004).
38
Euclidean Distance of F1 and F2 (first half of vowel)
For the Euclidean Distance for combined F1 and F2 during the first half of the vowel,
there were significant main effects for syllable number (Table 7) and stress pattern (Table 8).
There were also significant interaction effects for task x stress pattern (Table 13) and syllable
number x stress pattern (Table 14). There were no other significant main or interaction effects.
For all words in all tasks, regardless of who the words were produced by (syllable
number x stress pattern), the Euclidean distance was smaller in the weak (first) syllable of iambs
than the strong (second) syllable of iambs (p < .001), and smaller in the weak (second) syllable
of trochees than the strong (second) syllable of iambs (p < .001). However, there were no
significant difference in the Euclidean distance between the strong (first) syllable of trochees and
the strong (second) syllable of iambs (p = .963) or between the strong (first) and weak (second)
syllables of trochees (p = .354).
For the task x stress pattern interaction effect, a difference was only seen in the words
produced in the list task. In list intonation, the Euclidean distance for the first half of the vowels
was smaller in trochees than in iambs (p < .001). However, there were no significant differences
in the Euclidean distance between trochees or iambs produced in either isolation (p = .995) or in
spontaneous speech (p = .200).
Euclidean Distance of F1 and F2 (second half of vowel)
For the Euclidean Distance for combined F1 and F2 for the second half of the vowels,
there were significant main effects for syllable number (Table 7) and stress pattern (Table 8).
There were also significant interaction effects for syllable number x stress pattern (Table 14).
There were no other significant main or interaction effects.
39
For all words in all tasks, regardless of who the words were produced by (syllable
number x stress pattern), the Euclidean distance for the second half of the vowels was greater in
the strong (first) syllable of trochees than the weak (first) syllables of iambs (p < .001), greater in
the strong (first) syllable of trochees than the weak (second) syllable of trochees (p < .001), and
greater in the weak (first) syllable of iambs than the strong (second) syllable of iambs (p = .003).
However, there were no significant difference in the Euclidean distance between the weak
(second) syllable of trochees and the strong (second) syllable of iambs (p = .064).
40
DISCUSSION
The Effects of Parkinson Disease on the Marking of Lexical Stress
This study was completed to explore the question of whether PD affects the ability of a
person to adequately differentiate between the syllables of two-syllable trochaic and iambic
words. The results of this study show that there are very few differences in the way that people
with PD mark lexical stress compared to their age- and sex-matched peers. However, differences
across tasks (isolation, list, and spontaneous speech) were prominent.
Turning first to the group differences, there were three significant differences noted
between people with PD and their age- and sex-matched peers. Two were true across all tasks
and all words, representing global differences rather than specific differences in the marking of
lexical stress. First, people with PD had a higher mean pitch than controls. This likely represents
changes to laryngeal physiology due to vocal fold bowing. Second, people with PD had a lower
F1 across all vowels than controls, suggesting that they are not opening their mouths as wide or
moving their tongues as much for any given speech task. This provides further evidence for the
tendency toward generalized neutralization of vowels, leading to potentially reduced stress
differentiation.
The final major difference is significant to the marking of lexical stress. Both people with
PD and their age- and sex-matched controls differentiated stress patterns using pitch (PVI f0)
more to show a difference between the syllables of trochees than iambs. However, people with
PD did not have as much pitch distinctiveness between trochee syllables as controls. But the
pitch distinctiveness in iambs was similar for people with PD and controls. Further, people with
PD used distinction in the duration and intensity domains similarly to controls. These findings
are consistent with the majority of researchers who have found that people with PD are able to

41
mark lexical stress with pitch, but that pitch distinctions are reduced. The current study adds to
this literature, clarifying that the primary difference in pitch distinctions are in trochees rather
than iambs.
Most other variables were consistent between people with PD and their age- and sex-
matched controls. The crucial ability to differentiate iambs from the dominant trochaic metrical
structure of Standard American English is preserved. Lexical stress appears to not be
significantly affected by having PD, and therefore is not, in and of itself, a clear component of
the hypokinetic dysarthria.
The Effects of Task on the Marking of Lexical Stress
Many research and clinical practice tasks focus on recording words spoken in isolation or
in list format. The results of this study demonstrate that words in isolation tend to be over-
articulated, with stress patterns and syllabic distinctions overemphasized compared to
spontaneous speech. The results around list intonation are less clear, sometimes differing from
words in isolation or spontaneous speech, but less systematically. Of note, most of the results in
this data suggest that the marking of lexical stress of words in isolated speech had more in
common with words produced in spontaneous speech than with list intonation. This suggests that
words in isolation are fine for learning a task, but that we must transition to connected speech
quickly to increase carry-over and to ensure that stress patterns are naturalistic after therapy.
Words in list intonation are not likely to be effective for studying or treating dysprosody unless
something specific is sought about the use of list intonation.
42
Differences in Marking of Lexical Stress for Trochees and Iambs
In addition to designing tasks to elicit target words in connected, spontaneous speech, it is
also important to separate words by stress pattern. This study demonstrated differences in the
marking of lexical stress between trochees and iambs. Assuming that trochaic stress is marked
the same as iambic stress could lead to incorrect conclusions about how effectively a patient is
marking stress.
Although the focus of this study was determining the effects of prosodic tasks on the
marking of lexical stress in people with PD, it also confirmed that adult speakers without PD
mark trochees differently than they mark iambs, and that this pattern is not significantly altered
by PD. Both groups tended to use duration the most to mark stress differences in syllables,
particularly in iambs. Trochees were distinguished by pitch and intensity more than iambs.
Differences in several of the measures in the current study were larger across the syllables in
iambs than in trochees (Duration of the vowel, PVI Duration, Euclidean distance for first half of
the vowel).
These finding are consistent with those reported by Goffman and Malin (1999). While
adults produce amplitude and temporal modulations between both trochees and iambs, the
modulations between the syllables of iambs tend to be much greater than those of trochees.
Goffman and Malin hypothesized that iambs are more strongly marked because they break the
typical prosodic pattern of standard American English (strong-weak), and thus, speakers draw
attention to this difference. However, some of the dependent measures were used more
prominently to distinguish syllables in trochees than iambs (PVI intensity, PVI pitch, F2 at 20%
and 80% of vowel). These findings underscore the difference in cues used to convey stress
patterns in trochees and iambs.
43
The Significance of Formants in Lexical Stress
While acoustic formants have been examined in the production of lexical stress in other
populations, it has not formally been assessed in people with PD until this study. It was
ultimately the formant data (and the Euclidian Distance data derived from it) that proved to be
the most interesting. Vowel quadrilaterals are provided in Appendix D, divided by task and
gender but combining groups together. The F1 data revealed an expected dichotomy: people with
Parkinson disease have smaller overall jaw and tongue excursions in the production of stressed
syllables (Forrest, Weismer, & Turner, 1989; Robertson & Hammerstad, 1996; Darling & Huber,
2011; Walsh & Smith, 2012; Kearney et al., 2017). This is consistent with other findings about
people with PD, which describe them has having overall reduced limb range and speed of
movement (Morris, 2000; Jankovic, 2008; Mazzoni, Shabbott, & Cortés, 2012). However, in
spontaneous speech, F1 was higher for both groups than in isolated word production, suggesting
that the differences in articulation may be exaggerated in isolated word production as compared
to spontaneous speech.
In F1, the differences across syllables reflect stress patterns rather than syllable number.
The stressed vocalic segment in the iambs “balloon” (low F1 value in /u/) and “giraffe” (high F1
value in /ae/) are compared to the stressed vocalic segments in the trochees “coffee” (mid-high
F1 value in /ɔ/) and the diphthong /ɑ͡ɪ/ in “tiger” (starting with a high F1 and closing with a low
F1). While it is expected that this mix of mostly high F1 values would have a higher F1 than the
comparative mid-to-low F1 values in the unstressed syllables (/ə/, /i/, and /ɚ/) respectively, the
phonetic content doesn’t explain all the differences. Regardless of the mix of phonetic content,
the stressed syllables consistently have a higher F1 value than the unstressed syllables (within
44
and across word comparisons). The Euclidean distance findings also follow stress patterns, rather
than syllable number, suggesting there is more change in formants across stressed syllables.
There are no differences across the two groups for F2. As F2 correlates most strongly
with how forward vs. backward the tongue is in the mouth, this suggests that either 1) this
component of prosodic articulation is not significantly affected by PD, 2) the phonemic content
of the token words obscured any possible differences, or 3) a broader samples of vowels needs to
be considered to fully appreciate any differences in F2 production in PD.
Instead of group differences, however, the strongest observed effect for F2 is a positional
one. Across all words at the 50% and 80% time points, the second syllable had a higher F2 (more
fronted) than the first syllable. The phonetics does not account for this difference; two of the
words moved front to mid/back (“balloon” and “tiger”) and two of words moved from back/mid
to front (“coffee” and “giraffe”), one iamb and one trochee in each set. For the most part, the
values observed for F2 in the iambs are consistent with what would be expected based on the
phonetic content (according to the collected formant charts of Kent and Read (2002)). However,
for the trochees, the F2 at 20% value is higher (more fronted) than expected for the first syllable
of trochees (across tasks), and lower (more backed) than expected in the second syllable of
trochees (across tasks). This suggests that F2 may be a marker of lexical stress in trochees, with
more fronting for stressed syllables and more backing for unstressed syllables. This is not
observed in iambs. However, given the small sample size, this remains a suggestion for future
research.

45
Limitations and Future Directions
Lexical Control of Positional Location in Phrase
While positional location effects are not explicitly observed in these results, they were
not controlled for in the spontaneous speech task. In the list task, analysis tokens were always
taken from the middle rather than beginning or the end of the list. However, the tokens in the
spontaneous speech task were taken from wherever they were produced in an utterance. Any
tokens produced in isolation or taken from the end of an utterance would likely show effects of
phrase-final lengthening that could distort measures such as duration. In fact, the second
syllables of iambs were produced with longer duration in isolated productions than in list
production or spontaneous speech (Table 15), and the duration distinction across syllables was
stronger in isolation than in list intonation (Table 13). We did not see the effects of final phrase
lengthening in our spontaneous speech data, but tasks with stronger positional control would
strengthen these findings.
Lip and Jaw Positioning for Consonants and Vowels
The target words were selected from a corpus because of their tendency to appear
multiple times in the designed tasks, not necessarily because of phonemic balance. There is a
benefit to using non-heteronymic target words because this represents more naturalistic speech.
We are not usually trying to differentiate between noun phrases and noun compounds, or
heteronymic noun-verb pairs, in everyday speech. However, the deliberate avoidance of
heteronomy results in a lack of phonemic balance. With this sample we cannot rule out the
effects of voiced vs. unvoiced consonants, plosives vs. fricatives, nasals, liquids, and overall
placement of consonants and vowels alike. Each of these physical components of motor-speech

46
production may have a significant effect or no effect on any of the dependent variables and
should be systematically controlled for and examined to increase the level of confidence with
which we can generalize from this data set.
Mean Pitch and Mean Intensity vs Min/Max
We chose to collect mean pitch and mean intensity data rather than min, max, and range
because individual syllable contours in standard American English are not expected to have a
significant intonation change across the syllable. The finding that the PVI of mean pitch was
greater in trochees than iambs could be explained by the tendency of the second syllable in a
declarative mode in standard American English to have a falling pitch. In iambs, the upward
pitch deflection is likely significantly higher in the second (strong) syllable than the first (weak)
syllable. However, the maximum downward pitch deflection could also be significantly lower in
the second syllable because of a falling contour. It is therefore possible for the average contour to
appear flat and equivalent with the first (weak) syllable. Because we did not collect full contour
data, assertions about the use of pitch to mark lexical stress, particularly in iambs, are more
limited.
Vocal Fry
It was noted anecdotally during analysis that some subjects frequently (though not
necessarily consistently) used vocal fry. This necessitated the development of protocols to
correct for pitch when this occurred. It is possible that the use of vocal fry, rather than being an
inherent sign of dysfunction, could be another way of marking stress differences between
syllables. If this is the case, unstressed syllables would be more likely than stressed syllables to
47
be produced with vocal fry. Vocal fry is typically associated with both reduced pitch and reduced
intensity, though it is sufficiently different from modal phonation that relying only on these two
measures is unlikely to capture the use of this mode in lexical stress marking. Anecdotally, the
samples analyzed in this data set included instances of fry across gender and group, with some
participants demonstrating vocal fry across both syllables of target words. Future research could
systematically explore the use of vocal fry as a prosodic marking strategy.
Formant 3 (and Higher)
As F1 appears to be a clear measure of lexical stress and there is evidence that F2 may
play a role in the marking of position, higher formants may also be worth exploring to determine
whether they also play a role in prosody, and perhaps even whether higher formants are affected
by PD.
Conclusions
Ultimately, people with PD rely on the same cues as typical age- and sex-matched
controls. Spontaneous speech tasks should be used to transfer skills to everyday communication,
although isolated productions could be used to support early learning. Trochees and iambs are
marked differently, thus, prosodic variation is more than learning to mark via one acoustic
characteristic. Assessments, whether in a research or a clinical setting, ought to use naturalistic
spontaneous speech tasks over tasks such as isolated words or lists of words in order to capture
the most accurate picture of a person’s prosodic deficit.

48
TABLES
Table 5: Main Effects of Group: Means (standard error in parentheses)
Variable F p Parkinson Disease Control
Duration of Vowel 0.04 0.851 0.18 (0.004) 0.18 (0.003)
PVI of Duration of Vowel 0.06 0.813 0.67 (0.019) 0.66 (0.019)
Mean F0 of Vowel 16.76 <0.001* 148.52 (2.291) 135.32 (2.270)
PVI of F0 of Vowel 16.29 <0.001* 0.10 (0.012) 0.17 (0.012)
Mean Intensity of Vowel 2.62 0.106 58.34 (0.423) 59.31 (0.419)
PVI of Intensity of Vowel 0.28 0.600 0.05 (0.004) 0.05 (0.004)
Bark Scale F1 20% of Vowel 5.67 0.018* 4.60 (0.070) 4.84 (0.069)
Bark Scale F1 50% of Vowel 8.46 0.004* 4.65 (0.073) 4.95 (0.072)
Bark Scale F1 80% of Vowel 8.31 0.004* 4.21 (0.087) 4.57 (0.086)
Bark Scale F2 20% of Vowel 3.58 0.059 13.30 (0.136) 12.93 (0.135)
Bark Scale F2 50% of Vowel 1.10 0.295 13.55 (0.141) 13.34 (0.140)
Bark Scale F2 80% of Vowel 1.97 0.161 13.68 (0.155) 13.37 (0.153)
Euclidean Distance of Vowel, F1-F2 (beg to mid) 0.45 0.504 1.35 (0.068) 1.41 (0.067)
Euclidean Distance of Vowel, F1-F2 (mid to end) 0.53 0.465 1.50 (0.064) 1.44 (0.063)
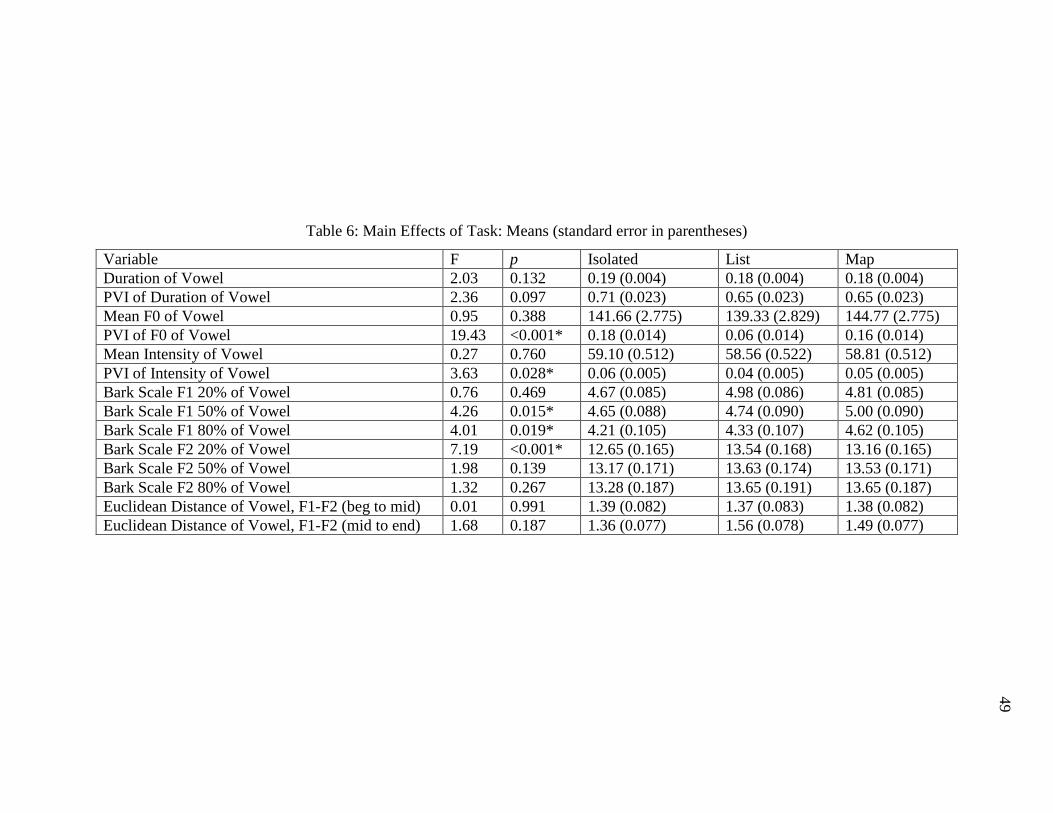
49
Table 6: Main Effects of Task: Means (standard error in parentheses)
Variable F p Isolated List Map
Duration of Vowel 2.03 0.132 0.19 (0.004) 0.18 (0.004) 0.18 (0.004)
PVI of Duration of Vowel 2.36 0.097 0.71 (0.023) 0.65 (0.023) 0.65 (0.023)
Mean F0 of Vowel 0.95 0.388 141.66 (2.775) 139.33 (2.829) 144.77 (2.775)
PVI of F0 of Vowel 19.43 <0.001* 0.18 (0.014) 0.06 (0.014) 0.16 (0.014)
Mean Intensity of Vowel 0.27 0.760 59.10 (0.512) 58.56 (0.522) 58.81 (0.512)
PVI of Intensity of Vowel 3.63 0.028* 0.06 (0.005) 0.04 (0.005) 0.05 (0.005)
Bark Scale F1 20% of Vowel 0.76 0.469 4.67 (0.085) 4.98 (0.086) 4.81 (0.085)
Bark Scale F1 50% of Vowel 4.26 0.015* 4.65 (0.088) 4.74 (0.090) 5.00 (0.090)
Bark Scale F1 80% of Vowel 4.01 0.019* 4.21 (0.105) 4.33 (0.107) 4.62 (0.105)
Bark Scale F2 20% of Vowel 7.19 <0.001* 12.65 (0.165) 13.54 (0.168) 13.16 (0.165)
Bark Scale F2 50% of Vowel 1.98 0.139 13.17 (0.171) 13.63 (0.174) 13.53 (0.171)
Bark Scale F2 80% of Vowel 1.32 0.267 13.28 (0.187) 13.65 (0.191) 13.65 (0.187)
Euclidean Distance of Vowel, F1-F2 (beg to mid) 0.01 0.991 1.39 (0.082) 1.37 (0.083) 1.38 (0.082)
Euclidean Distance of Vowel, F1-F2 (mid to end) 1.68 0.187 1.36 (0.077) 1.56 (0.078) 1.49 (0.077)
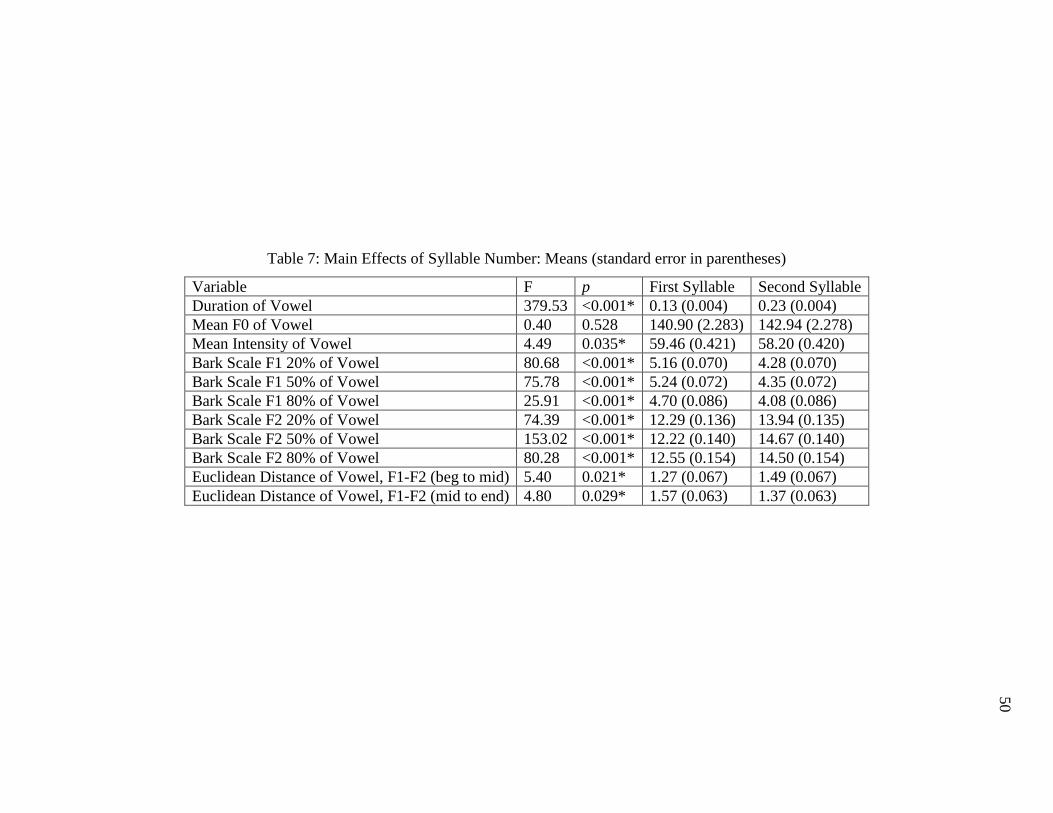
50
Table 7: Main Effects of Syllable Number: Means (standard error in parentheses)
Variable F p First Syllable Second Syllable
Duration of Vowel 379.53 <0.001* 0.13 (0.004) 0.23 (0.004)
Mean F0 of Vowel 0.40 0.528 140.90 (2.283) 142.94 (2.278)
Mean Intensity of Vowel 4.49 0.035* 59.46 (0.421) 58.20 (0.420)
Bark Scale F1 20% of Vowel 80.68 <0.001* 5.16 (0.070) 4.28 (0.070)
Bark Scale F1 50% of Vowel 75.78 <0.001* 5.24 (0.072) 4.35 (0.072)
Bark Scale F1 80% of Vowel 25.91 <0.001* 4.70 (0.086) 4.08 (0.086)
Bark Scale F2 20% of Vowel 74.39 <0.001* 12.29 (0.136) 13.94 (0.135)
Bark Scale F2 50% of Vowel 153.02 <0.001* 12.22 (0.140) 14.67 (0.140)
Bark Scale F2 80% of Vowel 80.28 <0.001* 12.55 (0.154) 14.50 (0.154)
Euclidean Distance of Vowel, F1-F2 (beg to mid) 5.40 0.021* 1.27 (0.067) 1.49 (0.067)
Euclidean Distance of Vowel, F1-F2 (mid to end) 4.80 0.029* 1.57 (0.063) 1.37 (0.063)

51
Table 8: Main Effects of Stress Pattern: Means (standard error in parentheses)
Variable F p Trochaic Iambic
Duration of Vowel 13.69 <0.001* 0.17 (0.004) 0.19 (0.004)
PVI of Duration of Vowel 833.10 <0.001* 0.29 (0.019) 1.05 (0.019)
Mean F0 of Vowel 2.44 0.119 144.44 (2.283) 139.40 (2.278)
PVI of F0 of Vowel 43.70 <0.001* 0.19 (0.012) 0.08 (0.012)
Mean Intensity of Vowel 5.50 0.019* 58.13 (0.421) 59.52 (0.420)
PVI of Intensity of Vowel 40.22 <0.001* 0.07 (0.004) 0.03 (0.004)
Bark Scale F1 20% of Vowel 48.15 <0.001* 5.06 (0.070) 4.38 (0.070)
Bark Scale F1 50% of Vowel 15.36 <0.001* 5.00 (0.072) 4.60 (0.072)
Bark Scale F1 80% of Vowel 11.93 <0.001* 4.18 (0.086) 4.60 (0.086)
Bark Scale F2 20% of Vowel 3.20 0.074 13.29 (0.136) 12.94 (0.135)
Bark Scale F2 50% of Vowel 8.94 0.003* 13.74 (0.140) 13.15 (0.140)
Bark Scale F2 80% of Vowel 67.25 <0.001* 14.42 (0.154) 12.63 (0.154)
Euclidean Distance of Vowel, F1-F2 (beg to mid) 15.76 <0.001* 1.19 (0.067) 1.57 (0.067)
Euclidean Distance of Vowel, F1-F2 (mid to end) 13.37 <0.001* 1.63 (0.063) 1.31 (0.063)
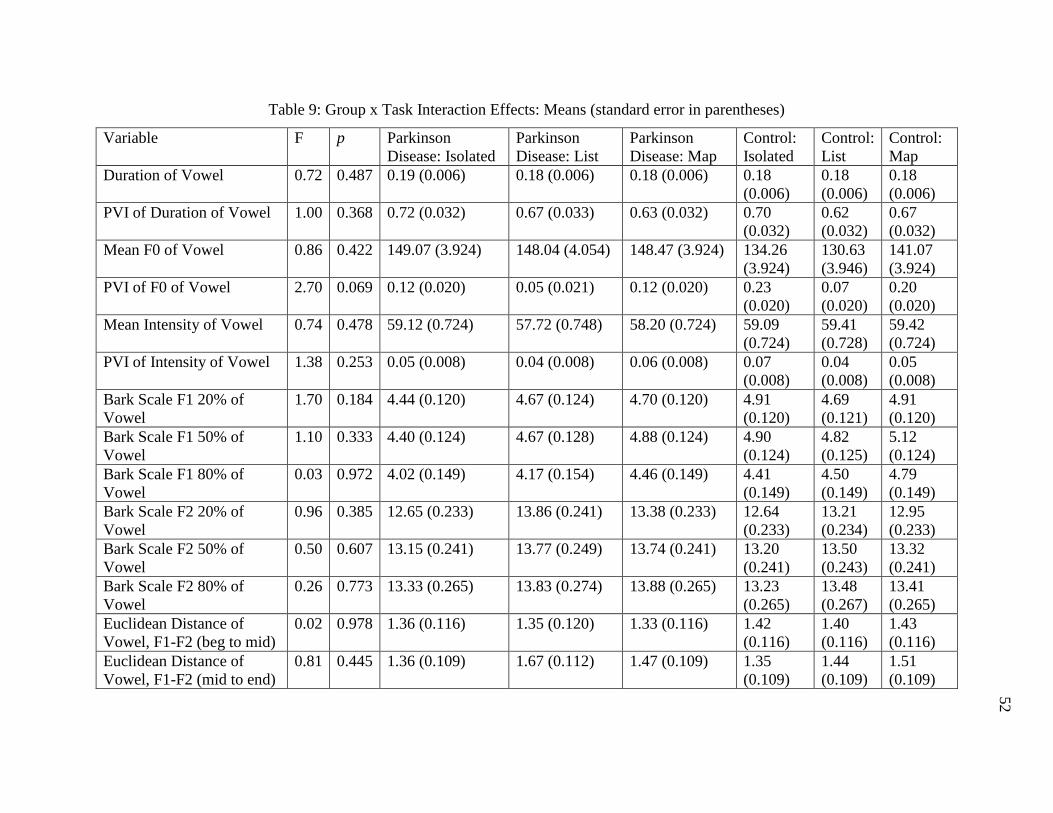
52
Table 9: Group x Task Interaction Effects: Means (standard error in parentheses)
Variable F p Parkinson
Disease: Isolated
Parkinson
Disease: List
Parkinson
Disease: Map
Control:
Isolated
Control:
List
Control:
Map
Duration of Vowel 0.72 0.487 0.19 (0.006) 0.18 (0.006) 0.18 (0.006) 0.18
(0.006)
0.18
(0.006)
0.18
(0.006)
PVI of Duration of Vowel 1.00 0.368 0.72 (0.032) 0.67 (0.033) 0.63 (0.032) 0.70
(0.032)
0.62
(0.032)
0.67
(0.032)
Mean F0 of Vowel 0.86 0.422 149.07 (3.924) 148.04 (4.054) 148.47 (3.924) 134.26
(3.924)
130.63
(3.946)
141.07
(3.924)
PVI of F0 of Vowel 2.70 0.069 0.12 (0.020) 0.05 (0.021) 0.12 (0.020) 0.23
(0.020)
0.07
(0.020)
0.20
(0.020)
Mean Intensity of Vowel 0.74 0.478 59.12 (0.724) 57.72 (0.748) 58.20 (0.724) 59.09
(0.724)
59.41
(0.728)
59.42
(0.724)
PVI of Intensity of Vowel 1.38 0.253 0.05 (0.008) 0.04 (0.008) 0.06 (0.008) 0.07
(0.008)
0.04
(0.008)
0.05
(0.008)
Bark Scale F1 20% of
Vowel
1.70 0.184 4.44 (0.120) 4.67 (0.124) 4.70 (0.120) 4.91
(0.120)
4.69
(0.121)
4.91
(0.120)
Bark Scale F1 50% of
Vowel
1.10 0.333 4.40 (0.124) 4.67 (0.128) 4.88 (0.124) 4.90
(0.124)
4.82
(0.125)
5.12
(0.124)
Bark Scale F1 80% of
Vowel
0.03 0.972 4.02 (0.149) 4.17 (0.154) 4.46 (0.149) 4.41
(0.149)
4.50
(0.149)
4.79
(0.149)
Bark Scale F2 20% of
Vowel
0.96 0.385 12.65 (0.233) 13.86 (0.241) 13.38 (0.233) 12.64
(0.233)
13.21
(0.234)
12.95
(0.233)
Bark Scale F2 50% of
Vowel
0.50 0.607 13.15 (0.241) 13.77 (0.249) 13.74 (0.241) 13.20
(0.241)
13.50
(0.243)
13.32
(0.241)
Bark Scale F2 80% of
Vowel
0.26 0.773 13.33 (0.265) 13.83 (0.274) 13.88 (0.265) 13.23
(0.265)
13.48
(0.267)
13.41
(0.265)
Euclidean Distance of
Vowel, F1-F2 (beg to mid)
0.02 0.978 1.36 (0.116) 1.35 (0.120) 1.33 (0.116) 1.42
(0.116)
1.40
(0.116)
1.43
(0.116)
Euclidean Distance of
Vowel, F1-F2 (mid to end)
0.81 0.445 1.36 (0.109) 1.67 (0.112) 1.47 (0.109) 1.35
(0.109)
1.44
(0.109)
1.51
(0.109)
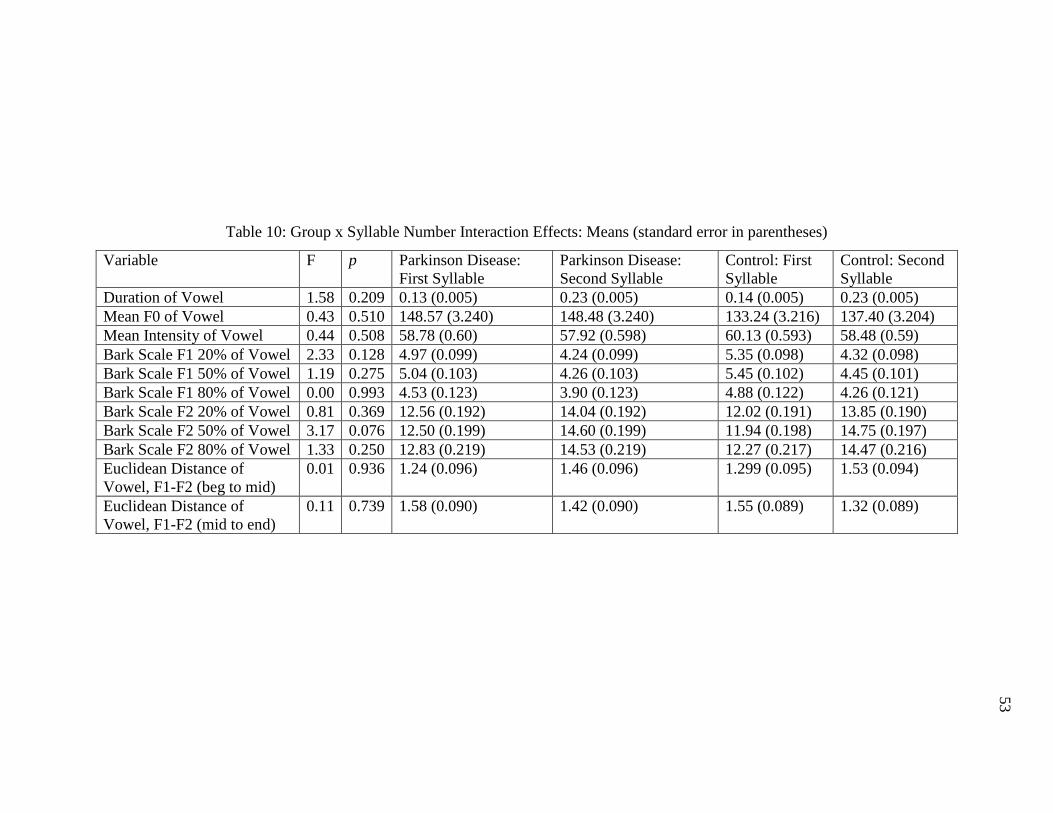
53
Table 10: Group x Syllable Number Interaction Effects: Means (standard error in parentheses)
Variable F p Parkinson Disease:
First Syllable
Parkinson Disease:
Second Syllable
Control: First
Syllable
Control: Second
Syllable
Duration of Vowel 1.58 0.209 0.13 (0.005) 0.23 (0.005) 0.14 (0.005) 0.23 (0.005)
Mean F0 of Vowel 0.43 0.510 148.57 (3.240) 148.48 (3.240) 133.24 (3.216) 137.40 (3.204)
Mean Intensity of Vowel 0.44 0.508 58.78 (0.60) 57.92 (0.598) 60.13 (0.593) 58.48 (0.59)
Bark Scale F1 20% of Vowel 2.33 0.128 4.97 (0.099) 4.24 (0.099) 5.35 (0.098) 4.32 (0.098)
Bark Scale F1 50% of Vowel 1.19 0.275 5.04 (0.103) 4.26 (0.103) 5.45 (0.102) 4.45 (0.101)
Bark Scale F1 80% of Vowel 0.00 0.993 4.53 (0.123) 3.90 (0.123) 4.88 (0.122) 4.26 (0.121)
Bark Scale F2 20% of Vowel 0.81 0.369 12.56 (0.192) 14.04 (0.192) 12.02 (0.191) 13.85 (0.190)
Bark Scale F2 50% of Vowel 3.17 0.076 12.50 (0.199) 14.60 (0.199) 11.94 (0.198) 14.75 (0.197)
Bark Scale F2 80% of Vowel 1.33 0.250 12.83 (0.219) 14.53 (0.219) 12.27 (0.217) 14.47 (0.216)
Euclidean Distance of
Vowel, F1-F2 (beg to mid)
0.01 0.936 1.24 (0.096) 1.46 (0.096) 1.299 (0.095) 1.53 (0.094)
Euclidean Distance of
Vowel, F1-F2 (mid to end)
0.11 0.739 1.58 (0.090) 1.42 (0.090) 1.55 (0.089) 1.32 (0.089)
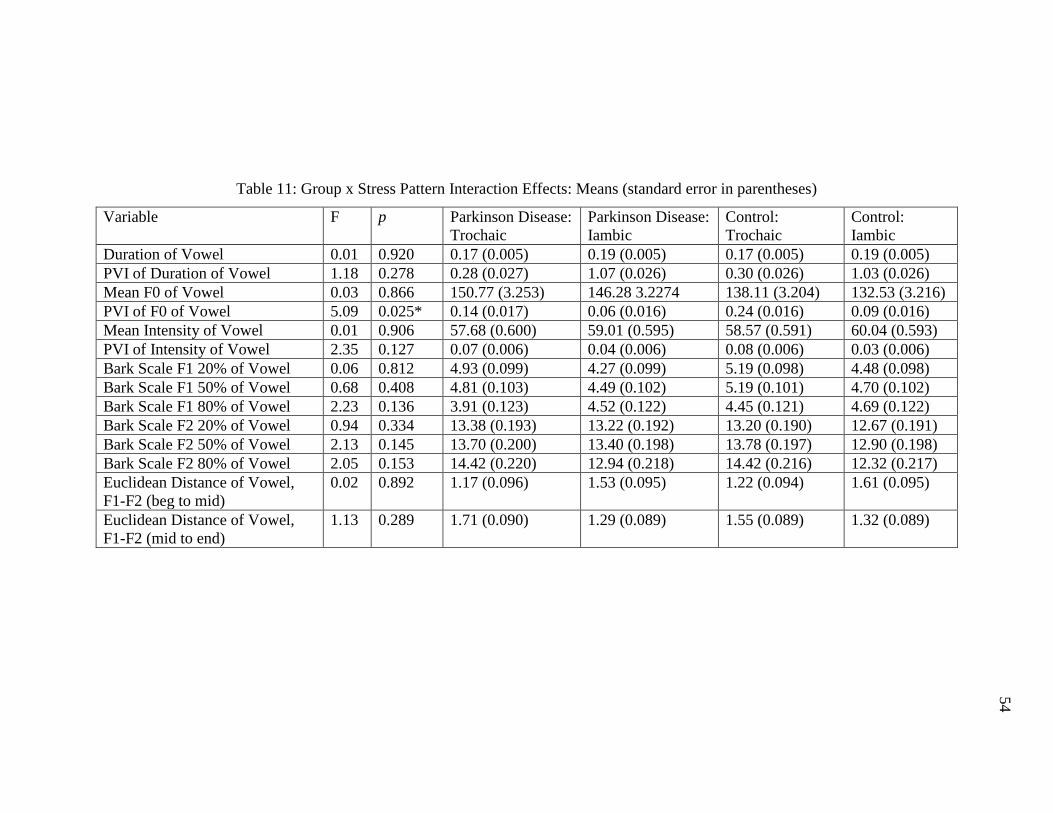
54
Table 11: Group x Stress Pattern Interaction Effects: Means (standard error in parentheses)
Variable F p Parkinson Disease:
Trochaic
Parkinson Disease:
Iambic
Control:
Trochaic
Control:
Iambic
Duration of Vowel 0.01 0.920 0.17 (0.005) 0.19 (0.005) 0.17 (0.005) 0.19 (0.005)
PVI of Duration of Vowel 1.18 0.278 0.28 (0.027) 1.07 (0.026) 0.30 (0.026) 1.03 (0.026)
Mean F0 of Vowel 0.03 0.866 150.77 (3.253) 146.28 3.2274 138.11 (3.204) 132.53 (3.216)
PVI of F0 of Vowel 5.09 0.025* 0.14 (0.017) 0.06 (0.016) 0.24 (0.016) 0.09 (0.016)
Mean Intensity of Vowel 0.01 0.906 57.68 (0.600) 59.01 (0.595) 58.57 (0.591) 60.04 (0.593)
PVI of Intensity of Vowel 2.35 0.127 0.07 (0.006) 0.04 (0.006) 0.08 (0.006) 0.03 (0.006)
Bark Scale F1 20% of Vowel 0.06 0.812 4.93 (0.099) 4.27 (0.099) 5.19 (0.098) 4.48 (0.098)
Bark Scale F1 50% of Vowel 0.68 0.408 4.81 (0.103) 4.49 (0.102) 5.19 (0.101) 4.70 (0.102)
Bark Scale F1 80% of Vowel 2.23 0.136 3.91 (0.123) 4.52 (0.122) 4.45 (0.121) 4.69 (0.122)
Bark Scale F2 20% of Vowel 0.94 0.334 13.38 (0.193) 13.22 (0.192) 13.20 (0.190) 12.67 (0.191)
Bark Scale F2 50% of Vowel 2.13 0.145 13.70 (0.200) 13.40 (0.198) 13.78 (0.197) 12.90 (0.198)
Bark Scale F2 80% of Vowel 2.05 0.153 14.42 (0.220) 12.94 (0.218) 14.42 (0.216) 12.32 (0.217)
Euclidean Distance of Vowel,
F1-F2 (beg to mid)
0.02 0.892 1.17 (0.096) 1.53 (0.095) 1.22 (0.094) 1.61 (0.095)
Euclidean Distance of Vowel,
F1-F2 (mid to end)
1.13 0.289 1.71 (0.090) 1.29 (0.089) 1.55 (0.089) 1.32 (0.089)
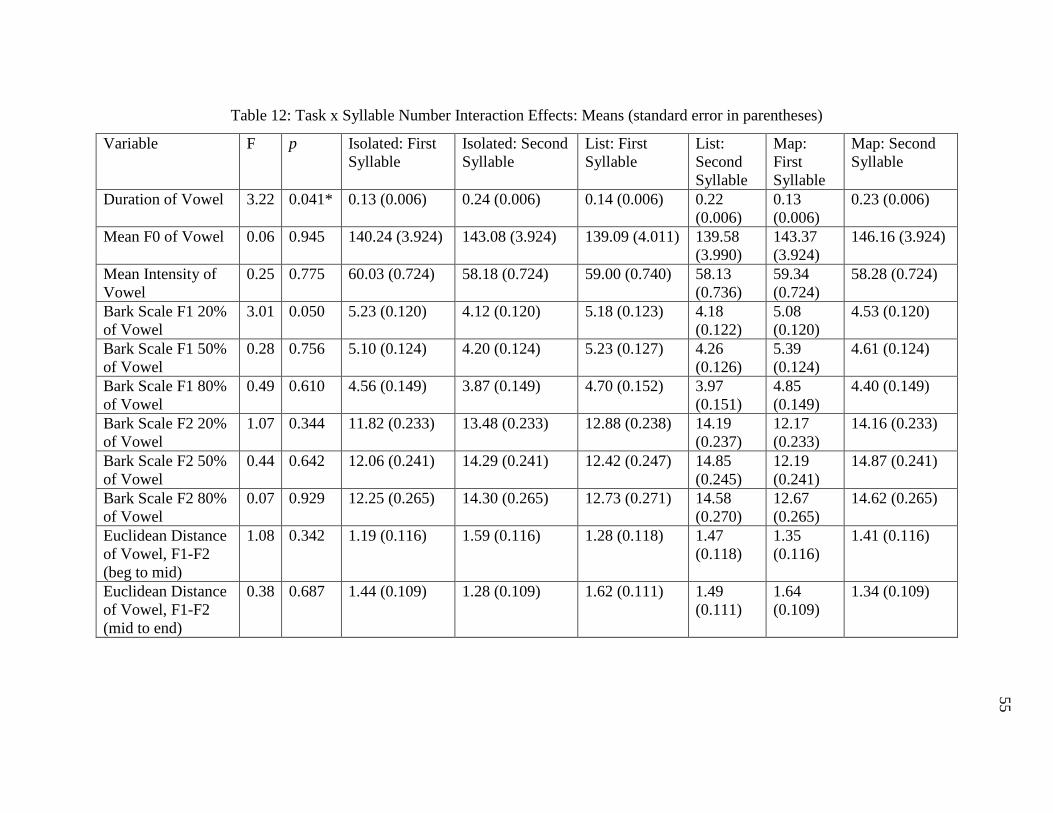
55
Table 12: Task x Syllable Number Interaction Effects: Means (standard error in parentheses)
Variable F p Isolated: First
Syllable
Isolated: Second
Syllable
List: First
Syllable
List:
Second
Syllable
Map:
First
Syllable
Map: Second
Syllable
Duration of Vowel 3.22 0.041* 0.13 (0.006) 0.24 (0.006) 0.14 (0.006) 0.22
(0.006)
0.13
(0.006)
0.23 (0.006)
Mean F0 of Vowel 0.06 0.945 140.24 (3.924) 143.08 (3.924) 139.09 (4.011) 139.58
(3.990)
143.37
(3.924)
146.16 (3.924)
Mean Intensity of
Vowel
0.25 0.775 60.03 (0.724) 58.18 (0.724) 59.00 (0.740) 58.13
(0.736)
59.34
(0.724)
58.28 (0.724)
Bark Scale F1 20%
of Vowel
3.01 0.050 5.23 (0.120) 4.12 (0.120) 5.18 (0.123) 4.18
(0.122)
5.08
(0.120)
4.53 (0.120)
Bark Scale F1 50%
of Vowel
0.28 0.756 5.10 (0.124) 4.20 (0.124) 5.23 (0.127) 4.26
(0.126)
5.39
(0.124)
4.61 (0.124)
Bark Scale F1 80%
of Vowel
0.49 0.610 4.56 (0.149) 3.87 (0.149) 4.70 (0.152) 3.97
(0.151)
4.85
(0.149)
4.40 (0.149)
Bark Scale F2 20%
of Vowel
1.07 0.344 11.82 (0.233) 13.48 (0.233) 12.88 (0.238) 14.19
(0.237)
12.17
(0.233)
14.16 (0.233)
Bark Scale F2 50%
of Vowel
0.44 0.642 12.06 (0.241) 14.29 (0.241) 12.42 (0.247) 14.85
(0.245)
12.19
(0.241)
14.87 (0.241)
Bark Scale F2 80%
of Vowel
0.07 0.929 12.25 (0.265) 14.30 (0.265) 12.73 (0.271) 14.58
(0.270)
12.67
(0.265)
14.62 (0.265)
Euclidean Distance
of Vowel, F1-F2
(beg to mid)
1.08 0.342 1.19 (0.116) 1.59 (0.116) 1.28 (0.118) 1.47
(0.118)
1.35
(0.116)
1.41 (0.116)
Euclidean Distance
of Vowel, F1-F2
(mid to end)
0.38 0.687 1.44 (0.109) 1.28 (0.109) 1.62 (0.111) 1.49
(0.111)
1.64
(0.109)
1.34 (0.109)

56
Table 13: Task x Stress Pattern Interaction Effects: Means (standard error in parentheses)
Variable F p Isolated:
Trochaic
Isolated:
Iambic
List:
Trochaic
List:
Iambic
Map:
Trochaic
Map:
Iambic
Duration of Vowel 3.94 0.020* 0.17 (0.006) 0.21 (0.006) 0.17
(0.006)
0.18
(0.006)
0.18
(0.006)
0.19
(0.006)
PVI of Duration of Vowel 7.86 <0.001* 0.26 (0.032) 1.16 (0.032) 0.33
(0.033)
0.96
(0.032)
0.27
(0.032)
1.03
(0.032)
Mean F0 of Vowel 0.25 0.782 144.56
(3.924)
138.77
(3.924)
143.01
(4.013)
135.66
(3.988)
145.75
(3.924)
143.79
(3.924)
PVI of F0 of Vowel 8.44 <0.001* 0.28 (0.020) 0.08 (0.012) 0.08
(0.020)
0.05
(0.020)
0.21
(0.020)
0.11
(0.020)
Mean Intensity of Vowel 1.37 0.254 58.11 (0.724) 60.10
(0.724)
58.57
(0.740)
58.56
(0.736)
57.71
(0.724)
59.91
(0.724)
PVI of Intensity of Vowel 2.41 0.092 0.09 (0.008) 0.03 (0.008) 0.06
(0.008)
0.03
(0.008)
0.07
(0.008)
0.04
(0.008)
Bark Scale F1 20% of Vowel 1.75 0.175 5.11 (0.120) 4.23 (0.120) 5.05
(0.123)
4.31
(0.122)
5.02
(0.120)
4.59
(0.120)
Bark Scale F1 50% of Vowel 1.07 0.345 4.92 (0.124) 4.37 (0.124) 4.97
(0.127)
4.52
(0.126)
5.10
(0.124)
4.90
(0.124)
Bark Scale F1 80% of Vowel 1.42 0.242 4.12 (0.149) 4.30 (0.149) 4.13
(0.152)
4.54
(0.151)
4.28
(0.149)
4.96
(0.149)
Bark Scale F2 20% of Vowel 2.97 0.052 13.13 (0.233) 12.16
(0.233)
13.64
(0.238)
13.43
(0.237)
13.09
(0.233)
13.24
(0.233)
Bark Scale F2 50% of Vowel 4.03 0.018* 13.86 (0.241) 12.49
(0.241)
13.78
(0.247)
13.49
(0.245)
13.59
(0.241)
13.48
(0.241)
Bark Scale F2 80% of Vowel 3.22 0.041* 14.56 (0.265) 11.99
(0.265)
14.36
(0.271)
12.95
(0.269)
14.34
(0.265)
12.96
(0.265)
Euclidean Distance of Vowel,
F1-F2 (beg to mid)
3.16 0.043* 1.35 (0.116) 1.43 (0.116) 1.04
(0.118)
1.71
(0.118)
1.19
(0.116)
1.57
(0.116)
Euclidean Distance of Vowel,
F1-F2 (mid to end)
0.87 0.419 1.54 (0.109) 1.18 (0.109) 1.64
(0.111)
1.47
(0.111)
1.72
(0.109)
1.26
(0.109)
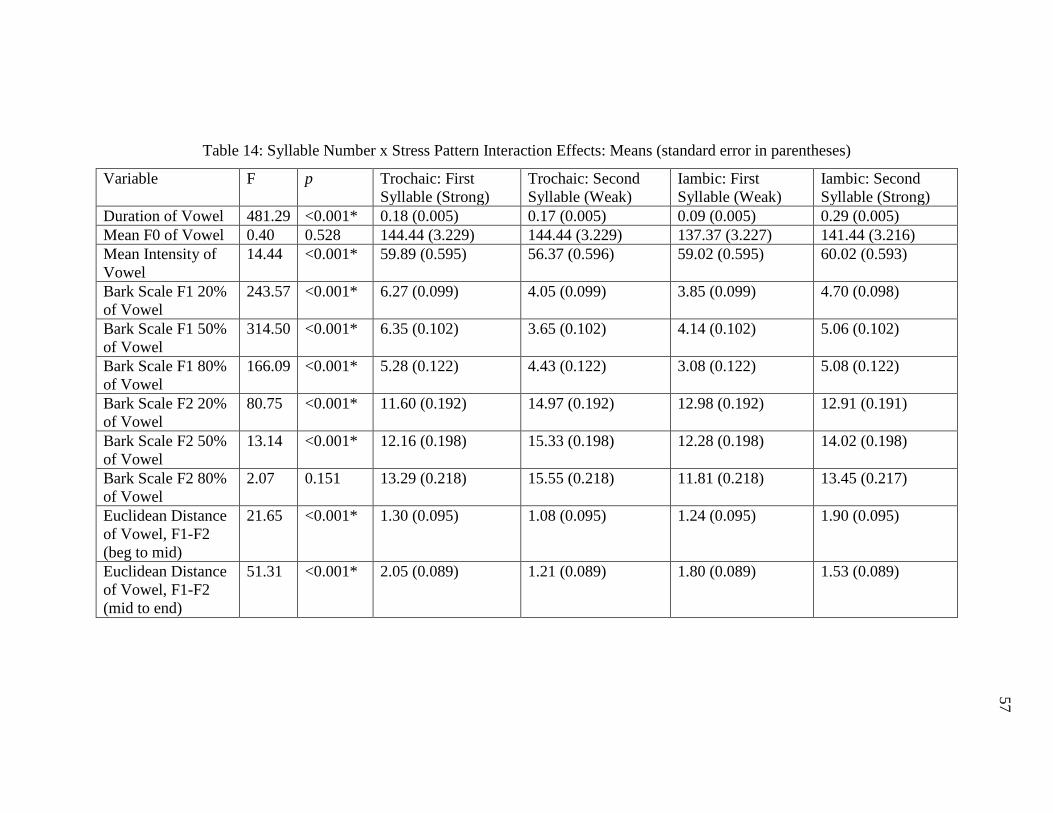
57
Table 14: Syllable Number x Stress Pattern Interaction Effects: Means (standard error in parentheses)
Variable F p Trochaic: First
Syllable (Strong)
Trochaic: Second
Syllable (Weak)
Iambic: First
Syllable (Weak)
Iambic: Second
Syllable (Strong)
Duration of Vowel 481.29 <0.001* 0.18 (0.005) 0.17 (0.005) 0.09 (0.005) 0.29 (0.005)
Mean F0 of Vowel 0.40 0.528 144.44 (3.229) 144.44 (3.229) 137.37 (3.227) 141.44 (3.216)
Mean Intensity of
Vowel
14.44 <0.001* 59.89 (0.595) 56.37 (0.596) 59.02 (0.595) 60.02 (0.593)
Bark Scale F1 20%
of Vowel
243.57 <0.001* 6.27 (0.099) 4.05 (0.099) 3.85 (0.099) 4.70 (0.098)
Bark Scale F1 50%
of Vowel
314.50 <0.001* 6.35 (0.102) 3.65 (0.102) 4.14 (0.102) 5.06 (0.102)
Bark Scale F1 80%
of Vowel
166.09 <0.001* 5.28 (0.122) 4.43 (0.122) 3.08 (0.122) 5.08 (0.122)
Bark Scale F2 20%
of Vowel
80.75 <0.001* 11.60 (0.192) 14.97 (0.192) 12.98 (0.192) 12.91 (0.191)
Bark Scale F2 50%
of Vowel
13.14 <0.001* 12.16 (0.198) 15.33 (0.198) 12.28 (0.198) 14.02 (0.198)
Bark Scale F2 80%
of Vowel
2.07 0.151 13.29 (0.218) 15.55 (0.218) 11.81 (0.218) 13.45 (0.217)
Euclidean Distance
of Vowel, F1-F2
(beg to mid)
21.65 <0.001* 1.30 (0.095) 1.08 (0.095) 1.24 (0.095) 1.90 (0.095)
Euclidean Distance
of Vowel, F1-F2
(mid to end)
51.31 <0.001* 2.05 (0.089) 1.21 (0.089) 1.80 (0.089) 1.53 (0.089)
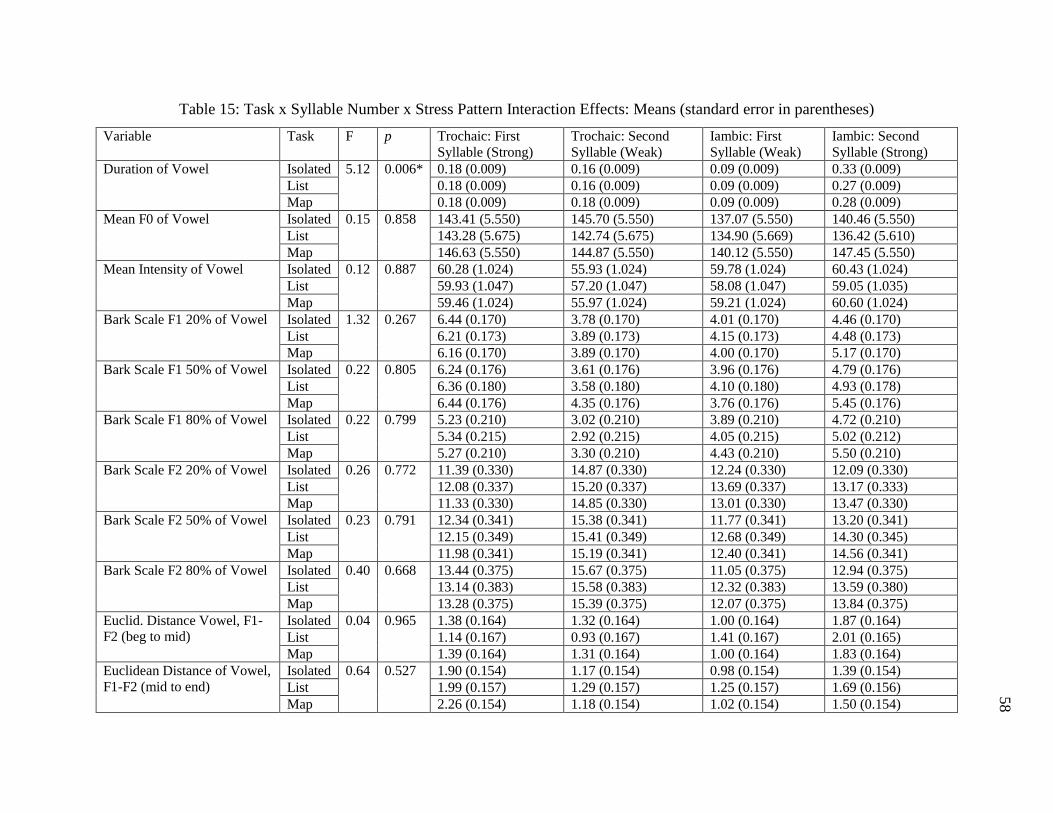
58
Table 15: Task x Syllable Number x Stress Pattern Interaction Effects: Means (standard error in parentheses)
Variable Task F p Trochaic: First
Syllable (Strong)
Trochaic: Second
Syllable (Weak)
Iambic: First
Syllable (Weak)
Iambic: Second
Syllable (Strong)
Duration of Vowel Isolated 5.12 0.006* 0.18 (0.009) 0.16 (0.009) 0.09 (0.009) 0.33 (0.009)
List 0.18 (0.009) 0.16 (0.009) 0.09 (0.009) 0.27 (0.009)
Map 0.18 (0.009) 0.18 (0.009) 0.09 (0.009) 0.28 (0.009)
Mean F0 of Vowel Isolated 0.15 0.858 143.41 (5.550) 145.70 (5.550) 137.07 (5.550) 140.46 (5.550)
List 143.28 (5.675) 142.74 (5.675) 134.90 (5.669) 136.42 (5.610)
Map 146.63 (5.550) 144.87 (5.550) 140.12 (5.550) 147.45 (5.550)
Mean Intensity of Vowel Isolated 0.12 0.887 60.28 (1.024) 55.93 (1.024) 59.78 (1.024) 60.43 (1.024)
List 59.93 (1.047) 57.20 (1.047) 58.08 (1.047) 59.05 (1.035)
Map 59.46 (1.024) 55.97 (1.024) 59.21 (1.024) 60.60 (1.024)
Bark Scale F1 20% of Vowel Isolated 1.32 0.267 6.44 (0.170) 3.78 (0.170) 4.01 (0.170) 4.46 (0.170)
List 6.21 (0.173) 3.89 (0.173) 4.15 (0.173) 4.48 (0.173)
Map 6.16 (0.170) 3.89 (0.170) 4.00 (0.170) 5.17 (0.170)
Bark Scale F1 50% of Vowel Isolated 0.22 0.805 6.24 (0.176) 3.61 (0.176) 3.96 (0.176) 4.79 (0.176)
List 6.36 (0.180) 3.58 (0.180) 4.10 (0.180) 4.93 (0.178)
Map 6.44 (0.176) 4.35 (0.176) 3.76 (0.176) 5.45 (0.176)
Bark Scale F1 80% of Vowel Isolated 0.22 0.799 5.23 (0.210) 3.02 (0.210) 3.89 (0.210) 4.72 (0.210)
List 5.34 (0.215) 2.92 (0.215) 4.05 (0.215) 5.02 (0.212)
Map 5.27 (0.210) 3.30 (0.210) 4.43 (0.210) 5.50 (0.210)
Bark Scale F2 20% of Vowel Isolated 0.26 0.772 11.39 (0.330) 14.87 (0.330) 12.24 (0.330) 12.09 (0.330)
List 12.08 (0.337) 15.20 (0.337) 13.69 (0.337) 13.17 (0.333)
Map 11.33 (0.330) 14.85 (0.330) 13.01 (0.330) 13.47 (0.330)
Bark Scale F2 50% of Vowel Isolated 0.23 0.791 12.34 (0.341) 15.38 (0.341) 11.77 (0.341) 13.20 (0.341)
List 12.15 (0.349) 15.41 (0.349) 12.68 (0.349) 14.30 (0.345)
Map 11.98 (0.341) 15.19 (0.341) 12.40 (0.341) 14.56 (0.341)
Bark Scale F2 80% of Vowel Isolated 0.40 0.668 13.44 (0.375) 15.67 (0.375) 11.05 (0.375) 12.94 (0.375)
List 13.14 (0.383) 15.58 (0.383) 12.32 (0.383) 13.59 (0.380)
Map 13.28 (0.375) 15.39 (0.375) 12.07 (0.375) 13.84 (0.375)
Euclid. Distance Vowel, F1-
F2 (beg to mid)
Isolated 0.04 0.965 1.38 (0.164) 1.32 (0.164) 1.00 (0.164) 1.87 (0.164)
List 1.14 (0.167) 0.93 (0.167) 1.41 (0.167) 2.01 (0.165)
Map 1.39 (0.164) 1.31 (0.164) 1.00 (0.164) 1.83 (0.164)
Euclidean Distance of Vowel,
F1-F2 (mid to end)
Isolated 0.64 0.527 1.90 (0.154) 1.17 (0.154) 0.98 (0.154) 1.39 (0.154)
List 1.99 (0.157) 1.29 (0.157) 1.25 (0.157) 1.69 (0.156)
Map 2.26 (0.154) 1.18 (0.154) 1.02 (0.154) 1.50 (0.154)

59
This page is left intentionally blank.
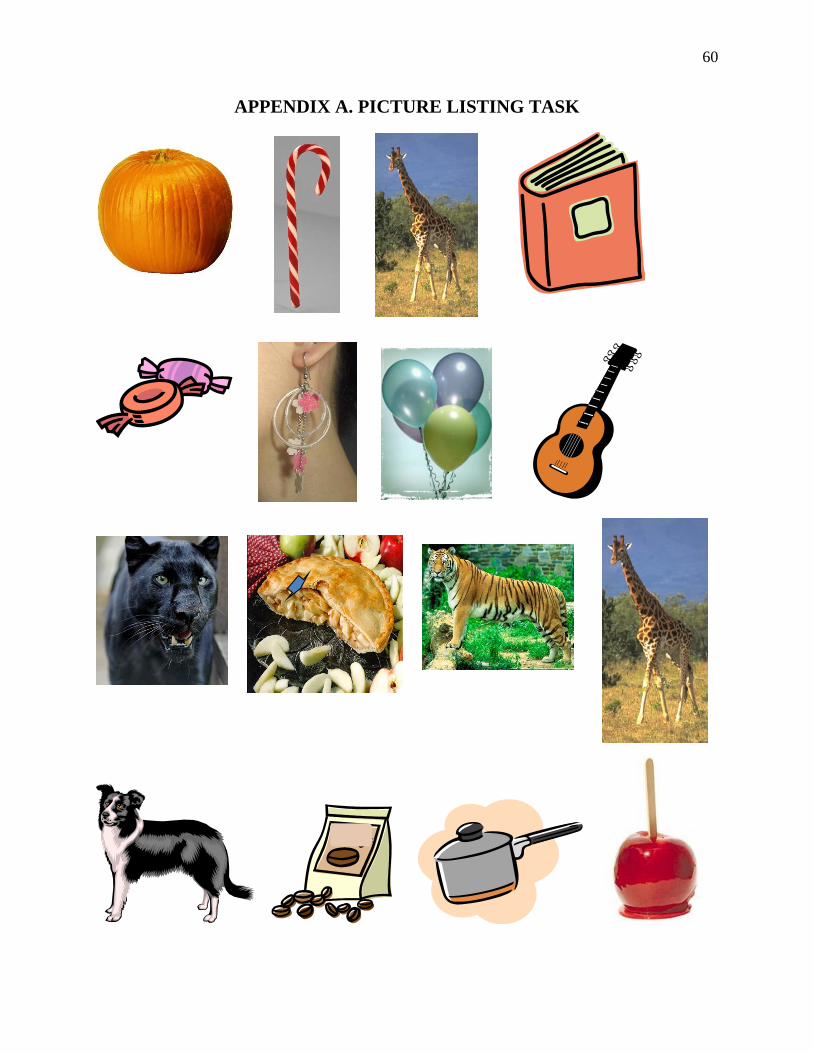
60
APPENDIX A. PICTURE LISTING TASK

61
APPENDIX B. MAP TASK: STREETS
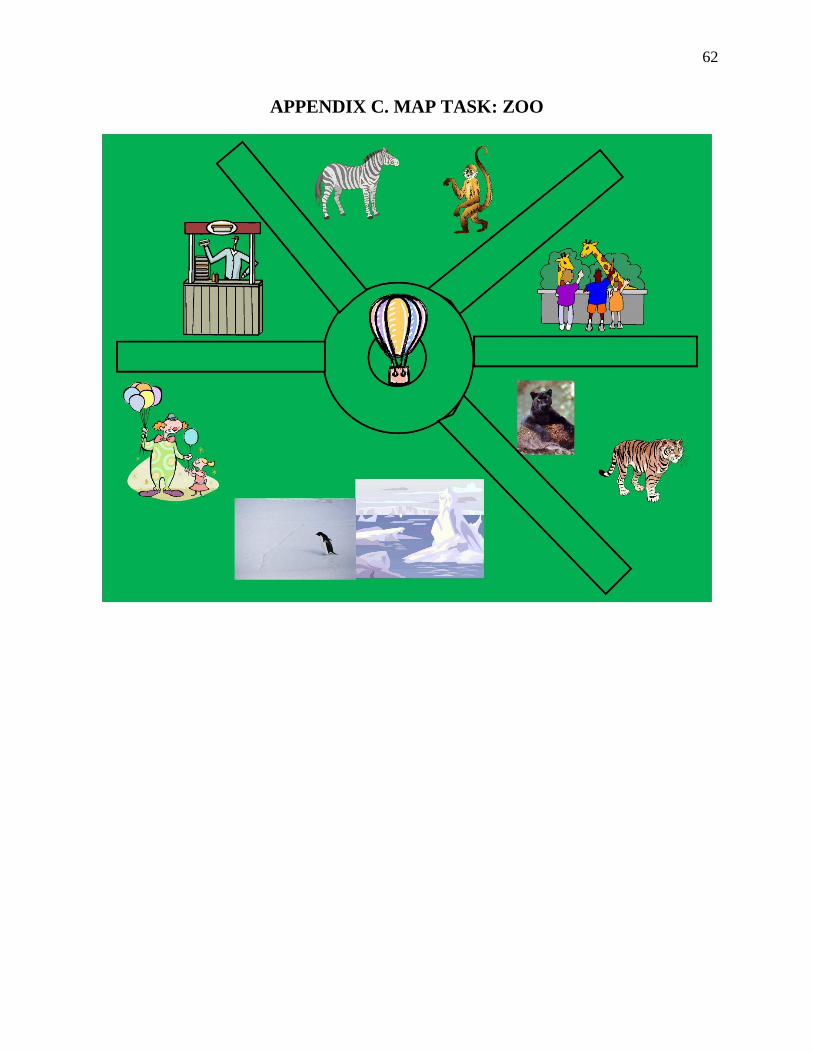
62
APPENDIX C. MAP TASK: ZOO
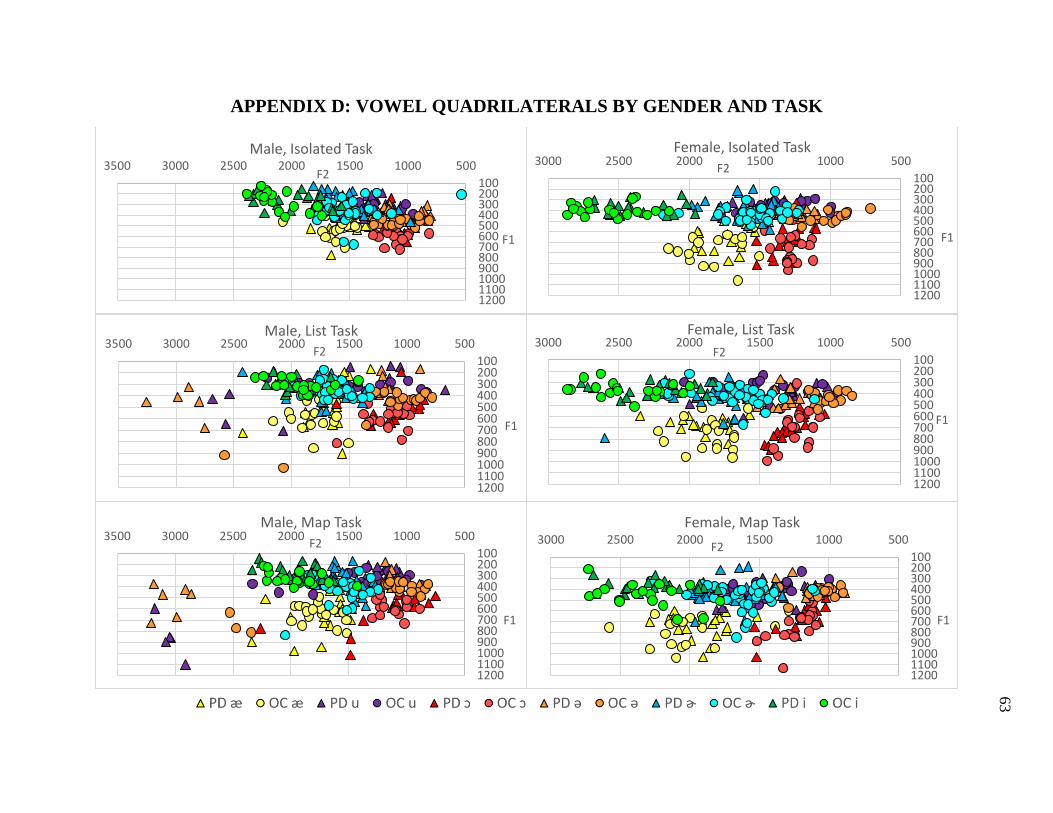
63
APPENDIX D: VOWEL QUADRILATERALS BY GENDER AND TASK
100200300400500600700800900100011001200
500100015002000250030003500
F1
F2
Male, Isolated Task
100200300400500600700800900100011001200
50010001500200025003000
F1
F2
Female, Isolated Task
100200300400500600700800900100011001200
500100015002000250030003500
F1
F2
Male, List Task
100200300400500600700800900100011001200
50010001500200025003000
F1
F2
Female, List Task
100200300400500600700800900100011001200
500100015002000250030003500
F1
F2
Male, Map Task
100200300400500600700800900100011001200
50010001500200025003000
F1
F2
Female, Map Task
64
REFERENCES
Alvar, A.M., Lee, J., & Huber, J.E. (2019). Filled pauses as a special case of automatic speech
behaviors and the effect of Parkinson’s disease. American Journal of Speech-Language
Pathology, 28, 835-843.
Bang, Y., Min, K., Sohn, Y.H., & Cho, S.R. (2013). Acoustic characteristics of vowel sounds in
patients with Parkinson disease. NeuroRehabilitation, 32(3), 649-654. doi: 10.3233/NRE-
130887.
Boersma, P. & Weenink, D. (2019). Praat: Doing phonetics by computer [Computer program].
Version 6.1.03 retrieved from http://www.praat.org/
Borrie, S.A., Baese-Berk, M., Van Engen, K., & Bent, T. (2017). A relationship between
processing speech in noise and dysarthric speech. The Journal of the Acoustical Society
of America, 141(6), 4660.
Bunton, K. & Keintz, C.K. (2008). The use of a dual-task paradigm for assessing speech
intelligibility in clients in Parkinson disease. Journal of Medical Speech-Language
Pathology, 16(3), 141-155.
Cheang, H.S. & Pell, M.D. (2007). An acoustic investigation of Parkinsonian speech in linguistic
and emotional contexts. Journal of Neurolinguistics, 20(3) 221-241.
Cutler, A. & Clifton, C. (1984). The use of prosodic information in word recognition. In H.
Bouma & D.G. Bouwhis (Eds.), Attention and performance X: Control of languages
processes, 183-196. London: Erlbaum.
Darkins, A.W., Fromkin, W.A., & Benson, D.R. (1988). A characterization of the prosodic loss
in Parkinson’s disease. Brain and Language, 34(2), 315-327.
65
Darley, F.L., Aronson, A.E., & Brown, J.R. (1969). Differential diagnostic patterns of dysarthria.
Journal of Speech, Language, and Hearing Research, 12, 246-269.
Darling, M. and Huber, J.E. (2011). Changes to articulatory kinematics in response to loudness
cues in individuals with Parkinson’s disease. Journal of Speech, Language, and Hearing
Research, 54, 1247-59. doi: 10.1044/1092-4388(2011/10-0024)
Forrest, K., Weismer, G., & Turner, G.S. (1989). Kinematic, acoustic, and perceptual analyses of
connected speech produced by parkinsonian and normal geriatric adults. The Journal of
the Acoustical Society of America, 85(6), 2608-2622.
Fry, D.B. (1955). Duration and intensity as physical correlates of linguistic stress. The Journal of
the Acoustical Society of America, 27, 765-768.
Fry, D.B. (1958). Experiments in the perception of stress. Language and Speech, 1(2), 126-152.
Goffman, L. & Malin, C. (1999). Metrical effects on speech movements in children and adults.
Journal of Speech, Language, and Hearing Research, 42(4), 1003-1015.
Gordon-Salant, S. Yeni-Komshian, G.H., Pickett, E.J., & Fitzgibbons, P.J. (2016). Perception of
bi-syllabic lexical stress in unaccented and accented words by younger and older
listeners. The Journal of the Acoustical Society of America, 139(3), 1132-1148.
Grabe, E. & Low, E.L. (2002). Durational variability in speech and the rhythm class hypothesis.
In C. Gussenhoven & N. Warner (eds.), Laboratory Phonology VII, (pp. 515-546).
Berlin: Mouton de Gruyter.
Hertrich, I. & Ackerman, A. (1993). Acoustic analysis of speech prosody in Huntington’s and
Parkinson’s disease: A preliminary report. Clinical Linguistics & Phonetics, 7(4), 285-
297. doi: 10.1080/02699209308985568
66
Holmes, R.J., Oates, J.M., Phyland, D.J., & Hughes, A.J. (2000). Voice characteristics in the
progression of Parkinson’s disease. International Journal of Language & Communication
Disorders, 35(3), 407-418.
Huber, J.E. & Darling, M. (2011). Effect of Parkinson’s Disease on the production of structured
and unstructured speaking tasks: Respiratory physiologic and linguistic considerations.
Journal of Speech, Language, and Hearing Research, 54, 33-46.
Jahanshahi, M., Obeso, I., Rothwell, J.C., & Obeso, J.A. (2015). A fronto-striato-subthalamic-
pallidal network for goal-directed and habitual inhibition. Nature Reviews Neuroscience,
16, 719-732.
Jankovic, J. (2008). Parkinson’s disease: Clinical features and diagnosis. Journal of Neurology,
Neurosurgery, and Psychiatry, 79(4), 368-376. doi:10.1136/jnnp.2007.131045
Jesse, A., Poellmann, K., & Kong, Y.Y. ((2017). English listeners use suprasegmental cues to
lexical stress early during spoken-word recognition. Journal of Speech, Language, and
Hearing Research, 60(1), 190-198.
Kearney, E., Giles, R., Haworth, B., Baloutsos, P., Baljko, M., & Yunusova, Y. (2017).
Sentence-level movements in Parkinson’s disease: Loud, clear, and slow speech. Journal
of Speech, Language, and Hearing Research, 60(12), 3426-3440.
doi:10.1044/2017_JSLHR-S-17-0075
Kent, R.D. & Read, C. (2002). The acoustic analysis of speech (2nd ed.). Albany, NY: Delmar,
Thomson Learning.
Kent, R.D. & Rosenbek, J.C. (1982). Prosodic disturbance and neurologic lesion. Brain and
Language, 15(2), 259-291.

67
Kondaurova, M.V., & Francis, A.L. (2008). The relationship between native allophonic
experience with vowel duration and perception of the English tense/lax vowel contrast by
Spanish and Russian listeners. The Journal of the Acoustical Society of America, 124(6),
3959.
Lam, J. & Tjaden, K. (2016). Clear speech variants: An acoustic study in Parkinson's disease.
Journal of Speech, Language, and Hearing Research, 59(4), 631-646.
Lansford, K.L., Liss, J.M., Caviness, J.N., & Utianski, R.L. (2011). A cognitive-perceptual
approach to conceptualizing speech intelligibility deficits and remediation practice in
hypokinetic dysarthria. Parkinson’s Disease, [150962]. doi: 10.4061/2011/150962
Lieberman, P. (1960). Some acoustic correlates of word stress in American English. The Journal
of the Acoustical Society of America, 32(451-454).
Lowit-Leuschel, A. & Docherty, G. (2001). Prosodic variation across sampling tasks in normal
and dysarthric speakers. Logopegdics Phoniatrics Vocology, 26(4), 151-164.
Ma, J.K.Y., Schneider, C.B., Hoffman, R., & Storch, A. (2015). Speech prosody across stimulus
types for individuals with Parkinson’s disease. Journal of Parkinson’s Disease, 5(2), 291-
299.
MacPherson, M.K., Huber, J.E., & Snow, D.P. (2011). The intonation-syntax interface in the
speech of individuals with Parkinson’s disease. Journal of Speech, Language, and
Hearing Research, 54(1), 19-32. doi: 10.1044/1092-4388(2010/09-0079)
McAuliffe, M.J., Gibson, E.M., Kerr, S.E., Anderson, T., & LaShell, P.J. (2013). Vocabulary
influences older and younger listeners’ processing of dysarthric speech. The Journal of
the Acoustical Society of America, 134(2), 1358-1368.

68
Miller, N., Noble, E., Jones, D., & Burn, D. (2006). Life with communication changes in
Parkinson’s disease. Age and Ageing, 35(3), 235-239.
Mazzoni, P., Shabbott, B., & Cortés, J.C. (2012). Motor control abnormalities in Parkinson’s
disease. Cold Spring Harbor Perspectives in Medicine, 2(6), a009282.
doi:10.1101/cshperspect.a009282
Morris, M.E. (2000). Movement disorders in people with Parkinson disease: A model for
physical therapy. Physical Therapy, 80(6), 578-597. doi:10.1093/ptj/80.6.578
Nakatani, L.H. & Aston, C.H. (1978). Perceiving the stress pattern of words in sentences. The
Journal of the Acoustical Society of America, 63.
Patel, R. & Campellone, P. (2009). Acoustic and perceptual cues to contrastive stress in
dysarthria. Journal of Speech, Language, and Hearing Research, 52(1), 206-222. doi:
10.1044/1092-4388(2008/07-0078)
Pell, M.D., Cheang, H.S., & Leonard, C.L. (2006). The impact of Parkinson’s disease on vocal-
prosodic communication from the perspective of listeners. Brain and Language, 97(2),
123-134. doi: 10.1016/j.bandl.2005.08.010
Ramig, L.O., Sapir, S., Fox, C., & Countryman, S. (2001). Changes in vocal loudness following
intensive voice treatment (LSVT) in individuals with Parkinson's disease: a comparison
with untreated patients and normal age-matched controls. Movement Disorders, 16(1),
79-83.
Redgrave, P., Rodriguez, M., Smith, Y., Rodriguez-Oroz, M.C., Lehericy, S., Bergman, H.,
Agid, Y., DeLong, M.R., Obeso, J.A. (2010). Goal-directed and habitual control in the
basal ganglia: implications for Parkinson's disease. Nature Reviews Neuroscience,
11(11), 760-772.

69
Robertson, L.T. & Hammerstad, J.P. (1996). Jaw movement dysfunction related to Parkinson’s
disease and partially modified by levodopa. Journal of Neurology, Neurosurgery, and
Psychiatry, 60(1), 41-50.
Rusz, J., Cmejla, R., Ruzickova, H., & Ruzicka, E. (2011). Quantitative acoustic measurements
for characterization of speech and voice disorders in early untreated Parkinson’s disease.
The Journal of the Acoustical Society of America, 129(1), 350-367.
Sadagopan, N. & Huber, J.E. (2007). Effects of loudness cues on respiration in individuals with
Parkinson's disease. Movement Disorders, 22(5), 561-659.
Sapir, S. (2014). Multiple factors are involved in the dysarthria associated with Parkinson’s
disease a review with implications for clinical practice and research. Journal of Speech,
Language, and Hearing Research, 57(4), 1330-1343. doi: 10.1044/2014_JSLHR-S-13-
0039
Skodda, S., Rinsche, H., & Schlegel, U. (2009). Progression of dysprosody in Parkinson’s
disease over time—a longitudinal study. Movement Disorders, 24(5), 716-722. doi:
10.1002/mds.22430
Tykalova, T., Rusz, J., Cmejla, R., Ruzickova, J., & Ruzicka, E. (2014). Acoustic investigation
of stress patterns in Parkinson’s Disease. Journal of Voice, 28(1), 129.e1-129.e8. doi:
10.1016/j.jvoice.2013.07.001
Walsh, B. & Smith, A. (2012). Basic parameters of articulatory movements and acoustic in
individuals with Parkinson’s disease. Movement Disorders, 27(7), 843-850.
Watson, P.J. & Munson, B. (2008). Parkinson’s disease and the effect of lexical factors on vowel
articulation. The Journal of the Acoustical Society of America, 124(5), EL291-EL295.
doi: 10.1121/1.2987464
70
Whitfield, J.A. & Goberman, A.M. (2014). Articulatory-acoustic vowel space: application to
clear speech in individuals with Parkinson’s disease. Journal of Communication
Disorders, 51, 19-28. doi: 10.1016/j.jcomdis.2014.06.005
Zesiewicz, T.A., Baker, M.J., Wahba, M., & Hauser, R.A. (2003). Autonomic nervous system
dysfunction in Parkinson’s Disease. Current Treatment Options in Neurology, 5(2), 149-
160.
Ziemssen, T. & Reichmann, H. (2010). Cardiovascular autonomic dysfunction in Parkinson’s
disease. Journal of the Neurological Sciences, 289(1-2), 74-80.