The effectiveness of the Right to Education (RTE) Act ... - CORE
314
The effectiveness of the Right to Education (RTE) Act in unrecognised schools of Delhi, India Gopalkrishnan Iyer A thesis submitted in candidature for the degree of Doctor of Philosophy Newcastle University 2018
-
Upload
khangminh22 -
Category
Documents
-
view
3 -
download
0
Transcript of The effectiveness of the Right to Education (RTE) Act ... - CORE

The effectiveness of the Right to
Education (RTE) Act in unrecognised
schools of Delhi, India
Gopalkrishnan Iyer
A thesis submitted in candidature for the degree of Doctor of Philosophy
Newcastle University
2018


i
Abstract
In 2009, the Government of India introduced a new Education Act known as the “Right to
Education” (RTE). The Act was brought out with all good intentions that would focus on the
provision of education to 6 –14 years of age. Focused heavily, on input based indicators the
Act intended to improve learning outcomes of children enrolled in private and public schools.
The RTE act is being imposed stringently on several low-cost private schools across Delhi,
and they have been, threatened with closure in the case of non-compliance to the RTE
indicators. This thesis investigates the possible consequences of the Act.
The current research using mixed methods attempts to understand the relationship between
the various RTE input indicators and the academic outcomes of the children enrolled in the
threatened private schools of Delhi. The study used two sets of instruments to measure the
learning outcomes of students. First, a test for subject-specific competence was measured
through a bespoke exam, known as the ‘diagnostic test’. Second, general intelligence was,
measured through Raven’s standard progressive matrices test to control for innate ability.
The background of children was also gathered using a questionnaire. Information on school
RTE indicators were collected through a school questionnaire. Teacher data related to the
RTE were gathered through a semi-structured teacher questionnaire. An in-depth interview
was carried out to collect qualitative data and gained narrative accounts from school head
teachers and principals to understand more deeply how the RTE indicators were impacting
on student outcomes and low-cost private schools in Delhi. These data were analysed using
linear regression models, to investigate the impact of the RTE on schools and student
outcomes.
The study revealed that most RTE infrastructure indicators were not statistically significant
regarding student outcomes. Only, two factors were positively significant first, the provision
of mid-day meals and second the presence of a library. Teacher qualifications have a
positive influence on student outcomes, however other factors mentioned in the RTE
including job status of the teacher, the salary range or parent-teacher association meetings,
were found not to influence test scores. Finally, regarding the core indicators of the RTE,
only two factors affected academic outcomes positively and were found to be significant.
First, practising inclusivity and second, allowing ‘hands-on-learning’ for students. Schools
that charged a fee on a higher spectrum, as compared to those which charged fees on a
lower range, were found to affect student outcomes negatively, at a significant level. Other
RTE academic and institutional indicators seemed to have negative or no impact on student
learning outcomes, however, they were not significant.

ii
A major policy implication of this research is to provide feedback to the Government of India
on the gaps that currently exist in the RTE act, that affect student’s learning in low-cost
private schools, threatened with closure notices. The study is unique as it gathered data
from officially threatened schools, from the districts of New Delhi, that weakly comply with
the RTE. The research provides insights generated from data and in-depth discussions with
school owners on schooling inputs likely to affect student learning outcomes, teaching and
the operation of low-cost private schools to inform future discussions around the RTE.

iii
Dedicated to my late friend Paras Trivedi
& the millions of children across the globe who struggle to get in schools

iv
Acknowledgements
At the outset, I would like to express my gratitude to all the people without whose support
this PhD would never be accomplished.
First and foremost my supervisor Professor Pauline Dixon who has been a great ‘friend’
‘guide’ and ‘guru’ during the arduous doctoral journey. Her sharp insights and vision acted as
a guiding light throughout the whole process. Right from designing the study, its execution
and interpretation, her sagacious advice made the whole process look easy and simple.
Most importantly, her constant ‘hand-holding’ and support during the tough phases of my
PhD assisted in shaping the thesis better at every stage.
I would also like to thank my other two supervisors, Dr James Stanfield and Dr Steve
Humble. James has been a great friend and his calm approach to any situation assisted in
making informed decisions. Steve’s brilliant analytical mind and lucid explanations helped
me to consider different strategies for tabulating the vast amounts of data collected in the
field.
I extend my gratitude to Professor James Tooley – his book The Beautiful Tree inspired and
motivated me to design the initial research proposal.
I am thankful to my friends Chris Counihan, David Longfield, Jack Charnley, Anand
Balasubramanian and Ankit Dixit. Chris’s practical ideas brought fresh perspectives to the
study whenever I found a ‘writer’s block’ while drafting the chapters. His humour and
experience of India brought valuable insights. David’s field expertise and knowledge on the
ground assisted me in designing the mammoth field tasks. Jack’s proofreading abilities
helped to set in, consistency and correct grammatical errors that crept in during the writing
stages. Anand’s help in visualising the data sets in SPSS guided me in streamlining the
research tools and data capturing formats. Ankit’s network and logistical experience ensured
the smooth implementation of the study within the given time frame.
I am grateful to my parents, Lakshmi, Mani and my in-laws Vimal Shah and Late Pallavi
Shah who believed in me and continuously motivated me to pursue my dreams. My parents
struggled hard and made immense sacrifices in their lives to ensure that I was never
deprived of a good education. Their outstanding example throughout my life gave me the
courage to risk my life savings and to pursue my doctoral dream.
I would also like to thank my younger brother Hari and my friend Nirav Pandya who took
care of my parents and ensured that they were safe and well in my absence.

v
Finally, my wife Ishita stood like a rock and supported me in every decision that I took. From
lending me financial support to accompanying me to Newcastle, she gave me the courage to
think ‘outside the box’ and helped me to focus whenever I deviated from the course. She
gave up her dreams so that I could fulfil mine and took great care of me by cooking some
lovely Indian curries that helped me to deliver the thesis in time.
Finally my thanks to all the volunteers who participated in the study, without whose support
and assistance this study would never have taken the current shape.

vi
Table of Contents
Abstract ................................................................................................................................. i
Acknowledgements ............................................................................................................ iv
Table of Contents ................................................................................................................ vi
List of tables ....................................................................................................................... xii
List of Appendices ............................................................................................................. xv
Statistical signs and symbols used ................................................................................ xvi
Glossary of terms ................................................................................................................ 2
Chapter One: Introduction to the RTE and Private sector education in India ................ 4
1.1 Prologue – the story behind the research ................................................................ 4
1.2 Background - the Indian education sector ............................................................... 6
1.3 Unfolding history –State of educational provision during the colonial rule ......... 8
1.4 How did the Right to Education (RTE) evolve and why look at it? ...................... 11
1.5 Examining the sections of the RTE Act .................................................................. 16
1.6 The growing private sector in education and the threat from RTE ...................... 21
1.7 Why consider the private sector for low-income families? .................................. 23
1.8 Why work in Delhi? ................................................................................................... 25
1.9 Thesis organisation .................................................................................................. 29
Chapter Two: Review of the literature ............................................................................. 32
2.1 Introduction ............................................................................................................... 32
2.2 Empirical Underpinnings ......................................................................................... 33
2.3 Indicators associated with the RTE ........................................................................ 37
2.4 School input and student academic achievement studies in developing world 39
2.5 Global education research using education production functions ..................... 42
2.6 Where does the current study draw inspiration? .................................................. 45
2.6.1 Abogan (2013) .................................................................................................. 45
2.6.2 Muralidharan (2013) ......................................................................................... 48
2.6.3 Dhruva Bhat (2017) .......................................................................................... 50
2.7 Teacher Factors ........................................................................................................ 52
2.8 School Physical Characteristics ............................................................................. 68
2.9 Conclusion ................................................................................................................ 79

vii
Chapter Three: Methodology ............................................................................................ 81
3.1 Introduction ............................................................................................................... 81
3.2 Research paradigms and philosophical stance .................................................... 81
3.3 Epistemology ............................................................................................................ 82
3.4 Influence of the pragmatist paradigm on the current research ........................... 83
3.5 Mixed methods – the use of quantitative and qualitative techniques ................. 85
3.5.1 Empirical influence and Strategy ...................................................................... 85
3.5.2 Mixed method designs ..................................................................................... 85
3.6 Quantitative techniques ........................................................................................... 88
3.6.1 Survey method ................................................................................................. 88
3.6.2 Regression modelling for quantitative analysis ................................................ 89
3.6.3 Characteristics and considerations in multiple regression modelling ............... 89
3.7 Qualitative approaches ............................................................................................ 90
3.7.1 Grounded theory design and its integration ..................................................... 90
3.7.2 Use of Grounded theory’s constructivist design ............................................... 91
3.7.3 Sources of evidence ......................................................................................... 92
3.8 Data Triangulation .................................................................................................... 94
3.9 Introduction to Sampling ......................................................................................... 95
3.9.1 Sample population ............................................................................................ 96
3.9.2 Constructing the sampling framework .............................................................. 97
3.9.3 PPS Sampling technique for selection schools ................................................ 98
3.10 Test instrument design – Introduction ................................................................... 99
3.10.1 Structure of the testing tools ........................................................................... 100
3.10.2 Test structure ................................................................................................. 100
3.10.3 Test response recording ................................................................................. 101
3.10.4 Sample test items and recording rubrics illustrations ..................................... 102
3.11 Test development process .................................................................................... 103
3.11.1 Test competency framework .......................................................................... 104
3.11.2 Translation and Validation .............................................................................. 104
3.12 Pilot tests and changes to test instrument ......................................................... 105
3.13 Field Work - Test Administration, Logistics and Data Entry .............................. 106
3.13.1 Designing a robust logistical plan ................................................................... 107

viii
3.13.2 School data collections and test booklet printing ........................................... 107
3.13.3 Test volunteers ............................................................................................... 107
3.13.4 Test administration ......................................................................................... 108
3.13.5 Quality control ................................................................................................ 108
3.13.6 Data entry, error rectification and validations ................................................. 109
3.14 Validity and Reliability ............................................................................................ 110
3.14.1 Validity ............................................................................................................ 110
3.14.2 Reliability ........................................................................................................ 113
3.15 Ethics ....................................................................................................................... 114
3.15.1 Ethical issues around testing assessment ..................................................... 114
3.15.2 How were the ethical concerns addressed? ................................................... 115
3.16 Conclusion .............................................................................................................. 116
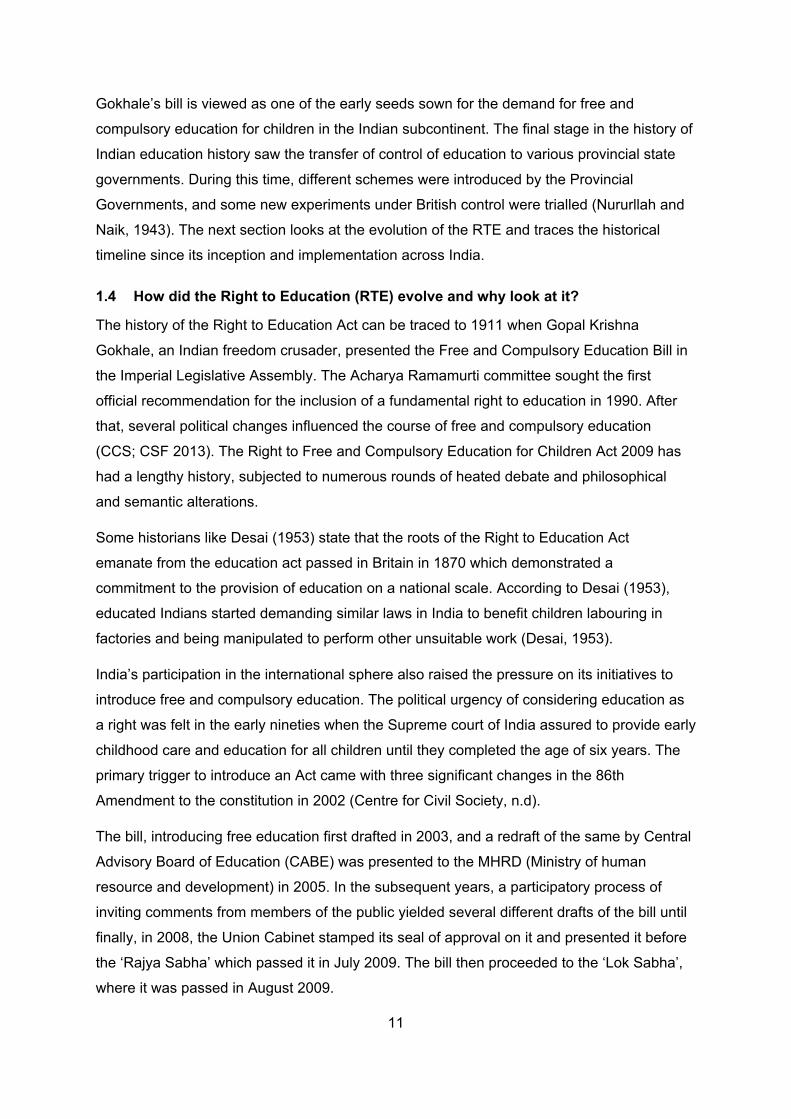
Chapter Four: Analysis and results ............................................................................... 118
4.1 Introduction ............................................................................................................. 118
4.2 General descriptive findings ................................................................................. 120
4.2.1 Overall stakeholder participation .................................................................... 120
4.2.2 Test scores differences within private schools ............................................... 120
4.2.3 Correlation between test scores ..................................................................... 123
4.2.4 Difference in test scores of private schools across Delhi districts .................. 124
4.2.5 Gender distribution across districts ................................................................ 125
4.3 Descriptive findings on RTE Act infrastructure indicators in private schools . 125
4.3.1 Is there any relationship between student achievement and the RTE Act’s emphasis on physical indicators? ......................................................................... 127
4.4 Descriptive findings from teacher data ................................................................ 129
4.4.1 Pedagogical practices and teacher attitudes .................................................. 131
4.4.2 PTR (Pupil Teacher Ratio) ............................................................................. 133
4.4.3 Do the RTE Act’s teacher indicators have any impact on diagnostic student achievement? ............................................................................................. 133
4.4.4 Impact of teachers job status, educational qualifications, salary range and (PTA) meetings ..................................................................................................................... 136
4.5 Descriptive findings on the RTE Act’s core and academic guidelines ............. 139
4.5.1 Does following the RTE Act’s core guidelines rigidly have any impact on students’ test achievement? ................................................................................... 141

ix
4.5.2 Does following the RTE Act’s institutional academic indicators have an impact on student achievement? ........................................................................... 143
4.6 ANOVA analysis ...................................................................................................... 145
4.7 School Monographs ............................................................................................... 149
4.7.1 School One ..................................................................................................... 151
4.7.2 School Two ..................................................................................................... 154
4.7.3 School Three .................................................................................................. 157
4.7.4 School Four .................................................................................................... 160
4.7.5 School Five ..................................................................................................... 162
4.7.6 School Six ...................................................................................................... 165
4.7.7 School Seven ................................................................................................. 167
4.7.8 School Eight ................................................................................................... 169
4.7.9 School Nine .................................................................................................... 172
4.7.10 School Ten ..................................................................................................... 174
4.8 Combining insights from quantitative and qualitative approaches ................... 177
Chapter Five: Discussion ................................................................................................ 181
5.1 Introduction ............................................................................................................. 181
5.2 Impact of physical facilities on academic learning outcomes ........................... 181
5.2.1 IQ tests indicate a positive impact on academic test scores .......................... 182
5.2.2 School feeding is likely to improve academic test scores .............................. 182
5.2.3 Libraries in schools can positively influence academic test scores ................ 183
5.2.4 Influence of other RTE Act infrastructure factors ........................................... 184
5.3 Impact of RTE teacher indicator on the academic outcomes ............................ 185
5.3.1 Teacher training and impact on academic performance ................................ 185
5.3.2 Teachers teaching multiple subjects .............................................................. 186
5.3.3 Teachers’ educational qualifications .............................................................. 186
5.3.4 Job status Teacher contracts ......................................................................... 186
5.3.5 Teacher salaries ............................................................................................. 187
5.3.6 Teachers’ experience ..................................................................................... 187
5.3.7 PTA meetings ................................................................................................. 187
5.4 Impact of the RTE Act’s organisational factors on student achievement ......... 188
5.4.1 Charging a lower fee is likely to raise student test outcomes ......................... 188

x
5.4.2 Presence of SMC’s in schools ........................................................................ 189
5.4.3 Impact of other RTE Act’s organisational guidelines ...................................... 189
5.4.4 Reservation policies of the RTE ..................................................................... 190
5.4.5 Schools practising inclusion policies .............................................................. 190
5.5 Impact of the RTE Act’s institutional academic indicators on student achievement ..................................................................................................................... 191
5.5.1 Usage of continuous, comprehensive evaluation (CCE) in schools ............... 191
5.5.2 Retaining students in the same class ............................................................. 192
5.6 Limitations and challenges to the study .............................................................. 193
5.6.1 Concrete counterfactual ................................................................................. 193
5.6.2 Limited sample size ........................................................................................ 194
5.6.3 Potential bias in the research ......................................................................... 194
5.6.4 Limitations of data set and interpretations ...................................................... 195
5.7 Future explorations and conclusion ..................................................................... 196
Chapter Six: Conclusion – The road ahead and the way for future research ............ 197
6.1. Introduction ............................................................................................................. 197
6.2. Consequences of the RTE Act in its current form ............................................... 200
6.3. Contribution of research to the knowledge repository ....................................... 201
6.4. Implications of the study on policy on the low-cost private schooling sector . 202
6.5. Remedial measures to bridge the gaps in the RTE Act ............................................ 204
6.6. Conclusion way forward and areas for further explorations .............................. 206
6.7. Epilogue ................................................................................................................... 207
Bibliography ..................................................................................................................... 209
Appendix ........................................................................................................................... 230

xi
List of figures
Figure 1 - Historical stages in the Indian Education system ................................................... 9
Figure 2 - Snapshot summary of the RTE sections .............................................................. 17
Figure 3 – Research Design Process ................................................................................... 87
Figure 4 – Sampling techniques ........................................................................................... 96
Figure 5 – Free response Language question and rubric ................................................... 102
Figure 6 – Free response Maths question and rubric ......................................................... 102
Figure 7 – Multiple choices - Science question and rubric .................................................. 103
Figure 8 – Question requiring more linguistic ability ........................................................... 106
Figure 9 – Student code on top-sheet ................................................................................. 109
Figure 10 – Student code on the test booklet ..................................................................... 109
Figure 11- District participation figures ............................................................................... 124
Figure 12 - Gender distribution across the districts ............................................................ 125
Figure 13 – Worksheets provided by teachers ................................................................... 131
Figure 14 – Punishment to be meted out for discipline ....................................................... 132
Figure 15 – Participants in the research ............................................................................. 150
Figure 16- Box plots for Diagnostic and IQ test scores ....................................................... 283
Figure 17– Screen shot of Mahalanobis distance ............................................................... 287
Figure 18 - Scatter plot to assess linearity .......................................................................... 292

xii
List of tables
Table 1 – Chronology of events leading to the RTE ............................................................. 12
Table 2 – Per annum Student Expenditure ........................................................................... 14
Table 3 – Rising enrolment in private schools ...................................................................... 22
Table 4 - Schedule of the RTE Act ....................................................................................... 38
Table 5 – Impact of various determinants on wage .............................................................. 43
Table 6 - Impact of input based variables on learning outcomes .......................................... 46
Table 7 – Teacher score comparison ................................................................................... 55
Table 8 - Teaching Experience, Mean English and Mathematics Scores ............................. 58
Table 9 – Effects of key resources based on 376 production function estimates ................. 61
Table 10 – Summary table for teacher qualifications & subject competency on student outcomes ....................................................................................................................... 63
Table 11 – Summary table for the impact of teacher training on student learning outcomes 64
Table 12 – Summary table for impact of teacher salaries on student learning outcomes..... 65
Table 13 - Summary table for impact of teacher experience on student learning outcomes 66
Table 14 – Summary table of teacher contract on student learning outcomes ..................... 67
Table 15- Input variables analysed relative to learning outcomes ........................................ 69
Table 16 - Summary table reflecting the impact of infrastructure ......................................... 70
Table 17 – Presence of library and its impact on student learning outcomes ....................... 75
Table 18 - Provision of mid-day meals and impact on student achievement ........................ 76
Table 19 - Availability of resources and its effect on learning outcomes .............................. 77
Table 20 – Impact of playground for physical activities on student learning outcomes ........ 78
Table 21 - Coding qualitative fieldwork ................................................................................. 92
Table 22 - Sources of Evidence ............................................................................................ 92
Table 23 – Test instrument structure .................................................................................. 100
Table 24 – Classification of codes ...................................................................................... 102
Table 25 - Subject matter skill measured in the language section of the diagnostic test .... 111
Table 26 – Snapshot summary of the research .................................................................. 120
Table 27 - Test score distribution ........................................................................................ 121
Table 28 – School wise descriptive statistics for diagnostic test ......................................... 121
Table 29 – School wise descriptive statistics for IQ test ..................................................... 122

xiii
Table 30 – Pearson Correlation between test scores ......................................................... 123
Table 31 – MANOVA analysis across districts .................................................................... 125
Table 32 – Infrastructure availability as per the RTE Act schedule..................................... 126
Table 33 – Regresion summary on diagnostic test scores ................................................. 127
Table 34 – ANOVA table for significance for diagnostic test scores ................................... 127
Table 35 – Regression model coefficient summary on diagnostic test scores.................... 128
Table 36 - Teacher demographics ...................................................................................... 131
Table 37 – Homework related practices by teachers .......................................................... 132
Table 38 – Teachers attitude towards students .................................................................. 132
Table 39 – Teachers, and enrolled students in schools ...................................................... 133
Table 40 - Regression summary – RTE Act teacher indicators on diagnostic test ............. 135
Table 41 - ANOVA table for significance – Teacher indicators on diagnostic test .............. 135
Table 42 - Overall regression summary teacher indicators on diagnostic test score .......... 136
Table 43 – Regression summary – teacher indicators ........................................................ 137
Table 44 – Annova’s table for significance ......................................................................... 137
Table 45 – Regression summary for teacher coefficients ................................................... 138
Table 46 – Core RTE guidelines ......................................................................................... 139
Table 47 – SMC, Curriculum and syllabus related findings ................................................ 140
Table 48 – Test of significance ........................................................................................... 141
Table 49 – Regression model summary ............................................................................. 141
Table 50 - Binomial logistic regression summary with RTE core indicators ....................... 142
Table 51 - Overall regression summary – RTE Act curriculum indicators .......................... 143
Table 52 - ANOVA table for significance – RTE Act curriculum related indicators ............. 143
Table 53 – Individual summary of the curriculum indicators ............................................... 144
Table 54 – Classification of RTE Norms ............................................................................. 146
Table 55 – Classification of learning resources .................................................................. 146
Table 56 – Anova between test scores and learning resources ......................................... 147
Table 57 – Anova between test scores and RTE infrastructure parameters ...................... 147
Table 58 – Anova between test scores and teacher effectiveness ..................................... 147
Table 59 – School one, RTE Act’s schedule checklist ........................................................ 152
Table 60 - School two, RTE Act’s schedule checklist ......................................................... 156
Table 61 – RTE’s schedule for School 3 ............................................................................. 158

xiv
Table 62 - RTE regulations checklist and school affiliation ................................................. 161
Table 63 - RTE Act regulations checklist ............................................................................ 164
Table 64 – RTE regulations and checklist .......................................................................... 166
Table 65 – RTE Act regulations and checklist for the school .............................................. 168
Table 66 - RTE regulations and school checklist ................................................................ 171
Table 67 – RTE regulations and school checklist ............................................................... 173
Table 68 – RTE Act regulations and school checklist ......................................................... 176
Table 69 – Box test for Equality of covariance .................................................................... 288
Table 70 – Family background of the children attending the schools ................................. 289
Table 71 – Capability to speak English by elderly or siblings ............................................. 290
Table 72 - Real Estate and Asset ownership characteristics across by the type of school attended ...................................................................................................................... 291
Table 73 – Regression model summary ............................................................................. 292
Table 74 – Regression model summary ............................................................................. 292
Table 75 - Summary of multiple regression analysis .......................................................... 292

xv
List of Appendices
Appendix 1 – Playground notification for schools ............................................................... 230
Appendix 2 - Specimen of Memorandum of Association (Moa) for educational societies .. 231
Appendix 3 – School registration requirements .................................................................. 232
Appendix 4 – Closure notification ....................................................................................... 237
Appendix 5 – Student Questionnaire with academic indicators .......................................... 239
Appendix 6 – Student questionnaire with demographic indicators ..................................... 241
Appendix 7 – Principal questionnaire .................................................................................. 245
Appendix 8 – Teacher questionnaire .................................................................................. 254
Appendix 9 – Principal in-depth interview questionnaire .................................................... 259
Appendix 10 – Pre-survey responses ................................................................................. 265
Appendix 11 – List of schools selected for sampling and final sample schools .................. 266
Appendix 12 – Names and role of volunteers participating in the study. ............................ 267
Appendix 13 - Diagnostic test paper ................................................................................... 268
Appendix 14 – Raven’s test of matrices .............................................................................. 270
Appendix 15 – Score Card for diagnostic test ..................................................................... 270
Appendix 16 – Top sheet .................................................................................................... 276
Appendix 17 – Language competency framework .............................................................. 278
Appendix 18 – Maths competency framework .................................................................... 278
Appendix 19 – Science competency framework ................................................................. 279
Appendix 20 – Descriptive statistics for Language test scores ........................................... 280
Appendix 21 -Descriptive statistics for Mathematics test .................................................... 280
Appendix 22 - Descriptive statistics for Science test .......................................................... 280
Appendix 23 - Normal distribution of diagnostic test scores ............................................... 281
Appendix 24 – Normal distribution for language and maths scores .................................... 281
Appendix 25 - Normal distribution for EVS and IQ test ....................................................... 282
Appendix 26 – Assumptions in MANOVA analysis ............................................................. 283
Appendix 27 - Demographic factors affecting student test scores ...................................... 289
Appendix 28 –Interview with school owner ......................................................................... 294

xvi
Statistical signs and symbols used
Symbol Denotation
μ mean
μl mean of language scores
μm mean of mathematics scores
μevs mean of environmental studies (Evs) scores
σX standard deviation
σ2 variance
σ2l variance in language scores
σ2m variance in mathematics scores
σ2evs variance in evs scores
∑ summation
₹ Indian national rupee
£ Pound sterling
R sample correlation coefficient
r2 coefficient of determination
R2 square multiple correlation coefficient
Error Term in regression/statistics. More, generally used to
denote an arbitrarily small positive number

2
Glossary of terms
ASER Annual Status of Education Report
B.Ed. Bachelor of Education
BRICS Brazil, Russia, India, China and South Africa
CABE Central Advisory Board of Education
CCS Centre for Civil Society
CSF Central Square Foundation
CSO Central Statistical Organisation
DD Difference-in-Difference
DEO District Education Officer
DISE District Information System for Education
DOE Department of Education
DSEAR Delhi State Education Act and Rules
DVD Digital Video Disc
EVS Environmental Studies
EWS Economically weaker sections
FY Financial Year
IAEEA International Association for the Evaluation of Educational Achievement
IMF International Monetary Fund
INR Indian National Rupee
IQ Test Intelligent Quotient test
IRT Item response theory
MDM Midday meals programme
MHRD Ministry of human resource and development
MOA Memorandum of Association
NAPE National Assessment of Progress in Education NCERT National Council for Education Research and Training
NCTE National Council for Teacher Education
NGO Non-Governmental Organisation
NLSY National Longitudinal Survey
NOC No objection certificate
NTTP National Teacher Training Programme
OECD Organisation for Economic and Co-operation and Development
OLS Ordinary least squares

3
OPEPA Odisha Primary Education Programme Authority.
PIRLS Progress in International Reading Literacy Study
PISA Programme for International Student Assessment
PTA Parent Teacher Association
PTR Pupil teacher ratio
RCT Randomised Controlled Trials
RDD Regression Discontinuity Design
RTE Right to Education Act
SD Standard deviation
SDP School Development Plan
SMC School Management Committee
SMC School Management Committee
ST Scheduled Tribe
TIMSS Third International Mathematics and Science Study
TLM Teaching-learning material
UDHR Universal Declaration of Human Rights
UEE Universal Elementary Education
UGC University Grants Commission
UNEB Uganda National Examination Board
UNESCO United Nations Educational, Scientific and Cultural Organization

4
Chapter One: Introduction to the RTE and Private sector education in India
1.1 Prologue – the story behind the research
In the year 2014, something happened to my wife and me which inspired my thinking and
strengthened my intention to research the landmark act in India known as the Right to
Education (RTE). We were newly married, settling down in our house and trying to adjust to
the changes around us. Although I had lived there for quite a long time, my wife had moved
in with me, and things were progressing well with our lives.
One day while driving back, my wife asked me if I could help someone to gain admission to
a government school, given my background in education consultancy. Not knowing what the
case was, I probed further as both of us were keen to help others, especially those who
came from economically challenged backgrounds. She said that a domestic help engaged at
our neighbour's house had approached her and asked if we could assist her daughter in
seeking admission in the nearby government school. I replied that I was glad to help. Having
struggled to obtain a good education all my life due to challenging financial circumstances, I
understood the value of education and the change it could bring about in one’s life.
The next day, we met the domestic help and asked her about the assistance she would
require. She told us that her daughter, who was enrolled in a village school in Uttar Pradesh
(neighbouring state to Delhi) wanted to study further. However, the village school did not
have a 10th grade1 , and therefore, she wanted our help to enrol her daughter in the
government school. We agreed to help so the next day; we accompanied her to the nearest
government school in our neighbourhood to request admission for her daughter. We met the
principal at the school and explained the situation, but to our dismay, she refused, stating
that there were no places and that the girl required a transfer certificate (TC).
We were shocked, and I quoted the country’s landmark regulation – the ‘Right to Education’
Act and explained that it was her duty to ensure that the girl was enrolled in the school.
Mocking the legislation, she said that the act is meaningless in reality and merely strong on
paper. I felt hopeless as the child’s dream of studying in school faded. A million thoughts ran
through my mind, and deep in my heart, I wanted the girl to get a good education.
1 10th Grade in the Indian education system is the GCSE equivalent of the British system.

5
My wife and I approached the nearest private school which charged a nominal fee and
enquired about the admission policy. The scenario was entirely different; the headmistress
happily met us, explaining that she would be glad to enrol the girl in the school. Although the
school was not as large as the government school or the premium private school, it was
nevertheless functioning well.
Following discussion with the headmistress, I realised that there were many gaps in the RTE
and that nothing was being done to bridge the gaps. We paid the initial admission fee to the
school, and the domestic help told us that she would be able to afford the monthly fee from
her savings. We were happy, but then something was indeed missing – I was unable to
sleep that night, and the RTE kept playing on my mind. One thing was abundantly clear: this
so-called landmark act introduced to raise the quality of human capital was indeed lacking
something.
Having already applied for a doctoral programme, I was searching for a catalyst, and the
incident hit me like a juggernaut. It made me realise how feeble the country’s landmark act
was and that its gaps engendered an unequal educational system by keeping the poor at
bay. I was determined that I would study the law in detail to understand the gaps and what
could be done to bridge them. Thus started my long journey to seek answers by deciphering
a myriad of complex questions associated with the RTE.
Throughout the thesis, I study the RTE Act in detail, weave the research questions around it,
present my findings and finally provide some concrete recommendations in the end as to
how the gap could be bridged. The chapter has been divided into five main sections and
includes information pertaining to the undertaking of this research project. The first section
explores the historical basis of private sector involvement before the introduction of the RTE.
It is crucial to understand how past events played a critical role in the government gaining
control of education and laid out the basis for new experiments in the education sector.
The second section looks at the emergence of RTE and the historical framework behind the
Act; it traces the timeline of the Act and discusses the two major components associated
with it. These include education financing and the involvement of non-state actors in the
provision of education.
The third section looks at the Right to Education Act and dissects its different sections. This
enables a thorough understanding of the RTE Act. Examining the different sections of the
Act assisted in designing the research instruments, employed during the data collection
process.

6
The gaps prevailing across the different sections, along with the insights generated during
the research were then used for drafting the recommendations in the concluding chapter.
The fourth section investigates the growing evidence of the private sector by tracing the
rising enrolment in private schools in India and tries to justify the involvement of the private
sector in the field of education. It outlines the crucial role that the private sector can play in
the regulation, provision and financing of education. Hence, it provides the necessary
impetus to strengthen the case for investments in the private sector for education, which is
currently threatened by the RTE act.
The story at the beginning of the thesis provided anecdotal evidence demonstrating how
poor families resort to low-cost education. The fifth section explores the predominant rise of
low-cost education providers across developing parts of the globe.
Delhi, the national capital of India, has created a maze of complex rules for private education
providers. Moreover, the hostile environment, logistical convenience and professional
networks which led to the selection of Delhi as the preferred location for the field work is
outlined in the sixth section. The final section provides a brief on the quest for my knowledge
by setting up the research questions and explains the layout and the structure of the thesis.
The next section throws light on the importance of education for human capital and the
change seen in the Indian education sector since its independence from the colonial rulers
1.2 Background - the Indian education sector
Human capital is a vital component of the progress of a nation, due to the emergence of
technical changes, globalised structures and economic liberalisation (Becker, 2009; Taylor,
2012). To develop human capital, it is imperative that the production of social goods like
education and healthcare be in capable hands (Shah and Miranda 2012). Given limited
resources and tight legislation, developing nations of the world attempt to influence the
production and delivery of social goods and key amongst them is education (Brende, 2015).
Education is important in the generation of human capital (Delsen 2007) and is a merit good
with externalities that are beneficial for society. Because of its dominant role, it is assumed
that the state should provide education free at the point of delivery for all of its citizens and
thus to a great extent states strive to maintain responsibility for this (Delsen, 2007; Shah and
Miranda 2012). Shah and Miranda (2012) though challenge the notion that if the private
sector can be entrusted with the production of economic goods, why it cannot subsequently
be trusted with the ownership and delivery of social goods? Such is the conundrum that
Indian governments, even after seventy years of colonial rule, are unable to decide upon.

7
The Indian education sector remained unchanged until the 1990s. However, since then,
government policy has favoured liberalisation, privatisation and globalisation (Ravan, 2014).
Advocacy for the private sector in elementary education and specifically for the schooling of
the poor has gained ground (Nambissan, 2015) in recent years with the assistance of
individuals, civil societies, social enterprises and some academic institutions (IDFC, 2012).
Several factors, as well as market-based principles, have shaped the Indian economy.
Market principles have driven efficiency, encouraged the spirit of competition, challenged
public systems to realign themselves to suit the requirements of the consumers in the Indian
education sphere and redefined education as a deliverable good (Batra, 2013; IDFC, 2012).
India has earned its place amongst the group of emerging nations due to its phenomenal
growth in recent decades (Anderson and Strutt, 2013). The countries which formed the
consortium of BRICS (Brazil, Russia, India, China and South Africa) have been among the
most rapidly growing nations of the world and have accounted for a quarter of global gross
domestic product (GDP). The Indian economy grew between 7 and 7.5 percent in the
financial year 2016-17 according to the Central Statistics Organisation (CSO) and
International Monetary Fund (IMF) (OECD, 2017). India’s thriving private enterprise is
reflected by the fact that in 2017 alone, the total investment value of the start-ups2 in India
amounted to US$3.5 billion (Statista, 2015) placing India in third place as the most
significant start-up base in the world. The propelling force behind India’s progress is its
labour force which is expected to reach 160-170 million by 2020 (IBEF, 2017).
Education will hold the key to fuel India’s future growth (PwC 2014), and it will undoubtedly
play a significant role as India projects itself as a knowledge economy. The spread of
education undoubtedly impacts on the wellbeing of the population, brought about in part
through high correlations with education, health and nutrition. Education will act as the
cornerstone not only for social segments of the society but will also contribute to the
economic transformation of the Indian society by building a healthy, active and democratic
society (PwC 2014). Hence, it is crucial for India’s young labour force to have access to
quality education (Basu, 2013). The Indian education system can be divided into three main
categories – schooling, higher education and vocational education (Nuffic 2015). Schooling
can be further classified into elementary, secondary and higher whereas higher education is
general and professional (Nuffic 2015).
2 Start‐ups, as defined by the Indian government includes any entity, less than seven years young with an
annual turnover of less than 250 million rupees and headquartered in India (Statista 2015)

8
The principal agency for the education sector is the Ministry of Human Resource and
Development. Other agencies at the central level that maintain the standards of the
education system comprise the National Council of Educational Research and training, the
University Grants Commission (UGC), the All India Council of Technical Education and the
National Council for Teacher Education (NCTE). The State Council of Education Research
and Training maintains standards at the state level (Madhavan and Sanyal, 2012).
The constitution of India enlists education as a ‘concurrent theme’, meaning that laws can be
framed both at the federal and state level. Several states have introduced their laws that
complement the RTE. These include the Delhi Primary Education Act, 1970; the Gujarat
Compulsory Primary Education Act, 1961 and the Tamil Nadu Compulsory Elementary
Education Act, 1994 (Juneja, 2003). The Supreme Court of India declared that education is a
fundamental right of every child and hence instructed the centre to amend the constitution. In
coherence with the instructions of the apex court, the constitution was amended in 2002 and
Article 21A was added, requiring the state to provide free and compulsory education to all
children between the age of 6 and 14 years. This formed the genesis of the RTE which was
instated in 2010 (Madhavan and Sanyal, 2012).
1.3 Unfolding history –State of educational provision during the colonial rule This section tracks the history of the Indian education from 1800 to 1937 and illuminates key
developments during the period. The 137 years is divided into five stages outlining the most
important events that occurred during this time (ref figure 1).
The first stage (1800-1853) commenced in the early 18th century and introduced the Charter
Act in 1813 which paved the way for the modern education system in India (Sharp, 1920).
The second stage (1854-1881) began with ‘Woods Educational Despatch’ in 1854, a move
intended to strengthen the British education system in India. During the third stage (1882-
1901), the Indian Education Commission was formed which encouraged private entities to
provide education. The fourth stage (1902–1921) saw the rise of thinkers who favoured state
education who laid the foundation for a state-based education system in India. Autonomy
was given to the Indian provinces during the final stage (1922–1937) leading to the
beginning of educational experimentation in a decolonised India
At the beginning of the first stage (the first half of the nineteenth century), the system did not
provide clarity on certain pertinent issues. Firstly, the objective of the education policy was
quite vague, and it was unclear amongst scholars whether to spread Western knowledge or
to preserve Eastern learning. Secondly, the medium of instruction to be adopted was also
not clear – whether it should be English or the vernacular language spoken across India.

9
Thirdly, it remained undecided whether education would be made available to everyone or
just to a selected few. Finally, the extent of government involvement in education provision
compared to that of the private sector was unclear.
The initial stage of the Indian education system attempted to resolve the above issues and
was put to rest with the promulgation of the Woods Despatch Act in 1854 (Nururllah and
Naik, 1943; Sharma and Sharma 2012).
Figure 1 - Historical stages in the Indian Education system
The second stage brought some level of clarity with the introduction of the Wood’s
Educational Despatch Act. The Woods dispatch was introduced to cover up the failure of
‘filtration theory’, believed to promote education amongst the upper echelons of Indian
society (Chand, 2007). The primary intent behind the Woods Educational Despatch was to
spread Western knowledge and introduce English as a medium of instruction in the Indian
education system (Sharma and Sharma, 2012)
Education historians Nururllah & Naik (1943) have captured the essence of the ‘Woods
Educational Despatch’ Act in the following words:
“The Despatch of 1854 declared that the main object of the educational
system was to spread Western knowledge and science.
• Introduction of the Charter Act •Vague education policy, unclear educational medium and undecided educational reach
Stage 1
(1800 - 1853)
•Woods Educational Despatch •Spread of western knowledge and introduction of English as the medium of instruction
Stage 2
(1854 - 1881)
•Formation of the Indian Education Commission• Encouragement to different entities, including private players to provide education
Stage 3
(1882 - 1901)
•Rise of thinkers favouring state education•Proposal of introducing free and compulsory education at elementary levels
Stage 4
(1902 - 1921)
• Transfer of control over education to provincial governments
•New experiments in education under British colonial era
Stage 5
(1922 - 1937)

10
The Government could never have the funds to provide for all the
educational needs of the country, the bulk of its educational institutions
would have to be organised by private bodies” (Nururllah and Naik 1943, p.
17)
It is evident from the Despatch that private participation was supported. The Despatch
acknowledged the role that private bodies could play an important role in shaping the Indian
education system. It is unequivocal that even during those times, the state alone could not
bear the responsibility of education as its resources were not adequate to support such an
endeavour.
The third stage marked the formation of the Indian Education Commission which considered
that the British government should withdraw itself from the direct provision of education and
allow distinct agencies to spearhead the propagation of education in India. These agencies
included schools run by missionaries, the government department and a small effort by a
group of private entrepreneurs. Nururllah and Naik (1943) outline the reason as to why the
private sector seemed to be the silver lining of the cloud amongst all of them.
“The Indian Education Commission….opined that ….. departmental
institutions were too costly to be multiplied; that it would be in the best
interests of a poor country like India to close them or transfer them to
private enterprise; and that the efforts of Government should be mainly
directed to the encouragement of private Indian enterprise.” (Nururllah and
Naik 1943, p19)
The fourth stage in the Indian education system (1902-1921) saw the predominance of
thinkers who advocated state education. This led to Gopal Krishna Gokhale’s3 bill which
introduced compulsory elementary education. However, the British government ignored the
bill, promising to provide better curricula in primary and secondary schools, improve the
higher education facilities and raise the number and standard of the existing institutions
(Jain, 2007; Biswas & Agarwal, 1994).
3 Gopal Krishna Gokhale was one of the founding social and political leaders during the Indian Independence
Movement against the British Empire in India. Gokhale’s bill to the Imperial Legislative Assembly was one of
the first attempts to confer the Right to Education on the Indian people see ( Dabholkar, 2010, Wikipedia ,
2015)
11
Gokhale’s bill is viewed as one of the early seeds sown for the demand for free and
compulsory education for children in the Indian subcontinent. The final stage in the history of
Indian education history saw the transfer of control of education to various provincial state
governments. During this time, different schemes were introduced by the Provincial
Governments, and some new experiments under British control were trialled (Nururllah and
Naik, 1943). The next section looks at the evolution of the RTE and traces the historical
timeline since its inception and implementation across India.
1.4 How did the Right to Education (RTE) evolve and why look at it?
The history of the Right to Education Act can be traced to 1911 when Gopal Krishna
Gokhale, an Indian freedom crusader, presented the Free and Compulsory Education Bill in
the Imperial Legislative Assembly. The Acharya Ramamurti committee sought the first
official recommendation for the inclusion of a fundamental right to education in 1990. After
that, several political changes influenced the course of free and compulsory education
(CCS; CSF 2013). The Right to Free and Compulsory Education for Children Act 2009 has
had a lengthy history, subjected to numerous rounds of heated debate and philosophical
and semantic alterations.
Some historians like Desai (1953) state that the roots of the Right to Education Act
emanate from the education act passed in Britain in 1870 which demonstrated a
commitment to the provision of education on a national scale. According to Desai (1953),
educated Indians started demanding similar laws in India to benefit children labouring in
factories and being manipulated to perform other unsuitable work (Desai, 1953).
India’s participation in the international sphere also raised the pressure on its initiatives to
introduce free and compulsory education. The political urgency of considering education as
a right was felt in the early nineties when the Supreme court of India assured to provide early
childhood care and education for all children until they completed the age of six years. The
primary trigger to introduce an Act came with three significant changes in the 86th
Amendment to the constitution in 2002 (Centre for Civil Society, n.d).
The bill, introducing free education first drafted in 2003, and a redraft of the same by Central
Advisory Board of Education (CABE) was presented to the MHRD (Ministry of human
resource and development) in 2005. In the subsequent years, a participatory process of
inviting comments from members of the public yielded several different drafts of the bill until
finally, in 2008, the Union Cabinet stamped its seal of approval on it and presented it before
the ‘Rajya Sabha’ which passed it in July 2009. The bill then proceeded to the ‘Lok Sabha’,
where it was passed in August 2009.

12
The president and the MHRD minister gave consent, and in 2010, the act was enforced by
the central government (Centre for Civil Society n.d). To understand the timeline and the
chronology of the historical events table 1 illustrates the landmark events that occurred over
a century before the RTE was finalised and enacted as a law.
Table 1 – Chronology of events leading to the RTE
4 Rajya Sabha or Council of States is the upper house of the Parliament of India. Membership of Rajya Sabha is limited by Constitution to a maximum of 250 members (Wikipedia, nd)
5 Lok Sabha also known as the house of the people is the lower house of the Indian parliament. The members are the representatives of people and it comprises of 545 members spread across the Indian states and union territories see (National Informatics Centre n.d)
Year Landmark events occurring during the years 1906 Gopalkrishna Gokhale’s plea to the imperial legislative council for free and
compulsory education 1917 The first law on compulsory education passed (popularly known as Patel Act) 1918-1930 Compulsory Education Act in the British province of India
1930 Hartog committee for quality primary education 1944 Sargent plan for achieving UEE (Universal Elementary Education) by 1984 1948 The United Nations adopted the Universal Declaration of Human Rights
UDHR and declared education as a fundamental right in Article 26. 1949 Advisory committee rejected free and compulsory education as a
fundamental right and defined it as ‘Directive principles of state policy.’ 1950 Article 45 of the directive principles of state policy of the newly adopted
constitution of India assures free and compulsory education for all children until completion of 14 years
1975 Central government declares primary education as a joint state/centre responsibility and puts it on the “concurrent list” in an amendment (the 42nd) to the Constitution.
1990 Acharya Ramamurthi’s first official recommendation to include education as a fundamental right.
2003 First draft of the Right to Education bill circulated for public review 2005 Redraft of the bill by Central Advisory Board of Education (CABE) committee
and its submission to MHRD 2008 Right of Children to Free and Compulsory Education Bill introduced in the
‘Rajya Sabha4, and the bill referred to Parliamentary standing committee 2009 ‘Rajya Sabha’ (Upper house) cleared the Bill with minor changes to
the 2008 draft bill. On August 4, the ‘Lok Sabha’5(Lower house) clears the Bill. President of India permits the Bill on August 26 and brings the bill into
force as an act

13
Primary government interventions in India over the past decades were, aimed at increasing
access (through capacity creation) and improving equity. However, to a large extent, the
quality issue remains unaddressed (Madhavan and Sanyal, 2012). The private education
sector has responded to these issues (both access and equity) through low-cost private
schools, but itself faces a massive challenge in this case due to the extreme regulatory
environment imposed by the government. Private players although allowed to set up schools
and participate in the education sector are, however, debarred from making profits; any
surplus has to be ploughed back into the school or institution (Basu, 2013). A regulation like
this poses a considerable challenge to the entrepreneurs, as restricting the distribution of
profit in the form of a dividend could discourage individuals from further investment in new
educational entities.
In the case of India, it is essential to examine the RTE from the two critical perspectives.
First the expenditure behind elementary education and second, the non-state actors involved
in providing education to the millions of children in India.
India’s education budget rose from ₹6 687.1 bn to ₹ 972.5 bn from (£ 7.5bn – £ 9.7bn) 2007-
08 to 2009-2010 an increase of 41.5% after the introduction of the RTE. (Aiyar, 2013). The
increased budgets and the regulations in place have no doubt raised the enrolment levels by
placing significant weight on infrastructure (almost every habitation in the country now has a
school building) however the learning levels seems to be increasingly low (Aiyar 2013).
Data indicates an increase in the overall expenditure on elementary education increased by
26% between FY 2011–12 and FY 2014–15. Some of the Indian states like Tamil Nadu,
Haryana, Uttar Pradesh, Rajasthan, and Gujarat witnessing the highest increases in both
nominal and real expenditure (Dongre and Kapur, 2016). Expenditure estimates collated
from the state budget documents, and government portals by Dongre and Kapur, (2016)
show that the per-student expenditure has risen positively across most states.
6 ₹ ‐ Indicates the currency symbol Indian National Rupee. Exchange rates for currency conversions are as on
Oct 2017
2010 Minister for Human Resource Development approved the Model Rules for the
Right to Education which state governments will use for their implementation of the Act (Jan 29)
RTE Act enforced by the central government on April 1st.

14
Table 2 shows that per-student spending in government and private schools increased by
37% between 2011–12 and 2014–15 (Dongre and Kapur 2016).
Analysing the table shows that there is a wide disparity in different states’ spending per
student. For example, Himachal Pradesh spent around ₹39,343 (approx. £455) whereas
Bihar spent only ₹5298 (approx. £61.73) per student (Dongre and Kapur, 2016).
Table 2 – Per annum Student Expenditure
States 2011–12 2014–15 Change 2011–12 2014–15 Change Nominal Expenditure in
(£) (%) Real expenditure in
(£) (%)
United Andhra Pradesh 143.11 154.957 8.2 143.11 128.348 -10.3 Bihar 49.9 58.278 16.9 49.885 44.968 -9.8 Chhattisgarh 131.9 177.661 34.7 131.857 150.447 14.1 Gujarat 143.4 188.166 31.2 143.396 164.549 14.7 Haryana 190.5 298.793 56.8 190.465 247.885 30.2 Himachal Pradesh 300.2 432.773 44.2 300.19 381.161 26.9 Jharkhand 62.9 88.22 40.1 62.975 76.076 20.8 Karnataka 141.4 186.054 31.6 141.372 150.634 6.5 Kerala 152.4 213.609 40.1 152.438 177.639 16.5 Madhya Pradesh 87.5 131.197 50.0 87.461 106.92 22.3 Maharashtra 124.9 161.832 29.6 124.861 137.698 10.3 Odisha 88.7 103.037 16.2 88.605 86.295 -2.6 Punjab 79.7 100.562 26.1 79.706 85.602 7.4 Rajasthan 127.3 213.301 67.5 127.325 178.42 40.1 Tamil Nadu 108.0 186.054 72.2 108.053 156.519 44.8 Uttarakhand 211.9 288.596 36.2 211.948 251.339 18.5 Uttar Pradesh 91.9 144.122 56.8 91.894 115.236 25.4 West Bengal 65.3 77.011 17.8 65.329 NA NA Total 92.8 126.753 36.6
The Annual State of Education Report (ASER) also provides similar findings and associates
it with the learning outcomes. For instance, the state of Maharashtra allocated ₹12,075,
(approx. £138) whereas Andhra Pradesh spent close to ₹8390 (approx. £95). However,
learning levels in both states seem to be similar. Nearly 60% of the children in both states at
grade five were able to read a class two textbook (ASER, Centre 2013).
All these figures indicate that the principal challenge at this juncture is to cement the link
between increased financial outlays and learning outcomes.

15
The RTE is a crucial aspect in the link as the core component of the law guarantees the
provision of ‘age-appropriate’ mainstreaming for all children (Aiyar, 2013). The second piece
of the puzzle is the non-state actors in India involved in the provision of education.
With more than 220 million children struggling to receive quality education, critiques the
provisions of the Act by arguing that they exclude critical non-state education providers and
thereby eliminate schooling options for millions of children (Brinkman, 2013).
Major schools run by non-state players in the Indian education system include:
Low-cost private schools
Schools run by non-governmental organisations
Alternative schools
Non-formal schools
One of the major players in the non-state sector is what have become known as budget
private schools or low-cost private schools. According to Chavan (2011), there are more
than 40 million children in India enrolled in low-cost private schools, although the official
census District Information System for Education (DISE) lists only 26,000 schools reaching
out to 2.7 million children in India (Chavan, 2011). Nearly 65 percent of the children in
Andhra Pradesh attend private unaided schools. Research from North Shahadra, East Delhi
shows that out of the 265 schools, private unaided schools constitute 66% of the total (175
schools). A large-scale census in Bihar reveals that there are 1,574 schools – approximately
4.5 times more than the figure reported by government sources (Rangaraju, Tooley and
Dixon 2012). According to Tooley and Dixon (2005), the low-cost schooling movement is so
imperative that it is central to any progress in the Indian education system.
Supporters of low-cost private schools have argued that such schools are more efficient than
state schools (Dixon, 2005). In their defence, they contend that these schools often charge
low fees, allowing low-income families to access good quality education (Tooley, 2009).
This is often in English medium and is capable of generating demand from the community
(Baird, 2009).
‘Choice and competition’ theories also favour low-cost private schools and make them more
accountable towards parents, offering an alternative to the state-based system (Basu, 2013).
De et al., (2002) find that although smaller and low-cost schools do not offer adequate
infrastructure, they still generate demand from parents when compared with government-
aided schools. Teachers in private schools are less inclined to absenteeism and more likely
to be engaged in teaching activity.

16
Similarly, an earlier study by Muralidharan & Kremer (2009) finds that students in private
schools have high attendance rates and better test scores, even after controlling for family
and school characteristics. Most recent evidence from one of the world’s most extensive
RCT voucher programmes conducted by Muralidharan and Sundararaman (2015) reports
positive effects in the Hindi language in favour of private schools which deliver better
achievement outcomes at a substantially lower cost per student. Further evidence by Dixon
et al. (2015) reports that voucher programmes in schools allow students to gain better test
scores as compared to non-voucher students.
Those that oppose the private sector argue that private schools may not be an appropriate
means of providing education to the poor especially in cases where states and governments
subsidise education to a great extent (Colclough 1996, 1997). Global monitoring report
(2009) (2013) for education deems education to be a fundamental human right and hence,
education provided by private players will deprive the poorest and most vulnerable with
those rights (EFA Global Monitoring Report 2009, 2013). Several others like Dyer and Rose
(2005) and Rose (2006) are of the view that private players should partner with the state and
limit themselves as wholly separate providers of education (Dyer and Rose, 2005, 2006).
Nambissan (2012) argues that much of the evidence in favour of low-cost private schools is
quite bleak and inconclusive. She further reports that low-cost private schools, in their quest
for profit, curtail necessary investments including teacher training and investment in
infrastructure to improve learning. This could have detrimental effects on teachers and can
defeat the very purpose of education (Nambissan, 2012).
The RTE Act is imposed on both public and private schools across India. However,
mandating the RTE norms across the country magnifies the risk of making albeit well-
intentioned errors as said error would be subsequently be imposed across the entire country
(Muralidharan, 2013). The RTE is a crucial act, capable of influencing the education system
positively and negatively. The next section examines the different legal sections of the act to
understand any existing gaps. My knowledge of the act allowed me to design the research
instruments and frame recommendations in the concluding chapter.
1.5 Examining the sections of the RTE Act The legal Act enacted by the government of India comprises seven chapters, and 38
sections mainly focused at the elementary levels.

17
The in-depth and thorough understanding of the RTE Act enabled in understanding the gaps
prevalent in the legal document7 brought by the Ministry of Human Resource Development
(MHRD). In the subsequent paragraphs, the various sections of the RTE are discussed. A
snapshot summary of the RTE Act and its various sections have been provided in Figure 2.
Figure 2 - Snapshot summary of the RTE sections
7 The actual legal document for further reading can be found in the link here

18
The first chapter of the Act commences with definitions, and hence, those sections have not
been included in the explanation here. The second chapter of the Act comprises sections 3,
4 and 5. Section 3 directs the state to allow every child, between the ages of six to fourteen
years, the right to ‘free and compulsory education’ in a ‘neighbourhood school’ until the
completion of elementary education. MHRD (2013) defines ‘neighbourhood schools’ as a
common space which enables all children from different castes, class, gender lines to learn
together inclusively.
The section further connotes that ‘free education’ means that no child is liable to pay any fee
or charges that otherwise prevent them from pursuing elementary education (MHRD, 2013).
Issues relating to children over six years who have either not been admitted to any school or
having been admitted, have failed to complete primary education due to extenuating
circumstances is addressed in section 4. This section also states the right of the child to be
accepted into a school in a class appropriate to his or her age for completing elementary
education (MHRD, 2013).
The Act provides the right to seek a transfer from any institution including government or
government-aided school to another such school to complete elementary education through
the issuing of a transfer certificate. Section 5 directs the elimination of procedural barriers
(MHRD, 2013).
Chapter 3 of the Right to Education Act is comprised of sections 6-11. Section 6 deals
explicitly with the provision of access to elementary education which includes necessary
schooling facilities within reasonable reach of the children. The rationale of the act is that if
schools are not located near to their dwellings, they may not enrol or finish schooling due to
the distance factor (MHRD, 2013).
The financial responsibilities of the Central Government and the State Governments for
undertaking the provisions of the proposed Act are directed under Section 7. It outlines the
ratio of the amount spent by the centre and the state. (MHRD 2013).
Section 8 directs the appropriate government to reimburse the cost of education where a
child is admitted to a school which is established, owned, controlled or substantially funded
by the necessary government or local authority. Section 9 outlines the responsibility of the
local governments including rules about discrimination, monitoring admissions, attendance
and completion of elementary education, provision of infrastructure and acceptance to
children of migrant families (MHRD 2013; Centre for Civil Society 2013).
Directions to parents and guardians to admit their children to schools and ensure that
children are not deprived of their right to elementary education is stated in Section 10.

19
This section directs the state to impose penal provisions upon parents and guardians who do
not admit their children to schools as penalising the parents would drive families towards
poverty and deprivation (MHRD, 2013). Section 11 of the RTE provides mandates that the
appropriate government may make necessary arrangements for pre-school education.
Chapter 4 of the Right to Education Act comprises of sections 12 to 28. Section 12 covers
three aspects mentioned in the subsequent sections:
a) Firstly, it directs all government schools to provide free and compulsory education to
all children between 6-14 years of age.
b) Secondly, institutions/schools aided by the government must provide free and
compulsory education to a proportion of students, equivalent to the funds it receives
from the government, subject to a minimum of 25%.
c) Thirdly, unaided institutions, as well as special category schools, shall reserve 25% of
their seats for children from disadvantaged or marginalised groups. Section 12 clarifies
that schools would be entitled to receive reimbursement ‘on the basis’ of per child cost
by the government.
RTE’s section 12 enables the admission of children from an economically disadvantaged
section of society. The rationale behind this is to enable institutions to develop the
professional capacity to respond to the intellectual and emotional needs of children from
diverse backgrounds. It is envisaged that, due to this provision of the act, children from
underprivileged backgrounds will not only have an opportunity for quality education but will
also mingle with children from other sections of society, thus narrowing existing societal
divisions.
Some schools in India provide admission to students instead of payments made towards the
school’s infrastructure fund. Termed as ‘capitation fees’, these are deemed illegal under
section 13 of the RTE. The section outlines an appropriate penalty on schools and
educational institutions that violate this rule.
Section 14 directs that children cannot be denied admission if they lack their age certificate.
The rationale for this is that relevant documents including birth certificates, marriage and
death certificates are often not obtained easily, and parents often struggle to procure
children’s age proof (MHRD, 2012).
Section 15 of the RTE Act mandates schools to provide admission to children, irrespective of
the time in the academic year during which admission is sought. Although children should
ideally be admitted at the start of the academic session, under challenging circumstances

20
like migration and displacement of labour, schools need to accommodate children at any
time.
Schools and institutions are restricted from holding back or expelling children until the
attainment of elementary education, as per section 16. The rationale of this section is that
coercing a child to repeat a grade or class dilutes their motivation to pursue further studies.
The RTE directs schools to put in place a continuous, comprehensive evaluation which will
be non-threatening, thus freeing children from the trauma of failure and encouraging
teachers to focus instead on their learning and performance. Schools are strictly instructed
to refrain from any form of physical punishment or mental harassment. This ensures the
healthy development of children’s potential, protecting their dignity and freedom of
expression. Physical punishment and mental trauma are counterproductive and may cause a
child to become even more defiant and rebellious than before (Centre for Civil Society,
2013).
Section 18 stipulates that private schools cannot be established or function without procuring
a certificate of recognition which is only issues to schools which fulfil the prescribed norms
and standards (MHRD, 2013). Section 19 subsequently defines these standards to which all
schools – government or private – must adhere. It also directs schools to upgrade their
infrastructure within three years from the date of commencement of the Act (Centre for Civil
Society, 2013; MHRD, 2013).
Section 20 enables the federal government to amend the schedule on norms and standards.
The formation and constitution of a ‘school management committee’ (SMC) is outlined in
Section 21. Section 22 advocates the preparation of a school development plan (SDP) by
the SMC. The SDP is comprehensive and includes all aspects of the school, e.g. protection
of children’s rights, infrastructure, teacher availability, classroom transaction, child
assessments and inclusiveness, etc. (MHRD, 2012, 2013).
Sections 23 – 26 discuss the norms regarding teaching regulations. These include
qualification and employment condition terms for school teachers. The National Council for
teacher education NCTE is recognised as the authoritative body for teacher qualifications.
These sections also detail the guidelines for teachers’ duties and call for lower maintenance
of pupil-teacher ratio in schools. Furthermore, school vacancies should not exceed ten
percent of the total teacher strength in the school. Sections 27 and 28 outline certain
restrictions on the teaching community – they discourage the deployment of teachers for
non-academic purposes. However, their participation in decennial population census,
disaster relief duties or duties relating to elections to the local authority, state legislatures
and parliament are all permitted.

21
Organisation of private tuitions by teachers is forbidden, and they are required never to use
their influence for commercial gain (Centre for Civil Society, MHRD, 2013).
Sections 29 and 30 of the RTE include rules relating to the curriculum as well as completion
of primary education by children enrolled in schools. These sections further instruct that no
child shall be required to pass the national examinations8 until the end of primary education
as national examinations are known to induce stress and anxiety amongst children (MHRD
2012).
Sections 31 – 34 describe the protection of children’s rights. Section 31 necessitates an
institutional body in the form of National and State Commissions responsible for the
protection of children’s rights. These bodies shall also monitor children out of schools9 and
aim to facilitate access and participation. They call for the establishment of a grievance
redressal mechanism for the rights of the child under the proposed act. Sections 33 and 34
enable the formation of advisory councils to give expert advice for the implementation of the
Act. While the former deals with the creation of the body at the centre, the latter deals with
forming an agency at the state level (Centre for Civil Society, 2013, MHRD, 2013).
The final chapter comprises sections 35 – 38. Section 35 outlines guidelines to be issued by
the central government as well as directions for local authorities on how to implement the Act
effectively. This section also provides powers to appropriate governments for giving
directions to local authorities. Section 36-38 address the prosecution of offences, provide
powers to the appropriate governments to take action in good faith and offer protection
against legal proceedings.
1.6 The growing private sector in education and the threat from RTE
India’s literacy rate rose from 52 percent to 65 percent, a 13 percent increase, from post the
reform era of 1990 in 10 years (1990-2001) and then surged to 74 percent by 2011.
The accumulated growth rate of 22 percent from 1990 to 2011 was the maximum for any
two-decade period since India’s independence (Shah and Miranda, 2012; D. N. Shah, 2013).
8 National examinations include board examinations held at the end of grade 10 and 12
9 Out of school children include who have never enrolled or have dropped out, children who are temporarily
absent, children who are permanent migrants, who migrate seasonally with their parents.

22
The phenomenal growth in the education sector throughout the last two decades calls for
investigation of budgetary allocation for understanding its prospects.
Pankaj and Dholakia (2009), have stated that the budgetary investments in the Indian
education sector are less than 4% of the GDP (Jain and Dholakia, 2009). Elsewhere, they
have stated that, given the high component of teachers’ salaries, it is impossible to raise
budgetary investments to 6% as recommended by UNESCO and hence, it is important to
understand which phenomena could fuel the growth of education in India (UNESCO n.d.)
Figures tabulated from India’s governmental database, District Information System for
Education (DISE), and Kingdon (2017) show that enrolment in private schools has
increased.
Table 3 – Rising enrolment in private schools
Data source - (G. Kingdon, 2017) (DISE data 2010-2016)
Student enrolment in Government and private schools Government schools Private schools
2010-11 2015-16 % change 2010-11 2015-16 % change
Andhra Pradesh 6186492 5367402 -13% 4592255 4943739 8% Assam 4082132 4140192 1% 998944 1013270 1%
Bihar 19495910 21548010 11% 404132 1812378 348%
Chhattisgarh 3808619 3281257 -14% 755632 1113912 47%
Gujarat 5901456 5816280 -1% 2017575 3031588 50%
Haryana 2093700 1663752 -21% 1304015 2006442 54%
Himachal Pradesh 745712 580395 -22% 284026 370371 30% Jammu-Kashmir 1213246 1024643 -16% 786400 832133 6%
Jharkhand 5591346 4727894 -15% 928935 1508344 62%
Karnataka 4624287 4043609 -13% 2328793 3007783 29%
Kerala 1075886 859682 -20% 375084 1471373 292%
Madhya Pradesh 10634585 7979148 -25% 4623450 4720051 2%
Maharashtra 7418628 5937688 -20% 2433975 3803480 56%
Odisha 5659929 5053711 -11% 599886 992117 65%
Punjab 2165466 2072324 -4% 1642518 1760579 7%
Rajasthan 7132668 6264557 -12% 4736520 6073144 28%
Tamil Nadu 4262160 4170562 -2% 3250332 3196288 -2%
Uttar Pradesh 19688240 16602404 -16% 10280445 17622294 71%
Uttaranchal 936630 757137 -19% 617344 886874 44%
West Bengal 13484910 11193885 -17% 1349964 1662095 23%
India (20 states) 126202002 113084532 -10% 44310225 61828256 40%

23
Table 3 compares enrolment rates in government and private schools between 2010 and
2016. At the national level, enrolment in private schools rose by 40% in a six-year time frame
whereas, in the same period, government schools reported a fall of 10%.
Some states like Bihar and Kerala have shown extraordinary growth (more than 100%) in
five years, and other states (Uttar Pradesh, Odisha, Jharkhand, Maharashtra, Haryana and
Gujarat) have shown a rise in enrolment of 50% or more.
A stark contrast is observed in government school enrolments; states like Madhya Pradesh,
Himachal Pradesh, Haryana, Kerala and Maharashtra show falling enrolments to the tune of
25 to 20 percent. The rising figures in private schools indicate the crucial role played by the
private sector in the Indian education ecosystem.
The story seems similar in Pakistan as well where literacy levels are said to be the lowest in
the world. Evidence from the World Bank (2012) indicates that enrolment in low-cost private
schools in the state of Punjab increased by 36 percent from 1998-1999 to 2004-2005.
Tooley (1998) outlines three primary areas – regulation, provision and financing – and
further states that the private sector can do an efficient job in all the above areas. He argues
that the state’s role can be confined to the provision of a legal framework for contracts and
the rule of law (Tooley, 1998). However, with the introduction of the RTE Act, the state in
India seems to be engaged in all three spheres. It regulates public and private schools
through the Act and is engaged in the provision too as there are purely state-owned schools
providing education. The state also finances education as it provides grants to many
recognised schools for the provision of teachers’ salaries, infrastructure upkeep and other
maintenance purposes.
Shah and Miranda (2012) argue, given the changing dynamics of India, that it is vital that the
private sector participates in the production of social goods like health and education. It
would be undoubtedly misguided to leave the production of such goods solely in the hands
of the state.
1.7 Why consider the private sector for low-income families?
Several studies have attempted to raise the question of education for the poor in developing
countries – is the private education sector capable of catering for children hailing from low-
income families? (Kingdon, 2017; Heyneman and Stern, 2013; Day Ashley et al. 2014).
Numerous reasons have been suggested for the rising demand for education amongst low-
income families.

24
Prime amongst them is the declaration of free and compulsory education acts emerging
across the different parts of the globe and the absolute shortage of education supply
(Heyneman and Stern, 2013).
A study by Day Ashley et al. (2014) reports that there is substantial evidence of better
teaching in low-cost private schools in comparison with state schools.
The study further states that there is moderate evidence of better learning outcomes, lower
cost of education delivery, better quality of teaching, improved teacher attendance, school
performance, smaller class size and discipline in low-cost private schools (Day Ashley et al.
2014).
The excess of demand from society has led to the rise in private education for low-income
families even in a socialist country like China (Z. Xu, 2002). Highlighting private investments
and the emergence of low-cost private schools, Shah and Miranda (2012) state:
“As parents began to earn more in the post-reform era, they began to
invest in their children. As better employment opportunities arose, the value
of education became more apparent to parents. This increased demand for
education was met by a rapid expansion of budget private schools.” (Shah
and Miranda 2012, p. 112)
Low-cost private schools, especially in rural areas and poor urban neighbourhoods, are an
attractive option for families looking for better educational opportunities for their children. A
World Bank report (2012) states that there is substantial evidence of increased enrolment in
low-cost private schools due to lower fees and better access, implying that these schools
offer an opportunity to reach students from economically-disadvantaged families with a
potentially higher quality of education.
Various developing countries have embraced female-focused educational initiatives, and
low-cost private schools represent a good avenue for improving girls’ education, even in
countries like Pakistan (World Bank, 2013) and Bangladesh (Raynor and Wesson, 2006)
which have been historically opposed towards education for women. Therefore, gender
equality is also a significant indicator and is among the many reasons for the spur in low-cost
non-government schooling amongst low-income families (Heyneman and Stern, 2013).
Baird (2009) suggests that the quality of education provided by state-owned schools does
not align with parents’ expectations for their child’s future. Stephen and Heyneman (2013)
also support the notion that parents’ decision to spend their income on private education
could be closely related to the poor quality of public schools in developing countries.

25
Evidence suggests that private schools are not only more efficient in imparting learning but
manage to do so at a fraction of the unit cost of government schools (Kingdon, 2007).
Private schools perform better even with much lower expenditure per pupil than government
schools (Singh, 2013).
Rigorous comparative studies undertaken between government and private sector schools in
India indicate the relative efficacy of the two options across rural and urban areas. Students
enrolled in private schools perform much better on average in achievement tests.
Raw scores from student achievement tests show considerably higher achievement in
private schools (Dixon, 2005). Kingdon (2007) examines data relating to learning
achievement levels gathered by a national level organisation in India which indicate that
private school students from grades 2 to 5 outperform government school students by 37.4
percent in reading and maths tests.
Teacher absenteeism is observed on a lesser scale in private schools as compared to
government schools. Only 38 percent of teachers were found teaching in classrooms in
government schools as compared to 70% in private schools when researchers attended
unannounced (Dixon, 2005).
It is quite likely that due to the perceived better quality, gender equality, academic
achievement, teacher accountability and geographical reach, parents from low-income
families are encouraged to seek low-cost private solutions for their children. The next section
outlines reasons as to why Delhi was chosen as the setting for field research.
1.8 Why work in Delhi?
Delhi, India’s political capital, has long been considered a centre of reform. It is interesting to
note the different set of regulations which govern the educational landscape of Delhi. The
complex regulatory framework of Delhi includes three overarching regulations, the Delhi
State Education Act and Rules (DSEAR), 1973, Delhi Right to Education Rules, 2010 along
with the central Right to Education Act, 2011.
General intelligence indicates that with the enactment of a central law, the other two older
acts would be repealed. However, it seems that this is not the case; educational
entrepreneurs wishing to set up new schools are required to read the RTE legislation in
conjunction with the other two acts for the fulfilment of legal requirements. It is both severe
and complicated to navigate through a myriad of legislation while establishing a school and
organising its everyday operations (Antony, 2014). Thus, Delhi’s legal, regulatory
environment prevailing in the education sector makes a compelling case.

26
Consider, a simple case of complexity in Delhi’s regulatory environment. A notification10 from
the Ministry of Human Resource Development MHRD recognises the fact that it is nearly
impossible for private schools operating in land-scarce cities to have a playground within the
existing school premises.
The DESAR 1973, on the other hand, obligates an established school to make
arrangements for a playground if it hitherto lacks in this requirement. The two sets of
regulations certainly seem to be complicated and confusing.
A review of documents reveals an elaborate system that educational entrepreneurs need to
follow for setting up a school.
The first step for establishing a school in Delhi requires it to be registered under the
‘Societies Registration Act of 1960’11. For a school registration the following documents need
to be submitted to the registrar of societies, Government of National Capital Region NCR,
Delhi (Govt. of Delhi, 2014). Essential documents include the following:
A Memorandum of Association (MOA) according to the prescribed MOA given in the
Act 1860
Essentiality certificate stating that it is the correct copy of the rules and regulations
Details of the governing body
Financial details of the body through a self-declaration form including bank accounts
and sources of income and management of funds
An affidavit consisting of a No Objection Certificate (NOC) from the legal owner of the
building stating that he/she has no objection to the society office to function in that
space
(Antony, 2014, p. 5), (Govt. of Delhi, 2014)
Moreover, the promoters need to send an intimation letter to the Directorate of Education
detailing the number of children to be enrolled, the stage of education to be provided, the
number of schools established in the proximity zone, information relating to the building’s
architecture and the financial resources.
10 See appendix 1 for playground notification from the government
11 See appendix 2 for the MOA required for the formation of educational societies

27
Potential owners must produce a NOC from three schools from the preferred zone or the
alternative zone, if there are any, for opening a school in said zone (Antony, 2014).
The DOE carries out an independent assessment to determine if there is a need for the
private school in the stated zone and would issue a NOC if the assessment report turned out
to be satisfactory. If the proposed school receives a go-ahead from the DOE, the second
step is to apply for school recognition. The recognition process is quite complicated as the
potential school owner is required to submit four different set of documents to the DOE.
These documents are listed in a circular brought out by the MHRD in 2011. Some of the
critical set of documents are as follows:
Certificate of Registration of Society under the Society Registration Act, 1860
A land ownership certificate which entitles the owner of the land for carrying out the
operations of the school
A fire safety certificate approved by Delhi fire safety services
Health certificate approved by the Director of Medical services ensuring that the
sanitary requirements have been addressed
Building safety certificate and a water test report sanctioned by the Delhi waterworks
department
Mock drill participation certification provided by the Delhi disaster management
authority
Income tax returns and audit of all financial documents
An affidavit of the list of members of the society along with their addresses
Certificate of Ownership of land or lease agreement for a rented building
Enrolment status of all children
Infrastructure details and sanitary conditions
Declaration of barrier-free access
Declaration of the area, building space, classroom size, number of classrooms
List of teaching and learning material
List of sports and play equipment
List of library books/periodicals/newspapers
Type of drinking water facility
Type of sanitary conditions – list of the number of urinals/lavatories for boys and girls
separately
Particulars of teaching staff – qualifications and teaching experience
A certificate stating that all information is, in ‘accordance with’ the data capture
format of DISE

28
Application to the District Education Officer (DEO) for the recognition certificate of the
school
Details admission of children as per Section 12(c) of the RTE Act, 2009, regarding
the 25% reservation for the economically weaker sections (EWS) and disadvantaged
groups
(MHRD 2011)
Other documents12 include budget estimates, the declaration of final accounts, declaration
that staff salaries are, prescribed as per the MHRD guidelines and the fee structure of the
school. Delhi is thus a suitable option for the research due to the complexity of regulations in
the area.
Apart from the complexity, three other vital criteria were also responsible for Delhi’s selection
as the research interest. The foremost, being able to identify a threat order issued by the
government authorities for private school closures13.
A comprehensive list was, discovered through complex secondary search strategies which
contained the details of 243 schools threatened to be, closed due to the failure of recognition
or its renewal. The closure list certainly made the research interesting in two ways.
Firstly, there was enormous complexity involved in establishing and obtaining recognition for
new schools and second, schools already established were required to complete a
cumbersome bureaucratic process for obtaining renewals. Failure or slight delays in applying
for recognition led to the school’s closure. Secondly, Delhi was also chosen due to logistical
ease and my awareness of the geographical terrain – I have considerable professional
experience working in the region. Therefore, it was easier to plan routes for undertaking the
arduous fieldwork in the summer months. Given the tight budgets and the lack of time to
collect the data, Delhi was the best option in terms of resource optimisation.
Professional networks are crucial for any research and given my experience as a
researcher; I had developed strong links which I presumed would enable me to undertake
the research smoothly. These were helpful in several ways.
12 See appendix 3 for the exhaustive list of documents required for registering a new school
13 See appendix 4 for the closure orders from the government of Delhi

29
Firstly, they helped me to contact sampled schools, enabling necessary approvals for testing
and interview permissions.
Secondly, they assisted in tool development improvement issues, specifically in the areas of
translation. The networks were used for professional printing of the tools which enhanced
the quality of tools during the field work.
Delhi was thus a suitable setting due to various factors like legislation, school closures,
familiarity with the geographical terrain and finally strong professional networks.
1.9 Thesis organisation
At the beginning of this chapter, I mentioned that human resources are an essential
component for the development of any nation and the catalyst for raising the quality of
human capital is education. A key measure to improve educational quality is the Right of
Children to Free and Compulsory Education Act of 2009, considered to be the most
sweeping and ambitious legislation in the history of India. Preliminary evidence indicates that
educational expenditure as a percentage of GDP increased in the last ten years (Aiyar
2013). However, learning levels in government schools declined during the same period
(ASER Centre, 2014). The RTE, according to the MHRD (2012, 2013) guarantees free and
compulsory schooling to the nation’s 233 million children in the age group of 6 to 14. It hopes
to empower the population by strengthening its bargaining power in the political, economic
and social spheres (Keaveney, 2014). The structure of the thesis is as follows.
Chapter one analysed the landmark stages in India’s education sphere and outlined the
significant events that led to the formation of the RTE act. The chapter also looks at the
various sections of the RTE and discusses the norms associated with it. ASER (2013)
reports that the RTE’s implementation to some extent has led to increased accessibility,
expanded school infrastructure and reduced class sizes. Although the nature of the events
indeed seems to be positive, critics contend that following the introduction of the Act, student
achievement levels in core subjects like reading and maths have been consistently poor and
have deteriorated (Chavan, 2011). Others like Muralidharan, Shah have questioned the
above RTE norms and regarded them as input-based norms, and a majority of these norms
are not concerned with improving learning outcomes for students (Muralidharan 2013).
Chapter two reviews the literature around the key drivers, empirically indicated, to affect
student learning and achievement. A detailed discussion of the various drivers as listed by
the RTE schedule is highlighted, and research around school input studies undertaken in
developing countries is considered. It further outlines the successful interventions, as well as
the ones that failed to improve student learning achievement.
30
The review of the literature attempts to find the causes and correlates of student learning
and performance on two fronts: the teacher and the institution.
The third chapter relates to methodology. It aims to align the context of educational research
and explores different philosophical stances. An overview of ontology, epistemology and
research paradigms enables understanding of more broad and minute aspects of the
research, rather than merely the procedure. Chapter three also discusses the selection of
research methods, adopted for gathering, tabulating and analysing the data, and outlines the
rationale behind the choice of methodology.
It further presents the sampling methodology and elaborates on the test instrument selected
for testing the children. The chapter concludes with a discussion of the ethical considerations
and the validity and reliability of the research study.
Chapter four details the results. It combines quantitative and qualitative techniques to report
the findings. Using test achievement scores obtained through diagnostic and IQ tests and
semi-structured interviews with teachers and principals, the chapter seeks to answer the
following research questions.
Is there any relationship between student achievement and the RTE’s emphasis on
physical indicators?
Do the RTE teacher indicators listed in the RTE act and schedule have any impact
on learning outcomes?
Does following certain core guidelines from the RTE rigidly have any impact on
student test achievement?
Does following the RTE’s institutional academic indicators have an impact on student
achievement?
In correlation to the above questions, how do low-cost school owners view the RTE
regulations?
To, answer the above questions, different regression models have been constructed to
predict the relationship between the dependent variable, (test scores obtained from the
sampled schools), and the covariates mentioned in the RTE’s schedule. The chapter
provides school vignettes, written after discussions with school heads and owners. The
insights generated through the vignettes are also used, for substantiating the correlations
identified through the quantitative techniques. The chapter enlists the findings around each
of the questions and concludes by combining the insights found through the process of
qualitative and quantitative enquiries.

31
Chapter five presents the overall findings and highlights specific insights, corroborated by
the literature review undertaken in chapter two. Insights presented in the chapter could be,
used in designing policy measures and significant reform interventions. The chapter also
introduces the implications of coerced school closures and the shortcomings of the current
research and steps that could be undertaken for the co-existence of private and public
schools in India. Limitations of the study and directions for future research are proposed.
The final chapter also discusses implications of the findings for threatened low-cost private
schools and recommends the way forward for such research undertaken in developing parts
of the globe.
The introductory chapter, initiated with a story, highlights the drive for researching Right to
Education and acts as a catalyst to investigate the educational, regulatory regime of the
RTE. The second section outlines the importance of education to raise the level of human
capital and discusses the structure of the introductory chapter. The third section revisits the
historical phases of the Indian education system and how state-based education dominated
India for nearly seven decades since its independence from the colonial rulers. Two
essential elements – education financing and non-state actors – were also discussed in the
section, as they played a crucial role in shaping the current education system. To
understand the laws, sections and subsections, a thorough review of the RTE was
undertaken in the fourth section. Understanding the RTE helped to design the research
instruments and enabled consideration of solutions for its gaps, presented in the concluding
chapter. The fifth section looked at private sector provision for education and the role it plays
in the area of regulation, provision and financing. The section highlighted the importance of
investing in the private education sector, especially at elementary levels, currently
threatened by the RTE. The sixth section lists the causes for selecting Delhi as the venue for
research, and the final section lays out the questions to be explored in the research.
The next chapter highlights the available literature across the globe and focuses on
institutional and individual factors that can potentially impact student learning outcomes.

32
Chapter Two: Review of the literature
2.1 Introduction
Economists, academics and other professionals across the globe to a certain extent agree
that education is imperative, for sustaining economic growth and achieving a high standard
of living (Lucas, 1998; Barro, 1991). Governments spend on average 4.7 percent of their
GDP on education with Latin America and the Caribbean at the top with 5.7 percent, and
South Asia ranked lowest with 3.81 percent (World Bank, 2017). Spending in such
proportions has no doubt led to a rise in enrolment of children in developing countries (World
Bank, 2018; Glewwe & Muralidharan, 2015). Two issues have repeatedly surfaced in
research around lower and middle-income countries (LMCs). Firstly, poor quality of learning
across elementary and secondary levels (Pritchett, 2013; Robinson, 2011; UNESCO, 2015)
and secondly, children struggling to complete their primary education or even failing to enrol
in schools (UNESCO, 2015). There is substantial evidence pointing to a trend of children
across developing regions acquiring knowledge, skills and competencies below the
threshold established by the relevant national curriculum (Glewwe and Muralidharan, 2015;
ASER Centre, 2015; Abogan, 2013; Banerjee and Duflo, 2011; Glewwe and Kremer, 2006).
Given this backdrop, it is crucial to understand which of the indicators promoted by the Right
to Education Act (RTE) can have a substantial impact on student learning and achievement.
This chapter aims to examine the literature that informs the research questions as well as
the overall research interest and will allow for comparisons with previous work undertaken in
this area. The four research questions to be answered by this research and therefore of
interest to the literature review are as follows:
Is there any relationship between student achievement and the RTE’s emphasis on
physical indicators?
Do the RTE teacher indicators listed in the RTE act and schedule have any impact
on learning outcomes?
Does following certain core guidelines from the RTE rigidly have any impact on
student test achievement?
Does following the RTE’s institutional academic indicators have an impact on student
achievement?
In correlation to the above questions, how do low-cost school owners view the RTE
regulations?
The field work in Delhi aims to collect the RTE indicators that are likely to have an impact on
student learning and achievement.
33
The plan for the current chapter is divided into six sections. First, the chapter begins with
three common drivers associated with low and middle and income countries (LMCs)
discussed across studies to improve learning outcomes. The second section focuses on
input-based indicators associated with the RTE which are of core relevance to answer the
research questions. Research carried out in developing countries using production function
analysis is discussed in the third section, aiming to understand the impact of input on
schools’ efficacy and the issues outlined in such studies.
The fourth section reviews a variety of studies from the global arena to assess the ones
which have been successful as compared to those, which were less, or not successful at all.
These studies include randomised controlled trials (RCTs) that aim to address student
learning outcomes. Although it is hard to design specific studies that seek to address
systemic issues in education, such studies are capable of providing insights into these.
The fifth and sixth sections study the evidence of causes and correlate of learning outcomes
associated with teachers and educational institutionsWith reference to teachers,
characteristics include inputs such as educational qualifications, training, remuneration,
experience and the nature of teachers’ contracts. On the institutional front, factors include
facilities and infrastructure, class sizes, school meals, teaching and learning materials and
playgrounds. The chapter ends with a final table outlining the effect (positive, negative or
indeterminate) of the input correlates on student outcomes.
2.2 Empirical Underpinnings
Various economic models have been discussed by several experts, outlining the importance
of schooling, which plays a vital role in propelling the economic growth of nations see
(Becker et al., 1990; Romer,1994). Thinkers such as Jacob Mincer and Theodore Shultz
contend that developing human capital is vital for ‘individual productivity and incomes’ which
could propel a nation towards development (Hanushek and Luque, 2002, p. 1). Developing
countries across the globe realise the importance of human capital due to its positive impact
upon economic development and thus have begun to invest in education to accelerate
growth following independence from colonial rule (Coombs, 1985; Tilak, 1988).
The drive to improve education in developing countries was first observed in the 1980s with
further impetus provided by the World Declaration on ‘Education for All’.
Recent goals posts like Millennium Development Goals (MDG’s) and Sustainable
Development Goals (SDG’s) set up international consortiums like the UN, World Bank and
other global foundations view education as an anchor to raise human capabilities.

34
The targeted approach has now become the norm, and several developing countries are
making efforts to reach these milestones as set by the international consortia (Masino and
Nin˜o-Zarazu´, 2015)
Growing evidence indicates that developing nations across the globe are now striving to
provide quality education at the primary and secondary level for two crucial reasons. Firstly,
evidence strongly implies that economic prosperity is hugely dependent on the quality of
education (Hanushek & Kimko, 2000; Ozturk & Ilhan, 2001; Patrinos, 2016). Secondly,
developing countries realise that although access to schooling has been increasing, poor
quality remains a chronic issue. By the first reason, a good example is the use of test scores
to predict economic development which is a better indicator than others such as enrolment
or improvement in access (Hanushek & Woessmann, 2008; Jamison et al., 2007; Laurini &
Andrade, 2012).
Masino and Nin˜o-Zarazu´ (2015) propose three drivers capable of improving the quality of
education in developing countries and enhancing student outcomes:
a. Enhancing supply-side capabilities of educational entities
b. Behavioural experiments aimed towards the supply side as well as the demand side
elements to trigger behaviour alterations for impacting educational services
c. Participatory and management interventions
Each of the above drivers has been discussed in detail. They will be later revisited in the
discussion section, as to what combination of strategies can prove to be effective in the case
of low and middle and income countries.
a. Enhancing supply-side capabilities of educational entities
Supply-side interventions include investments that are undertaken to augment the existing
physical infrastructure, make provisions for new infrastructure or improve teaching-learning
materials (Barrera-Osorio & Linden, 2009; Glewwe et al., 2004; Vermeersch & Kremer,
2005, Banerjee et al. 2007; Muralidharan & Venkatesh, 2009). Such interventions also direct
a significant portion of the government budget to enhance student learning (Paqueo &
Lopez-Acevedo, 2003; Bjorkman, 2004; Barrera-Osorio, 2007).
“Supply-side interventions aim to raise student achievements by targeting
infrastructure or organisational deficiencies through, improving physical
infrastructure, providing teaching materials, and training and hiring extra
teachers.

35
Financial resources provided by governments and/or aid-funded
programmes can take the form of directed or generalised financial
allocations to improve physical conditions of existing schools or involve
the construction of new schools.”– (Masino and Nin˜o-Zarazu´ 2015, p.54)
Evidence on improving educational quality through supply-side interventions remains limited.
In the subsequent sections, this thesis will review evidence on such interventions as they
form a central component of the RTE, India’s most significant policy reform. The other two
drivers have been briefly explored in this section.
b. Experiments aimed towards the supply side as well as the demand side elements that
potentially trigger behaviour alterations to impact educational services
Behavioural economists are known to use ‘incentives’ to understand the way agents of
education act on increasing or decreasing incentives (Rau & Contreras, 2009; Glewwe et al.,
2010; Kingdon & Teal, 2007; Duflo et al., 2012). Agents of education include both providers
and the entities directly involved in education, namely teachers, students and parents.
Material benefits like remunerations rise, bonus incentives or morale raising strategies like
training and development or career progression may be offered to teachers to view the
changes in their teaching (Muralidharan & Venkatesh, 2009; Glewwe et al., 2009). School
vouchers may be provided to parents and students under the preferential choices for
education providers (Angrist et al. 2002, 2006).
Experiments on the supply side front of incentivising indicate that the impact of incentives is
short-lived. In Chile, for instance, monetary incentives are linked to teacher presence and
performance. Teachers who improved the academic performance of secondary school
students during an annual year were provided with monetary incentives (Contreras, 2001;
Hsieh & Urquiola, 2006). However, test gains could not be sustained for a more extended
period as the teachers altered their behaviour for a short time when the incentives were
provided and thus did not make any efforts to improve instructions that could have a long-
lasting impact (Rau & Contreras, 2009)
Mere monetary and non-monetary incentives alone do not lead to positive achievements;
these had to be tied with other complementary provisions like regular monitoring and
enforcement. For instance, Duflo et al. (2012) observe that pay rise combined with
monitoring teacher attendance leads to the improvement of test scores in schools. On the
other hand, demand-side initiatives are effective in raising learning outcomes in sub-Saharan
African countries with a few stipulations.

36
Demand-side interventions could include the provision of cash or vouchers to students and
households to produce a change in how people use education services (Das et al., 2004;
Baird et al., 2011).
Behavioural changes in such cases include improving attendance by motivating families to
regularly send children to school, grade progressions or improving test scores. Demand-side
interventions targeted towards females can impact on gender bias and normative
discriminations (Ni˜no-Zarazua, 2011) that usually exist in developing countries. Examples
on the end of demand-side interventions in Kenya comprise a scholarship programme
awarded to girls for improving academic progress at secondary levels. This intervention also
produces positive spillover effects over boys (Kremer et al., 2009). Heckman and
LaFontaine, (2010), view that socially and economically backward groups, including
minorities based on religions, are also targeted as beneficiary groups of conditional cash
transfers (CCT’s) as they encounter high-risk factors (Heckman et al., 2010).
Nyugen (2008) finds that the efficacy of such policies is dependent on certain factors. For
instance, in Madagascar, when parents were informed about the returns to education, it
motivated parents to aim for better cognitive achievement in their children which was a cost-
effective way to improve student test scores (Nguyen, 2008). Furthermore, demand-side
experiments are also known to generate redistributive effects meaning that households
which usually spend a specific number of resources on their children reallocated these to
other purposes following the provision of cash grants (Masino and Nin˜o-Zarazu´, 2015). In
this context, Baird (2011) finds that conditional cash transfers to households are more
efficient and have a more enduring impact than unconditional cash transfers. Masino and
Nin˜o-Zarazu´ (2015) indicate that resources provided with conditionalities are capable of
altering individuals decisions as to what options become available in the future.
c. Participatory and management interventions for the community to improve educational
needs
Under the participatory management intervention, Masino and Nin˜o-Zarazu´(2015) outline
two different strategies for changing educational outcomes, defined as ‘bottom-up’ and ‘top-
down’. The ‘bottom-up’ approach usually refers to policies that are introduced at the grass
root level to raise the participation of community members in educational services. Such
interventions are usually effective in breaking or changing customary social norms that
impede the demand for education, particularly amongst vulnerable and needy groups
(Jimenez & Sawada, 1998; Masino & Nin˜o-Zarazu´, 2015). On the other hand, ‘top-down’
programmes aim to enhance the deployment of resources by way of standardised reforms or
practices (Jimenez & Sawada, 1998) (Masino & Nin˜o-Zarazu´, 2015).

37
State or federal governments usually initiate top-down programmes, providing resources,
encouraging community participation and rationalising the flow of educational services
(Galiani et al., 2008; Garcı´a Palomer & Paredes, 2010.)
Thus participatory interventions for the community can be viewed as an additional
component to both supply and demand side elements as they engender social change (King
& Ozler, 2005; Masino & Nin˜o-Zarazu´, 2015).
Prominent examples of the ‘bottom-up’ approach suggested in literature are the EDUCO and
PROHECO schemes in El Salvador and Honduras which encourage community
participation. They were capable of improving student test scores (Jimenez & Sawada,
1999). In Chile, a government programme placed students from low-income families in top
performing schools. Results of such interventions tend to be mixed. While Argentinian
reforms hardly reach marginalised sections, the Chilean programme reported better test
scores for children from more impoverished families when placed in better performing
schools (King & Ozler 2005; Galiani et al., 2008).
Masino and Nin˜o-Zarazu´ (2015) study no doubt have thrown lights on some of the critical
drivers helps in raising student test scores. However, it could have been more helpful if they
could outline which drivers are more powerful than others. Moreover, the study could assign
some weights to each of the drivers and describe which drivers work better than others,
which could potentially make the study robust.
2.3 Indicators associated with the RTE
The Right to Education in India, constituted in 2009 and implemented in 2010, created a
myriad of accountability initiatives. These range from infrastructure obligations, class size
specifications, increases in schools’ expenditure, teacher training, textbooks and
increasingly tightened regulations on private education (Abogan, 2013). The RTE also
advocates the creation of school management committees and recommends the formation
of national and state commissions (see sections 20, 31; MHRD, 2013). Academics and
experts have criticised the RTE’s emphasis on inputs; although the RTE has invested in
schools, teachers, training, textbooks and other resources, it has been unsuccessful in
improving the learning outcomes of children (Basu, 2013; Centre for Civil Society, 2015;
Mukerji & Walton, 2012). It seems that the primary focus of the RTE is to raise access in
schools by focusing on physical infrastructure. This section discusses the schedule of the act
and the three critical components associated with it: infrastructure, guidelines for teachers
and accountability mechanisms.

38
The RTE’s schedule outlines various input components such as class sizes, floor space,
toilets, teacher qualifications, capital-intensive building requirements such as kitchens,
playgrounds, barrier-free access and an office that can double as the head teacher’s room.
The impact of the various input-based measures on student outcomes is discussed later in
sections 2.7 and 2.8. These input-based measures are divided into teacher factors and
school factors. Teacher factors include educational qualifications, subject competency,
teacher training, remuneration, experience, nature of teacher contract and pupil-teacher
ratios in the classroom. School factors include facilities and infrastructure, class sizes,
school feeding programmes, libraries, textbooks, teaching-learning materials and
playgrounds.
Table 4 - Schedule of the RTE Act
S.No. Schedule Item Norms and Standards Admitted children Number of Teachers
1. No. of Teachers for first class to fifth class
Upto 60 Two Between 61-90 Three Between 91-120 Four Between 121 to 200 Five Above 150 children Five + 1 Headteacher Above Two hundred children
Pupil-Teacher Ratio (excluding Headteacher) shall not exceed forty
2. For sixth class to eighth class
At least one teacher per class so that there shall be at least one teacher each for
i. Science and Mathematics; ii. Social Studies iii. Languages
At least one teacher for every thirty-five children Where admission of children is above one hundred
I. A full-time head-teacher; II. Part-time instructor for Art Education Health and Physical Education Work Education
3. Building All-weather building consisting of: I. At least one classroom for every teacher and an office-
cum-store-cum-Head teacher’s room; II. Barrier-free access III. Separate toilets for boys and girls. IV. Safe and adequate drinking water facility to all children’ V. A kitchen where mid-day- meal is cooked in the school;
VI. Playground
4. Minimum number of working days/ instructional hours in an academic year
I. Two hundred working days for first class to fifth class II. Two hundred and twenty working days for sixth class to
eighth class III. Eight hundred instructional hours per academic year for
first class to fifth class IV. One thousand instructional hours per academic year for
the sixth class to eighth class

39
S.No. Schedule Item Norms and Standards 5. Minimum number of
working hours per week for the teacher
Forty-five teaching including preparation hours
6. Library There shall be a library in each school providing newspaper, magazines and books on all subjects, including story-books
7. Play material, games and sports and teaching-learning equipment
Shall be provided to each class as required
Source - (MHRD 2009, 12)
The mandatory requirements of the act as listed in the schedule and its compliance with
private and state schools are shown in table 4. Ironically, the schedule has no mention of
learning standards or student outcomes, considered as a critical measure to judge the health
of an educational system.
2.4 School input and student academic achievement studies in developing countries
Policy discussions around the world of late have focused on schooling inputs, and with the
growing popularity of schooling in developing countries, there is a natural tendency to focus
on them. Several aspects have improved or changed in the last couple of decades. Class
sizes have reduced, teacher competency and qualifications have improved, the quality of
teaching-learning materials has improved, and physical infrastructure in schools has become
more conducive to learning. However, evidence indicating that there are significant changes
in learning outcomes is mixed or in some cases very scant (Hanushek, 2003).
Education economists and academics have aimed to determine the impact of schooling on
student outcomes since the publication of two significant reports – Coleman, 1966 in the US
and Plowden, 1967 in the UK. Both report that schooling factors do not play a dominant role
in raising academic performance or influencing the earning capacities of students when
community background is taken into account. The Coleman report, commissioned by the US
Office of Education, uses data from over 600,000 students and teachers. It suggests that
academic achievement is closely linked with schools’ social composition rather than their
quality (Kivia, 2000).
One crucial concern outlined in various publications is that school and family environments
differ considerably in developing and developed countries (Jamison et al., 1981; Harbison &
Hanushek, 1992; Heyneman, 1984). Therefore, much caution needs to be taken in
replicating findings in different contexts as the emulated policies are likely to encounter cost
escalations, resulting in minimal or no impact on student achievement.

40
For instance, Lockheed and Komenan (1989) caution policymakers who intend to blindly
replicate findings, suggesting an appropriate mix of academic inputs to enhance student
achievement:
“Finding the appropriate mix of alternative…differs from country setting to
country setting. To better inform local policymakers, within-country
research capacity will need to be enhanced, and the appropriate mix of
inputs identified through local research efforts” – (Lockheed & Komenan
1989, p. 111)
The peril of replicating theories is echoed by Heyneman and Loxley (1983), and they note
that theories with school effectiveness are mindlessly emulated without understanding its
long-term implications and thorough evaluations. Moreover, one significant impact could be
the loss of resources, which could prove to be disastrous to those states which may not be
sufficiently endowed with capital (Heyneman & Loxley 1983).
“A danger inherent in paradigms pioneered in one part of the world is that
results might be assumed to be universal without undergoing the requisite
testing. This is the case in the prediction of academic achievement. It is
unfortunate that not all countries are self-sufficient in terms of
development capital, including the capital necessary to improve learning
and to conduct research on the improvement of learning.”
(Heyneman and Loxley 1983, p. 1183)
Academic performance of students across countries requires internationally comparable
data on student achievement. In recent years, assessment interventions such as TIMSS
(Third International Mathematics and Science Study), PIRLS (Progress in International
Reading Literacy Study), projects administered by the International Association for the
Evaluation of Educational Achievement (IAEEA) and the PISA (Programme for International
Student Assessment) project managed by the OECD have become benchmarks for
comparing student performances. However, such data is only available for developed
countries, some middle-income countries but hardly any for developing and low-income
countries. Data available from some of the developing countries indicates below average
performance of the students in critical subjects as reading, mathematics and science
(Glewwe & Kremer, 2006).
“Internationally comparable data are not available for very low-income
countries, but the performance of students on achievement tests

41
administered within many of these countries suggests that academic
achievement is often very low – (Glewwe & Kremer 2006, p. 958) ”
Data collection about the variables and the measurement of these variables is also an issue
in developing parts of the world. Firstly, this is due to the assumption that variables are likely
to change quickly or there would be minimal change in a short frame of time (Glewwe &
Kremer, 2006). However, this assumption is likely to be a misconception as schools and
educational institutions are likely to make quick changes in schooling facilities with the
introduction of new policies and framework by the state or educational authorities. Due to
errors in data collection, it is likely that educationists using sophisticated models may
encounter an omitted variable bias, attributing the cause of academic achievement to a
highly unlikely variable and incorrectly leaving out one or more critical factors. This bias
occurs when models penalise the impact of the missing element by over/underestimating the
effect of one or the other factors.
The use of retrospective data to understand the impact of school inputs and teacher inputs
can also lead to distorted conclusions. For instance, Hanushek (1995) reports that there is
scant evidence that indicates that educational inputs are capable of raising student
outcomes in developing countries. Hanushek (1995) summarises his findings from 96
studies based on variables such as pupil-teacher ratio, educational qualification of teachers,
teacher experience and salary, the cost incurred per pupil and physical facilities (Hanushek,
1995). Kremmer (1995), however, has an alternative interpretation and reports a positive
influence of school inputs on student test score except teacher-pupil ratio. Commenting on
retrospective studies, Glewwe and Kremer (2006) note that:
“Even the best retrospective studies suffer from serious estimation
problems, the most serious being omitted variable bias with respect to
school and teacher characteristics, unobserved child and household
characteristics that are correlated with observed school and teacher
variables, and measurement error in school and teacher data” (Glewwe
and Kremer 2006, p. 995)
Limitations in retrospective studies encourage researchers to turn their attention towards
natural experiments and randomised controlled trials. These methods assist in averting the
estimation issues that surround retrospective studies. However, such studies still require a
broader set of results before forming any concrete conclusions as to how schooling inputs
may affect student outcomes.

42
2.5 Global education research using education production functions
Analysing the available literature on student attainment indicate that a majority of studies use
some form of production function to determine the impact of the inputs. The standard form of
equation observed in the literature is demonstrated below:
The above production function permits to determine a relationship between the different
elements associated with it. Where A, is the student achievement or the attainment by a
pupil in the educational production process. β0 is the intercept (also known as the constant),
β1 is the slope parameter or the slope coefficient) and ε represents the errors.
In the above model, student achievement is measured through some form of test scores and
this research uses a diagnostic test score, which determines the student’s proficiency in
language, maths and environmental studies (EVS). Vector I captures the inputs or resources
prevalent in a school, H captures the household and family characteristics, Sf captures the
school or institutional factors and IT captures innate talent (Hanushek & Woessmann, 2017).
Although, a scientific and a rational method to determine the impact of inputs on the outputs,
the use of production function in the educational context is not free from criticism. Some of the
criticism outlined to the production function approach are discussed below:
Omitted variable bias - Hanushek and Woessmann (2017) believe that inputs usually taken
into account in a production function are not always likely to be exogenous in a statistical
sense. This means that a production function is expected to omit certain crucial variables.
For instance, a critical component ignored in several international test the innate talent of the
student. Measuring this through a proxy variable like an IQ test can further the complexity of
an endogenous bias. The impact of endogeneity bias is reflected in longitudinal surveys
which attempt to use the production function.
Consider the example using data from NLSY (National Longitudinal Survey) the USA, which
employs education, experience and ability as variables to measure the impact on wages of
935 men in 1980 using the following function.
log
The coefficient for education showed an increase of 2.1% point when the proxy variable was
omitted.

43
Table 5 – Impact of various determinants on wage
Log(wage) Coefficient Std. Err. Coefficient Std. Err.
Education 0.078 0.007 0.057 0.007 Experience 0.020 0.003 0.0020 0.003 IQ — — 0.006 0.001 Constant 5.503 0.112 5.198 0.122
(University College London, 2008)
Estimated returns to education change from 7.8% to 5.7% once the proxy variable IQ is
introduced for ability. Results from large-scale research using production functions need to
be interpreted with great caution, due to the substantial scope of endogeneity bias that can
create distortions, while using the least squares estimates.
Inclusion of cultural aspects - This is another major criticism of production functions,
mentioned in Alexander (2000). Hanushek and Woessmann (2017) suggest that
“unobserved heterogeneity at the country level may introduce new forms
of omitted variable bias. For example, cultural factors such as “Asian
values” may remain unobserved in the econometric model and correlate
both with student outcomes and relevant inputs in the education
production function” (Hanushek and Woessmann 2017, p. 153)
However, the cultural aspect to a great extent is covered through elements like family
background, ethnic groups and the socio-economic status of the children in the schools that
they are enrolled. Hanushek (2017), further advises checking for the robustness, which is
comprised of the correlates of cultural factors as control variables (Hanushek & Woessmann
2017, p153).
Data limitations – Data collected from the field may not always be as accurate, and thus can
lead to inaccurate measurement bias. Consider the two primary forms of errors that are likely
to occur during the data collection process. First, students may not have an accurate
memory of their family background or any other variable related to the socio-economic
status. Second, data about teaching methods, especially the variables pertaining to
classroom transactions are omitted (Todd & Wolpin, 2003). The former can be rectified
through back-checks, a process in which a certain proportion of questionnaires and
schedules are checked twice or thrice by different people to spot any data aberration. In the
case of the latter, researchers can use classroom observations in conjunction with
questionnaires administered to subjects in the study which form part of the statistical
analysis. The collection of information from various sources including teacher, students and
school environment provides a rich variety of data inputs, and the above limitation can be

44
mitigated by collating the various attributes of the subjects robustly. For instance, in the case
of teachers, these attributes could include experience, educational qualifications, socio-
economic background, age, subject proficiency and remuneration. For students, it could be
socio-economic status, IQ, age, family composition, parental education and finally data
collection on schooling amenities can include physical facilities such as building
maintenance, availability of toilets, library, computer labs and playgrounds. Such rich data
from various sources mitigates for skewed effects and enhances the contributing effects of
the endogenous variables.
Utilisation of test scores – Educational quality is measured with the help of student
achievement. Several historical studies including Heyneman and Loxley (1983) and Toma
(1996) make use of them along with educational production functions.
Woessmann (2003) conducted the first economic study using micro data on student
achievement, family background and school inputs that exist across different nations to
estimate the impact of education production functions. Hanushek and Luque (2002) state
that using test scores to determine student achievement is considered to be quite
controversial. However, they defend it as well by contending that student test scores are the
best proxies that are available to researchers and academicians in the absence of other
indicators. It would be indeed difficult to collate data on income, the status of the individual in
the society and criminal offences, to name a few examples. Moreover, one has to consider
the practical hurdles in measuring such data (Hanushek & Woessmann, 2017).
Hanushek and Luque (2002) further state that ‘educational quality’ can be hard to define.
The term quality can be best estimated by measuring the ‘knowledge’ and ‘analytical skills’
which are mainstays of the school system (Hanushek & Luque, 2002).
“Relying on standardised tests to provide measures of quality is
controversial… Nevertheless, such measures appear to be the best
available indicators of quality and do relate to outcomes that we care
about.” – (Hanushek & Luque 2002, p. 3)
Arbitrary selection of variables Alexander (2000) criticises research on school efficacy using
education production functions by stating that the endogenous variables used to build the
equations are selected ‘arbitrarily’ and the equation constructs are mainly based on search
engine results. Thus the function is a mere representation of what the educational
researcher has chosen to write about or investigate (Alexander, 2001). One might
disapprove of this conclusion as it is doubtful that prominent education economists like
Hanushek, Woessmann, Muralidharan, Glewwe, Kingdon, Heyneman and Kremer would

45
disregard newer methods and models and instead select variables through arbitrary
procedures. One way to raise the robustness of the findings is by using multi-level estimation
techniques which allow for a self-section bias and control for family background and child’s
cognitive ability. This enriches the analytical findings and allows more flexibility and variation
in the data.
Multicollinearity – Butler and McNertney (1991) indicate that estimates from coefficients
cannot be relied upon if they are highly correlated. They explain that the measure function
may lead to inconsistent estimates and describe this as an issue of multicollinearity.
Multicollinearity occurs when endogenous variables are closely correlated with each other
which means that it is unclear which variable is responsible for the variance in the dependent
variable.
However, with new sophisticated software which detects the presence of multicollinearity
through the inspection of the ‘coefficients’ and ‘tolerance values’, the problem can be
resolved to a great extent (Butler & McNertney, 1991).
2.6 Where does the current study draw inspiration?
The current research draws inspiration from four studies in particular. These studies use a
combination of various methods ranging from production techniques, panel data and
experimentation. Using these different techniques, they study the causes and correlates of
student learning outcomes and aim to establish causal relationships between inputs and
outcomes. The work undertaken by Abogan (2013), Muralidharan (2013) and Mukerji and
Dhruva Bhat (2017) is of particular relevance to this study.
Apart from the above, the thesis is inspired by Professor Pauline Dixon’s doctoral thesis
which aimed to study school inputs using production functions and regression models to
enhance student learning in developing countries including India. However, Professor
Dixon’s thesis focuses on examining the regulatory policy in Indian schools and matching
them with Austrian economic principles whereas the current thesis focuses on input-based
indicators about the RTE (Right to Education Act).
2.6.1 Abogan (2013)
Student achievement is pivotal to Abogan’s work which identifies the complicated
relationship between inputs that can potentially lead to better learning outcomes. The work
also attempts to ‘evaluate the efficacy and logic of the RTE and looks into various indicators
of the RTE including infrastructure deliverables, proceeds to educator and student
attendance and aims to gauge their impact on outcomes. Abogan (2013) uses secondary
data sets from the Annual Status of Education Report (ASER) which is an annual survey that
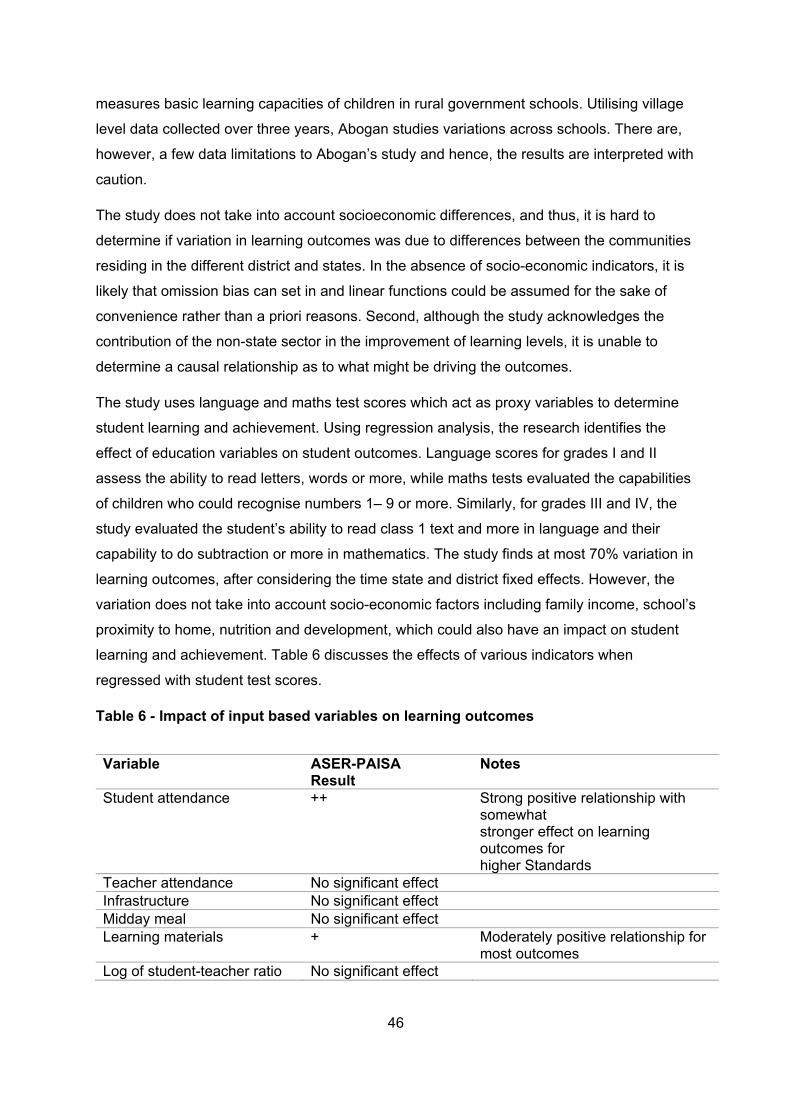
46
measures basic learning capacities of children in rural government schools. Utilising village
level data collected over three years, Abogan studies variations across schools. There are,
however, a few data limitations to Abogan’s study and hence, the results are interpreted with
caution.
The study does not take into account socioeconomic differences, and thus, it is hard to
determine if variation in learning outcomes was due to differences between the communities
residing in the different district and states. In the absence of socio-economic indicators, it is
likely that omission bias can set in and linear functions could be assumed for the sake of
convenience rather than a priori reasons. Second, although the study acknowledges the
contribution of the non-state sector in the improvement of learning levels, it is unable to
determine a causal relationship as to what might be driving the outcomes.
The study uses language and maths test scores which act as proxy variables to determine
student learning and achievement. Using regression analysis, the research identifies the
effect of education variables on student outcomes. Language scores for grades I and II
assess the ability to read letters, words or more, while maths tests evaluated the capabilities
of children who could recognise numbers 1– 9 or more. Similarly, for grades III and IV, the
study evaluated the student’s ability to read class 1 text and more in language and their
capability to do subtraction or more in mathematics. The study finds at most 70% variation in
learning outcomes, after considering the time state and district fixed effects. However, the
variation does not take into account socio-economic factors including family income, school’s
proximity to home, nutrition and development, which could also have an impact on student
learning and achievement. Table 6 discusses the effects of various indicators when
regressed with student test scores.
Table 6 - Impact of input based variables on learning outcomes
Variable ASER-PAISA Result
Notes
Student attendance ++ Strong positive relationship with somewhat stronger effect on learning outcomes for higher Standards
Teacher attendance No significant effect Infrastructure No significant effect Midday meal No significant effect Learning materials + Moderately positive relationship for
most outcomes Log of student-teacher ratio No significant effect
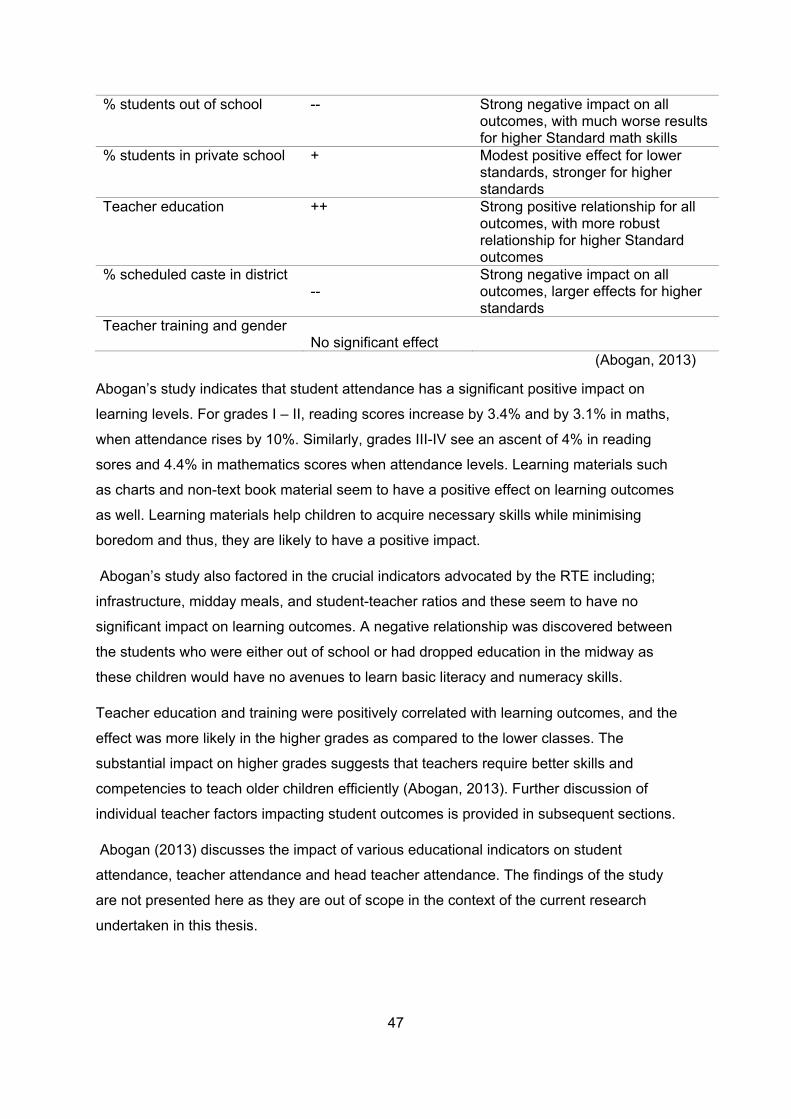
47
(Abogan, 2013)
Abogan’s study indicates that student attendance has a significant positive impact on
learning levels. For grades I – II, reading scores increase by 3.4% and by 3.1% in maths,
when attendance rises by 10%. Similarly, grades III-IV see an ascent of 4% in reading
sores and 4.4% in mathematics scores when attendance levels. Learning materials such
as charts and non-text book material seem to have a positive effect on learning outcomes
as well. Learning materials help children to acquire necessary skills while minimising
boredom and thus, they are likely to have a positive impact.
Abogan’s study also factored in the crucial indicators advocated by the RTE including;
infrastructure, midday meals, and student-teacher ratios and these seem to have no
significant impact on learning outcomes. A negative relationship was discovered between
the students who were either out of school or had dropped education in the midway as
these children would have no avenues to learn basic literacy and numeracy skills.
Teacher education and training were positively correlated with learning outcomes, and the
effect was more likely in the higher grades as compared to the lower classes. The
substantial impact on higher grades suggests that teachers require better skills and
competencies to teach older children efficiently (Abogan, 2013). Further discussion of
individual teacher factors impacting student outcomes is provided in subsequent sections.
Abogan (2013) discusses the impact of various educational indicators on student
attendance, teacher attendance and head teacher attendance. The findings of the study
are not presented here as they are out of scope in the context of the current research
undertaken in this thesis.
% students out of school -- Strong negative impact on all outcomes, with much worse results for higher Standard math skills
% students in private school + Modest positive effect for lower standards, stronger for higher standards
Teacher education
++ Strong positive relationship for all outcomes, with more robust relationship for higher Standard outcomes
% scheduled caste in district --
Strong negative impact on all outcomes, larger effects for higher standards
Teacher training and gender
No significant effect

48
2.6.2 Muralidharan (2013)
Muralidharan’s research draws evidence from various sources and describes the impact
of input at multiple levels (school, teacher, student) on student outcomes. The study,
however, does not consider all the input variables as listed in the RTE schedule. Using
experimental evidence and panel level data, the policy research finds that investment in
inputs may not lead to improvement in education quality.
The research, organised into five sections, begins by outlining insights from various
academic papers drawn from developing countries, based explicitly on large-scale data
panels. In the second section, the research presents the facts relating to progress made
by the Indian education system in terms of inputs and the dwindling levels of student
outcomes. The third section reviews the evidence on educational inputs at the school,
teacher and student level on learning outcomes and also looks at evidence influencing
outcomes by reforming pedagogy and school level governance.
In the last two sections, the study details the priorities for policies keeping the future
outlook in perspective and closes with challenges envisaged and proposed strategies to
mitigate them. For the review of the literature, the thesis focuses on the second and third
sections of the policy research.
The research throws light on positive achievements in the government schooling
spectrum. It reports a decline in PTR, approximately by 8 % (from 47.4 to 39.8), doubling
in infrastructure facilities like toilets (40% to 84%), electricity (20% to 45%) and the rise in
mid-day meal programmes (MDM) by nearly four times 21% to 79% in a period of six
years. While lauding the achievements made to improve the school quality, the study
laments the fact that improvements in educational inputs have not translated into benefits
in student achievements (Muralidharan, 2013; Kremer et al., 2005).
Muralidharan (2013) quotes the ASER report which finds that less than ½ of the children
enrolled in the fifth grade can read a simple paragraph suitable for second-grade children
and a little more than a quarter (27%), enrolled in the third grade are capable of solving a
two-digit subtraction problem. Most children at these levels are usually expected to solve
problems of these types (Muralidharan, 2013, p. 5). Quoting a study by ‘Educational
Initiatives14’, the research describes that student performance on test items ‘requiring
14 Educational Initiatives is an Indian educational consultancy focused on undertaking large scale research
assessments across India.

49
application of concepts is consistently lower than those representing rote learning’
(Muralidharan 2013, p 6). Further, the study informs that the average scores across grade
4 in languages is less than half than that of their international counterparts.
Muralidharan (2013) quotes his work with Zieleniak and Yendrick (2013) using item
response theory (IRT) and highlights that ‘not only are learning levels low but so are the
learning trajectories over time’ (Muralidharan, 2013, p. 6). The use of IRT allows for
estimation of the ‘probability of a typical student in a given grade getting a question correct
over time as they progress through the grades’ (Muralidharan, 2013, p. 6). The research
finds that less than 20% of the students were capable of answering a grade N-level question
correctly while nearing the end of grade N. However, they were able to solve it accurately
after grade N+1 ( Muralidharan, 2013, p 6; Muralidharan & Zieleniak, 2013).
Not only are learning levels reduced at the elementary levels but they are also poor at
secondary levels as well. Quoting PISA assessments, Muralidharan (2013) finds that India’s
two states which participated in the test were at the bottom of the league tables.
Ranked 72nd and 73rd from a total of 74 countries, the results highlight a significant gap in
learning levels and India’s fragile position educationally as compared to international entities
(Maurice, 2011).
Muralidharan (2013) states that most correlational measurements of student learning with
inputs based on investments seem to be happening at three levels: school, teacher and
student.
At the school level, Muralidharan (2013) uses village-level panel data from more than 1000
villages and 19 Indian states and finds no correlation between ‘village-level school
infrastructure’ and enrolment, teacher absence and student test scores. The paper outlines
that the reasons for the minimal impact of infrastructure on learning outcomes are not
obvious. However, it does indicate a few possible causes as to what might be hampering the
impact. First, investments in infrastructure may appeal to teachers and students, although
they may not affect the ‘teaching and learning process’ which could be the leading cause of
learning. Second, existing infrastructure in schools might not be used at all, and thus, no
visible impact is likely to be produced. Finally, evaluation of investments in infrastructure for
shorter periods may yield negligible returns to learning, and therefore they become a
challenge to measure statistically. At the teacher level, Muralidharan reviews the inputs in
terms of teacher remuneration, training and reducing pupil-teacher ratios (PTR). Using
evidence from Kingdon and Teal (2010), the research reports a lack of significant positive
relationship between teacher training and test scores.
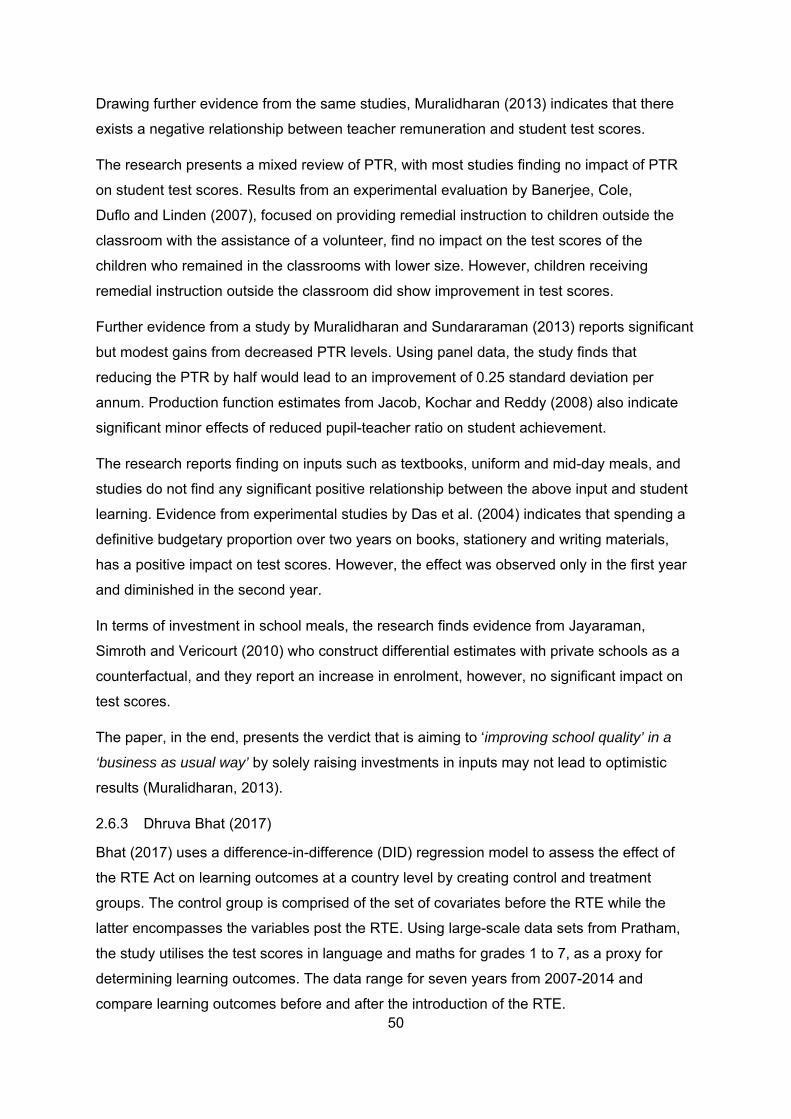
50
Drawing further evidence from the same studies, Muralidharan (2013) indicates that there
exists a negative relationship between teacher remuneration and student test scores.
The research presents a mixed review of PTR, with most studies finding no impact of PTR
on student test scores. Results from an experimental evaluation by Banerjee, Cole,
Duflo and Linden (2007), focused on providing remedial instruction to children outside the
classroom with the assistance of a volunteer, find no impact on the test scores of the
children who remained in the classrooms with lower size. However, children receiving
remedial instruction outside the classroom did show improvement in test scores.
Further evidence from a study by Muralidharan and Sundararaman (2013) reports significant
but modest gains from decreased PTR levels. Using panel data, the study finds that
reducing the PTR by half would lead to an improvement of 0.25 standard deviation per
annum. Production function estimates from Jacob, Kochar and Reddy (2008) also indicate
significant minor effects of reduced pupil-teacher ratio on student achievement.
The research reports finding on inputs such as textbooks, uniform and mid-day meals, and
studies do not find any significant positive relationship between the above input and student
learning. Evidence from experimental studies by Das et al. (2004) indicates that spending a
definitive budgetary proportion over two years on books, stationery and writing materials,
has a positive impact on test scores. However, the effect was observed only in the first year
and diminished in the second year.
In terms of investment in school meals, the research finds evidence from Jayaraman,
Simroth and Vericourt (2010) who construct differential estimates with private schools as a
counterfactual, and they report an increase in enrolment, however, no significant impact on
test scores.
The paper, in the end, presents the verdict that is aiming to ‘improving school quality’ in a
‘business as usual way’ by solely raising investments in inputs may not lead to optimistic
results (Muralidharan, 2013).
2.6.3 Dhruva Bhat (2017)
Bhat (2017) uses a difference-in-difference (DID) regression model to assess the effect of
the RTE Act on learning outcomes at a country level by creating control and treatment
groups. The control group is comprised of the set of covariates before the RTE while the
latter encompasses the variables post the RTE. Using large-scale data sets from Pratham,
the study utilises the test scores in language and maths for grades 1 to 7, as a proxy for
determining learning outcomes. The data range for seven years from 2007-2014 and
compare learning outcomes before and after the introduction of the RTE.

51
The geographical scope of the study includes Jammu and Kashmir (J&K), and the whole of
India, before and after the enactment of the act. The inclusion of J&K state in the study is
interesting as it was exempt from the RTE due to the adoption of article 370, providing it with
autonomy over several matters and restricting the state’s involvement to defence, foreign
affairs and communications (Noorani, 2011).
Bhat (2017) uses three major controls in the DID equation to study the impact of RTE on
student outcomes. The research controls for the gender of the student, checks for the
student’s enrolment with a private school and finally, ensures that the changes in the
outcomes are not due to the rising incomes by controlling the state level GDP.
Bhat provides an important clarification for all the controls and states that due to the
preference of male children in India, it is plausible that outcomes could be ‘impacted by
gender’ (Bhat, 2017, p19 ). Secondly, controlling for the private school ensures that the
performance of public schools is highlighted under the RTE.
The research reports that the introduction of the RTE in government schools had negative
results in language across all grades, except grade one. These findings reflect a similar story
for mathematics as well as the results were negatively impacted at a broad level across all
classes. However, they were not statistically significant. The research states that children
enrolled in private schools are likely to gain a 6.9 percentage point increase in reading and a
5 to 13 point increase in math skills following the introduction of the RTE.
The research ensures the robustness of the findings in two ways – by plotting the average
scores of the treatment and control groups and observing a steep decline in student
performance. However, to make the findings more robust, Bhat (2017) regresses the
outcome variables against the covariates and plots the coefficients.
The research also finds that the school level characteristics improved under the RTE regime,
as did the usage of blackboards, while teacher absence declined.
A significant limitation to the study is ‘omitted variable bias’, which means that Bhat’s study
(2017) does not identify or pinpoint the covariates responsible for declines in differences due
to RTE schedule. The researcher does control for private schools, gender and the GDP of
the state but the RTE itself is a complex mechanism which outlines several drivers in its
schedule. For instance, the RTE schedule regulates hiring trained teachers, salary levels
and infrastructure components such as playground, office-cum-store, library and teaching-
learning materials. The research needs to consider the drivers of the RTE listed in the
schedule and separate its effects to measure the real impact on learning outcomes in public
schools pre and post the RTE. Furthermore, the study also does not consider student-level

52
characteristics such as the family background of the student, income levels and the IQ level
of the students, which is likely to affect student outcomes. Other absent variables include
pedagogical style, teaching quality and curriculum itself.
The current thesis takes into account the different RTE indicators which form a gap in the
above study and tries to determine the differences in learning outcomes in the threatened
private schools due to the imposition of RTE regulations. In the next sections, the thesis
throws light on the different teacher level factors and institutional factors that have
empirically shown to influence student performance.
2.7 Teacher Factors
One of the essential drivers for variation in student achievement is the quality of teachers
(Mckinsey, 2007). Education systems gain strength from the quality of teachers, as effective
teaching aims to improve student outcomes which in turn helps students to shape their
future careers (Coe et al. 2014). Mckinsey’s (2007) report, which investigates some of the
high performing systems across the globe, focuses on improving student learning and finds
three things in common amongst these systems. Firstly, high performing systems aim to
maximise the quality of teachers by ensuring the right people for the right job. Secondly,
these systems invested in time and resources to train the teachers to be better instructors,
as they were aware that – to raise outcomes it was imperative to invest in improving
instruction. Finally, they build well-integrated support systems that benefit students through
excellent instruction (Mckinsey and Company 2007). Although it is clear that ‘teachers’ in
any system do have an impact on student achievement, it is nevertheless important to
determine which factors associated with teachers can lead to better learning outcomes.
Therefore, the research focuses on the following factors based on secondary literature
(Glewwe et al. 2012; Evans & Popova, 2015; Abogan, 2013; Nannyonjo, 2007;
Muralidharan, 2013; Goyal & Pandey 2011).
Educational qualifications and subject competency
Teacher training (In-service and academic)
Teacher remuneration
Teacher experience
Nature of teacher’s contract
Pupil teacher ratios
2.7.1 Educational qualifications and subject competency
Buddin and Zamarro (2009), using contemporaneous value-added models, find that teacher
education has no effect on student achievement, and hence they recommend that using

53
‘teacher education’ as a way to increase student achievement should be viewed with
caution. They report that teachers with advanced degrees are not likely to impact test scores
positively or sometimes are also known to have an adverse effect on reading and
mathematics scores.
Glewwe et al. meta-study (2012) analyse studies which focus on the various characteristics
that have positive impacts on learning outcomes. The study finds the relationship between
teachers’ qualifications and student outcomes to be vague. Of the 13 studies analysed by
Glewwe, ten were found to be statistically insignificant, two turned to be significantly positive,
and one was significantly weak (Glewwe et al. 2012).
Hanushek (2015, 1997) analyses 151 studies on teacher education and finds only 9% of the
studies statistically significant to student achievement. The other 86% of the studies are
statistically insignificant, of which 53% were negative or indeterminate.
Coe et al. (2014) and Rockoff et al. (2011) find a negligible or small relationship between
academic qualification, general competency of teacher and student achievement. They
describe the relationship as ‘disappointing’ (Coe et al. 2014, p.18).
Studies by Sadler et al. (2013) report a positive but modest relationship between teachers’
subject knowledge and student learning outcomes. Sadler et al. (2013) test teachers and
students on subject competency in science. They find that more than 4/5th of teachers
respond correctly to the questions as compared to a little more than a third of students
(38%). However, their study also finds that teachers’ ability to recognise misconceptions in
science is ‘hardly above chance’ (Sadler et al., 2013). Similar trends are observed in a less
recent study (Harbison & Hanushek, 1992) which compares teachers’ subject competency in
language (Portuguese) and mathematics with that of their students. They report that
although teachers performed better in tests, their performances were not ‘remarkably good’.
The tests were designed with specific learning objectives of the fourth grade. 1/5th of the
questions were not completed by the teachers. The usual expectation in such scenarios is
that teachers’, the extent of whose education is approximately eight years, would be capable
of acing such tests with near perfect scores (Harbison & Hanushek, 1992). Evans and
Popova (2015), in a metastudy, report that teachers’ subject knowledge helps raise student
achievement in that particular subject. Abogan (2013) also finds that as subject mastery
improves, it paves the way for better teaching to a different category of students. Zuzovsky
(2003) analyses the TIMSS-2003 data to study the relationship between teacher
characteristics and student achievements. The study reports that teachers with an advanced
degree in science or majoring in science have a positive influence on science test scores,
although not significant. Reporting the findings, Zuzovsky states:

54
“Students taught by science teachers with a second degree or by
teachers who had majored in at least one of five relevant subject areas ..
had achievement levels that were slightly higher (about one fifth to one
third of a group standard deviation) than those of students studying in
groups taught by science teachers with a first degree or less” – (Zuzovsky
2003, p. 48)
In conclusion, it is difficult to ascertain if general teacher qualifications or degree can have a
positive impact on student outcomes. However, the literature does indicate that depth of
subject knowledge or specialised subject competence can help in scoring better outcomes
for students.
2.7.2 Teacher training (In-service and academic)
Meichen et al. (2017) review the National Teacher Training Programme (NTTP) in China to
understand the impact of national training programmes on student outcomes. The research,
comprised of more than 3000 students and 84 teachers, finds that the training programme in
maths had no effect on achievement and a negative impact on student outcomes. Meichen
et al. (2017) further state that it is likely that teachers fail to ‘apply’ their training in a
classroom setting and therefore, they may fail to impact upon student learning. The other
causal reason could be the disruption of normal learning for students, as teachers attended
the NTTP during term time. A major limitation could be the limited sample size. Secondly,
the study was undertaken to determine changes during a specific period, and therefore it is
plausible that the long-term effects of teachers’ knowledge could yield better effects on
student outcomes (Meichen et al., 2017).
Similarly, Harbison and Hanushek (1992) analyse two different national programmes,
namely, the ‘Logos’ and the ‘Curso de Qualificacao’ under the ‘Edurural’ project in Brazil.
They find a statistically negative impact of teacher training on mathematics achievement in
the second and fourth grade. Elaborating on the negative impact detected in Curso de
Qualificacao programme, Harbison and Hanushek (1992) report that teachers participating in
the programme would have been those with low levels of formal educational attainment or
with poor skills.
Evans and Popova (2015) review six different studies and find that teacher training is
capable of producing the largest effect on student outcomes. However, Evans and Popova
quickly caution that schools and educational institutions aiming to provide ‘general guidance’
in the name of training may not lead to better student outcomes. A study by Muralidharan
and Sundararaman (2010) provides an example to that effect, showing that when teachers

55
are equipped with general information and training to assist student learning, this does not
impact student outcomes. However, training which focuses on classroom transactions and
pedagogical strategies have a more profound effect on weaker students (Murnane &
Ganimian, 2014). He, Linden and MacLeod (2008) show that when teachers are equipped
with a bespoke lesson plan, provided with storybooks, teaching-learning materials and are
given instructions on how to use them, they are useful in raising learning outcomes for
children.
Nannyonjo (2007) aims to find the impact of teacher training on an extensive database of
3949 pupils after analysing test scores from the Uganda National Examination Board
(UNEB) and National Assessment of Progress in Education (NAPE, 2003). On examining
the evidence between teacher training and student performance in English and
Mathematics, the study shows the following results:
Table 7 – Teacher score comparison
Subjects
Teachers who attended in-
service training - (μ)
scores
Teachers who did not
participate in in-service
training - (μ) scores
English scores 26.15 24.60
Maths scores 27.87 30.04
Table based on data from - (Nannyonjo 2007)
The results indicate that for English, teachers who receive training have students with higher
test scores as compared to those who have not received training. However, for mathematics,
the results are reversed; teachers who have not received any in-service training in the last
three years have higher pupil mathematics scores compared to those who have received
training. Nannyonjo (2007) further reports that positive test scores in English and negative
scores in mathematics are significant. The study outlines that the effect of the in-service
training for mathematics was adverse as it might have lacked focus on the improvement of
pedagogical skills or would not have been linked to the new curriculum (Nannyonjo, 2007).
Abogan (2013), analysing the RTE indicators, finds that teacher training has a positive
correlation with student learning outcomes, especially in higher standards than in lower
standards. The findings suggest that teachers need to be better equipped to teach children.
It seems that it is difficult to determine the effect of in-service training on student learning
and achievement, due to the lack of substantial evidence in this area. However, there is
some evidence that the quality of teachers engaged in training programmes and the type of
training intervention are likely to impact student outcomes positively.

56
2.7.3 Teacher incentives and salaries
Imberman (2015) presents evidence from India and Kenya on teacher incentives, and
reports that the ‘knowledge of teacher wages impacting student outcomes in developing
countries is far more limited’ (Imberman 2015, p. 7). Indian evidence includes a study by
Muralidharan and Sundraraman (2011), who study the effect of pay incentives on student
outcomes in the government schools of Andhra Pradesh.
In the first stage, the treatment group was provided with an incentive based on the mean
achievement of students in language and mathematics. Following their intervention, schools,
where teachers received incentives,15 saw an improvement in test scores by 0.27 standard
deviation (SD) and 0.17 SD. Apart from that, students also perform well in other subjects
including science and social studies, indicating a positive spillover effect of the experiment.
In the second stage, Muralidharan and Sundraraman (2011) experimented with ‘individual’
and ‘group incentives’, which reveal that students scored better in language and maths in the
schools which received individual incentives. However, the differences are not statistically
significant (Imberman, 2015).
Glewwe and Kremer (2010), in their experiment in Kenya, award incentives to the schools
that have the best average student scores and the highest average increases in student test
scores. They report that financial awards encourage teachers to teach for the tests, resulting
in a short-term improvement in learning rather than a long-term one. Another interesting
finding from the study indicates that students’ outcomes are better in more critical tests as
compared to lower priority ones and also the gains in the tests fade after the end of the
intervention.
Harbison and Hanushek (1992), while evaluating teacher salaries over three years in the
second and fourth grade find a negligible but small effect on student achievement by raising
remuneration. At grade four level they find that a 35 percent rise in the mean average salary
is associated with a gain of 1.5 points in mathematics test scores. The results are not very
different at the grade two level as well, although the effect of teacher remuneration is
positive and statistically significant across the years. However, due to the small effects they
conclude;
15 Teachers, were given a 3% rise to their annual wages, in case of improved student by administering internal
and external tests

57
“Salaries themselves apparently ignore considerable variation in teacher
quality.... increasing teachers' pay indiscriminately, by itself and without
regard to their other characteristics, will not meaningfully enhance student
achievement” (Harbison and Hanushek 1992, p.109).
Kingdon and Teal (2010) attempt to find the relationship between student outcomes and
teacher salaries from private schools in India. They study teachers who join the unions and
receive better pay as compared to teachers who are not union members.
Their study confirms that student achievement is strongly reduced when teachers receive
higher pay after joining the unions.
Ree et al. (2015) report no changes in test outcomes of children in Indonesian schools when
teacher salaries are doubled permanently from the existing scales. They report a rise in
satisfaction levels, but income raises fail to yield positive effects on student achievement
(Mbiti, 2016; Ree et al., 2015). Similarly, in Gambia, Pugatch and Schroeder (2014) report
that when teachers’ income is raised by 30-40% in rural areas, there is no improvement in
average test scores. However, their research indicates that salary raises did result in
increases in the performance of high-attaining students.
The current evidence to some extent does indicate that higher wages and incentives are
unlikely to impact student outcomes positively. It is also unclear whether changes to wages
or incentive structure is capable of producing long-term and sustained effects on student
learning. In conclusion, teacher remuneration is a problematic element capable of improving
the quality of learning but using it to increase test scores should be considered with caution.
2.7.4 Teachers experience
Teacher experience is also one of the crucial traits that need to be examined for its impact
on student outcomes. Analysing 151 studies, Hanushek (2015) finds that nearly 1/3rd of the
studies (29%) indicate a positive correlation between teacher experience and student
achievement, while 71% of the studies are statistically insignificant and altogether negative.
Leclercq (2005) also finds a positive association between experience and student outcomes,
but the findings are advised to be taken with caution as the effect is non-linear. Furthermore,
elaborating the non-linear impact, Leclercq observes that positive and significant coefficients
are only observed in the first few years of the teacher’s experience and the effect seems to
dissipate with time.
Govinda and Varghese (1993) also found that teachers, with an experience range of 5–10
years were capable of positively influence student learning, whereas those with more than

58
10 or 15 years were less effective in conducting classroom transaction unless they received
training. Referring to their findings, they believe that:
“With age, the teachers continue to maintain the same style and pedagogical
practices. In the absence of in-service training programmes to upgrade their
pedagogical skills, they become less effective”– (Govinda and Varghese
1993, p. 255).
Nannyonjo (2007), while determining the association between student achievement and
teacher experience, finds that test scores in mathematics and English plateau after five
years and begin to decline after ten years. For instance, his study in Uganda shows that
mean test scores in mathematics are 29.34 for teachers with 6-10 years of experience and
26.71 for teachers with more than ten years of experience.
Table 8 - Teaching Experience, Mean English and Mathematics Scores
Teacher’s experience
% of students (English teacher) N=3570
Mean English Score
% of students (Maths) N=3574
Mean Maths Score
<1 year 9.9 21.14 10.8 25.36 1-5 years 38.8 26.94 38.6 27.74 6-10 years 27.2 26.46 31.3 29.34 More than 10 years 29.2 21.98 19.3 26.71
Test scores in mathematics and English are found to be different at 5% significant level.
Findings by Nannyonjo (2007) are consistent with those of Govinda and Varghese (1993)
and Leclercq (2005). Outlining the decline in student achievement with experience,
Nannyonjo (2007) states that:
“It is possible that teachers get tired of teaching or do not get new skills as
changes take place in education..…The results of this study call into
question the widely held view that employing more experienced teachers
improves pupil performance. It may also call for a more clear
understanding of what contributes to continued teacher effectiveness, or
what leads to reduced teacher effectiveness over time” – (Nannyonjo
2007, p. 46).
An interesting insight relevant to the developing world can be found in slightly less recent
research, undertaken by Schiefelbein and Simmons (1981), which could be relevant in
today’s context. The research examines 19 studies of which nearly 63% produce
insignificant results when teacher experience is regressed on student achievement.

59
However, most studies from Asia and Africa are found to be significant, leading to indicate
that the length of teaching experience is probably associated with cultural traditions. Their
research demonstrates that good supervisors tend to share their positive teaching
experiences with their subordinates. They hypothesise that the experience of rural teachers
is more likely to have an impact on student achievement as rural teachers are more
frequently in contact with their supervisors compared to their urban peers.
This could still be applicable in the Indian context where close to 1.3 million schools are still
located in the rural area, where experienced teachers could influence children’s learning
(DISE, 2016).
From the works reviewed above, it can be concluded with some certainty that teachers
within the experience range of 5-10 years are likely to impact student outcomes positively.
However, teaching experience must be supported with appropriate in-service teacher
training to maintain the positive impact.
2.7.5 Nature of teachers contract
Various parts of the developing are under increasing pressure to improve the quality of
learning in schools. However, given constrained educational budgets and limited financial
bandwidth, governments are embracing creative ways to find solutions to problems
surrounding teaching. One such way is by deploying contract teachers, who have been
increasingly used in Africa, South Asia and Latin America to solve the problem. Contract
teachers, often hired at a fraction of the cost, as compared to the civil teachers with the aim
of achieving equity and efficiency.
Kingdon et al. (2013) review 15 studies which use a combination of techniques to determine
the effect of contract teachers on learning outcomes. The meta-study concludes that
contract teachers are in general more effective in improving student outcomes than regular
teachers (Kingdon et al., 2013). However, the authors of the study are quick to caution that
the findings are entirely context-specific.
Goyal and Pandey (2011) find that contract teachers usually exert more effort compared to
permanent teachers and high efforts by contract teachers are found to be positively
associated with student outcomes. Furthermore, contract teachers are found to be cost-
effective, with an average attendance of 75% as compared to 60% for those with permanent
tenure. Moreover, as reported by Kremer et al. (2005), a 10% increase in teacher absence
results in a 1.8% increase in students’ absence and a reduction of 0.02 SDs in test scores.

60
Banerjee et al. (2007) show improvement in test scores by hiring young women without any
requisite teacher qualification or high salary. The RCT programme claims to have improved
the average test scores of all children in treatment schools by 0.14 standard deviation in the
first year and 0.28 in the second year, relative to comparison schools. The young women
hired in the treatment schools were not qualified as per the RTE norms, nor were they paid
salaries as prescribed by the RTE (Banerjee et al., 2005).
In a different, contrasting study, Vegas and De Laat (2003) report negative findings from
Togo. They find that teachers with permanent and regular contracts outperform teachers
with temporary contracts and outline that the better performance of permanent teachers is
plausible due to their higher level of experience as compared to contract teachers. A
UNESCO (2015) report, on the contrary, finds no difference in overall learning outcomes
when students are taught by a regular teacher or a contract teacher. A majority of studies do
indicate that contract teachers can efficiently raise learning outcomes for children. However,
such research must be interpreted with caution due to region specificity.
2.7.6 Pupil-teacher ratios
Pupil-teacher ratios (PTR) are known to play a crucial role in the way that children learn in
the classroom, which in turn can impact outcomes (Koc & Celik, 2010; Chetty et al., 2011;
Hanushek, 2003; Kremer & Holla; 2009). Koc and Celik (2010) study the correlation between
PTR and student achievement in Turkey and find a negative correlation, indicating that
higher class sizes may represent a barrier to raising learning outcomes.
In advanced, industrialised nations such as the United States, Chetty et al. (2011) find that
reducing class sizes is likely to improve labour market outcomes. Research in Nigeria by
Ajani and Akinyele (2014) identifies a significant positive relationship between PTR and
student achievement in maths in the elementary grades. They reveal that teachers are
capable of providing more attention if there are fewer children in the classroom. Moreover,
due to lower class sizes, teachers can focus on weaker students and provide them with
more academic inputs to improve their outcomes. Even at the secondary levels, smaller
class sizes are instrumental in reducing the attainment gap in reading and science (Ajani &
Akinyele, 2014; Bayo; 2005).
On the other hand, Hanushek (2003), while analysing the distributed effect of PTR, finds an
equal number of studies that have a significant, positive and negative impact on student
outcomes, based on 376 production function estimates.
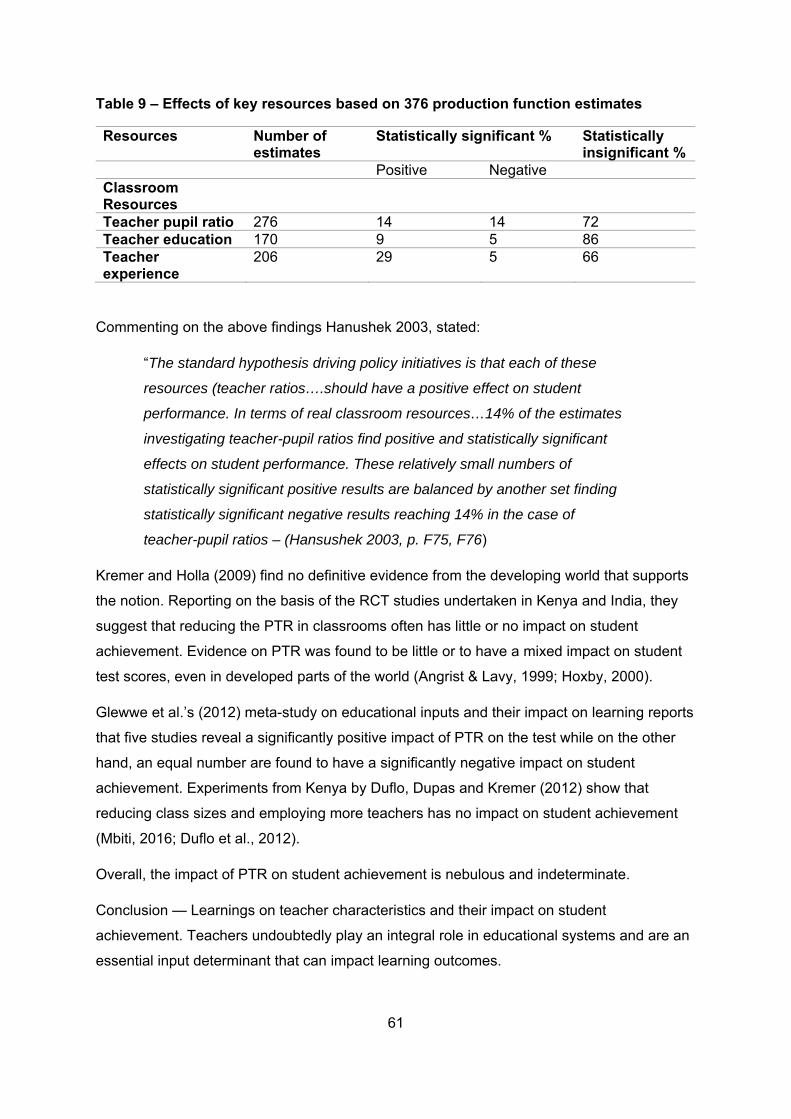
61
Table 9 – Effects of key resources based on 376 production function estimates
Resources Number of estimates
Statistically significant % Statistically insignificant %
Positive Negative Classroom Resources
Teacher pupil ratio 276 14 14 72 Teacher education 170 9 5 86 Teacher experience
206 29 5 66
Commenting on the above findings Hanushek 2003, stated:
“The standard hypothesis driving policy initiatives is that each of these
resources (teacher ratios….should have a positive effect on student
performance. In terms of real classroom resources…14% of the estimates
investigating teacher-pupil ratios find positive and statistically significant
effects on student performance. These relatively small numbers of
statistically significant positive results are balanced by another set finding
statistically significant negative results reaching 14% in the case of
teacher-pupil ratios – (Hansushek 2003, p. F75, F76)
Kremer and Holla (2009) find no definitive evidence from the developing world that supports
the notion. Reporting on the basis of the RCT studies undertaken in Kenya and India, they
suggest that reducing the PTR in classrooms often has little or no impact on student
achievement. Evidence on PTR was found to be little or to have a mixed impact on student
test scores, even in developed parts of the world (Angrist & Lavy, 1999; Hoxby, 2000).
Glewwe et al.’s (2012) meta-study on educational inputs and their impact on learning reports
that five studies reveal a significantly positive impact of PTR on the test while on the other
hand, an equal number are found to have a significantly negative impact on student
achievement. Experiments from Kenya by Duflo, Dupas and Kremer (2012) show that
reducing class sizes and employing more teachers has no impact on student achievement
(Mbiti, 2016; Duflo et al., 2012).
Overall, the impact of PTR on student achievement is nebulous and indeterminate.
Conclusion — Learnings on teacher characteristics and their impact on student
achievement. Teachers undoubtedly play an integral role in educational systems and are an
essential input determinant that can impact learning outcomes.

62
The following conclusions are drawn from the preceding literature review on the various
factors associated with teachers.
Education qualifications and subject competency – Through the available literature, it is
difficult to ascertain if general teacher qualifications are of any help in improving student
outcomes. However, subject specialisation to improve teachers’ skills and competencies
does help to improve efficiency in the classroom, thereby leading to better student
achievement.
In-service training – Teacher training programmes do not seem to impact student
learning outcomes. However, some studies do indicate that in-service training assists in
raising learning outcomes, provided that the quality of teachers participating in the
training is better.
Teacher remuneration – Most studies indicate a negative relationship between teacher
remuneration and student test outcomes.
Teacher experience – The evidence on teacher experience is quite mixed. The available
literature indicates that teachers with an experience range of 5-10 years can impact
student learning outcomes positively. However, beyond ten years, efficiency begins to
decline significantly and is hardly likely to have any impact on student learning
outcomes.
Nature of teacher contract – Existing literature on teachers’ contract is quite limited, and
most literature does indicate a positive co-relation between temporary or contract
teachers and their ability to raise learning outcomes. Current, supporting studies are
quite region specific, and hence, they need to be interpreted with caution when applied
to a broader context or at a policy level.
Pupil-teacher ratio – The impact of PTR does seem to be positive on student learning
outcomes, but further research is required in this area to support any concrete opinion.
Summary tables 10 –14 represent the synopsis of the study and the evidence found across
these studies. The tables also provide a conclusive decision on the various indicators based
on the evidence presented.

63
Table 10 – Summary table for teacher qualifications & subject competency on student outcomes
Statistically significant Statistically not significant
Conclusion on indicator Teacher Indicator Study
Author/Author’s +ve Impact -ve Impact
Educational qualifications and subject competency
Buddin and Zamarro (2009)
Teachers with advanced degrees are unlikely to impact the test scores positively, or sometimes, they are also known to have adverse effects on reading and mathematics
Difficult to ascertain, if general teacher training has any impact on student learning outcome. Specialised and subject teacher training seems to have some positive impact on student achievement.
Coe, et al. (2014) Negligible and insignificant relationship between academic qualification and student achievement
Sadler et al. (2013) Modest, positive relationship between teachers specialised subject knowledge and student learning outcomes
Evans and Popova (2015)
Positive impact due to teacher’s subject knowledge on a specific subject
Zuzovsky (2003) Teachers with advanced degree in mathematics and science are capable of influencing test scores positively

64
Table 11 – Summary table for the impact of teacher training on student learning outcomes
Statistically significant Statistically not significant
Conclusion on indicator Teacher
Indicator Study Author/Author’s
+ve Impact -ve Impact or no impact
Teacher
training (In-
service and
academic)
Meichen, et al. 2017
Teacher training programme in math did not affect achievement, and the study reported a negative impact on student outcomes
Generalised teacher training may not be beneficial to improve student learning, specialised teacher training and the type of training intervention may assist in raising learning outcomes.
Harbison and Hanushek (1992)
Negative impact on mathematics achievement, when, the national programme Logos’ and the ‘Curso de Qualificacao’ were evaluated
Evans and Popova (2015), Muralidharan & Sundararaman (2010)
Positive impact of specialised subject training on student outcomes, general teacher training may not have a strong impact on student outcomes
Nannyonjo 2007 Teacher training in languages improved student outcomes in language
Teacher training in mathematics had, an adverse effect on mathematics test scores
Abogan 2013 Teacher training impacts score positively, especially at elementary levels

65
Table 12 – Summary table for impact of teacher salaries on student learning outcomes
Statistically significant Statistically not significant
Conclusion on indicator Teacher
Indicator Study Author/Author’s
+ve Impact -ve Impact or no impact
Teacher
incentives and
salaries
Muralidharan and Sundraraman (2011)
Teacher incentives had a positive impact on student outcomes, when, teachers were given individual incentives, as compared to group incentives
Current evidence on financial incentives is negative and shows no or negative impact on student test outcomes
Glewwe and Kremer (2010),
Financial rewards to teachers assisted in improving scores in the short term, rather than in the longer run.
Kingdon and Teal (2010)
Negative impact, on student achievement, when teachers were paid higher compared to their regular incomes
Ree, et al. (2015) No change in student outcomes, when teacher salaries were, doubled
Gambia, Pugatch and Schroeder (2014)
No improvement in the average test scores, in the rural areas of Gambia, when teacher salaries were, raised

66
Table 13 - Summary table for impact of teacher experience on student learning outcomes
Statistically significant Statistically not significant
Conclusion on indicator Teacher
Indicator Study Author/Author’s
+ve Impact -ve Impact or no impact
Teacher Experience
Hanushek, (2015) – analysed 151 studies as a part of metanalysis
Nearly 1/3rd of the studies indicated a positive impact of teacher experience on student outcomes
More than 70 percent of the studies were found to have no impact or insignificant results of teacher experience on student outcomes
Teachers with an experience range of 5-10 years are capable of influencing student outcomes positively. However, any experience beyond ten years needs to be supplemented by teacher training to influence student achievement.
Leclercq (2005) Positive effect of teacher experience on student outcomes but. the effect fades away after a certain period of time
Nannyonjo (2007) Positive impact on student test scores for teachers with 5-10 years of experience, however, the achievement starts declining, for teachers with more than ten years of experience
Govinda and Varghese (1993)
Positive impact of teacher’s experience on student outcomes but, teachers with more than ten years of experience need to be skilled and trained to sustain learning outcomes

67
Table 14 – Summary table of teacher contract on student learning outcomes
Statistically significant Statistically not significant
Conclusion on indicator Teacher
Indicator Study Author/Author’s
+ve Impact -ve Impact or no impact
Nature of teacher contract
Kingdon et al. (2013)
Contract teachers are more effective in improving student outcomes than regular teachers.
Temporary teacher contract does seem to positively influence student learning outcomes. However, the findings need to be interpreted with caution, as they could be region specific.
UNESCO (2015) No impact on student outcomes, when taught by regular or contract teachers
Goyal and Pandey (2011)
Contract teachers usually exert more efforts compared to regular teachers and thus contract teachers are found to be more effective in raising student learning outcomes
Vegas and De Laat (2003)
Contract teachers are incapable of producing positive effects on student outcomes. Regular teachers are capable of performing better, due to more extended experience
Banerjee et al. (2007)
RCT’s find that employing teachers, without any formal qualifications, temporarily improved average test scores in schools
68
2.8 School Physical Characteristics
Despite the dearth of research concerning the impact of school characteristics or inputs,
specifically, associated with the RTE, a significant body of literature does summarise the
impact of general infrastructure in schools on learning outcomes. Studies of particular
interest, which primarily focused on facility aspects and looked at the state of learning
facilities in developing countries include; Abogan (2013), Adrogue and Orlicki (2013),
Adukia (2016), Cameiro (2015), Chakraborty and Jayaraman (2016), Coe et al. (2006),
Glewwe et al. (2012), Howie and Pate (2012), Mukerji and Walton (2012), Murillo and
Roman (2011), Muralidharan (2013), Kamijo et al.(2011), Kazianga et al. (2012), Tradeau
and Shephard (2008) and Walker (2011),.
This section discusses the following input-based components relating to school
characteristics. These characteristics include school buildings and facilities (electricity
provision, toilets, desks, tables, chairs, and computers), the inclusion of learning spaces
(libraries and laboratories), teaching-learning materials and school meal programmes.
2.8.1 School facilities and infrastructure
The schedule (Table 4) from the RTE act indicates that to some extent the government
regulations prioritise the physical environment over the learning inside the classroom. The
schedule makes it evident that there should be at least one classroom for every teacher, a
multi-purpose office and storeroom for the head teacher, safe and adequate drinking water
for all children, separate toilets for boys and girls, a playground and a boundary wall or
fencing. It also stipulates the minimum working hours for teachers in government and private
schools. The schedule also instructs schools to have libraries and play materials including
games and sports equipment.
Commenting on such a framework reports that it “considers schools as “factories” that
produce “learning” using various school and teacher characteristics as “inputs” (Glewwe et
al. 2012, p 5). Further, Glewwe has noted that such a framework uses the production
function approach, which argues that cognitive skills are an outcome of several different
factors (Glewwe et al. 2012). The impact of school infrastructure and pedagogical materials
on student achievement is quite mixed, so any conclusion derived should be treated with
caution.
Carneiro et al. (2015), in their research in Senegal, found that schools that invested
significantly in material and infrastructural improvements saw only minor gains in student
achievement, compared to ones which invested in raising the capability and capacity of
teachers and school leaders through training interventions (Carneiro, et al. 2015)

69
On the other hand, Muralidharan et al., using panel data, from Indian states found no
correlation between an improvement in village-level school infrastructure and enrolment. The
study also reported no relationship between village-level school infrastructure and student
test scores (Muralidharan, 2013).
Abogan (2013) uses regression estimates to conclude that improved infrastructure provision,
as recommended in the RTE Act is unlikely to produce positive results on short-term
education outcomes. He reports no significant effect on student outcomes and suggests that
it would be too early to expect any impact of the RTE’s investment on infrastructure
(Abogan, 2013).
Table 15- Input variables analysed relative to learning outcomes
Variable ASER-Paisa dataset Commentary Infrastructure No significant effect Midday meals No significant effect Learning materials ++ Moderately positive outcomes
(Abogan 2013, 11)
Another critical factor is toilet provision. Adukia (2017) explores the relationship between
school sanitation infrastructure and student educational outcomes, using a difference-in-
difference empirical strategy. The study used a national level government database for
identifying schools with and without sanitation infrastructure. Adukia (2017) finds that the
presence and construction of gender-specific toilets and sanitation facilities raise enrolment
in schools, especially that of pubescent girls. However, constructing new toilets in schools
does not affect the test scores of students (Adukia, 2017).
Mukerji and Walton (2012) conclude that although limited evidence is available in this area,
the existing literature indicates that students enrolled in schools endowed with better
infrastructure do not seem to have better learning outcomes (Mukerji & Walton, 2012). A
Brazilian project analysed by Harbison and Hanushek (1992) by various infrastructure
facilities including sanitary facilities, offices, classroom space, electricity, water, desks and
chairs found that the presence of facilities can potentially raise student test scores by four
basis points.
Of all the studies, the most comprehensive is that of Glewwe et al. (2012) who attempt to
review the literature over 20 years. The meta-review examines 79 studies and further
classifies 43 papers as high-quality studies due to their rigour. The 43 studies either use
RCTs (randomised controlled trials), DD (difference-in-difference) or RDD (regression
discontinuity design) for estimating variables.

70
The remaining 36 papers rely on OLS (ordinary least squares) methodology (Glewwe et al.,
2012). The table below provides a summary of the findings:
Table 16 - Summary table reflecting the impact of infrastructure
Variable Overall studies examined - (79)
High-quality studies - (43)
Studies on school infrastructure
Status Studies on school infrastructure
Status
Desks/Tables/Chairs 11 Almost all positive
4 All positive
Computers/Games 8 Mostly positive 6 Ambiguous Electricity 6 Mostly positive 3 No
significant effect
Blackboard 6 Mostly positive 3 Ambiguous Roof/Wall floor 4 Mostly positive 4 Mostly
positive
Studies using sophisticated designs such as RCT, DD and RDD find that schools with better
quality desk, tables and chairs, roof, wall and floor show improved student learning.
Rigorous reviews indicate that the impact of resources like computers, games and
blackboards on student outcomes is vague (Glewwe et al., 2012).
Willms and Somers (2001) also report that the size of a library is capable of influencing test
scores. They measure size in two categories: less than or more than one thousand copies.
They conclude that libraries with a collection of 1000 books or more are capable of
increasing test scores by 12 points in reading and mathematics. Murillo and Roman (2011),
in their study conducted across 15 Latin American countries, find a significant positive
relationship between the number of books and student academic performance in most of the
countries.
Lonsdale (2003) reviews several studies conducted over 12 years and finds that school
libraries have a positive impact on student test scores. Some of the key findings of the
review are listed below:
Library facilities with adequate staff and resources can lead to better student
achievement, regardless of a student’s socio-economic background
The quality of book collection and usage of the library have a significant effect on
student test scores

71
Collaborative relationship between teachers and librarians has a positive influence
on student achievement
Libraries are capable of inducing self-esteem, confidence, independence and sense
of responsibility in students with regards to their learning and thus allow them to
learn better which positively influences their achievement
To conclude, firstly, it is difficult to determine the impact of school infrastructure on learning
outcomes. Secondly, it is clear that maintenance and usage of infrastructure are critical to
derive maximum benefit out of existing infrastructure. Finally, investments in infrastructure
yield return over an extended period as compared to other interventions.
2.8.2 School meal programme
School feeding programme is another component of the RTE schedule that mandates the
provision of a kitchen for feeding pupils in the school. A vast body of research indicates that
school feeding programmes can lead to two main advantages. First, they motivate children
to be present in the school thus impacting enrolment and attendance (Jomaa, McDonnell &
Probart 2011; Kaur & Bansal 2016; Chakraborty & Jayaraman 2016). Second, children from
the most impoverished families receive food for no cost, thus helping them to alleviate
hunger, leading to improved health and better cognitive outcomes (Chakraborty &
Jayaraman 2016; Adrogue & Orlicki 2013; Kazianga et al., 2012).
Chakraborty and Jayaraman (2016) find that provision of midday meals raises learning
achievement, albeit at a decreasing rate. Using OLS estimates, they find that schools
providing mid-day meals up to five years have 18% higher reading test scores and 9%
increased maths test scores, compared to those which offer mid-day meals for less than a
year. The rise in test scores is statistically significant for both the subjects (Chakraborty &
Jayaraman, 2016; Jayaraman, Simroth & Veriocurt 2010).
Others including McEwan (2013), Adrogue and Orlicki (2013), Tan et al. (1999) and
Kazianga et al. (2012) also found a positive impact of school feeding programmes on test
scores. McEwan (2013) discovered insignificant but positive language test scores amongst
grade four children in Chile. Adrogue and Orlicki (2013) observed statistically insignificant
positive test scores in language, and significant positive test scores in mathematics,
amongst grade three children In the Philippines, school feeding programmes were found to
significantly impact test scores in maths by (0.25 σX) and (0.16 σX) in language (Tan et al.
1999).
72
Glewwe et al. (2012) conducted a meta-review of 79 studies, observing the impact of school
feeding on student outcome. They produce 13 distinct estimates of which seven are
negative, four are significantly negative, and six are positive and statistically significant.
On reviewing 79 studies, of which 43 were of a higher standard, Glewwe recognises that
“the evidence does not provide strong support … as a means to raise student learning”
(Glewwe et al. 2012, p25).
In conclusion, school feeding programmes do seem to produce positive effects on learning
outcomes to some extent. However, more evidence is required to understand the impact of
substitution effects on student achievement due to the provision of free school meals.
2.8.3 Textbooks and teaching-learning materials (TLM)
The RTE’s schedule does not quite clearly outline the norm for textbooks and other teaching-
learning material, and the mandate seems to be quite vague and muddled. The schedule
instructs schools to provide textbooks and teaching-learning materials ‘as required by every
classroom’ (OPEPA, 2016)
Research in Sub-Saharan Africa by Michaelowa (2001) across five nations mainly speaking
the French language – Burkina Faso, Cameroon, Côte d’Ivoire, Madagascar and Senegal–,
finds a positive impact on French and mathematics in standardised tests due to the
availability of textbooks (Yu, 2007; Michaelowa, 2001). Yu (2007) clarifies that the provision
of textbooks in schools and educational institutions may not be sufficient. His research
further suggests that textbooks and teaching-learning materials should be utilised and
efficiently deployed, which can subsequently raise engagement levels and lead to learning
outcomes. Sabharwal, Evans and Marshak (2014), in research conducted in Sierra Leone,
show that when textbooks are provided freely, they lay unused and produce minimal or no
impact on student learning in the given context (Sabarwal, Evans & Marshak, 2014).
A less recent study from Govinda and Varghese (1993) find a considerable difference in the
test scores of children in mathematics and Hindi in schools where all students possess
textbooks, those where most children have textbooks and classes where children have no
textbooks. They further report that teaching aids assist in improving mean achievement
scores. However, their conclusions are similar to Yu, (2007) and Sabharwal, Evans and
Marshak, (2014). They recommend that teaching aids need to be utilised efficiently to raise
test scores; mere provision of textbooks and learning materials may not be sufficient.

73
A recent report by the World Bank (2018) reviews several studies across the globe and finds
that raising the material provided in schools may not improve learning interactions in the
classroom.
Experiments from Kenya show that textbooks have no impact on learning outcomes as the
students are unable to understand the language in the textbooks. Similarly, in Colombia,
technology aids fail to produce any impact on learning achievement as they merged poorly
with the curriculum (Barrera-Osorio et al., 2009; Glewwe et al., 2009; Ganimian & Murnane,
2016). The World Bank (2018) report reiterates the historical findings:
“It seems obvious that resources have to be used to have an impact, but
many interventions that provide inputs fail exactly because insufficient
thought is given to how resources will be used. Infrastructure and other
inputs are essential, but they work only when they serve the relationship
between teaching and learning” – (World Bank, 2018, p. 148)
Overall it is clear from the above literature reviewed that if textbooks and other TLM in
schools are capable of improving learning outcomes. However, there seems to be some
positive effect when, textbooks and other resources, are efficiently used by teachers.
Investments in resources that lie idle in classrooms introduced merely as a part of a
legislative regime are highly unlikely to yield any results in terms of academic achievements.
2.8.4 Presence of playgrounds for physical activities
The RTE Act demands that every school have a playground and teaching-learning materials
for games to be made available to students. The logic behind this is to ensure that
educational institutions undertake sports and physical exercises. Schools are always under
pressure to improve academic achievement, and this has forced schools to devote less time
and resources towards activities that enhance physical health. Some research in this context
does indicate that undertaking physical activity in schools can lead to better cognitive
development and academic achievement (Howie & Pate 2012; Active Living Research,
2015) and lower physical activity may lead to deteriorated learning outcomes (Roberts et al.,
2010). Carlson et al. (2008) show that female students who devote an hour to five hours on
physical education per week performed better in mathematics and language, as compared to
those who spent less than ½ an hour on P.E.
Kamijo et al. (2011) use an RCT to show that children aged 7-9 years who participated in a
physical activity programme performed better in activities related to working memory as well
as cognitive tasks.

74
Tradeau and Shephard (2008) also report strong correlations between academic
achievement and participation in sports and extracurricular activities (Lewis, 2004; Trudeau
& Shephard, 2008). Using quasi-experimental data, they find the following relationship:
“Data from quasi-experimental studies find support in mechanistic
experiments on cognitive function, pointing to a positive relationship
between physical activity and intellectual performance.” – (Trudeau and
Shephard 2008, p.1)
On the other hand, Coe et al. (2006) report no improvement in standardised test scores in
sixth-grade pupils after a semester of arduous physical activity. Similarly, Dwyer et al.
(1983), in an experimental study, find no effect on student outcomes due to physical activity.
Sallis et al. (1999) report no improvement in academic performance when comparing an
active group of students to a less active group. Even in the case of Kamijo et al. (2011)
where the control group was found to be better in cognitive tasks, several participants opted
out of the cognitive tasks, and therefore, it is recommended to interpret this research with
caution.
Evidence, from several cross-section research publications and RCTs do indicate that ‘fit and
healthy’ children demonstrate better academic achievement. However, proof that strenuous
physical activity and involvement in sports benefits children’s academic activities is still
lacking. Thus the relation between non-academic activities such as sports and games needs
to be further explored before drawing any concrete conclusion.
A summary indicating how different input factors can impact achievement is shown in tables
17 – 20.

75
Table 17 – Presence of a library and its impact on student learning outcomes
Statistically significant Statistically not significant
Conclusion on indicator Input
indicators Study Author/Author’s
+ve Impact -ve Impact or no impact
Library Murillo and Roman (2011)
Positive relationship between the number of books and student academic performance in research undertaken, in 15 Latin American countries
Size of the library, quality of collection can influence student achievement. Mere presence of a library in a school may not be sufficient to raise student outcomes.
Willms and Somers (2001)
Size of a library in a school is capable of influencing the student outcomes
Lonsdale (2003) Found positive impact between libraries and student test scores, however, lists the factors associated with libraries capable of influencing academic outcomes:
Quality of book collection
Collaborative relationship between library staff, teachers and students
Capability of libraries to induce self-esteem, confidence, independence and sense of responsibility in students with regards to their learning

76
Table 18 - Provision of mid-day meals and impact on student achievement
Statistically significant Statistically not significant
Conclusion on indicator Input
indicators Study Author/Author’s
+ve Impact -ve Impact or no impact
Mid-day meals Chakraborty and Jayaraman (2016)
Finds that schools providing mid-day meals up to five years, have 18% higher reading test scores, and 9% increased maths test scores, as compared to those schools which were providing mid-day meals for less than a year
School meals programme does seem to produce positive effects on learning outcomes to some extent.
Adrogue and Orlicki (2013)
Observed, positive relationship between school meals and mathematics test scores
Observed, positive relationship, between school meals and language scores
Glewwe and Muralidharan (2015)
School feeding programme found to positively impact test scores in maths by (0.25 σX) and (0.16 σX) in language

77
Table 19 - Availability of resources and its effect on learning outcomes
Statistically significant Statistically not significant
Conclusion on indicator Input
indicators Study Author/Author’s
+ve Impact -ve Impact or no impact
Textbooks and teaching-learning materials
Michaelowa (2001) Yu 2007
Positive impact on French and mathematics in standardised tests due to the availability of textbooks
Difficult to ascertain the impact of textbooks and teaching-learning material on student outcomes.
Sabharwal, Evans and Marshak (2014)
Minimal or no impact on student learning, when textbooks were provided but remained unused in schools
Govinda and Varghese (1993)
Children with textbooks were found to have better scores in Hindi and Mathematics. Teaching aids further reported that teaching aids helped in improving the mean achievement scores
World Bank, (2018)
Reviewed studies from the developing world, found raising the material provision like textbooks and TLM in the schools may not improve learning interactions in the classroom
Barrera-Osorio et al., (2009); Glewwe et al., n (2009); Ganimian and Murnane, (2016)
Experiments from Kenya showed textbooks had no impact on learning outcomes. In Colombia, technology aids failed to produce any impact on learning achievement

78
Table 20 – Impact of playground for physical activities on student learning outcomes
Statistically significant Statistically not significant
Conclusion on indicator Input
indicators Study Author/Author’s
+ve Impact -ve Impact or no impact
Playgrounds for physical activities
Howie and Pate (2012); Active living research (2015)
Physical activity in schools leads to better cognitive development and academic achievement
Research indicates that fit and healthy children do tend to perform better academically. However, the potential of physical activities in schools, and its impact on student outcomes, remains indeterminate.
Carlson et al., (2008)
Female students, who spent an hour to five hours on physical education (P.E), performed better in mathematics and language
Kamijo et al., (2011)
Using RCT showed that children between 7 to 9 years, who participated in a physical activity programme performed better in activities related to working memory as well as cognitive tasks
Coe et al. (2006 Found no improvement in standardised test scores, in sixth-grade pupils after a semester of arduous physical activity
Sallis et al., (1999)
No improvement in scholastic or academic performance, when an active group of students was compared to a lesser active group

79
2.9 Conclusion
Sections 2.7 and 2.8 specifically focused on the different teacher, and school inputs that are
likely to affect student achievement – either positively, negatively, or if the effect of the input
is indeterminate. Other factors such as a student’s family background or socioeconomic
status, are also capable of influencing student outcomes. However, they are out of the scope
and purview of the research.
The summary tables (10 – 20) present the final results drawn from the literature review on
the various inputs discussed. The table consists of five columns; the first column lists the
name of the input. The second column denotes the author/authors of the study. The third
column reports if the study has a statistically negative or positive impact on student outcome,
while the fourth column indicates whether or not the study is statistically significant. The final
column describes the conclusion of the studies examined during the literature survey.
In the case of teacher inputs, the indicators found to be positively associated with student
achievement are teachers’ experience and the nature of teachers’ contract. However, the
literature also reveals that the length of teachers’ experience is critical in influencing student
outcomes. The effect of experience is limited to a certain length, after which in-service
training is required to retain the positive influence of teachers’ experience on student
learning outcomes. The verdict on remuneration, teacher qualifications and subject
competency remain indeterminate. Generalised teacher training is found to have no impact
on student learning. However, specialised training in subjects like mathematics and science
can assist in raising scores for respective subjects.
In the case of material inputs, school meal programmes seem to have a positive effect on
student achievement as they act as a lucrative incentive for children to attend school,
alleviating hunger, improving physical and mental stamina and ultimately leading to better
learning outcomes. It is difficult to ascertain the impact of textbooks and teaching-learning
material on student achievement, but some studies show positive effects, leading to an
improvement in test scores whenever they are used efficiently by teachers. In the case of
schools’ physical infrastructure, it is tough to determine the impact of every individual input
associated with the school due to two reasons. Firstly, the effect of infrastructure depends on
its use and maintenance. For instance, in the case of libraries, the size of the library and its
usage matters; merely stipulating a library in schools may not yield fruitful results for student
achievement. Secondly, investments in infrastructure generate positive outcomes over an
extended period; the prolonged duration combined with accounting complexities involves
depreciation which makes it challenging to estimate achievement effects caused by
infrastructure.

80
Most teacher and school inputs are, introduced in the schooling systems with an aim to
improve student achievement. The RTE as a regulatory measure focuses on several of
these inputs, however, misses a crucial link, i.e. the development of academic and cognitive
abilities. Brinkmann (2012), notes that individual sections of the Act do mention learning
processes. However, it does not form the core criteria of the Act, nor does it become an
integral component while securing recognition for a new school. Furthermore, she states that
act guarantees: “a right to schooling rather than a right to education. If followed in its entirety,
it will produce a schooled population, but not necessarily an educated citizenry” (Brinkman
2012, p. 104).
Conclusions drawn from the above literature survey for the various inputs will be used to
inform the research questions drawn at the beginning of the chapter:
Is there any relationship between student achievement and the RTE’s emphasis on
physical indicators?
Do the RTE teacher indicators listed in the RTE act and schedule have any impact
on learning outcomes?
Does following certain core guidelines from the RTE rigidly have any impact on
student test achievement?
Does following the RTE’s institutional academic indicators have an impact on student
achievement?
In correlation to the above questions, how do low-cost school owners view the RTE
regulations?
81
Chapter Three: Methodology
3.1 Introduction
This chapter focuses on exploring the context of educational research. It is imperative to
analyse distinct philosophical standpoints relating to social science research methods
proposed by various thinkers. Through this overview, I intend to examine the process of my
research which is constructing my knowledge and social reality, providing a firm, theoretical
foundation for my research. Understandably, ontological assumptions give rise to
epistemological assumptions; these, in turn, motivate methodological considerations,
enabling the creation of research instruments required for data collection (Irene, 2014)
Philosophical standpoints allow us to understand research methods as more than a mere
technical exercise. They assist us in understanding the world, as well as clarifying the
purposes of this understanding (Cohen et al., 2007)
The first three sections of the chapter explain the different paradigms associated with the
research, tracing tenets, critical thinkers and their influence. In the subsequent three
sections, I elaborate on the sampling methodology, instrument design and field operations of
my research. The final sections focus on ethical considerations and the validity and reliability
aspects of the study undertaken in Delhi.
3.2 Research paradigms and philosophical stance
Before beginning the research, understanding the research paradigm is of paramount
importance. According to Scotland (2012), ‘paradigm’ encompasses the following: ’ontology,
epistemology, methodology, and, methods (Scotland, 2012, p9). Each of these terminologies
is explained below.
Researchers need to understand the mechanics of how reality is constructed. ‘Ontology’ is
the study of the existence of a phenomenon (Crotty, 1998; Scotland, 2012). The etymology
of the term is derived from the Greek present participle ´ ων/on/ which means ‘to exist’
(Irene, 2014). Ontology further can be split into two basic positions – objectivism and
‘constructionism’ (Bryman, 2004).
‘Epistemology’ refers to the foundation of existing or acquired knowledge. The knowledge
could be concrete, factual or could be more porous or subjective, obtained through
experience and insight (Cohen et al., 2006; Irene, 2014). Origins of this term share the same
roots as ontology, specifically the Greek verb ‘episteme’ meaning to understand a concept
and grasp it through experiencing phenomena or processes (Irene, 2014). Furthermore,
Irene (2014) outlines that epistemology views the quest of knowledge in two dimensions.

82
First, that which considers knowledge to be ‘objective and tangible’, termed as ‘positivism’
(Irene, 2014). Secondly, any knowledge which advocates understanding the subjective world
of human experience is termed as ‘constructivism’ (Cohen, Manion & Morrison, 2007)
Crotty (1998) defines methodology as a ‘plan of action’ or the rationale behind the selection
of a plan to use a particular method. The process of answering questions about ‘why, what,
where and how’ the data will be collected termed as ‘methodology’ (Scotland, 2012; Guba &
Lincon, 1994; Crotty, 1998). The importance of paradigms in research is crucial as every
research method can be linked with epistemology and an ontological position. The
differences in ontological and epistemological stances often lead researchers to employ
different research methods. However, the aim may be identical (Grix, 2004; Scotland, 2012)
The current research follows a ‘pragmatist’ approach, focusing on the solutions to problems
which allows the flexibility to choose the method suited to attain the research objectives.
Moreover, it provides the flexibility to use multiple ways to address a problem (Creswell,
2003; Rossman & Wilson, 1985). Tashakkori and Teddlie (1998) recommend that this
approach justify the use of mixed methods as it lays the foundation to use ‘pluralistic
approaches’ to resolve a problem (Creswell, 2003.
3.3 Epistemology
Stuart and Little (2007) describe epistemology as the study of the ‘components, sources,
limits and the justification of knowledge’. Epistemology, according to the Sandford dictionary
(2009) is defined as the process of ‘creating and disseminating’ knowledge in particular
areas of enquiry
Carter and Little (2007) describe three components capable of influencing an
epistemological stance. These include interactivity, the data gathering process and finally the
communication and dissemination of obtained knowledge. Interactivity determines the
relationship between the researcher and the participants which can be viewed in two ways.
First, the objective view in which a researcher employs scientific tools for the collection of
data in a way that avoids bias, refraining from obtaining any knowledge likely to impact the
study and assessing the subjects through an independent approach. The second view is the
subjective view which allows the researcher to create knowledge in coherence with his/her
subjects. Interaction is essentially the mode of communication between the researcher and
the subjects, allowing for a multi-dimensional view of the research.
Second, an epistemological stance indeed determines how the data is collected, validated,
cleaned and analysed (Angen, 2000). The objective position allows researchers to collect
responses through questionnaires and to triangulate and interpret them in a predefined

83
fashion, suiting the requirements of the research. The subjective view allows the researcher
to understand the reaction and experiences of his/her subjects by linking with the process
(Carter & Little, 2007).
Lastly, an epistemological stance also determines how a researcher shares findings with the
outside world (Mantzoukas, 2004). For instance, from a subjectivist viewpoint, a researcher
becomes part of the story, allowing for successes and failures encountered during the
research process (Carter & Little, 2007). However, from an objective standpoint, the results
are summarised and discussed without the interference of emotions or experiences
encountered during the data gathering process.
In the current study, responses were sought from participants and subjects through a semi-
structured questionnaire. Data was gathered from various sources, but the researcher
remained an independent observer without interfering so that the subjects could report their
beliefs and attitudes without bias. Collection of data from multiple sources allowed for
triangulation. Data gathered from the field through the semi-structured questionnaires16 were
analysed with sophisticated regression models, and the findings are presented most
accurately. The narrative data is presented in the form of vignettes, maintaining the
anonymity of subjects participating in the study.
3.4 Influence of the pragmatist paradigm on the current research
The ’pragmatist’ paradigm influences the current research as it provides flexibility to
integrate the subjective and objective view in research. It aims to provide a bridge with the
binary divide between positivist and ‘interpretivist’ traditions. The recognition of the dual
approach makes it relatively unique to the social sciences. According to Cresswell (2003),
pragmatism does not restrict itself to any particular philosophical stance and thus allows
researchers to draw the appropriate assumptions, either from the qualitative or quantitative
domain. The approach further allows a ‘freedom of choice’ (Cresswell, 2003 p12) and thus
researchers are at liberty to adopt methods, processes and techniques that satisfy their
objectives. Moreover, it permits to look at several approaches, across the different stages of
the research from data gathering to analysis.
Using a pragmatic approach allows for analysis of both quantitative and qualitative data,
advocating the selection of whichever approach is optimum for resolving a problem.
16 See appendix 5, 6 7 and 8 for student, principal and teacher questionnaires.

84
Applying the pragmatist view to the current research which aims to understand the impact of
a four-year educational law in India, this paradigm provides the flexibility to choose from
quantitative or qualitative methods owing to the complexity of the study.
Using pragmatism to follow the quantitative line of enquiry assisted in understanding the
causal links that are necessary for prediction and control as indicated by Cohen, (2007). The
proposed piece of research aims to observe the impact of compliance on educational
regulation which seeks to improve student learning outcomes by implementing various
drivers across schools. Private schools failing to comply with the Act are threatened or
closed down citing clauses of non-compliance which in turn is forcing children out of school.
The quantitative method of enquiry observed the impact on learning outcomes in private
schools of drivers of the RTE Act (infrastructure, student-teacher ratio, student enrolment,
school management committees, accountability mechanisms and inspections). It also
enabled a deeper understanding of social phenomena (household status) and psychological
phenomena incentives to teachers and students, curricula, assessments and pedagogical
approach.
However, given the rigour of the framework, I understand the limits of the approach because
human affairs, including teaching and learning, are inevitably complicated. Equally,
quantitative methods have a major limitation in that their application is restricted to
phenomena that are stable and uniform across time, space and context. This may not be
consistently true of the human world of teaching and learning (Gage, 2014). The pragmatist
paradigm, as discussed earlier, focuses on methods and problems rather than associating
with a philosophical stance, unlike other paradigms.
To, overcome the limitations of the quantitative approach, pragmatism incorporates the
qualitative mode of enquiry which is characterised by a concern for the individual. Qualitative
methods enable understanding of the subjective world of human experience (Cohen et al.,
2007) and the pragmatist stance adds rigour to the subject of investigation as the aim is to
understand the perspective of the subject of inquiry.
Using the pragmatist paradigm in the current research allowed me the flexibility to gather the
data not only through structured instruments but also through experiences, observations,
discussions and one-to-one interviews with school heads and owners. For instance, school
owners revealed their experience in dealing with the threat of closure and how it could
impact the lives of students and teachers associated with the school. This could not have
been captured through quantitative methods.

85
3.5 Mixed methods – the use of quantitative and qualitative techniques
3.5.1 Empirical influence and Strategy
The mixed methodology employed in this current research was discussed at length during
the 1980s and 90s. Subsequently, these varying research designs came to be known as
‘contrastive approaches’ in research methodology circles. There was a tension between the
humanistic, subject-centered approach aiming to capture participants’ subjective
experiences and the hard, statistical approach of quantitative analysis (Talja, 1999).
A similar situation is confronted in the current research as the understanding the RTE Act
and its implication on student learning, and school closures require an in-depth study of its
quantitative drivers. However, to gain a thorough understanding of subjects and their current
social situations, experiences, perspectives and histories, a qualitative approach is equally
necessary. The thesis, hence, followed a mixed method strategy, employing both qualitative
and quantitative techniques.
According to Creswell and Clark (2011), a mixed method strategy allows combining the
quantitative and qualitative line of enquiry. The former includes techniques like surveys and
use of a semi-structured questionnaire to gather numerical data, while the latter includes
one-to-one in-depth interviews and focus group discussions to gain an understanding of the
research question in focus.
Johnson et al. (2007) define mixed methods as:
“Mixed methods research is a systematic integration of quantitative and qualitative
methods in a single study for purposes of obtaining a fuller picture and deeper
understanding of a phenomenon. Mixed methods can be integrated in such a way
that qualitative and quantitative methods retain their original structures and
procedures (pure form mixed method”– (Johnson et al., 2007, p. 119)
Combining the methods provided a clearer understanding of the research issue in hand.
Cresswell (2012) advocates for mixed methods in research, explaining that the mixed
methods approach requires an understanding of both quantitative and qualitative domains.
Incorporating mixed methods in the research design requires extensive thinking to merge,
integrate and link the data (Cresswell 2012).
3.5.2 Mixed method designs
Mixed methods, can be achieved by four basic research designs. These include the
convergent parallel, the explanatory sequential, the embedded and the transformative
design. Each of these designs has been explained sequentially below.

86
In a convergent mixed methods designs, the qualitative, as well as the quantitative data, is
collected simultaneously, and the objective of this design is to provide a comprehensive
understanding of the research problem outcomes by merging the data from both sources
(Creswell, 2012). In an explanatory sequential method, quantitative data is collected in the
beginning and analysed, and in the next stage, the qualitative data is collected to inform the
quantitative data (Ivankova et al., 2006). However, in the case of an exploratory sequential
design, qualitative data takes priority over quantitative data, and qualitative data informs the
quantitative data (Onwuegbuzie et al., 2010). The embedded design is similar to the parallel
design whereby the quantitative and qualitative data is collected simultaneously, but one
form of data plays a ‘supportive role to the other form of data’ (Cresswell, 2012, p. 544).
Using mixed methods has some advantages as the researcher can garner information from
the quantitative and qualitative fields. According to Creswell (2012), quantitative data assists
in identifying patterns and helps to derive generalizable insights, thwarting biased or skewed
interpretations. On the other hand, qualitative information enables a researcher to acquire a
better understanding of the setting in which humans operate. When methods are combined,
and data are merged, they give a better understanding of the research problem at hand.
However, using mixed methods can be cumbersome, time-consuming and expensive.
Moreover, the researcher has to plan for collecting the data while maintaining the quality and
rigour of both methods (Wisdom et al., 2011; Creswell, 2012).
Thus the use of dual methods enables a broader range of inference, interpretation,
explanation and prediction of the data gathered. Figure 3 on the next page describes the
research design adopted for collecting the data. The subsequent section describes the
different strategies adopted for analysing the data obtained through the positivist and
interpretivist approaches.

87
Figure 3 – Research Design Process
Convergent Research Design
Quantitative methods
Student questionnaire
Principal and teacher questionnaire
Qualitative methods In-depth interviews with school heads
Student achievement tests
Analysis and interpretation of Quantitative and Qualitative data

88
3.6 Quantitative techniques
3.6.1 Survey method
Using the survey study methodology prescribed by Wolf (1993), I study the relationship
between the variables that already exist in the RTE and its impact on student achievement.
The research also follows the UNESCO (2005) guide for causal modelling, which attempts to
find the tenability of causal relationships (UNESCO, 2005). It is also critical to understand
the differences in the terminologies – ‘association’ and ‘causation’. Using the definitions
given by UNESCO (2005), an association states that there exists a relationship between any
two given variables, while, causation implies that a variation in one variable is due to the
cause of another (UNESCO, 2005, p. 10).
As described in the beginning, the survey method allows for exploration of associative
relationships; the current research goes further to draw the causal relationships that might
exist between the different variables included in the study. Using sophisticated statistical
techniques (discussed at length below), the research attempts to draw further insights into
these causal relationships. Furthermore, Wolf (1993), commenting on the nature of the
relationship between variables, suggests that ‘if two variables are associated’ (p. 14), it is
likely that a plausible causal relationship amongst the variables exists. However, he
cautions, that researchers should refrain from firmly concluding that the ‘causal relationship
already exists or has been established between the variables (Wolf, 1993, p. 14)
The current research deals with several variables associated with physical inputs – teaching
and teacher-related factors and curriculum-related factors. Variables related to physical
inputs include the components listed in the schedule of the RTE Act comprising pupil-
teacher ratio, the presence of a playground and library, teaching-learning materials, kitchen
for mid-day meals, barrier-free access and boundary wall or fencing in the school. Similarly,
teaching and teacher-related factors include their experience, salary, educational
qualifications, in-service training received and the nature of their contract.
To find the strength of the association between variables and to determine if there is any
plausible causation due to covariates associated with the RTE Act, this research used
multiple regression modelling. The regression model allowed to determine the overall fit, i.e.
(indicating the variance) and the relative contribution of each the indicator to the total
variance explained The next section discusses in detail the objective of using the regression
models and the considerations and limitations of using such models in a large scale study.

89
3.6.2 Regression modelling for quantitative analysis
Regression modelling as a statistical technique has been used to determine the relationship
between several covariates and a single dependent variable. The current study which deals
with understanding the influences on student outcomes is likely to have more than one
predictor as it occurs in an educational set up with several elements associated with it.
According to Field (2009), regression models enable the prediction of a variable through a
combination of variables multiplied with their respective coefficients plus a residual term.
Jeon (2015) outlines several objectives that can be achieved through regression models.
Firstly, they assist in defining the influence of covariates on a dependent variable. Secondly,
they facilitate understanding of the extent to which changes occur in the dependent variable
due to the independent variables in consideration. Finally, they enable estimation of the
value of dependent variables due to the variation in the independent variables. Jeon 2015
summarises thus:
“When the goal is to understand (including predicting and explaining) the causal
influence on a population outcome, regression analysis can be a powerful tool.”
(Jeon 2015, p. 1634)
3.6.3 Characteristics and considerations in multiple regression modelling
Multiple regression models allow for experimentation with different independent variables
that were likely to have an impact on the dependent variable, such as test scores. For
instance, a regression model can be constructed using three or more variables. Most models
used in the current study considered more than three variables to understand the desired
influence of the covariates. A typical model with three covariates would take the following
form:
Y = β0 + β1X1 + β2X2 + β3X3 + ε.
Where β0 is the constant and β1 is the slope parameter (also known as the slope coefficient)
for X1, and so forth, and ε represents the errors. In using a statistical test like the above,
there is an initial assumption that there exists a linear relationship between each
independent variable and the dependent variable, as well as the "composite" of the
independent variables and the dependent variable.
Jeon (2015) advises that researchers should carefully consider a large number of equations
when resorting to regression models, where the possibilities could be 2n.

90
However, he cautions that while selecting the most appropriate equation for the determining
the impact, ‘meaningfulness should be the main objective rather than raising or gaining an
incremental value of statistical significance’ (Jeon, 2015, p. 1635).
Osborne and Waters (2002) outline four crucial assumptions which include linearity between
the covariates and the dependent variable, normality of distribution, assumption of
homoscedasticity and independence of error terms. All the premises in the current research
have been addressed through partial regression plots, identifying outliers and normal QQ
plots before drawing causal conclusions. Regression equations were also checked for
multicollinearity as recommended by Jeon (2015) to estimate the effect of covariates on
dependent variables. Variables were removed or replaced whenever the models identified
multicollinearity between the variables.
Finally, the sample size was large enough to generalise the reports and estimate effect
sizes; it is usually difficult to draw generalisable insights based on small samples.
The use of survey methods and regression modelling assisted in understanding the
relationship between the variables and helped in identifying the causal relationships
wherever they existed. The next section deals with the methods used to collect, tabulate and
analyse the qualitative data
3.7 Qualitative approaches
3.7.1 Grounded theory design and its integration
The current research uses a grounded theory design to report the qualitative data generated.
According to Creswell (2012), using grounded theory approaches allows a researcher to
‘generate a theory that explains, at a broad conceptual level, a process, an action, or an
interaction about a substantive topic’ (Creswell 2012, p. 423). Grounded theory, established
by Glaser and Strauss (1967), allows researchers to collect data systematically, classify
them in different topics or categories and then link these topics to explain a theory.
In the current study, the objective was to study the patterns, process and practices that
emerge amongst school leaders after the introduction of the RTE Act. The critical element of
the approach allows the formulation of a new theory through collection and analysis of the
interview data relating to a phenomenon. The central aspect was the school closures being
faced by the low fee private schools in Delhi due to the Act and the strategies employed by
school owners to prevent their schools from being closed.
Creswell (2012) describes three critical designs in ‘grounded theory’ research.

91
These include systematic design proposed by Hood (2007) and Corbin and Strauss (2008),
the emerging design propagated by Larson (1997) and finally the constructivist design
advocated by Charmaz (2000, 2006).
In the systematic design process, the researcher attempts to find out the influence of an
event using strategies like open coding, axial coding and selective coding (Creswell, 2012).
In an emerging design propagated by Larson (2012), the attempt is to examine the collected
data through fewer categories and then compare them with emerging categories to form a
theory around the phenomenon.
3.7.2 Use of Grounded theory’s constructivist design
Grounded theory merged with constructivist design helped to gain genuine reflections and
experiences from school heads located in different areas of Delhi. Information gathered
during the research when blended with quantitative data, provided powerful and useful
insights capable of assisting people facing the threat of school closure.
Taking a cue from (Creswell, 2012) and using the constructivist design allowed the
researcher to gather the ‘views, values, beliefs, feelings, assumptions, and ideologies of
individuals. Similarly, constructivist design advocated by Charmaz (2000, 2006) tied up with
the positivist (i.e., more quantitative) and the interpretivist stance. Gathering data on these
attributes was crucial to draw the link between the causal relationships emerging from the
quantitative data. The merit of using the constructivist design assisted in generating insights,
on issues like the – understanding and applicability of the RTE act, the mechanisms followed
by schools to obtain recognition and the hurdles faced by them.
Moreover, using a constructivist design allowed to present findings in a more explanatory
and discursive fashion. Hence, this placed more importance on individuals especially the
school principals and allowed the probing of events like ‘school establishment’, ‘RTE
awareness and norms’, ‘teaching and input mechanism’ ‘school closure and law
enforcement’ to be examined in detail.
The design allowed the flexibility to relate to school owners’ ‘experiences, conditions and
consequences’ (Chamaz, 1994, pgs. 283-284).
Grounded theory requires the classification of data into properly coded headings and further
classification into subcategories (Strauss, 1987, p27). During the fieldwork, data was
collected from in-depth interview with principals. Notes and verbatim collected during the
fieldwork were then tabulated for headings. The main coding categories and sub-categories
that emerged from the in-depth interviews have been listed in table 22:

92
Table 21 - Coding qualitative fieldwork
Code heading Subcategories
School inception and
establishment
Struggle for quality education, first generation learners, provide education to poor, uplift financially backward areas
RTE Act awareness
and recognition
Government permission, administrative and legal issues, non-compliance, certification, no academic benefit and temporary recognition
RTE regulation norms RTE schedule, capital investments, complicated rules and laws, bribery, corruption, harassment by officials, graft, building certificate, fire and safety certificate, schedule norms and powerful and well-connected
Teacher and teaching
input mechanism
Teacher training, teacher employment, parent-teacher association, Library and TLM provision and teacher tenure
Consequences of law
enforcement
Students coerced to join labour stream, teachers unemployed, capacity failure of govt. schools and children drop-out
3.7.3 Sources of evidence
Yin (2009) describes several sources of data. The essential sources indicated include
documentation, archival records, interviews, direct observations, participant observation and
physical artefacts (p. 101). Each of these sources has advantages and disadvantages, and
this research uses three of the above. Table 21 shows the type of source utilised in this
research.
Table 22 - Sources of Evidence
Source of Evidence Type
Documentation RTE Education Act, Court order by the Government of Delhi for schools closure (online document), Newspaper articles and magazine articles.
Interviews Semi-structured interviews 17carried out with, school owners who faced the threat of closure.
17 See appendix 5, 6 7 and 8 for student, principal and teacher questionnaires.

93
Observations Observations were undertaken in the premises of threatened low-cost private schools: playground, head teacher’s office, and the areas in the local vicinity.
Documentary evidence 18 issued by government agencies and courts was studied before
approaching the schools threatened with closure. The Delhi Right to Education Act and the
Central Education Act were examined to understand the legal framework better before
discussions with school owners.
Government documents also indicated the spread of schools across Delhi districts. Other
documents used include publications from NISA19 Government websites including the
Ministry of Human resources and development (MHRD) were also accessed to collect
documents required for analysis.
Interviews were held with school owners from the different districts of Delhi with the help of
an in-depth personal interview guideline20 to gather facts, opinions and views on the RTE Act
and their mechanism to cope with it. Semi-structured interviews were held with teachers
enquiring about the status of their job, their income range, educational qualification, total
years of teaching experience, subjects taught by them and the methods they used during
classroom transaction. The information obtained from the field was adequately documented
on the same day in an MS Word file format. School owners refused to speak on a recorder
due to concerns around misquotation – regulatory authorities could instigate harsh actions
against them if they spoke out of turn. Handwritten notes taken during field surveys are
available for inspection.
Observations are an integral part of the evidence for the study. These were undertaken
inside school premises with school owners or principals. During the interviews, the school
principals readily agreed to conduct a guided school tour.
18 See appendix 4 for closure notifications
19 NISA – National Independent School Alliance is an independent body aiming to promote equality, equity and
social justice by uniting the budget fee private schools in India through a common platform.
20 See appendix 9 for in‐depth interviews

94
3.8 Data Triangulation
The advantage of using mixed methods is that it facilitates the triangulation of data; many of
the quantitative findings emerging from the research were supported and verified by the
qualitative findings. The quantitative methodology allowed for more insights into the impact
of the RTE Act’s drivers on student learning and background factors like teacher
qualifications, teacher salary, student family background, the association of law and student
achievement. Meanwhile, the qualitative element gave an in-depth understanding of how
low-cost private schools avoid closure resulting from the RTE Act and how they plan to
prevent forced shutdown in the future.
Employing both qualitative and quantitative data has its advantages and disadvantages.
Quantitative research is guided by a hypothesis, allowing the collection and analysis of data
from various subjects.
However, the drawback of using this technique is that it limits the research through set
questions and predetermined answer categories (Field, 2009). Qualitative techniques, on the
other hand, allow the generation of information in great detail through techniques like
interviewing and focus groups.
However, these are time-consuming, and a qualitative approach is most suitable in cases
where the sample size is small and when monetary and physical resources are readily
available (Creswell, 2007).
Keeping in mind advantages and disadvantages, this research carried out semi-structured
interviews with school principals, aiming to explore their views on the RTE Act and gather
their experiences in dealing with school closure notifications. The semi-structured interviews
aimed to avoid bias by ensuring that the researcher’s preconceptions were not expressed.
The aim was to discover the truth from the different participants using diverse techniques,
extracting the data with minimum errors and maximum accuracy. The broader objective was
to report the findings neutrally and formulate a concrete policy recommendation to save the
low-cost private schools from closures due to the impact of the Act.
The descriptive statistics helped in analysing test scores and interpreting background data
obtained from the subjects, including teachers, students and school principals. These were
gathered through semi-structured questionnaires. The diagnostic test instruments, capable
of measuring skills and competencies of children in grade 5 and an IQ test, capable of meas
the general cognitive ability of the students, supported the quantitative data.
Information was collected through the various quantitative tools including background data
on the school’s physical facilities and amenities.

95
The practices followed by teachers in the classroom were matched with test student scores
to obtain an accurate picture of student performance enrolled across the different set of
schools.
To capture the ‘interpretative repertoire’ of the subjects involved in the research, qualitative
research was employed. The research study is interwoven with multiple levels of social
structure - school principals, students and teachers. It was necessary to have an
understanding of underlying patterns as well as the mass events that confront them. The
study used in-depth interviews 21as a method of inquiry for data collection. This qualitative
technique generated opinions, facts, views, details and stories. The grounded theory
approach provided a strong platform to produce new theories and insights. It allowed a
systematic way to collect the qualitative data and assisted in presenting the series of ‘events,
actions and interactions’ occurring in the private schools due to the RTE Act.
Triangulation is one of the most advantageous characteristics of conducting mixed methods
research (Creswell, 2002). Cohen and Manion (2000) state that triangulation is an ‘attempt
to map out, or explain more fully, the richness and complexity of human behaviour by
studying it from more than one standpoint (Cohen and Manion 2000, p 112). Triangulation of
data thus assisted in conducting the mixed method smoothly. The use of triangulation,
therefore allowed to examine the complexity of human behaviour by allowing it to study
through multiple standpoints
3.9 Introduction to Sampling
Sampling in educational research surveys is undertaken to know more about a part of the
population rather than the whole. The insights derived from samples often assist in the
development of generalisations relating to the whole population. These generalisations are
usually in the form of estimations about the characteristics of the population, or they may
show the strength of relationships between the characteristics of the population.
Two main methods of sampling strategies are described by Cohen (2007) and Schofield
(1996), bifurcating the sampling process into probability sampling (random sampling) and
non-probability sampling (purposive sampling). The fundamental difference between the
sampling techniques is that in probability sampling, the selection of a unit of a larger problem
is confirmed, but a unit selection from a broader population is unknown (Cohen et al., 2007,
21 See appendix 9 for in‐depth interviews guideline

96
p110). Probability sampling can be further divided into systematic sampling, stratified
sampling, cluster sampling, stage sampling and multi-phase sampling. Other techniques
such as convenience sampling, quota sampling, purposive sampling, dimensional sampling
and snowball sampling are categorised under non-probability sampling (Cohen et al. 2005).
The figure below provides a clear understanding of the different kinds of sampling and their
techniques.
Figure 4 – Sampling techniques
PPS (probability proportional to size) sampling technique was utilised to draw the sampled
units from the population. Two issues were confronted before the selection of the sample –
sample size to be drawn from the population and whether or not the selected sample would
yield results that could be generalised for the whole population.
3.9.1 Sample population
The desired target population or the population for which the results were ideally required
included the students studying in grade 5 from 243 low-cost private schools. The target
population was obtained through a meticulous internet search carried out with sophisticated
research22 techniques. A government document obtained through the research listed 243
unrecognised low-cost private schools of Delhi threatened for closure under the RTE Act.
22 Use of sophisticated research techniques comprised using Boolean Operators which make use of simple
words (AND, OR, NOT or AND NOT) used as conjunctions to combine keywords in a search, resulting in more
focused and productive results (https://library.alliant.edu/screens/boolean.pdf). Phrase searching was also
used in obtaining the lists. Phrases searching was also used extensively and phrases like “low cost private
school closure”, “low fee private school closure”, “notice for closure of unrecognised schools’, “list of
unrecognised schools in Delhi for closure” were also used for obtaining the closure list.
(http://www.stthom.edu/public/getfile.asp?file_content_id=3580)
Probability Sampling Non Probability sampling
• Simple random sampling • Systematic sampling • Stratified random sampling • Cluster sampling • Stage sampling
• Convenience sampling • Quota sampling • Purposive sampling • Dimensional sampling • Snowball sampling

97
The document cited the lack of structural stability certificates as the prime reason for closure.
Because of this, the schools had been rejected by the department of education.
3.9.2 Constructing the sampling framework
The original target sample size was 1000 students, and the number of schools to be tested
across all the districts of Delhi was 25 (assuming an average of 35 to 40 students per class
from 15 low-cost private schools, and 50 students per class from 10 government schools).
From the 243 low-cost private schools, a pre-survey23 was carried out in 96 schools across
all the districts, for drawing preliminary information to construct a sampling framework. The
pre-survey24 provided information on the number of children enrolled in the school
(especially in Grade 4 & 5), type of school (playschool/primary/secondary), the willingness of
the schools to participate in the test, nearest government schools and any other relevant
information about the school. Once the sampling framework was constructed, some schools
were excluded due to the sorting process. These schools included the ones where grade five
was not prevalent; the special schools and schools with extremely low enrolment. Out of the
96 schools which were pre-surveyed, close to 40% did not have grade five#25 , and hence
they were excluded from the sampling framework. 21% of the schools in the sampling
framework could not be surveyed as they were either inaccessible#, had temporary
principal’s#, refused testing#, or they were schools for children with special educational
needs. Close to 13% of the schools had very few children enrolled in grade five, and thus
they were also excluded from the sampling framework. Only 26% of the schools adequately
met the requirements to be selected in the sampling framework refer (appendix 10). Two
likely reasons that emerge, for the pre-survey schools that did not have grade 5.
One that many of the low-cost private schools acted as feeder schools to the recognised
schools, as well as to the other government schools prevailing in the community pockets.
23 All the 243 schools could not be covered due to the paucity of resources, time and manpower required for
covering such a huge population base.
24 See appendix 10 for the results obtained from the 96 schools.
#25Test instruments used in the research were calibrated for grade five hence, schools without grade five were
automatically excluded. Inaccessible schools included those which had been closed down, or no school was
found at the designated address during the visit by the representative. Schools with temporary principals could
not allow the research, as they had limited authority to provide assent. Some schools refused testing as they
were unsure of the consequences of their participation in the study, although anonymity assurances and a
study brief was provided to allay their fears.

98
Two schools comprising of grade five are required to issue a TC (Transfer Certificate) to
children upon completion of class 5. However, for issuing, a transfer certificate, it is
mandatory that the department of education recognised the schools.
Schools that met the following requirements in the sampling frame were selected for the
PPS sampling technique:
a. Those that included grade five classes
b. Those that had an adequate number of students in grade 5 (the lower threshold
was lowered to 15-20 students per school. The pre-survey process did not find a
sufficient number of schools with 30 – 40 students)
Based on the pre-surveys, the main sampling framework was comprised of 25 schools
selected from the 96 schools. These schools were willing to participate in the tests and
provided an adequate sample size for data collection purposes.
3.9.3 PPS Sampling technique for selection schools
Probability Proportional to Size (PPS) technique of sampling was used to select the schools
from the sampling framework. This method is a unique as the sampling unit chosen in the
study is proportional to some known variable (e.g. in a population survey, the population size
of the sampling unit – in this case, the sampling unit is the school. PPS method of sampling
was selected, because of two reasons. Firstly, the sampling units of the population were
quite varied and secondly to ensure that every element in the target population has an equal
chance of being included
In situations where the populations of sampling units vary in size and the sampling units are
selected with equal probability, the likelihood of elements from a sampling unit with a large
population being selected for the survey is less than the possibility of items from a sampling
unit with a small population being selected. The PPS method of sampling is thus used to
reduce standard error and bias in statistical sampling procedures.
The following steps were followed to select the schools from the sampling framework26 using PPS:
Compiling the list of schools with an average predetermined classroom size, ideally
also known as the Measure of Size (MOS).
26 Refer to appendix 11 for the 25 complete list of schools that were chosen for PPS technique and the selected
ones

99
The MOS (average classroom size) was decreasingly ordered, enabling the
replacement schools to be close in characteristics to the sampled schools
A cumulative MOS was calculated as shown in column F
The sampling interval was calculated by dividing the total population by the number
of clusters to be sampled to get the Sampling Interval (SI). In the case of this
research: (Total cumulative MOS / No. of schools to be sampled)
A random number between 1 and the SI was chosen. This is Random Start (RS).
The first cluster contains this cumulative population: (Column C). [Excel command
=rand () *SI]
Adequate replacement schools were chosen for each sampled school; this was done
to avoid sample size losses.
The first sampled school was, selected by choosing a random number in the range between
0 and the sampling interval. The school whose cumulative MOS contains the random
number was the sampled school. The second school in the sample was, chosen by adding
the sampling interval to the first random number. Subsequently, the following series: RS; RS
+ SI; RS + 2SI; ..RS+(d-1)*SI was calculated to select the schools as per the PPS method to
achieve the required size for the field work.
The PPS method was, chosen to achieve the maximum precision for adequate and
representative sampling, as the population in the case of the study was large. The sampling
mechanism paid sufficient attention to the resources available and ensured that its
implementation was straightforward. Finally, the design was selected to yield statistically
authentic results keeping in mind the administrative and operational constraints. The list of
finally selected schools is provided in Appendix 11.
3.10 Test instrument design – Introduction
Instrument design is the most integral part of any research study. In the case of this
research, ‘instrument’ has been used for the different test papers used for assessing the
skills and competencies of children enrolled in low-cost private schools and government
schools.
The accuracy, validity and reliability of the data depend on the tools developed for the
research. It is essential to have an accurate, standardised process for preparing the tools of
the study. This section of the thesis describes the features of the instruments that make up
its design, format and nature of the question as well the scoring process utilised for the field
work.

100
The section also focuses on the test developments, competency framework, translation and
validation of the tests and the final blueprint for the subject’s language, maths and science.
3.10.1 Structure of the testing tools
Two test papers were used during fieldwork for the research. Paper one, a comprehensive
diagnostic test27, assessed the subject’s skills in language, mathematics and environmental
sciences. The test followed a written format; the students were required to read the question
paper and write answers in the paper itself. The tests and its items have been used by
India’s leading educational firms and NGOs to measure the learning levels of children across
different states. A pilot test was also undertaken to check the validity and reliability of the
instrument and details are discussed in the subsequent section.
Paper two, Raven's IQ test28 was administered to measure the IQ (intelligence quotient) of
the children participating in the study. The idea behind conducting both tests was to
understand if there was any correlation between the IQ of the children and their performance
in the subject-based tests.
3.10.2 Test structure
The comprehensive diagnostic test29 comprised 50 questions, 17 from both the subject’s
language and science and 16 in mathematics. The questions varied between multiple choice
and free response items. Open response questions included items which required students
to give a numerical response, write a word or a short sentence, interpret text or diagrams
and complete a sketch. A clear rubric was created for assessing the free response items
objectively. Children were familiar with multiple choice questions in tests due to several
large-scale assessment studies undertaken by various agencies such as the World Bank,
Educational Initiatives, Pratham and the Azim Premji Foundation.
Table 23 – Test instrument structure
Grade Subject Paper Code
Questions Duration (mins)
5 Comprehensive Test
C05 Language Maths Science Total 105 17 16 17 50
5 Raven's Test R05 60 60
27 See appendix 11 for specimen diagnostic test
28 See appendix 12 for specimen Raven’s IQ test of matrices
29 See appendix 11 for specimen diagnostic test
101
The comprehensive tests were designed to assess the competency levels of children in
grade 5. Each item (test question) linked to a particular competency reflected in the National
Curriculum Framework (NCF) brought by the National Council for Education Research and
Training (NCERT).
The test items varied in difficulty, aiming to achieve a competency balance – it was intended
that they would not be too difficult for less able children or too simple for high-ability children.
Questions that replicated the format in which they appeared in the school subject textbooks
of language, maths and environmental sciences were termed as ‘straightforward’. A ‘non-
straightforward’ item, appearing in the test, was designed to report children’s capabilities.
The purpose of a ‘non-straightforward’ item was to ascertain whether children were able to
perform only textbook-type problems or whether they could apply essential skills to solve
more complicated issues.
3.10.3 Test response recording
The comprehensive test paper was supplemented with a scoring card30 which was
comprised of a detailed rubric (with scores/codes) indicating the procedure to record student
responses from the test instrument. Test papers scored this way reduced evaluator bias and
were on par with international assessment tests like PISA, TIMSS and NAS in India.
The evaluators who engaged in the field survey were trained before the tests for capturing
the responses of students participating in the tests.
The codes were entered in a separate sheet called the ‘top-sheet’31. For coding the multiple
response questions in the test instrument, the response option chosen by the student was
recorded on the top-sheet whereas items requiring free responses were scored using a
detailed scoring rubric (see appendix) provided for the evaluators. While evaluating the
answer sheets, if the student had crossed, circled or marked a specific response in any way
that option was treated as their choice. The scoring cards also had universal codes assigned
for a specific type of responses which were common across all sections of the test.
Table 24 shows the codes for capturing the frequently appearing responses in the test
papers.
30 See appendix 14 for sample score cards
31 See appendix 15 for sample top sheets

102
Table 24 – Classification of codes
Nature of the test item Classified code Test items not attempted by students 88 Test items with invalid answers (e.g. question copied, more than one option chosen, crossed out answers, illegible answers)
86
3.10.4 Sample test items and recording rubrics illustrations
This section includes examples from the language, mathematics and science test papers. The
test was multiple choice so the scoring rubric captured the possible responses that students
would provide during the test.
Figure 5 – Free response Language question and rubric
Reading Comprehension question Scoring Rubric Code
Correct answer in a complete sentence mentioning ‘kitchen’ (Eg.. “Sarala was having tea in the kitchen”)
01
Other variations of the correct answer (Eg. “Sarala was having tea with her mummy in the kitchen”.
02
Correct answer in a word or phrase (Eg. In the kitchen)
11
‘Ghar Mein’ 21 Any other answer 85
Figure 6 – Free response Maths question and rubric
Question assessing the knowledge of time Scoring Rubric Code 6 /six /6 o’clock /6a.m / 6p.m 01
12.30 (any other related form) 81
Any other wrong answer 85
6 /six /6 o’clock /6a.m / 6p.m 01
12.30 (any other related form) 81

103
Figure 5 & 6 illustrate examples from the language and math sections. For instance, as
shown in Figure 5, students were required to answer a question after reading a short
comprehension paragraph. Similarly, in mathematics, the students were asked to determine
the time based on Figure 6.
Student responses were captured in the test paper, and the scoring rubric indicated the most
likely responses to the questions provided. Test evaluators were required to read the
response on the test paper and capture the correct code on a ‘top sheet’ provided to them.
Figure 7 – Multiple choices - Science question and rubric
Multiple choice questions such as the above required a different scoring rubric. The top
sheet captured the option letter marked by the student. The coding process thus helped in
maintaining consistency while evaluating the test papers.
3.11 Test development process
The test development was comprised of two broad stages.
Stage 1 - Necessary background information for designing the test competency framework32
was researched using textbook analysis and syllabi, allowing for the development of the test
items by surveying pre-existing tests assessing student learning.
Stage 2 - At stage two, test instruments were fine-tuned through the process of pre-testing or
pilot testing, carried out in the northern district of Haryana, India.
32 See appendix 15, 16 and 17 for the competency frameworks in Language, Maths and EVS
Which of these is likely to be the foot print of a dog?
Scoring Rubric Answer code
Enter the option marked (enter option A, B, C, D in English) <Option Letter>
A B C D

104
The pilot testing gave further insights as to whether the test items were too difficult or too
simple for children and whether the test items could discriminate between the top and
bottom quartiles.
3.11.1 Test competency framework
The test competency framework33 is the heart of the testing instrument and was designed
following analysis of the following documents:
Studying the competencies and skills listed in the curriculum textbooks
Skills and competencies identified, based on international best practices including
tests like TIMSS and formats used in other tests across India.
Researching and understanding the minimum levels of learning
The starting point for developing the competency framework was to refer to textbooks
published by the State of Delhi as they were indicative of the kind of content a student would
be expected to know by the end of class 4 and 5. Test papers and content from those used
in Third International Mathematics and Science Survey (TIMSS) and ASER (Annual Survey
of Education Report) were also reviewed to understand the construction of a competency
framework. A significant influence for designing the structure was the ‘Municipal School
Benchmarking’ test undertaken by Educational Initiatives, India. Finally, skills and
competencies were outlined after reviewing the minimum levels of learning.
3.11.2 Translation and Validation
The comprehensive paper was first designed in English. After a pre-survey across the
schools, it was decided that the test needed to be translated into Hindi as this was the
medium of instruction across several schools. Based on the original English test blueprint, all
the sections of the comprehensive test paper were translated into Hindi. The researcher
translated the tests into Hindi with assistance from language experts to ensure validity and
appropriateness of questions reflected across the Hindi versions. The researcher’s expertise
in the Hindi Language, as well as expert input, ensured that the question meanings
remained unchanged and the difficulty level of the questions was intact. The translation
process also took into account cultural adaptions and appropriate dialect for a classroom
context.
33 See appendix 15, 16 and 17 for the competency frameworks in Language, Maths and EVS

105
The robust process followed for translation ensured that the test papers were child-friendly,
embraced colloquial terms used in classrooms and were comparable across English and
Hindi language.
3.12 Pilot tests 34 and changes to test instrument
Once in their final form, the instruments were pilot-tested in two rural private schools in Mewat
District, located in the state of Haryana in India. The pilot testing was carried out to accomplish
the following objectives:
To fine-tune instruments for the final fieldwork conducted in July 2016
To anticipate the problems and issues that might arise during actual field test
administration
In total, 53 children across grade four and five were tested across two schools. The pilot test
paper was calibrated to suit both classes and had 45 questions. It took the children about 90
minutes to complete the test. The entire process of pre and post-test administration was kept
similar to the field test to ensure standardised test administration and the integrity of the
tests.
Test scores were evaluated using binary coding procedures, and scoring and analysis was
carried out using MS Excel.
The following changes were made to the final instrument after the pilot testing with the help
of preliminary analysis on the student test scores:
Preliminary analysis observed that there were too many easy questions in the mathematics
section about the same skill (number sequencing). Nearly 80% of the students from grade 5
received similar scores on those questions, and the questions repeatedly tested the same
competency. Hence, it was decided to eliminate a few questions corresponding to number
sequencing skills. The excluded questions on ‘number sequencing’ were then replaced with
questions on ‘place value’ skills in the final test paper.
Secondly, it was observed that the mathematics section required more conceptual questions
in nature to distinguish between the ablest and least able children. Thus items which needed
linguistic abilities were removed from the mathematics section.
34 Pilot test papers were similar to the final testing instruments used in the field study, each of the question
had a skill or competency associated with it

106
Figure 8 – Question requiring more linguistic ability
For instance, the question in the pilot test
(Figure 8) was eliminated as it required better
linguistic capabilities and was replaced by a
question which needed conceptual clarity
(Figure 9) rather than linguistic ability.
The pilot tests also captured the time taken
by the students to complete the paper. It was observed that students were able to respond to
the questions comfortably within the given time frame. The duration of the tests after the pilot
was reduced to 105 minutes from 135 minutes. The next section discusses the details of test
administration, logistics and data management procedures.
3.13 Field Work - Test Administration, Logistics and Data Entry
The thesis incorporated all the elements of a large-scale project. These included a different
set of activities upon which the project executions were heavily dependent.
The success of the project was dependent on the cohesive function of all the elements to
achieve the desired results. The following activities were undertaken for the execution of the
fieldwork smoothly.
Designing a robust logistical plan
School data collection and test booklet printing
Test volunteers
Test administration
Quality control
Data entry error rectification and validation
The research fieldwork was undertaken with the utmost rigour, and all attempts were made
to mitigate the issues enabling its timely and successful completion. The fieldwork was
undertaken in India in July and August 2016.
Figure 9 – Question requiring mathematical competency

107
The actual test administration in the schools was undertaken in the second and third weeks
of July. The subsequent section provides a detailed description of the various activities
carried out for the smooth implementation of the field work.
3.13.1 Designing a robust logistical plan
During the pre-survey, the testing dates were obtained from each school. Most of the
schools consented in the second week of July. Due to the short window of time provided by
the schools for testing, it was decided to use voluntary test administrators who could conduct
the tests most impartially.
A detailed logistical plan was drawn for the smooth execution of tests in the schools. The
logistical plan was quite helpful to the research in the following ways:
It allowed preparations to be carried out in advance; these included the number of
test papers to be printed, the stationery to be supplied and the class enrolments of
the respective schools.
It assisted in dealing with unprecedented circumstances. For instance, some schools
requested a change in dates as soon as the team arrived at the schools. Since the
team was aware of the logistical plan, changes such as exchanging dates could be
made possible in consultation with other schools.
The logistical plan thus facilitated a smooth execution of the research study on the ground.
3.13.2 School data collections and test booklet printing
Enrolment and data collection from most of the schools were carried out during pre-survey.
All the sampled schools were approached in May, a few months before the actual testing,
and their enrolments were noted from school registers. The data collected from schools were
entered into an Excel spreadsheet to facilitate the sampling exercise. The data collection
also helped in estimating the test booklets to be printed. After the printing, the test
instruments were securely stored. Final copies are provided in the appendix7 and 8.
3.13.3 Test volunteers
Actual testing in the sampled low-cost private schools of Delhi was undertaken with a team35
of test volunteers. Test volunteers were selected for the research after a rigorous interview
and personal discussion. The idea of recruiting volunteers enabled timely completion of the
35 For the field study execution the team comprised of a logistics co‐ordinator and twelve test volunteers were
chosen. A detailed list of their names and roles have been provided in appendix 12.

108
study as the schools had advised adhering to the agreed dates. All selected test volunteers
were provided with two-day training on standardised test administration. This was relevant in
terms of ethics and technical reasons.
It was crucial that all the test volunteers implemented the test uniformly without any variation
which could have reduced the accuracy of results. The detailed training and coding manual
are provided in the appendix.
3.13.4 Test administration
The diagnostic and Raven’s IQ tests were conducted from 11th – 21st of July 2016. Two
volunteers and tests visited each school and held the tests over two consecutive days. On
the first day, the comprehensive test was administered to the students, with Raven’s IQ test
administered on the second day. On the day of testing, the volunteers met the school
principal and explained the purpose of their visit. They initiated the test after creating a
relaxed atmosphere in the classrooms.
The volunteers monitored the classrooms during testing and ensured that students taking
the tests did not confer. They discouraged teachers from assisting children in case of
prompts and ensured that all test books were returned following completion. The test papers
also included a student questionnaire which students completed after they had finished the
tests. All the test papers were organised in chronological order with the help of a student
code which was similar across the comprehensive and the Raven’s tests. Five schools from
the final sample excluded themselves as they were concerned that the research might be a
government-funded programme to check the quality of their education provision.
3.13.5 Quality control
The test volunteers returned to the evaluation centre after the completion of the test each
day. Responses provided by the students in the test papers were coded in the ‘top sheets’.
For coding the test papers, test volunteers had a detailed scoring sheet which assisted them
in the process of coding. All the test papers were evaluated on the same day. Coding the
test papers assisted in eliminating evaluator bias while marking the responses. The
researcher maintained high levels of quality control – several checks and parameters were
put in place to ensure that the fieldwork took place smoothly as planned.
Test administrations were monitored across the schools during the testing period to ensure
that they were uniformly administered across schools. Feedback was provided to test
volunteers in case any discrepancy was observed in the course of test administration.

109
To, gain in-depth insights, all personal interviews with school leaders and administrators
were carried out by the researcher. This ensured consistency in the manner in which
interviews were conducted. This allowed the probing and generating of new information from
participants in case of standard responses received during personal interviews.
The researcher participated in the coding process and also guided the test volunteers
whenever they needed clarifications. Spot-checks were undertaken on the top sheet entries
made by the test volunteers. These were also cross-examined in case of any major error in
the coding process. Following completion of the testing programme, all the test papers and
top sheets were separated. Each was assigned a unique student ID so that they could be
identified in case of any discrepancy arising during the data entry stage. Figure 9 and 10
show the unique ID provided to the students on the test paper and the top sheet.
Figure 9 – Student code on top-sheet Figure 10 – Student code on the test booklet
3.13.6 Data entry, error rectification and validations
All the questionnaires were arranged school-wise before the data entry process. Data entry
was undertaken using SPSS with the help of top sheets. Backchecks were conducted in all
the questionnaires to ensure an error-free data entry. The most commonly identified issues
during the manual data entry process include:
Double entry – As the volume of test papers was huge, it was observed that a double entry
took place on a few occasions. This means attributing similar answer codes to questions that
are in proximity to each other. Duplicate codes were identified and removed from the data
sheets.
Missing entries – There were some questions for which the entries were found to be missing
during the back checks. The missing entries were rectified, and the correct codes were
attributed to the questions.

110
Erroneous entries – All incorrect entries to the respective test items were checked and
immediately rectified in case of discrepancies. Datasheets were thoroughly checked with top
sheets at first level and in case of any ambiguity of test papers, students were identified, and
incorrect entries were corrected immediately.
Robust data checking ensured that errors were minimised as much as possible and that data
was captured and entered correctly in the set formats for analysis.
3.14 Validity and Reliability
Golafshani (2003) underlines the importance of validity and reliability in quantitative
research, stating that ‘quantitative research’ usually deploys the positivist paradigm to
generalise hypothesis and attempt to find causal relationships between variables (Denzin &
Lincoln, 1998). Furthermore, Golafshani (2003) emphasises the ‘measurable nature’ of
quantitative research, stating that the process of measurement can be all ‘about numbers,
objective hard data’ and thus can classify the process or the end outcomes ‘into measurable
or common categories’ (Golafshani 2003, p 598). For measuring the variables, researchers
usually design instruments capable of capturing the traits in a phenomenon. For instance,
Smallbone & Quinton (2004) believe that one of the critical aspects of social research is the
necessity to quantify human behaviour which is mainly measured through instruments.
Hence, it is of crucial that the designed instruments are valid and reliable, as the success of
the research relies on the capability of the instrument to measure, what it is intended to
measure. Golafshani (2003) summarises:
“A quantitative researcher may prepare a list of behaviour to be checked or rated by an
observer using a predetermined schedule or numbers (scales) as an instrument in his/her
method of research. Thus, a quantitative researcher needs to construct an instrument to be
administered in a standardised manner according to predetermined procedures. However,
the question is if the measuring instrument measures what it is supposed to measure. …The
significance of this test is to ensure replicability or repeatability of the result”.
(Golafshani 2003, p. 598)
3.14.1 Validity
Validity is equally essential to qualitative and quantitative research. However, aiming for
absolute validity is unreasonable – it is highly unlikely due to biases and standard errors that
occur in research (Cohen et al., 2000). Validity, however, is a crucial aspect that needs to be
considered, especially when any testing is involved as a method of measurement (Cohen et
al., 2000).

111
Cohen (2007) enlists eighteen different types of validity:
content validity criterion-related validity construct validity internal validity external validity concurrent validity face validity jury validity predictive validity
consequential validity systemic validity catalytic validity ecological validity cultural validity descriptive validity interpretive validity theoretical validity
evaluative validity
Content Validity
Content validity is reflected in a testing instrument when it represents the subject matter
content from the syllabus which is being measured (Ross, 2005). An instrument is said to
meet content validity when it is capable of accurately representing the domain or area that it
intends to test (Cohen, 2007). Content validity in the current research was ensured through
the bespoke diagnostic test instrument that aimed to measure the specific set of components
as reflected in the syllabus and language textbooks of grade four.
Table 25 provides a brief example of the subject matter obtained from textbooks and the
corresponding questions appearing in the test paper.
Table 25 - Subject matter skill measured in the language section of the diagnostic test
S. No Competency tested Written Question numbers in the test
1 Identifies names of objects, birds and animals not seen in daily life and words denoting actions
3 13,14,15
2 Reads and writes moderately difficult words that have 4–5 letters with vowels and conjunct letters
3 1,2,3
3 Uses words appropriate to the context based on their meanings, opposites and gender endings
3 4,5,6,
4 Reads, understands, writes and constructs three simple and short sentences that have less than five words in a sentence
2 7,8
5 Student understands simple, short stories of 10-12 sentences when told and comprehends beyond the stated facts
2 16,17
6 Student reads short text of 5-6 sentences that describe daily activity, routine context, simple description, simple story independently and comprehends stated facts
4 9,10,11,12
Total 17

112
Construct validity
Drost (2011) describes ‘construct validity’ as how well an idea or concept was constructed
into a functioning reality. Construct validity intends to examine if inferences drawn from the
research are meaningful. According to Cohen et al. (2000), “Construct validity must
demonstrate that the categories that the researchers are using are meaningful to the
participants themselves (p110).
Ross (2005) believes that construct validity aims to measure a psychological quality
assumed to exist in the subjects which in turn would explain some aspect of their behaviour;
it is usually measured using testing instruments.
Messick (1989) believes that ‘construct validity’ is closely associated with the efficacy of
testing instruments capable of gauging the learner's knowledge on the relevant topics of
interest. The tests should be appropriately administered, keeping in mind inference of results
while integrating the evidence gathered from various sources. Inferences drawn from test
results should be meaningful and trustworthy to ensure that ‘construct validity’ is
appropriately embedded in the research process (Messick, 1989).
Predictive validity
Predictive validity occurs when the instrument used for assessing the performance of
students is capable of predicting the outcome in the future.
In the case of the research, it is predicted that students who excel in the diagnostic test
would equally score better in the school’s language, maths and environmental exams. It is
expected that this would be the case for the assessment of both factual understanding and
high order skills such as synthesis and analysis of information.
Internal and external validity
Cohen et al. (2000) advocate testing the internal and external validity of the research.
Internal validity is achieved when the collected data support the issues under investigation.
Internal validity can be secured through methods including triangulation, active field
engagement, peer debriefing and member checking.
For triangulating the data, semi-structured questionnaires gathered the objective information
on the participants associated with the study including teachers, parents and students. A
better understanding from an interpretivist point of view was obtained through in-depth

113
interview guidelines devised for school leaders. Information gathered from the various
sources were matched by triangulating the data to generate quality insights.
Peer debriefing was undertaken while designing the instruments. Various suggestions from
linguistic experts in terms of the wording of options and items were incorporated into the
instrument following the pilot testing. Discussions were undertaken with academic
colleagues at Newcastle University and leading Indian practitioners of data gathering and
analytical procedures for large-scale studies.
Three months were invested in the field research in India, visiting the schools, collecting the
data, entering the data and ensuring that there were no errors in data through a back-check
method. This aimed to check 15% of the test papers that were administered to participants.
According to Drost (2011), external validity in a study allows the researcher to check the
general validity of the study towards a larger population. External validity of a study or
relationship implies generalising to other persons, settings, and times (Drost, 2011, p120).
Bogdan and Biklen (1992) extend this further, and according to them, it is not only essential
that research findings be generalisable to the broader population but also that they apply to
people in similar situations and settings.
To, ensure the conditions of external validity, a detailed list of unrecognised private schools
threatened with closure was obtained from a government website, and this served as the
master list for sampling. Schools were chosen through probability proportional to size
sampling, a rigorous method that ensured that every unit of the population had an equal
chance of being selected. The final chosen schools from different districts of Delhi ensured
adequate representation. Descriptive data from these areas show that family background
and socioeconomic status were consistent with each other.
3.14.2 Reliability
According to Ross (2005), reliability in a study occurs when the instruments or tools used are
capable of producing consistent results. It is crucial that tests used for the research subjects
should be capable of producing similar results when administered on an independent set of
samples or groups externally to the research. However, Ross (2005) states that “Reliability is
a necessary but not sufficient condition for validity” (p41). This means that low reliability is
likely to indicate a restricted degree of validity while high reliability does not guarantee a
greater degree of validity. Kirn and Miller (1986) state three different types of reliability;
a) Measurement through the instrument, remains the same when repeatedly administered to
similar populations

114
b) Measurement, through the instrument remains stable over a period
c) Measurements yield similar results, when administered, in a particular time frame
Cohen (2000) also believes that the three different reliability measures as stable,
equivalence and internal. Stability is achieved when the research outcomes remain the same
over a specific period when administered on populations with similar characteristics.
Quantitative research involves several complex calculations to ensure that there is no
significant difference between subjects participating in the study. Equivalence reliability was
not targeted in the current research as this type is usually associated with research involving
pre and post-test measures or treatment and control groups.
Lastly, internal consistency (the reliability of the instrument) was determined through the
SPSS software and the KR20 through Cronbach. The derived value (0.86) indicated high
levels of internal test reliability.
3.15 Ethics
3.15.1 Ethical issues around testing assessment
Various ethical issues are involved in testing and evaluation of children as they play a vital
role in the lives of the children from a very early age. From the elementary stages to the high
school, college and higher education assessments are undertaken to decide on graduation,
retention, admissions, scholarships and placements. Review of the literature reports several
issues related to assessments with regards to ethics in developing and developed parts of
the globe (Camara, 1997). Some of them are discussed below:
Doiron and Asselin (2015) question how research treats children during the entire
process. Reporting variance observed in the position of children in international
studies; they find that their involvement (whether that be as passive subjects or
active participants providing feedback) potentially affects their lives and careers.
They ask “Do researchers provide children with the opportunity to give informed
consent or at least assent?” (Doiron and Asselin 2015, p4).
Protecting the rights and welfare of the participants involved in the research without
concealing any information from them is highly critical. BERA’s code of conduct
advises to seek consent before involving participants formally in the study and
researchers are required to present the concerns candidly and let the subjects know
how the findings will be put to use.
Recent economic prosperity and globalisation have led to rising incomes, resulting in
the emulation of western countries by developing nations. The phenomenon has

115
raised expectations that the English language will be at the forefront of all sorts of
associations. Sensitivity towards local language and culture is of first importance
(Doiron and Asselin, 2015).
Educational institutions participating in research interventions such as large-scale
testing programmes have been known to misuse data.
Instrument design for research interventions should keep in mind cultural sensitivity
and should have plans for addressing any issues. In the majority of developing
countries, English is usually the second or even third language, and this can cause
problems when translated into languages like Hindi, Arabic or Swahili (Doiron and
Asselin, 2015).
Cases of cheating operations across the US and UK have been reported widely.
Penalties for cheating and plagiarism issued by Ofqual have risen by 25% in 2018
(BBC, 2018).
Schools and teachers have been reported to prepare students for testing, rather than
focusing on ‘learning by understanding’ which can gradually raise the scores.
Negative consequences of testing and assessments also lead to ethical issues
associated with it. These include discouragement and institutionalisation of failure,
encouraging rote and mechanised learning and lesser focus on the development of
cognitive abilities that prepare students for life and prolonged student tracing, even
after they graduate from schools and colleges (Camara, 1997).
3.15.2 How were the ethical concerns addressed?
Not all the above ethical issues bore equal weight but some were directly relevant to the
current study. Therefore, appropriate measures were taken to ensure that they were
addressed satisfactorily according to the code of conduct set out by the University’s ethics
committee.
First, some issues related to consent and participation. All the private schools participating in
the study were contacted before initiating the study. School heads and relevant authorities
were debriefed about the nature and aim of the research in a one-to-one meeting and
through a participant information sheet provided in a written format. The meeting outlined the
exact involvement of the school and pupils and the invitation to parents to participate in the
study. Consent forms were designed for school heads participating in the research to
indicate that they understood the involvement expected from the school and pupils and to
allow the research to go ahead.
Having, obtained permission to conduct the study in the school, teachers from standard five
were met and asked to provide a list of students who intended to participate in the research.

116
Consent for children’s participation in the study came through the definite choice of the
principal to participate in the research.
Over and above, teachers were asked to emphasise the voluntary nature of participation in
the study and to inform the students that they had the option to end their involvement at any
time if they felt uncomfortable with the testing process. All the students who participated in
the research received a pencil and a rubber as a token of appreciation for their efforts.
To, mitigate issues arising from cultural sensitivity, all the question papers were designed in
bilingual formats (English and Hindi). Schools were free to choose the medium of testing
which felt appropriate, keeping in mind the students’ comfort and fluency. Even while
translating the test instruments, assistance was sought from language experts to ensure
validity, appropriateness, minimum levels of complexity and culture-specific words used in
the northern state of Delhi.
Secondly, data were collected through questionnaires, testing instruments and in-depth
interview schedules. Students were identified with a unique student ID, thus remaining
anonymous. Data was retained using the UK’s data deposit service, and field laptops and
computers were secured using stringent passwords to protect data in the case of any
untoward incident.
Thirdly, an independent team of trained test volunteers were sent out to schools who
monitored the testing process. The test volunteers forbade teachers from helping the
students and also ensured that there were no cases of cheating amongst the students during
the tests.
Fourthly, there was little opportunity for teachers to prepare students through any sort of
technique such as rote learning. All the schools were informed that the diagnostic test was
designed to test the understanding of the students with minimal weighting on fact-based
questions which favour rote and memorisation. Students were informed that it was a low-
stakes test to minimise issues such as the stigma of failure, penalisation in case of weak
performance or any sort of association with grades affecting their future.
3.16 Conclusion
The research aims to gather evidence through mixed methods. The current chapter
describes the ontology, epistemology and lays out the detailed strategy for using mixed
methods to analyse data collected through the field research. Elaborating upon the use of
mixed methods, I have further outlined the used of data triangulation which combines data
through both quantitative and qualitative techniques to produce meaningful insights.

117
Instrument design, its field administration and its fine-tuning after the pilot testing have been
discussed in detail to showcase the rigour of the tools used in the study.
Conditions about validity, reliability and ethics have been outlined, and the necessary steps
to satisfy the requirements are discussed in detail.
The next chapter describes the findings and insights generated from in-depth interviews with
the participants. Chapter five discusses the implications of the findings and the final chapter
concludes.

118
Chapter Four: Analysis and results
4.1 Introduction
Using a mix methods strategy to analyse the data gathered in field research, I combine
quantitative and qualitative approaches to study the impact of the RTE Act indicators. The
descriptive statistics include measures of central tendencies – mean, median and mode – to
gain necessary information and build demographics of the. The research primarily uses
linear and logistic regression models to draw a clear perspective on the relationship between
student achievement and the different input indicators including physical indicators in
schools, teachers, RTE Act tenets and curriculum. The quantitative findings are supported
by qualitative insights wherever appropriate.
The purpose of this study is to explore the impact of the RTE input indicators on student
achievement. Using diagnostic test scores and IQ test scores gathered from private schools
during my field research, I intend to seek insights into the following questions.
Is there any relationship between student achievement and the RTE Act’s emphasis
on physical indicators?
Do the RTE Act’s teacher indicators have any impact on student learning outcomes?
Does following certain core guidelines of the RTE Act rigidly have any impact on
student test achievement?
Does following the RTE Act’s institutional academic indicators have an impact on
student achievement?
In correlation with the above questions, how do low-cost school owners view the RTE
Act’s regulations?
The thesis used three different questionnaires to gather quantitative data. These include;
student questionnaire, teacher questionnaire and school questionnaire. In the case of
student questionnaires, there were two sets of questionnaires; the first one collected
information on 13 variables, including information related to student’s homework, the
availability of teaching and learning material and tuitions attended by them. The second set
of questionnaires collected the data on the surrogate socioeconomic indicators, details about
family size, parental education as well as their occupation. The teacher questionnaire was
comprised of three parts. The first gathered information about general background, job
status, experience levels, educational qualifications, pay grades and subjects taught by
them.

119
The second part focused on variables about homework-related activities and the last dealt
with variables associated with teachers’ attitudes towards students during classroom
transactions.
Qualitative data in the study was generated through in-depth interviews with school
principals. An in-depth interview guideline, capable of producing different themes was
designed. The tool focused on obtaining information related to the Right to Education Act,
the norms listed under the schedule of the RTE Act and schools’ strategies to adhere to the
RTE Act norms. Verbatim from the school principals or owners could not be voice recorded
for analysis as the participants did not permit it. Hence, the researcher relied on detailed
handwritten notes that were prepared during the interview and then they were transferred to
a word document on the very same day. This was done to prevent any loss of information
that could have occurred due to memory lapse from the point of collecting the data to
recording it. After transferring the detailed notes to a single document, using a constructivist
design, the researcher coded the notes into headings and further classified them into
subcategories. For instance, wherever phrases such as - ‘struggle for quality education’, ‘first
generation learners’, ‘provide education to poor’, ‘uplift financially backward areas’ occurred
they were classified under the main heading School inception and establishment. Table 22
provides the various code heading and subcategories that were generated from the
qualitative interview notes.
Code headings and the sub-categories generated from the document formed the basis of
school monographs presented later in the analysis chapter. Verbatim quotations from the
interviews have been provided and combined with analytical insights wherever required.
The roadmap of the chapter is designed around four different sections. The first begins by
presenting descriptive statistics relating to both the diagnostic test and Raven’s IQ test – test
score distribution patterns, differences in scores between the districts and the extent to
which infrastructure decreed by the RTE Act was available across the schools. A regression
model determines the impact of the different covariates on the diagnostic and IQ test.
Further, an ANOVA test was undertaken to determine if there were any mean differences
between the scores of the private schools which complied with some or many requirements
of the RTE.
The second section reports the demographic and pedagogical practices by teachers and
determines the various teacher covariates capable of influencing test scores. Core indicators
from the RTE Act are discussed in the third section. Using a binomial logistic model, I report
the impact of the RTE Act’s core indicators on test scores in the third section. The final
section is comprised of school monographs, presenting an elaborate record of conversations

120
with school owners and heads. It aims to provide insights into approaches adopted by
schools to deal with the Act’s regulations. Qualitative and quantitative insights are bound
together in several instances.
Findings about infrastructure, teacher parameters and the RTE Act’s guidelines are obtained
from linear and multiple regression, intertwined with data from interviews with school owners
and heads.
4.2 General descriptive findings
4.2.1 Overall stakeholder participation
The field study was comprised of a diagnostic test and Raven’s IQ test. 305 students
participated in the diagnostic test, and 293 students participated in Raven’s IQ test of
matrices. Participation in Raven’s test was reduced as one of the schools cancelled the
second day of testing, and some students at other schools were absent that day too. 39
teachers and 12 principals agreed to take part in the research interview process. Table 26
presents a snapshot summary of the participants in the research.
Table 26 – Snapshot summary of the research
Item Private school
participation
Comprehensive Diagnostic test student
participation
305
Raven’s IQ test student participation 293
Student questionnaire with SEC variables 202
Teacher participation 36
Principal participation 12
The next section looks at test score differences between the private schools and identifies
the variance between the scores across the different subjects.
4.2.2 Test scores differences within private schools
305 students from low-cost private schools took the diagnostic test. A few other students
were absent from participating schools, so 12 fewer students took Raven’s IQ test. Mean
test scores across the subjects were reported to be (μ = 32.90) with a standard deviation of
(σx= 5.42) and variance of (σ2 = 29.45). A high standard deviation explains the widespread
of scores.

121
Table 27 - Test score distribution
N Mean Std. Dev. Variance Language Scores 305 13.15 2.35 5.51 Maths Scores 305 10.87 2.19 4.83 Evs Scores 305 8.86 2.35 5.52 Total test score 305 32.90 5.42 29.45 Total IQ score 293 29.23 11.81 139.53
A valuable insight that can be drawn from the test results is that the performance of the
children seems to fall as they progress through the test. The highest mean score was
observed in language (μ = 13.15) and the lowest was in EVS (μ= 8.86), indicating a sharp
drop in mean scores by 4.29 points (Table 27). There could be two possible explanations for
the decline in test scores. First, fatigue might have set in amongst students, and they may
have attempted to complete the test papers in a hurry so there is a likelihood that they could
have chosen incorrect answer options in the multiple-choice diagnostic test.
The other reason could be that students were aware that the assessment was a low stakes
test36 and hence may not have attempted all the questions until the end. Variance for the
private schools indicated a lower spread between the scores (σ2l =5.51, σ2
m=4.83,
σ2evs=5.52) (ref. table 27).
The highest mean for the diagnostic test amongst the participating schools was (μ= 36.93)
with a low standard deviation (σx = 3.174) indicating that the scores were not much spread
from the mean. On the other hand, the lowest mean scores were, reported at (μ = 29.77)
with a standard deviation (σx = 4.22) reflecting a broader disparity in scores from the mean.
The highest total test scores across the participating schools was 44 and the lowest was10
(ref table 28).
Table 28 – School wise descriptive statistics for diagnostic test
Name of the school
N Mean Median Min. Max. Range Std. Dev. Variance
School A 66 31.76 32 23 40 24 4.14 17.17 School B 51 31.88 33 10 44 34 6.85 46.91 School C 16 32.38 33 23 39 16 4.56 20.78
36 Students in India usually take high stakes testing seriously due to the important consequences associated
with it. A high score or successfully clearing the test can lead to important benefits such as a high school
diploma, a scholarship or a licence to practise a profession

122
Name of the school
N Mean Median Min. Max. Range Std. Dev. Variance
School D 18 33.72 34 25 42 17 4.72 22.33 School E 12 33.17 32 28 40 12 4.26 18.15 School F 14 36.93 38 29 41 12 3.174 10.071 School G 11 36.09 36 28 44 16 4.549 20.691 School H 57 31.65 32 18 41 23 5.79 33.63
School I 13 29.77 29 22 37 15 4.22 17.85 School J 47 35.85 34 20 43 23 4.76 22.69 Total 305 32.90 34 10 44 34 5.42 29.45
Mean test scores on for Raven’s IQ were, reported at (μ= 29.23) lower than the diagnostic
test scores. Furthermore, compared to the diagnostic test, the standard deviation (σx= 11.81)
and the variance (σ2= 139.58) were also quite high, indicating a wide variation in scores from
the mean. Comparing, between schools, the highest mean score for Raven’s test was
reported a (μ = 37.71), and the lowest mean stood at (μ = 10.08). Interestingly, the standard
deviations were almost similar at both the schools, where the highest and the lowest mean
scores were reported, indicating that there was not much disparity in the I.Q. test scores (ref
table 29).
Table 29 – School wise descriptive statistics for IQ test
School N Mean Median Min. Max. Range Std. Dev.
Variance
School A 65 29.31 32 3 46 43 10.80 116.59 School B 46 27.09 29.5 0 45 45 11.92 142.08 School C 14 37.71 38.5 29 49 20 6.49 42.22 School D 18 27.33 26 12 48 36 11.32 128.24 School E 12 34.67 36 23 46 23 6.47 41.88 School F 14 21.57 20.5 8 38 30 10.28 105.64 School G 11 27.18 24 10 46 36 12.07 145.76 School H 55 27.93 31.0 7 45 38 10.52 110.69 School I 12 10.08 10.5 1 24 23 6.85 46.99 School J 46 37.35 40.05 11 51 40 9.823 96.49 Total 293 29.23 32 0 51 51 11.81 139.53
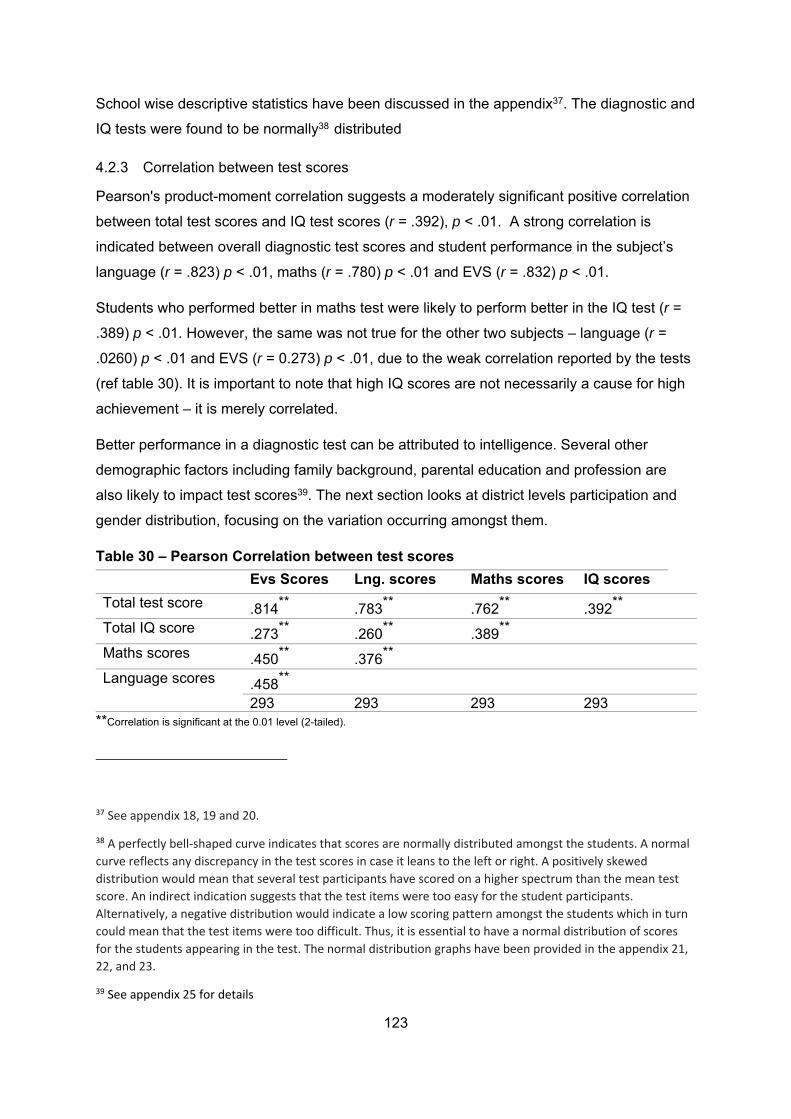
123
School wise descriptive statistics have been discussed in the appendix37. The diagnostic and
IQ tests were found to be normally38 distributed
4.2.3 Correlation between test scores
Pearson's product-moment correlation suggests a moderately significant positive correlation
between total test scores and IQ test scores (r = .392), p < .01. A strong correlation is
indicated between overall diagnostic test scores and student performance in the subject’s
language (r = .823) p < .01, maths (r = .780) p < .01 and EVS (r = .832) p < .01.
Students who performed better in maths test were likely to perform better in the IQ test (r =
.389) p < .01. However, the same was not true for the other two subjects – language (r =
.0260) p < .01 and EVS (r = 0.273) p < .01, due to the weak correlation reported by the tests
(ref table 30). It is important to note that high IQ scores are not necessarily a cause for high
achievement – it is merely correlated.
Better performance in a diagnostic test can be attributed to intelligence. Several other
demographic factors including family background, parental education and profession are
also likely to impact test scores39. The next section looks at district levels participation and
gender distribution, focusing on the variation occurring amongst them.
Table 30 – Pearson Correlation between test scores
**Correlation is significant at the 0.01 level (2-tailed).
37 See appendix 18, 19 and 20.
38 A perfectly bell‐shaped curve indicates that scores are normally distributed amongst the students. A normal
curve reflects any discrepancy in the test scores in case it leans to the left or right. A positively skewed
distribution would mean that several test participants have scored on a higher spectrum than the mean test
score. An indirect indication suggests that the test items were too easy for the student participants.
Alternatively, a negative distribution would indicate a low scoring pattern amongst the students which in turn
could mean that the test items were too difficult. Thus, it is essential to have a normal distribution of scores
for the students appearing in the test. The normal distribution graphs have been provided in the appendix 21,
22, and 23.
39 See appendix 25 for details
Evs Scores Lng. scores Maths scores IQ scores
Total test score .814** .783** .762** .392** Total IQ score .273** .260** .389**
Maths scores .450** .376**
Language scores .458**
293 293 293 293

124
4.2.4 Difference in test scores of private schools across Delhi districts
Student representation was analysed by the proportion of students represented from each
district participating in the study. Data from
the four districts, reveals that most districts
had a representation of 20% or more except
the North. The maximum representation of
students was from the Southern district
(41%) followed by the Western and Central
districts. The Northern district included only
6% of the total student representation (ref
fig. 11).
Variation in performance of students across different districts
A one-way MANOVA test was undertaken to determine the variation in student performance
between the various participating districts. The test assisted in identifying the vector of the
means, among the groups, of the independent variables. Assumptions related to the test
have been discussed in Appendix 24. The analysis tests for the significant differences
between the groups and the newly formed composite variable.
The dependent variables included the ‘total diagnostic test scores’, and the ‘total IQ test
scores and the independent variables comprised of the different districts of Delhi.
Table 31 provides the multivariate tests, the primary outcome of the MANOVA analysis.
These include; Pillai’s Trace, Wilks' Lambda, Hotelling's Trace and Roy's Largest Root for
determining the statistical significance between groups (Laerd Statistics, 2015). However,
the most commonly recommended test is Wilks' Lambda, and hence, this research uses it to
determine the statistical significance, and it is, determined by the p-value in the “Sig” column.
The test was found to be statistically significant if p < .05 and it is evident from the table
below that p is statistically significant, implying that there is less than a 5 in 10,000 chance of
the vector means being different, provided the given null hypothesis be true. Thus it can be
concluded that there exists a statistically significant difference in the test scores between the
participating districts on the combined dependent variables, (i.e. test scores) F (6, 576) =
6.75, p < .0005; Wilks'Λ = .87; partial η2 = .07 (ref table 31).
Figure 11- District participation figures
20%
6%
41%
33%
0% 10% 20% 30% 40% 50%
% Reprsentation
West A South North Central

125
Table 31 – MANOVA analysis across districts
Effect Value F Hypothesis df
Error df
Sig. Partial Eta Squared
Intercept Pillai's Trace .95 2867.255b 2.00 288.00 .000 .95 Wilks' Lambda .05 2867.255b 2.00 288.00 .000 .95 Hotelling's Trace 19.91 2867.255b 2.00 288.00 .000 .95
Roy's Largest Root
19.91 2867.255b 2.00 288.00 .000 .95
Final Districts
Pillai's Trace .13 6.56 6.00 578.00 .000 .06 Wilks' Lambda .87 6.756b 6.00 576.00 .000 .07 Hotelling's Trace .15 6.95 6.00 574.00 .000 .07
Roy's Largest Root
.14 13.659c 3.00 289.00 .000 .12
4.2.5 Gender distribution across districts
Gender distribution by districts revealed
that there was an equal representation of
boys and girls from the central district. The
western district also came close to an
equitable distribution. However, the
proportion of boys were found to be slightly
more as compared to girls. Boys constituted
2/3rd of the sample from the southern district compared to girls (37%). The Northern district
had the highest disparity with almost 78% of the sample being boys.
Gender disparity is a huge issue in Indian society where boys are much preferred over girls,
and parental focus is on male children as the ‘male child’ is considered to be the
breadwinner and social security avenue for parents. It is heartening to see the push in the
central and western districts where gender distribution is almost equal. This reflects
changing trends and beliefs in Indian society (ref fig 12).
The next section focuses on the first research question which aims to identify the
relationship between the physical infrastructural indicators mentioned in the RTE Act and its
impact on the learning outcomes of students enrolled in low-cost private schools.
4.3 Descriptive findings on RTE Act infrastructure indicators in private schools
Having understood the differences in test scores across schools and districts, I report the
different physical facilities available in low-cost private schools from the participating
districts. Necessary facilities such as a concrete building, electricity, safe drinking water and
Figure 12 - Gender distribution across the districts
50 50
78
22
63
3758
42
020406080100
Boy Girl Boy Girl Boy Girl Boy Girl
Central North South West

126
blackboard facility were found in 100% of the schools. More than 90% of the schools
claimed to have office-cum-store and separate toilets for boys and girls (Ref. table 32).
Close to three-quarters of the schools (73.1%) reported a separate classroom for every
teacher and most schools secured their periphery with a boundary wall (94.8%). However,
school designs did not prioritise access for the disabled; ‘barrier-free accesses’ as specified
in the RTE Act to assist children were reported only in 19.7% of low-cost private schools.
School feeding programmes (midday meals) are quite popular in government schools to
encourage poor parents to send their children to school, thus boosting attendance. However,
only 4% of low-cost private schools reported that they had a school feeding programme
which is most likely due to three reasons (ref table 32). First, the cost of providing meals was
quite high, and the only source of revenue that the schools had was from the fees that they
received from parents.
Therefore, providing food would be a significant overhead in their expenditure. Second, the
logistics involved in such an operation are vast and complex. Sourcing the raw materials,
employing people for food preparation, delivering high-quality food and finally maintaining
sanitation and hygiene are difficult to manage. Thirdly, most children have their breakfast at
home and bring their lunch to school, so private schools felt no obligation to provide food to
children who were enrolled in the schools.
More than ½ of low-cost private schools had libraries (55.1%), and 65.6% mentioned that
they had computer labs. Schools with libraries reported books in the range of 150 – 2000.
Computers were reported to be functional in all the schools where computer labs were
reported.
Adequate TLM that supplement pedagogy like the presence of AV resources (72.5%), and
charts or maps (78.4%) were reported in more than 70% of schools (ref table 32).
Table 32 – Infrastructure availability as per the RTE Act schedule
Item Low-cost private* Office cum stores 93.7 Separate toilets for boys and girls 94.8 Boundary walls 94.8 Barrier-free access 73.1 Availability of a library 55.1 Availability of a computer lab 65.6 Availability of charts maps to facilitate learning 78.4 Provision of MDM (mid-day-meal) 4.4 Barrier-free access 19.8

127
4.3.1 Is there any relationship between student achievement and the RTE Act’s emphasis on physical indicators?
Using, a multiple linear regression model, I determine the variation in the dependent variable
caused due to the independent variables.
⋯ ∈
The independent variables include:
x1- total IQ test score, x2 - mid-day meals served in school, x3 - barrier-free access to school
x4 - Separate toilets for boys and girls x5 – school has a library x6 – separate classroom for
every teacher, x7 – availability of AV resources. Where β0 is the constant and β1 is the
sample slope parameter for x1, and so on for other constants, ε represents the error term.
Some variables mentioned in the RTE Act are excluded from analysis as they were
commonly present indicators across all the schools. For instance, provision of clean and
potable water, electricity and blackboard were available in all the schools that were
interviewed. Assumptions related to the multiple regression including independence of
residuals, heteroscedasticity, multicollinearity and test score normality have been checked,
and detailed notes are provided in the appendix.
Table 33 shows the multiple correlation value coefficient (R= 0.483) suggesting a moderate
positive linear association between diagnostic test scores and the various infrastructural
amenities. R2 explains a 23% variance on the diagnostic test scores with an adjusted R2 of
21.4, indicating that the regression model was a modest fit, which means that 77% of the
variance was caused due to other factors in play (Mujis, 2004). The overall regression
equation model is statistically significant to determine the variation, (P[F(7)>12.388]<0.001)
(ref table 33 and 34).
Table 33 – Regresion summary on diagnostic test scores
R R Square Adjusted R Square
Std. Error of the Estimate
Durbin-Watson
.483a 0.233 0.214 4.664 1.774
Table 34 – ANOVA table for significance for diagnostic test scores
Sum of Squares df Mean Square F Sig. Regression 1886.38 7 269.48 12.388 .000b Residual 6199.97 285 21.75 Total 8086.35 292

128
Table 35 – Regression model coefficient summary on diagnostic test scores
B Std. Error
Beta t Sig. Lower Bound
Upper Bound
Tolerance
VIF
(Constant) 23.093 3.694 6.251 .000 15.821 30.365 Total IQ score .189 .024 .425 7.912 .000** .142 .236 .934 1.070 Mid-day meals served in school
4.097 1.554 .155 2.637 .009** 1.039 7.155 .783 1.277
Barrier free access to school
-1.183 .893 -.090 -1.324 .186 -2.941 .575 .586 1.706
Separate toilets for boys and girls
-.151 1.604 -.006 -.094 .925 -3.308 3.006 .634 1.577
School has a library
3.455 .882 .328 3.918 .000** 1.720 5.191 .385 2.599
One classroom for every teacher
-4.419 .945 -.373 -4.675 .000** -6.280 -2.558 .422 2.370
Availability of AV resources
-.555 .810 -.047 -.686 .493 -2.149 1.038 .571 1.752
Findings from the analysis
The model indicates that IQ tests have a positive impact on scores. The slope coefficient for
IQ score is 0.189 where (p < .05) represents the change in the diagnostic test scores for one
unit of change in Raven’s IQ test. The findings show that students scoring highly on Raven’s
IQ test scores have a high probability of scoring better on the diagnostic tests (ref table 35).
School feeding programmes are likely to have a positive impact on student test scores. The
slope of the coefficient is 4.097, where (p < .05) indicates a significant positive correlation
between test scores and school feeding. Although few private schools provide meals to the
children, it seems that in those that do, learning outcomes are positively influenced (ref table
35).
Test scores are positively impacted due to the presence of a library in the school. The slope
of the coefficient 3.455 and p < 0.5 indicates that low-cost private schools which have
libraries and make use of it are bound to improve learning outcomes. The findings are
statistically significant, (p < .05) (ref table 35).
One classroom for every teacher as mandated by the RTE Act is likely to impact test scores
negatively. The slope of the coefficient is -4.419, p<0.05, indicating a significant negative
correlation. The exact reasons for this are not known. However, it is quite likely that a single
teacher might not be competent enough to teach all the subjects.

129
Children at primary levels have varying levels of competencies and allocating a single
teacher per classroom for teaching different subjects such as language, maths and EVS is
unlikely to yield positive test scores across different subjects (ref table 35). However, the
limited sample size of teachers participating in the study should be kept in mind before
arriving at any concrete conclusion. The discussion chapter highlights the limitations of the
current research study.
Other infrastructure factors such as barrier-free access, separate toilets for boys and girls
and the availability of AV resources were also found to have a negative impact on test
scores. However, the findings were not statistically significant, as p>.05 across these
variables.
Summary
Of the six RTE Act variables, only two variables (provision of meals to children and library)
were found to have a significant impact on student test score. Other infrastructure indicators
including barrier-free access, provision of ‘gender separate’ toilets, availability of audio-video
resources, were found to be statistically insignificant, suggesting that meal provision and
library presence are of greater significance as compared to other indicators.
However, it should be noted that overall, the number of schools in the sample which provide
food to children is quite low and results should be interpreted in light of this fact.
The next section focuses on the detailed findings related to teacher variables and attempts
to study their impact on student outcomes.
4.4 Descriptive findings from teacher data
The first question focused on the extent to which infrastructure factors affect student
learning. The second research question looks at different teacher attributes listed in the RTE
Act and its schedule that are likely to influence students’ test scores.
Three teachers were chosen from each school and data about them was gathered through a
semi-structured questionnaire. However, for analysis, data from one teacher was
corroborated and aligned with student data to understand the associative relationships.
Teachers were chosen from the elementary levels, and it is highly likely that teachers
involved in the study from the respective schools taught any one of the subjects (Language,
Maths, EVS) or possibly all of them. The findings should be interpreted with caution due to
the limited sample size of teachers participating in the study.
130
Before addressing the research question, I report the descriptive statistics associated with
teacher demographics, pedagogical practices and PTR ratios from private schools
participating in the study.
Teacher demographics include aspects such as job status, remuneration range, educational
qualifications, teaching experience and the subjects taught. Pedagogical practices refer to
teachers’ general attitude towards meeting learning objectives.
Demographic findings from teacher data indicate that nearly 3/5th of teachers (58.7%) have
a permanent position. Qualitative interviews revealed that one potential reason for low-cost
private schools to hire teachers temporarily could be to test their capabilities during the
probation period, following which the school is under no obligation to retain those who
underperform. The contract system ensures efficiency so that schools are capable of
retaining the best teachers.
Salary scales seem to have several layers in low-cost private schools, more than 2/5th of the
teachers (43.6%) reported drawing monthly salaries between ₹2500 – ₹3999 INR (£27 –
£44). 10.7% of the teachers mentioned that their monthly salaries ranged between ₹4000 –
₹5999 INR (£44 – £67). Nearly a fourth of the teachers (26.9%) reported monthly earnings
between 6000– 9999 INR (£68 – £112). 20% of the teachers said that their monthly
earnings were between ₹10000 – ₹20000 INR (ref table 36).
Under the RTE Act’s legislation, the central government has mandated that unrecognised
low-cost private schools must raise pay levels for teachers. However, this is challenging as
low-cost private schools operate on enormous fixed costs, including rents, maintenance bills
and investments in capital expenditures. On the other hand, revenue margins are usually
thin and dependent on school enrolments, and educational institutions are not allowed to
make a profit on their investments. Due to such tight stipulations, low-cost private schools
are unable to increase remuneration for their staff as ordered by the government.
Close to 1/5th of the teachers (21.6%) reported that they had neither a graduate or
postgraduate degree. 63% reportedly had a graduate degree, and 15% held postgraduate
degrees.
Nearly a third mentioned having 1-3 years’ experience, more than ½ (56.1%) were found to
be experienced in the range of 5-10 years, and less than 5% reported more than 15 years’
experience (ref table 36). Teachers in low-cost private schools are expected to teach
multiple subjects to the same grade – more than 2/5th of teachers (43.6%) reported teaching
all the subjects in the grades that they taught (ref table 36).

131
Table 36 - Teacher demographics
Item Low-cost private* Job status - permanent 58.7 Monthly Salary Range (INR/£) 2500 - 3999 (£27 - £44) 43.6 4000 – 5999 (£44 - £67) 10.7 6000 – 9999 (£68 - £112) 26.9 10000 – 14999 (£113 - £169) 4.3 15000 – 19999 (£170 - £228) 15.4 Educational qualifications Below Graduate 21.6 Graduate 63.0 Post graduate 15.4
Teaching experience 1-3 Years 35.7
3-5 years 4.6 5-10 years 56.1 More than 15 years 3.6 Subjects Taught Maths only 18.7
Language only 21.6
EVS (Environmental sciences only) 16.7 All three subjects taught 43.0
4.4.1 Pedagogical practices and teacher attitudes
Teachers were questioned about their pedagogical practices. All teachers interviewed
accepted that they read lessons aloud while explaining them to the students and 100%
agreed that they ask questions relating to the topic while teaching lessons.
Learning through drills and repetitive
practices is quite a standard way to
explain difficult concepts and more than
3/4 of teachers (76.1%) confirmed that
they use worksheets for practising
problems. All the students were asked to
undertake some form of homework daily,
as a part of their learning enhancement
process (ref fig 13).
76.1
18.7
5.2
0.0
20.0
40.0
60.0
80.0
100.0
Often Sometimes Never
Figure 13 – Worksheets provided by teachers

132
Nearly 3/4th of the teachers (74.4%) denied that they did not encourage memorising lessons
given as a part of the homework (ref table 37). 4/5th of the teachers agreed that they gave
students mathematical problems and handwriting exercises for students as practice, and
nearly a third admitted that they asked students to learn the meaning of ambiguous words as
part of their homework (ref table 37).
Table 37 – Homework related practices by teachers
Item Teacher response (%)
Homework is given to students every day 100 Students discouraged from memorising homework 74.4 Practise mathematics problems for homework 79.3
Practise handwriting for homework 81.3
Learn difficult meanings for homework 64.6
Teacher attitude in the threatened low-cost
private schools was measured, with the help of
variables like - discipline, loss of respect,
punishments, learning capabilities and beliefs
prevalent amongst them. The attitude of
teachers was found to be authoritative. Nearly
2/3rd (68.9%) believed in punishing students for
instilling discipline amongst students (ref fig 14).
Nearly 73% of the teachers felt that they are
likely to lose respect if they share jokes with students. More than 90% of the teachers
believed that 'students respect teachers only through fear’. More than half of the teachers
(57.3%) also had stereotyped beliefs such as the notion that girls are likely to be better at
language and boys are likely to be better in science and mathematics (ref table 38).
Table 38 – Teachers attitude towards students
Item Low-cost private* Believes in losing respect if he/she shares jokes with students 72.5
Believes that there is no respect without fear 94.1 All children are capable of learning 80.3 Believes that learning abilities of both genders are the same 54.4
Believes that girls perform better in language while boys are strong in maths
57.3
68.9
31.1
Yes No
Figure 14 – Punishment to be meted out for discipline

133
4.4.2 PTR (Pupil Teacher Ratio)
According to the RTE Act’s schedule, schools should maintain a PTR of 1:30. Data indicates
that six of the schools adhered to this but the remaining four schools exceeded the stipulated
norms. One of the reasons for the unusually high numbers enrolled in the schools could be
that a new school session had just begun in June. The four schools may not have
anticipated the influx so the existing teacher staff would have been asked to manage the
new set of students (see table 39).
PTR formulae calculations:
Where, = Enrolment in school i in year t, = total number of primary teachers in school i in year t.
Table 39 – Teachers, and enrolled students in schools
School code Total students Total teachers PTR Ratio
School A 740 12 61.67
School B 1000 33 30.30
School C 126 7 18.00
School D 200 10 20.00
School E 297 9 33.00
School F 300 16 18.75
School G 197 9 21.89
School H 700 40 17.50
School I 350 8 43.75
School J 600 12 50.00
4510 156 28.91
Following discussion of demographics, pedagogy and PTR across the schools, the next
section looks at the second research question which focuses on teacher attributes outlined
by the RTE Act and their impact on student outcomes.
4.4.3 Do the RTE Act’s teacher indicators have any impact on diagnostic student achievement?
To answer the above research question, I construct two different linear regression models.
The first model includes RTE Act components for teachers like training attended,
experience, single grade or double grade teacher, single subject or multiple subject teacher.
The second model is comprised of components like job status, educational qualifications,

134
salary range and parent-teacher meetings. The idea of constructing two different models
helped to select the best fit. The models also enabled experimentation with different
variables and assisted in understanding the impact of each component on student outcome.
Both equations also comprise specific variables which were polytomous (each variable had
several categories). Therefore, variables chosen in the regression model were converted to
dummy variables by re-coding them as different variables. For instance, training was coded
into three different categories — ‘recently attended training’, ‘training in the range of three to
five years’, and ‘no training attended’. Similarly, experience was classified as ‘low
experience’, ‘moderate experience’ and ‘high experience’.
Using the first equation model the research attempted to identify the impact of the following
different co-variates on student achievement
… . ∈
Where Y= total test scores x1- recently attended training x2 – training range in three to five
years x3 – highly experience x4 – moderately experienced, x5 – single grade teacher, x6 –
multiple grade teacher, x7 – single subject teacher, x8 – multiple subject teacher, is the
constant, and β1 is the sample slope parameter for x1, β2 for x2, so on for other constants
and ε represents the error term. The multiple regression model predicted the impact on
diagnostic test scores from the various teacher variables including training attended,
experience, subjects and the grades taught.
Regression estimates R2 = .112, explains that combining all the independent variable
estimates an 11.2% variation on the dependent variable (i.e. diagnostic test scores). The R2
determines a positively biased estimate of the model. The adjusted R2 for the model was
8.8% which is indicative of a small effect size according to Cohen's (1988) classification.
Assumptions40 related to the model were found to be satisfactory.
Table 41 shows that the regression model is statistically significant to determine the
variation, (P[F(8)>4.6.71]<0.001) (ref table 40 and 41)
40 The residuals were independent, as assessed by Durbin‐Watson statistic of 1.72. The model showed no
evidence of multicollinearity as the tolerance values were greater than 0.1. Visual examination of the Q‐Q
plots satisfied the normality conditions

135
Table 40 - Regression summary – RTE Act teacher indicators on diagnostic test
Sum of Squares df Mean
Square
F Sig.
Regression 1003.569 8 125.446 4.671 .000b
Residual 7949.481 296 26.856
Total 8953.049 304
Table 41 - ANOVA table for significance – Teacher indicators on diagnostic test
R R Square Adjusted R Square
Std. Error of the Estimate
Durbin-Watson
.335a .112 .088 5.182 1.722
Findings from the analysis
The results indicate that teachers who recently attended training and had an opportunity to
undergo training in the past three to five years were able to impact test scores positively,
compared to those who had never experienced any training.
The positive slope coefficients B = (2.29, 4.86) indicate that schools with trained teachers
are likely to have better test scores see (ref table 42). Teachers teaching multiple subjects
were able to influence test scores positively compared to those who taught single subjects.
The positive slope of the coefficient (2.78) was statistically significant at p<0.5. It is quite
likely that those who teach multiple subjects gain competence in different subjects over
some time and can differentiate their approach according to students’ ability level see (ref
table 42).
Teachers with high and moderate experience were likely to influence student achievement
positively, compared to teachers with low experience. The slope of the coefficients was
positive, 2.92 – highly experienced, 1.49 – moderately experienced.
Similarly, the model reported positive coefficients for single subject teachers, but the findings
were not significant (ref table 42).

136
Table 42 - Overall regression summary teacher indicators on diagnostic test score
To summarise the research question, the analysis finds that teachers who attended training
recently or had undergone training in the range of 3-5 years were likely to impact test scores
positively.
The model also reported that teachers with knowledge on multiple subjects at primary levels
could positively influence test scores. Other factors like experience and teachers who taught
single or multiple grades had a positive impact on test scores, but these factors were not
statistically significant. Having discussed the effects of teacher training, experience and
number of subjects taught, the next section focuses on other teacher indicators including
educational qualifications, remuneration and PTA (parent-teacher association meetings held
in the schools).
4.4.4 Impact of teachers job status, educational qualifications, salary range and (PTA) meetings
The second model predicted the effect on diagnostic test scores of various teacher inputs
including job status, educational qualification, salary range and PTA meetings held in
schools.
Unstandardized Coefficients
Standardised Coefficients
t Sig. 95.0% Confidence Interval for B
Collinearity Statistics
B Std. Error Beta Lower Bound
Upper Bound
Tolerance
VIF
(Constant) 26.89 1.79 15.05 0 23.38 30.41 Recently attended training
2.29 1.16 0.21 1.98 0.05** 0.01 4.57 0.27 3.64
Training range 3-5 years
4.86 1.67 0.39 2.91 0.00** 1.58 8.15 0.16 6.12
Moderately experienced
1.5 1.16 0.14 1.29 0.2 -0.78 3.77 0.27 3.74
Highly experienced
2.92 2.16 0.1 1.35 0.18 -1.33 7.18 0.54 1.85
Single grade teacher
1.2 1.85 0.11 0.65 0.52 -2.44 4.84 0.11 9.71
Double grade teacher
2.39 2.05 0.2 1.17 0.24 -1.64 6.42 0.11 10.02
Single subject teacher
2.06 1.53 0.15 1.35 0.18 -0.95 5.06 0.25 4.03
Multiple subject teacher
2.78 1.37 0.25 2.04 0.04** 0.09 5.47 0.19 5.19

137
Table 43 shows that the regression model is statistically significant to determine the variation
in scores (P[F(4)>8.987]<0.001). Assumptions41 to the regressions were found to be in
order. The regression estimate R2 = .10 explains that combining all the covariates accounted
for a 10% variation on the diagnostic test scores, indicating a modest correlation (Mujis,
2004). The adjusted R2 for the model was 9.5%, indicative of a small to medium effect size
according to Cohen's (1988) classification (ref table 43 and 44)
Table 43 – Regression summary – teacher indicators
R R Square Adjusted R Square
Std. error of the Estimate
Durbin-Watson
.327a .107 .095 5.162 1.726
Table 44 – Annova’s table for significance
Sum of Squares
df Mean Square F Sig.
Regression 958.013 4 239.503 8.987 .000b Residual 7995.036 300 26.650 Total 8953.049 304
Findings from the analysis
Educational qualification of a teacher revealed a positive effect on student test scores. The
slope of the coefficient was significantly positive at 6.082, where p<0.5. (ref table 45)
The nature of teachers contract had a negative impact on student outcomes, with the slope
of the coefficient reported at -3.420, where p< 0.5. The exact reasons for the negative
impact are not clear, but it is plausible that teachers with temporary contracts may be
involved at a superficial level, lacking authentic engagement which in-turn is likely to have a
deleterious effect on student outcomes. Salaries showed a negative correlation with
diagnostic test achievements – the slope of the coefficient was (− 5.690) and statistically
significant at p<0.5 (ref table 45). However, again it should be noted that the sample size of
teachers was limited so any conclusion from the above analysis should be drawn with
caution.
41 The equation showed that the residuals were independent and the Durbin‐Watson statistic almost similar to
the first equation (1.72). There was no evidence of multicollinearity as tolerance values were higher than 0.1
and a visual examination of the Q‐Q plots satisfied the normality conditions.

138
PTAs are unlikely to have any impact on student scores. The regression slope coefficient is
negative (− 3.581), and the covariate was not statistically significant, (p=0.001), p>.05 (ref
table 46). The qualitative interviews revealed good insights as to why the existence of the
PTA’s was a mere formality as laid out by the RTE Act, rather than an active body involved
in the improvement of academic matters. Most students in these schools come from
economically disadvantaged families where both parents are engaged in some manual
labour work and earn daily wages to sustain their families. Summoning them to a PTA
meeting is not feasible. Further elaborations on the reasons are discussed in chapter five
(ref table 45,).
Table 45 – Regression summary for teacher coefficients
In retrospect to the research question, the model indicated that teachers with better
educational qualifications are likely to impact test scores positively. Many low-cost private
schools are expected to hire teachers with senior or senior secondary education. However,
the RTE Act has laid out rules for primary teachers and upper primary teachers. Primary
teachers are required to have a diploma, and the upper primary teachers are required to
hold a B.Ed. Degree at the minimum. It is likely that teachers with better educational
qualifications have a better understanding and grasp of the subjects compared to those with
a minimum level of qualification. Therefore, they may be capable of planning lesson plans
efficiently, helping students achieve the learning objectives and raising learning outcomes.
However other factors such as teachers’ job status, salary range and the PTA meetings
were unlikely to influence the test scores.
Unstandardized Coefficients
Standardised Coefficients
t Sig. 95.0% Confidence Interval for B
Collinearity Statistics
B Std. Error Beta Lower Bound
Upper Bound
Tolerance
VIF
(Constant) 42.069 3.554 11.839 0.000 35.076 49.062 Job status -3.420 0.965 -0.311 -3.543 0.000** -5.319 -1.520 0.387 2.585Educational qualification
6.082 1.618 0.405 3.759 0.000** 2.898 9.265 0.256 3.904
Salary range -5.690 1.664 -0.417 -3.419 0.001** -8.966 -2.415 0.200 5.010
PTA meetings -3.581 1.022 -0.293 -3.503 0.001** -5.593 -1.569 0.425 2.352

139
Summary of findings
Of the eight RTE teacher variables regressed with academic test scores, five variables were
found to be positively associated, and three were found to be negative. Of the five variables,
only three variables were determined to be statistically significant. These include teacher
training, teachers teaching multiple subjects and educational qualifications. All three
variables which were found to be negatively associated with academic outcomes (teachers’
job status, salary ranges and the PTA meetings in schools) were found to be statistically
significant.
The next section discusses the RTE Act’s core academic and institutional guidelines. It
focuses on the third and fourth research question, attempting to understand the influence of
the guidelines on student outcomes.
4.5 Descriptive findings on the RTE Act’s core and academic guidelines
The RTE Act’s guidelines include awareness of the Act, teachers attending RTE Act
orientation, providing free and compulsory education to children, admitting children without
transfer certificates, constituting an SMC in the school and some others outlined in tables 46
and 47. Descriptive findings revealed that although private schools complied with the norms,
they candidly admitted that they could not follow every letter of the RTE Act. About 4/5th of
the schools (83.7%) reported that there was a copy of the RTE Act on premises at all times.
Teacher orientation on the RTE Act was not made mandatory, and only 41.1% of the
principals agreed to send their teaching staff to orientations. More than a third of the school
leaders (35.4%) reported that education was free in their schools and children aged 6 –11
were not charged tuition fees. Qualitative interviews with principals reported that deserving
students were provided with scholarships and bursaries to support their schooling. 77% of
the schools said enrolling new students without a transfer certificate (TC) and denied
expelling or dismissing children from the school on the grounds of poor performance or as a
part of a disciplinary measure. 63.5% of schools confirmed that they encouraged the
admission of disabled students (ref table 46).
Table 46 – Core RTE guidelines
Item Low-cost private*
Awareness of the Act 77.1 Teacher attending Act orientation 41.1 Free and compulsory education for children 35.5 School does not have a reservation policy 78.6 Children are admitted without transfer certificates 78.3 Admission of disabled children in the schools 63.5

140
The RTE Act prescribes specific governance structures like the presence of school
management committees (SMCs) and parent-teacher associations (PTA) for better
engagement between parents and school administration. The RTE Act also states that the
school should facilitate overall development, build talent and knowledge through methods
like ‘learning by doing’. The rationale for such structures is to enhance student engagement
and welfare, thereby leading to improved student test scores and high achievement.
Moreover, the Act also requires private schools to provide mandatory training to teachers,
allow free and compulsory education to 6 –14 year-olds and adopt a reservation policy for
the scheduled castes (SC) and scheduled tribes 42(ST). School heads were asked about
their opinion on the fundamental RTE Act tenets followed in their school. Table 47 provides
detailed findings related to the presence of an SMC and views of principals on the syllabus
and curriculum-related parameters as listed in the RTE Act.
Table 47 – SMC, Curriculum and syllabus related findings
Item Low-cost private (%) RTE mandates Teachers attending RTE orientation 41 Reservation policy followed 21.6 Admission of children with disability 64.6 Presence of an SMC 26.6 PTA meetings established 73.1 RTE’s tenets on curriculum and development Syllabus helps in overall development 57.2 Syllabus builds talent and knowledge 58.8 Curriculum places importance to learn through activities 58.2
More than 2/5th of the schools (41%) sent their teacher for RTE Act orientation. Although the
Act prescribes free and compulsory education, almost all schools reported charging fees
from their students. Reservation policies were evident in 21.6% of the schools. These
schools allocated a limited number of seats for children who came from the SC and ST
backgrounds. Close to 2/3rd of the schools (64.6%) reported admitting children with a
42 Traditionally children from scheduled castes and tribe come from socially and educationally backward class
or such other groups having disadvantage owing to social, cultural, economic, geographical, linguistic, gender
or such other factors. Such groups are identified and specified by the Government of India

141
disability. 57.2% of schools said that the syllabus helped the children to some extent in their
overall development (ref table 47).
The next section focuses on the third core research question, trying to understand the
influence of the Act’s core guidelines on student test outcomes.
4.5.1 Does following the RTE Act’s core guidelines rigidly have any impact on students’ test achievement?
To answer the above question, I use a binomial logistic regression model to estimate the
effect of the independent RTE covariates on the dichotomous dependent variable, test
scores
Logit(Y) = β0 + β1X1 + β2X2 +...βnXn+ e.
Where Y is the test score range with a dichotomous response, β0 is the intercept (constant),
β1 is the slope parameter (slope coefficient) for X1, β2 for X2 and so on for other constants.
The independent variables include – X1= thorough awareness of RTE, X2=teachers
attending RTE orientation, X3 = Range of fee charged by the school, X4 - RTE reservation
policy followed by the school, X5 - disability policy followed by the school, and X6 - presence
of an SMC in the school. e represents the errors/residuals.The model was statistically
significant, χ2 (6) = 27.79, p < .0005. The equation explained the variation in the ranges of
test scores at 12% based on Nagelkerke R2 and classified 63.3% of the cases accurately.
Of the six predictor variables, only two were statistically significant: a fee category and
presence of SMC (ref. table 48 and 49).
Table 48 – Test of significance
Table 49 – Regression model summary
-2 Log likelihood Cox & Snell R Square Nagelkerke R Square 395.001a .087 .116
Findings from the analysis
Unaided schools which charge fees in a higher range, above INR 600 (approximately £7 per
month), are less likely to raise their students’ test score, compared to those which charge
Chi‐square df Sig.
Step 27.790 6 .000 Block 27.790 6 .000 Model 27.790 6 .000

142
fees at a lower rate. The negative B coefficient –1.213 is found to be statistically significant,
where p<0.5. Further potential causes for this are proposed in the discussion section.
Schools with SMCs are likely to raise test scores. The equation reported a positive
coefficient B= (1.483), statistically significant at p<0.5. Qualitative interviews indicate that
schools with SMCs focus on academic issues and take measures if there are aberrations
from set academic targets. Such proactive steps by the SMCs might be assisting in raising
the overall achievement of students in the school. Other factors such as thorough knowledge
of the Act’s norms, teachers attending RTE Act orientation and reservation policy are
unlikely to raise test scores. However, the values are not significant: p>0.5.
Inclusion (admitting children with disability) is likely to raise academic achievement. One
possible explanation that emerged from the discussions was that the standard PTR was on
average 1:30. A student with a disability, when able to gain access to a classroom, benefits
from the discussions and interactions of other students. The other possible explanation could
be - that teaching children with special needs may require better preparation of subject
concepts. Therefore, teachers who have thorough knowledge and conceptual clarity are
likely to have good academic discourse in classrooms which in turn could raise achievement
levels. However, the effect of this variable was not statistically significant: p>0.5 (ref table
50).
Table 50 - Binomial logistic regression summary with RTE core indicators
Summary
To, answer the research question, more low-cost private schools need to establish school
management committees to strengthen decision making with parents. Improving inclusion in
schools is likely to affect test scores positively. However, other factors like providing RTE Act
orientation to teachers and following a reservation policy are not expected to yield any
positive impact on student outcomes.
B S.E. Wald df Sig. Exp(B) 95% C.I. for EXP(B)
Lower Upper RTE Act awareness -.389 .346 1.264 1 .261 .678 .344 1.335 RTE Act orientation -.512 .475 1.161 1 .281 .599 .236 1.521 Fee category -1.213 .429 8.001 1 .005** .297 .128 .689 RTE reservation policy
-.621 .540 1.319 1 .251 .538 .186 1.550
Disabled children .114 .401 .081 1 .776 1.121 .511 2.461 SMC presence 1.483 .358 17.123 1 .000** 4.405 2.182 8.891 Constant .962 .587 2.691 1 .101 2.617

143
Moreover, the model also indicates that private schools need to maintain relatively low fees if
they intend to raise achievement scores in the long run.
The next section focuses on analysing the impact of the RTE Act’s academic indicators and
its effect on the diagnostic test scores involving language, maths and EVS.
4.5.2 Does following the RTE Act’s institutional academic indicators have an impact on student achievement?
To answer the above question, I regress the diagnostic test score with academic indicators
as listed in the RTE Act. The following equation attempts to determine the relationship
between the covariates and test scores.
⋯ ∈
Where Y= diagnostic total test scores, x1 – children are held back in the same class, x2 –
existing curriculum aids to learn through activities, x3 – Continous comprehensive evaluation
(CCE) undertaken in school, x4 – Schools not aware about CCE, is the constant, and is
the sample slope parameter for X1, so on for other constants and ε represents the error term.
Assumptions43 related to the model were found to be in order. The overall model was
statistically significant to determine the variation scores (P[F(4)>3.788]<0.001). Regression
estimates R2 = reported a 35% variation on the dependent variable diagnostic test scores).
The adjusted R2 for the model was 48%, indicative of medium to large scale effect (ref table
51, 52)
Table 51 - Overall regression summary – RTE Act curriculum indicators
Table 52 - ANOVA table for significance – RTE Act curriculum related indicators
Sum of Squares
df Mean Square F Sig.
Regression 430.419 4 107.605 3.788 .005b Residual 8522.630 300 28.409 Total 8953.049 304
43 The Durbin Watson statistic was reported at (1.895) indicating that the residuals were independent. The
data showed no signs of multicollinearity, as the tolerance and VIF values were satisfied. The Q‐Q plots
assessed normality, and the score distributions showed no signs of abnormality.
Model R R Square Adjusted R
Square
Std. Error of
the Estimate
Durbin-
Watson
1 .219a .048 .035 5.330 1.895

144
Table 53 – Individual summary of the curriculum indicators
Unstandardized Coefficients
Standardized Coefficients
t Sig. 95.0% Confidence Interval for B
Collinearity statistics
B Std. Error
Beta Lower Bound
Upper Bound
Tolerance
VIF values
(Constant) 30.490 1.846 .091 16.52 .000 Children are held back in same class
–1.011 .869 .244 1.164 .245 -.088 .067 .524 1.910
Curriculum helps to learn thru activities
2.677 1.019 .032 2.627 .009** .206 .150 .367 2.727
School undertakes CCE
.381 1.625 -.006 .235 .815 .150 .014 .169 5.935
Schools not aware about CCE activities
-.071 1.886 .091 -.037 .970 -.161 -.002 .136 7.330
Findings from the analysis
Of the four independent variables, only one of the variables seemed to influence the test
scores positively and was statistically significant. Schools which followed a ‘learning by
doing’ policy influenced the test scores positively. The co-efficient b= 2.67 was statistically
significant to determine the variations, p=.009, where p < .0005. Private schools which still
follow the traditional ‘rote-based’ learning models are unlikely to raise learning levels. On the
other hand, it is quite plausible that schools which allow students to experiment and
encourage more ‘hands-on work’ are more likely to motivate students and to learn better
which could translate into improved test scores.
CCE was introduced in the RTE Act as a measure of evaluating students not only by
academic performance but also taking into account the non-academic traits of the student
including accomplishments in arts, music or athletics. Embracing, Continuous,
Comprehensive Evaluation (CCE) seems to impact positively on test scores, compared to
those schools where heads were not aware of CCE measures as listed in the Act. The
coefficient was reported at .381, but it was not significant.
Another critical finding from the regression equation is the schools’ policy of obligating
children to repeat the year owing to poor performance in end of year examinations’. Children
perceive annual examinations in Indian schools as vital. These academic examinations
decide if children have acquired the desired competencies and skills in the current year for
progressing to the next year. Children scoring less than a predetermined threshold
determined by SMCs must repeat the same year.

145
Such policies in schools demotivate children as they lose an academic year if they fail to
perform in the year-end examinations. The model reports a negative correlation between
student achievement and schools that followed this policy. The slope of the coefficient was
negative, where b= –1.011 but the coefficient was not statistically significant.
Summary of the findings
The model indicated that schools which allowed students to experiment and encouraged
‘learning by doing’ were likely to see better test outcomes. Assessments followed at regular
intervals were likely to boost student achievement rather than one-time examination at the
end of the year which caused undue stress and tension amongst students to perform better.
Holding children in the same class is highly unlikely to improve student outcomes in schools.
The next section44 describes insights from qualitative studies and constructs school
monographs based on responses received from school owners and heads on the various
issues about infrastructure, teacher indicators and RTE Act-related academic and
institutional guidelines.
4.6 ANOVA analysis Anova analysis was undertaken to overcome the limitation of multiple regression. Multiple
regression suffers from the drawback of not having sufficient degrees of freedom to provide
a robust picture of the findings from the analysis. Anova analysis, thus determined if there
were any significant differences in the test scores within the private schools that aimed to
follow the RTE norms.
Table 54 shows the RTE norms that were studied in three areas which include; learning
resources, the infrastructure requirements and the teacher effectiveness. Eight norms were
studied under the learning resources area, eleven were considered for the infrastructure
requirement area, and finally, three were chosen from the teacher effectiveness area for
ANOVA analysis.
44 A complete section on demographic factors has been included in the appendix. It was critical to understand
the demographic factors of the study. However, it was out of the scope and purview of the research as the
current thesis focuses on the RTE Act’s indicators and their impact on student test outcomes.

146
Table 54 – Classification of RTE Norms
Learning resources as advised by RTE
Infrastructure as recommended by RTE schedule
Teacher effectiveness as advised by RTE
Library in the school Availability of a concrete building
Participation in RTE training
Computers in the school Availability of a drinking water facility
Teachers paid as per RTE norms
Functionality of computers Availability of electric connection
School’s awareness of government norms for teacher pay
Availability of audio-video resources
Serving mid-day meals
Functionality of audio-video resources
Separate classroom for every teacher
Toys for supplementing the study
Store and office room
Availability of charts and maps in the school?
Barrier-free access
Blackboard in the school Boundary wall Teaching-learning materials Safe drinking water facility Separate toilet for boys and
girls
Each of the areas was treated as a separate variable and questions on the relevant areas
were studied. A binary score of 0 and 1 was assigned to the variables. The variables were
further classified into further categories based on their overall scores.
Table 55 – Classification of learning resources
Learning resources variable
Infrastructure variable Teacher effectiveness variable
Schools with some learning resources
School with most learning resource
Schools with some infrastructure resources
School with most infrastructure resources
Schools following some teacher norms
School following most teacher norms

147
Table 56 – ANOVA between test scores and learning resources
Sum of Squares df Mean Square F Sig.Evs Scores Between groups 5.195 1 5.195 0.254 0.626
Within Groups 183.714 9 20.413
Total 188.909 10
Lng. scores Between groups 0.379 1 0.379 0.651 0.441 Within Groups 5.243 9 0.583
Total 5.622 10
Maths scores Between groups 1.014 1 1.014 0.961 0.353 Within Groups 9.502 9 1.056
Total 10.517 10
Total scores Between groups 4.75 1 4.75 0.648 0.442 Within Groups 65.958 9 7.329
Total 70.709 10
Table 57 – ANOVA between test scores and RTE infrastructure parameters
Sum of Squares df Mean Square F Sig. Evs SCORES
Between Groups 74.242 1 74.242 5.827 0.039
Within Groups 114.667 9 12.741 Total 188.909 10
Lng. Scores Between Groups 0.589 1 0.589 1.053 0.332 Within Groups 5.033 9 0.559 Total 5.622 10
Maths Scores
Between Groups 0.097 1 0.097 0.084 0.778
Within Groups 10.419 9 1.158 Total 10.517 10
Total Scores
Between Groups 10.584 1 10.584 1.584 0.24
Within Groups 60.125 9 6.681 Total 70.709 10
Table 58 – ANOVA between test scores and teacher effectiveness
Sum of Squares df Mean Square F Sig.Evs SCORES Between Groups 15.709 1 15.709 0.816 0.39
Within Groups 173.2 9 19.244 Total 188.909 10
Lng Scores Between Groups 0.711 1 0.711 1.302 0.283 Within Groups 4.911 9 0.546 Total 5.622 10
Maths Scores
Between Groups 0.015 1 0.015 0.013 0.913
Within Groups 10.502 9 1.167 Total 10.517 10
Total scores Between Groups 6.808 1 6.808 0.959 0.353 Within Groups 63.9 9 7.1 Total 70.709 10

148
Findings from ANOVA analysis
Anova analysis indicated that there were no statistically significant in the total scores
between the schools with different levels of learning resources, F (1,9)=0.254, p=0.626.
Further, no statistically significant differences were found in language F(1,9)=0.651,
p=0.441, maths F(1,9)=0.961, p=0.353 and evs scores F(1,9) = 0.254, p=0.626 and the
schools with varied levels of learning resources (Ref table 56 )
Table 57 reported no statistically significant difference in the total test scores, between the
schools with different levels of learning infrastructure F (1,9) = 1.584, p=0.24. No significant
difference was observed across language F (1,9) = 1.053, p=0.332 , maths F(1,9) = 0.084,
p=0.778 and evs scores F(1,9) = 5.827, p=0.039 between the schools that some
infrastructure and those which had the most in accordance with the RTE stipulations.
Table 58 shows that there was no statistically significant difference in the total test scores,
between the schools with varying levels of teacher effectiveness F(1,9) = 0959, p=0.353.
The findings indicate that there are no significant differences in the means scores of schools
with a varied combination of requirements as legislated by the RTE. It implies that the
academic and administrative conditions as demanded by the landmark act have whatsoever
no influence on the learning levels.

149
4.7 School Monographs
School heads and owners were interviewed to understand their views on RTE Act
regulations. The themes were broadly set out concerning the research questions (shown
below) and the interview guideline comprised questions on different issues such as
awareness of the RTE Act, infrastructure norms of the Act followed by schools, teacher-
related factors and steps taken by the school to fulfil regulatory standards.
The discussions also provided insights on the hassles faced by unrecognised schools while
applying for recognition and on school closure and its impact:-
Is there any relationship between student achievement and the RTE Act’s emphasis
on physical indicators?
Do the RTE Act’s teacher indicators have any impact on student learning outcomes?
Does following the RTE Act’s core guidelines rigidly have any impact on student test
achievement?
Does following the RTE Act’s institutional academic indicators have an impact on
student achievement?
In correlation to the above research questions, how do low-cost school owners view
the RTE Act regulations?
This section explores insights generated from discussions undertaken with school heads.
The primary data was collected from a sample of ten schools chosen from the different
locations of Delhi.
These schools also participated in the diagnostic and Raven’s IQ test of matrices and the
heads agreed to participate in a personal in-depth interview discussion as they wanted to
communicate their concerns associated with the RTE Act.
The schools were selected on the following basis:
Participated in the testing process
Threatened by the local state government for closure and struggling to stay active.
Required to meet certain norms to establish themselves as educational entities
Providing education to the poor communities in the impoverished regions of Delhi.
Monthly fees in the range of ₹ 100 – ₹ 1000 (£1.21 to £12.14 )
Did not have any external funding or assistance from the government
A prior appointment was sought with all the schools, and the visits were carried out on the
scheduled dates. An in-depth interview guideline was designed to gather insights from the
discussions.

150
Responses from school heads were recorded in the form of written notes in the in-depth
schedule. School heads refused to record the conversations, although confidentiality was
assured to them. They believed that controversial aspects were likely to emerge during the
discussions so it would not be appropriate to allow a recording of the conversations. The
interviews were carried out during July 1st - 22nd 2016. These in-depth interviews were
conducted in a guided conversation style.
Ten schools participated in the research and for anonymity reasons the schools were
numbered from 1 to 10. School heads and owners were quite receptive and open to probing
during the interview, facilitating insights on recognition mechanisms. Participating schools
were English-medium, meaning that lessons were conducted in English language. These
schools also taught ‘Hindi’ as a second language. All the schools participating in the
research were elementary schools comprising of grades 1-5.
Most of the information shared by the school heads referred to their struggle to remain open
and also revealed their extra-legal activities for obtaining government recognition. School
heads felt that highlighting these issues with a research scholar associated with an
internationally-renowned institution could assist in addressing them. They thought that the
study could present the difficulties faced by school owners to comply with the RTE Act’s
regulations which they found to be rigid and inflexible.
Figure 15 provides information on the various participants associated with the research and
the nature of the data supplied by each of them. The findings are presented in the form of
school monographs to answer the below research questions and also bind the findings from
the quantitative analysis.
Research Elements
Principals
Quantiative data
Qualitative data
TeachersQuantiative
data
Students
Diagnostic and Ravens IQ test
Quantiative data
Figure 15 – Participants in the research

151
At the end of the monographs, insights that emerged during the conversation are outlined
and supported with the quantitative findings presented earlier in the chapter.
4.7.1 School One
The ethos behind the establishment
Located in the Western district of Delhi and serving poor communities, the school was
established by an entrepreneur who hailed from the northwestern state of India,
Uttarakhand. The school owner struggled himself to access good quality education so was
determined to start a school in the slums of Delhi.
Following discussions with parents in
the community, and with his years of
experience, he was convinced that first
generation children from the slums
required good quality education.
On infrastructure requirement and school recognition
The school applied for government recognition in 2007. However, due to administrative and
legal issues, this was not granted. The owner was aware of the rules and regulations as
mentioned in the schedule of the RTE Act.
He views the regulations from more of an administrative angle rather than from an academic
standpoint. He further felt that the Act creates a myriad set of rules and expects small budget
schools to follow them, even though the extent to which these regulations improve learning
outcomes at elementary or secondary levels is dubious.
He further explained that the
regulatory norms listed in the Act
require more capital investments,
which act as massive hurdles for
small budget schools. Capital
investments were undertaken by the
owner to comply with the rules and regulations, so they received recognition in 2015.
However, this was ‘provisional’ which meant that the school was required to renew the
recognition certificate every year with the Department of Education.
“I am happy when children coming from poor and
impoverished backgrounds can speak English”.
School owner from School One
“RTE regulations do not seem to help improve the
learning levels of children, they are created for
harassing school owners like us”.
School owner from School one

152
As shown in table 59 the school
followed almost all the regulations as
mentioned in the RTE schedule. The
school head informed that no child with
a disability was, enrolled in the
academic year, and hence, no ‘barrier-
free’ entrance was required in the
school premises. Children enrolled in
the school usually got the meals from their homes, and therefore the school did not provide
any free meals to the children. Most books in the library were either related to the academic
subjects or were for pleasure reading including short stories books or books with poetries.
Books on puzzles, problem-solving were, not found in the library. On being enquired, the
owner reported that most children preferred to read books with more images and short
stories. Moreover, according to the owner investment in such books assisted in improving
the teacher knowledge, and assisted in better classroom transactions, which lead to better
scores in internal and external examinations.
Table 59 – School one, RTE Act’s schedule checklist
Item Norms & Standards Mark (✔) if applicable
No. of Teachers Number of teachers/days/hours
For classes 1 to 5 Up to 60 students 2 Between 61 to 90 3 Between 91 to 120 4 Between 121 to 200 5
Teaching-learning equipment
Provided to all the classrooms as required
Building All-weather building consisting of : At least one classroom for every teacher and a multipurpose office-store;
Barrier-free access X Separate toilets for boys and girls. Safe and adequate drinking water facility to all children’*
A kitchen where midday meal is cooked in the school
X
Playground
“As we charge fees, we understand that we are morally
responsible for the performance of children. We ensure
that we invest our time and energy in students, as we
understand that parents have put their faith and hard
earned savings with us”.
School owner from school one

153
Item Norms & Standards Mark (✔) if applicable
Arrangements for securing the school building by boundary wall or fencing
Minimum number of working days/ instructional hours in an academic year
For class 1 to 5 200
For class 6 to 8 220 For class 1 to 5 (Instructions hours)
800
For class 6 to 8 (Instruction 1000 Minimum number of working hours per week for the teacher (Including preparatory
Forty-five teaching including preparation hours
45
Library Library in each school providing newspaper, magazines and books on all subjects, including story-
Play material, games and sports equipment
Shall be provided to each class as required
– Facility present X – Facility not present ∞ ‐ facility status not known
The school charged a monthly tuition fee of INR 500 (approximately £5 - £6) so did not
follow the mandate of ‘free education’ provision as outlined by the RTE Act.
There were 700 children in the school, and close to 63% of these were from scheduled caste
and scheduled tribe backgrounds45.
On teachers, teaching inputs and PTA’s
Academic and subject-specific training
was conducted by external experts or
teachers from premium private
schools. School teachers were
employed for 220 working days in a
year, the equivalent of 1320
instructional hours, which was far more
than the requirement of the RTE Act. PTAs were constituted according to the Act, but they
had been dissolved since parents did not attend.
45 Refer footnote 30 for details
“Our school calls external experts from DPS and
Sanskriti schools and the teachers are trained by
the experts on the fourth Saturday of every
month.”
School owner from school one

154
Feedback on student performance was communicated through the students’ handbooks
whenever necessary. Parents were summoned to discuss student performance on the day
that results were published
School inspection and closure
Educational school inspectors visited the school twice, and the last visit was on the 2nd of
May 2016. The inspectors pointed out the absence of a scientific laboratory for children, so
the school subsequently invested in these resources.
On the issue of school closure, the owner expressed his concern that teachers would be
unemployed and the students would be forced to join the manual labour stream. He
mentioned that government schools might not have the intake capacity for admitting more
children and most children, no longer in school would be, considered under the ‘drop-out46
category.
4.7.2 School Two
Inception and RTE Awareness
The school, established by a couple, aimed to provide education to the poor residents of a
community in the Western district of Delhi.
The owners were aware of the RTE Act legislation and had applied for recognition in the
year 2012-2013, but due to a lack of fire safety certificate, recognition was refused.
According to the owner, the building complied with all the fire safety norms, but they could
not gain a fire safety certificate as officials issuing it had demanded a bribe that the owners
were unwilling to pay.
Elaborating further on the issue,
the owner explained that the
education department had
mandated other certificates such
as a building health certificate
and electricity regulations which
initially seem to be useful.
46 The government of India regular conducts a census for school going children. An increasing number in the
‘drop out’ category indicates a stagnation in the growth of human capital.
“Going through the RTE makes me feel that the laws
focused towards improving infrastructural norms. I don’t
see any of the regulations aimed at improving classroom
instructions”
School owner from school two
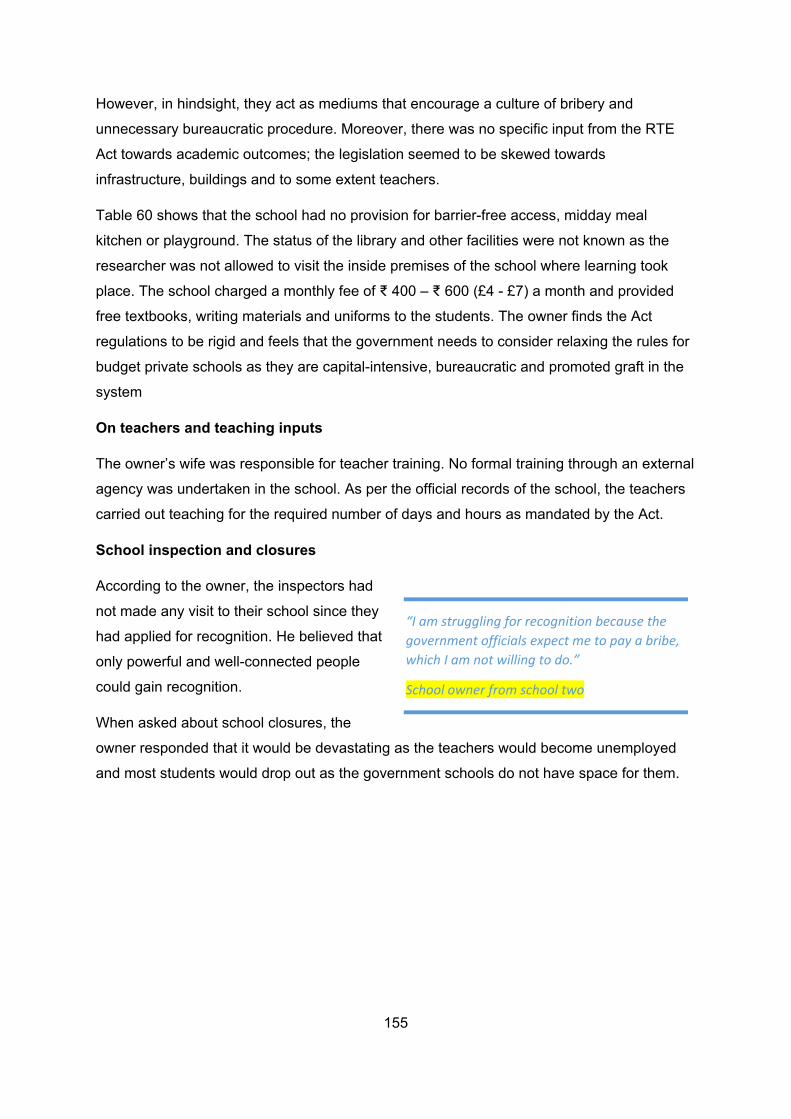
155
However, in hindsight, they act as mediums that encourage a culture of bribery and
unnecessary bureaucratic procedure. Moreover, there was no specific input from the RTE
Act towards academic outcomes; the legislation seemed to be skewed towards
infrastructure, buildings and to some extent teachers.
Table 60 shows that the school had no provision for barrier-free access, midday meal
kitchen or playground. The status of the library and other facilities were not known as the
researcher was not allowed to visit the inside premises of the school where learning took
place. The school charged a monthly fee of ₹ 400 – ₹ 600 (£4 - £7) a month and provided
free textbooks, writing materials and uniforms to the students. The owner finds the Act
regulations to be rigid and feels that the government needs to consider relaxing the rules for
budget private schools as they are capital-intensive, bureaucratic and promoted graft in the
system
On teachers and teaching inputs
The owner’s wife was responsible for teacher training. No formal training through an external
agency was undertaken in the school. As per the official records of the school, the teachers
carried out teaching for the required number of days and hours as mandated by the Act.
School inspection and closures
According to the owner, the inspectors had
not made any visit to their school since they
had applied for recognition. He believed that
only powerful and well-connected people
could gain recognition.
When asked about school closures, the
owner responded that it would be devastating as the teachers would become unemployed
and most students would drop out as the government schools do not have space for them.
“I am struggling for recognition because the
government officials expect me to pay a bribe,
which I am not willing to do.”
School owner from school two

156
Table 60 - School two, RTE Act’s schedule checklist
Item Norms & Standards Put a (✔) wherever necessary
No. of Teachers
Number of teachers/days/hours
For classes 1 to 5 Up to 60 students 2 Between 61 to 90 3
Between 91 to 120 4
Between 121 to 200 5
Teaching-learning equipment
Provided to all the classrooms as required
Building All-weather building consisting of
At least one classroom for every teacher and a multipurpose office-store
X
Barrier-free access X Separate toilets for boys and girls.
Safe and adequate drinking water facility to all children’
A kitchen where mid-day- meal is cooked in the school
X
Playground X Arrangements for securing the school building by boundary wall or fencing
Minimum number of working days/ instructional hours in an academic year
For class 1 to 5 200
For class 6 to 8 220
For class 1 to 5 (Instructions hours)
800
For class 6 to 8 (Instruction 1000 Minimum number of working hours per week for the teacher (Including preparatory time)
Forty-five teaching including preparation hours
45
Library Library in each school providing newspaper, magazines and books on all subjects, including story-books
∞
Play material, games and sports equipment
Shall be provided to each class as required ∞
– Facility present X – Facility not present ∞ ‐ facility status not known

157
4.7.3 School Three
School inception and establishment
The owner, influenced by his education felt that
‘quality education’ was the key to the
development of society. He claimed that his
school was one of the oldest schools of Delhi,
established since, 1959, with a mission to
provide good quality education to the poor.
RTE awareness and recognition
The school owner was not completely aware of the RTE Act’s rules and regulations, but he
was quick to state that he could not see that it offers any academic benefit. The school
attempted to secure recognition from the government in 1980 when the Act was not in place.
The owner candidly admitted that he never followed up with the department of education on
the status of the recognition due to the lengthy process. The school received no notification
from the education department for closure, and the owner reported that there were an
estimated 3000-3400 schools in Delhi operating without recognition.
On teachers and teaching inputs
Teacher recruitment was an issue for small budget schools as it was challenging to recruit
passionate and well-qualified teachers. The government has mandated that low-cost private
schools recruit teachers with minimum qualifications, but the owner thought that many of the
teacher training colleges in the country are not sufficiently upgraded. Therefore, teachers
lack the necessary skills to teach their relevant subject and struggle to explain difficult
concepts to children within a classroom setting. Teachers in the school did not receive any
form of in-service training to enhance their pedagogical skills. Three teachers in the school
had relevant teacher education qualifications as mandated by the government. Most
teachers had been serving the school for more than 20 years.
RTE regulations
The schools struggled to fulfil the Act’s requirements due to a lack of capital and the owner’s
unwillingness to change the outlook of the school regarding upgrading the physical
infrastructure with regards to the RTE schedule.
“I started the school with two important
objectives, first, to provide good quality
education and second to bring passionate
people into education”.
School owner from school three

158
The school was not affiliated to any particular
board of education nor did it follow the RTE Act
recommendation of providing free and compulsory
education to children between 6-14 years as the
fee paid by the students was the primary source of
revenue to the school to cover its overheads.
Typical overheads for a month included rent for
the premises of ₹ 45000 (approximately £495 –
£500), water bills of ₹ 10,000 (around £110 – £115) and charges for electricity of ₹ 10,000
(approximately £110 – £115). With such overheads to pay and school fees being the only
source of revenue, the school charged a nominal fee of ₹ 700 (approximately £7-£8) per
month and did not provide any scholarship or financial incentives to children.
The school provided books and uniforms, charging them on an actual basis. The school
struggled to keep up with several requirements of the Act as demonstrated in table 61.
PTAs, formed as a part of the RTE Act requirements, had not been active as working
parents were not able to afford time for meetings. Parental feedback or one-to-one
conversations related to students’ academic progress were conducted on the day that
examination results were announced.
Table 61 – RTE’s schedule for School 3
Item Norms & Standards Put a (✔) wherever necessary
No. of Teachers Number of teachers/days/hours
For classes 1 to 5 Upto 60 students 2 Between 61 to 90 3 Between 91 to 120 4 Between 121 to 200 5
Teaching-learning equipment
Provided to all the classrooms as required
X
Building All-weather building consisting of :
At least one classroom for every teacher and a multipurpose office-store
X
Barrier-free access X Separate toilets for boys and girls. X Safe and adequate drinking water facility to all children’
“With such overheads in place, how do
you expect me to provide free and
compulsory education as mandated by
the government? The government is not
going to pay my bills”.
School owner from school three

159
Item Norms & Standards Put a (✔) wherever necessary
A kitchen where mid-day- meal is cooked in the school
X
Playground X Arrangements for securing the school building by boundary wall or fencing
Minimum number of working days/ instructional hours in an academic year
For class 1 to 5 200
For class 6 to 8 220
For class 1 to 5 (Instructions hours)
800
For class 6 to 8 (Instruction 1000 Minimum number of working hours per week for the teacher (Including preparatory time)
Forty-five teaching including preparation hours
45
Library Library in each school providing newspaper, magazines and books on all subjects, including story-books
X
Play material, games and sports equipment
Shall be provided to each class as required
School inspection and closures
No educational inspector had visited the school in recent times. According to the owner, the
last visit was in the year 1980, and he candidly admitted that the school would be closed
down if they received any notification from the government in the future. He believed that the
government needs to take into consideration the fate of such low budget schools before
issuing them with closure notices.

160
4.7.4 School Four
School inception and establishment
Located in the southern district of Delhi and
established in the year 2002, the school was
started by an ex-military official, who served in one
of the ‘premium private’ 47 schools of Delhi.
RTE awareness and recognition
The owner was quite aware of the RTE Act norms
and regulations and had faced difficulties in obtaining recognition as the school was run on
rented premises. The Act stipulates a minimum requirement of 200 m2 of land to be owned
by the person establishing a school and the owner was not capable of meeting this
requirement. He explained that land rates in Delhi are quite exorbitant and many low-cost
school owners, including himself, are unable to purchase the land due to the high prices.
Therefore, most low-cost schools were using rented buildings. The school received a
notification from the education department, requesting them to provide details on the health
of the building in which they operated through a ‘building health certificate’.
On teacher and teaching inputs
Teacher recruitment was a challenge due to the location of the school. The owner carried
out a background check on teachers before recruiting them. Training of teachers was
undertaken by the school head himself as he had considerable experience of working in a
private school for a long time. Moreover, due to limited budgets and cash flow, the school
was not capable of hiring external experts for training. Interestingly, the school hired a
teacher for supporting children with special needs.
Concerning the RTE Act regulations, the school did not have a kitchen as there was no food
served to children. There was no playground in the school as the school itself was on rented
premises. There was limited space in the school, and therefore, the owner could not set up a
library when it was established. However, other regulations including the number of teachers
required per classroom, the working days and hours, provision of toilets and clean drinking
water to students were met by the school (ref table 62).
47 Premium private schools refers to those schools where the fee ranges from £30 ‐ £1500 a month and is
afforded by the upper middle class and affluent people in Indian society.
“I am a dedicated educationist and I have
been running this school on a ‘no loss no
profit basis’ and it’s my aim in life to
educate the poorest kids at the lowest
cost”
School owner from school four

161
Table 62 - RTE regulations checklist and school affiliation
Item Norms & Standards Put a (✔) wherever necessary
No. of Teachers
Number of teachers/days/hours
For classes 1 to 5 Upto 60 students 2
Between 61 to 90 3
Between 91 to 120 4 Between 121 to 200 5
Teaching-learning equipment
Provided to all the classrooms as required
Building All-weather building consisting of :
At least one classroom for every teacher and a multipurpose office-store;
X
Barrier-free access X Separate toilets for boys and girls. Safe and adequate drinking water facility to all children’
A kitchen where midday meal is cooked in the school
X
Playground X Arrangements for securing the school building by boundary wall or fencing
X
Minimum number of working days/ instructional hours in an academic year
For class 1 to 5 200
For class 6 to 8 220
For class 1 to 5 (Instructions hours)
800
For class 6 to 8 (Instruction 1000 Minimum number of working hours per week for the teacher (Including preparatory time)
Forty-five teaching including preparation hours
45
Library Library in each school providing newspaper, magazines and books on all subjects, including story-books
X
Play material, games and sports equipment
Shall be provided to each class as required
– Facility present X – Facility not present ∞ ‐ facility status not known

162
The school was affiliated with the CBSE board 48 curriculum, and the students numbered
300. The school charged a monthly fee of ₹ 500/- (approximately £5 – £6), so there was no
provision of free education to children between 6-14 years of age. High-achieving students
received scholarships and bursaries amounting to approximately £10-£20, and this incentive
helped children from economically weaker backgrounds to pursue their education
School inspections and closures
The owner mentioned that regular inspection
was undertaken by the educational officials.
The owner found that the school inspections
were more of a ‘fault finding’ mechanism rather
than corrective action.
He reported that officials who visited the
school on the pretext of inspection - often
expected bribes in return.
4.7.5 School Five
School inception, RTE awareness and issues
Established, in 2006, the school provides education to children from around the
neighbourhood where it is situated. The school administrator had limited knowledge of the
rules and regulations of the RTE Act. The school owner was aware of some norms and rules
of the Act but was quite sceptical that this awareness could improve the test scores of
children enrolled in primary classes.
The school had not applied for any recognition as the owner realised that they did not have
the minimum land requirement prescribed by the government.
According to the owner, in a meeting convened by the association of low budget schools,
several issues related to the RTE Act were discussed, and a proposal to be submitted to the
government was drawn.
48 Indian education system mainly comprises of four educational boards. The state board of secondary
education, central board of secondary education (CBSE), Indian School Certificate Examination and
International Baccalaureate. Schools are free to choose their affiliation to any board, provided they meet the
criteria laid out by the boards.
“I am aware of many schools, where
inspectors carry out inspections on the
pretext of inspection, however, the real
motive is to extort bribes”
School owner from school four

163
The minimum land requirement stipulated by the government for a primary school is 200m2,
but there are many unrecognised schools unable to meet this requirement. The school
owner believed that if the land requirement rules for schools were reduced to 150m2, many
budget schools would feel encouraged to apply for recognition.
Another issue highlighted by the school owner was the issuance of different certificates for
school recognition from different locations. These comprised of ‘structural stability’ and ‘fire
safety’ and ‘health and safety’. School owners were required to visit the various departments
for getting the necessary approvals. A comprehensive ‘single window’ system where all
certificates are granted by one entity could facilitate easy and fast approvals for schools
which meet all the requirements.
Teacher inputs
Teachers, were trained by a private NGO based in Delhi. The school was also assisted by
teachers from government schools who
visited the school periodically to train the
teachers. The school followed the norms of
the RTE Act in terms of the number of
instructional hours and days to be spent by
teachers in the classroom in an academic
year.
The school charged a fee of ₹ 2000 (£20 - £25) and did not provide free and compulsory
education to 6-14-year-olds as stated in the Act. However, the school did provide
scholarships to deserving children from economically weaker backgrounds of society.
The school followed the majority of rules listed in the Act which included maintaining PTR
ratios, providing separate toilets, clean drinking water, securing the building with a boundary
wall or fence and providing the required TLM to students. However, the school did not have
a library, playground or kitchen due to space constraints (ref table 63).
The owner reported that there were no visits by any educational inspector to the school in
the recent past. Land requirements stipulated by the government are a major challenge for
unaided private schools to gain recognition, and more closures could take place if the land
norms are not revised for low-cost private schools.
“Teacher trainings help in skilling our
workforce and this certainly has impacts on
how well children learn in their
classrooms”.
School owner from school five

164
Table 63 - RTE Act regulations checklist
Item Norms & Standards Put a (✔) wherever necessary
No. of Teachers
Number of teachers/days/hours
For classes 1 to 5 Upto 60 students 2
Between 61 to 90 3
Between 91 to 120 4
Between 121 to 200 5 Teaching-learning equipment
Provided to all the classrooms as required
Building All-weather building consisting of :
At least one classroom for every teacher and a multipurpose office-store
X
Barrier-free access X Separate toilets for boys and girls. Safe and adequate drinking water facility to all children’
A kitchen where mid-day meal is cooked in the school
X
Playground X Arrangements for securing the school building by boundary wall or fencing
Minimum number of working days/ instructional hours in an academic year
For class 1 to 5 200
For class 6 to 8 220
For class 1 to 5 (Instructions hours)
800
For class 6 to 8 (Instruction 1000 Minimum number of working hours per week for the teacher (Including preparatory time)
Forty-five teaching including preparation hours
45
Library Library in each school providing newspaper, magazines and books on all subjects, including story-books
X
Play material, games and sports equipment
Shall be provided to each class as required
– Facility present X – Facility not present ∞ ‐ facility status not known

165
4.7.6 School Six
School inception and issues with RTE recognition
The school was run by a newly-appointed principal
who had recently taken charge. According to the
principal, there was a government school in the
nearby vicinity which was likely to follow most RTE
Act regulations. However, parents in the area are
mostly encouraged to enrol their children in private
school. The principal was getting to know more
about the RTE Act. She was aware that the school
owners had applied for recognition in the past and had been trying to gain recognition for 5-6
years. According to the principal, a significant hurdle was the stipulated land requirement.
However, finding land and relocating the school to an entirely new location would cause
hassle for poor parents who reside in the catchment area.
Views on teacher inputs
Teacher salaries were an issue, and the school
principal admitted that they could not afford the
high wages paid in government schools. Most
teachers in the school had a graduation degree
(B.Ed.), a government requirement for hiring
teachers.
Most of the time, the senior teachers trained
junior teachers by passing on their experience and wisdom. Recruitment of teachers was
undertaken through in-class demonstrations and depending on performance, their position
was confirmed on the school payroll.
The fee was charged at ₹ 1000 a month (approx. £9 – £10) and the school provided
textbooks and uniforms at an actual cost. Nearly 10% of the school’s student population was
classified as students from economically weaker backgrounds. A limited number of
incentives and scholarships was provided to overcome their financial hardships. During the
interview, the principal explained that government schools, supposed to provide free
education, demanded a bribe from parents to get their children enrolled in the school.
Under the RTE Act regulations, private schools are supposed to reserve 25% seats for
children from poorer backgrounds and government schools are required to provide free
education. The school complied with most aspects of the Act, but it lacked a playground,
“We usually have demonstration
classes from new hires and we observe
them for three to four days before
confirming them on the rolls”
School principal from school six
“The parents in this area are quite
poor and they will not be able to
afford the transportation cost if the
school moves out from here and
establishes itself at a new place”
School principal from school six

166
kitchen for the midday meal and barrier-free access due to a lack of space. The principal
was not convinced that the RTE Act requirements would lead to better education
Table 64 – RTE regulations and checklist
Item Norms & Standards Put a (✔) wherever necessary
No. of Teachers
Number of teachers/days/hours
For classes 1 to 5 Upto 60 students 2
Between 61 to 90 3
Between 91 to 120 4 Between 121 to 200 5
Teaching-learning equipment
Provided to all the classrooms as required
Building All-weather building consisting of :
At least one classroom for every teacher and a multipurpose office-store
X
Barrier-free access X Separate toilets for boys and girls. Safe and adequate drinking water facility to all children’
A kitchen where mid-day meal is cooked in the school
X
Playground X Arrangements for securing the school building by boundary wall or fencing
Minimum number of working days/ instructional hours in an academic year
For class 1 to 5 200
For class 6 to 8 220 For class 1 to 5 (Instructions hours)
800
For class 6 to 8 (Instruction 1000 Minimum number of working hours per week for the teacher (Including preparatory time)
Forty-five teaching including preparation hours
45
Library Library in each school providing newspaper, magazines and books on all subjects, including story-books
Play material games and sports equipment
Shall be provided to each class as required
– Facility present X – Facility not present ∞ ‐ facility status not known

167
School inspections and closure implications
Inspectors from THE education department undertook a bi-monthly visit. The principal of the
school was not aware of the response mechanism to be adopted in case of a closure notice.
Commenting on the issue, the principal felt that
forced closures would lead to unemployment of
teachers while families could force children to join
the labour work. She mentioned that educational
entrepreneurs who invested their ‘blood and sweat’
in building such schools would be demotivated to
start educational ventures as they would lose faith
in the system. According to her, the government
should consider the hurdles faced by unrecognised
schools and assist by relaxing the rules to some
extent.
4.7.7 School Seven
School characteristics and recognition issues
The school in the southern district of Delhi aimed to provide English education to families
facing financial difficulties. It failed to obtain recognition due to limited land availability. A
nominal fee of ₹ 350 – 500 (£3 – £6) was charged which included the provision of uniforms
and books. The school administration recognised
high-achieving students through medals, badges
and honours.
However, no financial incentive or scholarship was
provided as the school could not afford them with its
limited financial resources. However, a discount was
provided to children whose siblings were enrolled in
the same school.
Teacher inputs
Teachers were recruited locally or by word of mouth. There was no formal training, and the
school owner was responsible for the orientation of teachers. Regular feedbacks and
discussions were held with teachers to improve teaching strategies. The school owner was
a teacher herself and believed in sharing experiences and orienting the teachers as and
when required. According to the owner, locally hired teachers were loyal and devoted
themselves to teach children, more so than teachers in government schools.
“The focus needs to be on improving
learning outcomes, rather than asking
schools to comply with norms, which
may or may not enhance learning.
Inspectors checking school
requirements do it as ritual rather than
a feedback process”.
School principal from school six
“We see parents shifting their
children from government schools to
the nearby private schools. Mothers
today are quite educated and they
can make informed choices for their
children”.
School owner from school seven
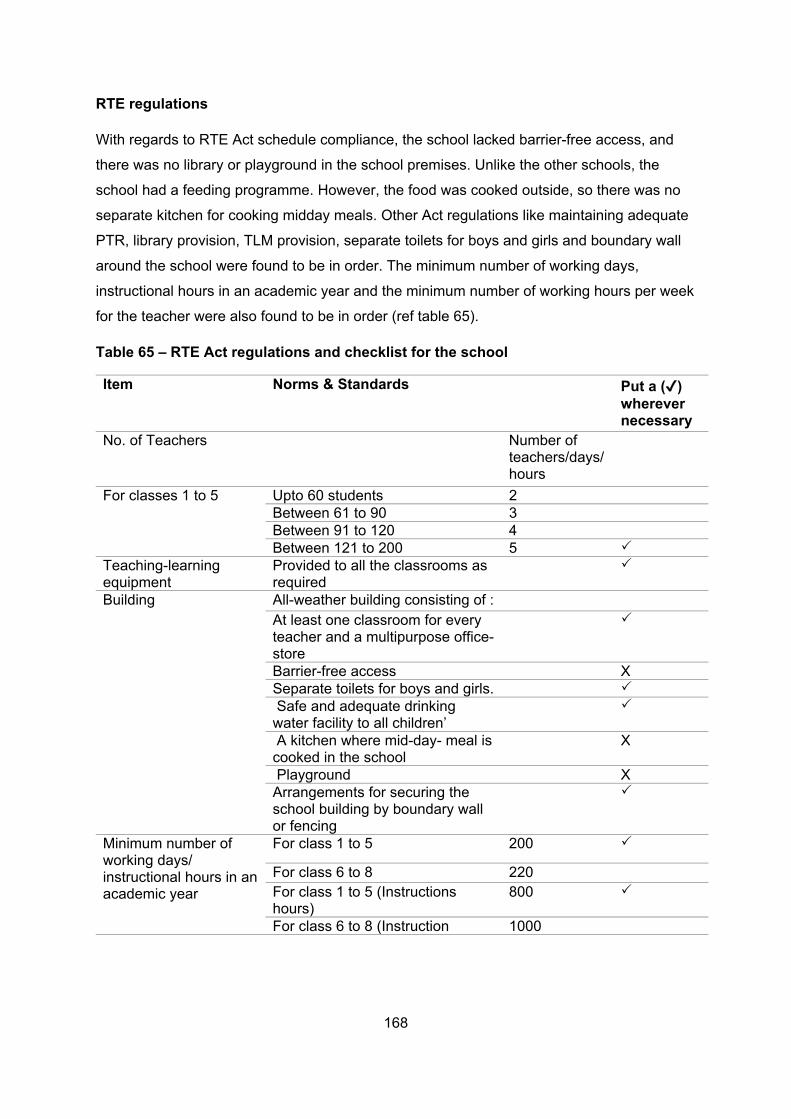
168
RTE regulations
With regards to RTE Act schedule compliance, the school lacked barrier-free access, and
there was no library or playground in the school premises. Unlike the other schools, the
school had a feeding programme. However, the food was cooked outside, so there was no
separate kitchen for cooking midday meals. Other Act regulations like maintaining adequate
PTR, library provision, TLM provision, separate toilets for boys and girls and boundary wall
around the school were found to be in order. The minimum number of working days,
instructional hours in an academic year and the minimum number of working hours per week
for the teacher were also found to be in order (ref table 65).
Table 65 – RTE Act regulations and checklist for the school
Item Norms & Standards Put a (✔) wherever necessary
No. of Teachers Number of teachers/days/hours
For classes 1 to 5 Upto 60 students 2 Between 61 to 90 3 Between 91 to 120 4 Between 121 to 200 5
Teaching-learning equipment
Provided to all the classrooms as required
Building All-weather building consisting of :At least one classroom for every teacher and a multipurpose office-store
Barrier-free access X Separate toilets for boys and girls. Safe and adequate drinking water facility to all children’
A kitchen where mid-day- meal is cooked in the school
X
Playground X Arrangements for securing the school building by boundary wall or fencing
Minimum number of working days/ instructional hours in an academic year
For class 1 to 5 200
For class 6 to 8 220 For class 1 to 5 (Instructions hours)
800
For class 6 to 8 (Instruction 1000

169
Item Norms & Standards Put a (✔) wherever necessary
Minimum number of working hours per week for the teacher (Including preparatory time)
Forty-five teaching including preparation hours
45
Library Library in each school providing newspaper, magazines and books on all subjects, including story-books
Play material, games and sports equipment
Shall be provided to each class as required
– Facility present X – Facility not present ∞ ‐ facility status not known
School closures and suggestions
No notice of closure was received by the school from the department of education, nor was
the school owner aware of any unrecognised school that was closed in the nearby vicinity
due to lack of recognition. One major hurdle that the school faced was the limited availability
of land and motivation from the regulatory authorities to run and operate the school. At the
end of the interview, she mentioned that education departments should facilitate the easy
purchase or lease of land which could assist in school setups, thus relaxing the regulations
to some extent to support easy recognition.
4.7.8 School Eight
School inception and recognition struggles
The school owner provided private tuitions to children from impoverished backgrounds which
led to the inception of the school. Providing a historical account, the school owner mentioned
that his financial survival in Delhi in the early days was possible only due to private tuitions
that he offered to students. This additional income allowed him to establish a school and
provide for the broader population.
Commenting on the setup and recognition of small budget schools, the owner felt that this
was quite complicated and arduous. Securing a recognition certificate requires a different set
of permissions acquired through various government departments. These permits include a
building safety certificate, fire safety certificate and a minimum land requirement of 200m2 for
primary school and 800m2 for a secondary school. Procuring each certificate required
extensive time, energy and financial resources. Officials issuing the permissions expected
bribes from school owners and entrepreneurs who applied for the recognition process.

170
Giving an example of his struggle, the
school owner admitted that he had resorted
to extra-legal activity to secure recognition.
Although apologetic about his actions, he
defended them as a survival mechanism for
an unjust system.
Furthermore, he reported that once a
school acquires the necessary certificates,
the authorities provide the institution with a provisional registration. Inspection is carried out
once every two years, and the school is required to renew the recognition.
On teachers and teaching inputs
Senior, experienced teachers mentored and trained recruits and junior teachers. Feedback
was gathered from students taught by newly recruited teachers. Teachers used a
combination of pedagogical approaches like project-based learning and live demonstrations.
Scientific processes like the digestive system and food chains were taught through visual
aids such as dummy models and charts.
The school also invested in low-cost maths toolkits for the tangible realisation of abstract
mathematical concepts. According to the owner, training by senior teachers of the school
worked well for the recruits; it was not necessary to outsource this to external agencies.
The school received a closure notice, so they applied for recognition. The first application in
2007 was rejected, but in 2009, the school authorities fulfilled all the RTE Act regulations
and applied successfully for recognition. However, the school is still unable to receive the
final recognition due to the long list of pending applications with the education department
(ref table 66).
The school charged fees between ₹ 600 – ₹1200 (approximately £7 – £14) per month and
provided textbooks, uniforms and bags which were charged on an actual basis. Apart from
that, it also followed the RTE Act policy of offering 25% of places to children from low-
income backgrounds.
“I did not want to compromise with my
principles of honesty, however, I realized that I
cannot sustain my school and in order to keep
my school up and running and for obtaining the
relevant recognitions, I had to resort to paying
bribes”.
School owner from school eight

171
Table 66 - RTE regulations and school checklist
Item Norms & Standards Put a (✔) wherever necessary
No. of Teachers
Number of teachers/days/hours
For classes 1 to 5 Upto 60 students 2
Between 61 to 90 3
Between 91 to 120 4
Between 121 to 200 5 Teaching-learning equipment
Provided to all the classrooms as required
Building All-weather building consisting of :
At least one classroom for every teacher and a multipurpose office-store
Barrier-free access Separate toilets for boys and girls. Safe and adequate drinking water facility to all children’
A kitchen where mid-day- meal is cooked in the school
X
Playground Arrangements for securing the school building by boundary wall or fencing
Minimum number of working days/ instructional hours in an academic year
For class 1 to 5 200
For class 6 to 8 220
For class 1 to 5 (Instructions hours)
800
For class 6 to 8 (Instruction 1000 Minimum number of working hours per week for the teacher (Including preparatory time)
Forty-five teaching including preparation hours
45
Library Library in each school providing newspaper, magazines and books on all subjects, including story-books
Play material, games and sports equipment
Shall be provided to each class as required
– Facility present X – Facility not present ∞ ‐ facility status not known

172
School closures and suggestions
Commenting on the school closure issue, the owner suggests that small, low-cost private
schools should seek NISA’s (National Independent School Alliance) advice in case of
notifications from the government. NISA, an independent association formed by the owners
of the budget schools, has been instrumental in voicing the concerns of low-cost private
schools. NISA confronts the regulatory authorities on behalf of budget private schools and
has assisted several schools in gaining or renewing recognition in case of closure threats.
4.7.9 School Nine
School inception, recognition issues and RTE awareness
Established, in 1976 the school failed to secure recognition due to the stringent land
requirements and the school owner admitted that he did not have sufficient funds to invest in
purchasing new land. An area of 190-200m2 could cost 10-12 million INR which means that
it is near impossible for small schools to meet this requirement.
The school owner was aware of the
norms and regulations of the RTE Act
but was quite concerned that a majority
of government schools in the periphery
did not adhere or follow the norms laid
out by the education department.
On teachers and teaching inputs
The school employed 12 teachers, and all of them were trained and qualified with a B.Ed.
Degree as required by the RTE Act. One experienced teacher mostly trained the teachers
and no external training was arranged. The owner reported that experienced teachers were
better than the external agencies as they are aware of the strengths and gaps of the
students enrolled in the schools. The training methods used by the experienced teachers
were suited to the requirements of the students which led to improved test scores.
Regarding the RTE Act schedule regulations, the school followed most of them, but three
components were lacking: barrier-free access, provision of midday meals and playground.
The owner was quite sceptical of the Act’s requirements and believed that except for
teaching-learning materials, library and play equipment, none of the standards would
influence learning outcomes.
There was no free education provided to the students enrolled in the school as per the RTE
Act. A nominal fee of ₹ 600 (£6 – £7) was charged every month (ref table 67).
“I doubt if any of the government schools in the
area followed the rules as prescribed by the
government. I am sure many of them would not
be satisfying the requirements of the RTE
schedule.”
School owner from school nine

173
Table 67 – RTE regulations and school checklist
Item Norms & Standards Put a (✔) wherever necessary
No. of Teachers
Number of teachers/days/hours
For classes 1 to 5 Upto 60 students 2
Between 61 to 90 3
Between 91 to 120 4
Between 121 to 200 5 Teaching-learning equipment
Provided to all the classrooms as required
Building All-weather building consisting of :
At least one classroom for every teacher and a multipurpose office-store
Barrier-free access x Separate toilets for boys and girls. Safe and adequate drinking water facility to all children’
A kitchen where mid-day- meal is cooked in the school
x
Playground x Arrangements for securing the school building by boundary wall or fencing
Minimum number of working days/ instructional hours in an academic year
For class 1 to 5 200
For class 6 to 8 220
For class 1 to 5 (Instructions hours)
800
For class 6 to 8 (Instruction 1000 Minimum number of working hours per week for the teacher (Including preparatory time)
Forty-five teaching including preparation hours
45
Library Library in each school providing newspaper, magazines and books on all subjects, including story-books
Play material, games and sports equipment
Shall be provided to each class as required
– Facility present X – Facility not present ∞ ‐ facility status not known
Limited scholarships were provided to children from extremely impoverished families and to
children of war widows. The school followed a reservation policy for admitting students from
scheduled caste (SC) and scheduled tribe (ST) backgrounds.

174
Views on school inspection closures and suggestions
There were no visits by officials from the education department as a monitoring exercise to
confirm adherence to the Act specifications. However, the owner specified that usually when
officials visit schools, they expect some financial gain in return for a favour.
According to the owner, the Act’s regulations are quite stringent, and these need to be
relaxed if the government wants budget private schools to flourish. This could come about
through:
Land relaxation – land rates in Delhi are astronomical, and in such a scenario it is
almost next to impossible for small schools to own land, so regulatory authorities
need to keep the context in mind before enforcing land-related norms on budget
private schools.
Pay scales – Most budget schools earn their income from the fees charged to
students. Thus revenue sources for the schools are limited and expecting them to
pay government-prescribed scales as per the seventh pay commission while
maintaining their overheads is utterly absurd and unwise.
The owner felt that diluting the RTE norms to a considerable extent is the way forward.
Concerning school closures, the owner felt that teachers’ employment would undoubtedly be
of great worry and there could be a significant risk to the student population adding to the
proportion of children ‘out of school’.
4.7.10 School Ten
School inception and RTE awareness
The owner started the low budget school in 1998 with a mission to provide quality education
to the poor as he perceived a gap in the quality of education provided by government
schools in the nearby vicinity.
According to the owner, the regulations introduced
by the department of education seem to be a ‘witch
hunt’ against the low budget schools and have been
introduced as a measure to legalise corruption in the
system.
Government authorities expect budget private
schools to follow all the norms which are impossible
so school owners would expect some leniency from
“The introduction of the RTE has not been of much use, as it does
not help in improving any
instructional leadership skills, or in
any way contribute towards raising
his capabilities to teach. They are
more like an administrative
measure rather than an academic
measure, which in many ways are
not helpful in learning outcomes”
School owner from school ten

175
the authorities. In return, the authorities would favour those willing to resort to extra-legal
activities such as providing bribe payments.
School – teacher inputs and pedagogical strategies and PTA
During a tour of the school, it was observed that the school complied with the RTE Act
schedule. Teachers used ‘learning by doing’ methods in classrooms to teach difficult
concepts in maths. Dummy models related to various scientific processes and phenomena
were observed during the visit.
The school head explained that the holistic development of students was central to the
school’s activities. Apart from the regular education, other activities promoting the mental
and physical wellbeing of students included yoga and self-defence classes, dance academy
and motivating children for national and state-level sports competitions.
School teachers regularly attended training, and senior teachers mentored the juniors and
new arrivals. The school owner compared teachers from the budget private school to those
employed by government schools. According to the school owner, teachers in government
schools lack the will to teach, seldom attend and make no use of their expensive,
government-funded training. On the other hand, low-cost schools hire passionate teachers
from the local area, train them with low budgets and make them capable of delivering high-
quality classroom transaction. Reinforcing his argument, he mentioned that alumni from the
school had been absorbed by major industrial and information technology companies across
India.
PTA existed in the school and parents and teachers used the meetings to discuss issues
relating to student progress in cases of new interventions undertaken by the school.
However, it was challenging to convene meetings regularly as several parents found it
difficult to attend due to professional commitments. The majority of parents in the PTA were
mothers as working fathers were mostly unable to participate in meetings.
The school followed most RTE Act regulations except for barrier-free access and a kitchen
for midday meals (ref table 68). According to the principal, there were no children with
special needs enrolled in the school and most children brought their food from home, so no
food was served in the school. The school charged a fee of ₹ 770 (approximately £7 – £8)
and provided a waiver for high-achieving children from low-income backgrounds.

176
Table 68 – RTE Act regulations and school checklist
Item Norms & Standards Put a (✔) wherever necessary
No. of Teachers
Number of teachers/days/hours
For classes 1 to 5 Upto 60 students 2
Between 61 to 90 3
Between 91 to 120 4
Between 121 to 200 5 Teaching-learning equipment
Provided to all the classrooms as required
Building All-weather building consisting of :
At least one classroom for every teacher and a multipurpose office-store
Barrier-free access X Separate toilets for boys and girls.
Safe and adequate drinking water facility to all children’
A kitchen where mid-day- meal is cooked in the school
X
Playground Arrangements for securing the school building by boundary wall or fencing
Minimum number of working days/ instructional hours in an academic year
For class 1 to 5 200
For class 6 to 8 220
For class 1 to 5 (Instructions hours)
800
For class 6 to 8 (Instruction 1000 Minimum number of working hours per week for the teacher (Including preparatory time)
Forty-five teaching including preparation hours
45
Library Library in each school providing newspaper, magazines and books on all subjects, including story-books
Play material, games and sports equipment
Shall be provided to each class as required
– Facility present X – Facility not present ∞ ‐ facility status not known
Views on schools inspections and closures

177
Official visits from the department of education were not undertaken, although the owner
explained that they were prepared for - any official visit as they complied with most RTE Act
regulatory norms.
According to the owner school closures
could be the worst measure if the
government intends to regulate budget
private schools. It could be the break the
spirit and moral of the budget private
schools which have been serving the
impoverished communities across the
various parts of the nation.
4.8 Combining insights from quantitative and qualitative approaches The themes generated from the monographs were, combined with the ideas generated from
the analytical models to build a clear picture of the scenario emerging due to the Act.
Views on infrastructure
Quantitative models revealed that of the many infrastructure indicators listed in the RTE Act,
most of them had either no impact or a negative impact on test scores. Discussions with the
school owners aligned with the quantitative findings as many of them found that the RTE Act
regulations relating to infrastructure listed in the schedule did not contribute to the learning
outcomes of the children.
School heads believed that the infrastructure norms of the RTE were more likely to be an
administrative burden and possibly had no positive academic effects. Infrastructure
improvements require extensive capital investments and conversations with school heads
revealed that investing an extra piece of land or resources is not likely to improve learning
outcomes. Analysis of secondary studies (Abogan 2013, Muralidharan 2012, Bhat 2017) in
the literature review are congruent with the qualitative insights found in the research.
Teachers, teaching inputs and Parent-teacher associations
The regression model revealed that teachers who underwent training were capable of
influencing test scores positively. The insight aligned perfectly with the narrative accounts
“Government regulations to budget private
schools can ‘bolster or break’ the institutions.
It’s up to the officials to think, whether they
want the support of the edupreneurs, or
continue providing inferior quality education to
students.”
School owner from school ten

178
shared by the school heads who mostly used senior teachers or the concept of instructional
leadership49 in their skills to improve teaching pedagogies.
Quantitative analysis indicated that teachers who taught multiple subjects were likely to
impact test scores positively. Interviews with principals revealed that most teachers in the
private schools were hired locally from the community, had some form of degree and taught
more than one subject. Those teachers were passionate and dedicated more time towards
the students to assist them academically.
PTAs showed negative correlations with student test outcome in the quantitative design.
However, many school principals had mixed responses to PTAs. On the positive side, PTAs
serve as a functional link between parents and teachers to communicate on academic and
non-academic issues. However, not all PTAs are successful – several school heads reported
that PTAs started strongly but were then dissolved as parents could not attend the meetings
due to work commitments.
RTE regulations
Analysis of the observation checklists of the participating schools indicates that most of the
schools complied with a majority of regulations listed in the RTE. These include -:
adequate pupil-teacher ratio
providing separate toilets for boys and girls
providing safe drinking water
adhering to a minimum number of days and hours for teachers
providing a library and adequate teaching learning material
Provisions of the RTE which were lacking in schools comprised of barrier-free access,
provision of a kitchen for the mid-day meals and playground. As there are few or no disabled
children in these schools, barrier-free access was not a requirement. However, principals do
agree that adding a barrier-free access can allow more disable children to join mainstream
schools. School heads also reported that parents were aware of special schools available for
disabled children and therefore many of them preferred those over the regular schools.
49 Cotton (2003) defines instructional leadership as the capability of school heads and principals to be engaged
in curricular and instructional issues, capable of influencing student outcomes. Similarly King (2002) and
Elmore (2000) advocate that instructional leadership comes into play when the role of principal is not confined
only to academia.
179
Similarly, schools which provided meals to children outsourced meal requirements to local
NGOs specialising in catering food for educational institutions. School heads believed it was
a cumbersome task to manage the kitchen and also monitor and regulate the procurement of
raw materials and other ingredients required for food preparations. Finally, land availability in
Delhi was scarce due to the burgeoning population, and as a result, procuring land in Delhi
was quite expensive so many schools could not afford a playground.
Conclusion
The chapter aimed to understand the impact of different indicators on diagnostic test scores
and Raven’s IQ test scores. Visual graphical representations indicated that both the
diagnostic and the IQ test scores were found to be normally distributed. Data analysis
through different prediction models assisted in identifying the actors likely to have an impact
on the diagnostic and IQ test scores.
A multiple regression model indicated that specific factors mandated by the RTE such as the
provision of mid-day meals, the presence of a library are likely to have a significant positive
impact on test scores. However other factors such as separate toilets, barrier-free access in
schools, charts and maps as mandated by the RTE may not be useful in improving test
scores or learning levels.
A separate model for teachers indicated that those who had recently attended training had
experience in the range of 5-10 years or who taught multiple subjects were capable of
influencing test scores positively. On the other hand, teacher contracts, salary range of
teachers and parent-teacher meetings may not be essential measures to raise student
outcomes. The binomial regression model regressed on the RTE Act core indicators
reported that schools charging fees and arranging RTE Act orientations are more likely to
improve learning achievements. However, the presence of a school management committee
(SMC) or provision of disability quota can reduce the probability of raising test scores for
students.
Qualitative insights in discussion with school heads and principals revealed that the RTE Act
regulations were more likely to be an administrative burden, rather than academic support.
Most schools were likely to follow the RTE regulations, except the ones which may not be
necessary or that were likely to be capital intensive.
School visits by inspectors were infrequent, and most visits were undertaken with the
intention of monetary compensation from the owners in the form of bribe.

180
School owners used multiple strategies to prevent school closure. These included:
Applying for recognition by fulfilling the requirements of the RTE Act schedule and by
obtaining the necessary certificates from the local council. The process may be
longer, and schools may not necessarily obtain recognition the first time.
Resorting to extra-legal activities to hasten up the process for securing recognition.
The process is likely to yield quick results and schools may even get recognition at
the first attempt.
Schools with temporary recognition and the ones who had their recognitions expired
made efforts to renew their recognition with the department of education.
The next chapter discusses the impact of each finding in detail and outlines the alignment of
the results with the existing literature, the effect of the research, future implications and the
limitations of the current study.
181
Chapter Five: Discussion
5.1 Introduction
This chapter presents the overall findings and connects them with the existing literature
undertaken in developing parts of the globe. Using, different regression models in the
previous chapter, this research complements a large body of literature (Abogan, 2013;
Glewwe et al., 2012; Hanushek, 2003; Mukerji & Walton, 2012), concluding that insisting on
an input-based policy may not lead to improving student outcomes. It encompasses insights,
useful for designing critical acts and reforms, which could have a balanced outlook towards
inputs and outcomes, rather than a skewed approach. Focusing on the different input-based
norms of the RTE Act about infrastructure, teacher demographics and organisation factors,
this research sets out the inputs that are capable of improving or worsening student test
scores. The chapter also discusses the implications of the findings for threatened low-cost
private schools and measures that could be undertaken to ensure the co-existence of such
schools with state schools. Limitations of the current research and directions for future
research are also discussed.
5.2 Impact of physical facilities on academic learning outcomes
The first part of the research attempted to understand the impact of physical indicators as
listed in the RTE Act and its impact on different test outcomes. To, measure the student
outcomes, two different tests were used – a diagnostic test and Raven’s IQ test. The
diagnostic test included subject-based questions from language, maths and environmental
sciences and Raven’s IQ test measured students’ intellectual capabilities. A school
questionnaire captured the different infrastructural and physical facilities in the school.
Separate regression models were designed to assess the impact of each input on student
outcomes. The following research question attempted to determine the relationship between
various infrastructural facilities in private schools and their relation to student outcomes.
Is there any relationship between student achievement and the RTE Act’s emphasis on
physical indicators?
A combination of different RTE Act factors was considered to determine their impact on
diagnostic test scores. Some factors such as concrete building, provision of drinking water
and electricity were excluded from the regression model as all the schools had such
essential amenities. However, specific factors that differed within the private schools were
included such as midday meals in the school, barrier-free access, separate toilets for boys
and girls and whether or not the school had a library.

182
The model also considered IQ test scores to explain the variance of the model concerning
the relative contribution of each of the predictors.
5.2.1 IQ tests indicate a positive impact on academic test scores
Students, who were, administered diagnostic tests were, also encouraged to take Raven’s
IQ test, so that their scores could be matched. Pearson’s product moment correlation
indicated a significant positive correlation. A strong relationship was also observed between
maths test scores and IQ test scores. This finding is consistent with studies undertaken by
Finn et al. (2014) who find substantial correlations between cognitive skills and achievement
in tests, more specifically in maths. Other studies which align with similar correlations include
(Alloway & Passolunghi, 2011; Gathercole et al., 2004 and St Clair-Thompson & Gathercole,
2006).
5.2.2 School feeding is likely to improve academic test scores
Schools feeding programmes were likely to have a positive effect on test scores. However,
qualitative interviews revealed that providing meals to children involves enormous costs and
logistics. Moreover, many children enrolled in the schools bring their lunch, so schools did
not offer a separate feeding programme. The findings of the current study were significant at
5% level, and this is an alignment with Chakraborty and Jayaraman (2016) who find a
positive relationship between learning and midday meals in schools.
Furthermore, their evidence also indicates that providing school meals accounts for raising
reading test scores by 18% and maths test scores by 9%. In a similar vein, other small-scale
studies such as Singh (2008) note the positive influence of midday meals on vocabulary
tests. Afridi et al. (2014) observe significant improvement in attention span and ability to
solve complicated puzzles due to midday meals.
The literature supports the view that school feeding programmes are capable of positively
influencing academic test scores and many of them outline two major reasons. First, a free
meal acts as an incentive so boosts enrolment and attendance in schools, both of which
provide an opportunity for children to learn. Second, provision of food addresses hunger and
raises the nutritional intake for children which in turn leads to better concentration and
ultimately better test scores. Low-cost private schools could consider cooperating with local
NGOs or large-scale food providers such as ‘Akshaya Patra’ which provide nutritious food
and manage the logistics.
Lack of a counterfactual can be a major limitation of the finding as it would have been
interesting to view the effects of feeding programmes in government schools which are likely
to have one due to the RTE Act’s mandate.

183
Secondly, the sample size is too small to conclusively determine the actual effects of a
school feeding programme on student outcomes.
5.2.3 Libraries in schools can positively influence academic test scores
Estimates of the regression model indicate that schools which invested in a library are likely
to have better test gains. Previous work by Willms and Somers (2001), Lonsdale (2003) and
Murillo and Roman (2011) find that presence of a library and the size and quality of book
collections can positively influence academic outcomes. Qualitative interviews with principals
and school owners revealed that schools with libraries were encouraged to invest in books
capable of raising learning outcomes.
During conversations with school owners, it was mentioned that libraries in schools fostered
a collaborative relationship between teachers and students. A similar insight is proposed by
Lonsdale (2003) who mentions collaboration as a factor likely to have a positive impact on
test outcomes.
Investment in a library and resources requires capital investments so schools which do not
have libraries may struggle if they are required to acquire one. The Delhi School Education
Rules (DSEAR), 1973 stipulate a minimum of 10 books per student in a school library.
However, the average requirement of books for the participating schools was 4500.
Assuming that each of the books is available at a discounted rate of ₹80-₹100 INR
(approximately £8-£10), the total cost of investment in library books can escalate to
₹3,60,000-₹4,50,000 INR (approximately £4000- £5000). Such an investment can be quite a
significant amount for many of the low-cost schools as the majority of these schools’ revenue
is generated through school fees.
One effective strategy to deal with such a scenario would be to pool resources. For instance,
a low-cost private school which already has a library could work with other schools in the
area which lack library facilities. These schools could then share the costs which include
procurement of new volumes, maintenance of the libraries and sharing the utility bills in
exchange for access. Such a measure would benefit all parties. The school which gains
access to a library can expect a positive influence on the academic outcome while the
school which provides access is likely to benefit due to the influx of students and teachers
from other schools as well as lower costs.
Thus budget private schools should be given an option to share libraries or even to share
libraries with government schools which are likely to have resources that possibly may be
underused.

184
5.2.4 Influence of other RTE Act infrastructure factors
Influence of other factors such as the provision of gender-specific toilets, availability of audio
and video resources in the school and the provision of barrier-free access were also studied
to determine their impact on test scores. The magnitudes of the coefficients were found to be
quite small and not statistically significant.
Provision of gender-specific toilets had a negative impact on students. These findings are
consistent with Adukia (2016), finding no statistically significant relationship between
sanitation infrastructure and student achievement. In another study carried out in Andhra
Pradesh using the regression approach and large-scale data, Wadhwa (2016) finds no
relationship between usable toilets in schools and maths and Telugu test scores. School
visits on the field confirmed that across several schools, the quality of toilets provided was
not up to standard. Several places lacked hygiene and suffered from issues like running
water and a lack of privacy
Although this research finds no significant relationship between the provision of toilets and
test scores, it should be borne in mind that there could be several other reasons for
constituting gender specific toilets in schools. Firstly, the lack of proper toilet facilities for
adolescent girls could discourage them from attending schools. Studies by Levy and
Houston (2017) show that lack of safe, private toilets is likely to cause absenteeism 20% of
the school year. Hence, constituting toilets specifically for adolescent girls can improve
attendance, lower dropout rates and improve educational efficiency.
Secondly, provision of toilets for girls can protect them from violence and assault. The peril
of a sexual assault and violence increases, especially in developing countries when girls
defecate in open or are coerced to use shared toilets. A survey in South Africa showed that
around a third of the girls were raped when schools had no toilets, when they were forced to
share toilets or when the toilets were located in desolated places. Violent acts such as these
are a significant impediment to school attendance, significantly affecting the self-esteem of
girls who have undergone such trauma and languishes the desire to learn.
Provision of barrier-free access in schools was found to be negatively correlated with test
scores. Very few studies have focused on this parameter so a decline in academic
achievement cannot be precisely attributed to the factor. However, one large-scale study
carried out in the four districts of Gujarat across the primary grades reports the average
achievement test scores before and after the introduction of barrier-free access in school
(Patel, 2016). This study finds an overall decrease in academic achievement across all
grades following the introduction of barrier-free access in the schools.

185
5.3 Impact of RTE teacher indicator on the academic outcomes
The second part of the study focused on understanding the various RTE Act teacher
indicators. A detailed teacher questionnaire captured the variables relating to teachers in
low-cost private schools. This comprised information about job status, experience levels,
educational qualifications, pay grades and subjects taught. Using OLS (Ordinary Least
Square) estimates, and the following research question, the research attempted to study the
impact of the different teacher covariates, on student achievement.
Do the RTE Act teacher indicators have any impact on diagnostic student achievement?
Different RTE Act indicators were combined to understand their impact on diagnostic test
scores. These indicators included teacher training, experience, teaching multiple subjects,
job status, salary range, educational qualification and parent-teacher meetings in schools.
5.3.1 Teacher training and impact on academic performance
The model indicated that teachers who attended the training in the recent past and in a time
frame between 3-5 years were likely to improve academic test scores, compared to those
who had never participated in any training programme. These findings are similar to Evans
and Popova (2015), He, Linden & MacLeod (2008), Nannyonjo (2007) and Abogan (2013)
who all find teacher training to be a strong indicator of student achievement.
Providing teacher training also proved to be useful for improving the Raven’s progressive
matrices. Teachers who recently received training were capable of positively impacting the
IQ performance, and the findings were significant at a 95% confidence level.
Further conversations with school owners revealed that in most schools, teacher training
was undertaken by the most experienced teacher or by the school heads themselves. Some
of the schools summoned experts from premium private schools, approached NGOs or
religious or charitable organisations capable of providing training at low cost. Most school
heads agreed that training teachers were not a major overhead to the costs. However, most
school heads collectively agreed that teachers learned better through on-the-job training
compared to the training received during the academic tenure.
Although teacher training impacts positively on student test scores, it is not entirely clear
what kind of training programmes were effective and efficient. Combining the primary
research as well as the evidence available, it seems that teacher training translates into
improved learning outcomes and better test scores.

186
5.3.2 Teachers teaching multiple subjects
Teachers across private schools were asked if they taught a single subject, double subjects
or multiple subjects in schools. The model predicted that teachers who taught multiple
subjects across different grades influenced test scores positively. This finding aligns with
Harbison and Hanushek (1992) and Evans and Popova (2015) who find that teachers’
subject competence and knowledge raises student achievement. Lockheed and Verspoor
(1991) and Govinda and Varghese (1993) find that in the context of developing countries,
teachers’ subject knowledge is likely to have a significant positive effect on student
achievement.
Another logical explanation could be that those who teach multiple subjects gain mastery
over the subject content and are likely to tailor lessons to individual students, thereby
improving academic performance.
5.3.3 Teachers’ educational qualifications
Educational qualifications of teachers are likely to yield positive test outcomes. These
findings are consistent with Zuzovsky (2003) who analysed the TIMSS 2003 data to study
the relationship between teacher educational qualification and student achievement. In the
context of the Indian sub-continent, Govinda and Varghese (1993) report that students score
highest when taught by teachers with a postgraduate or Master’s degree qualification.
Willms and Somers (2001), in research conducted across Latin American countries, find that
students tend to score 5 points higher when taught by teachers who completed four years of
post-secondary education, compared to those taught by teachers who completed two years
of post-secondary education.
5.3.4 Job status Teacher contracts
Teachers were divided into two categories – those with a permanent contract and those with
temporary contracts. The model indicates that teachers with temporary contracts are likely to
influence student outcomes negatively. These findings are similar to Vegas and De Laat
(2003) who find that teachers with a permanent contract tend to produce better student
outcomes compared to contract teachers. However, other studies by Goyal and Pandey
(2011), Banerjee (2007) and Kingdon et al. (2013) find that teachers with temporary
contracts tend to perform better as they exert more effort compared to permanent teachers
and tend to produce better academic outcomes. It is difficult to determine the exact causes
precisely. However, one likely reason could be that contract teacher may be dissatisfied with
their status and may tend to lessen rather than increase their efforts in classrooms. This
lack of rigour and authentic engagement is likely to affect scores negatively.
187
5.3.5 Teacher salaries
Teacher salaries reported an adverse effect on test achievements. The salaries were
classified into two ranges – lower and upper. Several studies concur with the current
research and find either negative or no correlation between teachers’ earnings and students’
learning. Commenting on the relationship between the two, Muralidharan (2013) concludes:
“the correlations typically point towards a negative relationship between teacher salaries and
gains in student test scores” (K. Muralidharan 2013, 10). Kingdon and Teal (2010) report that
student achievement is strongly reduced when teachers receive better or higher pay.
Harbison and Hanushek (1992) evaluate teacher salaries for three years persistently and
find a negligible impact on student achievement. As stated in the literature review earlier,
teacher salaries are highly unlikely to influence student test outcomes significantly.
5.3.6 Teachers’ experience
Teacher experience as an input indicator was regressed with academic test scores, and the
model predicted a positive coefficient for teachers with moderate and high experience. A
moderately experienced teacher was classified as someone with an experience range of 3-9
years and teachers with more than nine years’ experience were classified as highly
experienced teachers.
The findings are consistent with Hanushek (2015) who finds in his meta-analysis that nearly
1/3rd of the studies (29%) indicate a positive correlation between teacher experience and
student achievement. While determining the association between student achievement and
teacher experience, Nannyonjo (2007) finds that test scores in mathematics and English
plateau after five years and start declining after ten years. Similiary, Leclercq (2005) reports
a positive but depleting association between experience and student outcomes.
Furthermore, Govinda and Varghese (1993) indicate a very similar pattern of findings to the
ones above. They conclude that teachers above 10-15 years of experience are effective.
However, they suggest that long-term experience needs to be supplemented by teacher
training to ensure prolonged efficiency.
5.3.7 PTA meetings
One of the requirements of the RTE Act is the formation of an association known as a
parent-teacher association (PTA). The underlying idea behind the PTA is to have regular
interactions between parents and teachers so that appropriate measures can be taken to
improve students’ performance.

188
The model showed that constituting a PTA is likely to yield adverse student outcomes.
Qualitative interviews with school heads gave some insights, as to why PTA’s formed in the
schools may not be a great idea to boost student achievement.
Firstly, in cases, where parents were found to be working, they avoided PTA meetings as
they were likely to lose wages if they attended the meeting and hence, the loss of daily
wages discouraged them from attending the meetings in the school.
Secondly, illiterate parents, or those having minimal education, thought that it’s the school's
job to check the academic progress, and PTA meetings would not be of much help to raise
learning levels.
Third parent-teacher meetings in several schools were held on a one-on-one basis. For
instance, it teachers met parents on the day when the student results were to be declared.
Schools rarely had the opportunity to have cohesive meetings with the parent fraternity as
many owners pointed out that organising such meetings would involve costs, and they would
instead invest their money to improve learning outcomes, instead of holding meetings on
such a large scale.
5.4 Impact of the RTE Act’s organisational factors on student achievement
To, understand the impact of organisational factors, a binomial logistic regression was
undertaken. The model predicted the possibility of scoring on a higher or lower range by
regressing the Act’s organisational indicators followed by a school while controlling other
factors. The indicators comprised awareness of the RTE Act, RTE Act training orientation, a
high or low fee charged, reservation policy followed by the school, admission policy for
disabled children, knowledge about salary norms and the presence of an SMC in the school.
The headline findings are as follows:
5.4.1 Charging a lower fee is likely to raise student test outcomes
All the schools participating in the research were split into two categories – low fee-paying
and high fee-paying schools. Schools which charged fees below INR 600 (approximately £7
per month) were categorised as low fee-paying, and those above INR 600 were defined as
high fee-paying. The findings revealed that private unaided schools which charged below
INR 600 are more likely to raise student test scores compared to those which charged fees
at a higher rate.
The findings align with Kingdon (2017) who finds a higher per pupil expenditure (PPE) in
government schools compared to a majority of private schools where fee levels are far
lower, and learning outcomes are better.

189
The realisation that in the majority of private schools, fee levels are far lower than
government schools’ per pupil expenditure causes Kingdon to question: “how can private
schools do so (without public subsidy) since the majority of them run on a small fraction of
the unit cost of government schools. (Kingdon 2017, p. 23).
It is likely that higher fee-charging schools in the sample may not manage their finances
effectively leading to higher per pupil expenditure (PPE). Higher fee-charging schools are
likely to be greater in size compared to their counterparts. These could include better and
bigger infrastructure, more teachers and administrative complexities. As a result, it is quite
likely that higher charging fee schools have significant overheads in terms of fixed and
maintenance costs, salaries and other administrative costs which can reduce the overall
surplus if not appropriately managed. A lower surplus would mean less reinvestment in the
educational institution which could subsequently lower student outcomes whereas lower fee-
charging schools seem to manage their finances better reinvest surplus to improve the
quality of educational resources and improve student outcomes.
5.4.2 Presence of SMC’s in schools
The RTE Act mandates the formation of SMCs, the primary objective of which is to involve
the community to monitor the operations of the school and create and recommend school
development plans for student welfare leading to better student achievement.
The results report that schools with an SMC are likely to score on a higher spectrum in
diagnostic tests. Qualitative interviews indicate that schools with active SMCs focused on
academic issues and took measures if there were aberrations from set academic targets.
There is ample evidence that school function improves to a considerable extent with an
active SMC (Ramachandran, 2001; Govinda & Diwan, 2003). Similarly, Govinda and
Badhopadhyay (2010) argue that SMCs are capable of defending ‘education exclusion’ by
raising awareness about educational issues and by active participation in school meetings
and decision-making processes (Govinda & Bandyopadhyay, 2010). Bruns et al. (2011)
show that community participation in school management leads to better student
achievement in Latin America. Even in the rural parts of Malawi, the involvement of
community members indicated a positive relationship with student outcomes (Taniguchi and
Hirakawa, 2016). Proactive measures by SMCs and their active participation in crucial
decisions are likely to be a cause for improving learning outcomes.
5.4.3 Impact of other RTE Act’s organisational guidelines
Other organisational factors that were examined to understand the variation in scores
include knowledge of RTE Act norms, RTE Act orientation and reservation policies in

190
schools. The models report a negative coefficient which indicates that following the RTE
Act’s organisational guidelines is unlikely to raise test scores.
Qualitative interviews with principals indicate that knowledge of the RTE Act did not assist in
improving their ‘instructional leadership’. According to Hallinger (2005), the role of the
principal is more that of an administrator. A school head is an educator, coach and mentor.
With time, the school principal’s responsibilities have further broadened, and these include
saving failing schools, being an active leader, motivating the stakeholders associated with
the schooling ecosystem and altering the school from a mere functional workplace to a
productive learning environment (Hallinger, 2005). School heads believed that attending the
RTE Act orientation would not increase their subject knowledge on subjects or motivate
them to teach effectively in the classroom.
Knowledge of RTE Act norms and orientations do not seem to improve the instructional
ability of teachers or principals which would aid in raising test scores and enhancing the
reputation of the school. Further research in this area would yield more insights as to why
the RTE Act norms are skewed towards strengthening the administrative environment rather
than the academic one
5.4.4 Reservation policies of the RTE
According to the World Bank, children from the wealthier areas with an educated family
background usually show more tendency towards higher skill development and have better
learning outcomes compared to those from deprived backgrounds (World Bank, 2015). The
RTE Act through its reservation policy attempts to bridge learning disparities between
children who come from wealthier families and those from disadvantaged backgrounds. It
tries to do this by reserving 25% of seats in private schools for underprivileged children. It
seems that the reservation policy of the RTE Act is not efficiently structured to assist children
from disadvantaged backgrounds who may develop an inferiority complex when confronted
with children from wealthier backgrounds. Such an effect is likely to have a negative impact
on learning outcomes, and that is reflected in the analysis section. Future research in this
area can determine what specific measures regarding reservation policies could strengthen
learning outcomes in schools.
5.4.5 Schools practising inclusion policies
Low-cost private schools which admitted children with disabilities and followed inclusive
practices were more likely to have higher test scores. The findings are consistent with
Robbins (2010) who finds that all-inclusive schools which admit non-disabled students
produce better results in reading and mathematics.
191
Klingner et al. (1998), Saint-Laurent et al. (1998) and Rea et al., (2002) also support the
current findings. Walker and Ovington (1998) compare two scenarios. Scenario one is a
general classroom comprised of twenty or more students that allow disabled students to
engage in lessons actively. When included in mainstream schooling, they are likely to benefit
from the broad level of conversations and the divergent thinking of the group. Scenario two
is where students with different levels of disabilities participate in drills and repetitive
methods in secluded settings. Walker and Ovington (1998) argue that students with a
disability learn better in the former scenario compared to the latter.
5.5 Impact of the RTE Act’s institutional academic indicators on student achievement
The RTE Act outlines specific academic indicators such as a ‘no detention policy’, facilitating
‘learning by doing’ and undertaking continuous, comprehensive evaluation (CCE) in schools.
A binomial logistic regression was undertaken on the covariates to determine the influence
on student test score outcomes.
Schools which promoted learning by doing as instructed in the curriculum are more likely to
improve test scores. Private schools which placed less emphasis on rote and mechanised
learning and whose curriculum promoted ‘learning by doing’ were likely to raise test scores.
These findings align with Cindy (1998) who reports that curricula which place undue
emphasis on rote and memorised learning cause poor performance. Furthermore, the study
reveals that providing hands-on materials to students raised involvement and peer learning,
fostering better learning and thinking and leading to higher test scores in mathematics).
Mullis and Jenkins (1988) surveyed two large-scale assessment programmes in the United
States - the National Assessment of Educational Progress (NAEP) and the National
Longitudinal Survey (NELS). They report that students who are often involved in innovative
and hands-on activities score higher test in science compared to those who have a low level
of exposure to hands-on activities (Mullis and Jenkins 1988).
5.5.1 Usage of continuous, comprehensive evaluation (CCE) in schools
One of the RTE Act’s academic indicators is the launch of CCE in schools for encouraging
schools to evaluate students holistically at regular intervals. Private schools which followed
the CCE method of evaluation (providing grades instead of marks and assess the students
through curricular and extra-curricular activities in tandem with academic assessment) were
found to have better odds of scoring higher on the diagnostic tests. Earlier assessment
methods in schools involved only a single test to assess the capabilities of children, but with
CCE, schools have an opportunity to carry out assessments multiple times in an annual

192
year. Saxena and Tyagi (2014) report an overall improvement in student scores and
combined pass percentages since the introduction of CCE in schools.
End-of-year examinations conducted in Indian schools can instil fear due to the high stakes
associated with them (Deb et al. 2015; Times of India, 2017). The current system of
assessment through annual examinations puts severe stress on students due to academic
and parental pressure, and students have been reported to have psychiatric symptoms and
examination-related anxiety (Deb et al. 2015). Therefore, it is plausible that CCE
interventions are capable of motivating students to perform better.
A formative assessment system such as CCE, regularly conducted in a non-threatening
manner is likely to encourage students to perform academically and beyond by mitigating the
stress caused by high stakes testing through annual examinations.
5.5.2 Retaining students in the same class
Before the RTE Act, primary and secondary schools in India were allowed to hold back
students in the same grade. However, the Act prohibits this up until the end of primary
education. The intent behind the ‘no detention policy’ (NDP) was to ensure automatic yearly
promotions for children, to reduce dropouts and to eliminate the fear of failure in exams. The
model indicated a negative correlation – schools that followed a detention policy were likely
to have lower test scores compared to those schools which had more liberal policies on
promotion.
Stopping children from progressing onto the next year group harms self-esteem, causes an
inferiority complex and leads to humiliation and embarrassment for students who are placed
with those younger than they are (Government of India, 2016). Moreover, this policy has a
huge social stigma attached to it and has shown to have “deeply damaging effects on the
psyche of the child” (Government of India 2016, p.77). Thus, allowing automatic progress to
the next year group is likely to reduce this fear and trauma in the minds of the children which
could eventually lead to better learning outcomes.
However, the RTE Act’s NDP has been criticised by many experts in recent times due to
several reasons. These include a lack of preparation by the education system to support the
policy, easy promotions disincentivising students, lowering enthusiasm in hard-working
students and lowering accountability of teachers, leading to lower learning outcomes
(KPMG, 2016; Bhukkal, 2014).
Further longitudinal research could assess the impacts of learning levels amongst students
who did not progress onto the next academic year and their peers and its effects on overall
learning levels of students in private and government schools.
193
Conclusion
To, understand the impact of the RTE Act’s organisational and academic indicators on
scoring abilities, nine variables were chosen. Of these, six were organisational, and the
remaining three were academic.
Four indicators of the total six showed a negative impact on student outcomes. These
include RTE Act awareness, RTE Act orientation, high fee-charging and reservation policies.
Of these four indicators, one covariate was statistically significant.
In the case of the remaining two organisational indicators, the inclusion of disabled children
and the presence of SMC showed a positive association with academic test scores, but only
one was categorised as statistically significant.
5.6 Limitations and challenges to the study
All large-scale research studies do suffer from certain limitations and biases. These need to
be discussed in the light of methodological stances, along with their impact on the
interpretation of findings and insights, restraints around generalizability, and finally, the
feasibility of implementation also need to be highlighted.
5.6.1 Concrete counterfactual
The initial stages of the study considered including government schools as the schools were
supposed to comply with the RTE Act and would have represented a sound counterfactual.
Repeated attempts to seek permission from the government authorities did not materialise,
and permission was sought from only one school. The reason as to why these schools would
have made an excellent counterfactual is because, as per section 8 (G) of the RTE Act,
government schools are required to comply with the norms of the schedule (MHRD, 2011).
However, they are not required to attain a recognition certificate or face any penalties for
noncompliance. Data from the government’s foremost educational institution, NUEPA,
reports that even government schools do not comply with all the Act’s regulations. In spite of
this, none of the government schools has been issued with closure notices. While, on the
contrary, NISA (2016) and Kingdon (2017) cite evidence from government documents, which
indicate that private schools have either received a threat for closure or have been closed
down (Kingdon 2017; NISA 2016). Comparing academic outcomes from government schools
with those of threatened private schools could have strengthened the case to outline the
gaps and inconsistencies in the RTE Act. However, due to the unavailability of the
government schools, the research was restricted to observe the variation in academic
outcomes caused due to the RTE Act indicators within the private schools themselves.

194
5.6.2 Limited sample size
The sample size was quite limited. The overall participation comprised ten low-cost private
schools, 33 teachers and 305 students participating in the diagnostic and IQ test. Due to the
time and cost constraints, a more substantial number of schools could not be included in the
study. Therefore, the significant associations between the RTE Act indicators and student
outcomes will need to be considered with caution.
Statistical associations have found to be counter-intuitive on a few occasions. For instance,
teachers’ salary range was negatively correlated with student test outcomes. Similarly, even
in case of infrastructure, the presence of toilets and audio-video resources have been
indicated to have negative effects on student achievement.
Research in the future undertaken with a broader sample size could investigate more certain
reasons for such associations and thereby add weight to policy implications.
5.6.3 Potential bias in the research
The sample size was quite limited. The overall participation comprised ten low-cost private
schools, 33 teachers and 305 students participating in the diagnostic and IQ test. Due to the
time and cost constraints, a more substantial number of schools could not be included in the
study. Therefore, the significant associations between the RTE Act indicators and student
outcomes will need to be considered with caution as there may be some element of bias
while selecting the sample, collecting the data, as well as interpreting the results.
Certain low-cost private schools were omitted during the design stage, such as those, which
had temporary principals50, if they were not traceable, or if they were closed during pre-
survey. The omission of such schools from the sample could have caused an inclusion bias,
meaning although they represented several characteristics of the actual sample they had to
be excluded due to some of the reasons listed above. The inclusion of such schools in the
study could have potentially altered the findings.
Schools, which voluntarily refused testing due to the fear of being prosecuted by the
government could have been better or poor performing schools. If they were better
performing schools, following minimal RTE rules, or if they were not, despite following the
RTE regulations, they still could have altered the existing relationships earlier described in
50 Temporary principals were heads of schools placed for an interim time period and they informed that they
had no substantial power in terms of decision making, and thus they were not in a position to allow the
research process to take place in the schools.

195
the analysis section. The absence of such schools from the research which satisfied the
conditions required for the sample, however, could prove to be a major limitation to the
research.
The RTE does not have any clear learning objectives for children. Most regulations outlined
in the RTE focus heavily on infrastructure norms, teacher policies and recognition for
schools. These regulations require a significant capital investment, which most of the times
is beyond the reach of low-cost private schools and indeed it's also a question of huge
opportunity cost. The government, apparently also seems to ignore the trade-off associated
with such investments and learning gains. For instance, it is quite likely that the low-cost
private schools by having fewer classrooms or no library can manage to have smaller class
sizes. Thus even if all the variables had a positive relationship with learning outcomes, the
example suggests that low-cost schools should not be implementing all the requirements of
the act to achieve the maximum rise in learning gains. This indicates that if requiring more
of one thing allows schools to provide less of something else, for those schools who do
not meet the requirements currently, implementing the act might potentially decrease
learning gains.
Data collection tools were assessed for validity and reliability; however; it is possible that the
instruments may not have been calibrated accurately and hence, there is a likelihood of
minor measurement errors in the evidence uncovered. For instance, the schools which were
found to be performing better as they embraced the regulations, doesn’t necessarily mean
that rolling out the RTE regulations to other schools could better their performance. It is
quietly likely that the better performing schools may have derived good benefits by allocating
the resources wisely. Hence, it is difficult to ascertain that implementing the rules may not
necessarily improve performance although statistical tests may suggest a relationship.
Statistical associations have found to be counter-intuitive on a few occasions. For instance,
teachers’ salary range was negatively correlated with student test outcomes. Similarly, even
in case of infrastructure, the presence of toilets and audio-video resources have been
indicated to have negative effects on student achievement. Research in the future
undertaken with a broader sample size could investigate more certain reasons for such
associations and thereby add weight to policy implications.
5.6.4 Limitations of data set and interpretations
Principals and schools heads reported the data on school-related RTE Act indicators from
various schools. It must be acknowledged that self-reporting on sensitive issues may not
yield the best results.

196
In this case, the reporting on several parameters of the RTE Act was akin to a double-edged
sword. On the one hand, school heads were sceptical of divulging too much information for
fear of being prosecuted if their identities were discovered. On the other hand, they felt the
urge to share as much information as possible as they believed that the outcomes for better
or for worse would at least narrate some part of their story. Robust checks and skips were
incorporated into the questionnaire to ensure response accuracy. However, it is still likely
that some participants, unintentionally, would have intended to project maximum compliance
to RTE indicators on specific sensitive issues. For instance, responses on the sensitive
matters could include; salary levels, holding back students in the same grade and transfer
certificate issued by schools. Responses to such issues were taken at face value.
Similarly, data on student indicators were gathered from the students themselves, and it is
likely that students may not have an accurate memory of their family background or any
other variable related to socio-economic status. Robust checks and back-checks were put in
place, and any error noticed in the data was corrected with participants the following day.
However, in spite of all the steps taken to avert the errors, there is a slim chance that data
errors might have crept in due to the volume of data so certain results associated with the
respective variables need to be interpreted with caution.
5.7 Future explorations and conclusion
The research indicates some interesting areas in which future work could be undertaken.
These include areas such as school management committees (SMCs), parent-teacher
associations (PTAs) and their effects on academic outcomes. The discussion chapter
outlined the findings from the research and aligned them with the second chapter (literature
review) around the impact of the RTE Act indicators on student outcomes. The concluding
chapter presents a summary of the findings around the research questions, the policy impact
on budget private schools across the globe and highlights the original contribution towards
knowledge.
197
Chapter Six: Conclusion – The road ahead and the way for future research
6.1. Introduction
The first chapter explores the reasons for the introduction of the RTE Act. The chapter
outlined the beginnings of the RTE Act and suggested that it is skewed to support
government schools over private schools. Examination of the various sections of the Act
showed that many of them were inherently detrimental to the growth of low-cost private
schools in India. The current research indicates that low-cost private schools not only impart
better quality education but they also keep their costs lower than their government
counterparts. Low-cost private schools across the country are being threatened with forced
closure, directly impacting the learning outcomes of children enrolled in them.
The RTE Act guarantees free and compulsory education to children between 6-14 years.
Threatening schools with closure not only jeopardises the future of the millions of children
enrolled in low-cost private schools but also seems to contradict the Act’s ethos. The
historical scenario laid out in chapter one studied the history of Indian education in five
phases, and it was discovered that even during the early 18th and 19th century, the private
sector was encouraged to engage in education provision for the masses. However, state-
based education took over following India’s independence, marginalising the private sector.
The historical timeline also traces the various acts, commissions and the transfer of control
of the education sector to the government after the colonial era and India’s independence.
Tracking the history of the RTE Act in India, it is evident that the bill had a long history before
being implemented across the states of India. However, a ‘concurrent theme’ in India meant
that the states of India could adapt it to their convenience and have state-specific acts
parallel to the main one laid out by the federal government. For instance, the state of Delhi
has two acts – the Delhi Primary Education Act, 1970 and the RTE Act of 2010.
The thesis mainly focused on the state of Delhi as the government threatened to close down
300 schools in the region for weak compliance with RTE Act indicators. The research
revealed that many schools are unable to comply with the indicators due to the enormous
capital expenditure involved. Moreover, chapter two discussed in detail the different physical
indicators related to schools and the teacher indicators which may or may not have an
impact on student learning.
Chapter two surveyed the literature around the world to determine the impact of various
educational inputs such as the physical indicators as well as teacher-related factors on
student learning outcomes from developing parts of the globe.

198
The review sensed a gap between the inputs and educational outcomes and found that
some were capable of influencing outcomes while others had a negative impact or no impact
at all. The effects of many inputs remained indeterminate.
Data collection was carried out through different instruments, and chapter three provides a
detailed account of their draft, design and implementation. For measuring learning
outcomes, a subject-specialised diagnostic test was used, and for determining the innate
ability of the students, Raven’s progressive matrices were utilised. A semi-structured
questionnaire assisted in collecting information on the RTE Act parameters from the school
as well as the teachers. To, capture the narratives and experiences of the schools’ owners, a
detailed, in-depth guideline was designed. The research project was high time-bound and it
was a major challenge to get the schools to agree to test during the same period. More than
300 students were tested in a two-week time frame, and the data was carefully collected,
monitored, validated and analysed.
Chapter four reported the findings from the research, and it transpired that most indicators
listed in the RTE Act did not have any significant impact on learning outcomes. The following
research questions were explored, and the findings were laid out concerning the quantitative
and qualitative analysis:
1. Is there any relationship between student achievement and the RTE Act’s emphasis
on physical indicators?
2. Do the RTE Act teacher indicators have any impact on students’ learning outcomes?
3. Does following certain RTE Act core guidelines rigidly have any impact on students’
test achievement?
4. Does following the RTE Act’s institutional academic indicators have an impact on
student achievement?
5. In correlation with the above questions, how do low-cost private school owners view
the RTE Act regulations?
The first question explored the infrastructure mandates required by the RTE Act. The
analysis revealed that most infrastructure requirements had no significant impact on student
learning outcomes except for two indicators which included the provision of meals and library
in the school. The second question constituted of eight different variables relating to teacher
indicators reported that teacher training, those who teach multiple subjects and educational
qualifications of the teacher had a positive impact on student outcomes. While on the other
hand, the job status of the teachers, salary ranges and the PTAs were found to be negatively
associated with student achievement.

199
The third question comprised the RTE Act’s academic indicators. The indicators chosen
included awareness of the RTE Act, RTE Act orientation for teachers, the range of fee
charged by a school, practising inclusion, disability policy and the presence of an SMC in the
school. Only one factor (practising inclusion) was found to be positively significant to learning
outcomes.
Similarly, the fourth and final question related to institutional indicators which included
children being denied progress to the following year group, aids to promote learning
activities and schools which undertook assessments at regular intervals. The findings
revealed that only schools that allowed ‘learning by doing’ were able to influence test scores
positively.
The qualitative insights from the schools revealed the following insights:
Schools threatened by the government were complying with most of the RTE Act
laws. However, they could not actively comply with all the regulations as it required
substantial capital investments from the school owners which they could not afford.
Most school owners realised and acknowledged that norms listed under the RTE Act
were associated with enhancing infrastructure requirements and were quite clear that
the RTE Act’s regulations do not contribute towards the enhancement of student
learning or achievement.
School owners felt that most regulations were a formality and the checklist
constituted by the RTE, fostered corruption in the system
The RTE Act has rigid regulations on teacher hiring, training and salaries. Owners of
low-cost private schools believed that it was almost impossible to follow the
regulations as they may not have the resources, networks and assistance found in
government schools or affluent private schools.
Several schools struggled to comply with the RTE Act due to the lengthy bureaucratic
process. For instance, schools were required to obtain different kinds of certificates
for operational purposes: a fire safety certificate, a structural stability certificate etc.
However, these certificates were available at different government office locations,
which often charged bribes for issuing the certificates, instead of a central location
providing all certificates.
The above research questions aimed to understand the RTE Act’s regulatory mechanism
from an inputs-based perspective. By examining the findings, it is quite evident that the RTE
Act’s regulations are skewed towards input mechanism rather than the output-based
measure.

200
However, one must acknowledge that a major limitation with the findings is the limited
sample size available for the study. The next section discusses the consequences of such a
state-promoted act which is likely to harm the growth of free-market enterprise and
entrepreneurship.
6.2. Consequences of the RTE Act in its current form
In light of the current research, it is important to understand the implications of the Right to
Education Act on various areas and highlight some of the detrimental consequences arising
due to its implementation. The RTE legislation was designed to promote inclusion and quality
education to children but it seems that these stringent regulations for low-cost private schools
with a focus on an input-based approach lead to adverse implications.
The RTE Act’s inflexible input-based policies are capable of jeopardising low-cost
private schools’ objectives of providing affordable education to poorer families. From
the findings of the research, it is evident that most low-cost private schools focus on
improving learning outcomes by hiring local teachers and skilling them internally.
Federal and state governments enforcing an input-based policy on these schools can
derail them from their mission.
The RTE Act regulations also foster fear and ambiguity as the threat of closure will
coerce schools to comply. Coerced compliances shall lead to more corruption in the
system and entrepreneurs are then likely to justify corruption as the ‘only means’ to
conform with the requirements.
The regimental regulations of the Act could plausibly usher an atmosphere of
mistrust and hostility towards the government. The nebulous nature of the RTE Act
could erode faith in the governmental system, specifically for those educational
entrepreneurs who are likely to set up new schools.
Closure of low-cost private schools would coerce parents to admit their children into
government schools. This is likely to prevent children from obtaining a quality
education at affordable costs. As a consequence, parents will be forced to send their
children to government schools instead of better quality, low-cost private schools.
This leads to violation of Article 2151 and 21A of the Indian constitution.
51 Article 21 of the Indian constitution states that no person shall be deprived of his life or personal liberty
except according to procedure established by law.

201
The inability of the school owners to adhere to the laws of the educational
department could harm their entrepreneurial spirit and stifle the developmental
agenda promoted by the current government.
Finally, the RTE regulations pose a major threat to the free market economy and
discourage a market-based approach to improve the quality of education in the
country. Moreover, by doing so, it sets up a poor precedent for the neighbouring
countries in the south Asian region, which are likely to emulate India’s policy
measures as they look upon India major emerging economy across the globe.
The next section considers the contribution of the study towards the knowledge repository.
6.3. Contribution of research to the knowledge repository
The research can be considered novel and unique in many ways. Although the sample size
of the study was limited to the depth and breadth of the learnings from the study are capable
of adding rich insights to the vast body of knowledge prevalent in this area.
Firstly, the research could be pioneering due to the nature of the schools participating in the
study. The government has threatened these schools for closure. Previous research (Baird,
2009; De, Noronha & Samson, 2002; Tooley & Dixon, 2005; Tooley & Longfield, 2014)
investigated low-cost private schools as a whole unit, possibly because the threat scenario
from the regulatory environment had not emerged. However, following the RTE Act, schools
were given notices for closure or closed down in case of weak compliance (NISA, 2016;
Ramachandran & Reddy, 2015). The dynamics of the schools threatened with closure is
distinct in the sense that these schools struggle to remain in operation and persistently
reinvent themselves due to the challenging environment created by the regulatory
authorities.
Secondly, however, several studies investigate the infrastructure elements and attempt to
ascertain the link, if any, between inputs and educational achievement. The current research
focuses explicitly on the RTE Act infrastructure indicators and attempts to establish the
extent of any links between infrastructure elements and learning outcomes. The findings
suggest that several input indicators listed in the RTE had no or minimal impact on how
children learned in school. This could have disastrous results as governmental bodies, and
education departments could end up spending resources on indicators which may not be
relevant to raise learning outcomes.
Thirdly, the study looks at some of the unique input parameters associated with the RTE Act:
awareness of the Act, RTE Act orientation for teachers, the range of fee charged by a

202
school, inclusion practices, disability policy and the presence of an SMC in a school.
Including these parameters makes the study more robust as it covers the landmark act in its
breadth and depth. Thus, it contributes towards the limited literature available in the domain
of RTE Act indicators and enriches the knowledge repository with some unique findings
applicable to the context of the RTE Act.
Fourthly, the study addresses misconceptions amongst policymakers relating to teachers.
The RTE Act places heavy emphasis on teacher recruitment by mandating stringent criteria
such as compulsory teacher training, minimum level qualifications and recruitment of
teachers on permanent rolls. Insights from interviews revealed that when teachers were
hired locally and trained in-house by experienced teachers, they tend to produce better
results. In that sense, the study overcomes misconceptions by contributing rich insights at a
policy level and can assist in building a robust policy, fair and acceptable for all schools
whether government or private.
Finally, several countries in South Asia such as Pakistan, Bangladesh and Sri Lanka are
likely to take a cue from India’s policy regulations. Even in many countries of sub-Saharan
Africa, such regulations focus on inputs and are skewed towards supply-based interventions.
This thwarts the growth of market-based education and the spread of low-cost private
schools. The current work will benefit other developing countries which may try and emulate
the policy regulations. It highlights the pitfalls and perils of embracing a skewed policy
focused merely on inputs which ignore the primary goal of learning outcomes.
6.4. Implications of the study on policy on the low-cost private schooling sector
Chapter one outlined the increasing demand for education; almost 96% of children in India
are enrolled in government and private schools, with an ever-increasing demand for private
schools. However, close to 100 percent enrollment in school has only resolved part of the
problem – the next major challenge is to improve learning outcomes. According to ASER
(2013), just a fifth of grade 3 students in government schools could solve basic arithmetic
computations like additions and subtractions, compared to 50% in private schools. This
finding worsens as the grades progress. To address such significant levels of ‘learning crisis’
would require a major overhaul of the Act itself, in the event that the current conclusions
were agreed and accepted. Based on the research results and the study of the RTE Act
sections in chapter one, the following implications are uncovered and recommendations
outlined:

203
The RTE act was drafted to inject the integral components, i.e. quality and equity to
schooling. However, it seems that the act has been imposing stringent standards on the
behest of implementing the components has done considerable harm to the low-cost private
schooling system (Brinkmann 2012, Centre for Civil Society 2015) rather than improving it.
Firstly, the decline in quality and some of the reasons associated with it have been
discussed below:
Lack of remedial support to weaker students – Before the introduction of the RTE Act private
and government schools were allowed to hold back students in case of poor performance
and assist them in improving their competencies and skills in their core subjects. However,
after the introduction of the RTE act, it was a mandatory requirement for the schools to
promote students to the next grades irrespective of their performance. Such a policy creates
a cohort of students who would lack a basic understanding of crucial subjects like
mathematics, reading and sciences. Private schools, mandatorily are now required to
promote weaker children year-on-year, as an obligation to the act and the regulation deters
them from providing remedial support to weaker students.
Mandatory imposition of regulation and absence of learning objective – The RTE which is a
landmark act does not have any clear learning objectives for children. Most regulations
outlined in the RTE focus heavily on infrastructure norms, teacher policies and recognition
for schools. These regulations require a signification capital infusion, which sometimes is
beyond the reach of low-cost private schools and hence, they are forced to shut down. The
consequences of such a monumental error in such a landmark act can prove to be
catastrophic, and it is quite likely that more and more schools which currently fall under the
ambit of the act are likely to discontinue operations.
Secondly, the RTE intended to promote social equity through compulsory schooling of 6 -14
years of age, and it attempts to do that through section 12(i) (c). The section mandates that
private schools are required to reserve 25% of their seats to children from economically
weaker sections (EWS) of the society. There is no doubt that such regulation shall help the
poor to avail of a good education at an affordable cost. However, a careful examination of
the section indicates that government assures to reimburse the fees of those children
enrolled under the EWS quota. Information from the media, qualitative interviews with the
principals and school owners indicate that the reimbursement policies have been vaguely
framed. Private schools have expressed grievance that they have neither received any
payment nor any communication from the government, as to when they could expect the
payments.

204
Low-cost private schools, do face capital deficits and the lack of capital injection, when
required hurts them and indeed, affects their ability to make any innovations to their learning
and pedagogical strategy.
Discouraging school choice - The RTE Act discourages parents’ school choice through
catchment areas, whereby parents are encouraged to enrol their children in the nearest
government school. However, the density of population in areas where people from lower
socio-economic backgrounds reside differs to a great extent. Therefore, it is likely that
schools could be over or under-subscribed. Catchment areas limit choice and low-income
families’ access to low-cost private schools. The RTE Act’s definition of ‘neighbourhood
schools’ which constitute catchment areas should thus comprise all types of school rather
than being limited to government schools. Moreover, the discouarging choice for parents as
to which schools they should choose for their children also kills competition among schools
6.5. Remedial measures to bridge the gaps in the RTE Act
The RTE directs unaided privates schools to reserve 25% of places for disadvantaged
children. It further assures that the government shall reimburse the school for this. However,
that is not sufficient as several schools do not receive this money in due course. The
government needs to ensure that all arrears are paid completely and transparency in
payments must be established through a tracker published on the website periodically.
Moreover, failure to pay the private schools should incur a penalty, and the appropriate
government (federal or state) should be liable to pay the fines with interest. In this manner,
the state can be made accountable to unaided private schools. The RTE Act mandates a
certificate of recognition for private schools. However, evidence exists to prove that
government schools themselves fail to comply with the RTE norms (Ashwathi, 2012). In spite
of this, government schools are recognised by default and have minimal or no scrutiny. The
Act should have standard accreditation procedures for all kinds of schools. An independent
consulting or evaluating agency should be constituted for periodic assessment of schools.
Evidence from the current research and previous studies indicates that the RTE Act is
skewed towards an input-based policy, even though neither the government nor the private
schools are capable of adhering to the norms completely. In such a scenario, a complex
regulation with much emphasis on input-based norms should be replaced by the overall
performance of the educational institutions including improvement in learning outcomes with
minimum weighting for infrastructure. Gujarat, an Indian state has made sweeping changes
to the RTE and has reduced the weightage of input-based norms, replacing them with
learning outcomes.

205
Component norm Strategic initiative Impact Weightage
in the Act
Student learning outcomes – (Absolute levels)
Use independent internal and
external assessments to
measure student learning
levels, focused not just on
rote but also higher order
skills like critical thinking,
communication, collaboration
and creativity.
A focus on improving learning
outcomes will prepare students
for the 21st century in a
burgeoning global knowledge
economy.
30%
Student learning
outcomes –
(School’s past
performance
comparisons)
Introducing this component
enables the monitoring of two
scenarios
a) Schools simply do not
show inflated results by
avoiding weaker students
b) Effect of the better
performance of the school
is not reflected due to the
students who come from
wealthier families
Schools will have a good blend
of students from all strata of
society and improving the
performance of mixed cohorts
shall enable the progress of
society at an overall level.
40%
Holistic student
development –
focusing on non-
academic outcomes,
including sports,
personality
development and
parental feedback
The components would try
and achieve the two
objectives:
a) Measure student progress
on a wholsitic basis
through a random sample
of parents
b) Encourage schools to
develop standardised
tools for measuring non-
academic outcomes
Focusing on ‘wholistic
development’ would avoid the
pitfalls of ‘teaching to test’ and
thus preparing students for a
better future and institutions for
excelling at all parameters.
20%
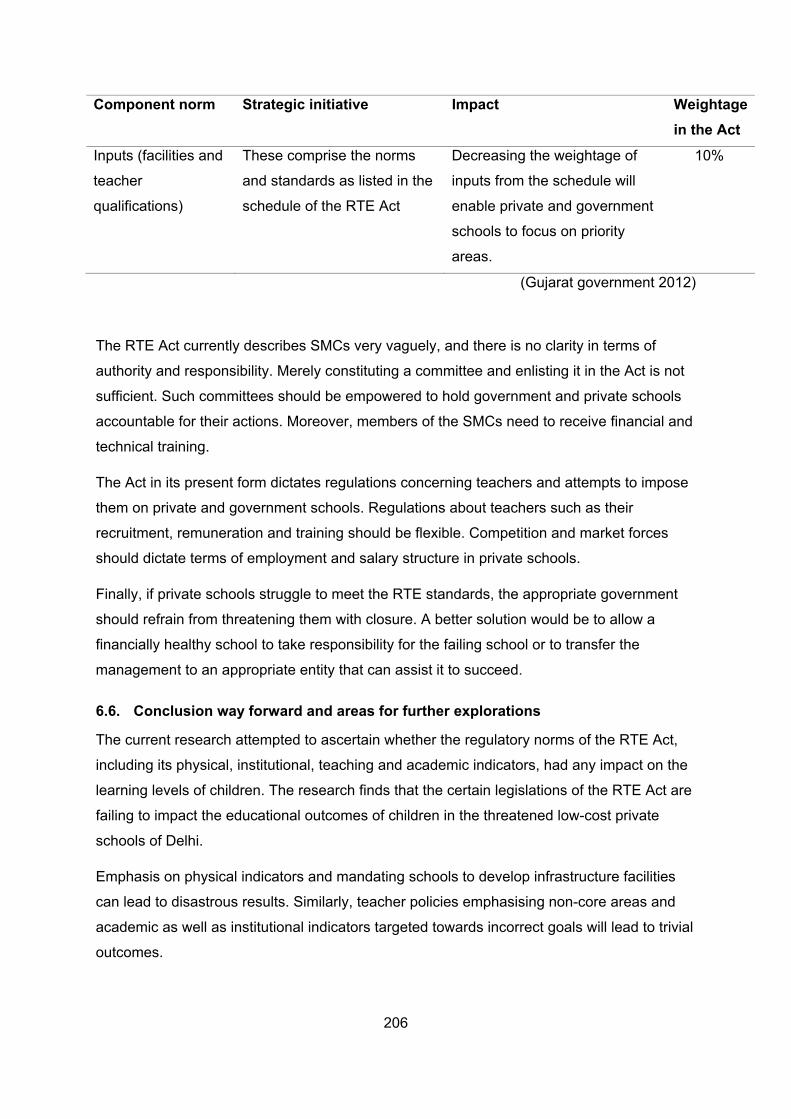
206
Component norm Strategic initiative Impact Weightage
in the Act
Inputs (facilities and
teacher
qualifications)
These comprise the norms
and standards as listed in the
schedule of the RTE Act
Decreasing the weightage of
inputs from the schedule will
enable private and government
schools to focus on priority
areas.
10%
(Gujarat government 2012)
The RTE Act currently describes SMCs very vaguely, and there is no clarity in terms of
authority and responsibility. Merely constituting a committee and enlisting it in the Act is not
sufficient. Such committees should be empowered to hold government and private schools
accountable for their actions. Moreover, members of the SMCs need to receive financial and
technical training.
The Act in its present form dictates regulations concerning teachers and attempts to impose
them on private and government schools. Regulations about teachers such as their
recruitment, remuneration and training should be flexible. Competition and market forces
should dictate terms of employment and salary structure in private schools.
Finally, if private schools struggle to meet the RTE standards, the appropriate government
should refrain from threatening them with closure. A better solution would be to allow a
financially healthy school to take responsibility for the failing school or to transfer the
management to an appropriate entity that can assist it to succeed.
6.6. Conclusion way forward and areas for further explorations
The current research attempted to ascertain whether the regulatory norms of the RTE Act,
including its physical, institutional, teaching and academic indicators, had any impact on the
learning levels of children. The research finds that the certain legislations of the RTE Act are
failing to impact the educational outcomes of children in the threatened low-cost private
schools of Delhi.
Emphasis on physical indicators and mandating schools to develop infrastructure facilities
can lead to disastrous results. Similarly, teacher policies emphasising non-core areas and
academic as well as institutional indicators targeted towards incorrect goals will lead to trivial
outcomes.

207
Low-cost private schools operating across the length and breadth of India are struggling to
keep themselves afloat due to the hostile policies of the government. Moreover, the
aggressive policies have pushed these schools to resort to an extra-legal sector, and they
attempt to gain freedom the government legislations by resorting to bribes and corruption.
Therefore, the recommendations provided in the current chapter attempt to bridge the gaps
existing in the RTE Act. The current research can act as a catalyst for future research that
assists in resolving the perennial problems that affect the education sector adversely. There
is an essential need to undertake large-scale research encompassing diagnostic tests to
check the health of the educational system regularly. The current research can also help in
strengthening the regulatory Act across Indian states. Further study can be undertaken in
the following areas:
Comparing private and public schooling systems with regards to student outcomes,
school efficacy and efficiency – (including per student spending, teacher recruitment,
motivation and retention) concerning the RTE Act indicators.
Reviewing and creating an index of best practices about the RTE Act and embracing
the regulatory norms adopted by other emerging and developing nations suited to
India’s context.
Exploring core RTE Act indicators with a larger sample size especially to study areas
like school management committees (SMCs), parent-teacher associations (PTAs)
and their effect on academic outcomes.
6.7. Epilogue
The thesis began with a personal story of how deprivation to education can dash the hopes of
the poor. There is ample evidence of how the quality of learning can raise the standard of
living, and how depriving education for the poor can push them in a vicious cycle of poverty.
In this context, the RTE which is likely to be the turning stone in the field of education and has
the potential to change the conditions for future generations cannot be solely focused on
inputs. The perils of such a skewed policy can be far-reaching and could have widespread
effects. Already, poor learning outcomes, one such significant influence has been outlined
time and again. The literature review found that learning outcomes in the have fallen since the
introduction of the RTE Act and the Annual Status of Education Report (ASER) is a testimony
to that fact, clearly outlining the falling levels of learning in language and mathematics. In that
context, the RTE Act has miserably failed to transform ‘schooling into learning’, and schooling
without learning is pointless as it leads to the potential loss of talent amongst schoolchildren.
With a population of more than a billion and considered to be an emerging economy in the
global spectrum, it is crucial that India’s education policy embraces a paradigm shift from an

208
‘input-based’ approach to an ‘output-based’ approach. Moreover, India’s sovereign parliament
is accountable to the people, so it is crucial that budgetary spending attains a balanced
approach to inject efficiency and efficacy to build robust policies.
The current research shares an in-depth understanding of the RTE Act regulations and their
impact on learning outcomes, especially concerning threatened low-cost private schools. It
provides recommendations as to how governments can work closely with the private sector.
The research hopes to play a crucial role in the cornerstone of reforms envisaged in the
education sector in the next decade to come.

209
Bibliography
Abhijit, Banerjee, Rukmini Banerji, Esther Duflo, Rachel Glennerster, and Stuti Khemani. 2011. “Effective pedagogies and a resistant education system experimental evidence on interventions to improve basic skills in rural India.” American Economic Journal (J-PAL) 2: 1-30.
Abogan, Ayokunle. 2013. Lessons in Learning. Woodrow Wilson School of International and Public Affairs.
Active living research. 2015. “https://activelivingresearch.org/sites/default/files/ALR_Brief_ActiveEducation_Jan2015.pdf.” https://activelivingresearch.org. January. Accessed March 23, 2018.
Adukia, Anjali. 2017. “Sanitation and Education.” American Economic Journal: Applied Economics 23-59.
Aiyar, Yamini. 2013. Towards a New Frontier for Governing Elementary Education Finances in India. New Delhi: Routledge.
Ajani, Idowu Rasheed, and Oluwole Bamidele Akinyele. 2014. “Effects of Student-Teacher Ratio on Academic Achievement of Selected Secondary School Students in Port Harcourt Metropolis, Nigeria.” Journal of Education and Practice Vol.5, No.24 100-106.
Alexander, Robin J. 2001. Culture and Pedagogy: International Comparisons in Primary Education. Oxford. Blackwell.
American Association for the Advancement of Science. 1990. “https://goo.gl/gWi7jD.”
Anderson, and Bennett. 2003. Developing educational leadership: using evidence for policy and practice. London: Sage.
Anderson, Kym, and Anna Strutt. 2013. Emerging Economies, Productivity Growth, and Trade with Resource-Rich Economies by 2030. New South Wales: AARES.
Angrist, J., E. Bettinger, and M. Kremer. 2006. “Long-term educational consequences of secondary school vouchers: evidence from administrative records in Colombia. .” American Economic Review 847–862.
Angrist, J., E. Bloom E. Bettinger, E. King, and M. Kremer. 2002. “Vouchers for private schooling in Colombia: evidence from a randomized natural experiment.” American Economic Review 1535–1558.
Antony, Meril. 2014. Challenges to School Edupreneurs in the Existing Policy Environment: Case Study of Delhi and Gujarat. New Delhi: Centre for Civil Society.
Antony, Meril. 2014. Challenges to School Edupreneurs in the Existing Policy Environment: Case Study of Delhi and Gujarat. New Delhi: Centre for Civil Society.
ASER Centre. 2015. Annual Status of Education Report 2014. New Delhi: ASER Centre.
ASER Centre. 2013. Annual Status of Education Report. New Delhi: Pratham.
ASER Centre. 2014. ASER Report. NewDelhi: Pratham.

210
Ashley, Laura Day, Claire Mcloughlin, Monazza Aslam, Jakob Engel, Joseph Wales, Shenila Rawal, Richard Batley, Geeta Kingdon, Susan Nicolai, and Pauline Rose. 2014. The role and impact of private schools in developing countries. London: DFID.
Ashwathi. 2012. https://www.careerindia.com/news/2012/04/10/rte-infrastructure-lack-in-almost-95-percent-of-schools.html. 10 April. Accessed May 13, 2018. https://www.careerindia.com.
Baird, Ross. 2009. Private schools for the poor. Gray Matters Capital.
Baird, Sarah, Craig McIntosh, and Berk Özler. 2011. “Cash or Condition? Evidence from a Cash Transfer Experiment.” Quarterly Journal of Economics 1709–1753.
Banerjee, A, S Cole, E Duflo, and L Linden. 2007. “Remedying education: evidence from two randomized experiments in India.” Quarterly Journal of Economics 1235–1264.
Banerjee, Abhijit, and Esther Duflo. 2011. Poor economics. New York.
Banerjee, Abhijit, Shawn Cole, Esther Duflo, and Leigh Linden. 2005. “Remedying Education: Evidence from Two Randomized Experiments in India.” National Bureau of Economic Research Working Paper Series 1-61.
Barrera-Osorio, F. 2007. The impact of the private provision of public education: empirical evidence from Bogota´s concession schools. World Bank Policy Research Papers 4121.
Barrera-Osorio, F, and L Linden. 2009. The use and misuse of computers in education: evidence from a randomised experiment in Colombia - Policy Research paper. World Bank Po.
Barrera-Osorio, Felipe, and Leigh L. Linden. 2009. The Use and Misuse of Computers in Education: Evidence from a randomized experiment in Colombia. Washington DC: World Bank - Policy Research Working Paper Series 4836.
Barro, R. 1991. “Economic growth in a cross-section of countries.” Quarterly Journal of Economics 407–443.
Bashir, Sajitha. 1997. “The Cost-Effectiveness of Public and Private Schools: Knowledge Gaps, New Research Methodologies and an Application in India .” In Marketizing Education and Health in Developing Countries: Miracle of Mirage? , by Christopher Colclough, 134-135. Clarendon Press Oxford.
Basu, Sambit. 2013. Private Sector in Education: An Overview. Public report, New Delhi: Routledge.
Basu, Sambit. 2013. Private Sector in Education: An Overview. New Delhi: Routledge.
Batra, Poonam. 2013. Positioning Teachers in the Emerging Education Landscape of Contemporary India. Academic, New Delhi: Routledge.
BBC. 2018. http://www.bbc.co.uk/news. 5 January. Accessed January 5, 2018. http://www.bbc.co.uk/news/education-42578874.
Becker, Gary. 2009. A Theoretical And Empirical Analysis, With Special Reference To Education. University of Chicago Press.

211
Becker, Murphy, and Tamura. 1990. “Economic growth, human capital and population growth.” Journal of Political Economy S12–S137.
Bhandari, Namita, and Nikita Doval. 2015. http://www.livemint.com/Politics/FBu7bMb0tTKQxihKOu07zH/The-surprising-surge-of-girls-in-the-classroom.html. 23 October. Accessed December 14, 2015. http://www.livemint.com/Politics/FBu7bMb0tTKQxihKOu07zH/The-surprising-surge-of-girls-in-the-classroom.html.
Bhat, Dhruva. 2017. “Harbinger of a New Era”? Evaluating the Effect of India’s Right to Education Act on Learning Outcomes. Harvard Kennedy School Mossavar-Rahmani Center for Business & Government.
Bhukkal, Geeta. 2014. Report of CABE subcommittee for assessment and implementation of continuous comprehensive evaluation in the context of no detention provision in the right to compulsory education act, 2009. Haryana, India: Government of Haryana.
Bjorkman, M. 2004. Public funding in the educational sector and its effect on test scores: evidence from Uganda. IIES Stockholm University Working Paper.
Brinkman, Suzana Andrade. 2013. Thinking Outside the Government Box. New Delhi: Routledge.
Brinkmann, Suzana Andrade. 2012. Thinking outside the Government Box. New Delhi: IDFC.
Bruns, B, D Filmer, and A. Patrinos. 2011. Making schools work: New evidence on Accountability Reforms. Washington, DC: World Bank.
Bryman, A. 2004. “Social Research Methods.” Oxford: Oxford University Press.
Buddin, Richard, and Gema Zamarro. 2009. Teacher Qualifications and Student Achievement in Urban Elementary School. Research report, Rand Corporation.
Butler, Michael R, and Edward M McNertney. 1991. “Estimating Educational Production Functions: The Problem of Multicollinearity .” The Social Science Journal 489-499.
Byrne, C J. 1983. Teacher Knowledge and Teacher Effectiveness. A Literature Review, Theoretical Analysis and Discussion of Research Strategy. North Western Educational Research Association - Paper presented.
Camara, Wayne J. 1997. “Use and Consequences of Assessments in the USA: Professional, Ethical and Legal Issues.” European Journal of Psychological Assessment 140–152.
Campbell, Donald T. 2009. “Foreword .” In Case study research Design and Methods, by Robert K Yin, viii. Los Angeles, London, Delhi and Singapore: Sage.
Carlson, SA, JE Fulton, and SM Lee. 2008. “Physical education and academic achievement in elementary school: data from the Early Childhood Longitudinal Study.” American Journal of Public health 721-727.
Carlsson, Sven A. 2011. “http://is2.lse.ac.uk/asp/aspecis/20030152.pdf.” Accessed January 8, 2015. http://is2.lse.ac.uk.

212
Carneiro, Pedro Manuel, Oswald Koussihouede, Nathalie Lahire, Costas Meghir, and Corina Mommaerts. 2015. Decentralizing Education Resources: School Grants in Senegal. CEPR Discussion Paper DP10527.
Case, Anne, and Angus Deaton. 1998. School quality and educational outcomes in South Africa. Working Paper #98-08, Center for Research on Child Wellbeing.
CCS; CSF. 2013. “http://righttoeducation.in/sites/default/files/The%20Right%20to%20Education%20Legislation%20A%20history.pdf#overlay-context=.” http://righttoeducation.in. Accessed May 7, 2015. http://righttoeducation.in/sites/default/files/The%20Right%20to%20Education%20Legislation%20A%20history.pdf#overlay-context=.
Centre for Civil Society. 2015. Effectiveness of School Input Norms under the Right to Education Act, 2009. New Delhi: Centre for Civil Society.
—. 2013. “http://righttoeducation.in/sites/default/files/Section%20Wise%20Rationale%20or%20Clarification%20of%20RTE%20Act.pdf#overlay-context=.” Accessed May 10, 2015. http://righttoeducation.in.
—. n.d. “http://righttoeducation.in/sites/default/files/The%20Right%20to%20Education%20Legislation%20A%20history.pdf#overlay-context=.” http://righttoeducation.in.
CFBT. 2011. Preliminary Study into Low Fee Private Schools and Education. DFID.
Chakraborty, Tanika, and Rajshri Jayaraman. 2016. School Feeding and Learning Achievement: Evidence from India’s Midday Meal Program. IZA Discussion Paper No. 10086.
Chavan, Madhav. 2011. The Unseen Change’, in Annual Status of Education Report. New Delhi: ASER.
Chetty, Raj, John N. Friedman, Nathaniel Hilger, Emmanuel Saez, Diane Whitmore Schanzenbach, and Danny Yagan. 2011. “How does your kindergarten classroom affect your earnings? Evidence from Project Star.” Quarterly Journal of Economics 1593-1660.
Chetty, Raj, John, Friedman, and Jonah E. Rockoff. 2014. “Measuring the Impacts of Teachers I: Evaluating Bias in Teacher Value-Added Estimates.” American Economic Review 2593-2632}.
Cindy, Garrrity. 1998. Does the Use of Hands-On Learning, with Manipulatives, Improve the Test Scores of Secondary Education Geometry students? Research report, Chicago: Educational Research and information centre.
Coe DP, Pivarnik JM, Womack CJ, Reeves MJ and Malina RM. 2006. “Effect of physical education and activity levels on academic achievement in children. .” Medicine & Science in Sports & Exercise 1515-1519.
Coe, Robert, Cesare Aloisi, Steve Higgins, and Lee Elliot Major. 2014. What makes great teaching? Sutton Trust.

213
Cohen, L, L Manion, and K Morrison. 2000. Research Methods in Education. London and New York: Routledge: Falmer.
Cohen, Louis, Lawrence Manion, and Keith Morrison. 2007. Research Methods in Education. Routledge.
Colclough, C. 1996. “Education and the market: which parts of the neo-liberal solution are correct?” World Development 589–610.
—. 1997. Marketizing education and health in developing countries: miracle or mirage? Oxford: Clarendon Press.
Contreras, D. 2001. Evaluating a voucher system in Chile. Individual, family and school characteristics. Universidad de Chile and Yale University Working Paper Series.
Coombs, P. H. 1985. The World Crisis in Education: The View from the Eighties. Oxford University Press.
Cotton, K. 2003. “Principals and student achievement. Alexandria,” Association for Supervision and Curriculum Development.
Creswell, J. 2012. Educational Research - Planning, Conducting and Evaluating Quantitative and Qualitative Research. Pearson.
Creswell, J, and P Clark. 2011. Designing and Conducting Mixed Methods Research. Thousand Oaks, CA: Sage.
Creswell, John. 2007. Qualitative Inquiry and Research Design. Sage Publications.
Creswell, John W. 2003. Research Design Qualitative, Quantitative and Mixed Methods Approaches. London, Delhi: Sage Publications.
Dabholkar, Vinay. 2010. http://www.catalign.in/2010/04/ideas-dont-die-easily-gopal-krishna.html. Accessed May 16, 2015. http://www.catalign.in/.
Das, Jishnu, Stefan Dercon, James Habyarimana, and Pramila Krishnan. 2004. When Can School Inputs Improve Test Scores? CSAE Working Paper Series No. 25.
Dash, N.K. 1993. “Research Paradigms in Education.” Journal of Indian Education 19: 1-6.
Dash, Nirod K. 2005. http://www.celt.mmu.ac.uk. Accessed January 6, 2015. http://www.celt.mmu.ac.uk/researchmethods/Modules/Selection_of_methodology/.
De, A, C Noronha, and M. Samson. 2002. “Private Schools for Less Privileged: Some Insights from A Case Study.” Economic & Political Weekly 5230-5236.
Deb, Sibnath, Esben Strodl, and Jiandong Sun. 2015. “Academic Stress, Parental Pressure, Anxiety and Mental Health among Indian High School Students.” International Journal of Psychology and Behavioral Sciences 26-34.
Delsen, Lei. 2007. Education and training: from consumption goods to investment goods. Nijmegen: Nijmegen Center for Economics (NiCE): Working Paper 07-102.
Desai, D. M. 1953. Universal, compulsory and free primary education in India. Bombay.
DISE . 2016. “DISE Data.” http://www.dise.in. Accessed March 20, 2018. http://www.dise.in/Downloads/Publications/Documents/U-DISE-SchoolEducationInIndia-2015-16.pdf.
214
—. n.d. “http://udise.in/Downloads/Trends-ElementaryEducation-2015-16/All-India.pdf.” http://udise.in. Accessed 10 24, 2017. http://udise.in.
Dixon, James Tooley & Pauline. 2005. Private Education is good for the poor. Washington: CATO Institute.
Doiron, Roy, and Marlene Asselin. 2015. “Ethical Dilemmas for Researchers Working in International Contexts.” School Libraries Worldwide 1-10.
Dongre, Ambrish, and Avani Kapur. 2016. “Trends in Public Expenditure on Elementary Education in India.” Economic & Political Weekly 23-25.
Dongre, Ambrish, Avani Kapur, and Vibhu Tewary. 2014. How much does India spend per student on Elementary Education? New Delhi: Accountability Initiative.
Dongre, and Kapur. 2012. PAISA. Accountability Initiative.
Drèze, Jean, and Geeta Gandhi Kingdon. 2001. “School participation in rural India.” Review of Development Economics 1-33.
Drost, Ellen. 2011. “Validity and Reliability in Social Science Research.” Education Research and Perspectives 105-124.
Duflo, E., R. Hanna, and S. Ryan. 2012. “Incentives work: getting teachers to come to school.” American Economic Review 102 (4) 1241–1278.
Duflo, Esther, Abhijit, Shawn Cole, and Leigh Lindon. 2005. “Remedying Education: Evidence from Two Randomised Experiments in India.” Quarterly Journal of Economics 3 (64): 122-123.
Duflo, Esther, James Berry, Shobhini Mukerji, and Marc Shotland. 2014. A Wide Angle View of Learning: Evaluation of the CCE and LEP Programmes in Haryana. International initiative for impact evaluation.
Duflo, Esther, Pascaline Dupas, and Kremer. And Michael. 2012. “School Governance, Teacher Incentives, and Pupil-Teacher Ratios: Experimental Evidence from Kenyan Primary Schools.” Journal of Public Economics 92-110.
Duflo, Esther, R Hanna, and S Ryan. 2012. “2012. Incentives work: getting teachers to come to school.” The American Economic Review 1241–1278.
Dwyer, T, WE Coonan, DR Leitch, BS Hetzel, and RA Baghurst. 1983. “An investigation of the effects of daily physical activity on the health of primary school students in South Australia.” International journal of epidemiology 308-313.
Dyer, C, and P Rose. 2005. “Decentralisation for educational development? An editorial introduction.” Compare: A Journal of Comparative and International Education 35(2): 105–113.
Economist. 2017. https://www.economist.com/news/asia/21723137-more-indians-are-attending-school-ever-they-are-not-learning-much-why-worlds. Accessed February Friday, 2018. https://www.economist.com.
EFA Global Monitoring Report. 2009. Overcoming inequality: why governance matters. . Paris: UNESCO.
EFA Global Monitoring Report. 2013. Policy Paper 9. Paris: UNESCO.

215
Elmore, R. 2000. Building a new structure for school leadership. Washington DC: The Albert Shanker Institute.
Ep Nuffic. 2015. The Indian education system described and compared with the Dutch system. EP Nuffic.
Eric A. Hanushek, and Javier A. Luque. 2002. Efficiency and equity in schools around the world. NBER Working Paper.
Evans, David K, and Anna Popova. 2015. What Really Works to Improve Learning in Developing Countries? World Bank Working paper 7203.
Field, Andy. 2009. Discovering statistics using SPSS. Sage Publications.
—. 2009. Discovering Statistics using SPSS. London, California, New Delhi, Singapore: SAGE.
Finn, Amy S., Matthew A. Kraft, Martin R. West, Julia A. Leonard, Crystal E. Bish, Rebecca E. Martin, Margaret A. Sheridan, Christopher F. O. Gabrieli, and John D. E. Gabrieli. 2014. “Cognitive Skills, Student Achievement Tests, and Schools.” Association for psychological science 736–744.
Fiorini, Mario. 2010. “The effect of home computer use on children's cognitive and non-cognitive skills.” Economics of Education Review 55-72.
First post. 2012. http://www.firstpost.com/india/no-water-no-toilet-95-schools-in-india-lack-rte-infrastructure-269363.html. Accessed May 05, 2015. http://www.firstpost.com.
Flyvbjerg, Bent. 2011. Case study. In Norman K. Denzin & Yvonna S. Lincoln (Eds.), The Sage handbook of qualitative research (4th ed., pp.301-316). Thousand Oaks, CA: Sage.
1988. “Foreign aid for education.” International Review of Education 313-335.
Frowe, I. 2001. “ Language and educational research. .” Journal of Philosophy and Education, 175-186.
Fuller, Bruce. 1985. Raising School Quality in Developing Counties: 2 What Investments Boost Learning? World Bank Discussion Paper - Education and training series.
g, Geeta. n.d.
Gage, Nathaniel. 2014. http://www.open.edu/openlearn/education/educational-technology-and-practice/educational-practice/engaging-educational-research/content-section-0. Accessed January 7, 2015. http://www.open.edu.
Galiani, S., P. Gertler, and E. Schargrodsky. 2008. “School decentralisation: helping the good get better, but leaving the poor behind. .” Journal of Public Economics 2106–2120.
Galiani, Sebastian, Paul Gertler, and Ernesto Schargrodsky. 2008. School decentralization: Helping the good get better, but leaving the poor behind . Elsevier.
Gall, MD, Borg Walter, and Gall and Joyce. 1996. Educational Research: An Introduction. New York: Logman.

216
Ganimian, Alejandro, and Richard J. Murnane. 2016. “Improving Education in Developing Countries: Lessons from Rigorous Impact Evaluations.” Review of Educational Research 719–55.
Garg, Nupur. 2011. “Low-Cost Private Education in India: Challenges and way forward.” Massachusetts Institute of Technology, 15 June.
Glaser, and Strauss. 1967. The discovery of grounded theory. Chicago: Aldine Publishing.
Glewwe, Eric A. Hanushek, Sarah D. Humpage, and Renato Ravina. 2012. School Resources and Educational Outcomes in Developing Countries: A Review of the Literature from 1990 to 2010. National Bureau of Economic Research.
Glewwe, P, M Kremer, S Moulin, and E Zitzewitz. 2004. “Retrospective vs prospective analyses of school inputs: the case of flip charts in Kenya.” Journal of Economic Development 251–268.
Glewwe, P., N. Ilias, and M. Kremer. 2010. “Teacher Incentives.” American Economic Journal 205–227.
Glewwe, Paul, and Karthik Muralidharan. 2015. Improving School Education Outcomes in Developing Countries: Evidence, Knowledge Gaps, and Policy Implications. RISE.
Glewwe, Paul, and Michael Kremer. 2006. Handbook of the Economics of Education, Volume 2. North-Holland: Elsevier B.V.
—. 2005. Schools, Teachers, and Education Outcomes in Developing Countries. Harvard University Press Working Paper.
Glewwe, Paul, Michael Kremer, and Sylvie Moulin. 2009. “Many Children Left Behind? Textbooks and Test Scores in Kenya.” American Economic Journal: Applied Economics 112–135.
Glewwe, Paul, Michael R. Kremer, and Sylvie Moulin. 2009. “Many Children Left Behind? Textbooks and Test Scores in Kenya.” American Economic Journal: Applied Economics 112–35.
Goel, Bal. 2014. “Regional Training Course on Sampling Methods for Producing Core Data Items for Agricultural and Rural Statistics.” Global strategy for agriculture and rural statistics. Jakarta Indonesia, September - October.
Golafshani, Nahid. 2003. “Understanding Reliability and Validity in Qualitative Research.” The Qualitative Report Volume 8 Number 4 597-607.
Gooptu, Debeshi. 2016. https://www.enterpriseinnovation.net/article/india-3rd-largest-startup-base-world-1674835767. 31 October. Accessed April 9, 2018. https://www.enterpriseinnovation.net.
Gosai, Dushyant. 2013. http://www.internationalpolicydigest.org/2013/04/24/history-of-economic-growth-in-india/. Accessed May 26, 2015. http://www.internationalpolicydigest.org.
Government of India. 2016. National Policy on Education. New Delhi: Government of India.
Govinda, and Diwan. 2003. Community Participation and Empowerment in Primary Education: Indian Experience. New Delhi: Sage Publishers.

217
Govinda, R, and M Bandyopadhyay. 2010. Changing Framework of Local Governance and Community Participation in Elementary Education n India, New Delhi/Brighton: NUEPA and the University of Sussex. CREATE Pathways to Access Research Monograph No.35.
Govinda, R, and NV Varghese. 1993. Quality of primary schooling in India - A case study of Madhya Pradesh. Paris: UNESCO.
Govt. of Delhi. 2014. “http://www.delhi.gov.in/wps/wcm/connect/98f8250046a2ddbd902e915d9d3d91ee/Registration+of+Societies.pdf?MOD=AJPERES&lmod=92948193.” http://www.delhi.gov.in. 22 March. Accessed October 26, 2017. http://www.delhi.gov.in/wps/wcm/connect/98f8250046a2ddbd902e915d9d3d91ee/Registration+of+Societies.pdf?MOD=AJPERES&lmod=92948193.
Goyal, Sangeeta, and Priyanka Pandey. 2009. How do Government and Private Schools Differ? - Findings from two large Indian states. New Delhi: World Bank.
Guba, E. G, and Y. S. Lincoln. 1994. “Competing paradigms in qualitative research.” In Handbook of qualitative research, by & Y. S. Lincoln N. K. Denzin, 105-117. London: Sage Publishing.
Gujarat government. 2012. http://gujarat-education.gov.in/education/Portal/News/159_1_MODEL%20RULES%2029.2.12.PDF. 29 February. Accessed May 13, 2018. http://gujarat-education.gov.in.
Hallinger, Philip. 2005. “Instructional Leadership and the School Principal: A Passing Fancy that Refuses to Fade Away.” Leadership and Policy in Schools 221-239.
Hamel, J, S Dufour, and D, Fortin. 1993. Case Study Methods, Qualitative Research Methods. California: Sage Publications.
Handa, Sudhanshu, and Kenneth R. Simler. 2000. “QUALITY OR QUANTITY? THE SUPPLY-SIDE DETERMINANTS OF PRIMARY SCHOOLING IN RURAL MOZAMBIQUE.” Washington, D.C. 20006 U.S.A: IFPRI, March. 1-46.
Hanks, Michael P, and Bruce Eckland. 1976. “Athletics and Social Participation in the Educational Attainment Process.” Sociology of Education 271-294.
Hanushek, Eric. 2003. “The failure of input based schooling policies.” The Economic Journal F64-F98.
Hanushek, and Woessmann. 2008. “The role of cognitive skills in economic development.” J Econ Lit. 607–68.
Hanushek, Eric A. 2015. “Education, Economics of.” International Encyclopedia of the Social & Behavioral Sciences, 2nd edition, Volume 7 149-157.
Hanushek, Eric A. 2003. “The failure of input based schooling policies.” The Economic Journal F64-F98.
Hanushek, Eric A. 1995. “Interpreting recent research on schooling in developing countries.” World Bank Research Observer 10 (2): 227-246.
Hanushek, Eric A., and Javier A. Luque. 2002. Efficiency and equity in schools around the world. Massachusetts: NBER Working Papers.

218
Hanushek, Eric A., and Ludger Woessmann. 2017. “School Resources and Student Achievement: A Review of Cross-Country Economic Research.” Springer 149-171.
Hanushek, Eric. 2010. “Education production function developed country evidence.” Economics of Education (Elsevier) 132-136.
Hanushek, Eric, and Dennis Kimko. 2000. “Schooling, labour-force quality, and the growth of nations.” The American Economic Review 1184–1208.
Harbison, Ralph W., and Eric A. Hanushek. 1992. Educational performance of the poor. Oxford University Press.
He, F, L. L Linden, and M. & MacLeod. 2008. “How to Teach English in India: Testing the Relative Productivity of Instruction Methods with Pratham English Language Education Program.” Unpublished manuscript, Columbia University, New York, NY.
Heckman, James, Seong Hyeok Moon, Rodrigo Pinto, Peter Savelyev, and Adam Yavitz. 2010. “Analyzing social experiments as implemented: A reexamination of the evidence from the HighScope Perry Preschool Program.” Quantitative Economics 1 1–46.
Helena, Harrison, Birks Melanie, Franklin Richard, and & Jane Mills. 2017. “Case Study Research: Foundations and Methodological Orientations.” http://nbn-resolving.de/urn:nbn:de:0114-fqs1701195. January. Accessed October 29, 2017.
Heyneman, Stephen P., and Jonathan M.B. Stern. 2013. “Low-cost private schools for the poor: What public policy is appropriate ?” International Journal of Educational Development 1-13.
Heyneman, Stephen. 1984. “Research on Education in the developing countries.” International Journal of Education Development 293-304.
Heyneman, Stephen, and William Loxley. 1983. “The Effect of Primary-School Quality on Academic Achievement across Twenty-nine High- and Low-Income Countries.” The American Journal of Sociology 1162-1194.
Hill, H. C., B Rowan, and D. L. and Ball. 2005. “Effects of Teachers' Mathematical Knowledge for Teaching on Student Achievement.” American Educational Research Journal 371-406.
Hodkinson. 2008. Grounded theory and inductive research. London: Sage Publications.
Howie, Erin K., and Russell R. Pate. 2012. “Physical activity and academic achievement in children: A historical perspective.” Journal of Sport and Health Science 160-169.
Hsieh, C., and M. Urquiola. 2006. “The effects of generalised school choice on achievement and stratification: evidence from Chile’s voucher program.” Journal of Public Economics 1477–1503.
IBEF. 2017. “https://www.ibef.org/economy/indian-economy-overview.” https://www.ibef.org. April.
IDFC. 2012. INDIA INFRASTRUCTURE REPORT. LONDON NEW YORK NEW DELHI: Routledge.
Imberman, Scott A. 2015. “How effective are financial incentives for teachers?” Institute for the Study of Labor (IZA) 158-158.
219
Irene. 2014. “The Ontological and Epistemological Foundations Of Qualitative And Quantitative Approaches To Research.” International Journal of Economics, Commerce and Management 1-17.
Jacob, Verghese, Anjini Kochar, and Suresh Reddy. 2008. School Size and Schooling Inequalities. Stanford: Stanford Centre for International Development.
Jain, Pankaj S., and Ravindra Dholakia. 2009. “Feasibility of Implementation of Right to Education Act.” Economic and Political Weekly, 44: 38-43.
Jamison, E. A, D.T Jamison, and E. A Hanushek. 2007. “The effects of education quality on income growth and mortality decline.” Economics of Education Review 771–788.
Jayaraman, Rajshri, Dora Simroth, and Francis De Veriocurt. 2010. The Impact of School Lunches on Primary School Enrollment: Evidence from India’s Midday Meal Scheme. New Delhi: Indian Statistical Institute.
Jefferies, Bill. 2011. “Critical Realism – an empirical realist critique.” Manchester University Business school working paper, July.
Jeon, Jihye. 2015. “The Strengths and Limitations of the Statistical Modeling of Complex Social Phenomenon: Focusing on SEM, Path Analysis, or Multiple Regression Models .” International Journal of Social, Behavioral, Educational, Economic, Business and Industrial Engineering International Journal of Social, Behavioral, Educational, Economic, Business and Industrial Engineering Vol 9 1634-1642.
Jimenez, E., and Y. Sawada. 1999. “Do community-managed schools work? An evaluation of El Salvador’s EDUCO program. .” World Bank Economic Review 415-441.
Jimenez, Emmanuel, and Yasuyuki Sawada. 1998. Do Community-Managed Schools Work? An Evaluation of El Salvador’s EDUCO Program. World Bank Working Paper Series.
Johnson, R. Burke, Anthony J. Onwuegbuzie, and Lisa A. Turner. 2007. “Toward a Definition of Mixed Methods Research.” Journal of Mixed Methods Research 112-132.
Jomaa, Lamis H, Elaine McDonnell, and Claudia Probart. 2011. “School feeding programs in developing countries: impacts on children's health and educational outcomes.” Nutrition Reviews 83-98.
Juneja, Nalini. 2003. “‘Constitutional Amendment to Make Education a Fundamental Right: Issues for a Follow-up Legislation’.”
Juneja, Nalini. 2003. (NUEPA).
Juneja, Nalini. 2003. “Constitutional Amendment to Make Education a Fundamental Right: Issues for a Follow-up Legislation’.”
Kakoli, Borkotoky, and Unisa Sayeed. 2013. “Educational progress in India in the Context of Out-of-School Children.” International Research Journal of Social Sciences 2(5): 9.
Kamijo, K, MB Pontifex, and KC O'Leary. 2011. “ The effects of an afterschool physical activity program on working memory in preadolescent children.” Developmental Science 1046-1058.
Kaur, Amandeep, and Ritu Bansal. 2016. “Impact of Mid-Day meal scheme on enrolment of students in Government schools.” Sai Om Journal of Arts & Education 13-16.

220
Kaveri, Subrahmanyam, and Greenfield Patricia. 1994. “Effect of video game practice on spatial skills in girls and boys.” Journal of Applied Developmental Psychology 13–32.
Kazmin, Amy. 2015. http://www.ft.com/cms/s/0/96c189a4-ef58-11e4-a6d2-00144feab7de.html#axzz3uffY3oDA. Financial Times. 7 May. Accessed December 18, 2015. http://www.ft.com/cms/s/0/96c189a4-ef58-11e4-a6d2-00144feab7de.html#axzz3uffY3oDA.
Keaveney, Erika V. 2014. “A Right Worth Fighting For? Understanding Declines in Student Achievement Following India’s Right to Education Act.” Graduate School of Education, Stanford University, July.
King, D. 2002. “The changing shape of leadership.” Educational Leadership 61–63.
King, Elizabeth M, and Berk Ozler. 2005. What’s Decentralization Got To Do with Learning? School Autonomy and Student Performance. Kyoto: Interfaces for Advanced Economic Analysis at Kyoto University.
Kingdon, G., and F. Teal. 2007. “Does performance-related pay for teachers improve student performance? Some evidence from India.” Economic Education Review 473–486.
Kingdon, Geeta. 1994. “An Economic Evaluation of School Management Types in Urban India.” An Economic Evaluation of School Management Types in Urban India: A case study of Uttar Pradesh. Unpublished PhD thesis at Oxford University.
Kingdon, Geeta Gandhi. 2007. “The progress of school education in India .” 22.
Kingdon, Geeta. 2017. The private schooling phenomenon in India: A review. Oxford University.
—. 2017. The Private Schooling Phenomenon in India: A review. Bonn, Germany: IZA – Institute of Labor Economics.
Kingdon, Geeta, Monazza Aslam, Sheila Rawal, and Sushmita Das. 2013. Are contract teachers and para-teachers a cost-effective intervention to address teacher shortage and improve learning outcomes? London: Evidence for Policy and Practice.
Kivia, Barbara J. 2000. http://pages.jh.edu/jhumag/0400web/18.html. April. Accessed 11 25, 2017. pages.jh.ed.
Klingner, J. K, S Vaughn, M. T Hughes, and J. S Schumm & B Elbaum. 1998. “Outcomes for students with and without learning disabilities in inclusive classrooms.” Learning Disabilities Research and Practice, 13(3), 153-161.
Koc, Nizamettin, and Celik Bekir. 2014. “The Impact of Number of Students per Teacher on Student Achievement.” Procedia - Social and Behavioral Sciences 65-70.
KPMG. 2016. Assessing the impact of Right to Education Act. Academic, KPMG.
Kremer, Michael, and Alaka Holla. 2009. “Improving Education in the Developing World: What Have We Learned from Randomized Evaluations?” Annual Review of Economics 513–42.
Kremer, Michael, and Alaka Holla. 2009. “Improving Education in the Developing World: What Have We Learned from Randomised Evaluations?” Annual Review of Economics 1.

221
Kremer, Michael, Karthik Muralidharan, Nazmul Chaudhury, F. Halsey Rogers, and Jeffrey Hammer. 2005. “Teacher Absence in India: A Snapshot.” Journal of the European 658-67.
Kurien, John. 2015. http://www.educationworldonline.net/index.php/page-article-choice-more-id-4365. Accessed May 14, 2015. http://www.educationworldonline.net.
L.W. Anderson, D.W. Ryan, and B.J. Shapiro. 1989. The IEA Classroom Environment Study. Elsevier.
Laerd Statistics. 2015. https://statistics.laerd.com/. Accessed June 2017. https://statistics.laerd.com/.
Laurini, M.P., and de Carvalho E. Andrade. 2012. “New evidence on the role of cognitive skill in economic development.” Economic Letters 123-126.
Leclercq, François. 2005. The Relationship between Educational Expenditures and Outcomes. France: Développement, Institutions et Mondialisation.
Lewis, Charla Patrice. 2004. “Doctoral Thesis.” The Relation between extra curricular activities with academic and social competencies in school-age children: A meta-analysis. Texas, August.
Lockheed, Marlaine, and Adriaan Verspoor. 1991. Improving Primary Education in Developing Countries. Oxford university press.
Lockheed, Marlaine, and Andre Komenan. 1989. “Teaching quality and student achievement in Africa: The case of Nigeria and Swaziland.” Teaching & Teacher Education, 93-113.
Lonsdale, Michele. 2003. Impact of School Libraries on Student Achievement: a Review of the Research. Camberwell Victoria: Australian Council for Educational Research.
Lucas, R. 1998. “On the mechanics of economic development.” Journal of Monetary Economics 3–42.
M, Crotty. 1998. The foundations of Social research. London: Sage Publications.
Madhavan, and Kaushik Sanyal. 2012. Regulations in the education sector. New Delhi: Routledge.
Mahoney, Joseph L., Beverley D. Cairns, and Thomas W. Farmer. 2003. “Promoting Interpersonal Competence and Educational Success Through Extracurricular Activity Participation.” Journal of Educational Psychology 409–418.
Mark foster. n.d. “http://www.markfoster.net/struc/critical-realism-jccc.pdf.” Accessed January 5, 2015. http://www.markfoster.net.
Masino, Serena, and Miguel Nin˜o-Zarazu´. 2015. “What works to improve the quality of student learning in developing countries ?” Elsevier 53-65.
Maurice, W. 2011. PISA 2009 Plus Results. Australia: ACER.
Mbiti, Isaac M. 2016. “The Need for Accountability in Education in Developing Countries.” Journal of Economic Perspectives 109-132.
Mckinsey and Company. 2007. How the world’s best performing school systems come on top. An analytical report, Mckinsey.

222
Meichen, Lu, Loyalka, Yaojiang Prashant, Fang Chang Shi, Chengfang Liu, and Scott Rozelle. 2017. The Impact of Teacher Professional Development Programs on student achievement in rural China. Standford University - Working paper.
MHRD. 2011. “http://mhrd.gov.in/sites/upload_files/mhrd/files/upload_document/delhi_rte-rules-2011_dt-25112011.pdf.” http://mhrd.gov.in. 23 November. Accessed October 26, 2017. http://mhrd.gov.in/sites/upload_files/mhrd/files/upload_document/delhi_rte-rules-2011_dt-25112011.pdf.
—. 2009. “http://mhrd.gov.in/sites/upload_files/mhrd/files/upload_document/rte.pdf.” http://mhrd.gov.in. 27 August. Accessed November 16, 2017.
—. 2012. “http://mhrd.gov.in/sites/upload_files/mhrd/files/upload_document/RTE_Section_wise_rationale_rev_0.pdf.” 01 January. Accessed May 14, 2015. http://mhrd.gov.in/.
—. 2013. “http://mhrd.gov.in/sites/upload_files/mhrd/files/upload_document/RTI1.pdf.” Accessed May 10, 2015. http://mhrd.gov.in/.
Moriarty, Jo. 2011. Qualitative Methods Overview. School for Social Care Research.
Mosteller, Frederick. 1995. “http://www.princeton.edu/futureofchildren/publications/docs/05_02_08.pdf.” http://www.princeton.edu. Accessed 2017. http://www.princeton.edu.
Mujis, Daniel. 2004. Doing Quantiative Research in Education. London, New Delhi: Sage Publications.
Mukerji, Shobhini, and Michael Walton. 2012. “http://www.michaelwalton.info/wp-content/uploads/2012/10/Mukerji-Walton-Learning-the-Right-Lessons_final_Sep-10.pdf.” 10 9. Accessed January 12, 2015. http://www.michaelwalton.info/.
Mullis, I. V. S., and Jenkins. 1988. The Science Report Card: Elements of Risk and Recovery. New Jersey Princeton: National Assessment of Educational Progress, Educational Testing Service.
Muralidharan. 2013. http://www.livemint.com/Opinion/nSU6PpzDw9Qi1Pbp11nviI/Using-evidence-for-better-policy-case-of-primary-education.html. 20 March. Accessed December 18, 2015. http://www.livemint.com/Opinion/nSU6PpzDw9Qi1Pbp11nviI/Using-evidence-for-better-policy-case-of-primary-education.html.
Muralidharan, K, and V. Sundararaman. 2010. “The Impact of Diagnostic Feedback to Teachers on student learning: Experimental Evidence from India.” The Economic Journal F187 - F203.
Muralidharan, Karthik. 2013. “https://pdel.ucsd.edu/_files/paper_2013_karthik.pdf.” https://pdel.ucsd.edu. 4 April. Accessed October 28, 2017.
—. 2013. Priorities for Primary Education Policy in India’s 12th Five-year Plan. NCAER-Brookings India Policy Forum.
—. 2013. Priorities for Primary Education Policy in India’s 12th Five-year Plan. NCAER-Brookings India Policy Forum.

223
Muralidharan, Karthik, and Sundararaman Venkatesh. 2009. “Teacher Performance Pay Experimental Evidence from India.” National Bureau of Economic Research.
Muralidharan, Karthik, Zieleniak, and Yendrick. 2013. Measuring Learning Trajectories in Developing Countries with Longitudinal Data and Item Response Theory. San Diego.
Muralidharan, Karthik, and Michael Kremer. 2009. Public and Private Schools in Rural India. Cambridge, MA: MIT Press.
Muralidharan, Kartik. 2012. “Long-Term Effects of Teacher Performance Pay: Experimental Evidence from India.” Society for Research on Educational Effectiveness.
Muralidharan, Kartik, and Venkatesh Sundraraman. 2011. “Teacher Performance Pay: Experimental Evidence from India.” Journal of Political Economy.
Murillo, Javier, and Marcela Román. 2011. “School infrastructure and resources do matter: analysis of the incidence of school resources on the performance of Latin American students.” School Effectiveness and School Improvement 29-50.
Murnane, R. J, and A.J. Ganimian. 2014. “Improving Educational Outcomes in Developing Countries: Lessons from Rigorous Evaluations.” Unpublished manuscript.
Nambissan, Geetha. 2012. “Low-Cost Private Schools for the Poor in India.” New Delhi.
—. 2015. “Poverty, Markets and Elementary Education in India.” New Delhi: Jawaharlal Nehru University.
Nannyonjo, Harriet. 2007. Education Inputs in Uganda - An Analysis of Factors Influencing Learning Achievement in Grade Six. World Bank.
Narang, Prashant. 2014. “Right to Education as another License Raj.” Chandigarh.
National Informatics Centre. n.d. http://parliamentofindia.nic.in/ls/intro/p1.htm. Accessed May 16, 2015. http://parliamentofindia.nic.in.
NCTE. 2011. “http://ncte-india.org/ncte_new/wp-content/uploads/2015/06/Minimum-Qualification-2011.pdf.” http://ncte-india.org. 29 July. Accessed November 18, 2017. http://ncte-india.org.
Neisser, Ulric, Gwyneth Boodoo, A. Wade Boykin, Stephen J Ceci, Diane F Halpern, John C. Loehlin, and Robert..Urbina, Susana Perloff. 1996. “Intelligence: Knowns and unknowns.” American Psychologist 77–101.
Nguyen, Trang. 2008. Information, Role Models and Perceived Returns to Education: Experimental Evidence from Madagascar. Massachusetts: Poverty action lab - Working paper.
Ni˜no-Zarazua, Miguel. 2011. Mexico’s Progresa-Oportunidades and the emergence of social assistance in Latin America. BWPI Working Paper 142.
NISA. 2016. http://nisaindia.org/data-school-closures-due-rte-act-may-2016. Accessed February 13, 2018. http://nisaindia.org.
NIUA. 2016. Status of Children in Urban India. New Delhi: National Institue of Urban Affairs.
NUEPA. 2009. http://www.dise.in/drc.htm. Accessed December 1, 2015. http://www.dise.in/drc.htm.

224
Nururllah, Syed, and J.P Naik. 1943. History of Education in India. Bombay: Macmillan.
OECD. 2017. Economic Surveys of India. OECD.
Ofer, Malamud, and Pop-Eleches Cristian. 2011. “Home computer use and the development of human capital.” Quarterly Journal of Economics 987–1027.
OPEPA. 2016. “http://opepa.in/pvtrte/PDF/Norms/Norms_Standards_Schools.pdf.” http://opepa.in. Accessed March 23, 2018. http://opepa.in/pvtrte/PDF/Norms/Norms_Standards_Schools.pdf.
Ormrod, J.E. 2008. “Educational Psychology Developing Learners,” Educational Psychology 155-156.
OXFAM India. 2015. Right to Education Act Claiming Education for Every Child. New Delhi: OXFAM.
Ozturk, and Ilhan. 2001. The role of education in economic development: a theoretical perspective - MPRA paper 9023. Munich, Germany.
Palmer, C. Garcı´a, and R. Paredes. 2010. “Reducing the educational gap: good results in vulnerable groups.” Journal of Development studies. 46 (3), 535–555.
Panagariya, Arvind. 2013. http://timesofindia.indiatimes.com/edit-page/What-Right-To-Education-Failing-to-meet-the-prescribed-norms-half-of-the-existing-schools-will-lose-their-recognition/articleshow/19403581.cms. Accessed May 15, 2015. http://timesofindia.indiatimes.com.
Paqueo, V., and G. Lopez-Acevedo. 2003. Supply-side school improvement and the learning achievement of the poorest children in indigenous and rural schools: the case of PARE. World Bank: Policy Research Working Paper Series.
Patel, Dr Harikrishna. 2016. “A study of effectiveness of Transportation/Escort facility on academic achievement of students.” International Journal of Indian Psychology.
Patrinos, Harry. 2016. https://blogs.worldbank.org/education/why-education-matters-economic-development. 17 May. Accessed March 11, 2018. https://blogs.worldbank.org.
Paul, Glewwe, Michael Kremer, and Sylvie Moulin. 2009. “Many Children Left Behind? Textbooks and Test Scores in Kenya.” American Economic Journal: Applied Economics 1 (1): 112-35.
Pennycuick, David. 1998. School effectiveness in developing countries - A summary of the research evidence. DFID - Educational research paper.
Popova, Anna, David Evans, and Violeta Arancibia. 2016. “Inside In-Service Teacher Training: What Works and How Do We Measure It?” 1-4.
Pratham. 2013. Status of Implementation of the RTE Act: Chhattisgarh, Madhya Pradesh and Rajasthan. India: Pratham, 7-8.
Prichett, Lant, and Yamini Aiyar. 2014. Value Subtraction in Public Sector Production: Accounting Versus Economic Cost of Primary Schooling in India. Center for Global Development, Washington, DC: Centre for Global Development.
Pring, R. 2000. Philosophy of educational research. London: Continuum.

225
Pritchett, L. 2013. The rebirth of education: Schooling ain’t learning. Washington D.C.: Center for Global Development.
PROBE. 1999. Government Report on Basic Education in India. New Delhi: Oxford University Press.
PwC. 2014. Future of India: The winning leap. Pricewaterhouse Coopers.
Ralph B. McNeal, Jr. 1995. “Extracurricular Activities and High School Dropouts.” Sociology of Education - American Sociological Association 62-80.
Ramachandran. 2001. Reflections on equity, quality and local planning in the district primary education program. New Delhi: European Commission.
Ramachandran, Vimala, and A N Reddy. 2015. Status Report on Closure of School after RTE Act 2009. Academic, National Coalition for Education.
Rangaraju, Baladevan, James Tooley, and Pauline Dixon. 2012. The Private School Revolution in Bihar. New Delhi: Bosco Society for Printing & Graphic Training.
Rau, T, and D Contreras. 2009. Tournaments, gift exchanges, and the effect of monetary incentives for teachers: the case of Chile. Universidad de Chile Working paper series.
Rau, T., and D Contreras. 2009. tournaments, gift exchanges, and the effect of monetary incentives for teachers: the case of Chile. Universidad de Chile: Working Paper Series.
Raynor, and Wesson K. 2006. “The girls’ stipend program in Bangladesh. Journal of.” 1-12.
Rea, P. J, V. L McLaughlin, and C. Walther-Thomas. 2002. “Outcomes for students with learning disabilities in inclusive and pullout programs.” Exceptional children 203-222.
Ree, De, Joppe, Karthik Muralidharan, Menno Pradhan, and Halsey Roger. 2015. Double for Nothing? Experimental Evidence on the Impact of an Unconditional Teacher Salary Increase on Student Performance in Indonesia. NBER Working Paper 21806.
Registrar General of India. 2010-2011. http://censusindia.gov.in/Census_And_You/scheduled_castes_and_sceduled_tribes.aspx. Accessed May 11, 2015. http://censusindia.gov.in/.
RESULTS Educational Fund . 2013. ). Is the World Bank Reaching Out-of-School Children? An Analysis of World Bank Commitments to Basic Education in Relation to Out-of-School Populations. Washington, D.C: RESULTS Educational Fund.
Robbins, Joan. 2010. “The Effect of Inclusion on Student Performance on State Assessments.” Thesis dissertation, 3 December.
Roberts, CK, B Freed, and WJ McCarthy. 2010. “Low aerobic fitness and obesity are associated with lower standardised test scores in children. .” Journal of Pediatrics 711-71.
Robinson, J. P. 2011. A global compact on learning: Taking action on education in developing countries. Washington D.C: Center for Universal Education at Brookings.
Romer, P M. 1994. “The origins of endogenous growth.” Journal of Economic Perspectives.

226
Rose, P. 2006. “Achieving Education for All through public-private partnerships?” Development in Practice 473–483.
Ross, Kenneth. 2005. Educational research: some basic concepts and terminology. France: UNESCO.
Rossman, Gretchen, and Bruce Wilson. 1985. “Numbers and words: Combining Quantitative and Qualitative Methods in a Single Large-Scale Evaluation Study .” Evaluation Review, 9 627–643.
Rothbard, Murray N. 1999. In Education Free & Compulsory, 10. Alabama: Ludwig von Mises Institute.
Sabarwal, Shwetlena, David K. Evans, and Anastasia Marshak. 2014. The Permanent Input Hypothesis: The Case of Textbooks and (No) Student Learning in Sierra Leone. Washington, DC: World Bank Policy Research Paper.
Sadler, P. M, G. Sonnert, H.P. Coyle, N. Cook-Smith, and J.L. Miller. 2013. “The influence of teachers’ knowledge on student learning in middle school physical science classrooms.” American Educational Research Journal 1020-1049.
Saint-Laurent, L, Dionne J, J Giasson, Royer E, and Simard, & B, Peirard C. 1998. “Academic achievement effects of an in-class service model on students with and without disabilities.” Exceptional Children 239-253.
Sairam, R. 2015. http://www.thehindu.com/news/cities/Coimbatore/schools-ponder-over-rte-act-fee-reimbursement/article7076203.ece. The Hindu. 7 April. Accessed December 21, 2015. http://www.thehindu.com/news/cities/Coimbatore/schools-ponder-over-rte-act-fee-reimbursement/article7076203.ece.
Sallis, JF, TL McKenzie, B Kolody, M Lewis, and S Marshall and P Rosengard. 1999. “Effects of health-related physical education on academic achievement: Project SPARK.” Res Q Exerc Sport.
Saxena, Deepa, and M.k Tyagi. 2014. “CCE A New Pattern of Evaluation.” International Journal of Education and Psychological Research 82-86.
Schiefelbein, Ernesto, and John Simmons. 1981. The Determinants of school achievement. Canada: International Development Research Centre.
Scotland, James. 2012. “Exploring the Philosophical Underpinnings of Research: Relating Ontology and Epistemology to the Methodology and Methods of the Scientific, Interpretive, and Critical Research Paradigms.” English Language Teaching; Vol. 5, No. 9 9 – 16.
Scroll.in. 2015. “http://scroll.in/article/733920/india-wants-private-sector-participation-in-railways-just-when-britain-debates-nationalising-theirs.” http://scroll.in/. 13 June. Accessed November 24, 2015. http://scroll.in/article/733920/india-wants-private-sector-participation-in-railways-just-when-britain-debates-nationalising-theirs.
Shah, Dr Navinchandra. 2013. “Literacy Rate in India.” International Journals of Multidisciplinary Research (RAIJMR) 1 (7): 12-16.
Shah, Parth J., and Luis Miranda. 2012. Private Initiative in India’s Education Miracle. IDFC.

227
Shah, Parth, and Shreya Agarwal. 2008. “http://cfo-connect.com/title_detail.asp?art_id=655&cat_id=6.” Accessed March 9, 2015. http://cfo-connect.com/images/article/tt-critique-may2010.pdf.
Sharp. 1920. Selections from Educational Records, Part I (1781-1839). Bureau of Education, Superintendent Government Printing, (Reprint) Delhi: National Archives of India, 1965.
Simmons, John, and Leigh Alexander. 1978. “The Determinants of School Achievement in Developing Countries: A Review of the research.” Economic Development and Cultural Change 341-357.
Singh, Abhijeet. 2013. Size and Sources of the Private School Premium in Test Scores in India. Oxford: Young Lives.
Sinha, Manoj Kumar. 2008. “Right to Education: Indian and International Practices.” Indian Journal of International Law 2 (48): 188–207.
Smallbone, and Quinton. 2004. “Increasing Business Students‘ Confidence in Questioning the Validity and Reliability of their Research.” Electronic Journal of Business - www.ejbrm.com 153-162.
Stake, Robert E. 1995. The art of case study research. Thousand Oaks, CA: Sage.
Stanfield, James. 2010. Self Help and Sustainability in Education in Developing Countries. United Kingdom: New Castle University.
Taniguchi, K, and Y. Hirakawa. 2016. “Dynamics of community participation, student achievement, and school management: The case of primary schools in a rural area of Malawi.” Compare 46(3), 479–502.
Tashakkori, Abbas, and Charles Teddlie. 1998. Mixed Methodology: Combining Qualitative and Quantitative Approaches. New Delhi London: SAGE Publishers Thousand Oaks.
Taylor, and Medina. 2013. “Educational Research Paradigms: From Positivism to Multiparadigmatic.” The Journal of Meaning-Centered Education 1.
Taylor, Gatto John. 2009. Weapons of Mass Instruction: A school teachers |Journey through the dark world of compulsory schooling. Gabriola Islands: New Society Publishers.
Tendulkar, Sengupta, and Radhakrishna. 2009. Report of the Expert Group to Review the Methodology for Estimation of Poverty. New Delhi: Government of India.
The Guardian. 2014. “https://www.theguardian.com/global-development/2014/aug/11/india-midday-meal-scheme-schoolchildren.” https://www.theguardian.com. 11 August. https://www.theguardian.com.
Times of India. 2017. “https://timesofindia.indiatimes.com/home/education/news/high-stakes-tests-private-tuition-harmful-to-students-unesco/articleshow/61309846.cms.” https://timesofindia.indiatimes.com. 28 October. Accessed February 12, 2018. https://timesofindia.indiatimes.com/home/education/news/high-stakes-tests-private-tuition-harmful-to-students-unesco/articleshow/61309846.cms.
Todd, Petra E., and Kenneth I. Wolpin. 2003. “On the specification and estimation of the production function for cognitive achievement.” The Economic Journal F3 – F33.

228
Tooley, James. 1998. Education without the state. Second. London: Institute of Economic Affairs.
Tooley, James. 2014. RTE and Budget Private Schools. New Delhi: Centre for Civil Society.
—. 2009. The beautiful tree. Washington, DC: Cato Institute.
Tooley, James, and David Longfield. 2014. The Role and Impact of Private Schools in Developing Countries: A Response to DFID’s “Rigorous Literature Review”. Newcastle Upon Tyne: Pearson.
Tooley, James, and Pauline Dixon. 2005. Private schools for the poor. New Delhi: Centre for Civil Society.
Trudeau, François, and Roy J Shephard. 2008. “Physical education, school physical activity, school sports and academic performance.” International Journal of Behavioral Nutrition and Physical Activity.
UNESCO. 2015. Education for All Global Monitoring Report. UNESCO.
UNESCO. 2007. EFA Global Monitoring Report 2008 Education for All by 2015 Will We Make it? Paris: United Nations Education, Science and Cultural Organization.
—. n.d. https://en.unesco.org. Accessed October 21, 2017. https://en.unesco.org/gem-report/statistics.
University College London. 2008. “http://www.homepages.ucl.ac.uk/~uctpsc0/Teaching/GR03/Endogeneity.pdf.” http://www.homepages.ucl.ac.uk. Accessed November 30, 2017. http://www.homepages.ucl.ac.uk/~uctpsc0/Teaching/GR03/Endogeneity.pdf.
Vegas, Emiliana, and Joost De Laat. 2003. Do differences in teacher contracts affect student performance? Evidence from Togo. World Bank Working Paper.
Vermeersch, C, and M Kremer. 2005. School meals, educational achievement and school competition: evidence from a randomised evaluation. World Bank - Working paper - ISSN 1813-9450.
Vincent, Steve, O'Mahoney, and Joseph. 2014. Critical realism as an empirical project: a beginner's guide. Oxford: Oxford University Press.
Walker, K. E, and J. A. Ovington. 1998. “www.ed.wright.edu~prenickJournalArchivesWinter_1999inclusion.html.” www.ed.wright.edu. 28 November. Accessed February 10, 2018.
Warwick, D, N McGinn, and Fernando Reimers. 1989. Policy Choices to Improve School Effectiveness in Pakistan. Canada Montreal: World Congress of comparative education - Paper.
Watkins, K. 2000. The Oxfam Education Report. Oxford, Oxford: Oxfam in Great Britain, 229-30.
Wharton University. 2013. http://knowledge.wharton.upenn.edu/article/needs-improvement-despite-progress-indias-primary-education-system-has-a-ways-to-go/. Accessed December 22, 2015. http://knowledge.wharton.upenn.edu.

229
Wikipedia. Nd. Rajya Sabha. Accessed May 16, 2015. http://en.wikipedia.org/w/index.php?title=Special:CiteThisPage&page=Rajya_Sabha&id=662609354.
Wikipedia. 2015. Gopal Krishna Gokhale. Accessed May 16, 2015. http://en.wikipedia.org/.
Wikipedia. 2015. Jyotirao Phule. Accessed May 16, 2015. http://en.wikipedia.org/w/index.php?title=Jyotirao_Phule&oldid=661827718.
Winter, G. 2000. A Comparative Discussion of the Notion of 'Validity' in Qualitative and Quantitative Research. Qualitative Report, http://nsuworks.nova.edu/tqr/vol4/iss3/4.
Wolf, Richard. 1993. Judging educational research based on experiments and surveys. UNESCO.
World Bank. 2015. Mind, Society and Behaviour. Washington DC: World Bank.
World Bank. 2017. http://datatopics.worldbank.org/education/wDashboard/dqexpenditures. Accessed March 9 March 2018.
—. 2012. http://siteresources.worldbank.org. October. Accessed October 28, 2017. http://siteresources.worldbank.org/INTHDOFFICE/Resources/E2P_Pakistan.pdf.
—. 2013. “From Evidence to Policy.” Using Low-Cost Private Schools to Fill the Education Gap, September: 1-4.
World Bank. 2018. World Development Report 2018: Learning to Realize Education’s Promise. Washinton DC: World Bank - doi:10.1596/978-1-4648-1096-1. License: Creative Commons Attribution CC BY 3.0 IGO.
World Bank. 2018. “World Development Report 2018: Learning to Realize Education’s Promise.” Overview booklet.” Washington, DC.
Xu, Z. 2002. “An Overview of Private Education Development in Modern China.” Education Policy Analysis Archives 10: 1-25.
Xu, Zeyu. 2002. “An Overview of Private Education Development.” Education Policy Analysis 15.
Yin, KR. 1998. Yin, K. R. (1998) The Abridged Version of Case Study Research: Design and Method, in Bickman, L., and Rog, D. J. (eds) Handbook of Applied Social Research Methods. Thousand Oaks. California: Sage.
Yin, Robert. 2009. Case study research Design and Methods. London, Delhi, Los Angeles, Singapore and Washinton: SAGE.
Yu, Guoxing. 2007. School Effectiveness and Education Quality in Southern and East Africa. EdQual RPC DFID.
Zuzovsky, Ruth. 2003. Teachers’ qualifications and their impact on student achievement: Findings from TIMSS 2003 data for Israel. Tel Aviv University, Tel Aviv, Israel: Center for Science and Technology Education.

230
Appendix
Appendix 1 – Playground notification for schools

231
Appendix 2 - Specimen of Memorandum of Association (Moa) for educational societies
MEMORANDUM OF ASSOCIATION
1. Name of the Society: The name of the society shall be ‘ABC.’ 2. The registered office of the society shall be situated in the National Capital Territory of
Delhi, at present, it is at
3. AIMS & OBJECTIVES
i. To open and run, educational and vocational schools or institutions to bring education within reach of poor & backward children, in the National Capital Territory of Delhi.
ii. To provide libraries, publish books on educational, cultural & social subjects, organise discussions & seminars to impart knowledge & understanding amongst the people.
iii. To provide hostels & residential accommodation that may be considered necessary for the students & for each member of the staff that may be made eligible for it.
iv. To establish & maintain institutions for the handicapped & for adult education, like vocational training in vocations of household industry, semi-skilled jobs for self-employment, shorthand & type-writing, social science, languages, fine arts, crafts, music, painting, modelling, physical training etc.
v. To provide the best education available in some of the best schools in Delhi. Emphasis would be on character building, self-discipline & the development of the creative & social faculties. The society aims at producing well informed & well assured young children just the kind of children that our country needs.
vi. To strive to meet changing need of providing comprehensive education to develop various facets of personality and to impart education to children on the most modern lines & provide an environment congenial to growth & development of the children.
vii. To arrange and organize the social, cultural and educational programmes from time to time
viii. All the income, earning, movable & immovable properties of the society shall be solely utilized & applied towards the promotion of its aim & objects only as set forth in the memorandum of association & no portion thereof shall be paid or transferred directly or indirectly by way of dividends, bonus, profits or in any manner whatsoever to the present or past members of the society or to any person claiming through any one or more of the present or the past members. No member of the society shall have any personal claim on any moveable property of the society or make any profit, whatsoever, by his/her membership.

232
Appendix 3 – School registration requirements
FORM-1(A)
SELF-DECLARATION FORM FOR RECOGNIZED SCHOOL
To,
The Director of Education, Directorate of Education, Government of NCT of Delhi.
Sir,
I forward herewith a self-declaration form regarding compliance with the norms and standards prescribed under the Right of Children to Free and Compulsory Education Act, 2009 for recognition to ………………………............................................................
(Name of school)…………………………………………………………………………..
………………………………………………………………………………….... (Address) With effect from the commencement of the Academic year 20……-20……..
Note: - Before filling-up the self-declaration form, the management may refer to the Right of Children for Free and Compulsory Education Act, 2009, thoroughly.
A. SCHOOL DETAILS 1. Name of school with school I.D. NO.
2 Aided/ Unaided
3 District & Zone
4 Postal address 5 Pin Code
6 Phone No. with STD Code
7 Fax No. 8 E-mail address, if any
B. GENERAL INFORMATION 1. Date of First Opening of School.
(DD/MM/YYYY)
2 Name of Trust/Society running the School.
3 Whether Proof of non-proprietary character of the Trust/Society is attached?
4 Whether list of members of Managing Committee with their addresses qualification & occupation is attached?
Yes/No (Please Tick)

233
B. GENERAL INFORMATION 5 Whether SOM approved? Yes/No (Please Tick)
6 Details of Manager of the school:- (a) Name :-
(b) Address:- (c) Academic Qualification (proof to be attached)
(d) Teaching Experience (in years, along with experience certificate countersigned by EO/DEO)
(e) Administrative Experience (in years)
(f) Phone (s) (OFFICE) (RES.) ( MOBILE)
7 Statement of Income and Expenditure (last three years) as per Balance Sheet
Year Income Expenditure Surplus/Deficit
D. Land & Building details (Area in Sq. Mtrs).1. Total Number of Rooms. 2. Number of Classrooms. 3. Head-Teacher/Principal Room 4. Staff Room. 5. Office Room. 6. Store Room.
C. NATURE & AREA OF SCHOOL 1 Medium of Institution 2 Type of School (specify entry & exit
classes).
3 If Aided, the name of Govt./Agency/Deptt., from which Aid is being received and percentage of
4 Whether the school is being run by society at its land & building or on rent/lease basis?
Owned or Rent/Lease (Please Tick)
5 Whether the school building or other structures or the playground are used only for education and skill development?
Yes/No (Please Tick)

234
7. Laboratory, if any, 8. Whether School has a boundary wall? If not, whether the school has proper
Yes/No (Please Tick) Yes/No (Please Tick)
9.Total Area of School Land including Building & Play Ground
10. Area of constructed School Building11. Total covered area of the School Building (including all floors).
12. Area of Play Ground.
E. Other Facilities:- Whether all facilities have barrier-free access?
Yes/No (Please Tick)
Library :
Number of Books in Library
Number of newspapers (daily subscription)
Number of magazines (Monthly subscription).
Whether the list of Sports & Play equipment attached or not?
Yes/No (Please Tick)
(i) Number of Toilets for Boys. (ii) Number of Toilets for Girls (iii)Number of Toilets for CWSN(Person with disabilities)
Whether safe and adequate drinking water facilities is available to all Children and Staff?
Yes/No (Please Tick)
Whether Teaching Learning Material is available
Yes/No (Please Tick)
Whether Kitchen is available? Yes/No (Please Tick)Whether the list of Sports & Play equipment attached or not?
Yes/No (Please Tick)
Total Number of Subject Teacher F. Teacher and Student Ratio: ------------------------------------------- Total Number of Students (a) Class I to V Ratio :
(b) Class VI to VIII Ratio : Note:- The Teacher do not include Lab Assistant, Coaches & Clerical Account Staff etc.

235
G. Details of Teachers:- Number (a) Principal/ Headmaster (b) TGT (s) (i) English (ii) Hindi (iii) Sanskrit or any other Language (as per three Language formula) (iv) Natural Science (v) Social Science (vi) Mathematics (c) Assistant. Teachers (d) PET (e) Work Education Teacher (f) Art Education Teacher.
H. Class wise Enrolment of Students:- Class Number of Sections Number of
Students Enrolled
Number of Students under EWS and Disadvantaged Group Quota
Pre-Primary
I II III IV V Total
I. Working days/Instructional hours in an academic year
1 (a) Class I to V Number of working
Number of Instructional
(b) Class VI to VIII Number of working
Number of Instructional
2 Number of working hours for the
Primary Teachers TGTs/PGTs.
It is to undertake that the school is open for inspection by any officer authorized by the appropriate authority.

236
Certified that the school undertakes to furnish such reports and information as may be required by the Director of Education from time to time and complies with such instructions of the appropriate authority or the D.D.E or Education Officer as may be issued to secure the continued fulfilment of the condition of recognition or the removal of deficiencies in working of the school.
Certified that records of the school pertinent to the implementation of this Act shall be open to inspection by any officer authorized by the Directorate of Education or appropriate authority at any time, and the school shall furnish all such information as may be necessary to enable the Central and/or State Government/Local Body or the Administration to discharge its or his obligations to Parliament/ Legislative Assembly of the State/Panchayat/ Municipal Corporation, as the case may be.
Total No. of Enclosures:
Place: Dated :
Signature with Stamp of the Manager

237
Appendix 4 – Closure notification

238

239
Appendix 5 – Student Questionnaire with academic indicators
Sl. No Questions and filters Coding Category Codes
A. Date of Survey
DD MM YR
B. School Code
C. Gender Boy
Girl
1
2
D. Grade/Class
Sl. No. Questions and filters Coding category Codes and Skips
Codes Skip
101. Which language do you speak at home?
Hindi Gujarati
Marawadi Bihari
Haryanvi Punjabi Awadhi
Kashmiri Garhwali
Other ____________________
__
1 2 3 4 5 6 7 8 9 10
102. Which of the following items do you have in your household? (Multiple responses)
TV DVD player
Smartphone/Mobile Computer/Laptop
Gas stove Refrigerator
Air cooler Livestock
(cow/goats/Buffalo) Scooter/motorcycle
Car Property
Any other asset
1 2 3 4 5 6 7 8 9
10 11 12
103. Which of these is used in your house to cook Food?
Firewood Cooking gas
Kerosene Stove
1 2 3
104. Do you go to tuitions? Yes No
1 2

240
Sl. No. Questions and filters Coding category Codes and Skips
105. For which subjects do you go to tuitions?
Language Maths
Evs All of the above
1 2 3 4
106. What do you do in school most of the time?
Working Playing
Studying Sleeping
1 2 3 4
107. . How many times do you receive homework at school?
Everyday One day in a week
Two or three times a week
No homework is given
1 2 3 4 5
Skip to 112
108. . Are you told to learn by heart for the homework given to you?
Yes No
1 2
109. . For homework, does your teacher tell you to write a question and answers by yourself?
Yes No
1 2
110. . I am made to read full lessons as given in the textbook, for my homework
Yes No
1 2
111. . I am made to do a lot of mathematical sums, as a part of my homework
Yes No
1 2
112. . You come to school because Parents send me forcibly Enjoy coming to school
Find a job when you grow up
1 2 3
113. . I have textbooks for the following subjects
Language Maths
EVS All of the above
1 2 3 4
114. . In school time, I do the following? Work Play
Study Sleep
1 2 3 4
115. . There are enough teaching-learning materials for all of us for supporting our study (charts, books, audio video)
Yes
No
1
2
Thank you for your co-operation

241
Appendix 6 – Student questionnaire with demographic indicators
Sl. No Questions and filters Codes
A. Date of Survey
DD MM YR
B. Name of the school (Code)
C. Your Age in
Years Months
D. How many members are there in your family? (write the number in the adjacent cell including yourself) Men – 18 years and above Women – 18 Years and above
Men
Boys
Girl
Women
Sl. No. Questions and filters Coding category Codes and Skips
Codes Skip
101. Which language do you speak at home? Hindi
Gujarati
Marawadi
Bihari
Haryanvi
Punjabi
Awadhi
Kashmiri
Garhwali
Other
_______________
1
2
3
4
5
6
7
8
9
10
102. Can any older member of your family write and/or speak English fluently?
Yes
No
1
2
103. Are there any older brothers or sisters that can read English in your family?
Yes
No
1
2

242
Sl. No. Questions and filters Coding category Codes and Skips
104. How many brothers and sisters do you have in your family (not including you)?
105. Which position in the children do you come in your family?
Eldest
Youngest
In between, not the eldest or youngest.
1
2
3
106. . How many members are there in your family?
107. . How many earning members are there in your . family?
108. . Do you own or rent a house? Own
Rent
1
2
109. Does your family own any of the following items? Please circle all that your family has:
(Multiple responses)
Electricity
TV
DVD player
Smartphone/Mobile
Computer/Laptop
Gas stove
Refrigerator
Air cooler
Livestock (Cow/Goats/Buffalo
)
Bicycle
Scooter/motorcycle any two wheeler)
Car or jeep (any four wheeler)
Shop or housing plot
1
2
3
4
5
6
7
8
9
10
11
12
13

243
Sl. No. Questions and filters Coding category Codes and Skips
110. What type of building is your home?
Building or concrete building
Semi-permanent building
Wooden and tin sheet building
Mud building
Other (specify)
_____________
1
2
3
4
5
111. Does your household have a toilet? Yes
No
1
2
112. Does your house have a separate kitchen for your family to use?
Yes
No
1
2
Questions about the guardian
Sl. No. Questions and filters Coding Category Codes and Skips
201. Does your father/(male guardian) have a monthly/weekly income?
Yes
No
1
2
202. Does your mother /(female guardian) have a monthly/weekly income?
Yes
No
1
2
203. What was the highest level of education your father (male guardian) completed? (only tick one)
(single response)
Illiterate
Primary pass
Secondary pass
Below graduate
Graduate
Post Graduate
PhD
Other
_____________
1
2
3
4
5
6
7
8
1
2
3
4
5
6
7
8
204. What was the highest level of education your mother (female guardian) completed? (only tick one)
Illiterate
Primary pass
Secondary pass
Below graduate
1
2
3
4
1
2
3
4

244
Sl. No. Questions and filters Coding Category Codes and Skips
Graduate
Post Graduate
PhD
Other
5
6
7
8
5
6
7
8
205. Sl. No. Questions and filters Codes and Skips
Coding category Father Coding category Mother
What do your parents (father/mother/guardians) do as a job?
(single response)
Unemployed
Daily wage labourer
Petty trader
Carpenter
Fitter/mechanic/plumber
Driver
Government job
Other
1
2
3
4
5
6
7
8
Housewife
Housemaid
Daily wage labourer
Laundry
Trader
Police
Government job
Other
1
2
3
4
5
6
7
8

245
Appendix 7 – Principal questionnaire
Sl. No Questions and filters
Coding category Codes
A. Date of Survey
DD MM YR
B. State (Name & Code)
C. District (Name & Code)
D. Type of school (Area) Encircle and enter the code in the box
1. Urban 2. Rural
E. Name of the school (Code)
F. Education level Enter code in box
1. Primary
2. Upper primary
3. High Schl/Sen.Secondary
4. Primary+Upper primary+Higher Secondary
5. Other_____________________________
G. Standards in School From Std to Std
H. School Managed by Enter code in the box
State Govt. 1
Central Govt. 2
Private Aided 3
Low-Cost Private Unaided 4
Local body/Panchayat/Municipal Corporation 5
Social Welfare Dept. 6
Others _____________________ 7
I. What is the type of school?
Boys
Girls
Co-education
1
2
3
J. The strength of school Children (Children Enrolled)
Boys
Girls
Total
K. Name and contact number of Head Master/ Principal
Name of Head Master/ Principal:……………………………………

246
Phone:………………………Mobile:……………………………………..
Postal Address Name of school:……………………………………
Name of P.O:…………………………………….
Taluk/Block:……………………………………
District:…………………………PIN Code: …………………..
Awareness’ and Information about the RTE Act
Sl. No. Questions and filters Coding category Codes and Skips
Codes Skip
113. Have you heard/ (or aware) about the RTE Act 2009?
Yes
No
1
2
201
114. Is there an RTE copy available with the school? Yes
No
1
2
115. Have any of the members of the school attended any orientation programme about the RTE Act?
Yes
No
1
2
116. How many members of the staff have attended the orientation programme of the RTE Act?
Sl. No. Questions and filters Coding category
Codes and Skips
Codes Skip
201. Does your school follow the norm of free and compulsory education for students between 6-14 years of age?
Yes
No
1
2
202. How many children in the school are between the age group of 6-14?
203. Do you charge fees from the students between six to fourteen years of age?
Yes
No
1
2
205
204. What is the monthly tuition fee charged from the students?
205. Does the school follow a reservation policy while admitting students?
Yes
No
1
2
206. Were children from the SC/ST category admitted in the schools?
Yes
No
1
2 208

247
Sl. No. Questions and filters Coding category
Codes and Skips
Can’t say/Not aware
3
207. Can you recall how many children were admitted in this category?
SC
ST
208. Do you allow school transfer to children, on their request?
Yes
No
No transfer policy
Cannot issue T.C (transfer
certificate)
Other
1
2
3
4
7
209. Do you provide admission to children who do not possess a transfer certificate?
Yes
No
Transfer certificate is
mandatory
Other
1
2
3
7
210. Does the school detain or expel any student in the last year?
Yes
No
Cannot share information
1
2
3
212
211. How many children have been expelled from the school since 2010? (Give approx. number)
Primary
Upper primary
Secondary

248
Sl. No. Questions and filters Coding category
Codes and Skips
212. Are there any children in your school with a disability?
Yes
No
1
2301
213. Can you share the approx? Number of children with disability in your school?
Primary
Upper primary
Secondary
Information about school staff
Sl. No. Questions and filters Coding Category Codes and skips
Codes Skip
301. How many teachers are there in the school? Primary
Upper primary
Secondary
Higher secondary
302. What are the minimum qualifications for teachers in the schools? (Please provide the number in the adjacent column) – Multiple responses possible
Below Graduate 1
Graduate
(B.A, B.Com, B.Ed)
2
Post Graduate
(M.A, M.Com, M.Ed)
3
PhD 4
303. Have your teachers received any training? Yes
No
1
2
304. Do you know what government norms are there for teacher pay?
Yes
No
1
2

249
Sl. No. Questions and filters Coding Category Codes and skips
305. What is the range of salaries for teachers in your school and how many teachers are there
in each of the category? (Monthly figure) (Single option only)
1000-2999 1
3000-5999 2
6000-9999 3
10000-14999 4
15000-19999 5
20000-24999 6
25000-29999 7
30000-39999 8
40000 & above 9
306. Does the school conduct PTA (parent-teacher association) meetings?
Yes
No
1
2
401
307. Can you tell me the two dates when the last PTA meeting was held?
Date 1
Date 2
Information about school infrastructure
Sl. No. Questions and filters Coding category Codes and Skips
Codes Skip
01. Does the school have a ‘pucca building’? Yes
No
1
2
02. Does the school have a drinking water facility?
Yes
No
1
2
03. Does the school have an electricity connection in functional condition?
Yes
No
1
2
04. Does the school serve mid-day meals to the children?
Yes
No
1
2
05. Is there a separate room for cooking and storing the mid-day meals?
For cooking
For storage
For both
None
1
2
3
4

250
406. Does the school have the following provision in terms of infrastructure complying with the laws of the Right to Education Act?
Sl. No. Coding category Codes
Yes No
1. Separate classroom for every teacher 1 2
2. Store cum office room 1 2
3. Barrier-free access 1 2
4. Boundary wall 1 2
5. Teaching-learning materials 1 2
6. Safe drinking water facility 1 2
7. Separate toilet for boys and girls 1 2
8. Library in the school 1 2
If yes then mention the number of books in the library
9. Computer lab in the school 1 2
If yes then mention the number of computer in the lab
Functional Learning resources
Sl. No. Questions and filters Coding category Codes and Skips
Codes Skip
501. Are the students of your school allowed to choose the books they want to read from the library books?
Yes
No
1
2
502. Are the computers in the computer lab functional?
Yes
No
1
2
503. Are there audio-video resources (TV/Radio) available in the school?
Yes
No
1
2
504. Are the audio/video resources functional? Yes
No
1
2
505. Are there enough toys and games available for children to supplement their study?
Yes
No
1
2
506. Are there charts and maps available in the school?
Yes
No
1
2
507. Is there a blackboard Yes
No
1
2

251
Governance of the school
Sl. No. Questions and filters Coding category Codes
601. Is there an SMC (school management committee) in the school?
Yes
No
1
2
601
602. How many members represent the SMC?
Males
Female
603. What are the functions of the SMC?
Monitor Grant utilisation
Ensure the enrolment of children from neighbourhood
areas
Report deviation in child rights including mental and
physical harassment of children, denial of admission,
and timely provision of free entitlement
Monitor mid-day meal programme
Monitor the receipts and expenditure of the school
Monitor the identify, enrolment of children with
disabilities, and ensure their participation in education
Other
1
2
3
4
5
6
7
604. Does the SMC help in monitoring the curricular and co-curricular activities?
Yes
No
1
2
605. Who provides the structure for the SMC?
State Government
Local government
Headmaster
Others
1
2
3
07

252
Information on curriculum and elementary education
Only for low-cost private schools
Sl. No. Questions and filters Coding category Private School
Codes Skip
701 Is the prescribed syllabus in each class is helpful for the all-around development of the child?
Quite helpful
Useful to some extent
Not useful at all
Can’t say/Not aware
1
2
3
4
702 Is the prescribed curriculum for the grades helpful to build the knowledge and talent of children?
Yes
No
Can’t say/Not aware
1
2
3
703 Does the curriculum give importance to learning through activities?
Yes
No
Can’t say/Not aware
1
2
3
704 Are any of the children in a particular grade detained or not allowed to go to the next higher class?
Yes
No
Can’t say/Not aware
1
2
3
705 Does your school undertake CCE (continuous, comprehensive evaluation)
Yes
No
Can’t say/Not aware
1
2
3
Sl. No.
Questions and filters Coding category Codes and Skips
Codes Skip
801 Do you know any of the schools that have been closed owing to RTE?
Yes
No
1
2
Say thank you and terminate the interview
802 If yes can you tell us how many have been closed due to the RTE?

253
Can you name share the names as well as the contact details of schools that have been closed in the last six to seven months?
S.No. Name of the School Address of the school
Contact Details Phone/Email
1.
2.
3.
4.
5.
Thank you for your co-operation

254
Appendix 8 – Teacher questionnaire
Sl. No
Questions and filters Coding Category Codes
A. Date of Survey
DD MM YR
B. State (Name & Code)
C. District (Name & Code)
D. Type of school (Area) Encircle and enter the code in the box
1. Urban 2. Rural
E. Name of the school (Code)
F. Education level Enter code in box
1. Primary
2. Upper primary
3. High Schl/Sen.Secondary
4. Primary+Upper primary+Higher Secondary
5. Other_____________________________
G. Standards in School From Std to Std
H. School Managed by Enter code in the box
State Govt. 1
Central Govt. 2
Private Aided 3
Low-Cost Private Unaided 4
Local body/Panchayat/Municipal Corporation 5
Social Welfare Dept. 6
Others _____________________ 7
I. What is the type of school?
Boys
Girls
Co-education
1
2
3
J. Strength of school Children (Children Enrolled)
Boys
Girls
Total
K. Name of the Teacher Name of Teacher interviewed:……………………………………
Phone:………………………Mobile:……………………………………..

255
Teacher Information
Sl. No.
Questions and filters Coding category Teacher 1
Teacher 2
Teacher 3
101. Gender of the teacher Male
Female
1
2
1
2
1
2
102. Status of the teacher Permanent teacher
Temporary teacher
Teacher on contract
Trainee teacher
1
2
3
4
1
2
3
4
1
2
3
4
103. What is the range of your salary per month?
0-499
500-999
1000-1499
1500-1999
2000-2499
3000-3999
4000-5999
6000-9999
10000-14999
15000-19999
20000-24999
25000-29999
30000 and above
1
2
3
4
5
6
7
8
10
11
12
13
14
1
2
3
4
5
6
7
8
10
11
12
13
14
1
2
3
4
5
6
7
8
10
11
12
13
14
104. What is your educational qualification?
Below Graduate
Graduate
(B.A, B.Com, B.Ed)
Post Graduate
(M.A, M.Com, M. Ed)
PhD
1
2
3
4
1
2
3
4
1
2
3
4
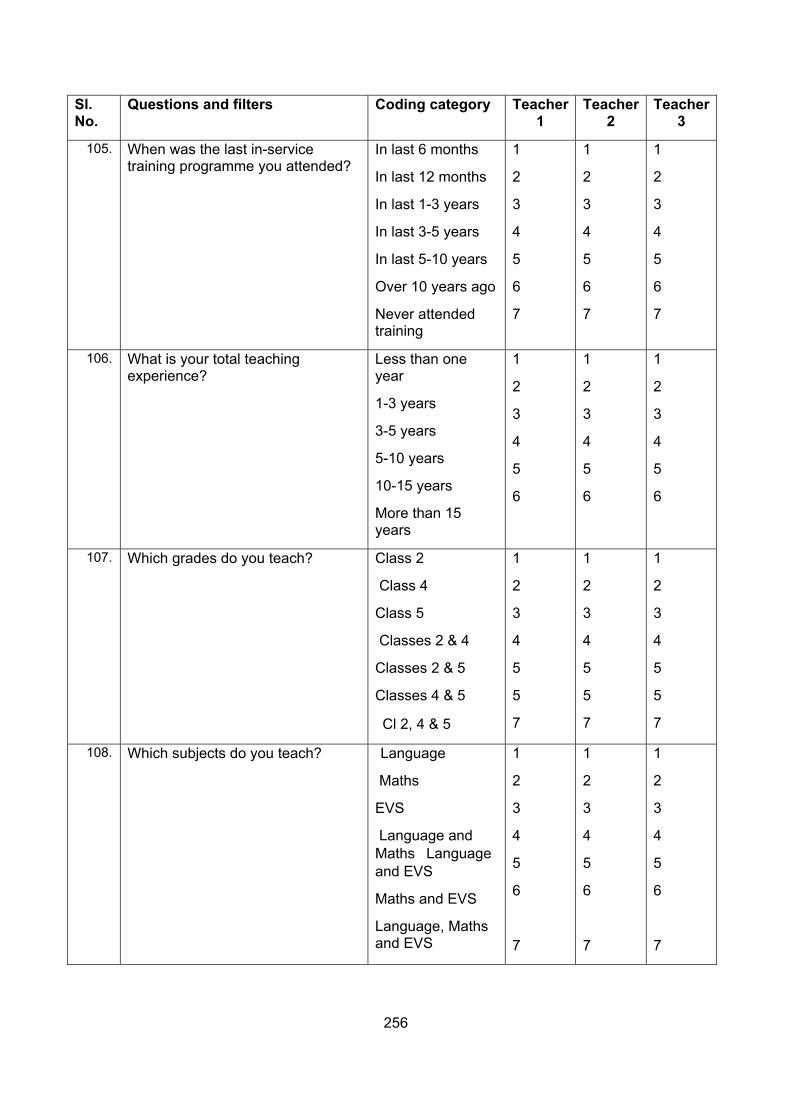
256
Sl. No.
Questions and filters Coding category Teacher 1
Teacher 2
Teacher 3
105. When was the last in-service training programme you attended?
In last 6 months
In last 12 months
In last 1-3 years
In last 3-5 years
In last 5-10 years
Over 10 years ago
Never attended training
1
2
3
4
5
6
7
1
2
3
4
5
6
7
1
2
3
4
5
6
7
106. What is your total teaching experience?
Less than one year
1-3 years
3-5 years
5-10 years
10-15 years
More than 15 years
1
2
3
4
5
6
1
2
3
4
5
6
1
2
3
4
5
6
107. Which grades do you teach? Class 2
Class 4
Class 5
Classes 2 & 4
Classes 2 & 5
Classes 4 & 5
Cl 2, 4 & 5
1
2
3
4
5
5
7
1
2
3
4
5
5
7
1
2
3
4
5
5
7
108. Which subjects do you teach? Language
Maths
EVS
Language and Maths Language and EVS
Maths and EVS
Language, Maths and EVS
1
2
3
4
5
6
7
1
2
3
4
5
6
7
1
2
3
4
5
6
7

257
Homework related information
Sl. No.
Questions and filters Coding category T 1 T2 T3
201. How often do you give homework to your students?
Almost everyday
More than thrice in a week
Thrice in a week
Less than thrice in a week
Never – I don’t assign homework
1
2
3
4
5
1
2
3
4
5
1
2
3
4
5
202. For homework, do you ask students to learn questions by heart?
Yes
No
1
2
1
2
1
2
203. For homework, do you ask students to write answers to questions from the textbook?
Yes
No
1
2
1
2
1
2
204. For homework, do you ask students to do mathematics sums?
Yes
No
1
2
1
2
1
2
205. For homework, do you give students handwriting practice?
Yes
No
1
2
1
2
1
2
206. For homework, do you ask students to learn meanings of difficult words?
Yes
No
1
2
1
2
1
2
207. Do you prepare and give additional worksheets to your students?
Often
Sometimes
Never
1
2
3
1
2
3
1
2
3
Information related to classroom transaction
Sl. No. Questions and filters Coding category
Teacher 1
Teacher 2
Teacher 3
In the classroom, do your students read aloud and you explain?
Yes
No
1
2
1
2
1
2
In the classroom, do you read and explain
Yes
No
1
2
1
2
1
2

258
Thank you for your co-operation
In the classroom, do you ask questions to students related to the study topic during class?
Yes
No
1
2
1
2
1
2
Do you explain mathematics sums to students?
Yes
No
1
2
1
2
1
2
In your opinion is strict discipline necessary for teacher’s control on students?
Yes
No
1
2
1
2
1
2
Do you think that teacher loses respect if she/he plays and cracks jokes with the students?
Yes
No
1
2
1
2
1
2
As a teacher, I believe there can be no discipline without fear of the teacher in students
Yes
No
1
2
1
2
1
2
As a teacher that students should be punished if they don’t pay attention
Yes
No
1
2
1
2
1
2
It is ok to punish students who are are not disciplined
Yes
No
1
2
1
2
1
2
Do you think all children are capable of learning
Yes
No
1
2
1
2
1
2
Do you think the learning abilities of girls and boys are the same
Yes
No
1
2
1
2
1
2
Girls are better at language and boys are better at mathematics
Yes
No
1
2
1
2
1
2

259
Appendix 9 – Principal in-depth interview questionnaire
SCHOOL ID PARTICULARS
Sl. No Questions and filters
Coding Category Codes
A. Date of Survey
DD MM YR
B. State (Name & Code)
C. District (Name & Code)
D. Type of school (Area) Encircle and enter the code in the box
1. Urban 2. Rural
E. Name of the school (Code)
F. Block/Taluka (Name)
G. Village/Town/City (Name)
H. Education level Enter code in box
1. Primary 2. Upper primary 3. High Schl/Sen.Secondary 4. Primary+Upper primary+Higher
Secondary 5. Other_________________________
__
I. Standards in School From Std to Std
J. School Managed by Enter code in box
State Govt. 1
Central Govt. 2
Private Aided 3
Private Unaided 4
Local body/Panchayat/Municipal Corporation
5
Social Welfare Dept. 6
Others _____________________ 7
K. Strength of school Children (Children Enrolled)
Boys
Girls
Total

260
L. Name and contact number of Head Master/ Principal
Name of Head Master/ Principal:………………………………………………
Phone:………………………Mobile:……………………………………..
Postal Address Name of school:……………………………………
Name of P.O:…………………………………….
Taluk/Block:……………………………………
District:…………………………PIN Code: …………………..
Personal Interview
1. Are you aware about the RTE Act 2009? ____________________________________________________________________________________________________________________________________________________________________________________________________________________________________________________________________________________________________
2. Do you know if the provisions of the RTE are applicable to your school/project? (Y/N/Not sure)
____________________________________________________________________________________________________________________________________________________________________________________________________________________________________________________________________________________________________
3. Have you applied or received Government recognition? If not, are you aware of the procedures to get Government recognition? Have you submitted the required forms to the District Education Officer? (Each state has outlined the procedures and requirements that you need to fulfill to get Government recognition)?
____________________________________________________________________________________________________________________________________________________________________________________________________________________________________________________________________________________________________
4. Can you let us know what hurdles do you face when you apply for recognition? What happens when you are not able to obtain the recognition from the local authorities?
____________________________________________________________________________________________________________________________________________________________________________________________________________________________________________________________________________________________________
5. How many times have you received notices for non-compliance with the RTE norms and regulations?
_____________________________________________________________________________________________________________________________________________________________________________________________________________________________________________________________________________________________________________________________________________________________________________

261
6. Do all students in your school get free education? (Y/N). If there is a fee for students, how many students pay the fee? How much is the fee?
____________________________________________________________________________________________________________________________________________________________________________________________________________________________________________________________________________________________________
7. How many of your students belong to SC/ST and OBC categories? Do you have students from Below Poverty Level (BPL) families?
Number of Students from BPL families
Category SC ST OBC
Primary (Classes 1-5)
Upper Primary (Classes 6-8)
8. What is the curriculum does your school follow? Do you follow CBSE/ICSE/State syllabi? If not, are you confident that the school curriculum meets the prescribed RTE norms?
____________________________________________________________________________________________________________________________________________________________________________________________________________________________________________________________________________________________________
9. Does your school provide free textbooks, writing materials and uniforms to all students? Can you share the details?
____________________________________________________________________________________________________________________________________________________________________________________________________________________________________________________________________________________________________
10. Does the school offer scholarships or financial incentives to the enrolled students? ___________________________________________________________________________________________________________________________________________________________________________________________________________________________
11. Did your teachers receive any kind of training in the recent past? If yes, what training did they receive and who trained these teachers?
_____________________________________________________________________________________________________________________________________________________________________________________________________________________________________________________________________________________________________________________________________________________________________________

262
12. How many working days does your school have every year for Primary Classes? What is that number for Upper Primary Classes? What are the school hours on a daily basis?
Category Working days Working hours
Primary (Classes 1-5)
Upper Primary (Classes 6-8)
13. Does your school meet the requirements as stated in the RTE schedule of the Act? Please consider the below aspects of the RTE and confirm if they comply with the below standards?
S.No. Item Norms & Standards Put a (✔) wherever necessary
1. No. of Teachers Number of teachers/Days/Hours
For classes 1 to 5 Upto 60 students 2 Between 61 to 90 3 Between 91 to 120 4 Between 121 to 200 5
For classes 6 to 8 At least one teacher per class so that there shall be at least one teacher each for (Science & Mathematics, social studies and Language) At least one teacher for every thirty-five children
If the school has more than 100 children
A full-time head-teacher; and a part-time teacher for Art Education Health and Physical Education Work Education
2 Teaching-learning equipment
Provided to all the classrooms as required
3 Building All-weather building consisting of At least one class-room for every teacher and an office-cum-store-cum-Head teacher’s room; Barrier-free access Separate toilets for boys and girls. Safe and adequate drinking water facility to all children’ A kitchen where mid-day- meal is cooked in the school Playground

263
S.No. Item Norms & Standards Put a (✔) wherever necessary
Arrangements for securing the school building by boundary wall or fencing
4 Minimum number of working days/ instructional hours in an academic year
For class 1 to 5 200 For class 6 to 8 220 For class 1 to 5 (Instructions hours)
800
For class 6 to 8 (Instruction 1000 5 Minimum number of
working hours per week for the teacher (Including preparatory
Forty-five teaching including preparation hours
45
6 Library Library in each school providing newspaper, magazines and books on all subjects, including
7 Play material, games and sports equipment
Shall be provided to each class as required
14. Did any school inspector visit the school in the recent past? If yes, when was the last visit? How often do they visit? Was there any communication with reference to the RTE?
____________________________________________________________________________________________________________________________________________________________________________________________________________________________________________________________________________________________________
15. What do school inspectors do when they find the school non-compliant with RTE? How do you usually cope up with the inspection visit?
_____________________________________________________________________________________________________________________________________________________________________________________________________________________________________________________________________________________________________________________________________________________________________________
16. What mechanisms do you adopt in case of a school closure notice?
_____________________________________________________________________________________________________________________________________________________________________________________________________________________________________________________________________________________________________________________________________________________________________________

264
17. What happens to the teachers, who are associated with the school in the advent of a school closure?
________________________________________________________________________________________________________________________________________________________________________________________________________________________________________________________________________________________________________
18. Is there any other additional information present in the RTE provisions, which you like to share, apart from the ones not covered in the questionnaire?
________________________________________________________________________________________________________________________________________________________________________________________________________________________________________________________________________________________________________________

265
Appendix 10 – Pre-survey responses
District Name 5th Grade not present
Temp. Principal
Not Surveyed
Not Traceable
Refused Testing
Residential Building
School Closed
Special School
Small School
Willing to test
Grand Total
Central
1 5 6 East 7
7
New Delhi 1 1 2 North 3 1 1 5 North West A 2
1 3
North West B 3
1 4 South 4 1 1 2 2 4 9 23 South West A 3 2 1 2 1 9 South West B 3 1 1 1 6 West A 7 1 2 2 1 1 5 19 West B 5 2 1 2 2 12 Grand Total 38 4 1 9 2 1 3 1 12 25 96

266
Appendix 11 – List of schools selected for sampling and final sample schools
S.No. (A)
District Name
(B)
School Name (C)
Total Students Enrolled
(D)
MOS(E)
CMOS (F)
Sampled Schools
(G)
1. West A Daffodils Convent School 700 45 45 S1 2. Central Himgiri School 150 42 87 S2 3. South new nanki public school 500 40 127 S3 4. Central Sharda Vidya Kendra School 175 35 162 S4 5. Central Sona Devi Public School 250 30 192 S5
6. North S.D Saini Public School 225 25 217 S6 7. South Divine Public School 150 25 242 S7 8. West A K. D. junior public school 200 25 267 S8 9. West B Columbia City School 180 25 292
10 South PTR Memorial Model School 200 20 312 S9
11 South West B
Children's Paradise School 350 20 332
12 West A New Navdeep Public School 250 20 352 S10 13 Central New Janta Montessori School 180 18 370 S11 14 North
West A Krishna Convent School 150 15 385
15 West A Satguru GURU KRIPA Children School
150 15 400 S12
16 South Modern Fairfield Public School 150 13 413
17 South St. Luke Public School 125 12 425
18 South Guru Amardas Public School 65 10 435 S13 19 South Zion Public School 150 10 445
20 South N P Public School 350 10 455
21 South West A
Anand Saraswati Public School 100 10 465
22 West A Janhit Public School 60 10 475 S14 23 West B Soni Public School 50 10 485
24 Central Zuby Public school 180 8 493
25 South Shiv Public School 100 8 501 S15 *Indicates sampled schools

267
Appendix 12 – Names and role of volunteers participating in the study.
S.Number Name of the volunteer Role 1. Ankit Dixit Logistics co-ordinator 2. Amit Test volunteer 3. Sonveer Test volunteer 4. Abhimanyu Test volunteer 5. Aakash Test volunteer 6. Deepak Test volunteer 7. Sachin Test volunteer 8. Rajat Test volunteer 9. Manish Test volunteer 10. Manoj Test volunteer 11. Kiran Test volunteer 12. Pooja Test volunteer 13. Dipti Test volunteer

268
Appendix 13 - Diagnostic test paper

269

270
Appendix 14 – Raven’s test of matrices

271
Option ticked (enter option A, B, C, D in English) <Option letter>
Option ticked (enter option A, B in English) <Option letter>
Option ticked (enter option A, B, C, D in English) <Option letter>
Option ticked (enter option A, B in English) <Option letter>
Option ticked (enter option A, B, C, D in English) <Option letter>
Option ticked (enter option A, B, C, D in English) <Option letter>
Option ticked (enter option A, B, C, D in English) <Option letter>
Option ticked (enter option A, B, C, D in English) <Option letter>
Option ticked (enter option A, B, C, D in English) <Option letter>
Option ticked (enter option A, B, C, D in English) <Option letter>
Option ticked (enter option A, B in English) <Option letter>
Option ticked (enter option A, B, C, D in English) <Option letter>
Option ticked (enter option A, B in English) <Option letter>
Option ticked (enter option A, B, C, D in English) <Option letter>
Option ticked (enter option A, B in English) <Option letter>
Appendix 15 – Score Card for diagnostic test
Scoring card for comprehensive paper
For each of the question, refer to the table below and enter the codes on your top Sheet in the corresponding boxes to the answer written by the student.
Note:
1. Items that have been not attempted at all should be coded as 88 2. Invalid answers (e.g. question copied, more than one option ticked in multiple
choice questions, crossed out responses, illegible answers) should be coded as 86.
3. Spellings are not to be checked unless explicitly indicated. 4. Instead of ticking, if a child crosses or circles or marks an option in any other
way, or rewrites one of the options, that option should be treated as their choice.
1.
2.
3.
4.
5.
6.
7.
8.
9.
10.
11.
12.
13.
14.
15.

272
Option ticked (enter option A, B, C, D in English) <Option letter>
Option ticked (enter option A, B, C, D in English) <Option letter>
16. Correct answer in complete sentence mentioning ‘kitchen’ (Eg.. “Sarala was having tea in the kitchen”)
01
Other variations of the correct answer
(Eg. “Sarala was having tea with her mummy in the kitchen”.
02
Correct answer in a word or phrase (Eg. In the kitchen) 11 ‘Ghar Mein’ 21 Any other answer 85 Note: Do not check for spelling errors
17. Correct answer in a complete sentence mentioning that the tiger was ‘hungry’ or ‘wanted something to eat or drink.’
(Eg. The tiger came as he was hungry and wanted something to eat and d i k )
01
Other variations of the correct answer
(Eg. The tiger came, as he wanted to have tea.)
02
Correct answer in a word or phrase (Eg.. hungry) 11 Any other answer 85 Note: Do not check for spelling errors
18. 29 01 39 81 Any other wrong answer 85
19. 34 pencils/34/Thirty four pencils/Thirty-four 01 30 81 7 82 430 or 4 30 83 43 84 Any other wrong answer 85
20.
21.
22.
23.
103 01 93 81
913 82 Any other wrong answer 85
27 01

273
Option ticked (enter option A, B, C, D in English) <Option letter>
Option ticked (enter option A, B, C, D in English) <Option letter>
Option ticked (enter option A, B, C, D in English) <Option letter>
24. 86 01 45 81 Any other wrong answer 85
25. 4 01 25 81 15 82 Any other wrong answer 85
26.
27. 6 /six /6 o’clock /6a.m / 6p.m 01 12.30 (any other related form) 81 Any other wrong answer 85
28. 4 / four 01 Four not written but clear division showing four groups of bananas 11 8 81 Any other wrong answer 85
29. 22 / twenty two / Rupees 22 (any related form) 01 20 (any related form) 81 Any other wrong answer 85
30.
31. 5 01 6 81 Any other wrong answer 85
32.
37 81 33 82 Any other wrong answer 85

274
33. 4 01 12 81 15 82 Any other wrong answer 85
34. 6/six/6 legs/six legs 01
Three pairs 02
3 81
8 82
Any other wrong answer 85
35. Any fruit that is commonly eaten with the peel.
(eg. guava/grapes/berries/plums/jamun/gooseberry)
01
Any fruit that is normally eaten without the peel, but can also be eaten with the peel. (eg. mango/Chiku/apple)
02
Any vegetable that is scientifically a fruit and is eaten with the peel (e.g. Tomato, cucumber)
03
Any fruit that is normally not eaten with peel (e.g. banana, oranges) 81
Any other vegetable that is scientifically not a fruit and is eaten with or without peel (e.g.: brinjal, carrot, potato, radish, beetroot)
82
Any other wrong answer 85
36. Teeth (any other containing ‘teeth’ should be accepted. E.g. back of teeth)
01
Palette (upper part of the mouth) 81
Any other wrong answer 85
37.
15th August 1947/15-08-1947 (any other acceptable date forms) 01
15th August (date and month correct, year missing) 11
26th January, 2nd October, (with any year) 81
Any other wrong answer 85
38. Taj Mahal/ Taj 01
Any wrong answer 85

275
Option ticked (enter option A, B, C, D in English) <Option letter>
Option ticked (enter option A, B, C, D in English) <Option letter>
Option ticked (enter option A, B, C, D in English) <Option letter>
Option ticked (enter option A, B, C, D in English) <Option letter>
Option ticked (enter option A, B, C, D in English) <Option letter>
Option ticked (enter option A, B, C, D in English) <Option letter>
Option ticked (enter option A, B, C, D in English) <Option letter>
Option ticked (enter option A, B, C, D in English) <Option letter>
Option ticked (enter option A, B, C, D in English) <Option letter>
Option ticked (enter option A, B, C, D in English) <Option letter>
39. Punjab 01
Chandigarh, New Delhi, Delhi 81
Any other wrong answer 85
40.
41.
42.
43.
44.
45.
46.
47. 900 grams / 900 or in words 01 1kilo/1 kg / 1 81 100 grams / 100 82 Any other wrong answer 85
48.
49.
50.

276
Appendix 16 – Top sheet

277

278
Appendix 17 – Language competency framework
S. No Competency tested Total question
Question Nos. in the test
1 The student identifies names of objects, birds and animals not seen in daily life and words denoting actions
3 13,14,15
2 The student reads and writes moderately difficult words that have 4–5 letters with vowels and conjunct letters
3 1,2,3
3 The student uses words appropriate to the context based on their meanings, opposites and gender endings
3 4,5,6,
4 Student - reads, understands, writes and constructs three simple and short sentences that have less than five words in a sentence
2 7,8
5 The student understands simple, short stories of 10-12 sentences when told and comprehends beyond the stated facts
2 16,17
6 The student reads a short text of 5-6 sentences that describe the daily activity, routine context, simple description, simple story independently and comprehends stated facts
4 9,10,11,12
Total 17
Appendix 18 – Maths competency framework
S. No Competency tested Total question
Question Nos. in the test
1 Number concepts (Number sequencing, Ordering, Naming numbers and Place Value)
2 Operations on whole numbers (Addition, Subtraction, Multiplication and Divisions)
3 Fraction concepts 4 Measurement and applications 5 Shapes and Geometry
(Understanding of shapes)
6 Problem Solving (Word problems and Reasoning)
Total

279
Appendix 19 – Science competency framework
S. No Competency tested The Body
The Living Environment
The Physical Environment
Science and Technology
The Universe
Man and society
Total number of questions
1 Recall of facts
2 Observation
3 Identification, pattern recognition and classifications
4 Reasoning and Analysis
5 Visual interpretation
6 Estimation and Measurement
7 Drawing a conclusion from designed experiments
Total No of Q

280
Appendix 20 – Descriptive statistics for Language test scores
Appendix 21 -Descriptive statistics for Mathematics test
Appendix 22 - Descriptive statistics for Science test
Name of the school
N Mean Median Min. Max. Range Std. Dev. Variance
School A 66 12.9265 13 7 16 9 1.94181 3.771 School B 51 12.6667 14 5 17 12 3.02435 9.147 School C 16 13.3125 13.5 10 16 6 1.92246 3.696 School D 18 12.7895 13 7 16 9 2.55123 6.509 School E 12 13 13 4 17 13 3.16228 10 School F 14 14.4286 14.5 11 17 6 1.78516 3.187 School G 11 13.7273 15 9 16 7 2.3277 5.418 School H 57 12.7931 13 3 17 14 3.08794 9.535 School I 13 12.2857 12.5 1 17 16 3.81149 14.527 School J 47 13.102 13 3 16 13 2.61602 6.844 Total 305 12.858 13 1 17 16 2.67461 7.154
Name of the school
N Mean Median Min. Max. Range Std. Dev. Variance
School A 66 10.25 10.00 3.00 14.00 11.00 2.21 4.88 School B 51 10.49 11.00 4.00 15.00 11.00 2.73 7.46 School C 16 10.94 11.50 8.00 14.00 6.00 1.77 3.13 School D 18 12.16 13.00 9.00 15.00 6.00 1.83 3.36 School E 12 9.93 10.50 6.00 13.00 7.00 2.13 4.53 School F 14 11.79 12.00 10.00 14.00 4.00 1.12 1.26 School G 11 11.73 12.00 9.00 14.00 5.00 1.74 3.02 School H 57 10.19 10.00 5.00 14.00 9.00 2.20 4.82 School I 13 9.00 8.00 7.00 11.00 4.00 1.62 2.62 School J 47 12.24 13.00 5.00 14.00 9.00 1.73 2.98 Total 305 10.7585 11 2 15 13 2.30846 5.329
Name of the school N Mean Median Min. Max. Range Std. Dev. VarianceSchool A 66 8.13 8.00 3.00 13.00 10.00 2.05 4.21 School B 51 8.73 9.00 1.00 14.00 13.00 2.46 6.04 School C 16 8.13 8.00 0.00 12.00 12.00 2.87 8.25 School D 18 9.00 9.00 5.00 12.00 7.00 1.89 3.56 School E 12 8.71 9.00 4.00 12.00 8.00 2.33 5.45 School F 14 10.71 11.00 8.00 13.00 5.00 1.49 2.22 School G 11 10.64 11.00 8.00 14.00 6.00 1.86 3.46 School H 57 8.40 9.00 2.00 12.00 10.00 2.25 5.05 School I 13 7.29 8.00 4.00 10.00 6.00 1.77 3.14 School J 47 9.67 10.00 0.00 15.00 15.00 2.93 8.60 Total 305 9.67 10.00 0.00 15.00 15.00 2.93 8.60

281
Appendix 23 - Normal distribution of diagnostic test scores
Appendix 24 – Normal distribution for language and maths scores

282
Appendix 25 - Normal distribution for EVS and IQ test

283
Appendix 26 – Assumptions in MANOVA analysis
A six-step assumptions check was undertaken before reaching to the conclusion through the
main test. Step one checks the univariate outliers through box plots; the second step reports
abnormality in the data through QQ plots. The third step verifies the presence of collinearity
through Pearson’s regression model and in the fourth step reports the linearity among the
variables through a scatter plot. The fifth checks the multivariate outliers through
Mahalanobis distance and finally, the sample size, homogeneity of variance and covariance
matrices is verified with the help of Box’s M test.
Step 1 – Determining univariate outliers through box plots
Figure 16- Box plots for Diagnostic and IQ test scores
Figure F represents the box plots for the test
scores, the blue plots represent the total diagnostic
test scores, and the green plots show the total IQ
test across the various districts of Delhi. The box
plot reveals that there were no outliers observed
across the districts for both, the diagnostic test
scores and the IQ tests.
Step 2 – Checking abnormality through QQ plots

284
Southern districts normality plots for test scores
Western districts normality plots for test scores
Northern district normality plots

285
The sample data is considered to be, normally distributed if the circular dots, representing
the data points are, clustered around the diagonal line. Figures 11 -14 representing the
normal Q-Q plots for the test scores across the four districts of Delhi do not report any
abnormality.
Step 3 –Verifying collinearity
Pearson’s regression model
Total test score Total IQ score Total test score Pearson Correlation
1 .392**
Sig. (2-tailed) 0.000 N 343 293
Total IQ score Pearson Correlation .392** 1 Sig. (2-tailed) 0 N 293 293
** Correlation is significant at the 0.01 level (2-tailed).
Table 21 shows the correlation between the two-dependent variable is .392, indicating a
moderate correlation between the variables, indicating no evidence of multicollinearity
between the variables.
Step 4 – Determining linearity through scatter plot
Scatter plots for Central and Northern districts

286
Scatter plots for Southern and Western districts
Figures 15 and 16 represent the scatter plots for the four districts, i.e., Central, North, South
and Western indicating that there is a linear relationship between the test scores of the
different districts. The linear relationship is determined by an imaginary line represented
across the data points. Looking at the graphs, it is quite evident, that all the plots allow the
formation of a straight line across the data points.
Step 5 – Determining multivariate outliers in the data
Step 1, determined the univariate outliers, which determined the unusual values within each
group of the independent variable. However, to proceed with MANOVA analysis, it is
imperative to identify the multivariate outliers in the data as well. Multivariate outliers are
slightly different from the univariate, as these are data points having an unusual combination
of values on the dependent variables. The research uses ‘Mahalanobis distance’ to
determine if a particular case (test scores, in our case) is a multivariate outlier. To, calculate
the distance, a unique student id was, allocated to all students. The procedure used the
dependent variables, i.e., total test scores and IQ test scores to predict the distance from the
student id by calculating the Mahalanobis distance. Each case would have a Mahalanobis
distance calculated, and this was carried out by splitting the independent group, ‘district’,
comprising of all the four districts of Delhi.

287
Figure 17– Screen shot of Mahalanobis distance
To determine the
multivariate outlier one
needs to look at the newly
formed variable MAH-2,
which indicates the
Mahalanobis distance from
each case. Unusual data
points in a data set are,
identified through the larger
values created under MAH-
2, and hence, the data is
sorted in descending order,
to bring the largest value is
brought to the top.
Each Mahalanobis distance is compared against a chi-square value (χ2) distribution with
degrees of freedom equal to the number of dependent variables at an alpha level of .001
(i.e., p < .001). The below table provides t values for Mahalanobis distance for the alpha
level for up to five dependent variables
In our case, we have two dependent variables, and hence, the Mahalanobis distance needs
to be, compared against the critical value of 13.82. Figure 17 indicates that largest value is
10.89, which is smaller than the critical value. Hence, it can be, concluded that there are no
multivariate outliers in the data points assessed by Mahalanobis distance (p > .001).
No. of Dependent Variables
Critical Value
2 13.82 3 16.27 4 18.47 5 20.52

288
Step 6 – Determining adequate sample size, equality of variance and homogeneity of
variance
Sample size determination
Between-Subjects Factors Value
Label N
Final Districts
1.00 Central 26 2.00 North 18 3.00 South 138 4.00 West 111
The "N" column in table 22 shows the number of cases in each district group. This indicates
that the sample size is sufficient to undertake the analysis.
Table 69 – Box test for Equality of covariance
Box's M 21.107 F 2.281 df1 9 df2 25687.105 Sig. .015
To, determine the equality of co-variance and covariance matrices, the box test represents
the significance level (p-value). For the values to have homogeneity of variance and
covariance matrices the p-value should not be statistically significant, in other words (p >
.001). In our case, the ‘sig’ value is greater than .001 (p=.015) indicating that the assumption
of homogeneity of variance-covariance matrices is satisfied. In technical terms, the
homogeneity of variance-covariance matrices, assessed by Box’s test of equality of
covariance matrices is reported (p=.015).

289
Appendix 27 - Demographic factors affecting student test scores
Information on student background characteristics included; the language spoke at home,
the employment status, and the literacy levels of both the parents. More than 97.5 percent of
the households spoke Hindi. In terms, of parental employment, more than 2/3rd of the
mothers were not employed (83.4%), and less than five percent of the mothers were,
categorised as professionals (4.6%). Close to 1/4th of the fathers were, categorised as
unskilled (22%), around 2/5th of them reported themselves to be skilled (37.9%), and more
than a third were, classified as professionals (36%) (ref table 54).
Most mothers had some form of education; less than 10% reported to be illiterate. Nearly a
third of the mothers, stated, that they had education till secondary levels. Close to 1/4th said
having a higher secondary (18.5%) or a higher education degree (16.9%). In the case of
fathers, less than 2% reported having no formal education nearly a fourth (25.1%) reported
to have obtained higher education. 60% of the fathers were reported to have a secondary
pass or a higher secondary degree (ref table 54).
More than 3/4th of the students (78.8%) reported that an elderly family member was capable
of conversing in English fluently. (68.3%) said that their siblings could understand English,
this indicates that students enrolled in low-cost private schools are likely to have siblings
enrolled in the same or different private schools located in the nearby periphery (ref table
54).
Table 70 – Family background of the children attending the schools
Item Low-cost private (%)
Language spoken at home Hindi 97.5 Employment status of Mother Not Working 83.4 Unskilled 8.8 Skilled 3.1 Professional 4.7 Employment status of Father Not Working 4.0 Unskilled 22.0 Skilled 38.0 Professional 36.0 Education, level of Mother

290
Item Low-cost private (%)
Illiterate 9.0 Primary pass 27.5 Secondary Pass 28.1 Higher secondary 18.5 Higher education 16.9 Education level of Father Illiterate 1.7
Primary Pass 14.2 Secondary Pass 28.4 Higher secondary 30.7 Higher education 25.0
Table 71 – Capability to speak English by elderly or siblings
Item Low-cost private
English is spoken by an elderly member
78.8%
Siblings capability to understand English
69.2%
Total – (N) 305
Regarding asset ownership, particularly related to dwellings, data indicates that almost a
majority of students (98.5%) enrolled in cost private schools are likely to reside in concrete
buildings and reported to have toilet provisions within the property (94.9%). With easy
availability and lower costs, digital assets – including; items like television, DVD,
smartphones and laptops seem to be available in a majority of households. 98% of the
students reported having a television and 88.9%, said that they had smartphones in their
homes. More than 2/5th of the students responded positively to the availability of DVD
players and laptops in their homes. Core assets included like refrigerators (87.4%), air
coolers (76.3%) and bicycles (56.6%) for commuting were available in more than half of the
homes surveyed. A luxury asset like a car was reported only in 1/5th of the homes and fixed
assets like house and shops were reported just in 26.8% of the households (ref table 55).

291
Table 72 - Real Estate and Asset ownership characteristics across by the type of school attended
Impact of demographic factors on diagnostic test scores
Family factors impacting test scores were assessed by a regression model, determining an
overall fit and contribution of each of the predictors (independent variables) to the total
variance in the dependent variable (diagnostic test scores). The following regression model
was used to determine the impact of covariates on test scores.
=β0+ β1X1 + β2X2 + βnXn + ε
Where, Y is the dependent variable, i.e. diagnostic test scores, and the eight independent
variables are represented from X1 to X8. β0 represents the constant, and β1 is the slope
coefficient for X1, β2 for X2 so on and so forth, and ε represents the errors. Independent
variables include X1 – student age, X2 – number of members in the family, X3 – language at
home, X4 – siblings’ capability to read English, X5 – employment status of father, X6 –
employment status of mother, X7 – education level of father and X8 – education level of the
mother
Item Low-cost private
Type of building Concrete building to live 98.5 Toilet provision near the property 94.9 Kitchen provision in the property 87.4 Core and ancillary asset ownership Refrigerator 87.4 Air cooler 76.3 Cycle 56.6 Car 21.2 House or shop 26.8 Digital asset ownership
Television 98.0 Digital Video Disc (DVD) Player 46.0 Smart Phone 88.9 Laptop 44.4

292
The regression model is statistically significant to
predict the test scores, F (8, 211) = 4.46, p < .0005.
Variance in the data, as determined by R2 was
reported at 14% with an adjusted R2 of 11%,
indicating a moderate association between the
variables. For determining the independence of the
residuals, the Durbin Watson statistic (1.328) closer
to 2, confirms that the residuals were independent
of errors (ref table 27 and 28). The linearity of the
relationship between the variables was assessed
by a scatter plot as shown in the figure. (Ref figure 18)
Table 73 – Regression model summary
Table 74 – Regression model summary
Sum of Squares df Mean Square F Sig.
Regression 1997.787 8 249.723 4.446 .000
Residual 11852.049 211 56.171
Total 13849.836 219
Table 75 - Summary of multiple regression analysis
Factors B SEB Beta t Sig. Lower Bound
Upper Bound
Constant 25.625 4.262 6.012 0 17.223 34.027
Student Age 0.189 0.291 0.042 0.648 0.518 -0.385 0.762
Family members -0.41 0.203 -0.133 -2.025 0.044** -0.81 -0.011
Language at home 0.612 0.737 0.054 0.83 0.407 -0.842 2.066
Siblings capability to read English
-0.912 0.383 -0.153 -2.378 0.018** -1.668 -0.156
Employment status of father
0.149 0.617 0.016 0.242 0.809 -1.066 1.365
Figure 18 - Scatter plot to assess linearity
Model R R2 Adjusted R2 Std. Error of
the Estimate
Durbin-
Watson
1 .380a 0.144 0.112 7.495 1.328

293
Factors B SEB Beta t Sig. Lower Bound
Upper Bound
Employment status of mother
-0.714 0.674 -0.069 -1.06 0.29 -2.042 0.614
Education level of father 0.751 0.515 0.107 1.459 0.146 -0.264 1.766
Education level of the Mother
1.607 0.491 0.238 3.274 0.001** 0.639 2.574
The regression model showed that large family sizes are likely to have a negative impact on
the test scores, as parents and guardians cannot focus their attention in cases, where there
are more than 2 or 3 children in a family. Moreover, in India, people still live in joint families,
in which a single female or two, manage an entire household of 8 to 10 people. This restricts
their time to assist their children with academic lessons.
Parental education has a positive impact on positive impact on student test scores. Mother’s
education in case of the research was, found to be statistically significant, with test scores.
Sibling’s capability to read English language seems to have an adverse effect on student
test scores, and there could be two possible reasons attributed to it. First, it is quite likely
that parents tend to focus on the children who learn faster and better and hence neglecting
the slow learning kid. Second, development of inferiority complex, wherein a child with
slower learning capabilities may feel ashamed to develop one’s capabilities. Other factors
such as student age, language spoken at home, employment status of parents indicate a
positive relation to the dependent variable, however, they are not significant.

294
Appendix 28 –Interview with school owner
Full transcript of interview School one. Name of the respondent has been withheld to protect their identity.
Gopal Iyer (GI) - Hi, good morning my name is Gopal, and I am from Newcastle University, researching on the phenomenon of school closure in the area. My colleague Ankit spoke highly about your school and it’s finally good to meet you.
SS- Hey good to meet you as well. Tell me how I help you today.
GI- Thank you for your time and accepting to be interviewed. I shall be taking a few notes as we carry out the discussion. So, could you tell me how you started the schools and are you aware of the RTE Act that started in 2009?
SS – Sure, I belong to the northern state of Uttrakhand, and I struggled myself to get a quality education and hence, he decided to start a school in the slums of Delhi. I have a strong conviction that first generation learners are capable of learning and so I am happy when children coming from poor and impoverished backgrounds can speak English.
Yes, I am quite aware of the RTE norms and regulations set out by the government, and I have gone through them, albeit not very much in detail.
GI – Do you know if the provisions of the RTE apply to your school?
SS – Yes, I am aware of the provisions of the RTE, and I feel some of the provisions are helpful in academics. However, many of the regulations hinder academic growth and are quite administrative in nature. Also, many regulations are quite capital intensive in nature and forcing small educational entrepreneurs like us to devote our time and energy on trivial matters rather than the crucial ones.
GI - Have you applied or received Government recognition? If not, are you aware of the procedures to get Government recognition? Have you submitted the required forms to the District Education Officer? (Each state has outlined the procedures and requirements that you need to fulfil to get Government recognition)?
SS - Yes, our school applied for the recognition, and according to the criteria we would require around 4000 square yards of space. I started school in the year 2006 and had applied for recognition in 2007. I did not receive any notifications for closure till date, however the department of education had listed the school in the category of ‘defaulters’ as we had some delay in the renewal process, for no fault of ours. I fought for recognition and finally received the recognition in September 2015
GI - Can you let us know what hurdles do you face when you apply for recognition? What happens when you are not able to obtain the recognition from the local authorities?
SS – I think the regulations are quite skewed towards the administrative side rather than the academic ones. The RTE in my view sets out a complex set of regulations and expects small budget schools to follow them, even though the extent to which these regulations improve learning outcomes at elementary or secondary levels is quite questionable. I have undertaken massive capital investments to comply with the rules and regulations, and hence, our school received recognition in 2015. However, this was ‘provisional’ which means

295
that the school is required to renew the recognition certificate every year with the Department of Education.
GI - How many times have you received notices for non-compliance with the RTE norms and regulations?
SS – We haven’t received notices for non-compliance however, our school was classified in the defaulter's list as there was a procedural delay from the education department’s administrative end, while led to delays for our school in procuring the recognition.
GI - Do all students in your school get free education? (Y/N). If there is a fee for students, how many students pay the fee? How much is the fee?
SS- Given the cost of teachers’ salaries, fixed capital and working capital costs we cannot afford to provide free education. We charge a monthly tuition fee of 500 Rs/- (approx. 5£) apart from the other fees. We do have separate charges for uniform, bags and books that we provide to children.
GI - How many of your students belong to SC/ST (schedule caste/schedule tribe) and OBC (other backward caste) categories? Do you have students from Below Poverty Level (BPL) families?
SS- We have a total strength of 700 students and close to 63% of the entire school population were from SC and OBC backgrounds. We do not have children from the ST backgrounds.
GI - What is the curriculum does your school follow? Do you follow CBSE/ICSE/State syllabi? If not, are you confident that the school curriculum meets the prescribed RTE norms?
SS – AT the school we follow the CBSE curriculum, as he mentioned that the curriculum did not help children to improve their learning levels.
GI - Does the school offer scholarships or financial incentives to the enrolled students?
SS – We do provide rebates in school tuition fees for those coming from extremely impoverished backgrounds and lowest economic strata of the society. However, we cannot afford to fully wave school fees.
GI - Did your teachers receive any kind of training in the recent past? If yes, what training did they receive and who trained these teachers?
SS – In our school, we did not have any specific trainings related to the RTE, however refresher training’s for teachers are held on an ad-hoc basis by calling external experts. We have expert teachers from DPS and Sanskriti who provide training to our teachers on the fourth Saturday of every month”.
GI - How many working days does your school have every year for Primary Classes? What is that number for Upper Primary Classes? What are the school hours daily?
SS- In our school teachers work for 220 working days and 1320 instructional hours for teachers. I believe this is far more than the requirement of the RTE norms.
GI - Does your school meet the requirements as stated in the RTE schedule of the Act? Please consider the below aspects of the RTE and confirm if they comply with the below standards?

296
SS – Sure, can you show me the table and I will help you to do the checks.
Item Norms & Standards Mark (✔) if applicable
No. of Teachers Number of teachers/days/hours
For classes 1 to 5 Up to 60 students 2 Between 61 to 90 3 Between 91 to 120 4
Between 121 to 200 5
Teaching-learning equipment
Provided to all the classrooms as required
Building All-weather building consisting of : At least one classroom for every teacher and a multipurpose office-store;
Barrier-free access X Separate toilets for boys and girls. Safe and adequate drinking water facility to all children
A kitchen where midday meal is cooked in the school
X
Playground Arrangements for securing the school building by boundary wall or fencing
Minimum number of working days/ instructional hours in an academic year
For class 1 to 5 200
For class 6 to 8 220 For class 1 to 5 (Instructions hours)
800
For class 6 to 8 (Instruction 1000 Minimum number of working hours per week for the teacher (Including preparatory
Forty-five teaching including preparation hours
45
Library Library in each school providing newspaper, magazines and books on all subjects, including story-
Play material, games and sports equipment
Shall be provided to each class as required
Our school followed almost all the provisions of the RTE Act except we did not have any barrier-free access for handicapped children, as we have not enrolled any disabled children in the schools.

297
GI - Did any school inspector visit the school in the recent past? If yes, when was the last visit? How often do they visit? Was there any communication concerning the RTE?
SS – Yes, school inspectors from the education department visited the school twice, and the last visit was on 2nd May 2016. The inspectors indicated that there was no scientific laboratory for children, as well as the library. Hence the school had invested in the laboratory and library.
GI - What do school inspectors do when they find the school non-compliant with RTE? How do you usually cope up with the inspection visit?
SS- Usually the communication is quite straight forward; however, one can sense as to what they are hinting towards. Most inspectors would ask me to meet in private and discuss the bribe related matters during the private meeting.
GI - What happens to the teachers, who are associated with the school in the advent of school closure?
SS - I am afraid that the teachers would be unemployed. Some experienced teachers may find jobs, but most of them would be jobless. Moreover, it would also impact the children as they would either drop out from the education system entirely and join the manual labour stream or enrol themselves in the overcrowded government schools. I see that there is a huge problem from the government in terms of capacity building. If the government provided good quality education, may be small players like us would have never existed. But thankfully that’s not the case. I think that the government does not understand the concept of quality education.
GI - Is there any other additional information present in the RTE provisions, which you like to share, apart from the ones not covered in the questionnaire?
SS- I think that’s it, I have covered most of the issues about the RTE.
GI – Thank you for your time and it was great chatting with you, also I appreciate the school tour.
SS-You are welcome and all the best for your future endeavours.