
The effect of emotion on voice production and speech ... - OSF
221
The effect of emotion on voice production and speech acoustics. Tom Johnstone, BSc. PGDip.Sc. University of Western Australia & University of Geneva This thesis is presented for the degree of Doctor of Philosophy of The University of Western Australia Psychology Department 2001.
-
Upload
khangminh22 -
Category
Documents
-
view
2 -
download
0
Transcript of The effect of emotion on voice production and speech ... - OSF

The effect of emotion on voice production and speech acoustics.
Tom Johnstone, BSc. PGDip.Sc.
University of Western Australia & University of Geneva
This thesis is presented for the degree of Doctor of Philosophy
of The University of Western Australia
Psychology Department
2001.

ii

iii
Abstract
The study of emotional expression in the voice has typically relied on acted portrayals of
emotions, with the majority of studies focussing on the perception of emotion in such
portrayals. The acoustic characteristics of natural, often involuntary encoding of emotion
in the voice, and the mechanisms responsible for such vocal modulation, have received
little attention from researchers. The small number of studies on natural or induced
emotional speech have failed to identify acoustic patterns specific to different emotions.
Instead, most acoustic changes measured have been explainable as resulting from the
level of physiological arousal characteristic of different emotions. Thus measurements of
the acoustic properties of angry, happy and fearful speech have been similar,
corresponding to their similar elevated arousal levels. An opposing view, the most
elaborate description of which was given by Scherer (1986), is that emotions affect the
acoustic characteristics of speech along a number of dimensions, not only arousal. The
lack of empirical data supporting such a theory has been blamed on the lack of
sophistication of acoustic analyses in the little research that has been done.
By inducing real emotional states in the laboratory, using a variety of computer
administered induction methods, this thesis aimed to test the two opposing accounts of
how emotion affects the voice. The induction methods were designed to manipulate
some of the principal dimensions along which, according to multidimensional theories,
emotional speech is expected to vary. A set of acoustic parameters selected to capture
temporal, fundamental frequency (F0), intensity and spectral vocal characteristics of the
voice was extracted from speech recordings. In addition, electroglottal and physiological
measurements were made in parallel with speech recordings, in an effort to determine the
mechanisms underlying the measured acoustic changes.
The results indicate that a single arousal dimension cannot adequately describe a
range of emotional vocal changes, and lend weight to a theory of multidimensional
emotional response patterning as suggested by Scherer and others. The correlations
between physiological and acoustic measures, although small, indicate that variations in
sympathetic autonomic arousal do correspond to changes to F0 level and vocal fold
dynamics as indicated by electroglottography. Changes to spectral properties, speech
fluency, and F0 dynamics, however, can not be fully explained in terms of sympathetic
arousal, and are probably related as well to cognitive processes involved in speech
planning.

iv

v
Contents
Overview ...................................................................................................................... 11. Introduction.............................................................................................................. 7
Overview of speech production................................................................................. 9The effects of emotion on speech production........................................................... 11
Affective pragmatics............................................................................................ 11Cognitive and attentional constraints ................................................................... 12Physiology .......................................................................................................... 14
Evidence on Acoustic Characteristics of Emotional Speech..................................... 16Stress.................................................................................................................. 17Anger and irritation ............................................................................................. 17Fear and anxiety.................................................................................................. 18Sadness............................................................................................................... 18Joy and contentment............................................................................................ 19Disgust................................................................................................................ 19Boredom............................................................................................................. 19
Problems with previous empirical research .............................................................. 20Acted versus real emotional speech..................................................................... 20Acoustic parameters measured ............................................................................ 21Theory based research......................................................................................... 22
Models of emotion and emotional speech................................................................ 22Modern theories of general arousal...................................................................... 23Modern theories of differentiated physiological response ..................................... 24
The Component Process Theory of emotion............................................................ 27The appraisal methodology in speech research......................................................... 29Summary................................................................................................................. 33Overview of this research........................................................................................ 34
2. Methodological issues............................................................................................. 39Acoustic analysis of emotional speech..................................................................... 39
Time-related measures......................................................................................... 40Intensity-related measures ................................................................................... 41Fundamental frequency-related measures............................................................. 42Spectral measures................................................................................................ 44
Real or induced emotional vocal expressions ........................................................... 46Computer games in emotion research .................................................................. 48
3. Experiment 1: Computer game induction of emotional speech................................. 53Introduction. ........................................................................................................... 53
Push effects of emotion on the voice.................................................................... 53Method ................................................................................................................... 56
Participants ......................................................................................................... 56Description of the game....................................................................................... 57Procedure............................................................................................................ 57Manipulation of appraisal dimensions .................................................................. 58Vocal reports ...................................................................................................... 59Emotion self-report ............................................................................................. 60
Results.................................................................................................................... 61Emotion reports .................................................................................................. 61Acoustic Analyses ............................................................................................... 62Statistical analyses............................................................................................... 65

vi
Discussion............................................................................................................... 73Push effects as simple arousal .............................................................................. 75
Conclusions............................................................................................................. 784. Experiment 2: Acoustic and physiological measurement of emotional speech........... 83
Introduction ............................................................................................................ 83Methodological issues ......................................................................................... 85Appraisal dimensions........................................................................................... 86Hypotheses.......................................................................................................... 91
Method ................................................................................................................... 93Participants.......................................................................................................... 93Design and Manipulations.................................................................................... 94Measurements ..................................................................................................... 94Procedure............................................................................................................ 96
Results .................................................................................................................... 97Subjective emotion reports .................................................................................. 97Acoustic analysis ................................................................................................. 98Physiological analysis ........................................................................................ 100Statistical analysis.............................................................................................. 101
Discussion............................................................................................................. 109Conclusions........................................................................................................... 112
5. Electroglottal measurements of emotional speech.................................................. 115Introduction .......................................................................................................... 115
Glottal analysis of imagined emotions. ............................................................... 118Method ................................................................................................................. 118
Participants........................................................................................................ 118Equipment......................................................................................................... 118Procedure.......................................................................................................... 119
Results .................................................................................................................. 119Acoustic and glottal analyses ............................................................................. 119Statistical analysis.............................................................................................. 122
Discussion............................................................................................................. 128Variation of acoustic measures across emotions................................................. 128Variation of EGG measures across emotions and with acoustic measures........... 128
Conclusions........................................................................................................... 1306. Experiment 3: Acoustic, electroglottographic, and physiological measurement ofemotional speech....................................................................................................... 131
Introduction .......................................................................................................... 131Experimental design .......................................................................................... 134Hypotheses........................................................................................................ 136
Method ................................................................................................................. 137The task ............................................................................................................ 138Speech material................................................................................................. 139Subjective emotion reports ................................................................................ 139Measurements ................................................................................................... 140Speakers............................................................................................................ 140Procedure.......................................................................................................... 141
Results .................................................................................................................. 142Acoustic measures............................................................................................. 142EGG measures .................................................................................................. 144Statistical analysis.............................................................................................. 145
Acoustic measures for the extended [a] vowel................................................ 145

vii
Acoustic measures for standard phrase .......................................................... 149Physiological measures .................................................................................. 154Emotion reports ............................................................................................ 157Emotion reports, vocal and physiological measures........................................ 157Correlations between dependent measures ..................................................... 160
Discussion............................................................................................................. 165Efficacy of the manipulations............................................................................. 165
Effects of the manipulations on the extended [a] vowel.................................. 166Effects of the manipulations on the standard phrase. ...................................... 169
Conclusion............................................................................................................ 1717. General Discussion................................................................................................ 173
Can emotional vocal changes be explained with an arousal model? ........................ 178Can emotional vocal changes be explained with an appraisal model?...................... 180How does appraisal affect the voice and physiology?............................................. 182How do emotional changes to physiology affect the voice?.................................... 184Conclusions and directions for future research....................................................... 187
References ................................................................................................................ 193Appendix 1. Vocal correlates of appraisal processes.................................................. 211

viii

ix
Acknowledgements
Along the way to completing this research, I have been encouraged, motivated,
assisted and sometimes, fortunately, pushed a little, by too many people to mention here.
To all those who have helped me get to this point, I would like to convey a sincere and
heartfelt thank you.
A number of my friends and colleagues I would particularly like to thank. To Erin,
Neville, and John, thank you for introducing me to the wonders of cognitive psychology
at UWA. To Trish, Andrew, Marie-Christine, Susanne, Alex, Veronique and Marcel –
many thanks for making an Aussie with bad French feel so welcome in Geneva, and for
all the interesting and enjoyable discussions we’ve had in the last few years. Brigitte and
Blandine – thank you for guiding me through the maze of red tape, and for doing so
repeatedly with astoundingly good cheer. Tanja, thank you for all your help and
collaboration, and good luck with your own studies on the voice.
Klaus, Kim and Kathryn, you got me interested in all this stuff in the first place, so
I suppose my writing this thesis is your fault more than anyone else’s. But I’m as
enthusiastic now as ever, which I credit to you inspiring and encouraging me from the
outset to ask difficult questions and seek their answers. Thank you.
Last of all, to Mum, Dad, Allan and Carien, for putting up with my stubbornness
and for always getting behind me and supporting me in what I’ve done. A few words
here doesn’t do justice to how much gratitude I have to all of you. Thank you.


1
Overview
Since Darwin (1872/1998) wrote about the expression of emotions in humans and
animals, the scientific study of emotion has seen numerous but sporadic developments.
Darwin's observations and insights provided the inspiration for a large amount of
research into facial expressions of emotion, much of which was carried out a century
later by Ekman and his collaborators (e.g. Ekman, 1972, 1973b, 1982a, 1984). Such
research showed that facial expressions of discrete emotions were universally recognised,
spanning widely separated cultures. In developing the Facial Action Coding System
(FACS; Ekman and Friesen, 1978; Ekman 1982b), Ekman also provided researchers
with a means of precisely quantifying the activity in the facial musculature that expresses
each distinct emotion. FACS is now widely used in psychological research on emotions,
not just in experiments that focus on facial expression, but also in conjunction with
subjective emotion reports as a measure of the presence of a particular emotional state in
an experimental participant. These developments have not only led to a much greater
understanding of human nonverbal communication and interaction, but also to a better
theoretical understanding of the human emotion system as a whole. In particular,
research on the facial expression of emotions has been instrumental in shaping one of the
dominant theories of emotion, which posits the existence of a limited set of biologically
innate emotion response systems that are common to all human beings.
In comparison to facial expression of emotion, the vocal expression of emotion has
received relatively little attention. Acted emotion portrayals have been used in a number
of emotion judgement studies, with the accumulated findings indicating that at least for
such acted expressions, recognition rates are comparable, though slightly lower, than for
facial emotion expressions (Scherer, 1989; Banse and Scherer, 1996; Johnstone and
Scherer, 2000; van Bezooijen, 1984) and are also recognised extremely well across

2
cultures (Scherer, Banse and Wallbott, 2001). The latter result is particularly relevant for
the vocal expression of emotion, because it indicates that the vocal expression of
emotion reflects mechanisms that function largely independently of the mechanisms for
production of a given spoken language. Only a small, albeit growing number of studies
have tried to identify the emotion-specific vocal characteristics that are presumably used
by listeners to infer an expressed emotion. In most of these studies, relatively simple
acoustical analyses of recordings of speech have failed to discover emotion-specific vocal
patterns, although recent efforts employing more sophisticated analysis techniques have
met with more success (e.g. Banse and Scherer, 1996; Sobin and Alpert, 1999). The last
two studies notwithstanding, it remains unclear exactly which acoustic characteristics
carry emotional information in the speech signal, and the degree to which such acoustic
markers are reliable across different speakers and listeners, which is one of the reasons
that no vocal equivalent of the FACS system has been developed. As a result, the
influence of studies of vocal emotion expression on theories of nonverbal behaviour and
theories of emotion has been minimal.
One can posit a number of reasons for the apparent lack of interest in the vocal
communication of emotion. One possible reason is that until the relatively recent
application of computers to digital signal processing, researchers lacked an obvious
method for the objective analysis of speech. Even with modern signal processing
software, analysis of speech requires a mathematical training that many psychologists
don't possess and don't have the time to learn. In addition, in order to properly analyse
speech, a high quality recording free of background noise is required. The fact that the
speech signal carries both linguistic and non-linguistic (including emotional) information
complicates matters, since one must find ways of either separating the various
components, or keeping the linguistic component constant while varying the emotional

3
component. Finally, and perhaps most influentially, we seem to possess a far better
intuitive knowledge of how faces encode emotions that we do of how the voice encodes
emotions. Thus we all know intuitively that people smile by raising the corners of their
mouths when they are happy, lower the corners of the mouths when they are sad, and
scowl by furrowing their brows when they are angry. We have little such knowledge of
people's voices. We say that people raise their voices when they're angry, but they also
raise their voices when elated or scared. We can usually tell by listening to the voice the
difference between someone who is elated and someone who is angry, but it is difficult to
say what the difference is. In short, our knowledge of the vocal expression of emotion is
more implicit and thus more inaccessible than our knowledge of the facial expression of
emotion.
Studies of emotional expression in the voice are not only fewer than those of facial
expression, their results are also less conclusive. Reviews of studies on emotional vocal
expression up to the late 1980s (Scherer, 1986; Pittam and Scherer, 1993; Johnstone and
Scherer, 2000) concluded that while consistent differences in the acoustical patterns
across emotions exist, they seem to indicate a single dimension of physiological arousal.
Thus emotions such as anger, fear and joy were all characterised by raised F0 and high
intensity, while emotions such as sadness and boredom were expressed with low F0 and
low intensity. Reliable acoustic parameters that could differentiate between two emotions
of similar arousal seemed, on the basis of the empirical evidence, not to exist.
Remarking, however, that the ability of judges to accurately judge expressed emotions,
including those with similar arousal levels, meant that such parameters must exist, the
authors suggested that a broader set of acoustic parameters would need to be analysed in
future research. Supporting this claim, Johnstone and Scherer reviewed some more

4
recent studies in which a more thorough acoustic analysis of acted speech allowed better
differentiation of emotions with similar arousal levels.
A question remains, however, about the use of acted speech in most of the studies
of vocal emotion expression that have so far been performed. Scherer (Scherer, 1985;
Scherer, Helfrich, and Scherer, 1980) has argued that the expression of emotion in
speech reflects the effects of two distinct influences on the voice. The most basic is the
direct effect of an emotional response on vocal production, termed a push effect by
Scherer. This effect might be due to interruption of cognitive processes involved in
speech planning and production, perturbation of the physiological systems that not only
underlie speech production but also serve to maintain the body in an optimal state for
survival (e.g. the skeletal musculature, the lungs), or the activation of specialised
neuromotor programs for the vocal expression of emotion. Push effects are expected to
be largely involuntary.
Pull effects, on the other hand, are those external influences that can shape vocal
production independently of the actual emotional state of the speaker. Such effects
include accepted sociocultural speaking styles and vocal display rules (the vocal
equivalent to facial display rules, cf. Ekman, 1973a), which will change with the speaking
context. In contrast to push effects, pull effects are expected to be more under voluntary
control, and can be used strategically with the express purpose of sending a signal to, or
evoking a response from cohorts. Such is the case with acted speech. Even those acting
techniques (e.g. the Stanislavski technique) that seek to create an emotion as the basis
for portraying that emotion reflect both push and pull effects. Thus the presence of
emotion-specific acoustic patterns in acted speech, as have been found in previous
research, might well be attributable to the adoption by the actors of culturally defined,
strategic speaking styles. The question of whether the push effects of emotions on the

5
voice produce well defined, emotion-specific changes to acoustic patterns remains
unaddressed. This is the central question of this thesis.
The presence or absence of such emotion-specific effects on the voice is an
interesting question not only in terms of emotional expression, but also in terms of
theories of emotion in general. Much debate in emotion psychology over the last century
has focused on whether emotional responses are well defined and emotion-specific, or
whether they are more diffuse, reflecting more general mechanisms of physiological
arousal (e.g. Cacioppo, Berntson, Larsen, Poehlmann and Ito, 2000; Davidson, Gray,
LeDoux, Levenson, Panksepp, and Ekman, 1994). Given that vocal production is
intimately connected with physiology, especially parts of the physiology that subserve
more "basic" homeostatic functions such as the respiratory system, it is natural that
arguments about whether physiological emotional responses are emotion-specific should
parallel similar arguments concerning the emotion-specificity of vocal characteristics. It
is perhaps surprising then that until very recently, no attempt has been made to examine
physiological and vocal emotional responses together. Scherer (1986), adopting a
theoretical stance that favours the presence of differentiated physiological and vocal
emotional responses, has suggested a number of ways in which physiological responses
lead to changes in vocal production that in turn lead to differentiated acoustic patterns.
In an effort to stimulate such an approach, Scherer produced predictions of physiological
and acoustic emotional responses that are amenable to empirical testing. In addition to
attempting to ascertain whether push effects of emotion on the voice produce
differentiated acoustical patterns, this thesis also seeks to test Scherer's predictions, and
more generally, to look for correspondence in measurements of vocal and physiological
emotional responses.

6
In order to examine the push effects of emotion on speech, this research adopted
the approach of inducing emotional responses in the laboratory using a range of emotion
induction techniques. Since efforts to induce emotional physiological responses using
passive techniques such as film watching have met with limited success in the past, active
emotion-inducing computer tasks and puzzles, designed to be more involving for the
participants, were developed. In all tasks, standard sentences, designed to be comparable
across emotion conditions, were elicited from participants and recorded using high
quality recording equipment. For the second and third experiments, a range of autonomic
and somatic nervous system measurements were also made. The specific physiological
measures that were chosen were selected either due to their predicted role in the
production of speech (e.g. respiration, electroglottogram, zygomatic muscle activity) or
their status as indicators of sympathetic or parasympathetic nervous system activity,
which plays an important, but distinct, role in both an arousal model of emotional speech
as well as in Scherer's theory. In addition, the third experiment included more direct
measurement of vocal fold function, using electroglottography, in an effort to better
identify the mechanisms underlying changes to the acoustics of emotional speech.

7
1. Introduction
The importance of vocalisations in affective communication amongst animals was
originally noted by Darwin (1872/1998). However, despite the fact that he rated vocal
communication alongside facial and postural displays as one of the most prominent
means by which animals (including humans) expressed emotions, and despite recent
advances in many areas of speech science, there has been a general lack of systematic
research into the expression of emotion in speech. Starkweather (1956) demonstrated
that the verbal content of speech was not necessary for communication of affective
information. Since then perceptual studies of acted emotional speech have used low-pass
filtered speech and various masking techniques to eliminate the verbal content of speech,
finding the existence of two separate channels of vocal emotion communication, one
carrying verbal related content and the other operating independently of verbal content
(Lieberman and Michaels 1962; Scherer, Ladd and Silverman, 1984). Studies of acted
emotional speech have consistently found that listeners are able to classify the emotional
state of the speaker at better than chance levels, when either verbal content is held
constant over a number of expressed emotions, or is absent entirely from the speech
signal (Johnstone and Scherer, 2000; Banse and Scherer, 1996). Although it has been
shown with such studies that the suprasegmental characteristics (i.e. those extending
over multiple syllables or words) of speech carry emotional information, the mechanisms
underlying such nonverbal transmission of emotion (termed emotional or affective
prosody1), and the specific suprasegmental acoustic parameters involved, remain to a
large extent uninvestigated.
Yet the study of affective prosody is important for a number of fields. In the
domain of speech and language science, the phylogenetic and ontogenetic development
of spoken language might be better understood given a better knowledge of how the

8
mechanisms of affective prosody interact with those of spoken language (e.g. see
Lieberman, 1996). In a more practical context, the growing recognition of affective
prosodic pathologies, in which production or perception of affective prosody is impaired
(see Baum and Pell, 1999), typically following brain damage, demands a better
understanding of affective prosody in order to develop effective treatments and
rehabilitation programmes. The study of emotion psychology, in which the focus has
long been on subjective feeling, facial expression, and physiological response, also stands
to benefit from an improved understanding of affective prosody. For example, an
examination of the physiology of emotional vocal production might provide further
evidence pertinent to the long running question of whether there exist differentiated,
emotion-specific physiological responses (see Cacioppo, Berntson, Larsen, Poehlmann
and Ito, 2000; Davidson, Gray, LeDoux, Levenson, Panksepp, and Ekman, 1994).
In what follows, a brief introduction to the mechanisms of speech production is
provided, which will serve as a basis for discussing current theory and empirical evidence
on the effects of emotion on the voice. This is followed by a summary of empirical
findings on the acoustic characteristics of emotional speech. The summary concludes that
most results seem to reflect a single dimension of arousal, and that specific vocal
characteristics that distinguish between emotions of similar arousal have not been
consistently found. The possible methodological and theoretical reasons underlying this
lack of measured emotion-specific vocal characteristics are then discussed. Of these, the
absence of a theory of the effects of emotion on speech, which could be used to better
guide research and compare results, is next addressed. An overview of the ways in which
emotion might affect speech production is followed by a review of current emotion
theories, in particular their predictions concerning the existence or absence of emotion-
specific physiological responses, and the resulting implications for emotional speech

9
production. The chapter concludes with a description of the aims and methodology of
this research, including how it attempts to address the problems encountered in previous
empirical studies.
Overview of speech production
The human voice is the basic sound which is then modified with the specific
features of a language, such as the phonemes representing vowels and consonants, as
well as other grammatically significant features such as pauses and intonation. In
research on human speech, it is useful to distinguish between short term segmental
aspects, which often carry linguistic information, and longer term suprasegmental
aspects, which carry a mixture of paralinguistic and non-linguistic information2. Non-
linguistic information carried by the voice includes indicators of the speaker’s age and
gender, their regional and educational background and, of central interest here, their
emotional state. Although emotions are often also expressed in the linguistic structure
and semantic content of speech, the most direct influence of emotions on speech is the
way in which they affect suprasegmental characteristics of speech, largely through
changes to the physiological mechanisms of voice production.
Speech is produced by the co-ordinated action of three physiological systems, the
respiratory system, the vocal (phonation) system and the resonance system. The
respiratory system is composed of the lungs, trachea, thoracic cage and its associated
muscles, and the diaphragm. By balancing the forces exerted by the air pressure within
the lungs with those exerted by the inspiratory and expiratory muscles, the respiratory
system provides a regulated air pressure that drives the phonation system.
The phonation system essentially consists of the larynx, a structure that includes
the vocal folds and the glottis (the opening between the vocal folds through which air
flows from the trachea to the pharynx). During quiet breathing, the vocal folds are far

10
apart and the air flows relatively freely through the glottis. During phonation, the vocal
folds are brought close together and put under tension (by the co-ordinated action of a
number of laryngeal muscles). The air is thus obstructed, causing air pressure to build up
below the vocal folds, eventually forcing them apart. As air starts to flow through the
glottis the air pressure between the vocal folds drops (due to the Bernoulli effect),
causing the vocal folds to close, whereupon the cycle repeats. The result is a periodic
fluctuation in the superlaryngeal air pressure, which corresponds to a sound with a base
frequency called the fundamental frequency (f0) and many harmonics, which have
frequencies that are whole number multiples of the f0. Any change in the air pressure
directly below the larynx (e.g. due to a change in respiratory function), or the tension and
position of the vocal folds, will affect how the vocal folds open and close, thus producing
variations in the intensity, f0 and the harmonic energy distribution of the sound. For
example, when the vocal folds are under heightened tension and subglottal pressure is
high due to heavy expiratory effort, the vocal folds will close more suddenly, leading to
an increase not only in overall intensity, but also in f0 and the energy in the higher
harmonics (Iwarsson, Thomasson and Sundberg, 1998; Hixon, 1987; Ladefoged, 1968).
Such a vocal configuration might be expected for certain high arousal emotions, such as
anger.
The resonance system, which comprises the rest of the vocal tract, extending from
the glottis, through the pharynx to the oral and nasal cavities, then filters the sound. The
shape and length of the resonance system, which depends on the configuration of the
articulators (the tongue, velum, teeth and lips), determines how certain harmonics are
amplified and others are attenuated, giving rise to a highly complicated, radiated speech
sound. A relatively small number of specific patterns of attenuated and amplified
harmonics, called formants, correspond to the different vowels and vocalised consonants

11
in spoken language (for a more thorough treatment of speech production, see Kent,
1997; Lieberman and Blumstein, 1988). This last stage of speech production, although
under greater voluntary control than the preceding stages, is still susceptible to
involuntary perturbation. The tension of articulator muscles, the tonus of the walls of the
resonance tract and the amount of saliva in the mouth will all have an effect on the
amplitudes and bandwidths of the formants. For example, many speakers have dry
mouths when anxiously giving public presentations, which could be expected to affect
formant amplitudes and bandwidths, although such effects are not yet well understood.
The effects of emotion on speech production
A speaker's emotional state will affect the quality of his or her speech in multiple
ways, from the largely uncontrolled changes to the speaker’s cognitive and physiological
speech production systems which accompany an emotion to the more controlled
adoption of emotion-specific, culturally accepted speaking styles. Any study on
emotional speech thus needs to consider the multiple determinants of vocal affect
expression.
Affective pragmatics
In parallel with the development of spoken language, formalised, prototypical ways
of expressing emotions or at least emotional attitudes (such as sarcasm and curiosity)
have been established. These affective representations, which could be termed “affective
pragmatics”, are partly determined by cultural norms, such as rules governing politeness
and etiquette in speech, and thus probably vary across cultures and social contexts. In
certain social situations speakers might attempt to control or mask the "natural"
expression of their internal affective state (e.g. Tolkmitt and Scherer, 1986). For
example, whereas vocal expressions of joy uttered amongst familiar friends might be
highly animated and loud, the same experienced emotion amongst strangers is likely to
12
lead to a more subdued emotional expression. Another example of a pull effect is the
manner in which speakers accommodate to their speaking partners to maintain, increase
or decrease communicative distance. The Communication Accommodation Theory of
Giles (e.g. Giles, Coupland and Coupland, 1991) suggests that a speaker’s
communicative style, and thus presumably their speaking style and vocal characteristics,
will converge or diverge with that of their speaking partner, depending upon the
relationship between the two individuals (e.g. Willemyns, Gallois, Callan, and Pittam,
1997). Affective prosody is also enlisted for strategic social aims, such as inducing
favourable behaviours in cohorts or social partners (Scherer, 1988).
It is worthwhile noting, however, that affective pragmatics are most likely not
arbitrary acoustic emotional codes. As pointed out by Scherer (Scherer, 1986; Johnstone
and Scherer, 2000), such affective signals almost certainly evolved from more
involuntary push effects of emotion on speech, and though the form of such expressions
might have been shaped through evolutionary pressures, they are unlikely to have strayed
too far from their origins, since in doing so they would lose their legitimacy. Indeed, one
of the striking things about posed emotional expressions is that they convincingly
communicate the real emotion of the speaker. This last point notwithstanding, the
research presented in this thesis, being concerned primarily with push effects, was
designed to eliminate or control for these more socially-mediated aspects of emotional
expression in speech.
Cognitive and attentional constraints
The production of speech starts with the cognitive processes underlying the
planning of the content and structure of what is to be said, and activation of the motor
commands responsible for driving the speech production systems to produce the
appropriate sounds. Although the planning of utterance content and structure is a largely

13
automatic, implicit process, it also draws upon limited capacity, attentional and working
memory resources, making it susceptible to interference by extraneous information or
processes that also use the same or overlapping resources (Schneider and Shiffrin, 1977;
Shiffrin and Schneider, 1977; Levelt, Roelofs and Meyer, 1999; Baddeley, 1986; Roberts
and Kirsner, 2000). The result of such interference will be a change to speech fluency, as
well as possible articulatory changes. For example, Lively, Pisoni, Van Summers and
Bernacki (1993) showed changes to amplitude, F0, speaking rate and spectral tilt in
response to manipulations of cognitive workload placed on speakers.
There are a number of reasons for believing that emotional situations impose
demands on attention and working memory. The presence of new and unexpected,
potentially significant information has been shown to lead to an orienting response and
refocusing of attention towards the novel stimulus (Sokolov, 1963; Öhman, 1992). This
fits with the common experience of halting one’s speech momentarily when surprised.
Emotions such as anxiety seem to adversely affect speech planning and execution, as
indicated by reduced speech fluency (Tolkmitt and Scherer, 1986; Scherer, 1986). A
large body of literature has shown that anxiety-vulnerable people show a cognitive
processing bias towards threatening stimuli that impacts on their performance of
unrelated tasks (MacLeod and Rutherford, 1998; Mathews and MacLeod, 1994). The
classic demonstration of this is the emotional Stroop task, in which subjects are asked to
name the colours of words presented to them in sequence. Colour naming latency,
recorded as a measure of performance, is found to be longer for threat-related words
than for non-threat related words for subjects high in trait anxiety (see MacLeod and
Rutherford, 1998). The explanation is that the threat related words are automatically
preferentially attended to and processed in high anxiety subjects, interfering with the
colour-naming task.

14
Although such effects have not been consistently found for people with average
trait anxiety but with high state anxiety, the results of Tolkmitt and Scherer (1986)
would seem to indicate that state anxiety can still impact on speech planning by causing
the reallocation of attention and working memory resources to the processing of other
incoming information. In contrast, the impact of other emotions on speech planning is
less clear. Experiments such as the emotional Stroop task conducted with depressed
subjects have failed to show a similar processing bias (MacLeod and Rutherford, 1998).
This result is consistent with the limited evidence showing no increase in speech
disfluency for sad speakers (e.g. Banse and Scherer, 1996; Scherer, 1986), although
Ellgring and Scherer (1996) did find that an increase in speech rate and a decrease in
pause duration corresponded to a decrease in negative mood in depressed patients after
therapy. It is feasible that some emotions, such as sadness, might even be characterised
by an improvement in speech fluency (relative to the absence of emotion) through the
withdrawal from external stimulation and thus the minimisation of extraneous processing,
although such a hypothesis is speculative. It must also be noted that any possible
disruptive effects of emotion on speech planning will depend upon the content of the
speech. Well-practised phrases are likely to be planned and executed largely
implicitly/automatically, and thus will not be as susceptible to interference as novel
phrases, which require more explicit planning and are thus more dependent on limited
working memory resources.
Physiology
The three speech production systems act under the control of both the autonomic
nervous system (ANS) and somatic nervous systems (SNS). Whilst motor programs for
the production of spoken language, and presumably affective pragmatics, control speech
production primarily through the SNS (albeit largely unconsciously), the state of the

15
three systems is also affected by both SNS and ANS activity which is not speech-related,
but rather seeks to maintain the body in a state which is optimal for biological
functioning (a process termed homeostasis). The respiratory system is under the
influence of control mechanisms that ensure a sufficient supply of oxygen to, and
discharge of carbon dioxide from the body. The striated musculature, which is
instrumental in controlling breathing, larynx position, vocal fold position and tension, and
articulator position, is also influenced by actual and anticipated motor needs. Muscles of
the mouth and lips, which change the length and shape of the vocal tract, are also used
for facial expression. Saliva and mucous production, which affect the resonance of the
vocal tract, depend on parasympathetic ANS activity related to digestion.
In situations where the body is in a relatively stable, unchallenging situation,
homeostatic requirements do not place restrictive constraints on the functioning of
speech production systems. Thus when we speak in everyday life, breathing can be
optimised for producing a sustained subglottal pressure in order to vocalise at a well
controlled intensity and f0 over the duration of a phrase or sentence, without
compromising respiratory requirements (Bunn and Mead, 1971; Shea, Hoit and Banzett,
1998). Likewise, the striated musculature can flexibly adapt to the requirements of
speech production, thus producing precise articulation and clear vowel and consonant
sounds. When an organism is placed in a situation of great significance for its continued
wellbeing, however, as is the case with emotional situations, the influence of the emotion
response system upon the three speech subsystems becomes more important. Many
emotion psychologists maintain that emotions are accompanied by adaptive responses in
the autonomic and somatic nervous systems that serve to prepare the body for necessary
action, such as fight or flight (Cacioppo, Klein, Berntson, and Hatfield, 1993; Levenson,
Ekman, Heider, and Friesen, 1992; Öhman, 1987; Smith, 1989; Stemmler, 1996). If this

16
is the case, it follows that emotional situations might provoke a pattern of physiological
changes that perturbs the speech production systems in some nonarbitrary, differentiated
manner. For example, with an emotion such as rage, preparation for conflict might
produce increased tension in skeletal musculature coupled with greater respiratory depth,
which in turn would provoke a change in the production of sound at the glottis and
hence a change to voice quality (cf. Scherer, 1986). The alternative theoretical position is
that emotions produce a change in general physiological arousal, with the differentiation
between emotions dependent on cognitive, rather than physiological factors (e.g.
MacDowell and Mandler, 1989; Schachter and Singer, 1962). A fundamental question
addressed by this research is whether the physiological changes that accompany different
emotions, and hence the provoked changes in associated acoustic parameters, reflect
simply a single arousal dimension or differentiate more specifically amongst emotions. In
addressing this question it is useful to briefly discuss the results of previous empirical
studies of the acoustic properties of emotional speech.
Evidence on Acoustic Characteristics of Emotional Speech
It is not necessary to provide herein a detailed review of previous empirical studies
that have measured the acoustic properties of emotional speech, since such reviews have
been made by Frick (1985), Scherer (1986), Pittam and Scherer (1993) and Banse and
Scherer (1996). In this section a brief summary of the major findings for the most
commonly studied emotions3 is provided. This section assumes a basic knowledge of
acoustic speech analysis – the reader unfamiliar with speech analysis is referred forward
to chapter two of this thesis which includes a review of the main principles of acoustic
analysis, in particular how they pertain to the study of emotion in speech.

17
Stress
Although stress is not a single, well-defined emotion, it is useful to start this
overview with a look at research on the acoustic indicators of psychological and
physiological stress, which were, until recently, the focus of more research in speech
science than specific emotions. High stress or high mental workload conditions have
generally been found to lead to raised values of fundamental frequency (F0), high
intensity and fast articulation (as indicated by low utterance duration). Stress-induced
variation in the position or precision of formants has also been reported in some studies.
The results for speech under stress are difficult to interpret, however, as changes to these
parameters depend on factors such as the speaker’s susceptibility to stress and their
coping strategy faced with a stressful situation, as well as the type of stress (e.g.
cognitive or emotional; see Tolkmitt and Scherer, 1986). Indeed, the term “stress” has
typically been used in a haphazard way, and is probably too broad a concept to be useful
in the empirical study of emotional speech. For example, the term “stress” has been used
to describe the state of speakers in situations likely to cause anxiety, frustration or mental
challenge, three states that might well have very different vocal expressions.
Anger and irritation
In general, an increase in mean F0 and mean intensity has been found in angry
speech. Some studies also show increases in F0 variability and in the range of F0 across
the utterances encoded. Considering that mean F0 is not a singular acoustic measure, it is
not clear whether angry speech has a higher F0 level or a wider range of F0 or both. It is
possible that those studies that have found increased F0 range and variability have
measured "hot" anger, or rage, whereas those studies in which these characteristics were
not found may have measured "cold" anger, or irritation, as found by Banse and Scherer
(1996). F0 contours tend to be downward directed and articulation rate is generally

18
increased for hot anger. Anger also seems to be characterised by an increase in high
frequency energy that, together with the increase in intensity, possibly reflects greater
vocal effort leading to more energy in the higher harmonics.
Fear and anxiety
Expected high arousal levels for fear are consistent with convergent evidence
showing increases in intensity, mean F0 and F0 floor. The results for F0 range are less
consistent, with some, but not all, studies finding F0 range to be large for fearful speech.
As with anger, the increased intensity of fearful speech accompanies an increase in high
frequency energy. Rate of articulation is also higher. Related emotions such as anxiety or
worry also show faster articulation, but data on the other variables is less consistent.
Some studies have found an increase in mean F0, but one notable study which made a
clear distinction between fear and anxiety (Banse and Scherer, 1996) reported a decrease
in mean F0, F0 floor and F0 range for anxiety. A decrease in intensity for anxious speech
has also been reported.
Sadness
As with fear, the findings converge across the studies that have included this
emotion. Decreases in mean F0, F0 floor, F0 range, and intensity are usually found, as
are downward directed F0 contours. Corresponding to the decrease in intensity, voiced
high frequency energy seems attenuated, indicating weaker higher harmonics. Rate of
articulation also decreases for sadness. Most studies reported in the literature seem to
have studied the quieter, resigned forms of this emotion, rather than the more highly
aroused forms such as desperation, where correlates reflecting arousal are found, such as
increased intensity, increased F0 floor and increased high frequency energy.
19
Joy and contentment
Joy is one of the few positive emotions frequently studied, most often in the form
of elation rather than the more subdued forms, such as enjoyment or happiness.
Consistent with the high arousal level that one might expect, there is a strong
convergence of findings of increases in mean F0, F0 floor and intensity. F0 range and F0
variability are also found to increase. There is also inconclusive evidence for an increase
in high frequency energy and an increase in the rate of articulation. Quieter forms of the
emotion, such as contentment, seem to be characterised by relaxed vocal settings,
leading to low mean F0, low F0 floor, lower intensity, slower articulation and weaker
higher harmonics.
Disgust
As noted by Scherer (1989), the results for disgust tend not to be consistent across
the encoding studies. The few that have included this emotion vary in their induction
procedures from actor simulation of the emotion to measuring disgust (or possibly
displeasure) to unpleasant films. The studies using the former found a decrease in mean
F0, whereas those using the latter found an increase of mean F0. Even within studies,
little consistency in the acoustic characteristics of digested speech has been found,
implying that disgust is simply not well encoded by speakers. This conclusion is echoed
in the decoding literature (see Johnstone and Scherer, 2000), where disgust is universally
reported to be poorly recognised in speech.
Boredom
Bored speech is generally slow and monotonous, with low F0 floor, low F0 range
and variability and slow rate of articulation. Interested speech tends to be the opposite,
with large F0 range and increased speaking rate.

20
It is evident from this brief overview that where there is considerable consistency in
the findings, it is usually related to arousal, regardless of the specific quality of the
emotion under investigation. Thus rage, joy and fear, all high arousal emotions, are
expressed with similar vocal profiles, marked by high F0, F0 range or variability, and
intensity. Few, if any, of the studies found acoustic patterns that could differentiate the
major non-arousal dimensions of emotional response such as valence and control. This
should not, however, be taken as evidence that discrete emotions are not differentiated
by vocal cues. Indeed, given the high recognition of emotions in acted speech measured
in perception studies, there is reason to believe that emotion-specific acoustic patterns
exist.
Problems with previous empirical research
There are several problems with the design and execution of previous studies of
affective prosody that might explain why such acoustic patterns which differentiate
emotions with similar arousal have not yet been consistently found, and which I have
attempted to address in this research:
Acted versus real emotional speech
It is possible that the high recognition rates in perception studies reflect the fact
that in such studies, acted emotional speech has always been used. Such acted emotional
expressions at least partly reflect the adoption of social or cultural vocal stereotypes,
termed “pull effects” by Scherer (1988, 1992). In perception studies this might lead to
artificially high recognition rates, as the purpose of acting is, after all, to communicate a
desired speaker-state to an audience. Real emotions, in contrast, are likely to be
accompanied by changes in the vocal signal which serve no intentional communication
purpose, but instead reflect uncontrolled changes to the underlying physiology of speech
production that accompany an emotion (termed “push effects” by Scherer, 1988, 1992).

21
If “real” emotional speech, reflecting the push effects of emotion, were to be judged,
emotion recognition scores might be much lower, consistent with the speech
characteristics varying on a single dimension of arousal. Unfortunately, the few studies
that have attempted some sort of real emotion induction (e.g. Alpert, Kurtzberg and
Friedhoff, 1963; Duncan, Laver and Jack, 1983; Simonov and Frolov, 1973), or that
have measured “real life” speech recordings, have also been limited almost completely to
bipolar inductions, such as high/low stress, or happy versus sad, and thus unsurprisingly
have arrived at an arousal explanation for the vocal changes measured. The question of
whether the push effects of emotion on speech are limited to the unidimensional effects
of general arousal, or if more differentiated emotional vocal profiles exist, is the central
question of this research. To address this question, the relatively new technique of using
computer games and tasks to induce a range of real emotional vocal responses (as
described in chapter two) was used in this research.
Acoustic parameters measured
Another possible reason for inability of previous research to identify acoustic
markers of similar arousal emotions is that the number of acoustic parameters that have
been measured in most previous studies is very small. Furthermore, the relatively simple
acoustic measures employed preclude a finer level of emotion differentiation, because
they tend to be exactly those measures that are most affected by physiological arousal. A
study by Banse and Scherer (1996) on the acoustic properties of acted emotional speech
demonstrated, however, that by using a greater range of acoustic parameters, one can
achieve a sizeable increase in the discrimination between different expressed emotions, as
measured using techniques such as discriminant analysis. Further improvements should
be possible through greater refinement of the acoustic parameters. For example, it
remains unclear how the measures of average voiced spectrum used by Banse and

22
Scherer relate to either vocal tract or glottal waveform characteristics. Measurement of
the glottal waveform in conjunction with the voiced spectrum would provide better
understanding of the underlying processes involved in emotion encoding. Indeed,
ongoing research which makes use of more sophisticated analyses such as formant
analysis, spectral and cepstral analysis, intonation scoring, and inverse filtering of the
speech signal to arrive at an estimate of the glottal waveform, looks very promising
(Bachorowski and Owren, 1995; Klasmeyer, 1998; Klasmeyer and Sendlmeier, 1997;
Moziconacci, 1998; Sobin and Alpert, 1999). A number of these techniques were applied
to the analysis of speech recorded in this research.
Theory based research
Perhaps the most fundamental problem that has hampered research into emotional
speech is the lack of a coherent theoretical framework that would serve to structure
empirical investigation, particularly since researchers of emotional speech commonly
approach the topic from quite different backgrounds. Thus while speech scientists bring
to their research sophisticated models of speech production, their research often wants
for a better understanding of emotion psychology. Research by psychologists has
suffered from a lack of sophistication in speech production and analysis. As a result,
much research to date has been difficult to compare and results difficult to assimilate. As
pointed out by Scherer (1986), research needs to be guided by a more thorough
theoretical treatment of the psychology and physiology of emotional speech, starting
with current knowledge of normal speech production.
Models of emotion and emotional speech
A number of detailed reviews of the history and current state of emotion
psychology exist in the scientific literature (e.g. see Cornelius, 1996; Frijda, 1986). This
section presents a brief overview of emotion theory, with an emphasis the various

23
theories’ predictions concerning physiological responses and their subsequent effects on
vocal production.
Darwin (1872/1998) was the first to explicitly recognise the importance of emotion
specific vocal and facial expressions in animals, both in terms of their communicative
importance and as manifestations of bodily changes that were occurring during emotional
episodes. The James-Lange theory of emotion (James, 1884) proposed that emotional
situations give rise to specific ANS and SNS activity that is then perceived by the brain
through a process of peripheral feedback. The perception of specific patterns of
peripheral physiological activity gives rise to the subjective feeling of different emotions.
Cannon (1929) argued against a number of specific parts of the James-Lange theory,
including the idea that emotions have corresponding, differentiated patterns of peripheral
physiological activity. Ever since, theories of emotion have differed with respect to the
issue of the specificity of emotional physiological arousal.
Modern theories of general arousal
The study of emotion was marginalised during the dominant period of
behaviourism during the first half of the 20th century. It wasn’t until the second half of
the century that new impetus was given to emotion research, corresponding with the rise
of cognitivism. The ideas of cognitive psychology prompted Schachter and Singer (1962)
to propose that the physiological arousal that was provoked during emotional episodes
was diffuse and undifferentiated. According to Schachter and Singer, the different
subjective emotional feelings arise when a perception of the increased general arousal is
interpreted in light of the context or situation. Thus when high arousal occurs in a
threatening situation, the arousal is interpreted as fear, whereas when the same arousal
occurs in response to winning a prize, it is interpreted as joy. Although the empirical
evidence for Schachter and Singer’s theory has subsequently been criticised both

24
methodologically and conceptually, arguments against the theory’s main propositions
remain largely theoretical, rather than empirical. In particular, despite much
psychophysiology research, evidence for the existence of emotion-specific physiological
responses remains inconclusive (Cacioppo, Berntson, Larsen and Poehlmann and Ito,
2000; Ekman, Levenson and Friesen, 1983; Davidson, Gray, LeDoux, Levenson,
Panksepp, and Ekman, 1994). A number of dimensional emotion theories, in which
emotions are characterised as existing in a two or three dimensional space, hold that
emotional physiological arousal is essentially non-specific. For example, Mandler
(Mandler, 1975; MacDowell and Mandler, 1989) has proposed that expectancy violation
leads to an increase in sympathetic ANS activity, which is perceived and interpreted in a
manner similar to the proposals of Schachter and Singer (1962), giving rise to
qualitatively different felt emotions.
Modern theories of differentiated physiological response
In contrast with models of non-specific emotional arousal, the theories of Ekman
(1984), Tomkins (1962), Izard (1972) posit the existence of innate neuromotor response
programs for each of a small number of basic emotions (which might also be combined
into “emotion blends” giving rise to a larger number of secondary emotions). According
to these theories, the activation of such a program produces a co-ordinated, emotion-
specific expressive and physiological response. The proposition that a limited number of
biologically innate basic emotions exist, each with a well defined emotional response, is
supported by a number of studies that have demonstrated that a small number of
expressed emotions are well recognised across widely ranging cultures (Ekman, 1972;
1992). Although some evidence exists for emotion-specific physiological responses (e.g.
Ekman, Levenson and Friesen, 1983; Levenson, 1992), it is, however, scarce and
inconsistent. Interestingly, some of the stronger evidence for the existence of

25
differentiated physiological responses comes from studies that have used variations of the
directed facial feedback task (Ekman, 1979). In this task, subjects are instructed to
produce elements of facial configurations corresponding to basic emotions (the
instructions are usually implicit, thus avoiding problems with demand characteristics).
Subjects not only report greater intensity of felt emotion corresponding to the facial
expression produced, but also show replicable effects on ANS activity, presumably due
to feedback between the different response systems (e.g. facial and ANS). These results
have been debated by Boiten (1996) however, who has suggested that the measured
ANS differences reflect the difference in effort required to produce such facial changes.
An as yet untested hypothesis would be that similar mechanisms to those proposed by
Ekman exist linking the ANS and biologically innate programs for emotion-specific vocal
emotion expressions. The research in this thesis, while not directly testing the hypothesis
of “vocal feedback”, should lead to a greater understanding of the links between ANS
activity and the effects of emotion on vocal expression.
Appraisal theories are another set of theories that posit the existence of
differentiated physiological emotion responses. The first cognitive appraisal theories of
emotion were put forward by Arnold (1960) and Lazarus (Lazarus, Averill and Opton,
1970). These early theories were followed up in the 1970’s and 1980’s by alternative
forms of appraisal theory (e.g. Frijda, 1986; Scherer, 1984; Roseman, 1984; see Scherer,
Schorr, and Johnstone, 2001 for an in-depth treatment of appraisal theories of emotion),
which all agree on the basic principal that emotions are produced in response to
evaluations of a situation and its consequences for the organism’s wellbeing and needs.
As pointed out by Gehm and Scherer (1988), there is much correspondence between the
different versions of appraisal theory, in particular with respect to the evaluative criteria,
or appraisal dimensions, which are thought to underlie most emotions. In addition, a

26
number of appraisal theorists discuss in some detail the link between appraisal outcomes
and expressive and physiological responses.
Although appraisal theorists are in broad agreement on the role of cognitive
evaluations in eliciting emotions, there is a lack of agreement over how appraisals
organise emotional responses, including subjective feeling, physiology, and facial and
vocal expression. Smith and Lazarus (1990) make the distinction between a molecular
level of organisation, in which responses are organised at the level of single appraisals,
and a molar level of organisation, in which responses are organised around patterns of
several appraisals or even more holistic "core relational themes" (CRT; Lazarus, 1991;
Smith and Lazarus, 1990). With a molar response, it is the personal meaning attributed
(through appraisal) to the situational encounter that leads to an adaptive response, which
may be considered a type of “affect program” (Smith and Lazarus, 1990, p. 624). Such
an affect program is not inconsistent with the idea of emotion response programs
suggested by basic emotion theorists. In terms of vocal production, emotional responses
organised at the level of core relational themes would be manifest as well defined, CRT-
specific vocal patterns.
Most researchers who have made predictions of the effects of appraisal results on
response patterning have, however, done so at a molecular level, i.e., suggesting specific
effects of appraisal results separately for each evaluation dimension (e.g. Scherer, 1986;
Smith, 1989; Schmidt, 1998; Wehrle, Kaiser, Schmidt and Scherer, 2000).4 Appraisal
theorists have argued that each appraisal dimension provides information to the organism
on how best to adapt to a situation or event and prepare for an appropriate course of
action. Thus the appraisal of a another person’s actions as conducive or obstructive will
lead to preparation for approach or avoidance respectively, whereas appraisal of another
person as being controllable or not might lead to preparation for either fighting or

27
submission respectively. It is the preparation for action that constitutes the emotional
response. For example, preparation for fighting is predicted to include heightened
sympathetic ANS activity and raised skeletal muscle tone, particularly in the upper body
(e.g. Scherer, 1986, p. 154). Such action preparations are predicted to cause
corresponding changes to vocal production, leading to different vocal-acoustic patterns.
Of course, although at least some emotional responses are likely to result from single
appraisal outcomes, it seems likely that most measurable emotional response patterns
will be combinations of single-appraisal responses occurring simultaneously or
cumulatively. It is difficult to envisage ways to empirically test whether an emotional
response occurs as a single, co-ordinated molar response, or as a combination of
molecular responses. Nevertheless, given a molecular level of organisation, one might be
able to find specific acoustic vocal parameters which serve as markers of single
appraisals, much in the same way as eyebrow frown and heart rate changes have been
linked to appraisals of goal obstruction and anticipated effort (Smith, 1989).
The Component Process Theory of emotion
The theory in which the link between appraisal, physiology and vocal expression
has been made most explicit is the Component Process Theory (CPT) of Scherer (1984,
1986). Scherer (1986) has made a number of predictions of how appraisals made by a
speaker will lead to specific physiological changes in the vocal production systems, in
turn causing modulation of particular acoustic parameters in the speech signal. In the
CPT, Scherer proposes that emotional state is the dynamic outcome of a number of
appraisals, termed Stimulus Evaluation Checks (SEC’s; see table 1.1), that a person5
continually makes of their environment. Based upon a consideration of the functional
requirements of different emotional responses, with a strong emphasis on their
phylogenetic development, the theory makes specific predictions of changes to

28
physiological subsystems that correspond to different appraisals. Scherer (1986) has
subsequently used knowledge of the physiology of the vocal production system (e.g.
Daniloff, Schuckers and Feth, 1980), to make predictions of how each appraisal outcome
might modify vocal production and hence the acoustic properties of speech (see Table 4,
p. 156 in Scherer, 1986). Scherer acknowledges that such predictions are speculative,
based as they are on a theory of emotion which proposes a chain of links between the
perception and evaluation of emotion eliciting information and the acoustic changes that
result.
Table 1.1. Summary of SEC’s in Scherer’s Component Process Theory of Emotion
(these descriptions are adapted from Scherer , 1986, p. 147).
1. Novelty check. Evaluating the novelty of the current/expected situation - has a change in the
environment occurred? A novel situation is expected to cause interruption to current activities and lead
to a focusing of sensory attention.
2. Intrinsic pleasantness check. A judgement of whether a given stimulus is pleasant or
unpleasant is made on the basis of intrinsic sensory mechanisms and past experiences. Pleasant stimuli
will tend to elicit approach behaviour, in contrast to the avoidance of unpleasant stimuli.
3. Goal/need significance check. An assessment is made on the relevance of a particular stimulus
to the needs and goals of the organism. Scherer has divided this SEC into four sub-checks, which assess
(1) the goal-related relevance of the stimulus, (2) whether or not it is consistent with expectations, (3)
whether or not it is conducive to achieving the goal or need and (4) how urgently a response is required.
The goal/need significance check is likely to affect organism subsystems involved in preparing the
organism for action, such as those responsible for providing energy and oxygen to the muscles.
4. Coping potential check. The overall ability of the organism to cope with a stimulus is assessed
in four sub-checks. (1) Identifying the cause of the stimulus enables the organism to evaluate (2) how
controllable are its causes or outcomes. Given that the stimulus can or can’t be controlled, the organism
assesses (3) its power to change or avoid the stimulus and (4) the possibility of adjusting to the final
situation. This sequence of sub-checks will influence the type of physiological response prepared for in
the preceding SEC. For example, either a (i)’fight” or (ii)’flight” response could be initiated in the case
of a (i)controllable or (ii)avoidable stimulus which threatens the organism’s goals or needs.
5. Norm/self compatibility check. This check assesses the degree to which a particular situation is
consistent with (1) the organism’s internal standards (i.e. self-image) and (2) the standards imposed by
the organism’s external environment (i.e. cultural expectations and rules).

29
Empirical results discrepant with Scherer's predictions could thus be attributed to a
number of possible shortcomings in the theory, including the way emotional information
is evaluated, the way these evaluations produce physiological responses, the effects of
such physiological responses on vocal production and the manner in which vocal
production is translated into an acoustic signal. Concerning the last two aspects, linking
physiology with vocal production and vocal production with speech acoustics, Scherer is
limited by the state of knowledge in the science of speech production. While much is
known about speech production in highly controlled, normative conditions (typically text
read aloud in a neutral voice), relatively little is known about speech production in more
extreme circumstances. There is still debate over some of the more basic mechanisms by
which speech is produced, such as the way subglottal pressure, vocal fold tension and
vertical larynx position contribute to F0 control. Rather than being treated as falsifiable
hypotheses, Scherer's predictions should thus be seen more as useful principles for
guiding and focussing empirical research, as well as lending theoretical precision to the
terms and concepts used.
The appraisal methodology in speech research
A small number of studies have been performed to test Scherer's predictions
(Scherer, Banse, Wallbott and Goldbeck, 1991; Banse and Scherer, 1996; T.M. Scherer,
2000). The study of Banse and Scherer (1996) differed from previous studies in three
important ways. First, a number of spectral characteristics of the voice were measured
(these parameters reflect both the dynamics of phonation as well as the resonance of the
vocal tract). Second, an effort was made to better define the emotions, with particular
attention paid to the different forms of emotions from within the same emotion family,
such as anxiety and fear, or contentment and elation. Last, the study aimed at testing
theory-driven predictions based upon the CPT.

30
Banse and Scherer found empirical support for many of the directional predictions,
although there remained a number of predictions that were not supported by the data, as
seen in table 1.2. Of particular interest were the results for spectral parameters, since
these aspects of the speech signal had not been extensively studied in previous research.
The prediction of an increase in high frequency energy for anger was supported by
Scherer, Banse, Wallbott and Goldbeck (1991), although the same study indicated no
significant increase in high frequency energy for fear, contrary to expectations. A sub-
analysis of the data from the Banse and Scherer study (Johnstone, Banse and Scherer,
1995) provided evidence that more specific patterns of spectral energy distribution might
be specific to particular emotions. Thus even spectral regions above 1000 Hertz could be
subdivided into regions with different emotion-specific amounts of energy. These more
specific spectral changes would seem to be due mainly to articulation changes than
changes to the voice source, which is usually linked to a more uniform spectral energy
roll off. Perhaps just as important as the results for specific acoustic parameters, Banse
and Scherer were able to demonstrate clear differences in the overall acoustic patterns
(i.e. the combined “profiles” of all acoustic parameters) between emotions, including
between expressions of emotions of similar arousal levels. Such differences were
particularly evident from the results of a discriminant analysis, in which expressed
emotions could be classified statistically with an accuracy well above chance, and in line
with that of human judges.
In this research, an acoustic analysis approach similar to that of Banse and Scherer
(1996) was applied, augmented by the parallel analysis of measures of physiology
thought to be implicated in vocal production.

31

32
Based on the results from the Banse and Scherer (1996) study, one might consider
that the question “what are the vocal characteristics corresponding to expressed
emotions?” is well on the way to being answered. There are, however, a number of
caveats. Most importantly, their study was still based upon actors expressing a number of
discrete emotions. Banse and Scherer did make efforts to obtain acted speech that was as
close to spontaneous emotional speech as possible. Actors were given written
descriptions of scenarios that would commonly elicit the target emotion, and were asked
to imagine the scenarios as vividly as possible, only producing their renditions when they
felt the emotion themselves. The authors claimed that under such conditions, the acted
emotional speech would be highly similar to real emotional speech. Given that it is part
of an actor's job to make their expressions identifiable to their audience, however, it is
likely that such emotional speech reflects affective pragmatics as much as it reflects the
more fundamental effects of physiological emotional responses on vocal production. It is
clear that research examining speech under real emotional situations is still required.
Indeed, the question “what are the mechanisms by which emotion is expressed in the
voice?” has barely been touched upon. If the study of Banse and Scherer did much to
advance the quantitative knowledge of vocal expression of emotion, its results were less
clear with regard to a theoretical understanding of the production process.
Perhaps the biggest problem in interpreting such data is that since the predictions
for each emotion were constructed originally from predictions for a number of individual
appraisals, it is not possible to identify the sources of the discrepancies. Another problem
is that the predictions could be wrong at any of a number of different levels. The
emotion-specific patterns of appraisal proposed by Scherer might not match the actual
patterns, the predictions of physiological changes resulting from each appraisal outcome

33
might be incorrect, or the predicted way in which vocal characteristics depend upon
speech physiology could be at fault.
Nonetheless, by comparing emotions that differ on certain appraisal dimensions, it
is possible to make some inferences about the influence of those dimensions on the voice.
For example, by comparing the profiles for panic and rage, one can arrive at an estimate
of the influence of an appraisal of low versus high coping potential. The observation that
high frequency energy is lower in panic than in rage is consistent with the results for
anxiety and irritation (see Banse and Scherer, 1996). Thus appraisals of high coping
seem to lead to more energy in the high frequencies, which is consistent with greater
respiratory force. Similar pairwise comparisons can be made for certain other appraisals,
such as guilt versus anger for appraisals of accountability, or elation/rage and
contentment/irritation for appraisals of valence. It is clear however, that such inferences
are highly conjectural and should be considered as circumstantial evidence, and as
providing useful hypotheses for further research. To properly isolate the changes to
vocal parameters due to specific appraisals (or specific combinations of appraisals)
requires an experimental design whereby appraisals are at least directly measured, and if
possible, directly manipulated. This is the approach that has been adopted by the research
presented in this thesis.
Summary
In a review of past research on vocal expression of emotion this proposal has
highlighted a number of problems concerning the use of acted instead of real emotional
speech, the limited set of acoustic parameters studied, and the failure to adopt a suitable
theoretical basis for hypothesis driven research. These deficiencies have made it difficult
to conclude one way or the other whether emotional speech is characterised by clearly
differentiated, emotion specific acoustic patterns. While there is a limited amount of

34
evidence supporting this proposition, it comes mainly from studies using acted speech.
Studies which have examined real, or induced emotional speech, seem to favour the view
that the acoustic correlates of emotion represent the single dimension of arousal, but
have not included a number of acoustic parameters which might be expected to
differentiate between emotions of equal arousal. In the following section, the
experimental plan that was designed to address these problems is outlined and justified.
Overview of this research
This thesis describes a series of experiments that were designed to induce real,
albeit low intensity, emotional responses in participants, with the aim of measuring the
resulting changes to voice production. In light of the difficulties in recording and
analysing “real life” emotional speech and the questions surrounding the ecological
validity of actor portrayals of emotion, this project made use of interactive computer
games and tasks to elicit emotional responses. Using appraisal theory of emotion,
specifically the CPT of Scherer (1984, 1986) as a guide, the games and tasks were
manipulated along specific evaluative dimensions that are thought to lead to emotional
responses. Participants were prompted throughout the tasks and games to pronounce
standard-content phrases, which were recorded for subsequent acoustical analysis. The
subjective emotional state of participants in response to game and task manipulations
was measured by means of subjective rating scales. In the last two experiments, a number
of physiological recordings were also made. These were intended to serve as independent
indicators of emotional response, as well as providing evidence concerning the
physiological mechanisms underlying any observed acoustic changes.
The complexity of the speech production system, together with the relative lack of
knowledge of the processes underlying emotional expression and the psychophysiology
of emotion, made it impractical for these studies to be based primarily upon the testing of

35
well developed, concrete hypotheses. Well-developed theories of emotional vocal
expression that make few unsubstantiated assumptions that could be used to generate
such hypotheses simply do not exist. Rather, the approach used in this research paralleled
that used in much of speech science, with a focus on the quantitative description of the
acoustic properties of speech under specific conditions. On the basis of results from the
first experiments, hypotheses were developed that could then be tested in later
experiments. In addition, the acoustic changes observed for different induced emotions in
these experiments were compared with previous findings for acted emotional speech.
Some hypotheses were nevertheless addressed in this thesis. Most fundamental,
both with respect to the vocal expression of emotion and debates on the specificity of
emotional response patterning in general, is the hypothesis that changes to the acoustic
characteristics of speech reflect simply the unidimensional effects of physiological arousal
on speech production. To examine this hypothesis, a number of emotional states and a
number of acoustical parameters were measured. It is only by measuring a more
complete set of acoustical parameters than has typically been the case in previous
research that this hypothesis can be tested. Given an arousal mechanism as the cause of
acoustical changes, one would expect the parameters to covary in a systematic manner
across all emotional states. Lack of such a covariance would indicate that other
mechanisms, which affect each parameter differently, are at play.6
The CPT of Scherer also provides a number of hypotheses that were directly
addressed by this research. As stated previously, when such hypotheses are not
supported by the data, it is difficult to pinpoint the cause of the discrepancy. As such, the
hypotheses are not falsifiable in the strict sense. However, given the pressing need for
theoretical development in the area of emotional vocal expression, it seems worthwhile

36
to make use of such theory and hypotheses as exist, with the aim of finding weaknesses
in the theory on the basis of a comparison with the empirical data.
The first experiment was designed to examine changes to the voice corresponding
to two types of event in an interactive computer game, chosen to provoke different
probable appraisal outcomes on the most fundamental appraisal dimension in Scherer's
CPT, goal congruence. In addition, the sound accompanying each event was manipulated
so as to provoke a probable appraisal of high or low intrinsic pleasantness. Immediately
following the game events, players were prompted to give a spoken report of the
preceding event, using a given standard phrase. Digital recordings of players' speech
were analysed, and differences in their acoustical properties compared between the four
conditions.
The second experiment was designed to test hypotheses based on the results for
goal congruence obtained in the first experiment, and to extend the general approach to
an examination of another important appraisal dimension, coping potential. In addition,
subjective reports of the player's emotional state, as well as a number of physiological
variables, were measured at each manipulated event. Results from acoustical analyses
were statistically compared over manipulated appraisal conditions. Subjective, acoustic
and physiological variables were statistically analysed, both to test whether converging
measures of emotional response could be found, and whether these measures differed
across manipulated appraisal conditions.
The third experiment addressed a number of methodological problems apparent in
experiment two. Given the lack of acoustic differences observed between the
manipulated appraisal conditions, a new computer task was designed to elicit emotional
responses in a more controlled manner. In addition to physiological measurements,
electroglottal measurements were synchronised with vocal recordings, thus allowing a

37
more precise characterisation of the opening and closing of the vocal folds. The
electroglottal measurements were compared both with F0 measures and spectral
measures in an effort to understand the basic mechanisms responsible for F0 and
harmonic modulation in emotional speech.
1 The term “prosody” is used throughout this thesis to refer to the broad range of
suprasegmental, nonverbal aspects of speech, including intonation, voice quality and
aspects of speech fluency such as syllable duration and number and type of pauses.
2 The distinction between paralinguistic and non-linguistic prosody is subtle and rarely
well-defined. “Paralinguistic” usually refers to those prosodic features that compliment
the linguistic content of an utterance, without being inextricably bound to linguistic
form. For example, when a speaker adopts a sarcastic “tone of voice”, suprasegmental
aspects of speech are altered in such a way as to indicate that the speaker’s intentions
are in fact opposite to the verbal content of the utterance. Paralinguistic prosody is
usually under volitional control and may be learned as part of a culture’s set of speaking
norms. In contrast, non-linguistic prosody encompasses the range of suprasegmental
variations in speech that bear no connection to the verbal content. Nonlinguistic
prosody is often unintentional and may be largely invariant across cultures.
3 The actual choice of emotions studied in much previous research has been relatively
arbitrary, motivated by the interests of the individual researchers (e.g. clinical,
technological) rather than by theoretical concerns.
4 Researchers who have used linear statistical techniques to predict subjective feeling
from appraisal profiles (e.g. Frijda, Kuipers, and ter Schure, 1989; Ellsworth and
Smith, 1988a,b) also seem to implicitly assume that the effects are due to single
appraisal dimensions and their additive effects.
5 In fact, the component process model of emotion has been proposed as applying not
only to humans but at least to higher primates, and possibly animals in general. One of
the claims of the theory is that the vocal expression of affect in humans can be traced
back to origins common to many animals, and has evolved continuously since (Scherer
and Kappas 1988, Scherer 1989).

38
6 This line of reasoning actually makes some assumptions about monotonic relationships
between underlying mechanisms and measurable acoustic parameters, which will be
discussed in chapter 3.

39
2. Methodological issues
Acoustic analysis of emotional speech
In principle, the encoding of emotion in the voice can be measured at any one of a
number of stages, from the physiological changes in various parts of the vocal
production system to the perceptual judgement of vocal quality by a listener. The
decision of which stage (or stages) is most suitable depends on the specific research
project and its goals. In order to be able to integrate and compare data from both vocal
encoding and decoding studies however, measurement of the physical (i.e. acoustic)
properties of the propagating speech sound is most appropriate. Techniques of acoustic
measurement and analysis are also well developed and can be applied using relatively
inexpensive, readily available equipment. Many acoustic measures of human speech and
vocal sounds have fairly well understood relationships with the perceived aspects of
speech. Although the relationships between the physiology of speech production and the
resulting acoustic signal are less clear, there exists a large and rapidly expanding
literature on the subject (see Borden and Harris, 1994, for an overview of speech
production and perception). Acoustic analysis thus allows an objective comparison of
studies of emotion encoding in speech with those focused on the decoding, or perception
of expressed emotion.
Since speech is a rapidly changing, dynamic signal, most standard acoustic
variables are measured over very short speech segments over which it can be assumed
that the signal is relatively stable. These segments might correspond to theoretically
significant speech features, such as phonemes, diphones or syllables, or alternatively
might be chosen for reasons pertaining to the mathematics and practicalities of signal
analysis. The measurement of short speech segments is well adapted to research on the

40
linguistic content of speech, since the phonemic content is itself transmitted in short
quasi-stable segments. The emotional modulation of speech, however, is expected to be
largely suprasegmental, since the physiological changes thought to underpin emotional
speech are relatively slow1. Most research on emotional speech has thus aggregated the
short-term acoustic variables over longer time frames (typically single or multiple phrases
or sentences) to obtain long-term, suprasegmental measures.
For the sake of this discussion, the acoustic measures of speech have been
subdivided into four categories: time-related, intensity-related, fundamental frequency-
related and more complicated spectral parameters. The first three categories are linked
mainly to the perceptual dimensions of speech rate, loudness and pitch respectively,
whilst the fourth category has more to do with perceived timbre and voice quality. The
following section presents a brief introduction to the four acoustic categories and their
associations with speech production and perception; many texts offer a more detailed
treatment of the acoustics of speech (e.g. Borden and Harris, 1994; Deller, Proakis and
Hansen, 1993).
Time-related measures
The speech signal consists of a temporal sequence of different types of sounds
(those corresponding to vowels, consonants, interjections) and silence, all of which can
be carriers of affective information. In practice, however, there exist no clear guidelines
as to which basic units of vocal sound are most appropriate for the analysis of emotional
speech. The most conceptually simple time-related measures of speech are the rate and
duration of both vocal sounds and pauses, which are expected to vary for different
expressed emotions. Past research has been limited mostly to measures of overall phrase
duration and word rate. Such measures either require that the same phrases are
compared across emotions, or that a long enough sample of speech, containing multiple

41
phrases, is measured (in such long speech samples, the duration and word rate
differences due to different phrases average out). Similar considerations also exist for
measurements of silence. In this research, measures of phrase duration were combined
with proportional measures of the duration of voiced (i.e. voiced consonants and
vowels), unvoiced (i.e. voiceless consonants, other non-vocal sounds) and silent (i.e.
background noise) segments of the speech signal, and compared across experimental
conditions.
Intensity-related measures
The acoustic measure that most closely correlates with the perception of the
loudness of speech is intensity2. Intensity is a measure of the power of a speech signal,
and reflects both the sound produced at the glottis, and the amplification and attenuation
of harmonics in the vocal tract. It thus varies as a function of vocal effort and tract
resonance, both of which might be altered by the effects of emotion on physiology. For
example, greater expiratory force, perhaps corresponding to preparation for a fight
response, will tend to increase speech intensity by increasing the intensity of sound
produced at the glottis. A lack of saliva corresponding to fear will lead to diminished
formant amplitudes, thus decreasing speech intensity. The dependence of speech intensity
on these two separate mechanisms implies that the interpretation of speech intensity
changes with emotion in terms of underlying mechanisms is difficult. Ideally, intensity
changes need to be compared with other aspects of the speech signal, such as its spectral
composition and, if possible, its glottal source waveform. By examining intensity in
combination with these other speech features, it should be possible to better understand
the source of intensity changes. This is the approach that was adopted in this research.

42
Fundamental frequency-related measures
One of the most frequently used vocal cues is fundamental frequency, measured in
cycles per second, or Hertz (Hz). F0 is the rate at which the vocal folds open and close
across the glottis, and strongly determines the perceived pitch of the voice. It varies
continuously and often quite rapidly, as a function of both linguistic and paralinguistic
aspects of speech, as well as totally non-linguistic physiological changes. Over the course
of a phrase or utterance, F0 can be quantified in terms of its average level or its “resting”
level, and the amount in which it varies over time.3
A theoretically motivated measure of the resting level of F0 is F0 floor, defined as
the lowest F0 value in an utterance.4 F0 floor is primarily determined by the tone of the
laryngeal musculature, in particular the vocal folds, with increased tension leading to
higher F0 floor. It is thus reasonable to expect that any changes to laryngeal muscle tone
produced as part of an emotional SNS response will have a significant impact on F0
floor. Those emotions characterised by elevated muscle tone, most notably anger and
fear, are likely to produce speech with elevated F0 floor, while emotions with relaxed
muscle tone, such a sadness, will show low F0 floor. Although mean F0 has been used in
a number of studies of vocal affect as a measure of the average, or resting level of F0, its
value really reflects the combined effects of F0 floor and F0 range, and thus might not
add usefully to an analysis which already includes these variables. If a measure of central
tendency of F0 is desired however (e.g. to facilitate comparison with previous studies),
median F0 is a more suitable measure than mean F0, given that the distribution of F0 is
often skewed and extremely high F0 outliers caused by F0 estimation errors or highly
irregular glottal cycles are more common than low F0 outliers.
One measure of F0 variability is F0 range, which is most simply quantified as the
difference between the lowest and highest F0 values occurring over the course of an

43
entire utterance. Alternatively, F0 variance, which is correlated with F0 range but also
depends on the temporal variability in F0 at shorter time scales, such as those
corresponding to syllables, can be measured. Both F0 range and F0 variance depend on
both pragmatic and affective-physiological factors. Since adjustments to F0 are the
primary carriers of linguistic and paralinguistic intonation, both these parameters vary to
a large extent with the linguistic content of the utterance, as well as with pragmatics
(including affective pragmatics). Such linguistic and pragmatic changes to F0 are
mediated by coordinated adjustments to vocal fold tension, vertical larynx position and
subglottal pressure. The effects of emotion on F0 variation are difficult to predict.
Emotional changes to muscle tone are likely to be tonic, and thus affect F0 level as
described above, rather than F0 variation. It is possible that the major physiological
mediator of emotional changes to F0 range and F0 variance is expiratory force. An
example is the case of angry utterances, in which powerful expiration will lead to an
eventual drop in subglottal pressure (due to exhaustion of the air supply in the lungs),
causing a corresponding drop in F0. Conversely, rapid, shallow breathing, as might be
expected in fear, should not lead to such differences in subglottal pressure, and hence
fearful speech might be expected to exhibit lower F0 range and variance.
In this research, all the aforementioned F0 parameters were measured, both in
order to compare results with those previously obtained, as well as to assess their
relative independence, and thus their expected utility in future studies of emotional
speech.
Another F0-based acoustic parameter that has been found to change with anxiety
and stress is jitter, which is the extent to which the fundamental period (i.e. the time for
the vocal folds to open and close once) varies rapidly and randomly from one vocal cycle
to the next (e.g. Smith, 1977). Based on physiological, acoustical and empirical evidence,

44
the mechanisms that have been suggested to underlie jitter, namely micro-tremors in
relaxed skeletal muscle, are questionable (Smith, 1982; Fuller, 1984; Hollien, Geison and
Hicks, 1987). The reliability of jitter measurements is also difficult to determine,
primarily because accurate measurements of fundamental period are difficult to make on
the basis of the acoustic speech signal, and since period measurements have to be
adjusted to allow for (i.e. eliminate) slower movements in F0 due to intonation. In this
research, jitter was measured in the third experiment, when the availability of
electroglottal equipment made the extremely accurate measurement of vocal fold
opening and closing possible.
Spectral measures
Many changes to the vocal tract that are postulated to accompany different
emotions, such as changes to articulator muscle tension and salivation, will lead to
changes in the amount of resonance (formant amplitudes) and the range of frequencies
amplified (formant bandwidths). Other changes such as those to expiratory force and
tension of the laryngeal muscles are postulated to affect the way in which the vocal folds
open and close, and hence affect the spectral slope of the sound produced at the glottis.
Such changes to glottal spectral slope will also be manifest in the frequency spectrum of
the final speech signal. The major difficulty that thus needs to be solved in the spectral
analysis of speech is separating the characteristics of the glottal waveform from the
resonant characteristics of the vocal tract and articulators. If certain approximations
about the linearity of and interactions between the glottal and resonance systems are
made, it is possible to estimate the vocal tract filter characteristics and, through a process
of inverse filtering, the glottal excitation, from the acoustic speech signal. This approach
has been widely used in speech research to estimate formants and the glottal waveform
(e.g. Fant, 1979a, 1979b, 1993; Rothenberg, 1973).

45
Unfortunately, estimation of the formants of speech with such techniques is a time
consuming process riddled with methodological pitfalls, which has rarely been applied to
the study of affective speech. In particular, accurate estimation of the formants requires
that low noise, linear recordings of speech are made, with no phase distortion. In
addition, estimation of formants in spontaneous speech is made less reliable due to the
rapidly varying characteristics of vocal tract resonance. Often the formant estimates can
vary greatly as a function of the specific parameters that are entered into the estimation
program (e.g. number of poles in an all pole model). For these reasons, formant analysis
was not applied to the study of emotion in this research.
The aim of glottal waveform analysis is to quantify aspects of the glottal
waveform which can be directly related to the physiology and mechanics of the opening
and closing of the vocal folds. Its close relationship to glottal physiology makes it a
promising candidate for studies on affective speech. Because the same linear predictive
technique as used in formant estimation is used to estimate the glottal waveform, the
estimate suffers from the same limitations as formant estimates. Specifically, the form of
the glottal wave, from which one would like to estimate parameters such as the glottal
opening time and closing time, is highly sensitive to both analysis input parameters and
recording conditions. Phase distortion during recording is particularly likely to affect
estimates of glottal opening and closing times. However, it is possible that more global
spectral measures of the glottal waveform estimate are relatively robust and might thus
yield useful information about glottal changes accompanying emotion. Some such
measures, such as the ratio of F1 to F0 and the spectral slope of the glottal spectrum
have been used as indicators of voice quality (Klatt and Klatt, 1990). These measures
have thus been included in the present research in an exploratory manner, primarily to
see if such measurements are reliable enough to be of use in future research on emotional

46
speech. In the last experiment, these measures were compared with more direct measures
of glottal opening and closing characteristics obtained using electroglottography (EGG).
The list of acoustic measures described above is certainly not comprehensive. In
addition to using the various types of acoustic measures individually, more complex
variables can be obtained by combining two of the three dimensions. Thus, Scherer and
Oshinsky (1977) used variations in the vocal envelope, a measure that combines the
amplitude and time dimensions, in studying the attribution of emotional state by judges.
Although studies are relatively scarce, there is evidence that the temporal pattern of F0
change, that is the form of the intonation contour, may also play an important role in the
communication of affect (Cosmides, 1983; Frick, 1985; Mozziconacci, 1995;
Mozziconacci and Hermes, 1997; Uldall, 1960). The decision not to include these and
other possible acoustic measures in this research was based primarily on the lack of
hypotheses concerning their connection to the involuntary effects of emotional responses
on voice production (this is particularly true for emotional intonation patterns, which
most likely reflect affective pragmatics, cf. Scherer, Ladd and Silverman, 1984; Ladd,
Silverman, Tolkmitt, Bergmann and Scherer, 1985), as well as practical problems with
their measurement for large numbers of speech samples from different speakers.
Real or induced emotional vocal expressions
Probably the major reason for the relative lack of emotional speech studies that
have used emotion induction techniques rather than acted speech is the difficulty of
inducing emotions in controlled, laboratory settings. Martin (1990) provides an overview
of the techniques that have been used to induce emotions in the laboratory. These include
having subjects read and try to imagine emotional stories, view emotional pictures, listen
to emotional music, watch emotionally provoking films as well as self-generated
techniques such as imagination and recall of past emotional events. A number of

47
problems exist with such methods, however. A common problem with all of these
methods is that ethical constraints prevent anything but the induction of low magnitude
emotions, which may not provide sufficient power for their differentiation on the basis of
vocal cues. It is difficult to see how this problem could be solved by any laboratory
technique – examination of anything but mild emotional states is probably limited to
either acted emotions, or observational studies of real life events, with the obvious
limitations in control and the sound quality of speech recorded.
Besides the limitation to low intensity emotions, however, there are other problems
more specific to particular induction techniques. Many of the techniques are essentially
passive, with the subject not actively participating as would normally be the case in
emotional situations. It could be argued that although many of the subjective qualities of
emotions induced by emotional films, music or stories, for example, are similar to those
encountered in real life, the physiological response will be muted, because the body does
not need to prepare for any expected action. A physiological reaction of sufficient
strength to measurably affect speech might require a more active, participatory induction
task.
In addition, it is difficult to manipulate the experimental induction in a theoretically
guided, consistent manner. Sad films, for example, might contain many things that make
them provoke sadness, or might even provoke different forms of sadness. In such cases,
comparison between two emotional films, one meant to provoke sadness and the other
fear, might be due to some other difference between the films (the difference between
films depicting social situations compared to those depicting wild animals, for example).
The construction of emotion-inducing stories that have been constructed to differ only
along specified dimensions might seem like a solution to this problem, but such
artificially constructed stories are unlikely to provoke much emotion in the reader.

48
Computer games in emotion research
Recently the promise of using computer games and simulations for the induction of
moderate intensity real emotions has been demonstrated (Anderson and Ford, 1986;
Banse, Etter, van Reekum, and Scherer, 1996; Kaiser, Wehrle, and Edwards, 1994;
Kappas, 1997; MacDowell and Mandler, 1989). The advantages of computer simulation
over other emotion induction techniques derives from their closeness in many ways to
real life. Games and simulations in general allow players to be submerged in scenarios
which can be modelled on everyday situations. Furthermore, games allow players to
become involved in the types of events which might only happen infrequently (or never)
in normal life, but nevertheless produce strong emotional reactions when they do occur.
The high level of interactivity involved in game playing is more conducive to emotion
elicitation, in particular elicitation of physiological responses, than more passive activities
such as watching films. Modern computer games, with their realistic graphics and sound
effects, add to this realism and player involvement.
From an experimental viewpoint, computer games have the advantage that they
can be played in a controlled laboratory environment, enabling high quality digital
recording of speech. Moreover, many of the possibly confounding factors which would
be uncontrollable in real life observational studies, or even film-watching inductions, can
be manipulated or controlled in a computer game experiment. For example, the social
context in which an event is evaluated plays a fundamental role in the emotional response
and ensuing behaviours, including expressive behaviours. Using computer games, social
factors can either be largely reduced if the experimental focus is on an individual’s
emotional response in isolation, or manipulated if the focus is on the effects of the social
environment on emotion and expression.

49
Another major advantage of using computer games as emotion inductors is the
ability to change the game in order to systematically manipulate emotion eliciting
situations, in accordance with theoretical hypotheses. For example, using appraisal
theory as a basis, games can be manipulated in such a way as to provoke appraisals along
posited appraisal dimensions. Although there will always be a degree of variability in the
way specific events are appraised by different people at different times, a reasonable
homogeneity in appraisals is likely when the event characteristics and contextual factors
can be well controlled. In addition, it is possible in computer games to encourage the
pursuit of specific goals, a factor too often neglected with other induction techniques
given that one of the central aspects of appraisal theories is that appraisals are always
made with respect to a person’s goals and concerns. An example would be the goal of
winning more points than all other players in a competition – if such goals are not
specified, different individuals will play for different reasons, just as individuals in film
watching inductions might watch films with different motivations.
There are still a number of issues than have to be addressed when using computer
games in studies of emotion. The most difficult is finding a balance between a game that
is interesting and involving enough to induce emotional responses, and one that provides
the necessary amount of experimental control. There is a trade-off between experimental
control, which is better in games that are very simple, in which only the experimentally
manipulated factors vary, and the players’ emotional involvement, which tends to
increase as the game becomes more varied and includes a greater range of scenarios.5 In
choosing a game as the basis for an experimental study then, it is necessary to find one
which is varied enough to be involving (and sustain involvement throughout the
experimental session) but not so varied as to swamp the data with effects from
uncontrolled sources. Other practical issues also affect game choice. While many games

50
are openly available on the market that include graphic violence and potentially offensive
themes, it is ethically desirable not to choose such games for research. In addition, the
source code of the computer game must be available to allow for manipulation of game
events, as well as the addition of features specific to the research setting, such as report
and rating screens and the recording of data files containing subjective ratings and
performance data.
The game XQuest (Mackey, 1994), a space-invaders type of game available as
shareware on the internet, was chosen for the first two experiments in this research. This
specific game was chosen primarily because the PASCAL source code had been made
available to our laboratory in Geneva by the game's author, thus allowing the game to be
reprogrammed for the sake of experimental manipulations and data collection. XQuest
was also chosen for its clear goals (completing each level and accumulating points), as
well as being involving enough to elicit mild emotional responses, without being violent
or otherwise ethically unsuitable. Despite being an involving and captivating game,
XQuest is relatively uncomplicated, thus permitting a high level of experimental control.
XQuest is described in more detail in the chapter describing the first experiment (chapter
three).
For experiment three, a manual tracking computer task was developed specifically
for the collection of standard speech samples under conditions designed to elicit a
number of modal emotions. The choice of XQuest had originally been made partly on
practical grounds, namely that the game was ready-made and the source code available,
thus enabling a prompt start to experimentation. Although the use of the XQuest game in
the first two experiments demonstrated the promise of using computer games to elicit
emotional speech, it was thought that better control could be achieved with a task

51
programmed “from the ground up”. A more extensive description of the task used in
experiment three is given in chapter six.
1 The voluntary modulation of speech to convey emotion, that is, affective pragmatics,
is more likely to occur at a segmental level, in interaction with the linguistic content
(see, e.g. Scherer, Ladd and Silverman, 1984; Ladd, Silverman, Tolkmitt, Bergmann
and Scherer, 1985). As research leads to more precise hypotheses, particularly
concerning affective pragmatics, it will be necessary to examine the acoustic properties
of emotional speech at shorter time scales.
2 The subjective perception of loudness, while highly correlated with the objective
measure of intensity, is also influenced by other factors such as the frequency
composition of the speech sound, and temporal aspects such as attack and decay of the
sound.
3 Various theories of intonation posit the existence of F0 declination, whereby F0
fluctuates within a range of values defined by an F0 baseline and an F0 ceiling line,
both of which drop gradually during an utterance or breath group. The existence of
declination in spontaneous, non-read speech however, remains controversial (e.g.
Lieberman, 1985).
4 In practice, F0 floor is measured not on the basis of the single lowest F0 value, but on
the basis of a low percentile value (e.g. the 5th) of F0. Similarly, F0 range is usually
quantified as the difference between F0 floor and a high percentile value (e.g. the 95th)
of F0 (e.g. Banse and Scherer, 1996).
5 Most emotion theories hold that emotions are responses to events that are relevant to a
person’s goals or plans. This implies that for a game to be effective as an inductor of
emotions, it must remain relevant to the player, that is, the player must remain involved
in the game. To maintain this involvement, it is necessary that the game is comprised of
more than simply manipulations of a few experimental factors.

52

53
3. Experiment 1: Computer game induction of emotional speech
Introduction.
As with all of the experiments reported in this thesis, the aims of this experiment
were both methodological and theoretical. The methodological aim of this experiment
was to develop and test the technique of studying the push effects of emotional response
on the characteristics of the voice by recording the speech of players of an
experimentally manipulated computer game. The principal theoretical aim was to gather
evidence on whether the push effects of emotion on the voice are limited to a simple
effect of arousal on the speech subsystems, or whether the effects are multidimensional
and reflect factors other than arousal. The experiment also aimed to test Scherer's (1986)
predictions of the vocal characteristics resulting from appraisals along the intrinsic
pleasantness and goal conduciveness dimensions.
Push effects of emotion on the voice
As discussed in the first chapter, there is little empirical evidence that the voice
changes produced by emotional responses reflect anything other than an increase or
decrease in general arousal. The lack of such evidence does not necessarily exclude the
existence of such non-arousal effects of emotion on the voice however, since the few
studies that have been performed on real emotional speech have not examined a wide
range of acoustic vocal characteristics, nor have they examined more than one or two
different emotions.
In keeping with the experimental approach outlined in the first chapter, this
experiment aims at measuring the acoustical changes that are provoked by emotional
responses to computer game situations designed to be appraised in specific ways. As this
was a first attempt at using such an experimental paradigm, appraisal dimensions were

54
chosen on the basis of theoretical predictions (Scherer, 1986) that they would produce
non-arousal changes to the voice as well as the ease with which they could be
instantiated within the game. Scherer (1986) suggests that it is likely that the vocal
characteristics of emotional speech can be quantified along the three classical emotion
response dimensions: activation (or arousal), valence and potency. The little empirical
evidence for the existence of three such dimensions in emotional speech (Green and Cliff,
1975) indicates that of the three, activation and valence are more easily identifiable than
the potency dimension. For this reason, this experiment focussed on the valence response
dimension which, according to Scherer (1986), is affected by appraisals of intrinsic
pleasantness and goal conduciveness.
Arguing that appraisals of intrinsic pleasantness or unpleasantness will elicit either
innate or learned approach or avoidance action tendencies respectively, Scherer draws
upon past research into orofacial behaviour, particularly in response to pleasant or
noxious tastes or odours. Thus unpleasant stimuli are predicted to elicit constriction of
the pharynx and approximation of the faucal arches, which serve to rejecting noxious
stimuli. Combining these vocal tract changes with Laver’s (1980) work on voice quality,
Scherer predicts strong resonance in high frequencies following appraisals of
unpleasantness. In contrast, stimuli appraised as pleasant are predicted by Scherer to lead
to faucal and pharyngeal expansion, which should lead to a damping of high frequency
energy. Both pleasant and unpleasant appraisals are also predicted by Scherer to produce
facial expressions such as the retraction of the corners of the mouth in smiles and
expressions of disgust, although it is unclear how these two types of expression would
differently affect vocal characteristics. Tartter (1980; Tartter & Braun, 1994) found that
lip retraction in smiling raised second formant frequency, whereas lip protrusion lowered

55
it. It is not clear whether the energy in the second formant is affected by such facial
expressions.
Scherer (1986) makes a theoretical distinction between appraisals of intrinsic
pleasantness, which has to do with innate, or highly learned evaluation of pleasantness,
and goal conduciveness, which involves an evaluation of whether a stimulus or event
helps or hinders one to obtain a desired goal or need. An example of this distinction
might be when one is offered a medicine that tastes terrible but will cure a bad illness.
According to Scherer, the medicine will be appraised as intrinsically unpleasant but goal
conducive. The opposite case might be a smoker trying desperately to give up smoking
who is offered a cigarette, an event that would be appraised as intrinsically pleasant, but
goal obstructive. Despite this theoretical distinction, Scherer predicts that many of the
effects of goal conduciveness appraisals on the voice will be similar to those of intrinsic
pleasantness appraisals, since the neurophysiological pathways that mediate expressive
responses to both appraisals are likely to be the same. Hence goal obstructive events are
predicted to produce constricted pharyngeal settings and approximated faucal pillars,
leading to fairly high energy at high frequencies, as opposed to less high frequency
energy corresponding to wide pharyngeal and faucal settings that result from goal
conducive appraisals.
Scherer’s (1986) predictions of vocal changes corresponding to a hedonic valence
response dimension are in direct contrast to a simple arousal theory of emotional vocal
expressions. Scherer predicts that F0 level and mean overall energy of speech will not
change as a function of appraisals of goal conduciveness or intrinsic pleasantness. An
arousal theory of emotional expression in the voice would predict at least F0 level and
mean energy to increase with increasing arousal. Indeed, as discussed in chapter 1,
studies that have been carried out on both real and acted emotional speech have almost

56
always measured an increase in F0 and energy for anger, joy and fear and a decrease for
boredom and sadness and attributed it to changes in physiological arousal. Other
acoustic variables, such as the spectral distribution of energy, might also be expected to
change according to an arousal theory, but they would be expected to covary with F0
and energy in a consistent manner.
In summary, by measuring the acoustical properties of speech immediately
following game events that are designed to elicit appraisals of intrinsic pleasantness and
goal conduciveness, this experiment sought to test the hypothesis that such events
provoke changes to the voice that are inconsistent with a simple arousal model of
emotional vocal expression. To this end, changes were predicted to the spectral
distribution of energy of elicited speech due to the different experimental conditions that
would not covary with any changes observed in speech F0 or speech energy. In addition,
the specific predictions of Scherer of more high frequency energy under conditions of
negative hedonic valence (unpleasant or obstructive) than under conditions of positive
hedonic valence (pleasant or conducive), and no valence-dependencies for F0, were also
tested.
Method
Participants
Thirty-three volunteer adolescents between the ages of 13 and 15 (27 males and 6
females) were recruited from nearby high schools. Both the schools and parents of all
children gave full written consent for the participation of their children based upon a full
explanation of the aims and procedure of the experiment. Participants were reimbursed
SFr.15 for their participation in the experiment. Adolescents were chosen because they
were considered most likely to be familiar with, and get involved in video games, thus
making it more likely that emotional responses to the video games would be elicited.

57
Description of the game
The game XQuest situates the player in a fictional galaxy, filled with crystals,
mines and enemies. The general assignment is to gather the crystals which are present in
each galaxy. Acceleration of the player’s space ship is controlled by moving the mouse,
thus leading to a ballistic movement of the ship. This feature makes the game particularly
interesting to play. Pressing the left button of the mouse launches bullets in the direction
in which the ship is going, which destroy any enemies which are hit. Pressing the right
button launches a bomb, if available, which destroys every enemy and mine in the galaxy.
Once the player has picked up all the crystals in the galaxy, a gate opens through which
the player proceeds to the next galaxy (or game level). Points are awarded for every
crystal gathered, completion of a game level within a certain time range, and every
enemy destroyed. Depending on the amount of points gained, extra ships are given. The
difficulty increases in successive game levels since there are more crystals to pick up, the
number of mines increases, the enemies become more numerous and difficult, and the
exit to the next game level becomes smaller. The game ends when the player loses all the
ships, after which the player starts a new game at the first game level.
Procedure
Upon their arrival in the laboratory, participants were fully informed of the nature
of the computer game and how long they would be asked to play for. Participants were
then given a demonstration of how to play the game, during which the experimenter
played the game and explained the appearance of the different objects (e.g. mines,
crystals, player's space ship, enemies), movement of the player's space ship, how to fire
bullets and to use the bomb, how to pick up the crystals and how to exit the galaxy when
all the crystals had been collected. Players were also shown the emotion rating screen
and verbal report screen and how to use them properly. Then they played the game for a

58
20 minute practice session. During this time, they were given extra instruction and
reminders whenever necessary. In order to ensure that all players were sufficiently
involved in the game, and to establish a minimal performance level for all players, a
selection criterion of reaching at least the fourth game level by the end of 20 minutes
practice was used. All players met this criterion. After the practice session, sensors for
physiological measures and the microphone were attached. The players were asked to
speak aloud in a normal voice while the microphone recording level was adjusted. The
experiment started with a 2.5 minute relaxation phase, to establish a resting baseline.
Then the game started and participants played for 45 minutes, after which the game
halted automatically.
Manipulation of appraisal dimensions
Two appraisal dimensions were operationalised by either manipulating or selecting
specific game events. From all possible events in the game which may elicit emotion-
antecedent appraisal, two types of events were selected a-priori since it is highly likely
that these events would be appraised in a similar way by all players. These events are
loosing a ship (by hitting an obstacle or being shot by an enemy) and passing to the next
game level after successful completion of a galaxy. In the context of the game, the first
type of event is obstructive and the latter conducive in the pursuit of gaining points and
progressing to as high a game level as possible. The independent variable goal
conduciveness was thus operationalised by selecting situations in which the player’s ship
was destroyed (low goal conduciveness) or a game level was successfully completed
(high goal conduciveness). The other appraisal dimension which was studied was the
intrinsic pleasantness of critical game events. As opposed to goal conduciveness, this
appraisal dimension was directly manipulated by playing valenced (i.e. pleasant and
unpleasant) sounds. The pleasantness of these sounds, which were equal in duration and

59
average intensity, had been established in an independent pre-test of 15 judges who were
asked to rate the sounds on a seven point scale from -3 (very unpleasant) to +3 (very
pleasant). The mean ratings are given in table 2.1.
Table 2.1. Ratings of the two sounds used in the experiment as a manipulation of
intrinsic pleasantness.
Mean rating Std. Dev.Unpleasant sound -2.3 1.1
Pleasant sound 2.2 0.8
The appraisal dimensions were manipulated in a 2 (intrinsic pleasantness) x 2 (goal
conduciveness) within-subjects design. Thus concurrent with the player reaching the next
level or losing a life, either a pleasant or an unpleasant sound was presented.
Vocal reports
Speech was elicited by means of a vocal report pop-up screen, which requested a
vocal report of the immediately preceding game events. The report screen, which was
designed to seem to the player like part of the game, rather than an intrusion on it, was
displayed whenever an experiment-relevant event (i.e. loss of ship or new level)
occurred, with the constraint that no more than one screen appeared every two minutes,
so that the continuity of the game was not unduly interrupted (see figure 2.1). The
players were requested to respond to the screen by pronouncing aloud the identification
number, choosing one of the three given reasons for the preceding event, and estimating
the percentage chance that they would be successful in the following game level. The
pop-up screen provided both strings of isolated letters and connected phrases to be
pronounced by the subject. For each presentation the identification number changed, but
the first six characters remained constant across all presentations.

60
Galaxie Franchie!
Votre rapport s.v.p.
Identification du vaisseau:
AG01813
Votre compte rendu:
Ennemis peu efficaces
Attaque ennemie
Navigation correcte
Mauvais navigation
Chance
Probabilite de franchir la galaxie
suivante?
X pourcent
Galaxy Completed!
Your report please
Identification of ship:
AG01813
Your account:
Enemies not very good
Enemy attack
Good navigation
Bad navigation
Luck
Probability to complete the next
galaxy?
X percent
Figure 2.1. Vocal report screen used in the experiment (left) and English translation
(right). Italics indicate phrases that were displayed in place of the preceding phrases for
ship destroyed events.
Emotion self-report
An emotion self-report was obtained using a pop-up screen which displayed a
popular French comic strip character (Gaston Lagaffe), expressing eight different
emotions (interest, joy, surprise, anger, shame, pride, tenseness and helplessness; see
Figure 2.2). The images of the characters, which were used to make the rating screen
clearer and easier for the adolescents, were accompanied by the corresponding emotion-
labels and a continuous graphic scale on which the felt intensity of each emotion could be
indicated by means of clicking and dragging with the mouse. The ratings were converted
to 100 decimal values ranging from 0 to 1. The pop-up screen was presented
immediately after a random sample of critical game events, but not more often than once
every four minutes, so that the continuity of the game was not unduly interrupted.

61
Figure 2.2. Subjective emotion rating screen.
Results
Emotion reports
For each subject, each experimental condition contained on average two
observations, the data for which were averaged. Mean reported emotion intensities are
shown in figure 2.3. Since the data for all emotions were heavily skewed, and had
distributions that could not be corrected with mathematical transformations, they were
then analysed with a Friedman test (this is an appropriate non-parametric within-subject
test of differences between mean ranks) to determine for each emotion if the reported
intensities differed across the four experimental conditions. Reported joy (χ2 (3, 32) = 10.0,
p = 0.02), pride (χ2 (3, 32) = 29.9, p < .0005), anger (χ2 (3, 32) = 29.2, p < .0005) and
surprise (χ2 (3, 32) = 12.3, p = 0.007) all differed across the four conditions. For these

62
emotions, posthoc two-way Wilcoxon signed ranks tests were used to compare the
reported intensities between conducive and obstructive, and pleasant and unpleasant
conditions respectively. Joy (Z = 2.0, p = 0.004) and Pride (Z = 4.1, p < 0.0005) were
both higher in conducive conditions than in obstructive conditions. Anger (Z = 4.0, p <
0.0005) and Surprise (Z = 3.1, p = 0.002) were both higher in obstructive conditions
than in conducive conditions. Surprise was also higher following games events
accompanied by pleasant sounds than following events accompanied by unpleasant
sounds (Z = 2.4, p = 0.02).
0
0.05
0.1
0.15
0.2
0.25
0.3
Interest Surprise Joy Pride Helplessness Tenseness Anger Shame
mea
n in
tens
ity
conducive/pleasant
conducive/unpleasant
obstructive/pleasant
obstructive/unpleasant
Figure 2.3. Mean reported emotion intensity as a function of experimental condition.
Acoustic Analyses
Sections of the DAT speech recordings corresponding to the prompted vocal
reports were identified using timing data recorded in the participants' data log files.
These sections were then digitised using 16-bit Kay Computer Speech Laboratory (CSL)
5300B speech analysis hardware and software at 20000 samples/second and stored as
separate digital PC sound files. A number of acoustic analyses were then performed on

63
each speech file, using CSL speech analysis software. These are detailed below for each
type of analysis.
Fundamental frequency (F0). For each speech file, a three stage procedure was
used to extract the F0 contour. The CSL software was first used to mark the onset of
each pitch impulse. For each participant, all their speech files were analysed with a set
minimum allowed F0 of 150 Hz and a set maximum allowed F0 of 400 Hz. These values
are used by the CSL routine to limit the search for pitch impulse peaks in the speech
waveform to within the expected range of F0 values for the adolescent participants. The
positions of the impulse markers were then visually compared with the speech waveform,
and obvious errors were manually corrected. For some participants for which there were
many errors, due to F0 being either above the maximum or below the minimum allowed
values, the minimum and maximum allowed F0 values were adjusted appropriately and
all the participant's speech files were reanalysed and pitch impulses re-inspected. For all
participants, a single adjustment of the minimum and maximum allowed F0 values was
sufficient to ensure an accurate calculation of pitch impulse markers. Finally, the CSL
software was used to calculate the F0 contour for each speech files based upon the pitch
impulse markers.
From each calculated F0 contour, the following statistical measures of F0 were
calculated: mean F0, standard deviation of F0, F0 5th percentile value and F0 95th
percentile value. The two percentile values were calculated as measures of F0 floor and
F0 ceiling respectively as reported in Banse and Scherer (1996).
Energy. The mean voiced energy of speech in each speech file was measured by
calculating the root mean square (RMS) value of 15 millisecond frames of the speech
signal, centred about each pitch impulse marker. The RMS value has advantages over
other energy measures since it reflects more accurately the perceived intensity of speech

64
(Deller, Proakis and Hansen, 1993). A 15 millisecond calculation window is long enough
to ensure that the energy is averaged over 2-3 fundamental periods.
Duration and fluency measures. Using the calculated pitch impulse markers, an
estimation was made of the length of each utterance, by measuring the time from the first
pitch impulse marker to the last pitch impulse marker in each speech file. This technique
is inaccurate in so far as it ignores unvoiced sounds at the beginning and end of each
utterance, but was nevertheless used since such unvoiced sounds were not expected to
vary greatly between experimental conditions (at least compared with the variation
expected for voiced parts of the utterance), and since no CSL algorithm could be used
for the automatic determination of the onset and offset of unvoiced sounds. A measure
of the proportion of each speech utterance that was voiced was made by using the pitch
impulse markers to estimate the voiced portions of each utterance and dividing the
summed duration of these portions by the estimated total utterance duration. Both
measures (i.e. utterance length and proportion voiced) were thus used as an indicator of
speech fluency.
Spectral measures. The pitch impulse markers were used to separate each speech
file into voiced and unvoiced parts. The average power spectrum of voiced parts of each
utterance was then calculated using the CSL software, with a frame size of 512 samples.
This thus yielded a power spectrum with 256 frequency bins, each one of width 39.06
hertz. The proportion of energy under 500 Hz, which is a measure of low frequency
energy that has been found to vary with different emotions (Banse and Scherer, 1996),
was calculated by summing all the frequency bins of the power spectrum below 500Hz,
and dividing by the sum of all the frequency bins across the entire spectral range. An
equivalent calculation was made of the proportion of energy under 1000 Hz.

65
Statistical analyses
To determine the effects of the experimental manipulations on the acoustic
parameters, each parameter was separately analysed with a univariate mixed-model
ANOVA, with conduciveness and pleasantness as two-level fixed factors, and participant
as a 30-level random factor. A univariate mixed-model approach was chosen because a
number of the acoustic variables measured are known to be highly interdependent, and
the aim of these analyses was to identify all the parameters that varied across
experimental conditions, rather than only those that contributed uniquely to a single
composite dependent variate. Because of the high interdependence1, no Bonferroni
corrections were performed – rather, the intention was to use replication in following
studies to verify the results of these analyses.
Pleasantness x Conduciveness interaction. There was very little interaction between
the two independent variables. A weak interaction was measured for the F0 ceiling
(F(1,30)=2.9, p=0.10). Post-hoc comparisons showed that this was due to F0 ceiling
being higher in response to unpleasant than to pleasant sounds that accompanied
obstructive events (F(1,30)=4.4, p=0.04), but the lack of such a difference for conducive
events (F(1,35)<1). An interaction for F0 standard deviation (F(1,30)=5.0, p=.03) was
also due to higher F0 standard deviation in response to unpleasant than to pleasant
sounds that accompanied obstructive events (F(1,32)=5.6, p=0.02), but the lack of such
a difference for conducive events (F(1,33)<1). These two interactions are illustrated in
figure 2.4. No other pleasantness x conduciveness interactions were observed.

66
2 1 9
2 2 1
2 2 3
2 2 5
2 2 7
2 2 9
2 3 1
2 3 3
2 3 5
c o n d u c iv e o b s tru c t iv e
F0
ceili
ng (
Hz.
)
1 9 .5
2 0
2 0 .5
2 1
2 1 .5
2 2
2 2 .5
2 3
2 3 .5
2 4
c o n d u c ive o b s t ru c tiv e
F0
stan
dard
dev
iatio
n (
Hz.
)
Figure 2.4. Interaction of pleasantness and conduciveness for F0 ceiling (top) and F0
standard deviation (bottom). Solid lines indicate pleasant sounds, broken lines indicate
unpleasant sounds. Bars represent 95% within-subjects confidence intervals.
Pleasantness. No effects of pleasantness on mean energy (F(1,29)<1), F0 floor
(F(1,29)<1), F0 ceiling (F(1,30)=2.1, p=0.15), mean F0 (F(1,29)<1), F0 standard
deviation (F(1,30)=1.2, p=0.28) were observed. The proportion of energy below 500
hertz was significantly lower for unpleasant than for pleasant sounds (F(1,31)=7.3,
p=0.01). A similar result was found for the proportion of energy under 1000 hertz, which
was also lower in response to unpleasant sounds than to pleasant sounds (F(1,29)=4.2,
p=0.05).

67
158
159
160
161
162
163
164
conducive obstructive
F0
floor
(H
z.)
69.2
69.4
69.6
69.8
70
70.2
70.4
RM
S e
nerg
y
Figure 2.5. Mean voiced energy in decibels (broken line) and F0 floor (solid line) as a
function of conduciveness. Bars represent 95% within-subjects confidence intervals.
Conduciveness. The effects of conduciveness on mean energy and F0 floor are
shown in figure 2.5. Mean energy was lower for conducive than for obstructive events
(F(1,29)=6.4, p=0.02). F0 floor was lower for conducive events than for obstructive
events (F(1,30)=4.6, p=0.04), although no effects of conduciveness on F0 ceiling
(F(1,30)<1), mean F0 (F(1,29)<1) or F0 standard deviation (F(1,30=1.2, p=0.27) were
measured. The effects of conduciveness on the fluency parameters is shown in figure 2.6.
The percentage of each utterance that was voiced was lower for conducive than for
obstructive events (F(1, 30)=23.4, p<0.0001). Utterance duration was higher for
conducive events than for obstructive events (F(1,30)=22.0, p<0.0001). No significant
differences due to the conduciveness manipulation were found for the proportion of
energy under 500 hertz (F(1,30)=1.8, p=0.19) nor for the proportion of energy under
1000 hertz (F(1,29)=1.3, p=0.27).

68
8
8.5
9
9.5
10
10.5
11
conducive obstructive
utte
ranc
e du
ratio
n (s
ecs.
)
27
28
29
30
31
32
33
34
35
perc
enta
ge v
oice
d
Figure 2.6. Mean utterance duration in seconds (solid line) and the percentage of each
utterance that was voiced (broken line) as a function of conduciveness. Bars represent
95% within-subjects confidence intervals.
Interactions with participant. As expected, all of the acoustic parameters differed
significantly across participants. More relevant to the current study is whether the ways
in which acoustic parameters varied across experimental conditions were participant-
dependent. In other words, how stable across participants were the effects of the
experimental conditions? The interactions between the random participant factors and
the two experimental factors can be used as an indicator of such a dependency. Weak
conduciveness x participant (F(29,28)=1.7, p=0.07) and pleasantness x participant
(F(29,26)=1.8, p=0.06) interactions were measured for the percentage of each utterance
that was voiced. A significant pleasantness x participant interaction was observed for
utterance duration (F(29,26)=2.1, p=0.03). No such interactions were measured for the
other acoustic parameters.
Data reduction. As mentioned above, the set of acoustic parameters measured in
this experiment are not indicators of distinct and independent voice production
characteristics, nor even indicators of distinct characteristics of the acoustic signal. There

69
is a large amount of overlap between certain parameters, for example the measures of
F0, which is unavoidable since parameters that independently measure distinct acoustic
properties are not yet well defined, particularly with respect to the acoustic properties of
emotional speech. Because of this lack of independence, one can expect the acoustic
parameters to be correlated to varying degrees. Table 2.2 lists the pairwise Pearson
correlations between all the acoustic parameters measured in this experiment. The
parameter values used for the calculation of the correlations were first zero-meaned for
each participant. This ensures that the correlations between parameters reflect within-
subject variability (i.e. variability due to experimental manipulations) rather than
between-subject variability. As can be seen, parameters that are primarily associated with
the same specific aspect of the acoustic signal, such as the F0-related measures, tend to
be highly correlated. In addition, there are a number of substantial correlations between
parameters that are based on different acoustic features, such as the correlations between
the F0-related parameters and the measures of spectral energy distribution. It is possible
that the latter correlations reflect underlying common characteristics of vocal production,
which might be directly affected by emotional responses.

70

71
To address this possibility, a principal components analysis (PCA) was used to
extract a small number of orthogonal factors that could be linked to specific voice
production characteristics. Three, four and five factor solutions were calculated on the
basis of the zero-meaned acoustic parameters, which accounted for 73%, 83% and 91%
of the within-subject variance respectively. The factors were Quartimax rotated, in order
to minimise the number of factors needed to explain the variables and to simplify
interpretation. The rotated factor weightings for the three solutions were then examined
to determine which of the solutions was most clearly interpretable with respect to current
understanding of voice production and speech acoustics. Of the three solutions, the four
factor solution provides the most parsimonious explanation of factors. Factor weightings
for the four factor solution are shown in table 2.3.
Table 2.3. Factor weightings for a four factor, Quartimax rotated PCA of acoustic
variables.
.74 .13 .11 -.12
.13 .01 .91 .13
-.06 .12 -.91 .08
.81 -.36 .09 .18
.41 .82 -.04 -.17
.87 .37 .01 -.08
-.04 .93 -.09 -.20
-.16 -.08 .06 .92
.10 -.38 -.02 .80
mean energy
Percentage voiced
Duration
F0 floor
F0 ceiling
F0 mean
F0 std. dev.
energy < 500 Hz
energy < 1000 Hz
1 2 3 4
Component
The first factor loads most heavily on mean energy, F0 floor and mean F0. These
three parameters are all indicators of physiological arousal or excitation, hence the first
factor would most appropriately be interpreted as an excitation factor. The second factor
loads highly on F0 ceiling and F0 variability, both indicators of F0 variability and range,
and would thus be appropriately labeled pitch dynamics. The third factor is most clearly

72
an indicator of fluency, as indicated by a high loading on percentage voiced and a high
negative loading on utterance duration. The fourth factor loads highly on the two
measures of spectral energy distribution, which have most commonly been linked to
vocal fold dynamics and the profile of the vocal tract.
The factor scores were entered into a univariate mixed-model ANOVA, with
conduciveness and pleasantness as two-level fixed factors and participant as a 30-level
random factor. Scores on the excitation factor were higher for obstructive events than
for conducive events (F(1,30)=4.1, p=0.05). There was no difference in the excitation
factor between pleasant and unpleasant events (F(1,32)<1), nor were there any
significant interactions. For the pitch dynamics factor, no significant difference was
observed between events paired with pleasant sounds and those paired with unpleasant
sounds (F(1,31)<1), nor between conducive events and obstructive events (F(1,30)<1).
A significant interaction between conduciveness and pleasantness (F(1,30)=4.0, p=0.05)
indicated that the pitch was less dynamic following pleasant sounds than following
unpleasant sounds when accompanied by obstructive events. The fluency factor scores
were significantly higher for conducive than for obstructive events (F(1,31)=27.6,
p<0.000). The fluency factor did not vary significantly across levels of pleasantness
(F(1,31)=1.9, p=0.18), nor was the pleasantness x conduciveness interaction significant
(F(1,31)<1), but there was a significant interaction between pleasantness and participant
(F(29,24)=2.3, p=0.02), indicating that fluency varied with pleasantness in a participant-
dependent manner. The spectral factor scores were significantly lower following
unpleasant sounds than following pleasant sounds (F(1,32)=6.9, p=0.01), with no other
significant main effects or interactions for this factor.

73
Discussion
The measured effects of the intrinsic pleasantness manipulation on the acoustic
speech signal were limited to the distribution of energy in the spectrum, with a greater
proportion of energy in higher frequencies being measured after unpleasant sounds than
after pleasant sounds. This result is consistent with the Scherer's (1986) predictions
which were based upon a presumed constriction of the faucal pillars and pharynx in
response to the appraisal of a stimulus or event as intrinsically unpleasant. Scherer did
not predict changes in speech intensity nor F0 due to pleasant or unpleasant appraisals,
and indeed no main effects of pleasantness on energy or F0 parameters were measured in
this experiment. The measured interaction between pleasantness and conduciveness for
F0 ceiling and F0 standard deviation, indicating that for obstructive events only, F0 had a
reduced dynamic for pleasant than for unpleasant sounds, was, however, unexpected and
is difficult to explain. Scherer's predictions have little to say about the interaction
between different appraisal outcomes, other than that the predicted effects of two
appraisal outcomes might reinforce or negate each other and thus produce a large or
small change to speech acoustics accordingly.
Scherer (1986) predicted that the vocal changes caused by appraisals of goal
conduciveness would parallel those of intrinsic pleasantness appraisals. Thus for events
appraised as goal obstructive, a voice described as “narrow”, with more high frequency
energy is expected, whereas for goal conducive events, a “wide” voice, with greater low
frequency energy was predicted. The results of the current experiment do not support
these predictions, with no significant spectral differences measured between conducive
and obstructive events. Also contrary to Scherer's predictions, conducive events were
lower in energy and had a lower F0 level, as indicated by F0 floor, than obstructive
events. These latter results, in combination to the higher scores on the excitation PCA

74
factor for obstructive events than for conducive events, suggest that physiological
arousal was higher following the destruction of a ship than following the completion of a
game level.
Such an arousal dimension is equivalent to the distinction used by Scherer to
predict the difference between vocal changes in response to goal discrepant appraisals
and those resulting from goal consistent appraisals. According to Scherer, appraisals of
goal discrepancy should result in an ergotropic shift, whereby the sympathetic branch of
the ANS is activated in preparation for probable action, leading to an overall tensing of
the skeletal musculature, including the vocal folds, and increased depth of respiration.
Such changes are expected to produce increases in F0 level and speech intensity. In
situations appraised as goal consistent, a shift towards ergotropic-trophotropic balance
is expected, in which sympathetic ANS activity is decreased and activity in the
parasympathetic branch of the ANS is increased for the purposes of energy conservation
and recovery, resulting in a “relaxed” voice with low to moderate F0 and intensity.
Indeed, it is probable that the ship destroyed events were more discrepant with
expectations than were the new level events, since when passing to a new level in
XQuest, players see their ship approaching the exit gate, whereas the enemies that collide
with the player’s ship often behave in unpredictable ways. It is thus quite conceivable
that the acoustic differences observed between ship destroyed and new level events were
due to differences in sympathetic ANS activity produced by appraisals of discrepancy
and consistency respectively. Support for this explanation comes from the reports of
surprise, which were higher for obstructive events than for conducive events.
Unfortunately, it is not possible to say whether the observed differences between
ship destroyed events and level completion events in this experiment were due to a
failure on the part of Scherer’s predictions, or a failure of the experiment to isolate the

75
desired appraisal dimension. Although the two events were clearly objectively
obstructive and conducive to the main goals of the game, it is not clear that they were
appraised as such by participants, nor that they were only appraised along that
dimension, and not also appraised along other dimensions such as discrepancy.
The practical problems with asking a player to report their appraisals as they play a
computer game include interrupting the flow of game play, as well as changing the very
way in which game events are perceived and evaluated (and hence affecting their
emotional responses). In addition, most appraisal theorists hold that appraisals often
occur unconsciously (e.g. Leventhal and Scherer, 1987; see van Reekum and Scherer,
1997, for a discussion of levels of processing in appraisal) and are thus not accessible for
reporting, a problem analogous to that of extracting problem solving techniques from
experts in the domain of expert systems research (Berry, 1987). Hence even if subjective
appraisal reports had been collected from players, they would not have provided a valid
indication of the way players actually appraised events during the game. It would be
desirable in future experiments to use a method of estimating participants’ appraisals to
events which provides a suitable compromise between validity and avoiding interference
with the ongoing experiment. Moreover, an effort needs to be made to avoid unwittingly
using experimental manipulations that lead to appraisals other than those intended.
Push effects as simple arousal
The hypothesis that push effects on the voice are limited to an arousal dimension
was not supported by the results. The fact that manipulations of intrinsic pleasantness
produced changes in certain acoustic parameters, while the conduciveness of events
produced changes in completely different acoustic parameters, is very difficult to explain
within a simple arousal model of emotional vocal response. Such a model would predict
that those acoustic parameters affected by general physiological arousal would covary –

76
that a change in the value of one such variable would be accompanied by a concomitant
change in the values of the others, and that for a given pair of variables, the relative
direction of change would be constant. Although it is possible that not all such changes
would be measurable, since some acoustic parameters might be more sensitive than
others, a purely arousal-based model would hold that their relative sensitivity would be
constant. In other words, if one experimental condition were to produce a change in
parameter A but not in parameter B, one would not expect that in another experimental
condition, a change would be observed in parameter B but not in parameter A. This is,
however, what the results of this experiment reveal: That variations in the intrinsic
pleasantness of an event cause changes to spectral energy distribution, but not to overall
energy, F0 level nor fluency, but that changes to the conduciveness of an event produce
changes to the latter set of variables, but not to spectral energy distribution.
Although a single-dimension arousal model could be modified to fit such data, a
more parsimonious explanation is that emotional changes to the voice reflect two or
more dimensions, presumably reflecting two or more underlying mechanisms. This does
not come as a surprise, given the evidence and theoretical justification that exists for the
existence of at least three dimensions that seem to characterise emotional responses in
general: activation, valence and potency. Scherer (1984) has suggested that the three
dimensions can be useful in describing the structure of emotional response, although they
are of more limited use in explaining the elicitation of emotion. In making his predictions
of the acoustic characteristics of speech corresponding to different emotions, Scherer
uses such a three-dimensional categorisation, which he proposes corresponds to three
dimensions of voice type. Thus Scherer proposes that hedonic valence corresponds to
variation in the voice from “wide” to “narrow”, activation corresponds to vocal variation
from “lax”, through “relaxed” to “tense, and that potency effects voice along a “thin” to

77
“full” dimension. The different vocal types, which are largely based upon the work of
Laver (1980) on vocal settings and voice quality, are also described by Scherer in purely
acoustic terms.
Despite the widespread acceptance of a three dimensional description of emotional
responses, there is, however, very little empirical evidence supporting such a view with
respect to push effects on the voice. Green and Cliff (1975) arrived at a three
dimensional description of vocal changes in acted emotional speech, labeling the factors
“pleasant-unpleasant”, “excitement” and “yielding-resisting”. The results from the factor
analysis in this experiment also provide some support for a three dimensional view of
vocal response patterning. A factor that could clearly be related to activation, which
consisted of F0 level and mean intensity, was identified. These two acoustic parameters
were indeed posited as indicators of the activation dimension by Scherer (1986). In
addition, the spectral energy factor, which varied significantly with manipulations of
intrinsic pleasantness, seems to match the description given by Scherer for a hedonic
valence dimension. The two other factors, F0 dynamics and fluency, do not, however,
easily map on to the remaining factor suggested by Scherer, the one of potency. The lack
of emergence of a factor that clearly corresponds to the potency dimension is perhaps
not surprising, since power, the appraisal dimension most implicated by Scherer in the
potency dimension, was not manipulated in the current experiment, and thus might not
have varied sufficiently to produce measurable effects in the acoustic data. In addition,
Scherer did not include parameters related to speech fluency in his predictions.
Nevertheless, at least the fluency factor that was measured in this experiment deserves an
explanation, since it varied significantly with goal conduciveness.
One possibility is that fluency is related to the cognitive factors involved in
emotional situations, such that situations requiring greater use of cognitive resources

78
“steal” cognitive resources away from speech planning and execution, leading to speech
that has more pauses and errors. Such situations are likely to be those appraised as
obstructive and needing an urgent response – the type of situations that typically provoke
anxiety and fear. The fluency measures from this experiment do not support such a
hypothesis however, since obstructive situations provoked speech that was more fluent,
as indicated by shorter overall duration and greater voiced percentage. Alternatively, the
increase in speech fluency observed for obstructive conditions over conducive conditions
could also be the result of increased arousal and excitation, although the low correlations
between both fluency measures and the mean energy and F0 measures would seem to
cast doubts on this explanation as well.
Conclusions
The results from this experiment indicate the potential of computer games to
induce emotional responses which in turn affect the acoustic properties of speech. The
main hypothesis of the experiment, that such changes reflect more than the
unidimensional effects of physiological arousal on the voice, was supported by the data.
In addition, acoustic analyses supported the specific hypotheses put forward by Scherer
(1986) concerning the acoustic changes to speech due to appraisals of intrinsic
pleasantness. Scherer’s predictions of changes to speech due to goal conduciveness
appraisals were not, however, supported in this experiment. A possible explanation for
the discrepancy is that players did not only appraise events along the two intended
dimensions, but also in terms of goal discrepancy.
This experiment has also highlighted a number of methodological and theoretical
issues that need to be addressed in future studies. The experiment was successful in
eliciting measurable vocal differences between experimental conditions despite the non-
negligible delay between the emotion-inducing event and the onset of speech, a result of

79
pausing the game to display the report screen. The measured acoustic differences in
speech between the experimental conditions, which in this experiment were small, were
presumably what remained of more immediate, possibly larger, acoustic effects.
Alternatively, it is possible that the measured effects did not reflect the immediate
emotional response to appraisal of the game event, but rather a secondary response,
perhaps produced by reappraisal of the event outcome, or even appraisal of the initial
emotional response or efforts to control such a response. Given the lack of knowledge of
the temporal course of emotional responses (an issue discussed in some depth by
Edwards, 1998), it is impossible to say with certainty which of these alternatives is
correct. Clearly, it would be preferable in future computer game studies to measure the
acoustic changes to speech more immediately after, or even during, appraised game
events, although how this can be done without unduly interrupting the game (and thus
interfering with the experimental manipulations) is not obvious.
A further issue concerns the difficulty of interpreting acoustic measurements, in
particular those that are inconsistent with theoretical predictions, in terms of the their
supposed physiological causes. It is difficult to interpret such global energy, F0 and
spectral parameters as were measured in this experiment, without any corresponding data
on the respiratory and muscular changes that are thought to affect them. Speech
production is highly redundant, so that the same or similar acoustic effects can be
produced using a variety of vocal settings. Thus acoustic measurements that are
consistent with theoretical predictions provide only indirect support for the theory of
how those acoustic changes are produced. More problematic still is when acoustic
measurements are inconsistent with the predictions, since one can only speculate as to
the causes of the discrepancies, as was the case with the goal conduciveness factor in this
experiment. The obvious way to solve this problem is by measuring theoretically relevant

80
physiological variables, such as respiration rate and depth, and muscular tension,
concurrently with vocal measurements, although such an approach brings with it many
new methodological problems.
One of the advantages of using a computer game to test the predictions made by
appraisal theories of emotion is that it can highlight ambiguities in the constructs of the
theories themselves. Such was the case in this experiment with goal conduciveness, the
manipulation of which was questionable on the grounds that goal discrepancy might have
also been manipulated. Although this could be considered a purely methodological
problem concerning the design of the goal conduciveness manipulation, a closer look at
the theory itself reveals a certain amount of confusion between the two appraisal
dimensions. Thus while goal discrepancy is sometimes described as an evaluation of
discrepancy with the expected state of proceedings (Scherer, 1986, p. 147), it is also
described as an evaluation of discrepancy with the desired state of proceedings (Scherer,
1986, p. 153)2, which seems to overlap with the goal conduciveness appraisal dimension.
In addition to such definitional issues, there is also the possibility that the different
appraisal dimensions are interdependent, that is, that the outcome of one appraisal will
influence one or more of the others. This possibility is indeed consistent with the outline
of Scherer’s theory, in which appraisals are postulated to function in a sequential
manner, the outcome of one appraisal check feeding forward into the next check in the
sequence (Scherer, 2001). Of course, if the different appraisal dimensions do influence
one another, it is difficult to see how they can be independently manipulated in an
experiment, an issue that is further addressed in the following chapter.

81
1 The Bonferroni correction is only applicable when multiple statistical tests are
mathematically independent. When multiple tests are highly correlated, the correction is
overly conservative.
2 In the most recent version of his theory, Scherer (2001) has combined appraisal of the
discrepancy and goal conduciveness of a situation into one appraisal check.

82

83
4. Experiment 2: Acoustic and physiological measurement of emotional speech
Introduction
The first experiment in this thesis highlighted that although a computer game could
be effective in eliciting emotional changes to voice quality, concurrent measurements of
voice-related physiology are needed to understand the mechanisms underlying such
changes. This would seem particularly the case when testing the theoretical predictions
of Scherer (1986), since they are based on a model of appraisal-produced physiological
responses. The issue of whether emotional vocal changes are unidimensional indicators
of arousal, or multidimensional indicators of a more complex physiological response
system would also be better addressed by experiments that included physiological
measures.
If there exists little prior research on the properties or production of real or
induced emotional speech, there exists virtually no such research that has included
measures of physiology relative to speech production. There is, however, a large and
growing body of research into the physiology of non-emotional speech production. The
techniques used in such research vary according to the specific research question being
addressed. Much of the research is concentrated on detailed measurements of speech
articulation, both in normal speech as well as speech under special circumstances or in
special populations (such as stutterers or speakers of particular dialects). Articulatory
research uses techniques including electropalatography, X-ray imaging and, more
recently, magnetic resonance imaging (MRI) to measure the precise positions of the
various articulators during speech production. While such techniques could be applied to
research on emotional speech, their invasive nature and high cost precludes them from
being easily applied to studies of real or induced emotional speech. The other major area

84
of research into speech physiology focuses on the mechanisms of vocal production
centred about the respiratory and laryngeal systems. Such research typically seeks to
measure how changes to respiratory function (such as respiratory depth, expiratory force
and subglottal pressure) and laryngeal function (such as vocal fold tension, vocal fold
abduction and adduction, and larynx position) interact to produce changes to vocal
energy, F0 level and dynamics, and vocal spectral characteristics (e.g. Strik and Boves,
1992; Iwarsson, Thomasson and Sundberg, 1996). A variety of techniques are used to
this end, including strain gauge measurement of chest circumference, which is an indirect
indicator of respiration, measures of oral flow with a pneumotachomask (flow mask),
direct intra-oral and subglottal pair pressure measurements, electroglottogram (EGG)
and photoglottogram (PGG) measurements of vocal fold opening and closing, EGG
measurement of larynx position, and fine wire electromyogram (EMG) measurements of
laryngeal muscle activity. Of these techniques, some (PGG, flow mask, intra-oral
pressure, fine wire EMG) are too invasive to be usefully applied to studies that seek to
induce real emotional speech, while all require specialised equipment of moderate to high
cost.
All the physiological measurement techniques listed above are pertinent to speech
production in general. In addition, it is likely that other types of physiological
measurements that are not usually used in speech production studies, but are commonly
used in studies of emotional response patterning, will also prove useful in explaining the
mechanisms underlying emotional changes to speech. Measurements such as heart rate
and skin conductance are indicators of autonomic nervous system activity (e.g. Bradley
and Lang, 2000; Tranel, 2000), which is directly pertinent to arousal-based theories of
emotional vocal changes, as well as to the more specific predictions of Scherer (1986).
In addition, surface EMG measurements of facial muscles have been suggested and used

85
as indicators of emotion-specific (Ekman, 1972, 1982a) or appraisal-specific (Scherer,
1992; Smith and Scott, 1997) expressive responses, and might thus prove useful when
combined with acoustic measurements of the voice. Finally, surface EMG of other
muscles might be used as an indicator of general skeletal muscle tension, which is
postulated by Scherer (1986) to change with different appraisals and thus affect voice
production through changes to laryngeal muscle tone.
This experiment was designed to concurrently measure both acoustic properties of
the voice and a set of physiological variables that could be linked either directly or
indirectly to emotional voice production. The choice of which physiological variables to
measure was decided on the basis of three considerations: a) the expected relevance of
the variable to either speech production or to emotional response patterning, based upon
current emotion and speech production theory, b) the non-invasiveness of measuring the
variable, so as not to interfere with the emotion induction by introducing anxiety and
distractions, and c) the cost, availability and ease of use of the equipment necessary to
measure the variable. Specific predictions of changes to the physiological measures for
the different manipulations are given in the section on this experiment’s hypotheses.
Methodological issues
One of the methodological problems discussed in the last chapter concerned
eliciting vocal reports some time after a manipulated event occurred in the game, having
in the meantime paused the game. When measuring physiological data, this problem is
even more relevant, since accurate measurement of physiological data requires a
relatively long window of time that is not affected by non-experimental changes in the
situation. The mere act of pausing the game will tend to elicit a physiological response,
since the player can take that opportunity to disengage from the action and take a break.
In so doing, players also often take the chance to readjust their posture, which leads to

86
large movement artifacts in most physiological recordings (due to electrode
displacement, strain gauge movement etc.). For these reasons, it was considered
desirable in this experiment to collect vocal reports during game play, without any
interruption. In this way, the effects of manipulated game events on speech and
physiological data could be recorded immediately and relatively freely of artifacts.
Therefore, in this experiment, during manipulated game situations, players were
requested with an audio prompt to give a vocal report of how they currently felt, using a
standard phrase and standard emotion labels that had been rehearsed in a practice
session. This technique of collecting speech data also allowed subjective emotion data to
be collected for each vocal report, rather than for a subset of manipulated game events as
was the case in the first experiment.
Not only were the vocal reports integrated into the game without interruptions, but
the experimental manipulations were changed from being single, one-off events (such as
losing a ship) to being situations with a prolonged duration (such as battling an enemy).
One reason for this change was to provide a suitably long window during which
physiological data alone, and vocal and physiological data together, could be recorded.
Another reason was that many of the situations that cause emotions in real life tend to be
prolonged ones in which the final outcome is uncertain and the emotional response builds
up over time, rather than quick events that resolve uncertainty. The slow building up of
an emotional response is more amenable to measurement than quick, short lived
responses to single events (although the latter do deserve research attention in their own
right).
Appraisal dimensions
The primary aim of this experiment was to gather further evidence that emotional
vocal changes reflect more than the simple effects of arousal on voice production. It was

87
also intended to extend the findings of the first experiment with respect to Scherer's
(1986) predictions, by further studying the appraisal dimension of goal conduciveness as
well as examining other appraisal dimensions. A summary of the design of this
experiment is presented in table 4.1; the manipulations of appraisal dimensions are
further discussed below.
Table 4.1. Factorial design of experiment two, showing manipulations of
conduciveness, control and power.
low power high power
low control high control low control high control
conducive
mine sweeper
few bullets
ship wobble
mine sweeper
few bullets
steady ship
mine sweeper
many bullets
ship wobble
mine sweeper
many bullets
steady ship
obstructive
mine layer
few bullets
ship wobble
mine layer
few bullets
steady ship
mine layer
many bullets
ship wobble
mine layer
many bullets
steady ship
Goal conduciveness. The goal conduciveness dimension was examined using a
different game manipulation from experiment one. The events used to examine goal
conduciveness in the first experiment were problematic because although they clearly did
vary along the dimension of goal conduciveness, they might also have varied across other
appraisal dimensions, in particular discrepancy. The effects of these events on the voice
were thus difficult to unambiguously interpret as either a failure of Scherer’s predictions
for goal conduciveness, or as the result of appraisal along a second, unintended appraisal
dimension. In addition, neither event meets the criteria of prolonged game situations that
would allow physiological and vocal measurements as described in the preceding section.
The manipulation of goal conduciveness in this experiment was thus designed to solve

88
these problems. The manipulation consisted of the presence of friends, who sweep up
enemy mines, or enemies, who place enemy mines, in a given game level (or galaxy). The
friends were intended to provoke appraisals of goal conduciveness, the enemies goal
obstructiveness. The manipulation was designed to be as symmetrical as possible, in that
the friends and enemies were identical except for their mine sweeping or mine laying
behaviour. Given such a symmetrical manipulation, it was not expected that other
appraisal dimensions such as discrepancy could account for vocal, physiological or
subjective differences between the two conditions.
Coping potential. The other major appraisal dimension included in most appraisal
theories of emotion is an appraisal of the expected ability to cope with a given situation,
either by attempting to alter the situation itself, avoid the situation, or deal with the
situation’s consequences. Such an appraisal is thought to be particularly relevant to the
choice of an appropriate emotional response. For example, confronted by an aggressor,
the decision to stand one’s ground and prepare or threaten to fight, as opposed to
conceding to the aggressor or running away, will depend largely on appraisal of one’s
ability to successfully carry out any of the response options. This appraisal dimension
also maps fairly well onto the commonly posited emotional response dimension of power
or potency. Some appraisal theorists make a distinction between appraisals of one’s
ability to cope with a situation (e.g. Scherer’s (1986) power and control; Smith’s (1989)
problem-focused coping) and appraisals of one’s ability to adjust to its consequences
(e.g. Scherer’s (1986) adjustment, Smith’s (1989) emotion-focused coping). Scherer
further distinguishes between appraisals of control, one’s ability in principle to cope with
a situation, and power, one’s ability at the moment to cope with a situation. For example,
this distinction of Scherer can be used to explain why one is frustrated when one can’t
open a door (low power) that one normally would be able to open (high control), but

89
resigned when one can’t open a door (low power) that one normally would not be able
to open (low control).
In this experiment it was decided to examine the effects of Scherer’s control and
power appraisal checks (equivalent to Smith’s problem-focused coping) on the voice.
The adjustment appraisal is less amenable to manipulation in a computer game, as it
refers to situations in which a person has to come to terms with the consequences of an
event by readjustment of their goals, plans or personal image (the term “emotion-focused
coping” used by Smith for this type of appraisal is particularly descriptive). Such types of
adjustment are almost never needed in computer game play or if they are, they are trivial
unless the game is being played in a highly competitive manner with much at stake – a
situation that becomes problematic for ethical reasons. Power and control were
manipulated in line with the requirements of prolonged manipulations that would allow
vocal and physiological recordings to be made without interrupting the game. For the
control manipulation, the player’s ship was made to either move in a smooth and
consistent manner, as dictated by the player’s movement of the mouse (high control), or
in a randomly wobbling manner, so that the player’s movement of the mouse only
partially determined the ship movement (low control). There was nothing the player
could do, even in principle, to avoid or diminish the random wobbliness of the ship in the
low control condition. Power was manipulated by giving the player either a high or low
shooting power. Contrary to the control manipulation, the player could make up for low
power in the low shooting condition by clicking more frequently on the mouse. Similarly,
a player could choose not to shoot at all in the high power condition. It should be noted
that although Scherer makes the distinction between control and power, other appraisal
theorists do not. The relative merits of either point of view would be tested by whether

90
the two manipulations produced different changes to the voice, as predicted by Scherer
(1986).
Interaction between appraisals. One of the possibilities that was briefly discussed in
the previous chapter was that different appraisals might interact in their effects on
emotional responses. This is particularly likely in the case of goal conduciveness and
coping potential, since the notion of coping with a situation would seem to be predicated
by the situation being appraised as obstructive (e.g. Lazarus, 1991) – one rarely speaks
of coping with a positive situation. If this hypothesis were true, then one would expect
manipulations of coping to have an effect on the voice only for goal obstructive
situations, but not for goal conducive situations. This experiment was designed in a fully
factorial manner to allow such a hypothesis to be tested. Thus with each level that
contained enemy mine placers or friendly mine sweepers, players were given either high
or low shooting power, and their space ship either moved smoothly or in a wobbly
manner, as shown in table 4.1. The hypothesis that coping potential appraisals should
only be relevant for goal obstructive situations is intuitively consistent with the
requirements of the manipulated game situations. When there are enemies placing mines,
one wishes to destroy the enemies by shooting them before they place more mines, and
needs smooth ship control to avoid the mines they have already put down. Conversely,
when there are friends clearing away the mines, one does not wish to shoot them, and
navigation becomes much easier, regardless of ship control.
Other methodological issues. A few changes were made to the experimental design
used in the first experiment. Adults (university students), instead of adolescents, were
invited to participate, since contrary to initial expectations, they were found in pilot
studies to perform better and be more involved in the game than adolescents, and were
more readily recruited. In order to standardise the goal of the participants in the game,

91
prizes were awarded to the best performers. This addressed a problem of the first
experiment that players might have had goals other than achieving the best score
possible, such as simply having fun, destroying as many enemies as possible, or exploring
each game level as thoroughly as possible.
Hypotheses
The three appraisal checks that were manipulated - goal conduciveness, control
and power - were also chosen because conditions of low conduciveness, low control or
low power increase task demands and hence would be expected in an arousal model of
emotional response to increase physiological arousal. The hypothesis that vocal changes
simply reflect the underlying arousal dimension would thus predict same direction main
effects for these three appraisal dimensions on acoustic parameters (although the
magnitudes of the effects might differ). Furthermore, the pattern of effects across
acoustic parameters, that is, the acoustic profiles for the three appraisal dimensions
should be the same according to an arousal hypothesis. These three appraisal dimensions
are predicted to affect vocal characteristics in different ways according to theories which
support differentiated responses, such as the component process theory. Thus a
differentiated response hypothesis would predict different patterns of acoustic changes
for each of the three manipulated dimensions.
As in experiment one, the second aim of this experiment was to experimentally test
the specific predictions of emotion response patterning made by Scherer (1986).
Scherer's predictions for appraisals of conduciveness, control and power are now
discussed, both in terms of expected acoustic changes to the speech signal, as well as the
physiological mediators of such acoustic changes and the associated physiological
parameters that were measured in this experiment.

92
Goal Conduciveness. The primary changes predicted by Scherer (1986) as
discussed in the first experiment involve the setting of the vocal tract and facial muscles
in either an appetitive or aversive configuration. For conducive situations, this is
expected primarily to produce raised low frequency spectral energy, through expansion
and relaxation of the vocal tract. Obstructive situations are predicted to provoke the
opposite changes, namely an increase in the proportion of high frequency energy due to
contraction and tensing of the vocal tract.
Control. Scherer (1986) has predicted that appraisals of control will affect
primarily sympathetic arousal, such that appraisals of high control indicating that the
player can, in principle, change the situation will lead to increased SNS activity and
raised general muscle tension, whereas low control appraisals will lead to lower SNS
activity, relatively higher parasympathetic activity and relaxed muscle tension. Thus
situations appraised as being highly controllable are predicted to produce higher F0, F0
range and variability and speech with greater amplitude than situations appraised as not
controllable. As an independent indicator of sympathetic arousal, measures of finger skin
conductance and heart rate were made. Skin conductance, is believed to be innervated
only by the sympathetic nervous system as has been found to be a reliable indicator of
arousal (Bradley and Lang, 2000). Heart rate is innervated by the sympathetic and
parasympathetic nervous systems, both of which can function independently of one
another (Berntson, Cacioppo, Quigley and Fabro, 1994). It is thus impossible to make
firm inferences about sympathetic arousal based solely on measures of heart rate.
Measures of heart rate can be regarded as useful, however, when measured in
combination with other sympathetic arousal indicators such as skin conductance. In this
experiment, both skin conductance activity and heart rate were expected to be higher for
high control than for low control situations. In addition to the autonomic measures,

93
EMG activity was measured over the forearm extensor muscle of the non-dominant arm
as an indicator of skeletal muscle tension, and was predicted to be higher for high control
than for low control situations.
Power. Appraisals of power are predicted by Scherer (1986) to affect speech
primarily through changes to respiration and changes to vocal register. The changes are
predicted on the basis of preparation for fight or flight behaviour, corresponding to
appraisals of high power or low power respectively. Thus high power appraisals are
predicted to produce deep, powerful respiration and the shift to a chest register of
phonation. Such changes have been observed in posturing animals in confrontations with
social counterparts, and are thought to not only prepare the organism for subsequent
action, but also serve to represent the organism as large and powerful (e.g. Morton,
1977; Scherer, 1985)1. In contrast, appraisals of low power are predicted to produce
fast, shallow respiration and a shift to a head register of phonation, once again both in
preparation for escape behaviour as well as serving to represent the organism as small
and unthreatening. Acoustically, one would thus expect high intensity and low F0
resulting from appraisals of high power, and low intensity and high F0 resulting from
appraisals of low power. In this experiment respiration rate was measured, and
respiration depth was estimated, to determine the accuracy of Scherer’s predictions of
respiratory changes and their effect on the voice in response to power appraisals.
Method
Participants
43 male students of the University of Geneva, aged between 19 and 38 (mean age
24.5) were recruited via announcements describing the experiment as a test of
perceptual-motor performance using a computer game. Students of the Faculty of
Psychology and Educational Sciences were excluded from participation, in order to

94
avoid participants' prior knowledge of the game and the subject of interest (emotion
psychology) affecting the results. SFr.30 was paid to each participant for the two hour
experiment. Additionally, three cash prizes (SFr.500, 350, and 150 respectively) were
awarded to the participants with the best three scores. All participants were native
speakers of French.
Design and Manipulations
The appraisal checks were manipulated in a Goal Conduciveness (Conducive vs.
Obstructive) x Power (High vs. Low) x Control (High vs. Low) fully factorial design.
Goal conduciveness was manipulated by the introduction of alien ships which either
placed more mines in the galaxy (goal obstructive), or swept the mines from the galaxy
(goal conducive). The power of the player was manipulated by diminishing (low power)
or augmenting (high power) the number and strength of bullets fired with each mouse
button press. Control was manipulated by having the player's ship wobble randomly (low
control) or move smoothly and predictably (high control).
Measurements
Subjective feeling. At manipulated points in the game, the participants were asked
to provide a report of their current emotional state, by pronouncing out loud "En ce
moment, je me sens..." (translation: “at the moment, I feel…”), and then completing the
sentence by choosing one or more emotion words and giving an intensity for each one.
The player was provided with the sentence and a list of eight emotion words placed
above the computer screen in an easy to read, large font, to use as a memory aid. Players
could also use their own words in the case that none of the words on the list
corresponded to their felt emotion. The felt intensity of the emotion was given by the
player by saying an integer from 1 (very little) through 5 (moderately) to 10 (extremely).

95
Players rehearsed the words on the list before the experiment to facilitate their easy recall
during the experiment, thus minimising their need to refer to the list while playing.
Vocal measures. Subjective feeling reports were recorded to a Casio DAT
recorder using a Sennheiser clip-on condenser microphone. The standard sentence used
at the start of each subjective report was chosen to allow the direct comparison of
acoustic tokens from different appraisal manipulations. Most importantly, the phrase was
deliberately chosen to be meaningful in the context, as opposed meaningless or "off-
topic" phrases as have been used in other studies.
Psychophysiological measures. All physiological measures were recorded
continuously throughout the experimental part of the session with Contact Precision
Instruments hardware, at a sample rate of 800 Hz. For the EMG measurements, 4 mm
Ag-Ag/Cl electrodes were placed over the forearm extensor muscles in accordance with
the guidelines provided by Cacioppo, Tassinary and Fridlund (1990). Raw EMG data
was sampled with a bandpass filter of 10 - 300 Hz. Skin conductance was measured
using 8 mm Ag-Ag/Cl electrodes placed on the tops of the index and third finger. The
electrodes were filled with a NaCl paste (49.295 grams of unibase and 50.705 grams of
isot. NaCl 0.9%). EMG and skin conductance were measured on the non-dominant arm
and hand respectively. ECG was measured using pre-gelled, disposable ECG electrodes
placed on the chest according to the Einthoven's triangle. A respiration strain gauge was
placed around the abdomen, just below the thoracic cage, to provide an approximate
measurement of respiration rate and depth. The respiration signal was highpass filtered at
0.03 Hz.
A digital CPI measurement channel, synchronised with the physiological data,
recorded a numerical code corresponding to the different game events of interest, which
was output from the game PC parallel port. This channel thus marked the physiological

96
data with the precise onset and offset of each game event, as well as the onset and offset
of vocal report screens.
Procedure
The participant was told that the general goal of the experiment was "to examine
how your reaction times, mouse movements and physiological responses vary with the
nature and complexity of different game events". Participants were then told that the
session consisted of two parts: a practice session of 20 minutes during which the
participant could get acquainted with the game and (after a break in which the participant
was connected to the physiology measuring apparatus), the experimental session. The
participant was told that after exactly 45 minutes of the experimental session the game
would automatically stop, and that at the end of the experiment the mean score of all
games played would be designated that player's final score, to be used in calculating the
winners of the prizes.
The training phase consisted of a brief introduction to the game by the
experimenter, followed by a 20 minute practice session. The introduction to the game
was standardised for all participants, its purpose being to explain in general terms how
the game was played, as well as making the participant familiar with the various game
objects (e.g. alien ships and mines). The experimenter also demonstrated how to give the
verbal subjective feeling reports. During the subsequent practice session the player had
to give verbal reports 7-8 times, thus familiarising the player with the procedure while
simultaneously allowing the recording level of the DAT recorder to be adjusted.
The experimental phase commenced with a 1.5 minute period of relaxation in
which the participant was requested to sit still for the purpose of recording a physiology
baseline. The game then started and continued for 45 minutes, after which an exit-

97
interview was completed, and the participant was fully debriefed as to the aims of the
study and the data analysis that would be performed.
Results
Subjective emotion reports
Subjective emotion reports were analysed to determine whether players reported
feeling different emotions in response to the game manipulations. To test for differences
in the different reported emotions between the manipulated events a Friedman test was
used, since the distributions of values for all emotions were extremely non-normal and
could not be corrected using arithmetic transformations. Significant differences were
measured for calm (χ (7, 41) = 13.751, p = .056), contentment (χ (7, 41) = 23.840, p =
.001), relief (χ (7, 41) = 13.811, p = .055), and stress (χ (7, 41) = 25.865, p = .001).
Inspection of figure 4.1 indicates that higher intensities of calmness were reported in the
high control-situations, whereas the level of reported stress increases with low control.
Higher levels of stress and irritation were reported for obstructive situations than for
conducive situations, and more relief was reported in the conducive situations compared
to the obstructive situations. More intense feelings of contentment were associated with
high control, particularly in conducive situations.

98
0
0.5
1
1.5
2
2.5
3
relie
ved
stre
ssed
disa
ppoi
nted
surp
rised
cont
ente
d
help
less
irrita
ted
alar
med
calm
conc
entr
ated
inte
nsity
ct-/p-/c-
ct-/p-/c+
ct-/p+/c-
ct-/p+/c+
ct+/p-/c-
ct+/p-/c+
ct+/p+/c-
ct+/p+/c+
Figure 4.1. Mean reported emotion intensities per event type. c = conduciveness, p =
power, ct = control; - = low, + = high.
Acoustic analysis
Vocal data was transferred digitally from DAT cassette to .WAV files on a
Pentium PC. The vocal data for each subject was edited so as to save each repetition of
"En ce moment, je me sens" to a separate file. All other subject vocalisations were
eliminated. Three of the subjects did not always complete the full sentence, but rather
used an abbreviated form "Je me sens". For these subjects, if the abbreviated sentence
was used more often than the full sentence, the abbreviated form was taken for further
analyses - any vocal samples containing the full sentence were edited so that only the
words "Je me sens" remained. If the full sentence was more common than the
abbreviated form, all the abbreviated samples were eliminated from further analysis. In
all, the data of one participant could not be used because he admitted after the
experimental session not to be a native French speaker. The vocal data from five other
participants could not be analysed because they did not use the standard phrase as
requested when making subjective reports. The samples were then low pass filtered and

99
down-sampled to 24kHz for analysis. In this experiment, a custom written software
package called LabSpeech was used for the acoustic analysis of speech.2
Energy. The root mean square (RMS) signal values for successive 1024 sample
frames of each speech file were calculated. The frame RMS values were then used in
classification of each frame as voiced, unvoiced or silence (see below). RMS values for
frames that were classified as voiced were then averaged to produce a mean RMS energy
value for each speech file.
Voiced, unvoiced, silence. For each successive frame of the speech signal, the
number of signal zero crossings were calculated. When the RMS energy was above a
visually set threshold, and the zero crossings were below a visually set threshold, the
frame was designated as voiced. When the zero crossings were above the threshold
value, the frame was labelled unvoiced. If both RMS energy and zero crossings were
below their threshold values, the frame was labelled silence (meaning background noise
only). Although such a simple method has its limitations and there are certainly more
sophisticated and better methods available, for good quality signals with low background
noise the procedure was found (by visual inspection) to work well.
F0. Voiced frames were centre-clipped at 30% of maximum amplitude and then
analysed with an autocorrelation technique. The lag corresponding to the maximum peak
in the autocorrelation function was accepted as a valid F0 value if the peak’s value was
greater than 0.4 and if the lag fell within the pre-set range of allowed F0 values for that
speaker. Once the whole speech file had been analysed, outlier F0 values, defined as
those differing from any other values by more than 20 Hertz, were excluded. On the
basis of the remaining F0 values, a number of summary measures were calculated. These
were F0 floor (F0 5th percentile), F0 ceiling (F0 95th percentile), F0 mean, F0 median,
and F0 3rd moment.

100
Spectral analyses. FFT power spectra were calculated for successive 1024 point
frames of each speech file. The spectra were then averaged separately for voiced and
unvoiced sections. On the basis of these averaged spectra, the proportion of total energy
below 500 Hertz and the proportion of total energy below 1000 Hertz were calculated
for voiced and unvoiced average spectra.
Physiological analysis
For each manipulated game level, two data blocks were extracted, one consisting
of the ten seconds immediately preceding the vocal report prompt, the other consisting
of the ten seconds immediately following the vocal report prompt.
EMG. The EMG signal was rectified and smoothed using a digital Butterworth
low-pass filter with a cut-off frequency of 4 Hz., after which the signal was down-
sampled to 20 Hz. and averaged over five seconds.
Skin conductance. The skin conductance signal was low-pass filtered, with a cut-
off of 0.7 Hz, and down-sampled to 20 Hz. before parameter extraction in order to
eliminate high frequency artefact spikes introduced by the CPI system. An automated
routine enabled the scoring of the number of skin conductance responses within the time
block as well as the average skin conductance amplitude, and magnitude (see Dawson,
Schell and Filion, 1990). A skin conductance response was scored when the increase in
skin conductance level exceeded 0.05 microSiemens. The response amplitude was
measured as the amplitude of the largest response occurring during the time block.
ECG. The inter-beat interval (IBI) derived from the R-R interval was calculated
using an automatic peak picking routine. Those IBIs shorter than 400 and longer than
1500 were considered as artefacts (caused by player movement or spikes introduced by
the CPI hardware) and eliminated from further analysis. For each block, the mean IBI
and the standard deviation of IBI was calculated.

101
Statistical analysis
Each vocal and physiological parameter was analysed with a 2 (control) x 2
(power) x 2 (conduciveness) univariate mixed model ANOVA, with the three
experimental factors as fixed factors and participant as a random factor. Since a number
of interaction effects were found, these will be discussed first, after which tests of main
effects will be presented.
Conduciveness by power interaction. A conduciveness x power interaction effect
on median F0 (F(1,34)=4.2, p=0.05) was due to greater median F0 for obstructive
situations than for conducive situations when power was high, but no such difference
when power was low (see figure 4.2). The same interaction was evident for mean F0
(F(1,34)=4.7, p=0.04) and although not statistically significant, F0 ceiling varied in the
same way (F(1,34)=2.2, p=0.15). A conduciveness x power interaction effect on the
proportion of voiced energy in the spectrum below 1000 Hertz (F(1,34)=3.8, p=0.06)
was due to lower energy below 1000 Hertz for obstructive situations than for conducive
situations when power was high, but no such difference when power was low (see figure
4.3). A conduciveness x power interaction effect on the variability of inter-beat interval
(F(1,42)=4.0, p=0.05) was due to greater variability when players had low power than
when they had high power in obstructive situations, but no such difference for conducive
situations, as shown in figure 4.4. Figure 4.5 shows that a similar interaction effect on
skin conductance level (F(1,44)=7.1, p=0.01) was due to a greater skin conductance
level when the player had low power than when the player had high power during
obstructive situations, but no such difference during conducive situations.

102
128
129
130
131
132
133
134
135
136
137
low power high power
med
ian
F0
(Hz.
)
obstructive
conducive
Figure 4.2. Interaction effect of conduciveness and power on median F0. Bars represent
95% within-subject confidence intervals.
0.96
0.965
0.97
0.975
0.98
low power high power
prop
ortio
n en
ergy
und
er 1
kHz.
obstructive
conducive
Figure 4.3. Interaction effect of conduciveness and power on the proportion of energy
under 1000 Hertz for voiced frames. Bars represent 95% within-subject confidence
intervals.

103
33
35
37
39
41
43
45
47
49
51
53
obstructive conducive
IBI v
aria
bilit
y (m
s)
low power
high power
Figure 4.4. The effect of conduciveness x power interaction on inter-beat interval
variability. Bars represent 95% within-subject confidence intervals.
12.4
12.5
12.6
12.7
12.8
12.9
13
13.1
13.2
13.3
obstructive conducive
skin
con
duct
ance
leve
l (µM
ho)
low power
high power
Figure 4.5. Effect of conduciveness x power interaction on skin conductance. Bars
represent 95% within-subject confidence intervals.
Conduciveness by control interaction. A conduciveness x control interaction effect
on the proportion of the total signal that was unvoiced (F(1,36)=4.2, p=0.05) was due to
a greater proportion of unvoiced sounds for low control than for high control situations
when the situation was obstructive, but the reversal of the difference when the situation

104
was conducive (see Figure 4.6). The proportion of the signal that was voiced showed a
trend for the opposite interaction (F(1,36)=3.2, p=0.08).
27
28
29
30
31
32
33
obstructive conducive
perc
enta
ge u
nvoi
ced
low control
high control
Figure 4.6. Interaction effect of conduciveness and control on the proportion of a phrase
that was unvoiced. Bars represent 95% within-subject confidence intervals.
Main effects. Means for the vocal parameters in the different conditions are shown
in table 4.1, and those of the physiological parameters are shown in table 4.2. It should
be noted that these values are not corrected for between-subject variation, and hence the
differences in the means across conditions might not correctly indicate the average size
of within-subject differences.
F0 floor was higher in high control conditions than in low control conditions
(F(1,37)=3.9, p=0.05). F0 range was significantly greater in low control conditions than
high control conditions (F(1,36)=11.7, p=0.002 respectively). Zygomatic muscle activity
was significantly greater in low control situations than in high control situations
(F(1,43)=6.8, p=0.01). Respiratory period was significantly longer (i.e. respiration rate
slower) in low control than in high control conditions (F(1,63)=4.95, p=.03). No other
main effects of control were measured.

105
RMS energy of voiced frames of speech was significantly higher in obstructive
situations than in conducive situations (F(1,37)=4.9, p=0.03. The same trend was
measured for the RMS energy of unvoiced frames of speech (F(1,37)=3.4, p=0.07).
There was a tendency for glottal slope to be greater (i.e. less steep) for obstructive than
for conducive situations (F(1,37)=3.6, p=0.07). Skin conductance response amplitudes
were higher for obstructive situations than for conducive situations (F(1,44)=5.0,
p=0.03. No other main effects of conduciveness were measured.
The only main effect of power was on IBI variability, which was significantly
higher when players had low power than when players had high power (F(1,45)=5.3,
p=0.03). This effect was limited to obstructive situations, as indicated by the significant
conduciveness by power interaction for IBI variability and illustrated in figure 4.4.
Correlations between acoustic and physiological variables. Scherer's (1986)
predictions are based largely upon the expected effects of physiological emotion
responses on vocal production An examination of the scatter plots between pairs of
physiological and acoustic variables reveals very few identifiable relationships, as borne
out by Table 4.3, which shows the correlations between vocal and physiological variables
after the main effect of speaker has been removed. As can be seen, none of the
correlations exceed a magnitude of 0.2.3

106

107

108
109
Discussion
As was discussed in the hypothesis section of this chapter, an arousal theory would
predict same direction main effects for each of the manipulations in this experiment.
Taken as a whole, the results of this experiment are not consistent with such an arousal
hypothesis. While energy of the speech signal was affected by manipulations of
conduciveness, F0 range and F0 floor were affected by control manipulations. Median
F0, and the proportion of energy below 1KHz changed according to the interaction of
conduciveness and power manipulations. As with experiment one, it is difficult to see
how general arousal could be responsible for such manipulation-dependent changes to
individual acoustic parameters. In particular, the data from this experiment seem to
suggest that separate mechanisms mediate changes to energy and fundamental frequency,
two aspects of the speech signal that have previously been suggested to covary with
physiological arousal.
The physiological data cast further doubt not only on the hypothesis of arousal
uniquely mediating acoustic changes, but more generally on the notion of unidimensional
physiological arousal. Contrary to what might be expected on the basis of such a notion,
the different physiological indicators did not covary across manipulations. Those
physiological measurements taken as indicators of autonomic activity do not show
consistent covariance; SC response amplitude varied with manipulations of
conduciveness, SC level and interbeat interval variability varied as a result of the
interaction between conduciveness and power, and respiration rate changed with
manipulations of control. As with the acoustic measures, it is difficult to reconcile such a
pattern of effects with a model of arousal. Indeed, the very notion of a single dimension
of arousal is questionable given current knowledge of the autonomic nervous system. As
pointed out by Berntson, Cacioppo, Quigley and Fabro (1994), the two components of

110
the ANS, the sympathetic and parasympathetic branches, cannot be assumed to function
antagonistically. Nor can the “net” result of both branches activation at any given
moment be mapped onto a single arousal dimension, since the stability and dynamics of
the two systems depends upon both individual branches, rather than their net sum.
Bernston et al’s arguments focus on the cardiovascular system, but equally pertain to
speech production, since both ANS branches enervate multiple organs, some of which
impact directly on speech.. It seems likely, then, that a simple arousal model of emotional
response needs to be dropped in favour of a more physiologically realistic model that
would allow for at least two dimensions of autonomic activity.
Although the data from this experiment do support a theory which posits multiple
mechanisms underlying emotional changes to vocal production, they do not show strong
correspondence with Scherer's predictions (1986). An increase in F0 floor was found for
high control versus low control situations, as predicted, although F0 range was lower in
high control situations than low control situations, contrary to prediction. The lower
measured proportion of energy below 1000Hz for obstructive situations than for
conducive situations under high power situations is in agreement with predictions and
replicates similar findings from experiment one, although the interaction effect of power
is difficult to explain. Contrary to Scherer’s predictions, but in agreement with results
from experiment one, speech energy was higher for obstructive situations than for
conducive situations. Coupled with the measured increase in skin conductance response
amplitude for obstructive situations compared with conducive situations, the results
imply an increased sympathetic arousal in obstructive situations.
Interestingly, Scherer’s predictions are based upon an additive model, in which the
effects of individual appraisal checks on the voice add together cumulatively, largely
independently of the other appraisal dimensions. For example, the predicted effects of

111
appraisals of conduciveness on the spectral characteristics of speech are the same
regardless of the outcome of other appraisals such as control or power. This experiment,
however, found manipulated dimensions to interact in their effects on the voice. A
conduciveness by power interaction effect found for median F0 indicated greater median
F0 for obstructive situations than for conducive situations when power was high, but no
such difference when power was low. It is tempting to explain this effect by suggesting
that when players have high shooting power, they actively engage in defeating enemies,
leading to an increase in muscle tone and an associated increase in median F0 relative to
when friends are present. Conversely, when players had low power, they might have
disengaged from dealing with enemies, having decided that they could not do so
effectively. Such effects of task engagement and disengagement on F0 have been found
in comparable manipulated game situations in other studies (Kappas, 2000). A similar
interaction effect on heart rate variability, in which, for obstructive situations, heart rate
variability was lower when players had high power than when they had low power,
supports such an explanation. An increase in mental workload, as might be expected with
increased task engagement, has been linked to reduced heart rate variability without a
corresponding effect on heart rate (Lee and Park, 1990), as observed in this experiment
for high versus low power in obstructive situations. The observed conduciveness by
power interaction effect on skin conductance level, which was due to a higher skin
conductance level when the player had low power than when the player had high power
during obstructive situations, but no such difference during conducive situations, might
seem to contradict the heart rate and median F0 data. The latter result seems to point to
lower sympathetic arousal when players had high power in obstructive situations,
although the lack of a corresponding drop in heart rate suggests that this is not the case.

112
Given that the measurement of tonic skin conductance level over a ten second window is
unreliable, the result for skin conductance level should not be given too much weight.
An interaction effect was also found for the relative proportion of utterance voiced
and unvoiced, such that for obstructive situations, utterances were relatively more voiced
when players had high control than when they had low control, whereas for conducive
situations the effect was reversed. Although an effect of conduciveness on the same
fluency measures was also found in experiment one, it is difficult to interpret the
interaction with control in this experiment.
Conclusions
This experiment replicated some of the results from experiment one, particularly
the inability of a simple arousal model of emotional response to explain emotional
changes to vocal production. In addition, the effects of the goal conduciveness dimension
on speech energy, median F0 and spectral energy distribution were also consistent with
results from experiment one. The results of this experiment were not, however,
consistent with Scherer’s essentially additive predictions of the effects of different
appraisals on the voice, indicating instead that such appraisal dimensions interact in
producing physiological and vocal changes.
The predictions of Scherer (1986), as well as the assumptions of other researchers
of emotional speech, are based largely upon the expected effects of physiological
emotion responses on vocal production. Although comparing the effects of
manipulations on the acoustic measures with the corresponding effects on physiological
measures has been helpful in the preceding paragraphs, it cannot be ignored that in
general the correlations between acoustic and physiological parameters were very low.
Such low correlations cast doubt on the assumption than emotional changes to vocal
production reflect predictable effects of emotional physiological responses. At least in

113
this experiment there was no consistently clear linear mapping between physiological
measures and acoustical measures of speech4. Because speech production is highly
redundant (i.e. the same or similar acoustic effects can be produced using a variety of
vocal settings), it might prove impossible to use the voice as a “readout” of emotional
state or underlying appraisals. Given the complexity of speech physiology, emotion
physiology and the difficulty in measuring the two within an emotion induction
experiment, however, it is clearly too early to draw firm conclusions. For example, the
fact that most effects on acoustic measures in this experiment resulted from interactions
of manipulated appraisal dimensions and that for a number of cells in the design neither
acoustic nor physiological measures differed, could have led to decreased correlations.
Indeed, the restricted range of variation of all the measured parameters in such an
induction paradigm is likely to restrict the correlation between different parameters.
To address these problems, two changes were made to the basic design of the last
experiment of this thesis. In an attempt to increase the size of effects, and thus the range
of variability in vocal and physiological parameters, the induction technique was changed
from event manipulations in the XQuest game to a computerised tracking task with
reward and punishment feedback. This task was programmed “from the ground up”, thus
allowing more focused and controlled manipulations and more seamless integration of
vocal reports. Electroglottography, which is a technique used to measure the opening
and closing characteristics of the vocal folds, was also introduced as a more direct
measure of vocal physiology than the physiological measures so far taken.
1 It could be argued that such a representational change to respiration and phonation
reflects a pull effect on the voice rather than a push effect (e.g. Scherer, 1985).
Nevertheless, given that the prediction made by Scherer (1986) and tested here is that
such representational functions are the product of evolutionary pressures and thus
highly automatic and innate, they are considered in this thesis to be push effects.

114
2 LabSpeech was designed around the type of analyses that were thought to be relevant
to the semi-automatic analysis of a large number of speech samples as is often required
in psychology research, but is not readily available in other speech analysis software. It
is available for download at the author’s web site and is free for non-commercial
purposes.
3 It must be noted that the correlations have been calculated by aggregating the
observations across all speakers. Since there are multiple observations per speaker, the
assumption of independent observations that is used in testing the significance of
correlations is violated, despite having first factored out the main effect of speaker. In
the correlations presented here, a conservative criterion of p<0.01 has thus been applied
in designating which correlations are significant.
4 Of course, it is possible that the relationship between physiological and acoustic
changes is nonlinear, and possibly nonstationary. Techniques such as nonlinear
regression or neural network modeling could be applied to identify such relationships,
although the increased degrees of freedom involved in such techniques also necessitates
a larger number of observations than were available in this experiment. It is also
possible that relationships between physiological and acoustic measures show complex
time dependencies, which could be identified using mathematical functions such as
cross power spectral density functions, although longer samples of speech and
physiology data than recorded in this experiment would need to be recorded.

115
5. Electroglottal measurements of emotional speech
Introduction
This experiment was motivated largely by the finding in the first two experiments
that average spectral energy distribution, as indicated by the relative proportion of
energy under 1000 Hz, differed significantly as a function of experimental manipulations.
This dependence of spectral energy distribution on emotional response is consistent with
similar findings in studies of acted emotional speech (Banse and Scherer, 1996). The
effects of emotional response on spectral energy distribution might be due in part to
differences in the configuration of the vocal tract, as suggested by Scherer (1986). For
example, changes to precision of articulation and therefore the amplitude and bandwidth
of formants, restriction or contraction of the faucal arches and changes to the amount of
mucous and saliva in the vocal tract will all have an impact on the resonance of vocal
harmonics.
It is also possible, however, that emotional changes to spectral energy distribution
are caused by changes to vocal fold vibration patterns. Much work on voice source
modeling and estimation has pointed to the relationship between the manner in which the
vocal folds open and close and the dynamics of glottal air flow (e.g. Titze, 1994;
Sundberg, 1994). The glottal air flow in turn strongly determines the relative strength of
vocal harmonics feeding into the vocal tract (e.g. see Fant, 1993). For example, when
vocal folds open and close abruptly, the result is proportionately more power in higher
harmonics, and thus proportionately more high frequency energy in the speech signal (all
other resonant characteristics being equal) than when the vocal folds open and close
slowly and smoothly. Such variations in vocal fold function, categorised into a range of
laryngeal settings, have been described phonetically by Laver (1980, 1991). They make

116
up part of a broader system for describing and categorising laryngeal and articulatory
voice quality settings, although such settings have more often been the focus of research
on pathological changes to voice quality rather than more subtle vocal changes. Scherer
(1986) also makes reference to appraisal-mediated changes from “tense” to “relaxed”
vocal settings, although the link between vocal settings, vocal fold dynamics and spectral
aspects of the resulting acoustic signal are not made explicit. The two possible sources –
vocal folds and vocal tract - of spectral changes to emotional speech, make the results
from experiments one and two difficult to interpret. A method of independently
measuring the emotion-provoked changes to vocal tract resonance and vocal fold
dynamics is necessary to resolve such ambiguity.
Electroglottography (EGG) is a technique that can be applied to better understand
the link between vocal fold dynamics and the spectral characteristics of emotional
speech. With EGG, a small, high frequency electric current is passed between two
surface electrodes placed on either side of the speaker’s neck, at the level of the larynx.
Since the electrical impedance of the path between the two electrodes will change as the
glottis opens and closes, a measurement of the impedance can be used as an indicator of
glottal opening and closing.
Figure 5.1 shows the acoustic and EGG signals from recording of an extended [a]
vowel (the “a” sound in the word “father”). As can be clearly seen, the EGG signal is
free of resonance from the vocal tract, which is apparent in the acoustic signal as rapid
fluctuations occurring in between successive vocal excitations. In fact, aside from its
application to measuring vocal fold dynamics, the EGG signal allows for an extremely
precise measurement of F0 and F0 perturbation.

117
Figure 5.1. Acoustic (top) and EGG (bottom) signals from recording of an extended [a]
vowel. Marks on the horizontal axis indicate fundamental periods. Symbols on the EGG
signal indicate the instant of glottal closure (a), instant of maximum vocal fold contact
(b), instant of glottal opening (c), instant of maximum minimum vocal fold contact (d)
and instant of glottal closure for subsequent glottal period (e).
Although the exact relationship between the size of the glottal opening and the
electrical impedance is not linear, the EGG signal is inversely proportional to the contact
area of the vocal folds (Childers & Krishnamurthy, 1985), and as such serves as a useful
indicator of vocal function. It is at least reasonable to assume that the temporal
characteristics of the measured EGG signal are good indicators of the temporal aspects
of glottal opening and closing. The magnitude of the EGG is a less valid measure of the
relative area of the glottal opening, although in the absence of alternative estimates
(other than invasive measurements such as photoglottography) it remains the best
approximate indicator.

118
Glottal analysis of imagined emotions.
This experiment was carried out to develop a set of analysis procedures for
extracting the main features from the EGG signal, as well as a test of the feasibility and
applicability of EGG analysis to the study of emotional voice production. In particular, it
was intended to apply such analysis to the final experiment of this thesis, in which
computer tasks and games would be used to induce emotional speech. To be assured of
high quality speech recordings, which were known to vary across different emotional
states, an imagination/acting procedure was used. Speakers were asked to imagine
themselves in specific emotional states and then to pronounce aloud two short phrases
and the sustained [a] vowel. Rather than recording expressions of extreme emotions such
as rage, elation and fear, seven non-extreme emotions (tense, neutral, happy, irritated,
depressed, bored, anxious) corresponding to those that could realistically be induced
with computer tasks and games, were selected for study.1
Method
Participants
Speakers were eight research workers and postgraduate students (two males and
six females) studying emotion psychology at the University of Geneva. The familiarity of
the speakers with emotion psychology was seen as an advantage in this pilot study, as
they were more readily able to follow the emotion imagination procedure and produce
emotional (albeit possibly stereotypical) vocal samples.
Equipment
Speech was recorded with a Casio DAT recorder using a Sony AD-38 clip-on
microphone to one channel of the DAT. EGG recordings were made with a Portable
Laryngograph onto the second DAT channel.

119
Procedure
Speakers were seated in front of a computer display at a comfortable viewing
distance. They were told that the experiment consisted of being presented with a number
of emotion words on the computer screen. When each emotion word was presented, they
were to try to imagine themselves in a situation that would provoke that emotion. They
were asked to imagine the situation as vividly as possible and try to actually feel the
emotion. When they felt that they were involved in the imagined situation as much as
possible, they were to click the mouse, whereupon they would be presented with a list of
phrases on the screen. Speakers were instructed to read aloud all the phrases on the
screen, while still trying to feel the imagined emotion. The order of the seven emotions
(tense, neutral, happy, irritated, depressed, bored, and anxious) was randomised across
speakers. For each emotion, each speaker was asked to pronounce the phrases “Je ne
peux pas le croire!” (“I can’t believe it!”), “En ce moment, je me sens…<emotion>” (“at
the moment, I feel…<emotion>”; speaker completed the phrase with the appropriate
emotion term), and the extended [a] vowel. Each phrase was pronounced twice by each
speaker in each emotion condition.
Results
Acoustic and glottal analyses
The samples from each subject were acoustically analysed using LabSpeech. In
contrast to the F0 measures made in the previous experiments, which were based upon
an autocorrelation analysis of the acoustic speech signal, in this experiment F0 was
calculated on the basis of the low-pass filtered EGG signal. First the EGG waveform was
high-pass filtered to remove low frequency fluctuations due primarily to larynx
movement. Next, a peak-picking algorithm was applied to the differentiated EGG
waveform to locate the instants of glottal closure, which are typically the points of

120
maximum positive gradient in each glottal period. Those sections of the EGG signal
displaying successive glottal closures corresponding to a frequency within the preset
permitted F0 range were designated voiced, and the F0 values saved. All other segments
were labeled non-voiced. RMS energy of voiced segments and the mean proportion of
energy under 1000 Hertz for voiced segments were calculated from the acoustic speech
signal as in experiment two.
Glottal opening, closing, open and closed times were calculated from the EGG
signal following guidelines given by Marusek (1997). Each glottal period, as demarcated
by successive instances of glottal closure, was analysed to identify closing, closed,
opening, and open times, as depicted in figure 5.2. An amplitude criterion of 90% of
total period amplitude was used to determine the onset and offset of closed phase. The
onset of glottal open phase was located using the equal level criterion as described by
Marasek (1997, section 12), which is the point at which the glottal signal drops to a level
equal to the level at the instant of glottal closure. These values were then converted to
quotients by dividing each by the total glottal period. The use of quotients, rather than
absolute times, was preferred since quotients give a better measure of the shape, rather
than the length, of the glottal EGG waveform. Such shape parameters were hypothesised
to correspond to spectral acoustic measures such as the proportion of energy under 1000
Hertz. In addition, because quotients are normalised to the length of each glottal period,
they can meaningfully be averaged across glottal cycles and compared between
conditions.
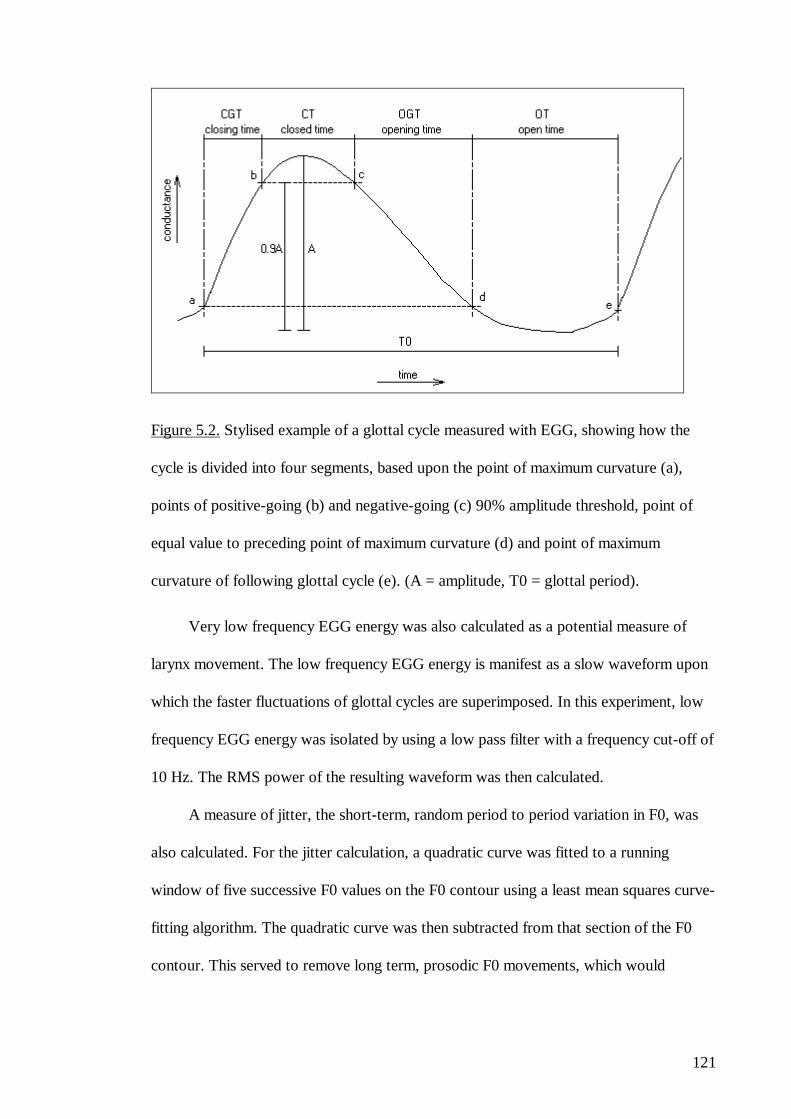
121
Figure 5.2. Stylised example of a glottal cycle measured with EGG, showing how the
cycle is divided into four segments, based upon the point of maximum curvature (a),
points of positive-going (b) and negative-going (c) 90% amplitude threshold, point of
equal value to preceding point of maximum curvature (d) and point of maximum
curvature of following glottal cycle (e). (A = amplitude, T0 = glottal period).
Very low frequency EGG energy was also calculated as a potential measure of
larynx movement. The low frequency EGG energy is manifest as a slow waveform upon
which the faster fluctuations of glottal cycles are superimposed. In this experiment, low
frequency EGG energy was isolated by using a low pass filter with a frequency cut-off of
10 Hz. The RMS power of the resulting waveform was then calculated.
A measure of jitter, the short-term, random period to period variation in F0, was
also calculated. For the jitter calculation, a quadratic curve was fitted to a running
window of five successive F0 values on the F0 contour using a least mean squares curve-
fitting algorithm. The quadratic curve was then subtracted from that section of the F0
contour. This served to remove long term, prosodic F0 movements, which would

122
otherwise contaminate jitter measurements. Jitter was then calculated as the mean of the
magnitude of period to period variation in the residual F0 values.
Statistical analysis
All acoustic and glottal parameters were tested with univariate mixed effect
ANOVA’s, with emotion and phrase as fixed factors and speaker as a random factor.
The results are presented below organised by vocal parameter.
Median F0. Median F0 differed significantly across emotions (F(6,78)=17.5,
p<0.000), and was categorised by high values for happy speech and low values for
depressed and bored speech. The middle curve in Figure 5.2 shows the emotion profile
for median F0.
F0 ceiling. The emotion profile for F0 ceiling is shown in Figure 5.3, top curve.
The F0 ceiling varied significantly across emotions (F(6,78)=11.3, p<0.000), and was
characterised by a higher value for happy speech than for the other expressed emotions.
F0 Floor. F0 floor varied significantly with emotion (F(6,78)=7.3, p<0.000) in
much the same way as median F0, with relatively high values of F0 floor for happy
speech, and low values for depressed and bored speech (see Figure 5.3, bottom curve).
Voiced RMS energy. The RMS energy of voiced segments of speech was
significantly different across emotions (F(6,78)=16.5, p<0.000), as shown in Figure 5.4.
In particular, voiced energy was high for happy and irritated speech and low for
depressed speech.
Jitter. Jitter values varied significantly with emotion (F(6,54)=2.9, p=0.013), with
jitter values being highest for bored and depressed speech and lowest for tense speech
(see Figure 5.5).

123
1 3 0
1 5 0
1 7 0
1 9 0
2 1 0
2 3 0
2 5 0
2 7 0
a n x io u s b o r e d d e p re s s e d h a p p y ir r ita te d n e u tra l te n s e
e m o t io n
freq
uenc
y (H
z.)
Figure 5.3. Mean values for F0 ceiling (top), median F0 (centre) and F0 floor (bottom),
shown as a function of emotion. Bars represent 95% within-subjects confidence
intervals.
1500
1700
1900
2100
2300
2500
2700
2900
3100
anxious bored depressed happy irritated neutral tense
emotion
ener
gy
Figure 5.4. Mean values for RMS Energy, shown as a function of emotion. Bars
represent 95% within-subjects confidence intervals.

124
8
9
10
11
12
13
14
anxious bored depressed happy irritated neutral tense
emotion
jitte
r
Figure 5.5. Mean values for jitter, shown as a function of emotion. Bars represent 95%
within-subjects confidence intervals.
0.29
0.31
0.33
0.35
0.37
0.39
0.41
0.43
anxious bored depressed happy irritated neutral tense
emotion
quot
ient
Figure 5.6. Mean values for open quotient (top) and opening quotient (bottom), shown
as a function of emotion. Bars represent 95% within-subjects confidence intervals.

125
Opening quotient. The glottal opening quotient varied significantly as a function of
emotion (F(6,78)=3.3, p=0.007), with high opening quotients for irritated and tense
speech, and low opening quotients for bored and depressed speech (figure 5.6).
Open Quotient. Glottal open quotient varied significantly across emotions
(F(6,78)=3.2, p=0.008), showing the inverse pattern of results from glottal opening
quotient, with high values for bored and depressed speech, and low values for irritated
and tense speech (figure 5.6).
Closing quotient. The glottal closing quotient did not vary significantly across
expressed emotions (F(6,78)=1.2, p=0.31).
Closed Quotient. Glottal closed quotient did not vary significantly across emotions
(F(6,78)<1).
Low frequency EGG power. Low frequency EGG power varied across emotions
(F(6,78)=11.9, p<0.000), with high values for happy speech and low values for bored
and depressed speech (figure 5.7).
100
120
140
160
180
200
220
240
260
280
anxious bored depressed happy irritated neutral tense
emotion
LF E
GG
pow
er
Figure 5.7. Mean values for low frequency EGG power, shown as a function of emotion.
Bars represent 95% within-subjects confidence intervals.

126
Voiced low frequency energy. The proportion of total energy below 1000 Hertz
for voiced segments of speech varied significantly according to the emotion expressed
(F(6,78)=9.9, p<0.000), as did the proportion of energy under 500 Hz (F(6,78)=28.4,
p<0.000). Figure 5.8 indicates that there was relatively more low frequency energy for
expressed depression and boredom than for irritation and happiness.
0.55
0.6
0.65
0.7
0.75
0.8
0.85
0.9
0.95
1
anxious bored depressed happy irritated neutral tense
emotion
prop
ortio
n of
ene
rgy
Figure 5.8. Mean values for the proportion of energy under 1000 Hz (top line) and
proportion of energy under 500 Hz (bottom line), shown as a function of emotion. Bars
represent 95% within-subjects confidence intervals.
Correlations between parameters. Table 5.1 provides the correlations between the
different vocal parameters, after the effects of speaker, stimulus and repetition have been
factored out. Many of the correlations are moderate, indicating that although the
parameters might share some underlying mechanism, or to a small extent measure some
common vocal feature, they capture different aspects of vocal production. Of particular
note are the correlations between those glottal parameters and acoustic parameters that
differed significantly across emotions.

127

128
Opening quotient correlated positively with F0 floor, F0 median and energy, but
negatively with jitter and low frequency spectral energy. Open quotient was highly
negatively correlated with opening quotient and thus showed the opposite pattern of
correlations. Low frequency EGG energy correlated positively with median F0 and F0
ceiling but not with F0 floor. Low frequency spectral energy correlated negatively with
the F0 measures.
Discussion
Variation of acoustic measures across emotions.
As with most prior research on acted expressions of emotional speech, F0 floor
and median F0 were found to be lowest for the emotions bored and depressed, and
highest for happy speech. A similar profile across emotions was found for F0 ceiling.
Although these results would seem consistent with the idea that arousal causes changes
to muscle tension, which in turn affects F0, the results for energy only partly support
such an explanation. Energy was high for happy speech and low for depressed speech,
thus corresponding to an arousal explanation for the F0 values, but bored speech did not
have low energy. The correlation of 0.47 between energy and F0 floor indicates a high
level of correspondence between the two measures, but given the result for bored
speech, it is evident that these two parameters do not always correspond.
Low frequency spectral energy also varied across expressed emotions, indicating
that there was more low frequency energy in bored and depressed speech, and less in
happy and irritated speech.
Variation of EGG measures across emotions and with acoustic measures.
Of the EGG parameters, opening quotient correlated positively and open quotient
negatively with F0 floor and F0 median. The pattern of these two EGG values across

129
emotions was also similar to those of F0 floor and median F0, indicating that emotional
changes to F0 level were principally mediated by changes to the time during which the
glottis was open. This can be concluded because as the vocal cycle becomes shorter (i.e.
as F0 rises) the open quotient falls but the opening quotient rises. Thus in absolute terms
(i.e. in milliseconds rather than as a proportion of the vocal period), the open time has
fallen but the opening time has remained relatively constant. An exception was the vocal
expression of happiness, in which neither opening quotient nor open quotient were
particularly low or high. For happiness then, it seems that an elevated F0 level was
caused by relatively equal reductions in both absolute opening and open times.
F0 ceiling (but not F0 floor) was also found to correlate positively with low
frequency EGG power, which was measured in this experiment as an approximate
indicator of larynx movement. As has been reported previously (Iwarsson and Sundberg,
1998), movement of the larynx is one mechanism that can be used in combination with
respiratory changes to vary F0 (indeed, beginner singers have to be trained in how to
vary their singing pitch without moving their larynx). It is thus possible in this case that
larynx movement was a mediator of increased F0 variation in happy speech.
The values for jitter, which correlated negatively with F0 floor and opening
quotient, were highest for bored and depressed speech and lowest for tense speech. This
result is in agreement with previous findings of a reduction of jitter for speakers under
stress (Smith, 1977), and hints that emotional effects on jitter might be due to variation
in the opening phase of the glottal cycle.
Low frequency energy correlated positively with open quotient and negatively with
opening quotient, although the correlations were only moderate, indicating that spectral
energy depends partly on glottal dynamics, but might also be affected by other factors
including vocal tract resonance.

130
Conclusions
In this experiment, EGG and acoustic recordings of expressed emotional speech
were analysed in an attempt to test the feasibility of using EGG techniques in studies of
emotional speech. The EGG parameters open quotient, opening quotient and low
frequency EGG energy were found to vary significantly across expressed emotions in
ways consistent with the acoustic parameters measured as well as past results and theory
of emotional speech production. Correlations between the EGG parameters and acoustic
parameters indicated that EGG measurements might provide useful information on the
glottal and laryngeal mechanisms responsible for emotional changes to speech. On the
basis of these results it is possible to make tentative hypotheses relating laryngeal
movement, as measured by low frequency EGG components, to F0 variability, and the
length of glottal open phase to F0 level. Such measurements thus provide us with the
potential to separate the mechanisms responsible for emotional changes to F0 level and
to F0 variation. These hypotheses are tested in the final experiment of this thesis.
Although the links between spectral aspects of the speech signal and EGG
parameters were not clear from this experiment, it is probable that techniques that better
quantify the shape of the EGG pulses will lead to clearer results. Further refinement of
the EGG analysis procedure are explained and tested in the following chapter.
1 Although the theme of this thesis is the experimental induction of emotional speech,
an imagination procedure was used here because the aim was to test the feasibility of
using EGG and develop EGG analysis procedures, rather than specifically testing
hypotheses of push effects on speech.

131
6. Experiment 3: Acoustic, electroglottographic, and physiological measurement of
emotional speech
Introduction
In this experiment, physiological measurements of ANS function were combined
with EGG measures of vocal fold activity and acoustic analysis of speech in an effort to
better explain the mechanisms by which experimental manipulations of conduciveness
and coping potential cause changes to the acoustic properties of speech. While the
physiological measurements made in experiment two provide some insights into the
mechanisms behind such changes, EGG was expected to provide a clearer understanding
of the involvement of vocal fold vibration in producing both F0 and spectral changes to
speech.
In both experiments one and two, significant changes to measures of fundamental
frequency occurred in response to manipulated appraisal dimensions. In contrast with
many previous studies of emotional speech, F0 floor and measures of F0 range were
found to be differently affected by the manipulations. In both experiments, the level of
physiological arousal, which varies with manipulations of conduciveness and coping
potential, seems to play some role in both F0 floor and F0 range variation. In experiment
one, F0 floor and speech energy varied in the same way as a function of goal
conduciveness, which was explained in terms of a corresponding variation in sympathetic
arousal. In experiment two, the behaviour of the F0 measures was less clear, with F0
range measures varying as a function of the interaction between appraisal dimensions, F0
floor varying as a function of control, and speech energy varying as a function of
obstructiveness. Although there was some evidence from ANS measures that F0 range

132
variation might have corresponded to the level of sympathetic arousal, this result was far
from certain.
It was hoped that the use of EGG recording together with physiological and
acoustic analysis in this experiment, would make the mechanisms underlying changes to
F0 more clear. Of particular interest is the way changes to F0 as a result of experimental
manipulations would be reflected in the different parts of the glottal period. As seen in
the EGG pilot study in the preceding chapter, it is possible that changes to F0 range
reflect changes to intonation that are not primarily mediated by changes to the vocal
folds, but rather reflect vertical movement of the larynx. If this is the case, then we
would expect F0 range variations across manipulations to correspond more highly with
low frequency EGG energy (an indicator of larynx movement) than with glottal phase
measures, such as open or closed times. Similarly, if sympathetic arousal is primarily
responsible for F0 floor changes through changes to laryngeal tension, we would expect
F0 floor variation across manipulations to correspond to similar variations in glottal
phase measures as well as variation in ANS indicators such as skin conductance, finger
temperature, and interbeat interval.
The first two experiments also directly tested a number of the predictions of
Scherer (1986) of changes to spectral energy distribution due to different appraisals.
Scherer predicted that constriction or opening of the vocal tract in response to appraisals
of goal obstructiveness or conduciveness respectively would cause such spectral
changes, by selectively increasing or decreasing amplification of high frequency
harmonics. In the first two experiments of this thesis, the proportion of energy below
1000 Hertz in voiced parts of speech was found to vary with the experimental
manipulations in agreement with Scherer’s predictions. Thus the proportion of energy
below 1000 Hertz was lower for obstructive than for conducive situations (though only

133
when speakers had high shooting power in experiment two). In a previous test of
Scherer’s predictions using acted speech, Banse and Scherer (1996) also found that the
distribution of acoustic energy across a number of specific frequency bands varied across
expressed emotions. A more global spectral measure of the proportion of energy below
1000 Hertz was found to vary significantly with expressed emotion. However, while
expressions of anger and panic were characterised by a low proportion of low frequency
energy, consistent with Scherer’s predictions, expressions of the emotions sadness and
shame had a high proportion of low frequency energy. Indeed, the proportion of low
frequency energy seemed at least partly determined by whether the expressed emotion
was high arousal (e.g. anger, panic), or low arousal (e.g. sadness, shame).
It is certainly possible that the manner in which the distribution of energy in the
spectrum varies with emotion depends not only on the configuration of the vocal tract,
but also on vocal fold function that might be linked to arousal. Research that has shown
a link between vocal fold function and spectral slope (Fant, 1993, Sundberg, 1994),
suggests that increased tension in the intrinsic laryngeal musculature causes vocal folds
to remain closed over a longer portion of the glottal period, only briefly opening and then
very rapidly closing again. The result is proportionally more energy in upper harmonics,
which might well result in speech with more high frequency energy. Thus one might
expect emotions in which laryngeal muscles are more tense, to be characterised by
relatively greater energy in higher harmonics, and a higher proportion of high frequency
energy. The possibility that spectral changes in emotional speech might depend on
phonation mechanisms rather than vocal tract mechanisms, is consistent with the results
of Banse and Scherer (1996) and the first two experiments of this thesis. Unfortunately,
based on those data, it is impossible to determine whether these spectral energy results
were mediated by changes to resonance in the vocal tract as suggested by Scherer, or

134
whether they might have been at least partly determined by changes to the way the vocal
folds vibrated.
It was hoped that using EGG in this experiment would help determine which
mechanisms are responsible for emotion-induced spectral changes to speech. If such
spectral changes are mediated by changes to phonation, the effects of experimental
manipulations on the shape of the glottal waveform should parallel the effects on spectral
energy distribution. In addition, correlations between EGG glottal waveform parameters
and spectral energy parameters should be apparent. The lack of such associations
between EGG measures and spectral measures would cast doubt on a phonatory
explanation, and provide further evidence that such changes are primarily related to vocal
tract resonance.
Experimental design
This experiment was intended to replicate the basic experimental design of
experiment two, with some modifications made to solve some of the problems with
experimental control evident in the second experiment. Only one coping potential
manipulation was included in this experiment, which was designed to represent a
combination of both control and power as described in Scherer’s appraisal theory. Thus
the manipulation was deigned to manipulate the general ability of the subject to cope
with the experimental situation given both the general nature of the task and the specific
given circumstances. The decision to change to a general manipulation of coping was
also made based on the findings of experiment two, which showed that the power
manipulation had an effect on sympathetic arousal consistent with those predicted by
Scherer for appraisals of control. Thus the distinction between appraisals of control and
appraisals of power seems fuzzy, at least in terms of their effects on speech. It is also
worth mentioning that most appraisal theorists do not make a distinction between control

135
and power, but rather suggest a more general appraisal of coping ability (e.g. problem-
focussed coping of Smith and Lazarus, 1990). The manipulation of coping potential for
this experiment was also extensively piloted and the difficulty adjusted so as to avoid
players disengaging from the task if it became too difficult, as might have been the case
in experiment two for obstructive, low power conditions.
It was also decided in this experiment to change from adapting an existing
computer game (XQuest) to using a computer task programmed from scratch. This
approach had not been used in the earlier experiments of this research for practical
reasons, mainly the time and effort spent programming and pretesting such a task. It was
thought that using a ready made game would still allow the necessary degree of control
and flexibility in manipulating events. The results in the second experiment however
point to the need for increased experimental control. In addition, although a computer
game was seen as a promising tool for induction of emotions, the very fact that a
computer game is entertaining means that it is intrinsically emotional even before
particular game manipulations are made to induce emotions. Different players play such
games for different reasons and have different goals and motives, posing additional
problems of experimental control (see Johnstone, van Reekum and Scherer, 2001, p. 281
for further discussion of this problem). In contrast, a computer task that is built from
scratch can include manipulations that are not constrained or compromised by the
structure of the game. Speech data collection can also be more easily and seamlessly
integrated by constructing tasks that have natural pauses and vocal interaction. The task
programmed for this experiment was a motor tracking task, in which speakers had to
manipulate the position of a box on the screen in the presence of other items that would
add or subtract from the participant’s score. The task was thus similar in many aspects to
the XQuest game, but without the extra features in XQuest included simply to add to

136
XQuest’s entertainment value. A more thorough description of the task used in this
experiment is given in the method section.
Hypotheses
Goal conduciveness. The principal hypothesis concerning the manipulation of goal
conduciveness in this experiment is the same as in experiment two. Conducive situations
were expected to produce raised low frequency spectral energy relative to obstructive
situations. As an independent measure of conduciveness, skin temperature was predicted
to fall during obstructive situations and rise in response to conducive situations.
Coping potential. For coping potential, it was predicted that low coping situations
would produce an increase in sympathetic arousal, as indicated by elevated skin
conductance activity and increased heart rate. Such arousal would also be manifest in
greater laryngeal muscle tension, and a corresponding increase in F0, and F0 variability.
This prediction, although seemingly running counter to Scherer’s predictions for low
coping, is based on the idea that in this experiment, coping potential is never low enough
to invoke task disengagement. Thus, given that the player is expected to remain engaged
in the game, their level of sympathetic arousal should increase with perceived difficulty,
and therefore be higher for the low coping condition that for the high coping condition.
Such an effect was found in experiment two, and was considered even more likely in this
experiment since the task had been specifically designed and pretested so as not to be so
difficult as to make players give up.
Furthermore, because coping potential appraisals were predicted to cause changes
to laryngeal tension, the manner in which vocal folds open and close was predicted to
change as a consequence. Thus measures of the different phases of the glottal period, as
measured with EGG were expected to vary with the coping potential manipulation. More
specifically, low coping situations, in which laryngeal muscles were more tense, were

137
expected to lead to relatively shorter open and opening phases and longer closed phase.
Although it is possible that closing phase would also shorten during low coping
situations, due to greater vocal fold compression leading to stronger elastic closing
forces, no firm prediction was made for closing phase. The reason for this is that closing
phase was expected to be very short for all experimental conditions, and thus a floor
effect in closing phase was likely.
A consequence of the predicted changes to glottal phases in response to the coping
manipulation would be corresponding changes to spectral energy distribution. The
principal such change would be a shallower spectral slope, and a relatively lower
proportion of energy at low frequencies, in low coping situations than in high coping
situations. The follows as a consequence of the prediction of short, rapid opening and
closing of vocal folds in low coping situations, which would lead to more energy in
higher speech harmonics.
Interaction effects of conduciveness and coping potential. As in experiment two,
the two appraisal dimensions were predicted to interact in their effect on physiology and
the voice. Specifically, the predicted coping potential effects were expected to be greater
in obstructive situations than in conducive situations, since appraisals of ability to cope
with a situation are more pertinent when faced with obstruction.
Method
This experiment was conducted as part of an ongoing, larger research project on
the effects of emotion and stress on automatic speaker verification technologies, and
made up part of a larger battery of emotion induction tasks. The total duration of the
experimental session was 11/2 hours, of which instructions, preparing the speaker for
physiological and EGG measurements, and this experiment took approximately 45
minutes. A general introduction to the purpose of the experiment, as well as specific

138
instructions for the task, were presented automatically by the computer program.
Speakers advanced at their own pace through the program.
The task
The task used in this experiment was a tracking task, in which the speaker had to
use the mouse to control the movement of a small box on the screen. The task was
presented in successive stages. In each stage, in addition to the player’s box, one of two
symbols, representing either reward or punishment respectively, moved about the screen.
The punishment symbol approached the player’s box and the rewarding symbol avoided
the player’s box. The player’s task was to avoid the punishment symbol from touching
the box, and to touch the rewarding symbol with the box. In addition to punishment and
reward, each type of symbol moved either quickly or slowly, thus making the task of
avoiding the punishment or achieving the reward more or less difficult, corresponding to
low and high coping respectively. Thus the two appraisal dimensions, goal
conduciveness and coping potential were manipulated in a factorial design, as shown in
table 6.1.
Table 6.1. Design of tracking task manipulations.
Goal Coduciveness
Conducive Obstructive
Lowfast reward
symbolfast
punishmentsymbolCoping
PotentialHigh
slow rewardsymbol
slowpunishment
symbol
Reward and punishment were implemented using the addition and subtraction of
points respectively. The player’s points were displayed in both a digital and graphical
form to the left of the playing space. Points were awarded or subtracted from the

139
player’s score on the basis of the distance of the player’s box from the reward or
punishment symbol. The closer the player’s box to the reward symbol, the more points
they were awarded. The closer their box to the punishment symbol, the more points they
lost. All players started with 5000 points, an amount chosen such that players could not
lose all their points or gain more than 10000 points during any task stage. The
experiment consisted of four stages, one of each condition, presented in an order
counterbalanced across subjects.
Speech material.
At four equally spaced intervals during each task stage, a small message at the
bottom of the screen appeared, prompting the player to either pronounce a standard
phrase (two times), or to pronounce an extended [a] vowel (two times). The order of
standard phrase prompts and [a] prompts was randomised. The standard phrase was
“Ceci est la tâche 4 2 5 1 0” (“This is task 4 2 5 1 0”), with a different 5-digit
combination of digits used in the phrase for each task stage. The digit combinations were
counterbalanced across task stages and subjects. The correct way to respond to the two
prompts, including instructions on how to pronounce the extended [a] vowel, were
shown with a demonstration prior to a practice stage. The four task stages then followed
the practice stage.
Subjective emotion reports
Following every task stage, speakers were asked to report how they felt, using
mouse-operated emotional state and intensity scales. With the scales, participants could
choose any number of emotions from a given list of seven provided emotions, and
indicate an intensity ranging from not felt at all to felt extremely, for each chosen
emotion. The emotions were satisfied, irritated, tired, stressed, disappointed, content,
bored and anxious. Alternatively, speakers could click a box indicating no felt emotion.

140
Measurements
Vocal measures. The acoustic speech signal and the EGG signal corresponding to
the standard phrases and extended vowels were recorded to both channels of a Casio
DAT recorder using a Sennheiser clip-on condenser microphone. These recordings were
then transferred digitally to a PC and stored as 22kHz sampling rate stereo wave files.
Psychophysiological measures. All physiological measures were recorded
continuously throughout the experimental part of the session with a Biopac MP100
physiology measurement system, at a sample rate of 250 Hz. Skin conductance was
measured using 8 mm Ag-Ag/Cl electrodes placed on the tops of the index and middle
finger of the non-dominant hand. The electrodes were filled with a NaCl paste (49.295
grams of unibase and 50.705 grams of isot. NaCl 0.9%). ECG was measured using pre-
gelled, disposable ECG electrodes placed on the chest according to the Einthoven's
triangle. Finger temperature was measured using a Biopac finger temperature probe
attached to the small finger on the non-dominant hand. A respiration strain gauge was
placed around the abdomen, just below the thoracic cage, to provide an approximate
measurement of respiration rate and depth. The respiration signal was highpass filtered at
0.03 Hz.
A one-byte digital measurement channel channel, synchronised with the
physiological data, recorded a numerical code corresponding to the different game events
of interest, which was output from the parallel port of the experimental presentation PC.
This channel thus marked the physiological data with the precise onset and offset of each
game event, as well as the onset and offset of vocal recordings.
Speakers
Speakers were 30 male first-language French adults aged between 18 and 34
(mean age 24.5) recruited via written notices and local radio announcements. Speakers

141
were told that the purpose of the experiment was to collect a variety of speech
recordings under different situations that were designed to simulate those that might
occur during everyday use of computers. Speakers were told that they would be asked to
complete a series of tasks and puzzles that would be presented on a PC. They were told
that they would be asked to pronounce a series of standard phrases and vowels that were
selected to serve the experimental goal of improving speech recognition technologies. All
speakers were paid SFr. 40 for their participation. Speakers were also told before the
start of the session that if they performed well enough in the series of tasks, they could
win an extra SFr. 10. This incentive served to increase motivation and involvement in the
task, and thus render the manipulations more powerful. All speakers were in fact paid the
extra SFr. 10 at the conclusion of the experimental session.
Procedure
On arrival, speakers were told that the purpose of the experiment was to collect a
variety of speech recordings under different situations that were designed to simulate
those that might occur during everyday use of computers. Speakers were informed that
they would be asked to complete a series of tasks and puzzles that would be presented
on a computer, and that the program would prompt them at specified times to provide
spoken input, including extended vowels, isolated digits, standard phrases and
spontaneous speech, which would be recorded.
The physiological sensors and EGG electrodes were then attached and regulated.
Regulation consisted of checking that the signals were suitably amplified and free of
noise. For all participants, the microphone was then fitted and the recording level
adjusted appropriately. Participants were then asked if they were comfortable and ready
to start before the experimenter left the experimental room and started the program.

142
The duration of the session was approximately 11/2 hours, including time to set up
the EGG, acoustic and physiological apparatus. At the end of the session, speakers were
debriefed and their agreement for further use of their data was obtained.
Results
Note. Although respiration was recorded with a respiration strain gauge in this
experiment, technical problems with the respiration amplifier precluded the data from
being analysed.
Acoustic measures
The set of acoustic measures was largely the same as that examined in experiments
two and three, with some changes. Mean F0 was not analysed, since median F0 had
consistently shown the same results in previous experiments and was judged to be less
susceptible to the effects of outliers than the mean. F0 3rd moment, which had been
included in the second experiment as an exploratory measure of the skewness of the F0
distribution, but had shown no effects of experimental manipulations, was also excluded.
Only voiced spectral measures were included, since unvoiced spectral measures had not
consistently shown changes with manipulations in previous experiments. Since spectral
energy under 500 Hertz had been found to be less reliable and less related to
manipulations in previous experiments than energy under 1000 Hertz, it was also not
analysed in this experiment. A number of new measures were added to the analysis:
F0 standard deviation. The standard deviation of F0 values was calculated for each
utterance, as a measure of overall F0 variability. F0 standard deviation across single
phrases or utterances has been measured in other studies (see, e.g. Banse and Scherer,
1996; Scherer, 1986) and shown to increase with highly aroused emotions and decrease
with emotions such as boredom. Because each F0 value has been calculated on the basis
of windows of the acoustic speech signal of varying lengths (always more than two

143
fundamental periods), it is difficult to know whether the standard deviation represents
global, suprasegmental variation in F0 or period to period variation. The former
corresponds to the changes in F0 associated with intonation, whether emotional or non-
emotional, and is related to the F0 range (difference between F0 floor and ceiling). The
latter type of variation is called jitter, and has been independently measured as an
indicator of emotional stress in previous research (e.g. Smith, 1977). In this experiment,
since the EGG signal made possible the accurate period to period measurement of F0,
jitter, F0 standard deviation and F0 range could all be measured and compared.
Spectral slope. The power spectrum of voiced speech has a spectral slope of
approximately –6 decibels (dB) per octave. The source of this spectral slope is the
spectrum of the glottal excitation, which has a slope of approximately –12 dB, which is
then modified by the filtering of the vocal tract and lips. Although the glottal source
spectrum is not directly available for measurement, it is possible that the spectral slope of
the acoustic speech signal will vary with emotion-induced changes to the glottal source
spectrum (Scherer, 1986; Klasmeyer, 1998; Klasmeyer and Sendlmeier, 1997). In
particular, it is predicted that greater tension in the vocal folds coupled with greater
expiratory force will cause a less negative spectral slope (i.e. relatively more high
frequency energy/less low frequency energy). For this reason, a regression line was fit to
the voiced power spectrum and the slope of the line in dB/octave was calculated and
analysed in this experiment.
Mel power spectrum. To provide further information on the change of the power
spectrum with the experimental manipulations, a mean Mel power spectrum was
calculated for each utterance. The Mel spectrum is a power spectrum in which the
frequency axis has been warped to reflect the perceptual properties of sound. It allows
for the fact that certain ranges of frequencies are perceived with greater resolution than

144
others. A transformation is applied to the frequency axis that effectively groups together
those frequencies that cannot be distinguished perceptually, while keeping separate those
frequencies that can be perceptually resolved. The formula for transforming frequency in
Hertz to frequency in Mel is
m=2595 log10(1+f/700)
Although widely used in the domain of speech science, the Mel spectrum of
emotional speech has not previously been examined. The Mel spectrum was used in this
experiment because it represents a more theoretically principled way in which to reduce
the 512 frequency values in a typical power spectrum than the purely statistical data
reduction techniques such as factor analysis used in previous studies (e.g. Banse and
Scherer, 1996).
EGG measures
The same set of EGG measures as analysed in experiment three was included in
this experiment. In addition to the measurement of glottal quotients, which indicate the
proportion of each glottal period occupied by the opening, open, closing and closed
phases, the absolute opening, open, closing and closed times were also measured. The
reason for this was to allow a better interpretation of how changes to the F0
corresponded to changes to the lengths of the four glottal phases. Quotients, in contrast,
measure the shape of the glottal waveform after normalisation to the length of the glottal
period, and are thus independent of the absolute F0 level.
For each utterance, an average glottal waveform was also calculated, by
normalising each glottal waveform by its length and amplitude range and then calculating
the mean. This waveform was intended to provide additional information on emotion-
induced changes to the shape (but not the amplitude or duration) of the glottal cycle.

145
Statistical analysis
Acoustic, EGG and physiological measures were analysed in conduciveness by
difficulty by subject mixed model ANOVA, with conduciveness and difficulty as fixed
factors and subject as a random factor. Two separate analyses were performed for the
EGG and acoustic data corresponding to the standard phrase and the extended vowel
respectively. The acoustic measures analysed were the same for both analyses, except
that duration and proportion voiced were not analysed for the extended [a] vowel, since
both these fluency-related measures are only relevant for spoken phrases.
Acoustic measures for the extended [a] vowel
An interaction of conduciveness with difficulty for median and ceiling F0 was due
to higher median F0 (F(1,27)=5.8, p=0.023) and F0 ceiling (F(1,28)=8.7, p=0.006) for
difficult obstructive situations than for difficult conducive situations. The variation of
median and ceiling F0 across conditions corresponded to that of EGG open time, for
which there was an effect of conduciveness (F(1,28)=7.9, p=0.009), indicating that the
vocal folds were open shorter during each vocal cycle in difficult obstructive than in
difficult conducive situations, as shown in figure 6.1.
An interaction of conduciveness with difficulty was measured for EGG closed
quotient (F(1,28)=6.3, p=0.018) and open quotient (F(1,28)=6.9, p=0.014), due to
greater EGG closed quotient and lower EGG open quotient for difficult obstructive than
difficult conducive situations. These effects, shown in figure 6.2, imply longer vocal fold
contact, as a proportion of vocal period, during difficult, obstructive situations than
during difficult, conducive situations.

146
111
113
115
117
conduciveeasy
obstructeasy
conducivedifficult
obstructdifficult
Condition
Med
ian
F0
(Hz.
)
113
114
115
116
117
118
119
120
121
conduciveeasy
obstructeasy
conducivedifficult
obstructdifficult
Condition
Cei
ling
F0
(Hz.
)
88
90
92
94
96
98
100
conduciveeasy
obstructeasy
conducivedifficult
obstructdifficult
Condition
Ope
n tim
e (s
ampl
es)
Figure 6.1. Median F0 (top), ceiling F0 (bottom) and EGG open time for extended [a]
vowel as a function of conduciveness and difficulty. Bars represent 95% within-subject
confidence intervals.

147
Figure 6.3 shows the mean normalised EGG glottal cycles for difficult conducive
and difficult obstructive situations. In this figure, the longer closed quotient for difficult
obstructive situations is apparent in the longer time for the EGG signal to fall from its
maximum amplitude (although because figure 6.3 represents an average across all
speakers, the effect appears small).
0.265
0.27
0.275
0.28
0.285
0.29
conduciveeasy
obstructeasy
conducivedifficult
obstructdifficult
Condition
Clo
sed
Quo
tient
0.46
0.465
0.47
0.475
0.48
0.485
0.49
0.495
conduciveeasy
obstructeasy
conducivedifficult
obstructdifficult
Condition
Ope
n Q
uotie
nt
Figure 6.2. EGG closed quotient (top),and open quotient (bottom) for extended [a]
vowel as a function of conduciveness and difficulty. Bars represent 95% within-subject
confidence intervals.

148
-0.8
-0.6
-0.4
-0.2
0
0.2
0.4
0.6
0.8
1
time
norm
alis
ed a
mpl
itude
Figure 6.3. Mean EGG glottal cycles for extended [a] vowel for the difficult conducive
(broken line) and difficult obstructive (solid line) conditions.
There was a nonsignificant trend for the proportion of energy under 1000 Hertz to
be greater for conducive than for obstructive situations (F(,28)=3.0, p=0.093, which was
mostly due to a lower proportion of low frequency energy for difficult obstructive
situations than the other conditions (see figure 6.4). This effect is not immediately
apparent when looking at the Mel spectrum (figure 6.5), which shows some low (under
1000 Hertz) frequencies for which there is greater energy for difficult obstructive
situations than for the other conditions. This discrepancy might be explained by the fact
that over the larger range of high frequencies, obstructive situations show greater energy
than conducive situations. Therefore, as a proportion of total energy, averaged over the
whole spectrum, the low frequency energy is lower for obstructive situations than
conducive situations. However, close examination of the Mel spectrum reveals that only
considering such global measures as proportion of energy under 1000 Hertz might not
give a clear picture of what is actually happening in the acoustic signal. In this case, there
is clearly an interesting effect of conduciveness and difficulty on a specific range of

149
frequencies from 300 to 700 Hertz. Furthermore, in the case of an [a] vowel this range
of frequencies corresponds to a part of the spectrum between two formants, implying
that a standard formant analysis could not have identified the effect either.
0.85
0.855
0.86
0.865
0.87
0.875
0.88
conduciveeasy
obstructeasy
conducivedifficult
obstructdifficult
Condition
prop
ortio
n of
ene
rgy
Figure 6.4. Proportion of energy below 1000 Hertz for extended [a] vowel as a function
of conduciveness and difficulty. Bars represent 95% within-subject confidence intervals.
0
10
20
30
40
50
60
Frequenc y (Mel)
Pow
er (d
B)
easy conduciveeasy obstructivedifficult conducivedifficult obstructive
Figure 6.5. Mel power spectrum for extended [a] vowel.
Acoustic measures for standard phrase
A main effect of difficulty on median F0 (F(1,28)=4.2, p=0.049) was due to higher
median F0 in difficult than in easy situations (see figure 6.6). An interaction of difficulty

150
and conduciveness on F0 floor (F(1,27)=4.9, p=0.035) was due to higher F0 floor for
easy conducive than easy obstructive situations, but higher F0 floor for difficult
obstructive than difficult conducive situations. A similar difficulty by conduciveness
interaction effect was found for F0 ceiling (F(1,27)=9.3, p=0.005). An interaction effect
of difficulty by conduciveness on open time (F(Figure 1,27)=4.3, p=0.047) was due to
shorter opening time for the difficult obstructive condition that the other conditions.
Figure 6.7 shows F0 ceiling, F0 floor and glottal open time for the standard phrases as a
function of experimental condition.
An interaction of difficulty and conduciveness on low frequency EGG energy
(F(1,27)=4.4, p=0.046) was due to greater low frequency EGG energy for easy
conducive situations than for easy difficult situations, but greater low frequency EGG
energy for difficult obstructive situations than for difficult conducive situations (see
figure 6.8).
122
123
124
125
126
127
128
129
130
conduciveeasy
obstructeasy
conducivedifficult
obstructdifficult
Condition
Med
ian
F0
(Hz.
)
Figure 6.6. Median F0 for standard phrase as a function of conduciveness and difficulty.
Bars represent 95% within-subject confidence intervals.

151
143144145146147148149150151152153
conduciveeasy
obstructeasy
conducivedifficult
obstructdifficult
Condition
Cei
ling
F0
(Hz
.
103
104
105
106
107
108
109
conduciveeasy
obstructeasy
conducivedifficult
obstructdifficult
Condition
Flo
or F
0 (H
z.
81
82
83
84
85
86
87
88
conduciveeasy
obstructeasy
conducivedifficult
obstructdifficult
Condition
Ope
n tim
e (s
ampl
es)
Figure 6.7. Ceiling F0 (top), F0 floor (centre) and glottal open time (bottom) for
standard phrase as a function of conduciveness and difficulty. Bars represent 95%
within-subject confidence intervals.

152
1400
1500
1600
1700
1800
1900
2000
2100
2200
conduciveeasy
obstructeasy
conducivedifficult
obstructdifficult
Condition
low
freq
uenc
y E
GG
ene
rgy
Figure 6.8. Low frequency EGG energy for standard phrase as a function of
conduciveness and difficulty. Bars represent 95% within-subject confidence intervals.
An interaction of difficulty and conduciveness on spectral slope (F(1,27)=11.7,
p=0.002) was measured, with flatter spectral slope for easy conducive situations than for
easy difficult situations, but flatter spectral slope for difficult obstructive situations than
for difficult conducive situations (see figure 6.9). Figure 6.10 shows the Mel power
spectrum for easy and difficult conditions. For the easy condition, the flatter spectral
slope for conducive than for obstructive situations is due to greater energy in the lower
half of the spectrum for obstructive than for conducive situations, but little or no
difference in the upper part of the spectrum. For the difficult condition, the flatter
spectral slope for obstructive than for conducive situations is due to greater energy in the
upper part of the spectrum for obstructive situations than for conducive situations, but
little or no difference in the lower part of the spectrum. It is worth noting that the
proportion of energy below 1000 Hertz showed no significant effects for the
experimental manipulations. Thus spectral slope seems to capture separate, possibly
more global, aspects of spectral change than the proportion of energy below 1000 Hertz
measure, which is more likely influenced by changes to local parts of the spectrum.

153
-6.7
-6.6
-6.5
-6.4
-6.3
-6.2
-6.1
-6
conduciveeasy
obstructeasy
conducivedifficult
obstructdifficult
Condition
spec
tral
slo
pe (
dB/o
ctav
e)
Figure 6.9. Spectral slope for standard phrase as a function of conduciveness and
difficulty. Bars represent 95% within-subject confidence intervals.
0
10
20
30
40
50
60
F req u en cy (M e l)
Pow
er (
dB)
0
10
20
30
40
50
60
Frequency (Mel)
Pow
er (
dB)
Figure 6.10. Mel power spectrum for easy situations (top) and difficult situations
(bottom) for the standard phrase. Solid lines represent conducive condition, broken lines
represent the obstructive condition.

154
Physiological measures
Skin conductance level was higher for obstructive than conducive situations
(F(1,25)=6.3, p=0.019), as were skin conductance response amplitudes (F(1,24)=4.8,
p=0.038; see figure 6.11). However, whereas skin conductance response amplitudes
varied equally with conduciveness in both easy and difficult conditions, the effect of
conduciveness on skin conductance level was larger in difficult than in easy situations, as
shown in figure 6.11.
12.1
12.3
12.5
12.7
12.9
13.1
13.3
conduciveeasy
obstructeasy
conducivedifficult
obstructdifficult
Condition
SC
leve
l (uS
)
0.24
0.29
0.34
0.39
0.44
0.49
0.54
conduciveeasy
obstructeasy
conducivedifficult
obstructdifficult
Condition
Mea
n S
C a
mpl
itude
(uS
)
Figure 6.11. Tonic skin conductance level (top) and mean skin conductance response
amplitude (bottom) as a function of difficulty and conduciveness. Bars represent 95%
within-subject confidence intervals.

155
An interaction trend of difficulty by conduciveness on the number of skin
conductance responses (F(1,23)=4.0, p=0.056) was due to more skin conductance
responses in difficult obstructive situations than the other conditions (see figure 6.12).
2.42.62.8
33.23.43.63.8
44.2
conduciveeasy
obstructeasy
conducivedifficult
obstructdifficult
Condition
num
ber
of r
espo
nses
Figure 6.12. Number of skin conductance responses as a function of difficulty and
conduciveness. Bars represent 95% within-subject confidence intervals.
There was a trend for heart rate variability to be lower for difficult (mean = 40.7)
than for easy conditions (mean = 45.5; F(1,25)=3.4, p=0.078). An interaction of
difficulty and conduciveness on finger temperature (F(1,24)=6.6, p=0.017) was due to
higher finger temperature in difficult conducive than in difficult obstructive conditions,
but no such conduciveness effect in easy conditions (see figure 6.13). Although finger
temperature slope showed the same pattern of means as finger temperature, the effect
was not significant.

156
91.3
91.4
91.5
91.6
91.7
91.8
91.9
conduciveeasy
obstructeasy
conducivedifficult
obstructdifficult
Condition
tem
pera
ture
(F
)
Figure 6.13. Finger temperature as a function of conduciveness and difficulty. Bars
represent 95% within-subject confidence intervals.
easy conduciveeasy obstructive
difficult conducivedifficult obstructive
condition
0.00
50.00
100.00
150.00
cont
ent
9
9
9
9
easy conduciveeasy obstructive
difficult conducivedifficult obstructive
condition
0.00
20.00
40.00
60.00
disa
ppoi
nted
9 99
9
easy conduciveeasy obstructive
difficult conducivedifficult obstructive
condition
0.00
25.00
50.00
75.00
100.00
stre
ssed
9
9
9
9
easy conduciveeasy obstructive
difficult conducivedifficult obstructive
condition
0.00
50.00
100.00
150.00
200.00
satis
fied
9
9
9
9
Figure 6.14. Subjective ratings of felt contentment, disappointment, stress and
satisfaction for the four experimental conditions.

157
Emotion reports
Figure 6.14 shows the mean reported intensity of contentment, disappointment,
stress and satisfaction for each condition. The other emotions are not discussed here,
since they were reported by fewer than five subjects. The four rated emotions were
analysed with conduciveness by difficulty mixed model ANOVA. Only rated intensity of
stress and satisfaction differed as a function of difficulty and conduciveness. Stress was
higher for difficult than for easy conditions (F(1,28)=4.7, p=0.038). Satisfaction was
higher for easy than for difficult conditions (F(1,28)=10.9, p=0.003).
Emotion reports, vocal and physiological measures
To examine how vocal and physiological measures varied with reported emotion,
emotion rating data from the four emotions presented in the preceding section was
collapsed into a categorical emotion variable representing the emotion that was
predominantly felt at that time. For each emotion report, the value of the emotion
variable was set to the emotion that had the highest rated emotion intensity. The last
category was “none” which was the case when subjects reported no felt emotion.
The means and 95% confidence intervals were then plotted for each vocal measure
and physiological measure across the categories of the emotion variable. Those measures
that differed across emotion (using the 95% confidence interval as a criterion) are
reported below.1 Vocal measures for the [a] vowel and the standard phrase have been
collapsed together, since the vocal variables showed the same pattern across reported
emotions for the two types of speech content for all variables discussed below.
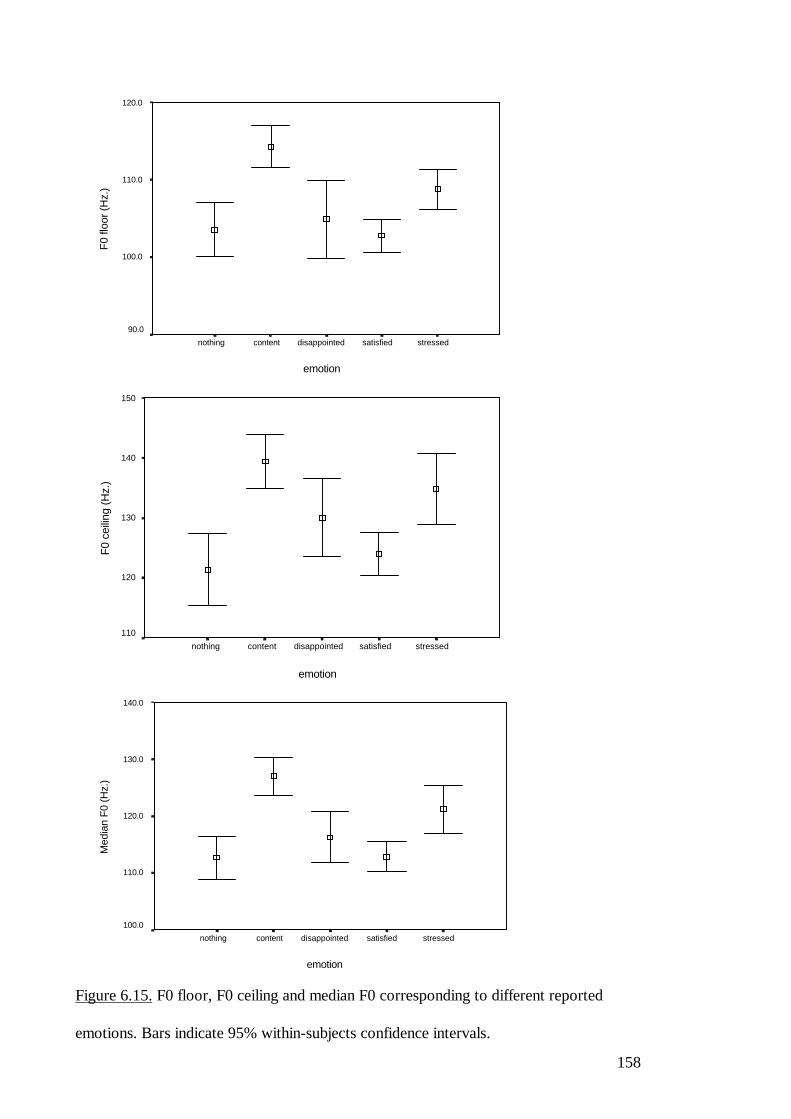
158
emotion
stressedsatisfieddisappointedcontentnothing
F0
floor
(H
z.)
120.0
110.0
100.0
90.0
emotion
stressedsatisfieddisappointedcontentnothing
F0
ceili
ng (
Hz.
)
150
140
130
120
110
emotion
stressedsatisfieddisappointedcontentnothing
Med
ian
F0
(Hz.
)
140.0
130.0
120.0
110.0
100.0
Figure 6.15. F0 floor, F0 ceiling and median F0 corresponding to different reported
emotions. Bars indicate 95% within-subjects confidence intervals.

159
F0 floor, F0 ceiling and median F0 all varied with reported emotion, as shown in
figure 6.15. Fundamental frequency level and range was relatively high when subjects
reported stress or contentment and relatively low when subjects reported
disappointment, satisfaction or no emotion. Values for glottal open time (figure 6.16)
corresponded to this pattern in F0, with low values when stress and contentment were
reported and high values when disappointment and satisfaction were reported. Figure
6.17 shows that spectral slope was relatively flatter when subjects reported
disappointment than when they reported contentment or stress. Speech corresponding to
reported satisfaction or no emotion had the steepest spectral slope.
emotion
stressedsatisfieddisappointedcontentnothing
Ope
n tim
e
100.0
90.0
80.0
Figure 6.16. Glottal open time corresponding to different reported emotions. Bars
indicate 95% within-subjects confidence intervals.

160
emotion
stressedsatisfieddisappointedcontentnothing
Spe
ctra
l slo
pe (
dB/o
ctav
e)-5.5
-6.0
-6.5
-7.0
-7.5
-8.0
-8.5
-9.0
Figure 6.17. Spectral slope corresponding to different reported emotions. Bars indicate
95% within-subjects confidence intervals.
Correlations between dependent measures
Table 6.2 shows the correlations between those physiological and vocal (i.e.
acoustic and EGG) measures which showed differences across experimental conditions.
As can be seen, similar to experiment two there are very few significant correlations.
Mean skin conductance response amplitude correlated positively with low frequency
spectral energy. Apart from this correlation, however, the only significant correlations
are found between physiological measures and EGG measures. This result confirms that
EGG measurement allows one to look more directly than acoustic measures at the
physiological mechanisms that are assumed to underlie emotional changes to speech. The
correlations are nevertheless small in magnitude. Negative correlations between the
measures of skin conductance activity and vocal fold open time and open quotient
indicate that as sympathetic arousal increased, glottal open phase decreased, both in
absolute terms, and as a proportion of glottal period. Corresponding to the lower open
quotient, glottal closed quotient correlated positively with skin conductance activity,

161
hinting that with increased sympathetic arousal, the vocal folds might have been held
together more firmly and thus stayed closed longer, possibly due to increased vocal fold
tension. These correlations were only present for the standard phrase and not for the
extended [a] vowel, which is puzzling given the significant differences measured in
glottal measures across experimental manipulations. For the extended [a] vowel, finger
temperature did correlate positively with glottal open time and open period, and
negatively (although not significantly) with closed quotient. Since finger temperature is
an indicator of parasympathetically-mediated peripheral vasodilation, these correlations
indicate that the vocal folds were held closed longer when parasympathetic activity was
low than when parasympathetic activity was high. A similar pattern of correlations was
observed between finger temperature and closed phase, open phase and open time for the
standard phrase, although the magnitude of the correlations was smaller and they were
not significant. Low frequency EGG energy showed a small correlation with skin
conductance level, although there were no corresponding correlations of low frequency
EGG energy with the other skin conductance measures.
Table 6.3. shows the correlations between vocal measures for both the extended
[a] vowel (top) and the standard phrase (bottom). It can be seen that the overall pattern
of observations is very similar for the standard phrase and the [a] vowel, except that a
number of correlations are weaker or non-existent for the standard phrase. Median F0,
F0 floor and F0 ceiling were all highly correlated. For the extended vowel these
correlations approached unity, reflecting the limited intonation of such vowel
pronunciation. For the standard phrase, F0 floor was only weakly correlated with F0
ceiling, confirming that for utterances, the two parameters describe separate aspects
(level and range) of the F0 contour. Moderate positive correlations of the F0 measures
with energy show that as overall speech energy increases, so does F0.

162

163

164
Moderate negative correlations of the F0 measures with the proportion of energy
under 1000 Hertz indicate that high F0 corresponded to a reduced proportion of low
frequency energy. Weak positive correlations of spectral slope with F0 measures for the
extended vowel were also consistent with a decrease in low frequency energy with high
F0, though the correlations were not evident for the standard phrase. In addition, a
negative correlation of overall energy with low frequency energy indicates that as overall
energy increased, the proportion of energy at low frequencies decreased. For the [a]
vowel, but not for the standard phrase, a positive correlation of overall energy with
spectral slope was measured.
Glottal closed quotient was highly negatively correlated with glottal open time and
open quotient, indicating that as the vocal folds remained closed for a longer proportion
of the glottal period, the vocal open period shortened, both in absolute terms and as a
proportion of total vocal period. F0 median, ceiling and floor all correlated negatively
with open time, indicating that the main change to F0 was brought about by a change to
the length of the glottal open period. The F0 measures also correlated negatively with
open quotient, and positively with closed quotient, for the extended [a] vowel, but not
for the standard phrase. Overall speech energy correlated positively with closed quotient
and negatively with open time. Of particular relevance to the aims of this experiment was
the lack of correlation between low frequency spectral energy and spectral slope, and the
EGG parameters.

165
Table 6.4. Correlations between physiological measures. Figures in bold represent
correlations significant at p < 0.05.
IBIvariability
FT SC level # SCresponses
mean SCRamplitude
IBI variability 1.00 -0.13 0.06 0.07 -0.03FT -0.13 1.00 -0.35 0.04 -0.14SCL 0.06 -0.35 1.00 0.32 0.51# SCRs 0.07 0.04 0.32 1.00 -0.03mean SCR amp. -0.03 -0.14 0.51 -0.03 1.00
Table 6.4. gives the correlations between the physiological measures that were
found to vary significantly with the experimental manipulations. As can be seen, apart
from correlations between skin conductance measures, the only significant correlation
was a negative correlation between finger temperature and skin conductance level. This
indicates that tonic sympathetic arousal as indicated by skin conductance level is
associated with peripheral vasoconstriction. Notably, heart rate variability was not
correlated with skin conductance measures. Insofar as heart rate variability might
indicate parasympathetic activity, no reciprocal sympathetic-parasympathetic activity is
evident here. It is also of note that no correlation was measured between the number of
skin conductance responses and the mean response amplitude, suggesting that both
parameters measure a different aspect of skin conductance activity.
Discussion
Efficacy of the manipulations
Based on the results of experiment two, in which players disengaged from the
obstructive, low power condition, an effort was made in this experiment to ensure that
players did not disengage from the difficult obstructive condition, while still effectively
manipulating goal conduciveness and coping dimensions. Confirmation of the efficacy of

166
the experimental manipulations comes from both subjective reports and physiological
data. Players reported feeling more stressed in difficult than in easy conditions, and more
satisfaction in easy than in difficult conditions. Coupled with these subjective reports
were the skin conductance data, which suggest that players were more sympathetically
aroused in difficult (particularly difficult obstructive) conditions that in easy conditions.
Measurements of finger temperature indicated a greater degree of vasoconstriction for
difficult obstructive situations than for difficult conducive situations, further confirming
that experimental manipulations were effective in eliciting a variety of subjective and
physiological emotional responses.
Effects of the manipulations on the extended [a] vowel
For the extended [a] vowel, F0 median and ceiling showed little or no difference
between easy conducive and easy obstructive conditions, but were higher for difficult
obstructive conditions than for difficult conducive conditions. This interaction effect was
matched by a similar interaction effect of difficulty and conduciveness on glottal open
time. The implication is that under difficult conditions, obstructive events cause a
decrease in glottal open time and hence an increase in F0 compared to conducive events.
A corresponding interaction effect was also found for open and closed quotients,
indicating that under difficult obstructive conditions, the vocal folds remain closed for a
greater proportion of the glottal cycle, at the “expense” of the period during which the
folds are open. This pattern of results corresponds to the description of the effects of
increased laryngeal muscle tension given by Sundberg (1994) according to which the
vocal folds are held in a closed position with greater force. A higher subglottal pressure
is therefore required to build up so as to force open the vocal folds. When the vocal folds
do eventually open, the rush of air through the glottis causes a sudden drop in pressure
due to the Bernoulli effect. The vocal folds are thus rapidly drawn back together again,

167
both under the influence of elastic forces of the increased muscle tension, and the
pressure drop between them. The result, termed “tense voice”, is a more skewed glottal
pulse, with longer closed phase and shorter open phase. Such was the case with the [a]
vowel under difficult obstructive situations compared to difficult conducive situations in
this experiment, as shown in figure 6.2. The pattern of correlations between glottal open
phase, glottal closed phase and F0 (shown in table 6.3) further supports such an
explanation.
Physiological evidence consistent with the F0 and glottal data comes from the skin
conductance data, which show the same difficulty by conduciveness interaction. The
higher skin conductance level and number of responses for the difficult obstructive
condition than for the difficult conducive situation indicates that in difficult situations,
sympathetic arousal was higher in obstructive than in conducive conditions. Finger
temperature indicated a greater degree of peripheral vasoconstriction, consistent with an
increase in sympathetic arousal, in difficult obstructive than in difficult conducive events.
Such high sympathetic arousal is possibly accompanied by increased muscular tension,
including the laryngeal muscles.
The range of changes to F0, glottal phase measures and sympathetic arousal
indicators is in partial agreement with the hypotheses of this experiment. An increase in
sympathetic arousal and laryngeal tension, leading to higher F0, shorter glottal open
phase and longer glottal closed phase, was predicted for difficult condition compared to
the easy condition. It is apparent, however, that as in experiment two, such effects were
depended primarily on an interaction of difficulty with the conduciveness manipulation.
An interaction effect was predicted, although the prediction was that the effects of the
difficulty manipulation would depend upon the obstructiveness manipulation, with
difficulty effects being amplified in obstructive events compared to conducive events.

168
The results of this experiment, however, indicate that the effects of the conduciveness
manipulation often depended upon the difficulty manipulation. Unfortunately, the theory
of Scherer (1986), while not excluding such interaction effects, does not discuss them
either. More will be said about the interaction of appraisal dimensions and the need to
address how such interactions affect the voice in the concluding chapter.
The proportion of energy under 1000 Hertz was also lower for obstructive than for
conducive conditions, particularly in the difficult condition. Such a result could be the
result of a more skewed glottal cycle, as described above, which produces sound with
more energy in higher harmonics. The positive correlation between energy under 1000
Hz and open time and the weak negative correlation between energy under 1000 Hertz
and closed quotient are consistent with such a relation between glottal cycle and spectral
energy. Similar correlations were found in experiment 3a. The correlations measured in
this experiment were very small, however, making it unlikely that manipulation-
dependent changes to the form of the glottal cycle were the sole cause of spectral energy
distribution changes.
Examination of the mean Mel power spectrum also reveals that the most prominent
differences between obstructive and conducive conditions correspond to fairly limited
frequency regions. Such differences, localised in frequency, are more likely a result of
differences to the resonance characteristics of the vocal tract than changes to glottal
function, which would lead to a more global spectral slope change. Indeed, no significant
effects of conduciveness or difficulty on spectral slope were measured for the extended
vowel, implying that the changes in the proportion of low frequency energy were more
localised in frequency, and at last partly due to resonance changes. Such an interpretation
is consistent with the results from experiment two and the predictions of Scherer (1986),

169
based on changes to resonance caused by a more constricted vocal tract in obstructive or
negative conditions.
Effects of the manipulations on the standard phrase.
For the standard phrase, results were similar to those for the extended vowel,
although median F0 showed a main effect of difficulty, with median F0 higher for
difficult than for conducive conditions. For F0 ceiling and F0 floor, an interaction
between difficulty and conduciveness was measured, with higher F0 ceiling and F0 floor
in difficult obstructive conditions than in difficult conducive situations, but an opposite
or no difference between easy obstructive and easy conducive situations. Glottal open
time varied in the same manner, suggesting that changes to the F0 floor, median and
ceiling were due to changes in the length of the glottal open phase.
In contrast with the results for the extended vowel, no significant effects were
found for glottal closed quotient nor glottal open quotient. It is probable that such
parameters are of limited use in describing glottal function when averaged across
multiple different vowels, and across sentences where intonation causes large shifts to
F0. The lower correlations between the glottal and acoustic parameters for the standard
phrase compared to the extended vowel indicate that this is the case.
It is also probable that the mechanisms responsible for changing F0 in a fluent
sentence differ from those at play during steady-state vowel production. A large
influence on F0 in sentences is intonation, which is non-existent in extended vowel
production. Although emotional changes to laryngeal tension might still have an effect on
the opening and closing function of the vocal folds, it is possible that such an effect is
swamped by the influence of emotion on large intonational F0 changes.
Relative to this point, an interesting correspondence between the effects of
difficulty and conduciveness manipulations on F0 ceiling and EGG low frequency energy

170
was measured. EGG low frequency energy had been measured in an exploratory manner
as a possible indicator of larynx movement that could be associated with sentence
intonation. The similarity in results between EGG low frequency energy and F0 ceiling
indicates that larynx movement might well be a significant contributor to emotional
changes to F0 range.
An interaction effect of difficulty and conduciveness on spectral slope was also
measured. Spectral slope was flatter for difficult obstructive than for difficult conducive
conditions, but flatter for easy conducive than for easy obstructive conditions. This result
raises the question of whether the changes observed to spectral slope were due to
changes in vocal fold function. The lack of correlation between spectral slope and any of
the F0 or EGG parameters would seem to suggest that no direct link exists. However,
the Mel spectra in figure 6.10 indicate that the differences between obstructive and
conducive conditions, for both easy and difficult cases, are quite global, stretching over
an extended range of frequencies. One might expect that changes to spectral
characteristics due to vocal tract resonance changes would be concentrated around parts
of the spectrum that correspond to formants, or perhaps anti-formants. This does not
seem to be the case here.
Unfortunately it is also the case that the spectra measured here were averaged over
multiple phonemes, and thus it is impossible to make inferences about individual formant
changes. A more detailed phoneme-by-phoneme formant analysis might be required to
understand the nature of emotion-induced spectral changes to fluent speech. Apart from
being very time consuming however, current techniques of formant analysis are fraught
with inaccuracies. The precise measurement of formant locations, amplitudes and
bandwidths requires very high quality, linear, recordings of speech without phase
distortions (as recorded in an anechoic chamber for example).

171
Conclusion
The results of this experiment indicate that faced with an obstructive situation with
limited coping potential, the body mobilises its resources to actively cope. This it does by
elevating activity in the sympathetic branch of the autonomic nervous system, as
indicated by skin conductance level and skin conductance responses. This elevated
sympathetic activity corresponds to a probable increase in laryngeal tension, which leads
to a corresponding change in the opening and closing of the vocal folds. In addition to a
general speeding up of the vocal cycle, the folds close with more force and remain closed
for a longer proportion of each vocal cycle. The result is a higher fundamental frequency,
as well as a possible increase in the strength of high harmonics and thus in the proportion
of acoustic speech energy at higher frequencies.
For pronunciation of a phrase, as opposed to an extended vowel, some F0
variation is due to the larynx movement involved in intonation, as indexed by the low
frequency EGG signal. Further investigation of larynx movement, possibly using more
accurate measurement techniques such as dual EGG recording from two vertically
separated locations on the neck, is needed to understand how such a mechanism is
affected by different types of emotional response.
Obstructive, challenging conditions also produce more local changes to spectral
distribution, possibly as a result of constriction of the walls of the vocal tract, as
predicted by Scherer (1986). The use of EGG measurements in this experiment has
provided valuable insights into the changes that occur in vocal fold function due to
emotional physiological responses, but has not provided clear results with respect to
spectral changes. An understanding of the causes of emotional spectral changes to
speech will require further use of such EGG techniques in combination with accurate
formant analysis.

172
1 Multivariate techniques of analysis, such as ANOVA, were not used in this instance
since they make implicit assumptions about the dependent and independent variables,
which we do not wish to make here (subjective ratings are as much a dependent
variable as vocal and physiological measures). In addition, given the unbalanced nature
of the repeated measures design, with eight unequally represented categories of
emotion, violations of the sphericity assumption in a repeated measures ANOVA would
be severe.

173
7. General Discussion
This thesis has focussed on the changes to the voice produced by emotion, with an
emphasis on physiological push effects as described by Scherer (1986). The principal aim
of the research was to test competing models of emotional changes to voice production.
Scherer’s predictions of a multi-dimensional pattern of changes based on emotion
antecedent appraisal outcomes were tested against the competing theory of one
underlying physiological arousal mechanism being responsible for changes to emotional
speech. In a series of three experiments, computer games and tasks were manipulated in
such a way as to provoke emotion appraisals along a small number of appraisal
dimensions. Acoustic and electroglottographic recordings of standard phrases and
vowels were made in conjunction with physiological measurements in an effort to
elucidate some of the mechanisms responsible for the resulting emotional changes to
speech.
In experiment one, the paradigm of using computer games as a means of inducing
and studying emotional responses was tested. Two appraisal dimensions, intrinsic
pleasantness and goal conduciveness, were manipulated in the computer game. At set
moments immediately following game manipulations, players were prompted to provide
a verbal report of the game situation, which was recorded for subsequent analysis. The
results from the first experiment indicated that the two appraisal dimensions affected
speech acoustics in two distinct ways. Manipulations of the intrinsic pleasantness of
game situations produced changes to the spectral characteristics of speech, with
unpleasant situations leading to a greater proportion of high frequency energy than
pleasant situations. This result was consistent with Scherer's prediction (1986) based
upon the hypothesis that unpleasant situations lead to a response that includes the
constriction of the vocal tract, a configuration that causes relatively greater resonance at

174
high frequencies than the unconstricted vocal tract corresponding to pleasant situations.
Manipulations of goal conduciveness lead to changes primarily to energy and F0
parameters. Goal obstructive game events were followed by speech with higher F0 floor
and energy than were goal conducive situations. This result was not consistent with
Scherer’s original (i.e. Scherer, 1986) predictions for goal conduciveness appraisals. A
possibility was that the game manipulation of goal conduciveness also inadvertently led
to other appraisals such as that of discrepancy. Appraisals of goal discrepancy should,
according to Scherer, lead to an increase in sympathetic arousal and muscle tension that
would cause a higher F0. Players’ emotion reports lent credence to such an explanation,
with more surprise being reported after obstructive than after conducive game events.1
Aside from addressing the specific predictions made by Scherer, data from experiment
one also indicated that emotional changes to speech occurred along at least two, and
possibly more, dimensions. It was concluded that such a result is inconsistent with the
hypothesis that emotional changes to speech reflect the effects of a single dimension of
physiological arousal.
Experiment two was designed to address the major problem with experiment one,
namely the possibility that the goal conduciveness manipulation had also provoked other,
unintended appraisals. A new manipulation of goal conduciveness was designed in which
the game situation was identical in both conducive and obstructive conditions, except for
the manipulation of conduciveness by awarding or penalising the player points. In
addition, the appraisal dimension of coping potential was studied by manipulating the
players’ control of their space ship and the power they had to defeat enemies. All the
manipulations in experiment two were also designed to last a number of seconds, so that
effects on the voice and physiology could be measured without pausing the game. A

175
number of physiological measurements were made in an effort to more directly measure
the physiological changes due to appraisal that might in turn affect vocal production.
Experiment two provided additional evidence that a simple arousal model of
emotional response could not be used to explain all the observed emotional changes to
vocal production. Manipulations of conduciveness produced changes to overall energy of
the speech signal, whereas control manipulations produced main effects in F0 range and
F0 floor. Median F0, and the proportion of energy below 1KHz changed according to
the interaction of conduciveness and power manipulations. The fact that the different
acoustic parameters showed such distinct effects of different experimental manipulations
implies that multiple mechanisms, rather than a single arousal mechanism, are responsible
for such vocal changes. Further support for such a conclusion was drawn from the lack
of unidimensional covariance of the physiological measurements. Thus the very notion of
“physiological arousal” as a quantifiable and scientifically useful construct was brought
into doubt.
The results of experiment also highlighted some areas in which Scherer’s
predictions of the effects of multiple appraisal outcomes on the voice need to be made
more specific. For example, instead of appraisal outcomes producing a cumulative,
additive effect on voice production, there was an interaction between appraisals in
determining vocal changes. In particular, manipulations of power interacted with
manipulations of conduciveness to produce effects on physiology and voice. The theory
of Scherer does not exclude that the outcome of one appraisal might depend on the
output of other appraisals, and thus lead to interaction effects on the voice. However, the
lack of an explicit description of exactly how multiple appraisals combine in their effects
on the voice makes it difficult to test the predictions empirically.

176
The finding in experiment two of greater low frequency energy for conducive than
for obstructive events under high power conditions was consistent with Scherer’s
hypothesis of constriction of the vocal tract for obstructive events leading to greater
resonance of higher frequencies. No such conduciveness effect was found for low power
conditions however. In addition, consistent with results from experiment one was the
finding of greater F0 values for obstructive events than for conducive events in high
power situations, although no such difference in low power conditions was measured.
Since experiment two had specifically been designed to other, uncontrolled factors as the
cause of such F0 changes (as there might have been for experiment one), the effect of
higher F0 values for obstructive than conducive situations seems to indicate greater
arousal during these conditions.
Such an explanation was supported by the data for heart rate variability, which was
consistent with lower parasympathetic activity for high power, obstructive than high
power conducive conditions. The data for skin conductance response amplitude
indicated a higher level of sympathetic arousal for obstructive situations than for
conducive situations regardless of power however, a result matched by greater overall
speech energy for obstructive than for conducive situations. These results would seem to
indicate that although sympathetic arousal plays a role in modulating certain vocal
characteristics, the mapping is not one-to-one. Unfortunately, the complexity of the
experimental design (a three factor factorial design), in experiment two, together with
the lack of more direct measures of vocal physiology, made it impossible to ascertain
with more precision the relationship between physiological changes and vocal changes.
Experiment three was designed to address these questions. In addition to
physiological measures, EGG was used to provide a more direct measure of changes to
vocal fold opening and closing as a function of experimental manipulations, and in

177
relation to concurrent acoustic changes to speech. Further refinements were made to the
experimental design, including concentrating on only two manipulated appraisal
dimensions, conduciveness and coping potential, in order to reduce complexity and make
the results more easily interpretable. In addition, the coping potential manipulation was
designed and pretested specifically so as not to lead to disengagement under the most
difficult condition, as might have happened in experiment two.
Results indicated that as with experiment two, changes to vocal measures
depended not only on individual manipulated appraisal dimensions, but also interactions
between them. The increased experimental control and more simple design of experiment
three led to results for vocal and physiological measures that were more consistent than
those of experiment two. In addition, EGG measures were found to be particularly useful
in interpreting F0 changes, and in linking them to changes to physiology.
Specifically, it was found that difficult, obstructive conditions led to generally
higher F0 (range and level) than difficult conducive conditions. For extended [a] vowels,
these changes in F0 were mirrored closely by a conduciveness by coping interaction for
skin conductance data and for finger temperature, indicating that sympathetic arousal
was higher in difficult obstructive than in difficult conducive conditions. Examining the
EGG measures revealed that the F0 changes could be explained in terms of shorter
glottal open times for obstructive situations. In addition, longer relative closed phases
and shorter relative open phases were consistent with raised laryngeal tension in difficult
obstructive conditions. Correlations between acoustic, EGG and physiological data,
though still small, supported these interpretations.
The picture for standard phrases was similar, although there was less
correspondence between physiological data and F0 measures. Measurement of low
frequency EGG signal energy indicated that larynx movement is likely an important

178
determinant of F0 variation in emotional speech. In pronunciation of full phrases or
sentences, such movement of the larynx, associated with speech intonation, is likely to
dominate more subtle changes in vocal fold function due to changes in laryngeal tension.
This experiment revealed that both low frequency EGG signal and F0 ceiling were higher
in easy conducive and difficult obstructive conditions than in easy obstructive or difficult
conducive situations, though the mechanisms behind such an interaction effect are were
unclear.
For both extended [a] vowels and standard phrases, there was evidence for a lower
proportion of energy at low frequencies for difficult obstructive than for difficult
conducive conditions. This result was partly consistent with Scherer's predictions that
obstructive situations would lead to constriction of the vocal tract and thus more
resonance of higher frequencies. There were also indicators that changes to spectral
slope were brought about partly by changes to vocal fold function, with tense voice
having more high frequency energy and a less steep spectral slope, as described by
Sundberg (1994).
Can emotional vocal changes be explained with an arousal model?
The primary aim of this research was to test unidimensional arousal theories of
emotional speech against multidimensional models. The results from the three
experiments clearly mitigate against a simple arousal model. In all three experiments,
patterns of change across different vocal – and physiological – measures did not covary
with experimental manipulations as one would predict under an arousal hypothesis.
Instead, while some measures were influenced primarily by manipulations of
conduciveness or pleasantness, others were influenced by manipulations of coping while
still others were changed by interactions between appraisal dimensions.

179
The most compelling evidence against a single arousal dimension came, however,
from the physiological measurements. Skin conductance response amplitude and finger
temperature were found to vary as a function of conduciveness, whereas the number of
skin conductance responses and skin conductance level were determined by interactions
between conduciveness and coping. Heart rate variability, which reflects both
sympathetic and parasympathetic influences, was found to vary primarily as a function of
coping.
Given what is now known about the organisation of the peripheral nervous system,
this should come as no surprise. The sympathetic and parasympathetic branches can both
be activated largely independently of one another (Bernston, Cacciopo, Quigley, and
Fabro, 1994). Different combinations of parasympathetic and sympathetic activity
provide the body with more possible responses to the variety of emotional situations
encountered, as well as subserving more basic homeostatic functions. Thus reciprocal
activation of sympathetic and parasympathetic branches (i.e. the activation of one and the
deactivation of the other) leads to a relatively stable response with a high dynamic range
(Bernston et al., p. 45). Such a response might be suitable for unambiguous situations in
which a clear, and extreme response is required, such as confrontation with a clearly
threatening stimulus. Coactivation of both branches leads to an inherently unstable
system (Bernston et al., 1994), in which small changes to activation in one of the
branches can lead to a sudden change in organ end state. Such a mode of activation
might be appropriate in highly relevant, but ambiguous situations.
Although it is unclear how such different modes of autonomic functioning
correspond to, or affect voice production, it is clear that the concept of one arousal
dimension producing concomitant changes to vocal measures is no longer tenable. The
results of this series of experiments have largely confirmed this.

180
Can emotional vocal changes be explained with an appraisal model?
The alternative model tested in this thesis has been the appraisal theory of Scherer
(1986), which proposes that situations are appraised by people along a number of
pertinent dimensions, with each appraisal outcome producing an adaptive pattern of
physiological responses, with predictable consequences on voice production. It should
again be noted, however, that appraisal theory was used in this research as a principled
way in which to examine emotional changes to voice production. One of the core aspects
of appraisal theory – that appraisals themselves are subjective evaluations, and do not
map one-to-one onto situations - was deliberately avoided in this research by designing
experimental manipulations that were as unambiguous as possible. The link between
appraisal outcomes and changes to speech and physiology is already highly complicated,
with many unknown parameters. To ensure that the results of the experiments in this
thesis could be meaningfully used to test or falsify competing hypotheses, it was deemed
necessary to eliminate any possible additional variation due to the link between situation
and appraisal outcome.
The most consistent agreement of the data with Scherer’s predictions was that
unpleasant or obstructive conditions led to speech with a lower proportion of low
frequency energy than conducive conditions, albeit only for difficult situations in
experiment three. Although mechanisms underlying such a change remain unclear, it
seems likely that changes to vocal tract resonance, as suggested by Scherer, are at least
partly involved. Scherer also suggested a link between appraised coping potential
(specifically control) and sympathetic arousal, that should be associated with changes to
laryngeal muscle tension and thus changes to F0. Such changes were found (for example,
the higher value of F0 for high control versus low control in experiment two), although
in most cases, coping potential (as manipulated with control and power in experiment

181
two, and difficulty in experiment three) interacted with conduciveness in producing vocal
and physiological effects.
The fact that in the last two experiments, the majority of effects found involved
interactions between coping potential and conduciveness manipulations represents the
greatest problem in comparing these results with Scherer's predictions. According to
Scherer, the outcome of each appraisal dimension can be expected to produce changes to
physiology, and therefore the voice, relatively independently of the other appraisal
dimensions. The result of a combination of appraisal outcomes will thus be the
cumulative effect of individual appraisal effects. To the extent that two appraisal
dimensions produce effects on different physiological organs, one might thus expect their
measured effects on resulting speech to be independently measurable. For example,
Scherer makes the prediction that appraisals of goal conduciveness will cause changes to
the configuration of the vocal tract, whereas appraisals of coping potential (specifically
power) will cause changes to the tension of laryngeal muscles. Since vocal tract
configuration has relatively little or no effect on F0, one would predict that
manipulations of coping potential would produce changes to F0 regardless of any
concurrent manipulations of conduciveness. This was clearly not the case in this
research. Consistent interaction effects of conduciveness and coping potential on vocal
measures were found.
One possibility is that the subjective appraisal of the manipulated events on one
dimension depended upon the appraisal on the other dimensions. Hence, rather than
coping being appraised as low in conducive, difficult situations, the appraisal of coping
might simply not have happened, or at least might have been accorded less importance,
following an appraisal of the situation as conducive. Scherer indeed allows for this type
of process in his sequential appraisal theory, with the outcome of one appraisal feeding

182
into and influencing the outcome of succeeding appraisals. The interactions observed in
this experiment might be explained by such a mechanism, although given that we have no
knowledge of exactly how each situation was subjectively appraised by the speakers, we
cannot be sure either way. Clearly it would be preferable in future studies to collect data
on how all manipulated situations are appraised. One suspects, however, that overt
verbal reports of appraisal of obviously easy or difficult situations will reflect the
obviously intended appraisal, rather than the possibly automatic or unconscious appraisal
that actually occurred.
How does appraisal affect the voice and physiology?
Another possible explanation for the interaction effects of appraisal dimensions on
vocal changes observed in this research is that appraisal outcomes are combined in some
way before an emotional response is generated. The idea that physiological and
expressive emotional responses might be organised at the level of specific combinations
of appraisal outcomes, rather than at the level of individual appraisals, is not contrary to
the basic tenets of appraisal theory. Appraisal theorists are in broad agreement on the
role of cognitive evaluations in eliciting emotions, and the core set of evaluative
dimensions involved. There is, however, a lack of agreement over how appraisals
organise emotional responses, including subjective feeling, physiology, and facial and
vocal expression. Smith and Lazarus (1990) make the distinction between a molecular
level of organisation, in which responses are organised at the level of single appraisals,
and a molar level of organisation, in which responses are organised around patterns of
several appraisals or even more holistic "core relational themes" (see Lazarus, 2001;
Lazarus, 1991; Smith and Lazarus, 1990).
Most appraisal researchers who have made specific predictions of the effects of
appraisal results on response patterning have done so at a molecular level, i.e.,

183
suggesting specific effects of appraisal results separately for each evaluation dimension
(e.g. Scherer, 1986; Smith, 1989; Schmidt, 1998; Wehrle, Kaiser, Schmidt and Scherer,
2000). In making predictions for full-blown emotional responses, the individual appraisal
effects are usually combined additively.
It seems likely, however, that at least some emotional response patterns reflect
highly learned combinations of appraisal outcomes occurring simultaneously. One
argument for the existence of such combined appraisals is that by combining appraisal
outcomes a more coherent understanding of the appraised situation will result. Such an
understanding should enable more appropriate response preparation to be undertaken.
For example, confronted by an overly inquisitive flying insect that is possible, though
difficult to escape (moderate coping potential), knowing whether or not the insect can
bite (goal conduciveness) would be highly useful in determining whether to prepare the
body for escape, and therefore whether to increase sympathetic arousal. The extreme
form of a combined-appraisal view, holds that it is the total appraised meaning of the
situation that leads to a coordinated, adaptive response (Smith and Lazarus, 1990, p.
624) or action tendency (Frijda, 1986). Such coordinated responses are not contrary to
the principles of appraisal theory, nor are they equivalent to the idea of completely “hard-
wired” emotion circuits. The subjective appraisal of a situation is still at the core of such
a mechanism.
The level of organisation, single or combined, with which emotional responses are
organised, has a direct bearing on the study of changes to speech due to appraisal. Given
a single-appraisal level of organisation, one might be able to find specific acoustic vocal
parameters which serve as markers of single appraisals. For example, eyebrow frown and
heart rate changes have been linked to appraisals of goal obstruction and anticipated
effort (Smith, 1989). In this thesis there is some evidence that changes to spectral energy

184
distribution are primarily related to appraisals of pleasantness or conduciveness.
However, at least in the case of the vocal measures examined herein, it seems that the
effect of a given appraisal dimension on vocal characteristics often depends on other
appraisal outcomes. Thus sympathetic arousal and F0 changes depend on the combined
meaning of conduciveness and coping potential appraisals, as indicated in particular by
the results of experiment three.
This does not imply that vocal measures cannot be used as indicators of single
appraisal dimensions. One must simply be careful to keep other appraisal dimensions
constant, and be aware of their influence on the measures of interest should they change.
Thus both F0 and high frequency spectral energy could be used as consistent measures of
coping potential only when studying goal obstructive situations. It is equally possible that
research on other response modalities, such as autonomic physiology or facial
expression, would benefit by considering the interaction between different appraisal
dimensions. Research on the cardiovascular indicators of coping (e.g. Smith, Ellsworth
and Pope, 1990; Pecchinenda and Smith, 1996) for example, might benefit from
explicitly examining the effects of goal conduciveness (e.g. by using reward or
punishment) on manipulations of coping.
How do emotional changes to physiology affect the voice?
This research has differed from most previous research on emotional speech in two
aspects. The emotional speech examined was not acted, but rather elicited using
manipulations of games and tasks. Furthermore, in an effort to understand the
mechanisms underlying emotional changes to speech, physiological measures were also
taken. In the last two experiments of this research, the correspondence between vocal
measures and physiological measures was examined, both in terms of how each measure

185
was affected by the experimental manipulations, as well as directly through correlational
analysis.
Direct correlations between vocal and physiological measures were very low in
both experiments, indicating a low degree of correspondence in their general (i.e. non-
manipulation specific) variation. The lack of higher correlations is probably due to two
factors. First, despite efforts to control for other sources of physiological and vocal
variation, the largest amount of variation to both types of measures is due to non-
experimental factors. Such non-controlled variation will mask any manipulation-specific
correlations. Second, the physiological measurements made were necessarily very
indirect measures of vocal physiology. Although it is possible to directly measure
laryngeal muscle tension, lung volume, subglottal pressure and the position and tension
of vocal tract muscles, such measurements are extremely invasive and would thus
interfere with the emotion induction procedure. Nevertheless, in experiment three, EGG
recordings were successfully used to “bridge the gap” between acoustic and
physiological measures. Correlations between EGG measures, acoustic measures and
physiological measures showed a covariation of glottal measures such open time and
closed phase, with autonomic measures such as skin conductance activity and finger
temperature, and acoustic measures such as F0. Thus sympathetic arousal was seen to
correspond to shorter glottal open time, and thus higher F0, confirming the role that
sympathetic arousal plays in emotional effects on F0.
The patterns of physiological and vocal changes across experimental conditions
showed that fluency changes (in the second experiment), as well as spectral changes and
changes to F0 range, could not be fully explained by sympathetic arousal. However,
interactions of conduciveness and coping potential consistently produced changes in
sympathetic arousal, as indexed by skin conductance activity and finger temperature, as

186
well as corresponding changes to glottal open time, glottal open phase, glottal closed
phase, and F0 measures. Such changes indicate that at least for some vocal measures,
changes due to emotion are mediated by changing autonomic activity. These results are
consistent with the research of Jürgens (1979, 1988, 1994), who has suggested that the
functional evolution of vocalisation is reflected in three hierarchically organised neural
systems, the second of which, consisting of the mid-brain periaqueductal gray, parts of
the limbic system including the hypothalamus, midline thalamus, amygdala and septum,
and the anterior cingulate cortex, is also central to the generation and regulation of
emotion. Consistent with the ideas of Jürgens, the Polyvagal Theory of Emotion of
Porges (1997) posits a special role of the Ventral Vagal Complex, which includes both
somatic and visceral efferent neural fibres of the cranial nerves, in both the rapid
regulation of metabolism to meet environmental challenges, and the production of
emotional expressions, including vocalisations. Organised neural structures have also
been identified in the midbrain periaqueductal grey (PAG) that are involved in
differentiated emotional responses and are also fundamental to the control of respiratory
and laryngeal functioning during vocal production (Davis, Zhang, Winkworth & Bandler,
1996; Bandler & Shipley, 1994). Interestingly, these studies indicate that control of the
vocal tract and articulators is mediated by separate mechanisms, which might explain
why emotion-invoked changes to speech fluency and spectral energy distribution did not
covary consistently with skin conductance measures.
Integrating these results, a picture develops of an emotional expression system that
makes up part of a more general emotional response system, in which specific brainstem
nuclei, activated via pathways from the limbic system, co-ordinate the activation of
groups of laryngeal and respiratory muscles leading to specific vocal patterns. It remains
to be seen if such neural mechanisms are organised around appraisals, as suggested by

187
Scherer (1986) and other appraisal theorists (see Smith and Scott, 1997). It also remains
unclear to which extent such mechanisms are the exclusive result of automatic processing
or might, particularly in humans, also be engaged in a controlled manner. If the latter is
the case, then one would expect the characteristics of voluntary emotional speech to
largely correspond to those of speech perturbed by involuntary emotional responses, as
had been suggested by Scherer (1986).
Conclusions and directions for future research
This research represents a first attempt to systematically study the changes to
speech that are produced by emotion. In attempting to integrate current theories of
emotion, psychophysiology and speech production, modest progress has been made in
understanding what mechanisms underlie changes to speech under emotional conditions.
The idea that the effects of emotion on speech are limited to the effects of general
physiological arousal has been refuted. Although some changes to emotional speech,
such as those involving the vocal folds, were shown to depend largely on sympathetic
arousal, other speech characteristics, such as speech fluency and spectral energy did not.
An alternative view, that changes to speech reflect changes to the underlying speech
physiology resulting from appraisals of the environment along a number of appraisal
dimensions, has received some support. Changes to a number of speech variables were
measured in response to manipulations of pleasantness, goal conduciveness and coping
potential. In finding that vocal changes often result from the interaction of appraisal
dimensions, this research has also identified an area where appraisal theories of
emotional speech need to be made more explicit. In particular, the mechanisms by which
interactions of goal conduciveness and coping potential consistently produce effects on
vocal and physiological measures need to be specified.

188
A number of additional questions remain as to the mechanisms responsible for
emotional changes to speech characteristics. In particular, consistent changes to the
spectral distribution of energy across different emotional conditions defy simple
explanation in terms of vocal fold function or resonance changes. F0 variation, while
partly affected by the changes to vocal fold function that correspond to sympathetic
activation of the ANS, also seems to change as a function of larynx movement. The latter
does not show a connection to sympathetic arousal, and given its role in speech
intonation, might reflect the effects of emotion on cognitive planning. Given current
interest in the topic of cognition and emotion, and how cognitive and emotional factors
interact in phobias, anxiety disorders and depression (as indexed by a number of recent
books on these topics, e.g. Dalgleish and Power, 1999; Eich, Kihlstrom, Bower, Forgas,
and Niedenthal, 2000), research on the possible cognitive mediators of emotional
changes to speech intonation and fluency could prove fruitful.
It should also be noted that the participants in these experiments were
predominantly young males, and in the case of the first experiment, were all adolescents.
There are reasons to believe that the results from these experiments can be generalised to
a large degree to females and older populations. There is no empirical evidence to
suggest that the way that speech physiology is influenced by emotion, differs
fundamentally with sex or age. The mechanisms of vocal fold vibration, and resonance of
the glottal sound wave through the vocal tract, are basically the same in males and
females of different ages. Indeed, in these experiments, the results from adolescent
speakers in experiment one were consistent with the results of subsequent experiments
with young adults. This fits with previous studies that have shown that for a range of
acoustic parameters, including f0 measures and formant frequencies, there is no
interaction between speaker or age and phonetic context (e.g. Whiteside & Hodgson,

189
2000). Nonetheless, although the basic mechanisms are likely to be the same across age
and sex of the speaker, some important age- and gender-specific differences can be
expected. The most obvious difference is that children and pre-pubescent adolescents
have a significantly less massive and differently positioned vocal apparatus than adults,
particularly for males for whom the larynx starts to descend as early as age 7 or 8 years
(Woisard, Percodani, Serrano, Pessey, 1996). The result is not simply a scaling of
fundamental frequency and formants. Vocal fold vibration modes in particular are likely
to be different in children than in adults, due to their different length and mass, and might
be differently affected by emotional physiological changes. A similar argument applies to
female speakers, for whom the vocal folds do not change following puberty to same
extent as for males. Further differences might result from the interaction between F0 and
formant frequencies that can take place with children's and female's voices (due to the
much higher F0 than adult male speakers). For example, studies have found that formant
frequencies and amplitudes depend upon a combination of vocal intensity and speaker
age and sex (Huber, Stathopoulos, Curione, Ash & Johnson, 1999). Unfortunately, it is
impossible even to speculate on the nature of emotion-dependent acoustic differences in
females and children, given the paucity of research on the topic. As mentioned earlier in
this thesis, female and child voices are intrinsically more difficult to analyse precisely
because of such F0-formant interactions; such difficulties would need to be overcome in
future research on emotional speech in these populations.
There are a number of obvious avenues for the continuation of this research. As
has been discussed, much can be done to improve and expand upon the acoustic and
physiological measures examined. Accurate formant analysis, using linear, non-phase
distortion recording equipment, could be used in combination with more accurate
laryngeal measurements, to better understand the causes of emotional changes to spectral

190
energy distribution. The formant analysis would need to include not only measurement of
formant frequency, but also bandwidth and amplitude. Laryngeal measurements could
include photoglottography, which would yield a precise measurement of the form of
vocal fold closure. With non-phase distorted recordings, accurate inverse filtering
techniques could also be used to arrive at an estimate of glottal airflow under different
emotional conditions (see Klasmeyer, 1998 for an example of such an approach).
An extension of the current research to other appraisal dimensions is warranted. In
particular, an examination of those appraisal dimensions concerning social situations
would seem particularly relevant to vocal expression, although it is unclear whether the
distinction between push and pull factors could be maintained in such a study. In
addition, further measurement of the same appraisal dimensions as those studied in this
thesis, but with different instantiations or in different contexts are needed. In order to
examine more intense forms of emotion, it might be necessary to resort to non-
experimental, or quasi-experimental designs. Portable voice recording and physiological
recording systems are now available that make it feasible to monitor and record speech
and physiology online in real emotion-inducing situations outside the laboratory.
Although activities involving physical movement are excluded due to the artefacts they
would produce in physiological measurements, it might be possible to successfully record
speech and physiology in situations such as interviews or public presentations.
The study of the expression of emotion in the voice, in particular the involuntary
effects of emotion on speech, has for a long time received much less attention than the
perception of emotional speech. The reasons are numerous, but primary among them no
doubt is the time-consuming nature and difficulty of eliciting emotions in the laboratory,
recording and analysing speech, and recording and analysing physiology. As has been
evident in this research, the results of such a long-winded undertaking are often

191
inconsistent and contradictory. However, such a continued effort is required if we are to
develop more than the rudimentary understanding of emotional speech that we currently
possess.
1 Although Scherer (1986) originally made a distinction between goal conduciveness
appraisals and discrepancy appraisals, in the most recent version of Scherer’s theory
(Scherer, 2001; Scherer, personal communication), goal conduciveness and discrepancy
are treated as the same appraisal dimension. Thus, obstructive/discrepant appraisal
outcomes are predicted to produce changes to the voice corresponding to the predictions
for obstructive appraisals and discrepant appraisals previously published.

192

193
References
Alpert, M., Kurtzberg, R. L. & Friedhoff, A. J. (1963). Transient voice changes
associated with emotional stimuli. Archives of General Psychiatry, 8, 362-365
Anderson, C. A., & Ford, C. M. (1986). Affect of the game player: Short-term effects of
highly and mildly aggressive video games. Personality and Social Psychology
Bulletin, 12, 390-402.
Arnold, M. B. (1960). Emotion and personality. (Vol.1). Psychological aspects. New
York: Columbia University Press.
Bachorowski, J. A., & Owren, M. J. (1995). Vocal expression of emotion is associated
with formant characteristics. Paper presented at the 130th meeting of the
Acoustical Society of America, St. Louis, MO.
Bachorowski, J. A., & Owren, M. J. (1998). Laughter: Some preliminary observations
and findings. In A. H. Fischer (Ed.), Proceedings of the Xth conference of the
International Society for Research on Emotions. (pp. 126-129).Wuerzburg:
International Society for Research on Emotions.
Baddeley, A. (1986). Working memory. Oxford: Clarendon Press.
Bandler, R. & Shipley, M. T. (1994). Columnar organization in the mid-brain
periaqueductal gray: modules for emotional expression? Trends in
Neuroscience, 17, 379-389.
Banse R. & Scherer, K. (1996). Acoustic profiles in vocal emotion expression. Journal of
Personality and Social Psychology, 70(3), 614-636
Banse, R., Etter, A., Van Reekum, C. & Scherer, K. R. (1996). Psychophysiological
responses to emotion-antecedent appraisal of critical events in a computer
game. Poster presented at the 36th Annual Meeting of the Society for
Psychophysiological Research, Vancouver, Canada, 16-20 October 1996.

194
Baum, S. R., Pell, M. D. (1999). The neural bases of prosody: Insights from lesion
studies and neuroimaging. Aphasiology, 13, 581-608.
Berntson, G. G., Cacioppo, J. T., Quigley, K. S., & Fabro, V. T. (1994). Autonomic
space and psychophysiological response. Psychophysiology, 31, 44-61.
Berry, D. C. (1987). The problem of implicit knowledge. Expert Systems, 4, 144-151.
Boiten, F. (1996). Autonomic response patterns during voluntary facial action.
Psychophysiology, 33, 123-131.
Boiten, F. (1993). Emotional breathing patterns. Doctoral dissertation, University of
Amsterdam.
Boiten, F. A. (1998). The effects of emotional behaviour on components of the
respiratory cycle. Biological Psychology, 49, 29-51.
Boiten, F. A., Frijda, N. H., & Wientjes, C. J. E. (1994). Emotions and respiratory
patterns: Review and critical analysis. International Journal of
Psychophysiology, 17, 103-128.
Borden, G.J., & Harris, K. S. (1994). Speech science primer. Physiology, acoustics and
perception of speech, 3rd Ed. London: Williams & Wilkins.
Bradley, M. M. & Lang, P. J. (2000). Measuring emotion: Behavior, feeling, and
physiology. In R.D. Lane, L. Nadel, G. L. Ahern, J. J. B. Allen, A. W.
Kaszniak, S. Z. Rapcsak, & G. E. Schwartz (Eds.), Cognitive neuroscience of
emotion (pp. 242-276). New York: Oxford University Press.
Bunn, J.C. & Mead, J. (1971). Control of ventilation during speech. Journal of Applied
Physiology, 31, 870-872.
Cacioppo, J. T., Berntson, G. G., Larsen, J. T., Poehlmann, K. M., & Ito, T. A. (2000).
The psychophysiology of emotion. In R. Lewis & J. M. Haviland-Jones (Eds.),
The handbook of emotion, 2nd Ed (pp. 173-191). New York: Guilford Press.

195
Cacioppo, J. T., Klein, D. J., Berntson, G. G., & Hatfield, E. (1993). The
psychophysiology of emotion. In R. Lewis & J. M. Haviland (Eds.), The
handbook of emotion (pp. 119-142). New York: Guilford Press.
Cacioppo, J. T., Tassinary, L. G., & Fridlund, A. J. (1990). The skeletomotor system. .
In J. T. Cacioppo & L. G. Tassinary (Eds), Principles of psychophysiology:
Physical, social, and inferential elements. (pp. 325-384). New York: Cambridge
University Press.
Cannon, W. B. (1929). Bodily changes in pain, hunger, fear, and rage (2nd ed.). New
York: Appleton.
Childers, D. G., & Krishnamurthy, A. K. (1985). A critical review of electro-
glottography. Critical Reviews in Bioengineering, 12(2), 131-161
Cornelius, R. R. (1996). The science of emotion. Upper Saddle River NJ: Prentice Hall.
Cosmides, L. (1983). Invariances in the acoustic expression of emotion during speech.
Journal of Experimental Psychology: Human Perception and Performance, 9,
864-881.
Dalgleish, T. & Power, M. J. (Eds.). (1999). Handbook of cognition and emotion.
Chichester, England: John Wiley and Sons.
Daniloff, R., Schuckers, G., & Feth, L. (1980). The physiology of speech and hearing.
Englewood Cliffs, NJ: Prentice-Hall.
Darwin, C. (1872). The expression of emotions in man and animals. London: John
Murray (3rd. edition, P. Ekman (Ed.). London: HarperCollins, 1998).
Davidson, R. J., Gray, J. A., LeDoux, J. E., Levenson, R. W., Panksepp, J., & Ekman, P.
(1994). Is there emotion-specific physiology? In P. Ekman, & R. J. Davidson.
(Eds.), The nature of emotion: Fundamental questions. (pp. 235-262). New
York: Oxford University Press.

196
Davis, P. J., Zhang, S.P., Winkworth, A., & Bandler, R. (1996). Neural control of
vocalization: Respiratory and emotional influences. Journal of Voice, 10, 23-38.
Dawson, M. E., Schell, A. M., & Filion, D. L. (1990). The electrodermal system. In J. T.
Cacioppo & L. G. Tassinary (Eds.), Principles of psychophysiology: Physical,
social, and inferential elements (pp. 295-324). New York: Cambridge University
Press.
Deller, J. R., Proakis, J. G., & Hansen, J. H. L. (1993). Discrete time processing of
speech signals. New York: Macmillan.
Duncan, G., Laver, J. & Jack, M. A. (1983). A psycho-acoustic interpretation of
variations in divers' voice fundamental frequency in a pressured helium-oxygen
environment (Work in Progress Report Ser.No.16 (S.9-16) University of
Edinburgh, Department of Linguistics)
Edwards, P. (1998) Etude empirique de déterminants de la différenciation des émotions
et de leur intensité. Unpublished Ph.D. Thesis, University of Geneva.
Eich, E., Kihlstrom, J. F., Bower, G. H., Forgas, J. P., & Niedenthal, P. M. (Eds.).
(2000). Cognition and Emotion. New York: Oxford University Press.
Ekman, P. (1972). Universals and cultural differences in facial expressions of emotions.
In J. Cole (Ed.) Nebraska symposium on motivation, 1971 (pp. 207-283).
Lincoln, NE: University of Nebraska Press.
Ekman, P. (1973a). Cross-cultural studies of facial expression. In P. Ekman (Ed.),
Darwin and facial expression: A century of research in review. (pp. 169-222).
New York: Academic Press.
Ekman, P. (1973b). Darwin and facial expression: A century of research in review. New
York: Academic Press.

197
Ekman, P. (1979). About brows: Emotional and conversational signals. In M. V.
Cranach, K. Foppa, W. Lepenies, & D. Ploog (Eds.), Human ethology (pp.
169-202). Cambridge: Cambridge University Press.
Ekman, P. (1982a). Emotions in the human face (2nd ed.).New York: Cambridge.
Ekman, P. (1982b). Methods of measuring facial action. In K. R. Scherer, & P. Ekman
(Eds.), Handbook of methods in nonverbal behavior research (pp. 45-90).
Cambridge: Cambridge University Press.
Ekman, P. (1984). Expression and the nature of emotion. In K. R. Scherer & P. Ekman
(Eds.), Approaches to emotion (pp. 319-343). Hillsdale, NJ: Erlbaum.
Ekman, P. (1992). An argument for basic emotions. Cognition and Emotion, 6(3-4),
169-200.
Ekman, P., & Friesen, W. V. (1978). The Facial Action Coding System: A technique for
the measurement of facial movement. Palo Alto, CA, Consulting Psychologists
Press.
Ekman, P., Levenson, R. W., & Friesen, W. V. (1983). Autonomic nervous system
activity distinguishes among emotions. Science, 221, 1208-1210.
Ellgring, H. & Scherer, K. R. (1996). Vocal indicators of mood change in depression.
Journal of Nonverbal Behavior, 20, 83-110.
Ellsworth, P. C., & Smith, C. A. (1988a). From appraisal to emotion: Differences among
unpleasant feelings. Motivation and Emotion, 12, 271-302.
Ellsworth, P. C., & Smith, C. A. (1988b). Shades of joy: Patterns of appraisal
differentiating pleasant emotions. Cognition and Emotion, 2, 301-331.
Fant, G. (1979a). Glottal source and excitation analysis. Speech Transmission
Laboratory Quarterly Progress and Status Report, 1, 70-85.

198
Fant, G. (1979b). Vocal source analysis – a progress report. Speech Transmission
Laboratory Quarterly Progress and Status Report, 3, 31-54.
Fant, G. (1993). Some problems in voice source analysis, Speech Communication, 13, 7-
22.
Frick, R. W. (1985). Communicating emotion: The role of prosodic features.
Psychological Bulletin, 97, 412-429.
Frijda, N. H. (1986). The emotions. Cambridge: Cambridge University Press.
Frijda, N. H., Kuipers, P., & ter Schure, E. (1989) Relations among emotion, appraisal,
and emotional action readiness. Journal of Personality and Social Psychology,
57, 212-228.
Fuller, B. F. (1984). Reliability and validity of an interval measure of vocal stress.
Psychological Medicine, 14, 59-166.
Gehm, Th., & Scherer, K. R. (1988). Factors determining the dimensions of subjective
emotional space. In K. R. Scherer (Ed.), Facets of emotion: Recent research.
(pp. 99-114). Hillsdale, NJ: Erlbaum.
Giles, H., Coupland, N., Coupland, J. (1991). Accommodation theory: Communication,
context, and consequence. In H. Giles, J. Coupland, & N. Coupland, (Eds.).
(1991). Contexts of accommodation: Developments in applied sociolinguistics.
Studies in emotion and social interaction. (pp. 1-68). New York: Cambridge
University Press.
Green, R. S., & Cliff, N. (1975). Multidimensional comparisons of structures of vocally
and facially expressed emotion. Perception and Psychophysics, 17, 429-438.
Hixon, T. J. (1987). Respiratory Function in Speech and Song. Boston: College-Hill
Press.

199
Hollien, H., Geison, L., & Hicks, J. (1987). Voice stress evaluators and lie detection.
Journal of Forensic Sciences, 32(2), 405-418.
Huber, J. E., Stathopoulos, E. T., Curione, G. M., Ash, T.A., Johnson, K. (1999).
Formants of children, women, and men: the effects of vocal intensity variation.
Journal of the Acoustical Society of America, 106, 1532-42.
Iwarsson, J. & Sundberg, J. (1998). Effects of Lung Volume on Vertical Larynx Position
during Phonation. Journal of Voice, 12, 159-165.
Iwarsson, J., Thomasson, M., & Sundberg, J. (1996). Long volume and phonation: A
methodological study. Logopedics Phoniatrics Vocology, 21, 13-20.
Iwarsson, J., Thomasson, M., & Sundberg, J. (1998). Effects of lung volume on the
glottal voice source. Journal of Voice, 12(4), 424-433.
Izard, C. E. (1972). Patterns of emotions: A new analysis of anxiety and depression.
New York: Academic Press.
James, W. (1884). What is emotion? Mind, 4, 188-204.
Johnstone, T., Banse, R. and Scherer, K. R. (1995). Acoustic Profiles from Prototypical
Vocal Expressions of Emotion. Proceedings of the XIIIth International
Congress of Phonetic Sciences, 4, 2-5.
Johnstone, T. & Scherer, K. R. (2000). Vocal communication of emotion. In M. Lewis
& J. Haviland-Jones (Eds.), Handbook of Emotions, 2nd Ed (pp. 220-235). New
York: Guilford Press.
Johnstone, T., vanReekum, C. M., & Scherer, K. R. (2001).Vocal correlates of appraisal
processes. In K.R. Scherer, A. Schorr, & T. Johnstone (Eds.). Appraisal
processes in emotion: Theory, Methods, Research (pp. 271-284). New York:
Oxford University Press.

200
Jürgens , U. (1979). Vocalization as an emotional indicator. A neuroethological study in
the squirrel monkey. Behaviour, 69, 88-117.
Jürgens, U. (1988). Central control of monkey calls. In D. Todt, P. Goedeking, & D.
Symmes (Eds.). Primate vocal communication (pp. 162-170). Berlin, Germany:
Springer.
Jürgens, U. (1994). The role of the periaqueductal grey in vocal behaviour. Behavioural
Brain Research, 62, 107-17
Kaiser, S., Wehrle, T. & Edwards, P. (1994). Multi- modal emotion measurement in an
interactive computer-game: A pilot-study. In N. H. Frijda (Ed.), Proceedings of
the VIIIth Conference of the International Society for Research on Emotions
(pp. 275-279). Storrs: ISRE Publications.
Kappas, A. (1997). His master's voice: Acoustic analysis of spontaneous vocalizations in
an ongoing active coping task. Thirty-Seventh Annual Meeting of the Society
for Psychophysiological Research, Cape Cod.
Kappas, A. (2000). Up, up, up, left, left, right, right: Affective vocalizations in a voice-
controlled video game. Presented at the XIth conference of the International
Society for Research in Emotions, Québec, Québec.
Kent, R. D. (1997). The Speech Sciences. San Diego: Singular.
Klasmeyer, G. (1998) Akustische Korrelate des stimmlich emotionalen. Ausdrucks in der
Lautsprache. Unpublished doctoral dissertation. Technical University of Berlin.
Klasmeyer, G. & Sendlmeier, W. F. (1997). The classification of different phonation
types in emotional and neutral speech. Forensic Linguistics – The International
Journal of Speech, Language and the Law, 4, 104-124.

201
Klatt, D. H., & Klatt, L. (1990) Analysis, synthesis, and perception of voice quality
variations among female and male talkers. Journal of the Acoustical Society of
America ,87, 820-856.
Ladd, D. R., Silverman, K. E. A., Tolkmitt, F., Bergmann, G., & Scherer, K. R. (1985).
Evidence for the independent function of intonation contour type, voice quality,
and F0 range in signaling speaker affect. Journal of the Acoustical Society of
America, 78, 435-444.
Ladefoged P. (1968). Linguistic aspects of respiratory phenomena. Annals of the New
York Academy of Sciences, 155,141–151.
Laver, J. (1980). The phonetic description of voice quality. Cambridge: Cambridge
University Press.
Laver, J. (1991). The gift of speech. Edinburgh, UK: Edinburgh University Press.
Lazarus, R. S. (1991). Emotion and adaptation. New York: Oxford University Press.
Lazarus, R. S. (2001). Relational meaning and discrete emotions. In K. R. Scherer, A.
Schorr, & T. Johnstone (Eds.). Appraisal Processes in Emotion: Theory,
Methods, Research. (pp. 37-67). New York: Oxford University Press.
Lazarus, R. S., Averill, J. R., & Opton, E. M. Jr. (1970). Towards a cognitive theory of
emotion. In M. B. Arnold (Ed.), Feelings and emotions: The Loyola Symposium
(pp. 207-232). New York: Academic Press.
Lee, D.H. & Park, K.S. (1990). Multivariate analysis of mental and physical load
components in sinus arrhythmia scores. Ergonomics, 33, 35-47.
Levelt, W. J. M., Roelofs, A., & Meyer, A. S. (1999). A theory of lexica access in
speech production. Behavioral and Brain Sciences, 22, 1-75.
Levenson, R. W. (1992). Autonomic nervous system differences among emotions.
Psychological Science, 3, 23-27.

202
Levenson, R. W., Ekman, P., Heider, K., & Friesen, W. V. (1992). Emotion and
autonomic nervous system activity in the Minangkabau of West Sumatra.
Journal of Personality and Social Psychology, 62, 972-988.
Leventhal, H. & Scherer, K. R. (1987). The relationship of emotion to cognition: A
functional approach to a semantic controversy. Cognition and Emotion, 1, 3-28.
Lieberman, P. (1986). Alice in declinationland - A reply to Johan 't Hart. Journal of the
Acoustical Society of America, 80, 1840-1842.
Lieberman, P. (1996). Some biological constraints on the analysis of prosody. In J.
Morgan & K. Demuth (Eds.), Signal to syntax: Bootstrapping from speech to
grammar in early acquisition (pp. 55-65). Mahwah: NJ: Erlbaum.
Lieberman, P., & Blumstein, S. E. (1988). Speech physiology, speech perception, and
acoustic phonetics. Cambridge & New York: Cambridge University Press.
Lieberman, P., & Michaels, S. B. (1962). Some aspects of fundamental frequency and
envelope amplitude as related to the emotional content of speech. Journal of the
Acoustical Society of America, 34, 922-927.
Lively, S., Pisoni, D., Van Summers, W., & Bernacki, R. (1993). Effects of cognitive
workload on speech production: Acoustic analyses and perceptual
consequences. Journal of the Acoustical Society of America, 93(5), 2962-2973.
MacDowell, K. A., & Mandler, G. (1989). Constructions of emotion: Discrepancy,
arousal, and mood. Motivation and Emotion, 13, 105-124.
MacLeod, C., & Rutherford, E. M. (1998). Automatic and strategic cognitive biases in
anxiety and depression. In K. Kirsner, C. Speelman, M. Maybery, A. O’Brien-
Malone, M. Anderson & C. MacLeod (Eds.), Implicit and explicit mental
processes (pp 233-254). Hillsdale, NJ: Erlbaum.

203
Mackey, M. (1994). XQuest. Computer software. Available on the internet at
http://www.ch.cam.ac.uk/MMRG/people/mdm/xquest.html
Mandler, G. (1975). Mind and emotion. New York: Wiley.
Martin, M. (1990). On the induction of mood. Clinical Psychology Review, 10, 669-697.
Marusek, K. (1997). EGG and voice quality. Electronic tutorial. http://www.ims.uni-
stuttgart.de/phonetik/EGG/frmst1.htm
Mathews, A., & MacLeod, C. (1994). Cognitive approaches to emotion and emotional
disorders. Annual Review of Psychology, 45, 25-50.
Morton, E. S. (1977). On the occurrence and significance of motivational-structural rules
in some bird and mammal sounds. American Naturalist, 111, 855-869.
Mozziconacci, S. J. L. (1995). Pitch variations and emotions in speech. Proceedings of
the XIIIth International Congress of Phonetic Sciences, 1, 178-181.
Mozziconacci, S. J. L. (1998). Speech variability and emotion: Production and
perception. Ph.D. thesis, Eindhoven, the Netherlands.
Mozziconacci, S. J. L., & Hermes, D. J. (1997). A study of intonation patterns in speech
expressing emotion or attitude: production and perception. IPO Annual
Progress Report 32, IPO, Eindhoven, the Netherlands, 154-160.
Öhman, A. (1992). Orienting and attention: Preferred preattentive processing of
potentially phobic stimuli. In B. A. Campbell, R. Richardson, & H. Haynes
(Eds.). Attention and information processing in infants and adults: Perspectives
from human and animal research. (pp. 263-295). Chichester, England: Wiley.
Öhman, A. (1987). The psychophysiology of emotion: An evolutionary-cognitive
perspective. In P. K. Ackles, J. R. Jennings, & M. G. H. Coles (Eds.), Advances
in psychophysiology, Vol. 2 (pp. 79-127). Greenwich, CT: JAI Press.

204
Pecchinenda, A., & Smith, C. A. (1996). The affective significance of skin conductance
activity during a difficult problem-solving task. Cognition and Emotion, 10(5),
481-503
Pittam, J. & Scherer, K. R. (1993). Vocal expression and communication of emotion. In
M. Lewis and J. M. Haviland (Eds.) Handbook of Emotions. New York:
Guilford Press.
Porges, S. W. (1997). Emotion: An evolutionary by-product of the neural regulation of
the autonomic nervous system. In C. S. Carter, I. I. Lederhendler, & B.
Kirkpatrick (Eds.). The integrative neurobiology of affiliation. Annals of The
New York Academy of Sciences, Vol. 807. (pp. 62-77). New York: New York
Academy of Sciences.
Roberts, B. & Kirsner, K. (2000). Temporal cycles in speech production. Language and
Cognitive Processes, 15, 129 – 157
Roseman, I. J. (1984). Cognitive determinants of emotion: A structural theory. In P.
Shaver (Ed.), Review of personality and social psychology: Vol. 5. Emotions,
relationships, and health (pp. 11-36). Beverly Hills, CA: Sage.
Rothenberg, M. (1973). A new inverse filtering technique for deriving the glottal airflow
during voicing. Journal of the Acoustical Society of America, 53, 1632-1645.
Schachter, S., & Singer, J. (1962). Cognitive, social, and physiological determinants of
emotional state. Psychological Review, 69, 379-399.
Scherer, K. R. (1985). Vocal affect signalling: A comparative approach. In J. Rosenblatt,
C. Beer, M. Busnel, & P. J. B. Slater (Eds.), Advances in the study of behavior
(pp. 189-244). New York: Academic Press.
Scherer, K. R. (1986). Vocal affect expression: A review and a model for future
research. Pychological Bulletin, 99(2), 143-165

205
Scherer, K. R. (1988). On the symbolic functions of vocal affect expression. Journal of
Language and Social Psychology, 7, 79-100.
Scherer, K. R. (1989) Vocal correlates of emotion. In H. Wagner & A. Manstead (Eds.),
Handbook of psychophysiology: Emotion and social behavior (pp. 165-197).
London: Wiley.
Scherer, K. R. (1992). What does facial expression express? In K. Strongman (Ed.),
International Review of Studies on Emotion (Vol. 2, pp. 139-165). Chichester:
Wiley.
Scherer, K. R. (2001). Appraisal considered as a process of multi-level sequential
checking. In K. R. Scherer, A. Schorr, & T. Johnstone (Eds.). Appraisal
processes in emotion: Theory, Methods, Research (pp. 92-120). New York and
Oxford: Oxford University Press.
Scherer, K. R., Banse, R., & Wallbott, H. G. (2001). Emotion inferences from vocal
expression correlate across languages and cultures. Journal of Cross-Cultural
Psychology, 32(1), 76-92.
Scherer, K. R., Banse, R., Wallbott, H. G., & Goldbeck, T. (1991). Vocal cues in
emotion encoding and decoding. Motivation and Emotion, 15, 123-148.
Scherer, K. R., & Kappas, A. (1988). Primate vocal expression of affective states. In D.
Todt, P. Goedeking, & E. Newman (Eds.). Primate vocal communication. (pp.
171-194). Heidelberg: Springer.
Scherer, K. R., Ladd, D. R., & Silverman, K. E. A. (1984). Vocal cues to speaker affect:
Testing two models. Journal of the Acoustical Society of America, 76, 1346-
1356.
Scherer, K. R., & Oshinsky, J. S. (1977). Cue utilization in emotion attribution from
auditory stimuli. Motivation and Emotion, 1, 331-346.

206
Scherer, K. R., Schorr, A., & Johnstone, T. (Eds.). (2001). Appraisal Processes in
Emotion: Theory, Methods, Research. New York: Oxford.
Scherer, T. M. (2000). Stimme, Emotion und Psyche. Untersuchungen zur emotionalen
Qualität der menschlichen Stimme. Unpublished Ph.D. thesis, Philipps-
Universität Marburg.
Scherer, U., Helfrich, H., & Scherer, K. R. (1980). Paralinguistic behaviour: Internal
push or external pull? In H. Giles, P. Robinson & P. Smith (Eds.), Language:
Social psychological perspectives (pp. 279-282). Oxford: Pergamon.
Schmidt, S. (1998). Les expressions faciales émotionnelles dans le cadre d'un jeu
d'ordinateur: Reflet de processus d'évaluation cognitive ou d'émotions de base?
Unpublished Ph. D. Thesis, University of Geneva.
Schneider, W., & Shiffrin, R. (1977). Controlled and automatic human information
processing: I. Detection search and attention. Psychological Review, 84, 1-126.
Shea, S. A., Hoit, J. D., & Banzett, R. B. (1998). Competition between gas exchange
and speech production in ventilated subjects. Biological Psychology, 49(1-2), 9-
27.
Shiffrin, R. M., & Schneider, W. (1977). Controlled and automatic human information
processing: II. Perceptual learning, automatic attention and a general theory.
Psychological Review, 84, 127-190.
Simonov, P. V. & Frolov, M. V. (1973). Utilization of human voice for estimation of
man's emotional stress and state of attention. Aerospace Medicine 44, 256-258
Smith, C. A. (1989). Dimensions of appraisal and physiological response in emotion.
Journal of Personality and Social Psychology, 56, 339-353.

207
Smith, C. A., Ellsworth, P. C., & Pope, L. K. (1990, Abstract). Contributions of ability
and task difficulty to appraisal, emotion, and autonomic activity.
Psychophysiology, 27, S64.
Smith, C. A., & Lazarus, R. S. (1990). Emotion and adaptation. In L. A. Pervin (Ed.).
Handbook of personality: Theory and research (pp. 609-637). New York:
Guilford.
Smith, C. A., & Scott, H. S. (1997). A componential approach to the meaning of facial
expressions. In J. A. Russell & J. M. Fernández-Dols (Eds.), The psychology of
facial expression: Studies in emotion and social interaction (pp. 229-254).
Cambridge: Cambridge University Press.
Smith, G. A. (1977). Voice analysis for the measurement of anxiety. British Journal of
Medical Psychology, 50, 367-373.
Smith, G. A. (1982). Voice analysis of the effects of benzodiazepine tranquillizers.
British Journal of Clinical Psychology, 21, 141-142.
Sobin, C., & Alpert, M. (1999). Emotion in speech: The acoustic attributes of fear,
anger, sadness, and joy. Journal of Psycholinguistic Research, 28, 347-365.
Sokolov, E. N. (1963). Perception and the conditioned reflex. Oxford: Pergamon.
Starkweather, J.A. (1956). Content-free speech as a source of information about the
speaker. Journal of Personality and Social Psychology, 35, 345-350.
Stemmler, G. (1996). Psychophysiologie der Emotionen. Zeitschrift fur
Psychosomatische Medizin and Psychoanalyse, 42, 235-260.
Strik, H. & Boves, L. (1992). Control of fundamental frequency, intensity and voice
quality in speech. Journal of Phonetics, 20, 15-25.
Sundberg, J. (1994). Vocal fold vibration patterns and phonatory modes. STL-QPRS 2-
3, KTH Stockholm, Sweden, 69-80.

208
Tartter, V. C. (1980). Happy talk: Perceptual and acoustic effects of smiling on speech.
Perception and Psychophysics, 27, 24-27.
Tartter, V. C., & Braun, D. (1994). Hearing smiles and frowns in normal and whisper
registers. Journal of the Acoustical Society of America, 96, 2101-2107.
Titze, I. R. (1994). Principles of voice production. Englewood Cliffs, NJ: Prentice Hall.
Tolkmitt, F. J., & Scherer, K. R. (1986). Effects of experimentally induced stress on
vocal parameters. Journal of Experimental Psychology: Human Perception and
Performance, 12, 302-313.
Tomkins, S. S. (1962). Affect, imagery, consciousness. Vol. 1. The positive affects. New
York: Springer.
Tranel, D. (2000). Electrodermal activity in cognitive neuroscience: Neuroanatomical
and neuropsychological correlates. In R. D. Lane & L. Nadel (Eds.). Cognitive
neuroscience of emotion. Series in affective science. (pp. 192-224). New York:
Oxford University Press.
Uldall, E. (1960). Attitudinal meanings conveyed by intonation contours. Language and
Speech, 3, 223-234.
van Bezooijen, R. (1984). The characteristics and recognizability of vocal expression of
emotions. Dordrecht, The Netherlands: Foris.
van Reekum, C. M., & Scherer, K. R. (1997). Levels of processing in emotion-
antecedent appraisal. In G. Matthews (Ed.), Cognitive science perspectives on
personality and emotion (pp. 259-330). Amsterdam: Elsevier
Wehrle, T., Kaiser, S., Schmidt, S. & Scherer, K. R (2000). Studying dynamic models of
facial expression of emotion using synthetic animated faces. Journal of
Personality and Social Psychology, 78, 105-119.

209
Whiteside, S. P. & Hodgson, C. (2000). Some acoustic characteristics in the voices of 6-
to 10-year-old children and adults: a comparative sex and developmental
perspective. Logopedics, Phoniatrics, Vocology, 25, 122-32.
Willemyns, M., Gallois, C., Callan, V. J., & Pittam, J. (1997). Accent accommodation in
the job interview: Impact of interviewer accent and gender. Journal of Language
and Social Psychology, 16, 3-22.
Woisard, V., Percodani, J., Serrano, E., & Pessey, J. J. (1996). La voix de l'enfant,
evolution morphologique du larynx et ses consequences acoustiques. [The voice
of the child, morphological evolution of the larynx and its acoustic
consequences]. Revue de Laryngologie Otologie Rhinologie, 117, 313-7.

210

211
Appendix 1. Vocal correlates of appraisal processes
This chapter provides a theoretical overview and relevant empirical evidence on
how appraisal processes affect the production of speech. The chapter is primarily the
work of the first author. Sections of the chapter were drawn from the introduction and
general discussion chapters of this thesis. Van Reekum provided advice on the effects of
appraisals on physiology, as well as contributing general comments on the first draft of
the chapter. Scherer was primarily responsible for the introduction paragraphs of the
chapter, as well as sections on personality and clinical issues in appraisal theory and
emotional speech, and contributed general comments on the first draft of the chapter.
Johnstone, T., vanReekum, C. M., & Scherer, K. R. (2001).Vocal correlates of appraisal
processes. In K.R. Scherer, A. Schorr, & T. Johnstone (Eds.). Appraisal processes
in emotion: Theory, Methods, Research (pp. 271-284). New York: Oxford
University Press.