The catastrophe over Jammu and Kashmir in September 2014
12
RESEARCH ARTICLES CURRENT SCIENCE, VOL. 109, NO. 3, 10 AUGUST 2015 580 *For correspondence. (e-mail: [email protected]) The catastrophe over Jammu and Kashmir in September 2014: a meteorological observational analysis Kamaljit Ray*, S. C. Bhan and B. K. Bandopadhyay India Meteorological Department, New Delhi 110 003, India An observational analysis of the catastrophic rain- storm during 4–6 September 2014 over Jammu and Kashmir (J&K) presented in this study shows that the event was unprecedented in terms of the 24, 48 and 72 h accumulated rainfall. The 24 h accumulated rainfall exceeded the previously determined one-day severe rainstorm limits of 20 cm for a number of sta- tions on 5 and 6 September 2014. Weekly cumulative rainfall (4–10 September 2014) exceeded the average rainfall of the entire monsoon season (June–September) in 6 out 18 districts of the state. A number of stations recorded all-time highest 24, 48 and 72 h accumulated rainfall during the week. Analysis of short-duration intensity of rainfall shows that the heaviest rain-rate (35 mm/h) was recorded over Kawa (Üdhampur dis- trict). The rain-rate remained less than 20 mm/h at other stations. As Kawa is on the windward side of the Pir Panjal Range, orography seems to have played a significant role. The analysis of synoptic conditions leading to unprecedented rainfall shows that the rains were caused by the interaction of the westward- moving monsoon low pressure area across central and northwest India and a eastward-moving deep trough in the mid-tropospheric westerlies. The additional low pressure areas that formed over Saurashtra and Kutch on 3 September 2014 and over head Bay of Bengal on 5 September 2014, ensured the vigour of the event was maintained through strong wind and mois- ture flux in J&K. NWP models could capture heavy rains over J&K only in day 1 forecast. Keywords: Accumulated rainfall, low pressure area, observational analysis, rainstorm. HEAVY rainfall and associated flash floods cause tremendous damage to life and property across most of the mountainous regions of the world, including the Himalaya. The Himalayan ranges are prone to heavy and prolonged rainfall events and associated flooding, par- ticularly during the summer rainy months of June to Sep- tember (monsoon season). Variability in precipitation over the Himalaya during monsoon season is controlled by the atmospheric systems (lows or depressions) that draw moisture from the Bay of Bengal 1 . The frequency of monsoon depressions formed in the Bay of Bengal is about 80% of the total number of depressions formed in the South Asia monsoon region 2 . One-third of the mon- soon lows fills up on crossing 85E and nearly half on crossing 80E. On some occasions a westerly wave pass- ing over North Pakistan may take the monsoon system under its grip and make it re-curve initially in a northerly direction and then northeastwards, causing heavy rains in the upper areas of Punjab and adjoining areas of Jammu and Kashmir (J&K), India 3 . The structure, track and movement of monsoon depressions and associated rainfall patterns have been studied and reviewed in detail 4,5 . The synchronization of movement of westerly waves in the extreme north with the passage of monsoon disturbances in the lower latitudes causes heavy to very heavy rainfall along the foothills of the Himalaya, in the upper areas of Punjab and adjoining areas of J&K. Heavy rainfall events in the Western Himalaya often produce landslides across the hilly terrain 6,7 . Houze et al. 8 and Medina et al. 9 have examined the TRMM rainfall over Western Himalaya; the region is prone to deep convec- tion during monsoon. Recently, Houze et al. 10 have studied the heavy rainfall over Pakistan, which caused floods during July and August 2010. Similar situation occurred in July 2005 when floods were reported in River Jhelum 11 . In the mountainous region, run-off from snow- melt and glacier-melt provides the dominant contribution to river flows during the spring and summer seasons, although monsoon rainfall may also influence peak flow 12 . A continuous spell of five days of very heavy rainfall in first week of September 2014, caused disastrous floods in many parts of the northwestern state of J&K. Accord- ing to media reports, the state government claimed that ‘the calamity, worst in the century, caused colossal losses to life and massive damage to housing and business sec- tors, public institutions particularly hospitals, road infra- structure, agriculture and transport sectors. Over 300 people lost their lives across J&K, including 85 persons from Kashmir. A preliminary survey by the government revealed that the flood damaged over 3.50 lakh structures, including 2.50 lakh residential houses and affected 12 lakh families in 5500 flood-hit villages across the state.
-
Upload
khangminh22 -
Category
Documents
-
view
6 -
download
0
Transcript of The catastrophe over Jammu and Kashmir in September 2014

RESEARCH ARTICLES
CURRENT SCIENCE, VOL. 109, NO. 3, 10 AUGUST 2015 580
*For correspondence. (e-mail: [email protected])
The catastrophe over Jammu and Kashmir in September 2014: a meteorological observational analysis Kamaljit Ray*, S. C. Bhan and B. K. Bandopadhyay India Meteorological Department, New Delhi 110 003, India
An observational analysis of the catastrophic rain-storm during 4–6 September 2014 over Jammu and Kashmir (J&K) presented in this study shows that the event was unprecedented in terms of the 24, 48 and 72 h accumulated rainfall. The 24 h accumulated rainfall exceeded the previously determined one-day severe rainstorm limits of 20 cm for a number of sta-tions on 5 and 6 September 2014. Weekly cumulative rainfall (4–10 September 2014) exceeded the average rainfall of the entire monsoon season (June–September) in 6 out 18 districts of the state. A number of stations recorded all-time highest 24, 48 and 72 h accumulated rainfall during the week. Analysis of short-duration intensity of rainfall shows that the heaviest rain-rate (35 mm/h) was recorded over Kawa (Üdhampur dis-trict). The rain-rate remained less than 20 mm/h at other stations. As Kawa is on the windward side of the Pir Panjal Range, orography seems to have played a significant role. The analysis of synoptic conditions leading to unprecedented rainfall shows that the rains were caused by the interaction of the westward-moving monsoon low pressure area across central and northwest India and a eastward-moving deep trough in the mid-tropospheric westerlies. The additional low pressure areas that formed over Saurashtra and Kutch on 3 September 2014 and over head Bay of Bengal on 5 September 2014, ensured the vigour of the event was maintained through strong wind and mois-ture flux in J&K. NWP models could capture heavy rains over J&K only in day 1 forecast. Keywords: Accumulated rainfall, low pressure area, observational analysis, rainstorm. HEAVY rainfall and associated flash floods cause tremendous damage to life and property across most of the mountainous regions of the world, including the Himalaya. The Himalayan ranges are prone to heavy and prolonged rainfall events and associated flooding, par-ticularly during the summer rainy months of June to Sep-tember (monsoon season). Variability in precipitation over the Himalaya during monsoon season is controlled by the atmospheric systems (lows or depressions) that
draw moisture from the Bay of Bengal1. The frequency of monsoon depressions formed in the Bay of Bengal is about 80% of the total number of depressions formed in the South Asia monsoon region2. One-third of the mon-soon lows fills up on crossing 85E and nearly half on crossing 80E. On some occasions a westerly wave pass-ing over North Pakistan may take the monsoon system under its grip and make it re-curve initially in a northerly direction and then northeastwards, causing heavy rains in the upper areas of Punjab and adjoining areas of Jammu and Kashmir (J&K), India3. The structure, track and movement of monsoon depressions and associated rainfall patterns have been studied and reviewed in detail4,5. The synchronization of movement of westerly waves in the extreme north with the passage of monsoon disturbances in the lower latitudes causes heavy to very heavy rainfall along the foothills of the Himalaya, in the upper areas of Punjab and adjoining areas of J&K. Heavy rainfall events in the Western Himalaya often produce landslides across the hilly terrain6,7. Houze et al.8 and Medina et al.9 have examined the TRMM rainfall over Western Himalaya; the region is prone to deep convec-tion during monsoon. Recently, Houze et al.10 have studied the heavy rainfall over Pakistan, which caused floods during July and August 2010. Similar situation occurred in July 2005 when floods were reported in River Jhelum11. In the mountainous region, run-off from snow-melt and glacier-melt provides the dominant contribution to river flows during the spring and summer seasons, although monsoon rainfall may also influence peak flow12. A continuous spell of five days of very heavy rainfall in first week of September 2014, caused disastrous floods in many parts of the northwestern state of J&K. Accord-ing to media reports, the state government claimed that ‘the calamity, worst in the century, caused colossal losses to life and massive damage to housing and business sec-tors, public institutions particularly hospitals, road infra-structure, agriculture and transport sectors. Over 300 people lost their lives across J&K, including 85 persons from Kashmir. A preliminary survey by the government revealed that the flood damaged over 3.50 lakh structures, including 2.50 lakh residential houses and affected 12 lakh families in 5500 flood-hit villages across the state.

RESEARCH ARTICLES
CURRENT SCIENCE, VOL. 109, NO. 3, 10 AUGUST 2015 581
Figure 1. Inundated area in Srinagar as on 10 September 2014. (Source: NRSC, Bhuvan, website: http://bhuvan-noeda.nrsc.gov.in/ disaster/disaster/disaster.php#.) In worst-hit Kashmir, 2.60 lakh structures got damaged with 95,000 houses in Srinagar alone. It was a “disaster of international magnitude” and the losses to properties and business were in excess of rupees one trillion.’ (http://www.greaterkashmir.com/news/2014/Sep/30/kashmir-flood-a-disaster-of-international-magnitude-govt-34.asp) Heavy rainfall led to landslides and widespread flood-ing in the Kashmir valley. Flood waters breached embankments in many low-lying areas in Kashmir, includ-ing the capital Srinagar. Jhelum, Chenab and many other streams were flowing above danger mark. The worst affected districts were Srinagar, Anantnag, Baramulla, Pulwama, Ganderbal, Kulgam, Budgam, Rajouri, Poonch and Reasi. Figure 1 shows the flood estimated by NRSC, Bhuvan on 10 September 2014 in Srinagar and surrounding areas. Bhuvan (http://bhuvan.nrsc.gov.in) was launched by Indian Space Research Organisation (ISRO) in 2009. It is a software application which allows users to explore a 2D/3D representation of the surface of the Earth. The browser is specifically tailored to view India, offering the highest resolution in this region. Apart from visualiza-tion, Bhuvan provides timely disaster support services (domestic and international) free satellite data and prod-ucts download facility, and rich thematic datasets. Bhu-van uses a crowd sourcing approach to enrich its maps and collect point of interest data. It also acts as a platform
for hosting Government data (for example, Karnataka Forest Department datasets). It offers detailed imagery of Indian locations with spatial resolutions ranging up to 1 m. ISRO has used data provided by satellites, including Resourcesat-1, Cartosat-1 and Cartosat-2 to get the best possible imagery of India. We analysed the event with regard to heavy rainfall and found that the severe rainstorm lasted for three days (4–6 September 2014). According to our analysis, the rainstorm was caused by large scale disturbed atmospheric conditions as a consequence of the interaction between the westward-moving monsoon low and the eastward-moving deep trough in the mid-latitude westerlies, caus-ing extremely heavy rainfall over districts in the south-western region of J&K and adjoining Pakistan. In Uttara-khand during 16–17 June 2013, a two-day rainstorm was also caused by similar conditions as a consequence of the interaction between the westward-moving monsoon low and the eastward-moving deep trough in the mid-latitude westerlies, causing extremely heavy rainfall. Historical rainfall data of the J&K have also been analysed to show that the event was unprecedented. Meteorological fea-tures associated with this catastrophic event are studied in this article using various observations (both in situ and satellite). Performances of operational numerical weather prediction (NWP) models have also been evaluated.

RESEARCH ARTICLES
CURRENT SCIENCE, VOL. 109, NO. 3, 10 AUGUST 2015 582
Study region
J&K is located in the northern part of the Indian subcon-tinent in the vicinity of the Karakoram and Western Himalayan mountain ranges. The state is bounded by Pakistan, Afghanistan and China from west to east. There is a sharp rise in altitude from 1000 to 28,250 ft amsl within the state’s four degree of latitude. The foothills of the Himalaya, rising from about 2000–7000 ft (600–2100 m), form the outer and inner zones. The Pir Panjal Range constitutes the first (southernmost) mountain ram-part associated with the Himalaya in the state and is the westernmost of the Lesser Himalayas. The Vale of Kashmir is a deep, asymmetric basin lying between the Pir Panjal Range and the western end of the Great Himalaya at an average elevation of 5300 ft (1620 m). The climate is characterized by annual precipitation of about 30 inches (750 mm), derived partially from the summer monsoon and partially from western disturbances during winter. The monsoonal rainfall varies from 39.6 mm in Ladakh to 184.3 mm in Srinagar and 860.5 mm in Jammu.
Data used and methodology
For the monsoon season, Indian Meteorological Depart-ment (IMD), New Delhi publishes, in its weekly weather reports, daily rainfall for each day of the season as recorded at about 2600 rain-gauge stations comprising IMD’s own network, automatic weather stations (AWS) network of IMD, state rain-gauge networks, etc. The normal daily and monthly rainfall over various stations/districts has been calculated using average data for the period 1970–2000 for which long-term records are available. Daily Indian precipitation analysis from a merges of rain-gauge data with the TRMM TMPA satellite-derived rainfall estimates13 during 3–7 September 2014 have been used to show rainfall over the J&K region. The rainfall rates have been calculated for some of the stations using hourly rainfall recorded in AWS installed in J&K. These data are subjected to quality control at the IMD earth station in Pune before dissemination to users.
Results
Analysis of heavy to very heavy rainfall during 3–6 September 2014
The event covering 3–6 September 2014 was perhaps unique and unprecedented, when very heavy rainfall occurred over almost the entire state. Table 1 shows sta-tion-wise, 24 h accumulated rainfall in the state (recorded from 0830 h IST of the previous date till 0830 h IST of that date). Data for some of the stations were not available,
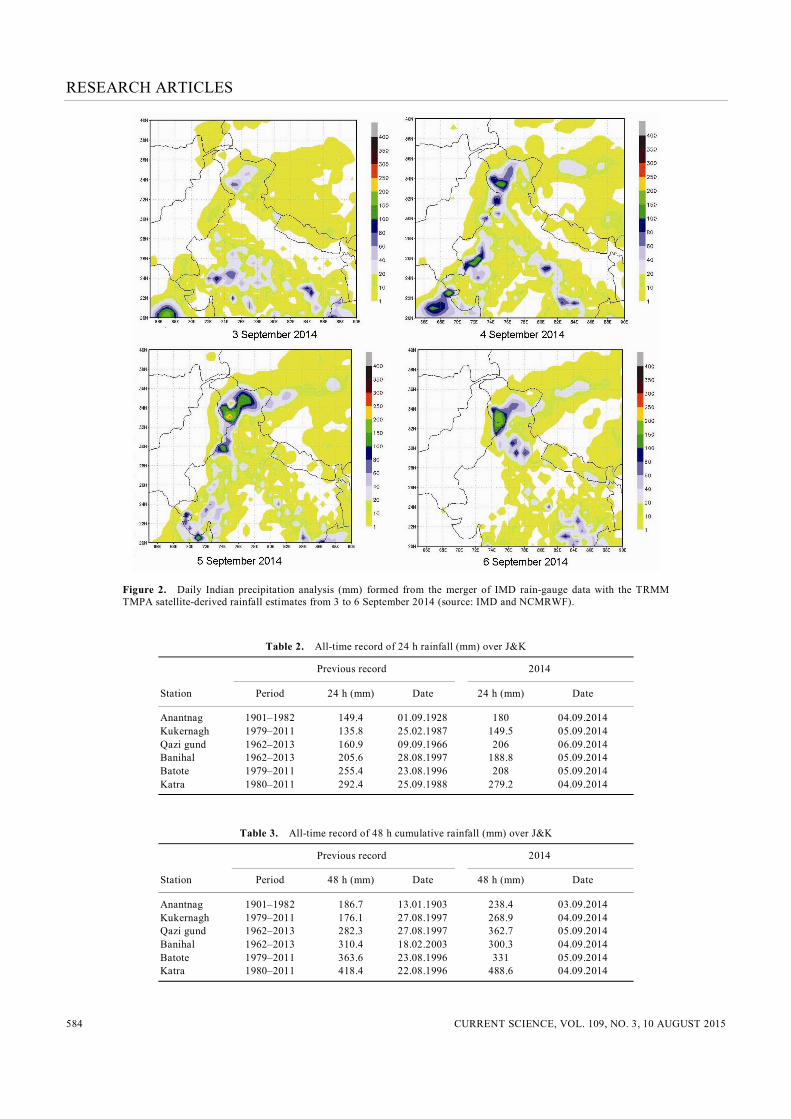
as either the rain gauges were submerged or were not approachable due to flooding. Widespread rainfall with isolated heavy rainfall was recorded on 3 September 2014, with rainfall average in the state being 31.3 mm. Heavy rainfall was recorded at three stations on 3 September 2014. On 4 September 2014, the rainfall activ-ity increased considerably with 13 out of 30 stations re-porting heavy to very heavy rainfall. The average rainfall recorded over the state was 66.9 mm. The activity increased further on 5 September 2014, with most of the stations reporting heavy to extremely heavy rainfall (16 out of 22 reporting stations). Katra (Reasi district) received 279 mm of rainfall, Batote (Ramban) 207.8 mm and many other stations received more than 125 mm of rainfall. Average rainfall for the state was 114.3 mm. Widespread heavy rainfall activity continued for another 24 h (6 September 2014) with 16 out of 23 stations reporting heavy to extremely heavy rainfall. Average rainfall for the state was 97.8 mm, with Kawa station (Udampur district) recording the highest rainfall of 260 mm. Analysis of merged gauge–satellite precipita-tion9 given in Figure 2 shows that precipitation in excess of 100 mm was realized in many parts of the state during 4–6 September 2014, the area under heaviest rainfall being maximum on 5 September 2014. Some pockets in the southwestern parts of the state also received rainfall in excess of 200 mm on 5 and 6 September 2014.
Comparison with historical records
The rains over J&K were unprecedented as revealed in the 24, 48 and 72 h accumulated rainfall analysis of some IMD stations whose long-term records are available (Tables 2–4 respectively). The rainfall recorded at An-antnag, Kukernag and Quazigand surpassed the 24, 48 and 72 h records for accumulated rainfall, whereas the 48 and 72 h records were exceeded in Katra. The tables also reveal that near record rainfall was experienced at some other stations as well. The spatial distribution of the heavy rainfall days (one or more number of stations over the state recording >65 mm of rainfall) during the mon-soon season for last 15 years (2000–14) over J&K was also analysed. The distribution of heavy rains was iso-lated (one or two stations) in September for all the years, except in 2014 when it was fairly widespread to wide spread ( 50% stations recorded heavy rainfall) on 4 and 5 September 2014 over the state. Besides, during the period of study, rainfall exceeded 20 cm/day (exceeding the limit of 1 day severe storm set by Dhar and Nandargi3) at several stations, which was not the case in similar events in the past decade. A comparison of average rain-fall over the state during 3–6 September 2014 and the normal average rainfall for these dates shows that the total accumulated rainfall on these dates was 900% to more than 11,000% above their normal values (Table 1).

RESEARCH ARTICLES
CURRENT SCIENCE, VOL. 109, NO. 3, 10 AUGUST 2015 583
Table 1. Rainfall reported (mm) over stations located in various districts of Jammu & Kashmir (J&K) during 3–6 September 2014
Rainfall reported (mm) Actual rainfall Normal rainfall Deviation during 3–6 during 3–6 from District Station 3 September 4 September 5 September 6 September September 2014 September 2014 normal (%)
Anantnag Anantnag 58.4 180 – – Kukernag 57.7 119.4 149.5 88.6 415.2 5.5 7449 Pahalgam 40.2 58.6 – – Pahalgam (AWS) 47 68 52 50 217 6.9 3045 Baramulla Baramulla (AWS) 8 65 84 28 185 1.9 9637 Gulmarg 34 106.6 128 98.2 366.8 6.5 5543 Doda Badarwah 29.2 81.4 138.8 100.6 350 21.8 1506 Jammu Jammu 9 39.3 101.4 218.3 368 24.1 1427 Jammu (AERO) 7.2 44.4 – 203.6 – – Kathua Katuwa 1.4 33.8 65.6 93.8 194.6 21.1 822 Kulgam Kulgam (AWS) 49 82 138 77 346 9.8 3431 Qazi Gund 80.4 156.7 156.7 206 599.8 5.4 11007 Pulwama Awantipur (IAF) 39.1 51 51 67 208.1 – – Malangpura (AWS) 37 61 102 66 266 – – Ramban Banihal 93.7 106.8 188.8 86.1 475.4 5.4 8704 Batote 67.8 102.4 207.8 123 501 18.2 2653 Govindpura (AWS) 52 71 202 102 427 – – Reasi Katra 21.8 67.4 279.2 209.4 577.8 41 1309 Shopian Shopian (AWS) 42 68 140 85 335 5 6600 Srinagar Rambagh (AWS) 18 51 52 19 140 2.6 5285 Srinagar 20 51.8 – – – – Srinagar (AWS) 26 54 49 23 152 – – Udampur Kawa (AWS) 14 64 152 260 490 – – Samba Samba 6.0 47.4 – – – – – Badgam Srinagar (Aero) 22.4 53.9 – – – – Ganderbal Gund 22.6 32.6 – – – – – Kupwara Kupwara 2.6 45.6 68.2 15.4 131.8 3.1 4152 Leh Leh (AWS) 11.0 0 0 6.0 – – – Poonch Poonch 0.3 1.3 9.5 – – – – Rajauri Rajauri 20.2 43.2 – – – – –
Analysis of meteorological synoptic conditions
Monsoon was in a weak phase over northwest India during the second fortnight of August. The daily actual and normal rainfall of northwest India showed that the region experienced an explosive increase in rainfall in the first week of September 2014, more than five times the normal value during 4–6 September 2014. This revival was in association with the formation of two low pressure areas (LOWs) that lay over central India and Gujarat and later merged and moved over to northwest India, and a trough in the mid and upper troposphere that moved across extreme northwestern parts of the country. Day-to-day position of these systems is given in Figures 3–5. The first LOW had formed over west–central and adjoining northwest Bay of Bengal, off north Andhra Pradesh–South Odisha coasts on 27 August 2014. It moved across south Chhattisgarh, Vidarbha and lay over northwest Madhya Pradesh on 2 September 2014, with the associ-ated upper air cyclonic circulation up to 500 hPa level. On 3 September 2014, the first LOW moved to south-east Rajasthan and its neighbourhood, and the associated upper air cyclonic circulation extended up to mid-tropo-spheric level tilting southwards with height (Figure 3 a–c).
Another LOW lay over Saurashtra and Kutch with the associated upper air cyclonic circulation extending up to mid-tropospheric level. At 500 hPa, a cyclonic circula-tion lay over North Pakistan and its neighbourhood embedded in the mid-latitude westerly trough. At 200 hPa, anticyclonic circulation lying to the south over west Uttar Pradesh provided divergence over the region (Figure 3 d). On 4 September 2014, the LOW moved over to central Rajasthan and the associated upper air cyclonic circula-tion was seen at 850 hPa (Figure 4 a and b). The LOW over Saurashtra and Kutch moved slightly north and lay over Kutch. A north–south trough extended from Gujarat to Punjab across these two LOWs at 850 hPa and pro-vided moisture influx from the Arabian Sea to NW India, particularly Rajasthan, Punjab and J&K. Jet maxima of 60–80 knots over J&K and adjoining regions continued to provide strong divergence at higher levels over the region (Figure 4 c). On 5 September 2014, the LOW over Kutch became less marked leading to increase in wind flow from the Arabian Sea towards the LOW over Rajasthan, which moved further north and intensified into a well-marked low pressure (WML) area (Figure 5 a). The previous day north–south trough at 850 hPa now extended from WML
RESEARCH ARTICLES
CURRENT SCIENCE, VOL. 109, NO. 3, 10 AUGUST 2015 584
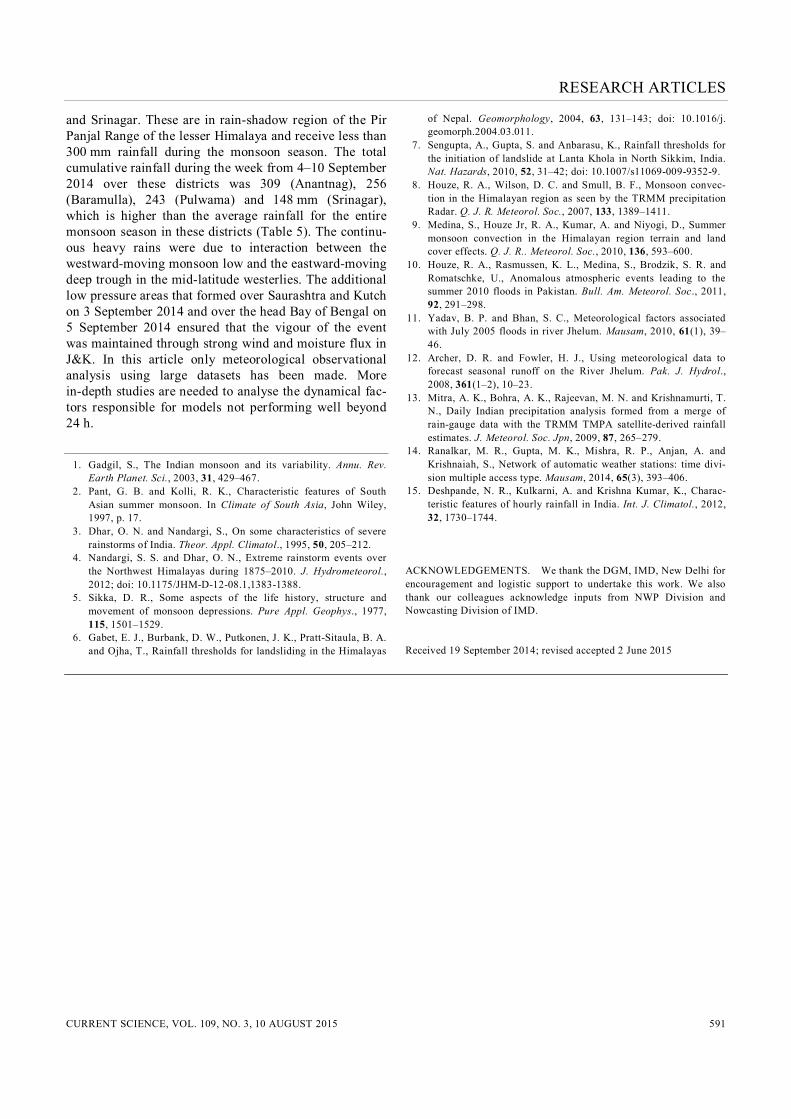
Figure 2. Daily Indian precipitation analysis (mm) formed from the merger of IMD rain-gauge data with the TRMM TMPA satellite-derived rainfall estimates from 3 to 6 September 2014 (source: IMD and NCMRWF).
Table 2. All-time record of 24 h rainfall (mm) over J&K
Previous record 2014
Station Period 24 h (mm) Date 24 h (mm) Date
Anantnag 1901–1982 149.4 01.09.1928 180 04.09.2014 Kukernagh 1979–2011 135.8 25.02.1987 149.5 05.09.2014 Qazi gund 1962–2013 160.9 09.09.1966 206 06.09.2014 Banihal 1962–2013 205.6 28.08.1997 188.8 05.09.2014 Batote 1979–2011 255.4 23.08.1996 208 05.09.2014 Katra 1980–2011 292.4 25.09.1988 279.2 04.09.2014
Table 3. All-time record of 48 h cumulative rainfall (mm) over J&K
Previous record 2014
Station Period 48 h (mm) Date 48 h (mm) Date
Anantnag 1901–1982 186.7 13.01.1903 238.4 03.09.2014 Kukernagh 1979–2011 176.1 27.08.1997 268.9 04.09.2014 Qazi gund 1962–2013 282.3 27.08.1997 362.7 05.09.2014 Banihal 1962–2013 310.4 18.02.2003 300.3 04.09.2014 Batote 1979–2011 363.6 23.08.1996 331 05.09.2014 Katra 1980–2011 418.4 22.08.1996 488.6 04.09.2014

RESEARCH ARTICLES
CURRENT SCIENCE, VOL. 109, NO. 3, 10 AUGUST 2015 585
Figure 3. a, Mean sea-level isobaric chart (hPa) of 0300 UTC of 3 September 2014. b–d, Wind analysis: (b) 850 hPa; (c) 500 hPa and (d) 200 hPa based on 0000 UTC of 3 September 2014.
Table 4. All-time record of 72 h cumulative rainfall (mm) over J&K
Previous record 2014
Station Period 72 h (mm) Date 72 h (mm) Date
Anantnag 1901–1982 210.8 16.09.1950 244.8 02.09.2014 Kukernagh 1979–2011 194.5 26.071995 357.5 04.09.2014 Qazi gund 1962–2013 300.7 17.02.2003 519.4 04.09.2014 Banihal 1962–2013 392.5 17.02.2003 389.3 03.09.2014 Batote 1979–2011 434 22.08.1996 433 04.09.2014 Katra 1980–2011 544.2 22.08.1996 698.6 04.09.2014
to the new LOW that developed over the head Bay of Bengal. It provided moisture feed from the Bay of Bengal as well. The jet maxima at 200 hPa intensified further with winds of the order of 70–90 knots (Figure 5 d). Figure 6 a shows the longitude time-section at 500 hPa of meridional wind anomaly along 30–35N from 1 to 7 September 2014. A thin line of strong southerly compo-nent of winds prevailed along 75long from 1 September 2014 onwards, with strengthening of anomalous winds to
more than 8 m/s from 2 to 6 September 2014. Figure 6 b shows the longitudinal time section of 850 hPa geopoten-tial height anomaly averaged over 25–30N, showing the westward movement of the low pressure area from northwest Madhya Pradesh to west Rajasthan from 1 September to 5 September 2014, and intensifying into a well-marked low pressure area over west Rajasthan on 5 September 2014. The track of the two low pressure areas as discussed above is shown in Figure 6 c. There was

RESEARCH ARTICLES
CURRENT SCIENCE, VOL. 109, NO. 3, 10 AUGUST 2015 586
Figure 4. a, Mean sea-level isobaric chart (hPa) of 0300 UTC of 4 September 2014. b–d, Wind analysis: (b) 850 hPa, (c) 500 hPa and (d) 200 hPa based on 0000 UTC of 4 September 2014.
good amount of moisture feeding from the Arabian Sea till 4 September 2014. Thereafter, due to the formation of another LOW in the head Bay of Bengal on 5 September 2014, further moisture feed continued through southeast-erly flow over J&K leading to extremely heavy rainfall during 4–6 September 2014.
Analysis of short-duration intensity of daily rainfall (3–6 September 2014)
To study the rainfall intensity, the hourly rainfall data re-corded at nine automatic rain gauges of IMD are shown in Figure 7, for the period 3–6 September 2014. The AWS data from all the IMD stations are received at the Earth Station in Pune and subjected to gross error check/range check before dissemination. This check ensures that the values of all meteorological parameters are within the sensor range. The software also has a provision to check
the current value of parameter for climatological consis-tency. The values are also subjected to time consistency check to ensure that temporal variation is within accept-able limit. The software has a provision to set maximum and minimum allowable change in the value of para-meters in an hour and decide appropriate flag depending upon the result of quality check (QC) procedures. After passing the data through QC checks, they are dissemi-nated to end-users in WMO code format14. The highest hourly rainfall of 35 mm was recorded in AWS Kawa (Udhampur) on 6 September 2014 between 2 and 3 h IST, followed by 17 mm in Anantnag on 6 September 2014 between 1–2 h IST and at Kulgam on 3 September 2014 between 16–17 h IST. The maximum three hourly rain-rates occurred in different three hourly intervals for 5 and 6 September 2014. For example, the three heaviest rain-rates were recorded between 0 and 3 h IST (101 mm) on 6 September 2014 in Kawa

RESEARCH ARTICLES
CURRENT SCIENCE, VOL. 109, NO. 3, 10 AUGUST 2015 587
Figure 5. a, Mean sea-level isobaric chart (hPa) of 0300 UTC of 5 September 2014. b–d, Wind analysis: (b) 850 hPa, (c) 500 hPa and (d) 200 hPa based on 0000 UTC of 5 September 2014.
Figure 6. a, Longitudinal time-section of meridional wind anomaly (m/s) along 30–35N at 500 hPa pressure level. b, Longitudinal time-section of 850 hPa geopotential height anomaly (m) averaged over 25–30N. c, Track of the low pressure systems that formed during the study period. WML, Well-marked low pressure area; L, Low pressure area.

RESEARCH ARTICLES
CURRENT SCIENCE, VOL. 109, NO. 3, 10 AUGUST 2015 588
Figure 7. Hourly rainfall recorded (mm) in a few automatic weather stations of IMD in Jammu and Kashmir. (Udhampur), 6–8 h IST (35 mm) on 4 September 2014 in Govindpur (Ramban) and between 23 h of 5 September 2014 and 2 h IST of 6 September 2014 (44 mm) at Pahal-gam (Anantnag). The rains were continuous and consis-tent from 4 to 6 September 2014, with an average rain-rate of 10–12 mm in Kawa (Udhampur), 6–8 mm in Govindpur (Ramban), 5–7 mm in Pahalgam (Anantnag), 5–6 mm in Shopian and lesser for other AWS stations. In Srinagar rain-rate was highest on 3 September 2014
(7–8 mm) and thereafter consistent 3–4 mm rain-rate was maintained till 6 September 2014 evening. The station at Kawa (Udhampur) was worst affected, receiving nearly 340 mm of rainfall in 14 h between 20 h IST of 5 Sep-tember and 10 h IST of 6 September 2014. Thus, the aver-age maximum intensity for Kawa was about 23 mm/h. Deshpande et al.15 have reported extreme rainfall for Srinagar as 40, 65, 91 and 111 mm for 1, 3, 6 and 12 h duration respectively, based on 1970–2005 records. The

RESEARCH ARTICLES
CURRENT SCIENCE, VOL. 109, NO. 3, 10 AUGUST 2015 589
Figure 8. Observed rainfall and GFS model days 1–3 rainfall forecast (mm) for 4 September 2014.
Figure 9. Observed rainfall and GFS model days 1–3 rainfall forecast (mm) for 5 September 2014.

RESEARCH ARTICLES
CURRENT SCIENCE, VOL. 109, NO. 3, 10 AUGUST 2015 590
Figure 10. Observed rainfall and GFS model days 1–3 rainfall forecast (mm) for 6 September 2014. Table 5. District-wise distribution of cumulative rainfall during 4–10 September 2014 and normal seasonal rainfall during monsoon season in J&K
Cumulative rainfall from Normal seasonal rainfall District 4–10 September (mm) (June–September) (mm)
Anantnag 309.1 285 Badgam 76.7 186 Baramulla 255.9 248 Doda 320.8 441 Ganderwal 32.6 184 Jammu 354.2 861 Kathua 193.2 982 Kulgam 460.2 269 Kupwara 129.2 253 Poonch 10.8 761 Pulwama 242.7 151 Rajouri 43.2 649 Ramban 425.6 401 Reasi 556 1323 Samba 47.4 861 Shopian 348.0 266 Srinagar 148.0 184 Udhampur 605.5 1377
rainfall recorded during 4–6 September 2014 for Srinagar has been much less than the maximum reported in the study.
Performance of operational NWP models
Global forecast system: The National Centre for Envi-ronmental Prediction (NCEP), USA-based global forecast system (GFS T574/L64) operational at IMD, New Delhi incorporates Global Statistical Interpolation (GSI) scheme as the global data assimilation for the forecast up to 7 days. The IMD GFS forecast rainfall (24, 48 and 72 h) valid for 4–6 September 2014 along with the corresponding observed rainfall is given in Figures 8–10 respectively. Rainfall over J&K on 4 September 2014 was reasonably captured during the day-1 forecast, although with lesser magnitude (Figure 8). Similarly, on 5 September 2014, the magnitude and location were well captured on day 1 but on days 2 and 3 the location was shifted southwards (Figure 9). On 6 September 2014, both the location and magnitude had shifted southwards on days 1–3 (Figure 10). Thus, the heavy rainfall event of J&K during 4–6 September 2014 was well captured only in the day-1 forecast.
Conclusions
The areas affected by floods were mostly districts in south Kashmir, including Anantnag, Pulwama, Baramulla
RESEARCH ARTICLES
CURRENT SCIENCE, VOL. 109, NO. 3, 10 AUGUST 2015 591
and Srinagar. These are in rain-shadow region of the Pir Panjal Range of the lesser Himalaya and receive less than 300 mm rainfall during the monsoon season. The total cumulative rainfall during the week from 4–10 September 2014 over these districts was 309 (Anantnag), 256 (Baramulla), 243 (Pulwama) and 148 mm (Srinagar), which is higher than the average rainfall for the entire monsoon season in these districts (Table 5). The continu-ous heavy rains were due to interaction between the westward-moving monsoon low and the eastward-moving deep trough in the mid-latitude westerlies. The additional low pressure areas that formed over Saurashtra and Kutch on 3 September 2014 and over the head Bay of Bengal on 5 September 2014 ensured that the vigour of the event was maintained through strong wind and moisture flux in J&K. In this article only meteorological observational analysis using large datasets has been made. More in-depth studies are needed to analyse the dynamical fac-tors responsible for models not performing well beyond 24 h.
1. Gadgil, S., The Indian monsoon and its variability. Annu. Rev. Earth Planet. Sci., 2003, 31, 429–467.
2. Pant, G. B. and Kolli, R. K., Characteristic features of South Asian summer monsoon. In Climate of South Asia, John Wiley, 1997, p. 17.
3. Dhar, O. N. and Nandargi, S., On some characteristics of severe rainstorms of India. Theor. Appl. Climatol., 1995, 50, 205–212.
4. Nandargi, S. S. and Dhar, O. N., Extreme rainstorm events over the Northwest Himalayas during 1875–2010. J. Hydrometeorol., 2012; doi: 10.1175/JHM-D-12-08.1,1383-1388.
5. Sikka, D. R., Some aspects of the life history, structure and movement of monsoon depressions. Pure Appl. Geophys., 1977, 115, 1501–1529.
6. Gabet, E. J., Burbank, D. W., Putkonen, J. K., Pratt-Sitaula, B. A. and Ojha, T., Rainfall thresholds for landsliding in the Himalayas
of Nepal. Geomorphology, 2004, 63, 131–143; doi: 10.1016/j. geomorph.2004.03.011.
7. Sengupta, A., Gupta, S. and Anbarasu, K., Rainfall thresholds for the initiation of landslide at Lanta Khola in North Sikkim, India. Nat. Hazards, 2010, 52, 31–42; doi: 10.1007/s11069-009-9352-9.
8. Houze, R. A., Wilson, D. C. and Smull, B. F., Monsoon convec-tion in the Himalayan region as seen by the TRMM precipitation Radar. Q. J. R. Meteorol. Soc., 2007, 133, 1389–1411.
9. Medina, S., Houze Jr, R. A., Kumar, A. and Niyogi, D., Summer monsoon convection in the Himalayan region terrain and land cover effects. Q. J. R.. Meteorol. Soc., 2010, 136, 593–600.
10. Houze, R. A., Rasmussen, K. L., Medina, S., Brodzik, S. R. and Romatschke, U., Anomalous atmospheric events leading to the summer 2010 floods in Pakistan. Bull. Am. Meteorol. Soc., 2011, 92, 291–298.
11. Yadav, B. P. and Bhan, S. C., Meteorological factors associated with July 2005 floods in river Jhelum. Mausam, 2010, 61(1), 39–46.
12. Archer, D. R. and Fowler, H. J., Using meteorological data to forecast seasonal runoff on the River Jhelum. Pak. J. Hydrol., 2008, 361(1–2), 10–23.
13. Mitra, A. K., Bohra, A. K., Rajeevan, M. N. and Krishnamurti, T. N., Daily Indian precipitation analysis formed from a merge of rain-gauge data with the TRMM TMPA satellite-derived rainfall estimates. J. Meteorol. Soc. Jpn, 2009, 87, 265–279.
14. Ranalkar, M. R., Gupta, M. K., Mishra, R. P., Anjan, A. and Krishnaiah, S., Network of automatic weather stations: time divi-sion multiple access type. Mausam, 2014, 65(3), 393–406.
15. Deshpande, N. R., Kulkarni, A. and Krishna Kumar, K., Charac-teristic features of hourly rainfall in India. Int. J. Climatol., 2012, 32, 1730–1744.
ACKNOWLEDGEMENTS. We thank the DGM, IMD, New Delhi for encouragement and logistic support to undertake this work. We also thank our colleagues acknowledge inputs from NWP Division and Nowcasting Division of IMD. Received 19 September 2014; revised accepted 2 June 2015