The book of OpenLayers 3
42
-
Upload
independent -
Category
Documents
-
view
3 -
download
0
Transcript of The book of OpenLayers 3


The book of OpenLayers 3Theory & Practice
Antonio Santiago
©2013 - 2014 Antonio Santiago

Tweet This Book!Please help Antonio Santiago by spreading the word about this book on Twitter!
The suggested hashtag for this book is #thebookofopenlayers3.
Find out what other people are saying about the book by clicking on this link to search for thishashtag on Twitter:
https://twitter.com/search?q=#thebookofopenlayers3

To my wife Pilar. To my parents. To my family.
To the OpenLayers community and to anyone who wants to learn.
Contents
About the book . . . . . . . . . . . . . . . . . . . . . . . . . . . . . . . . . . . . . . . . . . iWho is this book addressed ? . . . . . . . . . . . . . . . . . . . . . . . . . . . . . . . . . . iHow is the book organized ? . . . . . . . . . . . . . . . . . . . . . . . . . . . . . . . . . . iWhy I wrote this book? . . . . . . . . . . . . . . . . . . . . . . . . . . . . . . . . . . . . . iiThe book cover . . . . . . . . . . . . . . . . . . . . . . . . . . . . . . . . . . . . . . . . . ii
1 The Map and the View . . . . . . . . . . . . . . . . . . . . . . . . . . . . . . . . . . . . . 11.1 The Map . . . . . . . . . . . . . . . . . . . . . . . . . . . . . . . . . . . . . . . . . . 1
1.1.1 Map properties and methods . . . . . . . . . . . . . . . . . . . . . . . . . . . . 31.1.2 What really happens when a map is created . . . . . . . . . . . . . . . . . . . 41.1.3 Different ways to render the map . . . . . . . . . . . . . . . . . . . . . . . . . 5
1.2 The View . . . . . . . . . . . . . . . . . . . . . . . . . . . . . . . . . . . . . . . . . 61.2.1 Controlling the view . . . . . . . . . . . . . . . . . . . . . . . . . . . . . . . . 61.2.2 Resolutions and zoom levels . . . . . . . . . . . . . . . . . . . . . . . . . . . . 81.2.3 The view properties . . . . . . . . . . . . . . . . . . . . . . . . . . . . . . . . 91.2.4 Other useful methods . . . . . . . . . . . . . . . . . . . . . . . . . . . . . . . 10
1.3 Animations . . . . . . . . . . . . . . . . . . . . . . . . . . . . . . . . . . . . . . . . 111.3.1 The animation functions . . . . . . . . . . . . . . . . . . . . . . . . . . . . . . 121.3.2 The tween functions . . . . . . . . . . . . . . . . . . . . . . . . . . . . . . . . 121.3.3 Applying animations . . . . . . . . . . . . . . . . . . . . . . . . . . . . . . . . 13
1.4 The practice . . . . . . . . . . . . . . . . . . . . . . . . . . . . . . . . . . . . . . . . 151.4.1 A basic map . . . . . . . . . . . . . . . . . . . . . . . . . . . . . . . . . . . . . 15
1.4.1.1 Goal . . . . . . . . . . . . . . . . . . . . . . . . . . . . . . . . . . . . 151.4.1.2 How to do it… . . . . . . . . . . . . . . . . . . . . . . . . . . . . . . . 151.4.1.3 How it works… . . . . . . . . . . . . . . . . . . . . . . . . . . . . . . 16
1.4.2 Moving around . . . . . . . . . . . . . . . . . . . . . . . . . . . . . . . . . . . 171.4.2.1 Goal . . . . . . . . . . . . . . . . . . . . . . . . . . . . . . . . . . . . 171.4.2.2 How to do it… . . . . . . . . . . . . . . . . . . . . . . . . . . . . . . . 181.4.2.3 How it works… . . . . . . . . . . . . . . . . . . . . . . . . . . . . . . 21
1.4.3 Animating the view . . . . . . . . . . . . . . . . . . . . . . . . . . . . . . . . 221.4.3.1 Goal . . . . . . . . . . . . . . . . . . . . . . . . . . . . . . . . . . . . 221.4.3.2 How to do it… . . . . . . . . . . . . . . . . . . . . . . . . . . . . . . . 231.4.3.3 How it works… . . . . . . . . . . . . . . . . . . . . . . . . . . . . . . 27

CONTENTS
1.4.4 Fit an extent . . . . . . . . . . . . . . . . . . . . . . . . . . . . . . . . . . . . 301.4.4.1 Goal . . . . . . . . . . . . . . . . . . . . . . . . . . . . . . . . . . . . 301.4.4.2 How to do it… . . . . . . . . . . . . . . . . . . . . . . . . . . . . . . . 301.4.4.3 How it works… . . . . . . . . . . . . . . . . . . . . . . . . . . . . . . 33

About the bookNowadays, a great degree of data is susceptible to be located and visualized in amap, from geologicalor climate data to marketing and sales information.
Geographic information has become one of most important and valuable kind of informations.
Professionals from many industries needs to know and be up to date with all the related GIStechnologies: spatial databases, map and feature servers, desktop or web application, frameworks,libraries, etc.
Within all this network, web technologies are one that has grown more in last decade due, in part,by the browsers performance evolution.
Who is this book addressed ?
This book is for anyone interested on Geographic Information Systems (GIS) technologies and,concretely, on web mapping based on the new version of OpenLayers library.
OpenLayers3 is one of the most complete and powerful open source GIS solutions for webdevelopment.
Whether you are an experienced user or a new OpenLayers user, this book is a great reference tostart learning the new concepts and API of the OpenLayers3. Learn to create maps, add controls andanimations, add data from OGC compliant servers using standard formats, work with vector layers,style features, etc.
How is the book organized ?
No one becomes an expert reading a book. Learn anything implies two things: understand concepts(the theory) and obtain experience working in real world samples (the practice).
Because of this, I have wanted to create a book as a mix between an usual programmers book anda cookbook. All chapters has been divided in two sections, the theory where I explain the chapterrelated concepts, and the practice, where we can see simple but real examples.
The chapters follows the order I consider are the logical path to introduce, understand and learnhow to work with OpenLayers3.

About the book ii
Why I wrote this book?
There are many reasons to write a book: to teach others, to earn money, for fame, … but mine ismuch more selfish than any of those. I wrote this book to learn.
As developer, learn new technologies and be up to date is part of my job. My day to day is a mixbetween front-end and back-end developer and OpenLayers is one of the tools in my toolbox. Afterlooking at the new OpenLayers3 API it was clear the project had been made a great evolution (newconcepts and completely new API) so I started to look at it.
As someone says the best way to learn is to teach¹. That is the real reason I started writing this book.I hope you enjoy it as I enjoy writing it.
The book cover
The book cover is the work of my friend Hugo Tobio² an awesome illustrator. It is based onthe OpenLayers logo, its colors and shape. It expresses the ability to build great things with thecomponents offered by the library.
¹http://en.wikipedia.org/wiki/Frank_Oppenheimer²http://hugotobio.com

1 The Map and the ViewAmong all the elements in the OpenLayers3 puzzle, the map is probably the main piece, so it isnatural to start introducing to OpenLayers3 describing how to work with it.
Contrary to previous versions, OpenLayers3 differentiates between the concept ofmap, which takescare of layers, controls, overlays, etc and the way we visualize it, which is done by the view. Theview is like a window through which we see the map. It allows to change the location we are lookingat or go closer or farther.
The concept of view allows us to make things like render the same map in different views (centeredat different places), render the same map in a 2D view and in a 3D one, or render different mapsusing the same view.
The goal of OpenLayers3 is to offer two implementations of the view: 2D and 3D.Unfortunately, when I write this lines, only a 2D view implementation is available butthere are plans for creating a 3D view based on the Cesium¹ project.
1.1 The Map
The ol.Map is the class that allows to handle the concept of map in our application. We can add orremove layers, controls, overlays and interactions.
On its simplest form, creating a new ol.Map instance requires the user specifies an object with thenext properties:
• target, the target HTML element (a DOM² node), where the map will be rendered• layers, one or more layer references with the data to be shown• view, an ol.View instance responsible to manage the way to visualize the map.
¹http://cesiumjs.org²http://en.wikipedia.org/wiki/Document_Object_Model
The Map and the View 2
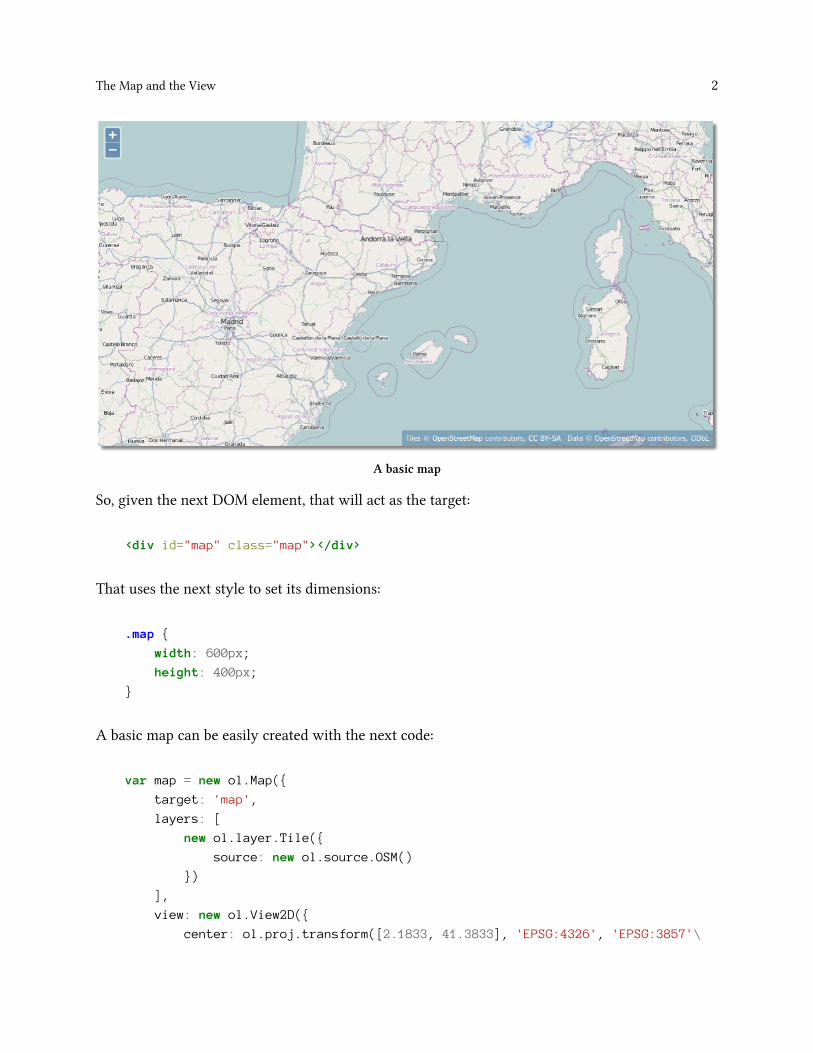
A basic map
So, given the next DOM element, that will act as the target:
<div id="map" class="map"></div>
That uses the next style to set its dimensions:
.map {
width: 600px;
height: 400px;
}
A basic map can be easily created with the next code:
var map = new ol.Map({
target: 'map',
layers: [
new ol.layer.Tile({
source: new ol.source.OSM()
})
],
view: new ol.View2D({
center: ol.proj.transform([2.1833, 41.3833], 'EPSG:4326', 'EPSG:3857'\

The Map and the View 3
),
zoom: 6
})
});
The target can be a string with the element identifier or a reference to the element itself, forexample, retrieving it using document.getElementById('map'). The map will be created withinthe target element and will fill it completely. The target allows to layout or style the map within theweb page.
The layers arraymust contain instances of layers, defined at the ol.layer namespace. In the sample,we are using a tile based layer that uses OpenStreetMap³ project as data source. Don’t worry aboutthe code related to layers at this point, we will cover it in detail in next chapters.
Finally, the view instance we are passing is a 2D view initialized at zoom level 6 and centerednear Barcelona city. As the ol.source.OSM source uses the projection EPSG:3857, the center of theview must be set in the same projection and, because the center is specified in EPSG:4326, we musttransform it to be in EPSG:3857.
Explain map projections⁴ is out of the scope of this book. We only cover how to make afew transformations to work with data in OpenLayers3.
It is worth to say that, by default, if no controls are specified when a map instance is created it isautomatically initialized with the controls: attribution, logo and zoom (which we will cover in nextchapters).
1.1.1 Map properties and methods
Although we usually initialize a map using the previous properties, the ol.Map class uses internallyonly four properties: the target, the layergroup, the view and size.
The target and the viewwere described in previous sections, while the size contains an array withthe map size in pixels.
The layergroup property is a reference to a ol.layer.Group instance, which stores the references tothe layers of the map. Thus, the initial set of layers we specify in the layers property at initializationtime are stored in the layergroup.
We will discuss in depth the ol.layer.Group class in the Layer Groups section on Layerschapter.
³http://www.openstreetmap.org⁴http://en.wikipedia.org/wiki/Map_projection

The Map and the View 4
The ol.Map class offers methods to get and set its properties in addition to methods needed to workwith layers, controls, etc. In this section we will cover the most basic ones while we will see the restin next chapters.
All the map properties has its corresponding getter and setter methods: getTarget, setTarget,getView, setView, getSize, setSize, getLayerGroup and setLayerGroup.
var size = map.getSize(); // [x,y] pixel size
var view = map.getView();
In addition to the getLayerGroup, which returns a ol.layer.Group reference, the map offer thegetLayers method which returns an array with the layers of the map:
var group = map.getLayerGroup(); // ol.layer.Group instance
var layers = map.getLayers(); // [layerA, layerB, ...]
Read the Controlling the layer stack section on Layers chapter to learn more about thedifference of layers and layergroup.
1.1.2 What really happens when a map is created
When an ol.Map instance is created on a target DOM element, OpenLayers3 creates a new div
element within the target, called the viewport, that is the real location where the map, the controlsor the overlays are placed.
As example, next we show the code created for a DOM based map on a target domMap element:
<div id="domMap" class="map">
<div class="ol-viewport" style="position: relative; overflow: hidden; wid\
th: 100%; height: 100%;">
<div class="ol-unselectable" style="position: absolute; width: 100%; \
height: 100%;">...</div>
</div>
<div class="ol-overlaycontainer"></div>
<div class="ol-overlaycontainer-stopevent">
<div class="ol-attribution ol-unselectable">...</div>
<div class="ol-logo ol-unselectable">...</div>
<div class="ol-zoom ol-unselectable">...</div>
</div>
</div>
If for any reason you will need access to this element you can obtain a reference from the mapinstance with the getViewport method.

The Map and the View 5
var map = new ol.Map({
target: "domMap",
...
});
var viewport = map.getViewport();
1.1.3 Different ways to render the map
OpenLayers3 comes with the ability to render the maps using three different technologies: DOM,canvas and WebGL.
Using DOM renderer, all map elements are drawn using HTML elements, for example using img
for tiles or svg for features. With canvas, the maps are rendered using the HTML5 canvas element,which offers an scriptable way to render 2D shapes and bitmap images. Finally, WebGL rendersthe map using the WebGL technology, a subset of OpenGL standard suitable for browsers and thatallows to take advantage of the GPU⁵ power.
You can force the map to use a specific renderer using the renderer or renderers properties. Therenderer can be set to one of the three possible values defined at the ol.RendererHint enumeration,which are: ol.RendererHint.WEBGL, ol.RendererHint.CANVAS and ol.RendererHint.DOM. On theother hand, the renderers property allows to specify an array of values.
Next sample forces the map to use the DOM mechanism to render its content:
var domMap = new ol.Map({
...
renderer: ol.RendererHint.DOM
...
});
By default, if none of the previous properties are specified, OpenLayers3 sets the renderers propertyto the next hints [ol.RendererHint.WEBGL. ol.RendererHint.CANVAS, ol.RendererHint.DOM].This means when a new map instance is created OpenLayers3 tries to use the WebGL renderer if itis supported by the browser, otherwise tries to use the canvas technology and, finally, if neither issupported uses the DOM mechanism.
Default renderer hints are set from better to worst performance. DOM mechanism has theleast performance.
In addition there is one more option to set up the rendered mechanism for our applications.The helper function ol.RendererHints.createFromQueryData allows to initialize the renderingmechanism from the renderer or renderers parameters specified in the URL.
⁵http://en.wikipedia.org/wiki/Graphics_processing_unit

The Map and the View 6
So, given a map initialized as follows:
var map = new ol.Map({
...
renderers: ol.RendererHints.createFromQueryData(),
...
});
and supposing our application is located at http://ourserver/ourapp, next are two valid samplesof URLs to be used to set the rendering mechanism:
http://ourserver/ourapp?renderer=canvas
http://ourserver/ourapp?renderers=canvas,webgl,dom
The valid values for the request parameters are webgl, canvas and dom. If no parameter is specifiedthe map is initialized with the default renderer hints.
1.2 The View
The concept of view is handled by the ol.View2D class and, as we have say previously, it determineshow the map is visualized allowing to change the zoom level, the center location or the rotationangle.
When instantiating a new view we need, at least, to specify a center location and zoom level (or aresolution value) to have a full functional view instance:
var view = new ol.View2D({
center: [0, 0],
zoom: 2
});
1.2.1 Controlling the view
The view is controlled by three properties: center, resolution and rotation. For this purpose,ol.View2D class offers getter and setter methods like: getCenter, setCenter, setResolution,getResolution, getRotation and setRotation.
The view also offer the getZoom and setZoom methods that also modifies the view’s zoomlevel. As we will see in the next section Resolutions and zoom levels, the ol.View2D worksinternally with the resolution property so modify the zoom level implicitly modifies theview’s resolution.
Given the next view instance:

The Map and the View 7
var view = new ol.View2D({
projection: 'EPSG:4326'
});
we can set the center location:
view.setCenter([2.1833, 41.3833]);
In OpenLayers3 we can specify coordinates with a simple array with two values forlongitude and latitude. Older versions has the OpenLayers.LonLat class to work withlocations.
We usually talk about latitude and longitude while OpenLayers requires the center locationbe specified as [longitude, latitude] array. Why? This is because when translateslatitude and longitude to a Cartesian plane, we express location using [x,y] array. The xelement represents the horizontal displacement and the y element the vertical displacement.Translated to geographic location the horizontal displacement is the longitude while thevertical displacement is the latitude.
change the resolution or zoom level:
view.setResolution(12000);
view.setZoom(7);
or rotate the view 5 degrees:
view.setRotation( 5 * Math.PI / 180);
Note the rotation angle must be expressed in radians, because of this we need to transformdegrees to radians.
In addition, the view has also a projection property, which is used to determine the coordinatesystem of the center. By default, the projection used is EPSG:3857. The properties getProjectionand setProjection allows us to retrieve and set the projection value.

The Map and the View 8
1.2.2 Resolutions and zoom levels
Usually, we talk about zoom levels and resolutions as if they were the same thing. It is true both areclose related but it is important to understand the differences between them.
Lets take as example the tile images from the OpenStreetMap project. At level zero, one tile is usedto show the whole world. At level one, four tiles are used to show the world. At level two, eighttiles. And so on. Following this rule, we can see each zoom level is formed by 2nx2n tiles, where nis the zoom level.
Zoom levels
Now, lets go to compute the resolution of each level. In EPSG:4326 projection, the length of theequator measures 40,075,016.686 meters. Working with a tile size of 256x256 pixels, that means, atzoom level zero the resolution of each pixel is 40,075,016.686 / 256 = 156,543.034 meter/pixel.At level one, two tiles are required to visualize the world so each tile represents (40,075,016.686 /
2) meters, the resolution of each pixel is (40,075,016.686 / 2) / 256 = 78,271.52 meters/pixel.Next table shows the relation among zoom levels, number of tiles and resolution:
Zoom Tiles Resolution (meters)
0 1x1 156,543.031 2x2 78,271.522 4x4 39,135.763 8x8 19,567.88… … …

The Map and the View 9
You can find more detail at the Slippy Map⁶ web page from OpenStreetMap project.
Looking at the above table, we can understand why no matter which method to use to modifythe view, if setZoom or setResolution, because both modifies the resolution property, the firstspecifying the zoom level and the second the resolution directly.
Even so the setZoom is probably more used than setResolution, since it is more easy to use becausedoes not requires to remember big numbers.
1.2.3 The view properties
We have seen the the ol.View2D class has three important properties through which we can controlit: center, resolution and rotation (plus the projection to indicate the view’s center coordinatesystem) but, in addition, it has other properties that can help us to configure it:
• resolutions, an array of valid resolutions that determines the zoom levels,• maxResolution, the maximum resolution (corresponds to the resolution value at zoom levelzero),
• maxZoom, the maximum number of zoom levels, we could change the zoom level from levelzero to this value,
• zoomFactor, we can understant it as the step value used to increase the zoom. By default it is2 because of this each zoom level has half of the resolution of the previous level.
These properties can only be used at instantiation time, there are no methods to modify itsvalues once the view is initialized.
We need to take into account if the resolutions property is passed to the view constructor the otherthree will be ignored or, said with other words, we can not pass the resolutions property if we wantto make use of the other properties. They are exclusive.
The resolutions property takes precedence over the maxResolution, maxZoom andzoomFactor. This is true because we can compute them from the resolutions array.
Next code shows a view instance initialized using the resolutions property:
⁶http://wiki.openstreetmap.org/wiki/Slippy_map_tilenames#Resolution_and_Scale

The Map and the View 10
var view = new ol.View2D({
center: [0, 0],
zoom: 0,
resolutions: [78271.52 , 39135.76]
});
This means the view will have two zoom levels. The zoom level 0 that corresponds to the resolutionvalue 78271.52 and the zoom level 1 that corresponds to the resolution 39135.76. Because the secondvalue is half of the first, the zoomFactor of the view is 2. The maxResolution property correspondsto the value 78271.52 and the maxZoom is 1.
Now, compare to the next example:
var view = new ol.View2D({
center: [0,0],
zoom: 0,
maxResolution: 78271.52,
maxZoom: 1,
zoomFactor: 2
});
With this configuration we will have two zoom levels, because the maxZoom=1, level 0 with acorresponding resolution of 78271.52 and level 1 that will be automatically computed as 78271.52/ 2 = 39135.76. If we were specified a maxZoom=2 we have been got three zoom levels, from 0 to 2,and the zoom level 2 would be computed as 39135.76 / 2 = 19567.88.
1.2.4 Other useful methods
In addition to the getter and setter methods previously seen, the ol.View2D offers other methodscan be useful in some situations.
• fitExtent, adjust the view location and zoom level to a given extent,• calculateExtent, returns the current extent visualized by the view,• constrainResolution, given a resolution value returns the closest valid available resolution,• constrainRotation, adjusts a rotation value given a set or rules.
So, given a map instance we can get the current extent we are visualizing with:
var view = map.getView();
var extent = view.calculateExtent( map.getSize() );

The Map and the View 11
Because a view can be used for more than one map instance, you need to specify the mapsize in the calculateExtent, that is, the view can not retrieve automatically the map sizebecause it has no reference to the map.
Now, we can navigate in the map and return to the original place applying the previous extent:
view.fitExtent( extent, map.getSize() );
Supposing the next map instance that uses a view with two resolutions:
var map = new ol.Map({
...
view: new ol.View2D({
resolutions: [78271.52 , 39135.76],
...
}),
...
});
we can change the view resolution specifying a zoom level with the setZoom method:
view.setZoom(1);
or we can change the view resolution to any desired value using setResolution method:
view.setResolution(40000);
But.. what if we want to restrict resolution values to one of the valid values defined? Using theconstrainResolution method we can constrain the resolution value before setting it:
var resolution = constrainResolution(40000); // This will return 39135.76
view.setResolution(resolution);
1.3 Animations
Modifying the view using its setter methods gives us lot of flexibility but, unfortunately, the changeson its properties (zoom level or center location) can be too much sudden. Sometimes what we desireis a more user friendly movement, like a nice displacement to some location. For this purpose,OpenLayers3 offers the concept of animation.

The Map and the View 12
1.3.1 The animation functions
Animations are functions specially designed to tween the view properties (center, rotation andresolution) producing a nice transition effects.
Next are all the available animations, which resides within the ol.animation namespace:
• ol.animation.pan, modifies the view’s center,• ol.animation.rotate, modifies the rotation angle,• ol.animation.zoom, modifies the zoom property,• ol.animation.bounce, modifies the resolution property to create a bounce effect.
Each of these functions returns a new one that does the real animation task. Because each functionis appropriate for a view property (center, rotation or resolution) each function requires we need tospecify at least one option. For the ol.animation.pan we need to specify the source point where tostart the animation:
var pan = ol.animation.pan({
source: ... // Initial center location
});
For the ol.animation.rotatewe need to specify at least the rotation options with the angle value.
var rotate = ol.animation.rotate({
rotation: ... // Initial rotation angle
});
Finally, for the ol.animation.zoom and ol.animation.bounce we need to specify the resolutionoption.
var zoom = ol.animation.zoom({
resolution: ... // Initial resolution
});
1.3.2 The tween functions
In addition to the animation functions, OpenLayers3 offers a set of tween⁷ functions that allowscontrol the transition of the values to be modified. This way, we have more degree of flexibility,because we can mix the animation function with the tween function it must be used.
⁷http://en.wikipedia.org/wiki/Inbetweening

The Map and the View 13
A tween function allows to modify a variable in a specified duration of time from an initialto a final value. Within that duration, each time we execute the function it will return avalue between the initial and final according to a mathematic formula.
The tween functions are located at the ol.easing namespace and they are:
• ol.easing.easeIn, start slow and speed up,• ol.easing.easeOut, start fastest and slows to a stop,• ol.easing.inAndOut, start slow, speed up, then slow down,• ol.easing.linear, constantly in time,• ol.easing.bounce, bounce effect,• ol.easing.elastic, elastic effect,• ol.easing.upAndDown, increases and decreases a value.
Note the ol.easing.upAndDown is more suitable to be used with the ol.animation.bounceanimation.
All the animations accepts the easing and duration options. With the easing we can specifythe tween function to be used, while with the duration we specify the time of the transition inmilliseconds:
var pan = ol.animation.pan({
duration: 2000,
easing: ol.easing.bounce,
source: map.getView().getCenter()
});
1.3.3 Applying animations
The map is almost constantly refreshing. Each time a change is produced, like when you pan themap or when a layer loads new data, the map is completely rendered.
The renderer process is reasonably complicated. It needs to render all the data layers of the map,both raster and vector, the controls and the overlays. All this taking into account properties likethe projection, the view center or the resolution, not to mention the features styling, and with theaddition it can be made using three different mechanisms: WebGL, canvas and DOM.
You’ll be asked why I’m talking about the rendering process, and the answer is because theanimations are placed at the beginning of it.
The ol.Map class offers the beforeRender method that accepts a so called preRender function asparameter. If you look at the OpenLayers3 source code you will find they are functions with the

The Map and the View 14
ol.PreRenderFunction type definition. Hopefully for us, all the functions in the ol.animation
namespace are suitable to be used as preRender functions.
After all the explanation, we can summarize that to create an animation we need to follow the nextthree steps:
• Create the desired animation function, optionally setting the desired tween function,• Attach it to the map, using the beforeRender method,• Make the change on the view to trigger the animation.
Remember the options passed to the animation function acts as the initial value while thevalue specified when modifying the view acts as the final value, so the animation will gofrom the initial to the final value using the specified tween function.
Next code creates a pan animation from the current view center to the coordinate origins:
// Define an animation function setting the current view's center
// as the initial position
var pan = ol.animation.pan({
source: map.getView().getCenter()
});
// Attach to the map
map.beforeRender(pan);
// Modify the view to a final position
map.getView().setCenter([0, 0]);
Next, increases 10 degrees the view’s rotation angle, animating it with a bounce effect:
// Define an animation function setting the current view's rotation
// as the initial angle value
var pan = ol.animation.rotate({
rotation: map.getView().getRotation(),
easing: ol.easing.bounce
});
// Attach to the map
map.beforeRender(pan);
// Modify the view's rotation angle to a final value
map.getView().setRotation(map.getView().getRotation() + 10 * Math.PI / 180);

The Map and the View 15
Take into account, the animations are available only once within the rendering process.Each time we add an animation to the map using the beforerender method they arequeued, in a list of preRender functions, ready to be consumed in the next map renderingaction. So, when we change any property of the view, it triggers the rendering processesthat consumes all the preRender queued functions and remove them from the queue.
1.4 The practice
All the examples follows the code structured described at section Getting ready for programmingwith OpenLayer3 on chapter Before to start.
The source code for all the examples can be freely downloaded from thebookofopenlayers3⁸repository.
1.4.1 A basic map
1.4.1.1 Goal
Introduce the ol.Map and ol.View2D classes and see how to create a basic map.
1.4.1.2 How to do it…
The map needs to be rendered on an HTML element, so we are going to use a <div> element:
<div id="map" class="map"></div>
The HTML element uses a CSS class we use to define its size. Within the <head> section of the HTMLdocument add an <style> with the next code:
.map {
width: 100%;
height: 500px;
box-shadow: 5px 5px 5px #888;
}
It makes the map 100% width and 500 pixels height and adds a nice shadow effect to emulate themap is floating over the page.
Nowwe can add the JavaScript code responsible to create the map. At the end of the document bodyadd a <script> element with:
⁸https://github.com/acanimal

The Map and the View 16
/**
* Create a map using a 2D view with a tile layer retrieving tiles from
* OpenStreetMap project
*/
var map = new ol.Map({
// The DOM element that will contains the map
target: 'map',
// The initial set of layers
layers: [
// Add a new Tile layer getting tiles from OpenStreetMap source
new ol.layer.Tile({
source: new ol.source.OSM()
})
],
// The view to be used to show the map is a 2D
view: new ol.View2D({
center: ol.proj.transform([2.1833, 41.3833], 'EPSG:4326', 'EPSG:3857'\
),
zoom: 6
})
});
1.4.1.3 How it works…
A map requires a target, a HTML element where to render it, so we have specified the identifier ofthe <div> element previously created:
target: 'map'
Remember the target can be an string with the element identifier or a reference to theelement, for example, using document.getElementById('map').
There has no sense a map without at least a layer. The layers of the map can be specified atinitialization time passing an array of layers to the layers property. In the sample, we have createda layer that loads tiles from OpenStreetMap⁹ project:
⁹http://www.openstreetmap.org

The Map and the View 17
layers: [
// Add a new Tile layer getting tiles from OpenStreetMap source
new ol.layer.Tile({
source: new ol.source.OSM()
})
]
Finally, the map requires a view which controls how it is rendered (defines the center location, thezoom level, etc). In the sample, we have created a 2D view, centered near of Barcelona city (Spain)and using a zoom level equal to 6:
view: new ol.View2D({
center: ol.proj.transform([2.1833, 41.3833], 'EPSG:4326', 'EPSG:3857'),
zoom: 6
})
The ol.View2D has a projection property that determines the coordinate system of the view’scenter. By default this projection is EPSG:3857 and because of this, if we specify the center locationin a different projection we need to transform it. In the sample we have set the center to [2.1833,
41.3833], which is EPSG:4326, so we transform it using the ol.proj.transform method.
1.4.2 Moving around
1.4.2.1 Goal
Demonstrate howwe can change the view properties programmatically. We are going to create threeforms to modify the center location, the rotation angle and the zoom level.

The Map and the View 18
Moving around
1.4.2.2 How to do it…
First we need to add the HTML code for the forms and the HTML to hold the map:
<div class="example">
Change center lon/lat:
<form role="form">
<div class="form-group">
<label for="lat">Latitude:</label>
<input type="text" class="form-control" id="lat" placeholder="lon\
gitude" value="0.0">
</div>
<div class="form-group">
<label for="lon">Longitude:</label>
<input type="text" class="form-control" id="lon" placeholder="lat\
itude" value="0.0">
</div>

The Map and the View 19
<button type="button" class="btn btn-primary btn-xs" id="changeCenter\
">Change</button>
</form>
</div>
<div class="example">
Change rotation angle:
<form role="form">
<div class="form-group">
<label for="angle">Degrees:</label>
<input type="text" class="form-control" id="angle" placeholder="r\
otation angle" value="5.0">
<span class="help-block">(OpenLayers3 requires you transform to r\
adians)</span>
</div>
<button type="button" class="btn btn-primary btn-xs" id="changeRotati\
on">Change</button>
</form>
</div>
<div class="example">
Change zoom:
<form role="form">
<div class="form-group">
<label for="level">Level:</label>
<input type="text" class="form-control" id="level" placeholder="z\
oom level" value="7">
</div>
<button type="button" class="btn btn-primary btn-xs" id="changeZoom">\
Change</button>
</form>
</div>
<div id="map" class="map"></div>
We use some CSS classes to beautify the map and define the forms width. Within the <head> sectionof the HTML document add an <style> with the next code:

The Map and the View 20
.map {
width: 100%;
height: 500px;
box-shadow: 5px 5px 5px #888;
}
.example {
width: 200px;
border: 1px solid #ddd;
padding: 5px;
display: inline-block;
vertical-align: top;
}
Finally add the JavaScript to initialize the map and modify view properties when buttons are clicked.At the end of the document body add a <script> element with:
/**
* Create a map using a 2D view with a tile layer retrieving tiles from
* OpenStreetMap project
*/
var map = new ol.Map({
// The DOM element that will contains the map
target: 'map',
// The initial set of layers
layers: [
// Add a new Tile layer getting tiles from OpenStreetMap source
new ol.layer.Tile({
source: new ol.source.OSM()
})
],
// The view to be used to show the map is a 2D
view: new ol.View2D({
center: ol.proj.transform([2.1833, 41.3833], 'EPSG:4326', 'EPSG:3857'\
),
zoom: 6
})
});
$(document).ready(function() {
var center = ol.proj.transform(map.getView().getCenter(), 'EPSG:3857', 'E\
PSG:4326');

The Map and the View 21
$('#lon').val(center[0]);
$('#lat').val(center[1]);
$('#angle').val(map.getView().getRotation());
$('#level').val(map.getView().getZoom());
$('#changeCenter').on('click', function() {
var center = [parseInt($('#lon').val()), parseInt($('#lat').val())];
map.getView().setCenter(ol.proj.transform(center, 'EPSG:4326', 'EPSG:\
3857'));
});
$('#changeRotation').on('click', function() {
map.getView().setRotation($('#angle').val() * Math.PI / 180);
});
$('#changeZoom').on('click', function() {
map.getView().setZoom($('#level').val());
});
});
We are using jQuery library, so the code responsible to handle buttons events is enclosedwithin the $(document).ready() to ensure it is executed once the document is full loaded.
1.4.2.3 How it works…
The map is initialized in the same way as in the A basic map example.
Once the document is fully loaded we initialize the form input texts with the current view propertiesvalues (the current center point, rotation and zoom level):
var center = ol.proj.transform(map.getView().getCenter(), 'EPSG:3857', 'EPSG:\
4326');
$('#lon').val(center[0]);
$('#lat').val(center[1]);
$('#angle').val(map.getView().getRotation());
$('#level').val(map.getView().getZoom());
Thanks to jQuery, we have registered a listener function that is executed when the button is clicked.Next is the registration for the button responsible to modify the center location:
The Map and the View 22
$('#changeCenter').on('click', function() {
// Actions here
});
Because the view uses, by default, the EPSG:3857 projection and we are specifying the centerlocation using EPSG:4326 values, when the user changes the center, the listener function gets thenew longitude and latitude values and transforms them using the ol.proj.transform() method:
var center = [parseInt($('#lon').val()), parseInt($('#lat').val())];
map.getView().setCenter(ol.proj.transform(center, 'EPSG:4326', 'EPSG:3857'));
Note how the array with the new position is specified with [lon, lat] values (and not [lat, lon]).
When user changes the rotation angle, the listener function must get the new value specified indegrees and translate to radians:
map.getView().setRotation($('#angle').val() * Math.PI / 180);
Finally, the listener responsible to change the zoom level simply requires to get the new value andapply it:
map.getView().setZoom($('#level').val());
1.4.3 Animating the view
1.4.3.1 Goal
Explain how to create animations to interact with the view.
We will create two different radio buttons list where to select the different combinations betweenanimation and tween functions. Each time the user clicks the map the animation will be executed.

The Map and the View 23
Moving around
1.4.3.2 How to do it…
First we need to add the HTML code for the radio buttons and the map element:
<div class="example" id="animation">
<h5>Animation:</h5>
<div class="radio">
<label>
<input type="radio" name="animationGroup" value="pan" checked>
ol.animation.pan
</label>
</div>
<div class="radio">
<label>
<input type="radio" name="animationGroup" value="rotate">
ol.animation.rotate
</label>
</div>

The Map and the View 24
<div class="radio">
<label>
<input type="radio" name="animationGroup" value="zoom">
ol.animation.zoom
</label>
</div>
<div class="radio">
<label>
<input type="radio" name="animationGroup" value="bounce">
ol.animation.bounce
</label>
</div>
</div>
<div class="example" id="tween">
<h5>Tween:</h5>
<div class="radio">
<label>
<input type="radio" name="tweenGroup" value="easeIn" checked>
ol.easing.easeIn
</label>
</div>
<div class="radio">
<label>
<input type="radio" name="tweenGroup" value="easeOut">
ol.easing.easeOut
</label>
</div>
<div class="radio">
<label>
<input type="radio" name="tweenGroup" value="inAndOut">
ol.easing.inAndOut
</label>
</div>
<div class="radio">
<label>
<input type="radio" name="tweenGroup" value="elastic">
ol.easing.elastic
</label>
</div>
<div class="radio">

The Map and the View 25
<label>
<input type="radio" name="tweenGroup" value="linear">
ol.easing.linear
</label>
</div>
<div class="radio">
<label>
<input type="radio" name="tweenGroup" value="bounce">
ol.easing.bounce
</label>
</div>
<div class="radio">
<label>
<input type="radio" name="tweenGroup" value="upAndDown">
ol.easing.upAndDown
</label>
</div>
</div>
<div id="map" class="map"></div>
Add some CSS classes and styles to beautify the map and the controls:
.map {
height: 500px;
margin: 5px auto;
box-shadow: 5px 5px 5px #888;
}
.example {
width: 200px;
border: 1px solid #ddd;
padding: 5px;
display: inline-block;
vertical-align: top;
font-size: 0.8em;
}
Finally add the JavaScript code responsible to create the view animations:

The Map and the View 26
/**
* Create a map using a 2D view with a tile layer retrieving tiles from
* OpenStreetMap project
*/
var map = new ol.Map({
// The DOM element that will contains the map
target: 'map',
// The initial set of layers
layers: [
// Add a new Tile layer getting tiles from OpenStreetMap source
new ol.layer.Tile({
source: new ol.source.OSM()
})
],
// The view to be used to show the map is a 2D
view: new ol.View2D({
center: ol.proj.transform([2.1833, 41.3833], 'EPSG:4326', 'EPSG:3857'\
),
zoom: 6
})
});
/**
* Creates the appropriate animation given the specified animation
* and tween functions.
*/
function createAnimation(animationFunction, tweenFunction) {
var params = {
easing: eval(tweenFunction)
};
if (animationFunction === ol.animation.pan) {
params.source = map.getView().getCenter();
} else if (animationFunction === ol.animation.rotate) {
params.rotation = map.getView().getRotation();
} else if (animationFunction === ol.animation.bounce) {
params.resolution = map.getView().getResolution() * 2;
} else {
params.resolution = map.getView().getResolution();
}
return animationFunction(params);

The Map and the View 27
}
/**
* Register a listener for a singleclick event on the map.
*/
map.on('singleclick', function(event) {
var animationFunction = ol.animation[ $("#animation input:checked").val()\
];
var tweenFunction = ol.easing[ $("#tween input:checked").val() ];
var animation = createAnimation(animationFunction, tweenFunction);
// Add animation to the render pipeline
map.beforeRender(animation);
// Modify the view
if (animationFunction === ol.animation.pan) {
// Change center location
map.getView().setCenter(event.getCoordinate());
} else if (animationFunction === ol.animation.rotate) {
// Increase rotation angle 10 degrees
map.getView().setRotation(map.getView().getRotation() + 10 * Math.PI \
/ 180);
} else if (animationFunction === ol.animation.bounce) {
map.getView().setCenter(map.getView().getCenter());
} else {
// Change zooom
map.getView().setResolution(map.getView().getResolution() / 2);
}
});
1.4.3.3 How it works…
As we saw at Animations section from The Map and the View chapter, animations are functionsspecially designed to modify a view property. In addition, each animation function will change theproperty value using a tween function, which determines how a value changes on time. This waywe can use different tween functions for the same animation producing different effects.
Because wewant to start the animation when the user clicks on the mapwe have registered a listenerfunction for the singleclick event:

The Map and the View 28
map.on('singleclick', function(event) {
...
});
The listener function is responsible to:
1. Get the selected animation and tween functions,2. Create the animation,3. Apply to the map,4. Modify the view to the animation takes effect.
Animations are defined as properties of the ol.animation object (for example ol.animation.pan),while the tween functions are defined at ol.easing (for example ol.easing.easeOut).
In JavaScript we can get an object property using object.propertyName or object['propertyName'].We are going to use the second form, because of this we first need to get the animation functionname and get a reference to the animation function (and the same for tween function):
var animationFunction = ol.animation[ $("#animation input:checked").val() ];
var tweenFunction = ol.easing[ $("#tween input:checked").val() ];
Once we have a reference to the functions we want to use we create the animation with thecreateAnimation function:
var animation = createAnimation(animationFunction, tweenFunction);
All the animation functions accepts easing property with a reference to the tween property to beuse (and also other common properties like the duration).
The issue is, because each animation function is implemented to modify a specific view property,we need appropriate property. As we can see in the code, of the animation function is theol.animation.panwe specify the source property pointing the initial center location where to startthe pan animation.
When the animation function is the ol.animation.rotate we specify the rotation property withthe current rotation angle value and, finally if the animation function is ol.animation.bounce orol.animation.zoom we specify the resolution property.

The Map and the View 29
function createAnimation(animationFunction, tweenFunction) {
var params = {
easing: eval(tweenFunction)
};
if (animationFunction === ol.animation.pan) {
params.source = map.getView().getCenter();
} else if (animationFunction === ol.animation.rotate) {
params.rotation = map.getView().getRotation();
} else if (animationFunction === ol.animation.bounce) {
params.resolution = map.getView().getResolution() * 2;
} else {
params.resolution = map.getView().getResolution();
}
return animationFunction(params);
}
Once we have the animation created we need to apply it to the map:
map.beforeRender(animation);
Remember the animations are attached to the beginning of the rendering pipeline to take beconsumed the next time the map is rendered. Once the animation is consumed it is removedfrom the pipeline. See Applying animations section at The Map and the View chapter.
So that the animation takes effect we need to change the view property which animation modifies.Next code checks the selected animation and changes the appropriate property:
if (animationFunction === ol.animation.pan) {
// Change center location
map.getView().setCenter(event.getCoordinate());
} else if (animationFunction === ol.animation.rotate) {
// Increase rotation angle 10 degrees
map.getView().setRotation(map.getView().getRotation() + 10 * Math.PI / 18\
0);
} else if (animationFunction === ol.animation.bounce) {
map.getView().setCenter(map.getView().getCenter());
} else {
// Change zooom
map.getView().setResolution(map.getView().getResolution() / 2);
}

The Map and the View 30
1.4.4 Fit an extent
1.4.4.1 Goal
This example demonstrate howwe can use some ol.View2Dmethods to set the view in a given zoomlevel and center to fit a given extent.
Fit extent
For this purpose wewill create some input controls that will show the current view extent and allowsus to modify it.
1.4.4.2 How to do it…
Start adding the HTML for the form controls:

The Map and the View 31
<form role="form">
<div class="form-group">
<label for="lon">Min. Longitude:</label>
<input type="text" class="form-control" id="minlon" placeholder="lati\
tude" value="0.0">
</div>
<div class="form-group">
<label for="lat">Min. Latitude:</label>
<input type="text" class="form-control" id="minlat" placeholder="long\
itude" value="0.0">
</div>
<br/>
<div class="form-group">
<label for="lon">Max. Longitude:</label>
<input type="text" class="form-control" id="maxlon" placeholder="lati\
tude" value="0.0">
</div>
<div class="form-group">
<label for="lat">Max. Latitude:</label>
<input type="text" class="form-control" id="maxlat" placeholder="long\
itude" value="0.0">
</div>
<br/>
<button type="button" class="btn btn-primary btn-xs" id="change">Change</\
button>
</form>
Add the <div> element to hold the map and some CSS code to beautify it:
<div id="map" class="map"></div>
Read the A basic map if you want to know how to beautify a bit the map element.
Add JavaScript code to initialize the map:

The Map and the View 32
var map = new ol.Map({
// The DOM element that will contains the map
target: 'map',
// The initial set of layers
layers: [
// Add a new Tile layer getting tiles from OpenStreetMap source
new ol.layer.Tile({
source: new ol.source.OSM()
})
],
// The view to be used to show the map is a 2D
view: new ol.View2D({
center: ol.proj.transform([2.1833, 41.3833], 'EPSG:4326', 'EPSG:3857'\
),
zoom: 6
})
});
Finally add the JavaScript code responsible to get and set the view extent:
$(document).ready(function() {
// Compute the current extent of the view given the map size
var extent = map.getView().calculateExtent(map.getSize());
// Transform the extent from EPSG:3857 to EPSG:4326
extent = ol.extent.transform(extent, ol.proj.getTransform("EPSG:3857", "E\
PSG:4326"));
$('#minlon').val(extent[0]);
$('#minlat').val(extent[1]);
$('#maxlon').val(extent[2]);
$('#maxlat').val(extent[3]);
$('#change').on('click', function() {
var minlon = parseInt($('#minlon').val());
var minlat = parseInt($('#minlat').val());
var maxlon = parseInt($('#maxlon').val());
var maxlat = parseInt($('#maxlat').val());
// Trasnform extent to EPSG:3857

The Map and the View 33
var extent = [minlon, minlat, maxlon, maxlat];
extent = ol.extent.transform(extent, ol.proj.getTransform("EPSG:4326"\
, "EPSG:3857"));
map.getView().fitExtent(extent, map.getSize());
});
});
1.4.4.3 How it works…
The first action we do when the page is loaded is to get the current view extent and initialize theform inputs. To do so, we use the calculateExtent method that requires to pass the map size inpixels.
Remember, because a view can be used on different maps it has no reference to a specificmap, so we need to pass the map size. The view can not get it automatically.
var extent = map.getView().calculateExtent(map.getSize());
Now, we have an array with the extent the view is currently shown in the form of [min-longitude,min-latitude, max-longitude, min-latitude].
There is no class to represent the extent, neither a latitude-longitude pair location. InOpenLayers3 any four element array can us used as an extent and any two element arrayas a latitude-longitude location.
The map uses is using the default view projection that is the EPSG:3857 but we want to show valuesas EPSG:4326, so we need to transform it.
The ol.extent object has some functions designed to work with extents. Among them we canfind the ol.extent.transform that accepts two parameters: the extent to work on and a transformfunction. Anyone can create a transform function that operates on a extent but OpenLayers3 offersus the most common ones.
In a similar way, ol.proj object contains functions to work with projections. Given two projectioncodes, the ol.proj.getTransform returns a function that knows how to transform between thespecified projections.
So, the code to transform the view extent from EPSG:3857 to EPSG:4326 is:

The Map and the View 34
extent = ol.extent.transform(extent, ol.proj.getTransform("EPSG:3857", "EPSG:\
4326"));
Once we have the extent in our preferred projection we set the values in the inputs:
$('#minlon').val(extent[0]);
$('#minlat').val(extent[1]);
$('#maxlon').val(extent[2]);
$('#maxlat').val(extent[3]);
Now the user can change the input values and set a different extent for the view. When the userclicks the change button we must obtain the input values:
$('#change').on('click', function() {
var minlon = parseInt($('#minlon').val());
var minlat = parseInt($('#minlat').val());
var maxlon = parseInt($('#maxlon').val());
var maxlat = parseInt($('#maxlat').val());
// Continue code here
...
});
create an extent and transform it from EPSG:4326 to EPSG:3857 projection:
// Trasnform extent to EPSG:3857
var extent = [minlon, minlat, maxlon, maxlat];
extent = ol.extent.transform(extent, ol.proj.getTransform("EPSG:4326", "E\
PSG:3857"));
and apply to the view using the fitExtent method that, similarly than calculateExtent, requiresthe map size in pixels:
map.getView().fitExtent(extent, map.getSize());


![Lucretius' Materialist Poetics: Epicurus and the 'Flawed' Consolatio of Book 3 (Ramus 15 [1986])](https://static.fdokumen.com/doc/165x107/631ff0db01d52108cc0188ae/lucretius-materialist-poetics-epicurus-and-the-flawed-consolatio-of-book-3-ramus.jpg)