The Devolution Tortoise and the Centralization Hare - CiteSeerX
Upload
khangminh22Category
view
4download
0
1 | P a g e
COUNTY GOVERNMENT OF THARAKA NITHI
DEPARTMENT OF FINANCE AND ECONOMIC PLANNING
THARAKA NITHI COUNTY PROGRAM BASED
BUDGET 2020/2021 FINANCIAL YEAR
APRIL 2020

2 | P a g e
Table of Contents BUDGET SUMMARIES .............................................................................................................................. 6
Summary of Total Projected Expenditure by Department FYY2020/21 ................................................. 6
Summary of Projected Recurrent Expenditure by Department FY 2020/21 .......................................... 7
Summary of Projected Development Expenditure by Department FY 2020/21-2022/23 ...................... 8
Summary by Department and Economic Classification ......................................................................... 9
Allocation by Programme, Sub Programme and Economic Classification ............................................ 12
AGRICULTURE, INDUSTRY AND COOPERATIVES ..................................................................................... 17
SECTION 1: INTRODUCTION ............................................................................................................... 17
Part C: Performance Overview and Background On the County Department .................................. 17
SECTION 2: PROGRAMME DETAILS .................................................................................................... 18
Part D: Programme (S) Objectives .................................................................................................. 18
Part E: Summary Of Programme Outputs And Performance Indicators ........................................... 19
Part F: Summary of Expenditure by Programmes, 2020/2021-2022/2023 ...................................... 21
Part G: Summary of Expenditure by Vote and Economic Classification, 2020/21-2022/2023 .......... 21
Part H: Summary of Expenditure by Programme, Sub-Programme and Economic Classification, 2020/2021-2022/23 ....................................................................................................................... 22
EDUCATION AND VOCATIONAL TRAINING ............................................................................................. 23
SECTION 1: INTRODUCTION ............................................................................................................... 23
Part C: Performance Overview and Background On the County Department .................................. 23
SECTION 2: PROGRAMME DETAILS .................................................................................................... 25
Part D: Programme (S) Objectives .................................................................................................. 25
Part E: Summary of Programme Outputs and Performance Indicators............................................ 27
Part F: Summary Of Expenditure By Programmes, 2020/2021-2022/2023 ...................................... 29
Part G: Summary of Expenditure by Vote and Economic Classification, 2020/21-2022/2023 .......... 29
Part H: Summary of expenditure by Programme, Sub-Programme and Economic Classification, 2020/21-2022/2023 ....................................................................................................................... 30
ENERGY AND HOUSING ......................................................................................................................... 36
SECTION 1: INTRODUCTION ............................................................................................................... 36
Part C: Performance Overview and Background On the County Department .................................. 36
SECTION 2: PROGRAMME DETAILS .................................................................................................... 36
Part D: Programme (S) Objectives .................................................................................................. 36
Part E: Summary of Programme Outputs and Performance Indicators............................................ 37

3 | P a g e
Part H: Summary of expenditure by Programme, Sub-Programme and Economic Classification, 2020/21-2022/2023 ....................................................................................................................... 39
FINANCE AND ECONOMIC PLANNING .................................................................................................... 41
SECTION 1: INTRODUCTION ............................................................................................................... 41
Part C: Performance Overview and Background On the County Department .................................. 41
SECTION 2: PROGRAMME DETAILS .................................................................................................... 42
Part D: Programme (S) Objectives .................................................................................................. 42
Part E: Summary of Programme Outputs and Performance Indicators............................................ 43
Part F: Summary of Expenditure by Programmes, 2020/2021-2022/2023 ...................................... 46
Part H: Summary of expenditure by Programme, Sub-Programme and Economic Classification, 2020/21-2022/2023 ....................................................................................................................... 47
LANDS, PHYSICAL PLANNING AND URBAN DEVELOPMENT .................................................................... 49
SECTION 1: INTRODUCTION ............................................................................................................... 49
PART A: VISION .............................................................................................................................. 49
PART B: MISSION ........................................................................................................................... 49
Part C: Performance Overview and Background On the County Department .................................. 49
SECTION 2: PROGRAMME DETAILS .................................................................................................... 51
Part D: Programme (S) Objectives .................................................................................................. 51
Part E: Summary of Programme Outputs and Performance Indicators............................................ 52
Part F: Summary of Expenditure by Programmes, 2020/2021-2022/2023 ...................................... 59
Part G: Summary of Expenditure by Vote and Economic Classification, 2020/21-2022/2023 .......... 59
Part H: Summary of expenditure by Programme, Sub-Programme and Economic Classification, 2020/21-2022/2023 ....................................................................................................................... 59
WATER, ENVIRONMENTAL AND NATURAL RESOURCES .......................................................................... 63
SECTION 1: INTRODUCTION ............................................................................................................... 63
Part C: Performance Overview and Background On the County Department .................................. 63
SECTION 2: PROGRAMME DETAILS .................................................................................................... 64
Part D: Programme (S) Objectives .................................................................................................. 64
Part E: Summary of Programme Outputs and Performance Indicators............................................ 65
Part F: Summary of Expenditure by Programmes, 2020/2021-2022/2023 ...................................... 68
Part G: Summary of Expenditure by Vote and Economic Classification, 2020/21-2022/2023 .......... 68
Part H: Summary of expenditure by Programme, Sub-Programme and Economic Classification, 2020/21-2022/2023 ....................................................................................................................... 68
LIVESTOCK, VETERINARY AND FISHERIES DEVELOPMENT ....................................................................... 71

4 | P a g e
SECTION 1: INTRODUCTION ............................................................................................................... 71
Part C: Performance Overview and Background On the County Department .................................. 71
SECTION 2: PROGRAMME DETAILS .................................................................................................... 72
Part D: Programme (S) Objectives .................................................................................................. 72
Part E: Summary of Programme Outputs and Performance Indicators............................................ 73
Part F: Summary of Expenditure by Programmes for FY 2020/2021-2022/2023 ............................. 76
Part G: Summary of Expenditure by Vote and Economic Classification, 2020/2021- 2022-2023 ...... 76
Part H: Summary of Expenditure by Programme, Sub-Programme and Economic Classification, 2020/2021-2022/23 ....................................................................................................................... 76
MEDICAL SERVICES, PUBLIC HEALTH AND SANIATION ............................................................................ 78
SECTION 1: INTRODUCTION ............................................................................................................... 78
Part C: Performance Overview and Background On the County Department .................................. 78
SECTION 2: PROGRAMME DETAILS .................................................................................................... 80
Part D: Programme (S) Objectives .................................................................................................. 80
Part E: Summary of Programme Outputs and Performance Indicators............................................ 81
Part F: Summary of Expenditure by Programmes, 2020/2021-2022/2023 ...................................... 86
Part G: Summary of Expenditure by Vote and Economic Classification, 2020/2021-2022/2023 ...... 87
Part H: Summary of expenditure by Programme, Sub-Programme and Economic Classification, 2020/2021-2022/2023 ................................................................................................................... 87
PUBLIC ADMINISTRATION, COUNTY PUBLIC SERVICE BOARD AND OFFICE OF THE GOVORNER .............. 92
ECTION 1: INTRODUCTION ................................................................................................................. 92
SECTION 2: PROGRAMME DETAILS .................................................................................................... 92
Part D: Programme (S) Objectives .................................................................................................. 92
Part E: Summary of Programme Outputs and Performance Indicators............................................ 93
Part F: Summary of Expenditure by Programmes, 2020/2021-2022/2023 ...................................... 97
Part G: Summary of Expenditure by Vote and Economic Classification, 2020/21-2022/2023 .......... 97
Part H: Summary of expenditure by Programme, Sub-Programme and Economic Classification, 2020/21-2022/2023 ....................................................................................................................... 98
ROADS, INFRASTRUCTURE AND PUBLIC WORKS .................................................................................. 101
SECTION 1: INTRODUCTION ............................................................................................................. 101
Part C: Performance Overview and Background On the County Department ................................ 101
SECTION 2: PROGRAMME DETAILS .................................................................................................. 102
Part D: Programme (S) Objectives ................................................................................................ 102
Part E: Summary of Programme Outputs and Performance Indicators.......................................... 104

5 | P a g e
Part G: Summary of Expenditure by Vote and Economic Classification, 2020/21-2022/2023 ........ 108
Part H: Summary of expenditure by Programme, Sub-Programme and Economic Classification, 2020/2021-2022/2023 ................................................................................................................. 108
TRADE AND REVENUE .......................................................................................................................... 111
SECTION 1: INTRODUCTION ............................................................................................................. 111
Part C: Performance Overview and Background On the County Department ................................ 111
SECTION 2: PROGRAMME DETAILS .................................................................................................. 112
Part D: Programme (S) Objectives ................................................................................................ 112
Part E: Summary of Programme Outputs and Performance Indicators.......................................... 114
Part F: Summary of Expenditure by Programmes, 2020/2021-2022/2023 .................................... 117
Part G: Summary of Expenditure by Vote and Economic Classification, 2020/21-2022/2023 ........ 117
Part H: Summary of expenditure by Programme, Sub-Programme and Economic Classification, 2020/21-2022/2023 ..................................................................................................................... 117

6 | P a g e
BUDGET SUMMARIES Summary of Total Projected Expenditure by Department FYY2020/21
Row Labels Sum of BUDGET FY 2019/20
Sum of PROPOSED BUDGET FY 2020/21
Sum of PROJECTED ESTIMATES FY 2021/22
Sum of PROJECTED ESTIMATES FY 2022/23
County Assembly 400,650,000 420,000,000 441,000,000 463,050,000
County Public Service Board 15,895,433 22,762,798 23,900,938 25,095,985
Finance and Economic Planning 262,896,200 376,662,130 395,495,237 415,269,998
Livestock, Veterinary and Fisheries Development 85,308,485 130,055,800 136,558,590 143,386,520
Medical Services 1,555,718,898 1,356,980,245 1,424,829,257 1,496,070,720
Office of Governor and Deputy Governor 140,986,311 143,803,042 150,993,194 158,542,854
Public Health and Sanitation 26,410,000 280,946,518 294,993,844 309,743,536
Trade and Revenue 106,197,394 115,080,802 120,834,842 126,876,584
Water Services and Irrigation 48,265,700 194,460,109 204,183,114 214,392,270
Youth, Sports, Culture and Tourism 46,847,875 91,538,961 69,865,909 73,359,205
Energy and Housing 25,696,455 19,257,500 20,220,375 21,231,394
Agriculture, Cooperatives and Industry 101,569,738 574,380,937 603,099,984 633,254,983
Education and Vocational Training 197,744,534 310,811,468 326,352,041 342,669,643
Lands, Physical Planning, Urban Development, Environment and Natural Resources
70,658,233 315,588,712 331,368,148 347,936,555
Public Administration and Devolution Affairs 149,730,789 269,529,734 283,006,221 297,156,532
Roads, Infrastructure, Public Works and ICT 56,231,053 557,606,440 585,486,762 614,761,100
Grand Total 3,290,807,098 5,179,465,196 5,438,438,456 5,710,360,379

7 | P a g e
Summary of Projected Recurrent Expenditure by Department FY 2020/21
Row Labels Sum of BUDGET FY 2019/20
Sum of PROPOSED BUDGET FY 2020/21
Sum of PROJECTED ESTIMATES FY 2021/22
Sum of PROJECTED ESTIMATES FY 2022/23
County Assembly 400,650,000 400,000,000 420,000,000 441,000,000
County Public Service Board 15,895,433 22,762,798 23,900,938 25,095,985
Finance and Economic Planning 262,896,200 239,419,880 251,390,874 263,960,418 Livestock, Veterinary and Fisheries Development
85,308,485 87,088,300 91,442,715 96,014,851
Medical Services 1,555,718,898 1,275,867,383 1,339,660,752 1,406,643,790 Office of Governor and Deputy Governor 140,986,311 143,803,042 150,993,194 158,542,854
Public Health and Sanitation 26,410,000 280,946,518 294,993,844 309,743,536 Trade and Revenue 106,197,394 115,080,802 120,834,842 126,876,584 Water Services and Irrigation 48,265,700 51,216,109 53,776,914 56,465,760 Youth, Sports, Culture and Tourism 46,847,875 43,507,961 45,683,359 47,967,527 Energy and Housing 25,696,455 4,257,500 4,470,375 4,693,894 Agriculture, Cooperatives and Industry 101,569,738 116,421,278 122,242,342 128,354,459
Education and Vocational Training 197,744,534 242,173,771 254,282,460 266,996,583 Lands, Physical Planning, Urban Development, Environment and Natural Resources
70,658,233 107,418,712 112,789,648 118,429,130
Public Administration and Devolution Affairs 149,730,789 269,529,734 283,006,221 297,156,532
Roads, Infrastructure, Public Works and ICT 56,231,053 62,520,600 65,646,630 68,928,962
Grand Total 3,290,807,098 3,462,014,388 3,635,115,107 3,816,870,863

8 | P a g e
Summary of Projected Development Expenditure by Department FY 2020/21-2022/23
Row Labels Sum of PROPOSED BUDGET FY 2020/21
Sum of PROJECTED ESTIMATES FY 2021/22
Sum of PROJECTED ESTIMATES FY 2022/23
County Assembly 20,000,000 21,000,000 22,050,000
Finance and Economic Planning 137,242,250 144,104,363 151,309,581
Livestock, Veterinary and Fisheries Development 42,967,500 45,115,875 47,371,669
Medical Services 81,112,862 85,168,505 89,426,930
Water Services and Irrigation 143,244,000 150,406,200 157,926,510
Youth, Sports, Culture and Tourism 48,031,000 24,182,550 25,391,678
Energy and Housing 15,000,000 15,750,000 16,537,500
Agriculture, Cooperatives and Industry 457,959,659 480,857,642 504,900,524
Education and Vocational Training 68,637,697 72,069,582 75,673,061
Lands, Physical Planning, Urban Development, Environment and Natural Resources
208,170,000 218,578,500 229,507,425
Roads, Infrastructure, Public Works and ICT 495,085,840 519,840,132 545,832,139
Grand Total 1,717,450,808 1,803,323,348 1,893,489,516

9 | P a g e
Summary by Department and Economic Classification
Row Labels Sum of BUDGET FY 2019/20
Sum of PROPOSED BUDGET FY 2020/21
Sum of PROJECTED ESTIMATES FY 2021/22
Sum of PROJECTED ESTIMATES FY 2022/23
County Assembly 400,650,000 420,000,000 441,000,000 463,050,000
2100000 Compensation to Employees
170,500,000 - -
2200000 Use of Goods And Services
207,286,000 - -
2600000 Grants and Other Transfers
400,000,000 420,000,000 441,000,000
2700000 Social Benefits 8,000,000 - -
3100000 Acquisition Of Non-Financial Assets
14,864,000 20,000,000 21,000,000 22,050,000
County Public Service Board 15,895,433 22,762,798 23,900,938 25,095,985
2100000 Compensation to Employees
9,395,183 12,542,798 13,169,938 13,828,435
2200000 Use of Goods And Services
6,150,250 9,270,000 9,733,500 10,220,175
3100000 Acquisition Of Non-Financial Assets
350,000 950,000 997,500 1,047,375
Finance and Economic Planning
262,896,200 376,662,130 395,495,237 415,269,998
2100000 Compensation to Employees
38,938,000 55,534,280 58,310,994 61,226,544
2200000 Use of Goods And Services
132,758,200 145,885,600 153,179,880 160,838,874
2800000 Other Expenses 8,000,000 20,000,000 21,000,000 22,050,000
3100000 Acquisition Of Non-Financial Assets
83,200,000 155,242,250 163,004,363 171,154,581
Livestock, Veterinary and Fisheries Development
85,308,485 130,055,800 136,558,590 143,386,520
2100000 Compensation to Employees
67,981,447 68,940,772 72,387,811 76,007,201
2200000 Use of Goods And Services
17,077,038 40,353,028 42,370,679 44,489,213
3100000 Acquisition Of Non-Financial Assets
250,000 20,762,000 21,800,100 22,890,105
Medical Services 1,555,718,898 1,356,980,245 1,424,829,257 1,496,070,720
2100000 Compensation to Employees
1,273,068,572 928,693,954 975,128,652 1,023,885,084
2200000 Use of Goods And Services
268,150,326 147,575,500 154,954,275 162,701,989
2600000 Grants and Other Transfers
- 124,899,670 131,144,654 137,701,886

10 | P a g e
3100000 Acquisition Of Non-Financial Assets
14,500,000 155,811,121 163,601,677 171,781,761
Office of Governor and Deputy Governor
140,986,311 143,803,042 150,993,194 158,542,854
2100000 Compensation to Employees
62,716,975 50,466,991 52,990,341 55,639,858
2200000 Use of Goods And Services
72,120,336 87,836,051 92,227,854 96,839,246
2600000 Grants and Other Transfers
4,700,000 2,500,000 2,625,000 2,756,250
3100000 Acquisition Of Non-Financial Assets
1,449,000 3,000,000 3,150,000 3,307,500
Public Health and Sanitation 26,410,000 280,946,518 294,993,844 309,743,536
2100000 Compensation to Employees
- 197,158,637 207,016,569 217,367,397
2200000 Use of Goods And Services
22,410,000 19,198,225 20,158,136 21,166,043
2600000 Grants and Other Transfers
- 60,389,656 63,409,139 66,579,596
3100000 Acquisition Of Non-Financial Assets
4,000,000 4,200,000 4,410,000 4,630,500
Trade and Revenue 106,197,394 115,080,802 120,834,842 126,876,584
2100000 Compensation to Employees
86,501,802 86,501,802 90,826,892 95,368,237
2200000 Use of Goods And Services
19,195,592 24,579,000 25,807,950 27,098,348
3100000 Acquisition Of Non-Financial Assets
500,000 4,000,000 4,200,000 4,410,000
Water Services and Irrigation 48,265,700 194,460,109 204,183,114 214,392,270
2100000 Compensation to Employees
28,935,200 31,901,059 33,496,112 35,170,918
2200000 Use of Goods And Services
4,830,500 4,988,800 5,238,240 5,500,152
3100000 Acquisition Of Non-Financial Assets
14,500,000 157,570,250 165,448,763 173,721,201
Youth, Sports, Culture and Tourism
46,847,875 91,538,961 96,115,909 100,921,705
2100000 Compensation to Employees
27,458,000 24,442,236 25,664,348 26,947,565
2200000 Use of Goods And Services
12,169,875 11,845,725 12,438,011 13,059,912
2600000 Grants and Other Transfers
7,220,000 7,220,000 7,581,000 7,960,050
3100000 Acquisition Of Non-Financial Assets
48,031,000 24,182,550 25,391,678
Energy and Housing 25,696,455 19,257,500 20,220,375 21,231,394
2100000 Compensation to Employees
6,210,455 - - -
2200000 Use of Goods And Services
12,486,000 4,057,500 4,260,375 4,473,394
3100000 Acquisition Of Non-Financial Assets
7,000,000 15,200,000 15,960,000 16,758,000

11 | P a g e
Agriculture, Cooperatives and Industry
101,569,738 574,380,937 603,099,984 633,254,983
2100000 Compensation to Employees
81,263,008 94,826,158 99,567,466 104,545,839
2200000 Use of Goods And Services
19,286,730 21,234,120 22,295,826 23,410,617
2600000 Grants and Other Transfers
387,194,659 406,554,392 426,882,112
3100000 Acquisition Of Non-Financial Assets
1,020,000 71,126,000 74,682,300 78,416,415
Education and Vocational Training
197,744,534 310,811,468 326,352,041 342,669,643
2100000 Compensation to Employees
110,302,993 151,846,409 159,438,729 167,410,666
2200000 Use of Goods And Services
23,058,562 21,824,660 22,915,893 24,061,688
2500000 Subsidies - - - -
2600000 Grants and Other Transfers
64,382,979 68,502,702 71,927,837 75,524,229
3100000 Acquisition Of Non-Financial Assets
- 68,637,697 72,069,582 75,673,061
Lands, Physical Planning, Urban Development, Environment and Natural Resources
70,658,233 315,588,712 331,368,148 347,936,555
2100000 Compensation to Employees
33,380,000 63,571,676 66,750,260 70,087,773
2200000 Use of Goods And Services
35,778,233 44,047,036 46,249,388 48,561,857
2600000 Grants and Other Transfers
- 8,800,000 9,240,000 9,702,000
3100000 Acquisition Of Non-Financial Assets
1,500,000 199,170,000 209,128,500 219,584,925
Public Administration and Devolution Affairs
149,730,789 269,529,734 283,006,221 297,156,532
2100000 Compensation to Employees
76,060,789 160,589,534 168,619,011 177,049,961
2200000 Use of Goods And Services
33,670,000 28,940,200 30,387,210 31,906,571
2700000 Social Benefits 40,000,000 80,000,000 84,000,000 88,200,000
Roads, Infrastructure, Public Works and ICT
56,231,053 557,606,440 585,486,762 614,761,100
2100000 Compensation to Employees
14,170,253 28,840,600 30,282,630 31,796,762
2200000 Use of Goods And Services
33,590,625 77,070,000 80,923,500 84,969,675
3100000 Acquisition Of Non-Financial Assets
8,470,175 451,695,840 474,280,632 497,994,664
Grand Total 3,290,807,098 5,179,465,196 5,438,438,456
5,710,360,379

12 | P a g e
Allocation by Programme, Sub Programme and Economic Classification
Row Labels Sum of BUDGET FY 2019/20
Sum of PROPOSED BUDGET FY 2020/21
Sum of PROJECTED ESTIMATES FY 2021/22
Sum of PROJECTED ESTIMATES FY 2022/23
County Assembly 400,650,000
420,000,000
441,000,000 463,050,000
County Public Service Board 15,895,433
22,762,798
23,900,938 25,095,985
P: County Government Advisory Services 1,875,000 3,000,000 3,150,000 3,307,500
SP: County Public Service Board 1,875,000 3,000,000 3,150,000 3,307,500
P: General Administration, Planning and Support Services 12,886,433
17,762,798
18,650,938 19,583,485
SP: General Administration and Support Services 12,836,183
17,462,798
18,335,938 19,252,735
SP: Human Resource Management Services 50,250 300,000 315,000 330,750
P: Human Resource Management and Development 1,134,000 2,000,000 2,100,000 2,205,000
SP: County Public Service Board Services 1,134,000 2,000,000 2,100,000 2,205,000
Finance and Economic Planning 262,896,200
376,662,130
395,495,237 415,269,998
P: Economic Policy and County Planning 10,640,000
8,290,000 8,704,500 9,139,725
SP: County Statistics Services 3,390,000 2,540,000 2,667,000 2,800,350
SP: Economic Development, Planning and Coordination Services 4,010,000 3,110,000 3,265,500 3,428,775
SP: Monitoring and Evaluation Services 3,240,000 2,640,000 2,772,000 2,910,600
P: Financial Management Services 19,710,000
17,810,000
18,700,500 19,635,525
SP: Accounting Services 4,600,000 4,400,000 4,620,000 4,851,000
SP: Audit Services 5,400,000 5,000,000 5,250,000 5,512,500
SP: Budget Formulation and Coordination 7,230,000 5,930,000 6,226,500 6,537,825
SP: Supply Chain Management Services 2,480,000 2,480,000 2,604,000 2,734,200
P: General Administration, Planning and Support Services 194,283,200
168,319,880
176,735,874 185,572,668
SP: Human Resource Management Services 194,283,200
168,319,880
176,735,874 185,572,668
P: Kenya Devolution Support Programme 38,263,000
182,242,250
191,354,363 200,922,081
SP: Tharaka Nithi KDSP Capacity Building 38,263,000
182,242,250
191,354,363 200,922,081
Livestock, Veterinary and Fisheries Development 85,308,485
130,055,800
136,558,590 143,386,520
P: Livestock and Fisheries Resource Management and Development
85,308,485
130,055,800
136,558,590 143,386,520
SP: Fisheries Development and Promotion 3,054,000 6,664,850 6,998,093 7,347,997

13 | P a g e
SP: Livestock Policy Development and Capacity Building 72,911,847
94,310,400
99,025,920 103,977,216
SP: Veterinary Services and Disease Prevention 9,342,638 29,080,550
30,534,578 32,061,306
Medical Services 1,555,718,898
1,356,980,245
1,424,829,257
1,496,070,720
P: Curative and Rehabilitative Services 1,400,000 74,064,480
77,767,704 81,656,089
SP: Hospital level services 1,400,000 74,064,480
77,767,704 81,656,089
P: General Administration Planning and Support Services 1,554,318,898
1,282,915,765
1,347,061,553
1,414,414,631
SP: General Administration Services 85,650,326
175,891,740
184,686,327 193,920,643
SP: Human resource management 1,275,768,572
929,693,954
976,178,652 1,024,987,584
SP: Health sector planning, budgeting Monitoring and Evaluation 1,500,000 3,149,500 3,306,975 3,472,324
SP: Procurement of medicine, medical and other supplies 191,400,000
174,180,571
182,889,600 192,034,080
Office of Governor and Deputy Governor 140,986,311
143,803,042
150,993,194 158,542,854
P: County Government Advisory Services 11,544,500
15,050,000
15,802,500 16,592,625
SP: Communication and Strategy 11,544,500
15,050,000
15,802,500 16,592,625
P: County Leadership and Coordination of MDAs 6,316,241 6,020,400 6,321,420 6,637,491
SP: Public Sector Advisory Services (Legal, Political, and Economic Affairs)
6,316,241 6,020,400 6,321,420 6,637,491
P: General Administration, Planning and Support Services 123,125,570
122,732,642
128,869,274 135,312,738
SP: Coordination and Supervisory Services (Deputy Governor's Office)
21,175,250
13,290,000
13,954,500 14,652,225
SP: Management of County Affairs (Office of Governor) 101,950,320
109,442,642
114,914,774 120,660,513
Public Health and Sanitation 26,410,000
280,946,518
294,993,844 309,743,536
P: Preventive and Promotive Health Services 26,410,000
280,946,518
294,993,844 309,743,536
SP: Disease Surveillance 1,100,000 1,920,000 2,016,000 2,116,800
SP: Environmental Health services 17,650,000
9,562,200 10,040,310 10,542,326
SP: Health Promotion and Disease Control 1,900,000 266,464,318
279,787,534 293,776,911
SP: HIV and AIDS Support Services 3,600,000 1,300,000 1,365,000 1,433,250
SP: Nutrition Services 1,060,000 800,000 840,000 882,000
SP: Reproductive Maternal and Child health Services 1,100,000 900,000 945,000 992,250
Trade and Revenue 106,197,394
115,080,802
120,834,842 126,876,584
P: General Administration, Planning and Support Services 90,606,802
89,891,802
94,386,392 99,105,712
SP: General Administration and Support Services 90,606,802
89,891,802
94,386,392 99,105,712
P: Trade Development and promotion 8,350,592 12,748,000
13,385,400 14,054,670
SP: Consumer Protection & Fair Trade Practices 5,374,342 2,975,000 3,123,750 3,279,938

14 | P a g e
SP: Consumer Protection (Alcohol Licencing ) 2,976,250 9,773,000 10,261,650 10,774,733
P: Resource mobilisation 7,240,000 12,441,000
13,063,050 13,716,203
SP: Revenue Administration 7,240,000 12,441,000
13,063,050 13,716,203
Water Services and Irrigation 48,265,700
194,460,109
204,183,114 214,392,270
P: Environment and Natural Resources Management 3,900,000 4,095,000 4,299,750
SP: Water Services 3,900,000 4,095,000 4,299,750
P: Water Supply Services 48,265,700
190,560,109
200,088,114 210,092,520
SP: Domestic Water Services 42,375,200
78,018,659
81,919,592 86,015,572
SP: Irrigation and Drainage Services 4,715,000 65,904,450
69,199,673 72,659,656
SP: Water Storage Services 1,175,500 46,637,000
48,968,850 51,417,293
Youth, Sports, Culture and Tourism 46,847,875
91,538,961
69,865,909 73,359,205
P: Culture, Arts and Social Services 6,505,250 14,581,100
15,310,155 16,075,663
SP: Culture and Arts Promotion 5,870,125 13,945,975
14,643,274 15,375,437
SP: Gender, PWDs and Social Services 635,125 635,125 666,881 700,225
P: Sports Development and Promotion 36,136,625
46,120,861
48,426,904 50,848,249
SP: Athletics Championships and Other Games 1,976,375 1,976,375 2,075,194 2,178,953
SP: County Football League and Clubs Development 3,752,000 3,752,000 3,939,600 4,136,580
SP: Talent Search and Promotion 30,408,250
40,392,486
42,412,110 44,532,716
P: Tourism Development and Promotion 4,206,000 5,837,000 6,128,850 6,435,293
SP: Miss Tourism Tharaka Nithi 2,730,500 2,730,500 2,867,025 3,010,376
SP: Tourism Branding and Marketing 1,475,500 1,075,500 1,129,275 1,185,739
SP: Tourism Promotion and Infrastructure Development 2,031,000 2,132,550 2,239,178
Energy and Housing 25,696,455
19,257,500
20,220,375 21,231,394
P: Energy Resource Development & Management 461,000 16,758,000
17,595,900 18,475,695
SP: Energy Resource Development & Management 461,000 16,758,000
17,595,900 18,475,695
P: General Administration Planning and Support Services 25,235,455
2,499,500 2,624,475 2,755,699
SP: General Administration Services 25,235,455
2,499,500 2,624,475 2,755,699
Agriculture, Cooperatives and Industry 101,569,738
574,380,937
603,099,984 633,254,983
P: Cooperative Development and Management 3,169,050 3,168,903 3,327,348 3,493,716
SP: Cooperative Development 3,169,050 3,168,903 3,327,348 3,493,716
P: Crop Development and Management 7,137,000 40,843,351
42,885,519 45,029,794

15 | P a g e
SP: Crops Development, Agribusiness and Market Development 7,137,000 40,843,351
42,885,519 45,029,794
P: General Administration Planning and Support Services 91,263,688
530,368,683
556,887,117 584,731,473
SP: Administration, Policy, Strategy and Management of Agriculture
91,263,688
530,368,683
556,887,117 584,731,473
Education and Vocational Training 197,744,534
310,811,468
326,352,041 342,669,643
P: Education and Youth Training 87,441,541
158,965,059
166,913,312 175,258,978
SP: Promotion of Basic Education (ECDE) 51,437,762
84,404,660
88,624,893 93,056,138
SP: Youth Training and Capacity Building 36,003,779
74,560,399
78,288,419 82,202,840
P: General Administration Planning and Support Services 110,302,993
151,846,409
159,438,729 167,410,666
SP: Administration Planning and Support Services 110,302,993
151,846,409
159,438,729 167,410,666
Lands, Physical Planning, Urban Development, Environment and Natural Resources
70,658,233
315,588,712
331,368,148 347,936,555
P: Environment and Natural Resources Management 9,678,633 23,013,728
24,164,414 25,372,635
SP: Environment and Natural Resource 9,678,633 23,013,728
24,164,414 25,372,635
P: General Administration Planning and Support Services 30,000,000
31,500,000 33,075,000
SP: General Administration Services 30,000,000
31,500,000 33,075,000
P: Kathwana Municipality Development Programme 3,120,000 62,469,600
65,593,080 68,872,734
SP: Kathwana Urban Area Support 3,120,000 62,469,600
65,593,080 68,872,734
P: Land Policy and Planning 48,500,000
66,292,484
69,607,108 73,087,464
SP: Land administration & management 7,572,000 6,829,174 7,170,633 7,529,164
SP: Physical Planning Services 40,928,000
59,463,310
62,436,476 65,558,299
P: Urban Development and Administration 9,359,600 133,812,900
140,503,545 147,528,722
SP: Urban Administrative Services 9,359,600 133,812,900
140,503,545 147,528,722
Public Administration and Devolution Affairs 149,730,789
269,529,734
283,006,221 297,156,532
P: County Government Advisory Services 3,100,000 1,900,000 1,995,000 2,094,750
SP: Disaster Management and Coordination 3,100,000 1,900,000 1,995,000 2,094,750
P: General Administration, Planning and Support Services 138,910,789
267,629,734
281,011,221 295,061,782
SP: General Administration and Support Services 131,910,789
263,429,734
276,601,221 290,431,282
SP: Human Resource Management Services 2,300,000 900,000 945,000 992,250
SP: Sub-County Administration and Field Services 4,700,000 3,300,000 3,465,000 3,638,250
P: Legal Affairs 7,720,000 - - -
SP: Enforcement Services - - -
SP: Legal Services 7,720,000 - - -

16 | P a g e
SP: Public participation and Civic Education - - - -
Roads, Infrastructure, Public Works and ICT 56,231,053
557,606,440
585,486,762 614,761,100
P: General Administration Planning and Support Services 22,170,253
28,840,600
30,282,630 31,796,762
SP: General Administration Services 22,170,253
28,840,600
30,282,630 31,796,762
P: ICT Infrastructure Development 2,677,000 25,050,000
26,302,500 27,617,625
SP: ICT Infrastructure Development 2,677,000 25,050,000
26,302,500 27,617,625
P: Public Works and Housing Services 5,079,500 2,815,000 2,955,750 3,103,538
SP: Public Works Services 5,079,500 2,815,000 2,955,750 3,103,538
P: Roads Transport 26,304,300
435,900,840
457,695,882 480,580,676
SP: Rural Roads Improvement and Maintenance Services 26,304,300
435,900,840
457,695,882 480,580,676
P: Housing Development and Human Settlement 65,000,000
68,250,000 71,662,500
SP: Public Works and Quality Control Services 65,000,000
68,250,000 71,662,500
Grand Total 3,290,807,098
5,179,465,196
5,438,438,456
5,710,360,379

17 | P a g e
AGRICULTURE, INDUSTRY AND COOPERATIVES
SECTION 1: INTRODUCTION PART A: VISION To attain sustainable food security and incomes for the people of Tharaka Nithi County
PART B: MISSION To improve livelihoods through provision of high quality, innovative and commercial agricultural services
Part C: Performance Overview and Background On the County Department
Crop Production Sub Sector Mandate
The crops production subsector is committed to promoting sustainable and competitive agriculture to enhance food security, wealth and employment creation, income generation and poverty reduction by providing efficient and effective support services to the clients and stakeholders through dissemination of information and provision of technical services. The mandate of the subsector is therefore to provide services and disseminate appropriate technologies, related innovations and information services to farmers and other clients through modern extension approaches in collaboration with development partners, research institutions and other stakeholders.
Key Achievements based on the planned outputs/services for the year 2018/19 The crops Sub programme was mainly involved in provision of agricultural services to the farming communities in the County in the FY 2018/19. While provision of extension services continued, capital infrastructure projects were initiated in the same financial year. The key outcomes of the crops sub programme were:
53,261 Farmers trained for improved production and marketing. Training was mainly supported by UN-FAO and National projects
Provision of subsidized farm inputs where various seeds were distributed to farmers in all sub counties, hence the adoption of quality planting materials. The materials were supplied with the support of National Government and various partners including Kenya Red Cross and ICRISAT. The planting materials provided include seeds, fertilizers and chemicals to address the challenge of pests and diseases, especially the Fall army worm.
Rehabilitation/improvement of tea buying centers (Mukuuni, Kiang’ondu, Kiini and Ithai tea buying centres)
Revitalization of coffee
Challenges a. Delay in release of funds by National Treasury affecting implementation of planned
activities

18 | P a g e
b. Inadequate extension officers/services limiting service delivery. c. Low adoption of new technical information (commercialization uptake low) d. Poor mechanization and low adoption of modern technologies e. Low adaption of value addition
Going Forward
Going forward, achievement of the sector’s goals will highly depend on linkages and synergies with other priority sectors of the economy. Moreover, response to emerging issues such as vagaries of climate change, new legislations, legal gazette notices and executive orders and competing land use will also influence implementation of the proposed programmes and projects. With the widening gap between resource requirements and allocations, there is need to pursue innovative ways of financing programmes and projects including Public Private Partnerships and donor funding while embracing prudent use of the available resources
SECTION 2: PROGRAMME DETAILS Part D: Programme (S) Objectives
Programme Sub-Programme Objectives
Crop production Cereals & pulses production and promotion
Increased productivity and household incomes
Crop production Cash crop production and promotion Increased productivity and household incomes
Crop production Horticulture Productivity Increased productivity and household incomes
Crop production Agro processing Increased productivity and household incomes
Crop production Resilience and risk management Mitigation for resilience in Livelihood options
Crop production Technology and innovation Efficient agricultural Technologies and information transfer
Crop production General administration & sector development
Improved efficiency and effectiveness in service delivery

19 | P a g e
Part E: Summary Of Programme Outputs And Performance Indicators
Programme 1: Crop production
Outcome: Increased family income
Sub-programme Delivery Unit Key Output (KO) Key Performance Indicators (KPIs)
Targets 2020/21 Targets 2021/2022
Targets 2022/2023
Cereals & pulses production and promotion-
Subsidized fertilizer
Operationalization of cereals stores
County Director of Agriculture
Improved crop production
%ge of farmers accessing Subsidized fertilizers
30% 40% 50%
County Director of Agriculture
Improved storage of cereals/ Reduced post-harvest losses
Number of grain stores operationalized
1 1 1
Cash crop production and promotion
-Improvement of tea buying centres
County Director of Agriculture
Improved quality of tea leaf
Number of tea buying centres supported
10 10 10
Horticulture Productivity
Provision of farm inputs
County Director of Agriculture
Horticultural crops production promoted
Types of seedlings distributed
Avocado, macadamia, banana, mango, cashew nuts, coffee
Avocado, macadamia, banana, mango, cashew nuts, coffee
Avocado, macadamia, banana, mango, cashew nuts, coffee
Resilience and risk management
- Investments funded
Project Coordinator- Kenya Climate Smart
Improved climate change resilience
Number of investments funded
60 100 100

20 | P a g e
- Climate Smart technologies
Agriculture Project (KCSAP)
at community level
No of climate smart technologies implemented
2 2 1
Technology and innovation
-Operationalization of ATI
-Promotion of conservation agriculture
County Director of Agriculture
Improved knowledge on crop production
Number of facilities operationalized
1 1 1
County Director of Agriculture
Up scaled conservation agriculture
No of farmers with CA tools/implements
10 20 30
General administration & sector development
Promotion of cereal, banana and dairy value chains in the county
Provision of extension services
County Project Coordinator- ASDSP
Improved value chain operations for selected enterprises
Number of trainings held
Number of value chain enterprises supported
6
6
6
County Director of Agriculture
Staff facilitation, compensation and capacity building
Vehicles maintained
Farmers reached with extension messages
No of officers supported for degree and professional courses
Number of vehicles maintained
20000 30000 30000
10 8 8
24 24 24

21 | P a g e
Part F: Summary of Expenditure by Programmes, 2020/2021-2022/2023
PROGRAMME Budget 2019/20
Estimates 2020/21
Projection 2021/2022
Projection 2022/2023
Crop Production 7,137,000 40,843,351 42,885,519 45,029,794
Cooperative Development and Management
3,169,050 3,168,903 3,327,348 3,493,716
General Administration services 91,263,688
530,368,683 556,887,117 584,731,473
Total expenditure 101,569,738
574,380,937 603,099,984 633,254,983
Part G: Summary of Expenditure by Vote and Economic Classification, 2020/21-2022/2023
Economic Classification
Estimates 2020/2021 Projections 2021/2022
Projections 2022/2023
Recurrent Expenditure
503,254,937 528,417,684 554,838,568
Compensation to Employees
94,826,158 99,567,466 104,545,839
Use of Goods and Services
21,234,120 22,295,826 23,410,617
Current Transfers to Govt. Agencies
387,194,659 406,554,392 426,882,112
Capital Expenditure 71,126,000 74,682,300 78,416,415
Acquisition of Non-Financial Assets
71,126,000 74,682,300 78,416,415
Capital Grants to Govt. Agencies
- - -
Other Development - - -
Total Expenditure 574,380,937 603,099,984 633,254,983

22 | P a g e
Part H: Summary of Expenditure by Programme, Sub-Programme and Economic Classification, 2020/2021-2022/23
Programme 1: Crop Development and Management
Sub Programme 1.1: Crops Development, Agribusiness and Market Development
Economic Classification Estimates 2020/2021
Projection 2021/2022
Projection 2022/2023
Current Expenditure 7,692,351 8,076,969 8,480,817 Compensation to Employees - - - Use of Goods and Services 7,692,351 8,076,969 8,480,817 Current Transfers to Govt. Agencies - - - Capital Expenditure 33,151,000 23,783,550 24,972,728 Acquisition of Non-Financial Assets 33,151,000 34,808,550 36,548,978 Capital Grants to Govt. Agencies - - - Other Development - - - Total Expenditure for programme 40,843,351 31,860,519 33,453,545 Programme 2: General Administration Planning and Support Services
Sub Programme 2.1: Administration, Policy, Strategy and Management of Agriculture
Economic Classification Current Expenditure 492,603,683 517,233,867 543,095,561 Compensation to Employees 94,826,158 99,567,466 104,545,839 Use of Goods and Services 10,582,866 11,112,009 11,667,610 Current Transfers to Govt. Agencies 387,194,659 406,554,392 426,882,112
Capital Expenditure 37,765,000 39,653,250 41,635,913 Acquisition of Non-Financial Assets 37,765,000 39,653,250 41,635,913 Capital Grants to Govt. Agencies - - - Other Development - - -
Total Expenditure for programme 530,368,683 556,887,117 584,731,474 P: Cooperative Development and Management
Economic Classification Current Expenditure 2,958,903 3,106,848 3,262,191 Compensation to Employees Use of Goods and Services 2,958,903 3,106,848 3,262,191 Current Transfers to Govt. Agencies - - - Capital Expenditure 210,000 220,500 231,525 Acquisition of Non-Financial Assets 210,000 220,500 231,525 Capital Grants to Govt. Agencies - - - Other Development - - - Total Expenditure for programme 3,168,903 3,327,348 3,493,716
Grand Total 574,380,937 592,074,984 621,678,735

23 | P a g e
EDUCATION AND VOCATIONAL TRAINING
SECTION 1: INTRODUCTION PART A: VISION: To be a leader in building a just, cohesive and enlightened society for sustainable County development.
PART B: MISSION: To build a just, cohesive and enlighten society through provision of quality Education and vocational training for sustainable County development.
Part C: Performance Overview and Background On the County Department The overall function of the sector as stipulated in the Fourth Schedule, Constitution of Kenya, 2010 relates to pre-primary education, village polytechnics, home craft centres and childcare facilities. In addition, undertake cultural activities, public entertainment and public amenities; sports and cultural activities and facilities; and county parks, beaches and recreation facilities.
The department is made up of four directorates namely ECDE, Vocational Training, Sports, Culture and tourism. Their broad mandate is to Improve Access to Basic Education and Vocation training as well as promote sports, culture and tourism activities. In furtherance of the mandate, the ECDE Directorates deals with recruitment of teachers and care givers, Construction / innovation of classrooms, Provision of teaching and learning materials, Enhancement of bursary funds, Strengthening of supervision service, Promotion and integration of research on basic Education, Promotion of feeding program/establishment of child friendly schools/ integration of children with special needs in normal schools. Whereas vocational training directorates deals with refurbishment and rehabilitation of YPs, Disbursements of grants, Capacity Building of YP staff, Inspection and quality Assurance of institutions, Procurement of YPs Equipment and materials, Recruitment of Youth Polytechnic instructors, Establishment of Home craft centres and Conduct study on Home craft centres.
The sports sub sector endeavours to achieve its mandate of sports promotion through construction of stadia, carrying out sporting activities for various groups as well as developing of policies to govern the sporting activities in the county. The culture sub sector has continued to improve the welfare of cultural groups through enabling the compliance with social services requirements and promotion of cultural groups. The tourism sub sector is involved in promotion of touristic activities as well as develop tourism products and market the County as a preferred tourist destination both locally and internationally.
Key Achievements Employed 446 ECDE caregivers in all the 15 wards
In partnership with KLB the department was able to train all the ECDE teachers in the
county for effective curriculum delivery.
The County Government has been able to construct 150 new classrooms distributed in all
the wards. This has greatly improved the learning environment in our centers
Provided Teaching and Learning materials worth over Kshs 14.5 million in all the 15 wards
The department of Education has distributed bursary worth 17.11 million to bright and
needy students in our secondary schools, tertiary colleges and universities.

24 | P a g e
The department has also established Education Forum Committee which has so far met all
the education stakeholders to discuss issues of education in the county
Constructed 150 classrooms for ECDE at a cost of 150M thereby reducing the ratio of
classroom to pupil ratio from 1:50 to 1:40.
In collaboration with the National Government, the sector has established 3 Technical
training institutes at a cost of 180M thus increasing the rate of skilled labour force
participation from 10% to 15%.
The County Government has been able to construct 20 new Infrastructure Projects in the
all-county youth polytechnic. One project in every polytechnic
Disbursed conditional grants totalling Kshs 45 million to all the twenty polytechnics for
quality training and Service delivery. Disbursed addition Conditional grants (capitation) of
Kshs 27.8 million last month. . Procurement and distribution of sanitary towels to 40
primary schools benefiting 1600 beneficiaries.
Organized and supported the UN- Day for persons with disabilities at Kairuni stadium on
3rd December 2018 and 3/12/2019 at Chiakariga in order to promote disability inclusion
in the County.
Held the Tharaka Nithi Uragate cultural Festival in August 2018 in order Promote, preserve
and display our rich cultural heritage and also exhibited our work of arts, natural products
and value addition in the county.
Campaigned on negative cultural practices (F.G.M) and supported the alternative rite of
passage for Girls in Tharaka Zone in conjunction with other stakeholders.
Construction of ablution block at Kathwana public grounds.
Construction of Kathwana Social hall is ongoing at 60% complete.
Identification and mapping of key Tourist sites
Opening up of Ura Gate which is the gate connecting Tharaka Nithi County to Meru
National Park with the aim of boosting tourist visitation to the county.
The department also hosted the first Tharaka Nithi County Annual Cultural Festival on 20th
to 22nd August 2015 at Ura –Gate Grounds near Meru National Park. An event that is now
annual.
The department constructed Nithi, Ura gate, Tourism Markets. Chiakariga cultural centre,

25 | P a g e
which is a flagship project, is still under construction. On completion, it will act as the
county's cultural hub as well as a tourist's information.
Erection of gantry points to improve the County branding.
Over the 3 years, the hospitality industry has recorded an improved growth with quality
accommodation facilities being established. This has since increased the bed capacity of
the county. Mt Kenya Kinondoni Lodge was refurbished in the year 2016 alongside
upgrading of the access road to the lodge.
Challenges
Lack of release of funds by the County Treasury to fund the department activities as
envisaged in the planning. The county treasury to ensure funds are released in time for the
planned activities.
Lack of adequate departmental staff for quality service delivery. Despite the freezing of
recruitment, a deliberate effort by the county public service board be put in place to ensure
more departmental staff are recruited for quality service delivery.
There is lack of enough departmental staff to implement the projects and programmes. The
department will liaise with the appropriate department to employ more staff for the
department.
The vocational training centers have few instructors leading to less manpower for quality
service delivery.
Going Forward Enhanced funding to departments in comparison to the total county budget in the medium
term to enable completion of budgeted programs.
Revitalization of vocational training to enhance effective training in youth polytechnic.
Introduction of matching funds for youth conditional grants from national government.
There should be timely facilitation of staff in terms of daily substenance allowance hence
fair utilization of recurrent budget.
SECTION 2: PROGRAMME DETAILS Part D: Programme (S) Objectives
PROGRAMME OBJECTIVE

26 | P a g e
Promotion of Basic Education (ECDE To enhance access, equity, quality and retention of Early Childhood Development.
Youth Training and Capacity Building To enhance access, equity, quality and retention of Vocational Training
Culture and Arts Promotion Harnessing and enhancing full potential of the people’s cultural heritage of Tharaka Nithi
county
Sports development and promotion Promoting sport activities in Tharaka Nithi
County
Tourism Development and Promotion Develop tourism products and market Tharaka Nithi as a preferred tourist destination both locally and internationally
General Administration Planning and Support Services
Remuneration and staff welfare

27 | P a g e
Part E: Summary of Programme Outputs and Performance Indicators
Programme 1: Education and Youth Training Outcome: Improved Access to Basic Education Sub Programme 1.1: Promotion of Basic Education (ECDE Delivery Unit Key Output (KO) Key Performance
Indicators (KPIs) Targets 2020/21 Targets 2021/2022 Targets 2022/2023
Directorate of ECDE Improved quality of Basic Education
No of classes constructed 30 30 30
Programme 1: Education and Youth Training
Outcome: Improved Access to Vocational Training
Sub Programme 1.2: Youth Training and Capacity Building
Delivery Unit Key Output (KO) Key Performance Indicators (KPIs)
Targets 2020/2021 Targets 2021/2022 Targets 2022/2023
Directorate of Youth Training
Improved Access to Vocational Training
No. of Youth Polytechnics rehabilitated
20 20 20
Programme 2: Culture, Arts and Social Services Outcome: Enhancing Culture and Arts Promotion Sub Programme 2.1: Culture and Arts Promotion Delivery Unit Key Output (KO) Key Performance
Indicators (KPIs) Targets 2020/21 Targets 2021/2022 Targets 2022/2023
Directorate of Culture Enhancing Culture and Arts Promotion
No. of social halls constructed
1 1 1
Programme 3: Sport Development and promotion Outcome: Enhancing sport talents in Tharaka Nithi County Sub Programme 3.1: Youth empowerment Delivery Unit Key Output (KO) Key Performance
Indicators (KPIs) Targets 2020/21 Targets 2021/2022 Targets 2022/2023
Directorate of Sports Enhancing sport talents in Tharaka Nithi
No. of youth groups empowered
20 20 20

28 | P a g e
County Programme 3: Sport Development and promotion Outcome: Enhancing sport talents in Tharaka Nithi County Sub Programme 3.2: Rehabilitation and upgrading of stadiums(Kairuni,Marimanti,Kathwana) Delivery Unit Key Output (KO) Key Performance
Indicators (KPIs) Targets 2020/21 Targets 2021/2022 Targets 2022/2023
Directorate of Sports Enhancing sports talents in Tharaka Nithi County
Increase in number of sports stadiums.
3 3 3
Programme 3: Sport Development and promotion Outcome: Enhancing sport talents in Tharaka Nithi County Sub Programme 3.3: County league Delivery Unit Key Output (KO) Key Performance
Indicators (KPIs) Targets 2020/21 Targets 2021/2022 Targets 2022/2023
Directorate of Sports Enhancing Sports talents in Tharaka Nithi County
% Increase in number of youths involved.
500 500 500
Programme 4: Tourism development, Diversification and Promotion. Outcome: Promote tourism and tourism activities. Sub Programme 4.1: Erection of gantries Delivery Unit Key Output (KO) Key Performance
Indicators (KPIs) Targets 2020/21 Targets 2021/2022 Targets 2022/2023
Directorate of Tourism Increase in tourists numbers
No. of gantries erected. 3 3 3
Programme 4: Tourism development, Diversification and Promotion. Outcome: Promote tourism and tourism activities. Sub Programme 4.2: Furnishing of Nithi and Ura Gate tourism markets Delivery Unit Key Output (KO) Key Performance
Indicators (KPIs) Targets 2020/21 Targets 2021/2022 Targets 2022/2023
Directorate of Tourism Increase in tourists numbers
No. of markets furnished 2 2 2

29 | P a g e
Part F: Summary Of Expenditure By Programmes, 2020/2021-2022/2023
PROGRAMME BUDGET 2019/20
Estimates 2020/21
Projection 2021/2022
Projection 2022/2023
P: Education and Youth Training 77,104,337 158,965,059 166,913,312 175,258,978
SP: Promotion of Basic Education (ECDE) 41,717,490 84,404,660 88,624,893 93,056,138
SP: Youth Training and Capacity Building 35,386,847 74,560,399 78,288,419 82,202,840
P: General Administration Planning and Support Services
102,444,712 151,846,409 159,438,729 167,410,666
SP: Administration Planning and Support Services
102,444,712 151,846,409 159,438,729 167,410,666
P: Culture, Arts and Social Services 4,973,927 14,581,100 15,310,155 16,075,663
SP: Culture and Arts Promotion 4,488,309 13,945,975 14,643,274 15,375,437
SP: Gender, PWDs and Social Services 485,618 635,125 666,881 700,225
P: Sports Development and Promotion 34,093,699 48,464,861 50,888,104 53,432,509
SP: Athletics Championships and Other Games
1,511,144 1,976,375 2,075,194 2,178,953
SP: County Football League and Clubs Development
2,868,788 3,752,000 3,939,600 4,136,580
SP: Talent Search and Promotion 29,713,767 42,736,486 44,873,310 47,116,976
P: Tourism Development and Promotion 3,215,915 5,737,000 6,023,850 6,325,043
SP: Miss Tourism Tharaka Nithi 2,087,745 2,730,500 2,867,025 3,010,376
SP: Tourism Branding and Marketing 1,128,170 1,075,500 1,129,275 1,185,739
SP: Tourism Promotion and Infrastructure Development
1,931,000 2,027,550 2,128,928
Total Expenditure 221,832,590 379,594,429 398,574,150 418,502,858
Part G: Summary of Expenditure by Vote and Economic Classification, 2020/21-2022/2023
Education and Youth Training
Economic Classification Budget 2019/20
Estimates 2020/2021
Projections 2021/2022
Projections 2022/2023
Current Expenditure 178,049,049 242,173,771 254,282,460 266,996,583
Compensation to Employees 102,444,712 151,846,409 159,438,729 167,410,666

30 | P a g e
Use of Goods and Services 18,518,691 21,824,660 22,915,893 24,061,688
Current Transfers to Govt. Agencies 57,085,646 68,502,702 71,927,837 75,524,229
Capital Expenditure 1,500,000 68,637,697 72,069,582 75,673,061
Acquisition of Non-Financial Assets 1,500,000 68,637,697 72,069,582 75,673,061
Capital Grants to Govt. Agencies 0 0 0 0
Other Development
Total Expenditure 179,549,049 310,811,468 326,352,042 342,669,644
Youth, Sports, Culture and Tourism
Economic Classification Budget 2019/20
Estimates 2020/2021
Projections 2021/2022
Projections 2022/2023
Current Expenditure 42,283,541 43,507,961 45,683,359 47,967,527
Compensation to Employees 27,458,000 24,442,236 25,664,348 26,947,565
Use of Goods and Services 9,305,113 11,845,725 12,438,011 13,059,912
Current Transfers to Govt. Agencies 5,520,428 7,220,000 7,581,000 7,960,050
Capital Expenditure 0 25,275,000 26,538,750 27,865,688
Acquisition of Non-Financial Assets 25,275,000 26,538,750 27,865,688
Capital Grants to Govt. Agencies 0 0 0 0
Other Development 0 0 0 0
Total Expenditure 42,283,541 68,782,961 72,222,109 75,833,215
Grand Total 221,832,590 379,594,429 398,574,151 418,502,858
Part H: Summary of expenditure by Programme, Sub-Programme and Economic Classification, 2020/21-2022/2023
Programme 1: Education and Youth Training
Sub-Programme 1.1:Promotion of Basic Education (ECDE)
Economic Classification Estimates 2020/2021
Projection 2021/2022
Projection 2022/2023
Current Expenditure 20,956,660 22,004,493 23,104,718
Compensation to Employees 0 0 0

31 | P a g e
Use of Goods and Services 20,956,660 22,004,493 23,104,718
Current Transfers to Govt. Agencies 0 0 0
Capital Expenditure 63,448,000 66,620,400 69,951,420
Acquisition of Non-Financial Assets 31,678,000 33,261,900 34,924,995
Capital Grants to Govt. Agencies 31,770,000 33,358,500 35,026,425
Other Development
Total Expenditure for SP1.1 84,404,660 88,624,893 93,056,138
Sub-Programme 1.2: Youth Training and Capacity Building
Economic Classification Estimates 2020/2021
Projection 2021/2022
Projection 2022/2023
Current Expenditure 37,600,702 39,480,737 41,454,774
Compensation to Employees - - -
Use of Goods and Services 868,000 911,400 956,970
Subsidies
Current Transfers to Govt. Agencies 36,732,702 38,569,337 40,497,804
Capital Expenditure 36,959,697 38,807,682 40,748,066
Acquisition of Non-Financial Assets 36,959,697 38,807,682 40,748,066
Capital Grants to Govt. Agencies 0 0 0
Other Development
Total Expenditure for SP1.2 74,560,399 78,288,419 82,202,840
Programme 2: General administration, planning and support services
Sub-Programme 1.2: General Administration and support services
Economic Classification Estimates 2020/2021
Projection 2021/2022
Projection 2022/2023
Current Expenditure 151,846,409 159,438,729 168,367,636
Compensation to Employees 151,846,409 159,438,729 167,410,666
Use of Goods and Services 0 0 956,970
Current Transfers to Govt. Agencies 0
Capital Expenditure 0 0 0
Acquisition of Non-Financial Assets 0 0 0
Capital Grants to Govt. Agencies 0 0 0

32 | P a g e
Other Development 0 0 0
Total Expenditure for SP1.2 151,846,409 159,438,729 168,367,636
Programme 3: Culture, Arts and Social Services
Sub-Programme 3.1: Culture and Arts Promotion
Economic Classification Estimates 2020/2021
Projection 2021/2022
Projection 2022/2023
5,945,975 6,243,274 6,555,437
Compensation to Employees - - -
Use of Goods and Services 5,945,975 6,243,274 6,555,437
Current Transfers to Govt. Agencies -
Capital Expenditure 8,000,000 8,400,000 8,820,000
Acquisition of Non-Financial Assets 8,000,000 8,400,000 8,820,000
Capital Grants to Govt. Agencies
Other Development
Total Expenditure for SP2.1 13,945,975 14,643,274 15,375,437
Sub-Programme 3.2: Gender, PWDs and Social Services
Economic Classification Estimates 2020/2021
Projection 2021/2022
Projection 2022/2023
Current Expenditure 635,125 666,881 700,225
Compensation to Employees - - -
Use of Goods and Services 635,125 666,881 700,225
Current Transfers to Govt. Agencies -
Capital Expenditure 0
Acquisition of Non-Financial Assets - - -
Capital Grants to Govt. Agencies - - -
Other Development
Total Expenditure for SP2.2 635,125 666,881 700,225
Programme 4: Sport Development and promotion
Sub-Programme 4.1: Athletics Championships and Other Games/Youth empowerment
Economic Classification Estimates 2020/2021
Projection 2021/2022
Projection 2022/2023

33 | P a g e
1,976,375 2,075,194 2,178,953
Compensation to Employees - - -
Use of Goods and Services 476,375 500,194 525,203
Current Transfers to Govt. Agencies 1,500,000 1,575,000 1,653,750
Capital Expenditure 0 0 0
Acquisition of Non-Financial Assets
Capital Grants to Govt. Agencies 0 0 0
Other Development
Total Expenditure for SP3.1 1,976,375 2,075,194 2,178,953
Sub-Programme 4.2: Talent Search and Promotion
Economic Classification Estimates 2020/2021
Projection 2021/2022
Projection 2022/2023
Current Expenditure 27,392,486 28,762,111 30,200,216
Compensation to Employees 24,442,236 25,664,348 26,947,565
Use of Goods and Services 230,250 241,763 253,851
Current Transfers to Govt. Agencies 2,720,000 2,856,000 2,998,800
Capital Expenditure 15,344,000 16,111,200 16,916,760
Acquisition of Non-Financial Assets 15,344,000 16,111,200 16,916,760
Capital Grants to Govt. Agencies
Other Development
Total Expenditure for SP3.2 42,736,486 44,873,311 47,116,976
Sub-Programme 4.3: County Football League and Clubs Development/County League
Economic Classification Estimates 2020/2021
Projection 2021/2022
Projection 2022/2023
Current Expenditure 752,000 789,600 829,080
Compensation to Employees - - -
Use of Goods and Services 752,000 789,600 829,080
Current Transfers to Govt. Agencies 3,000,000 3,150,000 3,307,500
Capital Expenditure 3,000,000 3,150,000 3,307,500
Acquisition of Non-Financial Assets
Capital Grants to Govt. Agencies

34 | P a g e
Other Development
Total Expenditure for SP3.3 3,752,000 3,939,600 4,136,580
Programme 5: Tourism development, Diversification and Promotion
Sub-Programme 5.1: Miss Tourism Tharaka Nithi
Economic Classification Estimates 2020/2021
Projection 2021/2022
Projection 2022/2023
Current Expenditure 2,730,500 2,867,025 3,010,376
Compensation to Employees - - -
Use of Goods and Services 2,730,500 2,867,025 3,010,376
Current Transfers to Govt. Agencies 0
Capital Expenditure 0 0 0
Acquisition of Non-Financial Assets
Capital Grants to Govt. Agencies
Other Development
Total Expenditure for SP4.1 2,730,500 2,867,025 3,010,376
Sub-Programme 5.2: Tourism Branding and Marketing/Erection of Gantries
Economic Classification Estimates 2020/2021
Projection 2021/2022
Projection 2022/2023
Current Expenditure 1,075,500 1,129,275 1,185,739
Compensation to Employees - - -
Use of Goods and Services 1,075,500 1,129,275 1,185,739
Current Transfers to Govt. Agencies 0 0 0
Capital Expenditure 0 0 0
Acquisition of Non-Financial Assets 0 0 0
Capital Grants to Govt. Agencies 0 0 0
Other Development 0 0 0
Total Expenditure for SP4.1 1,075,500 1,129,275 1,185,739
Sub-Programme 5.3: Tourism Promotion and Infrastructure Development
Economic Classification Estimates 2020/2021
Projection 2021/2022
Projection 2022/2023
Current Expenditure 0 0 0
Compensation to Employees 0 0 0

35 | P a g e
Use of Goods and Services 0 0 0
Current Transfers to Govt. Agencies 0 0 0
Capital Expenditure 1,931,000 2,027,550 2,128,928
Acquisition of Non-Financial Assets 1,931,000 2,027,550 2,128,928
Capital Grants to Govt. Agencies 0 0 0
Other Development 0 0 0
Total Expenditure for SP4.2 1,931,000 2,027,550 2,128,928
Grand Total 379,594,429 398,574,151 419,459,828

36 | P a g e
ENERGY AND HOUSING SECTION 1: INTRODUCTION PART A: VISION
To be the leading provider of efficient and cost-effective infrastructure facilities and services in
Housing and Energy.
PART B: MISSION To provide efficient, affordable and reliable infrastructure in Housing and Energy through
construction, modernization, rehabilitation and effective management for sustainable development.
Part C: Performance Overview and Background On the County Department
Key Achievements i. Supply of power to Kathangathachini market
Challenges i. Poor Energy infrastructure that affect service delivery in rural areas
ii. Insufficient office space to accommodate the staff and all the equipment
iii. Slow procurement that hinders availability of some basic equipment and machinery on
time
iv. Lack of Adequate Staff due to staffing requirement
v. Inadequate budget to procure all the necessary high-level equipment and maintenance
vi. Poor project management and evaluation that leads to misplaced targets and, poor
implementation.
Going Forward The department will focus on projects that create impact to the residents of the county and mostly if they
generate revenue or enhance service delivery. This is to ensure that the limited resources are optimally
utilized for the benefit of all citizens. The department will continually focus on ensuring that the number of
households with access to clean and affordable energy is achieved.
SECTION 2: PROGRAMME DETAILS Part D: Programme (S) Objectives
PROGRAMME OBJECTIVE
P1. Energy resource development and management
To enhance electricity connectivity and energy access in the county
P2: General Administration Planning and Support Services
Provide planning and support services and County Government Capacity Development

37 | P a g e
Part E: Summary of Programme Outputs and Performance Indicators
Programme 1: Energy resource development and management
Outcome: To enhance electricity connectivity and energy access in the county
Sub Programme 1.1: Energy resource
Delivery Unit Key Output (KO) Key Performance Indicators (KPIs)
Targets 2020/2021 Targets 2021/2022 Targets 2022/2023
Energy and ICT Connect Shauri market/ura-gate to the national power grid and connect public facilities and upgrade power in health facilities (including procurement of transformers)
% of connection done towards electrification of ura-gate
Number of public facilities connected
Number of health facilities upgrade power
100% electrification of ura-gate and surrounding facilities
20% health facilities
20% markets
20% health facilities
20% markets
20% health facilities
20% markets
Energy and ICT Automatic generators
Number of generators procured and fixed
15 15 15
Programme 2: General Administration Planning and Support Services

38 | P a g e
Outcome: effective and efficient planning, service delivery and well equipped staff
Sub Programme 1.2: General Administration Planning and Support Services
Delivery Unit Key Output (KO) Key Performance Indicators (KPIs)
Targets 2020/2021 Targets 2021/2022 Targets 2022/2023
Energy and ICT ICT and energy policies
Number of policies
1 Energy policy
1 ICT policy
1 Energy policy
1 ICT policy
1 Energy policy
1 ICT policy
Staff compensation and capacity building(taking them to different courses and trainings)
% of staff compensated and equipped
100% staff equipped
100% salary paid
100% staff equipped
100% salary paid
100% staff equipped
100% salary paid

39 | P a g e
Part F: Summary of Expenditure by Programmes, 2020/2021-2022/2023
PROGRAMME : BUDGET 2019/20 Estimates 2020/21 Projection 2021/2022
Projection 2022/2023
P1:Energy resource development and management
461,000 16,758,000 17,595,900 18,475,695
SP 1.1: Energy resource
461,000 16,758,000 17,595,900 18,475,695
P2: General Administration Planning and Support Services
25,235,455 2,499,500 2,624,475 2,755,699
SP 2.1 General Administration Planning and Support Services
25,235,455 2,499,500 2,624,475 2,755,699
Total Expenditure 25,696,455 19,257,500 20,220,375 21,231,394
Part G: Summary of Expenditure by Vote and Economic Classification, 2020/21-2022/2023
Economic Classification Budget 2019/20 Estimates 2020/2021
Projections 2021/2022
Projections 2022/2023
Current Expenditure 18,696,455 4,057,500 4,260,375 4,473,394
Compensation to Employees 6,210,455 - - -
Use of Goods and Services 12,486,000
4,057,500
4,260,375
4,473,394
Current Transfers to Govt. Agencies
- - - -
Capital Expenditure 7,000,000 15,200,000 15,960,000 16,758,000
Acquisition of Non-Financial Assets
7,000,000
15,200,000
15,960,000
16,758,000
Capital Grants to Govt. Agencies - - - -
Other Development - - - -
Total Expenditure 25,696,455 19,257,500 20,220,375 21,231,394
Part H: Summary of expenditure by Programme, Sub-Programme and Economic Classification, 2020/21-2022/2023
Programme 1: Energy resource development and management Sub-Programme 1.1: Energy Resource Economic Classification Estimates
2020/2021 Projection 2021/2022
Projection 2022/2023
Current Expenditure 1,758,000 1,845,900 1,938,195 Compensation to Employees - - - Use of Goods and Services 1,758,000 1,845,900 1,938,195 Current Transfers to Govt. Agencies - - - Capital Expenditure 15,000,000 15,750,000 16,537,500 Acquisition of Non-Financial Assets 15,000,000 15,750,000 16,537,500 Capital Grants to Govt. Agencies - - - Other Development - - -

40 | P a g e
Total Expenditure for SP2.1 16,758,000 17,595,900 18,475,695 Programme 2: General Administration Planning and Support Services
Sub-Programme 2.1: General Administration Planning and Support Services
Economic Classification Estimates 2020/2021
Projection 2021/2022
Projection 2022/2023
Current Expenditure 2,299,500 2,414,475 2,535,199 Compensation to Employees - - - Use of Goods and Services 2,299,500 2,414,475 2,535,199 Current Transfers to Govt. Agencies - - - Capital Expenditure 200,000 210,000 220,500 Acquisition of Non-Financial Assets 200,000 210,000 220,500 Capital Grants to Govt. Agencies - - - Other Development - - - Total Expenditure for SP1.1 2,499,500 2,624,475 2,755,699 TOTAL Expenditure 19,257,500 20,220,375 21,231,394

41 | P a g e
FINANCE AND ECONOMIC PLANNING
SECTION 1: INTRODUCTION PART A: VISION A leading sector of excellence in public administration, financing and planning in Kenya.
PART B: MISSION To provide overall leadership and policy direction in resource mobilization, management and accountability for efficient and quality public service delivery.
Part C: Performance Overview and Background On the County Department
Key Achievements In the spirit of upholding Public Expenditure Principles (fiscal discipline, allocative efficiency and operational efficiency), the department has prepared three public finance management documents: County Budget, CBROP and CFSP. The department pledges fiscal discipline as set out in PFM Act, 2012 as well as adoption of best practices.
In reiteration of commitments to prudent fiscal policy, the department ensured that there is
equitable sharing of burdens and benefits of the use of resources and public borrowing between
the present and future generation; ensured that development portfolio is not crowded out by
increasing wage burden; ensured adherence to the ratio of development to recurrent of at least
30:70 on annual basis and over the medium term, as set out in the legal framework- Section 107(2)
of the PFM Act 2012.The department has developed a strategy to enhance revenue management
by identifying strong revenue raising measures such as revenue automation and correct duplication
and distortions in local taxes and fees that hurt the business environment. This lead to significant
increase in own source revenue from Ksh. 143 million in FY 2017/18 to Ksh. 242 million in FY
2018/19.
Challenges The department gets its major funding for its activities from the Government. The department therefore recommends increased funding from the government to improve service delivery.
Going Forward The department will improve on resource mobilization strategies, and strengthen partnerships with development partners, and public and private enterprises in order to fully implement its mandate.

42 | P a g e
SECTION 2: PROGRAMME DETAILS
Part D: Programme (S) Objectives
PROGRAMME OBJECTIVE
Economic Policy and County Planning To provide leadership and policy direction for effective service delivery
Financial Management Services To ensure prudent financial management
General Administration, Planning and Support Services To facilitate the delivery of services to empowered, informed citizens by an efficient, effective and service-oriented staff
Kenya Devolution Support Programme Optimal capacity building

43 | P a g e
Part E: Summary of Programme Outputs and Performance Indicators
Programme 1: Economic Policy and County Planning
Outcome: Coordinated budgeting and planning in the county
Sub Programme 1.1: County Statistics Services
Delivery Unit Key Output (KO) Key Performance Indicators (KPIs)
Targets 2020/21 Targets 2021/2022 Targets 2022/2023
Economic Planning Unit 1 Statistical Abstract
Easiness in accessing data for planning
1 Statistical Abstract
1 Statistical Abstract
1 Statistical Abstract
Programme 1: Economic Policy and County Planning Outcome: Coordinated budgeting and planning in the county Sub Programme 1.2: Economic Development, Planning and Coordination Services Delivery Unit Key Output (KO) Key Performance Indicators
(KPIs) Targets 2020/2021 Targets 2021/2022 Targets 2022/2023
Budget and Economic Unit Integrated development planning
Number of prepared public finance management documents
Prepare three public finance management documents: County Budget, CBROP and CFSP.
Prepare three public finance management documents: County Budget, CBROP and CFSP.
Prepare three public finance management documents: County Budget, CBROP and CFSP.
Programme 1: Economic Policy and County Planning Outcome: Coordinated budgeting and planning in the county Sub Programme 1.3: Monitoring and Evaluation Services Delivery Unit Key Output (KO) Key Performance Indicators
(KPIs) Targets 2020/2021 Targets 2021/2022 Targets 2022/2023
Economic planning unit [Output 1]
[SMART indicators] [Target year1] [Target year2] [Target year3]

44 | P a g e
Monitoring and evaluation report
Number of monitoring and evaluation report done and submitted
3-quarterly and one annual monitoring and evaluation report
3-quarterly and one annual monitoring and evaluation report
3-quarterly and one annual monitoring and evaluation report
Programme 2: Financial Management Services Outcome: Efficient capacity for coordinating, implementing and monitoring and evaluation of county plans Sub Programme 2.1: Accounting Services Delivery Unit Key Output (KO) Key Performance Indicators
(KPIs) Targets 2020/2021 Targets 2021/2022 Targets 2022/2023
Accounting Unit Efficient and effective Accounting Services
Annual Consolidated Financial Statements
Appropriation accounts prepared and submitted to be laid before the County Assembly by September 30th 2020
Appropriation accounts prepared and submitted to be laid before the County Assembly by September 30th 2021
Appropriation accounts prepared and submitted to be laid before the County Assembly by September 30th 2022
Programme 2: Financial Management Services Outcome: Efficient capacity for coordinating, implementing and monitoring and evaluation of county plans Sub Programme 2.2: Audit Services Delivery Unit Key Output (KO) Key Performance Indicators
(KPIs) Targets 2020/2021 Targets 2021/2022 Targets 2022/2023
Audit Unit Efficient and effective internal auditing Services
Internal audited reports Audited reports submitted to Audit Committee
Audited reports submitted to Audit Committee
Audited reports submitted to Audit Committee
Programme 2: Financial Management Services Outcome: Efficient capacity for coordinating, implementing and monitoring and evaluation of county plans Sub Programme 2.3: Budget Formulation and Coordination Delivery Unit Key Output (KO) Key Performance Indicators
(KPIs) Targets 2020/2021 Targets 2021/2022 Targets 2022/2023
County treasury Budget formulated Budget implemented One financial budget One financial budget One financial budget
Prepared CBROP One financial CBROP report
One financial CBROP report
One financial CBROP report
Programme 2: Financial Management Services Outcome: Efficient capacity for coordinating, implementing and monitoring and evaluation of county plans

45 | P a g e
Sub Programme 2.4: Supply Chain Management Services Delivery Unit Key Output (KO) Key Performance Indicators
(KPIs) Targets 2020/2021 Targets 2021/2022 Targets 2022/2023
Procurement Unit Procurement opportunities preserved for youths PLWDs
30% of opportunities awarded to youths and PLWDS
30% 32% 34%
Annual
Procurement Plans
Annual Procurement
Plans
One county procurement plan
One county procurement plan
One county procurement plan
Goods and services procured for use by departments
Timely delivery of goods and services;
85% 90% 95%
Programme 3: General Administration, Planning and Support Services Outcome: An efficient, effective and service-oriented staff, empowered and informed citizens Sub Programme 3.1: Human Resource Management Services
Delivery Unit Key Output (KO) Key Performance Indicators (KPIs)
Targets 2020/2021 Targets 2021/2022 Targets 2022/2023
County treasury Improved services that enhances customer satisfaction
No. of Policies, bills and legal notices developed & disseminated
2 2 2
Programme 4: Kenya Devolution Support Programme Outcome: skilled and knowledgeable workforce Sub Programme 4.1: Tharaka Nithi KDSP Capacity Building Delivery Unit Key Output (KO) Key Performance Indicators
(KPIs) Targets 2020/2021 Targets 2021/2022 Targets 2022/2023
County treasury Capacity building trainings
Number of capacity building activities held
3 5 8

46 | P a g e
Part F: Summary of Expenditure by Programmes, 2020/2021-2022/2023
Programme Budget 2019/20
Estimates 2020/21 Projection 2021/2022 Projection 2022/2023
Sp1.1: County Statistics Services
3,390,000 2,540,000 2,667,000 2,800,350
Sp1.2: Economic Development, Planning And Coordination Services
4,010,000 3,110,000 3,265,500 3,428,775
Sp1.3: Monitoring And Evaluation Services
3,240,000 2,640,000 2,772,000 2,910,600
P1: Economic Policy And County Planning
10,640,000 8,290,000 8,704,500 9,139,725
Sp 2.1: Accounting Services
4,600,000 4,400,000 4,620,000 4,851,000
Sp 2.2: Audit Services
5,400,000 5,000,000 5,250,000 5,512,500
Sp 2.3: Budget Formulation And Coordination
7,230,000 5,930,000 6,226,500 6,537,825
Sp 2.4: Supply Chain Management Services
2,480,000 2,480,000 2,604,000 2,734,200
P2: Financial Management Services
19,710,000 17,810,000 18,700,500 19,635,525
Sp 3.1: Human Resource Management Services
194,283,200 168,319,880 176,735,874 185,572,668
P3: General Administration, Planning And Support Services
194,283,200 168,319,880 176,735,874 185,572,668
Sp 4.1: Tharaka Nithi KDSP Capacity Building
38,263,000 182,242,250 191,354,363 200,922,081
P4: Kenya Devolution Support Programme
38,263,000 182,242,250 191,354,363 200,922,081
Total Expenditure 262,896,200 376,662,130 395,495,237 415,269,998
Part G: Summary of Expenditure by Vote and Economic Classification, 2020/21-2022/2023
Economic Classification Budget 2019/20 Estimates 2020/2021
Projections 2021/2022
Projections 2022/2023
Current Expenditure 262,896,200 376,662,130 395,495,237 415,269,998

47 | P a g e
Compensation to Employees 38,938,000 55,534,280 58,310,994 61,226,544
Use of Goods and Services 132,758,200 145,885,600 153,179,880 160,838,874
Other Expenses 8,000,000 20,000,000 21,000,000 22,050,000 Acquisition of Non-Financial Assets
83,200,000 155,242,250 163,004,363 171,154,581
Part H: Summary of expenditure by Programme, Sub-Programme and Economic Classification, 2020/21-2022/2023
Programme 1: Economic Policy and County Planning
Sub-Programme 1.1: County Statistics Services
Economic Classification Estimates 2020/2021
Projection 2021/2022
Projection 2022/2023
Use of Goods and Services 2,540,000 2,667,000 2,800,350
Acquisition of Non-Financial Assets - - -
Total Expenditure for SP 1.1 2,540,000 2,667,000 2,800,350
Sub-Programme 1.2: Economic Development, Planning and Coordination Services
Use of Goods and Services 3,010,000 3,160,500 3,318,525
Acquisition of Non-Financial Assets 100,000 105,000 110,250
Total Expenditure for SP 1.2 3,110,000 3,265,500 3,428,775
Sub-Programme 1.3: Monitoring and Evaluation Services
Use of Goods and Services 2,640,000 2,772,000 2,910,600
Acquisition of Non-Financial Assets - - -
Total Expenditure for SP 1.3 2,640,000 2,772,000 2,910,600
Programme 2: Financial Management Services Sub-Programme 2.1: Accounting Services Use of Goods and Services 4,400,000 4,620,000 4,851,000
Total Expenditure for SP 2.1 4,400,000 4,620,000 4,851,000
Sub-Programme 2.2: Audit Services
Use of Goods and Services 4,500,000 4,725,000 4,961,250
Acquisition of Non-Financial Assets 500,000 525,000 551,250
Total Expenditure for SP 2.2 5,000,000 5,250,000 5,512,500
Sub-Programme 2.3: Budget Formulation and Coordination
Use of Goods and Services 4,930,000 5,176,500 5,435,325
Acquisition of Non-Financial Assets 1,000,000 1,050,000 1,102,500
Total Expenditure for SP 2.3 5,930,000 6,226,500 6,537,825
Sub-Programme 2.4: Supply Chain Management Services

48 | P a g e
Use of Goods and Services 2,480,000 2,604,000 2,734,200
Total Expenditure for SP 2.4 2,480,000 2,604,000 2,734,200
Programme 3: General Administration, Planning and Support Services Sub-Programme 3.1: Human Resource Management Services
Compensation to Employees 55,534,280 58,310,994 61,226,544
Use of Goods and Services 92,385,600 97,004,880 101,855,124
Other Expenses 20,000,000 21,000,000 22,050,000
Acquisition of Non-Financial Assets 400,000 420,000 441,000
Total Expenditure for SP 3.1 168,319,880 176,735,874 185,572,668
Programme 4: Kenya Devolution Support Programme
Sub-Programme 4.1: Tharaka Nithi KDSP Capacity Building
Use of Goods and Services 29,000,000 30,450,000 31,972,500
Acquisition of Non-Financial Assets 153,242,250 160,904,363 168,949,581
Total Expenditure for SP 4.1 182,242,250 191,354,363 200,922,081
Grand Total 376,662,130 395,495,237 415,269,998

49 | P a g e
LANDS, PHYSICAL PLANNING AND URBAN DEVELOPMENT
SECTION 1: INTRODUCTION PART A: VISION To be a leading entity in the provision of efficient, equitable and sustainable use of land resource,
spatial planning and development of urban areas.
PART B: MISSION To steer positive land reforms for improvement of livelihood of county citizens through efficient
administration, equitable access, secure tenure and controlled physical planning and urban
development.
Part C: Performance Overview and Background On the County Department
Urban development This is a department under and urban development. The department has the core mandate to ensure
efficient and effective service delivery to urban residents. The following factor has facilitated
progress towards this goal:
Enough working space
Good offices
Dedicated staff
Stakeholders support
Good communication from ministry and stakeholders
Well-functioning town boards
Land Adjudication & Settlement. The department of land adjudication and settlement has committed itself to ensuring all lands in
the County are adjudicated so that residents acquire title deeds. This will give security of tenure
and empower area residents. The following factor has facilitated progress towards this goal:
Availability of PIDs
Goodwill from stakeholders
Adequate and committed human resource

50 | P a g e
Good support from county government
Office space
Land Survey Department The department has already come up with a draft land policy and we are in the process of liaising
with the national assembly secretariat to assist us come up with a fair copy for tabling before
County assembly for approval.
The department has factored procurement of survey equipment in FY2015-2016 in readiness to
come up with a modern survey lab geared towards digitizing/ geo-referencing all survey records.
The sub-sector has also factored in purchase of 4 wheel vehicles as well as putting up a survey
office block. The existence of LCB, TMB and the newly established County lands boards are all
geared in achieving the sub-sector mandate and goals.
Physical Planning Department The Department is in the process of developing guidelines and regulations on development control.
These are to guide the development in our urbanizing areas as well as control development in rural
areas. This will ensure among others food security and regulated land use. The department has also
factored the review of local physical development plans for all major urban areas. These will be
part of the ongoing process of developing the County spatial plan which is also a key plan
stipulated by the law. Development of the Ministry Strategic Plan is in progress.
Key Achievements Construction of Kaanwa, kangathachini, Kaare, Itugururu and magutuni modern markers
Construction of 10 sanitation facilities
Equipping of the incinerator
Tarmacking of Kathwana town roads
Construction of the Chuka jua kali garage
Installation of 10 flood lights
Construction of the Governor’s and Deputy Governor official residences
Garbage collection
Development of the County spatial plans
Development control in urban centres policy formulation and legislation especially the
County climate change policy and Act.

51 | P a g e
Public awareness and service delivery clinics
Challenges
o Inadequate resources
o Delayed disbursement of funds
o High pending bills
o Inadequate staffs in key departments
Going Forward
SECTION 2: PROGRAMME DETAILS Part D: Programme (S) Objectives
PROGRAMME OBJECTIVE
General Administration and management
Ensure proper coordination of departmental functions and responsibilities
Urban Development and settlement To have secure, accessible and conducive environment for doing business
Waste Management To have Clean, Healthy and conducive environment for doing business
Physical planning To have an elaborate county spatial framework
Land management and administration To ensure equitable and sustainable use of land resources
Kathwana Municipality To promote the development of Kathwana as a modern vibrant county head quarter.

52 | P a g e
Part E: Summary of Programme Outputs and Performance Indicators
Programme 1: Urban Development and settlement Outcome: To have secure, accessible and conducive environment for doing business Sub Programme 1.1: Urban infrastructure Services Delivery Unit Key Output (KO) Key Performance
Indicators (KPIs) Targets 2020/21 Targets 2021/2022 Targets 2022/2023
Urban Development
Construction of three markets
Number of markets constructed
5 5 5
Urban Development Identification and opening of access roads
Km of access roads opened 25 30 30
Urban Development Develop zoning regulations and standards
Approved regulations Approved regulations
Implementation of regulations
Implementation of regulations
Urban Development Construction of modern public toilets
Number of toilets constructed 15 15 15
Urban Development Opening, grading, murruming and tarmacking of roads.
KM of roads graded, murrumed and tarmacked
25 30 30
Urban Development Urban Beautification and landscaping
Square km beatified and landscaped
5 5 5
Urban Development Installation of flood lights
Number of flood lights 10 10 10
Programme 1: Urban development and settlement Outcome: To have secure, accessible and conducive environment for doing business
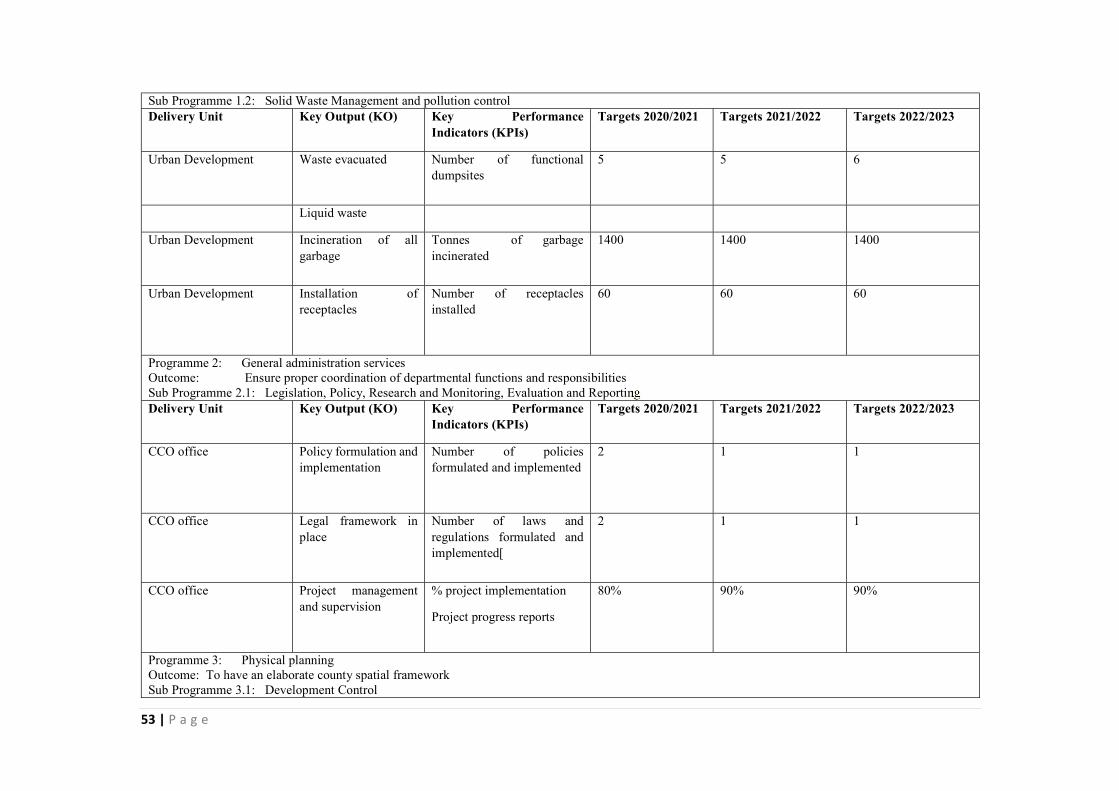
53 | P a g e
Sub Programme 1.2: Solid Waste Management and pollution control Delivery Unit Key Output (KO) Key Performance
Indicators (KPIs) Targets 2020/2021 Targets 2021/2022 Targets 2022/2023
Urban Development
Waste evacuated
Number of functional dumpsites
5 5 6
Liquid waste
Urban Development
Incineration of all garbage
Tonnes of garbage incinerated
1400 1400 1400
Urban Development
Installation of receptacles
Number of receptacles installed
60 60 60
Programme 2: General administration services Outcome: Ensure proper coordination of departmental functions and responsibilities Sub Programme 2.1: Legislation, Policy, Research and Monitoring, Evaluation and Reporting Delivery Unit Key Output (KO) Key Performance
Indicators (KPIs) Targets 2020/2021 Targets 2021/2022 Targets 2022/2023
CCO office Policy formulation and implementation
Number of policies formulated and implemented
2 1 1
CCO office Legal framework in place
Number of laws and regulations formulated and implemented[
2 1 1
CCO office Project management and supervision
% project implementation
Project progress reports
80% 90% 90%
Programme 3: Physical planning Outcome: To have an elaborate county spatial framework Sub Programme 3.1: Development Control
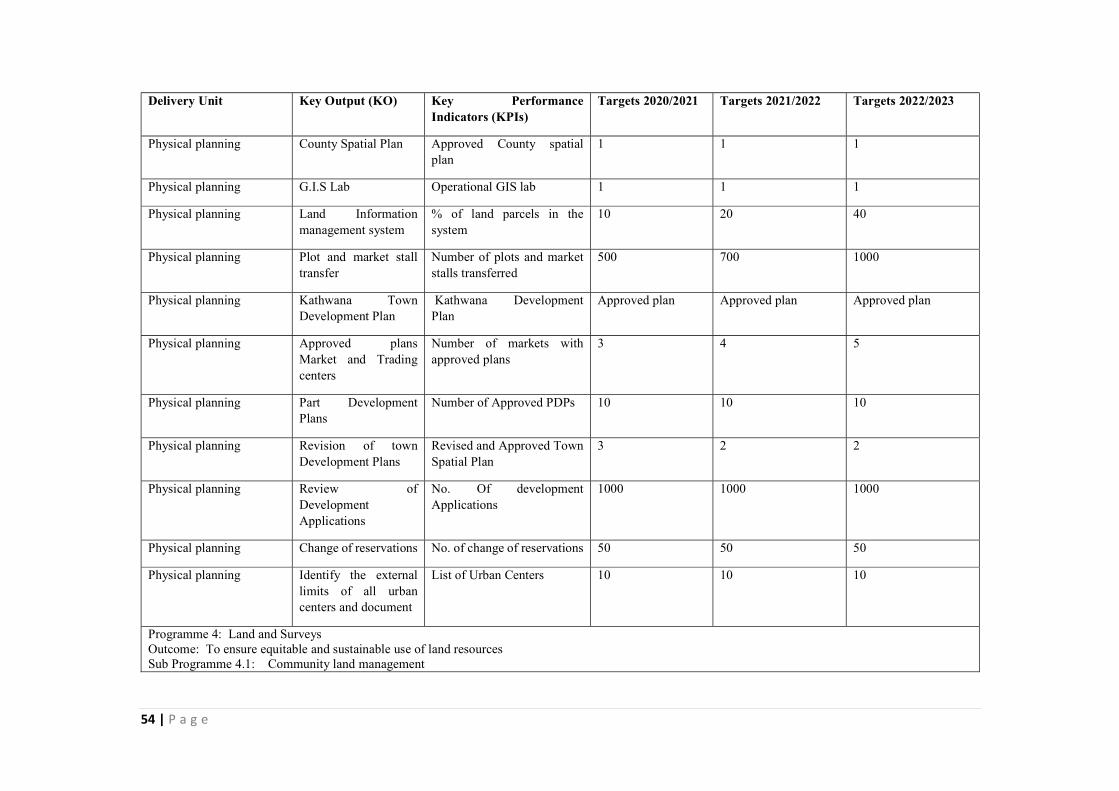
54 | P a g e
Delivery Unit Key Output (KO) Key Performance Indicators (KPIs)
Targets 2020/2021 Targets 2021/2022 Targets 2022/2023
Physical planning County Spatial Plan Approved County spatial plan
1 1 1
Physical planning G.I.S Lab Operational GIS lab 1 1 1
Physical planning Land Information management system
% of land parcels in the system
10 20 40
Physical planning Plot and market stall transfer
Number of plots and market stalls transferred
500 700 1000
Physical planning Kathwana Town Development Plan
Kathwana Development Plan
Approved plan Approved plan Approved plan
Physical planning Approved plans Market and Trading centers
Number of markets with approved plans
3 4 5
Physical planning Part Development Plans
Number of Approved PDPs 10 10 10
Physical planning Revision of town Development Plans
Revised and Approved Town Spatial Plan
3 2 2
Physical planning Review of Development Applications
No. Of development Applications
1000 1000 1000
Physical planning Change of reservations No. of change of reservations 50 50 50
Physical planning Identify the external limits of all urban centers and document
List of Urban Centers 10 10 10
Programme 4: Land and Surveys Outcome: To ensure equitable and sustainable use of land resources Sub Programme 4.1: Community land management
55 | P a g e
Delivery Unit Key Output (KO) Key Performance Indicators (KPIs)
Targets 2020/2021 Targets 2021/2022 Targets 2022/2023
Lands and survey Development of county land use policy
customized land policy for the county
1 0 0
Lands and survey Secure public Lands Approved Part Development Plans
20 10 10
Programme 4: Land and Surveys Outcome: To ensure equitable and sustainable use of land resources Sub Programme 4.2: Cadastral Survey Delivery Unit Key Output (KO) Key Performance
Indicators (KPIs) Targets 2020/2021 Targets 2021/2022 Targets 2022/2023
Lands and survey Provision of geodetic reference frame
Bench marks all over the entire county
1 1 1
Lands and survey Establishment of county geodetic control network
Control points in All the 15 county wards
1 1 1
Lands and survey Creation of data base Scanned Map 1 1 1
Programme 4: Land and survey Outcome: To ensure equitable and sustainable use of land resources Sub Programme 4.4: Reconnaissance/Advisory Survey Delivery Unit Key Output (KO) Key Performance
Indicators (KPIs) Targets 2020/2021 Targets 2021/2022 Targets 2022/2023
Lands and survey Demarcation and Survey
Number of sections demarcated and surveyed
2 2 2
Lands and survey Establish new adjudication sections and finalize demarcation and survey
Number of adjudication sections established and finalised
2 2 2

56 | P a g e
Hearing of appeal to minister cases
% of appeals handled 70 80 90
Programme 4: Land and survey Outcome: To ensure equitable and sustainable use of land resources Sub Programme 4.6 : Mapping and GIS Delivery Unit Key Output (KO) Key Performance
Indicators (KPIs) Targets 2020/2021 Targets 2021/2022 Targets 2022/2023
Lands and survey Geospatial data developed
No of topographical and thematic maps updated
10 10 10
Lands and survey GIS Lab
Completed GIS lab 1 1 0
Programme 5: Climate Change Fund Mechanism
Outcome: Community resilience to climate change impacts Sub Programme 7.1: County Climate Change fund mechanism
Delivery Unit Key Output (KO) Key Performance Indicators (KPIs)
Targets 2020/2021 Targets 2021/2022 Targets 2022/2023
County climate change unit
Establishment of County climate change fund
Number of climate change project
20 30 30
County climate change unit
Climate change mitigated
No. of County Appropriate Mitigation Actions) (NAMA) proposals
3 3 4
County climate change unit
Climate change mitigated
No of climate change programmes and projects approved and supported
3 3 3

57 | P a g e
County climate change unit
National Climate Change Action Plan Reporting (NCCAP)
No of action reports to operationalize NCCAP
1 1 1
County climate change unit
Climate change financing
Climate change financing as % of total budget
2% 3% 3%
Programme 6: KATHWANA MUNICIPALITY Outcome: To promote the development of Kathwana as a modern vibrant county head quarter. Sub Programme8.1: Kathwana Town Development program Delivery Unit Key Output (KO) Key Performance
Indicators (KPIs) Targets 2020/2021 Targets 2021/2022 Targets 2022/2023
Kathwana Municipality Better administration of Kathwana municipality
Establishment of municipality board
1 1 1
Kathwana Municipality Policy coordination and administration services delivered
Number of board meetings 12 12 12
Kathwana Municipality Upgrading of Kathwana town roads to bitumen standards
Number of Km tarmacked 2 2 2
Kathwana Municipality Development of modern market
% completion 40 80 100
Kathwana Municipality Kathwana urban development policy framework (Spatial plan)
Approved Kathwana urban development policy framework (Spatial plan)
1 1 1
Kathwana Municipality Integrated Development Plan (IDeP)
Approved Integrated Development Plan (IDeP)
1 1 1
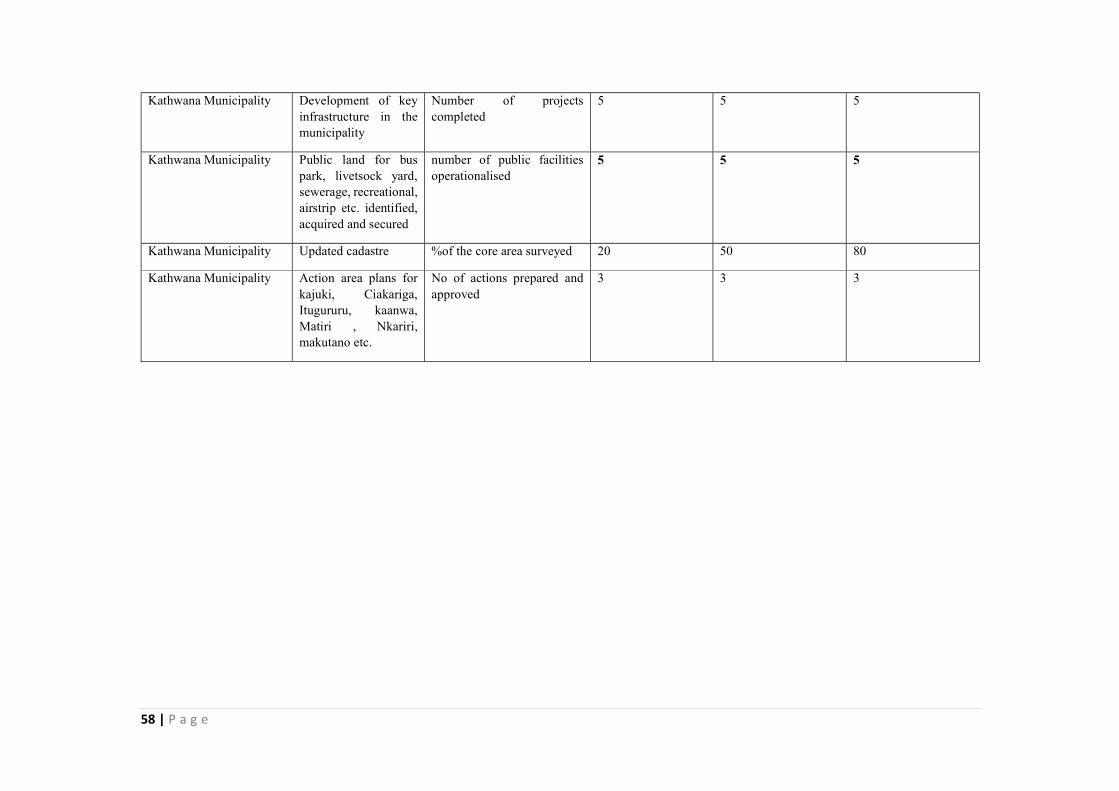
58 | P a g e
Kathwana Municipality Development of key infrastructure in the municipality
Number of projects completed
5 5 5
Kathwana Municipality Public land for bus park, livetsock yard, sewerage, recreational, airstrip etc. identified, acquired and secured
number of public facilities operationalised
5 5 5
Kathwana Municipality Updated cadastre %of the core area surveyed 20 50 80
Kathwana Municipality Action area plans for kajuki, Ciakariga, Itugururu, kaanwa, Matiri , Nkariri, makutano etc.
No of actions prepared and approved
3 3 3

59 | P a g e
Part F: Summary of Expenditure by Programmes, 2020/2021-2022/2023
Programme Budget 2019/20 Estimates 2020/21
Projection 2021/2022
Projection 2022/2023
Urban development and settlement
132,530,000 133,812,900 140,503,545 147,528,722
General administration and management
79,699,432 75,432,510 79,204,136 83,164,342
Physical planning services
12,854,809 14,030,800 14,732,340 15,468,957
Land administration and management
12,162,220 6,829,174 7,170,633 7,529,164
Kathwana Municipality
119,518,538 62,469,600 65,593,080 68,872,734
Total Expenditure 356,764,999 292,574,984 307,203,733 322,563,920
Part G: Summary of Expenditure by Vote and Economic Classification, 2020/21-2022/2023
Economic Classification
Budget 2019/20 Estimates 2020/2021
Projections 2021/2022
Projections 2022/2023
Current Expenditure 53,334,999.00
93,404,984.00
98,075,233.20
102,978,994.86
Compensation to Employees
32,699,432.00
46,930,110.00
49,276,615.50
51,740,446.28
Use of Goods and Services
20,635,567.00
37,674,874.00
39,558,617.70
41,536,548.59
Current Transfers to Govt. Agencies
- 8,800,000.00
9,240,000.00
9,702,000.00
Capital Expenditure 303,430,000.00
199,170,000.00
209,128,500.00
219,584,925.00
Acquisition of Non-Financial Assets
187,630,000.00
199,170,000.00
209,128,500.00
219,584,925.00
Capital Grants to Govt. Agencies
115,800,000.00
- - -
Other Development
Total Expenditure 356,764,999.00
292,574,984.00
307,203,733.20
322,563,919.86
Part H: Summary of expenditure by Programme, Sub-Programme and Economic Classification, 2020/21-2022/2023
Programme 1: Urban Development
Economic Classification
Estimates 2020/2021 Projection 2021/2022 Projection 2022/2023

60 | P a g e
Current Expenditure
14,672,900
15,406,545
16,176,872
Compensation to Employees
0 0 0
Use of Goods and Services
14672900 15406545 16176872.25
Current Transfers to Govt. Agencies
0 0 0
Capital Expenditure
119,170,000
125,128,500
131,384,925
Acquisition of Non-Financial Assets
119,170,000
125,128,500
131,384,925
Capital Grants to Govt. Agencies
- - -
Other Development
- - -
Total Expenditure for P1
133,842,900
140,535,045
147,561,797
Programme: General Administration
Economic Classification
Estimates 2020/2021 Projection 2021/2022 Projection 2022/2023
Current Expenditure
45,432,510
47,704,136
50,089,342
Compensation to Employees
45,432,510
47,704,136
50,089,342
Use of Goods and Services
- - -
Current Transfers to Govt. Agencies
- - -
Capital Expenditure
30,000,000
31,500,000
33,075,000
Acquisition of Non-Financial Assets
30,000,000
31,500,000
33,075,000
Capital Grants to Govt. Agencies
- - -
Other Development
- - -
Total Expenditure for P2
75,432,510
79,204,136
83,164,342
Programme: Physical planning services
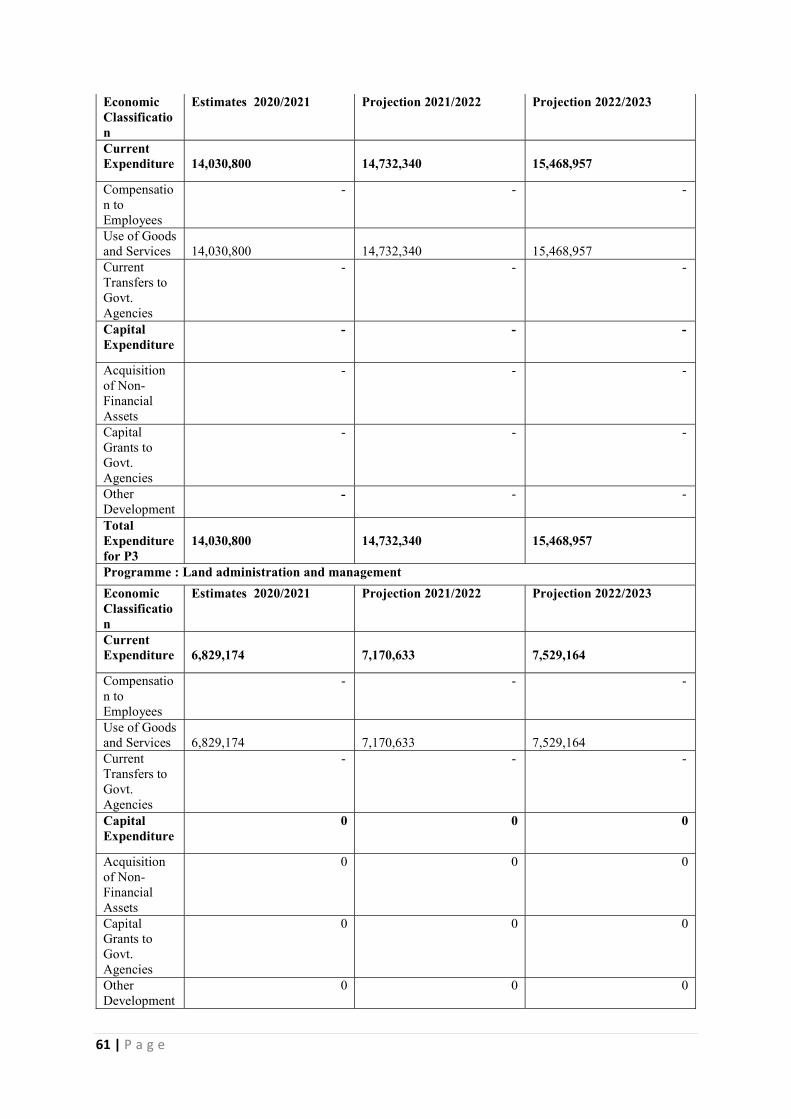
61 | P a g e
Economic Classification
Estimates 2020/2021 Projection 2021/2022 Projection 2022/2023
Current Expenditure
14,030,800
14,732,340
15,468,957
Compensation to Employees
- - -
Use of Goods and Services
14,030,800
14,732,340
15,468,957
Current Transfers to Govt. Agencies
- - -
Capital Expenditure
- - -
Acquisition of Non-Financial Assets
- - -
Capital Grants to Govt. Agencies
- - -
Other Development
- - -
Total Expenditure for P3
14,030,800
14,732,340
15,468,957
Programme : Land administration and management
Economic Classification
Estimates 2020/2021 Projection 2021/2022 Projection 2022/2023
Current Expenditure
6,829,174
7,170,633
7,529,164
Compensation to Employees
- - -
Use of Goods and Services
6,829,174
7,170,633
7,529,164
Current Transfers to Govt. Agencies
- - -
Capital Expenditure
0 0 0
Acquisition of Non-Financial Assets
0 0 0
Capital Grants to Govt. Agencies
0 0 0
Other Development
0 0 0

62 | P a g e
Total Expenditure for P4
6,829,174
7,170,633
7,529,164
Programme : Kathwana Municipality
Economic Classification
Estimates 2020/2021 Projection 2021/2022 Projection 2022/2023
Current Expenditure
12,469,600
13,093,080
13,747,734
Compensation to Employees
1,497,600
1,572,480
1,651,104
Use of Goods and Services
2,172,000
2,280,600
2,394,630
Current Transfers to Govt. Agencies
8,800,000
9,240,000
9,702,000
Capital Expenditure
50,000,000
52,500,000
55,125,000
Acquisition of Non-Financial Assets
50,000,000
52,500,000
55,125,000
Capital Grants to Govt. Agencies
- - -
Other Development
- - -
Total Expenditure for P5
62,469,600
65,593,080
68,872,734
Grand Total 292,604,984
307,235,233
322,596,995

63 | P a g e
WATER, ENVIRONMENTAL AND NATURAL RESOURCES
SECTION 1: INTRODUCTION PART A: VISION
Clean and secure Environment with sustainable use of water and other natural resources.
PART B: MISSION
To promote, conserve and protect the environment and other natural resources and increase water
supply and forest cover for sustainable development.
Part C: Performance Overview and Background On the County Department During the FY 2015/16 to 2017/18 the sector achieved the following rehabilitation of fifty two ha
of forest and 17 hills are under conservation, Formation of 3 CFA (community forest association)
in Chogoria forest station, Chuka forest and Kiera Hills, Formation of 4 PFMPS (Participatory
Forest Management Plans In Kiera Hills, Ntugi Hills, Gikingo Hills, Chogoria Forest, Chuka
Forest and Gikingo Hills .
To divert the attention of communities to understand the important of forest and other natural
resources as well as help the community from depleting the existing natural resources, the
department was involved in various environmental awareness programmes by organising 4
environmental stakeholder meetings and involved in 3 annual world environment day and 2 annual
international day of forest cerebrations. This increased the capacity of people in conservation and
protection of the environment as well as helped the farmers to practice smart agriculture, non-
wood forest products enterprises like bee keeping, basket weaving, tree nursery preparation and
management among others.
Mapped, restored, conserved and rehabilitated various wetlands in the county to increase in water
quality and quantity in rivers, swamps, streams and springs. This was achieved through formation
of 11 WRUAs up stream along 10 rivers in Chuka/Igambang’ombe sub-county and protection of
9 springs in Chuka/Igambang’ombe and Maara Sub-County.

64 | P a g e
Key Achievements
o Purchase of drilling equipment
o Drilling of 10 boreholes
o Construction of three earth dams
o Initiation of 5 water projects
o Tree planning campaigns
Challenges o Inadequate funds for the capital intensive water projects
o Delayed release of funds
o High pending bills
o Delayed procurement process
o Inadequate staffing levels
o Reducing water levels in rivers due to droughts
o Increased demand of wood leading to cutting down of trees
Going Forward [Description of how the current budget implementation contributes towards addressing some of the
challenges outlined and the way forward on solving some pertinent issues that affects the County
Department.]
SECTION 2: PROGRAMME DETAILS Part D: Programme (S) Objectives
PROGRAMME OBJECTIVE
Environment and Natural Resources To enhance sustainable management of environment, water, irrigation and natural resources;
Water services To increase access to clean and adequate water for sustainable development
Irrigation and Drainage To increase utilization of land through irrigation, drainage and land reclamation

65 | P a g e
Part E: Summary of Programme Outputs and Performance Indicators
Programme 1: Water Supply Services
Outcome: [Key outcome/ expected results reflecting objective outlined in Part D]
Sub Programme 1.1: Domestic water services
Delivery Unit Key Output (KO) Key Performance Indicators (KPIs)
Targets 2020/21 Targets 2021/2022 Targets 2022/2023
Water services Improved access to water and sanitation services
Additional people served with clean water
4000 5000 5000
Water services Improved access to water and sanitation services
M3 of water supplied per day
200,000 200,000 200,000
Water services Improved access to water and sanitation services
Number of boreholes drilled and equipped
15 20 10
Water services Improved access to water and sanitation services
Number of earth dams constructed
15 15 15
Water services Improved access to water and sanitation services
Number of operational drilling equipment
2 2 2
Water services Improved access to water and sanitation services
Number of operational schemes 30 40 50
Programme 1: Water Supply Services
Outcome : reduced dependence on rain fed agriculture

66 | P a g e
Sub programme : Irrigation and drainage services
Delivery Unit Key Output (KO) Key Performance Indicators (KPIs)
Targets 2020/2021 Targets 2021/2022 Targets 2022/2023
Irrigation unit Irrigation support services
Acreage of irrigated land (acres) 200 250 300
Irrigation unit Irrigation support services
Number of households with irrigation water
10,000 11,000 12,000
Irrigation unit Irrigation support services
Number of project designs 5 5 5
Environment and Natural resources
Outcome : Clean and safe environment
Sub programme : Environment management and conservation
Delivery Unit Key Output (KO) Key Performance Indicators (KPIs)
Targets 2020/2021 Targets 2021/2022 Targets 2022/2023
Environment and natural resources
Environment policies
Number of policies developed 2 1 1
Environment and natural resources
Improved environment governance
No. of MEAs, ratified and domesticated
1 1 1
Environment and natural resources
Increased forest cover
HA of trees planted 50 70 80
Environment and natural resources
Community awareness on environmental conservation
Number of forums 15 30 30

67 | P a g e
Environment and natural resources
School greening program
Number of schools in the program
10 15 20
Environment and natural resources
Catchment conserved and rehabilitated
Number of hectares under sustainable Land management practice.
200 300 500
Environment and natural resources
Rehabilitated and protected river riparian zones
Hectares of catchment rehabilitated
100 1001 00
Environment and natural resources
Reduced waste and pollution control
Waste management strategy 1 1 1

68 | P a g e
Part F: Summary of Expenditure by Programmes, 2020/2021-2022/2023
PROGRAMME BUDGET 2019/20 Estimates 2020/21 Projection 2021/2022
Projection 2022/2023
P: Water Supply Services
144,984,765 194,460,109 204,183,114 14,392,270
SP: Domestic Water Services
75,830,874 78,018,659 81,919,592 86,015,572
SP: Irrigation and Drainage Services
27,405,098 65,904,450 69,199,673 72,659,656
SP: Water Storage Services
41,748,793 44,293,000 46,507,650 48,833,033
P: Environment and Natural Resources Management
7,400,305 23,013,728 24,164,414 25,372,635
SP: Environment and Natural Resources Management
7,400,305 23,013,728 24,164,414 25,372,635
Total Expenditure 152,385,070 217,473,837 228,347,528 39,764,905
Part G: Summary of Expenditure by Vote and Economic Classification, 2020/21-2022/2023
Economic Classification
Budget 2019/20 Estimates 2020/2021
Projections 2021/2022
Projections 2022/2023
Current Expenditure
49,385,070 59,903,587 62,898,766 66,043,705
Compensation to Employees
28,935,200 48,542,625 50,969,756 53,518,244
Use of Goods and Services
20,449,870 11,360,962 11,929,010 12,525,461
Current Transfers to Govt. Agencies
- - -
Capital Expenditure
103,000,000 157,570,250 162,987,563 171,136,941
Acquisition of Non-Financial Assets
103,000,000 157,570,250 162,987,563 171,136,941
Capital Grants to Govt. Agencies
- - -
Other Development - - - -
Total Expenditure 152,385,070 217,473,837 225,886,329 237,180,646
Part H: Summary of expenditure by Programme, Sub-Programme and Economic Classification, 2020/21-2022/2023
P: Water Supply Services
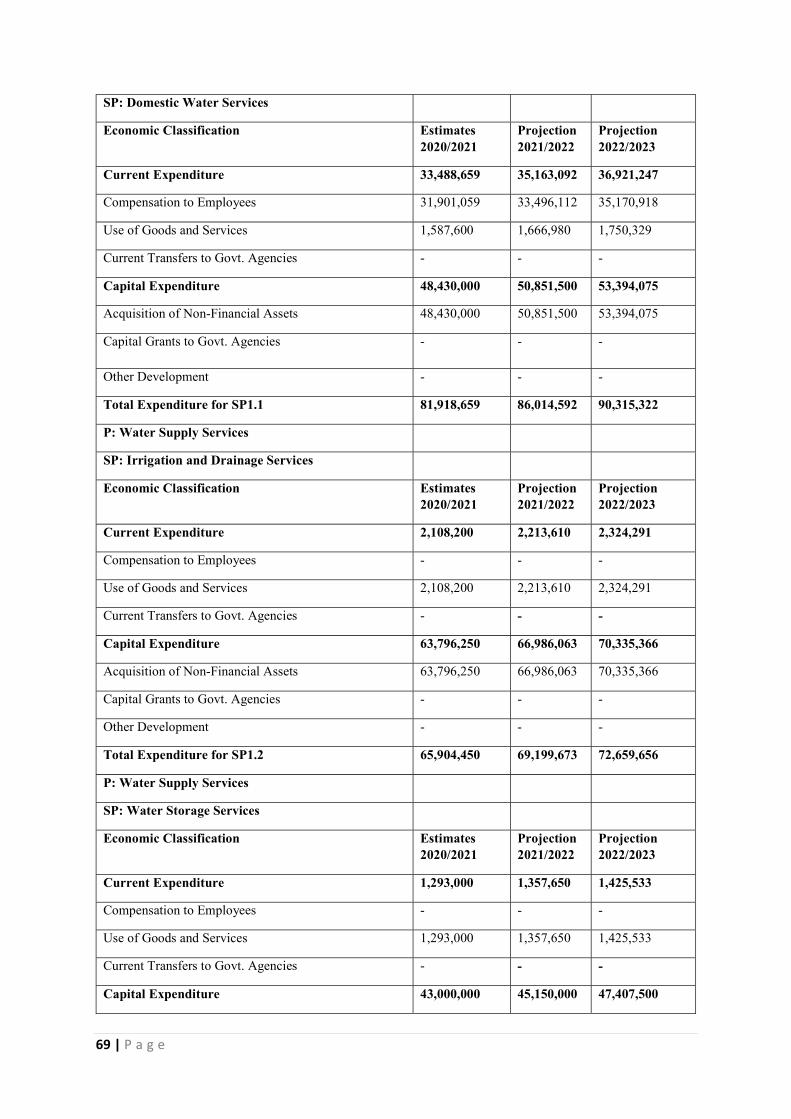
69 | P a g e
SP: Domestic Water Services
Economic Classification Estimates 2020/2021
Projection 2021/2022
Projection 2022/2023
Current Expenditure 33,488,659 35,163,092 36,921,247
Compensation to Employees 31,901,059 33,496,112 35,170,918
Use of Goods and Services 1,587,600 1,666,980 1,750,329
Current Transfers to Govt. Agencies - - -
Capital Expenditure 48,430,000 50,851,500 53,394,075
Acquisition of Non-Financial Assets 48,430,000 50,851,500 53,394,075
Capital Grants to Govt. Agencies - - -
Other Development - - -
Total Expenditure for SP1.1 81,918,659 86,014,592 90,315,322
P: Water Supply Services
SP: Irrigation and Drainage Services
Economic Classification Estimates 2020/2021
Projection 2021/2022
Projection 2022/2023
Current Expenditure 2,108,200 2,213,610 2,324,291
Compensation to Employees - - -
Use of Goods and Services 2,108,200 2,213,610 2,324,291
Current Transfers to Govt. Agencies - - -
Capital Expenditure 63,796,250 66,986,063 70,335,366
Acquisition of Non-Financial Assets 63,796,250 66,986,063 70,335,366
Capital Grants to Govt. Agencies - - -
Other Development - - -
Total Expenditure for SP1.2 65,904,450 69,199,673 72,659,656
P: Water Supply Services
SP: Water Storage Services
Economic Classification Estimates 2020/2021
Projection 2021/2022
Projection 2022/2023
Current Expenditure 1,293,000 1,357,650 1,425,533
Compensation to Employees - - -
Use of Goods and Services 1,293,000 1,357,650 1,425,533
Current Transfers to Govt. Agencies - - -
Capital Expenditure 43,000,000 45,150,000 47,407,500

70 | P a g e
Acquisition of Non-Financial Assets 43,000,000 45,150,000 47,407,500
Capital Grants to Govt. Agencies - - -
Other Development - - -
Total Expenditure for SP1.2 44,293,000 46,507,650 48,833,033
P: Environment and Natural Resources Management
SP: Environment and Natural Resources Management
Economic Classification Estimates 2020/2021
Projection 2021/2022
Projection 2022/2023
Current Expenditure 23,013,728 24,164,414 25,372,635
Compensation to Employees 16,641,566 17,473,644 18,347,327
Use of Goods and Services 6,372,162 6,690,770 7,025,309
Current Transfers to Govt. Agencies - - -
Capital Expenditure - - -
Acquisition of Non-Financial Assets - - -
Capital Grants to Govt. Agencies - - -
Other Development - - -
Total Expenditure for SP1.2 23,013,728 24,164,414 25,372,635
Total 215,129,837 225,886,329 237,180,645

71 | P a g e
LIVESTOCK, VETERINARY AND FISHERIES DEVELOPMENT
SECTION 1: INTRODUCTION PART A: VISION To attain sustainable food security and incomes for the people of Tharaka Nithi County
PART B: MISSION To improve livelihoods through provision of high quality, innovative, competitive and sustainable agricultural services.
Part C: Performance Overview and Background On the County Department
Livestock Production Sub Sector Mandate The livestock department has the mandate to promote, regulate and facilitate livestock production for socio-economic development and industrialization. For the sub sector to contribute effectively to socio-economic development and industrialization, both output and productivity needs to be enhanced.
Veterinary Services Sub Sector Mandate
The mandate of Veterinary sub sector is to prevent and control livestock diseases, prevent zoonosis; increase production and productivity contribute to external and internal trade in livestock and livestock products in a sustainable environment and contribute to food security and wealth creation.
Fisheries Development Sub Sector Mandate
The mandate of the fisheries subsector entails exploration, exploitation, utilization, conservation and management of fisheries resources while promoting aquaculture development and research in fresh water fisheries for sustainable development.
Key Achievements based on the planned outputs/services for the year 2018/19 Livestock Production The key output for the sub sector was identified as increased output and productivity. To achieve this output, the livestock production sub programme was mainly involved in promotion of breeds and provision of extension services as well as market development for livestock products (milk).Honey production is a key economic activity in the County and production of honey improved 239,397 kg and 12600 kg of beeswax. Honey fetches between Kshs. 300- 600 per kg depending on the level of refining. Two hundred Langstroth hives were introduced in Igambang’ombe by County government. Veterinary Services The County veterinary services department was involved in: Diseases and Pest Control and Surveillance, under which activity,
Veterinary Public Health, under which zoonotic diseases incidences was reduced.
Livestock upgrading/ Breeding.
Leather Development.
Veterinary Extension services

72 | P a g e
Clinical services.
Financial services and investment collected Kshs. 3,194,000 in the FY 2018/19.
In FY 2018/19 all A.I. equipment and materials were procured and A.I. Stations set. Fisheries Development The following are the key outcomes for the sector in the FY 2018/19: Fish farming production and productivity
Recreational and Ornamental fisheries promotion
Fish quality management
Fish value addition and marketing
Fisheries resources utilization and management
Extension services
Challenges f. Delay in release of funds by National Treasury affecting implementation of planned
activities g. Inadequate extension officers/services limiting service delivery. h. Low adoption of new technical information (commercialization uptake low) i. Lack of citizen feedback mechanism j. Poor mechanization and low adoption of modern technologies k. Low adaption of value addition
Going Forward
Going forward, achievement of the sector’s goals will highly depend on linkages and synergies with other priority sectors of the economy. Moreover, response to emerging issues such as vagaries of climate change, new legislations, legal gazette notices and executive orders and competing land use will also influence implementation of the proposed programmes and projects. With the widening gap between resource requirements and allocations, there is need to pursue innovative ways of financing programmes and projects including Public Private Partnerships and donor funding while embracing prudent use of the available resources
SECTION 2: PROGRAMME DETAILS Part D: Programme (S) Objectives
PROGRAMME Strategic Objective of the Programme (Each programme should have only one strategic objective)
Livestock Development
To support transformation of livestock production from subsistence into commercially oriented enterprise for sustainable food and nutrition security in the county.
Veterinary services
To safeguard animal health and welfare, increase animal production and productivity and promote trade in animals and animal products for sustainable food security, food safety and economic prosperity.
Fisheries development
To increase fish production for subsistence and cash generation in a sustainable way

73 | P a g e
Part E: Summary of Programme Outputs and Performance Indicators
Sub-programme Delivery unit Key Output (KO) Key Performance Indicators (KPIs)
Targets 2020/21
Targets 2021/22
Targets 2022/23
Programme Name: Livestock Development Outcome: Increased family income Livestock output and productivity
County Director, Livestock production
Increased Livestock output and productivity
No of farmers trainings for Grade breeding
58000 60500 61250
Livestock output and productivity
County Director, Livestock production
Increased Livestock output and productivity
No of breeding goats 150 180 220
Livestock output and productivity
County Director, Livestock production
Increased production of honey and hive products
Amount of honey produced/hive quarterly
11 12.6 14
Animal feed and nutrition
County Director, Livestock production
Increased production of pasture and fodder
Area under fodder (acres) 1300 1400 1500
Animal feed and nutrition
County Director, Livestock production
Increased production of pasture and fodder
% increase in quantity of fodder conserved
55tons 8 10
Market development County Director, Livestock production
Reduced post-harvest losses % increase in volume of marketed milk (litres daily)
90,000 140000 160000
Market development County Director, Livestock production
Increased Livestock output and productivity
No of Milk cooling plants installed
6 8
Extension services County Director, Livestock production
Increased Livestock output and productivity
No of farmers trainings on breeding goats
58000 60500 61250

74 | P a g e
Programme Name: Fisheries Development Outcome: Increased income and wealth Fish farming production and productivity
County Director, Fisheries development
240.75 Tons %Increase in production from fish farming
100 120% 150%
Development of cold water fisheries
County Director, Fisheries development
12 No. of rivers restocked with certified appropriate fingerlings
100 100 100
County Director, Fisheries development
2.2 Tons % Increase in volume of fish and fish products exported
7 8.5 10
Fish quality assurance and bio-safety management
County Director, Fisheries development
5% post-harvest losses % reduction in post-harvest losses
15 10 5
County Director, Fisheries development
100 % increase of certification and compliance
75 90 100
Fish value addition and marketing
County Director, Fisheries development
Ksh.2,400,000/year Amount increase in sales of fish and fish products
150 180 200
Fisheries resources utilization and management
County Director, Fisheries development
1 % increase of fisheries resources mapped
20 10 20
Financial services County Director, Fisheries development
1600 farmers accessing financial services
%Increase of fish farmers accessing financial services
20 10 20
Extension Services County Director, Fisheries development
1530 fish farmers %Increase in number of fish farmers
10 10 10
Media, Lifeline programming and Visibility
County Director, Fisheries development
1 % of fisheries baseline data updated
100% 100% 100%

75 | P a g e
Integrated warm water Fish farm
County Director, Fisheries development
1 % Completion of Integrated Warm Water Fish Farm
60% 80% 100%
Integrated aquaculture County Director, Fisheries development
0.3 % increase in surface area under fish farming
18% 25% 30%
Programme Name: Veterinary Services Outcome: Reduction and eradication of livestock diseases Diseases and Pest Control and Surveillance
County Director, Veterinary Services
Disease incidences reduce to 1% % disease incidences 3% 2% 1%
County Director, Veterinary Services
Tick-borne disease incidences reduce to 0.1%
% tick-borne disease incidences 0.28% 0.19% 0.10%
County Director, Veterinary Services
Vector-borne disease incidences reduce to 0.01%
% Vector-borne disease incidences
0.05% 0.03% 0.01%
County Director, Veterinary Services
0.01% trans-boundary disease incidences
% trans-boundary disease incidences
0.15% 0.10% 0.05%
Veterinary Public Health
County Director, Veterinary Services
Zoonotic diseases incidences Reduce to 0.01%
% Reduction in zoonotic diseases incidences
0.25% 0.15% 0.1%%
Livestock upgrading/ Breeding
County Director, Veterinary Services
-increase from 10 to 16 litres/day/cow -Increase from 100 to 160 kgs carcass weights
% Increase in productivity 45% 55%
65%
Leather Development County Director, Veterinary Services
Hides and skins rejects reduce to 4%
% reduction of hides and skins rejects
7% 6% 5%
Veterinary Extension services
County Director, Veterinary Services
Economic production losses due to diseases reduce to 10m
% reduction in economic production losses due to diseases
8% 6% 5%
Clinical services County Director, Veterinary Services
Livestock deaths due to curable diseases reduce to 1%
% reduction in livestock deaths 2% 1.50% 1%

76 | P a g e
Part F: Summary of Expenditure by Programmes for FY 2020/2021-2022/2023
PROGRAMME BUDGET 2019/20
Estimates 2020/21
Projection 2021/2022
Projection 2022/2023
Livestock production 36,444,971 63,546,813 66,499,154 57,059,111
Veterinary services 67,252,455 89,341,554 93,808,632 98,499,063
Fisheries development 12,532,312 20,134,933 21,291,680 22,521,264
Part G: Summary of Expenditure by Vote and Economic Classification, 2020/2021- 2022-2023
Economic Classification Budget 2019/20
Estimates 2020/2021
Projections 2021/2022
Projections 2022/2023
Recurrent Expenditure
Compensation to Employees 67,981,447 68,940,772 72,387,811 76,007,201
Use of Goods and Services 13,248,291 61,115,028 64,170,779 67,379,318
Current Transfers to Govt. Agencies 0 0 0 0
Capital Expenditure
Acquisition of Non-Financial Assets 35,000,000 30,967,500 33,040,875 34,692,919
Capital Grants to Govt. Agencies 0 12,000,000 12,000,000 0
Other Development 0 0 0 0
Total Expenditure 116,229,738 173,023,300 181,599,465 178,079,439
Part H: Summary of Expenditure by Programme, Sub-Programme and Economic Classification, 2020/2021-2022/23
Programme 1: Livestock Production
Economic Classification Estimates 2020/2021
Projection 2021/2022
Projection 2022/2023
Current Expenditure 43,046,813 45,199,154 47,459,111
Compensation to Employees 17,677,185 18,561,044 19,489,096
Use of Goods and Services 25,369,628 26,638,109 27,970,015
Current Transfers to Govt. Agencies 0 0 0
Capital Expenditure 20,500,000 21,300,000 9,600,000
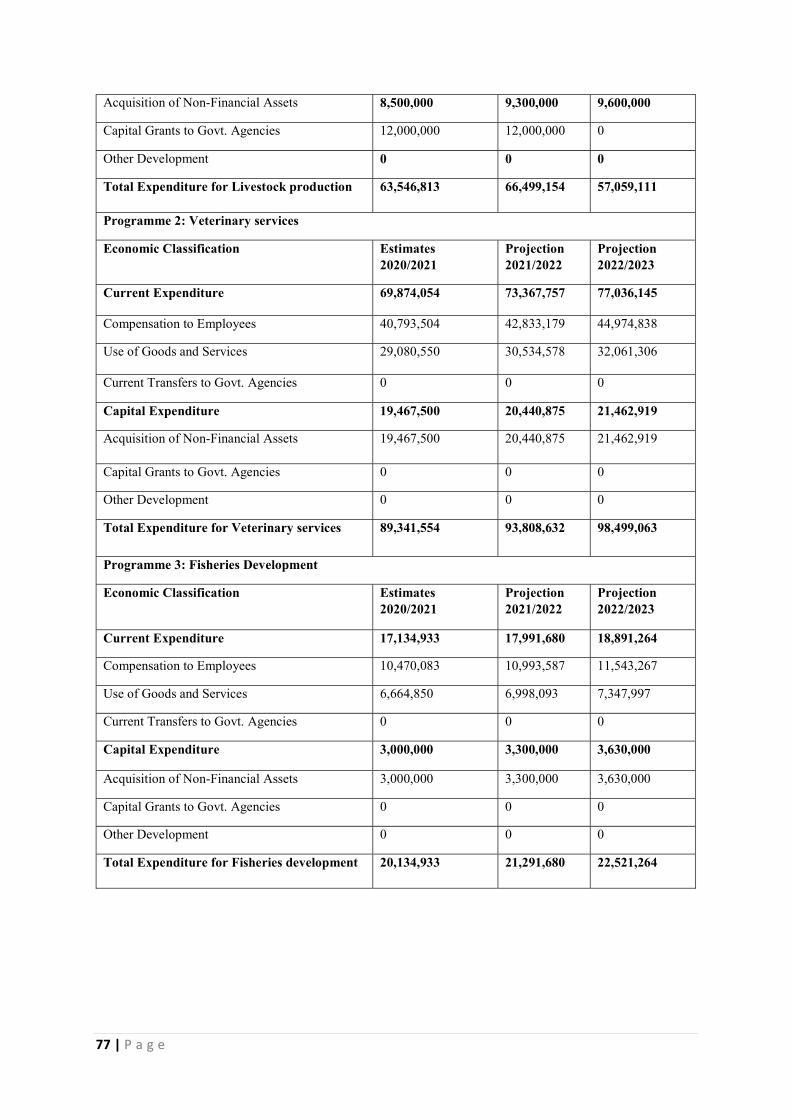
77 | P a g e
Acquisition of Non-Financial Assets 8,500,000 9,300,000 9,600,000
Capital Grants to Govt. Agencies 12,000,000 12,000,000 0
Other Development 0 0 0
Total Expenditure for Livestock production 63,546,813 66,499,154 57,059,111
Programme 2: Veterinary services
Economic Classification Estimates 2020/2021
Projection 2021/2022
Projection 2022/2023
Current Expenditure 69,874,054 73,367,757 77,036,145
Compensation to Employees 40,793,504 42,833,179 44,974,838
Use of Goods and Services 29,080,550 30,534,578 32,061,306
Current Transfers to Govt. Agencies 0 0 0
Capital Expenditure 19,467,500 20,440,875 21,462,919
Acquisition of Non-Financial Assets 19,467,500 20,440,875 21,462,919
Capital Grants to Govt. Agencies 0 0 0
Other Development 0 0 0
Total Expenditure for Veterinary services 89,341,554 93,808,632 98,499,063
Programme 3: Fisheries Development
Economic Classification Estimates 2020/2021
Projection 2021/2022
Projection 2022/2023
Current Expenditure 17,134,933 17,991,680 18,891,264
Compensation to Employees 10,470,083 10,993,587 11,543,267
Use of Goods and Services 6,664,850 6,998,093 7,347,997
Current Transfers to Govt. Agencies 0 0 0
Capital Expenditure 3,000,000 3,300,000 3,630,000
Acquisition of Non-Financial Assets 3,000,000 3,300,000 3,630,000
Capital Grants to Govt. Agencies 0 0 0
Other Development 0 0 0
Total Expenditure for Fisheries development 20,134,933 21,291,680 22,521,264

78 | P a g e
MEDICAL SERVICES, PUBLIC HEALTH AND SANIATION
SECTION 1: INTRODUCTION PART A: VISION
A county free from preventable diseases and ill health.
PART B: MISSION
To provide effective leadership and participate in provision of equitable, responsive, accessible and
accountable high-quality health care services to Tharaka Nithi Citizens.
Part C: Performance Overview and Background On the County Department The sector comprises:
Health services
Public health and sanitation
The department continued to focus on its broad strategies to enhance health care in the county by
promoting reproductive, maternal, new born, child, and adolescent health, procuring essential
commodities such as medicines and medical supplies, and improving existing and new health
facilities in Tharaka Nithi. The county also continued strengthening public health and sanitation
services through initiatives that reduce hygiene related diseases. Additionally, improvement of
health referral services and health information systems was carried out through increasing the
number of operational ambulances and computerizing the health information system.
Key Achievements 1. Renovating level two and three hospitals to standard requirements.
2. Upgrading Magutuni Hospital and Marimanti Hospital, currently underway and near
completion.
3. Upgrading Chuka Level IV Hospital
4. Construction of mortuary at Marimanti
5. Establishment of oxygen plant at Chuka.
6. Complete construction of the laboratories at Kathangacini, Rukenya and Chuka.
7. Completion of the Chuka Pediatric ward and Chuka isolation amenity

79 | P a g e
Challenges 1. Insufficient funding for completion of various capital – intensive projects
2. Delayed release of funds by the national government
3. Inadequate staffing levels for the upgrading of various health facilities and hospitals.
4. Capacity building continues to be required for the implementation of various projects in
the sector.
5. Management, availability, and use of information for decision-making suffers due to the
budget cycle restrictions, slowing the pace of projects.
Going Forward Kshs 1,499,792,076 was allocated to medical services while Kshs 330,946,518 was allocated to
Public Health and Sanitation in the 2020-21 CFSP. The medical services department projects that
approximately Kshs 1,028,757,572 will be utilized for compensation to employees while the
Department of Public Health will utilize Kshs 247,158,637 for the same purpose. Medical services
will utilize Kshs 160.28 million for acquisition of non-financial assets while Public Health requires
Kshs 4.2 million for the same during FY 2020/21.
The department ceiling for recurrent and development expenditure is Kshs 1,375,931,001 and Kshs
102,112,862 respectively and County Government remains committed to increase access to quality
healthcare across the county through operationalization of existing facilities and completion of
various development projects launched in the sub-counties. Kshs 102.1 million is expected to
improve infrastructure.
Furthermore, the sector remains a high priority, with approximately Kshs 330,9 million set aside
for medical services and public health and sanitation programs in FY 2020-21. Enhancing the
capacity of existing and new personnel will also be done to realize this target and is expected to
take place within the medium-term planning period, despite the looming challenges at national
level and global economic financial crisis.

80 | P a g e
SECTION 2: PROGRAMME DETAILS Part D: Programme (S) Objectives
Medical Services
PROGRAMME OBJECTIVE
Programme (1):
Curative and Rehabilitative Services
To improve access to quality and affordable Health care
Programme (2):
General Administration Planning and Support Services
To strengthen the provision and management of Health care services
Public Health
ROGRAMME OBJECTIVE
Programme (1):
Preventive and Promotive Health Services
To increase access to quality and timely Preventive and promotive Health services

81 | P a g e
Part E: Summary of Programme Outputs and Performance Indicators
Programme 1: Curative and Rehabilitative Services
Outcome: Reduced morbidity and mortality from curable and manageable diseases
Sub Programme 1.1: Essential Medicines and Medical Supplies
Delivery Unit Key Output (KO) Key Performance Indicators (KPIs) Targets 2020/2021 Targets 2021/2022 Targets
2022/23
Medical services Essential Health Commodities Increased access to essential Health
Commodities 20% 10% 5%
Medical services Access to basic Health care services
Proportion of Dispensaries Offering Basic Maternal, Newborn and Child Health Services
75%
87.5% 100%
Medical services Access to basic Health care services
Proportion of Health Centers Offering Basic Inpatient Services for Mothers and Children
60% 80% 100%
Medical services Access to basic and some specialized health care services
Proportion of Hospitals offering adequate Diagnostic, Therapeutic, Medical and Surgical Services
60%
80% 100%
Medical services Access to basic and some specialized health care services
A New Hospital Constructed at Kathwana, County HQs
0 0 1
Medical services Access to specialized health care services
Number of Hospitals Providing adequate Specialized, Teaching and Referral Health Services
0 1 1
Programme 2: General Administration, Planning and Support Services

82 | P a g e
Outcome: Improved efficiency and effectiveness in service delivery
Sub Programme 1.1: Human resource management
Delivery Unit Key Output (KO) Key Performance Indicators (KPIs) Targets 2020/2021 Targets 2021/2022 Targets 2022/23
Health care providers per 10,000 Population
Nurse population ratio 13.3 14 15
Health care providers per 10,000 Population
Doctor Population Ratio 1.4 1.5 2
Health care providers per 10,000 Population
Clinical officers Population Ratio 4.7 5.7 6.7
Health care providers per 10,000 Population
Public Health Officers Population Ratio
1.7 2 2.3
Health care providers per 10,000 Population
Medical laboratory officers Population ratio
2.8 3 3.3
Health care providers per 10,000 Population
Community Health Workers Population Ratio
0.6 0.7 1
Health care providers per 10,000 Population
Other Technical Health care workers Population ration
6.3 7 8
Sub-program 1.2: General administration and support services
Strengthened leadership and governance structures
County Health Bill developed 0 0 0
County Health Sector Strategic Plan developed
0 0 0
Annual Programme Based Budgets developed
1 1 1
Annual Work Plans developed 1 1 1
Health sector reviews conducted 1 0 1

83 | P a g e
% of service units with Performance Contracts
100% 100% 100%
Health sector organizational structure developed and ratified
0 0 0
% of health facilities with functional committees
100% 100% 100%
Coverage of Health facilities with Service charters
60% 70% 80%
Client satisfaction index 80%
Coverage of Quarterly support supervision visits to Health facilities
100% 100% 100%
Utility vehicles procured 3 3 2
Ambulances Procured 2 2 2
Motorcycles procured for use by Public Health and Community Health Extension Workers
6 6 6
Sub-program 1.3: Health Information Management System
Increased use of information for decision making
Proportion of the operational units submitting timely, complete and accurate information
93% 95% 98%
County based Health Research conducted
5 5 5
Client satisfaction survey conducted 0 1 0
Employee satisfaction survey conducted
0 1 0

84 | P a g e
Public Health And Sanitation
Programme 2: Preventive and Promotive Health Services Outcome: Reduced incidences of preventable diseases Sub Programme 1.2: Environmental and Community Health Services Delivery Unit Key Output (KO) Key Performance Indicators
(KPIs) Targets 2020/2021
Targets 2021/2022
Targets 2022/23
Reduced incidences of water-borne and sanitation related diseases
Coverage of Households with access to improved sanitation
42% 45% 48%
Coverage of open defecation free villages
15% 20% 25%
Coverage of Households that own any latrines (whether improved or unimproved)
87% 88% 89%
Coverage of schools implementing school Health policy
15% 20% 25%
Coverage of functional community health units
32% 39% 46%
% increase of food premises meeting minimum public Health Requirements
70% 80% 90%
% increase of food, feed and water products/items meeting Health standards
70% 80% 90%
% increase of commercial premises meeting the minimum public Health standards
70% 80% 90%
Sub-program 2.2: Communicable Disease Prevention Programmes
Detection rate of AFP 4 4 4

85 | P a g e
Detection of measles 244 244 244
Detection rate of Neonatal tetanus 6 6 6
TB case detection rate 85% 90% 95%
TB treatment success rate 96% 97% 98%
% reduction in new HIV Infections 60% 75% 80%
Malaria Incidence 1% 1% 1%
Sub-program 2.3: Non-Communicable Disease Control Programme
% reduction of the new cases of
Non-communicable Diseases 20% 25% 30%
Sub-program 2.4: Reproductive, Maternal, Newborn, Child and Adolescent health services (RMNCAH)
Improved maternal, newborn, child and adolescent Health
Proportion of children under one year fully immunized
77% 87% 97%
Contraceptive Prevalence Rate (WRA receiving FP commodities)
69% 74% 79%
Proportion of pregnant women attending 4 ANC visits
60% 70% 80%
Proportion of deliveries conducted by skilled attendants
55% 60% 65%
% Women of Reproductive age screened for Cervical cancers
50% 80% 90%
Sub-program 2.5: Nutrition services
Reduced incidences of malnutrition
Stunting Rate 20% 19% 18%
Prevalence of underweight 7% 6% 5%
% of children (6-11 months) dewormed at least once a year
57% 62% 67%

86 | P a g e
Part F: Summary of Expenditure by Programmes, 2020/2021-2022/2023 Medical Services PROGRAMME 1: Curative and Rehabilitative Services Sub programme Estimates
2020/21 Projected Estimates 2021/22
Projected Estimates 2022/23
SP 1.1: Hospital level services 74,064,480 77,767,704 81,656,089
Sub total 74,064,480 77,767,704 81,656,089
PROGRAMME 2: General Administration, Planning and Support Services
Sub programme Estimates 2020/21
Projected Estimates 2021/22
Projected Estimates 2022/23
S.P 2.1: General administration and support services
175,891,740 184,686,327 193,920,643
S.P 2.2: Human resource management 929,693,954 976,178,652 1,024,987,584
S.P. 2.3: Health sector planning, budgeting, monitoring and evaluation
3,149,500 3,306,975 3,472,324
S.P.2.4: Procurement of medicine, medical and other supplies
174,180,571 182,889,600 192,034,080
Sub total 1,282,915,765 1,347,061,553 1,414,414,631
Total Expenditure 1,356,980,245 1,424,829,257 1,496,070,720
PUBLIC HEALTH PROGRAMME 1: Preventive and Promotive Health Services
Sub programme Estimates 2020/21
Projected Estimates 2021/22
Projected Estimates 2022/23
S.P. 1.1: Disease surveillance 1,920,000 2,016,000 2,116,800
S.P 1.2: Environmental health services 9,562,200 10,040,310 10,542,326
S.P 1.3 Health promotion and disease control 266,464,318 279,787,534 293,776,911
S.P 1.4: HIV and AIDS support services 1,300,000 1,365,000 1,433,250
S. P.1.5: Reproductive maternal and childbirth services
900,000 945,000 992,250
Total Expenditure 280,146,518 294,153,844 308,861,537

87 | P a g e
Part G: Summary of Expenditure by Vote and Economic Classification, 2020/2021-2022/2023
Medical Services Economic Classification Estimates 2020/21 Projected Estimates
2021/22 Projected Estimates 2022/23
Current Expenditure 1,201,169,124 1,261,227,580 1,324,288,959
Compensation to Employees 928,693,954 975,128,652 1,023,885,084
Use of Goods and Services 147,575,500 154,954,275 162,701,989
Current Transfers to Govt. Agencies
124,899,670 131,144,654 137,701,886
Capital Expenditure 155,811,121 163,601,677 171,781,761
Acquisition of Non-Financial Assets
155,811,121 163,601,677 171,781,761
Capital Grants to Govt. Agencies 0 0 0
Other Development - - -
Total Expenditure 1,356,980,245 1,424,829,257 1,496,070,720
Public Health and Sanitation
Economic Classification Estimates 2020/21 Projected Estimates 2021/22
Projected Estimates 2022/23
Current Expenditure 276,746,518 290,583,844 305,113,036
Compensation to Employees 197,158,637 207,016,569 217,367,397
Use of Goods and Services 19,198,225 20,158,136 21,166,043
Current Transfers to Govt. Agencies
60,389,656 63,409,139 66,579,596
Capital Expenditure 4,200,000 4,410,000 4,630,500
Acquisition of Non-Financial Assets
4,200,000 4,410,000 4,630,500
Capital Grants to Govt. Agencies 0 0 0
Other Development - - -
Total Expenditure 280,946,518 294,993,844 309,743,536
Part H: Summary of expenditure by Programme, Sub-Programme and Economic Classification, 2020/2021-2022/2023
Medical Services Programme 1: Curative and Rehabilitative Services Sub-Programme 1.1: Hospital level services Economic Classification
Estimates 2020/21 Projected Estimates 2021/22
Projected Estimates 2022/23

88 | P a g e
Current Expenditure 12,500,000 13,125,000 13,781,250
Compensation to Employees
- -
Use of Goods and Services
12,500,000 13,125,000 13,781,250
Current Transfers to Govt. Agencies
- - -
Capital Expenditure 61,564,480 64,642,704 67,874,839
Acquisition of Non-Financial Assets
16,523,500 17,349,675 18,217,159
Capital Grants to Govt. Agencies
45,040,980 47,293,029 49,657,680
Other Development
Total Expenditure for SP1.1
74,064,480 77,767,704 81,656,089
Programme 2: General Administration, Planning and Support Services Sub-Programme 2.1: General Administrative Services
Economic Classification
Estimates 2020/21 Projected Estimates 2021/22
Projected Estimates 2022/23
Current Expenditure 45,268,119 47,531,525 49,908,101
Compensation to Employees
- - -
Use of Goods and Services
37,050,000 38,902,500 40,847,625
Current Transfers to Govt. Agencies
8,218,119 8,629,025 9,060,476
Capital Expenditure 130,623,621 137,154,802 144,012,542
Acquisition of Non-Financial Assets
130,623,621 137,154,802 144,012,542
Capital Grants to Govt. Agencies
- - -
Other Development - - -
Total Expenditure for SP1.1
175,891,740 184,686,327 193,920,643
Sub-Programme 2.2: Human Resource management
Estimates 2020/21 Projected Estimates 2021/22
Projected Estimates 2022/23
Current Expenditure 929,693,954 976,178,652 1,024,987,584
Compensation to Employees
928,693,954 975,128,652 1,023,885,084
Use of Goods and Services
1,000,000 1,050,000 1,102,500
Current Transfers to Govt. Agencies
- - -
Capital Expenditure - - -
Acquisition of Non-Financial Assets
- - -
Capital Grants to Govt. Agencies
- - -

89 | P a g e
Other Development - - -
Total Expenditure for SP1.1
929,693,954 976,178,652 1,024,987,584
Sub-Programme 2.3: Health sector planning, budgeting Monitoring and Evaluation Economic Classification
Estimates 2020/21 Projected Estimates 2021/22
Projected Estimates 2022/23
Current Expenditure 1,065,500 1,118,775 1,174,714
Compensation to Employees
1,065,500 1,118,775 1,174,714
Use of Goods and Services
Current Transfers to Govt. Agencies
- - -
Capital Expenditure 2,084,000 2,188,200 2,297,610
Acquisition of Non-Financial Assets
2,084,000 2,188,200 2,297,610
Capital Grants to Govt. Agencies
Other Development
Total Expenditure for SP. 2.2
3,149,500 3,306,975 3,472,324
Sub-Programme 2.4: Procurement of medicine, medical and other supplies
Estimates 2020/21 Projected Estimates 2021/22
Projected Estimates 2022/23
Current Expenditure 167,600,571 175,980,600 184,779,630
Compensation to Employees
- - -
Use of Goods and Services
95,960,000 100,758,000 105,795,900
Current Transfers to Govt. Agencies
71,640,571 75,222,600 78,983,730
Capital Expenditure 6,580,000 6,909,000 7,254,450
Acquisition of Non-Financial Assets
6,580,000 6,909,000 7,254,450
Capital Grants to Govt. Agencies
Other Development
Total Expenditure for SP1.1
174,180,571 182,889,600 192,034,080
Grand Total 1,356,980,245 1,424,829,258 1,496,070,720
Public Health and Sanitation
Programme 1: Preventive and Promotive Services
Sub-Programme 1.1: Disease Surveillance

90 | P a g e
Economic Classification Estimates 2020/21 Projected Estimates 2021/22
Projected Estimates 2022/23
Current Expenditure 1120000 1176000 1234800
Compensation to Employees - - -
Use of Goods and Services 1,120,000 1,176,000 1,234,800
Current Transfers to Govt. Agencies - - -
Capital Expenditure 800,000 840,000 882,000
Acquisition of Non-Financial Assets 800,000 840,000 882,000
Capital Grants to Govt. Agencies - - -
Other Development - - -
Total Expenditure for SP1.1 1,920,000 2,016,000 2,116,800
Sub-Programme 1.2: Environmental Health Services
Economic Classification Estimates 2020/21 Projected Estimates 2021/22
Projected Estimates 2022/23
Current Expenditure 6,162,200 6,470,310 6,793,826
Compensation to Employees 6,162,200 6,470,310 6,793,826
Use of Goods and Services - - -
Current Transfers to Govt. Agencies - - -
Capital Expenditure 3,400,000 3,570,000 3,748,500
Acquisition of Non-Financial Assets 3,400,000 3,570,000 3,748,500
Capital Grants to Govt. Agencies - - -
Other Development - - -
Total Expenditure for SP1.2 9,562,200 10,040,310 10,542,326
Sub-Programme 1.3: Health Promotion and Disease Control
Economic Classification Estimates 2020/21 Projected Estimates 2021/22
Projected Estimates 2022/23
Current Expenditure 206,074,662 216,378,395 227,197,315
Compensation to Employees 197,158,637 207,016,569 217,367,397
Use of Goods and Services 8,916,025 9,361,826 9,829,918
Current Transfers to Govt. Agencies - - -
Capital Expenditure 60,389,656 63,409,139 66,579,596
Acquisition of Non-Financial Assets - - -
Capital Grants to Govt. Agencies 60,389,656 63,409,139 66,579,596
Other Development - - -
Total Expenditure for SP1.3 266,464,318 279,787,534 293,776,911
Sub-Programme 1.4: HIV and AIDS Support Services
Economic Classification Estimates 2020/21 Projected Estimates 2021/22
Projected Estimates 2022/23
91 | P a g e
Current Expenditure 1,300,000 1,365,000 1,433,250
Compensation to Employees - - -
Use of Goods and Services 1,300,000 1,365,000 1,433,250
Current Transfers to Govt. Agencies - - -
Capital Expenditure
Acquisition of Non-Financial Assets - - -
Capital Grants to Govt. Agencies - - -
Other Development - - -
Total Expenditure for SP1.4 1,300,000 1,365,000 1,433,250
Sub-Programme 1.5: Nutrition Services
Economic Classification Estimates 2020/21 Projected Estimates 2021/22
Projected Estimates 2022/23
Current Expenditure 800,000 840,000 882,000
Compensation to Employees - - -
Use of Goods and Services 800,000 840,000 882,000
Current Transfers to Govt. Agencies - - -
Capital Expenditure - - -
Acquisition of Non-Financial Assets - - -
Capital Grants to Govt. Agencies - - -
Other Development - - -
Total Expenditure for SP1.5 800,000 840,000 882,000
Sub-Programme 1.6: Reproductive Maternal and Child Health Services
Economic Classification Estimates 2020/21 Projected Estimates 2021/22
Projected Estimates 2022/23
Current Expenditure 900000 945000 992250
Compensation to Employees - - -
Use of Goods and Services 900,000 945,000 992,250
Current Transfers to Govt. Agencies - - -
Capital Expenditure - - -
Acquisition of Non-Financial Assets - - -
Capital Grants to Govt. Agencies - - -
Other Development - - -
Total Expenditure for SP 1.6 900,000 945,000 992,250
Grand Total 280,946,518 294,993,844 309,743,537
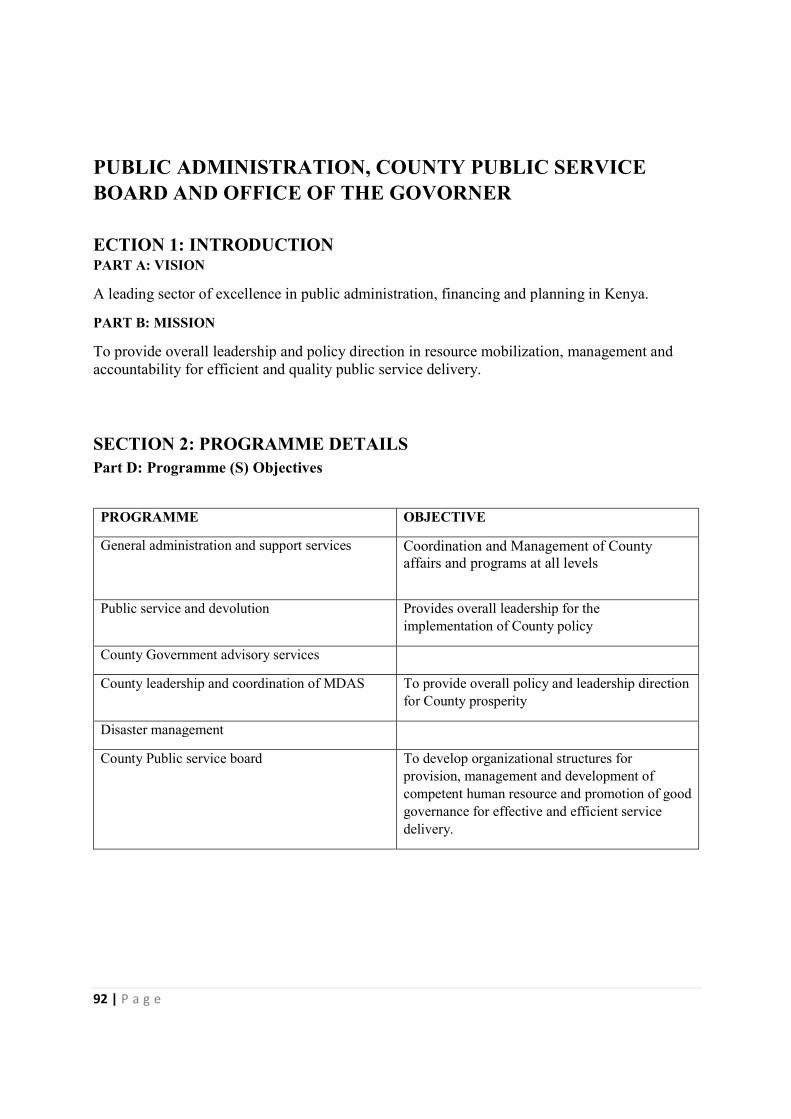
92 | P a g e
PUBLIC ADMINISTRATION, COUNTY PUBLIC SERVICE BOARD AND OFFICE OF THE GOVORNER
ECTION 1: INTRODUCTION PART A: VISION
A leading sector of excellence in public administration, financing and planning in Kenya.
PART B: MISSION
To provide overall leadership and policy direction in resource mobilization, management and accountability for efficient and quality public service delivery.
SECTION 2: PROGRAMME DETAILS Part D: Programme (S) Objectives
PROGRAMME OBJECTIVE
General administration and support services Coordination and Management of County affairs and programs at all levels
Public service and devolution Provides overall leadership for the implementation of County policy
County Government advisory services
County leadership and coordination of MDAS To provide overall policy and leadership direction for County prosperity
Disaster management
County Public service board To develop organizational structures for provision, management and development of competent human resource and promotion of good governance for effective and efficient service delivery.

93 | P a g e
Part E: Summary of Programme Outputs and Performance Indicators
Programme 1: General administration, planning and support services Outcome: Efficient and effective Public service delivery Sub Programme 1.1: General administration and support services Delivery Unit Key Output (KO) Key Performance Indicators
(KPIs) Targets 2020/21 Targets 2021/2022 Targets 2022/2023
Public service and devolution
Efficiency and effectiveness of Government Processes and Programmes
Procedure manual 1 1 1
Public service and devolution
Project management and reporting
Number of reports 12 12 12
Public service and devolution
Performance management
Number of staff appraised 2500 3000 3000
Office of the governor Improved intergovernmental relations
Number of consultation and joint meetings
10 10 10
Office of the governor National day celebrations
Number of celebrations 4 4 4
Programme 1: General administration, planning and support services Outcome: Efficient and effective Public service delivery Sub Programme 1.2: Sub County administration and field services Delivery Unit Key Output (KO) Key Performance Indicators
(KPIs) Targets 2020/2021 Targets 2021/2022 Targets 2022/2023
Public service and devolution
Projecting management and reporting
Quarterly reports 4 4 4
Public service and devolution
Improved feedback to the community
Number of public awareness forums
15 15 15

94 | P a g e
Public service and devolution
Improved coordination of field activities
Number of staff meeting at the sub county and ward level
100 100 100
Public service and devolution
Improved access to services
Number of wards with offices 15 15 15
Public service and devolution
Increased public participation
Number of public participation forums
60 75 100
Programme 1: General administration, planning and support services Outcome: Efficient and effective Public service delivery Sub Programme 1.3: Coordination and supervisory services Delivery Unit Key Output (KO) Key Performance Indicators
(KPIs) Targets 2020/2021 Targets 2021/2022 Targets 2022/2023
Office of the governor Improved coordination among county departments
Number of sector meetings 32 32 32
Office of the governor Project initiation and commissioning
Number of projects initiated and commissioned
200 200 150
Office of the county secretary
Policy coordination and review
Number of policies reviewed 5 5 5
Office of the county secretary
Allocation of departmental roles and responsibities
Cabinet memo 1 1 1
Office of the county secretary
Performance of CECs/Cos
Number of officers appraised 22 22 22
Programme 1: General administration, planning and support services Outcome: Efficient and effective Public service delivery Sub Programme 1.3: Management of county affairs Delivery Unit Key Output (KO) Key Performance Indicators
(KPIs) Targets 2020/2021 Targets 2021/2022 Targets 2022/2023
Office of the governor Improved policy and program coordination
Number of policy directions 20 20 20

95 | P a g e
Office of the governor Policy and legislative approval
Number of legislation signed 10 10 10
Office of the county secretary
Cabinet meetings Number of cabinet meetings 12 12 12
Programme 2: County government advisory services Outcome: Sub Programme 2.1: Communication and strategy Delivery Unit Key Output (KO) Key Performance Indicators
(KPIs) Targets 2020/2021 Targets 2021/2022 Targets 2022/2023
Communication unit Public awareness Number of brief 15 15 15
Communication unit Community feedback
% response to public inquiries 95% 95% 95%
Programme 3: County leadership and coordination of MDAS Outcome: Efficient and effective Public service delivery Sub Programme 3.1: Public sector advisory services Delivery Unit Key Output (KO) Key Performance Indicators
(KPIs) Targets 2020/2021 Targets 2021/2022 Targets 2022/2023
Legal affairs Legal representation Number of cases handled 20 15 10
Legal affairs Legal advice to government agencies
Number of opinions provided 25 25 25
Service delivery unit Project monitoring and reporting
Number of reports 4 4 4
Service delivery unit Policy guidance Number of policy briefs 5 5 5
Programme 4: Disaster management Outcome: Disaster preparedness and mitigation Sub Programme 4.1: Disaster management Delivery Unit Key Output (KO) Key Performance Indicators
(KPIs) Targets 2020/2021 Targets 2021/2022 Targets 2022/2023
Disaster management unit Contingency planning
Approved contingency plan 1 1 1
Disaster management unit Disaster risk reduction
Number of sector assessments reports
12 12 12

96 | P a g e
Disaster management unit Improved public awareness
Number of forums 15 15 15
Disaster management unit Provision of fire services
Number of fire incidents responded to
100% 100% 100%
Disaster management unit Well-equipped fire department
Number of operational fire engines
3 4 4
Programme 5: County Public service board services Outcome: Sub Programme 5.1: General administration and support services Delivery Unit Key Output (KO) Key Performance Indicators
(KPIs) Targets 2020/2021 Targets 2021/2022 Targets 2022/2023
County Public service board
Staff training and capacity building
Number trained 1000 1500 1500
County Public service board
Vacancies filled Number hired 200 150 150
County Public service board
Staff establishment Number of departments with approved establishment
14 14 14
County Public service board
Service scheme implementation
Number of schemes implemented
30 30 30

97 | P a g e
Part F: Summary of Expenditure by Programmes, 2020/2021-2022/2023
PROGRAMME BUDGET 2019/20
Estimates 2020/21
Projection 2021/2022
Projection 2022/2023
General administration, planning and support services
131,910,789 263,429,734 276,601,221 290,431,282
Coordination and supervisory services
21,175,250 13,290,000 13,954,500 14,652,225
Management of county affairs
101,950,320 109,442,642 114,914,774 120,660,513
Communication and strategy
11,544,500 15,050,000 15,802,500 16,592,625
County leadership and coordination of MDAS
6,316,241 6,020,400 6,321,420 6,637,491
Disaster management 2,370,267 1,900,000 1,995,000 2,094,750
County Public service board services
21,607,854 22,762,798 23,900,938 25,095,985
Total Expenditure 296,875,221 431,895,574 453,490,353 476,164,870
Part G: Summary of Expenditure by Vote and Economic Classification, 2020/21-2022/2023
Economic Classification
Budget 2019/20 Estimates 2020/2021
Projections 2021/2022
Projections 2022/2023
Public service , devolution and disaster management
Current Expenditure 149,730,789 269,529,734 283,006,221 297,156,532
Compensation to Employees 76,060,789 160,589,534 168,619,011 177,049,961 Use of Goods and Services 33,670,000 28,940,200 30,387,210 31,906,571 Social Benefits 40,000,000 80,000,000 84,000,000 88,200,000 Capital Expenditure 0 0 0 0
Acquisition of Non-Financial Assets
0 0 0 0
Capital Grants to Govt. Agencies
0 0 0 0
Other Development 0 0 0 0
Total Expenditure 149,730,789 269,529,734 283,006,221 297,156,532
office of the Governor
Current Expenditure 146,605,235 140,803,042 147,843,194 155,235,354
Compensation to Employees 62,636,343 50,466,991 52,990,341 55,639,858 Use of Goods and Services 80,798,978 87,836,051 92,227,854 96,839,246 Current Transfers to Govt. Agencies 3,169,914 2,500,000 2,625,000 2,756,250 Capital Expenditure 611,682 3,000,000 3,150,000 3,307,500
Acquisition of Non-Financial Assets 611,682 3,000,000 3,150,000 3,307,500 Capital Grants to Govt. Agencies
0 0 0 0

98 | P a g e
Other Development 0 0 0 0
Total Expenditure 147,216,917 143,803,042 150,993,194 158,542,854
County public service board
Current Expenditure 15,545,433 21,812,798 22,903,438 24,048,610
Compensation to Employees 9,395,183 12,542,798 13,169,938 13,828,435 Use of Goods and Services 6,150,250 9,270,000 9,733,500 10,220,175 Current Transfers to Govt. Agencies
0 0 0 0
Capital Expenditure 350,000 950,000 997,500 1,047,375
Acquisition of Non-Financial Assets 350,000 950,000 997,500 1,047,375 Capital Grants to Govt. Agencies
0 0 0 0
Other Development 0 0 0 0
Total Expenditure 15,895,433 22,762,798 23,900,938 25,095,985
Grand Total 312,843,139 436,095,574 457,900,353 480,795,370
Part H: Summary of expenditure by Programme, Sub-Programme and Economic Classification, 2020/21-2022/2023
Programme 1: General administration, planning and support services Sub-Programme 1.1: General administration and support services Economic Classification Estimates
2020/2021 Projection 2021/2022
Projection 2022/2023
Current Expenditure 264,329,734 277,551,221 291,381,282 Compensation to Employees 160,589,534 168,619,011 177,049,961 Use of Goods and Services 23,740,200 24,932,210 26,131,321 Social Benefits 80,000,000 84,000,000 88,200,000 Current Transfers to Govt. Agencies - - - Capital Expenditure - - - Acquisition of Non-Financial Assets - - - Capital Grants to Govt. Agencies - - - Other Development - - - Total Expenditure for SP1.1 264,329,734 277,551,221 291,381,282 Programme 1: General administration, planning and support services
Sub-Programme 1.2: Sub county administration and field services
Economic Classification Estimates 2020/2021
Projection 2021/2022
Projection 2022/2023
Current Expenditure 3,300,000 3,465,000 3,638,250 Compensation to Employees - - - Use of Goods and Services 3,300,000 3,465,000 3,638,250 Current Transfers to Govt. Agencies - - - Capital Expenditure - - - Acquisition of Non-Financial Assets - - -

99 | P a g e
Capital Grants to Govt. Agencies - - - Other Development - - - Total Expenditure for SP1.2 3,300,000 3,465,000 3,638,250 Programme 1: General administration, planning and support services
Sub-Programme 1.3: Coordination and supervisory services
Economic Classification Estimates 2020/2021
Projection 2021/2022
Projection 2022/2023
Current Expenditure 13,290,000 13,954,500 14,652,225 Compensation to Employees - - - Use of Goods and Services 13,290,000 13,954,500 14,652,225 Current Transfers to Govt. Agencies - - - Capital Expenditure - - - Acquisition of Non-Financial Assets - - - Capital Grants to Govt. Agencies - - - Other Development - - - Total Expenditure for SP1.1 13,290,000 13,954,500 14,652,225 Programme 1: General administration, planning and support services
Sub-Programme 1.4: Management of County affairs
Economic Classification Estimates 2020/2021
Projection 2021/2022
Projection 2022/2023
Current Expenditure 106,442,642 111,764,774 117,353,013 Compensation to Employees 50,466,991 52,990,341 55,639,858 Use of Goods and Services 53,475,651 56,149,434 58,956,905 Current Transfers to Govt. Agencies 2,500,000 2,625,000 2,756,250
Capital Expenditure 3,000,000 3,150,000 3,307,500 Acquisition of Non-Financial Assets 3,000,000 3,150,000 3,307,500 Capital Grants to Govt. Agencies - - - Other Development - - - Total Expenditure for SP1.1 109,442,642 114,914,774 120,660,513 Programme 2: County government advisory services
Sub-Programme 2.1: Communication and strategy
Economic Classification Estimates 2020/2021
Projection 2021/2022
Projection 2022/2023
Current Expenditure 15,050,000 15,802,500 16,592,625 Compensation to Employees - - - Use of Goods and Services 15,050,000 15,802,500 16,592,625 Current Transfers to Govt. Agencies - - - Capital Expenditure - - - Acquisition of Non-Financial Assets - - - Capital Grants to Govt. Agencies - - - Other Development - - - Total Expenditure for SP1.1 15,050,000 15,802,500 16,592,625 Programme 3: County leadership and coordination of MDAs
Sub-Programme 3.1: Public sector advisory services
Economic Classification Estimates 2020/2021
Projection 2021/2022
Projection 2022/2023
Current Expenditure 6,020,400 6,321,420 6,637,491 Compensation to Employees - - - Use of Goods and Services 6,020,400 6,321,420 6,637,491 Current Transfers to Govt. Agencies - - - Capital Expenditure - - -

100 | P a g e
Acquisition of Non-Financial Assets - - - Capital Grants to Govt. Agencies - - - Other Development - - -
Total Expenditure for SP1.1 6,020,400 6,321,420 6,637,491 Programme 4: Disaster management
Sub-Programme 4.1: disaster management
Economic Classification Estimates 2020/2021
Projection 2021/2022
Projection 2022/2023
Current Expenditure 1,900,000 1,995,000 2,094,750 Compensation to Employees - - - Use of Goods and Services 1,900,000 1,995,000 2,094,750 Current Transfers to Govt. Agencies - - - Capital Expenditure - - - Acquisition of Non-Financial Assets - - - Capital Grants to Govt. Agencies - - - Other Development - - -
Total Expenditure for SP1.1 1,900,000 1,995,000 2,094,750 Programme 5: County Public service board services
Sub-Programme 5.1: General administration and support services
Economic Classification Estimates 2020/2021
Projection 2021/2022
Projection 2022/2023
Current Expenditure 22,762,798 23,900,938 25,095,985 Compensation to Employees 12,542,798 13,169,938 13,828,435 Use of Goods and Services 9,270,000 9,733,500 10,220,175 Current Transfers to Govt. Agencies 950,000 997,500 1,047,375 Capital Expenditure - - - Acquisition of Non-Financial Assets - - - Capital Grants to Govt. Agencies - - - Other Development - - - Total Expenditure for SP1.1 22,762,798 23,900,938 25,095,985 Grand Total 436,095,574 457,905,353 480,753,120

101 | P a g e
ROADS, INFRASTRUCTURE AND PUBLIC WORKS SECTION 1: INTRODUCTION PART A: VISION
To be the leading provider of efficient and cost-effective infrastructure facilities and services in roads, housing, transport and public works in Kenya.
PART B: MISSION
To provide efficient, affordable and reliable infrastructure in roads, housing and public works through construction, modernization, rehabilitation and effective management for sustainable development.
Part C: Performance Overview and Background On the County Department The department comprises:
Public works and housing
Roads
The department ceiling as provided by the CFSP and attributed to the further development of
county tarmac roads, opening, maintenance, and expansion of various ward roads. Furthermore,
the department successfully procured equipment for the works mentioned, which would
significantly reduce the county’s cost of leasing equipment.
However, with unpredictable weather patterns, an increased need to fast track county projects and
ensure quality, more investments in infrastructure will be required. The county remains committed
to bringing infrastructural development through promoting the increase of classified roads through
strategic partnerships with KenHa and KeRRA.
Key Achievements Increased number of kilometers that were graded and graveled
Opening and expansion of various ward roads strategically linking towns to public
amenities that enhance the livelihoods of residents.
Increased number of kilometers with low volume seal roads in the county such as those
tarmacked through low volume seal technology in Chuka, Chogoria town roads and
Kathwana municipality and other roads in process of tarmacking include Tunyai-
Nthaara road, Mitheru - Kaanwa road, Kambandi-Chera-Ruguti road.

102 | P a g e
Challenges o Insufficient funding for completion of various projects
o High cost of fuel led to increase in unforeseen expense of expanding the road network
and classifying roads, limiting the number of graveled roads.
o Expense of upgrading previous works redirected funds intended for other activities. For
example, the opportunity cost of expanding the road network to that of maintaining
existing roads.
o Delays in resolving disputes, property titles and political issues hindering long term
investment in the county.
o Encroachment of road reserves and insufficient public participation fora specifically
dedicated to the infrastructure agenda. Inadequate staff levels which needs to be
enhanced in terms of number and professional development.
Going Forward The department projects are in terms of priority to enhance economic development for spur
development in the County
The government’s agenda to increase access across the county and increase the rural access will
drive a significant portion of development projects going forward. Enhancing the staff of existing
and new staff to fulfil this agenda is expected to resume in subsequent fiscal years despite a
dynamic and challenging economic environment.
SECTION 2: PROGRAMME DETAILS
Part D: Programme (S) Objectives
PROGRAMME OBJECTIVE
Programme 1: Roads and transport Boost trade and connectivity
Programme 2: Public works and housing
To offer technical services on building and construction field to all sub sectors
Programme 3: General Administration Planning and Support Services
Provide planning and support services and County Government Capacity Development

103 | P a g e
ICT Infrastructure Development To enhance connectivity in the county; enable fast information access, resource sharing and fast service delivery
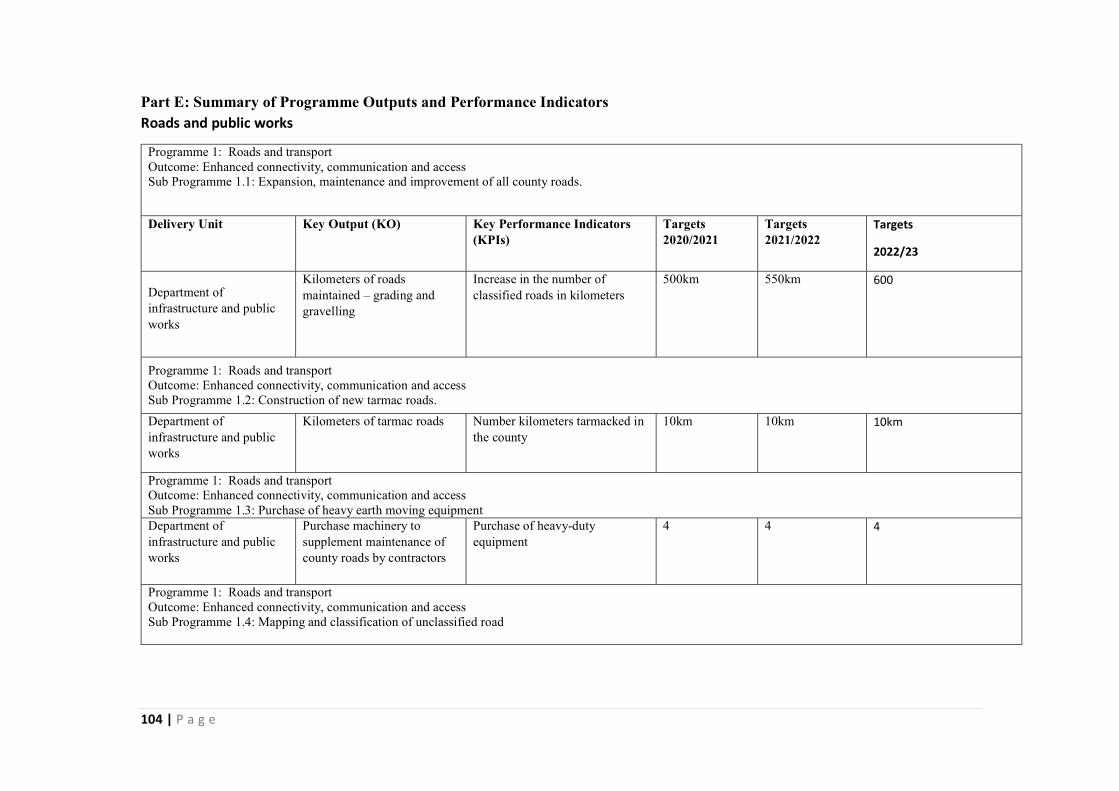
104 | P a g e
Part E: Summary of Programme Outputs and Performance Indicators Roads and public works
Programme 1: Roads and transport Outcome: Enhanced connectivity, communication and access Sub Programme 1.1: Expansion, maintenance and improvement of all county roads.
Delivery Unit Key Output (KO) Key Performance Indicators (KPIs)
Targets 2020/2021
Targets 2021/2022
Targets
2022/23
Department of infrastructure and public works
Kilometers of roads maintained – grading and gravelling
Increase in the number of classified roads in kilometers
500km 550km 600
Programme 1: Roads and transport Outcome: Enhanced connectivity, communication and access Sub Programme 1.2: Construction of new tarmac roads.
Department of infrastructure and public works
Kilometers of tarmac roads Number kilometers tarmacked in the county
10km 10km 10km
Programme 1: Roads and transport Outcome: Enhanced connectivity, communication and access Sub Programme 1.3: Purchase of heavy earth moving equipment Department of infrastructure and public works
Purchase machinery to supplement maintenance of county roads by contractors
Purchase of heavy-duty equipment
4 4 4
Programme 1: Roads and transport Outcome: Enhanced connectivity, communication and access Sub Programme 1.4: Mapping and classification of unclassified road

105 | P a g e
Department of infrastructure and public works
Number of kilometers classified and mapped
No. of km mapped and classified 448 km 692km 916km
Programme 1: Roads and transport Outcome: Enhanced connectivity, communication and access Sub Programme 1.5: Improved drainage and access Department of infrastructure and public works
Number of bridges constructed
Number of bridges constructed in inaccessible areas.
13 23 34
Number of culverts constructed
Number of culverts built
2000m 3000m 4000m
Programme 2: Public works and housing Outcome: Effective and efficient information management and service delivery Sub Programme 2.1: Public Works, housing services, development and human settlement Delivery Unit Key Output (KO) Key Performance Indicators
(KPIs) Targets 2020/2021
Targets 2021/2022
Targets 2022/23
Department of roads and public works
Number of approved drawings
Approved buildings and commercial construction sites in the county
All plans for new buildings
All plans for new buildings
All plans for new buildings
County HQ Completion County HQ Complete 100% - -
Programme 3: General Administration Planning and Support Services Outcome: effective and efficient planning, service delivery and well equipped staff Sub Programme 3.1: General Administration Planning and Support Services
Delivery Unit Key Output (KO) Key Performance Indicators (KPIs)
Targets 2020/2021
Targets 2021/2022
Targets 2022/23
Staff compensation and capacity building(taking them to different courses and trainings)
Staff compensation and capacity building(taking them to different courses and trainings)
Staff compensation and capacity building(taking them to different courses and trainings)
100 % Staff compensation and capacity building(taking them to different courses and trainings)
100% Staff compensation and capacity building(taking them to different courses and trainings)
100% Staff compensation and capacity building(taking them to different courses and trainings)
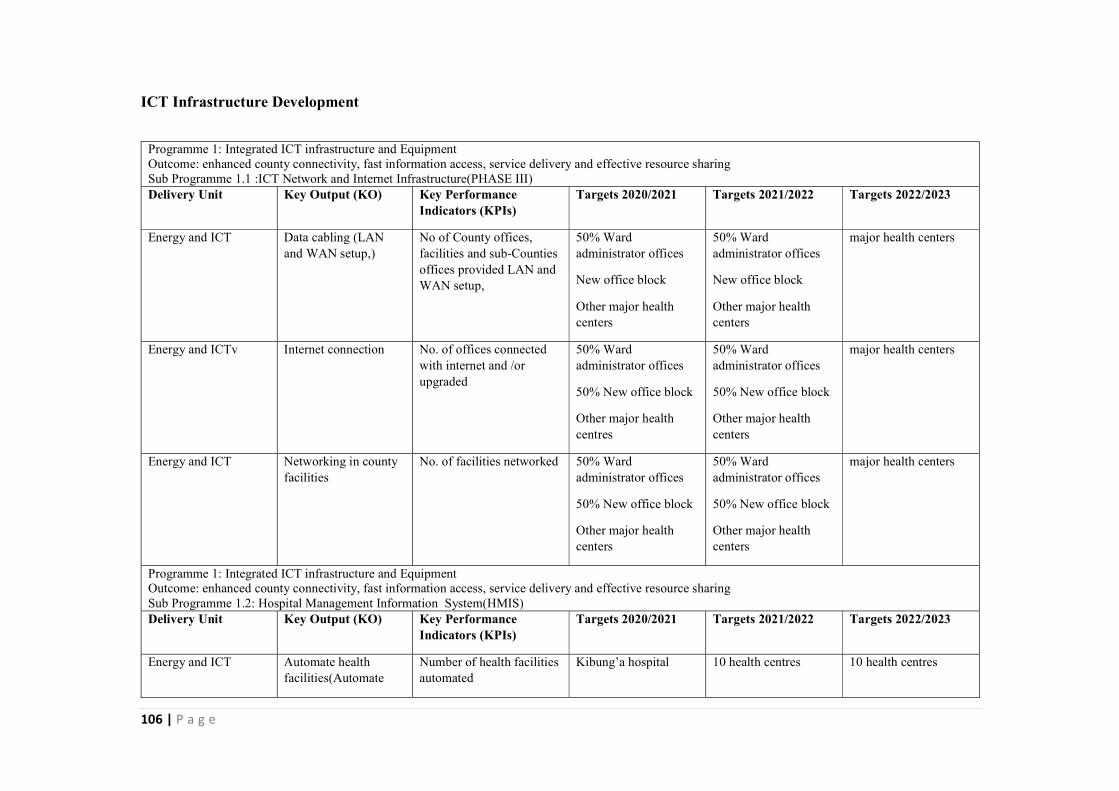
106 | P a g e
ICT Infrastructure Development
Programme 1: Integrated ICT infrastructure and Equipment Outcome: enhanced county connectivity, fast information access, service delivery and effective resource sharing Sub Programme 1.1 :ICT Network and Internet Infrastructure(PHASE III) Delivery Unit Key Output (KO) Key Performance
Indicators (KPIs) Targets 2020/2021 Targets 2021/2022 Targets 2022/2023
Energy and ICT Data cabling (LAN and WAN setup,)
No of County offices, facilities and sub-Counties offices provided LAN and WAN setup,
50% Ward administrator offices
New office block
Other major health centers
50% Ward administrator offices
New office block
Other major health centers
major health centers
Energy and ICTv Internet connection
No. of offices connected with internet and /or upgraded
50% Ward administrator offices
50% New office block
Other major health centres
50% Ward administrator offices
50% New office block
Other major health centers
major health centers
Energy and ICT Networking in county facilities
No. of facilities networked 50% Ward administrator offices
50% New office block
Other major health centers
50% Ward administrator offices
50% New office block
Other major health centers
major health centers
Programme 1: Integrated ICT infrastructure and Equipment Outcome: enhanced county connectivity, fast information access, service delivery and effective resource sharing Sub Programme 1.2: Hospital Management Information System(HMIS) Delivery Unit Key Output (KO) Key Performance
Indicators (KPIs) Targets 2020/2021 Targets 2021/2022 Targets 2022/2023
Energy and ICT Automate health facilities(Automate
Number of health facilities automated
Kibung’a hospital 10 health centres 10 health centres
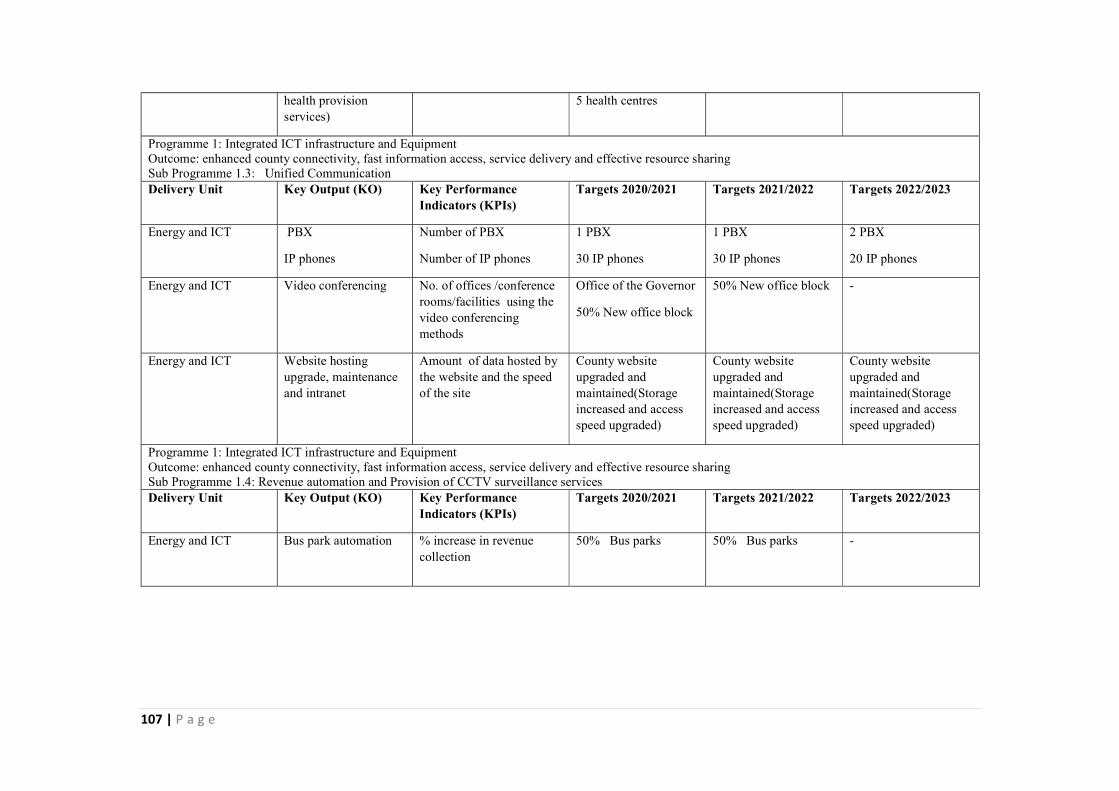
107 | P a g e
health provision services)
5 health centres
Programme 1: Integrated ICT infrastructure and Equipment Outcome: enhanced county connectivity, fast information access, service delivery and effective resource sharing Sub Programme 1.3: Unified Communication Delivery Unit Key Output (KO) Key Performance
Indicators (KPIs) Targets 2020/2021 Targets 2021/2022 Targets 2022/2023
Energy and ICT PBX
IP phones
Number of PBX
Number of IP phones
1 PBX
30 IP phones
1 PBX
30 IP phones
2 PBX
20 IP phones
Energy and ICT Video conferencing No. of offices /conference rooms/facilities using the video conferencing methods
Office of the Governor
50% New office block
50% New office block -
Energy and ICT Website hosting upgrade, maintenance and intranet
Amount of data hosted by the website and the speed of the site
County website upgraded and maintained(Storage increased and access speed upgraded)
County website upgraded and maintained(Storage increased and access speed upgraded)
County website upgraded and maintained(Storage increased and access speed upgraded)
Programme 1: Integrated ICT infrastructure and Equipment Outcome: enhanced county connectivity, fast information access, service delivery and effective resource sharing Sub Programme 1.4: Revenue automation and Provision of CCTV surveillance services Delivery Unit Key Output (KO) Key Performance
Indicators (KPIs) Targets 2020/2021 Targets 2021/2022 Targets 2022/2023
Energy and ICT Bus park automation % increase in revenue collection
50% Bus parks
50% Bus parks
-

108 | P a g e
Part F: Summary of Expenditure by Programmes, 2020/2021-2022/2023
Programme Estimates
2019/20 Estimates 2020/21
Projected 2021/22
Projected 2022/23
General Administration 22,170,253
28,840,600
30,282,630
31,796,762
Public Works and Housing services
5,079,500
2,815,000
2,955,750
3,103,538
Roads and Transport Services
26,304,300
435,900,840
457,695,882
480,580,676
P: Housing Development and Human Settlement
-
65,000,000
68,250,000
71,662,500
ICT Infrastructure Development
21,339,105
25,050,000
26,302,500
27,617,625
Total 74,893,158
557,606,440
585,486,762
614,761,100
Part G: Summary of Expenditure by Vote and Economic Classification, 2020/21-2022/2023
Economic Classification Budget 2019/20
Estimates 2020/2021
Projections 2021/2022
Projections 2022/2023
Current Expenditure 47,760,878 105,910,600 111,206,130 116,766,437 Compensation to Employees 14,170,253 28,840,600 30,282,630 31,796,762 Use of Goods and Services 33,590,625 77,070,000 80,923,500 84,969,675 Current Transfers to Govt. Agencies
- - - -
Capital Expenditure 520,202,107 451,695,840 474,280,632 497,994,664 Acquisition of Non-Financial Assets
520,202,107 451,695,840 474,280,632 497,994,664
Capital Grants to Govt. Agencies - - - -
Other Development - - - - Total Expenditure 567,962,985 557,606,440 585,486,762 614,761,100
Part H: Summary of expenditure by Programme, Sub-Programme and Economic Classification, 2020/2021-2022/2023
P 1: General Administration Planning and Support Services
SP 1.1: General Administration Planning and Support Services
Economic Classification Estimates 2020/21
Projected Estimates 2021/22
Projected Estimates 2022/3
Current Expenditure 28,840,600 30,282,630 31,796,762
Compensation to Employees 28,840,600 30,282,630 31,796,762
Use of Goods and Services - - -
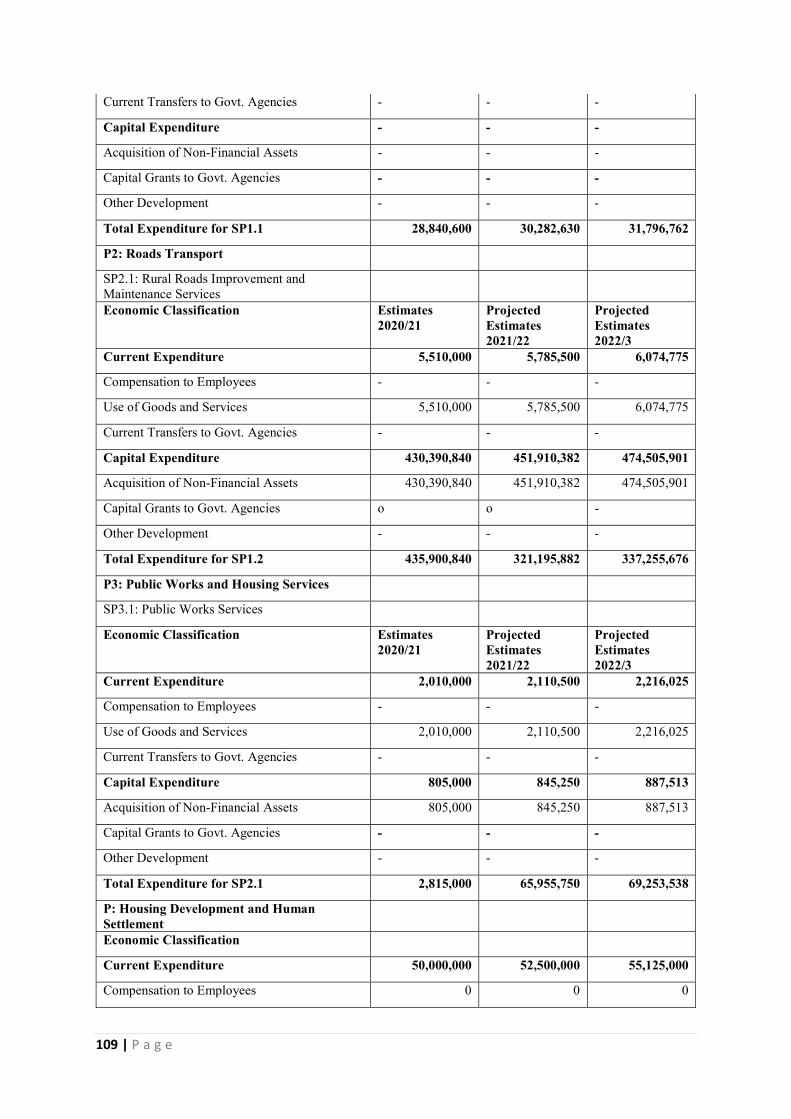
109 | P a g e
Current Transfers to Govt. Agencies - - -
Capital Expenditure - - -
Acquisition of Non-Financial Assets - - -
Capital Grants to Govt. Agencies - - -
Other Development - - -
Total Expenditure for SP1.1 28,840,600 30,282,630 31,796,762
P2: Roads Transport
SP2.1: Rural Roads Improvement and Maintenance Services
Economic Classification Estimates 2020/21
Projected Estimates 2021/22
Projected Estimates 2022/3
Current Expenditure 5,510,000 5,785,500 6,074,775
Compensation to Employees - - -
Use of Goods and Services 5,510,000 5,785,500 6,074,775
Current Transfers to Govt. Agencies - - -
Capital Expenditure 430,390,840 451,910,382 474,505,901
Acquisition of Non-Financial Assets 430,390,840 451,910,382 474,505,901
Capital Grants to Govt. Agencies o o -
Other Development - - -
Total Expenditure for SP1.2 435,900,840 321,195,882 337,255,676
P3: Public Works and Housing Services
SP3.1: Public Works Services
Economic Classification Estimates 2020/21
Projected Estimates 2021/22
Projected Estimates 2022/3
Current Expenditure 2,010,000 2,110,500 2,216,025
Compensation to Employees - - -
Use of Goods and Services 2,010,000 2,110,500 2,216,025
Current Transfers to Govt. Agencies - - -
Capital Expenditure 805,000 845,250 887,513
Acquisition of Non-Financial Assets 805,000 845,250 887,513
Capital Grants to Govt. Agencies - - -
Other Development - - -
Total Expenditure for SP2.1 2,815,000 65,955,750 69,253,538
P: Housing Development and Human Settlement
Economic Classification
Current Expenditure 50,000,000 52,500,000 55,125,000
Compensation to Employees 0 0 0

110 | P a g e
Use of Goods and Services 50,000,000 52,500,000 55,125,000
Current Transfers to Govt. Agencies 0 0 0
Capital Expenditure 15,000,000 15,750,000 16,537,500
Acquisition of Non-Financial Assets 15,000,000 15,750,000 16,537,500
Capital Grants to Govt. Agencies
Other Development
Total Expenditure for SP2.1 65,000,000
P: ICT Infrastructure Development
Economic Classification
Current Expenditure 19,550,000 20,527,500 21,553,875
Compensation to Employees
Use of Goods and Services 19,550,000 20,527,500 21,553,875
Current Transfers to Govt. Agencies
Capital Expenditure 5,500,000 5,775,000 6,063,750
Acquisition of Non-Financial Assets 5,500,000 5,775,000 6,063,750
Capital Grants to Govt. Agencies
Other Development
Total Expenditure for SP2.1 25,050,000
TOTAL 557,606,440 417,434,262 438,305,976

111 | P a g e
TRADE AND REVENUE
SECTION 1: INTRODUCTION PART A: VISION: A vibrant entrepreneurial and commercialized county economy in Kenya
PART B: MISSION: To promote, coordinate and implement integrated policies and programmes
in trade and industry, tourism, and cooperatives for rapid commercialization of the county
economy.
Part C: Performance Overview and Background On the County Department
ACHIEVEMENTS: The co-operative subsector has regular/annual 1/3 rotational elections that are carried out in all
registered and active co-operative societies. There are about 150 active cooperative societies in the
county. Around 135 elections were carried out in the active societies.
Over 80 per cent of the above societies have continued to hold their AGMs where audited accounts
are presented to members. The 80% have also been running with approved budgets. The budget is
approved in special general meetings held at least three months before the end of each financial
year.
The department carries education and training; member education and information continued to
be carried in all societies’ in general meetings initiated/convened by the societies themselves,
In tourism subsector has rolled out several projects to help create and boost the tourism industry
in the County. The department constructed Nithi and Ura gate Tourism Market. The construction
is complete awaiting furnishing and branding so as they can be operational. On opening, the centres
will act as the county's cultural hub as well as a tourist's information centers. The department also
undertook erection of gantry points in the year 2018 to improve the County image.
The subsector has also supported the celebration of Ura Gate cultural festival in conjunction with
the culture department. This event takes place at the entry point to Meru National park.
Over the 3 years, the hospitality industry has recorded an improved growth with quality
accommodation facilities being established. This has since increased the bed capacity of the

112 | P a g e
county. Mt Kenya Kinondoni Lodge was refurbished alongside upgrading of the access road to the
lodge. This has improved visitation from 700 visitors to averagely 1000 visitors annually.
Industry subsector has various main industries in Tharaka-Nithi; Weru tea factory, Muthiru Dairy
and Tharaka Nithi county Coffee mill. The county has supported the dairy sector by supplying
milk coolers to different groups. Muthiru Dairy is the only cooperative that does milk processing.
They have been plans to start a countywide milk processing plant to merge all the small societies
but the same is yet to be realized. The subsector took part in the county innovations fair held in
February, 2019. The objective of the fair was to identify untapped talents in the county with an
aim of creating small enterprises and startups.
CHALLEGES: In the Co-operative subsector there were no routine or impromptu inspections done as they are
supposed to be initiated by the sub-county co-operative office but the offices had no funds for the
same. Only one inspection was carried out through the initiation of the then director co-operatives
in a coffee cooperative society following complaints by members during the period.
Industry subsector has a need to support other agro-processing industries including banana,
cassava, mangoes and cereals. The county has not done much to support the sector hence there is
a need to double efforts in order to tap the potential in the sector through increased funding.
Going forward: The department needs increased funding in the coming financial year to enable it achieve its goals,
objective and mission.
In the financial year 2018/2019 the department faced many challenges in terms of funding and
some of its major projects re-allocated in other departments i.e projects allocated in trade were
later re-allocated to other department hence making the department loose its core focus.
SECTION 2: PROGRAMME DETAILS Part D: Programme (S) Objectives
Programmes Objective

113 | P a g e
General administration, planning and support
services
To provide efficient support service delivery.
Trade Development and Promotion To promote trade and upgrade market
infrastructures.
Resource mobilisation

114 | P a g e
Part E: Summary of Programme Outputs and Performance Indicators
DELIVERY UNIT Key outputs KPI Key performance indicator.
Target 20/21 Actual 2021/22 Target (2022/21
Industrial parks 3 parks Established Increase in number of parks established.
1 1 1
Development of industries 2 processing factories Increase in number of processing factories.
1 0 1
Development of industries 10 feasibility studies done % increase in feasibility studies.
3 4 3
Tourism development, promotion
3 tourism markets established
Increase in number of tourism markets.
1 0 0
Tourism development, promotion
1 cultural Centre established
Increase in number cultural centre established.
1 0 0
Tourism development, promotion
20 tourist sites mapped and profiled
Increase in number of tourist sites mapped.
0 0 0
Tourism development, promotion
rehabilitation of 1 lodge % Increase in rehabilitation lodges
1 0 0
Tourism development, promotion
1 cycling route Increase in number of cycling route.
1 0 0
Tourism development, promotion
5 zip lines established % increase in line established,
2 2 1
Tourism development, promotion
10 cable cars introduced Increase in number of cable cars introduced
3 3 4
Tourism development, promotion
1 agro-tourism centre % increase in agro-tourism centre.
1 0 0

115 | P a g e
Tourism development, promotion
10 homestays established Increase I number of homestays
3 3 4
Tourism Promotion and marketing
1 tourism documentary % increase in tourism documentary.
1 0 0
Tourism Promotion and marketing
15 road signs and billboards
% Increase road signs and billboards.
5 5 2
Tourism Promotion and marketing
5 tourism conferences held
% Increase in tourism conference held
1 1 1
Tourism Promotion and marketing
2 County tourism guides Increase in number of county tourism guides.
1 0 1
Cooperative development Renovation and fencing of co-operative offices
% increase in Renovation and fencing of co-operative office.
1 0 0
Cooperative development 53 coffee factories digitalized
Increase in number of digitalized factories.
17 18 18
Cooperative development Members education day(M.E.Ds)
% increase in member education days
113 113 113
Cooperative development Committee member education day(C.M.E.Ds)
% increase in committee member education day
113 113 113
Cooperative development Members Education tours(M.E.Ts)
% increase in Members Education tours
113 113 113
Cooperative development Committee member education tours (C.M.E.Ts)
% increase in committee member education tours.
113 113 113
Cooperative development Co-operatives Staff seminars
Increase in number of co-operative staff seminars
16 16 18

116 | P a g e
Cooperative development 53Installation of metallic drying tables
Increase in number of metallic drying tables.
17 18 18
Cooperative development 53 installation of eco pulpers
Increase in number of eco puplpers
17 18 18
Cooperative development provision of Moisture content meters.
% increase in moisture content meters
18 17 18
Cooperative development Installation of one coffee roasting and packaging equipment.
Increase in number of coffee roasting and packaging equipment.
0 0 0
Cooperative development The building of one warehouse and capping Centre
Increase in number of warehouse and capping center
1 0 0
Cooperative development Construction of one dairy processing unit
Increase in number of dairy processing unit
0 0 0
Cooperative development Installation of 3 cereal sorting and packaging machine
Increasing in number of cereal sorting and packaging machine
1 2 0
Cooperative development 3 products branded % increase in products branded
0 3 0
Cooperative development Formulation of policies % increase in formulation policies.
5 5 5

117 | P a g e
Part F: Summary of Expenditure by Programmes, 2020/2021-2022/2023
PROGRAMME BUDGET 2019/20
Estimates 2020/21
Projection 2021/2022
Projection 2022/2023
P: General Administration, Planning and Support Services
89,702,963
89,891,802
94,386,392
99,105,712
SP: General Administration and Support Services
89,702,963
89,891,802
94,386,392
99,105,712
P: Trade Development and promotion 7,584,880
12,748,000
13,385,400
14,054,670
SP: Consumer Protection & Fair Trade Practices
4,609,234
2,975,000
3,123,750
3,279,938
SP: Consumer Protection (Alcohol Licencing )
2,975,646
9,773,000
10,261,650
10,774,733
P: Resource mobilisation 4,771,118
12,441,000
13,063,050
13,716,203
SP: Revenue Administration 4,771,118
12,441,000
13,063,050
13,716,203
Total Expenditure By Programme 102,058,961 115,080,802 120,834,842 126,876,584
Part G: Summary of Expenditure by Vote and Economic Classification, 2020/21-2022/2023
Economic Classification Budget 2019/20 Estimates 2020/2021
Projections 2021/2022
Projections 2022/2023
Current Expenditure 102,058,961 111,080,802 116,634,842 122,466,584
Compensation to Employees 86,501,803 86,501,802 90,826,892 95,368,237
Use of Goods and Services 15,557,158 24,579,000 25,807,950 27,098,348
Current Transfers to Govt. Agencies
- - - -
Total Current Expenditure 0 4,000,000 4,200,000 4,410,000
Acquisition of Non-Financial Assets
- 4,000,000 4,200,000 4,410,000
Capital Grants to Govt. Agencies - - - -
Other Development - - - -
Total Capital Expenditure 102,058,961 115,080,802 120,834,842 126,876,584
Part H: Summary of expenditure by Programme, Sub-Programme and Economic Classification, 2020/21-2022/2023
P: General Administration, Planning and Support Services

118 | P a g e
SP: General Administration and Support Services
Economic Classification Estimates 2020/2021
Projections 2021/2022
Projections 2022/2023
Current Expenditure 89,891,802 94,386,392 99,105,712
Compensation to Employees 86,501,802 90,826,892 95,368,237
Use of Goods and Services 3,390,000 3,559,500 3,737,475
Current Transfers to Govt. Agencies - - -
Capital Expenditure - - -
Acquisition of Non-Financial Assets - - -
Capital Grants to Govt. Agencies - - -
Other Development - - -
Total Expenditure for SP1.1 89,891,802 94,386,392 99,105,712
P: Trade Development and promotion
SP: Consumer Protection & Fair Trade Practices
Economic Classification Estimates 2020/2021
Projections 2021/2022
Projections 2022/2023
Current Expenditure 2,975,000 3,123,750 3,279,938
Compensation to Employees - - -
Use of Goods and Services 2,975,000 3,123,750 3,279,938
Current Transfers to Govt. Agencies - - -
Capital Expenditure - - -
Acquisition of Non-Financial Assets - - -
Capital Grants to Govt. Agencies - - -
Other Development - - -
Total Expenditure for SP 1.6 2,975,000 3,123,750 3,279,938
P: Trade Development and promotion
SP: Consumer Protection (Alcohol Licencing )
Economic Classification Estimates 2020/2021
Projections 2021/2022
Projections 2022/2023
Current Expenditure 8,773,000 9,211,650 9,672,233
Compensation to Employees - - -
Use of Goods and Services 8,773,000 9,211,650 9,672,233
Current Transfers to Govt. Agencies - - -

119 | P a g e
Capital Expenditure 1,000,000
Acquisition of Non-Financial Assets 1,000,000 1,050,000 1,102,500
Capital Grants to Govt. Agencies - - -
Other Development - - -
Total Expenditure for SP 1.6 9,773,000 9,211,650 9,672,233
P: Resource mobilisation
SP: Revenue Administration
Economic Classification Estimates 2020/2021
Projections 2021/2022
Projections 2022/2023
Current Expenditure 9,441,000 9,913,050 10,408,703
Compensation to Employees - - -
Use of Goods and Services 9,441,000 9,913,050 10,408,703
Current Transfers to Govt. Agencies - - -
Capital Expenditure 3,000,000 1,075,500 1,129,275
Acquisition of Non-Financial Assets 3,000,000 3,150,000 3,307,500
Capital Grants to Govt. Agencies - - -
Other Development - - -
Total Expenditure for SP 1.6 12,441,000 10,988,550 11,537,978
Grand Total 115,080,802 117,710,342 123,595,859
Copyright © 2022 FDOKUMEN