
Thank you. Very truly yours, ATTY. JOSELITO V. BANAAG ...
332
UnionBank Plaza, Meralco Avenue cor OnLJdž & Sapphire Roads Ortigas Center Pasig CitLJ ϭϲϬϱ unionbankph.com July 9, 2021 THE PHILIPPINE STOCK EXCHANGE, INC. 6 th Floor, PSE Tower 28 th Street corner 5 th Avenue Bonifacio Global City, Taguig City Attention: MS. JANET A. ENCARNACION Head, Disclosure Department PHILIPPINE DEALING AND EXCHANGE CORP. 29/F BDO Equitable Tower 8751 Paseo de Roxas, Makati City Attention: ATTY. MARIE ROSE M. MAGALLEN-LIRIO Head, Issuer Compliance and Disclosure Department Gentlemen: Pursuant Section 20 of the Securities Regulation Code, we are transmitting herewith the Preliminary Information Statement (SEC Form 20-IS) of Union Bank of the Philippines subject to comments and approval of the Securities and Exchange Commission. Thank you. Very truly yours, ATTY. JOSELITO V. BANAAG Senior Vice-President, General Counsel & Corporate Secretary
-
Upload
khangminh22 -
Category
Documents
-
view
0 -
download
0
Transcript of Thank you. Very truly yours, ATTY. JOSELITO V. BANAAG ...

UnionBank Plaza, Meralco Avenue cor On
& Sapphire Roads Ortigas Center Pasig Cit
unionbankph.com
July 9, 2021 THE PHILIPPINE STOCK EXCHANGE, INC. 6th Floor, PSE Tower 28th Street corner 5th Avenue Bonifacio Global City, Taguig City Attention: MS. JANET A. ENCARNACION Head, Disclosure Department
PHILIPPINE DEALING AND EXCHANGE CORP. 29/F BDO Equitable Tower 8751 Paseo de Roxas, Makati City Attention: ATTY. MARIE ROSE M. MAGALLEN-LIRIO Head, Issuer Compliance and Disclosure Department Gentlemen:
Pursuant Section 20 of the Securities Regulation Code, we are transmitting herewith the Preliminary Information Statement (SEC Form 20-IS) of Union Bank of the Philippines subject to comments and approval of the Securities and Exchange Commission. Thank you. Very truly yours, ATTY. JOSELITO V. BANAAG Senior Vice-President, General Counsel & Corporate Secretary


UnionBank Plaza, Meralco Avenue cor Onyx & Sapphire Roads Ortigas Center Pasig City
unionbankph.com
PROXY KNOW ALL MEN BY THESE PRESENTS: That I, the undersigned, a shareholder of UNION BANK OF THE PHILIPPINES (“UnionBank”), do hereby nominate, constitute and appoint the Chairman of the meeting, with power of substitution, as my Attorney and Proxy to represent me and vote all shares registered in my name in the books of UnionBank or owned by me, at the Special Stockholders’ Meeting of UnionBank to be held on Wednesday, 11 August 2021 at 1:00 P.M. by remote communication, as fully to all intents and purposes as I might or could lawfully do if present and acting in person, and hereby ratifying and confirming any and all matters which may properly come before said meeting, or adjournment thereof. In case of the non-attendance of my Attorney and Proxy above-named at said meeting, I hereby authorize and empower the Corporate Secretary to fully exercise all rights as my Attorney or Proxy at said meeting. This Proxy authorizes my Attorney to act among other things on the following matters: (Please read the instruction below) INSTRUCTION: Please check the appropriate column; otherwise, you shall be deemed to have conferred discretionary authority in favor of the Chairman of the meeting, or in his absence, the Corporate Secretary, to vote your shares in favor of the approval of the below matters.
Vote for Approval
Vote Against
Abstain
a. Amendment of Articles of Incorporation on the Increased in Authorized Capital Stock
□ □ □
b. Declaration of 25% Stock Dividends □ □ □ 1. Revocability of Proxy
I have the right to revoke the proxy by participating in the meeting by remote communication and voting in absentia, or by execution of another proxy at a later date, subject to the pertinent requirements of law and SEC Circular No. 5, Series of 1996.
2. Persons Making the Solicitation
1. This solicitation is made solely by the registrant Bank. 2. There are no participants in the solicitation other than by the registrant Bank itself. 3. The solicitation is made through a courier service company, and by registered mail in cases of post office
box addresses. 4. The cost of solicitation will be borne by the registrant Bank.
3. Interest of Certain Persons in Matters to be Acted Upon
There are no substantial interests, by security holdings or otherwise, of UnionBank, any Director or Officer thereof, participant in the solicitation, or associate of any of the foregoing persons, in any matter to be acted upon at the Special Meeting.
The power and authority hereby granted shall remain valid and effective until such time that the same is withdrawn by me through notice in writing delivered to the Corporate Secretary before the date of any such meeting or adjournment(s) thereof. Likewise, the said authority is effective for subsequent annual meetings within a period of five (5) years from the date of this Proxy unless otherwise instructed, as follows:

UnionBank Plaza, Meralco Avenue cor Onyx & Sapphire Roads Ortigas Center Pasig City
unionbankph.com
[ ] THIS PROXY IS TO BE USED ONLY FOR THE 2021 SPECIAL STOCKHOLDERS’ MEETING OF UNIONBANK.
In case the security holder fails to indicate a vote on the matters in the Agenda by placing the corresponding marks on the columns provided therein, the same is considered a waiver of the security holder’s right to manifest his or her vote thereon and management can exercise its discretion in voting on such matters. Important: The Office of the Corporate Secretary must receive this Proxy not later than 30 July 2021. You may also send the scanned copy of this Proxy through e-mail at [email protected].
THIS PROXY IS BEING SOLICITED ON BEHALF OF MANAGEMENT
______________________________ _____________________________ PRINTED NAME OF SHAREHOLDER SIGNATURE OF SHAREHOLDER
Dated this ______ day of ____, 2021 OR AUTHORIZED SIGNATORY


1
Annex “A”
UNION BANK OF THE PHILIPPINES (“UnionBank”)
2021 SPECIAL STOCKHOLDERS’ MEETING
August 11, 2021 at 1:00 P.M.
REQUIREMENTS AND PROCEDURES FOR VOTING ELECTRONICALLY IN ABSENTIA AND
PARTICIPATION THROUGH REMOTE COMMUNICATION I. Electronic Voting or Voting in Absentia
1. Stockholders as of July 9, 2021 (“Record Date”) may exercise their right to vote in the items for approval at the 2021 Special Stockholders’ Meeting (“Special Meeting”) through UnionBank’s secure Annual Stockholders’ Meeting Portal (“ASM Portal”) at https://asm.unionbankph.com. Registration in the ASM Portal and submission of votes to the agenda items for approval is until 9:00 a.m. (Philippine time) of August 11, 2021, such registration being subject to verification and validation by the Corporate Secretary.
Stockholders who registered and voted before the cut-off time will be counted for purposes of quorum.
2. Upon accessing the ASM Portal, stockholders will be required first to read the Data
Privacy Policy of UnionBank and click the “Accept” button to show that they agree to process their personal information before they can proceed to register at the ASM Portal. Stockholders shall provide the following information required for registration:
a. For Individual Stockholders
i. Valid email address, active mobile number and residential address; ii. A scanned copy of the front and back portions of any valid identification cards
(ID) in .jpg, .jpeg, .png, and .pdf formats with a file size no larger than 5MB. Valid types of IDs are: Driver’s License, Passport, Unified Multi-Purpose ID (UMID), GSIS ID, company ID, PRC ID, IBP ID, iDOLE Card, OWWA ID, Comelec Voter’s ID, Senior Citizen’s ID, and Alien Certificate of Registration/ Immigrant Certificate of Registration; and
iii. Stock certificate number of any stock certificate issued by UnionBank in the name of the individual stockholder.
b. For Stockholders with Joint Accounts
i. Documents required under Items 2.a.(i) and 2.a.(ii) for the authorized stockholder;
ii. An authorization letter signed by one of the stockholders indicating the name of the person authorized to cast the votes for the account; and
iii. Stock certificate number of any stock certificate issued by UnionBank in the name of joint stockholders.
c. For Stockholder under PCD Participant/ Brokers Account or “Scripless Shares”
i. The broker’s name and broker’s ID (BPID) of their broker registered with the
Philippine Depository and Trust Corp. (PDTC); ii. A scanned copy of the broker’s certification of shareholdings under the name
of the stockholder; and iii. Documents required under Items 2.a.(i) and 2.a.(ii) above.

2
d. For Corporate Stockholders i. Name of the corporate stockholder; ii. A scanned copy of the Secretary’s Certificate attesting to the authority of the
representative to vote the shares on behalf of the corporate stockholder; iii. Stock certificate number of any stock certificate issued by UnionBank in the
name of the corporate stockholder; and iv. Documents required under Items 2.a.(i) and 2.a.(ii) above for the authorized
representative.
3. The Office of the Corporate Secretary of UnionBank will verify and validate the online registration form submitted by the stockholder.
4. Once verified, an e-mail will be sent to the stockholder containing his/her
username and default password. 5. The stockholder will log-in to the ASM Portal using his/her username and default
password. The system will prompt the stockholder to change his/her password. A One-time Password (OTP) will be sent to his/her registered mobile number to confirm the change of password.
It is strongly recommended that stockholders do not share their username and password with any other person and take utmost care to keep their username and password confidential.
6. The agenda items for approval indicated in the Notice of Special Meeting of
Stockholders are set out in a digital absentee ballot in the ASM Portal, and the registered stockholders may cast their votes as follows:
(a) Stockholders have the option to vote “In Favor”, “Against”, or “Abstain” on the
agenda items for approval. (b) Once the stockholder completes his/her votes, he/she can proceed to submit
the accomplished form by clicking the “Submit” button. (c) After the digital absentee ballot has been submitted, the stockholder will no
longer be allowed to modify his/her votes. (d) An e-mail confirmation will be sent to the stockholders upon submission of the
votes. Stockholder can view his/her votes by clicking the “View Votes” button.
7. The Office of the Corporate Secretary will tabulate all valid and confirmed votes cast through the ASM Portal, together with the votes cast through proxies. If a stockholder cast his/her vote electronically in absentia, and also executed a proxy form, only the latest vote received by the Office of the Corporate Secretary will be counted. The votes will be validated by Sycip, Gorres, Velayo & Co.
8. Note that the submission of votes in the ASM Portal is until 9:00 a.m. (Philippine Time) of August 11, 2021. The voting function in the ASM portal will be disabled after this time to give the Office of the Corporate Secretary time to collate and validate votes received through the portal. Stockholders are no longer be allowed to cast votes during the livestream of the Special Meeting.
II. Attendance in the Special Meeting by Remote Communication
1. The Special Meeting will be livestreamed, and stockholders may participate at the meeting by logging-in at https://asm.unionbankph.com.
2. Stockholders as of July 9, 2021 (“Record Date”) who registered and cast their votes
in the ASM Portal, may attend the Special Meeting through remote communication by logging-in and accessing the “Join Zoom Meeting” button in the portal.
3. Stockholders who have not registered in the ASM Portal but wish to participate at
the Special Meeting shall notify the Corporate Secretary of their intention by

3
sending an e-mail at [email protected] together with their (a) full name (b) stock certificate number of any stock certificate issued by UnionBank (c) valid e-mail address (d) mobile number and (e) a scanned copy of the front and back portions of any valid identification cards (ID) in .jpg, .jpeg, .png, and .pdf formats with a file size no larger than 5MB, as proof of identity. Valid types of IDs are Driver’s License, Passport, Unified Multi-Purpose ID (UMID), GSIS ID, company ID, PRC ID, IBP ID, iDOLE Card, OWWA ID, Comelec Voter’s ID, Senior Citizen’s ID, and Alien Certificate of Registration/ Immigrant Certificate of Registration.
An e-mail will be sent to the stockholders containing the instructions to access the livestream of the meeting.
4. Please note that due to the limitations of available technology, voting will not be
possible during the livestream. Questions and/or remarks to items in the agenda may be sent in advance to the Corporate Secretary via e-mail at [email protected] on or before 5:00 p.m. (Philippine time) of August 10, 2021, to be read and answered during the meeting. The Bank will respond to any questions and/or remarks that were not answered during the meeting in writing to the stockholder’s e-mail address.
5. Stockholders shall be responsible for their stable internet connectivity during the
Special Meeting. 6. The proceedings of the Special Meeting will be recorded in video and audio format.
For any questions and concerns, stockholders may visit UnionBank’s website at
www.unionbankph.com or contact the Office of the Corporate Secretary via e-mail at [email protected] or at telephone no. (+632) 7577-2625.

1
Annex “B”
UNION BANK OF THE PHILIPPINES LIST OF LEASED BRANCHES
As of March 31, 2021
UNION BANK OF THE PHILIPPINES
Branch Name Address Monthly
Rental Expiration of
Lease Term of Renewal
2ND AVENUE - GLOBAL CITY
G/F, Unit 1, Blue Sapphire Bldg., 2nd Avenue, Bonifacio Global City, Taguig City
341,878.94 October 31, 2025 every 5 years
32ND AVE. - BGC
G/F, Trade & Financial Tower, 7th Avenue corner 32nd Street, Bonifacio Global City, Taguig City
768,075.00 September 30,
2024 every 5 years
5TH AVENUE - GLOBAL CITY
G/F, Unit 103, One Global Place Bldg., 5th Avenue, Bonifacio Global City, Taguig City
328,600.00 April 30, 2025 every 5 years
ACROPOLIS G/F, Bridgeview Bldg., 171 E. Rodriguez Jr. Avenue, Brgy. Bagumbayan, Quezon City
120,681.79 April 30, 2025 every 5 years
ADB AVENUE
G/F, AIC Burgundy Empire Tower, ADB Avenue corner Sapphire St, Brgy. San Antonio, Pasig City
279,751.18 October 31, 2023 every 5 years
ALABANG COUNTRY CLUB
G/F, Main Lobby, Alabang Country Club, 113 Country Club Drive, Ayala Alabang, Muntinlupa
40,000.00
February 28, 2025
every 5 years
ALABANG TOWN (Kiosk)
G/F, Makati Supermart Alabang, T. Molina St., Alabang Town Center, Muntinlupa City
237,682.60
September 30, 2021 every 1 years
ALI MALL
Araneta Center, Ali Mall Financial Center, P.Tuazon Boulevard , Brgy.. Socorro, Quezon City
187,942.70 September 30,
2023 every 5 years
ANGELES
G/F, Central Town Mall Bldg., 363 Fil-Am Friendship Highway, Brgy. Cutcut, Angeles City, Pampanga
123,135.65 November 06,
2021 every 5 years
ANNAPOLIS
G/F Unit 133, Promenade Bldg., Missouri cor. Annapolis Sts., Brgy.. Northeast Greenhills, San Juan
241,399.54 September 30,
2021 every 5 years
AURORA - BALETE DRIVE
G/F, Marsk Realty Bldg., 738 Aurora Blvd., cor. Balete Drive, Quezon City
98,541.70 September 14,
2025 every 5 years
AURORA BLVD. G/F Aurora Blvd., cor. Broadway St., Brgy. Mariana, New Manila, Quezon City
85,085.44 March 14, 2025 every 5 years
AYALA ALABANG G/F, JD Tower, 1308 Commerce Avenue corner Acacia Avenue, Ayala Alabang, Muntinlupa City
582,778.80 June 30, 2024 every 5 years
AYALA MADRIGAL G/F Don Vicente Madrigal Bldg., 6793 Ayala Avenue, Salcedo Village, Makati City
723,162.41 November 15,
2025 every 5 years
AYALA RUFINO G/F, Rufino Bldg., 6784 Ayala Avenue corner V Rufino St., Legazpi Village, Makati City
276,549.20 June 30, 2022 every 5 years
AYALA SSS G/F, SSS Bldg., 6782 Ayala Avenue corner V.A. Rufino St., Legazpi Village, Makati City
850,922.69
December 31, 2021
every 5 years

2
BACOLOD NORTH MANDALAGAN
G/F, Unit 101, CODECO Bldg., Lacson St. corner Consuela Avenue, Brgy. Bata, Bacolod City
123,906.00 October 31, 2024 every 5 years
BACOLOD-LACSON G/F Philam Bldg., Lacson corner Galo Sts., Brgy. 19, Bacolod City
117,965.43
November 14, 2024 every 5 years
BACOOR G/F, Addio Bldg., Aguinaldo Highway, Brgy. Talaba, Bacoor, Cavite
107,611.53 March 31, 2026 every 5 years
BAESA G/F, Dra. C. Pascual Bldg., 142 Quirino Highway, Baesa, Quezon City
88,200.00 July 31, 2021 every 5 years
BAGUIO CITY
Upper G/F, Cedar Peak Bldg., General Luna corner Mabini Sts., Brgy.. Kabayanihan , Baguio City
178,993.74
March 31, 2026 every 5 years
BALIWAG
G/F, Unit 3 and 4, 3006 Augustine Square, 17 Pinagbarilan St, Dona Remedios Trinidad Highway, Baliuag, Bulacan
67,904.12
April 30, 2026 every 5 years
BATANGAS CITY
G/F, University of Batangas Bldg., Pres. Jose P. Laurel Highway, Brgy. Hilltop, Highway Hills, Batangas City
98,018.57 September 30,
2021 every 5 years
BF HOMES 55 President's Avenue, Brgy.., BF Homes, Parañaque City
280,716.37 August 31, 2023 every 5 years
BGC 34TH STREET (Panorama)
G/F Panorama Bldg., 34th St., Bonifacio Global City, Taguig City
460,684.00
February 28, 2025 every 5 years
BGC 38TH STREET G/F Orion Bldg., 38th St, Bonifacio Global City, Taguig City
569,240.00 March 31, 2025 every 5 years
BGC 3RD AVENUE
G/F, The Net Square Bldg., 3rd Avenue corner 28th Street, Bonifcaio Global City, Taguig City
361,902.50
May 15, 2026 every 5 years
BGC 7TH AVENUE
G/F Twenty Four-Seven Mckinley Bldg., 7th Avenue cor. 24th St., Bonifacio Global City, Taguig City
441,064.64
June 24, 2025 every 5 years
BGC MCKINLEY ROAD
G/F, Unit 2, Fairways Tower, 5th Avenue, Bonifacio Global City, Taguig City
198,030.00 January 31, 2025 every 5 years
BGC MCKINLEY WEST
Lower G/F, Robinsons Cyber Sigma Bldg., Bonifacio South, Taguig City
95,952.78 July 07, 2022 every 5 years
BGC THE LUXE RESIDENCES
G/F, Shop 3, The Luxe Residences, 28th St., cor. 4th Avenue, Bonifacio Global City, Taguig City
679,056.00
January 31, 2025 every 5 years
BGC TRIANGLE DRIVE
G/F, Shop 3, Philplans Bldg. Corporate Center, Bonifacio Global City, Taguig City
407,506.05
August 14, 2023 every 5 years
BGC UPTOWN PLACE MALL
Lower G/F Uptown Place Mall, 9th Avenue, Bonifacio Global City, Taguig City
421,265.49
October 31, 2021 every 5 years
BICUTAN 28 Dona Soledad Avenue, Better Living Subd., Parañaque City
161,832.14
December 31, 2022 every 10 years
BIÑAN-CARMONA
Governor's Drive corner Golden Mile Avenue, Golden Mile Business Park, Brgy.. Maduya, Carmona, Cavite
135,980.00
June 30, 2025 every 5 years
3
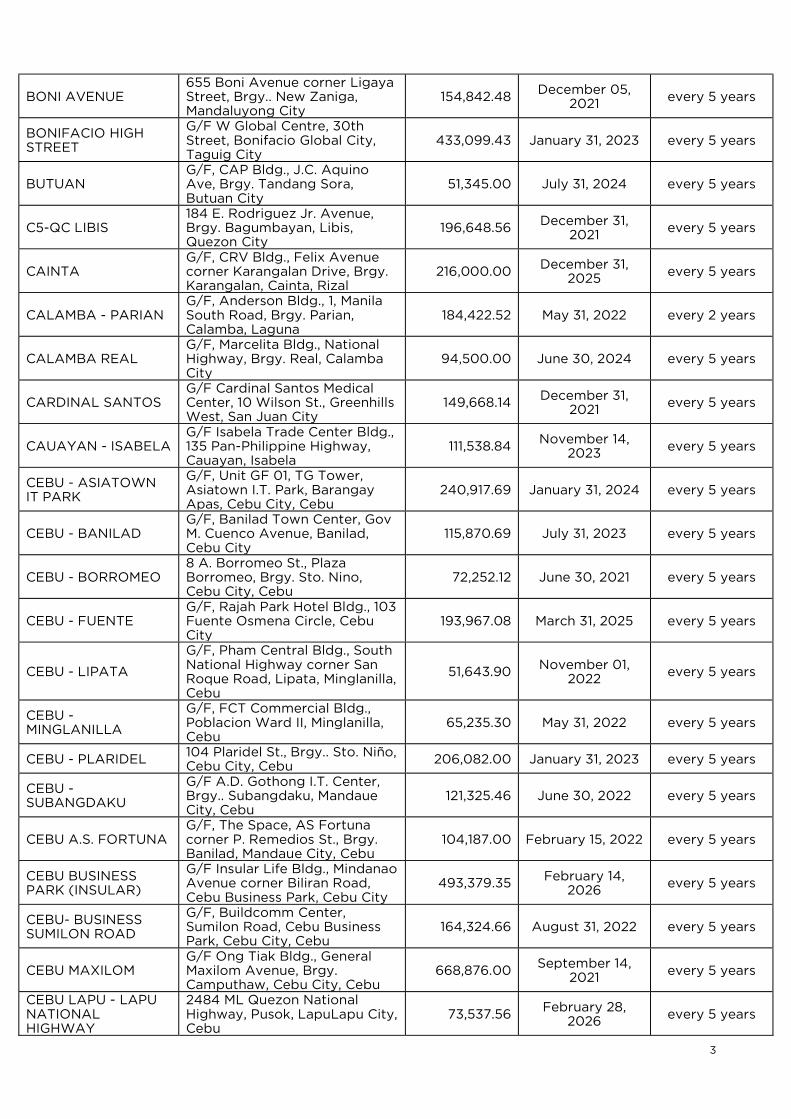
BONI AVENUE 655 Boni Avenue corner Ligaya Street, Brgy.. New Zaniga, Mandaluyong City
154,842.48 December 05,
2021 every 5 years
BONIFACIO HIGH STREET
G/F W Global Centre, 30th Street, Bonifacio Global City, Taguig City
433,099.43 January 31, 2023 every 5 years
BUTUAN G/F, CAP Bldg., J.C. Aquino Ave, Brgy. Tandang Sora, Butuan City
51,345.00 July 31, 2024 every 5 years
C5-QC LIBIS 184 E. Rodriguez Jr. Avenue, Brgy. Bagumbayan, Libis, Quezon City
196,648.56 December 31, 2021
every 5 years
CAINTA G/F, CRV Bldg., Felix Avenue corner Karangalan Drive, Brgy. Karangalan, Cainta, Rizal
216,000.00 December 31,
2025 every 5 years
CALAMBA - PARIAN G/F, Anderson Bldg., 1, Manila South Road, Brgy. Parian, Calamba, Laguna
184,422.52 May 31, 2022 every 2 years
CALAMBA REAL G/F, Marcelita Bldg., National Highway, Brgy. Real, Calamba City
94,500.00 June 30, 2024 every 5 years
CARDINAL SANTOS G/F Cardinal Santos Medical Center, 10 Wilson St., Greenhills West, San Juan City
149,668.14 December 31, 2021
every 5 years
CAUAYAN - ISABELA G/F Isabela Trade Center Bldg., 135 Pan-Philippine Highway, Cauayan, Isabela
111,538.84 November 14,
2023 every 5 years
CEBU - ASIATOWN IT PARK
G/F, Unit GF 01, TG Tower, Asiatown I.T. Park, Barangay Apas, Cebu City, Cebu
240,917.69 January 31, 2024 every 5 years
CEBU - BANILAD G/F, Banilad Town Center, Gov M. Cuenco Avenue, Banilad, Cebu City
115,870.69 July 31, 2023 every 5 years
CEBU - BORROMEO 8 A. Borromeo St., Plaza Borromeo, Brgy. Sto. Nino, Cebu City, Cebu
72,252.12 June 30, 2021 every 5 years
CEBU - FUENTE G/F, Rajah Park Hotel Bldg., 103 Fuente Osmena Circle, Cebu City
193,967.08 March 31, 2025 every 5 years
CEBU - LIPATA
G/F, Pham Central Bldg., South National Highway corner San Roque Road, Lipata, Minglanilla, Cebu
51,643.90 November 01, 2022
every 5 years
CEBU - MINGLANILLA
G/F, FCT Commercial Bldg., Poblacion Ward II, Minglanilla, Cebu
65,235.30 May 31, 2022 every 5 years
CEBU - PLARIDEL 104 Plaridel St., Brgy.. Sto. Niño, Cebu City, Cebu 206,082.00 January 31, 2023 every 5 years
CEBU - SUBANGDAKU
G/F A.D. Gothong I.T. Center, Brgy.. Subangdaku, Mandaue City, Cebu
121,325.46 June 30, 2022 every 5 years
CEBU A.S. FORTUNA G/F, The Space, AS Fortuna corner P. Remedios St., Brgy. Banilad, Mandaue City, Cebu
104,187.00 February 15, 2022 every 5 years
CEBU BUSINESS PARK (INSULAR)
G/F Insular Life Bldg., Mindanao Avenue corner Biliran Road, Cebu Business Park, Cebu City
493,379.35 February 14, 2026
every 5 years
CEBU- BUSINESS SUMILON ROAD
G/F, Buildcomm Center, Sumilon Road, Cebu Business Park, Cebu City, Cebu
164,324.66 August 31, 2022 every 5 years
CEBU MAXILOM G/F Ong Tiak Bldg., General Maxilom Avenue, Brgy. Camputhaw, Cebu City, Cebu
668,876.00 September 14,
2021 every 5 years
CEBU LAPU - LAPU NATIONAL HIGHWAY
2484 ML Quezon National Highway, Pusok, LapuLapu City, Cebu
73,537.56 February 28,
2026 every 5 years

4
CEBU LAPU LAPU / MEPZ
Lot 2, Block 1, Phase 1, MEPZ, SEPZ, Lapu Lapu City, Cebu
40,285.74 May 31, 2026 every 5 years
CEBU MACTAN NEWTOWN
G/F Plaza Magellan Tower 1, Mactan Newtown, Lapu Lapu City, Cebu
184,040.48 November 30, 2021
every 5 years
CEBU MANDAUE G/F, Kentredder Bldg., AC Cortes Avenue, Mandaue City, Cebu
119,603.00 February 28, 2025
every 5 years
CEBU MANDAUE NORTH
G/F, Khuz'ns Bldg., North Hi-way, Estancia, Mandaue City, Cebu
110,611.20 December 31,
2021 every 5 years
CEBU NORTH DRIVE G/F, North Drive Center, Ouano Avenue, North Reclamation Area, Mandaue City, Cebu
125,356.00 June 30, 2022 every 6 years
CEBU TIME SQUARE
G/F, Time Square 2 Bldg., Mantawe Avenue, Brgy. Tipolo, North Reclamation Area, Mandaue City, Cebu
127,563.72 October 31, 2021 every 5 years
CITYPLACE SQUARE
3rd Floor, Lucky Chinatown-Cityplace Square, Calle Felipe cor. Lachambre Streets, Binondo, Manila
264,344.04 August 31, 2021 every 5 years
CLARK
G/F, The Pavillion Mall Bldg., Manuel A. Roxas Highway, Philexcel Business Park, Clark Freeport Zone
86,641.37 April 14, 2023 every 5 years
COMMONWEALTH
G/F, Diliman Commercial Center, Commonwealth Avenue, Brgy. Batasan Hills, Quezon City
97,453.90 February 28,
2025 every 5 years
COMMONWEALTH-LUZON AVE.
UGF, Kayumanggi Bldg., Commonwealth Avenue corner Luzon Avenue, Brgy. Matandang Balara, Quezon City
109,754.46 January 15, 2023 every 5 years
CUBAO (P. Tuazon) 7th Avenue Corner P. Tuazon St., Brgy.. Socorro, Cubao, Quezon City
225,200.36 January 31, 2025 every 5 years
DAGUPAN INSULAR G/F, Insular Life Bldg., Arellano Street, Barangay Pantal, Dagupan City
130,075.54 September 14,
2022 every 5 years
DASMARIÑAS CAVITE
Aguinaldo Highway corner Congressional Avenue, Brgy. San Agustin II, Dasmarinas, Cavite
131,271.00 July 31, 2024 every 5 years
DAVAO - CABAGUIO G/F, DMIRIE Bldg., 676 JP Cabaguio Avenue, Brgy.. Paciano Bangoy, Davao City
114,605.57 March 31, 2022 every 5 years
DAVAO - MONTEVERDE
G/F, Mintrade Bldg., 323 Monteverde Avenue corner Sales St., Brgy.. 27C, Davao City
201,981.60 June 30, 2021 every 5 years
DAVAO - QUIRINO Quirino Avenue corner San Pedro St., Brgy.. 2A, Davao City
141,000.00 September 30, 2024
every 5 years
DAVAO - RIZAL G/F Quibod Commercial Complex, Rizal St., Brgy.. 3, Davao City
100,835.75 November 30,
2025 every 5 years
DEL MONTE AVENUE 345 Del Monte Avenue corner Banawe St., Brgy.. Manresa, Quezon City
260,000.13 March 31, 2026 every 5 years
DELA ROSA
G/F, Insular Health Care Bldg., 167 Legaspi St. corner Dela Rosa., Legazpi Village, Makati City
280,618.12 May 31, 2022 every 5 years
DOUBLE DRAGON MERIDIAN
G/F, Double Dragon Center, West Tower, Macapagal Avenue corner EDSA Extension, Bay Area, Pasay City
381,039.75 December 16,
2024 every 5 years

5
DR. A. SANTOS
G/F MTF Building, Dr. A. Santos Avenue corner Kabesang Segundo St., Brgy. San Isidro, Parañaque City
135,883.85 April 30, 2022 every 5 years
E. RODRIGUEZ G/F, Katipunan Bldg., 95 E. Rodriguez Avenue, Brgy. Tatalon, Quezon City
47,250.48 May 31, 2024 every 5 years
EASTWOOD CITY (Le Grand)
G/F Le Grand Tower 1, Eastwood Palm Tree Avenue, Eastwood City, Brgy.. Bagumbayan, Quezon City
211,457.58 January 31, 2024 every 5 years
EDSA - KALOOKAN 512 EDSA cor. Urbano Plata St., Brgy. 94, Caloocan City
322,325.73 March 15, 2025 every 5 years
EDSA PIONEER UG-07 Robinsons Cybergate Plaza, EDSA, Brgy. Barangka Ilaya, Mandaluyong City
161,604.01 April 24, 2025 every 5 years
ESCOLTA G/F Regina Building, 408 Escolta St., Binondo, Manila
201,819.58
May 31, 2025 every 5 years
FRONTERA VERDE G/F, Transcom Bldg., Frontera Verde, E. Rodriguez Jr. Avenue, Brgy. Ugong, Pasig City
254,620.07 February 28,
2023 every 5 years
GENERAL SANTOS G/F, SunCity Suites, Digos Makar National Hway., Brgy.. Lagao, General Santos City
96,000.00 July 31, 2025 every 5 years
GMA TIMOG G/F, Cabrera Bldg. I , Timog Avenue, Barangay Sacred Heart, Quezon City
265,845.53 January 23, 2024 every 5 years
GREENBELT G/F, Twin Cities Condominium, 110 Legazpi St., Legazpi Village, Makati City
311,144.15
December 31, 2023 every 5 years
GREENHILLS G/F, Harmonia Center, Ortigas Avenue, Greenhills West, San Juan City
427,549.85 April 30, 2024 every 5 years
GSIS G/F, GSIS Main Office Financial Center, JW Diokno Blvd, Pasay City
159,248.55 May 31, 2023 every 5 years
H.V. DELA COSTA G/F Global Enterprise Bldg., 138 HV Dela Costa St., Salcedo Village, Makati City
214,767.00 January 01, 2024 every 5 years
ICTSI - PORT AREA G/F Administration Bldg., MICT Access Road, ICTSI, Brgy. 20, Manila
30,180.00 March 31, 2022 every 5 years
ILOILO - IZNART NORTH
Villanueva Bldg., 217 Iznart Street, Brgy. President Roxas, Iloilo City
90,000.00 August 31, 2023 every 9 years
IMUS
G/F Melta Bldg., cor. Sampaguita Village , Aguinaldo, Hi-way Brgy.. Bayan Luma III , Imus, Cavite
132,000.00 December 31,
2023 every 5 years
INTRAMUROS G/F, BF Condominium Bldg., 409 A. Soriano Avenue, Intramuros, Manila
259,275.80 July 31, 2025 every 5 years
J. P. RIZAL 731 Dr. Jose P. Rizal Avenue, Brgy. Poblacion, Makati City
79,380.00
November 30, 2022
every 5 years
JULIA VARGAS
G/F, Centerpoint Condominium, Dona Julia Vargas Avenue corner Garnet Road, Brgy. San Antonio, Pasig City
154,222.64 February 28,
2022 every 5 years
KALOOKAN 357 Rizal Avenue Extension, Brgy. Grace Park West, Caloocan City
236,250.20 March 31, 2023 every 5 years
KAMIAS G/F, TDS Bldg., 72 Kamias Road, Brgy. East Kamias, Quezon City
91,207.68
November 30, 2021
every 5 years

6
KATIPUNAN G/F, Agcor Bldg., 335 Katipunan Avenue, Brgy. Loyola Heights, Quezon City
200,436.00 January 15, 2024 every 10 years
LAOAG - SAN NICOLAS
G/F, 365 Plaza Bldg., Brgy.. San Francisco, San Nicolas, Ilocos Norte
78,880.50
December 31, 2023 every 10 years
LAS PIÑAS - PAMPLONA
Alabang-Zapote Road corner Crispina Avenue, Brgy.. Pamplona 3, Las Pinas City
322,546.36 May 31, 2026 every 5 years
LEGAZPI CITY G/F, Unit 1, SMC Bldg., Landco Business Park, Brgy.. Capatawan, Legaspi City, Albay
96,314.40 November 15,
2021 every 7 years
LIBERTAD MANDALUYONG
G/F, Cluster El Dorado, California Garden Square, Domingo M. Guevara St., Brgy. Highway Hills, Libertad, Mandaluyong City
193,721.22
October 31, 2021 every 2 years
LIMA
Unit GC-R04-R05, The Outlets, LIMA Technological Center Special Economic Zone, Malvar, Lipa City
131,540.07
June 30, 2023 every 5 years
LIPA CITY 17 B. Morada Avenue, Lipa City, Batangas
159,536.00
April 30, 2022 every 1 year
LOURDES HOSPITAL G/F Main Bldg., Our Lady of Lourdes Hospital, 46. P. Sanchez St., Sta. Mesa, Manila
77,174.92 March 31, 2022 every 5 years
LUCENA (One People Square)
G/F One People Square, ML Tagarao Street corner Granja Street, Brgy. 3, Lucena City, Quezon
177,043.50
March 21, 2022 every 5 years
MACAPAGAL AVENUE
G/F, Y Tower, Macapagal Avenue corner Coral Way Drive, Brgy.. 76, Pasay City
335,240.00 January 02, 2024 every 5 years
MAGALLANES G/F, Maga Center, Paseo De Magallanes, Brgy. Magallanes, Makati City
56,955.15
December 15, 2024 every 10 years
MAKATI AVENUE Makati Avenue corner Durban St, Brgy. Bel Air, Makati City
583,745.16
December 31, 2021
every 15 years
MALABON Gov Pascual Avenue corner River St., Brgy. Tinajeros, Malabon City
87,222.31 September 05,
2023 every 5 years
MALATE G/F, Marioco Bldg., 1945 M. Adriatico St., Brgy. 700, Malate, Manila
219,727.04 October 15, 2024 every 5 years
MALINTA G/F, Mirjan Bldg., 295 Maysan Road, Paso De Blas, Valenzuela City
146,410.20 July 15, 2023 every 5 years
MANDALUYONG G/F, PICPA Bldg, 700 Shaw Blvd, Brgy. Wack Wack, Mandaluyong City
275,426.00 January 31, 2026 every 5 years
MARIKINA G/F, WRC-2 Bldg., 47 Gil Fernando St., Brgy. San Roque, Marikina City
77,189.76 March 18, 2023 every 5 years
MASANGKAY 911-913 Masangkay Street, Brgy. 295, Manila
157,499.20
September 15, 2021
every 5 years
MAYHALIGUE G/F One Masangkay Place, 1420 Masangkay St., Sta Cruz, Manila
213,073.82 June 30, 2022 every 5 years
MAYON G/F ACI Bldg., 178 Mayon St., Brgy. Maharlika, Sta. Mesa Heights, Quezon City
90,000.30 January 31, 2022 every 5 years
MCKINLEY HILL G/F, Two World Square Bldg., McKinley Hill, Fort Bonifacio, Taguig City
456,500.00 January 01, 2022 every 5 years

7
MEDICAL CITY
G/F The Medical Arts Tower, Medical City Hospital, 1605 Ortigas Avenue Brgy.. Rosario Pasig City
153,731.00 May 31, 2024 every 5 years
MEDICAL CENTER PARANAQUE
G/F, Medical Center Paranaque, Dr. A. Santos Avenue, Brgy.. San Antoniio, Sucat, Parañaque City
184,200.00 February 28,
2025 every 5 years
MEYCAUAYAN G/F Marian Bldg., MacArthur Highway, Calvario, Meycauayan, Bulacan
161,338.14
December 31, 2023 every 5 years
MULTINATIONAL BANCORP
G/F Multinational Bancorporation Center, 6805 Ayala Avenue, Salcedo Village, Makati City
75,633.60 December 15,
2022 every 5 years
MUÑOZ G/F, Muñoz Market, EDSA cor. Roosevelt Avenue, Quezon City
3,878.42 March 20, 2022 every 50 years
MUNTINLUPA G/F, Jaysons Bldg., 12 National Road, Putatan, Muntinlupa
120,608.61
September 30, 2021
every 5 years
NAGA CITY
G/F, Prime Days Hotel, Panganiban Drive, Barangay Concepcion Pequeña, Naga City
164,560.26 April 30, 2024 every 5 years
NAVOTAS 817 M. Naval St., Brgy. Sipac Almasen, Navotas City
147,746.14 May 31, 2026 every 5 years
NEWPORT CITY G/F, Star Cruises Centre, 2012 Andrews Avenue, Newport City, Pasay City
539,968.00 January 31, 2024 every 5 years
NOVALICHES 854 Quirino Highway, Brgy. Gulod, Novaliches, Quezon City
213,119.60
July 31, 2024 every 5 years
ORTIGAS (SAN MIGUEL)
G/F, The Crescent Condominium,29 San Miguel Avenue, Ortigas Center, Pasig City
228,013.02
May 31, 2023 every 5 years
PAGADIAN CITY 133 Rizal Avenue, Gatas Poblacion, Pagadian City
113,422.89
December 31, 2024 every 5 years
PAMPANGA G/F, Mel-Vi Bldg., Olongapo-Gapan Road, Brgy. Dolores, San Fernando, Pampanga
169,707.00 May 31, 2023 every 5 years
OTIS 1763 Paz M. Guazon Street, Brgy. 829, Zone 90, Paco, Manila
222,580.99 May 31, 2021 every 5 years
PASAY (TAFT) 2528 Taft Avenue, Brgy. 93, Zone 11, Pasay City
122,167.10
November 30, 2025 every 5 years
PASAY ROAD 912 Arnaiz Avenue, San Lorenzo Village, Makati City
254,121.00
April 14, 2023 every 5 years
PASCOR DRIVE
G/F, Skyfreight Center, Ninoy Aquino Avenue corner Pascor Drive, Brgy. Sto Nino, Pasay City
105,749.08 December 31,
2025 every 5 years
PASEO DE ROXAS G/F, 111 Paseo de Roxas Bldg., 111 Paseo De Roxas, Legazpi Village, Makati City
214,908.63 May 31, 2023 every 5 years
PASEO DE STA. ROSA
G/F The Medical City South Luzon, United Blvd, Brgy. Don Jose, Sta. Rosa, Laguna
88,200.00 December 31,
2022 every 5 years
PASONG TAMO - JTKC
G/F, BCS Prime Bldg., 2297 Chino Roces Avenue, Brgy. Magallanes, Makati City
451,327.49 July 31, 2021 every 5 years
PASONG TAMO EXTENSION
G/F JTKC Bldg., 2155 Chino Roces Avenue, Legazpi Village, Makati City
370,863.10 October 01, 2023 every 5 years
PEREA G/F Greenbelt Mansion Bldg., 106 Perea St., Legazpi Village, Makati City
221,530.40 October 15, 2024 every 5 years

8
RADA G/F, Prince Bldg., 117 Rada St., Legazpi Village, Makati City
287,910.52 May 31, 2022 every 5 years
RENAISSANCE G/F, Renaissance Tower, 29 Meralco Avenue, Brgy. Ugong, Pasig City
221,494.90 February 29, 2024
every 5 years
ROOSEVELT G/F, 244 Roosevelt Avenue., San Francisco del Monte, Quezon City
185,564.96 June 30, 2021 every 5 years
SALCEDO G/F, Golden Rock Bldg., 168 Salcedo St., Legazpi Village, Makati City
207,730.64 February 28,
2026 every 5 years
SAN AGUSTIN DELA COSTA
G/F, Liberty Plaza Bldg., 102 HV Dela Costa cor. San Agustin Streets, Salcedo Village Makati City
452,160.00 May 31, 2024 every 5 years
SAN FERNANDO - PAMPANGA
G/F, 3M Bldg., 69 Manila North Road, Brgy. San Agustin, San Fernando, Pampanga
42,000.00 May 31, 2023 every 5 years
SAN FERNANDO LA UNION
G/F Nisce Business Center, Quezon Avenue, San Fernando City, La Union
70,030.00 November 30, 2023
every 5 years
SAN PEDRO Manila South Road corner Cataquiz Avenue, Brgy.. Landayan, San Pedro, Laguna
167,600.00 December 31, 2023
every 5 years
SANTIAGO Maharlika National Highway, Brgy. Malvar, Santiago, Isabela
85,000.37 July 31, 2021 every 5 years
SHAW BLVD. 131-133 Shaw Boulevard Brgy.. Oranbo, Pasig City 204,571.47 January 31, 2026 every 5 years
SHAW PASIG G/F, Chipeco Bldg., Shaw Blvd corner Meralco Avenue, Brgy. San Antonio, Pasig City
154,350.00 December 31,
2023 every 5 years
SOUTH TRIANGLE 1604 Quezon Avenue corner Sct. Albano, Brgy. South Triangle, Quezon City
385,000.00 December 31,
2023 every 5 years
SSS EAST AVENUE G/F SSS Main Bldg., East Avenue, Brgy. Pinyahan, Quezon City
105,769.19 May 13, 2024 every 5 years
ST. FRANCIS SHANGRI-LA PLACE
G/F, The St. Francis Shangri-La Place Tower 1, St. Francis St., Brgy. WackWack, Mandaluyong City
286,909.74 October 15, 2023 every 5 years
ST. LUKE’S HOSPITAL - E. RODRIGUEZ
G/F St. Luke's Medical Center, 279 E. Rodriguez Sr. Avenue, Brgy. Kalusugan, Quezon City
27,382.20 July 07, 2022 every 3 years
STA. ROSA 718 Rizal Blvd corner Zavalla Street, Brgy. Malusak, Sta Rosa, Laguna
104,347.19 October 31, 2023 every 5 years
STO. DOMINGO G/F Elements Bldg., 560 Quezon Avenue, Brgy. Tatalon, Quezon City
181,340.00 September 30,
2023 every 5 years
STO. CRISTO G/F, Burke Plaza Bldg., Sto. Cristo St corner San Fernando St, Binondo, Manila
259,622.21 February 28, 2026
every 5 years
SUBIC Manila Avenue corner Canal Road, Subic Bay Freeport Zone, Zambales
- July 31, 2054 every 15 years
T. ALONZO 625 T. Alonzo St., Binondo, Manila
195,177.67 November 14, 2025
every 5 years
TACLOBAN CITY G/F, Tacloban Plaza Bldg., Justice Romualdez St., Brgy. 14, Tacloban City
145,113.39 June 30, 2021 every 5 years
TAFT AVENUE G/F, Kassel Condominium, 2625 Taft Avenue, Malate, Manila
98,398.31 September 30, 2023
every 5 years
TAGAYTAY G/F Tagaytay Prime Residences, Tagaytay-Calamba
67,244.80 December 16, 2023
every 5 years

9
Road, Brgy. San Jose, Tagaytay City, Cavite
TAGBILARAN JS Torralba St. corner Carlos P. Garcia Avenue, Poblacion 2, Tagbilaran City, Bohol
106,995.04 September 30,
2022 every 5 years
TARLAC G/F, Jaral Bldg., MacArthur Highway corner Juan Luna St., Brgy.. St. Cristo, Tarlac City
155,368.20 February 28,
2022 every 5 years
TEKTITE G/F PSE Center, Ortigas Complex, Pasig City
974,768.34
September 30, 2021
every 5 years
THE ARK-INSULAR AYALA-PASEO
G/F, Insular Life Bldg., Ayala Avenue corner Paseo De Roxas, Salcedo Village, Makati City
1,123,500.00 August 19, 2022 every 5 years
TIMOG G/F, Cabrera II Bldg., 64 Timog Avenue, Brgy. Sacred Heart, Quezon City
337,165.92 February 23,
2023 every 5 years
TOMAS MORATO G/F, Tomas Morato, corner Sct. Lozano St., Quezon City
215,711.84
November 30, 2024
every 5 years
TUGUEGARAO Andrews St, Bagay Road , Brgy.. Caritan Centro ,Tuguegarao City
75,000.00 January 31, 2024 every 5 years
UN AVENUE United Nations Avenue corner Guerrero and MH Del Pilar Sts., Ermita, Manila
250,227.50 December 31,
2023 every 5 years
VALENZUELA - FATIMA
G/F, JLB Bldg., KM 12 MacArthur Highway, Brgy. Dalandanan, Marulas, Valenzuela City
192,622.50
May 14, 2022 every 1 years
VALERO G/F Le Grand Condominium, 130 Valero St., Salcedo Village, Makati City
306,000.00 July 31, 2023 every 3 years
VERTEX ONE - SAN LAZARO
G/F, Vertex One Bldg., 2113 Felix Huertas St., San Lazaro, Manila
178,379.21
December 31, 2023 every 5 years
VIGAN A.R. Lahoz Bldg., Jose Singson Street, Brgy. VIII, Vigan City
93,111.52
August 29, 2021 every 5 years
VISAYAS CONGRESSIONAL EXT.
G/F, WMG Bldg., 47 Visayas Avenue corner Congressional Ext., Brgy. Culiat, Quezon City
181,512.00 December 31,
2025 every 5 years
VITO CRUZ 29 Pablo Ocampo Sr. Extension, Brgy. La Paz, Makati City
92,954.91
January 30, 2026 every 5 years
WACK - WACK G/F, PBJ Bldg., 6 Shaw Blvd corner Laurel St., Brgy. Pleasant Hills, Mandaluyong City
192,880.16 December 31,
2024 every 5 years
WEST AVENUE G/F, 27-A West Avenue, Quezon City
123,840.00 March 31, 2022 every 5 years
WEST AVENUE - BALER
91-A West Avenue, Barangay Bungad, Project 7, Quezon City
148,014.70
May 31, 2023 every 5 years
WEST SERVICE ROAD
G/F, Rodeo Bldg., 802 West Service Road, Brgy. Marcelo Green, Parañaque City
108,885.10 July 31, 2022 every 5 years
YUCHENGCO G/F, Units 2 & 3 , Escolta Parking Bldg., Escolta corner Yuchengco Sts., Binondo Manila
212,730.00 August 31, 2025 every 5 years
ZAMBOANGA CITY G/F, ZAEC Bldg., Mayor Jaldon corner Governor Alvarez Sts., Zone 1, Zamboanga
124,106.03
September 29, 2024 every 5 years
CITY SAVINGS BANK
Branch Name Address Monthly Rental
Expiration of Lease
Term of Renewal
BOGO BRANCH P. RODRIGUEZ ST., BRGY. COGON, BOGO CEBU 6010 24,640.00 July 31, 2021
August 1, 2016 to July 31, 2021
10
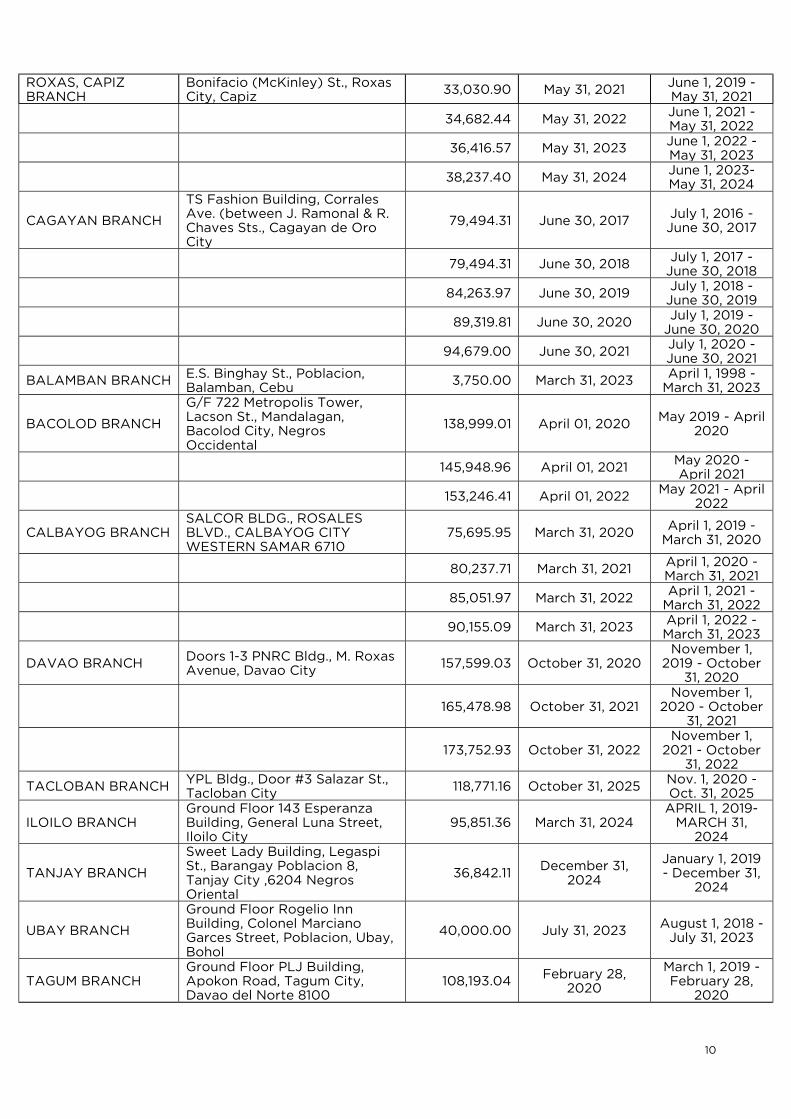
ROXAS, CAPIZ BRANCH
Bonifacio (McKinley) St., Roxas City, Capiz
33,030.90 May 31, 2021 June 1, 2019 - May 31, 2021
34,682.44 May 31, 2022 June 1, 2021 - May 31, 2022
36,416.57 May 31, 2023 June 1, 2022 - May 31, 2023
38,237.40 May 31, 2024 June 1, 2023- May 31, 2024
CAGAYAN BRANCH
TS Fashion Building, Corrales Ave. (between J. Ramonal & R. Chaves Sts., Cagayan de Oro City
79,494.31 June 30, 2017 July 1, 2016 - June 30, 2017
79,494.31 June 30, 2018 July 1, 2017 - June 30, 2018
84,263.97 June 30, 2019 July 1, 2018 -
June 30, 2019
89,319.81 June 30, 2020 July 1, 2019 - June 30, 2020
94,679.00 June 30, 2021 July 1, 2020 - June 30, 2021
BALAMBAN BRANCH E.S. Binghay St., Poblacion, Balamban, Cebu
3,750.00 March 31, 2023 April 1, 1998 - March 31, 2023
BACOLOD BRANCH
G/F 722 Metropolis Tower, Lacson St., Mandalagan, Bacolod City, Negros Occidental
138,999.01 April 01, 2020 May 2019 - April
2020
145,948.96 April 01, 2021 May 2020 - April 2021
153,246.41 April 01, 2022 May 2021 - April
2022
CALBAYOG BRANCH SALCOR BLDG., ROSALES BLVD., CALBAYOG CITY WESTERN SAMAR 6710
75,695.95 March 31, 2020 April 1, 2019 - March 31, 2020
80,237.71 March 31, 2021 April 1, 2020 - March 31, 2021
85,051.97 March 31, 2022 April 1, 2021 -
March 31, 2022
90,155.09 March 31, 2023 April 1, 2022 - March 31, 2023
DAVAO BRANCH Doors 1-3 PNRC Bldg., M. Roxas Avenue, Davao City
157,599.03 October 31, 2020 November 1,
2019 - October 31, 2020
165,478.98 October 31, 2021 November 1,
2020 - October 31, 2021
173,752.93 October 31, 2022 November 1,
2021 - October 31, 2022
TACLOBAN BRANCH YPL Bldg., Door #3 Salazar St., Tacloban City 118,771.16 October 31, 2025
Nov. 1, 2020 - Oct. 31, 2025
ILOILO BRANCH Ground Floor 143 Esperanza Building, General Luna Street, Iloilo City
95,851.36 March 31, 2024 APRIL 1, 2019-
MARCH 31, 2024
TANJAY BRANCH
Sweet Lady Building, Legaspi St., Barangay Poblacion 8, Tanjay City ,6204 Negros Oriental
36,842.11 December 31,
2024
January 1, 2019 - December 31,
2024
UBAY BRANCH
Ground Floor Rogelio Inn Building, Colonel Marciano Garces Street, Poblacion, Ubay, Bohol
40,000.00 July 31, 2023 August 1, 2018 -
July 31, 2023
TAGUM BRANCH Ground Floor PLJ Building, Apokon Road, Tagum City, Davao del Norte 8100
108,193.04 February 28, 2020
March 1, 2019 - February 28,
2020

11
113,602.70 February 28,
2021
March 1, 2020 - February 28,
2021
119,282.83 February 28,
2022
March 1, 2021 - February 28,
2022
125,246.98 February 28, 2023
March 1, 2022 - February 28,
2023
SOGOD BRANCH Corner Concepcion and Mangkaw Streets, Barangay Zone 1 Sogod, Southern Leyte
50,000.00 July 31, 2025 July 31, 2020 - July 31, 2025
CARCAR BRANCH WPT Building Esperanza Village Awayan Poblacion III, Carcar City, Cebu
92,261.84 July 15, 2020 July 14, 2019 - July 15, 2020
97,797.55 July 15, 2021 July 14, 2020 - July 15, 2021
ORMOC BRANCH STP BLDG., AVILES ST., ORMOC CITY, LEYTE 126,588.66
December 31, 2024
January 1, 2019 - December 31,
2024
ANTIQUE BRANCH C.R. Building, T.A. Fornier St., San Jose, Antique
67,020.40 November 30,
2020
December 1, 2019 -
November 30, 2020
70,371.42 November 30,
2021
December 1, 2020 -
November 30, 2021
73,889.99 November 30,
2022
December 1, 2021 -
November 30, 2022
77,584.49 November 30,
2023
December 1, 2022 -
November 30, 2023
KABANKALAN BRANCH
L&M Bldg., Corner Guanzon & Azcona Sts., Kabankalan City
27,830.00 March 31, 2023 April 1, 2018 - March 31, 2023
MANDAUE BRANCH Unit 3 & 4 Citybridge Plaza, AC Cortes Avenue cor. P. Burgos St., Mandaue City, Cebu
116,040.33 March 31, 2020 April 1, 2019 - March 31, 2020
121,842.35 March 31, 2021 April 1, 2020 - March 31, 2021
SAN CARLOS BRANCH
DOOR 2, 3 & 4 HERITAGE BLDG. FC LEDESMA AVE. SAN CARLOS CITY NEG. OCC. 6127
33,689.29 February 28, 2024
March 1, 2019-February 28,
2024
CATARMAN, NORTHERN SAMAR BRANCH
Camara Building 1305 Bonifacio corner Garcia Sts., Barangay Mabolo, Catarman, Northern Samar
72,268.35 May 31, 2020 June 1, 2019 - May 31, 2020
75,881.77 May 31, 2021 June 1, 2020 - May 31, 2021
79,675.86 May 31, 2022 June 1, 2021 - May 31, 2022
83,659.65 May 31, 2023 June 1, 2022 - May 31, 2023
CALAMBA BRANCH
Unit #1EF GF Margimel Building, National Highway Brgy. Halang Calamba City, Laguna
121,980.00 January 31, 2021 February 1,
2020 - January 31, 2021
128,079.00 January 31, 2023 February 1, 2021
- January 31, 2023
134,482.95 January 31, 2024 February 1,
2023 - January 31, 2024

12
141,207.10 January 31, 2025 February 1,
2024 - January 31, 2025
DUMAGUETE BRANCH
GF EROS BLDG. DR. V. LOCSIN & REAL STS.POBLACION 8, DUMAGUETE CITY 6200
129,654.00 January 01, 2020 January 1, 2019
- January 1, 2020
117,810.00 January 01, 2021 January 1, 2020 - January 1, 2021
123,700.50 January 01, 2022 January 1, 2021 - January 1, 2022
129,886.46 January 01, 2023 January 1, 2022
- January 1, 2023
136,380.97 January 01, 2024 January 1, 2023
- January 1, 2024
143,200.86 January 01, 2025 January 1, 2024
- January 1, 2025
BORONGAN BRANCH
JRC BLDG., REAL ST., BRGY. SONGCO, BORONGAN EASTERN SAMAR 6800
53,532.63 October 31, 2025 November 1,
2020 - October 31, 2025
LEGANES BRANCH
PESTAÑO COMMERCIAL BUILDING, DOORS 4,5&6, POBLACION, LEGANES, ILOILO 5000
61,742.17 December 31,
2020
January 1, 2019 - December 31,
2020
66,064.12 December 31,
2021
January 1, 2020 - December 31,
2021
KALIBO BRANCH G/F Cruzadel Bldg, Archbishop Reyes St. Poblacion, Kalibo, Aklan
44,210.53 March 31, 2020 April 1, 2019 - March 31, 2020
46,421.05 March 31, 2021 April 1, 2020 - March 31, 2021
48,742.10 March 31, 2022 April 1, 2021 -
March 31, 2022
51,179.21 March 31, 2023 April 1, 2022 - March 31, 2023
LA UNION Kenny Plaza, Quezon Ave., Catbangen, San Fernando City, La Union
90,105.26 February 28,
2022
March 1, 2017 - February 29,
2022
LUCENA BRANCH Ground Floor ML Tagaro Street, Barangay 5, Lucena City, Quezon
110,270.72 May 20, 2023 May 21, 2020 - May 20, 2023
LEGAZPI BRANCH Mezzanin Floor of the Tower Mall Building 4, Landco Business Park, Legazpi City
125,635.68 January 31, 2020 February 1, 2019
- January 31, 2020
125,635.68 January 31, 2021 February 1,
2020 - January 31, 2021
131,917.46 January 31, 2022 February 1, 2021
- January 31, 2022
138,513.33 January 31, 2023 February 1,
2022 - January 31, 2023
145,438.99 January 31, 2024 February 1,
2023 - January 31, 2024
LIPA BRANCH G/F 1NK Centre, General Luna St., Sabang, Lipa City, Batangas
85,413.82 October 04, 2020
October 5, 2019 - October 4,
2020
89,684.51 October 04, 2021 October 5,
2020 - October 4, 2021

13
94,168.73 October 04,
2022
October 5, 2021 - October 4,
2022
DAGUPAN CITY Rudel Bldg., Perez Blvd. corner Guilig St., Dagupan City
67,032.00 May 31, 2020 June 1, 2019 - May 31, 2020
70,383.60 May 31, 2021 June 1, 2020 - May 31, 2021
CABANATUAN CITY 701 PACO ROMAN STREET, DIMASALANG CABANATUAN CITY, NUEVA ECIJA
72,546.54 December 04,
2020 Dec. 4, 2019 - Dec. 4, 2020
76,173.87 December 04,
2021 Dec. 4, 2020 - Dec. 4, 2021
79,982.56 December 04, 2022
Dec. 4, 2021 - Dec. 4, 2022
TARLAC CITY PLAZA DE ORO ARCADE MC ARTHUR HIGHWAY POBLACION 2, TARLAC CITY
105,063.50 December 07,
2020
December 8, 2019 -
December 7, 2020
110,316.67 December 07,
2021
December 8, 2020 -
December 7, 2021
115,832.51 December 07,
2022
December 8, 2021 -
December 7, 2022
CALOOCAN BRANCH
DIANNE BUILDING 746 RIZAL AVENUE EXTENSION GRACE PARK CALOOCAN CITY
236,256.00 October 31, 2020 November 1,
2019 - October 31, 2020
252,793.92 October 31, 2021 November 1,
2020 - October 31, 2021
270,489.49 October 31, 2022 November 1,
2021 - October 31, 2022
DASMARIÑAS BRANCH
Lot 5 & 6, Block 94, Governor's Drive, Metrogate Subdivision, Dasmarinas City, Cavite
52,800.00 December 31,
2020
January 1, 2020 - December 31,
2020
52,800.00 December 31, 2021
January 1, 2021 - December 31,
2021
58,080.00 December 31, 2022
January 1, 2022 - December 31,
2022
58,080.00 December 31,
2023
January 1, 2023 - December 31,
2023
OLONGAPO CITY, ZAMBALES
G/F PHIL. NATIONAL RED CROSS BLDG. MAGSAYSAY STREET OLONGAPO CITY ZAMBALES
111,157.89 June 30, 2020 July 1, 2019 -
June 30, 2020
116,715.79 June 30, 2021 July 1, 2020 - June 30, 2021
122,551.58 June 30, 2022 July 1, 2021 - June 30, 2022
128,679.16 June 30, 2023 July 1, 2022 -
June 30, 2023
MATI BRANCH ANDRADA BLDG. NO. 56 RIZAL ST. MATI CITY, DAVAO ORIENTAL
55,362.26 February 28,
2020
March 1, 2019 - February 28,
2020
58,130.37 February 28, 2021
March 1, 2020 - February 28,
2021
61,036.90 February 28, 2022
March 1, 2021 - February 28,
2022

14
64,088.74 February 28,
2023
March 1, 2022 - February 28,
2023
NAGA BRANCH Door #44-45 CBD II Terminal, Triangulo, Naga City, Camarines Sur
62,233.92 April 30, 2020 May 01, 2019 - April 30, 2020
65,345.61 April 30, 2021 May 01, 2020 - April 30, 2021
68,612.89 April 30, 2022 May 01, 2021 - April 30, 2022
72,043.53 April 30, 2023 May 01, 2022 - April 30, 2023
DIGOS BRANCH UNIT NO. 6,7 & 8 USPD BLDG. RIZAL AVENUE ZONE III DIGOS CITY, DAVAO DEL SUR
93,767.63 April 30, 2020 May 01, 2019 - April 30, 2020
98,456.02 April 30, 2021 May 01, 2020 - April 30, 2021
103,378.82 April 30, 2022 May 01, 2021 - April 30, 2022
108,547.77 April 30, 2023 May 01, 2022 - April 30, 2023
URDANETA CITY, PANGASINAN
UNIT 18 & 19 HONACO COMMERCIAL BLDG. NANCAYASAN URDANETA CITY, PANGASINAN
77,262.79 March 31, 2020 April 01, 2019 - March 31, 2020
81,125.92 March 31, 2021 April 01, 2020 - March 31, 2021
85,182.22 March 31, 2022 April 01, 2021 - March 31, 2022
89,441.33 March 31, 2023 April 01, 2022 - March 31, 2023
TAYTAY BRANCH National Road, Ilog Pugad, Barangay San Juan, Taytay, Rizal
98,858.28 August 31, 2020 September 01, 2019 - August
31, 2020
108,744.10 August 31, 2021 September 01, 2020 - August
31, 2021
BAGUIO CITY G/F INSULAR LIFE BLDG., ABANAO CORNER LEGARDA ST., BAGUIO CITY, BENGUET
141,377.04 September 30, 2020
October 01, 2019 -
September 30, 2020
151,273.92 September 30,
2021
October 01, 2020 -
September 30, 2021
161,862.96 September 30,
2022
October 01, 2021 -
September 30, 2022
173,192.88 September 30,
2023
October 01, 2022 -
September 30, 2023
NORTH CALOOCAN BRANCH
R-V Sabangan Building, Door 1-4, 500 Susano Road, Hilcrest Village, Camarin, Caloocan City
45,920.00 March 30, 2024 March 31, 2019- March 30, 2024
SURIGAO BRANCH Ground Floor Parkway Mall Km 3, Barangay Luna, National Highway, Surigao City
84,595.70 June 11, 2020 June 12, 2019 - June 11, 2020
93,055.27 June 11, 2021 June 12, 2020 -
June 11, 2021
102,360.80 June 11, 2022 June 12, 2021 - June 11, 2022
112,596.87 June 11, 2023 June 12, 2022 - June 11, 2023

15
123,856.55 June 11, 2024 June 12, 2023 - June 11, 2024
SANTIAGO CITY, ISABELA
Insular Life Building, Maharlika Highway, Santiago City, Isabela 50,599.54 April 01, 2020
May 1, 2019- April 2020
55,615.36 April 01, 2021 May 1, 2019- April 2021
61,176.36 April 01, 2022 May 1, 2019- April 2022
67,293.46 April 01, 2023 May 1, 2019- April 2023
74,022.94 April 01, 2024 May 1, 2019- April 2024
BUTUAN BRANCH Ismael Elloso Street, corner JC Aquino Avenue and Imadejas Subdivision, Butuan City
70,371.42 April 30, 2020 May 1, 2019 -
April 30, 2020
73,889.99 April 30, 2021 May 1, 2020 - April 30, 2021
77,584.49 April 30, 2022 May 1, 2021 -
April 30, 2022
81,463.72 April 30, 2023 May 1, 2022 -
April 30, 2023
85,536.90 April 30, 2024 May 1, 2023 -
April 30, 2024
CALAPAN BRANCH Pure Gold - Calapan, J.P. Rizal Street, Barangay Camilmil, Calapan City, Oriental Mindoro
80,922.82 September 08,
2020
Sept. 09, 2019 - September 08,
2020
80,922.82 September 08, 2021
Sept. 09, 2020 - September 08,
2021
84,968.96 September 08,
2022
Sept. 09, 2021 - September 08,
2022
89,217.40 September 08,
2023
Sept. 09, 2022 - September 08,
2023
93,678.27 October 08, 2024
Sept. 09, 2023 - October 08,
2024
MARIKINA BRANCH # 3 G. Fernando Avenue, San Roque, Marikina City
114,785.40 June 04, 2020 June 5, 2019- June 4, 2020
120,524.71 June 04, 2021 June 5, 2020- June 4, 2021
126,550.95 June 04, 2022 June 5, 2021- June 4, 2022
132,878.49 June 04, 2023 June 5, 2022- June 4, 2023
139,522.42 June 04, 2024 June 5, 2023- June 4, 2024
TAGUIG BRANCH 48 Gen. Alfredo Santos Ave., Lower Bicutan, Taguig City
63,150.00 September 28,
2020
September 29, 2019 -
September 28, 2020
64,413.00 September 28,
2021
September 29, 2020 -
September 28, 2021
65,701.26 September 28,
2022
September 29, 2021 -
September 28, 2022
67,015.29 September 28,
2023
September 29, 2022 -
September 28, 2023

16
68,355.59 September 28, 2024
September 29, 2023 -
September 28, 2024
LEMERY BRANCH National Road, Barangay Malinis 4209, Lemery, Batangas 70,000.00
September 27, 2020
Sept. 28, 2019 - September 27,
2020
73,500.00 September 27, 2021
Sept. 28, 2020 - September 27,
2021
73,500.00 September 27, 2022
Sept. 28, 2021 - September 27,
2022
77,175.00 September 27,
2023
Sept. 28, 2022 - September 27,
2023
77,175.00 September 27, 2024
Sept. 28, 2023- September 27,
2024
GUMACA BRANCH A Bonifacio Street, Barangay Tabing Dagat, Gumaca, Quezon
15,411.58 August 22, 2020 August 23, 2019
- August 22, 2020
16,952.74 August 22, 2021 August 23,
2020 - August 22, 2021
18,648.01 August 22, 2022 August 23, 2021
- August 22, 2022
20,512.81 August 22, 2023 August 23,
2022 - August 22, 2023
22,564.09 August 22, 2024 August 23,
2023 - August 22, 2024
LAS PINAS BRANCH Alabang - Zapote Road Corner Crispina Avenue, Pamplona, Las Pinas City
137,916.18 May 31, 2020 June 1, 2019 - May 31, 2020
144,812.00 May 31, 2021 June 1, 2020 - May 31, 2021
NAVOTAS BRANCH 807 to 817 M. Naval St., Navotas, Metro Manila
59,693.63 May 31, 2020 June 1, 2019 - May 31, 2020
62,678.30 May 31, 2021 June 1, 2020 - May 31, 2021
STA. CRUZ BRANCH P. Guevarra Street, Poblacion, Barangay IV, Sta. Cruz, Laguna 79,205.93 October 14, 2019
October 15, 2018 - October
14, 2019
MARILAO, BULACAN G/F RL Building McArthur Highway Abangan Norte, Marilao Bulacan
55,000.00 November 17,
2020
November 17, 2019 -
November 17, 2020
55,000.00 November 17,
2021
November 17, 2020 -
November 17, 2021
57,750.00 November 17,
2022
November 17, 2021 -
November 17, 2022
60,637.50 November 17, 2023
November 17, 2022 -
November 17, 2023
63,669.38 November 17, 2024
November 17, 2023 -
November 17, 2024

17
GEN SANTOS BRANCH
Santiago Blvd., Brgy. Dadiangas South, General Santos City
89,443.20 December 25, 2019
December 25, 2018 -
December 25, 2019
SORSOGON BRANCH
AD Reyes Building 1461 Magsaysay Street, Barangay Salog, Sorsogon City
93,025.00 December 07, 2020
December 8, 2019 -
December 7, 2020
97,676.25 December 07, 2021
December 8, 2020 -
December 7, 2021
102,560.06 December 07,
2022
December 8, 2021 -
December 7, 2022
107,688.07 December 07,
2023
December 8, 2022 -
December 7, 2023
113,072.47 December 07,
2024
December 8, 2023 -
December 7, 2024
PALAWAN BRANCH
Unit 1-A Ground Floor UnionBank Building, Rizal Avenue Corner Dacanay Street, Barangay Maningning, Puerto Princesa City, Palawan
56,484.34 February 04, 2025
February 5, 2020- February
4, 2025
SAN JOSE, NUEVA ECIJA
MARIO SALVADOR BUILDING, MAHARLIKA HIGHWAY BRGY. MALASIN SAN JOSE CITY, NUEVA ECIJA
101,581.58 March 31, 2025 April 1, 2020 - March 31, 2025
SAN JOSE DEL MONTE, BULACAN
DALISAY BLDG., QUIRINO HIGHWAY, BRGY. MAHARLIKA, SAN JOSE DEL MONTE CITY, BULACAN
88,897.25 April 12, 2020 April 13, 2019 - April 12, 2020
Brgy. Kaypian, Quirino Highway, San Jose Del Monte Bulacan
60,000.00 April 12, 2021 January 12,
2020- April 12, 2021
60,000.00 April 12, 2022 April 12, 2021- April 12, 2022
63,000.00 April 12, 2023 April 12, 2022- April 12, 2023
66,150.00 April 12, 2024 April 12, 2023- April 12, 2024
69,457.50 April 12, 2025 April 12, 2024- April 12, 2025
ANGELES, PAMPANGA
G/F Diamond Spring Hotel, 192 McArthur Highway, Brgy. Balibago Angeles City, Pampanga
110,838.60 April 06, 2020 April 7, 2019 - April 6, 2020
116,380.53 April 06, 2021 April 7, 2020 - April 6, 2021
122,199.54 April 06, 2022 April 7, 2021 - April 6, 2022
128,309.51 April 06, 2023 April 7, 2022 - April 6, 2023
134,724.99 April 06, 2024 April 7, 2023 - April 6, 2024
141,461.23 April 06, 2025 April 7, 2024 - April 6, 2025
VALENZUELA BRANCH
389 MCARTHUR HIGHWAY, MALINTA VALENZUELA CITY
129,654.00 March 31, 2025 April 1, 2020 - March 31, 2025

18
DAET BRANCH
Ground Floor Central Plaza Mall, Central Plaza Complex, Barangay Lag-on, Daet, Camarines Norte
88,905.60 April 30, 2025 May 1, 2020 - April 30, 2025
IRIGA BRANCH Zone 5, Highway 1, San Miguel, Iriga City
71,265.60 June 12, 2025 June 13, 2020 - June 12, 2025
SOLANO, NUEVA VISCAYA
G/F ONGTAO BUILDING, JP RIZAL AVE. COR. BURGOS ST., SOLANO, NUEVA VISCAYA
69,877.50 April 30, 2025 May 1, 2020 - April 30, 2025
PAGADIAN BRANCH F&N Building, San Francisco District, Pagadian City, Zamboanga del Sur
79,735.37 April 30, 2020 May 1, 2019 -
April 30, 2020
77,500.00 April 30, 2025 May 1, 2020 - April 30, 2025
ESPAÑA BRANCH 1880 Espana Gallery Building, San Diego and Quintos Sts., cor. España Blvd., Sampaloc, Manila
194,481.00 May 27, 2020 May 28, 2019 - May 27, 2020
TONDO BRANCH Ushio Plaza V Honorio Lopez Blvd., Tondo, Manila
86,821.87 June 09, 2025 June 10, 2020 - June 9, 2025
SAN JOSE, OCC. MIN. BRANCH
Lebrilla Ang Building, Burgos Corner Rizal Street, Barangay Poblacion 1, San Jose Occidental Mindoro
69,631.57 June 30, 2025 July 1, 2020 - June 30, 2025
INFANTA, QUEZON BRANCH
General Luna Street, Publacion 39, Infanta Quezon Province 18,278.29 July 31, 2020
August 1, 2019 - July 31, 2020
19,192.21 July 31, 2021 August 1, 2020 -
July 31, 2021
20,151.82 July 31, 2022 August 1, 2021 -
July 31, 2022
21,159.41 July 31, 2023 August 1, 2022 -
July 31, 2023
22,217.38 July 31, 2024 August 1, 2023 -
July 31, 2024
23,328.25 July 31, 2025 August 1, 2024 -
July 31, 2025
MASBATE BRANCH Upper Ground Floor, Gaisano Capital Mall, National Highway, Masbate City
72,685.32 August 30, 2025 August 31, 2020
- August 30, 2025
ANONAS BRANCH Ground Floor Belmont Place Bldg. No.5 Anonas St., Project 3, Quezon City
74,875.19 July 22, 2025 July 23, 2020 - July 22, 2025
ALAMINOS, PANGASINAN
Quezon Avenue Poblacion, Alaminos City Pangasinan 82,687.50 June 30, 2025
July 1, 2020 - June 30, 2025
DIPOLOG BRANCH
Bulosan Building, Sergio Osmeña St., Central Barangay, Dipolog City, Zamboanga Del Norte
31,578.95 July 23, 2025 July 24, 2020 - July 23, 2025
42,000.00 July 23, 2025 July 23, 2020- July 23, 2025
KORONADAL BRANCH
Villa Amor Hotel, Door 14, General Santos Drive corner Arellano Street, Koronadal City, General Santos
88,164.72 July 22, 2025 July 23, 2020 - July 22, 2025
ZAMBOANGA BRANCH
RHW Building Mayor Jaldon St., Brgy. Canelar, Zamboanga City 70,093.46
December 20, 2025
December 21, 2020 -
December 20, 2025
KIDAPAWAN BRANCH
G/F Aspilla Bldg. Quirino Drive, North Cotabato, Kidapawan City
55,125.00 June 15, 2020 June 16, 2019 - June 15, 2020
57,881.25 June 15, 2021 June 16, 2020 - June 15, 2021
BALIWAG, BULACAN Unit 2 & 3, R. Building, DRT Hi-way, Brgy. Pinagbarilan, Baliwag, Bulacan
81,900.00 April 09, 2020 April 10, 2019 - April 9, 2020

19
85,995.00 April 09, 2021 April 10, 2020 - April 9, 2021
90,294.75 April 09, 2022 April 10, 2021 - April 9, 2022
94,809.49 April 09, 2023 April 10, 2022 - April 9, 2023
STA. ROSA BRANCH G/F Unitop Building, Balibago Complex, Balibago, Sta. Rosa, Laguna
58,500.00 October 31, 2024 November 1,
2019 - October 31, 2024
SAN FERNANDO, PAMPANGA
Unit 102 Suburbia Commercial Center, Mc Arthur Highway, Maimpis, San Fernando City, Pampanga
96,630.60 March 31, 2020 April 1, 2016 -
March 31, 2020
101,462.13 March 31, 2021 April 1, 2020- March 31, 2021
NAVAL BRANCH LITE
208 P. Inocentes St., Naval, Biliran
12,487.25 August 31, 2025 September 1,
2020 - August 31, 2025
ESTANCIA BRANCH LITE
National Highway, Brgy.. Tabuan, Estancia, Iloilo 16,500.00 July 31, 2021
August 1, 2018 - July 31, 2021
CATBALOGAN BRANCH LITE
P-3, Brgy.. Mercedes, Catbalogan City, Samar
13,070.77 September 10, 2025
September 11, 2020 -
September 10, 2025
GUIMARAS BRANCH LITE
E. Cantua Bldg., Brgy.. San Miguel, Jordan, Guimaras
6,631.58 September 14,
2020
September 15, 2019 -
September 14, 2020
6,963.16 September 14,
2021
September 15, 2020 -
September 14, 2021
TABUK, KALINGA Commercial Space 2, Purok 2, Provincial Rd. Bulanao, Tabuk City, Kalinga Apayao
18,232.60 September 30, 2025
October 1, 2020 - September 30,
2025
VIRAC BRANCH LITE
Unit 21 Ground Floor Virac Town Center, Rizal Avenue, Barangay Gogon Sirangan Virac, Catanduanes
38,428.82 October 31, 2020 November 1,
2019 - October 31, 2020
40,350.26 October 31, 2021 November 1,
2020 - October 31, 2021
BALER, AURORA Etcubañez Building, Ground Floor, Purok 7 Quezon St. Brgy. Suklayin Baler Aurora
35,000.00 December 03,
2020
December 04, 2019 -
December 03, 2020
36,750.00 December 03,
2021
December 04, 2020 -
December 03, 2021
38,587.50 December 03, 2022
December 04, 2021 -December
03, 2022
40,516.88 December 03,
2023
December 04, 2022 -
December 03, 2023
42,542.72 December 03, 2024
December 04, 2023 -
December 03, 2024
DANAO BRANCH LITE
Ground Floor, GA Complex 2, Juan Luna St., Danao City, Cebu
15,789.47 November 15, 2020
November 16, 2019 -
November 15, 2020

20
16,578.95 November 15, 2021
November 16, 2020 -
November 15, 2021
CADIZ BRANCH LITE Laura Hotel, Villena St., Zone 2, Cadiz City, Negros Occidental 14,817.60
September 30, 2020
October 1, 2019 - September 30,
2020
15,558.48 September 30,
2021
October 1, 2020 - September 30,
2021
15,558.48 September 30, 2022
October 1, 2021 - September 30,
2022
16,336.40 September 30,
2023
October 1, 2022 - September 30,
2023
ILIGAN BRANCH LITE Barangay Mahayahay, Roxas Avenue, Iligan City 21,052.63 October 17, 2021
October 18, 2018 - October
17, 2021
VALENCIA BRANCH LITE
Unit 2, Velox Energy Gas Station, Sayre Highway, Hagkol Poblacion, Valencia City,Bukidnon
19,992.00 October 04, 2020
October 5, 2019 - October 4,
2020
20,991.60 October 04, 2021 October 5,
2020 - October 4, 2021
SAN FRANCISCO BRANCH LITE
GF-01, Gaisano Capital San Francisco, Brgy. 5, National Highway, San Francisco, Agusan Del Sur.
32,413.51 September 28,
2025
September 29, 2020 -
September 28, 2025
GOA BRANCH LITE #102 Rizal St. Goa, Camarines Sur 9,596.10 April 26, 2020
April 27, 2019 - April 26, 2020
10,606.22 April 26, 2021 April 27, 2020 - April 26, 2021
11,136.53 April 26, 2022 April 27, 2021 - April 26, 2022
MEYCAUAYAN, BULACAN
Meycauayan College Commercial Center, McArthur Highway, Brgy. Calvario, Meycauayan City, Bulacan
12,101.04 April 26, 2020 April 27, 2019 - April 26, 2020
12,706.09 April 26, 2021 April 27, 2020 - April 26, 2021
NABUNTURAN BRANCH LITE
Door #3 Tsukiko Bldg. LB Flores St. Purok 13 Poblacion Nabunturan, Compostela Valley
12,631.58 May 04, 2021 May 6, 2019 - May 4, 2021
MANGAGOY, BISLIG BRANCH LITE
Saint Vincent de Paul College Arcade, John Bosco Road, Mangagoy, Bislig City, Surigao del Sur
6,600.00 April 19, 2022 April 19, 2019-April 19, 2022
TANDAG BRANCH LITE
#11 Purok Saturn, Telaje, Capitol Road, Tandag City, Surigao Del Sur
15,000.00 December 07,
2023
December 7, 2018-December
7, 2023 CABARROGUIS BRANCH LITE
Purok 1, Gundaway, Cabarroguis, Quirino
12,560.75 July 17, 2023 July 18, 2018 - July 17, 2023
BANGUED, ABRA Snooks Commercial Building, National Highway Torrijos St. Zone 5, Bangued, Abra
10,467.28 July 17, 2020 July 18, 2019 - July 17, 2020
10,781.31 July 17, 2021 July 18, 2020 - July 17, 2021
11,104.74 July 17, 2022 July 18, 2021 - July 17, 2022
11,437.89 July 17, 2023 July 18, 2022 - July 17, 2023
BONTOC, MT. PROVINCE
Purok 1, Gundaway, Cabarroguis, Quirino
11,514.01 July 17, 2020 July 18, 2019 - July 17, 2020

21
12,089.72 July 17, 2021 July 18, 2020 - July 17, 2021
12,694.20 July 17, 2022 July 18, 2021 - July 17, 2022
13,328.91 July 17, 2023 July 18, 2022 - July 17, 2023
LAGAWE, IFUGAO No. 7 Rizal Avenue, Poblacion East, Lagawe, Ifugao
10,739.44 July 17, 2020 July 18, 2019 - July 17, 2020
11,276.41 July 17, 2021 July 18, 2020 - July 17, 2021
11,840.24 July 17, 2022 July 18, 2021 - July 17, 2022
12,432.24 July 17, 2023 July 18, 2022 - July 17, 2023
LUNA, APAYAO 2nd Flr. Awali Square Building, San Isidro, Luna, Apayao
7,894.74 July 17, 2020 July 18, 2019 - July 17, 2020
8,289.47 July 17, 2021 July 18, 2020 - July 17, 2021
8,703.95 July 17, 2022 July 18, 2021 - July 17, 2022
9,139.15 July 17, 2023 July 18, 2022 - July 17, 2023
IPIL BRANCH LITE CL Arcade, Poblacion, Ipil, Zamboanga Sibugay, Province
25,121.50 August 15, 2020 August 16, 2019
- August 15, 2020
27,633.65 August 15, 2021 August 16, 2020
- August 15, 2021
27,633.65 August 15, 2022 August 16, 2021
- August 15, 2022
30,397.01 August 15, 2023 August 16, 2022
- August 15, 2023
MALITA BRANCH LITE
Lustre Building, Manuel Peralta St., Malita, Davao Occidental
10,526.31 August 14, 2020 August 15, 2019
- August 14, 2020
11,052.63 August 14, 2021 August 15, 2020
- August 14, 2021
GLAN BRANCH LITE
Space 3, Anares Building, Hombrebueno Street, Poblacion, Glan, Sarangani Province
8,421.05 September 06, 2021
September 7, 2018 -
September 6, 2021
ISULAN BRANCH LITE
Unit 4, Second Flr. RDPI Building, National Highway Kalawag 2, Isulan, Sultan Kudarat
15,700.93 August 01, 2021 August 1, 2018 - August 1, 2021
ABULUG Near Abulug Police Station Maharlika Highway Libertad Abulug Cagayan 3517
40,896.90 August 31, 2022 September 1, 2017 - August
31, 2022
ALICIA National Highway Magsaysay Alicia Isabela 3306
260,173.46 August 31, 2022 September 1, 2017 - August
31, 2022
ANTIPOLO BRANCH Unit 105 Rikland Center Marcos Highway Mayamot Antipolo City, Rizal
92,020.00 June 30, 2023 July 1, 2018 - June 30, 2023
BALANGA Arzadon Bldg Don Manuel Banzon Ave Dona Francisca Balanga City Bataan 2100
90,719.63 May 14, 2025 May 14, 2020 - May 14, 2025
BANTAY Real St., corner National Highway Zone 2 Bantay Ilocos Sur 2727
59,940.00 August 31, 2022 September 1, 2017 - August
31, 2022
BATANGAS BRANCH Junction Commercial Complex, Zone 12, Padre Burgos St., Batangas City, Batangas
109,807.50 February 28, 2025
February 28, 2020 -

22
February 28, 2025
BAYAMBANG
PR Savings Bank Bldg. Rizal Avenue Corner Juan Luna St. Poblacion Sur Bayambang Pangasinan 2423
127,993.50 August 31, 2022 September 1, 2017 - August
31, 2022
ECHAGUE Garfunkel Fine Properties National Highway San Fabian Echague Isabela 3309
78,498.60 August 31, 2022 September 1, 2017 - August
31, 2022
ILAGAN National Highway Baligatan Ilagan City Isabela 3300
107,266.20 August 31, 2022 September 1, 2017 - August
31, 2022
PLARIDEL AAM Building Cagayan Valley Road Banga 1st Plaridel Bulacan 3004
67,634.29 May 05, 2025 May 5, 2020 - May 5, 2025
RAMON PR Savings Bank Bldg. Purok1 National Highway Bugallon Proper Ramon Isabela 3319
35,479.50 August 31, 2022 September 1, 2017 - August
31, 2022
TAGAYTAY BRANCH Lot I2(Briones Derm Clinique) E. Aguinaldo Highway, Brgy. San Jose, Tagaytay City, Cavite
60,000.00 October 13, 2020 October 14,
2019- October 13, 2020
63,000.00 October 13, 2021 October 14,
2020- October 13, 2021
66,150.00 October 13, 2022 October 14,
2021- October 13, 2022
69,457.50 October 13, 2023 October 14,
2022- October 13, 2023
72,930.38 October 13, 2024 October 14,
2023- October 13, 2024
NAGUILIAN Magsaysay District, Naguilian, Isabela, 3302
20,134.80 August 31, 2022 September 01,
2017- August 31, 2022
APARRI Maharlika Highway, Macanaya, Aparri, Cagayan
36,602.50 March 31, 2020 March 31, 2019- March 30, 2020
38,432.63 March 31, 2021 March 31, 2020- March 30, 2021
40,354.26 March 31, 2022 March 31, 2021- March 31, 2022
CANDON Long National Highway San Nicolas Candon City Ilocos Sur
8,500.00 March 17, 2021 March 18, 2018- March 17, 2021
BACOOR BRANCH G/F San Miguel Bldg, Panapaan I, Aguinaldo Hi-way Bacoor Cavite
79,007.91 May 31, 2024 June 1, 2019 - May 31, 2024
SAN CARLOS Pagsolingan Bldg. Rizal Avenue, San Carlos City, Pangasinan 3,325.00 March 12, 2025
March 13, 2020 - March 12, 2025
IBA BRANCH LITE 2F Rhoi Bldg Posadas St. National Highway, Palanginan, Iba, Zambales
14,113.49 May 31, 2025 May 31, 2020 - May 31, 2025
DINALUPIHAN BRANCH LITE
Brgy.. Burgos,Dinalupihan Bataan 27,353.55 May 01, 2025
May 1, 2020 - May 1, 2025
TUGUEGARAO De Yro Building Mabini Street Ugac Norte Tuguegarao City Cagayan 3500
155,278.85 February 28,
2020
March 1, 2019- February 28,
2020
70,000.00 February 27, 2022
February 28, 2020 -
February 27, 2022
72,100.00 February 27,
2023
February 28, 2022 - February
27, 2023

23
74,263.00 February 27,
2024
February 28, 2023 - February
27, 2024
76,490.89 February 27,
2025
February 28, 2024 - February
27, 2025 TANAY, RIZAL BRANCH
#23 M.H. Del Pilar Street, Brgy.. Plaza Aldea, Tanay, Rizal 10,000.00 March 2, 2025
March 2, 2020 - March 2, 2025
NASUGBU, BATANGAS BRANCH LITE
HBT Building JP Laurel St., Brgy.. 9 Nasugbu, Batangas
16,842.11 March 2, 2021 March 2, 2020 - March 2, 2021
MARINDUQUE BRANCH LITE
Brgy.. Malusak, Boac, Marinduque
17,407.89 March 2, 2025 March 2, 2020 - March 2, 2025
ROMBLON BRANCH 2nd Flr., Rose Petal Bldg. Brgy.. Dapawan, Odiongan, Romblon 9,345.79 March 2, 2025
March 2, 2020 - March 2, 2025
IROSIN BRANCH LITE JRC Bldg. Fr. Zamora St., Barangay San Julian, Irosin, Sorsogon
15,789.47 March 2, 2025 March 2, 2020 - March 2, 2025
BAYAWAN BRANCH LITE
Poblacion, Bayawan City, Negros Oriental
27,368.42 February 28, 2025
February 28, 2020 -
February 28, 2025
MAASIN BRANCH LITE
Aquino- Ledesma Suites, R. Kangleon St. Brgy.. Tagnipa, Maasin Southern Leyte
9,473.68 March 31, 2025 March 31, 2020
- March 31, 2025
IMELDA BRANCH LITE
National Highway, Poblacion, Imelda, Zamboanga Sibugay 12,631.58 March 1, 2023
March 1, 2020 - March 1, 2023
SINDANGAN BRANCH LITE
Mabini St. corner Fr. Zamora St., Poblacion, Sindangan, Zamboanga del Norte.
16,800.00 March 4, 2025 March 4, 2020 - March 4, 2025
TUBOD BRANCH LITE
2 Flr. A & A Parklane Building, Poblacion, Tubod, Lanao Del Norte
16,800.00 March 1, 2025 March 2, 2020 - March 1, 2025
OZAMIS BRANCH LITE
Zamora St., Barangay 50th, Ozamis City 15,789.47 March 1, 2025
March 1, 2020 - March 1, 2025
SAN JOSE, DINAGAT BRANCH LITE
DM Avenue P-1 Brgy.. San Juan, San Jose Poblacion, Dinagat Island (Landmark: San Jose Public Market)
15,789.47 March 1, 2025 March 1, 2020 - March 1, 2025
MIDSAYAP BRANCH LITE
Rizal St., corner Magallanes St., Poblacion 3, Midsayap, North Cotabato
15,789.47 March 2, 2023 March 2, 2020 - March 2, 2023
FAIR BANK
Branch Name Address Monthly Rental
Expiration of Lease
Term of Renewal
CARCAR BRANCH San Vicente St., Cogon, Carcar Cebu 15,000.00 June 1, 2023 3 years
MANDAUE BRANCH CQR bldg., 251 SB, Cabahug Street Ibabao Estancia, Mandaue City
15,000.00 September 14,
2021 1 year
SAN CARLOS BRANCH
Ilang- Ilang St. San Julio Subd., San Carlos, Negros
7,500.00 June 1, 2023 3 years
SIBULAN BRANCH Campaclan, Poblacion, Sibulan, Negros Oriental 10,000.00 June 1, 2023 3 years
TOLEDO BRANCH Poblacion, Toledo City, Cebu 15,000.00 February 3, 2023 3 years
TUBIGON BRANCH Poblacion, Tubigon, Bohol 12,000.00 December 29,
2021 1 year
KABANKALAN BLU Barangay 1, Los Angeles cor. Oklahoma Sts., Kabankalan City Negros Occidenta
6,550.00 June 1, 2021 1 year
SILAY BLU Zone 1, Antilla Subd, Silay City 11,000.00 June 30, 2021 7 months and 24 days

24
BAGO BLU Purok Matinipigon 1A Brgy.. Lag- asan, Bago City, Negros Occidental
8,000.00 June 1, 2022 3 years
DANAO BLU Tuburan Sur, Danao City, Cebu 12,350.00 April 14, 2021 1 year
ESCALANTE BLU Lt. Varca St., Escalante City 10,000.00 June 30, 2021 7 months and
23 days
BANGKO KABAYAN
Branch Name Address Monthly Rental
Expiration of Lease
Term of Renewal
BATANGAS BRANCH 76 E. P. burgos St. Batangas City 99,207.42 March 31, 2021 every 5 years
SAN JOSE Makalintal Avenue, Brgy.. Taysan, San Jose, Batangas
60,717.89 October 02, 2021 every 5 years
CALATAGAN Poblacion, Calatagan, Batangas 8,933.97 March 01, 2025 every 15 years
SARIAYA Poblacion, Sariaya, Quezon 25,467.75 July 25, 2027 every 15 years
TIAONG Poblacion I, Tiaong, Quezon 11,025.00 August 17, 2027 every 15 years
AGONCILLO Poblacion, Agoncillo, Batangas 17,697.77 August 17, 2024 every 5 years
LOBO Lobo, Batangas 9,408.00 June 30, 2021 1 year
LIPA Laserta Building, Lipa City 63,157.89 November 30, 2025
every 5 years
TALISAY Brgy. Banga, Talisay, Batangas 20,897.94 March 01, 2026 every 10 years
ATIMONAN 280 P. Enriquez St. corner Rizal St. Atimonan, Quezon 17,173.50 March 31, 2026 every 10 years
GUMACA Brgy. Tabong Dagat, Gumaca, Quezon
19,845.00 April 08, 2026 every 10 years
BALAYAN Brgy. V., Balayan Batangas 33,157.89 January 30, 2028 every 10 years
TANAUAN
Unit 102, Emir Commercial Building, President J.P. Laurel Highway, Pob II., Tanauan City, Batangas
72,689.43 March 31, 2028 every 10 years
LEMERY National Highway, Brgy. Palanas, Lemery Batangas
49,193.76 February 28, 2027
every 10 years

COVER SHEET
3 6 0 7 3
S.E.C. Registration Number
U N I O N B A N K O F T H E P H I L I P P I N E S
(Company's Full Name)
U N I O N B A N K P L A Z A M E R A L C O A V E N U E
C O R O N Y X A N D S A P P H I R E S T R E E T S
O R T I G A S C E N T E R , P A S I G C I T Y
( Business Address : No. Street City / Town / Province )
FRANCIS B. ALBALATE (632)8667-6388
Contact Person Company Telephone Number
1 2 3 1 0 4 2 3
Month Day FORM TYPE Month Day
Fiscal Year Annual Meeting
Secondary License Type, If Applicable
C F D
Dept. Requiring this Doc. Amended Articles Number/Section
Total Amount of Borrowings
Total No. of Stockholders Domestic Foreign
To be accomplished by SEC Personnel concerned
File Number LCU
Document I.D. Cashier
S T A M P S
Remarks = pls. use black ink for scanning purposes
UNDERWRITER OF SECURITIES
SEC FORM 17Q
4,965

SECURITIES AND EXCHANGE COMMISSION
SEC FORM 17-Q
QUARTERLY REPORT PURSUANT TO SECTION 17 OF THE SECURITIES REGULATION CODE AND SRC RULE 17(2)(b) THEREUNDER
1. For the quarterly period ended : March 31, 2021
2. Commission identification number : 36073
3. BIR Tax Identification No. : 000-508-271-000
4. Exact name of registrant as specified in its charter : UNION BANK OF THE PHILIPPINES
5. Province, country or other jurisdiction of incorporation or organization : PHILIPPINES
6. Industry Classification Code : ________ (SEC Use Only)
7. Address of principal office : UBP Plaza, Meralco Avenue corner Onyx and Sapphire Roads, Ortigas Center, Pasig
8. Registrant’s telephone number, including area code : (632) 8667-6388
9. Former name, former address and former fiscal year
if changed since last report : Not Applicable
10. Securities registered pursuant to Section 8 and 12 of the Code, or Sections 4 and 8 of the SRC
Number of Share of Common Amount of Debt Outstanding Title of Each Class Stock Outstanding (Unpaid Subscription) Common Stock 1,219,362,818 None P10 par value
11. Are any or all of the securities listed on a Stock Exchange? Yes ( x ) No ( ) If yes, state the name of such stock exchange and the classes of securities listed therein: Stock Exchange : Philippine Stock Exchange Class of Securities : Common Shares
12. Indicate by check mark whether the registrant:
(a) Has filed all reports required to be filed by Section 17 of the Code and SRC Rule 17
thereunder or Section 11 of SRC and SRC Rule 11 (a)-1 thereunder and Section 26 and 141 of the Corporation Code of the Philippines during the preceding 12 months (or for such shorter period the registrant was required to file such reports) Yes (x) No ( )
(b) Has been subject to such filing requirements for the past 90 days Yes (x) No ( )


Annex 1
UNION BANK OF THE PHILIPPINES AND SUBSIDIARIES
UNAUDITED INTERIM CONSOLIDATED STATEMENTS OF CONDITION
March 31, 2021
(Amounts in PHP Thousands)
March 31, 2021 December 31, 2020
(Unaudited) (Audited)
ASSETS
Cash and Other Cash Items 9,124,808 8,958,042
Due From Bangko Sentral Ng Pilipinas 85,996,163 103,869,770
Due From Other Banks 35,919,247 68,532,218
Interbank Loans Receivables 14,760,470 -
Trading and Investment Securities
At fair value through profit or loss (FVTPL) 8,352,611 18,448,649
At amortized cost 146,730,837 155,810,967
At fair value through other comprehensive income (FVOCI) 54,237,042 31,190,259
Loans and Other Receivables - net 344,882,392 339,536,830
Investment in Associates 251,826 255,342
Bank Premises, Furniture, Fixtures
And Equipment - net 6,692,318 6,894,768
Investment Properties 9,052,940 8,922,366
Goodwill 14,818,932 15,348,531
Other Resources - net 16,491,396 16,691,495
TOTAL ASSETS 747,310,982 774,459,237
LIABILITIES AND CAPITAL FUNDS
Deposit Liabilities
Demand 171,946,305 159,783,546
Savings 105,530,757 98,957,845
Time 219,775,240 266,043,635
Long-term negotiable certificate of deposits 3,000,000 3,000,000
Deposit Liabilities 500,252,302 527,785,026
Bills Payable 52,763,267 54,223,543
Notes and Bonds Payable 60,739,868 59,853,656
Other Liabilities 29,515,975 27,444,610
Total Liabilities 643,271,412 669,306,835
CAPITAL FUNDS
Capital Funds Attributable to the Parent Bank's Stockholders:
Common stock 12,193,628 12,184,715
Additional paid-in capital 14,269,668 14,214,983
Surplus free 77,313,274 77,096,218
Surplus reserves 2,876,131 2,645,080
Net unrealized fair value gains
on investment securities (1,511,769) 55,384
Other reserves (14,844) (18,886)
Remeasurement of defined benefit plan (1,886,328) (1,815,784)
Total Capital Funds Attributable
to the Parent Bank's Stockholders: 103,239,760 104,361,710
Non-controlling Interests 799,810 790,692
TOTAL CAPITAL FUNDS 104,039,570 105,152,402
TOTAL LIABILITIES AND CAPITAL FUNDS 747,310,982 774,459,237

Annex 2
page 1 of 2
UNION BANK OF THE PHILIPPINES AND SUBSIDIARIES
UNAUDITED INTERIM CONSOLIDATED STATEMENTS OF INCOME
For the three months ended March 31, 2021 and 2020
(Amounts in PHP Thousands, Except Earnings per Share)
2021 (Unaudited) 2020 (Unaudited)
INTEREST INCOME ON
Loans and other receivables 6,736,394 7,511,726
Investment securities at amortized cost and FVOCI 1,788,228 2,008,255
Cash and cash equivalents 210,194 219,480
Financial assets at FVTPL 83,556 204,430
Interbank loans receivable 6,334 72,777
8,824,706 10,016,668
INTEREST EXPENSE ON
Deposit Liabilities 739,012 1,901,046
Bills payable and other liabilities 870,337 1,289,587
1,609,349 3,190,633
NET INTEREST INCOME 7,215,357 6,826,035
PROVISION FOR CREDIT LOSSES 2,334,015 1,326,948
NET INTEREST INCOME AFTER PROVISION
FOR CREDIT LOSSES 4,881,342 5,499,087
OTHER INCOME (EXPENSE)
Gains (losses) on investment securities at amortized cost 6,206,112 1,662,034
Service charges, fees and commissions 593,324 554,942
Gains (losses) on trading and investment securities at
FVTPL and FVOCI (363,842) 87,999
Miscellaneous income 636,319 400,056
7,071,913 2,705,031
OPERATING EXPENSES
Salaries and employee benefits 2,194,964 1,729,036
Taxes and licenses 751,674 802,388
Depreciation and amortization 336,321 320,546
Occupancy 229,131 233,223
Miscellaneous expense 2,743,200 1,969,928
6,255,290 5,055,121
INCOME BEFORE INCOME TAX 5,697,965 3,148,997
PROVISION FOR INCOME TAX 969,449 508,062
NET INCOME 4,728,516 2,640,935
Net income attributable to:
Equity holders of the Parent Bank 4,715,877 2,641,524
Non-controlling Interests 12,639 (589)
4,728,516 2,640,935
Basic/Diluted Earnings per Share Attributable
to Equity Holders of the Parent Bank (EPS)* 15.47 8.67
*Basic and Diluted EPS is based on annualized figures.
For the three months ended March 31

Annex 2
page 2 of 2
UNION BANK OF THE PHILIPPINES AND SUBSIDIARIES
UNAUDITED INTERIM CONSOLIDATED STATEMENTS OF COMPREHENSIVE INCOME
For the three months ended March 31, 2021 and 2020
(Amounts in PHP Thousands)
2021 (Unaudited) 2020 (Unaudited)
NET INCOME 4,728,516 2,640,935
OTHER COMPREHENSIVE INCOME (LOSS)
Items that will be reclassified subsequently to profit and loss
Unrealized mark to market gain (loss) on investment securities at FVOCI (1,531,187) (413,734)
Realized gain on sale of investment securities at FVOCI recognized in
profit or loss (35,966) (574,694)
Cumulative Foreign Currency Translation 4,042 -
Items that will not be classified to profit and loss
Remeasurements of defined benefit plan (8,161) (18,826)
Tax income (expense) (65,904) 5,648
(74,065) (13,178)
Total Other Comprenhensive Income (Loss), net of tax (1,637,176) (1,001,606)
TOTAL COMPREHENSIVE INCOME 3,091,340 1,639,329
Attributable to the:
Parent Bank's Stockholders 3,082,222 1,639,918
Non-controlling Interests 9,118 (589)
3,091,340 1,639,329
For the three months ended March 31

Annex 3
UNION BANK OF THE PHILIPPINES AND SUBSIDIARIESUNAUDITED INTERIM CONSOLIDATED STATEMENTS OF CHANGES IN EQUITYFor the three months ended March 31, 2021 and 2020(Amounts in PHP Thousands)
Net Unrealized
Fair Value
Gains (Losses) on Remeasurements
Additional Investment of Defined Other Non-controlling Total
Common Stock Paid-in Capital Surplus Free Surplus Reserves Securities Benefit Plan Reserves Total Interests Capital Funds
Balance at January 1, 2021 12,184,715 14,214,983 77,096,218 2,645,080 55,384 (1,815,784) (18,886) 104,361,710 790,692 105,152,402 Total comprehensive income (loss) for the period - - 4,715,877 - (1,567,153) (70,544) 4,042 3,082,222 9,118 3,091,340 Cash dividends - - (4,267,770) - - - - (4,267,770) - (4,267,770) Transfer to surplus reserves - - (231,051) 231,051 - - - - - - Issuance of new shares 8,913 54,685 - - - - - 63,598 - 63,598
Effect of business combination - - - - - - - - - -
Balance at March 31, 2021 12,193,628 14,269,668 77,313,274 2,876,131 (1,511,769) (1,886,328) (14,844) 103,239,760 799,810 104,039,570
Balance at January 1, 2020 12,176,096 14,172,060 67,851,771 4,600,747 78,437 (1,379,157) (3,549) 97,496,405 520,560 98,016,965
Total comprehensive income (loss) for the period - 2,641,524 - (988,428) (13,178) - 1,639,918 (589) 1,639,329
Cash dividends - (4,264,650) - - - - (4,264,650) - (4,264,650)
Transfer to surplus reserves - - - - - - - - - -
Issuance of new shares 8,619 42,923 - - - - - 51,542 - 51,542
Effect of business combination - - - - - - - - 181,658 181,658
Balance at March 31, 2020 12,184,715 14,214,983 66,228,645 4,600,747 (909,991) (1,392,335) (3,549) 94,923,215 701,629 95,624,844

Annex 4
UNION BANK OF THE PHILIPPINES AND SUBSIDIARIES
UNAUDITED INTERIM CONSOLIDATED STATEMENTS OF CASH FLOWS
(Amounts in PHP Thousands)
2021 2020
CASH FLOWS FROM OPERATING ACTIVITIES
Income before income tax 5,697,965 3,148,997
Adjustments for:
Gains on sale of investment securities at amortized cost (6,206,112) (1,662,034)
Provision for credit losses 2,334,015 1,326,948
Amortization of premium or discount 506,146 (2,568,459)
Depreciation and amortization 336,321 320,546
property and equipment (65,915) (31,616)
Gains on foreclosure of investment properties (59,097) (52,754)
Gains on sale of investment securities at FVOCI (35,966) (574,694)
Unrealized foreign exchange losses - net 27,298 206,352
Share in net profit of subsidiaries and associates 3,516 2,739
Changes in operating assets and liabilities:
Decreases (increases) in:
Loans and other receivables (28,368,395) 8,024,624
Financial assets at FVPTL 10,096,038 (15,194,672)
Other assets (340,481) (452,792)
Increases (decreases) in:
Deposit liabilities (27,532,724) 24,923,140
Other Liabilities 2,438,494 (2,330,007)
Net cash provided (used in) operations (41,168,898) 15,086,319
Income taxes paid (147,526) (380,753)
Net cash provided by (used in) operating activities (41,316,424) 14,705,566
CASH FLOWS FROM INVESTING ACTIVITIES
Acquisitions of:
Investment securities at amortized cost (41,040,530) (10,407,605)
Investment securities at FVOCI (28,503,197) (25,218,741)
Bank premises, furniture, fixtures and equipment (91,417) (175,985)
Proceeds from maturities/sale of:
Investment securities at amortized cost 55,882,269 12,730,951
Investment securities at FVOCI 4,939,594 15,637,510
Investment properties 107,860 125,891
Bank premises, furniture, fixtures and equipment 12,324 22,375
Acquisitions of a subsidiary and an associate, net of cash acquired - (41,878)
Net cash used in investing activities (8,693,097) (7,327,482)
CASH FLOWS FROM FINANCING ACTIVITIES
Payments of:
Bills payable (50,362,193) (423,988,877)
Cash dividends (4,267,770) (4,264,650)
Notes and bonds payable (868,710) (7,200,000)
Lease Liabilities (157,517) (100,958)
Proceeds from:
Bills payable 48,543,715 385,770,200
Notes payable 1,332,700 6,800,000
Issuance of new shares 63,598 51,542
Net cash used in financing activities (5,716,177) (42,932,743)
EFFECTS OF FOREIGN CURRENCY
TRANSLATION ADJUSTMENT (237,067) (172,011) (55,962,765) (35,726,670)
For The Three Months Ended March 31
NET DECREASE IN CASH AND CASH EQUIVALENTS
Losses (Gains) on disposal of investment properties and

CASH AND CASH EQUIVALENTS AT
BEGINNING OF YEAR
Cash and Other Cash Items 8,958,042 8,580,709
Due from Bangko Sentral ng Pilipinas (BSP) 103,869,770 73,749,813
Due from Other Banks 68,532,218 73,675,709
Interbank Loans Receivable - 213,062
Securities purchased under repurchase agreement (SPURA) 42,621,961 34,773,704
223,981,991 190,992,997
CASH AND CASH EQUIVALENTS AT
END OF YEAR
Cash and Other Cash Items 9,124,808 13,101,293
Due from BSP 85,996,163 45,057,548
Due from Other Banks 35,919,247 54,485,525
Interbank Loans Receivable 14,760,470 -
SPURA 22,218,538 42,621,961
168,019,226 155,266,327

UNION BANK OF THE PHILIPPINES: 2021 SEC Form 17-Q 3
Annex 5 UNION BANK OF THE PHILIPPINES
GENERAL NOTES TO CONSOLIDATED FINANCIAL STATEMENTS FOR THE THREE MONTHS ENDED MARCH 31, 2021
1. Corporate Information
Union Bank of the Philippines (the Bank, UnionBank or the Parent Bank) was incorporated
in the Philippines on August 16, 1968 and operates as a universal bank through its
universal banking license acquired in July 1992.
The Bank provides expanded commercial banking products and services such as loans
and deposits, cash management, retail banking, foreign exchange, capital markets,
corporate and consumer finance, investment management and trust banking.
As of March 31, 2021, the Bank and its subsidiaries (collectively referred to as the “Group”) has 387 branches and 389 onsite and 97 off-site automated teller machines (ATMs),
located nationwide.
The Bank’s common shares are listed in the Philippine Stock Exchange (PSE). The Bank is effectively 49.27% owned by Aboitiz Equity Ventures, Inc. (AEVI), a company incorporated and domiciled in the Philippines. AEVI is the holding and management company of the Aboitiz Group of Companies.
2. Summary of Significant Accounting Policies The significant accounting policies that have been used in the preparation of these
financial statements are summarized below. These policies have been consistently applied to all the years presented unless otherwise stated.
Basis of Preparation
The accompanying financial statements have been prepared on a historical cost basis except for financial assets at fair value through profit or loss (FVPL), financial assets at fair value through other comprehensive income (FVOCI) and derivative financial instruments that are measured at fair value. The unaudited interim consolidated financial statements are presented in Philippine peso (P=). All values are rounded to the nearest thousands in peso except when otherwise indicated.
Statement of Compliance
The unaudited interim consolidated financial statements of the Group have been prepared in accordance with PAS 34, Interim Financial Reporting. Accordingly, the unaudited interim consolidated financial statements do not include all of the information and disclosures required in the annual audited financial statements and should be read in conjunction with the Groups’ annual audited financial statements as at and for the year ended December 31, 2020.
Basis of Consolidation The Group’s unaudited interim consolidated financial statements comprise the accounts of the Parent Bank and its subsidiaries, after the elimination of material intercompany transactions. All intercompany resources and liabilities, equity, income, and expenses and cash flows relating to transactions with subsidiaries are eliminated in full. Unrealized profits and losses from intercompany transactions that are recognized in the separate financial statements are also eliminated in full. Intercompany losses that indicate impairment are recognized in the Group’s unaudited interim condensed financial statements.
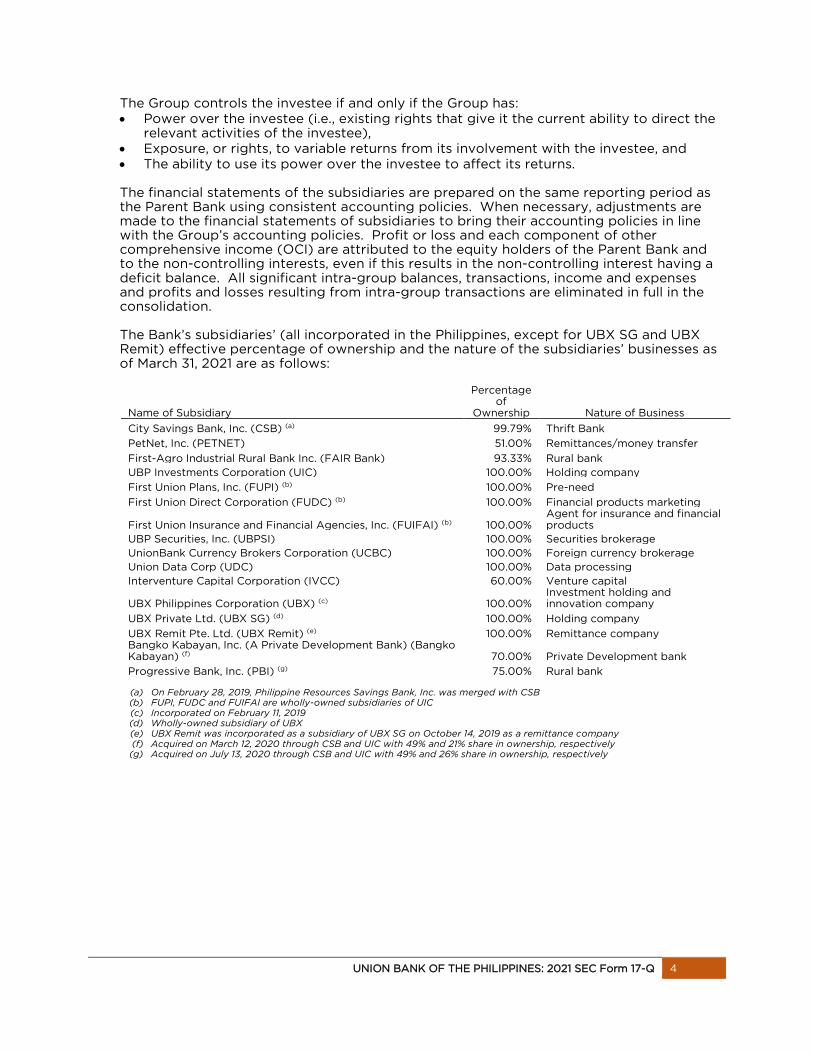
UNION BANK OF THE PHILIPPINES: 2021 SEC Form 17-Q 4
The Group controls the investee if and only if the Group has: • Power over the investee (i.e., existing rights that give it the current ability to direct the
relevant activities of the investee), • Exposure, or rights, to variable returns from its involvement with the investee, and • The ability to use its power over the investee to affect its returns.
The financial statements of the subsidiaries are prepared on the same reporting period as the Parent Bank using consistent accounting policies. When necessary, adjustments are made to the financial statements of subsidiaries to bring their accounting policies in line with the Group’s accounting policies. Profit or loss and each component of other comprehensive income (OCI) are attributed to the equity holders of the Parent Bank and to the non-controlling interests, even if this results in the non-controlling interest having a deficit balance. All significant intra-group balances, transactions, income and expenses and profits and losses resulting from intra-group transactions are eliminated in full in the consolidation. The Bank’s subsidiaries’ (all incorporated in the Philippines, except for UBX SG and UBX Remit) effective percentage of ownership and the nature of the subsidiaries’ businesses as of March 31, 2021 are as follows:
Name of Subsidiary
Percentage of
Ownership Nature of Business
City Savings Bank, Inc. (CSB) (a) 99.79% Thrift Bank
PetNet, Inc. (PETNET) 51.00% Remittances/money transfer
First-Agro Industrial Rural Bank Inc. (FAIR Bank) 93.33% Rural bank
UBP Investments Corporation (UIC) 100.00% Holding company
First Union Plans, Inc. (FUPI) (b) 100.00% Pre-need
First Union Direct Corporation (FUDC) (b) 100.00% Financial products marketing
First Union Insurance and Financial Agencies, Inc. (FUIFAI) (b) 100.00% Agent for insurance and financial products
UBP Securities, Inc. (UBPSI) 100.00% Securities brokerage
UnionBank Currency Brokers Corporation (UCBC) 100.00% Foreign currency brokerage
Union Data Corp (UDC) 100.00% Data processing
Interventure Capital Corporation (IVCC) 60.00% Venture capital
UBX Philippines Corporation (UBX) (c) 100.00% Investment holding and innovation company
UBX Private Ltd. (UBX SG) (d) 100.00% Holding company
UBX Remit Pte. Ltd. (UBX Remit) (e) 100.00% Remittance company Bangko Kabayan, Inc. (A Private Development Bank) (Bangko Kabayan) (f) 70.00% Private Development bank
Progressive Bank, Inc. (PBI) (g) 75.00% Rural bank
(a) On February 28, 2019, Philippine Resources Savings Bank, Inc. was merged with CSB (b) FUPI, FUDC and FUIFAI are wholly-owned subsidiaries of UIC (c) Incorporated on February 11, 2019 (d) Wholly-owned subsidiary of UBX (e) UBX Remit was incorporated as a subsidiary of UBX SG on October 14, 2019 as a remittance company (f) Acquired on March 12, 2020 through CSB and UIC with 49% and 21% share in ownership, respectively (g) Acquired on July 13, 2020 through CSB and UIC with 49% and 26% share in ownership, respectively

UNION BANK OF THE PHILIPPINES: 2021 SEC Form 17-Q 5
Business Acquisitions and Related Investments Other relevant information about the subsidiaries’ nature of businesses and their status of operations are discussed in the sections that follow: a. In 2020, CSB and UIC subscribed to 414,543 and 431,157 new common shares,
respectively, of FAIR Bank at par value of P=100 per share. As a result of the subscription, the percentage of ownership of UIC increased to 44.33% while CSB’s ownership interest stood at 49%.
b. On February 21, 2020, UBX SG acquired 25% of Pacific Payments Pte. Ltd. (PPPL)’s outstanding capital for a total consideration amounting to $1.6 million (P=50.0 million). PPPL is a holding company that was incorporated in Singapore in November 2014.
c. On November 27, 2020, the Bank’s Board of Directors approved the additional capital
infusion of P=500 million into UBX. Said capital infusion was approved by the Bangko Sentral ng Pilipinas (BSP) on February 15, 2021. The additional capital is intended to grow UBX’ business operations and venture platforms. UBX is a wholly-owned subsidiary of the Bank in its 3rd year of operations.
d. In February 2019, CSB and UIC executed a SPA with the majority shareholders of Bangko Kabayan to acquire 70% ownership, with CSB owning 49% and UIC owning 21%. The transaction was approved by BSP and Philippine Competition Commission (PCC) on September 19, 2019 and January 9, 2020, respectively. On March 12, 2020, the parties executed the Deed of Absolute Sale, which is determined to be the Group’s acquisition date. The transaction is accounted for as a business combination. For convenience purposes, the Group used March 31, 2020 as the date of business combination. CSB and UIC have paid 90% of the purchase price while the remaining 10% was deposited on April 27, 2020 as a retention amount in an escrow account. Other than Cash and other cash items, Due from BSP, and Due from other banks, the Group determined the fair values of identifiable assets and liabilities acquired, which will be adjusted once relevant information has been obtained, including the valuation of external appraisers. The fair values of the identifiable assets and liabilities acquired at the date of acquisition are as follows (amounts in thousands):
Fair values recognized on
acquisition date
Assets Cash and other cash items P=70,628 Due from BSP 323,440 Due from other banks 325,770 Investment securities 328,132 Loans and receivables 1,953,472 Bank premises, furniture and fixtures, and
equipment 183,352 Investment properties 253,400 Other resources 41,224 Total assets 3,479,418 Liabilities Deposit liabilities 2,546,758 Other liabilities 124,651 Total liabilities 2,671,409 Net assets acquired P=808,009

UNION BANK OF THE PHILIPPINES: 2021 SEC Form 17-Q 6
The goodwill as the result of the acquisition is determined as follows (amounts in thousands): The goodwill arising from the acquisition is attributed to expected synergies in the operations of the Group and Bangko Kabayan and the planned expansion of network to rural areas and extend the digital products offered by the Parent Bank. None of the goodwill recognized is expected to be deductible for income tax purposes. The fair value of the loans and receivables acquired as part of the business combination amounted to P=1.95 billion, with gross contractual amount of P=2.04 billion. Net cash outflow related to the acquisition Bangko Kabayan amounted to P=38.09 million, net of cash acquired.
e. On January 5, 2018, CSB and UIC signed an SPA to acquire 75% ownership interest of Progressive Bank, Inc. (PBI) through a combination of (a) subscription to 18,000,000 new shares and (b) purchase of 11,980,916 common shares from the major stockholders of PBI pursuant to Special Powers of Attorney dated November 16, 2017. On March 16, 2020, the BSP approved the application of CSB and UIC to acquire 75% ownership of PBI. On July 13, 2020, BSP noted a clarification made by the PCC in its acknowledgement letter indicating that the PCC does not categorically declare that the acquisition does not breach the thresholds prescribed by PCC and its IRR, leaving the parties involved with the responsibility to ensure that they fully comply with the notification requirement. The PCC issued a Letter of Non-Coverage declaring that the transaction is not subject to compulsory notification on August 5, 2020. On August 7, 2020, 18 million shares of PBI was subscribed and fully paid for in the following proportions, CSB for 8,820,000 shares (22.06% of outstanding) and UPI for 9,180,000 shares (22.96% of outstanding) all at P=1.00 per share. PBI was authorized to engage in the business of extending credit to farmers, tenants, and rural industries or enterprises; and to transact all business that may be legally done by the rural banks formed under and in accordance with the existing Rural Banks Act (Republic Act No. 7353). The principal office address of PBI is located at Del Rosario St., Poblacion, Balasan, lloilo, and operates an extension office in Pototan, lloilo, for the purpose of providing microfinance loans along with its primary banking services; and a branch at No. 243 E. Lopez St., Brgy. Lourdes, Jaro, lloilo City. The Group is in the process of completing the closing conditions of the agreement, including the execution of deed of absolute sale of shares. Other than Cash and other cash items, Due from BSP, and Due from other banks, the Group determined the provisional fair values of identifiable assets and liabilities acquired, which will be adjusted once relevant information has been obtained, including the valuation of external appraisers of the bank premises and investment properties.
Purchase price P=681,745 Share in fair value of net assets acquired: Fair values of net assets acquired
P=808,009
Less: Proportionate share of non-controlling interest
242,403 565,606
Goodwill P=116,139

UNION BANK OF THE PHILIPPINES: 2021 SEC Form 17-Q 7
The provisional fair values of the identifiable assets and liabilities acquired at the date of acquisition are as follows (amounts in thousands):
The provisional goodwill as the result of the acquisition is determined as follows (amounts in thousands): The provisional fair value of the loans and receivables acquired as part of the business combination amounted to P=252.41 million, with gross contractual amount of P=360.56 million. Net cash inflow related to the acquisition of PBI amounted to P=140.47 million, net of cash acquired. In a special meeting of the stockholders of the BOD of PBI held on December 18, 2020, it approved the increase in PBI’s authorized capital from P=50 million to P=160 million. UIC and CSB subscribed to the increase and paid P=18.2 million and P=34.3 million, respectively.
Non-controlling Interests Non-controlling interest represents the portion of profit or loss and net assets not owned, directly or indirectly, by the Parent Bank. The Group’s transactions with non-controlling interests that do not result in loss of control are accounted for as equity transactions - that is, as transaction with the owners of the Group in their capacity as owners. The difference between the fair value of any consideration paid and the relevant share acquired of the carrying value of the net assets of the subsidiary is recognized in capital funds. Disposals of equity investments to non-controlling interests may result in gains and losses for the Group that are also recognized in capital funds. When the Group ceases to have control over a subsidiary, any retained interest in the entity is remeasured to its fair value at the date when control is lost, with the change in carrying amount recognized in the statements of income. The fair value is the initial carrying amount for the purposes of subsequently accounting for the retained interest as
Provisional fair values recognized on
acquisition date Assets Cash and other cash items P=27,285 Due from BSP 12,994 Due from other banks 158,189 Loans and receivables 252,407 Bank premises, furniture and fixtures, and equipment 41,771 Investment properties 4,595 Other resources 22,917 Total assets 520,158 Liabilities Deposit liabilities 387,633 Other liabilities 21,471 Total liabilities 409,104 Net assets acquired P=111,054
Purchase price P=58,000 Share in fair value of net assets acquired: Provisional fair values of net assets acquired
P=111,054
Less: Proportionate share of non-controlling interest
27,763 83,291
Gain on Bargain Purchase (provisional) P=25,291

UNION BANK OF THE PHILIPPINES: 2021 SEC Form 17-Q 8
an associate, joint venture or financial asset. In addition, any amounts previously recognized in other comprehensive income in respect of that entity are accounted for as if the Group had directly disposed of the related resources or liabilities. This may mean that amounts previously recognized in other comprehensive income are reclassified to profit or loss.
Changes in Accounting Policies and Disclosures The accounting policies adopted in the preparation of interim condensed consolidated financial statements are consistent with those followed in the preparation of the Group’s annual consolidated financial statements for the year ended December 31, 2020, except for the adoption of new standards, interpretations and amendments effective as of January 1, 2021. The Group has not early adopted any other standard, interpretation or amendment that has been issued but is not yet effective. Unless otherwise indicated, adoption of these new standards did not have an impact on the interim condensed consolidated financial statements of the Group.
• Amendments to PFRS 9, PFRS 7, PFRS 4 and PFRS 16, Interest Rate Benchmark
Reform – Phase 2
The amendments provide the following temporary reliefs which address the financial reporting effects when an interbank offered rate (IBOR) is replaced with an alternative nearly risk-free interest rate (RFR): • Practical expedient for changes in the basis for determining the contractual cash
flows as a result of IBOR reform • Relief from discontinuing hedging relationships • Relief from the separately identifiable requirement when an RFR instrument is
designated as a hedge of a risk component
The Group shall disclose information about: • The nature and extent of risks to which the entity is exposed arising from financial
instruments subject to IBOR reform, and how the entity manages those risks; and • Their progress in completing the transition to alternative benchmark rates, and
how the entity is managing that transition
The amendments are effective for annual reporting periods beginning on or after January 1, 2021 and apply retrospectively, however, the Group is not required to restate prior periods.
3. Significant Accounting Judgments and Estimates
The preparation of the Group’s interim condensed consolidated financial statements in accordance with PFRS requires management to make judgments and estimates that affect the amounts reported in the interim consolidated financial statements and related notes. Judgments and estimates are continually evaluated and are based on historical experience and other factors, including expectations of future events that are believed to be reasonable under the circumstances. Actual results may ultimately differ from these statements. Critical Management Judgments in Applying Accounting Policies In the process of applying the Group’s accounting policies, management has made the following judgments that are consistent with those followed in the preparation of the Group’s annual consolidated financial statements for the year ended December 31, 2020, apart from those involving estimation, which have the most significant effect on the amounts recognized in the financial statements. Among those significant judgements applied for the three months ended March 31, 2021 and for the year ended December 31, 2020 are discussed below:

UNION BANK OF THE PHILIPPINES: 2021 SEC Form 17-Q 9
Determining functional and presentation currency PAS 21, The Effects of Changes in Foreign Exchange Rates requires management to use its judgment to determine the entity’s functional currency such that it most faithfully represents the economic effects of the underlying transactions, events and conditions that are relevant to the entity. The Group has determined that its functional and presentation currency is the Philippine Peso considering the following:
• the currency that mainly influences prices for financial instruments and services (this will often be the currency in which prices for its financial instruments and services are denominated and settled);
• the currency in which funds from financing activities are generated; and • the currency in which receipts from operating activities are usually retained.
Evaluation of business model in managing financial instruments The Group manages its financial assets based on business models that maintain adequate level of financial assets to match its expected cash outflows, largely arising from customers’ withdrawals and continuing loan disbursements to borrowers, while maintaining a strategic portfolio of financial assets for investment and trading activities consistent with its risk appetite. In determining the classification of a financial instrument under PFRS 9, the Group developed business models which reflect how it manages its portfolio of financial instruments. The Group’s business models need not be assessed at entity level or as a whole but applied at the level of a portfolio of financial instruments (i.e., group of financial instruments that are managed together by the Group) and not on an instrument-by-instrument basis (i.e., not based on intention or specific characteristics of individual financial instrument). The Group evaluates in which business model a financial instrument or a portfolio of financial instruments belong to taking into consideration the objectives of each business model established by the Group. PFRS 9 emphasizes that if more than an infrequent and more than an insignificant sale is made out of a portfolio of financial assets carried at amortized cost, an entity should assess whether and how such sales are consistent with the objective of collecting contractual cash flows. In making this judgment, the Group considers certain circumstances documented in its business model manual to assess that an increase in the frequency or value of sales of financial instruments in a particular period is not necessarily inconsistent with a held-to-collect business model if the Group can explain the reasons for those sales and why those sales do not reflect a change in the Group’s objective for the business model. For the three months ended March 31, 2021, the Parent Bank sold investment securities classified as Investment securities at amortized cost with carrying amount of $617.7 million (P=29.7 billion), resulting in Gain on sale of investment securities at amortized cost totaling P=6.2 billion. These sales were made in response to unanticipated significant changes in the current market conditions which the Parent Bank assessed to have significant impact on its operations. Certain investments were sold in order to shorten the duration of financial assets and reduce interest rate risk of the Parent Bank necessary as a response to significant changes in current market conditions.
The Parent Bank has assessed that the sales do not reflect a change in the business model of the Group. Accordingly, the remaining investment securities in the affected hold-to-collect portfolio are continued to be measured at amortized cost. Testing the cash flow characteristics of financial assets In determining the classification of financial assets under PFRS 9, the Group assesses whether the contractual terms of the financial assets give rise on specified dates to cash flows that are solely payments of principal and interest (SPPI) on the principal outstanding, with interest representing time value of money and credit risk associated with the principal amount outstanding. The assessment as to whether the cash flows meet the test is made in the currency in which the financial asset is denominated. Any other contractual term that changes the timing or amount of cash flows (unless it is a

UNION BANK OF THE PHILIPPINES: 2021 SEC Form 17-Q 10
variable interest rate that represents time value of money and credit risk) does not meet the amortized cost criteria. In cases where the relationship between the passage of time and the interest rate of the financial instrument may be imperfect, known as modified time value of money, the Group assesses the modified time value of money feature to determine whether the financial instrument still meets the SPPI criterion. The objective of the assessment is to determine how different the undiscounted contractual cash flows could be from the undiscounted cash flows that would arise if the time value of money element was not modified (the benchmark cash flows). If the resulting difference is significant, the SPPI criterion is not met. In view of this, the Group considers the effect of the modified time value of money element in each reporting period and cumulatively over the life of the financial instrument. Determining the lease term of contracts with renewal and termination options – Group as lessee The Group determines the lease term as the non-cancellable term of the lease, together with any periods covered by an option to extend the lease if it is reasonably certain to be exercised, or any period covered by an option to terminate the lease, it is reasonably certain not to be exercised. The Group has several lease contracts that include extension and termination options. The Group determined that generally, the options to extend or terminate the lease are not included in the determination of the lease term. These optional periods are not enforceable, as the Group cannot enforce the extension of the lease without the agreement from the lessor, and therefore, the Group does have the right to use the asset beyond the non-cancellable period. Key Sources of Estimation Uncertainty The following are the key assumptions concerning the future, and other key sources of estimation uncertainty at the end of the reporting period, that have a significant risk of causing a material adjustment to the carrying amounts of assets and liabilities within the next reporting period: Estimation of impairment losses on Loans and other receivables, Financial assets at amortized cost and Financial assets at FVOCI The measurement of impairment losses under PFRS 9 across all categories of financial assets requires judgment, in particular, the estimation of the amount and timing of future cash flows and collateral values when determining impairment losses and the assessment of a significant increase in credit risk. These estimates are driven by a number of factors, changes in which can result in different levels of allowances.
The Group’s expected credit losses (ECL) calculations are outputs of complex models with a number of underlying assumptions regarding the choice of variable inputs and their interdependencies. Significant factors affecting the estimates on the ECL model include: • The Group’s internal grading model, which assigns probability of defaults (PD)s to
individual grades. Since 2020, account level and portfolio credit risk rating assessments, which considered how clients are being affected by and are responding to COVID-19- related challenges, have been applied to the scorecards. Sensitivities were applied to consider uncertainties on available economic forecasts.
• The Group’s criteria for assessing if there has been a significant increase in credit risk (SICR) which is the basis for measuring allowances for financial assets on a Lifetime Expected Credit Loss (LTECL) basis. In 2020, the BSP issued several memoranda granting temporary relief measures to banks and supervised financial institution (BSFI). The relief includes payment moratorium which defers payment of maturing loans. With the delay of past due information, the Group performed qualitative assessment to consider significant increase in credit risk based on the identified risk profiles of their accounts and portfolios.
• The Group’s definition of default, which considers the regulatory requirement and the Bank’s indicators of loss events.

UNION BANK OF THE PHILIPPINES: 2021 SEC Form 17-Q 11
• Financial assets have been segmented. In 2020, the accounts have been further segmented, and the Group identified specific accounts and portfolios that are considered severely affected by the challenges related to COVID-19.
• Development of ECL models, including the various formulas and the choice of inputs. Similar to prior years including 2020, models have been reviewed and revised as appropriate based on latest economic outlook and studies by external sources.
• Determination of associations between macroeconomic scenarios and, economic inputs, such as unemployment levels, level of government spending, and collateral values, and their effect on PDs, EADs and LGDs. As the pandemic progresses, lockdown measures were imposed and public health policy changed, the macroeconomic associations were reviewed in-depth and updated frequently. Because of the uncertainties surrounding the business landscape during the period, the quantitative overlays were complemented by an experience-based expert judgment inputs through management overlays considered integral to the systematic processes.
Fair value of derivatives Management applies valuation techniques to determine the fair value of derivatives that are not quoted in active markets. This requires management to develop estimates and assumptions based on market inputs, using observable data that market participants would use in pricing the instrument. Where such data is not observable, management uses its best estimate. Estimated fair values of financial instruments may vary from the actual prices that would be achieved in an arm’s length transaction at the reporting date. Valuation techniques are used to determine fair values which are validated and periodically reviewed. To the extent practicable, models use observable data, however, areas such as credit risk (both own and counterparty), volatilities and correlations require management to make estimates. Changes in assumptions could affect reported fair value of financial instruments. The Group uses judgement to select a variety of methods and make assumptions that are mainly based on market conditions existing at the end of each reporting period. Recognition of deferred tax assets Deferred tax assets are recognized for all unused tax losses and temporary differences to the extent that it is probable that future taxable profit will be available against which the losses can be utilized. Significant management judgment is required to determine the amount of deferred tax assets that can be recognized, based upon the likely timing and level of future taxable income together with future tax planning strategies.
The enactment into law of the Corporate Recovery and Tax Incentives for Enterprises Act resulted in a reduction in net deferred tax asset amounting to P=1 billion, all of which has been fully recognized as of March 31, 2021. Impairment of goodwill The Group conducts an annual review for any impairment in the value of goodwill. Goodwill is written down for impairment where the recoverable amount of the related CGU is insufficient to support its carrying value. The Group determines the recoverable value of goodwill by discounting the estimated excess earnings using the weighted-average cost of capital (WACC) as the discount rate. The Group estimates the discount rate used for the computation of the net present value by reference to industry cost of capital.
The recoverable amount of the CGUs is determined based on a value-in-use calculation using cash flow projections from financial budgets covering a five-year period. Financial budget for the immediately succeeding year is approved by senior management and the BOD of the Parent Bank, while the financial budgets for the other years of cash flows projections are determined by corporate planning group and the relevant business units. In 2020, the key assumptions used in the calculation of value-in-use, including loan and deposit growth rates, net interest margin, have been updated to consider the pandemic. The discount rates used for the computation of the value in use for various CGUs are

UNION BANK OF THE PHILIPPINES: 2021 SEC Form 17-Q 12
based on the pre-tax discount rates ranging from 6.69% to 11.1% as of March 31, 2021 and December 31, 2020. The long-term growth rates used range from 0% to 1% as of March 31, 2021 and December 31, 2020. As a result of the ongoing economic uncertainty brought about by the COVID-19 pandemic, the results of the motorcycle lending business was lower than expected. The volume of loan releases was lower and the motorcycle loans reported higher NPLs, indicating a potential impairment of goodwill.
This temporary setback on the business plans for motorcyles resulted in the recognition of impairment amounting to P=530 million and P=223.17 million for the quarter ended March 31, 2021 and the year ended December 31, 2020, respectively, related to a CGU where the calculated value in use is below the carrying amount, while the other remaining CGUs remain unimpaired.
Though management believes that the assumptions used in the estimation of fair values reflected in the financial statements are appropriate and reasonable, significant changes in these assumptions may materially affect the assessment of recoverable values and any resulting impairment loss could have a material adverse effect on the results of operations.
4. Financial Risk Management Objectives and Policies
Risks are inherent in the business activities of the Group. Among its identified risks are credit risk, liquidity risk, market risk, interest rate risk, foreign exchange risk, operational risk, information security risk, legal risk, and regulatory risk. These are managed through a risk management framework and governance structure that provides comprehensive controls and management of major risks on an ongoing basis. Risk management is the process by which the Group identifies its key risks, collects consistent and understandable risk measures, decides which risks to take on or reduce and establishes procedures for monitoring the resulting risk positions. The objective of risk management is to ensure that the Group conducts its business within the risk levels set by the BOD while business units pursue their objective of maximizing returns. Risk Management Strategies The Group maintains a prudent risk management strategy to ensure the soundness and profitability of its operations and sustained profitability. Business units are held accountable for all the risks and related returns, and ensure that decisions are consistent with business objectives and risk tolerance. Strategies and limits are reviewed regularly and updated to ensure that risks are well-diversified and risk mitigation measures are in place. A system for managing and monitoring risks is in place so that all relevant issues are identified at an early stage and appropriate actions are taken on a timely basis. Risk reporting is done on a regular basis, either daily, monthly or quarterly. Although the BOD is primarily responsible for the overall risk management of the Group’s activities, the responsibility rests with all levels of the organization. The risk appetite is defined and communicated, including parameters and limits, through an enterprise-wide risk policy framework. Risk Management Structure The BOD of the Parent Bank exercises oversight over the Parent Bank’s risk management process as a whole and through its various risk committees. For the purpose of day-to-day management of risks, the Parent Bank has established independent Risk Management Units (RMUs) that objectively review and ensure compliance with the risk parameters set by the BOD. The RMUs are responsible for the monitoring and reporting of risks to senior management and the various committees of the Parent Bank.
UNION BANK OF THE PHILIPPINES: 2021 SEC Form 17-Q 13
On the other hand, the risk management processes of its subsidiaries are handled separately by their respective BODs. The Parent Bank’s BOD is primarily responsible for setting the risk appetite, approving risk parameters, proposed credit policies, and investment guidelines, as well as establishing the overall risk-taking capacity of the Parent Bank. To fulfill its responsibilities in risk management, the BOD has established the following committees, whose functions are described below. (a) The Executive Committee (EXCOM), composed of seven (7) members of the BOD,
exercises certain functions as delegated by the BOD including, among others, confirming or noting approvals made by the Management within its delegated level of authority limits and the approval of credit proposals, asset recovery and real and other properties acquired (ROPA) sales within its delegated limits.
(b) The Risk Management Committee (RMC), composed of seven (7) members of the
BOD, majority of whom are Independent Directors including its Chairman, shall advise the BOD of the Parent Bank’s overall current and future risk appetite, oversee Senior Management’s adherence to the risk appetite statement, and report on the state of risk culture of the Parent Bank.
(c) The MRC is composed of nine (9) members of the BOD, majority of whom are
independent directors, including the Chairman. The MRC is primarily responsible for reviewing the risk management policies and practices relating to market risk including interest rate risk in the banking book and liquidity risk.
(d) The ORMC, composed of seven (7) members of the BOD, majority of whom are
Independent Directors including its Chairman, is responsible for reviewing risk management policies and practices relating to operational risk, including those that affect branches, online banking, central processing services and treasury operations.
(e) The Audit Committee is composed of seven (7) members, all non-executive and
majority of whom are independent, including the Chairman, most of whom are with accounting, auditing, or related financial management expertise or experience. The skills, qualifications, and experience of the committee members are appropriate for them to perform their duties as laid down by the BOD.
The Audit Committee serves as principal agent of the BOD in ensuring independence of the Parent Bank’s external auditors and the internal audit function, the integrity of management, and the adequacy of disclosures and reporting to stockholders. It monitors and evaluates the adequacy and effectiveness of the Parent Bank’s internal control. It also oversees the Parent Bank’s financial reporting process on behalf of the BOD. It assists the BOD in fulfilling its fiduciary responsibilities as to accounting policies, reporting practices and the sufficiency of auditing relative thereto, and regulatory compliance. To effectively perform these functions, the Audit Committee has a good understanding of the Parent Bank’s business including the following: Parent Bank’s structure, businesses, controls, and the types of transactions or other financial reporting matters applicable to the Parent Bank as well as to determine whether the controls are adequate, functioning as designed, and operating effectively. It also considers the potential effects of emerging business risks and their impact on the Parent Bank’s financial position and results of operations. Among the responsibilities of the Audit Committee are:
• Oversight of the financial reporting framework. The Audit Committee ensures that
the Parent Bank’s financial reporting framework enables the generation and preparation of accurate and comprehensive information and reports. In this regard,

UNION BANK OF THE PHILIPPINES: 2021 SEC Form 17-Q 14
the Audit Committee through the Controllership Group monitors the financial reporting process and the existence of significant financial reporting issues and concerns.
• Monitors and evaluates the adequacy and effectiveness of Bank’s internal control. The Audit Committee, through the IAG, monitors and evaluates the adequacy and effectiveness of the Parent Bank’s internal control framework, integrity of financial reporting, and security of physical assets. The Audit Committee ensures that a proactive and forward-looking approach on evaluation of risks and controls is taken. The Audit Committee also ensures that periodic assessment of the internal control system is conducted to identify weaknesses and evaluates its robustness considering the risk profile and strategic direction of the Parent Bank.
• Oversees the audit function. The Audit Committee evaluates and approves the
internal audit strategies, methodology, scope and quality assurance measures, and ensures that the audit plan is aligned with the overall strategic plan of the Bank, and is based on robust risk assessment.
• Oversees the outsourced internal audit activities. The Audit Committee oversees the performance of the internal audit service provider and ensures that they comply with sound internal auditing standards and other supplemental standards issued by regulatory authorities/government agencies, as well as with relevant code of ethics.
• Oversees the implementation of Group Internal Audit Policy. The Audit Committee
oversees the implementation of the policy through the periodic reports on oversight of the Group Internal Audit, and takes appropriate action on any group internal oversight issues identified. The Audit Committee reviews and evaluates the group internal audit policy, and any amendments thereto, and endorse the same to the Parent Bank for approval.
• Oversees of the whistle-blowing mechanism. The Audit Committee oversees the establishment of a whistle-blowing mechanism in the Parent Bank by which officers and staff shall in confidence raise concerns about possible improprieties or malpractices in matters of financial reporting, internal control, auditing or other issues to persons or entities that have the power to take corrective action. It also ensures that independent investigation, appropriate follow-up, action and subsequent resolution of complaints are in place.
(f) The Corporate Governance Committee (CGC) is primarily responsible for helping the
BOD fulfil its corporate governance and compliance responsibilities. It is responsible for ensuring the BOD’s effectiveness and due observance of corporate governance principles and of oversight of the compliance risk management. It assists in the establishment of a compliance program that facilitates the escalation and resolution of compliance issues expeditiously. The CGC is composed of nine (9) members of the BOD, all non-executive, majority of whom, including its Chairman, are independent directors. Its specific duties include, among others, making recommendations to the BOD regarding continuing education of directors, overseeing the periodic performance evaluation of the 1) Board; 2) Board Committees; 3) Individual Directors; 4) Management-level Committees (through the Compliance and Corporate Governance Office; and 5) Chief Compliance and Corporate Governance Officer (CCCGO). The CGC also performs oversight functions over the Compliance and Corporate Governance Office (CCGO) and the following management-level committees: 1) Anti-Money Laundering Committee and 2) Discipline Committee.

UNION BANK OF THE PHILIPPINES: 2021 SEC Form 17-Q 15
Senior management, through the CCCGO, periodically reports to the CGC the status of regulatory audit and compliance testing findings until their closure. Any material breaches of the compliance program are reported to and promptly addressed by the CCCGO within the mechanisms defined by the Compliance Manual. The Parent Bank’s CCCGO defines the Group’s minimum governance and compliance requirements and works closely with the subsidiaries’ and affiliates’ Chief Compliance Officers in the execution of these standards. The CGC assumed the functions of the Nominations Committee (NomCom) and the Compensation and Remuneration Committee (CompRem) upon the latter Committees’ dissolution. The NomCom reviews the qualifications of and screens candidates for the board including nominees for independent directors and key officers of the Parent Bank. As part of its added functions, it also reviews the implementation of programs for identifying, retaining and developing critical officers and the succession plan for various units in the organization. The functions of the CompRem includes overseeing implementation of the programs for salaries and benefits of directors and senior management, and monitoring that the performance scorecards for the Parent Bank and its officers are comprehensive and balanced, and assessing the adequacy, effectiveness for driving performance and consistency of the Parent Bank’s total compensation program vis-à-vis corporate philosophy and strategy. The Parent Bank’s CCCGO assists the CGC in fulfilling its functions by apprising the same of (1) pertinent regulations and other issuances relating to compliance or corporate governance, (2) related regulatory issues and compliance initiatives affecting the various units of the Bank and the status of the corrective action plans, and (3) continuously giving updates thereon. In addition, the CCCGO keeps the CGC abreast of best governance practices and discusses issues being brought up among private organizations and individuals advocating good governance philosophy.
(g) The Related Party Transaction Committee is a board-level committee composed of three (3) members, all of whom are Independent Directors, including its Chairman. The Committee assists the BOD in the fulfillment of its corporate governance responsibilities on related party transactions by ensuring that the latter are transacted at arm’s length terms. The Committee reviews and endorses the related party transactions to the BOD for approval or confirmation, as applicable.
The major risk types identified by the Group are discussed in the following sections: Credit Risk Credit risk is the risk of loss resulting from the failure of a borrower or counterparty to honor its financial or contractual obligation to the Group. The risk may arise from lending, trade finance, treasury, investments, derivatives and other activities undertaken by the Group. Credit risk is managed through strategies, policies and limits that are approved by the respective BOD of the various companies within the Group. With respect to the Parent Bank, it has a well-structured and standardized credit approval process and credit scoring system for each of its business and/or product segments. The RMU undertakes several functions with respect to credit risk management. The RMU independently performs credit risk assessment, evaluation and review for its retail, commercial and corporate financial products to ensure consistency in the Parent Bank’s risk assessment process. It also ensures that the Parent Bank’s credit policies and procedures are adequate and are constantly updated to meet the changing demands or risk profiles of the business units. The RMU also reported to the Board’s Risk Management Committee the COVID-19-related overlays as well as their impact on credit impairment and credit portfolio’s credit risk profiles.

UNION BANK OF THE PHILIPPINES: 2021 SEC Form 17-Q 16
For the year ended December 31, 2020, there were enhancements in the risk rating & SICR parameters in certain portfolios to consider the effect of COVID-19. The RMU’s portfolio management function involves the review of the Parent Bank’s loan portfolio, including the portfolio risks associated with particular industry sectors, regions, loan size and maturity, and the development of a strategy for the Parent Bank to achieve its desired portfolio mix and risk profile. The RMU reviews the Parent Bank’s loan portfolio quality in line with the Parent Bank’s policy of avoiding significant concentrations of exposure to specific industries or groups of borrowers. Concentrations arise when a number of counterparties are engaged in similar business activities, or activities in the same geographic region, or have similar economic features. Concentrations indicate the relative sensitivity of the Parent Bank’s performance to developments affecting a particular industry or geographical location. The Group and the Parent Bank consider concentration risk to be present when the total exposure to a particular industry exceeds 30.0% of the total exposure, which is similar to the BSP requirement. As of December 31, 2020, and 2019, the Group and the Parent Bank does not exceed the limit in any of its industry concentration. In order to avoid excessive concentrations of risk, the Parent Bank’s policies and procedures include guidelines for maintaining a diversified portfolio mix (e.g., concentration limits). Identified concentrations of credit risks are controlled and managed accordingly. The RMU also monitors compliance to the BSP’s limit on exposures.
Credit risk management practices and credit quality disclosures Corporate Loans Corporate lending activities are undertaken by the Parent Bank’s Corporate Banking Center. The customer accounts under this group belong to the top tier corporations, conglomerates and large multinational companies. The Parent Bank undertakes a comprehensive procedure for the credit evaluation and risk assessment of large corporate borrowers based on its obligor risk rating master scale. The Parent Bank currently utilizes the same single rating system for both Corporate and Commercial accounts. In addition, the result on the latter is further refined through a second model to take more careful account of the nuances between the commercial bank portfolio with that of the corporate loan book. The rating system assesses default risk based on financial profile, management capacity, industry performance, and other factors deemed relevant. Significant changes in the credit risk considering movements in credit rating, among other account-level profile and performance factors, define whether the accounts are classified in either Stage 1, Stage 2, or Stage 3 per PFRS 9 loan impairment standards. Based on foregoing factors, each borrower is assigned a Borrower Risk Rating (BRR), from AAA to D. In addition to the BRR, the Parent Bank assigns a loan exposure rating (LER), a 100-point system which consists of a Facility Tenor Rating (FTR) and a Security Risk Rating (SRR). The FTR measures the maturity risk based on the length of loan exposure, while the SRR measures the quality of the collateral and risk of its potential deterioration over the term of the loan. The FTR and the SRR, each a 100-point scoring system, are given equal weight in determining the LER. Once the BRR and the LER have been determined, the credit limit to a borrower is determined under the Risk Asset Acceptance Criteria (RAAC) which is a range of acceptable combinations of the BRR and the LER. Under the RAAC system, a borrower with a high BRR will have a broader range of acceptable LERs.

UNION BANK OF THE PHILIPPINES: 2021 SEC Form 17-Q 17
The credit rating for each borrower is reviewed annually or earlier when there are extraordinary or adverse developments affecting the borrower, the industry and/or the Philippine economy such as the COVID-19 pandemic. Any major change in the credit scoring system, the RAAC range and/or the risk-adjusted pricing system is presented to and approved by the RMC. Commercial Loans The Parent Bank’s commercial banking activities are undertaken by its Commercial Banking Center (ComBank). These consist of banking products and services rendered to customers which are entities that are predominantly small and medium scale enterprises (SMEs). These products and services are similar to those provided to large corporate customers, with the predominance of trade finance-related products and services. The non-financial ComBank accounts use an adjusted obligor rating scale derived from the one applied for corporate loans, and follows the same RAAC framework, while ComBank accounts classified as banks and non-bank financial institutions are still rated using the 2018 rating scale. Retail and Small and Medium Enterprise (SME) Financial Products The Retail loan portfolio of the Parent Bank is composed of four main product lines, namely: Home Loans, Credit Cards, Auto Loans, and Quick Loans. SME portfolio is composed of Business Line Loans and a small portion from emerging products. Each of these products has established credit risk guidelines and systems for managing credit risk across all businesses. Scoring models have been revised and fine-tuned while data analytics have been enhanced to improve portfolio quality and product offers. On the other hand, CSB, an accredited lending institution of the Department of Education (DepEd), provides salary loans to teachers under an agreement with DepEd for payroll deductions. CSB also provides motorcycle loans as a result of its acquisition and subsequent merger of PR Savings Bank. Exposure to credit risk is managed through diligent assessment upon onboarding and regular portfolio and segment analysis of the ability of borrowers to meet interest and capital repayment obligations and by changing these lending limits when appropriate. The Retail products’ respective masterscale is defined by the credit scoring models, which consider demographic variables and behavioral performance, to segment the portfolio according to risk masterscale per product. The stages are defined by the approved Significant Increase in Credit Risk (SICR) for Retail which takes into account the following: NPL status, months on books, and credit score rating for Application Score (point of application) and Behavior Score (monthly credit performance). The SME products, including but not limited to Business Line and Supplier Financing, uses credit scorecards developed specific for each product segment. These scorecard models updated the Business Line rating scale to 1 to 5. Meanwhile Credit cards, Mortgage loans, and Auto loans still use the existing scorecards and hence same rating scale as previous year.
Investments and Placements Investments and placements include financial assets at amortized cost, debt financial assets through other comprehensive income, due from BSP, interbank loans receivable and due from other banks. Each has established credit risk guidelines and systems for managing credit risk across all businesses.
Modification In certain circumstances, the Group modifies the original terms and conditions of a credit exposure to form a new loan agreement or payment schedule. The modifications can be given depending on the borrower’s or counterparty’s current or expected financial difficulty. The modifications may include, but are not limited to, change in interest rate and terms,

UNION BANK OF THE PHILIPPINES: 2021 SEC Form 17-Q 18
principal amount, maturity date, date and amount of periodic payments and accrual of interest and charges. On March 24, 2020, Republic Act No. 11469 or the “Bayanihan to Heal as One Act” (Bayanihan 1) was enacted declaring a state of national emergency over the entire country to control the spread of the Coronavirus Disease 2019 (COVID-19). Among the provisions of Bayanihan 1 is the implementation of a 30-day grace period for all loans with principal and/or interest falling due within the period of the Enhanced Community Quarantine without incurring interest on interest, on penalties, fees and other charges. Further, on September 11, 2020, Republic Act No. 11494 or the “Bayanihan to Recover as One Act” (Bayanihan 2) was enacted and provided for the implementation of a one-time 60-day grace period to be granted for the payment of all existing, current and outstanding loans falling due, or any part thereof, on or before December 31, 2020, without incurring interest on interest, penalties, fees and other charges, thereby extending the maturity of said loans. In addition, Bayanihan 2 allows loans and interest due during the Bayanihan 2 period to be settled on a staggered basis without interest on interests, penalties, fees or other charges until December 31, 2020 or as may be agreed upon by both parties. Furthermore, the Bank provided additional grace period to the borrowers. The impact of loan modifications as a result of the Bayanihan 1 and Bayanihan 2 Acts amounted to a loss of P=506.70 million for the Group in 2020. For the year ended December 31, 2020 and the quarter ended March 31, 2021, accretion amounted to P=82.83 million and P=20.03 million, respectively, which were recognized in interest income. Collateral Held as Security and Other Credit Enhancements The Group holds collateral against loans and other receivables from customers in order to mitigate risk. The collateral may be in the form of mortgages over real estate property, chattels, inventory, cash, securities and/or guarantees. The Bank regularly monitors and updates the fair value of the collateral depending on the type of credit exposure. Estimates of the fair value of collateral are considered in the review and assessment of the adequacy of allowance for credit losses. In general, the Bank does not require collateral for loans and advances to other banks, except when securities are held as part of reverse repurchase agreements. Liquidity Risk Liquidity risk is the risk that there are insufficient funds available to adequately meet the credit demands of the Group’s customers and repay deposits on maturity. The ALCO and the Treasurer of the Group ensure that sufficient liquid assets are available to meet short-term funding and regulatory requirements. Liquidity is monitored by the Group on a daily basis and under stressed situations. A contingency plan is formulated to set out the amount and the sources of funds (such as unused credit facilities) that are available to the Group and the circumstances under which the Group may use such funds. Liquidity ratios are used to monitor and manage the Bank’s liquidity. The MRC approves the ratios to be used for monitoring the performance of the Bank and for mapping out areas where improvements are needed. These ratios include Liquid Assets to Deposits Ratio, Liquidity ratio, Leverage Ratio and Intermediation Ratio. In June 2020, the MRC approved to set the peso liquid assets to deposits ratio limit to automatically be consistent with the reserve requirement ratio for peso deposits. The Group also manages its liquidity risks through the use of a Maximum Cumulative Outflow (MCO) limit which regulates the outflow of cash on a cumulative basis and on a tenor basis. To maintain sufficient liquidity in foreign currencies, the Group has also set an MCO limit for certain designated foreign currencies. The MCO limits are endorsed by the MRC and approved by the BOD. In June 2020, the BOD approved to change the MCO limits, providing separate limits for short term (generally less than 30 days) and medium term tenor (from 30 days to one year). Previously, the Bank has single limit for all tenors.

UNION BANK OF THE PHILIPPINES: 2021 SEC Form 17-Q 19
Market Risk Market risk is the risk that the fair value or future cash flows of financial instruments will fluctuate due to changes in market variables such as interest rate, foreign exchange rates and equity prices. The Group classifies exposures to market risk into either trading book or banking book. The market risk for the trading portfolio is managed and monitored based on a Value-at-Risk (VaR) methodology. Meanwhile, the market risk for the non-trading positions are managed and monitored using other sensitivity analyses. The Parent Bank applies a VaR methodology to assess the market risk of positions held and to estimate the potential economic loss based upon a number of parameters and assumptions for various changes in market conditions. VaR is a method used in measuring financial risk by estimating the potential negative change in the market value of a portfolio at a given confidence level and over a specified time horizon. The Parent Bank uses the historical VaR approach in assessing the possible changes in the market value of investment securities based on historical data for a rolling one-year period. The VaR models are designed to measure market risk in a normal market environment. The models assume that any changes occurring in the risk factors affecting the normal market environment will have the same distribution as they had in the past. This involves running the portfolio across a set of historical price changes, thus creating a distribution of changes in portfolio value which may or may not be normal. The historical approach does not make any assumptions regarding the distribution of the risk factors and therefore can accommodate any type of distribution. The Bank uses the maximum between the 1st and 99th percentile of historical changes in asset returns in the calculation of volatility as this is a more conservative approach as any potential gain may reverse to a loss. VaR may also be underestimated or overestimated due to the assumptions placed on risk factors and the relationship between such factors for specific instruments. Even though positions may change throughout the day, the VaR only represents the risk of the portfolios at the close of each business day, and it does not account for any losses that may occur beyond the 99% confidence level. The VaR figures are backtested daily against actual and hypothetical profit and loss of the trading book to validate the robustness of the VaR model. To supplement the VaR, the Parent Bank performs stress tests wherein the trading portfolios are valued under extreme market scenarios not covered by the confidence interval of the Parent Bank’s VaR model. Since VaR is an integral part of the Parent Bank’s market risk management, VaR limits are established annually for all financial trading activities and exposures against the VaR limits and are monitored on a daily basis. Limits are based on the tolerable risk appetite of the Parent Bank. Interest Rate Risk Interest rate risk in the banking book (IRRBB) is the current and prospective risk to earnings and capital arising from adverse movements in interest rates that affect the bank’s banking book positions. When interest rates change, the present value and timing of future cash flows change. This, in turn, changes the underlying value of the Bank’s assets, liabilities and off-balance sheet items, and hence its economic value. On the other hand, changes in interest rates also affect the Bank’s earnings by altering interest rate-sensitive income and expenses, affecting its net interest income (NII). The Asset and Liability Committee establishes appropriate asset and liability pricing in support of the Bank’s balance sheet objectives. The Group employs “gap analysis” to measure rate-sensitivity of the income and expenses, also known as Earnings-at-Risk (EaR). This sensitivity analysis is performed at least every month. The EaR measures the impact on the net interest income for any mismatch between the amounts of interest-earning assets and interest-bearing liabilities within a one-year period. The EaR is calculated by first distributing the interest sensitive

UNION BANK OF THE PHILIPPINES: 2021 SEC Form 17-Q 20
assets and liabilities into tenor buckets based on time remaining to the next repricing date or the time remaining to maturity if there is no repricing and then subtracting the liabilities from the assets to obtain the repricing gap. The repricing gap per tenor bucket is then multiplied by the assumed interest rate movement and appropriate time factor to derive the EaR per tenor. The Bank uses one-year differences in the term structure of the different benchmark curves as the bases for the calculation of interest rate risk factor across all currencies. The total EaR is computed as the sum of the EaR per tenor within one year. To manage the interest rate risk exposure, BOD-approved EaR limits were established. Non-maturing or repricing assets or liabilities are considered to be non-interest rate sensitive and are not included in the measurement. A positive gap occurs when the amount of interest rate sensitive assets exceeds the amount of interest rate sensitive liabilities while a negative gap occurs when the amount of interest rate sensitive liabilities exceeds the amount of interest rate sensitive assets. Accordingly, during a period of rising interest rates, an entity with a positive gap will have more interest rate sensitive assets repricing at a higher interest rate than interest rate sensitive liabilities which will be favorable to it. During a period of falling interest rates, an entity with a positive gap will have more interest rate sensitive assets repricing at a lower interest rate than interest rate sensitive liabilities, which will be unfavorable to it. EAR is complemented by stress tests which are conducted quarterly. It involves subjecting the total interest rate sensitive assets and liabilities within one year to probable short-term and medium-term interest rate movements, assuming parallel and non-parallel (flatteners and steepeners) in the yield curve. Additionally, the Bank also monitors long-term sensitivity to interest rate risk of the Bank’s balance sheet through the Economic Value of Equity (EVE) method. EVE measures the economic value which provides a more comprehensive view of potential long-term effects of changes in interest rates. The Bank’s interest rate sensitive asset and liability positions are analyzed based on its cash flows, and its present value are computed using appropriate market rates which include the current risk-free rate plus the corresponding margin. On the other hand, the present values of non-interest sensitive assets and liabilities will be kept at their carrying values. The Bank’s risk management program includes measuring and monitoring the risks associated with fluctuations in market interest rates on the its net interest income and capital ensuring that the exposures in interest rates are kept within acceptable limits. Foreign Exchange Risk Foreign exchange risk is the risk to earnings or capital arising from changes in foreign exchange rates. The Group’s net foreign exchange exposure, taking into account any spot or forward exchange contracts, is computed as foreign currency assets less foreign currency liabilities. The foreign exchange exposure is limited to the day-to-day, over-the-counter buying and selling of foreign exchange in the Group’s branches, as well as foreign exchange trading with corporate accounts and other financial institutions. The Group is permitted to engage in proprietary trading to take advantage of foreign exchange fluctuations. Operational Risk BSP Circular 900, Guidelines on Operational Risk Management, serve as the groundwork for the Bank’s Operational Risk Management (ORM) framework. This is to standardize the approach undertaken by the Bank in order to facilitate consistently strong ORM practices across the organization.

UNION BANK OF THE PHILIPPINES: 2021 SEC Form 17-Q 21
Operational risk is defined as the risk of loss arising from direct or indirect loss from inadequate or failed internal processes, people and systems or from external events. This definition includes legal risk, but excludes strategic and reputational risk. Direct loss being the result primarily from an operational failure while an indirect loss relates to the impact of operational risk on other risks such as market, credit or liquidity risk. Each specific unit of the Bank has its roles and responsibilities in the management of operational risk and these are clearly stated in the ORM framework. At the BOD level, an ORMC was formed to provide overall direction in the management of operational risk, aligned with the overall business objectives. Key to the effective implementation of the operational risk management framework is a governance structure that transparently defines the lines of responsibility from the BOD down to the Business and Functional Units level. The ORMC was formed and given the mandate to build and lead the roadmap in developing the foundations and systems necessary for the effective implementation of an Operational Risk Management Framework. The ORM, together with all other Risk Units, reports directly to the Chief Risk Officer. In managing products, services and systems, these are implemented only after a thorough operational risk evaluation. As part of the product and systems approval process, product owners and managers ensure that risks are clearly identified and adequately controlled and mitigated. For existing products, services and systems, regular reviews are conducted and controls are assessed to determine continued effectiveness. The Parent Bank, as part of its continuing effort to manage operational risk, has ensured that the basic controls to manage exposure to operational risk have been embedded in its processes. Legal Risk and Regulatory Risk Management Legal risk pertains to the Parent Bank’s exposure to losses arising from cases decided not in favor of the Parent Bank where significant legal costs have already been incurred, or in some instances, where the Parent Bank may be required to pay damages. The Parent Bank is often involved in litigation in enforcing its collection rights under loan agreements in case of borrower default. The Parent Bank may incur significant legal expenses as a result of these events, but the Parent Bank may still end up with non-collection or non-enforcement of claims. The Parent Bank has established measures to avoid or mitigate the effects of these adverse decisions and engages several qualified legal advisors, who were endorsed to and carefully approved by senior management. At year-end, the Parent Bank also ensures that material adjustments or disclosures are made in the financial statements for any significant commitments or contingencies which may have arisen from legal proceedings involving the Parent Bank. Regulatory compliance risk refers to the potential risk for the Parent Bank and its subsidiaries to suffer financial loss due to changes in the laws, monetary, tax or other governmental regulations of the country. The monitoring of the Parent Bank’s and subsidiaries’ compliance with these regulations, as well as the study of the potential impact of new laws and regulations, is the primary responsibility of the entity’s Chief Compliance and Corporate Governance Officer (CCCGO). The CCCGO is responsible for communicating and disseminating new rules and regulations to all units, analyzing and addressing compliance issues, performing periodic compliance testing and regularly reporting to the CGC and the BOD.

UNION BANK OF THE PHILIPPINES: 2021 SEC Form 17-Q 22
5. Fair Value Measurement
In accordance with PFRS 13, Fair Value Measurement, the fair value of financial assets and liabilities and non-financial assets which are measured at fair value on a recurring or non-recurring basis and those assets and liabilities not measured at fair value but for which fair value is disclosed in accordance with other relevant PFRS, are categorized into three levels based on the significance of inputs used to measure the fair value. The fair value hierarchy has the following levels:
• Level 1: quoted prices (unadjusted) in active markets for identical assets or liabilities; • Level 2: inputs other than quoted prices included within Level 1 that are observable for
the resource or liability, either directly (i.e. as prices) or indirectly (i.e. derived from prices); and,
• Level 3: inputs for the asset or liability that are not based on observable market data (unobservable inputs).
The level within which the financial asset or liability is classified is determined based on the lowest level of significant input to the fair value measurement. For purposes of determining the market value at Level 1, a market is regarded as active if quoted prices are readily and regularly available from an exchange, dealer, broker, industry group, pricing service, or regulatory agency, and those prices represent actual and regularly occurring market transactions on an arm’s length basis.
The following table shows an analysis of financial instruments recorded at fair value by level of the fair value hierarchy (amounts in millions of Philippine pesos):
March 31, 2021 (Unaudited) December 31, 2020 (Audited)
Level 1 Level 2 Level 3 Total Level 1 Level 2 Level 3 Total
Resources Financial Assets at FVTPL
Equity securities P=2,608 P=139 P=- P=2,747 P=2,586 P=138
P=29 P=2,754
Debt securities
4,843
- -
4,843
15,012
-
-
15,012
Derivative assets
-
717
46
763 -
637
45
682
Trust fund assets
64
- -
64 66
-
- 66 Financial Assets at FVOCI
Equity Securities -
-
42
42
-
-
42
42
Debt securities
54,195
- -
54,195
31,149
-
-
31,149
Liabilities
Derivatives with negative fair values
-
692 -
692
-
747
-
747

UNION BANK OF THE PHILIPPINES: 2021 SEC Form 17-Q 23
The following table summarizes the carrying amounts and fair values of those financial resources and liabilities not presented in the statement of financial position at their fair values (amounts in millions of Philippines pesos):
Financial assets at amortized cost include foreign currency denominated investments in government bonds and other debt securities amounting to P=131.95 billion as of March 31, 2021. Government bonds and other debt securities issued by resident and non-resident corporations earned interest at 0% to 18.25% from January 1 to March 31, 2021.
6. Segment Information
The Group’s main operating businesses are organized and managed separately according to the nature of products and services provided and the different markets served, with each segment representing a strategic business unit. These are also the basis of the Group in reporting to its chief operating decision-maker for its strategic decision-making activities. The Group’s main business segments are presented below.
(a) Consumer Banking – This segment principally handles individual customers’ deposits and provides consumer type loans, such as automobiles and mortgage financing, credit card facilities and funds transfer facilities.
(b) Corporate and Commercial Banking – This segment principally handles loans and other credit facilities and deposit and current accounts for corporate, institutional, small and medium enterprises, and middle market customers.
(c) Treasury – This segment is principally responsible for managing the Bank’s liquidity and funding requirements, and handling transactions in the financial markets covering foreign exchange, fixed income trading and investments, and derivatives.
March 31, 2021 December 31, 2020
(Unaudited) (Audited)
Carrying Amt
At Fair Value Carrying Amt
At Fair Value
Financial Assets
Cash and other cash items P=9,125 P=9,125 P=8,958 P=8,958
Due from BSP 85,996 85,996 103,870 103,870
Due from other banks 35,919 35,919 68,532 68,532
Interbank loans receivable 14,760 14,760 - -
Financial Assets at amortized cost 146,731 147,320 155,811 176,826
Loans and other receivables 344,882 344,912 339,537 339,481
Financial Liabilities
Deposit liabilities 500,252 500,377 527,785 527,967
Bills payable 52,763 52,418 54,224 54,550
Notes and Bonds payable
60,740 61,667 59,854 72,726
Manager Checks
8,386
8,386 6,925 6,925 Bills Purchased-Domestic and foreign
720
720 1,002 1,002
Accounts Payable
3,996
3,996 5,028 5,028
Accrued Interest Payable
1,016
1,016 758 758
Finance Lease Payment Payable
1,085
1,085 1,220 1,220
Payment Order Payable
5,097
5,097 2,343 2,343
Due to Treasurer of the Philippines
2
2 2 2

UNION BANK OF THE PHILIPPINES: 2021 SEC Form 17-Q 24
(d) Headquarters – This segment includes corporate management, support and administrative units not specifically identified with Consumer Banking, Corporate and Commercial Banking or Treasury.
These segments are the basis on which the Group reports its primary segment information. Transactions between segments are conducted at estimated market rates on an arm’s length basis.
Segment resources and liabilities comprise operating resources and liabilities including items such as taxation and borrowings. Revenues and expenses that are directly attributable to a particular business segment and the relevant portions of the Group’s revenues and expenses that can be allocated to that business segment are accordingly reflected as revenues and expenses of that business segment. Segment information of the Group as of March 31, 2021 and December 31, 2020 and for the periods ended March 31, 2021 and 2020 is presented as follows (amounts in millions of Philippine pesos):
Consumer Banking
Corporate &
Commercial Banking
Treasury & Trust Headquarters Total
March 31, 2021
Results of operations Net interest income and other income P=4,109 P=2,394 P=7,104 P=680 P=14,287
Other expenses
3,092
469
247
2,447
6,255 Income before provision for probable losses and income tax P=1,017 P=1,925 P=6,857 (P=1,767)
8,032
Provision for impairment
(2,334)
Tax expense
(969)
Net income for the period P=4,729
Segment assets, March 31, 2021 P=196,460 P=212,882 P=300,784 P=37,185 P=747,311
Segment liabilities, March 31, 2021 P=338,369 P=129,793 P=129,505 P=45,604 P=643,271
Consumer Banking
Corporate &
Commercial Banking
Treasury & Trust Headquarters Total
March 31, 2020
Results of operations Net interest income and other income P=4,283 P=2,156 P=3,007 P=85 P=9,531
Other expenses
2,398
562
399
1,696
5,055 Income before provision for probable losses and income tax P=1,885 P=1,593 P=2,608 (P=1,611) P=4,476
Provision for impairment
(1,327)
Tax expense
(508)
Net income for the period P=2,641
Segment assets, December 31, 2020 P=198,004 P=191,700 P=263,197 P=121,558 P=774,459
Segment liabilities, December 31, 2020 P=325,529 P=142,167 P=137,240 P=64,371 P=669,307

UNION BANK OF THE PHILIPPINES: 2021 SEC Form 17-Q 25
7. Capital Funds The Bank’s capital stock as of March 31, 2021 and December 31, 2020 consists of the following (amounts in thousands):
The authorized capital stock of the Bank is P=23,114,224 divided into 1,311,422,420 common shares at P=10 par value and 100,000,000 preferred shares at P=100 par value. The Bank’s outstanding common stock as of March 31, 2021 is 1,219,362,818 shares. No preferred shares have been issued to date. On January 29, 2021, the Bank issued 891,351 common shares to qualified employees under the Bank’s Employee Stock Plan. The following is a summary of the dividends declared and distributed by the Bank in 2021 and 2020 (amounts in thousands):
Date of Date of Date of Dividend
per Shares Total
Declaration Record Payment Share Outstanding Amount
29-Jan-21 15-Feb-21 04-Mar-21 P=3.50 1,219,362,818 P=4,267,770
24-Jan-20 07-Feb-20 24-Feb-20 P=3.50 1,218,471,467 P=4,264,650
In compliance with BSP regulations, the Bank ensures that adequate reserves are in place for future bank expansion requirements. The foregoing cash dividend declarations were made within the BSP’s allowable limit of dividends.
8. Related Party Transactions
Related party transactions are transfers of resources, services, or obligations between related parties, regardless of whether a price is charged. Parties are said to be related if one party has the ability to control the other party or exercise significant influence over the other in making financial and operating decisions. These parties include: (a) individuals owning, directly or indirectly through one or more intermediaries, control or are controlled by, or under common control with the Parent Bank (b) associates, and (c) individuals owning, directly or indirectly, an interest in the voting power of the Parent Bank that gives them significant influence over the Parent Bank and close members of the family of such individual; and, (d) the Group’s funded retirement plan. In considering each possible related party relationship, attention is directed to the substance of the relationship and not merely on the legal form.
Shares Amount
March 31, 2021 2020 March 31, 2021 2020
Common - ₱10 par value
Authorized
1,311,422,420
1,311,422,420 P=13,114,224 P=13,114,224
Issued and Outstanding
1,219,362,818
1,218,471,467
12,193,628
12,184,715
Preferred - ₱100 par value, non-voting Authorized 100,000,000 100,000,000 P=10,000,000 P=10,000,000
Issued and Outstanding
-
-
-
-

UNION BANK OF THE PHILIPPINES: 2021 SEC Form 17-Q 26
9. Commitments and Contingent Liabilities
In the normal course of the Group’s operations, there are various outstanding commitments and contingent liabilities such as guarantees, commitments to extend credit, which are not reflected in the accompanying financial statements. The Group recognizes in its books any losses and liabilities incurred in the course of its operations as soon as these become determinable and quantifiable. Management believes that, as of March 31, 2021, no additional material losses or liabilities are required to be recognized in the accompanying financial statements as a result of the above commitments and transactions. There are several suits, assessments or notices and claims that remain unsettled. Management believes, based on the opinion of its legal counsels, that the ultimate outcome of such suits, assessments and claims will not have a material effect on the Group’s and the Parent Bank’s financial position and results of operations. Following is a summary of the Parent Bank’s commitments and contingent accounts:
10. Earnings Per Share
Basic earnings per share were computed as follows:
As of March 31, 2021, and December 31, 2020, the Group has no outstanding potentially dilutive securities, hence, basic earnings per share are equal to diluted earnings per share.
March 31, 2021 December 31, 2020
(Unaudited) (Audited)
Trust department accounts P=77,221,244 P=74,469,549
Commitments
57,480,973 59,653,709
Forward exchange bought
31,900,883
30,396,594
Forward exchange sold 26,552,534 19,533,966
Inward bills for collections 21,891,725
25,694,563
Other derivatives 8,621,881
7,799,215
Unused commercial letters of credit 5,306,847
6.724,426
Spot exchange sold
4,554,533
2,095,779
Spot exchange bought
3,204,385
3,135,021
Outstanding guarantees issued
396,696
405,927 Other commitment and contingent accounts
110,140
72,127
March 31, 2021 March 31, 2020
Net income attributable to equity holders
of the Parent Bank P=4,715,877 P=2,641,524
Divided by the weighted average number
of outstanding common shares (in thousands) 1,219,066 1,218,184
Basic earnings per share P=3.87 P=2.17
Annualized basic and diluted earnings
per share P=15.47 P=8.67

UNION BANK OF THE PHILIPPINES: 2021 SEC Form 17-Q 27
11. Other Matters None to report.
12. Events After the Reporting Period
None to report.

UNION BANK OF THE PHILIPPINES: 2021 SEC Form 17-Q 28
Annex 6 UNION BANK OF THE PHILIPPINES AND SUBSIDIARIES FINANCIAL INDICATORS AS OF INDICATED RATES
Ratios March 31, 2021 December 31, 2020
a. Liquidity Ratio 51.8% 56.3%
b. Debt to Equity Ratio 6.2:1 6.4:1
c. Asset to Equity Ratio 7.2:1 7.4:1
d. Capital Adequacy Ratio 17.6% 17.0%
March 31, 2021 March 31, 2020
e. Interest Rate Coverage Ratio 454.1% 198.7%
f. Return on Average Equity 18.2% 11.0%
g. Return on Average Assets 2.5% 1.4%
h. Net interest Margin 4.6% 4.5%
i. Cost-to-income Ratio 43.8% 53.0%

UNION BANK OF THE PHILIPPINES: 2021 SEC Form 17-Q 29
Annex 7
UNION BANK OF THE PHILIPPINES SEC FORM 17-Q
FOR THE THREE MONTHS ENDED MARCH 31, 2021 Item 2. Management’s Discussion and Analysis or Plan of Operation Statement of Income for the Three Months Ended March 31, 2021 vs March 31, 2020
Union Bank of the Philippines posted a net income of Php4.7 billion in the first three months of 2021, up 79% compared to the same period last year at Php2.6 billion. The Bank’s strong earnings performance was driven by strong revenue growth, which grew 50% year-on-year (YoY) to Php14.3 billion. Net interest income increased by 6% to Php7.2 billion due to higher margins from robust growth of CASA deposits, while non-interest income rose by 2.6x to Php7.1 billion mainly driven by trading gains.
Total interest income went down by 12% to Php8.8 billion driven by lower interest
income on loans and receivables, which declined by 10% to Php6.7 billion on account of lower average volume levels and average yields. Interest income on financial assets at fair value through profit and loss (FVTPL) also decreased by 59% to Php83.6 million for the same reason. Despite higher average volume levels, interest income on investment securities at amortized cost and fair value through other comprehensive income (FVOCI) was lower by 11% YoY to Php1.8 billion, interest income on cash and cash equivalents went down by 4% to Php210.2 million, and interest income on interbank loans receivable declined by 91% to Php6.3 million due to lower average yields.
Total interest expense went down by 50% to Php1.6 billion in the first three months of
the year from Php3.2 billion. This resulted from the lower interest expense on deposit liabilities, which declined by 61% to Php739.0 million driven by the robust growth of CASA deposits and lower interest rates from previous policy rate and reserve requirement ratio (RRR) cuts by the BSP. Interest expense on bills payable and other liabilities was also down by 33% YoY to Php870.3 million which contributed to the lower overall interest expense.
As a result, the Bank’s net interest income increased by 6% to Php7.2 billion from
Php6.8 billion a year ago. The Bank’s higher revenues provided cushion for the Bank to book additional loan loss
provisions of Php2.3 billion even as the Bank’s gross non-performing loans (NPL) ratio has declined to 4.7% from 5.1% in December 2020.
Total other income went up by 2.6x to Php7.1 billion from Php2.7 billion a year ago
driven by higher trading gains. The higher gains on investment securities at amortized cost offset the losses on trading and investment securities at FVTPL and FVOCI resulting to a 3.3x increase in total trading gains to Php5.8 billion from Php1.8 billion last year. Service charges, fees, and commissions grew 7% to Php593.3 million from higher transaction fees such as ATM charges, online bills payment fees, and card fees. Miscellaneous income which increased by 59% to Php636.3 million also boosted revenues driven by higher foreign exchange gains and lower trust fund loss of a subsidiary coming from lower mark-to-market losses of the underlying trust fund investments .
Total expenses amounted to Php6.3 billion in the first three months of the year
compared to Php5.1 billion in the same period last year. Salaries and employee benefits increased by Php465.9 million to Php2.2 billion on account of higher fringe benefit costs, as well as compensation-related increases. Taxes and licenses declined by 6% to Php751.7 million driven by revenue-related gross receipt taxes. Meanwhile, miscellaneous expense went up by 39% to Php2.7 billion mainly driven by goodwill impairment.

UNION BANK OF THE PHILIPPINES: 2021 SEC Form 17-Q 30
Provision for income tax increased to Php969.4 million from Php508.1 million as the Bank absorbed the one-time impact on deferred taxes due to the CREATE Law in the first quarter of the year.
Net gains attributable to non-controlling interests grew to Php12.6 million reflecting the subsidiaries’ performance for the year. Statement of Comprehensive Income for the Three Months Ended March 31, 2021 vs March 31, 2020
The Bank recorded a total comprehensive income of Php3.1 billion in the first quarter of 2021, 89% higher than Php1.6 billion in the same period last year. This was driven by the higher net income for the quarter at Php4.7 billion, partially offset by fair market value losses on investment securities at FVOCI amounting to Php1.5 billion, realized gains on sale of investment securities at FVOCI amounting to Php36.0 million, and losses on remeasurements of defined benefit plan (net of tax) amounting to Php74.1 million, inclusive of the impact of CREATE Law. Total comprehensive income attributable to non-controlling interests was at Php9.1million driven by subsidiaries’ performance for the year. Statement of Condition as of March 31, 2021 vs December 31, 2020
The Bank’s total assets as of March 31, 2021 was recorded at Php747.3 billion, lower by 4% compared to Php774.5 billion as of December 31, 2020 driven by lower Due from Bangko Sentral ng Pilipinas (BSP) and Due from Other Bank accounts.
Due from BSP account declined by 17% to Php86.0 billion due to the deployment of
funds to higher yielding securities and loans. Similarly, Due from other banks went down by 48% to Php35.9 billion from lower working balances with foreign correspondent banks. Interbank loans receivable was at Php14.8 billion as excess liquidity was placed in other banks.
Holdings of trading and investment securities increased to Php209.3 billion from
Php205.4 billion driven by the build-up of financial assets at FVOCI, which grew 74% to Php54.2 billion. Financial assets at amortized cost and FVTPL, on the other hand, went down by 6% and 55% to Php146.7 billion and Php8.4 billion, respectively.
Net loans and other receivables amounted to Php344.9 billion as of March 31, 2021, up
2% from Php339.5 billion as of end-December 2020 driven by higher securities purchased under reverse repurchase agreements. Loan-to-deposit ratio was recorded at 69% as at March 31, 2021 vs. 64% at year-end 2020.
Total liabilities were lower by 4% to Php643.3 billion as of end-March 2021 compared
to Php669.3 billion at end-December 2020. Deposit liabilities were down by 5% to Php500.3 billion driven by the lower level of time deposits at Php219.8 billion, 17% lower than Php266.0 billion at year-end 2020. Demand and savings deposits, on the other hand, increased by 8% and 7% to Php171.9 billion and Php105.5 billion, respectively, from the Bank’s strong CASA businesses across retail and institutional segments.
Total capital funds decreased by 1% to Php104.0 billion compared to end-December
2020 mainly driven by the lower market value of the Bank’s investment securities at FVOCI which resulted to net unrealized loss balance of Php1.5 billion. Surplus reserves, on the other hand, increased by 9% to Php2.9 billion on account of the appropriation for the difference between BSP’s required 1% general loan loss provision (GLLP) over the Bank’s computed expected credit loss (ECL) allowance for stage 1 accounts.

UNION BANK OF THE PHILIPPINES: 2021 SEC Form 17-Q 31
Key performance indicators of the Bank are as follows:
Mar 2021* Mar 2020* Return on Average Assets 2.5% 1.4% Return on Average Equity 18.2% 11.0% Cost-to-Income Ratio 43.8% 53.0% Mar 2021* Dec 2020 Net Non-Performing Loan Ratio
2.9% 3.2%
Capital Adequacy Ratio 17.6% 17.0% The manner by which the Bank calculates the above indicators is as follows:
Return on Average Assets: Net income divided by average total resources for the period indicated
Return on Average Equity: Net income divided by average total capital funds for the period indicated
Cost-to-Income Ratio: Total operating expenses divided by the sum of net interest income and other income
Net Non-Performing Loan Ratio: (Total non-performing loans less specific loan loss reserves for NPL) divided by (total loans inclusive of interbank loans receivables)
Capital Adequacy Ratio: Total qualifying capital divided by total risk-weighted assets (inclusive of credit, market and operational risk charge)
*Based on unaudited figures
As to material event/s and uncertainties, the Bank has nothing to disclose on the following apart from those already disclosed elsewhere or presented in the accompanying audited financial statements:
• Any known trends, demands, commitments, events or uncertainties that will have a material impact on the issuer’s liquidity.
• Any events that will trigger direct or contingent financial obligation, including any default or acceleration of an obligation.
• Any material off-balance sheet transactions, arrangements, obligations (including contingent obligations), and other relationships of the company.
• Any material commitments for capital expenditures, the general purpose of such commitments and the expected sources of funds for such expenditures.
• Any known trends, events or uncertainties that have had or that are reasonably expected` to have a material favorable or unfavorable impact on net sales/revenues/income from continuing operations.
• Any significant elements of income or loss that did not arise from the issuer’s continuing operations. Any seasonal aspects that had a material effect on the financial condition or results of operations.

UNION BANK OF THE PHILIPPINES: 2021 SEC Form 17-Q 32
UNIONBANK OF THE PHILIPPINES ANNEX II
Aging of Accounts Receivable
As of March 31, 2021
Current
PD NPL
ITL 90 days 91 to 121 to 181 days
more
than Total Past
Type of Accounts Receivable Total or less 120 days 180 days to 1 year 1 year Due
1) Interbank Loans
Receivable
14,760,470
14,760,470
2) Loans
344,476,914
313,526,118
17,122,988
2,150,209
2,256,219
4,591,393
4,813,123 30,933,931 16,865
3) Accrued Interest
Receivable
6,778,137
4,573,442
268,381
38,626
127,215
1,405,658
364,815
2,204,695 -
4) Sales Contract Receivable
1,422,163
1,335,566
35,857
5,171
564
12,682
32,323 86,597 -
5) Accounts Receivable
4,313,215
2,837,674
87,117
24,387
119,670
136,623
929,109
1,296,906 178,635
6) Installment Contract
Receivable
4,170
-
-
-
-
-
4,170 4,170 -
Less: Allow. For Doubtful
Account
12,112,206
TOTAL
359,642,863
337,033,270
17,514,342
2,218,393
2,503,668
6,146,356
6,143,540 195,500


*SGVFSM005928*
C O V E R S H E E Tfor
AUDITED FINANCIAL STATEMENTS
SEC Registration Number
3 6 7 0 3
C O M P A N Y N A M E
U N I O N B A N K O F T H E P H I L I P P I N E S
PRINCIPAL OFFICE ( No. / Street / Barangay / City / Town / Province )
U N I O N B A N K P L A Z A M E R A L C O A V E N U E
C O R O N Y X A N D S A P P H I R E S T R E E T S
O R T I G A S C E N T E R , P A S I G C I T Y
Form Type Department requiring the report Secondary License Type, If Applicable
A A F S
C O M P A N Y I N F O R M A T I O N
Company’s Email Address Company’s Telephone Number Mobile Number
www.unionbankph.com 8667-6388
No. of Stockholders Annual Meeting (Month / Day) Fiscal Year (Month / Day)
4,953 May 22 December 31
CONTACT PERSON INFORMATION
The designated contact person MUST be an Officer of the Corporation
Name of Contact Person Email Address Telephone Number/s Mobile Number
FRANCIS B. ALBALATE [email protected] (632) 8667-6388
CONTACT PERSON’s ADDRESS
UnionBank Plaza Bldg, Meralco Ave. cor. Onyx and Sapphire Streets, Ortigas Center, Pasig City
NOTE 1 : In case of death, resignation or cessation of office of the officer designated as contact person, such incident shall be reported to the Commissionwithin thirty (30) calendar days from the occurrence thereof with information and complete contact details of the new contact person designated.
2 : All Boxes must be properly and completely filled-up. Failure to do so shall cause the delay in updating the corporation’s records with
the Commission and/or non-receipt of Notice of Deficiencies. Further, non-receipt of Notice of Deficiencies shall not excuse the corporation from liability for itsdeficiencies.

*SGVFSM005928*
INDEPENDENT AUDITOR’S REPORT
The Board of Directors and StockholdersUnion Bank of the PhilippinesUnionBank PlazaMeralco Avenue corner Onyx street and Sapphire Road,Ortigas Center, Pasig City
Report on the Consolidated and Parent Bank Financial Statements
Opinion
We have audited the consolidated financial statements of Union Bank of the Philippines and itssubsidiaries (the Group) and the parent bank financial statements of Union Bank of the Philippines (theParent Bank), which comprise the consolidated and parent bank statements of financial position as atDecember 31, 2020 and 2019, and the consolidated and parent bank statements of income, consolidatedand parent bank statements of comprehensive income, consolidated and parent bank statements ofchanges in capital funds and consolidated and parent bank statements of cash flows for each of the threeyears in the period ended December 31, 2020, and notes to the consolidated and parent bank financialstatements, including a summary of significant accounting policies.
In our opinion, the accompanying consolidated and parent bank financial statements present fairly, in allmaterial respects, the financial position of the Group and the Parent Bank as at December 31, 2020 and2019, and their financial performance and their cash flows for each of the three years in the period endedDecember 31, 2020 in accordance with Philippine Financial Reporting Standards (PFRSs).
Basis for Opinion
We conducted our audits in accordance with Philippine Standards on Auditing (PSAs). Ourresponsibilities under those standards are further described in the Auditor’s Responsibilities for the Audit
of the Consolidated and Parent Bank Financial Statements section of our report. We are independent ofthe Group and the Parent Bank in accordance with the Code of Ethics for Professional Accountants in thePhilippines (Code of Ethics) together with the ethical requirements that are relevant to our audit of theconsolidated and parent bank financial statements in the Philippines, and we have fulfilled our otherethical responsibilities in accordance with these requirements and the Code of Ethics. We believe that theaudit evidence we have obtained is sufficient and appropriate to provide a basis for our opinion.
Key Audit Matters
Key audit matters are those matters that, in our professional judgment, were of most significance in ouraudit of the consolidated and parent bank financial statements of the current period. These matters wereaddressed in the context of our audit of the consolidated and parent bank financial statements as a whole,and in forming our opinion thereon, and we do not provide a separate opinion on these matters. For eachmatter below, our description of how our audit addressed the matter is provided in that context.
SyCip Gorres Velayo & Co.6760 Ayala Avenue1226 Makati CityPhilippines
Tel: (632) 8891 0307Fax: (632) 8819 0872ey.com/ph
BOA/PRC Reg. No. 0001, October 4, 2018, valid until August 24, 2021SEC Accreditation No. 0012-FR-5 (Group A),
November 6, 2018, valid until November 5, 2021
A member firm of Ernst & Young Global Limited

*SGVFSM005928*
- 2 -
We have fulfilled the responsibilities described in the Auditor’s Responsibilities for the Audit of the
Consolidated and Parent Bank Financial Statements section of our report, including in relation to thesematters. Accordingly, our audit included the performance of procedures designed to respond to ourassessment of the risks of material misstatement of the consolidated and parent bank financial statements.The results of our audit procedures, including the procedures performed to address the matters below,provide the basis for our audit opinion on the accompanying consolidated and parent bank financialstatements.
Applicable to the Audit of the Consolidated and Parent Bank Financial Statements
Allowance for expected credit loss (ECL)
The Group’s and the Parent Bank’s application of the expected credit loss (ECL) model in calculatingthe allowance for credit losses on loans and receivables is significant to our audit as it involves theexercise of significant management judgment. Key areas of judgment include: segmenting the Group’sand the Parent Bank’s credit risk exposures; determining the method to estimate ECL; definingdefault; identifying exposures with significant deterioration in credit quality, taking into accountextension of payment terms and payment holidays provided as a result of the coronavirus pandemic;determining assumptions used in the ECL model such as the counterparty credit risk rating, theexpected life of the financial asset, expected recoveries from defaulted accounts, and impact of creditenhancements extended by any party; and incorporating forward-looking information, including theimpact of the coronavirus pandemic, in calculating ECL.
Refer to Notes 4 and 20 of the consolidated and parent bank financial statements for the disclosures onthe details of the allowance for credit losses using the ECL model.
Audit Response
We obtained an understanding of the methodologies and models used for the Group’s and the ParentBank’s different credit exposures and assessed whether these considered the requirements of PFRS 9,Financial Instruments, to reflect an unbiased and probability-weighted outcome, and to consider timevalue of money and the best available forward-looking information. We also inspected and consideredthe results of the model validation on the risk rating performed by management’s specialist.
We (a) assessed the Group’s and the Parent Bank’s segmentation of its credit risk exposures based onhomogeneity of credit risk characteristics; (b) tested the definition of default and significant increase incredit risk criteria against historical analysis of accounts, credit risk management policies and practices inplace, and management’s assessment of the impact of the coronavirus pandemic on the counterparties;(c) tested the Group’s and the Parent Bank’s application of internal credit risk rating system, including theimpact of the coronavirus pandemic on the borrowers, by reviewing the ratings of sample creditexposures; (d) tested loss given default by inspecting historical recoveries and related costs, write-offsand collateral valuations, and the effects of credit enhancements provided by any party; (e) testedexposure at default considering outstanding commitments and repayment scheme; (f) checked theforward-looking information used for overlay through statistical test and corroboration using publiclyavailable information and our understanding of the Group’s and the Parent Bank’s lending portfolios andbroader industry knowledge, including the impact of the coronavirus pandemic; and (g) tested theeffective interest rate used in discounting the expected credit loss.

*SGVFSM005928*
- 3 -
Further, we checked the data used in the ECL models by reconciling data from source system reports tothe data warehouse and from the data warehouse to the loss allowance models and financial reportingsystems. To the extent that the loss allowance analysis is based on credit exposures that have beendisaggregated into subsets of debt financial assets with similar risk characteristics, we traced or re-performed the disaggregation from source systems to the loss allowance analysis.
We recalculated impairment provisions on a sample basis. We reviewed the completeness of thedisclosures made in the consolidated and parent bank financial statements.
We involved our internal specialists in the performance of the above procedures.
Accounting for Disposals of Investment Securities held under the Hold-to-Collect (HTC) Business Model
In 2020, the Parent Bank disposed of investment securities managed under the hold-to-collect (HTC)business model. Investment securities held under a hold-to-collect business model, which are classifiedas ‘Investment securities at amortized cost’, are managed to realize cash flows by collecting contractualpayments over the life of the instrument.
The accounting for the disposals is significant to our audit because the amounts involved are material tothe consolidated and parent bank financial statements. Moreover, it involves the exercise of significantjudgment by management in assessing that the disposals are consistent with the HTC business model andthat it would not impact the measurement of the remaining securities in the affected portfolios.
The disclosures relating to the disposals from its HTC portfolio are included in Note 3 to the consolidatedand parent bank financial statements.
Audit Response
We obtained an understanding of the Parent Bank’s objectives for disposals of investment securities atamortized cost through inquiries with management and review of approved internal documentations,including governance over the disposals. We evaluated management’s assessment of the impact of thedisposals on the affected portfolios in reference to the Parent Bank’s business models and the provisionsof the relevant accounting standards and regulatory issuances. We also reviewed the calculation of thegains on the disposals and the measurement of the remaining securities in the affected portfolios.
We reviewed the disclosures related to the disposals based on the requirements of PFRS 7, Financial
Instruments: Disclosures, PFRS 9 and Philippine Accounting Standard (PAS 1), Presentation of
Financial Statements.
Impairment testing of goodwill
Under PFRS, the Group and the Parent Bank perform testing of goodwill for impairment annually ormore frequently if events or changes in circumstances indicate that the carrying values may be impaired.The Group’s and the Parent Bank’s goodwill attributable to the various cash generating units (CGUs) isconsidered significant to the consolidated and parent bank financial statements. The Group’s and theParent Bank’s impairment assessment requires significant judgement and is based on assumptions whichare subject to higher level of estimation uncertainty due to the current economic conditions which havebeen impacted by the coronavirus pandemic, specifically on loan growth rate, deposit growth rate anddiscount rate. The disclosures in relation to the CGUs to which the goodwill is allocated and the Group’sand the Parent Bank’s impairment assessment are included in Notes 3 and 18 to the consolidated andparent bank financial statements.
A member firm of Ernst & Young Global Limited

*SGVFSM005928*
- 4 -
Audit Response
We involved our internal specialist in evaluating the methodologies and the assumptions used incalculating the value-in-use (VIU) of the CGUs. We compared the key assumptions used such as loangrowth rate, deposit growth rate and discount rate against the historical financial performance and thespecific plans for the CGUs and other relevant external data, taking into consideration the impactassociated with coronavirus pandemic. We tested the parameters used in the determination of the discountrate against market data. We also reviewed the Group’s and the Parent Bank’s disclosures about thoseassumptions to which the outcome of the impairment test is most sensitive; specifically those that havethe most significant effect on the determination of the recoverable amount of goodwill.
Other Information
Management is responsible for the other information. The other information comprises the informationincluded in the SEC Form 20-IS (Definitive Information Statement), SEC Form 17-A and Annual Reportfor the year ended December 31, 2020, but does not include the consolidated and parent bank financialstatements and our auditor’s report thereon. The SEC Form 20-IS (Definitive Information Statement),SEC Form 17-A and Annual Report for the year ended December 31, 2020 are expected to be madeavailable to us after the date of this auditor’s report.
Our opinion on the consolidated and parent bank financial statements does not cover the otherinformation and we will not express any form of assurance conclusion thereon.
In connection with our audit of the consolidated and parent bank financial statements, our responsibility isto read the other information identified above when it becomes available and, in doing so, considerwhether the other information is materially inconsistent with the consolidated and parent bank financialstatements or our knowledge obtained in the audits, or otherwise appears to be materially misstated.
Responsibilities of Management and Those Charged with Governance for the Consolidated and
Parent Bank Financial Statements
Management is responsible for the preparation and fair presentation of the consolidated and parent bankfinancial statements in accordance with PFRSs, and for such internal control as management determinesis necessary to enable the preparation of consolidated and parent bank financial statements that are freefrom material misstatement, whether due to fraud or error.In preparing the consolidated and parent bankfinancial statements, management is responsible for assessing the Group’s and Parent Bank’s ability tocontinue as a going concern, disclosing, as applicable, matters related to going concern and using thegoing concern basis of accounting unless management either intends to liquidate the Group and the ParentBank or to cease operations, or has no realistic alternative but to do so.Those charged with governance areresponsible for overseeing the Group’s and Parent Bank’s financial reporting process.
Auditor’s Responsibilities for the Audit of the Consolidated and Parent Bank Financial Statements
Our objectives are to obtain reasonable assurance about whether the consolidated and parent bankfinancial statements as a whole are free from material misstatement, whether due to fraud or error, and toissue an auditor’s report that includes our opinion. Reasonable assurance is a high level of assurance, butis not a guarantee that an audit conducted in accordance with PSAs will always detect a materialmisstatement when it exists. Misstatements can arise from fraud or error and are considered material if,individually or in the aggregate, they could reasonably be expected to influence the economic decisions ofusers taken on the basis of these consolidated and parent bank financial statements.
A member firm of Ernst & Young Global LimitedA member firm of Ernst & Young Global Limited

*SGVFSM005928*
- 5 -
As part of an audit in accordance with PSAs, we exercise professional judgment and maintainprofessional skepticism throughout the audit. We also:
Identify and assess the risks of material misstatement of the consolidated and parent bank financialstatements, whether due to fraud or error, design and perform audit procedures responsive to thoserisks, and obtain audit evidence that is sufficient and appropriate to provide a basis for our opinion.The risk of not detecting a material misstatement resulting from fraud is higher than for one resultingfrom error, as fraud may involve collusion, forgery, intentional omissions, misrepresentations, or theoverride of internal control.
Obtain an understanding of internal control relevant to the audit in order to design audit proceduresthat are appropriate in the circumstances, but not for the purpose of expressing an opinion on theeffectiveness of the Group’s and Parent Bank’s internal control.
Evaluate the appropriateness of accounting policies used and the reasonableness of accountingestimates and related disclosures made by management.
Conclude on the appropriateness of management’s use of the going concern basis of accounting and,based on the audit evidence obtained, whether a material uncertainty exists related to events orconditions that may cast significant doubt on the Group’s and Parent Bank’s ability to continue as agoing concern. If we conclude that a material uncertainty exists, we are required to draw attention inour auditor’s report to the related disclosures in the consolidated and parent bank financial statementsor, if such disclosures are inadequate, to modify our opinion. Our conclusions are based on the auditevidence obtained up to the date of our auditor’s report. However, future events or conditions maycause the Group and the Parent Bank to cease to continue as a going concern.
Evaluate the overall presentation, structure and content of the consolidated and parent bank financialstatements, including the disclosures, and whether the consolidated and parent bank financialstatements represent the underlying transactions and events in a manner that achieves fairpresentation.
Obtain sufficient appropriate audit evidence regarding the financial information of the entities orbusiness activities within the Group to express an opinion on the consolidated financial statements.We are responsible for the direction, supervision and performance of the audit. We remain solelyresponsible for our audit opinion.
We communicate with those charged with governance regarding, among other matters, the planned scopeand timing of the audit and significant audit findings, including any significant deficiencies in internalcontrol that we identify during our audit.
We also provide those charged with governance with a statement that we have complied with relevantethical requirements regarding independence, and to communicate with them all relationships and othermatters that may reasonably be thought to bear on our independence, and where applicable, relatedsafeguards.
From the matters communicated with those charged with governance, we determine those matters thatwere of most significance in the audit of the consolidated and parent bank financial statements of thecurrent period and are therefore the key audit matters. We describe these matters in our auditor’s reportunless law or regulation precludes public disclosure about the matter or when, in extremely rarecircumstances, we determine that a matter should not be communicated in our report because the adverseconsequences of doing so would reasonably be expected to outweigh the public interest benefits of suchcommunication.
A member firm of Ernst & Young Global Limited

*SGVFSM005928*
- 6 -
Report on the Supplementary Information Required Under Bangko Sentral ng Pilipinas (BSP)
Circular No. 1074 and Revenue Regulations 15-2010
Our audit was conducted for the purpose of forming an opinion on the basic financial statements taken as
a whole. The supplementary information required under BSP Circular No. 1074 in Note 37 to thefinancial statements and Revenue Regulations 15-2010 in Note 38 to the financial statements is presented
for purposes of filing with the BSP and the Bureau of Internal Revenue, respectively, and is not a required
part of the basic financial statements. Such information is the responsibility of the management of UnionBank of the Philippines. The information has been subjected to the auditing procedures applied in our
audit of the basic financial statements. In our opinion, the information is fairly stated, in all material
respects, in relation to the basic financial statements taken as a whole.
The engagement partner on the audit resulting in this independent auditor’s report is Janet A. Paraiso.
SYCIP GORRES VELAYO & CO.
Janet A. ParaisoPartner
CPA Certificate No. 92305
SEC Accreditation No. 0778-AR-3 (Group A),
June 19, 2018, valid until June 18, 2021Tax Identification No. 193-975-241
BIR Accreditation No. 08-001998-62-2020,
December 3, 2020, valid until December 2, 2023PTR No. 8534211, January 4, 2021, Makati City
February 26, 2021
A member firm of Ernst & Young Global Limited

*SGVFSM005928*
UNION BANK OF THE PHILIPPINES AND SUBSIDIARIES
STATEMENTS OF FINANCIAL POSITIONDecember 31, 2020 and 2019
(Amounts are presented in thousands of Philippine Pesos)
Group Parent Bank
December 31 December 31
2020 2019 2020 2019
RESOURCES
Cash and Other Cash Items (Note 8) P=8,958,042 P=8,580,709 P=7,814,917 P=7,832,302Due from Bangko Sentral ng Pilipinas (Note 8) 103,869,770 73,749,813 83,867,434 67,798,418
Due from Other Banks (Note 9) 68,532,218 73,675,709 64,763,768 71,497,226Interbank Loans Receivable (Note 10) − 213,062 − 213,062Trading and Investment Securities
At fair value through profit or loss (Note 11) 18,448,649 7,866,401 18,411,304 7,817,555At amortized cost (Note 12) 155,810,967 161,664,369 153,171,111 161,664,369At fair value through other comprehensive income (Note 13) 31,190,259 5,657,636 31,009,041 5,657,636
Loans and Other Receivables - net (Note 14) 339,536,830 392,564,364 273,339,863 332,136,609Investment in Subsidiaries and Associates (Note 15) 255,342 159,094 21,867,987 20,523,633Bank Premises, Furniture, Fixtures and Equipment - net (Note 16) 6,894,768 6,500,643 5,525,366 5,294,595
Investment Properties (Note 17) 8,922,366 9,127,581 7,662,547 8,044,119Goodwill (Note 18) 15,348,531 15,455,564 7,886,898 7,886,898Other Resources - net (Note 19) 16,691,495 15,572,594 13,559,769 11,247,053
TOTAL RESOURCES P=774,459,237 P=770,787,539 P=688,880,005 P=707,613,475
LIABILITIES AND CAPITAL FUNDS
LIABILITIES
Deposit Liabilities (Note 21)Demand P=159,783,546 P=136,288,738 P=160,883,453 P=137,357,451Savings 98,957,845 72,000,404 93,564,392 68,830,072
Time 266,043,635 273,046,898 207,780,774 229,766,826Long-term negotiable certificate of deposits 3,000,000 3,000,000 3,000,000 3,000,000
527,785,026 484,336,040 465,228,619 438,954,349
Bills Payable (Note 22) 54,223,543 105,087,722 34,502,421 92,149,256Notes and Bonds Payable (Note 23) 59,853,656 49,331,506 59,746,857 49,182,060Other Liabilities (Note 24) 27,444,610 34,015,306 24,838,361 29,339,260
669,306,835 672,770,574 584,316,258 609,624,925
CAPITAL FUNDS
Capital funds attributable to the Parent Bank’s stockholders (Note 25)Common stock 12,184,715 12,176,096 12,184,715 12,176,096Additional paid-in capital 14,214,983 14,172,060 14,214,983 14,172,060
Surplus free 77,096,218 67,851,771 77,697,363 70,201,147Surplus reserves 2,645,080 4,600,747 2,171,842 2,669,285Net unrealized fair value gains on investment securities (Note 13) 55,384 78,437 46,845 77,986
Remeasurements of defined benefit plan (Note 29) (1,815,784) (1,379,157) (1,741,389) (1,308,024)Other reserves (18,886) (3,549) (10,612) −
Total capital funds attributable to the Parent Bank’s stockholders 104,361,710 97,496,405 104,563,747 97,988,550
Non-controlling interests 790,692 520,560 − −105,152,402 98,016,965 104,563,747 97,988,550
TOTAL LIABILITIES AND CAPITAL FUNDS P=774,459,237 P=770,787,539 P=688,880,005 P=707,613,475
See accompanying Notes to Financial Statements.

*SGVFSM005928*
UNION BANK OF THE PHILIPPINES AND SUBSIDIARIES
STATEMENTS OF INCOMEFor the Years Ended December 31, 2020, 2019 and 2018
(Amounts are presented in thousands of Philippine Pesos, Except Earnings per Share)
Group Parent Bank
Years Ended December 31 Years Ended December 31
2020 2019 2018 2020 2019 2018
INTEREST INCOME ON
Loans and other receivables (Note 14) P=28,850,939 P=28,004,013 P=23,441,710 P=20,076,020 P=19,237,123 P=15,038,506Investment securities at amortized cost
and FVOCI (Notes 12 and 13) 8,084,663 9,491,890 7,836,159 7,937,196 9,491,890 7,836,159Cash and cash equivalents (Notes 8 and 9) 1,021,974 188,086 207,458 756,035 127,654 148,788Trading securities at FVTPL (Note 11) 524,261 423,688 36,639 524,261 423,688 36,639
Interbank loans receivable (Note 10) 95,857 247,478 107,254 95,451 247,039 126,167
38,577,694 38,355,155 31,629,220 29,388,963 29,527,394 23,186,259
INTEREST EXPENSE ON
Deposit liabilities (Note 21) 5,616,821 10,160,322 8,841,473 4,256,480 8,069,749 7,045,224Bills payable and other liabilities
(Notes 22, 23, 24 and 29) 4,230,619 5,859,148 2,788,350 3,262,923 4,847,211 1,983,958
9,847,440 16,019,470 11,629,823 7,519,403 12,916,960 9,029,182
NET INTEREST INCOME 28,730,254 22,335,685 19,999,397 21,869,560 16,610,434 14,157,077
PROVISION FOR CREDIT
LOSSES (Note 20) 8,381,856 1,857,347 855,991 7,450,171 1,548,187 803,576
NET INTEREST INCOME AFTER
PROVISION FOR CREDIT
LOSSES 20,348,398 20,478,338 19,143,406 14,419,389 15,062,247 13,353,501
OTHER INCOME
Gains on sale of investment securities atamortized cost (Note 12) 5,111,793 7,074,044 152,161 5,111,793 7,074,044 152,161
Gains on trading and investment securities at FVTPL and FVOCI (Notes 11 and 13) 3,829,710 2,347,389 1,390,897 3,831,674 2,348,971 1,390,867
Service charges, fees andcommissions (Note 27) 2,346,639 1,956,218 1,572,244 1,723,620 1,422,716 1,284,667
Miscellaneous (Note 28) 2,078,996 2,967,381 2,358,277 2,565,048 3,592,846 3,999,191
13,367,138 14,345,032 5,473,579 13,232,135 14,438,577 6,826,886
TOTAL OPERATING INCOME 33,715,536 34,823,370 24,616,985 27,651,524 29,500,824 20,180,387
OTHER EXPENSES
Salaries and employee benefits (Note 29) 7,809,204 8,070,248 5,726,593 5,910,981 6,434,752 4,669,491Taxes and licenses (Note 17) 3,503,233 3,052,481 2,563,610 2,597,693 2,239,684 1,776,391
Depreciation and amortization (Note 28) 1,406,900 1,378,194 1,115,607 1,008,907 904,950 862,997Occupancy (Note 16) 904,750 962,275 849,476 674,692 676,207 673,387Miscellaneous (Note 28) 7,749,066 6,862,168 6,447,574 6,126,463 5,333,354 5,210,328
21,373,153 20,325,366 16,702,860 16,318,736 15,588,947 13,192,594
PROFIT BEFORE TAX 12,342,383 14,498,004 7,914,125 11,332,788 13,911,877 6,987,793
INCOME TAX EXPENSE
(BENEFIT) (Note 30) 781,380 494,494 1,039,673 69,365 (114,242) 203,123
NET PROFIT P=11,561,003 P=14,003,510 P=6,874,452 P=11,263,423 P=14,026,119 P=6,784,670
Attributable to:
Parent Bank’s stockholders P=11,553,430 P=14,026,128 P=6,875,587 P=11,263,423 P=14,026,119 P=6,784,670
Non-controlling interests 7,573 (22,618) (1,135) − − −P=11,561,003 P=14,003,510 P=6,874,452 P=11,263,423 P=14,026,119 P=6,784,670
Basic/Diluted Earnings per Share
(Note 33) P=9.48 P=11.52 P=6.26 P=9.24 P=11.52 P=6.18
See accompanying Notes to Financial Statements.

*SGVFSM005928*
UNION BANK OF THE PHILIPPINES AND SUBSIDIARIES
STATEMENTS OF COMPREHENSIVE INCOMEFor the Years Ended December 31, 2020, 2019 and 2018
(Amounts are presented in thousands of Philippine Pesos)
Group Parent Bank
Years Ended December 31 Years Ended December 31
2020 2019 2018 2020 2019 2018
NET PROFIT FOR THE YEAR P=11,561,003 P=14,003,510 P=6,874,452 P=11,263,423 P=14,026,119 P=6,784,670
OTHER COMPREHENSIVE
INCOME (LOSS)
Items that may be reclassified to profit or
loss in subsequent periods:
Realized gains on sale of investment securities at FVOCI recognized
in profit or loss (Note 13) (3,020,457) (1,072,005) (1,496,649) (3,020,457) (1,072,005) (1,496,649) Unrealized mark-to-market gains on investment securities
at FVOCI 2,997,404 1,075,277 1,571,749 2,989,316 1,074,826 1,571,749Cumulative translation adjustment (15,337) (3,549) − (10,612) − −
Items that will not be reclassified to
profit or loss in subsequent periods:
Remeasurement gains (losses) on defined benefit plan (Note 29) (634,623) (562,373) 271,197 (588,767) (336,186) 232,394
Income tax benefit (expense) (Note 30) 190,387 168,712 (81,359) 176,630 100,856 (69,718) Share in changes in remeasurement
gains (losses) of subsidiaries (Note 15) − − − (21,228) (87,086) 26,171
TOTAL OTHER COMPREHENSIVE
INCOME (LOSS) FOR THE YEAR (482,626) (393,938) 264,938 (475,118) (319,595) 263,947
TOTAL COMPREHENSIVE INCOME
FOR THE YEAR P=11,078,377 P=13,609,572 P=7,139,390 P=10,788,305 P=13,706,524 P=7,048,617
Attributable to:
Parent Bank’s stockholders P=11,078,413 P=13,632,190 P=7,140,511 P=10,788,305 P=13,706,524 P=7,048,617Non-controlling interests (36) (22,618) (1,121) − − −
P=11,078,377 P=13,609,572 P=7,139,390 P=10,788,305 P=13,706,524 P=7,048,617
See accompanying Notes to Financial Statements.

*SGVFSM005928*
UNION BANK OF THE PHILIPPINES AND SUBSIDIARIES
STATEMENTS OF CHANGES IN CAPITAL FUNDSFor the Years Ended December 31, 2020, 2019 and 2018
(Amounts are presented in thousands of Philippine Pesos)
Group
Equity Attributable to Equity Holders of the Parent Bank
Capital Stock
Additional
Paid-in Capital Surplus Free Surplus Reserves
Net Unrealized
Fair Value
Gains on
Investment
Securities at
FVOCI
Remeasurements
of Defined
Benefit Plan Other Reserves Total
Non-controlling
Interests
Total Capital
Funds
Balances as at January 1, 2020 P=12,176,096 P=14,172,060 P=67,851,771 P=4,600,747 P=78,437 (P=1,379,157) (P=3,549) P=97,496,405 P=520,560 P=98,016,965
Total comprehensive income (loss) for the year − − 11,553,430 − (23,053) (436,627) (15,337) 11,078,413 (36) 11,078,377
Issuance of new shares (Note 25) 8,619 42,923 − − − − − 51,542 − 51,542
Cash dividends (Note 25) − − (4,264,650) − − − − (4,264,650) − (4,264,650)
Effect of business combination (Note 15) − − − − − − − − 270,168 270,168
Reversal of appropriations during the year -net (Note 25) − − 1,955,667 (1,955,667) − − − − − −Balances as at December 31, 2020 P=12,184,715 P=14,214,983 P=77,096,218 P=2,645,080 P=55,384 (1,815,784) (P=18,886) P=104,361,710 P=790,692 P=105,152,402
Balances as at January 1, 2019 P=12,171,495 P=14,146,988 P=57,236,205 P=3,502,769 P=75,165 (P=985,496) P=− P=86,147,126 P=543,178 P=86,690,304Total comprehensive income (loss) for the year − − 14,026,128 − 3,272 (393,661) (3,549) 13,632,190 (22,618) 13,609,572Issuance of new shares (Note 25) 4,601 25,072 − − − − − 29,673 − 29,673Cash dividends (Note 25) − − (2,312,584) − − − − (2,312,584) − (2,312,584)Appropriations during the year (Note 25) − − (1,097,978) 1,097,978 − − − − − −Balances as at December 31, 2019 P=12,176,096 P=14,172,060 P=67,851,771 P=4,600,747 P=78,437 (P=1,379,157) (P=3,549) P=97,496,405 P=520,560 P=98,016,965
Balances as at January 1, 2018 10,583,439 5,819,861 53,914,302 1,959,938 65 (1,175,320) − 71,102,285 52,411 71,154,696Total comprehensive income (loss) for the year − − 6,875,587 − 75,100 189,824 − 7,140,511 (1,121) 7,139,390Issuance of new shares (Note 25) 1,588,056 8,327,127 − − − − − 9,915,183 − 9,915,183Cash dividends (Note 25) − − (2,010,853) − − − − (2,010,853) − (2,010,853)Appropriations during the year (Note 25) − − (1,542,831) 1,542,831 − − − − − −Effect of business combination (Note 15) − − − − − − − − 493,635 493,635Acquisition of shares of non-controlling interests − − − − − − − − (1,747) (1,747)
Balances as at December 31, 2018 P=12,171,495 P=14,146,988 P=57,236,205 P=3,502,769 P=75,165 (P=985,496) P=− P=86,147,126 P=543,178 P=86,690,304

*SGVFSM005928*
- 2 -
Parent Bank
Capital Stock
Additional
Paid-in Capital Surplus Free Surplus Reserves
Net Unrealized
Fair Value
Gains on
Investment
Securities at
FVOCI
Remeasurements
of Defined
Benefit Plan Other Reserves
Total Capital
Funds
Balances as at January 1, 2020 P=12,176,096 P=14,172,060 P=70,201,147 P=2,669,285 P=77,986 (P=1,308,024) P=− P=97,988,550
Total comprehensive income for the year − − 11,263,423 − (31,141) (433,365) (10,612) 10,788,305
Issuance of new shares (Note 25) 8,619 42,923 − − − − − 51,542
Cash dividends (Note 25) − − (4,264,650) − − − − (4,264,650)
Reversals of appropriations during the year – net (Note 25) − − 497,443 (497,443) − − − −Balances as at December 31, 2020 P=12,184,715 P=14,214,983 P=77,697,363 P=2,171,842 P=46,845 (P=1,741,389) (P=10,612) P=104,563,747
Balances as at January 1, 2019 P=12,171,495 P=14,146,988 P=59,281,830 P=1,875,067 P=75,165 (P=985,608) P=− P=86,564,937
Total comprehensive income for the year − − 14,026,119 − 2,821 (322,416) − 13,706,524
Issuance of new shares (Note 25) 4,601 25,072 − − − − − 29,673Cash dividends (Note 25) − − (2,312,584) − − − − (2,312,584)
Appropriations during the year (Note 25) − − (794,218) 794,218 − − − −Balances as at December 31, 2019 P=12,176,096 P=14,172,060 P=70,201,147 P=2,669,285 P=77,986 (P=1,308,024) P=− P=97,988,550
Balances as at January 1, 2018 P=10,583,439 P=5,819,861 P=56,147,907 P=235,173 P=65 (P=1,174,455) P=− P=71,611,990
Total comprehensive income for the year, 6,784,670 75,100 188,847 7,048,617Issuance of new shares (Note 25) 1,588,056 8,327,127 − − − − − 9,915,183
Cash dividends (Note 25) − − (2,010,853) − − − − (2,010,853)
Appropriations during the year (Note 25) − − (1,639,894) 1,639,894 − − − −Balances as at December 31, 2018 P=12,171,495 P=14,146,988 P=59,281,830 P=1,875,067 P=75,165 (P=985,608) P=− P=86,564,937
See accompanying Notes to Financial Statements.

*SGVFSM005928*
UNION BANK OF THE PHILIPPINES AND SUBSIDIARIES
CONSOLIDATED STATEMENTS OF CASH FLOWSFor the Years Ended December 31, 2020, 2019 and 2018
(Amounts are presented in thousands of Philippine Pesos)
GROUP PARENT BANK
Years Ended December 31 Years Ended December 31
2020 2019 2018 2020 2019 2018
CASH FLOWS FROM OPERATING
ACTIVITIES
Profit before tax P=12,342,383 P=14,498,004 P=7,914,125 P=11,332,788 P=13,911,877 P=6,987,793Adjustments for:
Provision for credit losses (Note 20) 8,381,856 1,857,347 855,991 7,450,171 1,548,187 803,576 Gains on sale of investment securities
at amortized cost (Note 12) (5,111,793) (7,074,044) (152,161) (5,111,793) (7,074,044) (152,161) Gain on sale of investment securities at
FVOCI (Note 13) (3,020,457) (1,072,005) (1,496,649) (3,020,457) (1,072,005) (1,496,649)Depreciation and amortization (Note 16) 1,928,421 1,883,035 1,115,607 1,447,218 1,308,500 862,997
Amortization of premium or discount of
financial assets and liabilities 633,893 975,812 789,669 635,120 953,206 789,669 Gains on sale of investment
properties (Note 17) (229,148) (200,079) (258,000) (195,471) (251,696) (245,980) Impairment of goodwill and investment in
subsidiaries (Notes 15 and 18) 223,172 − − 290,002 − − Gains on foreclosure of investment
properties (Note 17) (153,876) (221,213) (239,741) (153,876) (208,233) (285,902) Unrealized foreign exchange loss
(gains) - net 45,873 (785,049) 208,731 45,882 (775,871) 208,731 Losses (gains) on disposal of property and
equipment (Note 16) 8,641 (679,298) (44,296) (6,236) (616,137) (44,225) Share in net loss (profit) of subsidiaries and
associates (Notes 15 and 28) 3,665 464 8 (953,082) (1,222,595) (1,775,210)
Changes in operating assets and liabilities:Decreases (increases) in:
Trading securities at FVTPL (10,582,248) 417,294 (5,101,655) (10,593,749) 408,014 (5,095,148)Loans and other receivables 29,147,657 (52,976,314) (30,076,903) 33,878,915 (57,372,464) (38,198,505)
Other resources (28,285) (1,200,710) (314,679) (1,175,000) (1,754,855) (1,497,652)Increases (decreases) in:
Deposit liabilities 46,590,101 66,633,507 (34,333,250) 32,349,777 61,243,986 (22,263,837)Other liabilities (6,953,527) 5,672,031 1,227,633 (4,817,926) 6,191,690 2,370,605
Net cash provided by (used in) operations 73,226,328 27,728,782 (59,905,570) 61,402,283 15,217,560 (59,031,898)
Income taxes paid (2,155,071) (1,703,147) (1,715,018) (1,296,905) (1,055,476) (875,121)
Net cash provided by (used in)
operating activities 71,071,257 26,025,635 (61,620,588) 60,105,378 14,162,084 (59,907,019)
CASH FLOWS FROM INVESTING
ACTIVITIES
Acquisitions of:
Investment securities at FVOCI (97,655,465) (54,459,546) (10,673,937) (97,655,465) (54,459,546) (10,673,937)
Investment securities at amortized cost (65,958,555) (26,829,682) (64,539,694) (63,475,137) (26,829,682) (64,539,694) Bank premises, furniture, fixtures and
equipment (Note 16) (1,026,363) (934,553) (1,042,901) (867,690) (810,243) (906,532)Proceeds from maturities/sale of:
Investment securities at FVOCI 72,201,864 59,623,639 20,537,059 72,201,864 59,623,188 20,537,059Investment securities at amortized cost 71,519,901 71,355,242 12,373,015 71,519,901 71,355,242 12,373,015
Investment properties (Note 17) 410,787 254,865 337,631 273,676 220,404 315,474 Bank premises, furniture, fixtures and
equipment (Note 16) 12,418 803,666 70,920 18,138 700,894 64,781Acquisition of associates and subsidiaries, net of
cash acquired (Note 15) 54,241 (130,000) (6,364,415) (702,502) (487,500) (1,747)
Net cash provided by (used in)investing activities (20,441,172) 49,683,631 (49,302,322) (18,687,215) 49,312,757 (42,831,581)
(Forward)

*SGVFSM005928*
- 2 -
GROUP PARENT BANK
Years Ended December 31 Years Ended December 31
2020 2019 2018 2020 2019 2018
CASH FLOWS FROM FINANCING
ACTIVITIES
Payments of:Bills payable (P=609,512,421) (P=2,291,736,846) (P=613,840,876) (P=565,341,774) (P=2,235,935,766) (P=602,798,238)
Notes and bonds payable (21,171,857) (3,426,766) − (18,200,000) − −Cash dividends (4,264,650) (2,312,584) (2,010,853) (4,264,650) (2,312,584) (2,010,853)
Lease liabilities (613,498) (527,633) − (477,197) (426,711) − Long term negotiable certificate of
deposits (Note 21) − (3,000,000) − − (3,000,000) −Proceeds from:
Bills payable 558,732,399 2,305,932,334 657,746,587 507,779,097 2,263,433,630 638,847,784
Notes payable (Note 23) 33,135,900 9,199,139 11,013,685 30,206,900 5,800,000 10,863,685Issuance of new shares (Note 25) 51,542 29,673 9,915,183 51,542 29,673 9,915,183
Issuance of long term negotiable certificateof deposits (Note 21) − − 3,000,000 − − 3,000,000
Net cash provided by (used in)
financing activities (43,642,585) 14,157,317 65,823,726 (50,246,082) 27,588,242 57,817,561
EFFECT OF CHANGES IN FOREIGN
CURRENCY EXCHANGE RATES (145,377) (125,033) 554,301 (140,652) (121,484) 554,301
NET INCREASE (DECREASE) IN CASH
AND CASH EQUIVALENTS 6,842,123 89,741,550 (44,544,883) (8,968,571) 90,941,599 (44,366,738)
CASH AND CASH EQUIVALENTS AT
BEGINNING OF THE YEAR
Cash and other cash items 8,580,709 10,916,533 6,633,237 7,832,302 10,334,793 6,249,122Due from Bangko Sentral ng Pilipinas (BSP) 73,749,813 56,510,701 66,276,960 67,798,418 52,961,426 60,350,126
Due from other banks 73,675,709 14,942,213 54,520,482 71,497,226 11,550,166 53,690,233Interbank loans receivable 213,062 − 4,793,280 213,062 − 4,793,280
Securities purchased under repurchase agreement(SPURA) 34,773,704 18,882,000 13,572,371 28,446,976 10,000,000 4,130,362
190,992,997 101,251,447 145,796,330 175,787,984 84,846,385 129,213,123
CASH AND CASH EQUIVALENTS AT END
OF YEAR
Cash and other cash items 8,958,042 8,580,709 10,916,533 7,814,917 7,832,302 10,334,793Due from BSP 103,869,770 73,749,813 56,510,701 83,867,434 67,798,418 52,961,426
Due from other banks 68,532,218 73,675,709 14,942,213 64,763,768 71,497,226 11,550,166Interbank loans receivable − 213,062 − − 213,062 −SPURA 16,475,090 34,773,704 18,882,000 10,373,294 28,446,976 10,000,000
P=197,835,120 P=190,992,997 P=101,251,447 P=166,819,413 P=175,787,984 P=84,846,385
OPERATIONAL CASH FLOWS FROM
INTERESTS AND DIVIDENDS
Interest received P=38,292,850 P=38,784,259 P=30,573,018 P=29,188,963 P=29,387,709 P=22,232,001Interest paid 10,304,166 16,173,752 10,573,621 7,976,641 12,942,912 8,137,924
Dividends received 200,671 202,888 207,456 200,671 201,858 206,425
See accompanying Notes to Financial Statements.

*SGVFSM005928*
UNION BANK OF THE PHILIPPINES AND SUBSIDIARIES
NOTES TO FINANCIAL STATEMENTS
1. Corporate Information
Incorporation and OperationsUnion Bank of the Philippines (the Bank, UnionBank or the Parent Bank) was incorporated in thePhilippines on August 16, 1968 and operates as a universal bank through its universal bankinglicense acquired in July 1992.
The Bank provides expanded commercial banking products and services such as loans anddeposits, cash management, retail banking, foreign exchange, capital markets, corporate andconsumer finance, investment management and trust banking. As of December 31, 2020, theBank and its subsidiaries (collectively referred to as the “Group”) has 388 branches and 389 on-site and 96 off-site automated teller machines (ATMs), located nationwide.
The Bank’s common shares are listed in the Philippine Stock Exchange (PSE). The Bank iseffectively 49.31% owned by Aboitiz Equity Ventures, Inc. (AEVI), a company incorporated anddomiciled in the Philippines. AEVI is the holding and management company of the AboitizGroup of Companies.
The Bank’s subsidiaries (all incorporated in the Philippines, except for UBX SG and UBXRemit), effective percentage of ownership and the nature of the subsidiaries’ businesses, as ofDecember 31, 2020 and 2019, are as follows:
Percentage of ownership
Name of Subsidiary 2020 2019 Nature of Business
City Savings Bank, Inc. (CSB) (a) 99.79% 99.79% Thrift bankPetNet, Inc. (PETNET) 51.00% 51.00% Remittances/ money transferFirst-Agro Industrial Rural Bank, Inc. (FAIR Bank) 93.33% 90.72% Rural bankUBP Investments Corporation (UIC) 100.00% 100.00% Holding companyFirst Union Plans, Inc. (FUPI) (b) 100.00% 100.00% Pre-needFirst Union Direct Corporation (FUDC) (b) 100.00% 100.00% Financial products marketingFirst Union Insurance and Financial Agencies, Inc.
(FUIFAI) (b)100.00% 100.00% Agent for insurance and
financial productsUBP Securities, Inc. (UBPSI) 100.00% 100.00% Securities brokerageUnionBank Currency Brokers Corporation (UCBC) 100.00% 100.00% Foreign currency brokerageUnionDataCorp (UDC) 100.00% 100.00% Data processingInterventure Capital Corporation (IVCC) 60.00% 60.00% Venture capitalUBX Philippines Corporation (UBX) (c) 100.00% 100.00% Investment holding and
innovation companyUBX Private Ltd. (UBX SG) (d) 100.00% 100.00% Holding companyUBX Remit Pte. Ltd. (UBX Remit) (e) 100.00% 100.00% Remittance companyBangko Kabayan, Inc. (A Private Development Bank)
(Bangko Kabayan) (f) 70.00% − Private development bankProgressive Bank, Inc. (PBI) (g) 75.00% − Rural bank
(a) On February 28, 2019, Philippine Resources Savings Bank, Inc. was merged with CSB
(b) FUPI, FUDC and FUIFAI are wholly-owned subsidiaries of UIC
(c) Incorporated on February 11, 2019
(d) Wholly owned subsidiary of UBX.
(e) UBX Remit was incorporated on October 14, 2019 as a remittance company through UBX SG
(f) Acquired on March 12, 2020 through CSB and UIC, with 49% and 21% share in ownership, respectively
(g) Acquired on July 13, 2020 through CSB and UIC, with 49% and 26% share in ownership, respectively

Corporate Information - 2 -
*SGVFSM005928*
Other relevant information about the subsidiaries’ nature of businesses and their status ofoperations are discussed in the sections that follow:
(a) CSB was incorporated and registered with the SEC on December 9, 1965. It is a thrift bankspecializing in granting teacher’s loans under the Department of Education’s AutomaticPayroll Deduction System.
(b) In December 2017, CSB purchased 127.72 million common stock and 65.0 million preferredshares of PR Savings Bank with par value of P10 per share or a total par value of P1,277.23million and P650 million, respectively. These shares represent 66.28% and 33.72%,respectively, of the total outstanding capital stock of PR Savings Bank.
On April 5, 2018, the Philippine Competition Commission (PCC) approved the acquisition ofPR Savings Bank by CSB. The acquisition was also approved by the Monetary Board (MB)of the BSP under MB Resolution No. 1003 dated June 14, 2018 (see Note 15), considered asthe date of business combination.
On July 5, 2018 and July 10, 2018, the BOD and the stockholders, respectively, of CSBapproved the plan of merger with PR Savings Bank, with CSB as the surviving entity. OnDecember 20, 2018, the MB of the BSP approved the merger subject to certain conditions,including completion of the merger within one year from the date of receipt of the BSPapproval and that the merger should be effective on the date the SEC issues the certificate ofmerger. On December 27, 2018 and February 28, 2019, the BSP and the SEC, respectively,approved the merger between CSB and PR Savings Bank, with CSB as the surviving entity.
PR Savings Bank was the 14th largest thrift bank in the country. Most of its 102 offices arelocated in Luzon offering motorcycle, agri-machinery, and salary loans to over 131,000borrowers, mostly from the mass market segment. The transaction enabled CSB to expandits reach in Luzon, and enter into new market segments, such as motorcycle and agri-machinery financing.
(c) In February 2018, CSB and UIC purchased of 2,461,338 common shares representing 51%ownership of AEVI on PETNET. On May 8, 2018, PCC approved the acquisition ofPETNET, Inc. by CSB and UIC. The agreement was approved by the BSP on November 23,2018. On December 17, 2018, the parties closed the transaction by settling the purchaseprice and confirming that all closing conditions have been fulfilled (see Note 15).
PETNET, more widely-known by its retail brand name PERA HUB, has the largest networkof Western Union outlets in the Philippines. PETNET has over 2,800 outlets nationwide. Itoffers a variety of cash-based services including remittance, currency exchange and billspayment.
(d) FAIR Bank was registered with the SEC on September 15, 1998 primarily to engage in thebusiness of extending rural credit to small farmers and tenants and to deserving ruralindustries or enterprises. FAIR Bank has one (1) banking office and ten (10) brancheslocated all over Cebu and Negros Occidental areas. On December 21, 2015, CSB and UICacquired 77.78% of the issued and outstanding capital stock of FAIR Bank. On December15, 2016, the MB of the BSP approved the acquisition by CSB and UIC of FAIR Bank’s441,000 common shares and 259,002 common shares, respectively, from the sellingshareholders of FAIR Bank. The common shares acquired by CSB and UIC represented49.00% and 28.78%, respectively, of the issued and outstanding capital stock of FAIR Bank.
Corporate Information - 3 -
*SGVFSM005928*
To meet the minimum capital requirements under the Manual of Regulations for Banks(MORB), CSB and UIC infused an additional capital of P=50.96 million (equivalent to 50,960common shares at par value of P=100 per share) and P=53.04 million (equivalent to 53,040common shares at par value of P=100 per share), respectively, on November 13, 2018. As aresult of the additional subscription, the percentage of ownership of CSB’s ownershipinterest in FAIR Bank remained at 49% while UIC’s ownership interest in FAIR Bankincreased to 38.53%.
Upon BSP’s recommendation and to maintain FAIR Bank’s capital adequacy ratio, CSB andUIC infused additional capital amounting to P=26.95 million (equivalent to 269,500 commonshares at P=100 par value) and P=28.05 million (equivalent to 280,500 common shares at P=100par value), respectively, or a total of P=55 million in 2019. The aggregate additional infusionin 2019 resulted in UIC’s percentage of ownership in FAIR Bank further increasing to41.72%, while CSB’s ownership remained the same at 49%.
In 2020, CSB and UIC further infused additional capital amounting to P=41.45 million(equivalent to 414,543 common shares at P=100 par value) and P=43.15 million (equivalent to431,157 common shares at P=100 par value), respectively, or a total of P=84.60 million. Theaggregate additional infusion in 2020 resulted in UIC’s percentage of ownership in FAIRBank further increasing to 44.33%, while CSB’s ownership remained the same at 49%.
(e) UIC was incorporated and registered with the SEC on December 20, 1993. It is presentlyengaged in business as a holding company authorized to hold investments of real andpersonal properties, including shares of stocks, bonds, debentures, notes and other securitiesand obligations, without engaging in business of an investment company or broker or dealerin securities of stocks.
Through its wholly-owned subsidiaries, FUPI, FUDC and FUIFAI, UIC is also engaged inthe servicing of existing pre-need plans, marketing of financial products and being an agentfor life and non-life insurance products.
(f) On February 11, 2019, the BSP approved the Parent Bank’s incorporation of UBXPhilippines Corporation (UBX). UBX was incorporated to invest in, hold, own, purchase,lease manage, sell or otherwise dispose of real and personal properties of every kind anddescription. It shall also engage in the development of financial technology innovations andengage in electronic commerce business.
On March 21, 2019, UBX then entered into an SPA with UIC to purchase 100 ordinaryshares of UBX SG, a Singapore-based entity incorporated by UIC in October 2018, for atotal consideration amounting to SGD100. Similar to UBX, UBX SG is incorporated toengage in the development of financial technology innovations and engage in electroniccommerce business.
(g) In February 2019, CSB and UIC acquired 70% ownership of Bangko Kabayan, with CSBowning 49% and UIC owning 21%. The transaction was approved by BSP and PhilippineCompetition Commission (PCC) on September 19, 2019 and January 9, 2020, respectively.On March 12, 2020, the parties executed the Deed of Absolute Sale, which is determined tobe the Group’s acquisition date. On the same date, CSB and UIC paid 70% of the totalpurchase price, bringing the total payment to 90% of the purchase price. The remaining 10%was deposited as a retention amount in an escrow account.

Corporate Information - 4 -
*SGVFSM005928*
Bangko Kabayan is authorized to engage in the business of extending financial services tofarmers, employees, entrepreneurs, commercial, manufacturing and industrial enterprises andto such other persons or entities that require financial intermediation, and to have and toexercise all authority and powers, and to do and perform all acts, and to transact all businesswhich may legally be done by Thrift Banks organized under and in accordance with theexisting New Thrift Banks Act of 1995 (Republic Act No. 7906). It converted its existingmicrofinance banking office to a branch-lite unit and has 23 branches, including the headoffice, in the areas of Batangas, Laguna and Quezon (Southern Luzon), and one branch-litein Lobo, Batangas.
(h) On January 5, 2018, CSB and UIC executed an SPA to acquire 75% ownership interest ofPBI through a combination of (a) subscription to 18,000,000 new shares and (b) purchase of11,980,916 common shares from the major stockholders. On February 24, 2020, the BSPapproved the application of CSB and UIC to acquire 75% ownership of PBI.
On July 13, 2020, BSP noted a clarification made by the PCC in its acknowledgement letterindicating that PCC does not categorically declare that the acquisition does not breach thethresholds prescribed by PCC and its IRR, leaving the parties involved with the responsibilityto ensure that they fully comply with the notification requirement. The PCC issued a Letterof Non-Coverage declaring that the transaction is not subject to compulsory notification onAugust 5, 2020. For convenience purposes, the Group used July 31, 2020 as the date ofbusiness combination.
PBI is authorized to engage in the business of extending credit to farmers, tenants, and ruralindustries or enterprises, and to transact all business that may be legally done by the ruralbanks formed under and in accordance with the existing Rural Banks Act (Republic Act No.7353). The principal office address of PBI is located at Del Rosario St., Poblacion, Balasan,lloilo, and operates an extension office in Pototan, lloilo, for the purpose of providingmicrofinance loans along with its primary banking services, and a branch atNo. 243 E. Lopez St., Brgy. Lourdes, Jaro, lloilo City.
Non-operating subsidiaries
(a) UBPSI was incorporated and registered with the SEC on March 2, 1993. It was organized toengage in the business of buying, selling or dealing in stocks and other securities. In January1995, as approved by UBPSI’s stockholders and BOD, UBPSI sold its stock exchange seat inthe PSE. Accordingly, UBPSI ceased its stock brokerage activities.
(b) UDC was registered with the SEC on September 8, 1998. It was organized to handle thecentralized branch accounting services as well as the processing of credit card applicationforms of the Parent Bank and the entire backroom operations of FUPI. On July 1, 2003, theBOD of UDC approved the cessation of its business operations effective on August 30, 2003,and subsequently shortened its corporate term to December 31, 2017 by amending itsArticles of Incorporation. The services previously handled by UDC are now undertaken bythe Centralized Processing Service Unit of the Parent Bank. UDC is still in process ofsecuring the tax clearance from the BIR.
(c) IVCC was incorporated and registered with the SEC on October 10, 1980. It was organizedto develop, promote, aid and assist financially any small or medium scale enterprises and topurchase, receive, take or grant, hold, convey, sell, lease, pledge, mortgage and otherwisedeal with such real and personal property, including securities and bonds of othercorporations as the transaction of the lawful business of the corporation may reasonably and

Corporate Information
Summary of Significant Accounting Policies - 5 -
*SGVFSM005928*
necessarily require, subject to the limitations prescribed by law and the constitution. IVCChas ceased operations since 1992.
The total assets, liabilities and capital funds of these non-operating subsidiaries amounted toP=5,032, P=3,158 and P=1,874, respectively, as of December 31, 2020, and P=5,260, P=3,158 andP=2,102, respectively, as of December 31, 2019.
The Bank’s registered address, which is also its principal place of business, is at UnionBankPlaza, Meralco Avenue corner Onyx Street and Sapphire Road, Ortigas Center, Pasig City.AEVI’s registered address is located at NAC Tower, 32nd Street, Bonifacio Global City, TaguigCity, Metro Manila.
Approval of Financial StatementsThe consolidated financial statements of UnionBank and Subsidiaries (the Group) and thefinancial statements of the Parent Bank as of and for each of the three years in the period endedDecember 31, 2020 were authorized for issue by the Bank’s BOD on February 26, 2021.
2. Summary of Significant Accounting Policies
The significant accounting policies that have been used in the preparation of these financialstatements are summarized below. These policies have been consistently applied to all the yearspresented, unless otherwise stated.
Basis of Preparation of Financial Statements
(a) Statement of Compliance with Philippine Financial Reporting Standards
The consolidated financial statements of the Group and the financial statements of the Bankhave been prepared in accordance with Philippine Financial Reporting Standards (PFRS).PFRSs are adopted by the Financial Reporting Standards Council (FRSC) from thepronouncements issued by the International Accounting Standards Board (IASB), andapproved by the Philippine Board of Accountancy.
The financial statements have been prepared using the measurement bases specified by PFRSfor each type of resource, liability, income and expense.
The measurement bases are more fully described in the accounting policies that follow.
(b) Presentation of Financial Statements
The financial statements are presented in accordance with Philippine Accounting Standards(PAS 1), Presentation of Financial Statements. The Group presents statement ofcomprehensive income separate from the statement of income.
(c) Functional and Presentation Currency
The financial statements of the Group include the accounts maintained in the RegularBanking Unit (RBU) and Foreign Currency Deposit Unit (FCDU). The functional currencyof RBU and FCDU is Philippine Peso (PHP) and United States Dollar (USD), respectively.For financial reporting purposes, FCDU accounts and foreign currency-denominated

Summary of Significant Accounting Policies - 6 -
*SGVFSM005928*
accounts in the RBU are translated into their equivalents in PHP (see accounting policyon Foreign Currency Translation).
The financial statements of these units are combined after eliminating inter-unit accounts.These are presented in Philippine pesos, and all values are presented in thousands ofPhilippine Pesos except when otherwise indicated.
Items included in the financial statements of the Group are measured using its functional currency,the currency of the primary economic environment in which the Group operates.
Adoption of New and Amended PFRS
(a) Effective in 2020 that are Relevant to the Group
Unless otherwise stated, the following amendments, interpretations and annual improvementshave no material impact to the Group’s annual consolidated financial statements as at and forthe year ended December 31, 2020:
Amendments to PFRS 3, Business Combinations, Definition of a Business
The amendments to PFRS 3 clarifies that to be considered a business, an integrated set of
activities and assets must include, at a minimum, an input and a substantive process that
together significantly contribute to the ability to create output. Furthermore, it clarifies
that a business can exist without including all of the inputs and processes needed to
create outputs. These amendments may impact future periods should the Group enter
into any business combinations.
Amendments to PFRS 7, Financial Instruments: Disclosures and PFRS 9, Financial
Instruments, Interest Rate Benchmark Reform
The amendments to PFRS 9 provide a number of reliefs, which apply to all hedging
relationships that are directly affected by the interest rate benchmark reform. A hedging
relationship is affected if the reform gives rise to uncertainties about the timing and or
amount of benchmark-based cash flows of the hedged item or the hedging instrument.
Amendments to PAS 1, Presentation of Financial Statements, and PAS 8, Accounting
Policies, Changes in Accounting Estimates and Errors, Definition of Material
The amendments provide a new definition of material that states “information is material
if omitting, misstating or obscuring it could reasonably be expected to influence
decisions that the primary users of general purpose financial statements make on the
basis of those financial statements, which provide financial information about a specific
reporting entity”.
The amendments clarify that materiality will depend on the nature or magnitude of
information, either individually or in combination with other information, in the context
of the financial statements. A misstatement of information is material if it could
reasonably be expected to influence decisions made by the primary users.

Summary of Significant Accounting Policies - 7 -
*SGVFSM005928*
Conceptual Framework for Financial Reporting issued on March 29, 2018
The Conceptual Framework is not a standard, and none of the concepts contained therein
override the concepts or requirements in any standard. The purpose of the Conceptual
Framework is to assist the standard-setters in developing standards, to help preparers
develop consistent accounting policies where there is no applicable standard in place and
to assist all parties to understand and interpret the standards.
The revised Conceptual Framework includes new concepts, provides updated definitions
and recognition criteria for assets and liabilities and clarifies some important concepts.
Amendments to PFRS 16, COVID-19-related Rent Concessions
The amendments provide relief to lessees from applying the PFRS 16 requirement on
lease modifications to rent concessions arising as a direct consequence of the corona
virus disease 2019 (COVID-19) pandemic. A lessee may elect not to assess whether a
rent concession from a lessor is a lease modification if it meets all of the following
criteria:
i. The rent concession is a direct consequence of COVID-19;
ii. The change in lease payments results in a revised lease consideration that is
substantially the same as, or less than, the lease consideration immediately preceding
the change;
iii. Any reduction in lease payments affects only payments originally due on or before
June 30, 2021; and
iv. There is no substantive change to other terms and conditions of the lease.
A lessee that applies this practical expedient will account for any change in lease
payments resulting from the COVID-19 related rent concession in the same way it would
account for a change that is not a lease modification, i.e., as a variable lease payment.
The amendments are effective for annual reporting periods beginning or after
June 1, 2020. Early adoption is permitted. The Group adopted the amendments
beginning January 1, 2020. The Group determined that the impact of the rent
concessions is not material to the consolidated and parent company financial statements.
(b) Standards Issued but not yet Effective
Pronouncements issued but not yet effective are listed below. Unless otherwise indicated, theGroup does not expect that the future adoption of the said pronouncements will have asignificant impact on its consolidated financial statements. The Group intends to adopt thefollowing pronouncements when they become effective.
Effective beginning on or after January 1, 2021
Amendments to PFRS 9, PFRS 7, PFRS 4 and PFRS 16, Interest Rate Benchmark
Reform – Phase 2
The amendments provide the following temporary reliefs which address the financialreporting effects when an interbank offered rate (IBOR) is replaced with an alternativenearly risk-free interest rate (RFR):

Summary of Significant Accounting Policies - 8 -
*SGVFSM005928*
• Practical expedient for changes in the basis for determining the contractual cashflows as a result of IBOR reform
• Relief from discontinuing hedging relationships• Relief from the separately identifiable requirement when an RFR instrument is
designated as a hedge of a risk component
The Group shall also disclose information about:• The about the nature and extent of risks to which the entity is exposed arising from
financial instruments subject to IBOR reform, and how the entity manages thoserisks; and
• Their progress in completing the transition to alternative benchmark rates, and howthe entity is managing that transition
The amendments are effective for annual reporting periods beginning on or after1 January 2021 and apply retrospectively, however, the Group is not required to restateprior periods.
Effective beginning on or after January 1, 2022
Amendments to PFRS 3, Reference to the Conceptual Framework
Amendments to PAS 16 , Plant and Equipment: Proceeds before Intended Use
Amendments to PAS 37, Onerous Contracts – Costs of Fulfilling a Contract
Annual Improvements to PFRSs 2018-2020 Cycle• Amendments to PFRS 1, First-time Adoption of Philippines Financial Reporting
Standards, Subsidiary as a first-time adopter
• Amendments to PFRS 9, Financial Instruments, Fees in the ’10 per cent’ test for
derecognition of financial liabilities
• Amendments to PAS 41, Agriculture, Taxation in fair value measurements
Effective beginning on or after January 1, 2023
Amendments to PAS 1, Classification of Liabilities as Current or Non-current
PFRS 17, Insurance Contracts
Deferred effectivity
Amendments to PFRS 10, Consolidated Financial Statements, and PAS 28, Sale or
Contribution of Assets between an Investor and its Associate or Joint Venture
Basis of Consolidated Financial StatementsThe Group’s financial statements comprise the accounts of the Parent Bank and its subsidiaries,as enumerated in Note 1 and as disclosed under Note 15, after the elimination of materialintercompany transactions. All intercompany resources and liabilities, equity, income, andexpenses and cash flows relating to transactions with subsidiaries are eliminated in full.Unrealized profits and losses from intercompany transactions that are recognized in the separatefinancial statements are also eliminated in full. Intercompany losses that indicate impairment arerecognized in the Group’s financial statements.
The financial statements of the subsidiaries are prepared in the same reporting period as theParent Bank using consistent accounting policies.
Non-controlling InterestsNon-controlling interest represents the portion of profit or loss and net assets not owned, directlyor indirectly, by the Parent Bank.

Summary of Significant Accounting Policies - 9 -
*SGVFSM005928*
The Group’s transactions with non-controlling interests that do not result in loss of control areaccounted for as equity transactions - that is, as transaction with the owners of the Group in theircapacity as owners. The difference between the fair value of any consideration paid and therelevant share acquired of the carrying value of the net assets of the subsidiary is recognized incapital funds. Disposals of equity investments to non-controlling interests may result in gainsand losses for the Group that are also recognized in capital funds.
When the Group ceases to have control over a subsidiary, any retained interest in the entity isremeasured to its fair value at the date when control is lost, with the change in carrying amountrecognized in the statements of income. The fair value is the initial carrying amount for thepurposes of subsequently accounting for the retained interest as an associate, joint venture orfinancial asset. In addition, any amounts previously recognized in other comprehensive incomein respect of that entity are accounted for as if the Group had directly disposed of the relatedresources or liabilities. This may mean that amounts previously recognized in othercomprehensive income are reclassified to profit or loss.
Investment in SubsidiariesSubsidiaries are entities (including structured entities) over which the Group has control. TheGroup controls an entity when it has the power over the entity, it is exposed, or has rights to,variable returns from its involvement with the entity, and it has the ability to affect those returnsthrough its power over the entity. Subsidiaries are consolidated from the date the Group obtainscontrol.
The Group reassesses whether or not it controls an entity if facts and circumstances indicate thatthere are changes to one or more of the three elements of controls indicated above. Accordingly,entities are deconsolidated from the date that control ceases.
In the Parent Bank’s separate financial statements, investments in subsidiaries are initiallyrecognized at cost and subsequently accounted for using the equity method (see Note 15).
All subsequent changes to the share in the equity of the subsidiaries are recognized in thecarrying amount of the Parent Bank’s investment. Changes resulting from the profit or lossgenerated by the subsidiaries are reported as Share in net profit of subsidiaries underMiscellaneous income account in the Parent Bank’s separate statements of income.
Changes resulting from other comprehensive income of the subsidiaries are recognized in othercomprehensive income of the Parent Bank. Any distributions received from the subsidiaries(e.g., dividends) are recognized as reduction in the carrying amount of investment in subsidiaries.However, when the Parent Bank’s share of losses in a subsidiary equals or exceeds its interest inthe subsidiary, including any other unsecured receivables, the Parent Bank does not recognizefurther losses, unless it has incurred obligations or made payments on behalf of the subsidiary. Ifthe subsidiary subsequently reports profits, the Parent Bank recognizes its share on those profitsonly after its share of the profits exceeds the accumulated share of losses that has previously notbeen recognized.
In computing the Parent Bank’s share in net profit or loss of subsidiaries, unrealized gains orlosses on transactions between the Parent Bank and its subsidiaries are eliminated to the extent ofthe Parent Bank’s interest in the subsidiaries. Where unrealized losses are eliminated, theunderlying asset is also tested for impairment from a group perspective.
The Parent Bank holds interests in various subsidiaries as presented in Notes 1 and 15.

Summary of Significant Accounting Policies - 10 -
*SGVFSM005928*
Investment in AssociatesAssociates pertain to all entities over which the Group and the Parent Bank have significantinfluence. Significant influence is the power to participate in the financial and operating policydecisions of the investee, but is not control or joint control over those policies. Investment inassociates is accounted for under the equity method of accounting.
Business Combinations and GoodwillBusiness acquisitions are accounted for using the acquisition method of accounting. Thisrequires recognizing and measuring the identifiable assets acquired, the liabilities assumed andany non-controlling interest in the acquiree. The consideration transferred for the acquisition of asubsidiary is the fair value of the assets transferred, the liabilities incurred and the equity interestsissued by the Group, if any. The consideration transferred also includes the fair value of anyasset or liability resulting from a contingent consideration arrangement.
Acquisition-related costs are expensed as incurred and subsequent change in the fair value ofcontingent consideration is recognized directly in the statements of income.
Identifiable assets acquired and liabilities and contingent liabilities assumed in a businesscombination are measured initially at their fair values at the acquisition date. On an acquisition-by-acquisition basis, the Group recognizes any non-controlling interest in the acquiree, either atfair value or at the non-controlling interest’s proportionate share of the recognized amounts ofacquiree’s identifiable net assets.
Goodwill represents the excess of the cost of an acquisition over the fair value of the Group’sshare of the net identifiable assets of the acquired subsidiary at the date of acquisition.Subsequent to initial recognition, goodwill is measured at cost less any accumulated impairmentlosses. Goodwill is tested annually for impairment. Impairment losses on goodwill are notreversed.
Gain on bargain purchase which is the excess of the Group’s interest in the net fair value of netidentifiable assets acquired over acquisition cost is recognized directly to profit.
For the purpose of impairment testing, goodwill is allocated to cash-generating units or groups ofcash-generating units that are expected to benefit from the business combination in which thegoodwill arose.
Gains and losses on the disposal of an interest in a subsidiary include the carrying amount ofgoodwill relating to it.
If the business combination is achieved in stages, the acquirer is required to remeasure itspreviously held equity interest in the acquiree at its acquisition-date fair value and recognize theresulting gain or loss, if any, in the statements of income, as appropriate.
Any contingent consideration to be transferred by the Group is recognized at fair value at theacquisition date. Subsequent changes to the fair value of the contingent consideration that isdeemed to be an asset or liability is recognized in accordance with PAS 37, Provisions,
Contingent Liabilities and Contingent Assets, either in the statements of income or as a charge toother comprehensive income. Contingent consideration that is classified as capital funds is notremeasured, and its subsequent settlement is accounted for within capital funds.
Summary of Significant Accounting Policies - 11 -
*SGVFSM005928*
Fair Value MeasurementThe Group measures financial instruments such as financial assets at fair value through profit orloss (FVTPL) and fair value through other comprehensive income (FVOCI) at fair value at eachreporting date. Also, fair values of financial instruments measured at amortized cost andinvestment properties are disclosed in Note 7.
Fair value is the price that would be received to sell an asset or paid to transfer a liability in anorderly transaction between market participants at the measurement date. The fair valuemeasurement is based on the presumption that the transaction to sell the asset or transfer theliability takes place either:
in the principal market for the asset or liability, or
in the absence of a principal market, in the most advantageous market for the asset orliability.
The principal or the most advantageous market must be accessible to the Group. The fair valueof an asset or a liability is measured using the assumptions that market participants would usewhen pricing the asset or liability, assuming that market participants act in their economic bestinterest.
If an asset or a liability measured at fair value has a bid price and ask price, the price within thebid-ask spread is the most representative of fair value in the circumstance shall be used tomeasure fair value regardless of where the input is categorized within the fair value hierarchy.The fair value measurement of a nonfinancial asset takes into account the market participant'sability to generate economic benefits by using the asset in its highest and best use or by selling itto another market participant that would use the asset in its highest and best use.
The Group uses valuation techniques that are appropriate in the circumstances and for whichsufficient data are available to measure fair value, maximizing the use of relevant observableinputs and minimizing the use of unobservable inputs.
All assets and liabilities for which fair value is measured or disclosed in the financial statementsare categorized within the fair value hierarchy, described in Note 7, based on the lowest levelinput that is significant to the fair value measurement as a whole.
For assets and liabilities that are recognized in the financial statements on a recurring basis, theGroup determines whether transfers have occurred between levels in the hierarchy byre-assessing categorization (based on the lowest level input that is significant to the fair valuemeasurement as a whole) at the end of each reporting period.
Financial Instruments - Initial Recognition and Subsequent MeasurementDate of recognitionFinancial assets and liabilities, with the exception of loans and advances to customers andbalances due to customers, are initially recognised on the trade date, i.e., the date that the Groupbecomes a party to the contractual provisions of the instrument. This includes regular way trades:purchases or sales of financial-assets that require delivery of assets within the time framegenerally established by regulation or convention in the market place. Loans and advances tocustomers are recognised when funds are transferred to the customers’ accounts. The Grouprecognises balances due to customers when funds are transferred to the Group.

Summary of Significant Accounting Policies - 12 -
*SGVFSM005928*
Initial measurement of financial instruments
The classification of financial instruments at initial recognition depends on their contractualterms and the business model for managing the instruments, as described below. Financialinstruments are initially measured at their fair value; except in the case of financial assets andfinancial liabilities recorded at FVTPL, transaction costs are added to, or subtracted from, thisamount. When the fair value of financial instruments at initial recognition differs from thetransaction price, the Group accounts for the Day 1 profit or loss, as described below.
‘Day 1’ differenceWhere the transaction price in a non-active market is different from the fair value based on otherobservable current market transactions in the same instrument or based on a valuation techniquewhose variables include only data from observable market, the Group recognizes the differencebetween the transaction price and the fair value (a ‘Day 1’difference) in the statements of incomeunless it qualifies for recognition as some other type of asset. In cases where transaction priceused is made of data which is not observable, the difference between the transaction price andmodel value is only recognized in the statements of income when the inputs become observableor when the instrument is derecognized. For each transaction, the Group determines theappropriate method of recognizing the ‘Day 1’ difference amount.
Measurement categories of financial assets and liabilitiesThe Group classifies all of its financial assets based on the business model for managing theassets and the asset’s contractual terms, measured at either at amortized cost, at FVOCI or atFVTPL.
The Group classifies and measures its derivative and trading portfolio at FVTPL. The Groupmay designate financial instruments at FVTPL, if so doing eliminates or significantly reducesmeasurement or recognition inconsistencies.
Financial AssetsFinancial assets are recognized when the Group becomes a party to the contractual terms of the
financial instrument. For purposes of classifying financial assets, an instrument is considered as
an equity instrument if it is non-derivative and meets the definition of equity for the issuer in
accordance with the criteria under PAS 32, Financial Instruments: Presentation. All other
non-derivative financial instruments are treated as debt instruments.
(a) Classification, Measurement and Reclassification of Financial Assets
Under PFRS 9, the classification and measurement of financial assets is driven by the entity’scontractual cash flow characteristics of the financial assets and business model for managingthe financial assets.
As part of its classification process, the Group assesses the contractual terms of financialassets to identify whether they meet the SPPI test. ‘Principal’ for the purpose of this test isdefined as the fair value of the financial asset at initial recognition and may change over thelife of the financial asset (e.g. if there are repayments of principal or amortization of thepremium or discount).
The most significant elements of interest within a lending arrangement are typically theconsideration for the time value of money and credit risk. To make the SPPI assessment, theGroup applies judgement and considers relevant factors such as the currency in which thefinancial asset is denominated, and the period for which the interest rate is set.

Summary of Significant Accounting Policies - 13 -
*SGVFSM005928*
In contrast, contractual terms that introduce a more than de minimis exposure to risks orvolatility in the contractual cash flows that are unrelated to a basic lending arrangement donot give rise to contractual cash flows that are solely payments of principal and interest onthe amount outstanding. In such cases, the financial asset is required to be measured atFVTPL.
The Group determines its business model at the level that best reflects how it managesgroups of financial assets to achieve its business objective.
The Group's business model is not assessed on an instrument-by-instrument basis, but at ahigher level of aggregated portfolios and is based on observable factors such as:
how the performance of the business model and the financial assets held within thatbusiness model are evaluated and reported to the entity's key management personnel
the risks that affect the performance of the business model (and the financial assets heldwithin that business model) and, in particular, the way those risks are managed
how managers of the business are compensated (for example, whether the compensationis based on the fair value of the assets managed or on the contractual cash flowscollected)
the expected frequency, value and timing of sales are also important aspects ofthe Group’s assessment.
The business model assessment is based on reasonably expected scenarios without taking'worst case' or 'stress case’ scenarios into account. If cash flows after initial recognition arerealized in a way that is different from the Group's original expectations, the Group does notchange the classification of the remaining financial assets held in that business model, butincorporates such information when assessing newly originated or newly purchased financialassets going forward.
The Group’s measurement categories are described below:
Financial Assets at Amortized Cost
Financial assets are measured at amortized cost if both of the following conditions are met:
the asset is held within the Group’s business model whose objective is to hold financialassets in order to collect contractual cash flows; and,
the contractual terms of the instrument give rise, on specified dates, to cash flows that areSPPI on the principal amount outstanding.
Financial assets meeting these criteria are measured initially at fair value plus transactioncosts. They are subsequently measured at amortized cost using the effective interest method,less any impairment in value.
The Group’s financial assets at amortized cost are presented in the statement of financialposition as Due from BSP, Due from other banks, Interbank loans receivable, Financialassets at amortized cost under Trading and investment securities, Loans and other receivablesand certain accounts under Other resources.
For purposes of cash flows reporting and presentation, cash and cash equivalents compriseaccounts with original maturities of three months or less, including Cash and other cashitems, non-restricted balances of Due from BSP, Due from other banks, Interbank loansreceivable and Securities purchased under repurchase agreements included in Loans and

Summary of Significant Accounting Policies - 14 -
*SGVFSM005928*
other receivables. These generally include cash on hand, demand deposits and short-term,highly liquid investments readily convertible to known amounts of cash and which aresubject to insignificant risk of changes in value.
The Group may irrevocably elect at initial recognition to classify a financial asset that meetsthe amortized cost criteria above as at FVTPL if that designation eliminates or significantlyreduces an accounting mismatch had the financial asset been measured at amortized cost.
Financial Assets at FVTPL
Debt instruments that do not meet the amortized cost criteria, or that meet the criteria but theGroup has chosen to designate as at FVTPL at initial recognition, are classified as financialassets at FVTPL. Equity investments are classified as financial assets at FVTPL, unless theGroup designates an equity investment that is not held for trading as at FVOCI at initialrecognition. The Group’s financial assets at FVTPL include government securities,corporate bonds and equity securities which are held for trading purposes.
A financial asset is considered as held for trading if:
it has been acquired principally for the purpose of selling it in the near term;
on initial recognition, it is part of a portfolio of identified financial instruments that theGroup manages together and has evidence of a recent actual pattern of short-term profit-taking; or,
it is a derivative that is not designated and effective as a hedging instrument or financialguarantee.
Financial assets at FVTPL are measured at fair value. Related transaction costs arerecognized directly as expense in the statements of income. Unrealized gains and lossesarising from changes (mark-to-market) in the fair value of the financial assets at FVTPLcategory and realized gains or losses arising from disposals of these instruments are includedin Gains (losses) on trading and investment securities at FVTPL and FVOCI account in thestatements of income.
Interest earned on these investments is reported in the statements of income under Interestincome account while dividend income is reported in the statements of income underMiscellaneous income account when the right of payment has been established.
Financial Assets at FVOCI - Equity Investments
At initial recognition, the Group can make an irrevocable election (on an instrument-by-instrument basis) to designate equity investments as at FVOCI; however, such designation isnot permitted if the equity investment is held by the Group for trading. The Group hasdesignated certain equity instruments as at FVOCI on initial application of PFRS 9.
Financial assets at FVOCI are initially measured at fair value plus transaction costs.Subsequently, they are measured at fair value, with no deduction for any disposal costs.Gains and losses arising from changes in fair value are recognized in other comprehensiveincome and accumulated in Net unrealized fair value gains (losses) on investment securitiesin the statements of financial position. When the asset is disposed of, the cumulative gain orloss previously recognized in the Net unrealized fair value gains (losses) on investmentsecurities account is not reclassified to profit or loss, but is reclassified directly to Surplusfree account.

Summary of Significant Accounting Policies - 15 -
*SGVFSM005928*
Any dividends earned on holding these equity instruments are recognized in the statements ofincome under Miscellaneous income account.
Financial Assets at FVOCI - Debt InstrumentsThe Group classifies debt instruments measured at FVOCI when both of the followingconditions are met:
the instrument is held within a business model, the objective of which is achieved byboth collecting contractual cash flows and selling financial assets, and
the contractual terms of the financial asset meet the SPPI test.
FVOCI debt instruments are subsequently measured at fair value with gains and lossesarising due to changes in fair value being recognized in OCI. Interest income and foreignexchange gains and losses are recognized in the statements of income in the same manner asfor financial assets measured at amortized cost. The ECL calculation for financial assets atFVOCI is explained in the ‘Impairment of Financial Assets’ section.
On derecognition, cumulative gains or losses previously recognized in OCI are reclassifiedfrom OCI to the statements of income.
Reclassification of financial assets
The Group can only reclassify financial assets if the objective of its business model formanaging those financial assets changes. Accordingly, the Group is required to reclassifyfinancial assets: (i) from amortized cost to FVTPL, if the objective of the business modelchanges so that the amortized cost criteria are no longer met; and, (ii) from FVTPL toamortized cost, if the objective of the business model changes so that the amortized costcriteria start to be met and the characteristic of the instrument’s contractual cash flows meetthe amortized cost criteria.
A change in the objective of the Group’s business model will be effected only at thebeginning of the next reporting period following the change in the business model.
(b) Impairment of Financial Assets
The Group recognizes the allowance for expected credit losses for all loans and other debtfinancial assets carried at amortized cost, together with loan commitments and financialguarantee contracts. Equity instruments are not subject to impairment underPFRS 9.
ECL represent possible credit losses that reflect an unbiased and probability-weightedamount which is determined by evaluating a range of possible outcomes, the time value ofmoney and reasonable and supportable information about past events, current conditions andforecasts of future economic conditions. ECL allowances are measured at amounts equal toeither (i) 12-month ECL or (ii) lifetime ECL for those financial instruments which haveexperienced a significant increase in credit risk (SICR) since initial recognition (GeneralApproach). The 12-month ECL is the portion of lifetime ECL that results from defaultevents on a financial instrument that are possible within the 12 months after the reportingdate. Lifetime ECL are credit losses that results from all possible default events over theexpected life of a financial instrument.
The Group has established a policy to perform an assessment, at the end of each reportingperiod, of whether a financial instrument’s credit risk has increased significantly since initialrecognition, by considering the change in the risk of default occurring over the remaining lifeof the financial instrument.

Summary of Significant Accounting Policies - 16 -
*SGVFSM005928*
For non-credit-impaired financial instruments:
Stage 1 consists of all non-impaired financial instruments which have not experienced aSICR since initial recognition. The Group and the Parent Bank recognizes a 12-monthECL for Stage 1 financial instruments.
Stage 2 consists of all non-impaired financial instruments which have experienced aSICR since initial recognition. The Group and the Parent Bank recognizes a lifetimeECL for Stage 2 financial instruments.
For credit-impaired financial instruments:
Financial instruments are classified as Stage 3 when there is objective evidence ofimpairment as a result of one or more loss events that have occurred after initialrecognition with a negative impact on the estimated future cash flows of a loan or aportfolio of loans. The ECL model requires that lifetime ECL be recognized forimpaired financial instruments.
The Group uses internal credit assessment and approvals at various levels to determine thecredit risk of exposures at initial recognition. Assessment can be quantitative or qualitativeand depends on the materiality of the facility or the complexity of the portfolio to beassessed.
The Group defines a financial instrument as in default, which is fully aligned with thedefinition of credit impaired, in all cases when the borrower becomes more than 90 days pastdue on its contractual payments. As a part of a qualitative assessment of whether a customeris in default, the Group also considers a variety of instances that may indicate unlikeliness topay. When such events occur, the Group carefully considers whether the event should resultin treating the customer as defaulted. An instrument is considered to be no longer in default(i.e., to have cured) when it no longer meets any of the default criteria for a consecutiveperiod of 180 days (i.e. consecutive payments from the borrowers for 180 days).
The criteria for determining whether credit risk has increased significantly vary by portfolioand include quantitative changes in probabilities of default and qualitative factors such asdowngrade in the credit rating of the borrowers and a backstop based on delinquency. Thecredit risk of a particular exposure is deemed to have increased significantly since initialrecognition if, based on the Group’s internal credit assessment, the borrower or counterpartyis determined to require close monitoring or with well-defined credit weaknesses. Days pastdue are determined by counting the number of days since the earliest elapsed due date inrespect of which full payment has not been received. In subsequent reporting periods, if thecredit risk of the financial instrument improves such that there is no longer a SICR sinceinitial recognition, the Group shall revert to recognizing a 12-month ECL. All exposures aretherefore provided with ECLs, in the context of SICR status.
ECL is a function of the PD, EAD and LGD, with the timing of the loss also considered, andis estimated by incorporating forward-looking economic information and through the use ofexperienced credit judgment.
The PD represents the likelihood that a credit exposure will not be repaid and will go intodefault in either a 12-month horizon for Stage 1 or lifetime horizon for Stage 2. The PD foreach individual instrument is modelled based on historical data and is estimated based oncurrent market conditions and reasonable and supportable information about future economicconditions. The Group segmented its credit exposures and developed a corresponding PD

Summary of Significant Accounting Policies - 17 -
*SGVFSM005928*
methodology for each portfolio. The PD methodology for each relevant portfolio isdetermined based on the underlying nature or characteristic of the portfolio, behavior of theaccounts and materiality of the segment as compared to the total portfolio.
EAD is modelled on historic data and represents an estimate of the outstanding amount ofcredit exposure at the time a default may occur. For off-balance sheet and undrawn amounts,EAD includes an estimate of any further amounts that may be drawn at the time of default.LGD is the amount that may not be recovered in the event of default and is modelled basedon historical cash flow recovery and reasonable and supportable information about futureeconomic conditions, where appropriate. LGD takes into consideration the amount andquality of any collateral held.
(c) Derecognition of Financial Assets
A financial asset (or where applicable, a part of a financial asset or part of a group offinancial assets) is derecognized when the contractual rights to receive cash flows from thefinancial instruments expire, or when the financial assets and all substantial risks and rewardsof ownership have been transferred to another party. If the Group neither transfers norretains substantially all the risks and rewards of ownership and continues to control thetransferred asset, the Group recognizes its retained interest in the asset and an associatedliability for amounts it may have to pay. If the Group retains substantially all the risks andrewards of ownership of a transferred financial asset, the Group continues to recognize thefinancial asset and also recognizes a collateralized borrowing for the proceeds received.
In certain circumstances, the Group modifies the original terms and conditions of a creditexposure to form a new loan agreement or payment schedule. The modifications can begiven depending on the borrower’s or counterparty’s current or expected financial difficulty.The modifications may include, but are not limited to, change in interest rate and terms,principal amount, maturity date, date and amount of periodic payments and accrual ofinterest and charges.
The Group derecognizes a financial asset when the terms and conditions have beenrenegotiated to the extent that, substantially, it becomes a new asset, with the differencebetween its carrying amount and the fair value of the new asset recognized as aderecognition gain or loss in profit or loss, to the extent that an impairment loss has notalready been recorded.
The Group also performs a quantitative assessment similar to that being performed formodification of financial liabilities. In performing the quantitative assessment, the Groupconsiders the new terms of a financial asset to be substantially different if the present valueof the cash flows under the new terms, including any fees paid net of any fees received anddiscounted using the original effective interest rate, is at least 10% different from the presentvalue of the remaining cash flows of the original financial asset.
When the modification of a financial asset results in the derecognition of the existingfinancial asset and the subsequent recognition of a new financial asset, the modified asset isconsidered a 'new ' financial asset. Accordingly, the date of the modification shall be treatedas the date of initial recognition of that financial asset when applying the impairmentrequirements to the modified financial asset. The newly recognized financial asset isclassified as Stage 1 for ECL measurement purposes, unless the new financial asset isdeemed to be originated as credit impaired (POCI). Distressed restructuring with indicationsof unlikeliness to pay are categorized as impaired accounts and are moved to Stage 3.

Summary of Significant Accounting Policies - 18 -
*SGVFSM005928*
When the contractual cash flows of a financial asset are renegotiated or otherwise modifiedand the renegotiation or modification does not result in the derecognition of that financialasset, the Group recalculates the gross carrying amount of the financial asset as the presentvalue of the renegotiated or modified contractual cash flows discounted at the original EIR(or credit-adjusted EIR for purchased or originated credit-impaired financial assets) andrecognizes a modification gain or loss in the statement of income.
Derivative Financial InstrumentsThe Group is a counterparty to derivatives contracts, such as forwards, swaps and warrants.These contracts are entered into as a means of reducing or managing the Group’s foreignexchange and interest rate exposures as well as those of its customers.
Derivatives are initially recognized at fair value on the date on which the derivative contract isentered into and are subsequently measured at their fair values. Fair values are obtained fromquoted market prices in active markets, including recent market transactions. All derivatives arecarried as resources when fair value is positive and as liabilities when fair value is negative.
The best evidence of the fair value of a derivative at initial recognition is the transaction price(the fair value of the consideration given or received) unless the fair value of that instrument isevidenced by comparison with other observable current market transactions in the sameinstrument. When such evidence exists, which indicates a fair value different from thetransaction price, the Group recognizes a gain or loss at initial recognition.
Changes in the fair value of derivatives are recognized in the statements of income.
Financial LiabilitiesFinancial liabilities which include deposit liabilities, bills payable, notes and bonds payable, andother liabilities (except tax-related payables, pre-need reserves and post-employment definedbenefit obligation) are recognized when the Group becomes a party to the contractual terms ofthe instrument.
Financial liabilities are recognized initially at their fair value and subsequently measured atamortized cost using the effective interest method, for those with maturities beyond one year, lesssettlement payments. All interest-related charges incurred on financial liabilities are recognizedas an expense in the statements of income under the caption Interest expense.
Deposit liabilities are stated at amounts in which they are to be paid. Interest is accruedperiodically and recognized in a separate liability account before recognizing as part of depositliabilities.
Bills payable and Notes and bonds payable are recognized initially at fair value, which is theissue proceeds (fair value of consideration received) less any issuance costs. These aresubsequently measured at amortized cost; any difference between the proceeds net of transactioncosts and the redemption value is recognized in the statements of income over the period of theborrowings using the effective interest method.
Derivative liabilities, which are included as part of Other Liabilities, are recognized initially andsubsequently measured at fair value with changes in fair value recognized in the statements ofincome.

Summary of Significant Accounting Policies - 19 -
*SGVFSM005928*
Other liabilities, apart from derivative liabilities, are recognized initially at their fair value andsubsequently measured at amortized cost, using effective interest method for maturities beyondone year, less settlement payments.
Financial liabilities are derecognized from the statement of financial position only when theobligations are extinguished either through discharge, cancellation or expiration. Where anexisting financial liability is replaced by another from the same lender on substantially differentterms, or if the terms of an existing liability are substantially modified, such an exchange ormodification is treated as a derecognition of the original liability and a recognition of the newliability, and the difference in the respective carrying amounts is recognized in the statements ofincome.
Offsetting Financial InstrumentsFinancial resources and liabilities are offset and the resulting net amount, considered as a singlefinancial asset or financial liability, is reported in the statements of financial position when thereis a legally enforceable right to offset the recognized amounts and there is an intention to settleon a net basis, or realize the asset and settle the liability simultaneously. The right of set-off mustbe available at the end of the reporting period, that is, it is not contingent on future event. It mustalso be enforceable in the normal course of business, in the event of default, and in the event ofinsolvency or bankruptcy; and must be legally enforceable for both entity and all counterpartiesto the financial instruments.
Bank Premises, Furniture, Fixtures and EquipmentBank premises, furniture, fixtures and equipment are carried at acquisition cost less accumulateddepreciation and amortization, and any impairment in value.
The cost of an asset comprises its purchase price and directly attributable costs of bringing theasset to working condition for its intended use. Expenditures for additions, major improvementsand renewals are capitalized, while expenditures for repairs and maintenance are charged toexpense as incurred.
Depreciation is computed on a straight-line basis over the estimated useful lives of thedepreciable assets as follows:
Buildings 25 - 50 yearsFurniture, fixtures and equipment 5 - 10 years
Leasehold rights and improvements are amortized over the term of the lease or the estimateduseful lives of the improvements of five to ten years, whichever is shorter.
An asset’s carrying amount is written down immediately to its recoverable amount if the asset’scarrying amount is greater than its estimated recoverable amount.
The residual values, estimated useful lives and method of depreciation and amortization of bankpremises, furniture, fixtures and equipment (except land) are reviewed and adjusted ifappropriate, at the end of each reporting period.
If a change in use requires an item of bank premises, furniture, fixtures and equipment to bereclassified to investment properties, the difference between the carrying amount of such assetand its fair value as of the date of change in use is recognized in other comprehensive income andaccumulated in equity under the Other reserves account. If the asset is subsequently retired ordisposed of, the related revaluation surplus is transferred directly to Surplus free account.
Summary of Significant Accounting Policies - 20 -
*SGVFSM005928*
An item of bank premises, furniture, fixtures and equipment, including the related accumulateddepreciation, amortization and impairment losses, is derecognized upon disposal or when nofuture economic benefits are expected to arise from the continued use of the asset. Any gain orloss arising on derecognition of the asset (calculated as the difference between the net disposalproceeds and the carrying amount of the item) is included in the statements of income in the yearthe item is derecognized.
The Group classifies ROU assets as part of property and equipment. The Group recognizes ROUassets at the commencement date of the lease (i.e., the date the underlying asset is available foruse). ROU assets are initially measured at cost, less any accumulated depreciation andimpairment losses, and adjusted for any remeasurement of lease liabilities. The initial cost ofROU assets includes the amount of lease liabilities recognized, initial direct costs incurred, leasepayments made at or before the commencement date less any lease incentives received andestimate of costs to be incurred by the lessee in dismantling and removing the underlying asset,restoring the site on which it is located or restoring the underlying asset to the condition requiredby the terms and conditions of the lease, unless those costs are incurred to produce inventories.
Unless the Group is reasonably certain to obtain ownership of the leased asset at the end of thelease term, the recognized ROU assets are depreciated on a straight-line basis over the shorter oftheir estimated useful life and lease term. ROU assets are subject to impairment.
Investment PropertiesInvestment properties are properties held either to earn rental income or for capital appreciationor for both, but not for sale in the ordinary course of business, use in the production or supply ofgoods or services or for administrative purposes. These include parcels of land and buildings andrelated improvements acquired by the Group from defaulting borrowers.
Investment properties are measured initially at cost, including transaction costs. An investmentproperty acquired through an exchange transaction is initially measured at fair value of the assetacquired unless the fair value of such an asset cannot be measured in which case the investmentproperty acquired is measured at the carrying amount of the asset given up. Foreclosedproperties are classified under Investment properties from foreclosure date. Gain or loss fromforeclosure is included as part of Gain or loss on foreclosure account under MiscellaneousIncome section of the statement of income.
Subsequent to initial recognition, depreciable investment properties are carried at cost lessaccumulated depreciation and amortization and impairment. Depreciation is computed using thestraight line method over the useful life of 50 years and 10 years for building held for lease andforeclosed properties, respectively. Land is carried at cost less any impairment in value.
Investment properties are derecognized when they have either been disposed of or when theinvestment property is permanently withdrawn from use and no future benefit is expected fromits disposal. Any gains or losses on the retirement or disposal of an investment property arerecognized in the statements of income in the year of retirement or disposal. Expendituresincurred after the investment properties have been put into operations, such as repairs andmaintenance costs and real estate taxes, are normally charged against income in the period inwhich costs are incurred.
Transfers are made to investment properties when, and only when, there is a change in useevidenced by ending of owner occupation, commencement of an operating lease to another partyor ending of construction or development. Transfers are made from investment properties when,

Summary of Significant Accounting Policies - 21 -
*SGVFSM005928*
and only when, there is a change in use evidenced by commencement of owner occupation orcommencement of development with a view to sale.
Intangible AssetsIntangible assets include goodwill and acquired computer software. Goodwill represents theexcess of the acquisition cost over the fair value of the net identifiable assets arising from theacquisition of (a) the former International Exchange Bank (iBank) on April 30, 2006; (b) CSBon January 8, 2013, (c) PR Savings Bank by CSB on June 14, 2018, (d) PETNET onDecember 17, 2018 and (e) Bangko Kabayan on March 12, 2020 (see Note 18). Goodwill hasindefinite useful life and, thus, not subject to amortization but requires an annual test forimpairment. Goodwill is subsequently carried at cost less accumulated impairment losses.
Goodwill is allocated to cash-generating units for the purpose of impairment testing. Goodwillsometimes cannot be allocated on a non-arbitrary basis to individual cash-generating units, butonly to groups of cash-generating units. As a result, the lowest level within the Group at whichgoodwill is monitored for internal management purposes sometimes comprises a number of cash-generating units. The Group’s cash-generating unit represents major business segments of theParent Bank and the subsidiaries of the Group.
Computer software used in administration is accounted for under the cost model. The cost of theasset is the amount of cash or cash equivalents paid or the fair value of the other considerationsgiven up to acquire an asset at the time of its acquisition or production.
Computer software are capitalized on the basis of the costs incurred to acquire, develop, andinstall the specific software. These costs are amortized on a straight-line basis over the expecteduseful lives ranging from five to ten years, as the lives of these intangible assets are consideredfinite. These costs are recognized as part of Depreciation and amortization in the statements ofincome. Costs associated with maintaining computer software are expensed as incurred. Inaddition, intangible assets are subject to impairment testing.
When an intangible asset is disposed of, the gain or loss on disposal is determined as thedifference between the proceeds and the carrying amount of the asset and is recognized in thestatements of income.
Other ResourcesOther resources pertain to resources controlled by the Group as a result of past events. These arerecognized in the financial statements only if recognition of that asset and of any resultingincome or expenses is a faithful representation of the resources and provides relevant informationabout the resources.
Provisions and ContingenciesProvisions are recognized when present obligations will probably lead to an outflow of economicresources and they can be estimated reliably even if the timing or amount of the outflow may stillbe uncertain. A present obligation arises from the presence of a legal or constructive obligationthat has resulted from past events (e.g., legal dispute or onerous contracts).
Provisions are measured at the estimated expenditure required to settle the present obligation,based on the most reliable evidence available at the end of the reporting period, including therisks and uncertainties associated with the present obligation. Any reimbursement expected to bereceived in the course of settlement of the present obligation is recognized, if virtually certain asa separate asset, at an amount not exceeding the balance of the related provision. Where there area number of similar obligations, the likelihood that an outflow will be required in settlement is

Summary of Significant Accounting Policies - 22 -
*SGVFSM005928*
determined by considering the class of obligations as a whole. When time value of money ismaterial, long-term provisions are discounted to their present values using a pretax rate thatreflects market assessment and the risks specific to the obligation. The increase in the provisiondue to passage of time is recognized as interest expense. Provisions are reviewed at the end ofeach reporting period and adjusted to reflect the current best estimate.
In those cases where the possible outflow of economic resource as a result of present obligationsis considered improbable or remote, or the amount to be provided for cannot be measuredreliably, no liability is recognized in the financial statements. Similarly, possible inflows ofeconomic benefits that do not yet meet the recognition criteria of an asset are consideredcontingent assets, hence, are not recognized in the financial statements. On the other hand, anyreimbursement that the Group can be virtually certain to collect from a third party with respect tothe obligation is recognized as a separate asset not exceeding the amount of the related provision.
Pre-Need Reserves and Insurance Premium Reserves
(a) Pre-need Reserves
In the Group’s consolidated financial statements, pre-need reserves (PNR), presented as partof Other liabilities in the consolidated statements of financial position, are recognized for allpre-need benefits guaranteed and payable by FUPI as defined in the pre-need pension plancontracts.
PNR for pension plans are determined using the requirements on provisioning of PAS 37 andthe specific method of computation required by the Insurance Commission (IC) as describedbelow.
The amount recognized as a provision to cover the PNR is the best estimate of theexpenditure required to settle the present obligation at the end of the reporting period. Therisks and uncertainties that inevitably surround many events and circumstances were takeninto account in reaching the best estimate of a provision.
PNR is computed based on the following considerations:
On actively paying plans, provision is equivalent to the present value of future planbenefits reduced by the present value of future trust fund contributions required perproduct model discounted using the transitory discount rate which does not exceed thelower of the attainable rate as certified by the Trustee, and the discount rate prescribed bythe IC in accordance with IC Circular Letter No. 23-2012, Valuation of TransitoryPre-need Reserves, for old basket of plans previously approved by the SEC.
On lapsed plans, provision is equivalent to the present value of future plan benefitsreduced by the present value of future trust fund contributions at lapse date, multiplied bythe reinstatement rate.
On fully paid plans, provision is equivalent to the present value of future plan benefitsdiscounted using the transitory discount rate.
Future events that may affect the foregoing amounts are reflected in the amount of theprovision for PNR where there is sufficient objective evidence that they will occur.

Summary of Significant Accounting Policies - 23 -
*SGVFSM005928*
The rates of surrender, cancellation, reinstatement, utilization and inflation, whenapplied, represent the actual experience of FUPI in the last three years, or the industry, inthe absence of a reliable experience.
The probability of pre-termination or surrender of fully paid plans are considered indetermining the PNR of fully paid plans. A pre-termination experience on fully paidplans of 5% and below are considered insignificant. In such cases, derecognition ofliability shall be recorded at pre-termination date.
The computation of the foregoing assumptions is validated by the IC-accredited actuaryof FUPI.
Any excess in the amount of the trust fund as a result of the revised reservingrequirement shall neither be released from the fund nor be credited/set-off to futurerequired contributions.
(b) Insurance Premium Reserves
Insurance premium reserves for pension plans represents FUPI’s actuarially-determinedliability in accordance with PAS 37 to guarantee the benefits provided in the plan inconsideration of the insurance premium funds assigned for this purpose as determined andcertified by the IC-accredited actuary.
Capital FundsCommon stock represents the nominal value of shares that have been issued.
Additional paid-in capital includes any premiums received on the issuance of common stock.Any transaction costs associated with the issuance of shares are deducted from additional paid-incapital, net of any related income tax benefits.
Surplus free includes all current and prior period results as reported in the statements of incomeand which are available and not restricted for use by the Group, reduced by the amounts ofdividend declared, if any.
Surplus reserves pertains to the following:
(a) Portion of the Group’s income from trust operations set-up on a yearly basis in compliancewith BSP regulations. The surplus set-up is equal to 10% of the net profit accruing from thetrust business until the surplus shall amount to 20% of authorized capital stock. The reserveshall not be paid out as dividends, but losses accruing in the course of the trust business maybe charged against this account.
(b) Accumulated trust fund income of FUPI that is automatically restricted to payments ofbenefits of planholders and releases from appropriation representing the amounts of trustfund income that pertains to the matured and pre-terminated plans of planholders which havebeen withdrawn from the trust fund during the year, in accordance with the amended Pre-need Uniform Chart of Accounts (PNUCA).
(c) The difference of the 1% required General Loan Loss Provision on Stage 1 on-balance sheetloans over the computed allowance for credit losses on Stage 1 accounts as required by theBSP Circular No. 1011 - Guidelines on the Adoption of the Philippine Financial ReportingStandard (PFRS) 9 - Financial Instruments.

Summary of Significant Accounting Policies - 24 -
*SGVFSM005928*
Net unrealized fair value gains (losses) on investment securities pertains to cumulativemark-to-market valuation of financial assets at FVOCI.
Remeasurements of defined benefit plan refer to accumulated actuarial losses, net of gains, as aresult of remeasurements of post-employment defined benefit plan and return on plan assets(excluding amount included in net interest).
Other reserves pertains to exchange differences arising from the translation of the Parent Bank’sForeign Currency Deposit Unit (FCDU) operations and UBX SG, which is taken to the statementof comprehensive income.
Non-controlling interests represent the portion of the net resources and profit or loss notattributable to the Group which are presented separately in the Group’s statements of income andwithin the capital funds in the Group’s statements of financial position and changes in capitalfunds.
Revenue Recognition
Revenue from contracts with customers is recognised when control of the goods or services aretransferred to the customer at an amount that reflects the consideration to which the Groupexpects to be entitled in exchange for those goods or services. Expenses are recognized in thestatements of income upon utilization of the resources or services or at the date these areincurred. All finance costs are reported on an accrual basis. The following specific recognitioncriteria of income and expenses must also be met before income or expense is recognized:
(a) Interest income recognized using the effective interest rate method - Interest income isrecognized in the statements of income for all instruments measured at amortized cost anddebt instruments classified as financial assets at FVOCI using the effective interest method.
The effective interest method is a method of calculating the amortized cost of a financialasset or a financial liability and of allocating the interest income or interest expense over therelevant period. The effective interest rate is the rate that exactly discounts estimated futurecash payments or receipts through the expected life of the financial instrument or, whenappropriate, a shorter period to the net carrying amount of the financial asset or financialliability. When calculating the effective interest rate, the Group estimates cash flowsconsidering all contractual terms of the financial instrument but does not consider futurecredit losses. The calculation includes all fees paid or received between parties to thecontract that are an integral part of the effective interest rate, transaction costs and all otherpremiums or discounts.
(b) Other interest income - Interest income on all trading assets and financial assets mandatorilyrequired to be measured at FVTPL is recognized using the contractual interest rate and isincluded under Interest Income on financial assets at fair value through profit or loss.
(c) Service charges, fees and commissions - Service charges, fees and commissions are generallyrecognized when the service has been provided. Loan commitment fees are earned asservices are provided, recognized as other income on a time proportion basis over thecommitment period.
The Group has a loyalty points programme as part of its credit cards business which allowscustomers to accumulate points that can be redeemed for free products. The loyalty pointsgive rise to a separate performance obligation as they provide a material right to thecustomer.

Summary of Significant Accounting Policies - 25 -
*SGVFSM005928*
A portion of the interchange fee is allocated to the loyalty points awarded to customers basedon relative stand-alone selling price and recognised as a contract liability until the points areredeemed. Revenue is recognised upon redemption of products by the customer.
(d) Gain (loss) on trading and investment securities - Gain (loss) on trading and investmentsecurities is recognized when the contractual rights on the securities is transferred to thebuyer (at an amount equal to the difference of the selling price and the carrying amount ofsecurities) and as a result of the mark-to market valuation of outstanding securities classifiedas FVTPL at year-end.
(e) Miscellaneous income includes the following accounts:
Commissions earned on credit cards - Commissions earned on credit cards arerecognized as income upon receipt from member establishments of charges arising fromcredit availments by credit cardholders. These commissions are computed based oncertain agreed rates and are deducted from amounts remittable to memberestablishments. Purchases by the credit cardholders, collectible on installment basis, arerecorded at the cost of the items purchased. Interest income is recognized on every termof installment billed to the cardholders and computed using the effective interest method.
Gain (loss) from assets sold or exchanged - Profit or loss from assets sold or exchangedis recognized when the control of the assets is transferred to the buyer or when thecollectibility of the entire sales price is reasonably assured.
Rental - Rental income arising from leased properties is accounted for on a straight-linebasis over the lease terms on ongoing leases.
Income from bancassurance business - Exclusive access fee (EAF) related to thebancassurance partnership is recognized as revenue by reference to the completion rateof the target cumulative annualized premium earned.
Dividend - Dividend income is recognized when the Group’s right to receive payment isestablished.
Income from trust operations - Trust fees related to investment funds are recognized inreference to the net asset value of the funds. The same principle is applied for wealthmanagement, financial planning and custody services that are continuously provided overan extended period of time.
LeasesThe Group assesses at contract inception whether a contract is, or contains, a lease. That is, if thecontract conveys the right to control the use of an identified asset for a period of time inexchange for consideration.
The Group as Lessee accounts for its leases as follows:
Group as LessorLeases, which do not transfer to the lessee substantially all the risks and benefits of ownership ofthe asset, are classified as operating leases. Lease income from operating leases is recognized asincome in the statements of income on a straight-line basis over the lease term.

Summary of Significant Accounting Policies - 26 -
*SGVFSM005928*
The Group determines whether an arrangement is, or contains a lease based on the substance ofthe arrangement. It makes an assessment of whether the fulfilment of the arrangement isdependent on the use of a specific asset or assets and the arrangement conveys a right to use theasset.
Group as a lessee
The Group applies a single recognition and measurement approach for all leases, except forshort-term leases and leases of low-value assets. The Group recognizes lease liabilities to makelease payments and ROU assets representing the right to use the underlying assets.
i. Right-of-use assets
The Group recognizes ROU assets at the commencement date of the lease (i.e., the date theunderlying asset is available for use). ROU assets are measured at cost, less any accumulateddepreciation and impairment losses, and adjusted for any remeasurement of lease liabilities.The cost of ROU assets includes the amount of lease liabilities recognized, initial direct costsincurred, and lease payments made at or before the commencement date less any leaseincentives received.
ii. Lease liabilities
At the commencement date of the lease, the Group recognizes lease liabilities measured atthe present value of lease payments to be made over the lease term. The lease paymentsinclude fixed payments (including in-substance fixed payments) less any lease incentivesreceivable, variable lease payments that depend on an index or a rate, and amounts expectedto be paid under residual value guarantees. The lease payments also include the exerciseprice of a purchase option reasonably certain to be exercised by the Group and payments ofpenalties for terminating a lease, if the lease term reflects the Group exercising the option toterminate. Variable lease payments that do not depend on an index or a rate are recognizedas expense (unless they are incurred to produce inventories) in the period on which the eventor condition that triggers the payment occurs.
In calculating the present value of lease payments, the Group uses its incremental borrowingrate at the lease commencement date because the interest rate implicit in the lease is notreadily determinable. After the commencement date, the amount of lease liabilities isincreased to reflect the accretion of interest recognized under Interest expense of billspayable and other liabilities and reduced for the lease payments made. In addition, thecarrying amount of lease liabilities is remeasured if there is a modification, a change in thelease term, a change in the lease payments (e.g., changes to future payments resulting from achange in an index or rate used to determine such lease payments) or a change in theassessment of an option to purchase the underlying asset.
iii. Short-term leases and leases of low-value assets
The Group applies the short-term lease recognition exemption to its short-term leases forsome branches and the related parking spaces, stalls used for specific events and severaloffice equipment (i.e., those leases that have a lease term of 12 months or less from thecommencement date and do not contain a purchase option). It also applies the lease of low-value assets recognition exemption to leases of ATM offsite locations, signages and severalitems of office equipment that are considered of low value (i.e. P=250,000 and below). Leasepayments on short-term leases and leases of low-value assets are recognized as expense on astraight-line basis over the lease term as is recognized as part of ‘Occupancy’ in thestatements of income.

Summary of Significant Accounting Policies - 27 -
*SGVFSM005928*
Foreign Currency Transactions and TranslationsThe accounting records of the Group are maintained in Philippine pesos except for the FCDU ofthe Parent Bank which are maintained in United States (U.S.) dollars. Foreign currencytransactions during the period are translated into the functional currency at exchange rates whichapproximate those prevailing on transaction dates.
For financial reporting purposes, the accounts of the FCDU are translated into their equivalents inPhilippine pesos based on the Philippine Dealing System closing rates (PDSCR) prevailing at theend of the period (for resources and liabilities) and at the average PDSCR for the period (forincome and expenses).
Foreign exchange gains and losses resulting from the settlement of foreign currency transactionsand from the translation at period-end exchange rates of monetary assets and liabilitiesdenominated in foreign currencies are recognized in the statements of income.
Changes in the fair value of monetary financial assets denominated in foreign currency areanalyzed between translation differences resulting from changes in the amortized cost of thesecurity and other changes in the carrying amount of the security. Translation differences relatedto changes in amortized cost are recognized in the statements of income, and other changes in thecarrying amount are recognized in other comprehensive income.
Impairment of Non-financial AssetsThe Group’s intangible assets (consisting of goodwill and computer software recorded as part ofOther resources), bank premises, furniture, fixtures and equipment, investment properties,investments in subsidiaries (for Parent Bank only) and other non-financial assets are subject toimpairment testing. Intangible assets with an indefinite useful life, such as goodwill, are testedfor impairment at least annually. All other individual assets or cash-generating units are testedfor impairment whenever events or changes in circumstances indicate that the carrying amountmay not be recoverable.
For purposes of assessing impairment, assets are grouped at the lowest levels for which there areseparately identifiable cash flows (cash-generating units). As a result, some assets are testedindividually for impairment and some are tested at cash-generating unit level.
Impairment loss is recognized in the statements of income for the amount by which the asset’s orcash-generating unit’s carrying amount exceeds its recoverable amount, which is the higher offair value, reflecting market conditions, less costs to sell and value in use. In determining valuein use, management estimates the expected future cash flows from each cash-generating unit anddetermines the suitable interest rate in order to calculate the present value of those cash flows.The data used for impairment testing procedures are directly linked to the Group’s latestapproved budget, adjusted as necessary to exclude the effects of asset enhancements. Discountfactors are determined individually for each cash-generating unit and reflect management’sassessment of respective risk profiles, such as market and asset-specific risk factors.
All assets are subsequently reassessed for indications that an impairment loss previouslyrecognized may no longer exist and the carrying amount of the asset is adjusted to therecoverable amount resulting in the reversal of the impairment loss, except for goodwill.

Summary of Significant Accounting Policies - 28 -
*SGVFSM005928*
Employee BenefitsThe Group’s employment benefits to employees are as follows:
(a) Post-employment Defined Benefit PlanA defined benefit plan is a post-employment plan that defines an amount of post-employmentbenefit that an employee will receive on retirement, usually dependent on one or more factorssuch as age, years of service and salary. The legal obligation for any benefits from this kindof post-employment plan remains with the Group, even if plan assets for funding the definedbenefit plan have been acquired. Plan assets may include assets specifically designated to along-term benefit fund, as well as qualifying insurance policies. The Group’s defined benefitpost-employment plan covers all regular full-time employees. The pension plan istax-qualified, noncontributory and administered by a trustee.
The liability recognized in the statement of financial position for a defined benefit plan(included as part of Other Liabilities) is the present value of the defined benefit obligation(DBO) at the end of the reporting period less the fair value of plan assets. The DBO iscalculated annually by independent actuaries using the projected unit credit method. Thepresent value of the DBO is determined by discounting the estimated future cash outflowsarising from expended benefit payments using a discount rate derived from the interest ratesof a zero coupon government bond as published by Philippine Dealing & Exchange Corp.,that are denominated in the currency in which the benefits will be paid and that have terms tomaturity approximating to the terms of the related post-employment liability.
Remeasurements, comprising of actuarial gains and losses arising from experienceadjustments and changes in actuarial assumptions and the return on plan assets (excludingamount included in net interest) are reflected immediately in the statement of financialposition with a charge or credit recognized in other comprehensive income in the period inwhich they arise. Net interest is calculated by applying the discount rate at the beginning ofthe period to the net defined benefit liability or asset and is included as part of Interestexpense or Interest income in the statements of income.
Past-service costs are recognized immediately in the statements of income in the period of aplan amendment or curtailment.
(b) Post-employment Defined Contribution PlanA defined contribution plan is a post-employment plan under which the Group pays fixedcontributions into an independent entity, such as the Social Security System. The Group hasno legal or constructive obligations to pay further contributions after payment of the fixedcontribution. The contributions recognized in respect of defined contribution plans areexpensed as they fall due. Liabilities and assets may be recognized if underpayment orprepayment has occurred.
(c) Termination Benefits
Termination benefits are payable when employment is terminated by the Group before thenormal retirement date, or whenever an employee accepts voluntary redundancy in exchangefor these benefits. The Group recognizes termination benefits at the earlier of when it can nolonger withdraw the offer of such benefits and when it recognizes costs for a restructuringthat is within the scope of PAS 37 and involves the payment of termination benefits. In thecase of an offer made to encourage voluntary redundancy, the termination benefits aremeasured based on the number of employees expected to accept the offer. Benefits fallingdue more than 12 months after the end of the reporting period are discounted to their presentvalue.

Summary of Significant Accounting Policies - 29 -
*SGVFSM005928*
(d) Profit-Sharing and Bonus Plans
The Group recognizes a liability and an expense for bonuses and profit-sharing, based on aformula that takes into consideration the profit attributable to the Parent Bank’s shareholders,as indicated in the statements of income, after certain regulatory adjustments. The Grouprecognizes a provision where it is contractually obliged to pay the bonus plans. The Groupalso recognizes a provision for profit-sharing and bonus plans where there is a past practicethat has created a constructive obligation, whether paid in cash or in the form of shares of theParent Bank to be issued under the Employee Stock Plan.
(e) Compensated Absences
Compensated absences are recognized for the number of paid leave days (including holidayentitlement) remaining at the end of the reporting date.
They are included as part of Accrued taxes and other expenses under the Other liabilitiesaccount in the statement of financial position at the undiscounted amount that the Groupexpects to pay as a result of the unused entitlement.
Income TaxesTax expense recognized in the statements of income comprises the sum of deferred tax andcurrent tax not recognized in other comprehensive income or directly in capital funds, if any.
Current tax assets or liabilities comprise those claims from, or obligations to, fiscal authoritiesrelating to the current or prior reporting period, that are uncollected or unpaid at the end of thereporting period. They are calculated using the tax rates and tax laws applicable to the fiscalperiods to which they relate, based on the taxable profit for the year. All changes to current taxassets or liabilities are recognized as a component of tax expense in the statements of income.Effective January 1, 2019, management periodically evaluates positions taken in the tax returnswith respect to situations in which applicable tax regulations are subject to interpretations andestablishes provisions where appropriate.
Deferred tax is accounted for using the liability method on temporary differences at the end ofthe reporting period between the tax base of assets and liabilities and their carrying amounts forfinancial reporting purposes. Under the liability method, with certain exceptions, deferred taxliabilities are recognized for all taxable temporary differences and deferred tax assets arerecognized for all deductible temporary differences and the carryforward of unused tax losses andunused tax credits to the extent that it is probable that taxable profit will be available againstwhich the deferred tax assets can be utilized. Unrecognized deferred tax assets are reassessed atthe end of each reporting period and are recognized to the extent that it has become probable thatfuture taxable profit will be available to allow such deferred tax assets to be recovered.
Deferred tax assets and liabilities are measured at the tax rates that are expected to apply to theperiod when the asset is realized or the liability is settled, based on tax rates and tax laws thathave been enacted or substantively enacted at the end of the reporting period.
The carrying amount of deferred tax assets is reviewed at the end of each reporting period andreduced to the extent that it is probable that sufficient taxable profit will be available to allow allor part of the deferred tax assets to be utilized.
The measurement of deferred tax liabilities and assets reflects the tax consequences that wouldfollow from the manner in which the Group expects, at the end of the reporting period, to recoveror settle the carrying amount of its assets and liabilities.

Summary of Significant Accounting Policies - 30 -
*SGVFSM005928*
Most changes in deferred tax assets or liabilities are recognized as a component of tax expense inthe statements of income, except to the extent that it relates to items recognized in othercomprehensive income or directly in capital funds. In this case, the tax is also recognized inother comprehensive income or directly in capital funds, respectively.
Deferred tax assets and deferred tax liabilities are offset if the Group has a legally enforceableright to set off current tax assets against current tax liabilities and the deferred taxes relate to thesame entity and the same taxation authority.
Related Party Relationships and TransactionsRelated party transactions are transfers of resources, services or obligations between the Groupand their related parties, regardless of whether or not a price is charged.
Parties are considered to be related if one party has the ability to control the other party orexercise significant influence over the other party in making financial and operating decisions.These parties include: (a) individuals owning, directly or indirectly through one or moreintermediaries, control or are controlled by, or under common control with the Parent Bank;(b) associates; (c) individuals owning, directly or indirectly, an interest in the voting power of theParent Bank that gives them significant influence over the Parent Bank and close members of thefamily of any such individual; and, (d) the Group’s funded retirement plan.
In considering each possible related party relationship, attention is directed to the substance ofthe relationship and not merely on the legal form.
Earnings Per ShareBasic earnings per share are determined by dividing the net profit for the year attributable tocommon shareholders by the weighted average number of common shares outstanding during theyear, after retroactive effect to any stock dividends declared in the current year.
Diluted earnings per common share are also computed by dividing net profit by the weightedaverage number of common shares subscribed and outstanding at the end of the reporting period,after making adjustments to reflect the effects of any potentially dilutive preferred shares, stockoptions and warrants.
Trust and Fiduciary ActivitiesThe Group commonly acts as trustee and in other fiduciary capacities that result in the holding orplacing of assets on behalf of individuals, trusts, retirement benefit plans and other institutions.These resources and the related income arising thereon are excluded from these financialstatements, as they are neither resources nor income of the Group.
Segment ReportingOperating segments are reported in a manner consistent with the internal reporting provided tothe Group’s chief operating decision-maker. The chief operating decision-maker is responsiblefor allocating resources and assessing performance of the operating segments.
In identifying its operating segments, management generally follows the Group’s products andservices as disclosed in Note 6, which represent the main products and services provided by theGroup.
Each of these operating segments is managed separately as each of these services requiredifferent technologies and other resources as well as marketing approaches. All inter-segmenttransfers are carried out at arm’s length prices.

Summary of Significant Accounting Policies
Summary of Accounting Judgments and Estimates - 31 -
*SGVFSM005928*
The measurement policies the Group uses for segment reporting under PFRS 8, Operating
Segments, are the same as those used in its consolidated financial statements in arriving at theoperating profit of the operating segments.
In addition, corporate assets which are not directly attributable to the business activities of anyoperating segment are not allocated to a particular segment.
There have been no changes from prior periods in the measurement methods used to determinereported segment profit or loss.
The Group’s operations are organized according to the nature of the products and servicesprovided. Financial information on business segments is presented in Note 6.
Events After the End of the Reporting PeriodAny post-year-end event that provides additional information about the Group’s position at thestatement of financial position date (adjusting event) is reflected in the financial statements.Post-year-end events that are not adjusting events, if any, are disclosed when material to thefinancial statements.
3. Summary of Accounting Judgments and Estimates
The preparation of the Group’s financial statements in accordance with PFRS requiresmanagement to make judgments and estimates that affect the amounts reported in the financialstatements and related notes. Judgments and estimates are continually evaluated and are basedon historical experience and other factors, including expectations of future events that arebelieved to be reasonable under the circumstances. Actual results may ultimately differ fromthese estimates.
Unless otherwise stated, below significant judgments and estimates apply as of and for the yearsended December 31, 2020, 2019 and 2018.
Critical Management Judgments in Applying Accounting PoliciesIn the process of applying the Group’s accounting policies, management has made the followingjudgments, apart from those involving estimation, which have the most significant effect on theamounts recognized in the financial statements:
Determining functional and presentation currency
PAS 21, The Effects of Changes in Foreign Exchange Rates requires management to use itsjudgment to determine the entity’s functional currency such that it most faithfully represents theeconomic effects of the underlying transactions, events and conditions that are relevant to theentity. The Group has determined that the functional currency of RBU and FCDU is PhilippinePeso and United States Dollar, respectively, considering the following:
the currency that mainly influences prices for financial instruments and services (this willoften be the currency in which prices for its financial instruments and services aredenominated and settled);
the currency in which funds from financing activities are generated; and
the currency in which receipts from operating activities are usually retained.

Summary of Accounting Judgments and Estimates - 32 -
*SGVFSM005928*
Evaluation of business model in managing financial instruments
The Group manages its financial assets based on business models that maintain adequate level offinancial assets to match its expected cash outflows, largely arising from customers’ withdrawalsand continuing loan disbursements to borrowers, while maintaining a strategic portfolio offinancial assets for investment and trading activities consistent with its risk appetite.
In determining the classification of a financial instrument under PFRS 9, the Group developedbusiness models which reflect how it manages its portfolio of financial instruments. The Group’sbusiness models need not be assessed at entity level or as a whole but applied at the level of aportfolio of financial instruments (i.e., group of financial instruments that are managed togetherby the Group) and not on an instrument-by-instrument basis (i.e., not based on intention orspecific characteristics of individual financial instrument). The Group evaluates in whichbusiness model a financial instrument or a portfolio of financial instruments belong to taking intoconsideration the objectives of each business model established by the Group.
PFRS 9 emphasizes that if more than an infrequent and more than an insignificant sale is madeout of a portfolio of financial assets carried at amortized cost, an entity should assess whether andhow such sales are consistent with the objective of collecting contractual cash flows. In makingthis judgment, the Group considers certain circumstances documented in its business modelmanual to assess that an increase in the frequency or value of sales of financial instruments in aparticular period is not necessarily inconsistent with a held-to-collect business model if the Groupcan explain the reasons for those sales and why those sales do not reflect a change in the Group’sobjective for the business model.
In 2018, the Parent Bank participated in the Republic of the Philippines (ROP) US Dollar bondexchange for its outstanding securities classified as Investment securities at amortized cost withtotal carrying amount of $121.28 million (P=6.4 billion), resulting in Gain on sale of investmentsecurities at amortized cost totaling P=152.2 million. The Parent Bank has assessed that such salesare not more than infrequent and not more than insignificant and are necessary in order to ensurethat the outstanding securities remain an acceptable liquid quality. The disposals are considerednot inconsistent with the objective of hold to collect business model. The remaining securities inthe affected hold-to-collect portfolio are continued to be measured at amortized cost.
In 2019, the Parent Bank sold investment securities classified as Investment securities atamortized cost with carrying amount of $1,054.04 million (P=53.5 billion), resulting in Gain onsale of investment securities at amortized cost totaling P=7.07 billion. The sales were made as partof the Group’s capital raising activities and in response to the regulatory changes which theParent Bank assessed to have significant impact on its operations.
In 2020, the Parent Bank sold investment securities classified as Investment securities atamortized cost with total carrying amount of P=57.75 billion, resulting in Gain on sale ofinvestment securities at amortized cost totaling P=5.11 billion. These sales were made in responseto regulatory changes and unanticipated significant changes in the current market conditionsbrought about by the COVID-19 pandemic which the Parent Bank assessed to have significantimpact on its operations. Certain investments were sold in order to shorten the duration offinancial assets and reduce interest rate risk of the Parent Bank necessary as a response tosignificant changes in current market conditions.

Summary of Accounting Judgments and Estimates - 33 -
*SGVFSM005928*
The Parent Bank has assessed that the sales resulted from changes in intention for certaininvestments classified as Investment securities at amortized cost. Further, the Parent Bankassessed that the sales do not reflect a change in the business model of the Group. Accordingly,the remaining investment securities in the affected hold-to-collect portfolio are continued to bemeasured at amortized cost.
Testing the cash flow characteristics of financial assets
In determining the classification of financial assets under PFRS 9, the Group assesses whetherthe contractual terms of the financial assets give rise on specified dates to cash flows that areSPPI on the principal outstanding, with interest representing time value of money and credit riskassociated with the principal amount outstanding. The assessment as to whether the cash flowsmeet the test is made in the currency in which the financial asset is denominated. Any othercontractual term that changes the timing or amount of cash flows (unless it is a variable interestrate that represents time value of money and credit risk) does not meet the amortized cost criteria.In cases where the relationship between the passage of time and the interest rate of the financialinstrument may be imperfect, known as modified time value of money, the Group assesses themodified time value of money feature to determine whether the financial instrument still meetsthe SPPI criterion. The objective of the assessment is to determine how different theundiscounted contractual cash flows could be from the undiscounted cash flows that would ariseif the time value of money element was not modified (the benchmark cash flows). If theresulting difference is significant, the SPPI criterion is not met.
In view of this, the Group considers the effect of the modified time value of money element ineach reporting period and cumulatively over the life of the financial instrument.
Determining the lease term of contracts with renewal and termination options - Group as lessee
The Group determines the lease term as the non-cancellable term of the lease, together with anyperiods covered by an option to extend the lease if it is reasonably certain to be exercised, or anyperiods covered by an option to terminate the lease, if it is reasonably certain not to be exercised.
The Group has several lease contracts that include extension and termination options. The Groupdetermined that generally, the options to extend or terminate the lease are not included in thedetermination of the lease term. These optional periods are not enforceable, as the Group cannotenforce the extension of the lease without the agreement from the lessor, and therefore, the Groupdoes not have the right to use the asset beyond the non-cancellable period.
Key Sources of Estimation UncertaintyThe following are the key assumptions concerning the future, and other key sources of estimationuncertainty at the end of the reporting period, that have a significant risk of causing a materialadjustment to the carrying amounts of assets and liabilities within the next reporting period:
Estimation of impairment losses on Loans and other receivables, Financial assets at amortized
cost and Financial assets at FVOCI
The measurement of impairment losses under PFRS 9 across all categories of financial assetsrequires judgment, in particular, the estimation of the amount and timing of future cash flows andcollateral values when determining impairment losses and the assessment of a significantincrease in credit risk. These estimates are driven by a number of factors, changes in which canresult in different levels of allowances.
The Group’s ECL calculations are outputs of complex models with a number of underlyingassumptions regarding the choice of variable inputs and their interdependencies. Significantfactors affecting the estimates on the ECL model include:
Summary of Accounting Judgments and Estimates - 34 -
*SGVFSM005928*
The Group’s internal grading model, which assigns PDs to individual grades. In 2020,account level and portfolio credit risk rating assessment, which considered how clients arebeing affected by and are responding to COVID-19- related challenges, have been appliedmore frequently to the scorecards. Sensitivities were applied to consider uncertainties onavailable economic forecasts.
The Group’s criteria for assessing if there has been a significant increase in credit risk(SICR) which is the basis for measuring allowances for financial assets on a LifetimeExpected Credit Loss (LTECL) basis. In 2020, the BSP issued several memoranda grantingtemporary relief measures to banks and supervised financial institution (BSFI). The reliefincludes payment moratorium which defers payment of maturing loans. With the delay ofpast due information, the Group performed qualitative assessment to consider significantincrease in credit risk based on the identified risk profiles of their accounts and portfolios.
The Group’s definition of default, which considers the regulatory requirement and the Bank’sindicators of loss events.
Financial assets were segmented. In 2020, the accounts are further segmented, and theGroup identified specific accounts and portfolios that are considered severely affected by thechallenges related to COVID-19.
Development of ECL models, including the various formulas and the choice of inputs. In2020, models have been reviewed and revised as appropriate based on latest economicoutlook and studies from external sources.
Determination of associations between macroeconomic scenarios and economic inputs, suchas unemployment levels, level of government spending, and collateral values, and their effecton PDs, EADs and LGDs. As the pandemic progressed, lockdown measures were imposedand public health policy changed, the macroeconomic associations were reviewed in-depthand updated frequently. Because of the uncertainties surrounding the business landscapeduring the period, the quantitative overlays were complemented by experience-based expertjudgment inputs through management discretion overlays considered integral to thesystematic process.
The carrying amount of loans and other receivables and the related allowance are disclosed inNotes 14 and 20, while the carrying amount of debt financial assets classified under amortizedcost and fair value through other comprehensive income and the related allowances are disclosedin Notes 12 and 20.
Fair value of derivatives
Management applies valuation techniques to determine the fair value of derivatives that are notquoted in active markets. This requires management to develop estimates and assumptions basedon market inputs, using observable data that market participants would use in pricing theinstrument. Where such data is not observable, management uses its best estimate. Estimatedfair values of financial instruments may vary from the actual prices that would be achieved in anarm’s length transaction at the reporting date.
Valuation techniques are used to determine fair values which are validated and periodicallyreviewed. To the extent practicable, models use observable data, however, areas such as creditrisk (both own and counterparty), volatilities and correlations require management to makeestimates. Changes in assumptions could affect reported fair value of financial instruments.The Group uses judgment to select a variety of methods and make assumptions that are mainlybased on market conditions existing at the end of each reporting period.
The fair values of derivatives as of December 31, 2020 and 2019 are presented and grouped intothe fair value hierarchy in Note 7.

Summary of Accounting Judgments and Estimates - 35 -
*SGVFSM005928*
Recognition of deferred tax assets
Deferred tax assets are recognized for all unused tax losses and temporary differences to theextent that it is probable that future taxable profit will be available against which the losses canbe utilized. Significant management judgment is required to determine the amount of deferredtax assets that can be recognized, based upon the likely timing and level of future taxable incometogether with future tax planning strategies.
Based on forecast, management assessed that it is probable that future taxable income will beavailable to utilize the deferred tax assets. The carrying value of recognized deferred tax assets isdisclosed in Note 30.
Impairment of goodwill
The Group conducts an annual review for any impairment in the value of goodwill. Goodwill iswritten down for impairment where the recoverable amount of the related CGU is insufficient tosupport its carrying value. The Group determines the recoverable value of goodwill bydiscounting the estimated excess earnings using the weighted-average cost of capital (WACC) asthe discount rate. The Group estimates the discount rate used for the computation of the netpresent value by reference to industry cost of capital.
The recoverable amount of the CGU is determined based on a value-in-use calculation using cashflow projections from financial budgets covering a five-year period. Financial budget for theimmediately succeeding year is approved by senior management and BOD of the Parent Bank,while the financial budgets for the other years of cash flow projections are determined bycorporate planning group and the relevant business units. In 2020, the key assumptions used inthe calculation of value-in-use, including loan and deposit growth rates, net interest margin, havebeen updated to consider the effect of the pandemic. The discount rates used for the computationof the value in use for various CGUs (see Note 18) are based on the pre-tax discount ratesranging from 6.69% to 11.1% and from 7.88% to 12.70%, as of December 31, 2020 andDecember 31, 2019, respectively. The long-term growth rates used range from 0% to 1% as ofDecember 31, 2020 and December 31, 2019. Based on the Group’s assessment after taking intoconsideration the impact of the pandemic to the key forecast assumptions, the Bank recognizedimpairment amounting to P=223.17 million related to a CGU where the calculated value in use isbelow the carrying amount, while the other remaining CGUs remain unimpaired.
Though management believes that the assumptions used in the estimation of fair values reflectedin the financial statements are appropriate and reasonable, significant changes in theseassumptions may materially affect the assessment of recoverable values and any resultingimpairment loss could have a material adverse effect on the results of operations.
The carrying amount of goodwill is disclosed in Note 18.
Valuation of post-employment and other benefits
The determination of the Group’s obligation and cost of pension and other post-employmentbenefits is dependent on the selection of certain assumptions used by actuaries in calculating suchamounts. Those assumptions include, among others, discount rates, expected rates of salaryincrease, and employee turnover rate. A significant change in any of these actuarial assumptionsmay generally affect the recognized expense, other comprehensive income or loss and thecarrying amount of the post-employment benefit obligation in the next reporting period.

Summary of Accounting Judgments and Estimates - 36 -
*SGVFSM005928*
The Group also estimates other employee benefit obligations and expenses, including the cost ofpaid leaves based on historical leave availments of employees, subject to the Group and theParent Bank policies. These estimates may vary depending on future changes in salaries andactual experiences during the year.
The amounts of post-employment defined benefit obligation and expense and an analysis of themovements in the estimated present value of post-employment defined benefit obligation, as wellas significant assumptions such as salary rate increase, discount rates, and turnover rates used inestimating such obligation are presented in Note 29.
Fair value determination of assets acquired and liabilities assumed from business combinations
In 2020, the Group provisionally determined the fair values of the assets acquired and liabilitiesassumed from the acquisition of Bangko Kabayan and PBI. In 2019, the Group finalized thedetermination of the fair values of the assets acquired and liabilities assumed from theacquisitions of PR Savings Bank and PETNET (see Note 15). The Group determines theacquisition-date fair values of identifiable assets acquired and liabilities assumed from theacquiree without quoted market prices based on the following:
For assets and liabilities that are short term in nature, carrying values approximate fairvalues;
For financial assets and liabilities that are long-term in nature, fair values are estimatedthrough the discounted cash flow methodology, using the appropriate market rates (e.g.,current lending rates);
For nonfinancial assets such as property and equipment and investment properties, fair valuesare determined based on an appraisal which follows sales comparison approach anddepreciated replacement cost approach depending on the highest and best use of the assets;and
For intangible assets, these are determined based on discounted cash flow over the benefitsand liabilities of ownership over the asset acquired, including an exit or terminal value.
Leases - Estimating the incremental borrowing rate
The Group cannot readily determine the interest rate implicit in the lease, therefore, it uses itsIBR to measure lease liabilities. The IBR is the rate of interest that the Group would have to payto borrow over a similar term, and with a similar security, the funds necessary to obtain an assetof a similar value to the right-of-use asset in a similar economic environment. The IBR thereforereflects what the Group ‘would have to pay’, which requires estimation when no observable ratesare available (such as for subsidiaries that do not enter into financing transactions) or when theyneed to be adjusted to reflect the terms and conditions of the lease.
The Group estimates the IBR using observable inputs (such as market interest rates) whenavailable and is required to make certain entity-specific estimates (such as the credit spread for astand-alone credit rating).
The carrying amount of the lease liabilities as of December 31, 2020 and 2019 is disclosed inNote 24.

Risk Management Objectives and Policies - 37 -
*SGVFSM005928*
4. Risk Management Objectives and Policies
Risks are inherent in the business activities of the Group. Among its identified risks are creditrisk, liquidity risk, market risk, interest rate risk, foreign exchange risk, operational risk,information security risk, legal risk, and regulatory risk. These are managed through a riskmanagement framework and governance structure that provides comprehensive controls andmanagement of major risks on an ongoing basis.
Risk management is the process by which the Group identifies its key risks, collects consistentand understandable risk measures, decides which risks to take on or reduce and establishesprocedures for monitoring the resulting risk positions. The objective of risk management is toensure that the Group conducts its business within the risk levels set by the BOD while businessunits pursue their objective of maximizing returns.
Risk Management StrategiesThe Group maintains a prudent risk management strategy to ensure the soundness andprofitability of its operations and sustained profitability. Business units are held accountable forall the risks and related returns, and ensure that decisions are consistent with business objectivesand risk tolerance. Strategies and limits are reviewed regularly and updated to ensure that risksare well-diversified and risk mitigation measures are in place. A system for managing andmonitoring risks is in place so that all relevant issues are identified at an early stage andappropriate actions are taken on a timely basis. Risk reporting is done on a regular basis, eitherdaily, monthly or quarterly.
Although the BOD is primarily responsible for the overall risk management of the Group’sactivities, the responsibility rests with all levels of the organization. The risk appetite is definedand communicated, including parameters and limits, through an enterprise-wide risk policyframework.
Risk Management StructureThe BOD of the Parent Bank exercises oversight over the Parent Bank’s risk managementprocess as a whole and through its various risk committees. For the purpose of day-to-daymanagement of risks, the Parent Bank has established independent Risk Management Units(RMUs) that objectively review and ensure compliance with the risk parameters set by the BOD.The RMUs are responsible for the monitoring and reporting of risks to senior management andthe various committees of the Parent Bank.
On the other hand, the risk management processes of its subsidiaries are handled separately bytheir respective BODs.
The Parent Bank’s BOD is primarily responsible for setting the risk appetite, approving riskparameters, proposed credit policies, and investment guidelines, as well as establishing theoverall risk-taking capacity of the Parent Bank. To fulfill its responsibilities in risk management,the BOD has established the following committees, whose functions are described below.
(a) The Executive Committee (EXCOM), composed of seven (7) members of the BOD,exercises certain functions as delegated by the BOD including, among others, the approval ofcredit proposals, asset recovery and real and other properties acquired (ROPA) sales withinits delegated limits.
Risk Management Objectives and Policies - 38 -
*SGVFSM005928*
(b) The Risk Management Committee (RMC) is composed of seven (7) non-executive directorsof the BOD, majority of whom are independent directors, including the Chairman. The RMCshall advise the BOD of the Parent Bank’s overall current and future risk appetite, overseeSenior Management’s adherence to the risk appetite statement, and report on the state of riskculture of the Parent Bank. The RMC shall oversee the risk management framework and therisk management function. The RMC also provides oversight, direction, and guidance to theother risk committees, specifically the Market Risk Committee (MRC) and the OperationsRisk Management Committee (ORMC).
(c) The MRC is composed of nine (9) members of the BOD, majority of whom are independentdirectors, including the Chairman. The MRC is primarily responsible for reviewing the riskmanagement policies and practices relating to market risk including interest rate risk in thebanking book and liquidity risk.
(d) The ORMC, composed of seven (7) members of the BOD, majority of whom are independentdirectors, including the Chairman, reviews various operations risk policies and practices.
Below are the responsibilities of the ORMC:
(a) Recognize and identify the nature and complexity of the major operational risks of theBank and the operating environment the Bank is exposed to;
(b) Approve the operational risk management framework which forms part of the Bank’senterprise risk management system and covers all business lines and functions of theBank, including outsourced services and services provided to external parties;
(c) Approve the outsourcing framework of the Bank which makes up of a process forevaluating and managing the risks of all existing and potential outsourcing arrangementsand policies relevant to this endeavor. The BOD also provides oversight on alloutsourcing activities and ensures effective management of risks arising from theseactivities;
(d) Ensure compliance with all applicable laws, rules and regulations on internal control,internal audit, and disclosure;
(e) Provide oversight on the adequacy of resources, including personnel complement, andare supported by appropriate technological systems. The use of technological systemsmust be commensurate to the activities being undertaken;
(f) Provide oversight on the implementation of a sound business continuity managementframework. The BOD instills a culture of placing importance on business continuity bysupplying the incumbent resources that support Bank’s business continuity initiatives;
(g) Report to the RMC/BOD results of operational risk and control assessments conductedby the Business and Support Units, summarized results, if any, of internal audits, BSPexaminations, and investigations of administrative cases that highlight trends indicativeof present or emerging exposures to specific operational risks;

Risk Management Objectives and Policies - 39 -
*SGVFSM005928*
(e) The Audit Committee is composed of seven (7) members, all non-executive and majority ofwhom are independent, including the Chairman, most of whom are with accounting, auditing,or related financial management expertise or experience. The skills, qualifications, andexperience of the committee members are appropriate for them to perform their duties as laiddown by the BOD.
The Audit Committee serves as principal agent of the BOD in ensuring independence ofthe Parent Bank’s external auditors and the internal audit function, the integrity ofmanagement, and the adequacy of disclosures and reporting to stockholders. It also overseesthe Parent Bank’s financial reporting process on behalf of the BOD. It assists the BOD infulfilling its fiduciary responsibilities as to accounting policies, reporting practices and thesufficiency of auditing relative thereto, and regulatory compliance.
To effectively perform these functions, the Audit Committee has a good understanding of theParent Bank’s business including the following: Parent Bank’s structure, businesses,controls, and the types of transactions or other financial reporting matters applicable to theParent Bank as well as to determine whether the controls are adequate, functioning asdesigned, and operating effectively. It also considers the potential effects of emergingbusiness risks and their impact on the Parent Bank’s financial position and results ofoperations.
Among the responsibilities of the Audit Committee are:
Oversight of the financial reporting process. The Audit Committee ensures thatthe Parent Bank has a high-quality reporting process that provides transparent, consistentand comparable financial statements. In this regard, the Audit Committee works closelywith management especially the Office of the Financial Controller, the Internal AuditGroup (IAG), as well as the external auditors, to effectively monitor the financialreporting process and the existence of significant financial reporting issues and concerns.
Monitoring and evaluation of internal control. The Audit Committee, through the IAG,monitors and evaluates the adequacy and effectiveness of the Parent Bank’s internalcontrol framework, integrity of financial reporting, and security of physical assets. TheAudit Committee ensures that a proactive and forward-looking approach on evaluation ofrisks and controls is taken. The Audit Committee also ensures that periodic assessmentof the internal control system is conducted to identify weaknesses and evaluates itsrobustness considering the risk profile and strategic direction of the Parent Bank.
Oversight of the audit process. The Audit Committee is knowledgeable on auditfunction and the audit process. The Audit Committee maintains supportive, trusting andinquisitive relationships with both internal and external auditors to enhance itseffectiveness.
Oversight of the outsourced internal audit activities. The Audit Committee oversees theperformance of the internal audit service provider and ensures that they comply withsound internal auditing standards and other supplemental standards issued by regulatoryauthorities/government agencies, as well as with relevant code of ethics.

Risk Management Objectives and Policies - 40 -
*SGVFSM005928*
Oversees the implementation of Group Internal Audit Policy. The Audit Committeeoversees the implementation of the policy through the periodic reports on oversight ofthe Group Internal Audit, and takes appropriate action on any group internal oversightissues identified. The Audit Committee reviews and evaluates the group internal auditpolicy, and any amendments thereto, and endorse the same to the Parent Bank forapproval.
Oversight of the whistle-blowing mechanism. The Audit Committee oversees theestablishment of a whistle-blowing mechanism in the Parent Bank by which officers andstaff shall in confidence raise concerns about possible improprieties or malpractices inmatters of financial reporting, internal control, auditing or other issues to persons orentities that have the power to take corrective action. It also ensures that independentinvestigation, appropriate follow-up, action and subsequent resolution of complaints arein place.
In the performance of these functions, the Audit Committee is supported by the IAG. TheChief Audit Executive derives authority from and is directly accountable to the AuditCommittee. However, administratively, the Chief Audit Executive reports to the President ofthe Parent Bank.
The IAG is entirely independent from all the other organizational units of the Parent Bank, aswell as from the personnel and work that are to be audited. It operates under the directcontrol of the Audit Committee and is given an appropriate standing within the Parent Bankto be free from bias and interference. The IAG is free to report its findings and appraisalsinternally at its own initiative to the Audit Committee.
The IAG is authorized by the Audit Committee to have unrestricted access to all functions,records, property, and personnel of the Bank subject to existing mandate and applicable laws.This includes the authority to allocate resources, set audit frequencies, select subjects,determine scope of work, and apply the techniques required to accomplish the auditengagement objectives.
The IAG is also authorized to obtain the necessary assistance from personnel within theParent Bank units where they perform audits, as well as other specialized services within oroutside the Parent Bank.
The IAG presents its risk-based annual audit plan that is forward-looking and consistent withthe Parent Bank’s strategic plans and priorities every quarter for approval by the AuditCommittee.
At least once a month, the Audit Committee meets to discuss the results of the assurance andconsulting engagements, and case investigations by IAG. The results of these meetings areregularly reported by the Audit Committee Chairman to the BOD in its monthly meetings.
As the Bank continuously evolves towards its digitization strategy, IAG has undertakeninitiatives to adapt and expand its processes, and to provide relevant and timelyrecommendations to the Bank. IAG has implemented continuous auditing process that aimsto provide assurance on high risk, high volume areas/process, on a real time, or near-real timebasis.

Risk Management Objectives and Policies - 41 -
*SGVFSM005928*
IAG adopted the GRC system which aims to integrate the operational risk managementacross the Parent Bank. IAG also uses it as an audit management system to aid in ensuringquality and completeness of documentation across its different engagements. IAG alsoimplemented remote auditing and leveraged on the document management system of theBank.
(f) The Corporate Governance Committee (CGC) is primarily responsible for helping the BODfulfill its corporate governance and compliance responsibilities. It is responsible for ensuringthe BOD’s effectiveness and due observance of corporate governance principles and ofoversight over the compliance risk management. It assists in the establishment of acompliance program that facilitates the escalation and resolution of compliance issuesexpeditiously.
The CGC is composed of nine (9) members of the BOD, all non-executive, majority ofwhom, including its Chairman, are independent directors. Its specific duties include, amongothers, making recommendations to the BOD regarding continuing education of directors,overseeing the periodic performance evaluation of the 1) Board; 2) Board Committees; 3)Individual Directors; 4) Management-level Committees (through the Compliance andCorporate Governance Office; and 5) Chief Compliance and Corporate Governance Officer(CCCGO).
The CGC also performs oversight functions over the Compliance and Corporate GovernanceOffice (CCGO) and the following management-level committees: 1) Anti-Money LaunderingCommittee and 2) Discipline Committee.
Senior management, through the CCCGO, periodically reports to the CGC the status ofregulatory audit and compliance testing findings until their closure. Any material breaches ofthe compliance program are reported to and promptly addressed by the CCCGO within themechanisms defined by the Compliance Manual.
The Parent Bank’s CCCGO defines the Group’s minimum governance and compliancerequirements and works closely with the subsidiaries’ and affiliates’ Chief ComplianceOfficers in the execution of these standards.
The CGC assumed the functions of the Nominations Committee (NomCom) and theCompensation and Remuneration Committee (CompRem) upon the latter Committees’dissolution. The NomCom review the qualifications of and screens candidates for the boardincluding nominees for independent directors and key officers of the Parent Bank. As part ofits added function, it also reviews the implementation of programs for identifying, retainingand developing critical officers and the succession plan for various units in the organization.
The functions of the CompRem includes overseeing implementation of the programs forsalaries and benefits of directors and senior management, and monitoring that theperformance scorecards for the Parent Bank and its officers are comprehensive and balanced,and assessing the adequacy, effectiveness for driving performance and consistency of theParent Bank’s total compensation program vis-à-vis corporate philosophy and strategy.

Risk Management Objectives and Policies - 42 -
*SGVFSM005928*
The Parent Bank’s CCCGO assists the CGC in fulfilling its functions by apprising the sameof (1) pertinent regulations and other issuances relating to compliance or corporategovernance, (2) related regulatory issues and compliance initiatives affecting the variousunits of the Bank and the status of the corrective action plans, and (3) continuously givingupdates thereon. In addition, the CCCGO keeps the CGC abreast of best governancepractices and discusses issues being brought up among private organizations and individualsadvocating good governance philosophy.
(g) The Related Party Transaction Committee is a board-level committee composed of three (3)members, all of whom are independent directors including its Chairman. The Committeeassists the BOD in the fulfillment of its corporate governance responsibilities on related partytransactions by ensuring that the latter are transacted at arm’s length terms. The Committeereviews and endorses the related party transactions to the BOD for approval or confirmation,depending on amounts involved.
The major risk types identified by the Group are discussed in the following sections:
Credit RiskCredit risk is the risk of loss resulting from the failure of a borrower or counterparty to honor itsfinancial or contractual obligation to the Group. The risk may arise from lending, trade finance,treasury, investments, derivatives and other activities undertaken by the Group. Credit risk ismanaged through strategies, policies and limits that are approved by the respective BOD of thevarious companies within the Group. With respect to the Parent Bank, it has a well-structuredand standardized credit approval process and credit scoring system for each of its business and/orproduct segments.
The RMU undertakes several functions with respect to credit risk management. The RMUindependently performs credit risk assessment, evaluation and review for its retail, commercialand corporate financial products to ensure consistency in the Parent Bank’s risk assessmentprocess. It also ensures that the Parent Bank’s credit policies and procedures are adequate andare constantly updated to meet the changing demands or risk profiles of the business units. TheRMU also reported to the Board’s Risk Management Committee the COVID-19-related overlaysas well as their impact on credit impairment and credit portfolio’s credit risk profiles.
For the year ended December 31, 2020, there were enhancements in the risk rating & SICRparameters in certain portfolios to consider the effect of COVID-19.
The RMU’s portfolio management function involves the review of the Parent Bank’s loanportfolio, including the portfolio risks associated with particular industry sectors, regions, loansize and maturity, and the development of a strategy for the Parent Bank to achieve its desiredportfolio mix and risk profile. The RMU reviews the Parent Bank’s loan portfolio quality in linewith the Parent Bank’s policy of avoiding significant concentrations of exposure to specificindustries or groups of borrowers. Concentrations arise when a number of counterparties areengaged in similar business activities, or activities in the same geographic region, or have similareconomic features. Concentrations indicate the relative sensitivity of the Parent Bank’sperformance to developments affecting a particular industry or geographical location.
The Group and the Parent Bank consider concentration risk to be present when the total exposureto a particular industry exceeds 30.0% of the total exposure, which is similar to the BSPrequirement. As of December 31, 2020 and 2019, the Group and the Parent Bank does notexceed the limit in any of its industry concentration.

Risk Management Objectives and Policies - 43 -
*SGVFSM005928*
In order to avoid excessive concentrations of risk, the Parent Bank’s policies and proceduresinclude guidelines for maintaining a diversified portfolio mix (e.g., concentration limits).Identified concentrations of credit risks are controlled and managed accordingly. The RMU alsomonitors compliance to the BSP’s limit on exposures. The table below shows the breakdown ofthe Group’s and the Parent Bank’s exposure on receivable from customers and investments andplacements as of December 31, 2020 and 2019:
2020
Group Parent Bank
Corporate loans P=116,736,437 P=116,736,437
Commercial loans 64,469,337 64,469,337
Home loans 56,749,179 56,749,179
CSB salary loans 47,918,513 −Other retail products 18,917,409 18,917,409
Other receivables from customers* 21,351,225 8,574,923
Total receivables from customers 326,142,100 265,447,285
Investments and placements 361,513,930 334,852,459
P=687,656,030 P=600,299,744*Comprised of HR loans, quick loans and Home Credit receivables
2019
Group Parent Bank
Corporate loans P=148,623,003 P=148,623,003Commercial loans 67,059,401 67,059,401Home loans 50,794,224 50,794,224CSB salary loans 44,303,147 −Other retail products 20,653,231 20,653,231Other receivables from customers* 26,375,949 17,480,234
Total receivables from customers 357,808,955 304,610,093Investments and placements 317,344,792 309,210,232
P=675,153,747 P=613,820,325*Comprised of HR loans, quick loans and Home Credit receivables
Investments and placements include financial assets at amortized cost, financial assets at FVOCI,due from other banks, due from BSP and interbank loans receivable and the related accruedinterest receivable amounting to P=2.49 billion and P=2.31 billion as of December 31, 2020 and2019, respectively.
The following summarizes the Group’s credit risk management practices and the relevantquantitative and qualitative financial information regarding the credit exposure according toportfolios:
Credit risk management practices and credit quality disclosures
Corporate LoansCorporate lending activities are undertaken by the Parent Bank’s Corporate Banking Center. Thecustomer accounts under this group belong to the top tier corporations, conglomerates and largemultinational companies.
The Parent Bank undertakes a comprehensive procedure for the credit evaluation and riskassessment of large corporate borrowers based on its obligor risk rating master scale.
Risk Management Objectives and Policies - 44 -
*SGVFSM005928*
The Parent Bank currently utilizes the same single rating system for both Corporate andCommercial accounts. In addition, the result on the latter is further refined through a secondmodel to take more careful account of the nunces between the commercial bank portfolio withthat of the corporate loan book.
The new rating system assesses default risk based on financial profile, management capacity,industry performance, and other factors deemed relevant. Significant changes in the credit riskconsidering movements in credit rating, among other account-level profile and performancefactors, define whether the accounts are classified in either Stage 1, Stage 2, or Stage 3 perPFRS 9 loan impairment standards.
Based on foregoing factors, each borrower is assigned a Borrower Risk Rating (BRR), fromAAA to D. In addition to the BRR, the Parent Bank assigns a loan exposure rating (LER),a 100-point system which consists of a Facility Tenor Rating (FTR) and a Security Risk Rating(SRR). The FTR measures the maturity risk based on the length of loan exposure, while the SRRmeasures the quality of the collateral and risk of its potential deterioration over the term of theloan. The FTR and the SRR, each a 100-point scoring system, are given equal weight indetermining the LER.
Once the BRR and the LER have been determined, the credit limit to a borrower is determinedunder the Risk Asset Acceptance Criteria (RAAC) which is a range of acceptable combinationsof the BRR and the LER. Under the RAAC system, a borrower with a high BRR will have abroader range of acceptable LERs.
The credit rating for each borrower is reviewed annually or earlier when there are extraordinaryor adverse developments affecting the borrower, the industry and/or the Philippine economy suchas the COVID-19 pandemic. Any major change in the credit scoring system, the RAAC rangeand/or the risk-adjusted pricing system is presented to and approved by the RMC.
The description of each credit quality grouping for the credit scores is explained further asfollows:
High Quality Grade - These accounts are of the highest quality and are likely to meet financialobligations.
Standard Grade - These accounts may be vulnerable to adverse business, financial and economicconditions but are expected to meet financial obligations.
Substandard Grade - These accounts are vulnerable to non-payment but for which default has notyet occurred.
Non-Performing - These refer to accounts which are in default or those that demonstrateobjective evidence of impairment.

Risk Management Objectives and Policies - 45 -
*SGVFSM005928*
Below is the breakdown of the Parent Bank’s corporate loans exposure (outstanding balance andaccrued interest receivable) by masterscale rating as of December 31, 2020 and 2019:
December 31, 2020
Amounts
Credit Score Masterscale Stage 1 Stage 2 Stage 3 Total
High Quality GradeAAA to A- 1 P=− P=− P=− P=−BBB+ 2 6,462,028 − − 6,462,028
BBB 3 4,349,295 − − 4,349,295
BBB- to BB+ 4 38,939,318 − − 38,939,318
Standard Grade
BB to BB- 5 22,605,080 30,023 − 22,635,103
B+ 6 3,769,148 8,996,172 − 12,765,320
B to B- 7 26,230,439 87,065 − 26,317,504
CCC+ to CCC 8 2,336,568 − − 2,336,568
Substandard Grade
Lower than CCC 9 1,643,232 120,587 − 1,763,819
Non-Performing
Default 10 − − 1,167,482 1,167,482
P=106,335,108 P=9,233,847 P=1,167,482 P=116,736,437
December 31, 2019
Amounts
Credit Score Masterscale Stage 1 Stage 2 Stage 3 Total
High Quality Grade
AAA to A- 1 P=− P=− P=− P=−BBB+ 2 9,294,307 − − 9,294,307BBB 3 5,280,700 − − 5,280,700BBB- to BB+ 4 62,485,268 − − 62,485,268
Standard Grade
BB to BB- 5 29,064,215 − − 29,064,215B+ 6 18,476,877 − − 18,476,877B to B- 7 10,088,965 − − 10,088,965CCC+ to CCC 8 13,703,879 − − 13,703,879
Substandard Grade
Lower than CCC 9 141,223 − − 141,223Non-Performing
Default 10 − − 87,569 87,569
P=148,535,434 P=− P=87,569 P=148,623,003
Commercial LoansThe Parent Bank’s commercial banking activities are undertaken by its Commercial BankingCenter (ComBank). These consist of banking products and services rendered to customers whichare entities that are predominantly small and medium scale enterprises (SMEs). These productsand services are similar to those provided to large corporate customers, with the predominance oftrade finance-related products and services.
The non-financial ComBank accounts use an adjusted obligor rating scale derived from the oneapplied for corporate loans, and follows the same RAAC framework, while ComBank accountsclassified as banks and non-bank financial institutions are still rated using the 2018 rating scale.

Risk Management Objectives and Policies - 46 -
*SGVFSM005928*
Below is the breakdown of the Parent Bank’s commercial loans exposure (outstanding balanceand accrued interest receivable) by masterscale rating as of December 31, 2020 and 2019 forfinancial and non-financial institutions:
Financial InstitutionsDecember 31, 2020
Amounts
Credit Score Masterscale Stage 1 Stage 2 Stage 3 Total
High Quality Grade
AAA to A- 1 P=− P=− P=− P=−BBB+ 2 − − − −BBB- 3 − − − −BBB- to BB+ 4 1,652,689 − − 1,652,689
Standard GradeBB to BB- 5 1,871,417 − − 1,871,417
B+ 6 472,654 − − 472,654
B to B- 7 11,861,087 − − 11,861,087
CCC+ to CCC 8 2,845,549 − − 2,845,549
Substandard GradeLower than CCC 9 25,028 − − 25,028
Non-PerformingDefault 10 − − − −
P=18,728,424 P=− P=− P=18,728,424
December 31, 2019
Amounts
Credit Score Masterscale Stage 1 Stage 2 Stage 3 Total
High Quality GradeAAA to A- 1 P=− P=− P=− P=−BBB+ 2 − − − −BBB- 3 − − − −BBB- to BB+ 4 752,525 − − 752,525
Standard Grade
BB to BB- 5 3,262,842 − − 3,262,842B+ 6 500,280 − − 500,280B to B- 7 12,383,270 − − 12,383,270CCC+ to CCC 8 273,292 − − 273,292
Substandard Grade
Lower than CCC 9 125,898 − − 125,898Non-Performing
Default 10 − − − −P=17,298,107 P=− P=− P=17,298,107
Non-financial InstitutionsDecember 31, 2020
Amounts
Masterscale Stage 1 Stage 2 Stage 3 Total
1 P=− P=− P=− P=−2 1,030,925 − − 1,030,925
3 1,993,546 − − 1,993,546
4 2,761,225 9,933 − 2,771,158
5 6,790,031 470,368 − 7,260,399
6 8,082,868 − − 8,082,868
7 14,453,915 112,404 − 14,566,319

Risk Management Objectives and Policies - 47 -
*SGVFSM005928*
December 31, 2020
Amounts
Masterscale Stage 1 Stage 2 Stage 3 Total
8 P=4,304,086 P=132,311 P=− P=4,436,397
9 809,459 1,482,787 − 2,292,246
10 − − 3,307,055 3,307,055
P=40,226,055 P=2,207,803 P=3,307,055 P=45,740,913
December 31, 2019
Amounts
Masterscale Stage 1 Stage 2 Stage 3 Total
1 P=− P=− P=− P=−2 − − − −3 6,123,078 − − 6,123,0784 4,137,269 − − 4,137,269
5 10,843,787 − − 10,843,7876 10,068,926 − − 10,068,9267 7,298,001 − − 7,298,001
8 6,659,372 − − 6,659,3729 1,916,217 11,469 − 1,927,686
10 − − 2,703,175 2,703,175
P=47,046,650 P=11,469 P=2,703,175 P=49,761,294
Retail and Small and Medium Enterprise (SME) Financial ProductsThe Retail loan portfolio of the Parent Bank is composed of four main product lines, namely:Home Loans, Credit Cards, Auto Loans, and Quick Loans. SME portfolio is composed ofBusiness Line Loans and a small portion from emerging products. Each of these products hasestablished credit risk guidelines and systems for managing credit risk across all businesses.Scoring models have been revised and fine-tuned while data analytics have been enhanced toimprove portfolio quality and product offers.
On the other hand, CSB, an accredited lending institution of the Department of Education(DepEd), provides salary loans to teachers under an agreement with DepEd for payrolldeductions. CSB also provides motorcycle loans as a result of its acquisition and subsequentmerger of PR Savings Bank.
Exposure to credit risk is managed through diligent assessment upon onboarding and regularportfolio and segment analysis of the ability of borrowers to meet interest and capital repaymentobligations and by changing these lending limits when appropriate.
The Retail products’ respective masterscale is defined by the credit scoring models, whichconsider demographic variables and behavioral performance, to segment the portfolio accordingto risk masterscale per product. The stages are defined by the approved Significant Increase inCredit Risk (SICR) for Retail which takes into account the following: NPL status, months onbooks, and credit score rating for Application Score (point of application) and Behavior Score(monthly credit performance).
In 2019, Credit Cards ratings range from 1 to 7 excluding default rating, while for Business Line,ratings range from 1 to 6, and for Auto Loans ratings range from 1 to 5.

Risk Management Objectives and Policies - 48 -
*SGVFSM005928*
In 2020, SME products, including but not limited to Business Line and Supplier Financing, nowuse new credit scorecards developed specific for each product segment. These scorecard modelsupdated the Business Line rating scale to 1 to 5. Meanwhile Credit cards, Mortgage loans, andAuto loans still use the existing scorecards and hence same rating scale as previous year. Fordisclosure purposes, these portfolios were combined under ‘Other Retail Products’.
Below is the breakdown of the Group’s and the Parent Bank’s major retail portfolio loansexposure (outstanding balance and accrued interest receivable) by masterscale rating as ofDecember 31, 2020 and 2019:
Home LoansDecember 31, 2020
Amounts
Masterscale Stage 1 Stage 2 Stage 3 Total
1 P=– P=– P=– P=–
2 – 2,334 – 2,334
3 170,091 14,963 – 185,054
4 314,229 42,589 – 356,818
5 719,677 33,337 – 753,014
6 5,654,606 218,120 – 5,872,726
7 40,178,679 1,450,627 – 41,629,306
Default − – 7,949,927 7,949,927
P=47,037,282 P=1,761,970 P=7,949,927 P=56,749,179
December 31, 2019
Amounts
Masterscale Stage 1 Stage 2 Stage 3 Total
1 P=1,873,719 P=– P=– P=1,873,7192 5,847,222 – – 5,847,2223 6,639,245 – – 6,639,2454 25,249,877 – – 25,249,8775 2,591,691 – – 2,591,6916 3,331,346 268,952 – 3,600,2987 1,925,602 924,881 – 2,850,483
Default − – 2,141,689 2,141,689
P=47,458,702 P=1,193,833 P=2,141,689 P=50,794,224
Other Retail Products (Credit Cards, Mass Market Loans, and Auto Loans)
December 31, 2020
Amounts
Masterscale Stage 1 Stage 2 Stage 3 Total
1 P=2,871,498 P=440 P=− P=2,871,938
2 1,166,753 1,300 − 1,168,053
3 2,336,036 783 − 2,336,819
4 3,064,846 14,179 − 3,079,025
5 2,439,425 39,363 − 2,478,788
6 1,565,438 18,222 − 1,583,660
7 2,369,551 127,076 − 2,496,627
Default − − 2,902,499 2,902,499
P=15,813,547 P=201,363 P=2,902,499 P=18,917,409

Risk Management Objectives and Policies - 49 -
*SGVFSM005928*
December 31, 2019
Amounts
Masterscale Stage 1 Stage 2 Stage 3 Total
1 P=2,586,012 P=2 P=− P=2,586,0142 796,811 − − 796,8113 2,694,775 90 − 2,694,8654 3,991,774 2,518 − 3,994,2925 3,404,519 10,786 − 3,415,3056 3,027,415 79,336 − 3,106,7517 856,157 267,281 − 1,123,438
Default − − 2,935,755 2,935,755
P=17,357,463 P=360,013 P=2,935,755 P=20,653,231
CSB Salary Loans
For CSB salary loans, which relates to the DepEd loans of CSB, each borrower is assigned acredit score with E as minimal risk, D as low risk, C as moderate risk, B as average risk and A ashigh risk.
The description of each credit quality grouping for the credit scores is explained further asfollows:
High grade (minimal to low risk) - These are receivables which have a high probability ofcollection. The counterparty has the apparent ability to satisfy its obligation and the security onthe receivables is readily enforceable.
Standard grade (moderate to average risk) - These are receivables where collections are probabledue to the reputation and the financial ability of the counterparty to pay but with experience ofdefault.
Substandard (high risk) - Accounts classified as “Substandard” are individual credits or portionsthereof which appear to involve a substantial and unreasonable degree of risk to the Bankbecause of unfavorable record or unsatisfactory characteristics. There exists in such accounts thepossibility of future loss to the Bank unless given closer supervision. Those classified as“Substandard” must have a well-defined weakness or weaknesses that jeopardize theirliquidation. Such well-defined weaknesses may include adverse trends or development offinancial, managerial, economic or political nature, or a significant weakness in collateral.
Below is the breakdown of CSB’s salary loans exposure (outstanding balance and accruedinterest receivable) by credit score as of December 31, 2020 and 2019:
December 31, 2020
Amounts
Credit Score Stage 1 Stage 2 Stage 3 Total
D to E P=45,247,019 P=341,563 P=− P=45,588,582
B to C 46,215 111,706 − 157,921
A − 120,974 − 120,974
Default − − 2,051,036 2,051,036
P=45,293,234 P=574,243 P=2,051,036 P=47,918,513

Risk Management Objectives and Policies - 50 -
*SGVFSM005928*
December 31, 2019
Amounts
Credit Score Stage 1 Stage 2 Stage 3 Total
D to E P=42,618,304 P=− P=− P=42,618,304B to C − 181,216 − 181,216A − 67,551 − 67,551Default − − 1,436,076 1,436,076
P=42,618,304 P=248,767 P=1,436,076 P=44,303,147
Other receivables from customers
Other receivables from customers of the Group and the Parent Bank include small portfolios suchas, with respect to the Parent Bank, (i) personal loans, (ii) HR loans, (iii) bills purchase and(iv) customer liabilities under acceptance, (v) home credit receivables, and, with respect to thesubsidiaries, (i) personal loans, and (ii) motorcycle loans. Each of these products has establishedcredit risk guidelines and systems for managing credit risk across all businesses.
Exposure to credit risk is managed through regular analysis of the ability of borrowers andpotential borrowers to meet interest and capital repayment obligations and by changing theselending limits when appropriate.
Each product was risk rated using techniques appropriate to the Group’s and Parent Bank’s creditexperience. Such methods consider the payment history that are reflected in aging, delinquency,and/or change in rating. These provide the bases for the ECL stage determination.
The description of each groupings according to stage is explained further as follows:
Stage 1 - those that are considered current and up to 30 days past due, and based on change inrating, delinquencies and payment history, does not demonstrate significant increase in creditrisk.
Stage 2 - those that are considered more 30 days past due but does not demonstrate objectiveevidence of impairment as of reporting date, and, based on change in rating, delinquencies andpayment history, demonstrates significant increase in credit risk.
Stage 3 - Those that are considered default or demonstrates objective evidence of impairment asof reporting date.
Below is a summary as of December 31, 2020 and 2019 of the Group’s and Parent Bank’s otherreceivables from customers.
December 31, 2020
Amounts
Stage 1 Stage 2 Stage 3 Total
Group P=17,255,611 P=1,168,124 P=2,927,490 P=21,351,225
Parent Bank 7,791,314 120,023 663,586 8,574,923
December 31, 2019
Amounts
Stage 1 Stage 2 Stage 3 Total
Group P=23,430,905 P=573,550 P=2,371,494 P=26,375,949Parent Bank 16,291,795 42,469 1,145,970 17,480,234

Risk Management Objectives and Policies - 51 -
*SGVFSM005928*
Investments and PlacementsInvestments and placements include financial assets at amortized cost, debt financial assetsthrough other comprehensive income, due from BSP, interbank loans receivable and due fromother banks. Each has established credit risk guidelines and systems for managing credit riskacross all businesses.
Below is a breakdown of the Group’s and the Parent Bank’s investments and placements(outstanding balance and accrued interest receivable) by masterscale rating as of December 31,2020 and 2019:
Sovereign - GroupDecember 31, 2020
Amounts
Masterscale Stage 1 Stage 2 Stage 3 Total
1 P=7,180,893 P=− P=− P=7,180,893
2 ‒ ‒ ‒ ‒3 ‒ ‒ ‒ ‒4 6,907,611 ‒ ‒ 6,907,611
5 20,688,846 ‒ ‒ 20,688,846
6 11,562,861 ‒ ‒ 11,562,861
7 ‒ ‒ ‒ ‒8 2,315,919 ‒ ‒ 2,315,919
9 97,070,517 ‒ ‒ 97,070,517
10 2,942,981 ‒ ‒ 2,942,981
11 − − ‒ −12 7,877,205 681,565 ‒ 8,558,770
13 − − ‒ −14 ‒ 2,787,314 ‒ 2,787,314
15 ‒ ‒ ‒ ‒16 ‒ ‒ ‒ ‒Default ‒ ‒ ‒ ‒
P=156,546,833 P=3,468,879 P=‒ P=160,015,712
December 31, 2019
Amounts
Masterscale Stage 1 Stage 2 Stage 3 Total
1 P=5,107,419 P=− P=− P=5,107,4192 ‒ ‒ ‒ ‒3 ‒ ‒ ‒ ‒4 9,208,281 ‒ ‒ 9,208,2815 724,160 ‒ ‒ 724,1606 12,196,427 ‒ ‒ 12,196,4277 ‒ ‒ ‒ ‒8 4,007,025 ‒ ‒ 4,007,0259 100,118,913 ‒ ‒ 100,118,91310 ‒ ‒ ‒ ‒11 − 719,370 ‒ 719,37012 8,890,002 ‒ ‒ 8,890,00213 − 2,939,437 ‒ 2,939,43714 ‒ ‒ ‒ ‒15 ‒ ‒ ‒ ‒16 ‒ ‒ ‒ ‒Default ‒ ‒ ‒ ‒
P=140,252,227 P=3,658,807 P=‒ P=143,911,034

Risk Management Objectives and Policies - 52 -
*SGVFSM005928*
Corporate – GroupDecember 31, 2020
Amounts
Masterscale Stage 1 Stage 2 Stage 3 Total
1 P=− P=− P=− P=−2 49,299,628 − − 49,299,628
3 17,560,176 − − 17,560,176
4 466,863 − − 466,863
5 102,481,183 − − 102,481,183
6 16,538,843 − − 16,538,843
7 154,698 − − 154,698
8 10,729,439 − − 10,729,439
9 25 − − 25
10 1,700,043 − − 1,700,043
11 2,567,320 − − 2,567,320
12 − − − −13 − − − −Default − − − −
P=201,498,218 P=− P=− P=201,498,218
December 31, 2019
Amounts
Masterscale Stage 1 Stage 2 Stage 3 Total
1 P=52,934 P=− P=− P=52,9342 55,769,526 − − 55,769,5263 − − − −4 18,709,865 − − 18,709,8655 9,664,185 − − 9,664,1856 21,162,758 − − 21,162,7587 67,945,332 − − 67,945,3328 663 − − 6639 27,607 − − 27,60710 55,454 − − 55,454
11 P=− P=− P=− P=−12 − − − −13 45,434 − − 45,434Default − − − −
P=173,433,758 P=− P=− P=173,433,758
Sovereign – Parent BankDecember 31, 2020
Amounts
Masterscale Stage 1 Stage 2 Stage 3 Total
1 P=7,180,893 P=− P=− P=7,180,893
2 ‒ ‒ ‒ ‒3 ‒ ‒ ‒ ‒4 6,907,611 ‒ ‒ 6,907,611
5 686,510 ‒ ‒ 686,510
6 11,562,861 ‒ ‒ 11,562,861
7 ‒ ‒ ‒ ‒8 2,315,919 ‒ ‒ 2,315,919
9 94,430,661 ‒ ‒ 94,430,661
10 2,942,981 ‒ ‒ 2,942,981
11 − − ‒ −

Risk Management Objectives and Policies - 53 -
*SGVFSM005928*
December 31, 2020
Amounts
Masterscale Stage 1 Stage 2 Stage 3 Total
12 P=7,877,205 P=681,565 P=‒ P=8,558,770
13 − − ‒ −14 ‒ 2,787,314 ‒ 2,787,314
15 ‒ ‒ ‒ ‒16 ‒ ‒ ‒ ‒Default ‒ ‒ ‒ ‒
P=133,904,641 P=3,468,879 P=‒ P=137,373,520
December 31, 2019
Amounts
Masterscale Stage 1 Stage 2 Stage 3 Total
1 P=5,107,419 P=− P=− P=5,107,4192 ‒ ‒ ‒ ‒3 ‒ ‒ ‒ ‒4 9,208,281 ‒ ‒ 9,208,2815 724,160 ‒ ‒ 724,1606 12,196,427 ‒ ‒ 12,196,4277 ‒ ‒ ‒ ‒8 4,007,025 ‒ ‒ 4,007,0259 94,167,518 ‒ ‒ 94,167,51810 ‒ ‒ ‒ ‒11 − 719,370 ‒ 719,37012 8,890,002 ‒ ‒ 8,890,00213 − 2,939,437 ‒ 2,939,43714 ‒ ‒ ‒ ‒15 ‒ ‒ ‒ ‒16 ‒ ‒ ‒ ‒Default ‒ ‒ ‒ ‒
P=134,300,832 P=3,658,807 P=‒ P=137,959,639
Corporate – Parent BankDecember 31, 2020
Amounts
Masterscale Stage 1 Stage 2 Stage 3 Total
1 P=− P=− P=− P=−2 49,299,628 − − 49,299,628
3 17,560,176 − − 17,560,176
4 466,863 − − 466,863
5 98,461,904 − − 98,461,904
6 16,538,843 − − 16,538,843
7 154,698 − − 154,698
8 10,729,439 − − 10,729,439
9 25 − − 25
10 1,700,043 − − 1,700,043
11 2,567,320 − − 2,567,320
12 − − − −13 − − − −Default − − − −
P=197,478,939 P=− P=− P=197,478,939

Risk Management Objectives and Policies - 54 -
*SGVFSM005928*
December 31, 2019
Amounts
Masterscale Stage 1 Stage 2 Stage 3 Total
1 P=52,934 P=− P=− P=52,9342 55,769,526 − − 55,769,5263 − − − −4 18,709,865 − − 18,709,8655 7,481,020 − − 7,481,0206 21,162,758 − − 21,162,7587 67,945,332 − − 67,945,3328 663 − − 6639 27,607 − − 27,60710 55,454 − − 55,45411 − − − −12 − − − −13 45,434 − − 45,434Default − − − −
P=171,250,593 P=− P=− P=171,250,593
Analysis of movements of gross carrying amountsMovements in 2020 and 2019 for total receivables from customers follow. The balancespresented include the related accrued interest receivables:
Group2020
Stage 1 Stage 2 Stage 3 Total
Balances at beginning of year P=343,745,565 P=2,387,632 P=11,675,758 P=357,808,955
Newly originated assets that remained inStage 1 as at December 31, 2020 123,248,369 − − 123,248,369
Newly originated assets that moved toStage 2 and Stage 3 as atDecember 31, 2020 − 2,554,867 1,992,551 4,547,418
Effects of business combination(see Note 15) 2,158,105 6,453 41,321 2,205,879
Movements in receivable balance(excluding write-offs) (156,406,473) (1,798,042) 1,416,635 (156,787,880)
Amounts written-off − − (4,880,641) (4,880,641)
Transfers to Stage 1 918,573 (279,228) (639,345) −Transfers to Stage 2 (13,434,159) 13,489,708 (55,549) −Transfers to Stage 3 (9,540,719) (1,214,040) 10,754,759 −Balance at end of year P=290,689,261 P=15,147,350 P=20,305,489 P=326,142,100
2019
Stage 1 Stage 2 Stage 3 Total
Balances at beginning of year P=294,464,999 P=1,234,832 P=11,899,014 P=307,598,845Newly originated assets that remained in
Stage 1 as at December 31, 2019 199,705,775 − − 199,705,775Newly originated assets that moved to
Stage 2 and Stage 3 as atDecember 31, 2019 − 516,559 1,629,028 2,145,587
Movements in receivable balance(excluding write-offs) (147,651,225) 125,453 (1,789,261) (149,315,033)
Amounts written-off − − (2,326,219) (2,326,219)Transfers to Stage 1 927,098 (266,982) (660,116) −Transfers to Stage 2 (1,389,907) 1,539,728 (149,821) −Transfers to Stage 3 (2,333,136) (761,957) 3,095,093 −Balance at end of year P=343,723,604 P=2,387,633 P=11,697,718 P=357,808,955

Risk Management Objectives and Policies - 55 -
*SGVFSM005928*
Parent Bank2020
Stage 1 Stage 2 Stage 3 Total
Balances at beginning of year P=293,988,151 P=1,607,784 P=9,014,158 P=304,610,093
Newly originated assets that remained inStage 1 as at December 31, 2020 90,902,328 − − 90,902,328
Newly originated assets that moved toStage 2 and Stage 3 as atDecember 31, 2020 − 2,469,468 1,959,239 4,428,707
Movements in receivable balance(excluding write-offs) (126,359,237) (2,645,913) (705,728) (129,710,878)
Amounts written-off − − (4,782,965) (4,782,965)
Transfers to Stage 1 362,979 (182,235) (180,744) −Transfers to Stage 2 (13,433,644) 13,484,627 (50,983) −Transfers to Stage 3 (9,528,847) (1,208,725) 10,737,572 −Balance at end of year P=235,931,730 P=13,525,006 P=15,990,549 P=265,447,285
2019
Stage 1 Stage 2 Stage 3 Total
Balances at beginning of year P=240,667,042 P=509,451 P=8,646,282 P=249,822,775Newly originated assets that remained in
Stage 1 as at December 31, 2019 153,290,357 − − 153,290,357Newly originated assets that moved to
Stage 2 and Stage 3 as atDecember 31, 2019 − 135,927 1,319,229 1,455,156
Movements in receivable balance(excluding write-offs) (96,726,638) (171,285) (948,706) (97,846,629)
Amounts written-off − − (2,111,566) (2,111,566)Transfers to Stage 1 337,348 (128,891) (208,457) −Transfers to Stage 2 (1,374,543) 1,431,941 (57,398) −Transfers to Stage 3 (2,205,415) (169,359) 2,374,774 −Balance at end of year P=293,988,151 P=1,607,784 P=9,014,158 P=304,610,093
The breakdown of movements in 2020 and 2019 for total receivables from customers follow:
Corporate Loans - Group and Parent Bank
2020
Stage 1 Stage 2 Stage 3 Total
Balances at beginning of year P=148,535,434 P=− P=87,569 P=148,623,003
Newly originated assets thatremained in Stage 1 as atDecember 31, 2020 22,584,311 − − 22,584,311
Newly originated assets that moved toStage 2 and Stage 3 as atDecember 31, 2020 − 237,675 149,252 386,927
Movements in receivable balance(excluding write-offs) (52,401,863) (2,329,494) (76,952) (54,808,309)
Transfers to Stage 2 (11,325,666) 11,325,666 − −Transfers to Stage 3 (1,057,108) − 1,057,108 −Amounts written off − − (49,495) (49,495)
Balance at end of year P=106,335,108 P=9,233,847 P=1,167,482 P=116,736,437

Risk Management Objectives and Policies - 56 -
*SGVFSM005928*
2019
Stage 1 Stage 2 Stage 3 Total
Balances at beginning of year P=128,983,106 P=− P=80,945 P=129,064,051Newly originated assets that
remained in Stage 1 as atDecember 31, 2019 65,803,649 − − 65,803,649
Newly originated assets that moved toStage 2 and Stage 3 as atDecember 31, 2019 − − 8,625 8,625
Movements in receivable balance(excluding write-offs) (46,237,801) − (15,521) (46,253,322)
Transfers to Stage 3 (13,520) − 13,520 −Balance at end of year P=148,535,434 P=− P=87,569 P=148,623,003
In 2019 there were no write-offs of corporate loans.
Commercial Loans - Group and Parent Bank
2020
Stage 1 Stage 2 Stage 3 Total
Balances at beginning of year P=64,344,757 P=11,469 P=2,703,175 P=67,059,401
Newly originated assets thatremained in Stage 1 as atDecember 31, 2020 48,664,247 − − 48,664,247
Newly originated assets that moved toStage 2 and Stage 3 as atDecember 31, 2020 − 1,968,142 806,375 2,774,517
Movements in receivable balance(excluding write-offs) (52,317,599) (40,435) (365,945) (52,723,979)
Transfers to Stage 2 (280,096) 280,096 − −Transfers to Stage 3 (1,456,830) (11,469) 1,468,299 −Amounts written-off − − (1,304,849) (1,304,849)
Balances at end of year P=58,954,479 P=2,207,803 P=3,307,055 P=64,469,337
2019
Stage 1 Stage 2 Stage 3 Total
Balances at beginning of year P=47,932,205 P=13,931 P=2,323,891 P=50,270,027Newly originated assets that
remained in Stage 1 as atDecember 31, 2019 57,079,204 − − 57,079,204
Newly originated assets that movedto Stage 2 and Stage 3 as atDecember 31, 2019 − − 431,281 431,281
Movements in receivable balance(excluding write-offs) (40,601,448) (9,473) (110,190) (40,721,111)
Transfers to Stage 1 19,079 (4,752) (14,327) −Transfers to Stage 2 − 13,124 (13,124) −Transfers to Stage 3 (84,283) (1,361) 85,644 −Balances at end of year P=64,344,757 P=11,469 P=2,703,175 P=67,059,401
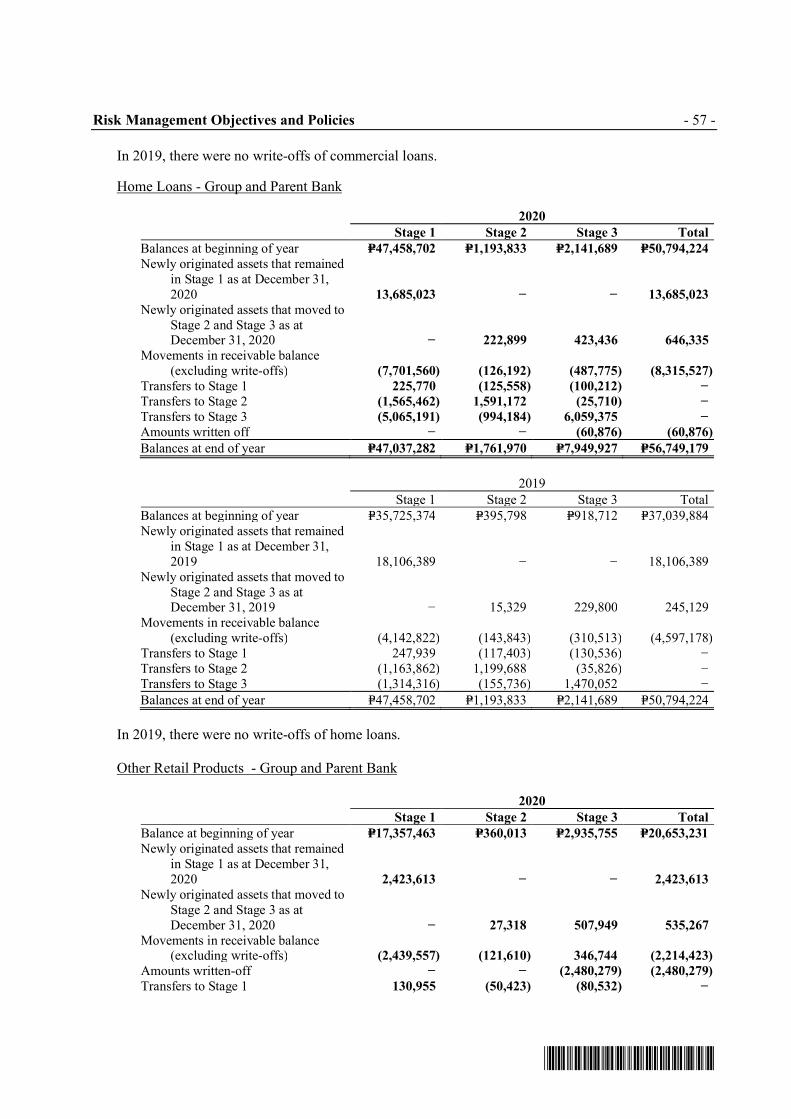
Risk Management Objectives and Policies - 57 -
*SGVFSM005928*
In 2019, there were no write-offs of commercial loans.
Home Loans - Group and Parent Bank
2020
Stage 1 Stage 2 Stage 3 Total
Balances at beginning of year P=47,458,702 P=1,193,833 P=2,141,689 P=50,794,224
Newly originated assets that remainedin Stage 1 as at December 31,2020 13,685,023 − − 13,685,023
Newly originated assets that moved toStage 2 and Stage 3 as atDecember 31, 2020 − 222,899 423,436 646,335
Movements in receivable balance(excluding write-offs) (7,701,560) (126,192) (487,775) (8,315,527)
Transfers to Stage 1 225,770 (125,558) (100,212) −Transfers to Stage 2 (1,565,462) 1,591,172 (25,710) −Transfers to Stage 3 (5,065,191) (994,184) 6,059,375 −Amounts written off − − (60,876) (60,876)
Balances at end of year P=47,037,282 P=1,761,970 P=7,949,927 P=56,749,179
2019
Stage 1 Stage 2 Stage 3 Total
Balances at beginning of year P=35,725,374 P=395,798 P=918,712 P=37,039,884Newly originated assets that remained
in Stage 1 as at December 31,2019 18,106,389 − − 18,106,389
Newly originated assets that moved toStage 2 and Stage 3 as atDecember 31, 2019 − 15,329 229,800 245,129
Movements in receivable balance(excluding write-offs) (4,142,822) (143,843) (310,513) (4,597,178)
Transfers to Stage 1 247,939 (117,403) (130,536) −Transfers to Stage 2 (1,163,862) 1,199,688 (35,826) −Transfers to Stage 3 (1,314,316) (155,736) 1,470,052 −Balances at end of year P=47,458,702 P=1,193,833 P=2,141,689 P=50,794,224
In 2019, there were no write-offs of home loans.
Other Retail Products - Group and Parent Bank
2020
Stage 1 Stage 2 Stage 3 Total
Balance at beginning of year P=17,357,463 P=360,013 P=2,935,755 P=20,653,231
Newly originated assets that remainedin Stage 1 as at December 31,2020 2,423,613 − − 2,423,613
Newly originated assets that moved toStage 2 and Stage 3 as atDecember 31, 2020 − 27,318 507,949 535,267
Movements in receivable balance(excluding write-offs) (2,439,557) (121,610) 346,744 (2,214,423)
Amounts written-off − − (2,480,279) (2,480,279)
Transfers to Stage 1 130,955 (50,423) (80,532) −

Risk Management Objectives and Policies - 58 -
*SGVFSM005928*
2020
Stage 1 Stage 2 Stage 3 Total
Transfers to Stage 2 (P=143,577) P=163,312 (P=19,735) P=−Transfers to Stage 3 (1,515,350) (177,247) 1,692,597 −Balance at end of year P=15,813,547 P=201,363 P=2,902,499 P=18,917,409
2019
Stage 1 Stage 2 Stage 3 Total
Balance at beginning of year P=15,142,559 P=57,245 P=2,786,168 P=17,985,972Newly originated assets that remained
in Stage 1 as at December 31,2019 4,232,182 − − 4,232,182
Newly originated assets that moved toStage 2 and Stage 3 as atDecember 31, 2019 − 97,139 587,224 684,363
Movements in receivable balance(excluding write-offs) (1,114,759) 10,207 (345,132) (1,449,684)
Amounts written-off − − (799,602) (799,602)Transfers to Stage 1 68,447 (6,736) (61,711) −Transfers to Stage 2 (203,323) 207,558 (4,235) −Transfers to Stage 3 (767,643) (5,400) 773,043 −Balance at end of year P=17,357,463 P=360,013 P=2,935,755 P=20,653,231
CSB Salary Loans - Group
2020
Stage 1 Stage 2 Stage 3 Total
Balance at beginning of year P=42,618,304 P=248,767 P=1,436,076 P=44,303,147
Newly originated assets that remainedin Stage 1 as at December 31,2020 32,346,041 − − 32,346,041
Newly originated assets that moved toStage 2 and Stage 3 as atDecember 31, 2020 − 85,399 33,312 118,711
Movements in receivable balance(excluding write-offs) (30,214,318) 337,304 1,125,304 (28,751,710)
Amounts written-off − − (97,676) (97,676)
Transfers to Stage 1 555,594 (96,993) (458,601) −Transfers to Stage 2 (515) 5,081 (4,566) −Transfers to Stage 3 (11,872) (5,315) 17,187 −Balance at end of year P=45,293,234 P=574,243 P=2,051,036 P=47,918,513
2019
Stage 1 Stage 2 Stage 3 Total
Balance at beginning of year P=45,059,885 P=245,386 P=1,620,327 P=46,925,598Newly originated assets that remained
in Stage 1 as at December 31,2019 41,790,387 − − 41,790,387
Newly originated assets that moved toStage 2 and Stage 3 as atDecember 31, 2019 − 148,339 35,313 183,652
Movements in receivable balance(excluding write-offs) (44,810,184) (1,098,215) 1,403,350 (44,505,049)

Risk Management Objectives and Policies - 59 -
*SGVFSM005928*
2019
Stage 1 Stage 2 Stage 3 TotalAmounts written-off P=− P=− (P=91,441) (P=91,441)Transfers to Stage 1 581,952 (137,951) (444,001) −Transfers to Stage 2 (869) 92,889 (92,020) −Transfers to Stage 3 (2,867) 998,319 (995,452) −Balance at end of year P=42,618,304 P=248,767 P=1,436,076 P=44,303,147
Other Receivables from CustomersOther receivables from customers include HR loans, quick loans and home credit receivables.
Group
2020
Stage 1 Stage 2 Stage 3 Total
Balance at beginning of year P=23,430,905 P=573,550 P=2,371,494 P=26,375,949
Newly originated assets that remained inStage 1 as at December 31, 2020 3,545,134 − − 3,545,134
Newly originated assets that moved toStage 2 and Stage 3 as atDecember 31, 2020 − 13,434 72,227 85,661
Effects of business combination (Note 15) 2,158,105 6,453 41,321 2,205,879
Movements in receivable balance(excluding write-offs) (11,331,576) 482,385 875,259 (9,973,932)
Amounts written-off − − (887,466) (887,466)
Transfers to Stage 1 6,254 (6,254) − −Transfers to Stage 2 (118,843) 124,381 (5,538) −Transfers to Stage 3 (434,368) (25,825) 460,193 −Balance at end of year P=17,255,611 P=1,168,124 P=2,927,490 P=21,351,225
2019
Stage 1 Stage 2 Stage 3 Total
Balance at beginning of year P=21,621,870 P=522,472 P=4,168,971 P= 26,313,313Newly originated assets that remained in
Stage 1 as at December 31, 2019 12,693,964 − − 12,693,964Newly originated assets that moved to
Stage 2 and Stage 3 as atDecember 31, 2019 − 255,752 336,785 592,537
Movements in receivable balance(excluding write-offs) (10,722,249) 1,366,775 (2,433,215) (11,788,689)
Amounts written-off − − (1,435,176) (1,435,176)Transfers to Stage 1 9,681 (140) (9,541) −Transfers to Stage 2 (21,853) 26,470 (4,617) −Transfers to Stage 3 (150,508) (1,597,779) 1,748,287 −Balance at end of year P=23,430,905 P=573,550 P=2,371,494 P= 26,375,949
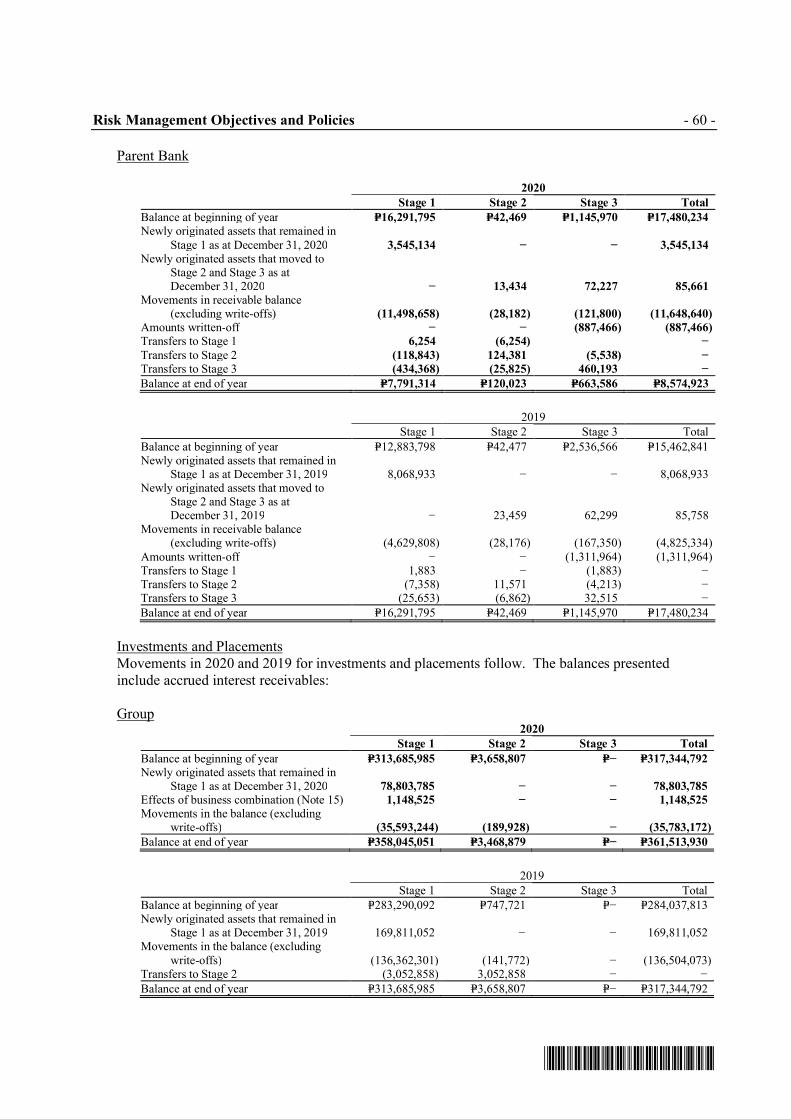
Risk Management Objectives and Policies - 60 -
*SGVFSM005928*
Parent Bank
2020
Stage 1 Stage 2 Stage 3 Total
Balance at beginning of year P=16,291,795 P=42,469 P=1,145,970 P=17,480,234
Newly originated assets that remained inStage 1 as at December 31, 2020 3,545,134 − − 3,545,134
Newly originated assets that moved toStage 2 and Stage 3 as atDecember 31, 2020 − 13,434 72,227 85,661
Movements in receivable balance(excluding write-offs) (11,498,658) (28,182) (121,800) (11,648,640)
Amounts written-off − − (887,466) (887,466)
Transfers to Stage 1 6,254 (6,254) −Transfers to Stage 2 (118,843) 124,381 (5,538) −Transfers to Stage 3 (434,368) (25,825) 460,193 −Balance at end of year P=7,791,314 P=120,023 P=663,586 P=8,574,923
2019
Stage 1 Stage 2 Stage 3 Total
Balance at beginning of year P=12,883,798 P=42,477 P=2,536,566 P=15,462,841Newly originated assets that remained in
Stage 1 as at December 31, 2019 8,068,933 − − 8,068,933Newly originated assets that moved to
Stage 2 and Stage 3 as atDecember 31, 2019 − 23,459 62,299 85,758
Movements in receivable balance(excluding write-offs) (4,629,808) (28,176) (167,350) (4,825,334)
Amounts written-off − − (1,311,964) (1,311,964)Transfers to Stage 1 1,883 − (1,883) −Transfers to Stage 2 (7,358) 11,571 (4,213) −Transfers to Stage 3 (25,653) (6,862) 32,515 −Balance at end of year P=16,291,795 P=42,469 P=1,145,970 P=17,480,234
Investments and PlacementsMovements in 2020 and 2019 for investments and placements follow. The balances presentedinclude accrued interest receivables:
Group2020
Stage 1 Stage 2 Stage 3 Total
Balance at beginning of year P=313,685,985 P=3,658,807 P=− P=317,344,792
Newly originated assets that remained inStage 1 as at December 31, 2020 78,803,785 − − 78,803,785
Effects of business combination (Note 15) 1,148,525 − − 1,148,525
Movements in the balance (excludingwrite-offs) (35,593,244) (189,928) − (35,783,172)
Balance at end of year P=358,045,051 P=3,468,879 P=− P=361,513,930
2019
Stage 1 Stage 2 Stage 3 Total
Balance at beginning of year P=283,290,092 P=747,721 P=− P=284,037,813Newly originated assets that remained in
Stage 1 as at December 31, 2019 169,811,052 − − 169,811,052Movements in the balance (excluding
write-offs) (136,362,301) (141,772) − (136,504,073)Transfers to Stage 2 (3,052,858) 3,052,858 − −Balance at end of year P=313,685,985 P=3,658,807 P=− P=317,344,792

Risk Management Objectives and Policies - 61 -
*SGVFSM005928*
Parent2020
Stage 1 Stage 2 Stage 3 Total
Balance at beginning of year P=305,551,425 P=3,658,807 P=− P=309,210,232
Newly originated assets that remained inStage 1 as at December 31, 2020 76,492,061 − − 76,492,061
Movements in the balance (excludingwrite-offs) (50,659,906) (189,928) − (50,849,834)
Balance at end of year P=331,383,580 P=3,468,879 P=− P=334,852,459
2019
Stage 1 Stage 2 Stage 3 Total
Balance at beginning of year P=276,339,956 P=747,721 P=− P=277,087,677Newly originated assets that remained in
Stage 1 as at December 31, 2019 169,811,052 − − 169,811,052Movements in the balance (excluding
write-offs) (137,546,725) (141,772) − (137,688,497)Transfers to Stage 2 (3,052,858) 3,052,858 − −Balance at end of year P=305,551,425 P=3,658,807 P=− P=309,210,232
In 2020, there were no transfers between stages. In 2020 and 2019, there were no write-offs ofinvestments and placements.
ModificationIn certain circumstances, the Group modifies the original terms and conditions of a credit exposureto form a new loan agreement or payment schedule. The modifications can be given depending onthe borrower’s or counterparty’s current or expected financial difficulty. The modifications mayinclude, but are not limited to, change in interest rate and terms, principal amount, maturity date,date and amount of periodic payments and accrual of interest and charges.
On March 24, 2020, Republic Act No. 11469 or the “Bayanihan to Heal as One Act” (Bayanihan1) was enacted declaring a state of national emergency over the entire country to control thespread of the Coronavirus Disease 2019 (COVID-19). Among the provisions of Bayanihan 1 isthe implementation of a 30-day grace period for all loans with principal and/or interest fallingdue within the period of the Enhanced Community Quarantine without incurring interest oninterest, on penalties, fees and other charges. Further, on September 11, 2020, Republic Act No.11494 or the “Bayanihan to Recover as One Act” (Bayanihan 2) was enacted and provided forthe implementation of a one-time 60-day grace period to be granted for the payment of allexisting, current and outstanding loans falling due, or any part thereof, on or before December31, 2020, without incurring interest on interest, penalties, fees and other charges, therebyextending the maturity of said loans. In addition, Bayanihan 2 allows loans and interest dueduring the Bayanihan 2 period to be settled on a staggered basis without interest on interests,penalties, fees or other charges until December 31, 2020 or as may be agreed upon by bothparties. Furthermore, the Bank provided additional grace period to the borrowers.
The impact of loan modifications as a result of the Bayanihan 1 and Bayanihan 2 Acts amountedto a loss of P=506.70 million for the Group and P=377.08 million for the Parent Company. For theyear ended December 31, 2020, the net impact of the loan modifications (i.e., after subsequentaccretion of the modified loans) amounted to a loss of P=423.87 million for the Group andP=346.01 million for the Parent Company.

Risk Management Objectives and Policies - 62 -
*SGVFSM005928*
Collateral Held as Security and Other Credit EnhancementsThe Group holds collateral against loans and other receivables from customers in order tomitigate risk. The collateral may be in the form of mortgages over real estate property, chattels,inventory, cash, securities and/or guarantees. The Bank regularly monitors and updates the fairvalue of the collateral depending on the type of credit exposure. Estimates of the fair value ofcollateral are considered in the review and assessment of the adequacy of allowance for creditlosses. In general, the Bank does not require collateral for loans and advances to other banks,except when securities are held as part of reverse repurchase agreements.
An estimate of the fair value of collateral and other security enhancements held by the Group andthe Parent Bank against loans and other receivables as of December 31, 2020 and 2019 is shownbelow:
Group
Exposure beforecollateral Property Deposits Others
Exposure afterfinancial effect of
collateral
As of December 31, 2020 P=352,583,919 P=31,294,142 P=658,275 P=15,629,399 P=305,002,103
As of December 31, 2019 P=402,180,710 P=34,007,524 P=653,388 P=12,932,426 P=354,587,372
Parent Bank
Exposure beforecollateral Property Deposits Others
Exposure afterfinancial effect of
collateral
As of December 31, 2020 P=282,176,601 P=29,642,564 P=619,434 P=14,801,878 P=237,112,725
As of December 31, 2019 P=338,572,248 P=33,117,833 P=533,150 P=12,406,131 P=292,515,134
The Group’s manner of disposing the collateral for impaired loans and receivables is normallythrough sale of the assets after foreclosure proceedings have taken place.
Liquidity RiskLiquidity risk is the risk that there are insufficient funds available to adequately meet the creditdemands of the Group’s customers and repay deposits on maturity. The ALCO and the Treasurerof the Group ensure that sufficient liquid assets are available to meet short-term funding andregulatory requirements. Liquidity is monitored by the Group on a daily basis and under stressedsituations. A contingency plan is formulated to set out the amount and the sources of funds (suchas unused credit facilities) that are available to the Group and the circumstances under which theGroup may use such funds.
Liquidity ratios are used to monitor and manage the Bank’s liquidity. The MRC approves theratios to be used for monitoring the performance of the Bank and for mapping out areas whereimprovements are needed. These ratios include Liquid Assets to Deposits Ratio, Liquidity ratio,Leverage Ratio and Intermediation Ratio. In June 2020, the MRC approved to set the peso liquidassets to deposits ratio limit to automatically be consistent with the reserve requirement ratio forpeso deposits.
The Group also manages its liquidity risks through the use of a Maximum Cumulative Outflow(MCO) limit which regulates the outflow of cash on a cumulative basis and on a tenor basis. Tomaintain sufficient liquidity in foreign currencies, the Group has also set an MCO limit forcertain designated foreign currencies. The MCO limits are endorsed by the MRC and approvedby the BOD. In June 2020, the BOD approved to change the MCO limits, providing separatelimits for short term (generally less than 30 days) and medium term tenor (from 30 days to oneyear). Previously, the Bank has single limit for all tenors.

Risk Management Objectives and Policies - 63 -
*SGVFSM005928*
The table below shows the financial assets and financial liabilities’ liquidity information whichincludes coupon cash flows categorized based on the contractual date on which the asset will berealized and the liability will be settled. For financial assets at FVTPL, the analysis into maturitygrouping is based on the remaining period from the end of the reporting period to the expecteddate the assets will be realized (amounts in millions).
Group
2020
On
Demand
Up to
1 month
1 to 3
Months
3 to 6
Months
6 to 12
Months
Beyond
1 year Total
Financial assets
Cash and other cash items P=8,958 P=‒ P=‒ P=‒ P=‒ P=‒ P=8,958
Due from BSP 43,972 59,913 ‒ ‒ ‒ ‒ 103,885
Due from other banks 68,532 ‒ ‒ ‒ ‒ ‒ 68,532
Interbank loans receivable ‒ ‒ ‒ ‒ ‒ ‒ ‒121,462 59,913 ‒ ‒ ‒ ‒ 181,375
Financial assets at FVTPLDerivative assets ‒ 145 60 196 213 573 1,187
Debt securities ‒ 15,050 ‒ ‒ ‒ ‒ 15,050
Equity securities ‒ 2,754 ‒ ‒ ‒ ‒ 2,754
Financial assets at FVOCI
Debt securities ‒ 21,830 18,032 ‒ 20 162 40,044
Equity securities ‒ ‒ ‒ ‒ ‒ 42 42
Financial assets at amortizedcost ‒ 4,982 1,579 1,539 4,636 235,912 248,648
‒ 44,761 19,671 1,735 4,869 236,689 307,725
Loans and other receivables 145 67,357 35,251 21,919 30,426 230,262 385,360
Other receivables ‒ ‒ ‒ ‒ ‒ ‒ ‒Accounts receivable ‒ ‒ ‒ ‒ ‒ 5,416 5,416
Accrued interest receivable ‒ 6,912 ‒ ‒ ‒ ‒ 6,912
Sales contract receivable ‒ 51 90 99 134 2,052 2,426
145 74,320 35,341 22,018 30,560 237,730 400,114
Other financial assets
Returned checks and othercash items ‒ 249 ‒ ‒ ‒ ‒ 249
Sundry debits ‒ (13) ‒ ‒ ‒ ‒ (13)
‒ 236 ‒ ‒ ‒ ‒ 236
Total assets P=121,607 P=179,230 P=55,012 P=23,753 P=35,429 P=474,419 P=889,450
Non-derivative liabilities
Deposit liabilitiesDemand P=159,784 P=‒ P=‒ P=‒ P=‒ P=‒ P=159,784
Savings 98,958 ‒ ‒ ‒ ‒ ‒ 98,958
Time and LTNCD 1,718 155,721 74,158 6,823 4,046 33,140 275,606
260,460 155,721 74,158 6,823 4,046 33,140 534,348
Bills payable ‒ 15,695 13,350 5,719 4,083 16,583 55,430
Notes and bonds payable ‒ ‒ 239 826 1,073 64,146 66,284
Manager’s checks 6,925 ‒ ‒ ‒ ‒ ‒ 6,925
Accrued interest payable ‒ 758 ‒ ‒ ‒ ‒ 758
Accounts payable ‒ 5,028 ‒ ‒ ‒ ‒ 5,028
Other liabilities ‒ 9,323 ‒ ‒ ‒ 1,081 10,404
267,385 186,525 87,747 13,368 9,202 114,950 679,177
Derivative Liabilities ‒ 73 123 205 261 484 1,146
Total liabilities P=267,385 P=186,598 P=87,870 P=13,573 P=9,463 P=115,434 P=680,323
Group
2019
OnDemand
Up to1 month
1 to 3Months
3 to 6Months
6 to 12Months
Beyond1 year Total
Financial assets
Cash and other cash items P=8,581 P=‒ P=‒ P=‒ P=‒ P=‒ P=8,581 Due from BSP 73,750 ‒ ‒ ‒ ‒ ‒ 73,750
Due from other banks 73,676 ‒ ‒ ‒ ‒ ‒ 73,676Interbank loans receivable ‒ 213 ‒ ‒ ‒ ‒ 213
156,007 213 ‒ ‒ ‒ ‒ 156,220
Financial assets at FVTPLDerivative assets ‒ 124 94 15 ‒ 173 406
Debt securities ‒ 4,760 ‒ ‒ ‒ ‒ 4,760
Equity securities ‒ 2,700 ‒ ‒ ‒ ‒ 2,700Financial assets at FVOCI
Debt securities ‒ 2,625 ‒ 2 95 4,138 6,860Equity securities ‒ ‒ ‒ ‒ ‒ 42 42
Financial assets at amortizedcost ‒ 1,255 1,135 1,759 4,149 285,537 293,835
‒ 11,464 1,229 1,776 4,244 289,890 308,603

Risk Management Objectives and Policies - 64 -
*SGVFSM005928*
Group
2019
OnDemand
Up to1 month
1 to 3Months
3 to 6Months
6 to 12Months
Beyond1 year Total
Loans and other receivables P=43 P=85,182 P=33,861 P=30,502 P=32,866 P=265,844 P=448,298 Other receivables ‒ ‒ ‒ ‒ ‒ ‒ ‒
Accounts receivable ‒ ‒ ‒ ‒ ‒ 6,122 6,122Accrued interest receivable ‒ 4,981 ‒ ‒ ‒ ‒ 4,981
Sales contract receivable ‒ 26 51 71 128 2,132 2,408
43 90,189 33,912 30,573 32,994 274,098 461,809
Other financial assets Returned checks and other
cash items ‒ 399 ‒ ‒ ‒ ‒ 399Sundry debits ‒ 29 ‒ ‒ ‒ ‒ 29
‒ 428 ‒ ‒ ‒ ‒ 428
Total assets P=156,050 P=102,294 P=35,141 P=32,349 P=37,238 P=563,988 P=927,060
Non-derivative liabilities
Deposit liabilitiesDemand P=136,289 P=‒ P=‒ P=‒ P=‒ P=‒ P=136,289Savings 73,727 ‒ ‒ ‒ ‒ ‒ 73,727
Time and LTNCD 311 173,298 68,266 3,272 2,540 30,233 277,920
210,327 173,298 68,266 3,272 2,540 30,233 487,936Bills payable ‒ 56,578 36,944 488 8,995 3,669 106,674Notes and bonds payable ‒ ‒ 7,491 646 11,741 27,139 47,017Manager’s checks 8,536 ‒ ‒ ‒ ‒ ‒ 8,536Accrued interest payable ‒ 1,214 ‒ ‒ ‒ ‒ 1,214
Accounts payable ‒ 8,106 ‒ ‒ ‒ ‒ 8,106
Other liabilities ‒ 8,301 ‒ ‒ ‒ 1,081 9,382
218,863 247,497 112,701 4,406 23,276 62,122 668,865
Derivative Liabilities ‒ 169 117 26 3 115 430
Total liabilities P=218,863 P=247,666 P=112,818 P=4,432 P=23,279 P=62,237 P=669,295
Parent Bank
2020
On
Demand
Up to
1 month
1 to 3
Months
3 to 6
Months
6 to 12
Months
Beyond
1 year Total
Financial assets
Cash and other cash items P=7,815 P=‒ P=‒ P=‒ P=‒ P=‒ P=7,815
Due from BSP 42,167 41,711 ‒ ‒ ‒ ‒ 83,878
Due from other banks 64,764 ‒ ‒ ‒ ‒ ‒ 64,764
114,746 41,711 ‒ ‒ ‒ ‒ 156,457
Financial assets at FVTPLDerivative assets ‒ 145 60 196 213 573 1187
Debt securities ‒ 15,012 ‒ ‒ ‒ ‒ 15,012
Equity securities ‒ 2,716 ‒ ‒ ‒ ‒ 2,716
Financial assets at FVOCI
Debt securities ‒ 21,829 18,032 ‒ ‒ ‒ 39,861
Equity securities ‒ ‒ ‒ ‒ ‒ 42 42
Financial assets at amortizedcost ‒ 4,980 1,578 1,448 4,636 231,922 244,564
‒ 44,682 19,670 1,644 4,849 232,537 303,382
Loans and other receivables ‒ 60,447 34,229 20,241 25,145 177,032 317,094
Other receivablesAccounts receivable ‒ ‒ ‒ ‒ ‒ 2,251 2,251
Accrued interest receivable ‒ 5,591 ‒ ‒ ‒ ‒ 5,591
Sales contract receivable ‒ 42 84 86 125 2,006 2,343
‒ 66,080 34,313 20,327 25,270 181,289 327,279
Other financial assets Returned checks and other
cash itemsP=‒ P=249 P=‒ P=‒ P=‒ P=‒ P=249
Sundry debits ‒ 11 ‒ ‒ ‒ ‒ 11
‒ 260 ‒ ‒ ‒ ‒ 260
Total assets P=114,746 P=152,733 P=53,983 P=21,971 P=30,119 P=413,826 P=787,378
Non-derivative liabilities
Deposit liabilitiesDemand P=160,883 P=‒ P=‒ P=‒ P=‒ P=‒ P=160,883
Savings 93,564 ‒ ‒ ‒ ‒ ‒ 93,564
Time and LTNCD 66 118,775 68,651 2,756 2,061 21,310 213,619
254,513 118,775 68,651 2,756 2,061 21,310 468,066
Bills payable ‒ 15,695 8,841 582 70 10,420 35,608
Notes and bonds payable ‒ ‒ 239 801 1,049 64,078 66,167
Manager’s checks 6,925 ‒ ‒ ‒ ‒ ‒ 6,925
Accrued interest payable ‒ 625 ‒ ‒ ‒ ‒ 625
Accounts payable ‒ 3,949 ‒ ‒ ‒ ‒ 3,949
Other liabilities ‒ 8,428 ‒ ‒ ‒ 1,081 9,509
261,438 147,472 77,731 4,139 3,180 96,889 590,849
Derivative liabilities ‒ 73 123 205 261 484 1,146
Total liabilities P=261,438 P=147,545 P=77,854 P=4,344 P=3,441 P=97,373 P=591,995

Risk Management Objectives and Policies - 65 -
*SGVFSM005928*
Parent Bank
2019
OnDemand
Up to1 month
1 to 3Months
3 to 6Months
6 to 12Months
Beyond1 year Total
Financial assets
Cash and other cash items P=7,832 P=‒ P=‒ P=‒ P=‒ P=‒ P=7,832
Due from BSP 67,798 ‒ ‒ ‒ ‒ ‒ 67,798Due from other banks 71,497 ‒ ‒ ‒ ‒ ‒ 71,497Interbank loans receivable ‒ 213 ‒ ‒ ‒ ‒ 213
147,127 213 ‒ ‒ ‒ ‒ 147,340
Financial assets at FVTPL
Derivative assets ‒ 124 94 15 ‒ 172 405Debt securities ‒ 4,760 ‒ ‒ ‒ ‒ 4,760Equity securities ‒ 2,700 ‒ ‒ ‒ ‒ 2,700
Financial assets at FVOCIDebt securities ‒ 2,625 ‒ 2 95 4,138 6,860Equity securities ‒ ‒ ‒ ‒ ‒ 42 42
Financial assets at amortized
cost ‒ 1,255 1,135 1,759 4,149 285,537 293,835
‒ 11,464 1,229 1,776 4,244 289,889 308,602
Loans and other receivables 43 85,182 33,861 30,502 32,866 265,844 448,298Other receivables
Accounts receivable ‒ ‒ ‒ ‒ ‒ 6,122 6,122
Accrued interest receivable ‒ 4,981 ‒ ‒ ‒ ‒ 4,981Sales contract receivable ‒ 26 51 71 128 2,132 2,408
43 90,189 33,912 30,573 32,994 274,098 461,809
Other financial assets Returned checks and other
cash items
P=‒ P=399 P=‒ P=‒ P=‒ P=‒ P=399
Sundry debits ‒ 29 ‒ ‒ ‒ ‒ 29
‒ 428 ‒ ‒ ‒ ‒ 428
Total assets P=147,170 P=102,294 P=35,141 P=32,349 P=37,238 P=563,987 P=918,179
Non-derivative liabilities
Deposit liabilitiesDemand P=137,357 P=‒ P=‒ P=‒ P=‒ P=‒ P=137,357Savings 68,830 ‒ ‒ ‒ ‒ ‒ 68,830
Time and LTNCD 180 141,238 67,619 2,465 1,342 20,702 233,546
206,367 141,238 67,619 2,465 1,342 20,702 439,733Bills payable ‒ 55,573 33,923 11 ‒ 3,668 93,175Notes and bonds payable ‒ ‒ 7,491 620 11,716 27,023 46,850Manager’s checks 8,536 ‒ ‒ ‒ ‒ ‒ 8,536Accrued interest payable ‒ 1,082 ‒ ‒ ‒ ‒ 1,082
Accounts payable ‒ 3,788 ‒ ‒ ‒ ‒ 3,788
Other liabilities ‒ 7,688 ‒ ‒ ‒ 1,081 8,769
214,903 209,369 109,033 3,096 13,058 52,474 601,933
Derivative liabilities ‒ 169 117 26 3 115 430
Total liabilities P=214,903 P=209,538 P=109,150 P=3,122 P=13,061 P=52,589 P=602,363
BSP ReportingLiquidity Coverage Ratio (LCR)
BSP Circular No. 905 provides the implementing guidelines on LCR and disclosure standardsthat are consistent with Basel III framework. The LCR is calculated as the ratio of stock of highquality liquid assets (HQLA) over the total net cash outflows over the next 30 calendar days,which should not be lower than 100%. Compliance with the LCR minimum requirementcommenced on January 1, 2018 with the prescribed minimum ratio of 90.00% for 2018 and100.00% effective January 1, 2019. The Group is required to disclose information related to theliquidity coverage ratio (LCR) in a single currency and on solo and consolidated basis starting2019.
The Group’s and the Parent Bank’s LCR as of December 31, 2020 and 2019 follows (amounts inmillions):
December 31, 2020
Group Parent Bank
Total HQLA P=246,291 P= 216,505
Total net cash outflows 118,718 97,842
LCR Ratio 207.46% 221.28%

Risk Management Objectives and Policies - 66 -
*SGVFSM005928*
December 31, 2019
Group Parent Bank
Total HQLA P=176,297 P=163,482Total net cash outflows 134,821 122,561
LCR Ratio 130.76% 133.39%
Net Stable Funding Ratio (NSFR)
On June 6, 2018, the BSP issued BSP Circular No.1007 covering the implementing guidelines onthe adoption of the Basel III Framework on Liquidity Standards – Net Stable Funding Ratio(NSFR). The NSFR is aimed to promote long-term resilience against liquidity risk by requiringbanks to maintain a stable funding profile in relation to the composition of its assets andoff-balance sheet activities. It complements the LCR, which promotes short term resilience of abank's liquidity profile. Banks shall maintain an NSFR of at least 100 percent (100%) at alltimes. The implementation of the minimum NSFR shall be phased in to help ensure that coveredbanks can meet the standard through reasonable measures without disrupting credit extension andfinancial market activities. An observation period was set from July 1 to December 31, 2018.Effective, January 1, 2019, banks shall comply with the prescribed minimum ratio of 100%. Asof December 31, 2020 and 2019, the NSFR was at 133.22% and 106.26%, respectively, for theGroup, and 135.97% and 108.05%, respectively, for the Parent Bank.
Market RiskMarket risk is the risk that the fair value or future cash flows of financial instruments willfluctuate due to changes in market variables such as interest rate, foreign exchange rates andequity prices. The Group classifies exposures to market risk into either trading book or bankingbook. The market risk for the trading portfolio is managed and monitored based on a Value-at-Risk (VaR) methodology. Meanwhile, the market risk for the non-trading positions are managedand monitored using other sensitivity analyses.
The Parent Bank applies a VaR methodology to assess the market risk of positions held and toestimate the potential economic loss based upon a number of parameters and assumptions forvarious changes in market conditions. VaR is a method used in measuring financial risk byestimating the potential negative change in the market value of a portfolio at a given confidencelevel and over a specified time horizon.
The Parent Bank uses the historical VaR approach in assessing the possible changes in the marketvalue of investment securities based on historical data for a rolling one-year period. The VaRmodels are designed to measure market risk in a normal market environment. The modelsassume that any changes occurring in the risk factors affecting the normal market environmentwill have the same distribution as they had in the past. This involves running the portfolio acrossa set of historical price changes, thus creating a distribution of changes in portfolio value whichmay or may not be normal. The historical approach does not make any assumptions regarding thedistribution of the risk factors and therefore can accommodate any type of distribution. TheBank uses the maximum between the 1st and 99th percentile of historical changes in asset returnsin the calculation of volatility as this is a more conservative approach as any potential gain mayreverse to a loss.
VaR may also be underestimated or overestimated due to the assumptions placed on risk factorsand the relationship between such factors for specific instruments. Even though positions maychange throughout the day, the VaR only represents the risk of the portfolios at the close of eachbusiness day, and it does not account for any losses that may occur beyond the 99% confidencelevel.

Risk Management Objectives and Policies - 67 -
*SGVFSM005928*
The VaR figures are backtested daily against actual and hypothetical profit and loss of the tradingbook to validate the robustness of the VaR model. To supplement the VaR, the Parent Bankperforms stress tests wherein the trading portfolios are valued under extreme market scenariosnot covered by the confidence interval of the Parent Bank’s VaR model.
Since VaR is an integral part of the Parent Bank’s market risk management, VaR limits areestablished annually for all financial trading activities and exposures against the VaR limits andare monitored on a daily basis. Limits are based on the tolerable risk appetite of the Parent Bank.
A summary of the Parent Bank’s VaR position at December 31, 2020 and 2019 follows (amountsin millions of Philippine pesos):
Foreign
Exchange Interest Rate Equity Total VaR
2020 P=23.7 P=5,675.8 P=142.5 P=5,842.0
Average daily 29.1 4,212.6 149.4 4,391.0
Highest 69.6 6,248.7 160.9 6,422.3
Lowest 7.5 285.8 141.0 447.7
2019 P=18.7 P=269.6 P=149.2 P=437.5Average daily 15.8 686.6 166.6 869.0Highest 43.3 1,127.5 201.5 1,305.8Lowest 3.1 159.1 149.2 330.6
The high and low of the total portfolio may not equal to the sum of the individual components asthe highs and lows of the individual portfolios may have occurred on different trading days.
Interest Rate RiskInterest rate risk in the banking book (IRRBB) is the current and prospective risk to earnings andcapital arising from adverse movements in interest rates that affect the bank’s banking bookpositions. When interest rates change, the present value and timing of future cash flows change.This, in turn, changes the underlying value of the Bank’s assets, liabilities and off-balance sheetitems, and hence its economic value. On the other hand, changes in interest rates also affect theBank’s earnings by altering interest rate-sensitive income and expenses, affecting its net interestincome (NII). The Asset and Liability Committee establishes appropriate asset and liabilitypricing in support of the Bank’s balance sheet objectives.
The Group employs “gap analysis” to measure rate-sensitivity of the income and expenses, alsoknown as Earnings-at-Risk (EaR). This sensitivity analysis is performed at least every month.The EaR measures the impact on the net interest income for any mismatch between the amountsof interest-earning assets and interest-bearing liabilities within a one-year period. The EaR iscalculated by first distributing the interest sensitive assets and liabilities into tenor buckets basedon time remaining to the next repricing date or the time remaining to maturity if there is norepricing and then subtracting the liabilities from the assets to obtain the repricing gap. Therepricing gap per tenor bucket is then multiplied by the assumed interest rate movement andappropriate time factor to derive the EaR per tenor. The Bank uses one-year differences in theterm structure of the different benchmark curves as the bases for the calculation of interest raterisk factor across all currencies. The total EaR is computed as the sum of the EaR per tenorwithin one year. To manage the interest rate risk exposure, BOD-approved EaR limits wereestablished.

Risk Management Objectives and Policies - 68 -
*SGVFSM005928*
Non-maturing or repricing assets or liabilities are considered to be non-interest rate sensitive andare not included in the measurement.
A positive gap occurs when the amount of interest rate sensitive assets exceeds the amount ofinterest rate sensitive liabilities while a negative gap occurs when the amount of interest ratesensitive liabilities exceeds the amount of interest rate sensitive assets. Accordingly, during aperiod of rising interest rates, an entity with a positive gap will have more interest rate sensitiveassets repricing at a higher interest rate than interest rate sensitive liabilities which will befavorable to it. During a period of falling interest rates, an entity with a positive gap will havemore interest rate sensitive assets repricing at a lower interest rate than interest rate sensitiveliabilities, which will be unfavorable to it.
The asset-liability gap position of the Group and Parent Bank at carrying amounts follows(amounts in millions of Philippine pesos):
Group
2020
Up to
Six Months
Beyond
Six Months
To One Year
Beyond
One Year Total
Resources
Loans P=118,867 P=24,860 P=195,490 P=339,217
Placements 128,429 – 43,972 172,401
Investments 4,448 1,040 199,279 204,767
251,744 25,900 438,741 716,385
Liabilities
Deposit liabilities 238,353 7,941 281,491 527,785
Bills payable 39,099 7,656 7,468 54,223
Notes and bonds payable – 107 59,747 59,854
277,452 15,704 348,706 641,862
Asset-Liability Gap (P=25,708) P=10,196 P=90,035 P=74,523
Group
2019
Up to
Six Months
Beyond
Six Months
To One Year
Beyond
One Year Total
Resources
Loans P=157,842 P=20,358 P=215,181 P=393,381
Placements 73,888 – 73,750 147,638
Investments 2,530 250 172,002 174,782
234,260 20,608 460,933 715,801
Liabilities
Deposit liabilities 246,694 2,530 235,112 484,336
Bills payable 96,741 3,733 4,614 105,088
Notes and bonds payable 7,200 11,014 31,118 49,332
350,635 17,277 270,844 638,756
Asset-Liability Gap (P=116,375) P=3,331 P=190,089 P=77,045

Risk Management Objectives and Policies - 69 -
*SGVFSM005928*
Parent Bank
2020
Up to
Six Months
Beyond
Six Months
To One Year
Beyond
One Year Total
Resources
Loans P=104,811 P=21,422 P=146,880 P=273,113
Placements 106,464 – 42,167 148,631
Investments 4,354 1,020 196,535 201,909
215,629 22,442 385,582 623,653
Liabilities
Deposit liabilities 190,042 1,930 273,257 465,229
Bills payable 33,183 1 1,319 34,503
Notes and bonds payable – – 59,747 59,747
223,225 1,931 334,323 559,479
Asset-Liability Gap (P=7,596) P=20,511 P=51,259 P=64,174
Parent Bank
2019
Up to
Six Months
BeyondSix Months
To One Year
Beyond
One Year Total
Resources
Loans P=141,924 P=11,566 P=179,408 P=332,898Placements 71,710 – 67,798 139,508
Investments 2,530 250 171,953 174,733
216,164 11,816 419,159 647,139
Liabilities
Deposit liabilities 213,434 1,249 224,271 438,954
Bills payable 90,753 – 1,396 92,149
Notes and bonds payable 7,200 10,865 31,118 49,183
311,387 12,114 256,785 580,286
Asset-Liability Gap (P=95,223) (P=298) P=162,374 P=66,853
EAR is complemented by stress tests which are conducted quarterly. It involves subjecting thetotal interest rate sensitive assets and liabilities within one year to probable short-term andmedium-term interest rate movements, assuming parallel and non-parallel (flatteners andsteepeners) in the yield curve.
Additionally, the Bank also monitors long-term sensitivity to interest rate risk of the Bank’sbalance sheet through the Economic Value of Equity (EVE) method. EVE measures theeconomic value which provides a more comprehensive view of potential long-term effects ofchanges in interest rates.
The Bank’s interest rate sensitive asset and liability positions are analyzed based on its cashflows, and its present value are computed using appropriate market rates which include thecurrent risk-free rate plus the corresponding margin. On the other hand, the present values ofnon-interest sensitive assets and liabilities will be kept at their carrying values.
The Bank’s risk management program includes measuring and monitoring the risks associatedwith fluctuations in market interest rates on the its net interest income and capital ensuring thatthe exposures in interest rates are kept within acceptable limits.
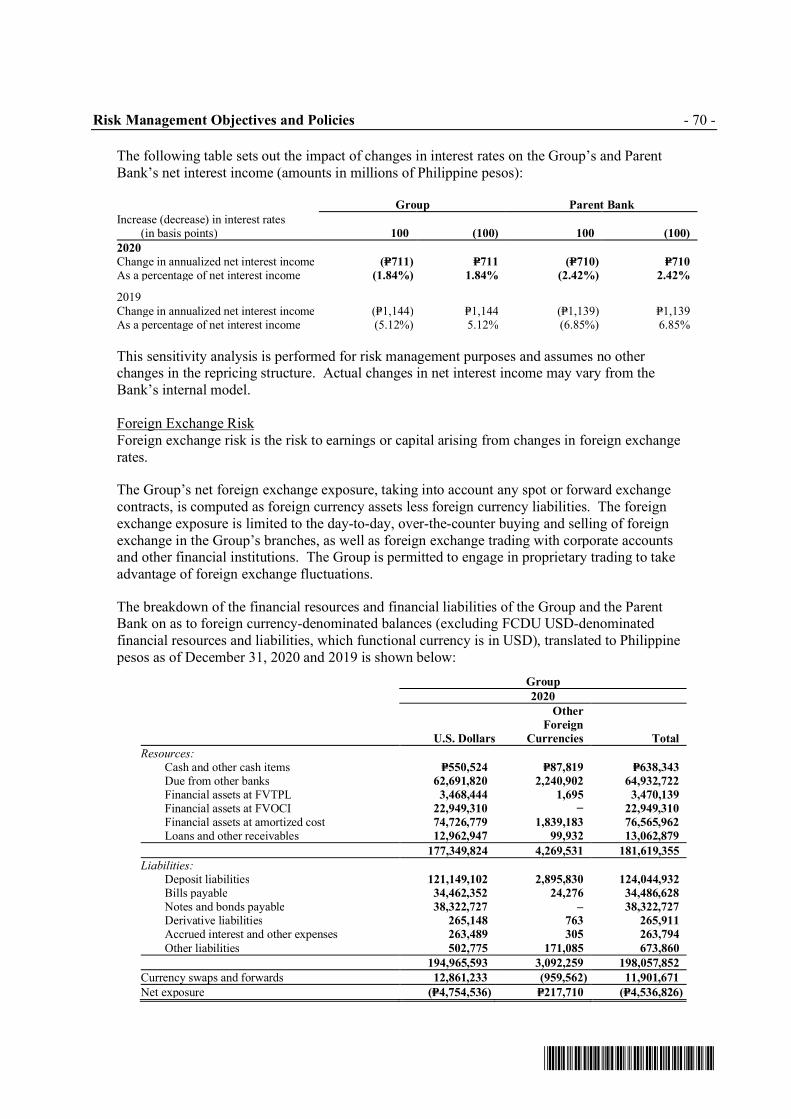
Risk Management Objectives and Policies - 70 -
*SGVFSM005928*
The following table sets out the impact of changes in interest rates on the Group’s and ParentBank’s net interest income (amounts in millions of Philippine pesos):
Group Parent Bank
Increase (decrease) in interest rates(in basis points) 100 (100) 100 (100)
2020
Change in annualized net interest income (P=711) P=711 (P=710) P=710
As a percentage of net interest income (1.84%) 1.84% (2.42%) 2.42%
2019Change in annualized net interest income (P=1,144) P=1,144 (P=1,139) P=1,139As a percentage of net interest income (5.12%) 5.12% (6.85%) 6.85%
This sensitivity analysis is performed for risk management purposes and assumes no otherchanges in the repricing structure. Actual changes in net interest income may vary from theBank’s internal model.
Foreign Exchange RiskForeign exchange risk is the risk to earnings or capital arising from changes in foreign exchangerates.
The Group’s net foreign exchange exposure, taking into account any spot or forward exchangecontracts, is computed as foreign currency assets less foreign currency liabilities. The foreignexchange exposure is limited to the day-to-day, over-the-counter buying and selling of foreignexchange in the Group’s branches, as well as foreign exchange trading with corporate accountsand other financial institutions. The Group is permitted to engage in proprietary trading to takeadvantage of foreign exchange fluctuations.
The breakdown of the financial resources and financial liabilities of the Group and the ParentBank on as to foreign currency-denominated balances (excluding FCDU USD-denominatedfinancial resources and liabilities, which functional currency is in USD), translated to Philippinepesos as of December 31, 2020 and 2019 is shown below:
Group
2020
U.S. Dollars
Other
Foreign
Currencies Total
Resources:Cash and other cash items P=550,524 P=87,819 P=638,343
Due from other banks 62,691,820 2,240,902 64,932,722
Financial assets at FVTPL 3,468,444 1,695 3,470,139
Financial assets at FVOCI 22,949,310 − 22,949,310
Financial assets at amortized cost 74,726,779 1,839,183 76,565,962
Loans and other receivables 12,962,947 99,932 13,062,879
177,349,824 4,269,531 181,619,355
Liabilities:Deposit liabilities 121,149,102 2,895,830 124,044,932
Bills payable 34,462,352 24,276 34,486,628
Notes and bonds payable 38,322,727 – 38,322,727
Derivative liabilities 265,148 763 265,911
Accrued interest and other expenses 263,489 305 263,794
Other liabilities 502,775 171,085 673,860
194,965,593 3,092,259 198,057,852
Currency swaps and forwards 12,861,233 (959,562) 11,901,671
Net exposure (P=4,754,536) P=217,710 (P=4,536,826)
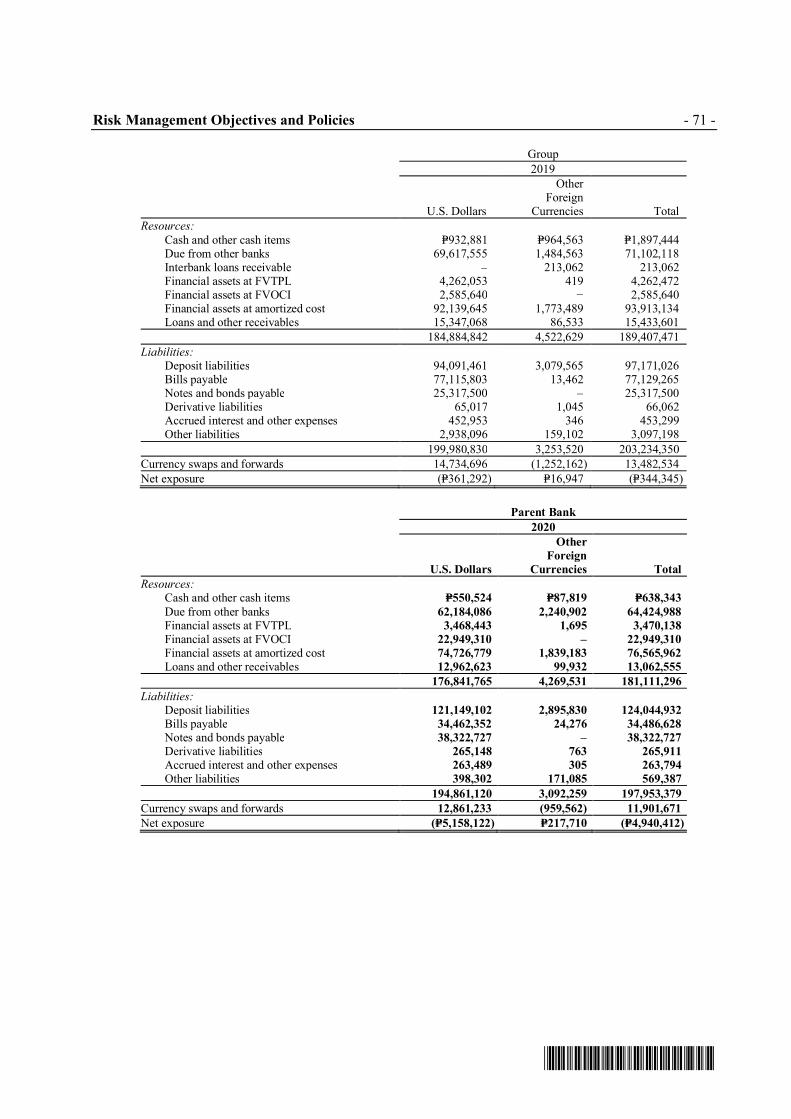
Risk Management Objectives and Policies - 71 -
*SGVFSM005928*
Group
2019
U.S. Dollars
OtherForeign
Currencies Total
Resources:
Cash and other cash items P=932,881 P=964,563 P=1,897,444Due from other banks 69,617,555 1,484,563 71,102,118Interbank loans receivable – 213,062 213,062Financial assets at FVTPL 4,262,053 419 4,262,472Financial assets at FVOCI 2,585,640 − 2,585,640Financial assets at amortized cost 92,139,645 1,773,489 93,913,134Loans and other receivables 15,347,068 86,533 15,433,601
184,884,842 4,522,629 189,407,471
Liabilities:Deposit liabilities 94,091,461 3,079,565 97,171,026Bills payable 77,115,803 13,462 77,129,265Notes and bonds payable 25,317,500 – 25,317,500Derivative liabilities 65,017 1,045 66,062Accrued interest and other expenses 452,953 346 453,299
Other liabilities 2,938,096 159,102 3,097,198
199,980,830 3,253,520 203,234,350
Currency swaps and forwards 14,734,696 (1,252,162) 13,482,534
Net exposure (P=361,292) P=16,947 (P=344,345)
Parent Bank
2020
U.S. Dollars
Other
Foreign
Currencies Total
Resources: Cash and other cash items P=550,524 P=87,819 P=638,343
Due from other banks 62,184,086 2,240,902 64,424,988
Financial assets at FVTPL 3,468,443 1,695 3,470,138
Financial assets at FVOCI 22,949,310 – 22,949,310
Financial assets at amortized cost 74,726,779 1,839,183 76,565,962
Loans and other receivables 12,962,623 99,932 13,062,555
176,841,765 4,269,531 181,111,296
Liabilities:Deposit liabilities 121,149,102 2,895,830 124,044,932
Bills payable 34,462,352 24,276 34,486,628
Notes and bonds payable 38,322,727 – 38,322,727
Derivative liabilities 265,148 763 265,911
Accrued interest and other expenses 263,489 305 263,794
Other liabilities 398,302 171,085 569,387
194,861,120 3,092,259 197,953,379
Currency swaps and forwards 12,861,233 (959,562) 11,901,671
Net exposure (P=5,158,122) P=217,710 (P=4,940,412)

Risk Management Objectives and Policies - 72 -
*SGVFSM005928*
Parent Bank
2019
U.S. Dollars
OtherForeign
Currencies Total
Resources:
Cash and other cash items P=931,287 P=964,563 P=1,895,850Due from other banks 69,536,843 1,484,563 71,021,406Interbank loans receivables – 213,062 213,062Financial assets at FVTPL 4,262,053 419 4,262,472Financial assets at FVOCI 2,585,640 – 2,585,640Financial assets at amortized cost 92,139,645 1,773,489 93,913,134Loans and other receivables 15,346,997 86,533 15,433,530
184,802,465 4,522,629 189,325,094
Liabilities:Deposit liabilities 94,091,461 3,079,565 97,171,026Bills payable 77,115,803 13,462 77,129,265Notes and bonds payable 25,317,500 – 25,317,500Derivative liabilities 65,017 1,045 66,062Accrued interest and other expenses 452,953 346 453,299
Other liabilities 2,938,096 159,102 3,097,198
199,980,830 3,253,520 203,234,350
Currency swaps and forwards 14,734,696 (1,252,162) 13,482,534
Net exposure (P=443,669) P=16,947 (P=426,722)
The Parent Bank’s policy is to maintain foreign currency exposure within acceptable limits andwithin existing regulatory guidelines. The Parent Bank believes that its profile of foreigncurrency exposure on its assets and liabilities is within conservative limits for a financialinstitution engaged in the type of business in which the Parent Bank is involved.
The following table illustrates the sensitivity of the net results and capital funds to the changes inforeign exchange rates on the Parent Bank’s financial assets and financial liabilities in the RBU.The percentages change (increase and decrease) have been determined based on the averagemarket volatility in exchange rates in the previous 12 months, using a confidence level of 99%.The sensitivity analysis is based on the Parent Bank’s foreign currency-denominated financialinstruments held at each reporting date, including currency swaps and forwards.
2020 2019
% Change
Effect on
Net Profit
For the Year % Change
Effect onNet Profit
For the Year
U.S. dollars 1.0% (51,581) 1.0% (4,437)Japanese yen 2.5% (6,292) 1.5% 864Euros 2.0% 4,540 1.5% (543)Others 1.6% 4,711 1.3% (235)
Operational RiskBSP Circular 900, Guidelines on Operational Risk Management, serve as the groundwork for theBank’s Operational Risk Management (ORM) framework. This is to standardize the approachundertaken by the Bank in order to facilitate consistently strong ORM practices across theorganization.
Operational risk is defined as the risk of loss arising from direct or indirect loss from inadequateor failed internal processes, people and systems or from external events. This definition includeslegal risk, but excludes strategic and reputational risk. Direct loss being the result primarily froman operational failure while an indirect loss relates to the impact of operational risk on other riskssuch as market, credit or liquidity risk.

Risk Management Objectives and Policies - 73 -
*SGVFSM005928*
Each specific unit of the Bank has its roles and responsibilities in the management of operationalrisk and these are clearly stated in the ORM framework. At the BOD level, an ORMC wasformed to provide overall direction in the management of operational risk, aligned with theoverall business objectives. Key to the effective implementation of the operational riskmanagement framework is a governance structure that transparently defines the lines ofresponsibility from the BOD down to the Business and Functional Units level.
The ORMC was formed and given the mandate to build and lead the roadmap in developing thefoundations and systems necessary for the effective implementation of an Operational RiskManagement Framework. The ORM, together with all other Risk Units, reports directly to theChief Risk Officer.
In managing products, services and systems, these are implemented only after a thoroughoperational risk evaluation. As part of the product and systems approval process, product ownersand managers ensure that risks are clearly identified and adequately controlled and mitigated.For existing products, services and systems, regular reviews are conducted and controls areassessed to determine continued effectiveness. The Parent Bank, as part of its continuing effortto manage operational risk, has ensured that the basic controls to manage exposure to operationalrisk have been embedded in its processes.
Legal Risk and Regulatory Risk ManagementLegal risk pertains to the Parent Bank’s exposure to losses arising from cases decided not infavor of the Parent Bank where significant legal costs have already been incurred, or in someinstances, where the Parent Bank may be required to pay damages. The Parent Bank is ofteninvolved in litigation in enforcing its collection rights under loan agreements in case of borrowerdefault. The Parent Bank may incur significant legal expenses as a result of these events, but theParent Bank may still end up with non-collection or non-enforcement of claims. The ParentBank has established measures to avoid or mitigate the effects of these adverse decisions andengages several qualified legal advisors, who were endorsed to and carefully approved by seniormanagement. At year-end, the Parent Bank also ensures that material adjustments or disclosuresare made in the financial statements for any significant commitments or contingencies which mayhave arisen from legal proceedings involving the Parent Bank.
Regulatory compliance risk refers to the potential risk for the Parent Bank and its subsidiaries tosuffer financial loss due to changes in the laws, monetary, tax or other governmental regulationsof the country. The monitoring of the Parent Bank’s and subsidiaries’ compliance with theseregulations, as well as the study of the potential impact of new laws and regulations, is theprimary responsibility of the entity’s Chief Compliance and Corporate Governance Officer(CCCGO). The CCCGO is responsible for communicating and disseminating new rules andregulations to all units, analyzing and addressing compliance issues, performing periodiccompliance testing and regularly reporting to the CGC and the BOD.

Capital Management - 74 -
*SGVFSM005928*
5. Capital Management
Regulatory CapitalAs the Parent Bank’s regulator, the BSP sets and monitors capital requirements of the ParentBank.
In implementing current capital requirements, the BSP requires the Group and the Parent Bank tomaintain a minimum capital amount and a prescribed ratio of qualifying capital to risk-weightedassets, known as the “capital adequacy ratio” (CAR). Risk-weighted assets is the aggregate valueof assets weighted by credit risk, market risk, and operational risk, based on BSP-prescribedformula provided under BSP Circular No. 360 and BSP Circular No. 538 which contain theimplementing guidelines for the revised risk-based capital adequacy framework to conform toBasel II recommendations.
Effective January 1, 2014, the BSP has adopted the new risk-based capital adequacy frameworkparticularly on the minimum capital and disclosure requirements for the Philippine bankingsystem in accordance with the Basel III standards through BSP Circular No. 781. The adoptedBasel III risk-based capital adequacy framework requires the Group to maintain:
(a) Common Equity Tier 1 (CET1) of at least 6.0% of risk-weighted assets;(b) Tier 1 Capital of at least 7.5% of risk-weighted assets;(c) Qualifying Capital (Tier 1 plus Tier 2 Capital) of at least 10.0% of risk-weighted assets;
and,(d) Capital Conservation Buffer of 2.5% of risk-weighted assets, comprised of CET1 Capital.
On November 29, 2018, the BSP amended the requirements of Subsection X115.1 of the Manualfor Regulations for Banks (MORB) through BSP Circular No. 1024. The amendment requiresthe Group and the Parent Bank to maintain, with respect to the CET 1 requirement, in addition tothe minimum, the following capital buffers:
(a) Capital conservation buffer (CCB) of 2.5%; and(b) Countercyclical capital buffer (CCyB) of 0% subject to upward adjustment to a rate
determined by the MB when systemic conditions warrant but not to exceed to 2.5%.
The Group’s and the Parent Bank’s regulatory capital position as of December 31, 2020 and2019, as reported to the BSP, follow (amounts in millions):
Group Parent Bank
2020 2019 2020 2019
Common Equity Tier 1 Capital
Paid-up common stock P=12,185 P=12,176 P=12,185 P=12,176Additional paid in capital 14,215 14,172 14,215 14,172Surplus free 63,778 55,725 65,216 56,183
Undivided profits 11,671 13,226 11,513 13,601Other comprehensive income (1,806) (1,023) (1,658) (908)Minority interest in financial allied subsidiary 802 522 – –
Sub-total 100,845 94,798 101,471 95,224
Less Regulatory Adjustments:
Total outstanding unsecured credit accommodations,both direct and indirect, to DOSRI, and unsecuredloans, other credit accommodations and guarantees
granted to subsidiaries and affiliates 378 268 267 240Deferred income tax 6,970 5,626 5,858 4,897Goodwill 13,377 13,650 7,887 7,887
Other intangible assets 1,554 1,539 1,013 1,084
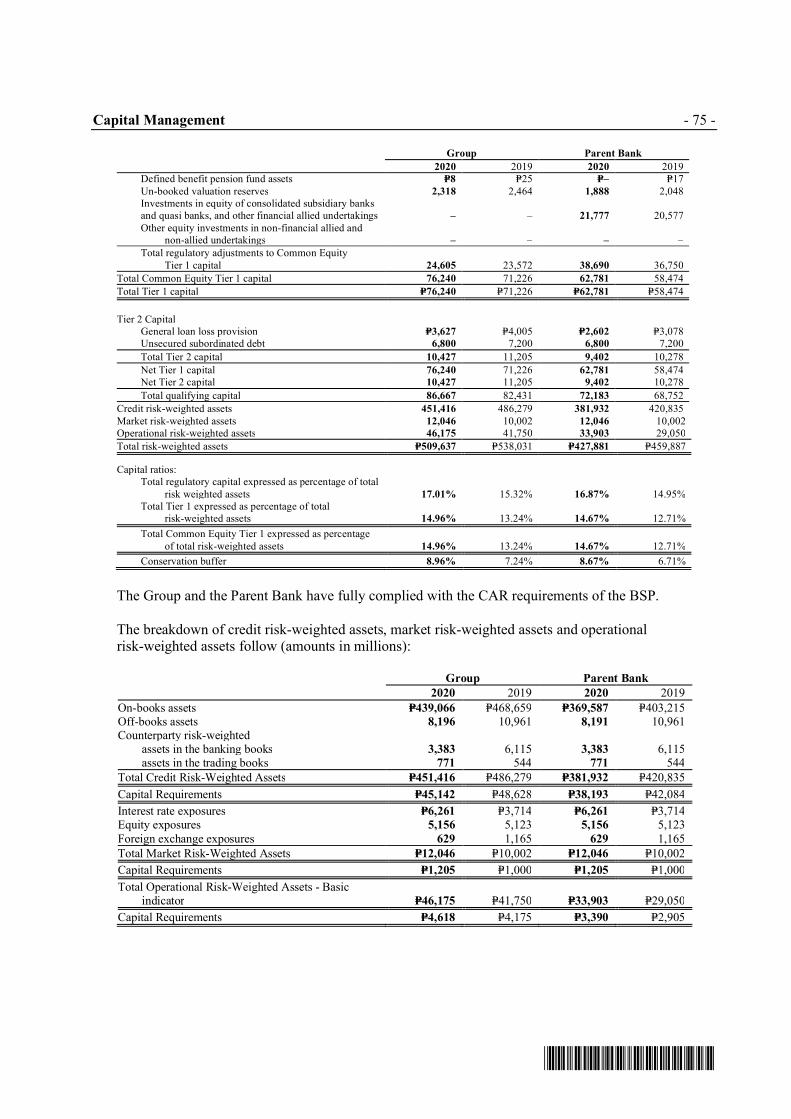
Capital Management - 75 -
*SGVFSM005928*
Group Parent Bank
2020 2019 2020 2019Defined benefit pension fund assets P=8 P=25 P=– P=17
Un-booked valuation reserves 2,318 2,464 1,888 2,048Investments in equity of consolidated subsidiary banksand quasi banks, and other financial allied undertakings – – 21,777 20,577
Other equity investments in non-financial allied andnon-allied undertakings – – – –
Total regulatory adjustments to Common Equity
Tier 1 capital 24,605 23,572 38,690 36,750
Total Common Equity Tier 1 capital 76,240 71,226 62,781 58,474
Total Tier 1 capital P=76,240 P=71,226 P=62,781 P=58,474
Tier 2 CapitalGeneral loan loss provision P=3,627 P=4,005 P=2,602 P=3,078Unsecured subordinated debt 6,800 7,200 6,800 7,200
Total Tier 2 capital 10,427 11,205 9,402 10,278
Net Tier 1 capital 76,240 71,226 62,781 58,474Net Tier 2 capital 10,427 11,205 9,402 10,278
Total qualifying capital 86,667 82,431 72,183 68,752
Credit risk-weighted assets 451,416 486,279 381,932 420,835
Market risk-weighted assets 12,046 10,002 12,046 10,002Operational risk-weighted assets 46,175 41,750 33,903 29,050
Total risk-weighted assets P=509,637 P=538,031 P=427,881 P=459,887
Capital ratios:Total regulatory capital expressed as percentage of total
risk weighted assets 17.01% 15.32% 16.87% 14.95%Total Tier 1 expressed as percentage of total
risk-weighted assets 14.96% 13.24% 14.67% 12.71%
Total Common Equity Tier 1 expressed as percentage
of total risk-weighted assets 14.96% 13.24% 14.67% 12.71%
Conservation buffer 8.96% 7.24% 8.67% 6.71%
The Group and the Parent Bank have fully complied with the CAR requirements of the BSP.
The breakdown of credit risk-weighted assets, market risk-weighted assets and operationalrisk-weighted assets follow (amounts in millions):
Group Parent Bank
2020 2019 2020 2019
On-books assets P=439,066 P=468,659 P=369,587 P=403,215Off-books assets 8,196 10,961 8,191 10,961Counterparty risk-weighted
assets in the banking books 3,383 6,115 3,383 6,115assets in the trading books 771 544 771 544
Total Credit Risk-Weighted Assets P=451,416 P=486,279 P=381,932 P=420,835
Capital Requirements P=45,142 P=48,628 P=38,193 P=42,084
Interest rate exposures P=6,261 P=3,714 P=6,261 P=3,714Equity exposures 5,156 5,123 5,156 5,123Foreign exchange exposures 629 1,165 629 1,165
Total Market Risk-Weighted Assets P=12,046 P=10,002 P=12,046 P=10,002
Capital Requirements P=1,205 P=1,000 P=1,205 P=1,000
Total Operational Risk-Weighted Assets - Basicindicator P=46,175 P=41,750 P=33,903 P=29,050
Capital Requirements P=4,618 P=4,175 P=3,390 P=2,905

Capital Management - 76 -
*SGVFSM005928*
The total credit exposure broken down by type of exposures and risk weights follow (amounts inmillions):
Group
2020
Credit Risk
Total Credit
Risk Exposure
Total
Credit Risk
Exposure
after Risk
Mitigation 0%-50% 75%-100% 150%
Total
Weighted
Assets
Risk-Weighted On-Books Assets
Cash on hand P=8,755 P=8,755 P=8,755 P= – P= – P= –
Checks and other cash items 30 30 30 – – 6
Due from BSP 103,879 103,879 103,879 – – –
Due from other banks 68,723 68,723 66,663 2,060 – 31,492
Financial assets at FVTPL 37 37 – 37 – 37
Financial assets at FVOCI 31,174 28,645 16,740 11,905 – 12,554
Financial assets at amortized cost 165,005 164,234 124,601 39,633 – 54,557
Loans and receivables 311,159 311,013 23,192 279,348 8,473 303,654
16,745 3,349 3,349 – – –
Sales contract receivable (SCR) 1,443 1,443 – 113 1,330 2,108
ROPA 5,619 5,619 – – 5,619 8,428
Other assets 24,937 24,937 157 24,780 – 24,781
Total risk-weighted on-books assets notcovered by CRM 737,506 720,664 347,366 357,876 15,422 437,617
Total risk-weighted on-books assets
covered by CRM – 16,841 16,837 4 – 1,449
P=737,506 P=737,505 P=364,203 P=357,880 P=15,422 P=439,066
Risk-Weighted Off-Books Assets
Direct credit substitutes (e.g., generalguarantee of indebtedness and
acceptances) P=1,357 P=– P=– P=1,357 P=– P=1,357
Transaction-related contingencies(e.g., performance bonds, bid
bonds, warrantees and stand-byLCs related to particulartransactions) 3,330 – – 1,665 – 1,665
Trade-related contingencies arisingfrom movements of goods
(e.g., documentary creditscollateralized by the underlyingshipments) and commitments with
an original maturity of up to oneyear P=25,870 P=– P=– P=5,174 P=– P=5,174
P=30,557 P=– P=– P=8,196 P=– P=8,196
Counterparty Risk-Weighted Assets
in the Banking Books
Repo-style Exposure P=30,745 P=6,421 P=5,615 P=806 P=– P=3,383
Counterparty Risk-Weighted Assets
in the Trading Books
Interest Rate Contracts P=4,010 P=550 P=278 P=272 P=– P=411
Exchange Rate Contracts 47,517 576 387 189 – 360
Total P=51,527 P=1,126 P=665 P=461 P=– P=771

Capital Management - 77 -
*SGVFSM005928*
Group
2019
Credit RiskTotal Credit
Risk Exposure
Total
Credit RiskExposure
after Risk
Mitigation 0%-50% 75%-100% 150%
TotalWeighted
Assets
Risk-Weighted On-Books AssetsCash on hand P=8,369 P=8,369 P=8,369 P= – P= – P= –
Checks and other cash items 121 121 121 – – 24Due from BSP 73,779 73,779 73,779 – – –Due from other banks 73,760 73,760 71,491 2,269 – 32,671
Financial assets at FVTPL 49 49 – 49 – 49Financial assets at FVOCI 5,840 5,840 5,734 106 – 106Financial assets at amortized cost 165,551 165,112 126,365 38,747 – 57,121
Loans and receivables 349,392 349,184 9,939 333,051 6,194 344,951SPURRA 34,774 6,955 6,955 – – –Sales contract receivable (SCR) 1,339 1,339 – 363 976 1,827
ROPA 5,698 5,698 – – 5,698 8,548Other assets 23,512 23,512 152 23,360 – 23,360
Total risk-weighted on-books assets notcovered by CRM 742,184 713,718 302,905 397,945 12,868 468,657
Total risk-weighted on-books assetscovered by CRM – 28,466 28,464 2 – 2
P=742,184 P=742,184 P=331,369 P=397,947 P=12,868 P=468,659
Risk-Weighted Off-Books AssetsDirect credit substitutes (e.g., general
guarantee of indebtedness and
acceptances) P=1,710 P=– P=– P=1,710 P=– P=1,710Transaction-related contingencies
(e.g., performance bonds, bid
bonds, warrantees and stand-byLCs related to particulartransactions) 3,120 – – 1,560 – 1,560
Trade-related contingencies arisingfrom movements of goods(e.g., documentary credits
collateralized by the underlyingshipments) and commitments withan original maturity of up to one
year P=38,456 P=– P=– P=7,691 P=– P=7,691
P=43,286 P=– P=– P=10,961 P=– P=10,961
Counterparty Risk-Weighted Assets inthe Banking Books
Repo-style Exposure P=72,382 P=12,035 P=10,337 P=1,698 P=– P=6,115
Counterparty Risk-Weighted Assets in
the Trading BooksInterest Rate Contracts P=1,198 P=130 P=71 P=59 P=– P=95Exchange Rate Contracts 56,660 793 623 170 – 449
Total P=57,858 P=923 P=694 P=229 P=– P=544

Capital Management - 78 -
*SGVFSM005928*
Parent Bank
2020
Credit Risk
Total Credit
Risk Exposure
Total
Credit Risk
Exposure
after Risk
Mitigation 0%-50% 75%-100% 150%
Total
Weighted
Assets
Risk-Weighted On-Books Assets
Cash on hand P=7,815 P=7,815 P=7,815 P= – P= – P= –
Due from BSP 83,875 83,875 83,875 – – –
Due from other banks 64,783 64,783 64,463 320 – 28,652
Financial assets through other
comprehensive income 30,983 28,454 16,558 11,896 – 12,519
Financial assets at amortized cost 162,363 161,592 121,959 39,633 – 54,549
Loans and receivables 255,260 255,171 21,938 227,728 5,505 246,955
SPURRA 10,373 2,075 2,075 – – –
SCR 1,364 1,364 – 73 1,291 2,010
ROPA 4,038 4,038 – – 4,038 6,057
Other assets 17,400 17,400 – 17,400 – 17,400
Total risk-weighted on-books assets not
covered by CRM 638,254 626,567 318,683 297,050 10,834 368,142
Total risk-weighted on-books assetscovered by CRM – 11,687 11,683 4 – 1,445
P=638,254 P=638,254 P=330,366 P=297,054 P=10,834 P=369,587
Risk-Weighted Off-Books Assets
Direct credit substitutes (e.g., generalguarantee of indebtedness andacceptances) P=1,357 P=– P=– P=1,357 P=– P=1,357
Transaction-related contingencies (e.g.,performance bonds, bid bonds,warrantees and stand-by LCs
related to particular transactions) 3,330 – – 1,665 – 1,665
Trade-related contingencies arisingfrom movements of goods (e.g.,
documentary credits collateralizedby the underlying shipments) andcommitments with an original
maturity of up to one year P=25,841 P=– P=– P=5,169 P=– P=5,169
P=30,528 P=– P=– P=8,191 P=– P=8,191
Counterparty Risk-Weighted Assets
in the Banking Books
Repo-style Exposure P=30,745 P=6,421 P=5,615 P=806 P=– P= 3,383
Counterparty Risk-Weighted Assets
in the Trading Books
Interest Rate Contracts P=4,010 P=550 P=278 P=272 P=– P=411
Exchange Rate Contracts 47,517 576 387 189 – 360
Total P=51,527 P=1,126 P=665 P=461 P=– P=771

Capital Management - 79 -
*SGVFSM005928*
Parent Bank
2019
Credit RiskTotal Credit
Risk Exposure
Total
Credit RiskExposure
after Risk
Mitigation 0%-50% 75%-100% 150%
Total
Weighted
Assets
Risk-Weighted On-Books AssetsCash on hand P=7,832 P=7,832 P=7,832 P= – P= – P= –
Due from BSP 67,824 67,824 67,824 – – –Due from other banks 71,497 71,497 71,228 269 – 30,540Financial assets through other
comprehensive income 5,831 5,831 5,734 97 – 97Financial assets at amortized cost 165,503 165,064 126,353 38,711 – 57,085Loans and receivables 298,121 298,001 9,937 284,431 3,633 292,521
SPURRA 28,447 5,689 5,689 – – –SCR 1,331 1,331 – 355 976 1,819ROPA 4,214 4,214 – – 4,214 6,321
Other assets 14,830 14,830 – 14,830 – 14,830
Total risk-weighted on-books assets not
covered by CRM 665,430 642,113 294,597 338,693 8,823 403,213Total risk-weighted on-books assets
covered by CRM – 23,317 23,315 2 – 2
P=665,430 P=665,430 P=317,912 P=338,695 P=8,823 P=403,215
Risk-Weighted Off-Books Assets
Direct credit substitutes (e.g., generalguarantee of indebtedness andacceptances) P=1,710 P=– P=– P=1,710 P=– P=1,710
Transaction-related contingencies (e.g.,performance bonds, bid bonds,warrantees and stand-by LCs
related to particular transactions) 3,120 – – 1,560 – 1,560Trade-related contingencies arising
from movements of goods (e.g.,
documentary credits collateralizedby the underlying shipments) andcommitments with an original
maturity of up to one year P=38,456 P=– P=– P=7,691 P=– P=7,691
P=43,286 P=– P=– P=10,961 P=– P=10,961
Counterparty Risk-Weighted Assets inthe Banking Books
Repo-style Exposure P=72,382 P=12,035 P=10,337 P=1,698 P=– P=6,115
Counterparty Risk-Weighted Assets inthe Trading Books
Interest Rate Contracts P=1,198 P=130 P=71 P=59 P=– P=95Exchange Rate Contracts 56,660 793 623 170 – 449
Total P=57,858 P=923 P=694 P=229 P=– P=544
Risk weighted on-balance sheet assets covered by credit risk mitigants were based oncollateralized transactions as well as guarantees by the Philippine National Government andthose guarantors and exposures with the highest credit rating.
Standardized credit risk weights were used in the credit assessment of asset exposures. Thirdparty credit assessments were based on the ratings by Standard & Poor’s, Moody’s, Fitch andPhilratings on exposures to Sovereigns, Multilateral Development Banks, Banks, LocalGovernment Units, Government Corporations and Corporates.
Minimum Capital RequirementUnder the relevant provisions of current BSP regulations, the required minimum capitalization ofa universal bank is P=20.0 billion both as of December 31, 2020 and 2019. As of those dates, theBank is in compliance with these regulations.

Capital Management - 80 -
*SGVFSM005928*
Basel III Leverage Ratio (BLR)BSP Circular Nos. 881 and 990 cover the implementing guidelines on the BLR frameworkdesigned to act as a supplementary measure to the risk-based capital requirements and shall notbe less than 5.00%. The monitoring period has been set every quarter starting December 31,2014 and extended until June 30, 2018. Effective July 1, 2018, the monitoring of the leverageratio was implemented as a Pillar I minimum requirement.
The details of the BLR as of December 31, 2020 and 2019 follow (amounts in millions, exceptfor percentages):
Consolidated Parent Bank
2020 2019 2020 2019
Tier 1 Capital P=76,240 P=71,226 P=62,780 P=58,474Exposure Measure 763,706 764,787 664,873 688,449BLR 9.98% 9.31% 9.44% 8.49%
Under the framework, BLR is defined as the capital measure divided by the exposure measure.Capital measure is Tier 1 capital. Exposure measure is the sum of on-balance sheet exposures,derivative exposures, security financing exposures and off-balance sheet items.
Ensuring Sufficient CapitalOn January 15, 2009, the BSP issued Circular No. 639, which articulates the need for banks toadopt and document an Internal Capital Adequacy Assessment Process (ICAAP). All universaland commercial banks are expected to perform a thorough assessment of all their material risks,as well as maintain capital adequate to support these risks. This is intended to complement thecurrent regulatory capital requirement of at least 10% of risk assets, which only covers credit,market and operational risks. On December 29, 2009, the BSP issued Circular No. 677 thateffectively extends the implementation of the ICAAP from January 2010 to January 2011.
Cognizant of the importance of a strong capital base to meet strategic and regulatoryrequirements, the Parent Bank has adopted a robust ICAAP on a group-wide level that isconsistent with its risk philosophy and risk appetite. The ICAAP Document embodies theGroup’s risk philosophy, risk appetite, and risk governance framework and structure, andintegrates these with: (a) the Group’s strategic objectives and long-term strategies; (b) thefive-year financial and business plans; and,(c) the capital plan and dividend policy.
The ICAAP’s objective is to ensure that the BOD and senior management actively and promptlyidentify and manage the material risks arising from the general business environment, and that anappropriate level of capital is maintained to cover these risks.
On January 4, 2018, the BSP issued Circular No. 989 which mandates the conduct of stresstesting exercise of banks. The Group’s ICAAP Document considered the impacts of severe butplausible scenarios on the Group’s capital position. The results are thoroughly discussed duringRMC meetings, and reported to the Board. In the course of its discussions, the BOD and seniormanagement may request for additional stress testing scenarios or revisions to the testassumptions in order to better align these to current trends and forecasts.
The Group has a cross-functional ICAAP technical team, comprised of representatives from thecore risk management units - credit, market, operational, information technology, and emergingrisks; corporate planning; financial controllership; treasury; internal audit; and compliance. Thisensures a well-coordinated approach to the development, documentation, implementation,review, improvement, and maintenance of the various sub-processes included in the ICAAP.

Capital Management and
Segment Reporting - 81 -
*SGVFSM005928*
The key members of the ICAAP technical team are enrolled in further training as well as variousfora and briefings to enhance their knowledge and expertise particularly on the subjects ofICAAP, Basel III, and their interface with PFRS.
The Group’s ICAAP Document is subjected each year to an independent review by the InternalAudit Division (IAD) to provide reasonable assurance that the Group has met the regulatoryrequirements. For the 2021 ICAAP Document submission, the results of the audit assessmentwere presented to the Audit Committee and the BOD.
Based on IAD’s assessment of the ICAAP document, its related supporting documents, andexisting processes and structures, IAD reported that the Group has satisfactorily complied withthe minimum requirements prescribed in BSP Circular No. 639. Presence of a proper governanceand oversight function of the ICAAP, comprehensive risk management framework, and soundcapital management process were verified in the audit process. For 2020, the Group and ParentBank’s ICAAP Document was submitted to the BSP on March 20, 2020.
6. Segment Reporting
Business SegmentsThe Group’s main operating businesses are organized and managed separately according to thenature of products and services provided and the different markets served, with each segmentrepresenting a strategic business unit. These are also the basis of the Group in reporting to itschief operating decision-maker for its strategic decision-making activities. The Group’s mainbusiness segments are presented below.
(a) Consumer BankingThis segment principally handles individual customers’ deposits and provides consumer typeloans, such as automobiles and mortgage financing, credit card facilities and funds transferfacilities.
(b) Corporate and Commercial Banking
This segment principally handles loans and other credit facilities and deposit and currentaccounts for corporate, institutional, small and medium enterprises, and middle marketcustomers.
(c) Treasury
This segment is principally responsible for managing the Bank’s liquidity and fundingrequirements, and handling transactions in the financial markets covering foreign exchange,fixed income trading and investments, and derivatives.
(d) Headquarters
This segment includes corporate management, support and administrative units notspecifically identified with Consumer Banking, Corporate and Commercial Banking orTreasury.
These segments are the basis on which the Group reports its primary segment information.Transactions between segments are conducted at estimated market rates on an arm’s lengthbasis.
Segment resources and liabilities comprise operating resources and liabilities including itemssuch as taxation and borrowings. Revenues and expenses that are directly attributable to aparticular business segment and the relevant portions of the Group’s revenues and expensesthat can be allocated to that business segment are accordingly reflected as revenues andexpenses of that business segment.

Segment Reporting - 82 -
*SGVFSM005928*
Analysis of Segment InformationSegment information of the Group as of and for the years ended December 31, 2020, 2019 and2018 follow (amounts in millions):
Consumer
Banking
Corporate and
Commercial
Banking Treasury Headquarters Total
December 31, 2020
Results of operationsNet interest income and
other income P=17,244 P=10,776 P=14,558 (P=481) P=42,097
Other expenses (9,839) (2,556) (2,046) (6,932) (21,373)
Income before creditlosses and income tax P=7,405 P=8,220 P=12,512 (P=7,413) 20,724
Provision for credit losses (8,382)
Tax expense (781)
Net income P=11,561
Segment resources P=198,004 P=191,700 P=263,197 P=121,558 P=774,459
Segment liabilities P=325,529 P=142,167 P=137,240 P=64,371 P=669,307
Other information:Depreciation and amortization P=984 P=3 P=7 P=413 ₱1,407
Capital expenditures 370 163 19 1,030 1,582
ConsumerBanking
Corporate andCommercial
Banking Treasury Headquarters Total
December 31, 2019Results of operations
Net interest income andother income P=15,279 P=6,810 P=14,476 P=116 P=36,681
Other expenses (8,813) (2,044) (1,687) (7,781) (20,325)
Income before creditlosses and income tax P=6,466 P=4,766 P=12,789 (P=7,665) 16,356
Provision for credit losses (1,857)Tax expense (495)
Net income P=14,004
Segment resources P=177,147 P=255,308 P=279,820 P=58,513 P=770,788
Segment liabilities P=283,771 P=135,677 P=183,904 P=69,419 P=672,771
Other information:Depreciation and amortization P=714 P=14 P=15 P=635 ₱1,378Capital expenditures 377 491 12 1,667 2,547
ConsumerBanking
Corporate andCommercial
Banking Treasury Headquarters Total
December 31, 2018Results of operations
Net interest income andother income P=12,752 P=5,560 P=4,947 P=2,214 P=25,473
Other expenses (7,221) (1,809) (1,439) (6,234) (16,703)
Income before creditlosses and income tax P=5,531 P=3,751 P=3,508 (4,020) 8,770
Provision for credit losses (856)Tax expense (1,040)
Net income P=6,874
Segment resources P=160,639 P=218,001 P=255,622 P=35,250 P=669,512
Segment liabilities P=251,495 P=134,105 P=137,054 P=60,168 P=582,822
Other information:Depreciation andamortization P=269 P=29 P=12 P=806 ₱1,116Capital expenditures 426 142 47 1,714 2,329

Fair Value Measurement and Offsetting of Financial Assets and Financial Liabilities - 83 -
*SGVFSM005928*
7. Fair Value Measurement and Offsetting of Financial Assets and Financial Liabilities
Fair Value HierarchyIn accordance with PFRS 13, Fair Value Measurement, the fair value of financial assets andliabilities and non-financial assets which are measured at fair value on a recurring ornon-recurring basis and those assets and liabilities not measured at fair value but for which fairvalue is disclosed in accordance with other relevant PFRS, are categorized into three levels basedon the significance of inputs used to measure the fair value. The fair value hierarchy has thefollowing levels:
Level 1: quoted prices (unadjusted) in active markets for identical assets or liabilities;
Level 2: inputs other than quoted prices included within Level 1 that are observable for theresource or liability, either directly (i.e. as prices) or indirectly (i.e. derived from prices); and,
Level 3: inputs for the asset or liability that are not based on observable market data(unobservable inputs).
The level within which the financial asset or liability is classified is determined based on thelowest level of significant input to the fair value measurement.
For purposes of determining the market value at Level 1, a market is regarded as active if quotedprices are readily and regularly available from an exchange, dealer, broker, industry group,pricing service, or regulatory agency, and those prices represent actual and regularly occurringmarket transactions on an arm’s length basis.
For investments which do not have quoted market price, the fair value is determined by usinggenerally acceptable pricing models and valuation techniques or by reference to the currentmarket of another instrument which is substantially the same after taking into account the relatedcredit risk of counterparties, or is calculated based on the expected cash flows of the underlyingnet asset base of the instrument.
When the Group uses valuation technique, it maximizes the use of observable market data whereit is available and relies as little as possible on entity specific estimates. If all significant inputsrequired to determine the fair value of an instrument are observable, the instrument is included inLevel 2. Otherwise, it is included in Level 3.
For assets and liabilities that are recognized at fair value in the statement of financial position ona recurring basis, the Group determines whether transfers have occurred between Levels in thehierarchy by reassessing categorization (based on the lowest level input that is significant to thefair value measurement as a whole) at the end of each reporting period.

Fair Value Measurement and Offsetting of Financial Assets and Financial Liabilities - 84 -
*SGVFSM005928*
The financial assets and financial liabilities measured at fair value in the consolidated statementsof financial position are grouped into the fair value hierarchy as follows:
a) Financial instruments measured at fair value
Group
December 31, 2020
Level 1 Level 2 Level 3 Total
Resources
Financial assets at FVTPL
Debt securities P=15,012,469 P=– P=– P=15,012,469
Equity securities 2,586,451 138,490 28,775 2,753,716
Derivative assets − 637,082 45,382 682,464
Trust fund assets 65,833 − − 65,833
Financial assets at FVOCIDebt securities 31,148,586 − − 31,148,586
Equity securities − − 41,673 41,673
Liabilities
Derivative liabilities − 747,310 − 747,310
December 31, 2019
Level 1 Level 2 Level 3 Total
Resources
Financial assets at FVTPLDebt securities P=4,711,248 P=– P=– P=4,711,248Equity securities 2,579,979 138,750 30,223 2,748,952
Derivative assets − 358,351 47,850 406,201Trust fund assets 1,716,214 − − 1,716,214Financial assets at FVOCI
Debt securities 5,615,963 − − 5,615,963Equity securities − − 41,673 41,673
Liabilities
Derivative liabilities − 430,476 − 430,476
Parent Bank
December 31, 2020
Level 1 Level 2 Level 3 Total
Resources
Financial assets at FVTPL
Debt securities P=15,012,469 P=– P=– P=15,012,469
Equity securities 2,577,881 138,490 − 2,716,371
Derivative assets − 637,082 45,382 682,464
Financial assets at FVOCIDebt securities 30,967,368 − − 30,967,368
Equity securities − − 41,673 41,673
Liabilities
Derivative liabilities − 747,310 − 747,310
December 31, 2019
Level 1 Level 2 Level 3 Total
Resources
Financial assets at FVTPL
Debt securities P=4,711,248 P=– P=– P=4,711,248Equity securities 2,561,356 138,750 − 2,700,106Derivative assets − 358,351 47,850 406,201
Financial assets at FVOCIDebt securities 5,615,963 − − 5,615,963Equity securities − − 41,673 41,673
Liabilities
Derivative liabilities − 430,476 − 430,476

Fair Value Measurement and Offsetting of Financial Assets and Financial Liabilities - 85 -
*SGVFSM005928*
b) Financial instruments measured at amortized cost and investment properties for which fair
value is disclosed
Group
December 31, 2020
Carrying Value Level 1 Level 2 Level 3 Total
Resources
Financial Assets
Financial assets at amortized cost P=155,810,967 P=176,826,261 P=– P=– P=176,826,261
Loans and other receivables 339,536,830 − − 339,481,298 339,481,298
Nonfinancial Assets
Investment properties 8,922,366 − − 15,052,499 15,052,499
Liabilities
Financial Liabilities
Deposit liabilities 527,785,026 − – 527,967,468 527,967,468
Bills payable 54,223,543 – 54,550,042 − 54,550,042
Notes and bonds payable 59,853,656 – 72,725,976 − 72,725,976
December 31, 2019
Carrying Value Level 1 Level 2 Level 3 Total
Resources
Financial assets at amortized cost P=161,664,369 P=169,695,933 P=– P=– P=169,695,933Loans and other receivables 392,564,364 − − 391,334,944 391,334,944
Investment properties 9,127,581 − − 15,350,636 15,350,636
Liabilities
Deposit liabilities 484,336,040 − – 484,383,410 484,383,410
Bills payable 105,087,722 – 104,021,861 − 104,021,861Notes and bonds payable 49,331,506 – 50,556,036 − 50,556,036
Parent Bank
December 31, 2020
Carrying Value Level 1 Level 2 Level 3 Total
Resources
Financial assets at amortized cost P=153,171,111 P=176,223,481 P=– P=– P=176,223,481
Loans and other receivables 273,339,863 − − 273,284,331 273,284,331
Investment properties 7,662,547 − − 13,792,680 13,792,680
Liabilities
Deposit liabilities 465,228,619 − – 465,411,061 465,411,061
Bills payable 34,502,421 – 34,828,920 − 34,828,920
Notes and bonds payable 59,746,857 – 72,619,177 − 72,619,177
December 31, 2019
Carrying Value Level 1 Level 2 Level 3 Total
Resources
Financial assets at amortized cost P=161,664,369 P=169,695,933 P=– P=– P=169,695,933
Loans and other receivables 332,136,609 − − 331,668,134 331,668,134Investment properties 8,044,119 − − 14,000,308 14,000,308
Liabilities
Deposit liabilities 438,954,349 − – 439,001,719 439,001,719
Bills payable 92,149,256 – 91,083,395 − 91,083,395Notes and bonds payable 49,182,060 – 50,406,590 − 50,406,590
There were neither transfers between Levels 1 and 2 nor changes in Level 3 instruments in bothyears. Certain disclosures required for financial instruments classified as Level 3 are notpresented as these financial instruments are comprised of derivative assets and unquoted equitysecurities that are not material to the financial statements.

Fair Value Measurement and Offsetting of Financial Assets and Financial Liabilities - 86 -
*SGVFSM005928*
Below provided information about how the fair values of the Group’s classes of financialinstruments are determined.
(a) For Cash and other cash items, Due from BSP and other banks, Interbank loans receivable
and Returned checks and other cash items, and Other liabilities such as Manager’s checks,
Bills purchased, Accounts payable, Accrued interest payable, Payment orders payable andDue to Treasurer of the Philippines
Management considers that the carrying amounts approximate their fair value due to theirshort-term nature. Accordingly, these are not presented in the tables above.
(b) Debt securities
Fair values of debt securities under Level 1, composed of government securities issued by thePhilippine government and other foreign governments and private debt securities, aredetermined based on quoted prices at the close of business as appearing on Bloomberg.
(c) DerivativesThe fair values of derivative financial instruments that are not quoted in an active market aredetermined through valuation techniques using the net present value computation (seeNote 3). The inputs to these models are taken from observable markets where possible, butwhere this is not feasible, a degree of judgment is required in establishing fair values.
(d) Equity securities
Instruments included in Level 1 comprise equity securities classified as financial assets atFVTPL. These securities are valued based on their closing prices published by the PhilippineStock Exchange.
Club shares classified as financial assets at FVTPL are included in Level 2 as their prices arenot derived from market considered as active due to lack of trading activities among marketparticipants at the end or close to the end of the reporting period.
Equity instruments included in Level 3 are UIC’s investment in unquoted equity securitiesvalued using the adjusted net asset method. The adjusted net asset method involves derivingthe fair value of the investee’s equity instruments by reference to the fair value of its assetsand liabilities. Adjustments in the fair value of the investee’s net assets, such as discount forthe lack of liquidity, were also considered in the valuation. The Level 3 instruments are notmaterial to the consolidated financial statements.
(e) Loans and receivables, Deposit liabilities and Bills payable
The Group maximizes the use of observable market data where it is available and rely aslittle as possible on entity specific estimates. If all significant inputs required to determinethe fair value of an instrument are observable, the instrument is included in Level 2.Otherwise, it is included in Level 3.
(f) Notes and bonds payable
Fair values of notes and bonds payable under Level 2 are determined based on quoted pricesat the close of business as appearing on PDEx and Bloomberg. These are classified asLevel 2 due to absence of an active market.

Fair Value Measurement and Offsetting of Financial Assets and Financial Liabilities - 87 -
*SGVFSM005928*
(g) Investment properties
The fair values of the Group’s investment properties are determined on the basis of theappraisals performed by internal appraisers (for investment properties with values belowP=5 million) and independent appraisal companies acceptable to the BSP (for investmentproperties with fair values above P=5 million), with appropriate qualifications and recentexperience in the valuation of similar properties in the relevant locations. The valuationprocess is conducted by the appraisers with respect to the determination of the inputs such asthe size, age, and condition of the land and buildings, and the comparable prices in thecorresponding property location.
In estimating the fair value of these properties, appraisal companies take into account themarket participant’s ability to generate economic benefits by using the assets in their highestand best use. Based on management’s assessment, the best use of the Group’s non-financialassets indicated above is their current use.
The fair values of investment properties are determined using the market data approach thatreflects observable and recent transaction prices for similar properties in nearby locations.Under this approach, when sales prices of comparable property in close proximity are used inthe valuation of the subject property with no adjustment on the price, fair value is included inLevel 2. On the other hand, if the observable and recent prices of the reference propertieswere adjusted for differences in key attributes such as property size, zoning, andaccessibility, the fair value will be the lower level of the hierarchy or Level 3. The mostsignificant input into this valuation approach is the price per square meter, hence, the higherthe price per square meter, the higher the fair value.
There has been no change to the valuation techniques used by the Group during the year forits investment properties.
Offsetting Financial Assets and Financial LiabilitiesCertain financial assets and financial liabilities of the Group and the Parent Bank with amountspresented in the statements of financial position as of December 31, 2020 and 2019 are subject tooffsetting, enforceable master netting arrangements and similar agreements. However, therewere no financial assets and financial liabilities presented at net in the statements of financialposition.
Presented below is the financial assets and financial liabilities subject to offsetting but the relatedamounts are not set-off in the statements of financial position.
Group
December 31, 2020 December 31, 2019
Net amount
presented
in the statement
Related amounts not set off
in the statement of
financial position
Net amountpresented
in the statement
Related amounts not setoff in the statement of
financial position
of financial
position
Financial
Instruments
Collateral
Received Net Exposure
of financialposition
FinancialInstruments
CollateralReceived Net Exposure
Financial assets
Derivative assets
Currency forwards P=104,488 P=40,800 P=− P=63,688 P=233,731 P=121,064 P=− P=112,667
Cross currency interestrate swaps 532,594 488,217 − 44,377 124,620 114,278 − 10,342
Loans and receivables 1,157,126 − 1,157,126 − 1,118,264 − 1,118,264 −Total financial assets P=1,794,208 P=529,017 P=1,157,126 P=108,065 P=1,476,615 P=235,342 P=1,118,264 P=123,009
Financial liabilities
Derivative liabilities
Currency forwards P=258,434 P=40,800 P=− P=217,634 P=315,577 P=121,064 P=− P=194,513Cross currency swaps 488,876 488,217 − 659 114,899 114,278 − 621
Deposit liabilities 1,649,048 − 1,157,126 491,922 1,753,248 − 1,118,264 634,984
Total financial liabilities P=2,396,358 P=529,017 P=1,157,126 P=710,215 P=2,183,724 P=235,342 P=1,118,264 P=830,118
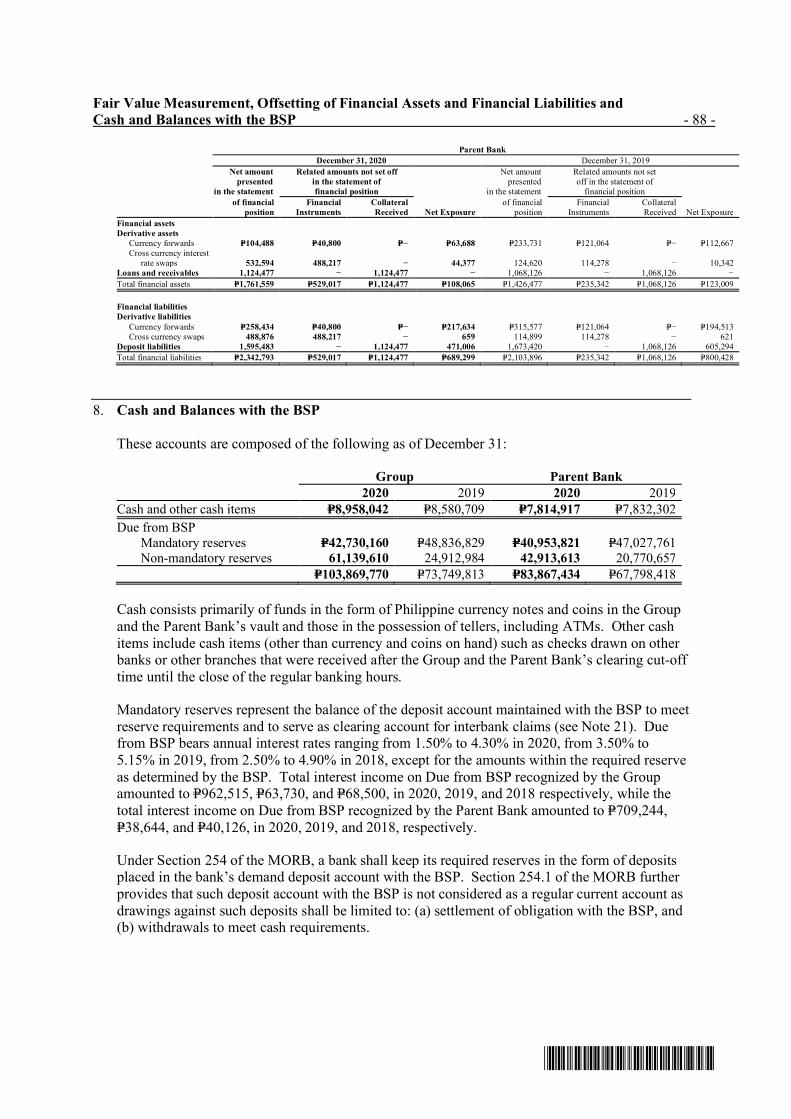
Fair Value Measurement, Offsetting of Financial Assets and Financial Liabilities and
Cash and Balances with the BSP - 88 -
*SGVFSM005928*
Parent Bank
December 31, 2020 December 31, 2019
Net amount
presented
in the statement
Related amounts not set off
in the statement of
financial position
Net amountpresented
in the statement
Related amounts not setoff in the statement of
financial position
of financial
position
Financial
Instruments
Collateral
Received Net Exposure
of financialposition
FinancialInstruments
CollateralReceived Net Exposure
Financial assets
Derivative assets
Currency forwards P=104,488 P=40,800 P=− P=63,688 P=233,731 P=121,064 P=− P=112,667 Cross currency interest
rate swaps 532,594 488,217 − 44,377 124,620 114,278 − 10,342Loans and receivables 1,124,477 − 1,124,477 − 1,068,126 − 1,068,126 −Total financial assets P=1,761,559 P=529,017 P=1,124,477 P=108,065 P=1,426,477 P=235,342 P=1,068,126 P=123,009
Financial liabilities
Derivative liabilities
Currency forwards P=258,434 P=40,800 P=− P=217,634 P=315,577 P=121,064 P=− P=194,513Cross currency swaps 488,876 488,217 − 659 114,899 114,278 − 621
Deposit liabilities 1,595,483 − 1,124,477 471,006 1,673,420 − 1,068,126 605,294
Total financial liabilities P=2,342,793 P=529,017 P=1,124,477 P=689,299 P=2,103,896 P=235,342 P=1,068,126 P=800,428
8. Cash and Balances with the BSP
These accounts are composed of the following as of December 31:
Group Parent Bank
2020 2019 2020 2019
Cash and other cash items P=8,958,042 P=8,580,709 P=7,814,917 P=7,832,302
Due from BSPMandatory reserves P=42,730,160 P=48,836,829 P=40,953,821 P=47,027,761Non-mandatory reserves 61,139,610 24,912,984 42,913,613 20,770,657
P=103,869,770 P=73,749,813 P=83,867,434 P=67,798,418
Cash consists primarily of funds in the form of Philippine currency notes and coins in the Groupand the Parent Bank’s vault and those in the possession of tellers, including ATMs. Other cashitems include cash items (other than currency and coins on hand) such as checks drawn on otherbanks or other branches that were received after the Group and the Parent Bank’s clearing cut-offtime until the close of the regular banking hours.
Mandatory reserves represent the balance of the deposit account maintained with the BSP to meetreserve requirements and to serve as clearing account for interbank claims (see Note 21). Duefrom BSP bears annual interest rates ranging from 1.50% to 4.30% in 2020, from 3.50% to5.15% in 2019, from 2.50% to 4.90% in 2018, except for the amounts within the required reserveas determined by the BSP. Total interest income on Due from BSP recognized by the Groupamounted to P=962,515, P=63,730, and P=68,500, in 2020, 2019, and 2018 respectively, while thetotal interest income on Due from BSP recognized by the Parent Bank amounted to P=709,244,P=38,644, and P=40,126, in 2020, 2019, and 2018, respectively.
Under Section 254 of the MORB, a bank shall keep its required reserves in the form of depositsplaced in the bank’s demand deposit account with the BSP. Section 254.1 of the MORB furtherprovides that such deposit account with the BSP is not considered as a regular current account asdrawings against such deposits shall be limited to: (a) settlement of obligation with the BSP, and(b) withdrawals to meet cash requirements.

Due from Other Banks, Interbank Loans Receivable and
Financial Assets at Fair Value through Profit or Loss - 89 -
*SGVFSM005928*
9. Due from Other Banks
The balance of this account consists of regular deposits with the following:
Group Parent Bank
2020 2019 2020 2019
Foreign banks P=64,419,921 P=67,802,099 P=64,419,921 P=70,759,121Local banks 4,112,297 5,873,610 343,847 738,105
P=68,532,218 P=73,675,709 P=64,763,768 P=71,497,226
The breakdown of this account as to currency follows:
Group Parent Bank
2020 2019 2020 2019
U.S. dollars P=62,691,820 P=69,617,555 P=62,184,086 P=69,536,843Philippine pesos 3,599,496 2,573,591 338,779 475,820Other currencies 2,240,902 1,484,563 2,240,903 1,484,563
P=68,532,218 P=73,675,709 P=64,763,768 P=71,497,226
Annual interest rates on these deposits range from 0.00% to 3.00% in 2020, from 0.80% to 6.13%in 2019, and from 0.00% to 6.80% in 2018. Total interest income on Due from other banksearned by the Group amounted to P=59,459, P=124,356, and P=138,958 in 2020, 2019, and 2018,respectively, while total interest income earned by the Parent Bank amounted to P=46,791,P=89,010, and P=108,662 in 2020, 2019 and 2018, respectively.
10. Interbank Loans Receivable
Interbank loans receivable consists of foreign currency-denominated loans granted to other bankswith terms ranging from 1 to 67 days in 2020 and from 6 to 14 days in 2019.
Interest income on interbank loans amounted to P=95,857, P=247,478, and P=107,254, in 2020,2019, and 2018, respectively, for the Group, and P=95,451, P=247,039, and P=126,167 in 2020,2019, and 2018, respectively, for the Parent Bank. Annual interest rates on interbank loansreceivable range from 0.01% to 4.00% in 2020, from 0.60% to 4.69% in 2019, and from 1.10%to 4.90% in 2018.
11. Financial Assets at Fair Value through Profit or Loss
The Group’s and Parent Bank’s financial assets at FVTPL as of December 31, 2020 and 2019consist of the following:
Group Parent Bank
2020 2019 2020 2019
Debt securities held for trading P=15,012,469 P=4,711,248 P=15,012,469 P=4,711,248
Equity securities designated
at FVTPL 2,753,716 2,748,952 2,716,371 2,700,106
Derivative assets 682,464 406,201 682,464 406,201
P=18,448,649 P=7,866,401 P=18,411,304 P=7,817,555
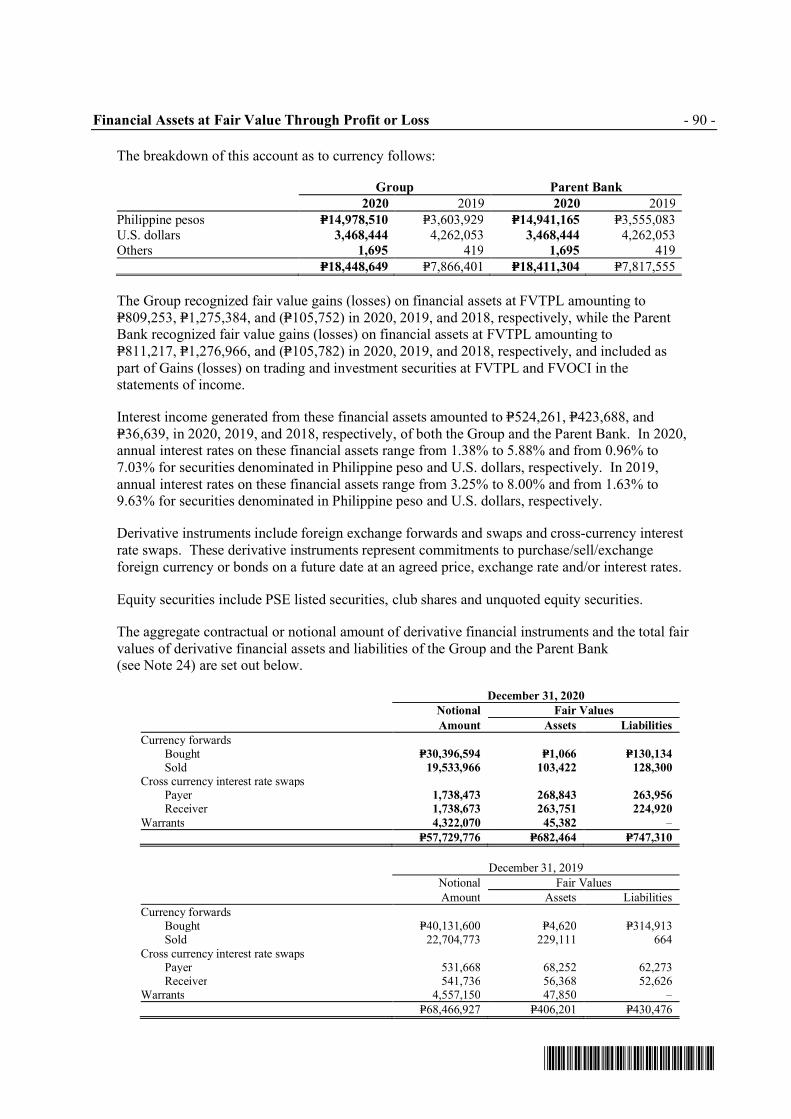
Financial Assets at Fair Value Through Profit or Loss - 90 -
*SGVFSM005928*
The breakdown of this account as to currency follows:
Group Parent Bank
2020 2019 2020 2019
Philippine pesos P=14,978,510 P=3,603,929 P=14,941,165 P=3,555,083U.S. dollars 3,468,444 4,262,053 3,468,444 4,262,053Others 1,695 419 1,695 419
P=18,448,649 P=7,866,401 P=18,411,304 P=7,817,555
The Group recognized fair value gains (losses) on financial assets at FVTPL amounting toP=809,253, P=1,275,384, and (P=105,752) in 2020, 2019, and 2018, respectively, while the ParentBank recognized fair value gains (losses) on financial assets at FVTPL amounting toP=811,217, P=1,276,966, and (P=105,782) in 2020, 2019, and 2018, respectively, and included aspart of Gains (losses) on trading and investment securities at FVTPL and FVOCI in thestatements of income.
Interest income generated from these financial assets amounted to P=524,261, P=423,688, andP=36,639, in 2020, 2019, and 2018, respectively, of both the Group and the Parent Bank. In 2020,annual interest rates on these financial assets range from 1.38% to 5.88% and from 0.96% to7.03% for securities denominated in Philippine peso and U.S. dollars, respectively. In 2019,annual interest rates on these financial assets range from 3.25% to 8.00% and from 1.63% to9.63% for securities denominated in Philippine peso and U.S. dollars, respectively.
Derivative instruments include foreign exchange forwards and swaps and cross-currency interestrate swaps. These derivative instruments represent commitments to purchase/sell/exchangeforeign currency or bonds on a future date at an agreed price, exchange rate and/or interest rates.
Equity securities include PSE listed securities, club shares and unquoted equity securities.
The aggregate contractual or notional amount of derivative financial instruments and the total fairvalues of derivative financial assets and liabilities of the Group and the Parent Bank(see Note 24) are set out below.
December 31, 2020
Notional Fair Values
Amount Assets Liabilities
Currency forwardsBought P=30,396,594 P=1,066 P=130,134
Sold 19,533,966 103,422 128,300
Cross currency interest rate swapsPayer 1,738,473 268,843 263,956
Receiver 1,738,673 263,751 224,920
Warrants 4,322,070 45,382 –
P=57,729,776 P=682,464 P=747,310
December 31, 2019
Notional Fair Values
Amount Assets Liabilities
Currency forwardsBought P=40,131,600 P=4,620 P=314,913
Sold 22,704,773 229,111 664Cross currency interest rate swaps
Payer 531,668 68,252 62,273Receiver 541,736 56,368 52,626
Warrants 4,557,150 47,850 –
P=68,466,927 P=406,201 P=430,476

Financial Assets at Amortized Cost - 91 -
*SGVFSM005928*
12. Financial Assets At Amortized Cost
The Group’s and the Parent Bank’s financial assets at amortized cost as of December 31, 2020and 2019 consist of the following:
Group Parent Bank
2020 2019 2020 2019
Government bonds and other
debt securities P=151,811,690 P=159,921,013 P=149,211,834 P=159,921,013
Private bonds and commercial
papers 4,338,979 1,856,760 4,298,979 1,856,760
156,150,669 161,777,773 153,510,813 161,777,773
Allowance for impairment
(Note 20) (339,702) (113,404) (339,702) (113,404)
P=155,810,967 P=161,664,369 P=153,171,111 P=161,664,369
Investment securities of both the Group and the Parent Bank with an aggregate principal amountof P=26,606,840 and P=66,431,000 as of December 31, 2020 and 2019, respectively, were pledgedas collaterals for bills payable under repurchase agreements (see Note 22).
The breakdown of this account as to currency as of December 31, 2020 and 2019 follows:
Group Parent Bank
2020 2019 2020 2019
U.S. dollars P=74,726,779 P=92,139,645 P=74,726,779 P=92,139,645Philippine pesos 79,245,005 67,751,234 76,605,149 67,751,234Others 1,839,183 1,773,490 1,839,183 1,773,490
P=155,810,967 P=161,664,369 P=153,171,111 P=161,664,369
Financial assets at amortized cost denominated in Philippine pesos have fixed interest ratesranging from 1.69% to 7.13% per annum in 2020 and from 3.38% to 18.25% per annum in 2019and 2018, while financial assets at amortized cost denominated in U.S. dollars and Euros havefixed interest rates ranging from 2.31% to 7.11% per annum in 2020, from 2.25% to 9.63% perannum in 2019 and from 2.25% to 9.50% per annum in 2018. These bonds have remainingmaturities of 1 year to 29 years and 1 year to 31 years as at December 31, 2020 and 2019,respectively.
Interest income generated from these financial assets, including amortization of premium ordiscount, amounted to P=7,202,846, P=9,138,830, and P=7,539,909 in 2020, 2019, and 2018,respectively, by the Group, and P=7,061,489, P=9,138,830, and P=7,539,909 in 2020, 2019, and2018, respectively, by the Parent Bank. This is shown as part of Interest income on investmentsecurities at amortized cost and FVOCI account in the statements of income.
In 2020, the Parent Bank sold investment securities classified as Investment securities atamortized cost with carrying amount of P=57.75 billion, resulting in gains totaling P=5.11 billion.In 2019, the Parent Bank sold investment securities classified as Investment securities atamortized cost with carrying amount of $1,054.04 million (P=53.5 billion), resulting in gainstotaling P=7.07 billion. In 2018, The Parent Bank exchanged outstanding securities classified asInvestment securities at amortized cost with total carrying amount of $121.28 million(P=6.4 billion), resulting in Gain on sale of investment securities at amortized cost amounting toP=152.2 million (see Note 3).

Financial Assets at Amortized Cost and
Financial Assets at Fair Value Through Other Comprehensive Income - 92 -
*SGVFSM005928*
Government bonds with aggregate face value of P=800,000 and P=650,000 as ofDecember 31, 2020, and 2019, respectively, are deposited with BSP as security for the Bank’sfaithful compliance with its fiduciary obligations (see Note 31).
13. Financial Assets at Fair Value Through Other Comprehensive Income
The Group’s and the Parent Bank’s financial assets at FVOCI as of December 31, 2020 and 2019consist of the following:
Group Parent Bank
2020 2019 2020 2019
Debt securities:Government bonds P=20,237,695 P=5,560,643 P=20,185,986 P=5,560,643
Private bonds and
commercial papers 10,910,891 55,320 10,781,382 55,320Equity securities 41,673 41,673 41,673 41,673
P=31,190,259 P=5,657,636 P=31,009,041 P=5,657,636
The breakdown of this account as to currency as of December 31, 2020 and 2019 follows:
Group Parent Bank
2020 2019 2020 2019
U.S. dollars P=22,949,310 P=2,585,640 P=22,949,310 P=2,585,640Philippine pesos 8,240,949 3,071,996 8,059,731 3,071,996
P=31,190,259 P=5,657,636 P=31,009,041 P=5,657,636
The Group has designated the above local equity securities as at FVOCI because they are held forlong-term investments and are neither held-for-trading nor designated as at FVTPL. Unquotedequity securities pertain to golf club shares and investments in non-marketable equity securities.
Debt securities denominated in Philippines pesos have interest rates ranging from 3.70% to5.33% per annum for 2020, 5.75% to 8.00% per annum for 2019, and from 6.0% to 8.1% perannum in 2018, while debt securities denominated in U.S. dollars have interest rates ranging from1.03% to 8.43% per annum in 2020, 1.63% to 7.38% per annum in 2019, and 2.9% to 7.5% perannum in 2018. Interest income, including amortization of premium or discount, amounted toP=881,817 and P=875,707 in 2020 for the Group and Parent Bank, respectively, and P=353,060 andP=296,250 in 2019 and 2018, respectively, for both the Group and Parent Bank, and is shown aspart of Interest income on investment securities at amortized cost and FVOCI account in thestatements of income.
In 2020, 2019 and 2018, the Group and the Parent Bank recognized gains from the sale ofinvestments securities at FVOCI amounting to P=3.0 billion, P=1.1 billion and P=1.5 billion,respectively. The amounts are included under Gains (losses) on trading and investmentssecurities at FVTPL and FVOCI in the statements of income.

Loans and Other Receivables - 93 -
*SGVFSM005928*
14. Loans and Other Receivables
The Group’s and the Parent Bank’s loans and other receivables as of December 31, 2020 and2019 consist of the following:
Group Parent Bank
December 31 December 31
2020 2019 2020 2019
Receivables from customers:Loans and discounts P=313,440,863 P=343,432,112 P=253,976,998 P=290,281,029
Customers’ liabilities underacceptances and trust receipts 7,525,880 6,846,490 7,525,880 6,846,490
Bills purchased 1,002,263 5,332,092 1,002,263 5,332,092Accrued interest receivable 4,173,094 2,198,261 2,942,144 2,150,482
326,142,100 357,808,955 265,447,285 304,610,093Unearned discounts (1,529,187) (1,734,026) (133,458) (137,084)
Allowance for impairment(Note 20) (10,473,864) (6,871,905) (7,691,647) (5,307,190)
314,139,049 349,203,024 257,622,180 299,165,819
Other receivables:SPURRA 16,745,090 34,773,704 10,373,294 28,446,976Accounts receivable 5,416,251 5,644,144 2,251,211 1,628,932Accrued interest receivable 2,739,153 2,453,309 2,648,608 2,448,627Sales contracts receivable 1,536,891 1,448,587 1,456,203 1,437,620UDSCL 191 46,322 – –Installment contracts receivable 4,243 5,689 – –
26,441,819 44,371,755 16,729,316 33,962,155 Allowance for impairment
(Note 20) (1,044,038) (1,010,415) (1,011,633) (991,365)
25,397,781 43,361,340 15,717,683 32,970,790
P=339,536,830 P=392,564,364 P=273,339,863 P=332,136,609
Restructured loans amounted to P=756,326 and P=1,483,100 as of December 31, 2020 and 2019,respectively, for the Group, and P=653,761 and P=1,365,267 as of December 31, 2020 and 2019,respectively, for the Parent Bank. Interest income on these restructured loans amounted toP=9,067, P=11,942, and P=14,491 in 2020, 2019, and 2018, respectively, for the Group, and P=6,126,P=9,796, and P=9,198 in 2020, 2019, and 2018, respectively, for the Parent Bank.
The maturity profile of loans and other receivables (net of unearned discounts) follows:
Group Parent Bank
2020 2019 2020 2019
Less than one year P=111,744,275 P=140,620,615 P=90,445,312 P=128,461,383One year to less than five years 132,122,394 123,301,534 84,911,197 88,622,483Beyond five years 107,188,063 136,524,535 106,686,634 121,351,298
P=351,054,732 P=400,446,684 P=282,043,143 P=338,435,164
Loans and other receivables bear annual interest ranging from 4.00% to 14.00% in 2020, from4.00% to 18.00% in 2019, and from 4.00% to 17.94% in 2018.

Loans and Other Receivables and
Investments in Subsidiaries and Associates - 94 -
*SGVFSM005928*
The breakdown of loans (receivable from customers excluding accrued interest receivable) as to type ofinterest rate follows:
Group Parent Bank
2020 2019 2020 2019
Variable interest rates P=239,823,493 P=191,751,315 P=239,823,493 P=191,751,315Fixed interest rates 82,145,513 163,859,379 22,681,648 110,708,296
P=321,969,006 P=355,610,694 P=262,505,141 P=302,459,611
The amounts of interest income per type of loans and receivables for each reporting period are asfollows:
Group
2020 2019 2018
Receivables from customers P=28,287,521 P=27,391,437 P=22,847,102Other receivables:
SPURRA 444,275 439,331 390,270Sales contracts receivable 118,611 172,600 143,700Installment contracts receivable 514 614 1,042UDSCL – – 7,810Others 18 31 51,786
P=28,850,939 P=28,004,013 P=23,441,710
Parent Bank
2020 2019 2018
Receivables from customers P=19,689,313 P=18,885,639 P=14,774,556Other receivables:
SPURRA 273,324 185,145 126,947Sales contracts receivable 113,383 166,339 137,003
P=20,076,020 P=19,237,123 P=15,038,506
15. Investments in Subsidiaries and Associates
Investment in Subsidiaries
This account in the Parent Bank’s financial statements pertains to investments in the followingsubsidiaries, which are accounted for using the equity method:
% Interest 2020 2019
Acquisition costs:CSB 99.79% P=6,746,861 P=6,746,861UIC 100% 924,861 712,361UBX 100% 600,000 400,000FUPI 100% 290,002 −UBPSI 100% 5,000 5,000UDC 100% 3,125 3,125UBPIBI 100% 2,500 2,500UCBC 100% 1,000 1,000
P=8,573,349 P=7,870,847

Investments in Subsidiaries and Associates - 95 -
*SGVFSM005928*
The movement of investments in subsidiaries is shown below:
2020 2019 2018
Acquisition costs:Beginning balances P=7,870,847 P=7,383,347 P=7,381,600Additional investments 702,502 487,500 1,747
8,573,349 7,870,847 P=7,383,347
Accumulated equity in total comprehensiveincome:Beginning balances 12,652,786 11,517,277 9,715,896Share in net profit (Note 28)* 953,082 1,222,595 1,775,210Impairment on investment in FUPI (290,002) − −
Share in other comprehensiveincome (loss) (Note 29) (21,228) (87,086) 26,171
13,294,638 12,652,786 11,517,277
Net investment in subsidiaries P=21,867,987 P=20,523,633 P=18,900,624
*The share in net profit for CSB in 2020 is net of goodwill impairment charge of P=223.2 million
The Parent Bank’s subsidiaries are all incorporated in the Philippines. The principal place ofbusiness of these subsidiaries is in Metro Manila, Philippines except for CSB and FAIR Bank,which have their principal place of operations in Cebu, Philippines.
Purchase of preferred shares issued by FUPI
In October 2020, the Parent Bank subscribed to FUPI’s non-voting, non-cumulative andredeemable preferred shares for a total consideration of P=290 million. The subscription was usedto support FUPI in meeting its maturing pre-need plans during 2020. As of December 31, 2020,the Parent Bank assessed that the preferred shares will not be redeemed or settled in theforeseeable future, as FUPI will not be generating additional income or revenues movingforward. The Parent Bank provided a full valuation allowance of P=290 million, presented underMiscellaneous expense (see Note 28). This transaction is eliminated in the consolidation and hasno impact on the consolidated financial statements.
Acquisition of Bangko Kabayan
In February 2019, CSB and UIC acquired 70% ownership, with CSB owning 49% and UICowning 21% (See Note 1). For convenience purposes, the Group used March 31, 2020 as thedate of business combination.
Other than Cash and other cash items, Due from BSP, and Due from other banks, the Groupdetermined the provisional fair values of identifiable assets and liabilities acquired, which willbe adjusted once relevant information has been obtained, including the valuation of externalappraisers. The provisional fair values of the identifiable assets and liabilities acquired at thedate of acquisition are as follows (amounts in thousands):
Provisional fairvalues recognized
on acquisitiondate
Assets
Cash and other cash items P=70,628Due from BSP 323,440Due from other banks 325,770Investment securities 328,132Loans and receivables 1,953,472

Investments in Subsidiaries and Associates - 96 -
*SGVFSM005928*
Provisional fairvalues recognized
on acquisitiondate
Bank premises, furniture and fixtures, and equipment P=183,352Investment properties 253,400Other resources 41,224
Total assets 3,479,418
Liabilities
Deposit liabilities 2,546,758Other liabilities 124,651
Total liabilities 2,671,409
Net assets acquired P=808,009
The provisional goodwill from the acquisition is determined as follows (amounts in thousands):
Purchase price P=681,745Share in fair value of net assets acquired:
Provisional fair values of net assets acquired 808,009 Less: Proportionate share of non-controlling
interest 242,403 565,606
Provisional Goodwill P=116,139
The goodwill arising from the acquisition is attributed to expected synergies in the operations ofthe Group and Bangko Kabayan and the planned expansion of network to rural areas and extendthe digital products offered by the Parent Bank. None of the goodwill recognized is expected tobe deductible for income tax purposes.
The provisional fair value of the loans and receivables acquired as part of the businesscombination amounted to P=1.95 billion, with gross contractual amount of P=2.04 billion.
Net cash outflow related to the acquisition of Bangko Kabayan amounted to P=38.09 million, netof cash acquired.
In 2020, Bangko Kabayan reported a total operating income and net income of P=313.16 millionand P=43.69 million, respectively. Had the acquisition occurred at the beginning of 2020, theconsolidated operating income and consolidated net profit would have increased byP=92.73 million and P=17.83 million, respectively.
Acquisition of PBI
On January 5, 2018, CSB and UIC acquired 75% ownership of PBI (see Note 1).
Other than Cash and other cash items, Due from BSP, and Due from other banks, the Groupdetermined the provisional fair values of identifiable assets and liabilities acquired, which will beadjusted once relevant information has been obtained, including the valuation of externalappraisers of the bank premises and investment properties. The provisional fair values of theidentifiable assets and liabilities acquired at the date of acquisition are as follows (amounts inthousands):

Investments in Subsidiaries and Associates - 97 -
*SGVFSM005928*
Provisional fairvalues recognized
on acquisitiondate
Assets
Cash and other cash items P=27,285Due from BSP 12,994Due from other banks 158,189Loans and receivables 252,407Bank premises, furniture and fixtures, and equipment 41,771Investment properties 4,595Other resources 22,917
Total assets 520,158
Liabilities
Deposit liabilities 387,633Other liabilities 21,471
Total liabilities 409,104
Net assets acquired P=111,054
The gain on bargain purchase (provisional) from the acquisition is determined as follows(amounts in thousands):
Purchase price P=58,000Share in fair value of net assets acquired:
Provisional fair values of net assets acquired P=111,054 Less: Proportionate share of non-controlling
interest 27,763 83,291
Gain on Bargain Purchase (provisional) P=25,291
The provisional fair value of the loans and receivables acquired as part of the businesscombination amounted to P=252.41 million, with gross contractual amount of P=360.56 million.Net cash inflow related to the acquisition of PBI amounted to P=140.47 million, net of cashacquired.
In 2020, PBI reported a total operating income and net loss of P=85.68 million and P=32.55 million,respectively. Had the acquisition occurred at the beginning of 2020, the consolidated operatingincome and consolidated net profit would have increased by P=49.31 million and decreased byP=14.74 million, respectively.
Incorporation of UBX and UBX SG
On February 11, 2019, the BSP approved the Parent Bank’s incorporation of UBX. The ParentBank subscribed and paid P=400.0 million for the capital stock of UBX.
In October 2018, UIC incorporated UBX SG. UBX then entered into a share purchase agreementwith UIC, also a wholly owned subsidiary of the Parent Bank, to purchase 100 ordinary shares ofUBX SG for a total consideration amounting to SGD100.
On May 9, 2019, UBX acquired 30% of Shiptek Solutions Corporation's (Shiptek) outstandingcapital stock for a total consideration amounting to P=80.0 million. Shiptek is incorporated in thePhilippines to operate, conduct and maintain the business of developing, marketing, selling,

Investments in Subsidiaries and Associates - 98 -
*SGVFSM005928*
distributing and/or licensing the logistics solution technology known as XLOG. Shiptek isaccounted for as an investment in associate in the Group’s financial statements.
On September 6, 2019, UBX acquired 35% of CC Mobile Financial Services Philippines, Inc.(CCPH) outstanding capital stock for a total consideration amounting to P=50.0 million. CCPHwas incorporated in the Philippines to engage in the business of a financing company byextending credit facilities, by discounting or factoring commercial paper or accounts receivable,by sales finance, by buying and selling contracts, leases, chattel mortgages, or other evidences ofindebtedness, or by financial or operating leasing of movable as well as immovable property, andreal estate mortgages, without engaging in quasi-banking functions or trust operations. CCPH isaccounted for as an investment in associate in the Group’s financial statements.
On February 21, 2020, UBX SG acquired 25% of Pacific Payments Pte. Ltd. (PPPL)’soutstanding capital for a total consideration amounting to $1.6 million (P=50.0 million). PPPL is aholding company that was incorporated in Singapore in November 2014.
Acquisition of PR Savings Bank
As discussed in Note 1, in June 2018, CSB acquired 100% ownership of PR Savings Bank. Thetransaction is accounted for as a business combination. The acquisition date, which is the finalapproval of the BSP, is on June 14, 2018. For convenience purposes, CSB used June 30, 2018 asthe date of the business combination.
The total consideration for the acquisition of PR Savings Bank amounted to P7.02 billion,P300.00 million of which shall be released by CSB directly to a Joint Venture (JV) Company.The sellers shall cause the relevant Ropali Group entity to execute a joint venture agreementwith CSB to form an incorporated JV Company engaged in motorcycle dealership withinone year from closing date or such longer period as the parties may agree upon in writing.On June 22, 2020, CSB and the Ropali Group came to a mutual understanding to deferthe incorporation of the JV due to challenges created by the COVID-19 pandemic.The P=300.0 million balance was released by CSB to the Ropali Group with the expectation thatthe same amount shall be delivered by the Ropali Group as its capital contribution uponincorporation of the JV.
In December, 2019, the previous shareholders of PR Savings Bank agreed to carve out certainassets and settle certain claims totaling P=338.54 million, which was deducted from the escrowamount, i.e. reduction from the agreed purchase price.
The final fair values of the identifiable assets and liabilities acquired at the date of acquisition areas follows (amounts in thousands):
Finalfair values
Assets
Cash and other cash items P=59,281Due from BSP and Other Banks 870,689Loans and receivables 8,726,594Property and equipment 862,726Investment properties 762,223Deferred tax assets –Other resources 862,731
Total assets 12,144,244

Investments in Subsidiaries and Associates - 99 -
*SGVFSM005928*
Finalfair values
Liabilities
Deposit liabilities P=4,419,570Bills payable 4,323,572Other liabilities 205,838
Total liabilities 8,948,980
Net assets acquired P=3,195,264
The acquisition resulted in goodwill determined as follows:
Consideration for the common shares P=5,789,185Consideration for the preferred shares held by IFC 888,274
Purchase price 6,677,459Fair value of net assets acquired 3,195,264
Final goodwill P=3,482,195
The acquisition of PR Savings Bank was to primarily gain a foothold in the motorcycle lendingbusiness. Accordingly, the entire goodwill arising from the PR Savings Bank acquisition wasattributed to the Motorcycle Loans Business CGU for the purpose of impairment testing (seeNote 18). The goodwill arising from the acquisition is attributed to expected synergies from thefuture growth of the motorcycle lending business through the benefits of combined talent andtechnology. None of the goodwill recognized is expected to be deductible for income taxpurposes.
The fair value of the loans and receivables acquired as part of the business combinationamounted to P=8.7 billion, with gross contractual amount of P=9.5 billion. Net cash outflow relatedto the acquisition PR Savings Bank amounted to P=5.79 billion, net of cash acquired.
On December 20, 2018, the Monetary Board of BSP granted certain merger incentives, includingtemporary relief from compliance with the minimum CAR of 10% on solo basis for both the CSBand PRSB from June 2018 until the effectivity of the merger, provided that the CSB’s CAR shallnot fall below 7%; ten-year amortization of the goodwill recognized by the BSP from July 2018to June 2028, and staggered booking of loan impairment determined based on BSP’sexamination of PR Savings Bank as of June 30, 2018 over a period of 5 years to start on the yearthe merger becomes effective. Subsequently, CSB recognized outright a significant amount ofthis required loan impairment as part of the determination of the final fair value of assetsacquired at the date of the business combination.
CSB’s CAR, after the effectivity of the merger, increased from 8.9% in December 2018 to 11.9%in March 2019. For prudential reporting, the CSB is amortizing the goodwill approved by theBSP. The difference between the final goodwill under PFRS and the BSP approved goodwillwas reflected as a reduction in Retained Earnings for prudential reporting to the BSP.

Investments in Subsidiaries and Associates - 100 -
*SGVFSM005928*
Acquisition of PETNET
As discussed in Note 1, in February 2018, CSB and UIC purchased of 2,461,338 common sharesrepresenting 51% ownership of AEVI on PETNET. On December 17, 2018, the parties closedthe transaction by settling the purchase price and confirming that all closing conditions have beenfulfilled. For convenience purposes, the Group used December 31, 2018 as the date of thebusiness combination.
The fair values of the identifiable assets and liabilities acquired at the date of acquisition are asfollows (amounts in thousands):
Final fair values
Assets
Cash and other cash items P=618,253Due from other banks 2,551Loans and receivables 445,965Investment in an associate 27,098Property and equipment 49,384Other resources 137,987
Total assets P=1,281,238
Liabilities
Notes and bonds payable 36,806Other liabilities 265,914
Total liabilities P=302,720
Net assets acquired P=978,518
The acquisition resulted in goodwill determined as follows:
Purchase price P=1,200,001Share in fair value of net assets acquired:
Fair values of net assets acquired P=978,518 Less: Proportionate share
of non-controlling interest 493,635 484,883
Final goodwill P=715,118
The goodwill arising from the acquisition is attributed to the expected increase in network of theGroup’s agency banking services. None of the goodwill recognized is expected to be deductiblefor income tax purposes.
Net cash outflow related to the acquisition PETNET amounted to P=579.20 million, net of cashacquired.

Investments in Subsidiaries and Associates and
Bank Premises, Furniture, Fixtures and Equipment - 101 -
*SGVFSM005928*
Investment in AssociatesAs of December 31, 2020 and 2019, the Group has investment in associates with aggregatecarrying amounts of P=255,342 and P=159,094, respectively. The aggregate share in losses onthese associates amounted to P=3,665, P=464, and P=8 for the years ended December 31, 2020,2019, and 2018, respectively.
Summarized Financial Information
The following table presents the financial information for CSB, FAIR Bank, PETNET, UIC andUBX, Bangko Kabayan and PBI as of and for the years ended December 31, 2020 and 2019:
Assets Liabilities Revenues
Net Profit
(Loss)
2020
CSB P=99,152,408 P=82,144,535 P=9,262,926 P=1,229,886
FAIR Bank 414,799 270,220 81,701 (78,111)
PETNET 1,444,374 456,684 581,823 17,278
UIC 1,313,549 318,940 153,123 (19,467)
UBX 406,144 107,602 86,761 (206,660)
Bangko Kabayan 3,477,142 2,854,077 274,504 23,165
PBI 423,972 355,310 78,293 (19,090)
2019
CSB P=77,416,639 P=61,407,021 P=9,078,157 P=1,439,131FAIR Bank 541,436 354,401 126,561 (35,821)PETNET 1,273,860 296,017 620,381 (41,820)UIC 2,737,603 2,186,963 250,211 7,474UBX 387,073 57,775 25,928 (67,153)
16. Bank Premises, Furniture, Fixtures and Equipment
The gross carrying amounts and accumulated depreciation and amortization of bank premises,furniture, fixtures and equipment as of December 31, 2020 and 2019 are shown below.
Group
Land Buildings
Furniture,
Fixtures and
Equipment
Right-of-use
Asset
Leasehold
Rights and
Improvements Total
December 31, 2020
Cost P=859,082 P=3,090,141 P=4,644,666 P=2,160,838 P=1,646,529 P=12,401,256
Accumulated depreciation and
amortization − (758,245) (2,713,265) (1,034,218) (1,000,760) (5,506,488)
Net carrying amounts P=859,082 P=2,331,896 P=1,931,401 P=1,126,620 P=645,769 P=6,894,768
December 31, 2019Cost P=765,374 P=2,783,641 P=4,184,851 P=1,766,048 P=1,348,799 P=10,848,713
Accumulated depreciation andamortization − (626,335) (2,347,347) (504,841) (869,547) (4,348,070)
Net carrying amounts P=765,374 P=2,157,306 P=1,837,504 P=1,261,207 P=479,252 P=6,500,643

Bank Premises, Furniture, Fixtures and Equipment - 102 -
*SGVFSM005928*
Parent Bank
Land Buildings
Furniture,
Fixtures and
Equipment
Right-of-use
Asset
Leasehold
Rights and
Improvements Total
December 31, 2020
Cost P=248,301 P=2,621,552 P=3,470,711 P=1,746,750 P=792,390 P=8,879,704
Accumulated depreciation and
amortization – (537,368) (1,738,353) (810,804) (267,813) (3,354,338)
Net carrying amounts P=248,301 P=2,084,184 P=1,732,358 P=935,946 P=524,577 P=5,525,366
December 31, 2019
Cost P=248,301 P=2,468,812 P=3,106,903 P=1,433,164 P=556,948 P=7,814,128
Accumulated depreciation and
amortization – (509,424) (1,411,031) (403,550) (195,528) (2,519,533)
Net carrying amounts P=248,301 P=1,959,388 P=1,695,872 P=1,029,614 P=361,420 P=5,294,595
A reconciliation of the carrying amounts at the beginning and end of 2020 and 2019 of thisaccount (including right-of-use assets) is shown below:
Group
Land Buildings
Furniture,
Fixtures and
Equipment
Right-of-Use
Assets
Leasehold
Rights and
Improvements Total
Balances at January 1, 2020, net of
accumulated depreciation andamortization P=765,374 P=2,157,306 P=1,837,504 P=1,261,207 P=479,252 P=6,500,643
Additions – 153,345 582,113 386,508 290,905 1,412,871
Disposals – – (21,058) − – (21,058)
Reclassifications/adjustments – 15,312 (29,718) (23,118) (4,960) (42,484)
Depreciation and amortization
charges for the year – (60,910) (466,683) (521,521) (131,213) (1,180,327)
Effect of business combinations(Note 15) 93,708 66,843 29,243 23,544 11,785 225,123
Balances at December 31, 2020,net of accumulateddepreciation and amortization P=859,082 P=2,331,896 P=1,931,401 P=1,126,620 P=645,769 P=6,894,768
Group
Land Buildings
Furniture,
Fixtures andEquipment
Right-of-UseAssets
Leasehold
Rights andImprovements Total
Balances at January 1, 2019, net of
accumulated depreciation andamortization P=814,032 P=1,920,198 P=1,793,568 P=– P=581,045 P=5,108,843
Effect of adoption of PFRS 16 – – – 1,241,094 – 1,241,094
Additions – 314,721 535,946 524,954 83,886 1,459,507Disposals (62,549) (23,402) (38,417) – – (124,368)Reclassifications/adjustments – (15,178) 17,009 – (12,793) (10,962)
Depreciation and amortizationcharges for the year – (64,429) (470,602) (504,841) (172,886) (1,212,758)
Adjustments to provisional fair
value (Note 15) 13,891 25,396 – – – 39,287
Balances at December 31, 2019,
net of accumulateddepreciation and amortization P=765,374 P=2,157,306 P=1,837,504 P=1,261,207 P=479,252 P=6,500,643

Bank Premises, Furniture, Fixtures and Equipment - 103 -
*SGVFSM005928*
Parent Bank
Land Buildings
Furniture,
Fixtures and
Equipment
Right-of-Use
Assets
Leasehold
Rights and
Improvements Total
Balances at January 1, 2020, net ofaccumulated depreciation and
amortization P=248,301 P=1,959,388 P=1,695,872 P=1,029,614 P=361,420 P=5,294,595
Additions – 152,528 479,720 376,639 235,442 1,244,329
Disposals – – (11,903) – – (11,903)
Reclassifications/adjustments – 15,275 (47,434) (31,996) – (64,155)
Depreciation and amortizationcharges for the year – (43,007) (383,897) (438,311) (72,285) (937,500)
Balances at December 31, 2020,net of accumulateddepreciation and amortization P=248,301 P=2,084,184 P=1,732,358 P=935,946 P=524,577 P=5,525,366
Balances at January 1, 2019, net of
accumulated depreciation andamortization P=289,619 P=1,717,661 P=1,592,923 P=– P=356,812 P=3,957,015
Effect of adoption of PFRS 16 – – – 1,014,624 – 1,014,624
Additions – 312,901 461,688 418,540 35,654 1,228,783Disposals (41,318) (23,402) (20,038) – – (84,758)Reclassifications/adjustments – (5,324) 2,434 – – (2,890)
Depreciation and amortizationcharges for the year – (42,448) (341,135) (403,550) (31,046) (818,179)
Balances at December 31, 2019 netof accumulated depreciationand amortization P=248,301 P=1,959,388 P=1,695,872 P=1,029,614 P=361,420 P=5,294,595
The Group has leases for branch offices, parking lots, stalls for specific events, signage and
computer equipment. With the exception of short-term leases and leases of low-value underlying
assets, each lease is reflected on the consolidated statement of financial position as a ROU asset and
a lease liability.
Generally, the Group is restricted from assigning and subleasing the leased assets. The lease
contracts are cancellable upon mutual agreement of the parties or renewable under certain terms
and conditions. Various lease contracts include escalation clauses, most of which bear an annual
rent increase of 5% to 10%. As of December 31, 2020 and 2019, the Group has neither a
contingent rent payable nor an asset restoration obligation in relation with these lease agreements.
The Group’s leasing activities qualified to recognize ROU assets mainly comprise of branch offices
and parking lots with remaining lease terms ranging from 1 to 10 years.
The details of depreciation and amortization in the consolidated statements of income follow:
Group
2020 2019 2018
Bank premises, furniture, fixtures and equipment P=658,806 P=707,917 P=539,915Investment properties (Note 17) 358,351 371,529 372,198Computer software (Note 19) 286,680 216,112 166,923Foreclosed machineries and chattel 103,063 82,636 36,571
P=1,406,900 P=1,378,194 P=1,115,607*Excluding depreciation of ROU asset presented in occupancy under “Miscellaneous expense” amounting to P=521,521 and P=504,841 in 2020 and 2019, respectively.
Parent Bank
2020 2019 2018
Bank premises, furniture, fixtures and equipment P=499,189 P=414,629 P=384,058Investment properties (Note 17) 350,290 356,583 356,097Computer software (Note 19) 159,428 133,738 108,083Foreclosed machineries and chattel − − 14,759
P=1,008,907 P=904,950 P=862,997*Excluding depreciation of ROU asset presented in occupancy under “Miscellaneous expense” amounting to P=438,311 and P=403,550 in 2020 and 2019, respectively.

Bank Premises, Furniture, Fixtures and Equipment and
Investment Properties - 104 -
*SGVFSM005928*
In 2020 and 2019, depreciation charges amounted to P=521.52 million and P=504.84 million,
respectively, for the ROU asset of the Group and P=438.31 million and P=403.55 million,
respectively, for ROU of the Parent Bank. This is shown as part of Occupancy in the consolidated
and parent bank statements of income.
Under BSP rules, investments in bank premises, furniture, fixtures and equipment should notexceed 50% of the Parent Bank’s unimpaired capital. As of December 31, 2020 and 2019, theParent Bank has satisfactorily complied with this requirement.
17. Investment Properties
The Group’s and the Parent Bank’s investment properties include several parcels of land andbuildings held for rentals and foreclosed properties. The composition of and movements in thisaccount under the cost model are shown below.
Group Parent
As at December 31 As at December 31
2020 2019 2020 2019
Cost P=11,723,974 P=11,622,884 P=10,299,738 P=10,380,251Accumulated depreciation (2,640,589) (2,315,745) (2,476,117) (2,175,058)Accumulated impairment loss (161,019) (179,558) (161,074) (161,074)
Net carrying amounts P=8,922,366 P=9,127,581 P=7,662,547 P=8,044,119
The movements in the Group’s and the Parent Bank’s investment properties are shown below.
Group
2020
Building Held
for Lease
Foreclosed
Properties Total
Cost
Balances at January 1 P=2,505,383 P=9,117,501 P=11,622,884
Effects of business combination (Note 15) 893 257,102 257,995
Reclassifications 290 (290) −Additions − 201,247 201,247
Disposals − (358,152) (358,152)
Balances at December 31 2,506,566 9,217,408 11,723,974
Accumulated depreciation and amortization
Balances at January 1 632,008 1,683,737 2,315,745
Reclassifications (290) 16,549 16,259
Depreciation 52,320 306,031 358,351
Disposals − (49,766) (49,766)
Balances at December 31 684,038 1,956,551 2,640,589
Accumulated impairment losses
Balance at January 1 − 179,558 179,558
Disposals − (18,539) (18,539)
Balances at December 31 − 161,019 161,019
Net book values P=1,822,528 P=7,099,838 P=8,922,366

Investment Properties - 105 -
*SGVFSM005928*
Group
2019
Building Heldfor Lease
ForeclosedProperties Total
CostBalances at January 1 P=2,502,647 P=9,335,415 P=11,838,062Adjustments to provisional fair values (Note 15) − (168,949) (168,949)Additions 2,736 343,087 345,823Disposals − (392,052) (392,052)
Balances at December 31 2,505,383 9,117,501 11,622,884
Accumulated depreciation and amortizationBalances at January 1 578,853 1,492,929 2,071,782Adjustments to provisional fair values (Note 15) − 4,964 4,964Depreciation 53,155 318,374 371,529Disposals − (132,530) (132,530)
Balances at December 31 632,008 1,683,737 2,315,745
Accumulated impairment lossesBalance at January 1 − 199,659 199,659Reversals (Note 28) − (13,173) (13,173)Disposals − (6,928) (6,928)
Balances at December 31 − 179,558 179,558
Net book values P=1,873,375 P=7,254,206 P=9,127,581
Parent Bank
2020
Building Held
for Lease
Foreclosed
Properties Total
Cost
Balances at January 1 P=2,171,110 P=8,209,141 P=10,380,251
Additions − 189,929 189,929
Disposals − (270,442) (270,442)
Balances at December 31 2,171,110 8,128,628 10,299,738
Accumulated depreciation and amortization
Balances at January 1 512,610 1,662,448 2,175,058
Depreciation 45,186 305,104 350,290
Disposals − (49,231) (49,231)
Balances at December 31 557,796 1,918,321 2,476,117
Accumulated impairment losses
Balances at January 1 and December 31 − 161,074 161,074
Net book values P=1,613,314 P=6,049,233 P=7,662,547
Parent Bank
2019
Building Heldfor Lease
ForeclosedProperties Total
CostBalances at January 1 P=2,171,110 P=8,221,818 P=10,392,928Additions − 342,608 342,608Disposals − (355,285) (355,285)
Balances at December 31 2,171,110 8,209,141 10,380,251
Accumulated depreciation and amortizationBalances at January 1 467,424 1,481,274 1,948,698Depreciation 45,186 311,397 356,583Disposals − (130,223) (130,223)
Balances at December 31 512,610 1,662,448 2,175,058
Accumulated impairment lossesBalances at January 1 − 178,875 178,875Reversals (Note 28) − (10,873) (10,873)Disposals − (6,928) (6,928)
Balances at December 31 − 161,074 161,074
Net book values P=1,658,500 P=6,385,619 P=8,044,119

Investment Properties and
Goodwill - 106 -
*SGVFSM005928*
Real property taxes related to these investment properties paid by the Group and recognized asexpense for the years ended December 31, 2020, 2019, and 2018 totaled P=44,653, P=34,110, andP=23,578, respectively, and are presented as part of Taxes and licenses account under Otherexpenses in the statements of income.
Rent income earned by the Group on its investment properties under operating leases amountedto P=142,033, P=156,407, and P=154,899 in 2020, 2019, and 2018, respectively, and is included aspart of Rental account under Miscellaneous income in the statements of income (see Note 28).
The gain from foreclosure of loan collaterals, presented as part of Miscellaneous income in thestatements of income (see Note 28), amounted to P=153.88 million, P=221.21 million, andP=239.74 million in 2020, 2019, and 2018, respectively, for the Group, and P=153.88 million,P=208.23 million, and P=285.90 million in 2020, 2019, and 2018, respectively, for the Parent Bank.
The gain on disposal of foreclosed properties, presented as part of Miscellaneous income in thestatements of income (see Note 28), amounted to P=229.15 million, P=200.08 million, andP=258.00 million in 2020, 2019, and 2018, respectively, for the Group, and P=195.47 million, andP=251.70 million, and P=245.98 million in 2020, 2019, and 2018, respectively, for the Parent Bank.
Information about the fair value of investment properties are presented in Note 7.
18. Goodwill
Goodwill represents the excess of the acquisition cost over the fair value arising from theacquisitions of (a) former iBank’s in April 2006; (b) CSB in January 2013, (c) PR Savings Bankby CSB in June 2018, (d) PETNET in December 2018 and (e) Bangko Kabayan in March 2020(see Note 1).
None of the goodwill recognised is expected to be deductible for income tax purposes.
For impairment testing purposes, the goodwill of the Group acquired through businesscombination is allocated to the following CGUs:a. With respect to acquisition of iBank, to the Parent Bank’s Consumer Banking and Parent
Bank’s Corporate and Commercial Banking.b. With respect to the goodwill from the acquisition of CSB and PR Savings Bank, to CSB’s
DepEd salary loans business and motorcycle loans business, respectively;c. With respect to the goodwill from the acquisition of PETNET, the separate cash generating
unit of PETNET at entity level; and,d. With respect to the goodwill from the acquisition of Bangko Kabayan, the separate cash
generating unit of Bangko Kabayan at entity level.
The following presents the movement of goodwill of the Group for 2020 and 2019:
Group
2020 2019
Beginning balance P=15,455,564 P=15,726,267Acquisition of subsidiaries (Note 15)* 116,139 −Impairment during the year (Notes 20 and 28) (223,172) −Effect of finalization of purchase
price allocation (Note 15) − (270,703)
Ending balance P=15,348,531 P=15,455,564*Based on provisional fair values

Goodwill - 107 -
*SGVFSM005928*
The goodwill of the Group is allocated to the following CGUs:
Group Parent Bank
2020 2019 2020 2019
iBank Parent Bank’s Corporate and
Commercial Banking P=3,208,998 P=3,208,998 P=3,208,998 P=3,208,998Parent Bank’s Consumer Banking 4,677,900 4,677,900 4,677,900 4,677,900
7,886,898 7,886,898 7,886,898 7,886,898CSB
CSB’s DepEd Salary Loans Business* 3,371,353 3,371,353 − − CSB’s Motorcycle Loans Business** 3,259,023 3,482,195 − −
6,630,376 6,853,548 − −PETNET 715,118 715,118 − −Bangko Kabayan 116,139 − − −
P=15,348,531 P=15,455,564 P=7,886,898 P=7,886,898
*Includes goodwill arising from the acquisition of CSB amounting to P=3.37 billion
**Includes goodwill arising from the acquisition of PR Savings Bank amounting to P=3.48 billion. In 2020, goodwill impairment
recognized for CBS’s motorcycle loans business amounted to P223.17 million.
Refer to Note 15 for the discussions on the acquisition of and merger with PR Savings Bank and acquisition of Bangko Kabayan.
The Group performed its annual impairment test in December of each year. The Group considersvarious internal and external sources of information in assessing whether there is any indicationthat goodwill is impaired including if there are significant changes with an adverse effect on theCGUs that have taken place during the period in the technological, market, economic or legalenvironment in which the Group operates. As a result of the ongoing economic uncertaintybrought about by the COVID-19 pandemic, the results of the motorcycle lending business werelower than expected. The volume of loan releases was lower and the motorcycle loans reportedhigher NPLs, indicating a potential impairment of goodwill.
The recoverable amount of the motorcycle loans CGU of P=3,496.0 million as ofDecember 31, 2020 has been determined based on a value in use calculation using cash flowprojections from financial budgets approved by senior management covering a five-year period.Key assumptions in VIU calculation of CGUs are most sensitive to include forecasts of loanreleases and discount rate. Future cash flows and growth rates were based on historicalexperiences and strategies developed, including assessment of impact of the COVID-19pandemic. The discount rate used for the computation of the net present value is the weightedaverage cost of capital and was determined by reference to a comparable entity, marketobservable inputs and assumptions consistent with the valuation practice. In 2020, the pre-taxdiscount rate applied to cash flow projections is 11.2%.
As a result of this analysis, management has recognized an impairment charge of P=223.2 millionin the current year against goodwill with a carrying amount of P=3,482.2 million (with total CGUcarrying amount of P=3,719.2 million, including the identifiable net asset of the CGU) as ofDecember 31, 2019. The impairment charge is recorded under Miscellaneous expenses in thestatement of income.

Other Resources - 108 -
*SGVFSM005928*
19. Other Resources
The composition of Other resources account as of December 31 follows:
Group Parent Bank
2020 2019 2020 2019
Deferred tax assets (Note 30) P=7,453,580 P=5,643,858 P=6,256,296 P=4,847,325Software under development 2,710,227 1,596,310 2,710,227 1,596,310Computer software – net 1,495,492 1,238,896 1,013,475 1,084,355Advances and other investments 1,135,403 1,040,582 1,090,830 852,660Creditable withholding taxes 861,860 816,845 808,283 760,945Non-current assets held for sale 370,333 303,160 – –Prepaid expenses 340,911 463,841 228,012 332,805Returned checks and other cash items 248,744 399,288 248,744 399,288Documentary stamps 229,881 286,586 221,598 243,875Deferred charges 217,950 73,762 – –Net retirement asset (Note 29) 70,411 81,960 – –Trust fund assets 66,164 1,708,515 – –Miscellaneous 1,586,449 1,970,197 1,043,475 1,155,063
16,787,405 15,623,800 13,620,940 11,272,626Allowance for impairment (Note 20) (95,910) (51,206) (61,171) (25,573)
P=16,691,495 P=15,572,594 P=13,559,769 P=11,247,053
Trust fund assets are maintained to cover pre-need liabilities of FUPI for pre-need planscomputed based on the provisions of PAS 37 as required by the IC and validated by a qualifiedactuary in compliance with the rules and regulations of the IC based on the amended PNUCA.The trust fund assets are managed by the Parent Bank’s Trust and Investments Services Group(TISG).
The details of FUPI’s trust fund assets as of December 31 follow:
2020 2019
Due from BSP and other banks* P=− P=246,512Financial assets at FVTPL 50,314 911,241Financial assets at FVOCI 15,882 −Financial assets at amortized cost 318 536,189Miscellaneous – net (350) 14,573
P=66,164 P=1,708,515*As of December 31, 2020 and 2019, due from other banks included under trust fund assets comprising placements with the Parent Bank
and not included in the above amounted to P=0.94 million and P=7.68 million, respectively.
Financial assets at FVTPL comprise of investments in shares of listed companies, governmentsecurities and other corporate debt instruments. The trust fund generated income (loss) of(P=15.0 million), P=72.5 million, and P=198.9 million in 2020, 2019, and 2018, respectively(see Note 28).
The movements in the Computer software account follow:
Group Parent Bank
2020 2019 2020 2019
Balance at beginning of year P=1,238,895 P=1,138,503 P=1,084,355 P=942,484Additions 551,490 320,265 93,596 278,420Amortization charges for the year (286,680) (216,112) (159,428) (133,738)Adjustment to provisional fair
values (Note 15) − (937) − −Effect of business combinations
(Note 15) 2,370 − − −Reclassifications (10,583) (2,823) (5,048) (2,811)
Balance at end of year P=1,495,492 P=1,238,896 P=1,013,475 P=1,084,355

Other Resources and
Allowance for Impairment - 109 -
*SGVFSM005928*
Miscellaneous includes foreclosed machineries, chattels, motorcycle and automobiles, securitydeposits and ongoing improvements on the Group’s and the Parent Bank’s branches and offices.
20. Allowance for Impairment
The breakdown of allowance for impairment is shown in the table below:
Group Parent Bank
2020 2019 2020 2019
Receivable from customers (Note 14) P=10,473,864 P=6,871,905 P=7,691,647 P=5,307,190Other receivables (Note 14) 1,044,038 1,010,415 1,011,633 991,365Investments and placements
(Notes 9 and 12) 367,738 113,911 363,617 113,911Others 480,101 230,764 222,245 186,647
P=12,365,741 P=8,226,995 P=9,289,142 P=6,599,113
Allowance for impairment of investments and placements include the Group’s and the ParentBank’s financial assets at amortized cost, debt financial assets at FVOCI, due from other banksand interbank loans receivable. The ECL allowance for financial assets at FVOCI amounted toP=4.93 million and P=0.51 million as of December 31, 2020 and 2019, respectively. Others refer toallowance for impairment of goodwill, investment properties and other resources.
With the foregoing level of allowance for impairment and credit losses, management believesthat the Group has sufficient allowance for any losses that the Group may incur from the non-collection or nonrealization of its receivables and other risk assets.
The reconciliation of allowance for the total receivables from customers follows.
Total Receivables from Customers - Group
2020
Stage 1 Stage 2 Stage 3 Total
Balances at beginning of year P=1,328,881 P=100,502 P=5,442,522 P=6,871,905
Newly originated assets that remained in
Stage 1 as at December 31, 2020 735,703 − − 735,703
Newly originated assets that moved to Stage 2and Stage 3 as at December 31, 2020 − 150,948 1,046,269 1,197,217
Effect of collections and other movements in
receivable balance (excluding write-offs) (710,033) (130,597) 677,623 (163,007)
Amounts written-off (542) (43,626) (4,400,605) (4,444,773)
Transfers to Stage 1 347,466 (64,376) (283,090) −Transfers to Stage 2 (13,532) 147,232 (133,700) −Transfers to Stage 3 (109,928) (118,547) 228,475 −Impact on ECL of exposures transferred
between stages (56,244) 577,026 2,792,012 3,312,794
Impact of changes in ECL model and
assumptions 267,390 165,672 2,530,963 2,964,025
Balances at end of year P=1,789,161 P=784,234 P=7,900,469 P=10,473,864

Allowance for Impairment - 110 -
*SGVFSM005928*
2019
Stage 1 Stage 2 Stage 3 Total
Balances at beginning of year P=1,362,369 P=30,278 P=6,072,067 P=7,464,714
Newly originated assets that remained inStage 1 as at December 31, 2019 995,317 − − 995,317
Newly originated assets that moved to Stage 2
and Stage 3 as at December 31, 2019 − 116,810 535,398 652,208Effect of collections and other movements in
receivable balance (excluding write-offs) (781,278) 4,307 (134,311) (911,282)
Amounts written-off (345) (132) (2,258,182) (2,258,659)
Transfers to Stage 1 92,152 (12,888) (79,264) −Transfers to Stage 2 (9,352) 27,197 (17,845) −Transfers to Stage 3 (71,313) (130,395) 201,708 −Impact on ECL of exposures transferred
between stages (103,269) 47,136 674,228 618,095Impact of changes in ECL model and
assumptions (155,400) 18,189 448,723 311,512
Balances at end of year P=1,328,881 P=100,502 P=5,442,522 P=6,871,905
Total Receivables from Customers – Parent Bank
2020
Stage 1 Stage 2 Stage 3 Total
Balances at beginning of year P=746,340 P=62,225 P=4,498,625 P=5,307,190
Newly originated assets that remained inStage 1 as at December 31, 2020 356,525 − − 356,525
Newly originated assets that moved to Stage 2
and Stage 3 as at December 31, 2020 − 79,376 886,468 965,844
Effect of collections and other movements inreceivable balance (excluding write-offs) (555,058) (38,437) (205,545) (799,040)
Amounts written-off (542) (43,626) (4,371,523) (4,415,691)
Transfers to Stage 1 57,453 (16,039) (41,414) −Transfers to Stage 2 (11,516) 28,006 (16,490) −Transfers to Stage 3 (108,707) (118,027) 226,734 −Impact on ECL of exposures transferred
between stages (56,244) 577,026 2,792,012 3,312,794
Impact of changes in ECL model and
assumptions 267,390 165,672 2,530,963 2,964,025
Balances at end of year P=695,641 P=696,176 P=6,299,830 P=7,691,647
2019
Stage 1 Stage 2 Stage 3 Total
Balances at beginning of year P=925,044 P=27,912 P=5,595,564 P=6,548,520Newly originated assets that remained in
Stage 1 as at December 31, 2020 500,471 − − 500,471Newly originated assets that moved to
Stage 2 and Stage 3 as atDecember 31, 2020 − 17,142 245,203 262,345
Effect of collections and other movementsin receivable balance (excluding write-offs) (503,680) (15,750) 27,108 (492,322)
Amounts written-off − − (2,131,720) (2,131,720)Transfers to Stage 1 23,796 (6,209) (17,587) −Transfers to Stage 2 (4,369) 10,367 (5,998) −Transfers to Stage 3 (16,050) (22,521) 38,571 −Impact on ECL of exposures transferred
between stages (23,472) 33,095 298,760 308,383Impact of changes in ECL model and
assumptions (155,400) 18,189 448,724 311,513
Balances at end of year P=746,340 P=62,225 P=4,498,625 P=5,307,190

Allowance for Impairment - 111 -
*SGVFSM005928*
Reconciliation of the allowance for impairment by class follows:
Corporate Loans - Group and Parent Bank
2020
Stage 1 Stage 2 Stage 3 Total
Balances at beginning of year P=267,666 P=− P=78,358 P=346,024
Newly originated assets that remained inStage 1 as at December 31, 2020 79,466 − − 79,466
Newly originated assets that moved toStage 3 as at December 31, 2020 − 4,561 50,269 54,830
Effect of collections and othermovements in receivable balance(excluding write-offs) (201,463) (448) (32,842) (234,753)
Amounts written-off − − (49,495) (49,495)
Transfers to Stage 1 − − − −Transfers to Stage 2 (4,116) 4,116 − −Transfers to Stage 3 (23,342) − 23,342 −Impact on ECL of exposures transferred
between stages − 502,907 670,735 1,173,642Impact of changes in ECL model and
assumptions 2,721 447 41,601 44,769
Balances at end of year P=120,932 P=511,583 P=781,968 P=1,414,483
2019
Stage 1 Stage 2 Stage 3 Total
Balances at beginning of year P=436,244 P=− P=80,945 P=517,189Newly originated assets that remained in
Stage 1 as at December 31, 2019 193,096 − − 193,096Newly originated assets that moved to
Stage 3 as at December 31, 2019 − − 2,575 2,575Effect of collections and other
movements in receivable balance(excluding write-offs) (296,670) − (6,507) (303,177)
Transfers to Stage 3 (4) 4 −Impact on ECL of exposures transferred
between stages − − 1,341 1,341Impact of changes in ECL model and
assumptions (65,000) − − (65,000)
Balances at end of year P=267,666 P=− P=78,358 P=346,024
In 2019, there were no write-offs for corporate loans.

Allowance for Impairment - 112 -
*SGVFSM005928*
Commercial Loans - Group and Parent Bank
2020
Stage 1 Stage 2 Stage 3 Total
Balances at beginning of year P=188,656 P=54 P=1,890,935 P=2,079,645
Newly originated assets that remained inStage 1 as at December 31, 2020 164,461 − − 164,461
Newly originated assets that moved toStage 3 as at December 31, 2020 − 59,278 351,591 410,869
Effect of collections and othermovements in receivable balance(excluding write-offs) (200,481) (40,956) (316,908) (558,345)
Amounts written-off − − (1,304,849) (1,304,849)
Transfers to Stage 1 3 (3) − −Transfers to Stage 2 − − − −Transfers to Stage 3 (6,824) (89,342) 96,166 −Impact on ECL of exposures transferred
between stages (2) − 403,514 403,512Impact of changes in ECL model and
assumptions 25,283 131,302 688,429 845,014
Balances at end of year P=171,096 P=60,333 P=1,808,878 P=2,040,307
2019
Stage 1 Stage 2 Stage 3 Total
Balances at beginning of year P=283,970 P=104 P=1,548,716 P=1,832,790Newly originated assets that remained in
Stage 1 as at December 31, 2019 148,412 − − 148,412Newly originated assets that moved to
Stage 3 as at December 31, 2019 − − 128,245 128,245Effect of collections and other
movements in receivable balance(excluding write-offs) (116,407) − (33,578) (149,985)
Transfers to Stage 1 4,275 − (4,275) −Transfers to Stage 2 − 3,916 (3,916) −Transfers to Stage 3 (4,795) (2) 4,797 −Impact on ECL of exposures transferred
between stages (4,271) (3,862) 19,763 11,630Impact of changes in ECL model and
assumptions (122,528) (102) 231,183 108,553
Balances at end of year P=188,656 P=54 P=1,890,935 P=2,079,645
In 2019, there were no write-offs for commercial loans.

Allowance for Impairment - 113 -
*SGVFSM005928*
Home Loans - Group and Parent Bank
2020
Stage 1 Stage 2 Stage 3 Total
Balances at beginning of year P=9,301 P=10,764 P=88,056 P=108,121
Newly originated assets that remained inStage 1 as at December 31, 2020 29,515 − − 29,515
Newly originated assets that moved toStage 3 as at December 31, 2020 − 10,482 80,313 90,795
Effect of collections and othermovements in receivable balance(excluding write-offs) (9,061) (361) 19,484 10,062
Amounts written-off − − (58,580) (58,580)
Transfers to Stage 1 19,674 (2,590) (17,084) −Transfers to Stage 2 (879) 5,043 (4,164) −Transfers to Stage 3 (1,959) (1,925) 3,884 −Impact on ECL of exposures transferred
between stages (19,589) 33,570 634,636 648,617Impact of changes in ECL model and
assumptions 17,772 (5,471) 757,256 769,557
Balances at end of year P=44,774 P=49,512 P=1,503,801 P=1,598,087
2019
Stage 1 Stage 2 Stage 3 Total
Balances at beginning of year P=5,456 P=23,724 P=130,012 P=159,192Newly originated assets that remained in
Stage 1 as at December 31, 2019 8,781 − − 8,781Newly originated assets that moved to
Stage 2 and Stage 3 as atDecember 31, 2019 − 207 5,499 5,706
Effect of collections and othermovements in receivable balance(excluding write-offs) (5,642) (918) 4,651 (1,909)
Amounts written off − − (790) (790)Transfers to Stage 1 3,351 (2,328) (1,023) −Transfers to Stage 2 (36) 164 (128) −Transfers to Stage 3 (34) (2,416) 2,450 −Impact on ECL of exposures transferred
between stages (3,344) 9,650 9,257 15,563Impact of changes in ECL model and
assumptions 769 (17,319) (61,872) (78,422)
Balances at end of year P=9,301 P=10,764 P=88,056 P=108,121
In 2019, there were no write-offs for home loans.

Allowance for Impairment - 114 -
*SGVFSM005928*
Other Retail Products - Group and Parent BankOther Retail Products include auto loans, business line, and credit cards.
2020
Stage 1 Stage 2 Stage 3 Total
Balances at beginning of year P=184,610 P=49,977 P=1,385,272 P=1,619,859
Newly originated assets that remained inStage 1 as at December 31, 2020 68,674 − − 68,674
Newly originated assets that moved toStage 3 as at December 31, 2020 − 3,377 307,615 310,992
Effect of collections and othermovements in receivable balance(excluding write-offs) (126,866) 3,487 89,846 (33,533)
Amounts written-off (542) (43,626) (2,090,359) (2,134,527)
Transfers to Stage 1 37,561 (13,231) (24,330) −Transfers to Stage 2 (2,708) 14,988 (12,280) −Transfers to Stage 3 (63,137) (26,454) 89,591 −Impact on ECL of exposures transferred
between stages (36,498) 35,573 966,047 965,122Impact of changes in ECL model and
assumptions 225,413 40,071 988,273 1,253,757
Balances at end of year P=286,507 P=64,162 P=1,699,675 P=2,050,344
2019
Stage 1 Stage 2 Stage 3 Total
Balances at beginning of year P=149,371 P=2,396 P=1,408,316 P=1,560,083Newly originated assets that remained in
Stage 1 as at December 31, 2019 61,076 − − 61,076Newly originated assets that moved to
Stage 2 and Stage 3 as atDecember 31, 2019 − 15,647 62,077 77,724
Effect of collections and othermovements in receivable balance(excluding write-offs) (69,678) (2,689) 221,765 149,398
Amounts written-off − − (783,668) (783,668)Transfers to Stage 1 16,048 (3,881) (12,167) −Transfers to Stage 2 (4,323) 6,102 (1,779) −Transfers to Stage 3 (11,105) (19,908) 31,013 −Impact on ECL of exposures transferred
between stages (15,736) 27,485 266,610 278,359Impact of changes in ECL model and
assumptions 58,957 24,825 193,105 276,887
Balances at end of year P=184,610 P=49,977 P=1,385,272 P=1,619,859
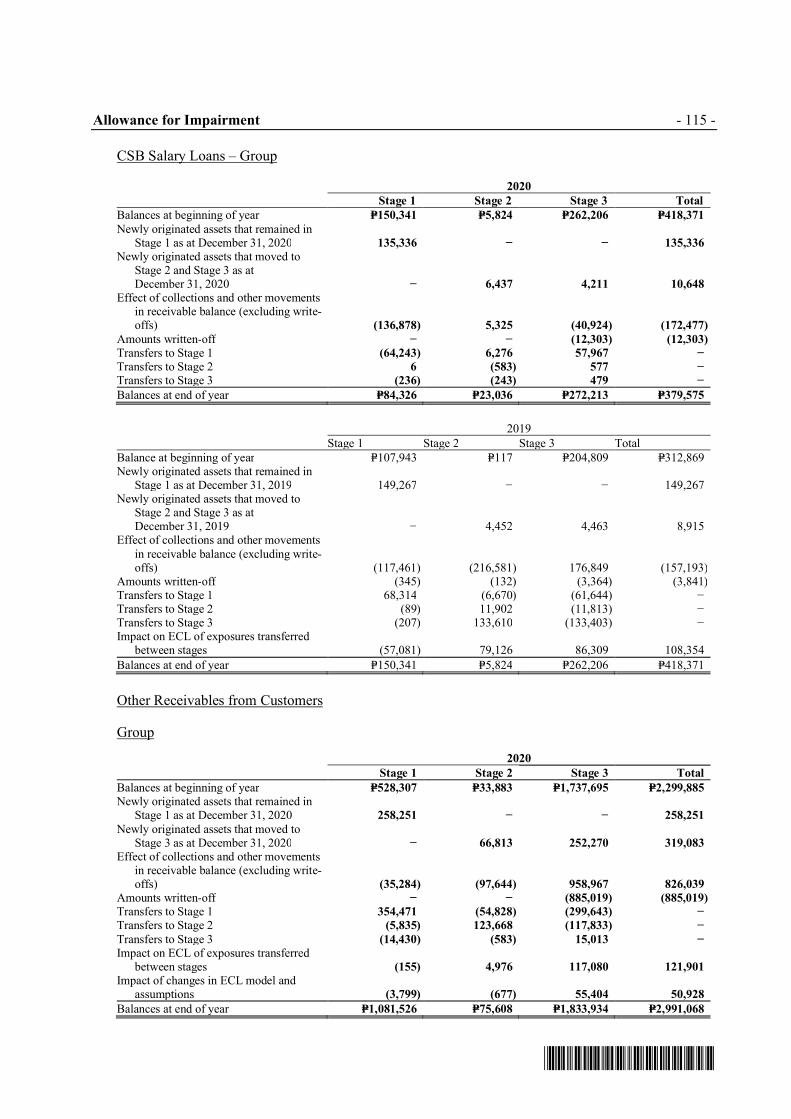
Allowance for Impairment - 115 -
*SGVFSM005928*
CSB Salary Loans – Group
2020
Stage 1 Stage 2 Stage 3 Total
Balances at beginning of year P=150,341 P=5,824 P=262,206 P=418,371
Newly originated assets that remained inStage 1 as at December 31, 2020 135,336 − − 135,336
Newly originated assets that moved toStage 2 and Stage 3 as atDecember 31, 2020 − 6,437 4,211 10,648
Effect of collections and other movementsin receivable balance (excluding write-offs) (136,878) 5,325 (40,924) (172,477)
Amounts written-off − − (12,303) (12,303)
Transfers to Stage 1 (64,243) 6,276 57,967 −Transfers to Stage 2 6 (583) 577 −Transfers to Stage 3 (236) (243) 479 −Balances at end of year P=84,326 P=23,036 P=272,213 P=379,575
2019
Stage 1 Stage 2 Stage 3 Total
Balance at beginning of year P=107,943 P=117 P=204,809 P=312,869Newly originated assets that remained in
Stage 1 as at December 31, 2019 149,267 − − 149,267Newly originated assets that moved to
Stage 2 and Stage 3 as atDecember 31, 2019 − 4,452 4,463 8,915
Effect of collections and other movementsin receivable balance (excluding write-offs) (117,461) (216,581) 176,849 (157,193)
Amounts written-off (345) (132) (3,364) (3,841)Transfers to Stage 1 68,314 (6,670) (61,644) −Transfers to Stage 2 (89) 11,902 (11,813) −Transfers to Stage 3 (207) 133,610 (133,403) −Impact on ECL of exposures transferred
between stages (57,081) 79,126 86,309 108,354
Balances at end of year P=150,341 P=5,824 P=262,206 P=418,371
Other Receivables from Customers
Group
2020
Stage 1 Stage 2 Stage 3 Total
Balances at beginning of year P=528,307 P=33,883 P=1,737,695 P=2,299,885
Newly originated assets that remained inStage 1 as at December 31, 2020 258,251 − − 258,251
Newly originated assets that moved toStage 3 as at December 31, 2020 − 66,813 252,270 319,083
Effect of collections and other movementsin receivable balance (excluding write-offs) (35,284) (97,644) 958,967 826,039
Amounts written-off − − (885,019) (885,019)
Transfers to Stage 1 354,471 (54,828) (299,643) −Transfers to Stage 2 (5,835) 123,668 (117,833) −Transfers to Stage 3 (14,430) (583) 15,013 −Impact on ECL of exposures transferred
between stages (155) 4,976 117,080 121,901
Impact of changes in ECL model andassumptions (3,799) (677) 55,404 50,928
Balances at end of year P=1,081,526 P=75,608 P=1,833,934 P=2,991,068

Allowance for Impairment - 116 -
*SGVFSM005928*
2019
Stage 1 Stage 2 Stage 3* Total
Balances at beginning of year January 1, 2019 P=379,385 P=3,937 P=2,699,269 P=3,082,591Newly originated assets that remained in Stage 1 as at
December 31, 2019 434,685 − − 434,685Newly originated assets that moved to Stage 2 and
Stage 3 as at December 31, 2019 − 96,504 332,539 429,043Effect of collections and other movements in
receivable balance (excluding write-offs) (175,420) 224,495 (497,491) (448,416)Amounts written-off − − (1,470,360) (1,470,360)Transfers to Stage 1 164 (9) (155) −Transfers to Stage 2 (4,904) 5,113 (209) −Transfers to Stage 3 (55,168) (241,679) 296,847 −Impact on ECL of exposures transferred between
stages (22,837) (65,263) 290,948 202,848Impact of changes in ECL model and assumptions (27,598) 10,785 86,307 69,494
Balances at end of year P=528,307 P=33,883 P=1,737,695 P=2,299,885
*Includes long outstanding receivables from customers that are fully provided with allowance amounting to P=0.79 billion as of December 31, 2019.
Parent Bank
2020
Stage 1 Stage 2 Stage 3 Total
Balances at beginning of year P=96,107 P=1,430 P=1,056,004 P=1,153,541
Newly originated assets that remained inStage 1 as at December 31, 2020 14,409 − − 14,409
Newly originated assets that moved toStage 3 as at December 31, 2020 − 1,678 96,680 98,358
Effect of collections and other movementsin receivable balance (excluding write-offs) (17,187) (159) 34,875 17,529
Amounts written-off − − (868,240) (868,240)
Transfers to Stage 1 215 (215) − −Transfers to Stage 2 (3,813) 3,859 (46) −Transfers to Stage 3 (13,445) (306) 13,751 −Impact on ECL of exposures transferred
between stages (155) 4,976 117,080 121,901
Impact of changes in ECL model andassumptions (3,799) (677) 55,404 50,928
Balances at end of year P=72,332 P=10,586 P=505,508 P=588,426
2019
Stage 1 Stage 2 Stage 3* Total
Balances at beginning of year P=50,003 P=1,688 P=2,427,575 P=2,479,266Newly originated assets that remained in
Stage 1 as at December 31, 2019 89,106 − − 89,106Newly originated assets that moved to
Stage 2 and Stage 3 as atDecember 31, 2019 − 1,288 46,807 48,095
Effect of collections and other movementsin receivable balance (excluding write-offs) (15,283) (12,143) (159,223) (186,649)
Amounts written-off − − (1,347,262) (1,347,262)Transfers to Stage 1 122 − (122) −Transfers to Stage 2 (10) 185 (175) −Transfers to Stage 3 (112) (195) 307 −Impact on ECL of exposures transferred
between stages (121) (178) 1,789 1,490Impact of changes in ECL model and
assumptions (27,598) 10,785 86,308 69,495
Balances at end of year P=96,107 P=1,430 P=1,056,004 P=1,153,541
*Includes long outstanding receivables from customers that are fully provided with allowance amounting to P=0.79 billion as of December 31, 2019.

Allowance for Impairment - 117 -
*SGVFSM005928*
Investments and Placements
Group
2020
Stage 1 Stage 2 Stage 3 Total
Balances at beginning of year P=11,878 P=102,033 P=− P=113,911
Newly originated assets that remained inStage 1 as at December 31, 2020 7,788 − − 7,788
Effect of collections and othermovements in receivable balance(excluding write-offs) 35,189 218,216 − 253,405
Impact of changes in ECL model andassumptions (7,366) − − (7,366)
Balances at end of year P=47,489 P=320,249 P=− P=367,738
Group and Parent Bank
2019
Stage 1 Stage 2 Stage 3 Total
Balances at beginning of year P=4,981 P=12,645 P=− P=17,626Newly originated assets that remained in
Stage 1 as at December 31, 2019 18,188 − − 18,188Effect of collections and other
movements in receivable balance(excluding write-offs) (71,040) − − (71,040)
Transfers to Stage 2 (406) 406 − −Impact on ECL of exposures transferred
between stages − 87,082 − 87,082Impact of changes in ECL model and
assumptions 60,155 1,900 − 62,055
Balances at end of year P=11,878 P=102,033 P=− P=113,911
Parent Bank
2020
Stage 1 Stage 2 Stage 3 Total
Balances at beginning of year P=11,878 P=102,033 P=− P=113,911
Newly originated assets that remained inStage 1 as at December 31, 2020 7,788 − − 7,788
Effect of collections and othermovements in receivable balance(excluding write-offs) 31,068 218,216 − 249,284
Amounts written-off − − − −Impact of changes in ECL model and
assumptions (7,366) − − (7,366)
Balances at end of year P=43,368 P=320,249 P=− P=363,617
In 2020 and 2019, there were no transfers to Stage 1 and Stage 3. There were also no write-offsfor investments and placements during the year.

Deposit Liabilities - 118 -
*SGVFSM005928*
21. Deposit Liabilities
The breakdown of deposit liabilities account follows:
Group Parent Bank
2020 2019 2020 2019
Due to banks:Demand P=1,194,495 P=687,119 P=1,194,495 P=686,051Savings 306,575 409,083 306,575 352,623Time 1,492,866 81,222 1,438,700 7,040Long-term certificate of deposits 10,000 10,000 10,000 10,000
3,003,936 1,187,424 2,949,770 1,055,714Due to customers:
Demand 158,589,051 135,601,619 159,688,958 136,671,400Savings 98,651,270 71,591,321 93,257,817 68,477,449Time 264,550,769 272,965,676 206,342,074 229,759,786Long-term certificate of deposits 2,990,000 2,990,000 2,990,000 2,990,000
524,781,090 483,148,616 462,278,849 437,898,635
P=527,785,026 P=484,336,040 P=465,228,619 P=438,954,349
The breakdown of deposit liabilities account as to currency follows:
Group Parent Bank
2020 2019 2020 2019
Philippine pesos P=403,740,094 P=387,165,014 P=341,183,687 P=341,783,323Foreign currencies 124,044,932 97,171,026 124,044,932 97,171,026
P=527,785,026 P=484,336,040 P=465,228,619 P=438,954,349
Deposit liabilities bear annual interest at rates ranging from 0.00% to 9.5% in 2020, and from0.00% to 8.5% in 2019 and 2018 for the Group and from 0.39% to 1.65% in 2020, from 0.0% to5.54% in 2019 and from 0.00% to 7.9% in 2018 for the Parent Bank. Demand and savingsdeposits usually have either fixed or variable interest rates while time deposits have fixed interestrates.
Long Term Negotiable Certificate of Deposits (LTNCD)
On December 12, 2017, the MB of the BSP approved the Parent Bank’s issuance of up toP=20,000,000 of Long-term Negotiable Certificate of Deposits (LTNCD). Out of the approvedamount, P=3,000,000 were issued on February 21, 2018 at a fixed coupon rate of 4.375% perannum, payable quarterly and will mature on August 21, 2023. The net proceeds were utilized tofurther improve the Parent Bank’s maturity profile and support business expansion plans.
On August 8, 2013, the MB of the BSP approved the Parent Bank’s issuance of up to P=5,000,000of LTNCD. Out of the approved amount, P=3,000,000 were issued on October 18, 2013 at acoupon rate of 3.50% per annum, payable quarterly, which matured and repaid by the ParentBank on April 17, 2019. The net proceeds from this issuance were used to improve the ParentBank’s deposit maturity profile and support business expansion plans.

Deposit Liabilities and
Bills Payable - 119 -
*SGVFSM005928*
Interest expense on the deposit liabilities amounted to P=5,616,821, P=10,160,322, andP=8,841,473 in 2020, 2019, and 2018, respectively, in the Group's statements of income, andP=4,256,480, P=8,069,749, and P=7,045,224 in 2020, 2019, and 2018, respectively, in the ParentBank's statements of income
Under existing BSP regulations, non-FCDU deposit liabilities of the Bank are subject to unifiedreserve requirement equivalent to 14.0% (under BSP Circulars 1041, 1056 and 1063) as atDecember 31, 2019. In 2020, BSP Circulars 1082 and 1092 were issued reducing the reserverequirement to 12.0%, 3.0% and 2.0% for universal and commercial banks, thrift banks, and ruralbanks, respectively. BSP Circulars 1083, 1087, and 1100 were issued in 2020 to provideguidelines allowing the use of eligible loans to MSME and large enterprises for alternativecompliance to required reserves for deposit liabilities.
LTNCDs are subject to required reserves of 4.0% if issued under BSP Circular 304 and 7.0% ifissued under BSP Circular 842. As of December 31, 2020 and 2019, the Group is in compliancewith such regulations.
Regular reserves as of December 31, 2020 and 2019 amounted to P=42,730,160 and P=48,836,829,respectively, for the Group, and P=40,953,821 and P=47,027,761, respectively, for the Parent Bank(see Note 8).
22. Bills Payable
Bills payable consist of borrowings from:
Group Parent Bank
2020 2019 2020 2019
Banks, other financial institutions andindividuals P=52,686,077 P=89,994,582 P=33,928,852 P=77,056,116
BSP − 15,000,000 − 15,000,000Others 1,537,466 93,140 573,569 93,140
P=54,223,543 P=105,087,722 P=34,502,421 P=92,149,256
Bills payable to banks and other financial institutions consist mainly of amortized cost balance ofshort-term borrowings. Certain bills payable to banks and other financial institutions arecollateralized by investment securities (see Note 12).
Bills payable to BSP mainly represent short-term borrowings availed of under the overnightlending facility of the BSP. These are collateralized by eligible loans (see Note 14).
Other bills payable of the Group mainly pertain to availments of short-term loan lines fromcertain related parties (see Note 32).

Bills Payable and
Notes and Bonds Payable - 120 -
*SGVFSM005928*
The breakdown of bills payable as to currency follows:
Group Parent Bank
2020 2019 2020 2019
Foreign currencies P=34,486,628 P=77,129,265 P=34,486,628 P=77,129,266Philippine pesos 19,736,915 27,958,457 15,793 15,019,990
P=54,223,543 P=105,087,722 P=34,502,421 P=92,149,256
The breakdown of interest expense on bills payable, which is presented as part of Interestexpense on bills payable and other liabilities account in the statements of income, follows:
Group Parent Bank
2020 2019 2018 2020 2019 2018
Banks, other financialinstitutions and individuals P=1,628,474 P=3,234,392 P=1,177,258 P=702,463 P=2,142,488 P=567,059
BSP 52,614 217,472 39,435 52,614 217,472 39,435Others 1,211 1,694 190,158 1,211 1,694 69
P=1,682,299 P=3,453,558 P=1,406,851 P=756,288 P=2,361,654 P=606,563
The range of interest rates of bills payable per currency follows:
Group and Parent Bank
2020 2019 2018
Philippine pesos 3.34% to 4.50% 3.75% to 8.28% 2.80% to 6.75%Foreign currencies 0.04% to 3.05% 1.69% to 3.35% 1.40% to 3.56%
23. Notes and Bonds Payable
The Group’s and the Parent Bank’s notes and bonds payable as of December 31, 2020 and 2019consist of the following:
Coupon Principal Outstanding Balance
Interest Amount 2020 2019 Issue Date Maturity Date Redemption Date
USD Senior Medium Term
Notes Due 2022 3.369% P=24,965,000 P=23,983,972 P=25,275,609 November 29, 2017 November 29, 2022USD Senior Medium Term
Notes Due 2025 2.125% 14,406,900 14,311,227 − October 22, 2020 October 22, 2025Peso Senior Series A Bonds
Due 2020 7.061% 11,000,000 − 10,952,898 December 7, 2018 December 7, 2020Peso Senior Series C Bonds
Due 2023 2.75% 8,115,000 8,055,828 − December 9, 2020 December 9, 2023 December 9, 2023Unsecured Subordinated
Tier 2 Notes Due 2025Callable in 2020 5.375% 7,200,000 − 7,200,000 November 20, 2014 February 20, 2025 February 20, 2020
Unsecured Subordinated
Tier 2 Notes Due 2030Callable in 2025 5.250% 6,800,000 6,745,110 − February 24, 2020 May 24, 2030 May 24, 2030
Peso Senior Series B BondsDue 2022 6.000% 5,800,000 5,772,252 5,753,553 June 3, 2019 June 3, 2022 June 3, 2022
Peso Senior Series D BondsDue 2026 3.375% 885,000 878,468 − December 9, 2020 March 9, 2026 March 9, 2026
Total for Parent Bank 79,171,900 59,746,857 49,182,060Loans payable 5.750% 150,000 106,799 149,446 May 31, 2018 May 31, 2023
Total for Group P=79,321,900 P=59,853,656 P=49,331,506
USD Senior Medium Term Notes Due 2022
The USD500 million Senior Medium Term Notes Due 2022 were issued under the Parent Bank’sUSD One Billion Medium Term Note (MTN) Programme and were rated Baa2 by Moody’s.
Notes and Bonds Payable - 121 -
*SGVFSM005928*
The Notes were listed on the Singapore Exchange Securities Trading Limited (SGX-ST) andconstitute direct, unconditional, unsubordinated and unsecured obligations of the Parent Bankand will rank pari passu among themselves and equally with all other unsecured obligations ofthe Parent Bank from time to time outstanding.
USD Senior Medium Term Notes Due 2025
These USD300 million Senior Medium Term Notes Due 2025 were issued under the updatedUSD 2 Billion MTN Programme of the Parent Bank and were also rated Baa2 by Moody’s. TheNotes were also listed on the SGX-ST.
The Notes will constitute direct, unconditional, unsubordinated and (subject to the Terms andConditions of the issuance) unsecured obligations of the Parent Bank and will rank pari passuamong themselves and (save for certain obligations required to be preferred by law) equally withall other unsecured obligations (other than subordinated obligations, if any) of the Parent Bankfrom time to time outstanding.
Peso Senior Series A Bonds Due 2020
The P=11.0 Billion worth of Peso Senior Corporate Series A Bonds were the first corporate bondsissued by the Parent Bank pursuant to BSP Circular No. 1010. These fixed rate bonds wereissued in scripless form and were listed on the PDEx.
The Bonds constitute direct, unconditional, unsecured, and unsubordinated peso-denominatedobligations of the Bank, and shall at all times rank pari passu and ratably without any preferenceor priority amongst themselves, and at least pari passu with all other present and future direct,unconditional, unsecured, and unsubordinated peso-denominated obligations of the Bank, exceptfor any obligation enjoying a statutory preference or priority established under Philippine laws.
The Bonds were redeemed at their principal amount on December 7, 2020.
Peso Senior Series C Bonds Due 2023
The P=8,115,000 worth of fixed rate Senior Series C Bonds were issued as part of the dual-tranche issuance of the Bank on December 9, 2021 under its existing P=39 Billion BondProgram. The bonds were listed on the PDEx.
The Bank may, at its sole option and subject to the Terms and Conditions of the issuance,redeem the Bonds at par plus accrued interest (if any), without premium or penalty, as of butexcluding the Early Redemption Date.
The Bonds constitute direct, unconditional, unsecured, and unsubordinated peso-denominatedobligations of the Bank, enforceable according to the Terms and Conditions of the Bonds, andshall at all times rank pari passu and ratably without any preference or priority amongstthemselves, and at least pari passu with all other present and future direct, unconditional,unsecured, and unsubordinated peso-denominated obligations of the Bank, except for anyobligation enjoying a statutory preference or priority established under Philippine laws.

Notes and Bonds Payable - 122 -
*SGVFSM005928*
Unsecured Subordinated Tier 2 Notes Due 2025 Callable in 2020
The P=7.2 Billion Unsecured Subordinated Tier 2 Notes were issued with a loss absorptionfeature, which means the Notes were subject to a non-viability write-down in case of a non-viability trigger event.
The Notes constitute direct, unconditional, unsecured and subordinated obligations of the ParentBank and shall at all times rank pari passu and without any preference among themselves.
On February 20, 2020, the Parent Bank exercised its Voluntary Redemption Option to earlyredeem the Notes in accordance with its Terms and Conditions.
Unsecured Subordinated Tier 2 Notes Due 2030 Callable in 2025
The Basel III-compliant Unsecured Subordinated Tier 2 Notes were issued by the Parent Bankunder its BSP-approved issuance of ₱20.0 Billion Unsecured Subordinated Notes Qualifying asTier 2 Capital.
Unless the Notes are previously redeemed, the Initial Interest Rate will be reset at the equivalentof the Initial Spread per annum plus the Benchmark as of Reset Date as defined in the Termsand Conditions of the Notes. Subject to certain conditions, the BSP Guidelines, and the Termsand Conditions, the Parent Bank may redeem the Notes in whole and not only in part on theRedemption Option Date at 100% of the face value of the Notes, plus accrued and unpaidinterest as of but excluding the Redemption Option Date.
The Notes have a loss absorption feature which means the Notes are subject to a Non-ViabilityWrite-Down in case of a Non- Viability Trigger Event. A Non-Viability Trigger Event isdeemed to have occurred when the Issuer is considered non-viable as determined by the BSP.
The Tier II Notes constitute a direct, unconditional, fixed, unsecured and subordinatedobligation of the Bank. Claims in respect of the Tier II Notes will rank: (a) junior to the claimsof holders of all deposits and general creditors of the Bank; (b) pari passu with obligations ofthe Bank that are, expressly or by applicable laws, subordinated so as to rank pari passu withclaims in respect of securities constituting “Tier 2” capital of the Bank; and (c) senior to (i) theclaims for payment of any obligation that, expressly or by applicable law, is subordinated to theTier II Notes, (ii) the claims in respect of securities constituting “Tier 1” capital of the Bank,and (iii) the rights and claims of holders of equity shares of the Bank.
Peso Senior Series B Bonds Due 2022
These P=5.8 Billion worth of Senior Corporate Series B Bonds were issued under the ParentBank’s P=39 Billion Corporate Bonds Program. These fixed rate Bonds were issued in scriplessform and were listed on the PDEx.
The Bonds constitute direct, unconditional, unsecured, and unsubordinated peso-denominatedobligations of the Bank, enforceable according to the Terms and Conditions of the Bonds, andshall at all times rank pari passu and ratably without any preference or priority amongstthemselves, and at least pari passu with all other present and future direct, unconditional,unsecured, and unsubordinated peso-denominated obligations of the Bank, except for anyobligation enjoying a statutory preference or priority established under Philippine laws.
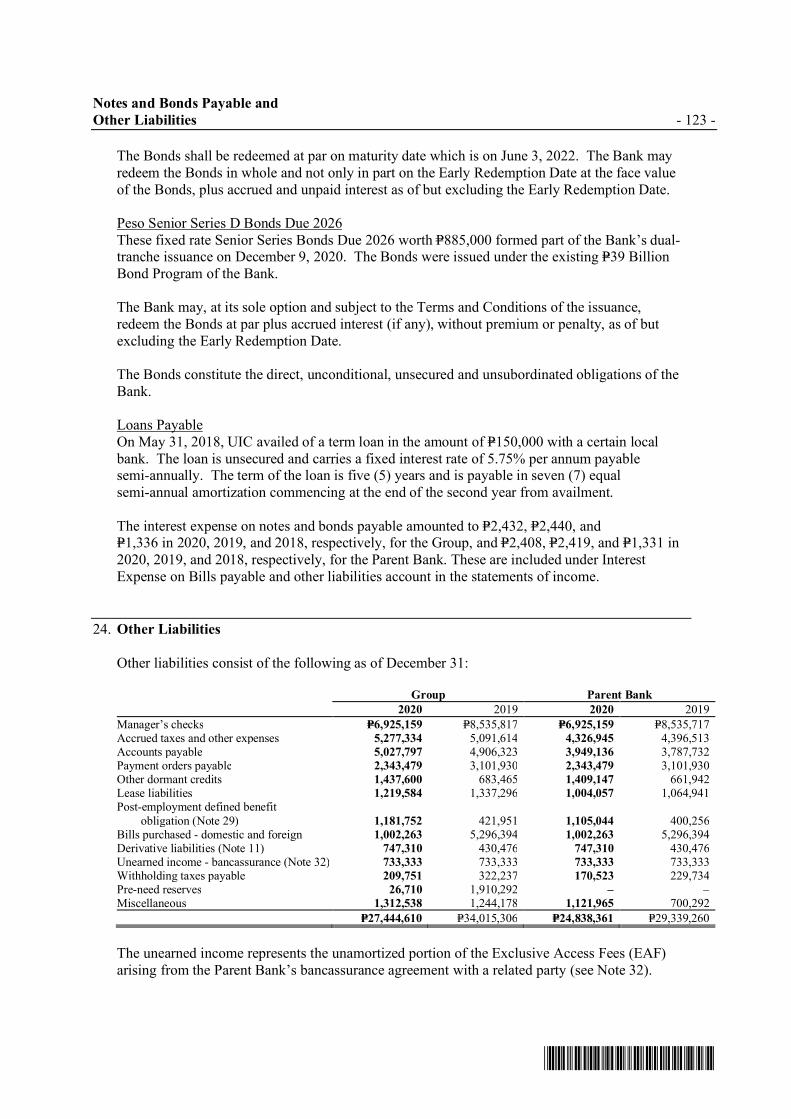
Notes and Bonds Payable and
Other Liabilities - 123 -
*SGVFSM005928*
The Bonds shall be redeemed at par on maturity date which is on June 3, 2022. The Bank mayredeem the Bonds in whole and not only in part on the Early Redemption Date at the face valueof the Bonds, plus accrued and unpaid interest as of but excluding the Early Redemption Date.
Peso Senior Series D Bonds Due 2026These fixed rate Senior Series Bonds Due 2026 worth P=885,000 formed part of the Bank’s dual-tranche issuance on December 9, 2020. The Bonds were issued under the existing P=39 BillionBond Program of the Bank.
The Bank may, at its sole option and subject to the Terms and Conditions of the issuance,redeem the Bonds at par plus accrued interest (if any), without premium or penalty, as of butexcluding the Early Redemption Date.
The Bonds constitute the direct, unconditional, unsecured and unsubordinated obligations of theBank.
Loans PayableOn May 31, 2018, UIC availed of a term loan in the amount of P=150,000 with a certain localbank. The loan is unsecured and carries a fixed interest rate of 5.75% per annum payablesemi-annually. The term of the loan is five (5) years and is payable in seven (7) equalsemi-annual amortization commencing at the end of the second year from availment.
The interest expense on notes and bonds payable amounted to P=2,432, P=2,440, andP=1,336 in 2020, 2019, and 2018, respectively, for the Group, and P=2,408, P=2,419, and P=1,331 in2020, 2019, and 2018, respectively, for the Parent Bank. These are included under InterestExpense on Bills payable and other liabilities account in the statements of income.
24. Other Liabilities
Other liabilities consist of the following as of December 31:
Group Parent Bank
2020 2019 2020 2019
Manager’s checks P=6,925,159 P=8,535,817 P=6,925,159 P=8,535,717Accrued taxes and other expenses 5,277,334 5,091,614 4,326,945 4,396,513Accounts payable 5,027,797 4,906,323 3,949,136 3,787,732Payment orders payable 2,343,479 3,101,930 2,343,479 3,101,930Other dormant credits 1,437,600 683,465 1,409,147 661,942Lease liabilities 1,219,584 1,337,296 1,004,057 1,064,941Post-employment defined benefit
obligation (Note 29) 1,181,752 421,951 1,105,044 400,256Bills purchased - domestic and foreign 1,002,263 5,296,394 1,002,263 5,296,394Derivative liabilities (Note 11) 747,310 430,476 747,310 430,476Unearned income - bancassurance (Note 32) 733,333 733,333 733,333 733,333Withholding taxes payable 209,751 322,237 170,523 229,734Pre-need reserves 26,710 1,910,292 – –Miscellaneous 1,312,538 1,244,178 1,121,965 700,292
P=27,444,610 P=34,015,306 P=24,838,361 P=29,339,260
The unearned income represents the unamortized portion of the Exclusive Access Fees (EAF)arising from the Parent Bank’s bancassurance agreement with a related party (see Note 32).

Other Liabilities and
Capital Funds - 124 -
*SGVFSM005928*
Set out below is the carrying amount of lease liabilities and the movements during the year:
Group Parent Bank
2020 2019 2020 2019
As at January 1, 2020 P=1,337,296 P=1,246,913 P=1,064,941 P=998,394Additions 392,602 524,954 348,608 418,540Effect of business combination (Note 15) 22,933 – – –
Payments (613,498) (534,042) (477,197) (426,711)Accretion of interest 80,251 99,471 67,705 74,718
As at December 31, 2020 P=1,219,584 P=1,337,296 P=1,004,057 P=1,064,941
Accretion of interest is included as part of Interest expense on bills payable and other liabilitiesaccount in the statements of income.
As at December 31, 2020 and 2019, the Group has not committed to leases which had not yetcommenced.
The breakdown of Accrued taxes and other expenses account follows:
Group Parent Bank
2020 2019 2020 2019
Accrued interest payable P=757,580 P=1,214,306 P=624,736 P=1,081,974Accrued income and other taxes 711,003 433,533 386,730 258,537Accrued sick leave benefits 574,160 465,292 573,308 464,098Other accruals 3,234,591 2,978,483 2,742,171 2,591,904
P=5,277,334 P=5,091,614 P=4,326,945 P=4,396,513
Other accruals represent mainly fringe and other personnel benefits.
25. Capital Funds
Capital Stock
The Parent Bank’s capital stock as of December 31, 2020 and 2019 consists of the following:
Shares Amount
2020 2019 2020 2019
Common – P=10 par value Authorized 1,311,422,420 1,311,422,420 P=13,114,224 P=13,114,224
Issued and outstanding 1,218,471,467 1,217,609,561 12,184,715 12,176,096
Preferred – P=100 par value, non-votingAuthorized 100,000,000 100,000,000 P=10,000,000 P=10,000,000Issued and outstanding – – – –
On June 29, 1992, the Parent Bank was originally listed with the then Makati Stock Exchange,now PSE. A total of 89.7 million shares were issued at an issue price of P=22.50. As ofDecember 31, 2020 and 2019, there are 1,217.1 million shares listed at the PSE. The numberof holders and the closing price of the said shares is 4,953 and P=71.90 per share as ofDecember 31, 2020, respectively, and 4,949 and P=57.70 per share as of December 31, 2019,respectively.

Capital Funds - 125 -
*SGVFSM005928*
On January 27, 2020 and March 1, 2019, the Parent Bank issued 861,906 and 460,049 commonshares to qualified employees under the Parent Bank’s Employee Stock Payment Plan,respectively.
Surplus Free
The following is a summary of the dividends declared and distributed by the Parent Bank in2020, 2019, and 2018:
Date of
Declaration Date of Record
Date of BSP
Approval
Date of
Payment
Dividend per
Share
Outstanding
Shares Total Amount
January 24, 2020 February 7, 2020 N/A February 24, 2020 P=3.50 1,218,471,467 P=4,264,650
January 25, 2019 February 11, 2019 N/A February 28, 2019 1.90 1,217,149,512 2,312,584
January 26, 2018 February 12, 2018 N/A February 27, 2018 1.90 1,058,343,929 2,010,853
In compliance with BSP regulations, the Parent Bank ensures that adequate reserves are in placefor future bank expansion requirements. The foregoing cash dividend declarations were madewithin the BSP’s allowable limit of dividends.
Surplus ReservesThe amended PNUCA requires that the portion of retained earnings representing Trust fundincome of FUPI be automatically restricted to payments of benefits of plan holders and relatedpayments as allowed in the amended PNUCA. The accumulated Trust Fund income, net ofreleases representing the amount of Trust fund income that pertains to the matured and pre-terminated plans of planholders which have been withdrawn from the trust fund during the year,should be appropriated and presented separately as Surplus Reserves in the statements of changesin capital funds. FUPI transferred out P=1,458.7 million, P=112.1 million and P=97.1 million fromappropriated reserves for the years ended December 31, 2020, 2019, and 2018, respectively.
In compliance with BSP regulations, a portion of the Group’s income from trust operations issetup as Surplus Reserves. For the years ended December 31, 2020, 2019, and 2018, the Groupand the Parent Bank appropriated P=17.1 million , P=16.1 million, and P=15.7 million, respectively.
Included in this account is the difference between the 1% general loan loss provision (GLLP)over the computed ECL allowance for credit losses related to Stage 1 accounts, as a required BSPappropriation. As of December 31, 2020 and 2019, surplus reserves related to the differencebetween GLLP over ECL allowance amounted to P=2.30 billion and P=2.82 billion, respectively,for the Group and, P=1.89 billion and P=2.40 billion, respectively, for the Parent Bank.

Maturity Profile of Assets and Liabilities - 126 -
*SGVFSM005928*
26. Maturity Profile of Assets and Liabilities
The following tables show an analysis of assets and liabilities analyzed according to whether theyare expected to be recovered or settled within one year and beyond one year from the statementof financial position date:
Group
2020 2019
Due within
one year
Due beyond
one year Total
Due withinone year
Due beyondone year Total
Financial Assets
Cash and other cash items P=8,958,042 P=− P=8,958,042 P=8,580,709 P=− P=8,580,709
Due from BSP 103,869,770 − 103,869,770 73,749,813 − 73,749,813Due from other banks 68,532,218 − 68,532,218 73,675,709 − 73,675,709IBLR − − − 213,062 − 213,062
Trading and investment securitiesat FVTPL 18,448,649 − 18,448,649 7,866,401 − 7,866,401at amortized cost - gross 3,542,411 152,608,258 156,150,669 504,253 161,273,520 161,777,773
at FVOCI 19,522 31,170,737 31,190,259 2,530,320 3,127,315 5,657,635Loans and receivables - net of
unearned discounts 111,744,274 239,310,457 351,054,731 141,437,460 259,826,069 401,263,529
Other resources 314,940 1,205,783 1,520,723 1,557,041 1,052,012 2,609,053
315,452,934 424,295,235 739,748,169 310,114,768 425,278,916 735,393,684
Nonfinancial Assets
Investment in associates − 255,342 255,342 − 159,094 159,094Bank premises, furniture, fixtures
and equipment − 12,401,256 12,401,256 − 10,848,713 10,848,713
Investment properties − 11,723,974 11,723,974 − 11,622,884 11,622,884Goodwill − 15,571,703 15,571,703 − 15,455,564 15,455,564Other resources 1,419,237 13,847,446 15,266,683 779,281 11,418,621 12,197,902
1,419,237 53,799,721 55,218,958 779,281 49,504,876 50,284,157
P=316,872,171 P=478,094,956 P=794,967,127 P=310,894,049 P=474,783,792 P=785,677,841
Allowance for credit losses andimpairment 12,360,813 8,226,487
Accumulated depreciation(Notes 16 and 17) 8,147,077 6,663,815
20,507,890 14,890,302
P=774,459,237 P=770,787,539
Financial Liabilities
Deposit liabilities P=504,349,110 P=23,435,916 P=527,785,026 P=457,777,805 P=26,558,235 P=484,336,040Bills payable 35,631,769 18,591,774 54,223,543 101,213,164 3,874,558 105,087,722
Notes and bonds payable − 59,853,656 59,853,656 10,952,898 38,378,608 49,331,506Other liabilities 21,381,423 1,711,596 23,093,019 27,784,468 3,205,848 30,990,316
561,362,302 103,592,942 664,955,244 597,728,335 72,017,249 669,745,584Nonfinancial Liabilities
Accrued income and other taxes 711,003 − 711,003 433,533 − 433,533
Other liabilities 209,751 3,430,837 3,640,588 322,237 2,269,220 2,591,457
920,754 3,430,837 4,351,591 755,770 2,269,220 3,024,990
P=562,283,056 P=107,023,779 P=669,306,835 P=598,484,105 P=74,286,469 P=672,770,574

Maturity Profile of Assets and Liabilities and
Service Charges, Fees and Commissions - 127 -
*SGVFSM005928*
Parent Bank
2020 2019
Due within
one year
Due beyond
one year Total
Due within
one year
Due beyond
one year Total
Financial Assets
Cash and other cash items P=7,814,917 P=− P=7,814,917 P=7,832,302 P=− P=7,832,302
Due from BSP 83,867,434 − 83,867,434 67,798,418 − 67,798,418Due from other banks 64,782,755 − 64,782,755 71,497,226 − 71,497,226IBLR − − − 213,062 − 213,062
Trading and investment securitiesat FVTPL 18,411,304 − 18,411,304 7,817,555 − 7,817,555at amortized cost - gross 3,450,996 150,059,817 153,510,813 504,253 161,273,520 161,777,773
at FVOCI − 31,009,041 31,009,041 2,530,320 3,127,315 5,657,635Loans and receivables - net of
unearned discounts 90,445,312 191,597,831 282,043,143 129,222,328 209,973,781 339,196,109
Other resources 248,744 1,090,830 1,339,574 399,288 231,368 630,656
269,021,462 373,757,519 642,778,981 287,814,752 374,605,984 662,420,736
Nonfinancial Assets
Investment in subsidiaries − 21,867,987 21,867,987 − 20,523,633 20,523,633Bank premises, furniture, fixtures
and equipment − 8,879,704 8,879,704 − 7,814,128 7,814,128Investment properties − 10,299,738 10,299,738 − 10,380,251 10,380,251Goodwill − 7,886,898 7,886,898 − 7,886,898 7,886,898
Other resources 1,269,214 11,012,152 12,281,366 605,736 9,275,289 9,881,025
1,269,214 59,946,479 61,215,693 605,736 55,880,199 56,485,935
P=270,290,676 P=433,703,998 P=703,994,674 P=288,420,488 P=430,486,183 P=718,906,671
Allowance for credit losses andimpairment 9,284,214 6,598,605
Accumulated depreciation(Notes 16 and 17) 5,830,455 4,694,591
15,114,669 11,293,196
P=688,880,005 P=707,613,475
Financial Liabilities
Deposit liabilities P=445,768,872 P=19,459,747 P=465,228,619 P=420,595,435 P=18,358,914 P=438,954,349Bills payable 22,060,529 12,441,892 34,502,421 89,075,645 3,073,611 92,149,256
Notes and bonds payable − 59,746,857 59,746,857 10,952,898 38,229,163 49,182,061Other liabilities 19,579,840 1,436,824 21,016,664 26,045,504 1,101,874 27,147,378
487,409,241 93,085,320 580,494,561 546,669,482 60,763,562 607,433,044
Nonfinancial Liabilities
Accrued income and other taxes 386,730 − 386,730 258,537 − 258,537Other liabilities 170,523 3,264,444 3,434,967 229,734 1,703,610 1,933,344
557,253 3,264,444 3,821,697 488,271 1,703,610 2,191,881
P=487,966,494 P=96,349,764 P=584,316,258 P=547,157,753 P=62,467,173 P=609,624,925
27. Service Charges, Fees and Commissions
This account is broken down as follows:
Group Parent Bank
2020 2019 2018 2020 2019 2018
Service charges P=1,402,768 P=1,169,886 P=1,066,576 P=1,040,199 P=1,000,367 P=866,172
Bank commissions 190,677 206,408 116,551 128,194 143,569 111,473Others 753,194 579,924 389,117 555,227 278,780 307,022
P=2,346,639 P=1,956,218 P=1,572,244 P=1,723,620 P=1,422,716 P=1,284,667
Others include commission income and other fees earned by the Parent Bank on the insurancepolicies sold under the bancassurance deal with Insular Life (see Note 32).

Miscellaneous Income and Expenses - 128 -
*SGVFSM005928*
28. Miscellaneous Income and Expenses
Miscellaneous Income
Miscellaneous income is composed of the following:
Group
2020 2019 2018
Foreign exchange gains - net P=535,536 P=682,371 P=584,920Gain on sale of investment properties (Note 17) 229,148 200,079 258,000
Fines and penalties 209,382 131,537 131,690
Dividend 200,671 202,888 207,456
Income from trust operations (Note 31) 171,271 160,929 156,524Rental (Notes 17 and 34) 154,077 163,730 160,713
Gain on foreclosure of investment properties (Note 17) 153,876 221,213 239,741
Recoveries from charged-off assets 94,523 143,781 112,378Gain from bargain purchase (Note 15) 25,291 − −Trust fund income (loss) (Note 19) (14,976) 72,534 198,919
Gain (loss) on sale of property and equipment (8,641) 679,298 44,296
EAF earned (Note 32) − − 100,000Others 328,838 309,021 163,640
P=2,078,996 P=2,967,381 P=2,358,277
Parent Bank
2020 2019 2018
Share in net profit of subsidiaries (Note 15) P=953,082 P=1,222,595 P=1,775,210
Foreign exchange gains - net 242,388 398,739 584,904
Dividend 200,671 201,858 206,425Gain on sale of investment properties (Note 17) 195,471 251,696 245,980
Income from trust operations (Note 31) 171,271 161,078 156,524
Rental (Notes 17 and 34) 164,177 165,523 156,276Gain on foreclosure of investment properties (Note 17) 153,876 208,233 285,902
Gain on sale of property and equipment 6,236 616,137 44,225
EAF earned (Note 32) − − 100,000
Others 477,876 366,987 443,745
P=2,565,048 P=3,592,846 P=3,999,191
Miscellaneous Expenses
The breakdown of miscellaneous expenses follows:
Group
2020 2019 2018
Insurance P=1,085,667 P=912,531 P=931,079
Information technology 1,072,710 617,882 458,902Outside services 882,658 829,185 695,084
Advertising and publicity 657,220 765,796 700,155
Supervision and compliance costs 579,870 541,818 553,058
Management and professional fees 421,616 502,090 550,908Card related expenses 326,021 253,815 224,190
Communication 279,268 418,923 347,516
Impairment on goodwill (Note 18) 223,172 − −Stationery and supplies 221,047 169,668 171,523Litigation 189,844 148,568 176,599
Provision (reversal) of impairment on investment properties
(Note 17) − (13,173) 11,054Transportation and travel 177,591 276,988 252,775
Repairs and maintenance 168,584 262,496 409,902
Plan benefits 52,500 108,000 158,000
Fines and penalties 49,665 40,873 105,566Representation and entertainment 39,516 57,529 83,701
Others 1,322,117 969,179 617,562
P=7,749,066 P=6,862,168 P=6,447,574

Miscellaneous Income and Expenses and
Salaries and Employee Benefits - 129 -
*SGVFSM005928*
Parent Bank
2020 2019 2018
Information technology P=1,015,784 P=600,133 P=453,413
Insurance 967,995 811,700 819,369Advertising and publicity 619,558 719,042 619,463
Outside services 607,103 647,026 615,933
Supervision and compliance costs 553,058 453,467 528,003Card related expenses 326,021 253,815 224,190
Management and professional fees 320,891 417,295 504,644
Provision for impairment of investment in
subsidiaries (Note 15) 290,002 − −Litigation 189,347 145,785 175,716
Stationery and supplies 173,489 122,257 143,869
Communication 143,293 291,884 280,262
Repairs and maintenance 122,550 212,122 365,235Transportation and travel 92,934 137,353 171,099
Representation and entertainment 34,107 52,093 75,204
Reversal of impairment on investment properties (Note 17) − (10,873) (9,728)Others 670,331 480,255 243,656
P=6,126,463 P=5,333,354 P=5,210,328
29. Salaries and Employee Benefits
Salaries and Employee Benefits Expense
Expenses recognized for employee benefits are as follows:Group
2020 2019 2018
Short-term benefits:Salaries and wages P=4,042,160 P=3,956,706 P=3,289,797Bonuses and fringe benefits 2,900,479 3,369,550 1,792,877Social security costs 172,358 194,438 139,182Other benefits 175,912 126,626 102,110
Post-employment benefits 454,081 336,957 337,837Other long-term benefits 64,214 85,971 64,790
P=7,809,204 P=8,070,248 P=5,726,593
Parent Bank
2020 2019 2018
Short-term benefits:Salaries and wages P=2,958,540 P=2,836,275 P=2,631,683
Bonuses and fringe benefits 2,295,770 3,068,768 1,529,952Social security costs 101,542 93,198 78,849Other benefits 114,174 107,215 103,048
Post-employment benefits 376,741 247,801 261,170Other long-term benefits 64,214 81,495 64,789
P=5,910,981 P=6,434,752 P=4,669,491
Post-employment Defined Benefit Plan
(a) Characteristics of the Defined Benefit Plan
The Group maintains funded, tax-qualified, noncontributory pension plans covering allregular full-time employees that are being administered by the Parent Bank’s TISG for theParent Bank, UIC and CSB and by trustee banks that are legally separated from the Groupfor FUIFAI, PR Savings Bank and PETNET. Under these pension plans, all coveredemployees are entitled to cash benefits after satisfying certain age and service requirements.

Salaries and Employee Benefits - 130 -
*SGVFSM005928*
The Group maintains seven separate retirement plans. Two of which are being maintainedfor UnionBank and former iBank employees, hence, the Parent Bank presents pensioninformation in its financial statements separately for the two plans. The other five pensionplans are for UIC, CSB, FUIFAI, PR Savings Bank and PETNET employees.
UnionBank PlanThe normal retirement age is 60. The plan also provides for an early retirement at age 55, orage 50 with the completion of at least ten years of service. However, late retirement issubject to the approval of the Parent Bank’s BOD. Normal retirement benefit is an amountequivalent to 150% of the final monthly salary for each year of credited service.
Former iBank PlanThe normal retirement age is 60 with a minimum of five years of credited service. The planalso provides for an early retirement at age 50 with the completion of at least ten years ofservice and late retirement subject to the approval of the Parent Bank’s BOD on a case-to-case basis. Normal retirement benefit is an amount equivalent to 125% of the final monthlycovered compensation for every year of credited service.
UIC PlanThe optional retirement age is 60 and the compulsory retirement age is 65. Both must have aminimum of five years of credited service. Both have retirement benefit equal to one-halfmonth’s salary as of the date of retirement multiplied by the employee’s year of service.Upon retirement of an employee, whether optional or compulsory, his services may becontinued or extended on a case to case basis upon agreement of management and employee.
This is based on the retirement plan benefits provided in the Retirement Law(R.A. No. 7641).
Under the law, unless the parties provide for broader inclusions, the term one-half (1/2)month salary shall mean fifteen (15) days plus one-twelfth (1/12) of the 13th month pay andthe cash equivalent of not more than (5) days of service incentive leaves.
CSB PlanThe normal retirement age is 60 or completion of 30 years of service whichever is earlier.The service of any member, however, may be extended from year to year beyond the normalretirement date, provided such an extension of service is with the consent of the member andthe express approval of CSB. The plan also provides for an early retirement after completionof at least ten years of service. Normal retirement benefit is an amount equivalent to 100%of the final basic monthly salary multiplied by the number of years of service prior toJanuary 1, 2008 and 150% of the final basic monthly salary for services rendered startingJanuary 1, 2008.
FUIFAI PlanThe normal retirement age is 60 with a minimum of five years of credited service. The planalso provides for an early retirement at age 50 with a minimum of five years of credited serviceand late retirement after age 60, both subject to the approval of FUIFAI’s BOD. Normalretirement benefit is an amount equivalent to 150% of the final monthly covered compensation(average monthly basic salary during the last 12 months of credited service) for every year ofcredited service.

Salaries and Employee Benefits - 131 -
*SGVFSM005928*
PR Savings Bank PlanThe normal retirement age is 60. Retirement benefit is an amount equivalent to 100%, 150% or200% of the latest basic monthly salary for each year of credited service if the years of serviceis 10 years but less than 15 years, 15 years but less than 20 years and 20 years or more,respectively.
PETNET PlanThe normal retirement age is 60. The plan also provides for an early retirement at age 50 withthe completion of at least ten years of service and late retirement beyond age 60. However,early and late retirement are subject to the approval of the company. Retirement benefit is anamount equivalent to 92% of the final monthly salary for each year of continuous service.
Bangko Kabayan PlanThe normal retirement age is 60 with at least five years of credited service. Retirement benefitis an amount equivalent to 100%, 125% or 150% of the latest basic monthly salary for eachyear of credited service if the years of service is 10 years but less than 15 years, 15 years butless than 20 years, and 20 years or more, respectively.
PBI PlanThe normal retirement age is 60 with at least five years of credited service. Retirement benefitis an amount equivalent to 22.5 days pay for every year of credited service.
(b) Analysis of Amounts Presented in the Financial Statements
Actuarial valuations are made annually to update the retirement benefit costs and the amountof contributions. All amounts presented in the subsequent pages are based on the actuarialvaluation reports obtained from independent actuaries in 2020 and 2019.
The amounts of post-employment defined benefit obligation (net retirement asset) recognizedin the statements of financial position are determined as follows (see Notes 19 and 24):
Group
2020 2019
Present value of the obligation P=5,225,149 P=3,912,530Fair value of plan assets 4,113,808 3,572,539
P=1,111,341 P=339,991
As of December 31, 2020 and 2019, the net retirement obligation amounting toP=1,111,341 and P=339,991 is separately shown as Net retirement asset of P=70,411 andP=81,960, respectively (see Note 19), and as Post-employment defined benefit obligation ofP=1,181,752 and P=421,951, respectively (see Note 24).
Parent Bank – UnionBank Plan
2020 2019
Present value of the obligation P=3,861,379 P=2,862,263Fair value of plan assets 2,857,169 2,471,361
P=1,004,210 P=390,902
Parent Bank – Former iBank Plan
2020 2019
Present value of the obligation P=683,325 P=550,665Fair value of plan assets 582,491 541,311
P=100,834 P=9,354

Salaries and Employee Benefits - 132 -
*SGVFSM005928*
The movements in the present value of the post-employment benefit obligation recognized inthe financial statements are as follows:
Group
2020 2019 2018
Balance at beginning of year P=3,912,530 P=3,344,042 P=4,175,532Current service cost 456,544 307,103 337,837Interest expense 182,222 226,273 187,136Past service cost (1,969) 29,854 −Remeasurements:
Actuarial losses (gains) arising fromChanges in financial assumptions 747,764 376,639 (549,408)Experience adjustments (190) (25,206) 217,217
Changes in demographic assumptions 4,095 (7,483) (23,676)Benefits paid (157,627) (338,692) (1,095,626)Effects of business combinations (Note 15) 81,780 − 95,030
Balance at end of year P=5,225,149 P=3,912,530 P=3,344,042
Parent Bank - UnionBank Plan
2020 2019 2018
Balance at beginning of year P=2,862,263 P=2,363,016 P=3,084,669Current service cost 347,923 220,321 227,011Interest expense 126,301 162,028 138,432Remeasurements: Actuarial losses (gains) arising from
Changes in financial assumptions 601,247 270,193 (458,958)Experience adjustments 7,076 24,637 230,179Changes in demographic assumptions 7,660 (3,097) −
Benefits paid (91,091) (174,835) (858,317)
Balance at end of year P=3,861,379 P=2,862,263 P=2,363,016
Parent Bank - Former iBank Plan
2020 2019 2018
Balance at beginning of year P=550,665 P=482,049 P=729,661Current service cost 28,818 27,480 34,159Interest expense 24,807 32,881 30,819Remeasurements:
Actuarial losses (gains) arising fromChanges in financial assumptions 108,630 55,384 (100,142)Experience adjustments 1,006 (5,842) 12,860Changes in demographic assumptions (5,280) 1,157 −
Benefits paid (25,321) (42,444) (225,308)
Balance at end of year P=683,325 P=550,665 P=482,049
The movements in the fair value of plan assets are presented below.
Group
2020 2019 2018
Balance at beginning of year P=3,572,539 P=3,380,329 P=3,236,803Interest income 167,778 235,128 143,434Return on plan asset (excluding amounts included
in net interest) 117,046 (218,422) (84,670)Contributions to the plan 353,473 514,196 977,032Benefits paid (157,625) (338,692) (1,095,626)Effects of business combinations (Note 15) 60,597 − 203,356
Balance at end of year P=4,113,808 P=3,572,539 P=3,380,329
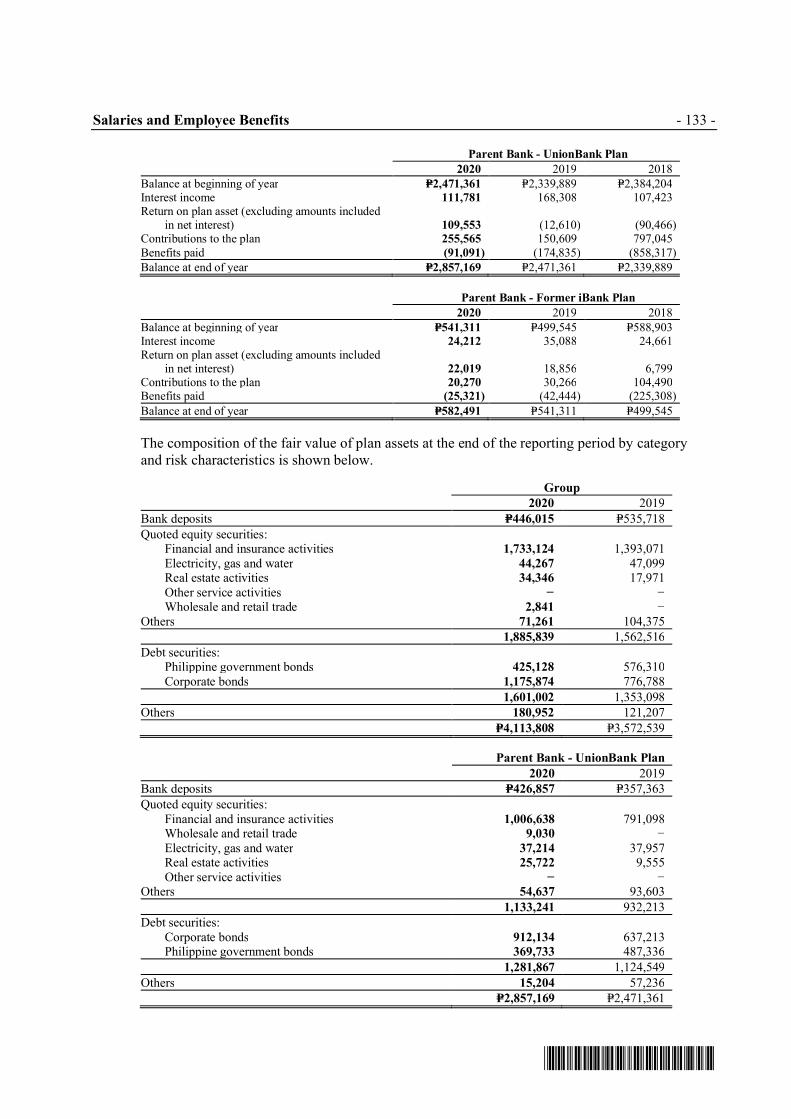
Salaries and Employee Benefits - 133 -
*SGVFSM005928*
Parent Bank - UnionBank Plan
2020 2019 2018
Balance at beginning of year P=2,471,361 P=2,339,889 P=2,384,204Interest income 111,781 168,308 107,423Return on plan asset (excluding amounts included
in net interest) 109,553 (12,610) (90,466)Contributions to the plan 255,565 150,609 797,045Benefits paid (91,091) (174,835) (858,317)
Balance at end of year P=2,857,169 P=2,471,361 P=2,339,889
Parent Bank - Former iBank Plan
2020 2019 2018
Balance at beginning of year P=541,311 P=499,545 P=588,903Interest income 24,212 35,088 24,661Return on plan asset (excluding amounts included
in net interest) 22,019 18,856 6,799Contributions to the plan 20,270 30,266 104,490Benefits paid (25,321) (42,444) (225,308)
Balance at end of year P=582,491 P=541,311 P=499,545
The composition of the fair value of plan assets at the end of the reporting period by categoryand risk characteristics is shown below.
Group
2020 2019
Bank deposits P=446,015 P=535,718
Quoted equity securities:Financial and insurance activities 1,733,124 1,393,071Electricity, gas and water 44,267 47,099Real estate activities 34,346 17,971Other service activities − −Wholesale and retail trade 2,841 −
Others 71,261 104,375
1,885,839 1,562,516
Debt securities:Philippine government bonds 425,128 576,310Corporate bonds 1,175,874 776,788
1,601,002 1,353,098
Others 180,952 121,207
P=4,113,808 P=3,572,539
Parent Bank - UnionBank Plan
2020 2019
Bank deposits P=426,857 P=357,363
Quoted equity securities:Financial and insurance activities 1,006,638 791,098Wholesale and retail trade 9,030 −Electricity, gas and water 37,214 37,957Real estate activities 25,722 9,555Other service activities − −
Others 54,637 93,603
1,133,241 932,213
Debt securities:Corporate bonds 912,134 637,213Philippine government bonds 369,733 487,336
1,281,867 1,124,549
Others 15,204 57,236
P=2,857,169 P=2,471,361

Salaries and Employee Benefits - 134 -
*SGVFSM005928*
Parent Bank - Former iBank Plan
2020 2019
Bank deposits P=2,328 P=33,906
Quoted equity securities:Financial intermediation 413,478 401,257Wholesale and retail trade − −
Others − −413,478 401,257
Debt securities:Corporate bonds 152,295 82,465Philippine government bonds 12,062 16,652
164,357 99,117
Others 2,328 7,031
P=582,491 P=541,311
Equity securities under the fund are primarily investments in corporations listed in the PSE,which include P=186,210 and P=154,225 investments in the shares of stocks of the Parent Bankas of December 31, 2020 and 2019, respectively, while debt securities represent investmentsin government and corporate bonds, which include P=444,099 and P=199,000 investment in thenotes of the Parent Bank as of December 31, 2020 and 2019, respectively (see Note 32).
The fair values of the above equity and debt securities are determined based on quotedmarket prices in active markets (classified as Level 1 of the fair value hierarchy). Theretirement fund neither provides any guarantee or surety for any obligation of the ParentBank nor its investments in the Bank’s shares of stocks covered by any restriction and liens.Bank deposits are maintained with reputable financial institutions, which include P=353,597and P=342,409 deposits with the Parent Bank as of December 31, 2020 and 2019, respectively(see Note 32).
Actual returns on plan assets amounted to P=284,824 in 2020, P=16,706 in 2019, and P=58,764in 2018 for the Group. Actual returns on plan assets amounted to P=221,334 in 2020,P=155,698 in 2019, and P=16,957 in 2018 for UnionBank Plan and P=46,231 in 2020, P=53,944in 2019, and P=31,460 in 2018 for Former iBank Plan.
The amounts recognized in the statements of income in respect of the post-employmentdefined benefit plan are as follows:
Group
2020 2019 2018
Current service cost P=456,544 P=307,103 P=337,837Past service cost (1,969) 29,854 −Net interest expense (income) 14,444 (8,855) 43,702
P=469,019 P=328,102 P=381,539
Parent Bank - UnionBank Plan
2020 2019 2018
Current service cost P=347,923 P=220,321 P=227,011Net interest expense (income) 14,520 (6,280) 31,009
P=362,443 P=214,041 P=258,020
Parent Bank - Former iBank Plan
2020 2019 2018
Current service cost P=28,818 P=27,480 P=34,159Net interest expense (income) 595 (2,207) 6,158
P=29,413 P=25,273 P=40,317
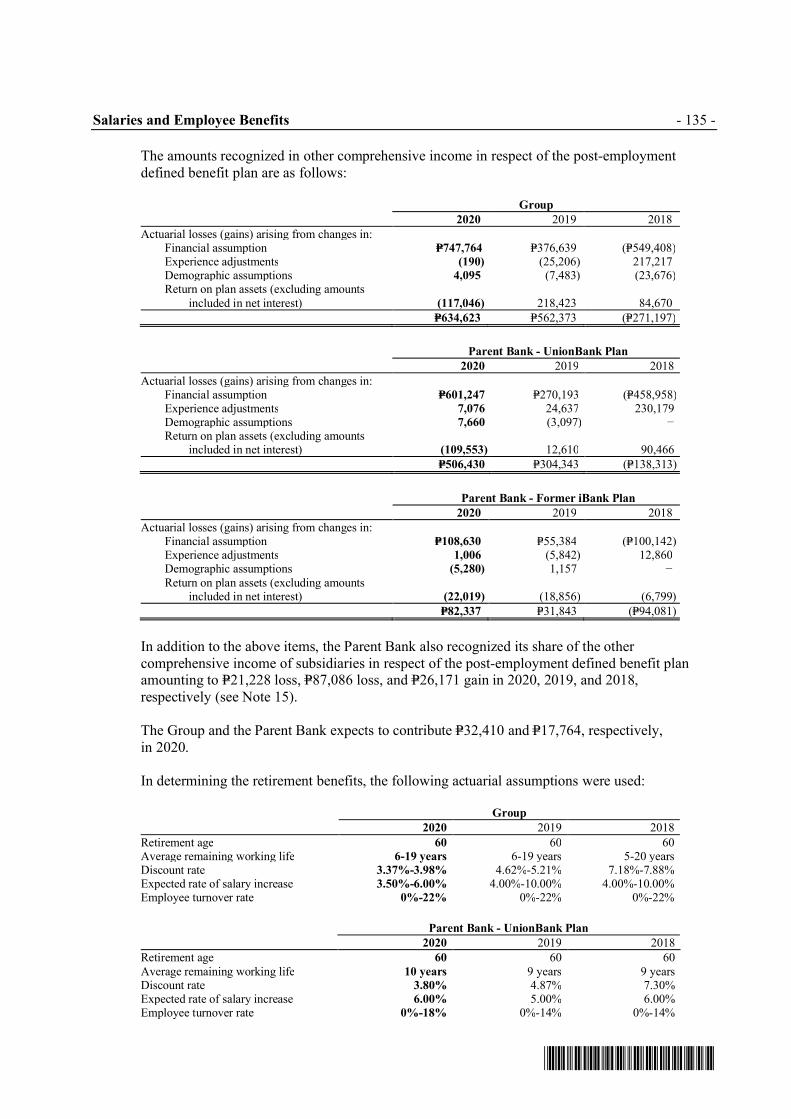
Salaries and Employee Benefits - 135 -
*SGVFSM005928*
The amounts recognized in other comprehensive income in respect of the post-employmentdefined benefit plan are as follows:
Group
2020 2019 2018
Actuarial losses (gains) arising from changes in:Financial assumption P=747,764 P=376,639 (P=549,408)Experience adjustments (190) (25,206) 217,217Demographic assumptions 4,095 (7,483) (23,676)
Return on plan assets (excluding amountsincluded in net interest) (117,046) 218,423 84,670
P=634,623 P=562,373 (P=271,197)
Parent Bank - UnionBank Plan
2020 2019 2018
Actuarial losses (gains) arising from changes in:Financial assumption P=601,247 P=270,193 (P=458,958)Experience adjustments 7,076 24,637 230,179Demographic assumptions 7,660 (3,097) −
Return on plan assets (excluding amountsincluded in net interest) (109,553) 12,610 90,466
P=506,430 P=304,343 (P=138,313)
Parent Bank - Former iBank Plan
2020 2019 2018
Actuarial losses (gains) arising from changes in:Financial assumption P=108,630 P=55,384 (P=100,142)Experience adjustments 1,006 (5,842) 12,860
Demographic assumptions (5,280) 1,157 − Return on plan assets (excluding amounts
included in net interest) (22,019) (18,856) (6,799)
P=82,337 P=31,843 (P=94,081)
In addition to the above items, the Parent Bank also recognized its share of the othercomprehensive income of subsidiaries in respect of the post-employment defined benefit planamounting to P=21,228 loss, P=87,086 loss, and P=26,171 gain in 2020, 2019, and 2018,respectively (see Note 15).
The Group and the Parent Bank expects to contribute P=32,410 and P=17,764, respectively,in 2020.
In determining the retirement benefits, the following actuarial assumptions were used:
Group
2020 2019 2018
Retirement age 60 60 60Average remaining working life 6-19 years 6-19 years 5-20 yearsDiscount rate 3.37%-3.98% 4.62%-5.21% 7.18%-7.88%Expected rate of salary increase 3.50%-6.00% 4.00%-10.00% 4.00%-10.00%Employee turnover rate 0%-22% 0%-22% 0%-22%
Parent Bank - UnionBank Plan
2020 2019 2018
Retirement age 60 60 60Average remaining working life 10 years 9 years 9 yearsDiscount rate 3.80% 4.87% 7.30%Expected rate of salary increase 6.00% 5.00% 6.00%Employee turnover rate 0%-18% 0%-14% 0%-14%

Salaries and Employee Benefits - 136 -
*SGVFSM005928*
Parent Bank - Former iBank Plan
2020 2019 2018
Retirement age 60 60 60Average remaining working life 9 years 10 years 9 yearsDiscount rate 3.47% 4.71% 7.20%Expected rate of salary increase 6.00% 5.00% 6.00%Employee turnover rate 0%-16% 0%-12% 0%-15%
Assumptions regarding future mortality and disability are based on published statistics andmortality tables. These assumptions were developed by management with the assistance ofan independent actuary. Discount factors are determined close to the end of each reportingperiod by reference to the interest rates of a zero coupon government bond with terms tomaturity approximating to the terms of the retirement obligation. Other assumptions arebased on current actuarial benchmarks and management’s historical experience.
(c) Risk Associated with the Retirement Plan
The plans expose the Group to actuarial risks such as investment risk, interest rate risk,longevity risk and salary risk.
Investment and Interest Risk
The present value of the defined benefit obligation is calculated using a discount ratedetermined by reference to market yields of government bonds. Generally, a decrease inthe interest rate of a reference government bonds will increase the plan obligation.However, this will be partially offset by an increase in the return on the plan’sinvestments in debt securities and if the return on plan asset falls below this rate, it willcreate a deficit in the plan. Currently, the plans are mostly invested in equity securities.Due to the long-term nature of plan obligation, a level of continuing equity investmentsis an appropriate element of the Group’s long-term strategy to manage the plansefficiently.
Longevity and Salary Risks
The present value of the defined benefit obligation is calculated by reference to the bestestimate of the mortality of the plan participants both during and after their employmentand to their future salaries. Consequently, increases in the life expectancy and salary ofthe plan participants will results in an increase in the plan obligation.
(d) Other Information
The information on the sensitivity analysis for certain significant actuarial assumptions, theGroup’s asset-liability matching strategy, and the timing and uncertainty of future cash flowsrelated to the retirement plan are described below and in the succeeding pages.
Sensitivity Analysis
The following table summarizes the effects of changes in the significant actuarialassumptions used in the determination of the defined benefit obligation as ofDecember 31:

Salaries and Employee Benefits - 137 -
*SGVFSM005928*
Group
Impact on Post-Employment Defined
Benefit Obligation
Change in
Assumption
Increase in
Assumption
Decrease in
Assumption
December 31, 2020
Discount rate +/-1.0% (P=420,091) P=497,098
Salary growth rate +/-1.0% 530,980 (461,934)
Turn-over rate +/-1.0% (70,426) 76,221
December 31, 2019Discount rate +/-1.0% (302,699) 351,641Salary growth rate +/-1.0% 366,772 (321,540)Turn-over rate +/-1.0% (32,066) 41,191
UnionBank Plan
Impact on Post-Employment Defined
Benefit Obligation
Change in
Assumption
Increase in
Assumption
Decrease in
Assumption
December 31, 2020
Discount rate +/-1.0% (P=306,244) P=358,795
Salary growth rate +/-1.0% 366,336 (319,319)
Turn-over rate +/-1.0% (47,717) 51,093
December 31, 2019Discount rate +/-1.0% (P=204,270) P=236,408Salary growth rate +/-1.0% 247,894 (218,149)Turn-over rate +/-1.0% (15,473) 16,260
Former iBank Plan
Impact on Post-Employment Defined
Benefit Obligation
Change in
Assumption
Increase in
Assumption
Decrease in
Assumption
December 31, 2020
Discount rate +/-1.0% (P=51,296) P=58,722
Salary growth rate +/-1.0% 59,982 (53,481)
Turn-over rate +/-1.0% (3,841) 4,025
December 31, 2019Discount rate +/-1.0% (P=40,081) P=45,817Salary growth rate +/-1.0% 47,926 (42,685)Turn-over rate +/-1.0% (432) 439
The above sensitivity analysis is based on a change in an assumption while holding allother assumptions constant. This analysis may not be representative of the actual changein the defined benefit obligation as it is unlikely that the change in assumptions wouldoccur in isolation of one another as some of the assumptions may be correlated.
Furthermore, in presenting the above sensitivity analysis, the present value of the definedbenefit obligation has been calculated using the projected unit credit method at the end ofthe reporting period, which is the same as that applied in calculating the defined benefitobligation recognized in the statements of financial position.

Salaries and Employee Benefits - 138 -
*SGVFSM005928*
Asset-liability Matching Strategies
To efficiently manage the retirement plan, the Group through its Retirement Committee,ensures that the investment positions are managed in accordance with its asset-liabilitymatching strategy to achieve that long-term investments are in line with the obligationsunder the retirement scheme. This strategy aims to match the plan assets to theretirement obligations by investing in long-term fixed interest securities (i.e., governmentor corporate bonds) with maturities that match the benefit payments as they fall due andin the appropriate currency. The Group actively monitors how the duration and theexpected yield of the investments are matching the expected cash outflows arising fromthe retirement obligations. In view of this, investments are made in reasonablydiversified portfolio, such that the failure of any single investment would not have amaterial impact on the overall level of assets.
A large portion of assets as of December 31, 2020 and 2019 consists of equity securitiesand bonds, although the Group also invests in bank deposits. The Group believes thatequity securities offer the best returns over the long term with an acceptable level of risk.The majority of equities are in a diversified portfolio of investments in corporationslisted in the PSE.
There has been no change in the Group’s strategies to manage its risks from previousperiods.
Funding Arrangements and Expected Contributions
There is no minimum funding requirement in the country.
The maturity profile of undiscounted expected benefits payments from the plan follows:
Group
2020 2019
Within one year P=738,615 P=634,928More than one year to five years 1,665,568 1,417,993More than five years to ten years 2,488,465 2,037,029More than ten years to 15 years 3,099,137 2,707,479More than 15 years to 20 years 3,194,127 2,556,124More than 20 years 7,793,315 6,422,060
P=18,979,227 P=15,775,613
UnionBank Plan
2020 2019
Within one year P=616,892 P=537,628More than one year to five years 1,279,552 1,082,022More than five years to ten years 1,971,473 1,569,155More than ten years to 15 years 2,333,867 1,958,481More than 15 years to 20 years 2,204,613 1,611,519More than 20 years 5,817,413 4,218,289
P=14,223,810 P=10,977,094

Salaries and Employee Benefits and
Income Taxes - 139 -
*SGVFSM005928*
Former iBank Plan
2020 2019
Within one year P=76,355 P=47,946More than one year to five years 235,414 214,362More than five years to ten years 299,880 244,704More than ten years to 15 years 343,087 331,108More than 15 years to 20 years 265,216 272,497More than 20 years 188,241 199,485
P=1,408,193 P=1,310,102
The weighted average duration of the defined benefit obligation is 19 years and 18 yearsin 2020 and 2019, respectively.
30. Income Taxes
Current and Deferred Income TaxesThe components of income tax expense (benefit) for the years ended December 31, 2020, 2019,and 2018 are as follows:
Group
2020 2019 2018
Reported in profit or loss
Current tax expense:Final tax at 20%, 10% and 7.5% P=1,162,262 P=878,067 P=747,296
Regular corporate income tax(RCIT) at 30% 706,944 580,264 504,017
MCIT at 2% 295,570 225,424 216,024
2,164,776 1,683,755 1,467,337 Deferred tax expense (benefit)
relating to origination and reversal of temporary
differences (1,383,396) (1,189,261) (427,664)
P=781,380 P=494,494 P=1,039,673
Reported in other comprehensive
income
Deferred tax expense (benefit) relating to origination and
reversal of actuarial gains orlosses (P=190,387) (P=168,712) P=81,359

Income Taxes - 140 -
*SGVFSM005928*
Parent Bank
2020 2019 2018
Reported in profit or loss
Current tax expense:Final tax at 20%, 10% and 7.5% P=991,134 P=813,187 P=672,123MCIT at 2% 292,860 221,523 182,501RCIT at 30% 18,358 17,488 22,425
1,302,352 1,052,198 877,049Deferred tax expense (benefit) relating to origination and reversal of temporary
differences (1,232,987) (1,166,440) (673,926)
P=69,365 (P=114,242) P=203,123
Reported in other comprehensive
income
Deferred tax expense (benefit) relating to origination and
reversal of actuarial gains orlosses (P=176,630) (P=100,856) P=69,718
The reconciliation of the statutory income tax rate and the effective income tax rate follows:
Group
2020 2019 2018
Statutory income tax rate 30.00% 30.00% 30.00%Adjustment for income subjected to
lower income tax rates (3.04) (3.13) (3.48)Tax effects of:
FCDU income before tax (15.04) (24.17) (13.66)Non-taxable income (17.04) (5.64) (8.27)Non-deductible expenses 5.77 2.86 5.84Others 5.69 3.48 3.49
Effective income tax rate 6.34% 3.40% 13.92%
Parent Bank
2020 2019 2018
Statutory income tax rate 30.00% 30.00% 30.00%Adjustment for income subjected to
lower income tax rates (2.94) (2.45) (3.38)Tax effects of:
FCDU income before tax (16.38) (25.18) (15.38)Non-taxable income (18.56) (5.69) (9.15)Non-deductible expenses 5.69 2.82 6.08Others 2.80 (0.31) (3.73)
Effective income tax rate 0.61% (0.81%) 4.44%

Income Taxes - 141 -
*SGVFSM005928*
The components of the net deferred tax assets presented under Other resources (see Note 19) asof December 31, 2020, and 2019 follow:
Group
2020 2019
Deferred tax assets:Allowance for credit losses P=3,128,789 P=2,186,535Net operating loss carry over (NOLCO) 1,285,608 720,386Accrued other expenses 883,613 824,916Excess MCIT 528,488 550,535Deferred service fees 411,482 494,571Unrealized foreign exchange loss 399,795 521,160Investment properties 319,366 293,319Others 990,050 645,074
7,947,191 6,236,496
Deferred tax liabilities:Unrealized foreign exchange gain 377,630 510,600Capitalized interest 27,456 28,554Others 88,525 53,484
493,611 592,638
Net deferred tax assets P=7,453,580 P=5,643,858
Parent Bank
2020 2019
Deferred tax assets:Allowance for credit losses P=2,542,622 P=1,966,291Net operating loss carry-over (NOLCO) 1,273,912 714,314Accrued other expenses 830,886 753,705Excess MCIT 514,383 545,953Unrealized foreign exchange loss 394,868 521,160Investment properties 303,195 282,578Others 830,484 630,368
6,690,350 5,414,369
Deferred tax liabilities:Unrealized foreign exchange gain 377,630 509,550Capitalized interest 27,456 28,554Others 28,968 28,940
434,054 567,044
Net deferred tax assets P=6,256,296 P=4,847,325
Other deferred tax asset includes post-retirement obligation and other future deductible items.
In 2020, 2019 and 2018, the Parent Bank incurred MCIT amounting to P=292,860, P=221,523 andP=182,501, respectively, that can be applied against regular corporate income tax liability for thenext three consecutive years after the MCIT was incurred.

Income Taxes - 142 -
*SGVFSM005928*
The Parent Bank also incurred NOLCO in 2020 amounting to P=1.87 billion which can be carriedover as a deduction from gross income for the next five consecutive taxable years from the year itwas incurred pursuant to Revenue Regulations No. 25-2020 (RR 25-2020), implementing Section4(bbbb) of Republic Act No. 11494 or the Bayanihan to Recover as One Act. In 2019 and 2018,the Parent Bank likewise incurred NOLCO amounting to P=1.74 billion and P=644.23 million,respectively, which can be carried over as a deduction from gross income for the next threeconsecutive taxable years from the year it was incurred.
NOLCO inventory under RR 25-2020:
Year Incurred NOLCO Amount Expiry Year
2020 P=1,865,326 2025
Relevant Tax RegulationsThe Republic Act 10963, The Tax Reform for Acceleration and Inclusion (TRAIN), is the firstpackage of the comprehensive tax reform program envisioned by the government. The bill wassigned into law on December 19, 2017 and took effect on January 1, 2018, amending the oldPhilippine tax system.
Except for resident foreign corporations, which is still subject to the existing rate of 7.5%, tax oninterest income of foreign currency deposits was increased to 15% under TRAIN. Documentarystamp tax on bank checks, drafts, certificate of deposit not bearing interest, all debt instruments,bills of exchange, letters of credit, mortgages, deeds and others are now subjected to a higherrate.
The following are the relevant tax regulations affecting the Group:
Income Tax
(a) MCIT, computed at 2% gross income, net of allowable deductions as defined under the taxregulations, or to RCIT of 30%, whichever is higher;
(b) FCDU transactions with non-residents of the Philippines and other offshore banking units(offshore income) are tax-exempt, while interest income on foreign currency loans fromresidents other than offshore banking units (OBUs) or other depository banks under theexpanded system is subject to 10% income tax;
(c) Withholding tax of 7.5% is imposed on interest earned by resident foreign corporations(RFCs) under the expanded foreign currency deposit system, while withholding tax of 15% isimposed on interest earned by residents other than RFCs; and,
(d) NOLCO can be claimed as deductions against taxable income within three years afterNOLCO is incurred. The excess of the MCIT over income tax due may be carried over to thethree succeeding taxable years and credited against income tax due provided the company isin RCIT position. On September 30, 2020, the BIR issued Revenue Regulations No. 25-2020implementing Section 4(bbbb) of Bayanihan to Recover as One Act which states that theNOLCO incurred for taxable years 2020 and 2021 can be carried over and claimed as adeduction from gross income for the next five (5) consecutive taxable years immediatelyfollowing the year of such loss.
Gross Receipts Tax
Banks are subject to gross receipts tax under Sec. 121 of the National Internal Revenue Code asamended.

Income Taxes - 143 -
*SGVFSM005928*
Documentary Stamp Tax
Documentary stamp taxes (DST) (at varying rates) are imposed on the following:(a) Bank checks, drafts, or certificate of deposit not bearing interest, and other instruments;(b) Bonds, loan agreements, promissory notes, bills of exchange, drafts, instruments and
securities issued by the Government of any of its instrumentalities, deposit substitute debtinstruments, certificates of deposits bearing interest and other not payable on sight ordemand;
(c) Acceptance of bills of exchange and letters of credit; and,(d) Bills of lading or receipt.
The significant provisions relating to DST under TRAIN are summarized below:(a) On every original issue of debt instruments, there shall be collected a DST of 1.50 on each
200 or fractional part thereof of the issue price of any such debt instrument; provided, that forsuch debt instruments with terms of less than one year, the DST to be collected shall be of aproportional amount in accordance with the ratio of its term in number of days to 365 days;provided further that only one DST shall be imposed on either loan agreement or promissorynotes to secure such loan.
(b) On all sales or transfer of shares or certificates of stock in any corporation, there shall becollected a DST of 1.50 on each 200, or fractional part thereof, of the par value of such stock.
(c) On all bills of exchange (between points within the Philippines) or drafts, there shall becollected a DST of 0.60 on each 200, or fractional part thereof, of the face value of any suchbill of exchange or draft.
(d) The following instruments, documents and papers shall be exempt from DST:
Borrowings and lending of securities executed under the Securities Borrowing andLending Program of a registered exchange, or in accordance with regulations prescribedby the appropriate regulatory authority;
Loan agreements or promissory notes, the aggregate of which does not exceed 250,000or any such amount as may be determined by the Secretary of Finance, executed by anindividual for his purchase on installment for his personal use;
Sale, barter or exchange of shares of stock listed and traded through the local stockexchange (as amended by RA No. 9648);
Fixed income and other securities traded in the secondary market or through anexchange;
Derivatives including repurchase agreements and reverse repurchase agreements;
Bank deposit accounts without a fixed term or maturity; and,
Interbank call loans with maturity of not more than seven days to cover deficiency inreserve against deposit liabilities.
Itemized DeductionIn 2020, 2019 and 2018, the Parent Bank opted to claim itemized deductions.

Trust Operations - 144 -
*SGVFSM005928*
31. Trust Operations
The following securities and other properties held by the Parent Bank in fiduciary or agencycapacity (for a fee) for its customers are not included in the accompanying statement of financialposition since these are not properties of the Parent Bank.
2020 2019
Investments P=69,674,637 P=49,480,781Others 4,794,912 4,839,637
P=74,469,549 P=54,320,418
In compliance with the requirements of the General Banking Act relative to the Parent Bank’strust functions:
(a) Investment in government securities with a total face value of P=800,000 and P=650,000 as ofDecember 31, 2020 and 2019, respectively, are deposited with BSP as security for the ParentBank’s faithful compliance with its fiduciary obligations (see Note 12); and,
(b) Ten percent of the Parent Bank’s trust income is transferred to Surplus reserves. This yearlytransfer is required until the surplus reserves for trust function is equivalent to 20% of theParent Bank’s authorized capital stock. No part of such reserves shall at anytime be paid outas dividends, but losses accruing in the course of business may be charged against suchsurplus. As of December 31, 2020 and 2019, the reserve for trust functions amounted toP=280,961 and P=263,834, respectively, and is included as part of Surplus reserves in thestatements of financial position (see Note 25).
Income from trust operations of the Group amounted to P=171,271, P=160,929 and P=156,524 in2020, 2019 and 2018, respectively. Income from trust operations of the Parent Bank amounted toP=171,271, P=161,078 and P=156,524 in 2020, 2019 and 2018, respectively. These are shown asIncome from trust operations account under Miscellaneous income in the statements of income(see Note 28).
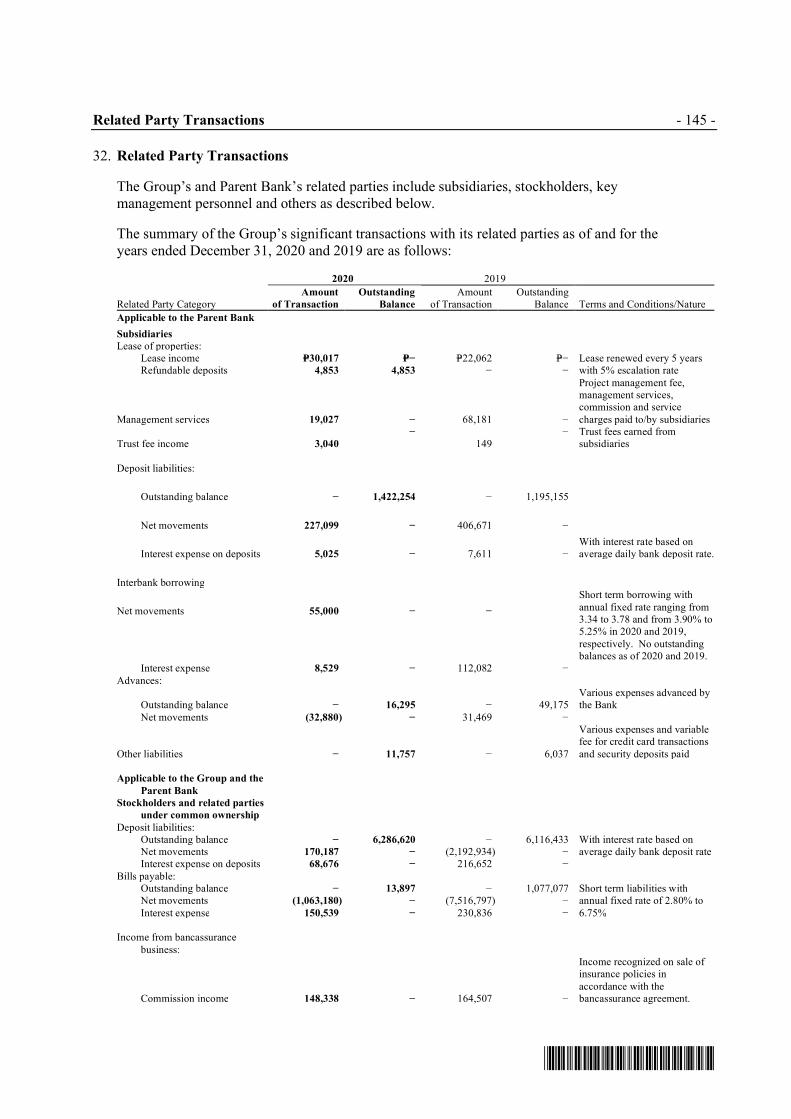
Related Party Transactions - 145 -
*SGVFSM005928*
32. Related Party Transactions
The Group’s and Parent Bank’s related parties include subsidiaries, stockholders, keymanagement personnel and others as described below.
The summary of the Group’s significant transactions with its related parties as of and for theyears ended December 31, 2020 and 2019 are as follows:
2020 2019
Related Party CategoryAmount
of Transaction
Outstanding
Balance
Amountof Transaction
OutstandingBalance Terms and Conditions/Nature
Applicable to the Parent Bank
Subsidiaries
Lease of properties:Lease income P=30,017 P=− P=22,062 P=− Lease renewed every 5 years
with 5% escalation rateRefundable deposits 4,853 4,853 − −
Management services 19,027 − 68,181 −
Project management fee,management services,commission and service
charges paid to/by subsidiaries
Trust fee income 3,040
−149
− Trust fees earned fromsubsidiaries
Deposit liabilities:
Outstanding balance − 1,422,254 − 1,195,155
With interest rate based onaverage daily bank deposit rate.
Net movements 227,099 − 406,671 −
Interest expense on deposits 5,025 − 7,611 −
Interbank borrowing
Net movements 55,000 − −Short term borrowing with
annual fixed rate ranging from3.34 to 3.78 and from 3.90% to5.25% in 2020 and 2019,
respectively. No outstandingbalances as of 2020 and 2019.
Interest expense 8,529 − 112,082 −Advances:
Outstanding balance − 16,295 − 49,175Various expenses advanced bythe Bank
Net movements (32,880) − 31,469 −
Other liabilities − 11,757 − 6,037
Various expenses and variablefee for credit card transactions
and security deposits paid
Applicable to the Group and the
Parent Bank
Stockholders and related parties
under common ownership
Deposit liabilities:Outstanding balance − 6,286,620 − 6,116,433 With interest rate based on
average daily bank deposit rateNet movements 170,187 − (2,192,934) −Interest expense on deposits 68,676 − 216,652 −
Bills payable:Outstanding balance − 13,897 − 1,077,077 Short term liabilities with
annual fixed rate of 2.80% to
6.75%
Net movements (1,063,180) − (7,516,797) −Interest expense 150,539 − 230,836 −
Income from bancassurance
business:
Commission income 148,338 − 164,507 −
Income recognized on sale ofinsurance policies in
accordance with thebancassurance agreement.

Related Party Transactions - 146 -
*SGVFSM005928*
2020 2019
Related Party CategoryAmount
of Transaction
Outstanding
Balance
Amountof Transaction
OutstandingBalance Terms and Conditions/Nature
Unearned income P=− P=733,333 P=− P=733,333
Unearned income fromExclusive Access Fees arisingfrom the bancassurance
agreement
Loans receivable 11,016 11,016 13,200 13,200Secured borrowings withannual interest rate of 9.0%
Key management personnel 2,213,938 − 1,826,566 −Employee benefits related to
key management personnel.Directors, officers and other
related interests:
Loans 538,888 538,888 483,623 483,623
Employee fringe benefit loanswith annual fixed interest ratefrom 0.00% to 6.01% in 2020
and 0.00% to 8.00% in 2019
Accounts receivable 121,730 121,730 116,480 116,480Fringe benefits related toemployee cars and laptop lease.
Bills purchased:Outstanding balance − − − − Short term receivablesNet movements − − (16,196) −
Others 10,514 − 10,514 − Standby LCs
Outstanding receivables from and payables to related parties, if any, arising from lease ofproperties, management services and advances are unsecured, noninterest-bearing and generallysettled in cash within 12 months or upon demand.
The Parent Bank and its subsidiaries’ retirement plans have transactions directly and indirectlywith the Parent Bank as of December 31, 2020 and 2019 as follows:
2020 2019
Amount
of Transaction
Outstanding
Balance
Amountof Transaction
OutstandingBalance
Investment in Parent Bank shares P=31,985 P=186,210 (P=50,019) P=154,225Investments in Parent Bank notes payable:
Outstanding balance − 444,099 − 199,000Net movements 245,099 − 95,100 −Interest income 37,007 − 6,415 −Accrued interest income − 3,987 − 1,515
Deposit liabilities:Outstanding balance − 353,597 − 342,410Net movements 11,188 − (156,193) −Interest income on deposits 13,676 − 10,159 −
Dividend income 9,064 − 4,921 −
Lease of PropertiesIn February 2014, the Parent Bank entered into a lease agreement with UIC, whereby the latter,as a lessee, leases one of the Parent Bank’s investment properties for a period of five years. InOctober 2019, the lease agreement was amended to lessen the location of UIC’s leased premisesupon the renewal of the lease agreement. UIC pays the Parent Bank a monthly rent of P=109 with5% annual escalation rate, exclusive of VAT.
CSB leases certain investment properties with the Parent Bank with lease term covering fiveyears. CSB pays the Parent Bank a fixed monthly rent for its leases with 5% annual escalationrate. In May 2020, CSB renewed one of its lease agreements for another five years.
In June 2019, the Parent Bank entered into a lease agreement with UBX for a period of fiveyears. UBX pays the Parent Bank a fixed monthly rent with 5% annual escalation rate.

Related Party Transactions - 147 -
*SGVFSM005928*
Management ServicesThe Parent Bank entered into a sales management agreement with FUDC whereby the latter sellsUnionBank Visa Credit Cards through its direct selling network. In July 2019, the agreementwas amended to pay a fixed monthly service fee of P=5.6 million plus fixed commission perapproved principal credit card (net of applicable taxes and service charges).
In September 2020, the terms of the service agreement were amended to expand the scope ofwork and services to be provided by FUDC. This also amended the terms to set a fixed monthlyservice fee of P=1.1 million, variable fees per sales officer and fixed commission per approvedcard (net of all applicable taxes).
The Parent Bank paid a fixed monthly service fee of P=4,123 until June 2019 and in 2018 (net ofapplicable taxes and service charges) plus fixed commission per approved principal card.
Deposit Liabilities and Interest ExpenseThe deposit accounts of subsidiaries and stockholders with the Parent Bank generally earninterest based on daily bank deposit rates.
AdvancesThe Parent Bank also has advances to CSB, FUDC, FUIFAI and UBX as of December 31, 2020and 2019. These are generally settled in cash upon demand.
Bills Payable and Interest ExpenseIn 2017, CSB availed of a loan with Aboitiz Foundation, Inc., a related party, amounting toP=74,000 which is payable in five years and bears an annual interest rate of 4.5%. Thisborrowing had an outstanding balance of P=73,953 (net of unamortized debt issue costs) as ofDecember 31, 2019. This was paid in full in 2020. In 2020, CSB availed of a loan with AboitizFoundation, Inc., amounting to P=14,000 which is payable in five years and bears an annualinterest rate of 4.0%. This borrowing had an outstanding balance of P=13,895 (net of unamortizeddebt issue costs) as of December 31, 2020.
In 2019, CSB availed of short-term borrowings from Aboitiz Power Corporation, related partyunder common ownership, amounting to P=1,003,124. This was subsequently paid in thefollowing month.
In 2020, CSB availed of short-term borrowings from AEVI, Aboitiz Power Corporation andAboitiz and Co., Inc., related parties under common ownership, amounting to P=5,727,803,P=13,441,672 and P=12,261,539, respectively. Payments during the year amounted to P=26,212,610.
Bancassurance AgreementOn January 27, 2017, the Parent Bank and its subsidiary, CSB, entered into a bancassurancepartnership (the Agreement) with Insular Life Assurance Company, Ltd. (Insular Life). Underthe Agreement, Insular Life paid the Parent Bank an amount representing Exclusive Access Fee(EAF) with a term of 15 years. In the event that the cumulative annualized premium earned(APE) sold during the first five year period is less than the agreed minimum amount, the ParentBank shall refund the proportion of EAF that equals the proportion by which the cumulative APEis less the minimum amount. EAF recognized for 2018 is presented as Income frombancassurance business under Miscellaneous Income account in the statements of income.Unearned income arising from this transaction is presented as part of Miscellaneous under Otherliabilities account in the statements of financial position (see Note 24).

Related Party Transactions - 148 -
*SGVFSM005928*
Under the distribution agreement, Insular Life will have exclusive access to the branch networkof the Parent Bank and CSB. Additionally, the Parent Bank’s sales force, composed ofrelationship managers and financial advisors, shall be trained and licensed to sell life insuranceproducts. Under the same Agreement, the Parent Bank shall earn commissions on all insurancepolicies sold by the Parent Bank. Commissions earned for the years ended December 31, 2020and 2019 are presented as part of Others under Service charges, fees and commissions account inthe statements of income (see Note 27).
Key Management Personnel CompensationThe compensation of key management personnel for the Group and Parent Bank follows:
Group
2020 2019 2018
Short-term benefits P=2,097,510 P=1,729,322 P=1,673,823Post-employment benefits 103,265 70,011 115,052Other long-term benefits 13,163 27,233 72,152
P=2,213,938 P=1,826,566 P=1,861,027
Parent Bank
2020 2019 2018
Short-term benefits P=1,783,964 P=1,466,293 P=1,486,828Post-employment benefits 87,882 58,879 103,092Other long-term benefits 7,786 21,306 72,140
P=1,879,632 P=1,546,478 P=1,662,060
Directors’ fees incurred by the Group amounted to P=91,830, P=80,948 and P=75,800 in 2020, 2019and 2018, respectively, and by the Parent Bank amounted to P=80,010, P=69,274 and P=66,672 in2020, 2019 and 2018, respectively, and are included as part of Salaries and employee benefitsaccount in the statements of income.
Loans and Other TransactionsIn the ordinary course of business, the Group has loans, deposits and other transactions with itsrelated parties and with certain DOSRI. Under the Group’s existing policies, these transactionsare made substantially on the same terms and conditions as transactions with other individualsand businesses of comparable risks. The amount of individual loans to DOSRI, of which 70%must be secured, should not exceed the amount of the deposit and book value of their investmentin the Group. In the aggregate, loans to DOSRI generally should not exceed the total equity or15% of the total loan portfolio of the Group, whichever is lower.
The following additional information is presented relative to DOSRI loans:
Group Parent Bank
2020 2019 2020 2019
Total DOSRI loans* P=549,904 P=496,823 P=430,097 P=411,452Unsecured DOSRI loans* 201,038 150,080 106,837 79,275% of DOSRI loans to total loan portfolio 0.17% 0.14% 0.16% 0.14%% of unsecured DOSRI loans
to total DOSRI loans* –% –% –% –%% of past due DOSRI loans
to total DOSRI loans –% –% –% –%% of non-accruing DOSRI accounts to total
DOSRI loans –% –% –% –%
*Total DOSRI loans and Unsecured DOSRI loans include fringe benefits that are excluded in determining the compliance with the
individual ceiling under subsection X330.1 of the MORB.
On January 31, 2007, BSP issued Circular No. 560 which provides the rules and regulations thatgovern loans, other credit accommodations and guarantees granted to subsidiaries and affiliates

Related Party Transactions - 149 -
*SGVFSM005928*
of banks and quasi-banks. Under the said circular, the total outstanding exposures to each of theParent Bank’s subsidiaries and affiliates shall not exceed 10% of bank’s net worth, the unsecuredportion of which shall not exceed 5% of such net worth. Further, the total outstanding exposuresto subsidiaries and affiliates shall not exceed 20% of the net worth of the lending bank.
Transactions with the Retirement PlanThe retirement fund of the Group covered under defined benefit post-employment planmaintained for qualified employees is administered by the Retirement Committee. The membersof the Retirement Committee are Senior Executives and officers of the Parent Bank as approvedby the Chairman/Chief Executive Officer. Through its Retirement Committee, it has appointedTISG as the trustee for the retirement fund which is covered by trust agreements.
The composition of the retirement plan assets of the Parent Bank and its subsidiaries as ofDecember 31, 2020 and 2019 are the following:
Group Parent Bank
2020 2019 2020 2019
Investments in:Equity securities P=1,885,839 P=1,562,515 P=1,552,295 P=1,333,468Debt securities 1,601,002 1,353,098 1,446,223 1,223,666
Bank deposits 446,015 535,718 429,185 391,269Others 17,847 121,208 16,510 64,269
P=3,950,703 P=3,572,539 P=3,444,213 P=3,012,672
As of December 31, 2020 and 2019, the carrying value of the fund is equivalent to its fair value.
The retirement fund of the Group includes investments in shares of stock and notes payable ofthe Parent Bank amounting to P=186,210 and P=444,099, respectively, as of December 31, 2020and P=154,225 and P=199,000, respectively, as of December 31, 2019. The investment in ParentBank shares are primarily held for re-sale and the Group’s retirement fund does not intend toexercise its voting rights over those shares. The terms of the investment in notes payable arediscussed in Note 23.
The combined retirement fund of the Group and the retirement funds of the Parent Bank havedeposits with the Parent Bank amounting to P=353,597 and P=337,553, respectively, as ofDecember 31, 2020 and P=342,409 and P=319,473, respectively, as of December 31, 2019.
The related dividend income and interest income amounted to P=9,064 and P=37,007, respectively,in 2020, P=4,921 and P=16,574, respectively, in 2019, and P=110 and P=18,608, respectively, in 2018.
Group Health Insurance from a Related PartyThe Parent Bank entered into a contract with Insular Life for its group health insurance. Thegroup health insurance package covering October 2019 to December 2020 amounted toP=123,190 and the group health insurance package covering October 2018 to September 2019amounted to P=110,650.
Receivable from Kingswood ProjectUIC acts as the project and fund manager of Kingswood Project. As fund manager, UIC isresponsible for the treasury and money management as well as arranging the necessary facilitiesand accounting for the development of the project. UIC also receives a certain percentage of thesales price related to Kingswood Project as sales commission and to compensate for themarketing expenses incurred. As of December 31, 2020 and December 31, 2019, the receivableof UIC from Kingswood Project amounted to P=31.45 million and P=34.79 million, respectively.

Earnings Per Share and
Commitments and Contingent Liabilities - 150 -
*SGVFSM005928*
33. Earnings Per Share
In 2020, 2019 and 2018, the Group and the Parent Bank have no outstanding potentially dilutivesecurities, hence, basic earnings per share are equal to diluted earnings per share. The basic anddiluted earnings per share were computed as follows:
Group
2020 2019 2018
Net profit attributable to ParentBank’s stockholders P=11,553,430 P=14,026,128 P=6,875,587
Divided by the weighted averagenumber of outstandingcommon shares (thousands) 1,218,400 1,217,605 1,098,045
Basic and diluted earningsper share P=9.48 P=11.52 P=6.26
Parent Bank
2020 2019 2018
Net profit P=11,263,423 P=14,026,120 P=6,784,670Divided by the weighted average
number of outstandingcommon shares (thousands) 1,218,400 1,217,605 1,098,045
Basic and diluted earningsper share P=9.24 P=11.52 P=6.18
34. Commitments and Contingent Liabilities
LeasesGroup as LesseeThe Parent Bank leases various branch premises for an average period of seven years. The leasecontracts are cancellable upon mutual agreement of the parties or renewable at the Parent Bank’soption under certain terms and conditions. Various lease contracts include escalation clauses,most of which bear an annual rent increase of 5%. Some leases include a clause to enableadjustment of the rental charge on an annual basis based on prevailing market rates. As ofDecember 31, 2020 and 2019, the Parent Bank has neither a contingent rent payable nor an assetrestoration obligation in relation with these lease agreements.
Shown below is the maturity analysis of the undiscounted lease payments as of December 31,2020 and 2019 as required by PFRS 16:
Group Parent Bank
2020 2019 2020 2019
1 year or less P=515,081 P=489,440 P=413,646 438,554more than 1 years to 2 years 385,692 360,514 320,727 332,086more than 2 years to 3 years 270,194 251,408 238,370 237,076more than 3 years to 4 years 136,626 153,517 126,699 150,381more than 5 years 54,139 44,460 30,461 44,291

Commitments and Contingent Liabilities - 151 -
*SGVFSM005928*
The following are the amounts recognized in profit or loss for the years ended December 31,2020 and 2019:
Group Parent Bank
2020 2019 2020 2019
Amortization expense of ROU assets(Note 16) P=521,521 P=504,841 P=438,311 P=403,550
Interest expense on lease liabilities 71,592 99,471 67,705 74,717Expenses relating to short term – leases 231,821 260,012 133,720 139,243
Total amount recognized in profit or loss P=824,934 P=864,324 P=639,736 P=617,510
Rentals charged against current operations included as part of Occupancy account in thestatements of income amounted to P=664,291 and P=525,146 in 2018 for the Group and ParentBank, respectively.
Group as LessorThe Group has entered into commercial property leases on the Group’s surplus offices. Thesenon-cancellable leases have remaining non-cancellable lease terms of one to four years.
Total rent income earned included under Miscellaneous income account in the statements ofincome (see Note 28) by the Group and the Parent Bank for the years ended December 31, 2020,2019 and 2018 are as follows:
2020 2019 2018
Group P=154,077 P=163,730 P=160,713Parent Bank 164,177 165,523 156,276
The estimated minimum future annual rentals receivable under non-cancellable operating leasesfollows:
Group
2020 2019
Within one year P=97,880 P=171,122Beyond one year but within five years 145,439 272,084Beyond five years – 77,977
P=243,319 P=521,183
Parent Bank
2020 2019
Within one year P=92,196 P=152,687Beyond one year but within five years 134,932 313,277
P=227,128 P=465,964
OthersIn the normal course of the Group’s operations, there are various outstanding commitments andcontingent liabilities such as guarantees, commitments to extend credit, which are not reflected inthe accompanying financial statements. The Group recognizes in its books any losses andliabilities incurred in the course of its operations as soon as these become determinable andquantifiable. Management believes that, as of December 31, 2020, no additional material lossesor liabilities are required to be recognized in the accompanying financial statements as a result ofthe above commitments and transactions.
There are several suits, assessments or notices and claims that remain unsettled. Managementbelieves, based on the opinion of its legal counsels, that the ultimate outcome of such suits,assessments and claims will not have a material effect on the Group’s and the Parent Bank’sfinancial position and results of operations.

Notes to the Statements of Cash Flows - 152 -
*SGVFSM005928*
35. Notes to the Statements of Cash Flows
Presented below is the supplemental information on the Group’s and the Parent Bank’s liabilitiesarising from financing activities:
Group
LTNCD Bills Payable
Notes and Bonds
Payable
Lease
Liabilities Total
Balances at January 1, 2020 P=3,000,000 P=105,087,722 P=49,331,506 P=1,337,296 P=158,756,524
Cash flows from financing activities:
Additions − 558,732,399 33,135,900 392,602 592,260,901
Repayment of borrowings − (609,512,421) (21,171,857) (613,498) (631,297,776)
Effect of business combination − − − 22,933 22,933
Non-cash financing activities: Effects of foreign exchange rate
changes − (84,157) (1,360,890) − (1,445,047)
Amortization of debt issue costsand accretion of interest − − (81,003) 80,251 (752)
Balances as of December 31, 2020 P=3,000,000 P=54,223,543 P=59,853,656 P=1,219,584 P=118,296,783
Group
LTNCD Bills Payable
Notes and Bonds
Payable
Lease
Liabilities Total
Balances at January 1, 2019 P=6,000,000 P=90,964,473 P=44,522,066 P=− P=141,486,539Cash flows from financing activities:
Additions − 2,305,932,334 9,199,139 524,954 2,315,656,427Repayment of borrowings (3,000,000) (2,291,736,846) (3,426,766) (534,042) (2,298,697,654)
Non-cash financing activities:
Adoption of PFRS 16 − − − 1,246,913 1,246,913 Effects of foreign exchange rate
changes − (72,239) (981,678) − (1,053,917)
Amortization of debt issue costsand accretion of interest − − 18,745 99,471 118,216
Balances as of December 31, 2019 P=3,000,000 P=105,087,722 P=49,331,506 P=1,337,296 P=158,756,524
Parent Bank
LTNCD Bills Payable
Notes and Bonds
Payable
Lease
Liabilities Total
Balances at January 1, 2020 P=3,000,000 P=92,149,256 P=49,182,061 P=1,064,941 P=145,396,258
Cash flows from financing activities:Additions − 507,779,097 30,206,900 348,608 538,334,605
Repayment of borrowings − (565,341,774) (18,200,000) (477,197) (584,018,971)
Non-cash financing activities: Effects of foreign exchange rate
changes − (84,157) (1,360,890) − (1,445,047)
Amortization of debt issue costsand accretion of interest − − (81,215) 67,705 (13,510)
Balances as of December 31, 2020 P=3,000,000 P=34,502,422 P=59,746,856 P=1,004,057 P=98,253,335
Parent Bank
LTNCD Bills Payable
Notes and Bonds
Payable
Lease
Liabilities Total
Balances at January 1, 2019 P=6,000,000 P=64,723,631 P=44,335,260 P=− P=115,058,891Cash flows from financing activities:
Additions − 2,263,433,630 5,800,000 418,540 2,269,652,170Repayment of borrowings (3,000,000) (2,235,935,766) − (426,711) (2,239,362,477)
Non-cash financing activities:
Adoption of PFRS 16 − − − 998,394 998,394 Effects of foreign exchange rate
changes − (72,239) (972,500) − (1,044,739)
Amortization of debt issue costsand accretion of interest − − 19,301 74,718 94,019
Balances as of December 31, 2019 P=3,000,000 P=92,149,256 P=49,182,061 P=1,064,941 P=145,396,258

Notes to the Statements of Cash Flows and
Events After the End of the Reporting Period - 153 -
*SGVFSM005928*
Non-cash investing activities of the Group for the period ended December 31, 2020 and 2019include additions to investment properties in settlement of loans and receivables amounting toP=201,247 million and P=231.90 million, respectively, and disposals of properties with carryingvalues of P=167.73 million and P=54.76 million, respectively, through sales contract receivables.
36. Events After the End of the Reporting Period
Dividend DeclarationOn January 29, 2021, the Parent Bank’s BOD approved the declaration of cash dividends atP=3.50 per share or a total of P=4,267,770 based on the outstanding common stock of 1,219,363shares as of January 29, 2021. Record date for stockholders entitled to the cash dividend isFebruary 15, 2021 and payment is expected to be made on March 4, 2021.
Employee Stock PlanOn January 29, 2021, the Parent Bank issued 891,351 common shares to qualified employeesunder the Parent Bank’s Employee Stock Plan.
Establishment of Sustainable Finance FrameworkSubsequent to December 31, 2020, the Parent Bank has established its Sustainable FinanceFramework (SFF). The SFF reinforces the Parent Bank’s commitment to sustainabledevelopment, focusing on People, Planet and Purpose, while managing risks and opportunities ofa changing world. Said framework is one of the key requirements of BSP Circular 1085mandating Philippine banks to set up a sustainable finance program that will further enable theenvironmental, social, and governance (ESG) mechanisms of banks.
Sustainalytics, a leading independent global provider of ESG research and ratings completed areview of the SFF and issued a second party opinion indicating that the Parent Bank's SFF isaligned with relevant global sustainability principles and standards referenced therein.
Citigroup served as Structuring Advisor to the Parent Bank for the SFF.
Approval by the Securities and Exchange Commission of the Amendments to By-LawsOn February 16, 2021, the Securities and Exchange Commission has approved the Parent Bank’sapplication for the amendment of Articles II, IV and V of its By-Laws. Part of the amendmentsis date of the Annual Meeting of the Parent Bank which will be moved to an earlier date (fromfourth Friday of the month of May to fourth Friday of the month of April).
Subsequent Sales of Investments at amortized costSubsequent to December 31, 2020, the Parent Bank sold securities in its FCDU portfolioclassified as investment securities at amortized cost with carrying amount of P=26.83 billionwhich resulted in a gain of P=5.94 billion. The sales were made to shorten the duration of financialassets and further reduce interest rate risk of the Parent Bank as a necessary response to thecurrent and expected changes in market conditions brought about by continuing impact of theCOVID-19 pandemic, which the Parent Bank assessed to have significant impact on itsoperations.

Supplementary Information Required Under BSP Circular 1074 - 154 -
*SGVFSM005928*
37. Supplementary Information Required Under BSP Circular 1074
Presented below is the supplementary information required by the BSP under BSP Circular 1074.
Basic quantitative indicators of financial performance
Group 2020 2019 2018
Return on average capital funds:
Net profit11.5% 15.3% 8.8%
Average total capital funds*
Return on average resources:
Net profit 1.5% 1.9% 1.1%
Average total resources*
Net interest margin:
Net interest income 4.7% 3.6% 3.7%
Average interest-earning resources*
Liquidity ratio:
Current Assets 56.3% 56.4% 42.5%
Current Liabilities
Debt-to-equity ratio:
Liabilities 6.4:1 6.9:1 6.7:1
Equity
Asset-to-equity ratio:
Asset 7.4:1 7.9:1 7.7:1
Equity
Interest rate coverage ratio:
Earnings before interestsand taxes 2.2:1 1.9:1 1.7:1
Interest expense*Average amount is calculated based on current year-end and previous year-end balances

Supplementary Information Required Under BSP Circular 1074 - 155 -
*SGVFSM005928*
Parent Bank 2020 2019 2018
Return on average capital funds:
Net profit 11.1% 15.3% 8.7%
Average total capital funds*
Return on average resources:
Net profit 1.6% 2.2% 1.2%
Average total resources*
Net interest margin:
Net interest income 4.0% 3.1% 3.0%
Average interest-earning resources*
Liquidity ratio:
Current Assets 55.4% 53.9% 41.9%
Current Liabilities
Debt-to-equity ratio:
Liabilities 5.6:1 6.2:1 5.9:1
Equity
Asset-to-equity ratio:
Asset 6.6:1 7.2:1 6.9:1
Equity
Interest rate coverage ratio:
Earnings before interestsand taxes 2.5:1 2.1:1 1.8:1
Interest expense*Average amount is calculated based on current year-end and previous year-end balances
Capital instruments issuedThe Parent Bank’s capital instruments consist of the following:
Capital stock
As of December 31, 2020 and 2019, the Parent Bank has outstanding capital stock shown below(peso amounts in thousands):
Shares Amounts
2020 2019 2020 2019
Common – P=10 par valueAuthorized 1,311,422,420 1,311,422,420 P=13,114,224 P=13,114,224Issued and outstanding 1,218,471,467 1,217,609,561 12,184,715 12,176,096
Preferred – P=100 par value, non-voting Authorized 100,000,000 100,000,000 P=10,000,000 P=10,000,000
Issued and outstanding – – – –

Supplementary Information Required Under BSP Circular 1074 - 156 -
*SGVFSM005928*
Unsecured Subordinated Tier 2 Notes Due 2030 Callable in 2025
The Basel III-compliant Unsecured Subordinated Tier 2 Notes were issued by the Parent Bankunder its BSP-approved issuance of ₱20.0 Billion Unsecured Subordinated Notes Qualifying asTier 2 Capital.
Unless the Notes are previously redeemed, the Initial Interest Rate will be reset at the equivalentof the Initial Spread per annum plus the Benchmark as of Reset Date as defined in the Termsand Conditions of the Notes. Subject to certain conditions, the BSP Guidelines, and the Termsand Conditions, the Parent Bank may redeem the Notes in whole and not only in part on theRedemption Option Date at 100% of the face value of the Notes, plus accrued and unpaidinterest as of but excluding the Redemption Option Date.
The Notes have a loss absorption feature which means the Notes are subject to a Non-ViabilityWrite-Down in case of a Non- Viability Trigger Event. A Non-Viability Trigger Event isdeemed to have occurred when the Issuer is considered non-viable as determined by the BSP.
The Tier II Notes constitute a direct, unconditional, fixed, unsecured and subordinatedobligation of the Bank. Claims in respect of the Tier II Notes will rank: (a) junior to the claimsof holders of all deposits and general creditors of the Bank; (b) pari passu with obligations ofthe Bank that are, expressly or by applicable laws, subordinated so as to rank pari passu withclaims in respect of securities constituting “Tier 2” capital of the Bank; and (c) senior to (i) theclaims for payment of any obligation that, expressly or by applicable law, is subordinated to theTier II Notes, (ii) the claims in respect of securities constituting “Tier 1” capital of the Bank,and (iii) the rights and claims of holders of equity shares of the Bank.
Unsecured Subordinated Tier 2 Notes Due 2025 Callable in 2020
The P=7.2 Billion Unsecured Subordinated Tier 2 Notes were issued with a loss absorptionfeature, which means the Notes were subject to a non-viability write-down in case of a non-viability trigger event.
The Notes constitute direct, unconditional, unsecured and subordinated obligations of the ParentBank and shall at all times rank pari passu and without any preference among themselves.
On February 20, 2020, the Parent Bank exercised its Voluntary Redemption Option to earlyredeem the Notes in accordance with its Terms and Conditions.
Concentration of credit exposuresAn analysis of concentrations of credit risk for loans and other receivables and investmentsecurities (grossed up for any allowance for credit losses and unearned discounts) of the Groupand the Parent Bank by industry and by geographic location as of December 31, 2020 and 2019 isshown below (amounts in thousands):
Group
2020
Loans and Other Receivables
Trading and
Investment
Amount % Securities Total
Concentration by industry
Real estate activities P=73,062,424 20.72 P=7,554,184 P=80,616,608
Financial and insurance activities 58,326,035 16.54 320,993,329 379,319,364
Information and communication 38,844,291 11.02 – 38,844,291
(Forward)

Supplementary Information Required Under BSP Circular 1074 - 157 -
*SGVFSM005928*
Group
2020
Loans and Other Receivables
Trading and
Investment
Amount % Securities Total
Wholesale and retail trade, repair ofmotor vehicles P=26,265,571 7.45 P=– P=26,265,571
Electricity, gas steam and air conditioning supply 18,299,725 5.19 28,535,139 46,834,864
Manufacturing 11,720,242 3.32 – 11,720,242
Accommodation and food service activities 1,663,091 0.47 – 1,663,091
Transportation and storage 11,891,455 3.37 745,580 12,637,035
Activities of households as employers andundifferentiated goods and services
2,950,691 0.84 – 2,950,691
Construction 10,158,902 2.88 – 10,158,902
Other service activities 7,986,955 2.27 – 7,986,955
Agriculture, forestry and fishing 2,553,855 0.72 – 2,553,855
Professional, scientific and technical activities 538,980 0.15 – 538,980
Arts, entertainment and recreation 12,730,967 3.61 – 12,730,967
Others 75,590,735 21.44 4,653,837 80,244,572
P=352,583,919 100.00 P=362,482,069 P=715,065,988
Concentration by location
Philippines P=351,318,265 99.67 P=217,694,681 P=569,012,946
Others - Asia 703,182 0.20 51,574,765 52,277,947
South America 213,281 0.07 13,900,473 14,113,754
North America 275,925 0.05 7,890,150 8,166,075
United States 43,041 0.01 67,977,986 68,021,027
Europe 30,225 – 3,444,014 3,474,239
P=352,583,919 100.00 P=362,482,069 P=715,065,988
Group
2019
Loans and Other ReceivablesTrading andInvestment
Amount % Securities Total
Concentration by industry
Real estate activities P=69,744,416 17.34 P=606,797 P=70,351,213Financial and insurance activities 46,768,436 11.63 136,551,897 183,320,333Information and communication 44,788,932 11.14 – 44,788,932Wholesale and retail trade, repair of
motor vehicles 27,242,887 6.77 136 27,243,023Electricity, gas steam and air conditioning supply 21,198,130 5.27 31,866,652 53,064,782Manufacturing 22,211,189 5.52 952 22,212,141Accommodation and food service activities 1,294,820 0.32 – 1,294,820Transportation and storage 16,232,252 4.04 – 16,232,252Activities of households as employers and
undifferentiated goods and services 7,178,219 1.78 – 7,178,219Construction 7,949,876 1.98 – 7,949,876Other service activities 8,894,506 2.21 3,315,190 12,209,696Agriculture, forestry and fishing P=2,881,109 0.72 P=– P=2,881,109Professional, scientific and technical activities 542,800 0.13 – 542,800Arts, entertainment and recreation 13,806,681 3.43 – 13,806,681
Others 111,446,457 27.72 45,370 112,308,672
P=402,180,710 100.00 P=172,386,994 P=575,384,549
Concentration by location
Philippines P=400,855,671 99.66 P=80,042,253 P=481,714,769
Others - Asia 792,011 0.20 64,344,389 65,136,400
South America 301,667 0.08 17,292,235 17,593,902
North America 209,845 0.05 8,151,039 8,360,884
United States 21,516 0.01 2,555,582 2,577,098
Europe – 0.00 1,497 1,497
P=402,180,710 100.00 P=172,386,995 P=575,384,550

Supplementary Information Required Under BSP Circular 1074 - 158 -
*SGVFSM005928*
Parent Bank
2020
Trading and
Loans and Other Receivables Investment
Amount % Securities Total
Concentration by industryReal estate activities P=72,713,675 25.77 P=7,554,184 P=80,267,859
Financial and insurance activities 45,862,261 16.25 293,363,719 339,225,980
Information and communication 38,840,892 13.76 – 38,840,892
Wholesale and retail trade, repair ofmotor vehicles
25,325,189 8.97 – 25,325,189
Electricity, gas steam and air conditioning supply 18,298,033 6.48 28,535,139 46,833,172
Manufacturing 11,601,427 4.11 – 11,601,427
Accommodation and food service activities 1,527,243 0.54 – 1,527,243
Transportation and storage 11,698,372 4.15 745,580 12,443,952
Activities of households as employers andundifferentiated goods and services
2,871,791 1.02 – 2,871,791
Construction 10,082,353 3.57 – 10,082,353
Other service activities 7,814,034 2.77 7,814,034
Agriculture, forestry and fishing 1,377,150 0.49 – 1,377,150
Professional, scientific and technical activities 533,400 0.19 – 533,400
Arts, entertainment and recreation 12,729,254 4.51 – 12,729,254
Others 20,901,527 7.41 4,653,837 25,555,364
P=282,176,601 100.00 P=334,852,459 P=617,029,060
Concentration by location
Philippines P=280,910,947 99.55 P=190,065,071 P=470,976,018
Others - Asia 703,182 0.25 51,574,765 52,277,947
South America 213,281 0.08 13,900,473 14,113,754
North America 275,925 0.10 7,890,150 8,166,075
United States 43,041 0.02 67,977,986 68,021,027
Europe 30,225 0.01 3,444,014 3,474,239
P=282,176,601 100.00 P=334,852,459 P=617,029,060
Parent Bank
2019
Trading andLoans and Other Receivables Investment
Amount % Securities Total
Concentration by industry
Real estate activities P=69,736,138 20.60 P=606,797 P=70,342,935Financial and insurance activities 46,271,152 13.67 136,551,897 182,823,049Information and communication 44,788,252 13.23 – 44,788,252Wholesale and retail trade, repair of
motor vehicles 26,658,739 7.87 136 26,658,875Electricity, gas steam and air conditioning supply 21,198,130 6.26 31,866,652 53,064,782Manufacturing 22,209,636 6.56 952 22,210,588Accommodation and food service activities 1,290,537 0.38 – 1,290,537Transportation and storage 15,904,179 4.70 – 15,904,179Activities of households as employers and
undifferentiated goods and services 7,178,219 2.12 – 7,178,219Construction 7,949,656 2.35 – 7,949,656Other service activities 7,766,846 2.29 3,315,190 11,082,036Agriculture, forestry and fishing 1,560,224 0.46 – 1,560,224Professional, scientific and technical activities 542,740 0.16 – 542,740Arts, entertainment and recreation 13,806,628 4.08 – 13,806,628Others 51,711,172 15.27 45,370 52,517,486
P=338,572,248 100.00 P=172,386,994 P=511,720,186
Concentration by location
Philippines P=337,247,209 99.61 P=80,042,253 P=418,050,406Others - Asia 792,011 0.23 64,344,389 65,136,400South America 301,667 0.09 17,292,235 17,593,902North America 209,845 0.06 8,151,039 8,360,884United States 21,516 0.01 2,555,582 2,577,098Europe – 0.00 1,497 1,497
P=338,572,248 100.00 P=172,386,995 P=511,720,187

Supplementary Information Required Under BSP Circular 1074 - 159 -
*SGVFSM005928*
Breakdown of total loans as to security and statusAs to security
The breakdown of total loans and other receivables (net of unearned discounts) as to secured,with corresponding collateral types, and unsecured loans follows (amounts in thousands):
Group Parent Bank
2020 2019 2020 2019
Secured:Real estate P=13,380,387 P=11,082,543 P=11,616,290 P=10,448,441Deposit hold-out 1,189,484 1,088,604 1,124,477 1,038,466Government securities 859,245 6,326,728 – –
Chattel mortgage 507,018 2,245,099 – 1,718,804Others 60,642,661 15,049,503 50,109,596 14,964,752
76,578,795 35,792,477 62,850,363 28,170,463Unsecured 274,475,937 364,654,207 219,192,780 310,264,701
P=351,054,732 P=400,446,684 P=282,043,143 P=338,435,164
The breakdown as to secured and unsecured of non-accruing loans of the Group and the ParentBank as of December 31 follows:
Group Parent Bank
2020 2019 2020 2019
Secured P=9,258,875 P=1,996,246 P=9,060,677 P=1,857,468Unsecured 12,156,932 13,588,717 7,530,274 9,408,526
P=21,415,807 P=15,584,963 P=16,590,951 P=11,265,994
As to statusNon-performing loans (NPLs) of the Group and the Parent Bank as of December 31, 2020 and2019 are presented below, net of the related allowance for credit losses in compliance with BSPCircular 855, respectively (amounts in thousands).
Group Parent Bank
2020 2019 2020 2019
Gross NPLs P=17,042,763 P=11,940,663 P=12,293,189 P=8,494,852Specific allowance for credit losses on NPLs (6,324,528) (5,106,021) (4,726,650) (4,289,056)
P=10,718,235 P=6,834,642 P=7,566,539 P=4,205,796
Under BSP Circular 941, an account or exposure is considered non-performing, even without anymissed contractual payments, when it is deemed impaired under existing applicable accountingstandards, classified as doubtful or loss, in litigation, and/or there is evidence that full repaymentof principal and interest is unlikely without foreclosure of collateral, in the case of securedaccounts. All other accounts, even if not considered impaired, shall be considered non-performing if any contractual principal and/or interest are past due for more than ninety (90)days, or accrued interests for more than 90 days have been capitalized, refinanced, or delayed byagreement.
Microfinance and other small loans with similar credit characteristics shall be considered non-performing after contractual due date or after it has become past due. Restructured loans shall beconsidered non-performing. However, if prior to restructuring, the loans were categorized asperforming, such classification shall be retained.

Supplementary Information Required Under BSP Circular 1074 - 160 -
*SGVFSM005928*
Non-performing loans, investment, receivables, or any financial asset (and/or any replacementloan) shall remain classified as such until (a) there is a sufficient evidence to support that fullcollection of principal and interests is probable and payments of interest and/or principal arereceived for at least six (6) months; or (b) written-off.
Related party loansAs of December 31, 2020 and 2019, the Group’s and the Parent Bank’s related party loans solelyconsist of DOSRI loans, as shown below (peso amounts in thousands):
Group Parent Bank
2020 2019 2020 2019
Total DOSRI loans P=549,904 P=496,823 P=430,097 P=411,452Unsecured DOSRI loans 201,038 150,080 106,837 79,275% of DOSRI loans to total loan
portfolio 0.17% 0.14% 0.16% 0.14%% of unsecured DOSRI loans
to total DOSRI loans –% –% –% –%% of past due DOSRI loans
to total DOSRI loans –% –% –% –%% of non-accruing DOSRI accounts
to total DOSRI loans –% –% –% –%
Secured liability and assets pledged as securityThe Group’s and the Parent Bank’s bills payable under repurchase agreements amounted toP=24.32 billion.
The following are the carrying values of the investment securities and loans and discountspledged against bills payable under repurchase agreement of the Group and the Parent Bank(amounts in thousands):
2020 2019
Investment securities at amortized cost P=28,822,698 P=71,704,809Loans and discounts – 15,000,000
P=28,822,698 P=86,704,809
Commitments and contingenciesFollowing is a summary of the Parent Bank’s commitments and contingent accounts (amounts inthousands):
Group Parent Bank
2020 2019 2020 2019
Trust department accounts P=74,469,549 P=54,320,418 P=74,469,549 P=54,320,418Commitments 59,653,709 65,117,500 59,624,188 65,117,500Forward exchange bought 30,396,594 40,131,599 30,396,594 40,131,599Forward exchange sold 19,533,966 22,704,773 19,533,966 22,704,773Inward bills for collections 25,694,563 21,400,791 25,694,563 21,400,791Other derivatives 7,799,215 5,630,555 7,799,215 5,630,555Unused commercial letters of credit 6,724,426 4,736,371 6,724,426 4,736,371Spot exchange bought 3,135,021 1,941,913 3,135,021 1,941,913Spot exchange sold 2,095,779 5,896,275 2,095,779 2,896,275Outstanding guarantees issued 405,927 456,234 405,927 493,824Other commitment and contingent accounts 72,127 146,748 16,236 122,260

Supplementary Information Required Under Revenue Regulations 15-2010 - 161 -
*SGVFSM005928*
38. Supplementary Information Required Under Revenue Regulations 15-2010
Presented below is the supplementary information required by the Bureau of Internal Revenue(BIR) under RR 15-2010 to be disclosed as part of the notes to financial statements. Thissupplementary information is not a required disclosure under PFRS.
Gross Receipts TaxIn lieu of the value-added tax (VAT), the Parent Bank is subject to the GRT imposed on all banksand non-bank financial intermediaries pursuant to Section 121 of the Tax Code.
The Parent Bank reported total GRT amounting to P=1,540,307 in 2020 as shown under Taxes andLicenses account. Total GRT payable as of December 31, 2020 amounted to P=371,508 and isincluded as part of Accrued taxes and other expenses under Other liabilities account in the 2020statement of financial position.
Documentary Stamp TaxThe Bank is enrolled under the Electronic DST System. In general, the Parent Bank’s DSTtransactions arise from the execution of debt instruments, security documents, and bills ofexchange.
For the year ended December 31, 2020, DST affixed amounted to P=1,864,419 .
Withholding TaxesThe details of total withholding taxes for the year ended December 31, 2020 are shown below:
Final P=1,091,116Expanded 190,792
Compensation and benefits 901,138
P=2,183,046
Taxes and LicensesThe details of taxes and licenses in 2020 of the Parent Bank are as follows:
GRT P=1,540,307DST 972,895Real property tax 30,854Fringe benefit tax (FBT) 34,165Local and business permits 40,172Miscellaneous 13,465Less:
FBT charged to employee benefits 34,165
P=2,597,693
Excise TaxesThe Parent Bank does not have excise taxes accrued since it did not have any transactions subjectto excise tax.

Supplementary Information Required Under Revenue Regulations 15-2010 - 162 -
*SGVFSM005928*
Claim for RefundOn August 5, 2013, the CTA granted the Bank's claim for refund amounting to P=90,923 arisingfrom the BIR's denial of the Bank's applications for administrative abatement in 2007. The CTAen banc affirmed this decision in 2014.
In July 2018, the Supreme Court affirmed the CTA decision granting the Bank’s claim forrefund. The BIR's Motion for Reconsideration of the Supreme Court’s Resolution was denied onSeptember 4, 2019.
In September 2020, the CTA granted the Bank's Motion for Issuance of Writ of Execution. TheBank is now processing the claim for refund with the BIR.
Other Required Tax InformationThe Parent Bank has not paid or accrued any excise taxes or customs’ duties and tariff fees as ithad no importation for the year ended December 31, 2020.
The Parent Bank has no pending tax assessment and case in courts or other regulatory bodiesoutside of the BIR as at and for the year ended December 31, 2020.
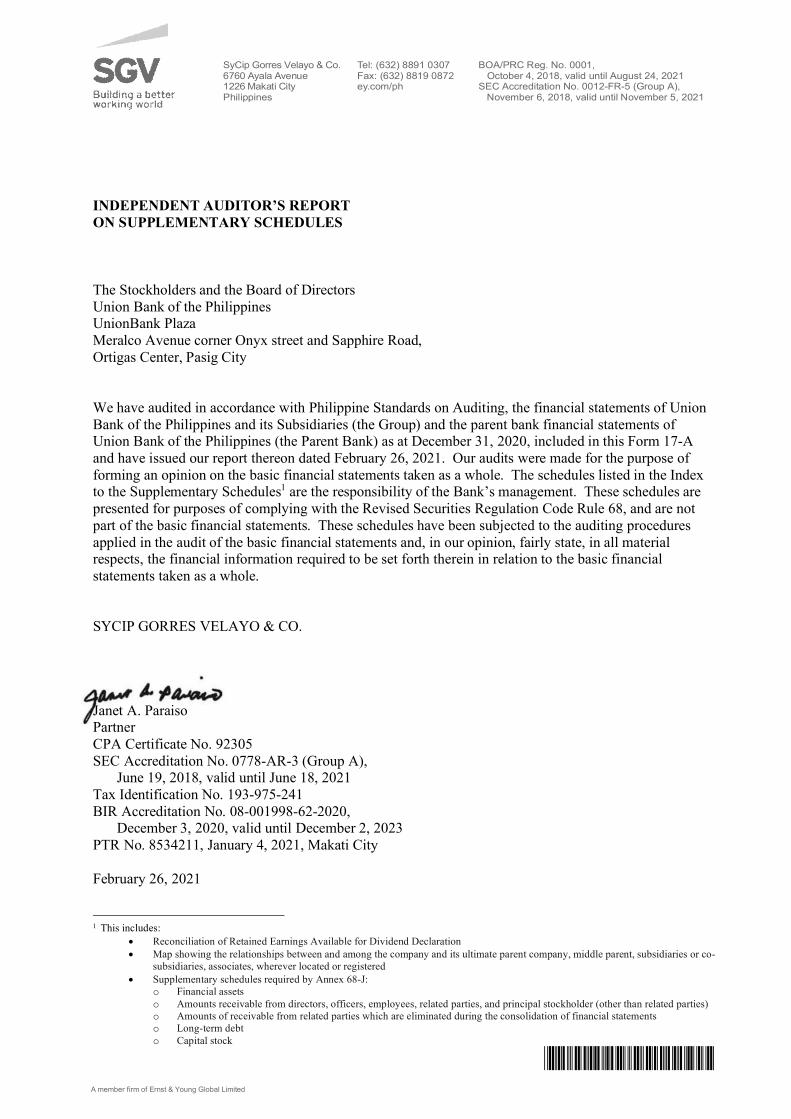
*SGVFSM005928*
INDEPENDENT AUDITOR’S REPORT
ON SUPPLEMENTARY SCHEDULES
The Stockholders and the Board of Directors
Union Bank of the PhilippinesUnionBank Plaza
Meralco Avenue corner Onyx street and Sapphire Road,
Ortigas Center, Pasig City
We have audited in accordance with Philippine Standards on Auditing, the financial statements of Union
Bank of the Philippines and its Subsidiaries (the Group) and the parent bank financial statements ofUnion Bank of the Philippines (the Parent Bank) as at December 31, 2020, included in this Form 17-A
and have issued our report thereon dated February 26, 2021. Our audits were made for the purpose of
forming an opinion on the basic financial statements taken as a whole. The schedules listed in the Indexto the Supplementary Schedules1 are the responsibility of the Bank’s management. These schedules are
presented for purposes of complying with the Revised Securities Regulation Code Rule 68, and are not
part of the basic financial statements. These schedules have been subjected to the auditing procedures
applied in the audit of the basic financial statements and, in our opinion, fairly state, in all materialrespects, the financial information required to be set forth therein in relation to the basic financial
statements taken as a whole.
SYCIP GORRES VELAYO & CO.
Janet A. ParaisoPartner
CPA Certificate No. 92305
SEC Accreditation No. 0778-AR-3 (Group A), June 19, 2018, valid until June 18, 2021
Tax Identification No. 193-975-241
BIR Accreditation No. 08-001998-62-2020, December 3, 2020, valid until December 2, 2023
PTR No. 8534211, January 4, 2021, Makati City
February 26, 2021
1 This includes:
Reconciliation of Retained Earnings Available for Dividend Declaration
Map showing the relationships between and among the company and its ultimate parent company, middle parent, subsidiaries or co-
subsidiaries, associates, wherever located or registered
Supplementary schedules required by Annex 68-J:
o Financial assets
o Amounts receivable from directors, officers, employees, related parties, and principal stockholder (other than related parties)
o Amounts of receivable from related parties which are eliminated during the consolidation of financial statements
o Long-term debt
o Capital stock
SyCip Gorres Velayo & Co.6760 Ayala Avenue1226 Makati CityPhilippines
Tel: (632) 8891 0307Fax: (632) 8819 0872ey.com/ph
BOA/PRC Reg. No. 0001, October 4, 2018, valid until August 24, 2021SEC Accreditation No. 0012-FR-5 (Group A),
November 6, 2018, valid until November 5, 2021
A member firm of Ernst & Young Global Limited

*SGVFSM005928*
INDEPENDENT AUDITOR’S REPORT ON
COMPONENTS OF FINANCIAL SOUNDNESS INDICATORS
The Stockholders and the Board of Directors
Union Bank of the PhilippinesUnionBank Plaza
Meralco Avenue corner Onyx street and Sapphire Road,
Ortigas Center, Pasig City
We have audited in accordance with Philippine Standards on Auditing, the consolidated financial
statements of Union Bank of the Philippines and its Subsidiaries (the Group) and the parent bankfinancial statements of Union Bank of the Philippines (the Parent Bank) as at December 31, 2020 and
2019 for each of the years in the period ended December 31, 2020 and have issued our report thereon
dated February 26, 2021. Our audits were made for the purpose of forming an opinion on the basicfinancial statements taken as a whole. The Supplementary Schedule on Financial Soundness Indicators,
including their definitions, formulas, calculation, and their appropriateness or usefulness to the intended
users, are the responsibility of the Group’s management. These financial soundness indicators are not
measures of operating performance defined by Philippine Financial Reporting Standards (PFRS) and maynot be comparable to similarly titled measures presented by other companies. This schedule is presented
for the purpose of complying with the Revised Securities Regulation Code Rule 68 issued by the
Securities and Exchange Commission and is not a required part of the basic financial statements preparedin accordance with PFRS. The components of these financial soundness indicators have been traced to
the Group’s consolidated financial statements as at December 31, 2020 and 2019 and for each of the three
years in the period ended December 31, 2020 and no material exceptions were noted.
SYCIP GORRES VELAYO & CO.
Janet A. Paraiso
Partner
CPA Certificate No. 92305SEC Accreditation No. 0778-AR-3 (Group A),
June 19, 2018, valid until June 18, 2021
Tax Identification No. 193-975-241
BIR Accreditation No. 08-001998-62-2020, December 3, 2020, valid until December 2, 2023
PTR No. 8534211, January 4, 2021, Makati City
February 26, 2021
SyCip Gorres Velayo & Co.6760 Ayala Avenue1226 Makati CityPhilippines
Tel: (632) 8891 0307Fax: (632) 8819 0872ey.com/ph
BOA/PRC Reg. No. 0001, October 4, 2018, valid until August 24, 2021SEC Accreditation No. 0012-FR-5 (Group A),
November 6, 2018, valid until November 5, 2021
A member firm of Ernst & Young Global Limited

A. Statement of Management’s Responsibility for Financial Statements
B. List of Supplementary Information
Supplementary Schedules to Financial Statements (Form 17-A, Item 7)
Schedule Page
A Financial Assets 1Financial Assets at Fair Value Through Profit or LossFinancial Assets at Amortized CostFinancial Assets at Fair Value Through Other Comprehensive Income
(Annex 68-J, A)B Amounts Receivable from Directors, Officers, Employees, Related Parties
and Principal Stockholders (Other than Related Parties) 9(Annex 68-J, B)
C Amounts Receivable from Related Parties which are Eliminated during the Consolidation of Financial Statements 10
(Annex 68-J, C) D Long-term Debt 11
(Annex 68-J, D) E Indebtedness to Related Parties (Long-term Loans from Related Companies) *
(Annex 68-J, E) F Guarantees of Securities of Other Issuers *
(Annex 68-J, F) G Capital Stock 12
(Annex 68-J, G)
I Reconciliation of Retained Earnings Available for Dividend Declaration 13(Annex 68-D)
II Map Showing the Relationship Between and Among the Bank and its Related Entities 14
C. Schedule of Financial Soundness Indicators for December 31, 2020 and 2019 (Annex 68-E) 15
D. Schedule for Listed Companies with a Recent Offering of Securities to the Public 16
* These schedules and supplementary information are not included as these are not applicable to Group.
UNION BANK OF THE PHILIPPINES AND SUBSIDIARIESINDEX TO SUPPLEMENTARY SCHEDULES
DECEMBER 31, 2020
Content

Number of Shares or Principal Amount of
Bonds and Notes
Amount Shown in the Statement Financial
Position
Value Based on Market Quotation at Statement
of Condition Date
Income Received and Accrued
FINANCIAL ASSETS AT FAIR VALUE THROUGH PROFIT OR LOSS
Debt Securities
Asia United Bank Corporation 2,800,000 2,878,179 P 2,878,179 P 97,048 P Banco De Oro 14,983,176 15,551,823 15,551,823 2,372,810 Bharat Petroleum Corp. Ltd. 1,526,266,986 1,565,003,642 1,565,003,642 12,604,623 Bureau of Treasury 6,343,770,000 6,470,188,861 6,470,188,861 263,861,713 Energy Development Corporation 7,203,450 7,226,069 7,226,069 172,552 Filinvest Development Corporation 48,023,000 49,583,267 49,583,267 574,455 FPT FINANCE LTD 115,495,315 121,885,553 121,885,553 2,695,342 International Container Terminal Services, Inc. 129,277,916 137,419,954 137,419,954 2,776,155 PT Indonesia Asahan Aluminium (Persero) 415,254,881 450,519,140 450,519,140 4,360,623 JG Summit Holdings 270,705,651 284,107,533 284,107,533 8,661,154 Manila Water Company, Inc. 57,627,600 58,131,265 58,131,265 529,767 Metropolitan Bank and Trust Company 311,641,017 317,534,395 317,534,395 3,801,201 Megaworld Corporation 24,827,891 25,927,022 25,927,022 857,700 Petroleos Mexicanos 360,172,500 357,042,601 357,042,601 1,016,669 Philippine National Bank 187,001,562 197,731,712 197,731,712 2,804,972 Power Finance Corporation Ltd. 144,069,000 150,040,660 150,040,660 1,952,794 Power Sector Asset and Liabilities Management Corp 743,636,155 989,079,042 989,079,042 30,687,048 PT Pertamina(Persero) 1,008,483,000 1,069,516,391 1,069,516,391 2,740,914 Rizal Commercial Banking Corporation 12,966,210 13,518,052 13,518,052 863,631 Republic of Philippines 961,324,414 992,098,999 992,098,999 2,689,641 San Miguel Corp 2,000,000 2,062,901 2,062,901 25,360 Saudi Arabia Sovereign Group 1,296,621,000 1,423,637,993 1,423,637,993 160,735,487 Saudi Arabian Oil Company 288,138,000 292,333,289 292,333,289 666,416 Vista Land and Lifescapes, Inc.(Vista Land) 18,632,924 19,449,605 19,449,605 14,594,495
Total Debt Securities 15,012,467,950 P 15,012,467,950 P 522,142,570 P
December 31, 2020
Union Bank of the Philippines and SubsidiariesSEC Released Amended SRC Rule 68
Annex 68-JSchedule A - Financial Assets
1

Number of Shares or Principal Amount of
Bonds and Notes
Amount Shown in the Statement Financial
Position
Value Based on Market Quotation at Statement
of Condition Date
Income Received and Accrued
December 31, 2020
Union Bank of the Philippines and SubsidiariesSEC Released Amended SRC Rule 68
Annex 68-JSchedule A - Financial Assets
Equity Securities
SMC Series 2C 33,049,760 2,577,881,280 P 2,577,881,280 P 200,671,488 P
Alta Vista Golf & Country Club 1 300,000 P 300,000 P - Cebu Country Club (certified true copy only) 1 7,300,000 7,300,000 - Cebu Country Club 1 7,300,000 7,300,000 - Celebrity (Sports) Plaza, Inc. 1 150,000 150,000 - Club Strata 1 - - - Green Valley Country Club (Baguio) 1 - - - Green Valley Country Club (Pasig) 1 - - - Manila Polo Club 5 115,000,000 115,000,000 - The Metropolitan Club, Inc. - A 10 3,500,000 3,500,000 - The Metropolitan Club, Inc. - B 13 4,940,000 4,940,000 -
138,490,000 P 138,490,000 P -
ABACORE CAPITAL 256,000 163,840 P 163,840 P - ABACORE CAPITAL (ABACUS) 200,000 128,000 128,000 - ANSCOR 31,250 206,250 206,250 - ARANETA PROP( INT. CHROME) A 544 647 647 - ASIA BEST GROUP INTERNATIONAL, INC.. formerly AGP INDUSTRIAL CORP. - A (Halted – Prev. Close 10/24/01) 4 42 42 - BDO - Equitable PCI Inc 72 7,690 7,690 - BENGUET CORP. -A 355 1,101 1,101 - BENGUET CORP. -B 1,702 5,106 5,106 - COSCO Capital formerly ALCORN GOLD RESOURCES – B 99,000 559,350 559,350 - EMPIRE EAST 5,857,808 1,845,210 1,845,210 - GLOBAL ESTATES RESORT (formerly Fil-Estate Land) 760,500 699,660 699,660 - IMPERIAL RESOURCES INC – A 30 50 50 - KEPPEL PHIL. PROPERTIES - A 593 1,992 1,992 - LEISURE & RESORTS WORLD CORP – A 166 319 319 -
PP
PP
PP
2

Number of Shares or Principal Amount of
Bonds and Notes
Amount Shown in the Statement Financial
Position
Value Based on Market Quotation at Statement
of Condition Date
Income Received and Accrued
December 31, 2020
Union Bank of the Philippines and SubsidiariesSEC Released Amended SRC Rule 68
Annex 68-JSchedule A - Financial Assets
MABUHAY HOLDINGS, INC. 170,000 91,800 P 91,800 P - METRO ALLIANCE (formerly Marsman & Company, Inc.) 645,000 1,206,150 1,206,150 - OMICO MINING & INDUSTRIAL CORP. 800 300 300 - PETRON 249,100 993,909 993,909 - PHILIPPINE DEPOSITORY & TRUST CORP. (formely Phil. Central Depository, Inc.) 5,228 862,214 862,214 - PHILODRILL CORP.- B (CLASS A and B are considered the same) 280,554 3,086 3,086 - PLDT 14 19,110 19,110 - PRIME MEDIA HOLDINGS (FIRST E BANK) 939 808 808 - PROJECT QUEST 8,750,000 27,914,161 27,914,161 - REPUBLIC GLASS 733,000 2,235,650 2,235,650 - SHANG PROP (formerly KOUK) 147,142 398,755 398,755 - WELLEX INDS., INC.(REPUBLIC RESOURCES) 333 75 75 -
37,345,273 P 37,345,273 P -
Total Equity Securities 2,753,716,553 P 2,753,716,553 P 200,671,488 P
PP
PP
3

Number of Shares or Principal Amount of
Bonds and Notes
Amount Shown in the Statement Financial
Position
Value Based on Market Quotation at Statement
of Condition Date
Income Received and Accrued
December 31, 2020
Union Bank of the Philippines and SubsidiariesSEC Released Amended SRC Rule 68
Annex 68-JSchedule A - Financial Assets
Derivative Assets
Barclays Bank 15,845 P 15,845 P - BNP Paribas 299,844 299,844 - Bank of New York 111,853 111,853 - Commerzbank AG 155,186 155,186 - Essel Propack Phils. Inc. 17,457 17,457 - Goldman Sachs 55,013 55,013 - Malayan Bank Savings & Mortgage Bank 35,009 35,009 - Standard Chartered Bank 854,325 854,325 - Union Bank of Switzerland 234,767 234,767 - Australia New Zealand Bank 36,543,631 36,543,631 - Banco De Oro 6,673,441 6,673,441 - Bank of the Philippine Islands 3,867,469 3,867,469 - China Banking Corporation 3,584,314 3,584,314 - Chinatrust Commercial Banking 22,078,127 22,078,127 - Deutsche Bank 5,871,150 5,871,150 - Essel Propack Phils. Inc. 410,272 410,272 - General Metal Container Corp. of the Phils. 49,072 49,072 - ING BANK NV 2,885,590 2,885,590 - Metropolitan Bank and Trust Company 8,538,629 8,538,629 - Micro Mechanics Technology International Inc 1,042 1,042 - Monark Equipment Corporation 10,428 10,428 - New York Bay Philippines, Inc 47,922 47,922 - Petron Corporation 1,794,720 1,794,720 - Philippine National Bank 8,413,706 8,413,706 - United Coconut Planters Bank 1,080,000 1,080,000 - UNIOIL Petroleum Philippines Inc 860,277 860,277 - Republic of the Philippines 45,381,735 45,381,735 - INDIVIDUALS 263,750,725 263,750,725 - ING BANK NV 26,282,101 26,282,101 -
P
4

Number of Shares or Principal Amount of
Bonds and Notes
Amount Shown in the Statement Financial
Position
Value Based on Market Quotation at Statement
of Condition Date
Income Received and Accrued
December 31, 2020
Union Bank of the Philippines and SubsidiariesSEC Released Amended SRC Rule 68
Annex 68-JSchedule A - Financial Assets
MayBank Philippines Inc 53,091,905 P 53,091,905 P - MUFG Bank, Ltd. 16,414,497 16,414,497 - Standard Chartered Bank 173,054,226 173,054,226 -
Total Derivative Asssets 682,464,281 682,464,281 -
Total - Financial Assets at Fair Value through Profit or Loss 18,448,648,784 P 18,448,648,784 P 722,814,058 P
FINANCIAL ASSETS AT AMORTIZED COST
Government bonds and other debt securities
Bangko Sentral ng Pilipinas 3,450,662,709 3,450,996,010 P 3,451,175,929 P - Bureau of Treasury 71,924,411,755 70,580,569,132 74,844,096,648 3,524,600,529 Abu Dhabi National Energy Co.(TAQA) 816,391,000 901,340,903 1,037,288,636 43,864,427 Bharat Petroleum Corp. Ltd. 3,481,667,500 3,357,214,665 3,672,293,598 153,742,032 Brazil Sovereign Group 7,011,358,000 7,671,336,559 9,274,390,010 499,089,324 Chile Sovereign Group 672,322,000 685,789,579 815,062,684 26,746,783 China Petrochemical Corporation Group(SINOPEC) 768,368,000 766,080,332 850,954,114 28,261,312 Colombia Sovereign Group 2,545,219,000 2,911,205,105 3,345,047,348 156,773,565 Indian Railway Finance Corp. Ltd. 624,299,000 589,668,676 686,042,171 24,675,441 Indonesian Government 9,537,367,800 10,596,116,704 12,464,235,954 537,967,759 Mexico Sovereign Group 1,536,736,000 1,416,262,565 1,767,014,929 68,228,053 NTPC Limited 2,353,127,000 2,284,428,907 2,605,739,506 107,155,412 Peru Sovereign Group 1,536,736,000 2,300,978,901 2,613,311,772 138,584,367 Perusahaan Perseroan(Persero) PT Perusahaan Listrik Negara 3,928,281,400 4,222,800,624 4,858,643,945 234,417,931 Petroleos Mexicanos 6,544,151,838 6,473,887,249 6,196,031,275 392,904,003 Petroliam Nasional Berhad(Petronas) 624,299,000 641,416,418 721,646,423 24,004,792
P
P
5

Number of Shares or Principal Amount of
Bonds and Notes
Amount Shown in the Statement Financial
Position
Value Based on Market Quotation at Statement
of Condition Date
Income Received and Accrued
December 31, 2020
Union Bank of the Philippines and SubsidiariesSEC Released Amended SRC Rule 68
Annex 68-JSchedule A - Financial Assets
Power Finance Corporation Ltd. 1,728,828,000 1,733,977,799 P 2,091,484,250 P 109,580,639 P PT Indonesia Asahan Aluminium (Persero) 240,115,000 247,729,228 326,738,887 16,721,689 PT Pertamina(Persero) 1,224,586,500 1,405,826,956 1,624,265,601 80,180,955 Qatar Sovereign Group 6,483,105,000 6,854,787,229 8,604,872,073 311,406,991 Saudi Arabia Sovereign Group 11,410,264,800 11,390,377,491 14,804,833,801 594,724,029 Saudi Arabian Oil Company 1,872,897,000 1,885,220,357 2,143,455,701 76,468,874 Sultanate of Oman Sovereign Group 624,299,000 668,827,377 607,392,983 41,822,782 Turkey Sovereign Group 2,737,311,000 2,759,848,700 2,614,593,986 165,249,484 Uruguay Sovereign Group 240,115,000 331,163,242 382,411,951 19,488,427 Republic of the Philippines 2,686,289,348 3,083,982,681 3,343,356,304 218,471,092 Republic of the Philippines 2,000,000,000 2,383,391,034 2,628,980,132 133,281,250 Republic of the Philippines 215,050,000 216,464,956 216,464,956 7,091,922
Total Government bonds and other debt securities 151,811,689,375 168,591,825,568 7,735,503,861
Private bonds and commercial papers
STI Education Services Group, Inc. 45,370,000 45,370,000 P 37,814,552 P 2,892,610 P Vista Land and Lifescapes, Inc.(Vista Land) 2,531,250,000 2,531,250,000 3,171,498,047 164,587,500 JG Summit Holdings 124,859,800 125,089,717 132,201,556 5,629,990 Hindustan Petroleum Corp. Ltd. 1,632,782,000 1,597,269,428 1,733,981,828 67,312,407 SMC BONDS 40,000,000 40,000,000 40,000,000 2,304,520
Total Private bonds and commercial papers 4,338,979,145 5,115,495,983 242,727,026
Less: Allowance for credit losses 339,701,671 )( 0 0
Total - Financial Assets at Amortized Cost 155,810,966,849 P 173,707,321,551 P 7,978,230,887 P
6

Number of Shares or Principal Amount of
Bonds and Notes
Amount Shown in the Statement Financial
Position
Value Based on Market Quotation at Statement
of Condition Date
Income Received and Accrued
December 31, 2020
Union Bank of the Philippines and SubsidiariesSEC Released Amended SRC Rule 68
Annex 68-JSchedule A - Financial Assets
FINANCIAL ASSETS AT FAIR VALUE THROUGH OTHER COMPREHENSIVE INCOME
Government and private bonds and other debt securities
Bureau of Treasury 7,704,040,000 8,018,057,756 P 8,018,057,756 P 384,743,688 P Power Sector Asset and Liabilities Management Corp 1,861,467,526 2,512,865,883 2,512,865,883 26,372,655 PT Pertamina(Persero) 470,433,308 505,080,721 505,080,721 52,197,218 Saudi Arabia Sovereign Group 336,161,000 369,091,332 369,091,332 206,020,509 US Treasury/Sovereign Group 7,683,680,000 7,144,997,005 7,144,997,005 75,787,335 Banco De Oro 240,115,000 245,637,645 245,637,645 5,483,453 Filinvest Development Corporation 2,353,127,000 2,429,580,096 2,429,580,096 25,850,447 FPT FINANCE LTD 1,632,782,000 1,707,661,383 1,707,661,383 21,917,445 International Container Terminal Services, Inc. 144,069,000 155,911,472 155,911,472 1,453,905 JG Summit Holdings 951,383,653 998,210,756 998,210,756 6,381,020 Manila Water Company, Inc. 2,859,385,466 2,884,376,495 2,884,376,495 25,036,348 Megaworld Corporation 2,483,413,399 2,593,354,110 2,593,354,110 16,006,442 Metropolitan Bank and Trust Company 971,025,060 989,358,013 989,358,013 9,199,926 Philippine National Bank 390,763,151 413,185,141 413,185,141 668,007 Republic of the Philippines 50,000,000 51,708,505 51,708,505 1,925,000 AYALA LAND INC 20,000,000 20,478,848 20,478,848 778,300 PETRON 40,000,000 39,909,270 39,909,270 1,705,020 SMIC BONDS 10,000,000 10,389,468 10,389,468 644,875 VISTA LAND BONDS 30,000,000 31,654,281 31,654,281 771,888 APC 10,000,000 10,655,126 10,655,126 1,725,361 SMC BONDS 16,000,000 16,422,149 16,422,149 527,570
Total Government and private bonds and other debt securities 31,148,585,454 31,148,585,454 865,196,410
7

Number of Shares or Principal Amount of
Bonds and Notes
Amount Shown in the Statement Financial
Position
Value Based on Market Quotation at Statement
of Condition Date
Income Received and Accrued
December 31, 2020
Union Bank of the Philippines and SubsidiariesSEC Released Amended SRC Rule 68
Annex 68-JSchedule A - Financial Assets
Equity Securities
BANCNET 50,000 5,000,000 P 5,000,000 P - BAP CONSULTING , INC. 12,500 1,250,000 1,250,000 - BAP-Credit Bureau - 50,000 50,000 - Coop Society Swift - 3,139 3,139 - Cruztelco 90 9,000 9,000 - Eastern Visayas Tel Co. 100 5,000 5,000 - Fixed Income Exchange 125,000 1,250,000 1,250,000 - Local Government Unit Guaranty Corporation 50,000 5,000,000 5,000,000 - Local Government Unit Guaranty Corporation 50,000 5,000,100 5,000,100 - Makati Executive Center 1 31,500 31,500 - Meralco 3,260 32,600 32,600 - Meralco 2,088 20,880 20,880 - Meralco 4,306 43,060 43,060 - Meralco 241 2,410 2,410 - Meralco 12,039 120,390 120,390 - Metropolitan Threater 1 40,000 40,000 - NAWASA - 150 150 - PHIL. CLEARING HOUSE CORP. 21,000 5,000,000 5,000,000 - PHILAM 2 1,000,000 1,000,000 - Philam Properties Corp. - 500,000 500,000 - Philippine Dealing System Holdings Corporation (formerly Philippine Central Depository Incorporated) 31,690 3,169,000 3,169,000 - PILTEL 75 6,000 6,000 - Rockwell Land Corporation 2 700,000 700,000 - Steel Asia - 13,439,870 13,439,870 -
Total Equity Securities 41,673,099 41,673,099 -
Total - Financial Assets at Fair value through OCI 31,190,258,553 P 31,190,258,553 P 865,196,410 P
GRAND TOTAL 205,449,874,186 P 223,346,228,888 P 9,566,241,355 P
P
8

Amounts Collected Amounts Written-off Current Not Current
Union Bank of the Philippines and SubsidiariesSEC Released Amended SRC Rule 68
Annex 68-JSchedule B - Amounts Receivable from Directors, Officers, Employees, Related Parties and Principal Stockholders (Other than Related Parties)
December 31, 2020
RECEIVABLES FROM DIRECTORS, OFFICERS, EMPLOYEES, RELATED PARTIES AND PRINCIPAL STOCKHOLDERS ARE WITHIN THE ORDINARY COURSE OF BUSINESS OF THE BANK
Deductions Ending Balance Balance at End of YearName and Designation of Debtor Balance at Beginning
of Year Additions
9

Amounts Collected Amounts Written-off Current Not Current
UBX Philippines Corporation (Subsidiary) 49,110,026 P 47,757,675 P 80,706,755 - 16,160,946 P - 16,160,946 P First Union Insurance and Financial Agencies, Inc. (Subsidiary) 65,432 644,193 575,413 - 134,212 - 134,212
49,175,458 P 48,401,868 P 81,282,168 P - 16,295,158 P - 16,295,158 P
Balance at End of Year
Union Bank of the Philippines and SubsidiariesSEC Released Amended SRC Rule 68
Annex 68-JSchedule C - Amounts Receivable from Related Parties which are Eliminated during the Consolidation of Financial Statements
December 31, 2020
Name and Designation of Debtor Balance at Beginning of Year Additions
Deductions Ending Balance
P
P P P
10

Title of Issue and Type of Obligation Amount Authorized by IndentureAmount Shown Under Caption"Current Portion of Long-term Debt" in Related
Statement of Financial Position
Amount Shown Under Caption"Long-term Debt" in related Statement of
Financial Condition
USD Senior Medium Term Notes Due 2022 96,046,000,000 P - 23,983,971,354 P USD Senior Medium Term Notes Due 2025 14,311,227,231 Peso Senior Series B Bonds Due 2022 39,000,000,000 - 5,772,252,337 Peso Senior Series C Bonds Due 2023 - 8,055,828,125 Peso Senior Series D Bonds Due 2026 - 878,467,857 Unsecured Subordinated Tier 2 Notes Due 2030 Callable in 2025 20,000,000,000 - 6,745,110,121 Long Term Negotiable Certificate of Deposit 2023 20,000,000,000 - 3,000,000,000 Loans Payable 150,000,000 - 106,798,740
Details:Maturity Date Interest Rate
USD Senior Medium Term Notes Due 2022 November 29, 2022 3.369%USD Senior Medium Term Notes Due 2025 October 22, 2025 2.125%Peso Senior Series B Bonds Due 2022 June 3, 2022 6.000%Peso Senior Series C Bonds Due 2023 December 9, 2023 2.750%Peso Senior Series D Bonds Due 2026 March 9, 2026 3.375%Unsecured Subordinated Tier 2 Notes Due 2030 Callable in 2025 May 24, 2030 5.250%Long Term Negotiable Certificate of Deposit 2023 August 21, 2023 4.375%Loans Payable May 31, 2023 5.750%
Union Bank of the Philippines and SubsidiariesSEC Released Amended SRC Rule 68
Annex 68-JSchedule D - Long-term Debt
December 31, 2020
P
11

Related Parties Directors, Officers and Employees Others
Common Stock 1,311,422,420 1,218,471,467 5,000,000 799,419,802 32,973,938 386,077,727
Preferred Stock 100,000,000 - - - - -
Number of Shares Held byNumber of Shares Reserved for Options, Warrants, Conversion
and Other Rights
Number of Shares Issued and Outstanding as Shown
Under the Related Statement of Condition
Caption
Number of Shares AuthorizedTitle of Issue
Annex 68-JSEC Released Amended SRC Rule 68
Union Bank of the Philippines and Subsidiaries
Schedule G - Capital StockDecember 31, 2020
12

Unappropriated Retained Earnings at Beginning of Year, as Previously Reported 70,201,147 P
Prior Years’ Outstanding Reconciling Items, net of taxAccumulated equity in net profit of subsidiaries 13,562,223 )( Deferred tax assets 5,185,297 )(
Unappropriated Retained Earnings, as Adjusted to Available for Dividend Distribution, Beginning of Year 51,453,627 P
Add: Net Profit Actually Earned/Realized during the Year
Net profit during the period closed to Retained Earnings 11,263,423
Less: Non-actual/unrealized income, net of tax Benefit from deferred tax asset 1,327,179 P Share in net profit of subsidiaries, net of dividends received 953,082 Unrealized fair value gains on financial assets at fair value
through profit or loss 15,505 Unrealized gain on foreclosure of investment properties 52,135
Subtotal 2,347,901 )(
Net Profit Actually Earned/Realized during the Year 8,915,522
Add (Less): Dividend declarations during the period 4,264,650 )( Net Reversal of Appropriation of Retained Earnings during the period 497,443 3,767,207 )(
Total Retained Earnings, End of the Year Available for Dividend Declaration 56,601,942 P
Ortigas Center, Pasig City
Annex 68 -D
Reconciliation of Retained Earnings Available for Dividend DeclarationFor the Year Ended December 31, 2020
(Amounts in Thousands of Philippine Pesos)
UNION BANK OF THE PHILIPPINESUnionBank Plaza, Meralco Avenue corner Onyx Street and Sapphire Road
13

Aboitiz Equity Ventures, Inc.
Union Bank of the Philippines*
UnionBank Currency Brokers
Corporation100%
UBP Securities, Inc.100%
UnionData Corp. 100%
Interventure Capital Corporation
60%
inactive inactive inactive inactive
First Union Plans, Inc.100%
First Union Insurance and
Financial Agencies, Inc. 100%
First Union Direct Corporation
100%
First-Agro Industrial Rural
Bank, Inc. 44.33%
Bangko Kabayan, Inc. 21%
Progressive Bank, Inc. 26%
PetNet, Inc. 11%
First-Agro Industrial Rural
Bank, Inc. 49%
Bangko Kabayan, Inc. 49%
Progressive Bank, Inc. 49%
PetNet, Inc. 40%
Shiptek Solutions Corporation
30%
CC Mobile Financial Services Philippines, Inc.
35%
UBX Remit Pte Ltd. 100%
Shiptek Solutions Pte Ltd. 30%
Pacific Payments Pte Ltd. 25%
* Union Bank of the Philippines (UBP) is effectively 49.31% owned by Aboitiz Equity Ventures, Inc. (AEVI); hence, UBP is an associate of AEVI in accordance with PAS 28, Investments in Associates .
** Required by Securities and Exchange Commssion, Revised Securities Regulation Code Rule 68, as Amended, dated August 19, 2019.
UBX Private Ltd.100%
Map Showing the Relationship Between and Among the Bankand its Related Entities**
December 31, 2020
C O N G L O M E R A T E M A P P I N G
UBP Investments Corporation (formerly Union Properties, Inc.)100%
City Savings Bank, Inc.99.79%
UBX Philippines Corporation 100%
UNION BANK OF THE PHILIPPINES AND SUBSIDIARIESUnionBank Plaza, Meralco Avenue corner Onyx Street and Sapphire Road,
Ortigas Center, Pasig City
14

Ratio Formula Current Year Prior YearCurrent ratio Current Assets/ Current Liabilities 56.3% 56.4%Acid test ratio Current Assets/ Current Liabilities 56.3% 56.4%
Solvency ratiosNet Profit After Tax, Before Non-cash
Expenses/ Liabilities 3.2% 2.6%Debt-to-equity ratio Liabilities/ Equity 6.4:1 6.9:1Asset-to-equity ratio Asset/ Equity 7.4:1 7.9:1
Interest rate coverage ratio Earnings before interests and taxes/
Interest expense 2.2:1 1.9:1
Return on equity Net Profit/ Average Total Capital Funds* 11.5% 15.3%Return on assets Net Profit/ Average Total Resources* 1.5% 1.9%
Net interest marginNet Interest Income/ Average Interest-
earning Resources* 4.7% 3.6%
*Average amount is calculated based on current year-end and previous year-end balances.
Annex 68 -E
SCHEDULE OF FINANCIAL SOUNDNESS INDICATORS
Union Bank of the Philippines and SubsidiariesAs of December 31, 2020
15

1. Gross and net proceeds as disclosed in the final prospectus
Gross proceeds Net proceedsUSD Senior Medium Term Notes Due 2025 14,406,900,000 P 14,391,371,675 P Unsecured Subordinated Tier 2 Notes Due 2030 Callable in 2025 6,800,000,000 6,736,154,224 Peso Senior Series C Bonds Due 2023 8,115,000,000 8,041,693,327 Peso Senior Series D Bonds Due 2026 885,000,000 868,348,919
2. Actual gross and net proceeds
Actual gross proceeds Actual net proceeds
USD Senior Medium Term Notes Due 2025 14,406,900,000 P 14,391,371,675 P Unsecured Subordinated Tier 2 Notes Due 2030 Callable in 2025 6,800,000,000 6,736,154,224 Peso Senior Series C Bonds Due 2023 8,115,000,000 8,041,693,327 Peso Senior Series D Bonds Due 2026 885,000,000 868,348,919
3. Each expenditure item where the proceeds were used
The net proceeds from the issuances shall be used to extend term liabilities, expand funding base, support business expansion plans and for other general corporate purposes. The funds were used to build up liquidity throughDue From Other Banks which increased by Php 40.33 billion between September and December 2020, and to refinance the Bank's P11.0 billion Peso bond maturity last December 2020.
4. Balance of the proceeds as at end of reporting period
Nil
ANNEX 68-I
SCHEDULE FOR LISTED COMPANIES WITH A RECENT OFFERING OF SECURITIES TO THEPUBLIC
Union Bank of the PhilippinesFor the Period Ended December 31, 2020
16


![Thanking you, Yours faithfully, [Naresh Kumar]](https://static.fdokumen.com/doc/165x107/6326bdd4051fac18490de8c7/thanking-you-yours-faithfully-naresh-kumar.jpg)

