Temporal changes in artificial light exposure of marine turtle nesting areas
13
Temporal changes in artificial light exposure of marine turtle nesting areas RUTH L. KAMROWSKI 1 , COL LIMPUS 2 , RHONDDA JONES 3 , SHAROLYN ANDERSON 4 andMARK HAMANN 1 1 School of Earth and Environmental Sciences, James Cook University, Townsville, QLD 4811, Australia, 2 Department of Environment and Heritage Protection, PO Box 2454, Brisbane, QLD 4001, Australia, 3 School of Marine and Tropical Biology, James Cook University, Townsville, QLD 4811, Australia, 4 School of Natural and Built Environments & Barbara Hardy Institute, University of South Australia, Adelaide, SA 5095, Australia Abstract Artificial light at night poses a significant threat to multiple taxa across the globe. In coastal regions, artificial lighting close to marine turtle nesting beaches is disruptive to their breeding success. Prioritizing effective man- agement of light pollution requires an understanding of how the light exposure of nesting areas changes over time in response to changing temporal and spatial distributions of coastal development. We analyzed multitempo- ral, satellite night-light data, in combination with linear mixed model analysis, to determine broadscale changes in artificial light exposure at Australian marine turtle nesting areas between 1993 and 2010. We found seven marine turtle management units (MU), from five species, have experienced significant increases in light exposure over time, with flatback turtles nesting in east Australia experiencing the fastest increases. The remaining 12 MUs showed no significant change in light exposure. Unchanging MUs included those previously identified as having high exposure to light pollution (located in western Australia and southern Queensland), indicating that turtles in these areas have been potentially exposed to high light levels since at least the early nineties. At a finer geo- graphic scale (within-MU), nine MUs contained nesting areas with significant increases in light exposure. These nesting areas predominantly occurred close to heavily industrialized coastal areas, thus emphasizing the impor- tance of rigorous light management in industry. Within all MUs, nesting areas existed where light levels were extremely low and/or had not significantly increased since 1993. With continued coastal development, nesting females may shift to these darker/unchanging ‘buffer’ areas in the future. This is valuable information that informs our understanding of the capacity and resilience of marine turtles faced with coastal development: an understanding that is essential for effective marine turtle conservation. Keywords: artificial light, conservation planning, GIS analysis, marine turtles, population resilience, temporal change Received 12 November 2013 and accepted 7 December 2013 Introduction Artificial lighting characterizes modern human society; however, life on Earth evolved under distinct day/ night cycles (H€ olker et al., 2010a). Light is a principle determinant of organism activity in natural ecosystems (Mills, 2008; Bradshaw & Holzapfel, 2010), and conse- quently, ecological impacts resulting from human use of light at night have received increasing attention in recent years (e.g., Longcore & Rich, 2004; Rich & Long- core, 2006; Gaston et al., 2013; Lyytim€ aki, 2013). Light pollution causes disruption in multiple taxonomic groups (Rich & Longcore, 2006), with nocturnal lights causing changes in critical animal behaviors including orientation, foraging, reproduction, and communica- tion (Longcore & Rich, 2004). As a result, artificial light at night has been identified as a global environmental change (Lyytim€ aki, 2013) significantly threatening bio- diversity (H€ olker et al., 2010b). Numerous studies document the disruptive effects of artificial lighting on marine turtle orientation (e.g., Pendoley, 2000, 2005; Witherington & Martin, 2000; Salmon, 2003; Harewood & Horrocks, 2008). Hatchling turtles locate the ocean using a combination of horizon and brightness cues (Salmon et al., 1992; Limpus & Kamrowski, 2013). The presence of artificial light adja- cent to nesting beaches can mask the turtle’s ability to discriminate horizons and lead to hatchlings travelling in the wrong direction (misorientation), or failing to decide on a direction to travel (disorientation) (Verhei- jen, 1985; Salmon et al., 1995); both of which reduce hatchling survival chances (Salmon, 2006). Artificial lighting also constrains nest site selection by adult females, with nesting density decreasing on beaches exposed to artificial lights (Witherington, Correspondence: Ruth L. Kamrowski, tel. +61 488 535 923, fax +61 748 715 581, e-mail: [email protected] © 2013 John Wiley & Sons Ltd 1 Global Change Biology (2014), doi: 10.1111/gcb.12503
-
Upload
independent -
Category
Documents
-
view
0 -
download
0
Transcript of Temporal changes in artificial light exposure of marine turtle nesting areas

Temporal changes in artificial light exposure of marineturtle nesting areasRUTH L . KAMROWSK I 1 , COL L IMPUS 2 , RHONDDA JONES 3 , SHAROLYN ANDERSON4
and MARK HAMANN1
1School of Earth and Environmental Sciences, James Cook University, Townsville, QLD 4811, Australia, 2Department of
Environment and Heritage Protection, PO Box 2454, Brisbane, QLD 4001, Australia, 3School of Marine and Tropical Biology,
James Cook University, Townsville, QLD 4811, Australia, 4School of Natural and Built Environments & Barbara Hardy Institute,
University of South Australia, Adelaide, SA 5095, Australia
Abstract
Artificial light at night poses a significant threat to multiple taxa across the globe. In coastal regions, artificial
lighting close to marine turtle nesting beaches is disruptive to their breeding success. Prioritizing effective man-
agement of light pollution requires an understanding of how the light exposure of nesting areas changes over
time in response to changing temporal and spatial distributions of coastal development. We analyzed multitempo-
ral, satellite night-light data, in combination with linear mixed model analysis, to determine broadscale changes in
artificial light exposure at Australian marine turtle nesting areas between 1993 and 2010. We found seven marine
turtle management units (MU), from five species, have experienced significant increases in light exposure over
time, with flatback turtles nesting in east Australia experiencing the fastest increases. The remaining 12 MUs
showed no significant change in light exposure. Unchanging MUs included those previously identified as having
high exposure to light pollution (located in western Australia and southern Queensland), indicating that turtles in
these areas have been potentially exposed to high light levels since at least the early nineties. At a finer geo-
graphic scale (within-MU), nine MUs contained nesting areas with significant increases in light exposure. These
nesting areas predominantly occurred close to heavily industrialized coastal areas, thus emphasizing the impor-
tance of rigorous light management in industry. Within all MUs, nesting areas existed where light levels were
extremely low and/or had not significantly increased since 1993. With continued coastal development, nesting
females may shift to these darker/unchanging ‘buffer’ areas in the future. This is valuable information that
informs our understanding of the capacity and resilience of marine turtles faced with coastal development: an
understanding that is essential for effective marine turtle conservation.
Keywords: artificial light, conservation planning, GIS analysis, marine turtles, population resilience, temporal change
Received 12 November 2013 and accepted 7 December 2013
Introduction
Artificial lighting characterizes modern human society;
however, life on Earth evolved under distinct day/
night cycles (H€olker et al., 2010a). Light is a principle
determinant of organism activity in natural ecosystems
(Mills, 2008; Bradshaw & Holzapfel, 2010), and conse-
quently, ecological impacts resulting from human use
of light at night have received increasing attention in
recent years (e.g., Longcore & Rich, 2004; Rich & Long-
core, 2006; Gaston et al., 2013; Lyytim€aki, 2013). Light
pollution causes disruption in multiple taxonomic
groups (Rich & Longcore, 2006), with nocturnal lights
causing changes in critical animal behaviors including
orientation, foraging, reproduction, and communica-
tion (Longcore & Rich, 2004). As a result, artificial light
at night has been identified as a global environmental
change (Lyytim€aki, 2013) significantly threatening bio-
diversity (H€olker et al., 2010b).
Numerous studies document the disruptive effects of
artificial lighting on marine turtle orientation (e.g.,
Pendoley, 2000, 2005; Witherington & Martin, 2000;
Salmon, 2003; Harewood & Horrocks, 2008). Hatchling
turtles locate the ocean using a combination of horizon
and brightness cues (Salmon et al., 1992; Limpus &
Kamrowski, 2013). The presence of artificial light adja-
cent to nesting beaches can mask the turtle’s ability to
discriminate horizons and lead to hatchlings travelling
in the wrong direction (misorientation), or failing to
decide on a direction to travel (disorientation) (Verhei-
jen, 1985; Salmon et al., 1995); both of which reduce
hatchling survival chances (Salmon, 2006).
Artificial lighting also constrains nest site selection
by adult females, with nesting density decreasing on
beaches exposed to artificial lights (Witherington,Correspondence: Ruth L. Kamrowski, tel. +61 488 535 923,
fax +61 748 715 581, e-mail: [email protected]
© 2013 John Wiley & Sons Ltd 1
Global Change Biology (2014), doi: 10.1111/gcb.12503

1992; Salmon et al., 1995). As coastal development
continues across the globe, there will likely be fewer
suitable beaches dark enough to be attractive to nest-
ing females. This is of serious concern in view of
other major threats to turtle nesting grounds; first,
coastal modifications for industrial, residential, recrea-
tional, and aesthetic (e.g., beach cleaning) purposes
(Defeo et al., 2009) are likely to influence current and
future nesting habitats, and second, a changing cli-
mate is predicted to limit, or require a shift in, turtle
nesting due to increased temperatures, cyclonic activ-
ity, sea-level rise, and altered oceanographic patterns
(Hawkes et al., 2009; Fuentes et al., 2010, 2011; Witt
et al., 2010; Hamann et al., 2011). Moreover, coastal
development and climate change are not mutually
exclusive – the sea-level rise expected to occur as a
result of climate change is likely to provoke an
upsurge in coastal modifications through protective
armouring, which in turn will impact beach erosion
(Defeo et al., 2009). As such, an understanding of
marine turtle exposure to the adverse consequences
of both climate change and coastal development is
essential for effective conservation of marine turtle
populations (Hamann et al., 2010).
As widely distributed and long-lived species, effec-
tive marine turtle conservation measures also depend
on an understanding of when and where threats
occur, at broad, ecologically relevant scales (Wallace
et al., 2010, 2011). Most research into the disruptive
influence of artificial light on turtles has been beach-
or region-specific (e.g., Witherington & Bjorndal,
1991; Peters & Verhoeven, 1994; Bertolotti & Salmon,
2005; Pendoley, 2005; Tuxbury & Salmon, 2005; Lorne
& Salmon, 2007; Harewood & Horrocks, 2008). While
these studies are necessary, two recent studies have
used remote sensing data to quantify marine turtles
nesting distribution relative to artificial light intensity
(Mazor et al., 2013), and the variation in nesting area
exposure to light pollution (Kamrowski et al., 2012),
at broader spatial scales relevant to management. As
conservation resources are often limited (Fuentes
et al., 2009), spatial knowledge of where marine
turtles are likely to be exposed to light pollution is
important for priority setting in management
(Kamrowski et al., 2012).
However, with on-going and changing anthropo-
genic pressures and natural processes, the environ-
ment is in a state of constant evolution (Lyytim€aki
et al., 2012). Studies using nighttime satellite data
have shown that levels of artificial lighting around
the world have increased (sometimes dramatically so)
in many countries over the past two decades (Elvidge
et al., 2011; Pestalozzi et al., 2013). Furthermore,
human population growth and urban expansion have
occurred more rapidly in coastal regions than else-
where (Nicholls, 1995), and this trend is expected to
continue across the globe (Turner et al., 1996), making
coastlines extremely vulnerable to development and
light pollution problems (Bird et al., 2004). Thus,
knowledge of where marine turtles are exposed to arti-
ficial light is not sufficient. An understanding of how
artificial light levels at nesting beaches change over
time is also necessary for investigating the capacity
and resilience of marine turtles in the face of coastal
development.
We examined temporal changes in artificial lighting
at marine turtle nesting areas in Australia, using mul-
titemporal, nighttime light (NTL) satellite data, freely
available from NOAA’s National Geophysical Data
Center (NGDC) (Elvidge et al., 2007), and spanning
the years 1992–2010. We addressed two aims: firstly,
we determined the temporal trend in artificial light
exposure for all marine turtle species that nest in
Australia, at a population management unit (MU)
scale, to identify the turtle MUs within Australia with
the greatest exposure to increasing light over time.
Secondly, as marine turtles do not necessarily show
absolute fidelity to individual nesting beaches, instead
generally choosing to nest on beaches occurring
within a particular region (Miller et al., 2003; Deth-
mers et al., 2006; Pfaller et al., 2009), each MU was
examined at a finer scale to determine which nesting
areas for each MU had the highest, and fastest chang-
ing exposure to artificial light, as well as those areas
least exposed to artificial light. This information is
useful because increases in coastal development may
lead to nesting females shifting to these darker ‘buf-
fer’ areas in the future. As such, our methods and
findings will permit more focused management and
conservation actions aimed at protecting marine tur-
tles around the world.
Materials and methods
Study area and species
Five species of marine turtle (loggerhead Caretta caretta, green
Chelonia mydas, hawksbill Eretmochelys imbricata, olive ridley
Lepidochelys olivacea, and flatback Natator depressus) nest in
abundance on Australia’s tropical and/or subtropical beaches.
Comprehensive genetic and demographic analyses in this
region have led to well-defined, geographically delineated
population segments (e.g., Bowen et al., 1992; Broderick et al.,
1994; Dobbs et al., 1999; Limpus et al., 2000; Dethmers et al.,
2006; Conant et al., 2009; Jensen et al., 2013). In this paper, we
follow the terminology of Dethmers et al. (2006) referring to
each population segment as a ‘management unit,’ and we fol-
low the MU groupings as described by Limpus (2009)
(Table 1). Nesting data for each species and MU were
© 2013 John Wiley & Sons Ltd, Global Change Biology, doi: 10.1111/gcb.12503
2 R. L. KAMROWSKI et al.

obtained from the Queensland Turtle Conservation Project
database in September 2012.
Nighttime light data
The version 4 time series of global Stable Lights was obtained
from the NGDC (collected as part of the US Air Force Defense
Meteorological Satellite Program (DMSP) Operational Line-
scan System (OLS), Baugh et al. (2010); downloaded from:
http://ngdc.noaa.gov/eog/download.html in September
2012). These data consist of large, grid-based GeoTIFF images
of the Earth’s surface at night, created annually from between
20 and 100 cloud-free observations, and showing the relative
OLS visible band intensities of lit regions across the globe
(Baugh et al., 2010). The image data have a spatial resolution
of 30 arc seconds, giving a grid-cell size of approximately one
square kilometre at the equator (Elvidge et al., 2011). The data
have 6-bit quantization (Sutton et al., 1997), and the amount of
light recorded in each pixel is given a digital number (DN)
value between 0 and 63 (with 63 being the maximum amount
of recorded light). The OLS is sensitive to wavelengths of light
between 440 and 940 nm, and the typical nighttime satellite
pass occurred between 20:30 and 21:30 hours local time
(Elvidge et al., 2001). As both adult and hatchling turtles
respond to wavelengths between 440 and 700 nm (Withering-
ton & Bjorndal, 1991; Levenson et al., 2004; Horch et al., 2008;
Fritsches, 2012), and both oviposition and hatchling emer-
gence occur throughout the night (with hatchling emergence
peaking between 20:00 and midnight) (Limpus, 1985; Gyuris,
1993), these datasets are valuable for assessing marine turtle
exposure to artificial light (see Kamrowski et al., 2012).
Data preparation
Spatial data preparation. The global NTL datasets (1992–
2010) were clipped to the Australia region using ESRI ArcGIS
10, transformed into the relevant Australian coordinate sys-
tem (GCS_GDA_1994), and then, the Australia NTL and the
turtle nesting datasets were subsequently clipped and pro-
jected into the correct coordinate system (GDA_1994_MGA_-
Zone_49 to 56).
Turtle nesting areas were grouped according to MU for
Aim 1 (see Limpus, 2009) (Fig. 1, solid and hatched circled
areas). For Aim 2, nesting areas within MUs were grouped
together either geographically or according to the importance
of the area to the MU overall (Tables 2–6; Fig. 1, black dots
and arrows). Marine turtles have temperature-dependent sex
determination (Yntema & Mrosovsky, 1980; Miller & Limpus,
1981), and thus, the sex ratio of produced hatchlings is
strongly influenced by sand albedo (Hays et al., 2001). In
Australia, mainland beaches are often characterized by dar-
ker sand than island beaches, and thus, mainland beaches
tend to be warmer and female-producing (Limpus, 1985) and
island beaches tend to be cooler and male-producing (Polo-
czanska et al., 2009). As marine turtle population viability
depends upon recruitment of both sexes into the adult breed-
ing population, which in turn is dependent upon the thermal
environment existing at nesting areas within each MU, nest-
ing area importance was based on the sex ratio of produced
hatchlings, as well as the number of annual nesting females
(Heppell et al., 2003). We primarily followed the within-MU
nesting area groupings described in Limpus (2009) (see
Tables 2–6).
Table 1 Change in artificial light exposure for marine turtle management units in Australia between 1993 and 2010. Management
units where light levels changed significantly during this period are shown in bold
Species Management unit (MU)
Slope (light change
over time) SE Significant change
Loggerhead Western Australia 0.095 0.03 Yes (t16 = 3.18, P < 0.01)
East Australia 0.588 0.304 No (P = 0.071)
Green Northwest Shelf �0.272 0.3 No (P = 0.37)
Scott Reef 0 – No change
Ashmore Reef 0 – No change
Gulf of Carpentaria 0.033 0.016 No (P = 0.06)
Northern GBR 0.102 0.05 Yes (t16 = 2.14, P < 0.05)
Coral Sea 0 – No change
Southern GBR 0.26 0.17 No (P = 0.15)
Hawksbill Western Australia �0.017 0.1 No (P = 0.87)
Northern Territory and Gulf of
Carpentaria
0.045 0.027 No (P = 0.12)
Torres Strait and northern GBR 0.064 0.017 Yes (t16 = 3.78, P < 0.01)
Olive Ridley Northern Territory 0.007 0.002 Yes (t16 = 3.29, P < 0.01)
Northern Queensland 0.02 0.0071 Yes (t16 = 2.74, P < 0.05)
Flatback Northwest shelf 0.026 0.41 No (P = 0.95)
Cape Dommett 0 – No change
Western Northern Territory 0.0025 (from 2005 on) 0.002 No (P = 0.24)
Gulf of Carpentaria 0.14 0.033 Yes (t16 = 4.14, P < 0.001)
East Australia 1.52 0.63 Yes (t16 = 2.4, P < 0.05)
© 2013 John Wiley & Sons Ltd, Global Change Biology, doi: 10.1111/gcb.12503
MARINE TURTLES AND CHANGING LIGHT LEVELS 3

Intercalibration of NTL imagery. The stable lights data
were collected by six different satellites over 19 years. The
OLS does not have an on-board calibration system (Elvidge
et al., 2011), and sensor degradation occurs over time. Thus,
direct comparisons of light levels collected by different sen-
sors and in different years are unreliable (Pestalozzi et al.,
2013). However, as data from two satellites are available in
most years, an intercalibration procedure to reduce these
yearly variations and sensor differences has been
documented (Elvidge et al., 2009, 2011). This second-order
regression model using coefficients provided by Christopher
Elvidge at NOAA (C. Elvidge, personal communication)
was applied.
Although the intercalibration procedure substantially
reduces interyear variability, it does not completely remove
it. This variability is largely due to spatial uncertainty and
‘overglow’ (Small & Elvidge, 2011). We did not examine tem-
poral changes in the spatial extent of light but instead
reduced light values for each nesting area to one value (mean)
within a buffer area, and thus, we consider the intercalibrated
dataset suitable for describing broadscale changes in light lev-
els at nesting areas over time. As a further measure to reduce
(a) (b)
(c)
(e)
(d)
Fig. 1 Species maps showing significant nighttime light change over the study period. Nesting areas grouped by management unit
(MU) are circled [a significant light change at the MU scale is shown by a solid line, no change by a dashed line (Aim 1)]. Finer-scale
significant light changes at grouped nesting areas (Aim 2) are shown within each MU circle (the up-arrows signify a significant increase
in light, down-arrows signify a significant decrease in light, the black dots indicate no change). NB: These maps show light change only,
NOT amount of light at each location. The locations of turtle nesting areas are approximate for display purposes. For comparisons,
amount of light and actual locations refer to Tables 2–6. (a) Loggerhead, (b) Green, (c) Hawksbill, (d) Olive ridley, (e) Flatback.
© 2013 John Wiley & Sons Ltd, Global Change Biology, doi: 10.1111/gcb.12503
4 R. L. KAMROWSKI et al.

variability, we also consulted with experts at NOAA to deter-
mine the optimum satellite data to use, after intercalibration,
for each year of our analysis (Table S1).
Light proximity to nest location. Nesting locations were
overlaid onto each year’s NTL data, and a buffer of radius
25 km drawn around each (Aubrecht et al., 2008; Kamrowski
et al., 2012). This buffer region contained approximately 2400
pixels, each with a DN value consistent with the amount of
artificial light existing in that area. For Aim 1, we calculated
the mean annual DN value occurring in each buffer zone
using Geospatial Modelling Environment (Version 0.7.2.0)
(Beyer, 2012). We then summed the mean annual values for
each nesting area (i.e., each of the buffer areas) within an MU
to examine and compare trends in artificial light between
MUs (Aim 1). For Aim 2, as we wanted to compare both trend
in artificial light levels over time and differences in the levels
of light existing between nesting-area groupings within each
MU, we calculated the mean DN and standard deviation of
each nesting area’s buffer zone, then calculated weighted
means, pooled variances and separate standard errors for each
nesting-area grouping (Miloslav et al., 2012) to allow compari-
sons.
Estimation of rates of change in nighttime lights
For each MU, we used the slope of the linear regression of
average light level against year, as a measure of the rate of
increase in average light level for that MU over the study per-
iod (Aim 1). However, slope estimation was complicated by
the existence of significant autocorrelation between successive
years in most MUs, and by the fact that 1992 was an outlier in
all locations. We therefore omitted the 1992 data from the
analyses and used a restricted maximum likelihood algorithm
available in the lme package for SPlus 8.2 to fit the regression.
This allowed incorporation of autocorrelation effects (AR(1))
in the model. With the inclusion of autocorrelation, residuals
were homogeneous and normally distributed.
To examine differences in NTL trends between nesting area
groupings within each MU (Aim 2), we re-analyzed the whole
dataset using nesting-area location as an additional fixed effect.
This allowed comparisons of both slope (rate of change) and
intercept (amount of light at the start of the study period) to be
made. There appeared to be some heterogeneity of variance
between nesting area locations, so the model was fitted with
and without allowing for heterogeneity of variance between
locations, with the optimum model (based on the Akaike
Information Criteria; Ngo & Brand, 1997) selected for use.
Results
Management unit scale light change over time (Aim 1)
Artificial light levels increased significantly over the
study period in at least one MU for each species of tur-
tle (Table 1 in bold, Fig. 1 solid circled areas). Namely,
loggerhead turtles in Western Australia (WA), green
turtles in the northern Great Barrier Reef (GBR), hawks-
bill turtles in the Torres Strait and northern GBR, all
olive ridley turtles, and flatback turtles in east Australia
and the Gulf of Carpentaria.
No light was recorded at green turtle Ashmore Reef
or Coral Sea MU nesting areas, or for flatback turtles
Table 2 Change in artificial light exposure for loggerhead turtle nesting areas in Australia between 1993 and 2010. Nesting area
groupings where light levels changed significantly during this period are shown in bold (*increase). Nesting area importance, in
this and subsequent tables, was determined based on both the number of nesting females and the sex ratio of produced hatchlings
Management
unit (MU)
Nesting area
grouping
Importance
for MU
Light change
equation
SE: Slope
(intercept)
Significant
slope Relative amount of light
Western
Australia
Dirk Hartog Island Major NA: no light
Ashmore Reefs Minor NA: no light
Mainland (inc.
Ningaloo and
Gnaraloo)
Moderate 0.13 + 0.004x 0.003 (0.04) No (P = 0.12) Higher than zero (t16 = 3.45,
P < 0.01)
Dampier
Archipelago
Minor 1.88 + 0.044x 0.02 (0.31) Yes* (t16 = 2.14,
P < 0.05)
Higher than Mainland
(t32 = 11.63, P < 0.001)
East
Australia
Woongarra Coast Major 2.24 + 0.015x 0.02 (3.43) No (P = 0.52) Higher than at Wreck Rock
(t48 = 36.21, P < 0.001)
Capricorn-Bunker
islands
Major NA: no light
Swain Reefs Major NA: no light
Wreck Rock Major 0.02 + 0.005x 0.001 (0.02) Yes* (t16 = 3.92,
P < 0.01)
Not different to zero
(t16 = 1.04, P = 0.31)
Sunshine Coast-
New South Wales
Minor 4.17 + 0.05x 0.01 (0.22) Yes* (t16 = 3.2,
P < 0.01)
Higher than other MU
groupings (t48 = 13.22–36.32,
P < 0.001)
© 2013 John Wiley & Sons Ltd, Global Change Biology, doi: 10.1111/gcb.12503
MARINE TURTLES AND CHANGING LIGHT LEVELS 5

nesting at Cape Dommett, across the entire study per-
iod. For green turtles nesting at Scott Reef, a small
amount of light registered in 2008 but did not appear
again in 2009 or 2010. In addition, no light registered in
the flatback turtle western Northern Territory MU until
2005, and from 2005 onward, the low light levels did
not change significantly. As a result, these five MU’s
were deemed to have low exposure to artificial light
and excluded from further analysis.
Comparisons between slopes of MUs with a signifi-
cant change over time (Table 1 in bold, Fig. 1 solid cir-
cled areas) indicated that the rate of light increase was
significantly higher for flatbacks in eastern Australia
than for any other MU in Australia (t112 = �3.52 to
�3.97, P < 0.001). Olive ridley turtles had the lowest
significant slope values of all the MUs, and further
analysis showed that the light increase was signifi-
cantly slower in the two olive ridley MUs compared to
all other MUs with significantly changing light levels
(Northern Territory: t112 = 2.35–4.55, P < 0.05; Northern
Queensland: t112 = �2.46 to 3.93, P < 0.05). Light
change was significantly slower for Northern Territory
olive ridleys compared with olive ridleys in Northern
Queensland (t112 = �2.46, P < 0.001), making Northern
Territory olive ridleys the MU with the slowest increase
in artificial light over the study period. There was no
significant difference in the rate of light increase
between flatbacks in the Gulf of Carpentaria and WA
loggerheads, northern GBR greens and Torres Strait
and northern GBR hawksbills (t112 = �0.7 to �1.38,
P = 0.17–0.48).
Finer scale light change over time (Aim 2)
NTL changes in nesting area groupings (see arrow
icons Fig. 1), and comparisons between groupings are
given for each species in Tables 2–6. Loggerhead,
hawksbill, and flatback turtles all experienced signifi-
cant NTL increases in nesting area groupings within
multiple MUs (Tables 2, 4, and 6). The fastest increase
in NTL over the study period occurred for Northwest
Shelf flatback turtles that nest along the mainland in
WA (slope: 0.05), closely followed by east Australian
loggerhead nesting along the southeast Queensland
Table 3 Change in artificial light exposure for green turtle nesting areas in Australia between 1993 and 2010. Nesting area group-
ings where light levels changed significantly during this period are shown in bold (*increase)
Management
unit (MU)
Nesting area
grouping
Importance
for MU
Light change
equation
SE: Slope
(intercept)
Significant
slope Relative amount of light
NWShelf Northwest Shelf
Islands
Major 1.96 � 0.057x 0.56 (11.3) No (P = 0.22) Higher than Ningaloo Region
(t32 = �16.87, P < 0.001)
Lacepede Islands Major NA: no light
Ningaloo Region Major 0.144 + 0.005x 0.006 (0.79) No (P = 0.42)
GOC Eastern Groote
Eyland
Moderate 0.008 + 0.0002x 0.0004 (0.006) No (P = 0.6) Higher than Eastern Arnhem
land (t32 = 3.04, P < 0.01).
Not different to zero
(t16 = 1.38, P = 0.19)
Wellesley Islands Moderate NA: no light
Eastern Arnhem
Land
Moderate 0.0009 � 0.00002x 0.0001 (0.002) No (P = 0.83) Not different to zero
(t16 = 0.62, P = 0.54)
nGBR Major rookeries
(Raine Island,
Moulter Cay)
Major NA: no light
Major rookeries
Sandbanks
7 and 8)
Major NA: no light
Minor rookeries Minor 0.23 + 0.002x 0.0008 (0.11) Yes*
(t16 = 2.14,
P < 0.05)
sGBR Capricorn-Bunker
Islands
Major NA: no light
Swain Reefs Major NA: no light
Bushy Island and
Percy is. Group
Moderate NA: no light
Mainland South
of Gladstone
Minor 1.304 + 0.016x 0.014 (2.1) No (P = 0.26) Not different to zero
(t16 = 0.62, P = 0.54)
© 2013 John Wiley & Sons Ltd, Global Change Biology, doi: 10.1111/gcb.12503
6 R. L. KAMROWSKI et al.

coast (Sunshine coast down to northern New South
Wales: slope = 0.046), and Western Australian logger-
head nesting in the Dampier Archipelago (slope =0.044).
However, in every MU, light levels in at least half of
the nesting area groupings were not found to have
increased significantly between 1993 and 2010. Green
turtles were the least exposed species to increasing light
levels over time, with only minor rookeries in the
northern GBR MU showing a significant increase in
light during the study period. Olive ridley turtles were
also found to have a low level of exposure to increasing
light over time; indeed, in the Northern Territory MU,
all nesting sites of major or moderate nesting numbers
registered low levels or no light over the study period.
As exposure to artificial light in this MU appeared
extremely low, no finer-scale analysis was deemed
necessary.
Discussion
Global nighttime light pollution has dramatically
increased in recent years (Cinzano et al., 2001; Narisada
& Schreuder, 2004; Chalkias et al., 2006; Smith, 2008;
H€olker et al., 2010a); yet environmental management of
this threat has lagged behind that of other pollutants
(H€olker et al., 2010a). Knowledge of how artificial light-
ing is changing at marine turtle nesting beaches over
time, at ecologically relevant scales, is vitally important
to determine the resilience and adaptive capacity of
marine turtles faced with coastal development and thus
inform and guide effective management efforts (e.g.,
Fuentes et al., 2013). Here, we used multitemporal satel-
lite data to examine trends in exposure of marine turtle
nesting areas in Australia to artificial light levels, at
broad, ecologically relevant scales.
At a management unit scale, levels of artificial light
increased significantly between 1993 and 2010 in at
least one MU for each species of turtle (Table 1 bold,
Fig. 1 solid circles). The fastest increase in light
occurred for flatbacks in east Australia, an increase
which was significantly faster than for any other MU in
Australia and thus warrants particular conservation
attention from managers, particularly in light of the
proposed industrial development of the Queensland
coast (UNESCO, 2012; Grech et al., 2013). A previous
Table 4 Change in artificial light exposure for hawksbills turtle nesting areas in Australia between 1993 and 2010. Nesting area
groupings where light levels changed significantly during this period are shown in bold (*increase; †decrease)
Management
unit (MU)
Nesting area
grouping
Importance
for MU
Light change
equation
SE: Slope
(intercept)
Significant
slope
Relative amount
of light
Western
Australia
Dampier Archipelago Major 1.41 + 0.035x 0.02 (0.27) No (P = 0.06) Lower than Northwest
Shelf Islands in 1993,
but higher by 2010
(t48 = 2.96, P < 0.01)
Other Northwest
Shelf Islands
Major 1.85 � 0.06x 0.01 (0.16) Yes†
(t16 = �5.24,
P < 0.001)
Higher than Mainland
(t48 = 21.1, P < 0.001)
Mainland Minor 0.181 + 0.005x 0.01 (0.73) No (P = 0.68) Not different to zero
(t16 = 0.25, P = 0.81)
Northern
Territory and
Gulf of
Carpentaria
Outer Islands of
English Company inc.
Truant Island
Moderate NA: no light
Mainland and
Bremer Island
Minor 0.427 + 0.0074x 0.003 (0.04) Yes*
(t16 = 2.76,
P < 0.05)
Higher than Groote
Eyland (t32 = 16.17,
P < 0.001)
Groote Eyland (and
associated Islands)
Major 0.05 � 0.0002x 0.0007 (0.01) No (P = 0.75)
Torres Strait
and northern
GBR
Dayman, Long and
Hawksbury Islands
Major 0.121 + 0.0028x 0.0005 (0.01) Yes*
(t16 = 5.48,
P < 0.001)
Higher than minor
rookeries
(t32 = 11.41,
P < 0.001)
Minor Rookeries (dot
on Fig. 1c indicates the
ca. centre of all rookeries
which span latitude
�9.8667 to �10.7400
Minor 0.027 + 0.0005x 0.0003 (0.005) No (P = 0.11)
© 2013 John Wiley & Sons Ltd, Global Change Biology, doi: 10.1111/gcb.12503
MARINE TURTLES AND CHANGING LIGHT LEVELS 7

study found that light pollution exposure at turtle nest-
ing areas along the northern coast of Australia may be
lower than at higher latitudes on both the west and east
coasts (Kamrowski et al., 2012). In contrast, our findings
suggest that at this broad scale, levels of artificial light
are generally increasing faster at northern nesting areas
(particularly in northern Queensland), and as such pro-
active management strategies should be considered in
these areas to prevent light levels reaching potentially
disruptive levels.
Artificial lighting did not change significantly over
the study period for the majority of marine turtle MUs,
despite the population of Australia growing by at least
1% every year (Heard, 2013). At first glance, this
appears positive, however, Kamrowski et al. (2012)
found that exposure to light pollution was significantly
Table 5 Change in artificial light exposure for olive ridley turtle nesting area in Australia between 1993 and 2010
Management
unit (MU)
Nesting area
grouping
Importance
for MU
Light change
equation
SE: Slope
(intercept)
Significant
slope Relative amount of light
Northern
Territory
NA: All nesting areas of major or moderate nesting numbers registered either very low or no light
Northern
Queensland
Northwestern
Cape York
Major 0.06 + 0.002x 0.001 (0.016) No (P = 0.06) Higher than zero
(t16 = 4.01, P < 0.01)
Table 6 Change in artificial light exposure for flatback turtle nesting areas in Australia between 1993 and 2010. Nesting area
groupings where light levels changed significantly during this period are shown in bold (*increase)
Management
unit (MU)
Nesting area
grouping
Importance
for MU
Light change
equation
SE: Slope
(intercept)
Significant
slope Relative amount of light
Northwest
Shelf
Northwest
Shelf Islands
Major 2.32 � 0.067x 0.05 (18.4) No (P = 0.23)
Mainland Major 0.497 + 0.0501x 0.02 (4.2) Yes*
(t16 = 2.23,
P < 0.05)
Higher than Mainland
areas in 1993, but ca.
same by 2010
(t32 = 8.91, P < 0.001)
Gulf of
Carpentaria
Crab and
Deliverance
Islands
Major 0.002 + 0.00015x 0.0003 (0.0002) No (P = 0.57) Not different to zero
(t16 = 0.49, P = 0.63)
Wellesley
Islands
Moderate NA: no light
East Gulf
of Carpentaria
Major 0.062 + 0.0026x 0.0004 (0.01) Yes*
(t16 = 6.14,
P < 0.001)
Higher than Crab and
Deliverance (t48 = 7.96,
P < 0.001). Higher than
zero (t16 = 6.14,
P < 0.001)
West Gulf
of Carpentaria
Moderate 0.0223 � 0.00002x 0.0003 (0.005) No (P = 0.95) Higher than Crab and
Deliverance (t48 = 5.69,
P < 0.001)
East
Australia
Gladstone region Minor 3.78 + 0.037x 0.02 (0.27) No (P = 0.07) Higher than all other MU
groupings (t64 = �42.9
to �22.7, P < 0.001)
Peak, Wild Duck
and Avoid Islands
Major 0.05 + 0.0018x 0.0007 (0.01) Yes*
(t16 = 2.71,
P < 0.05)
Lower than all other MU
groupings
(t64 = 33.7–36.7,
P < 0.001)
North of
Rockhampton
(inc Townsville
and Mackay)
Minor 1.71 + 0.019x 0.007 (0.11) Yes*
(t16 = 2.59,
P < 0.05)
No difference compared
to areas South of
Gladstone
(t64 = 1.17, P = 0.24)
South of Gladstone
(inc Woongarra)
Minor 1.68 + 0.013x 0.02 (1.78) No (P = 0.46)
© 2013 John Wiley & Sons Ltd, Global Change Biology, doi: 10.1111/gcb.12503
8 R. L. KAMROWSKI et al.

higher at nesting areas in the Northwest Shelf of WA
and southeast Queensland than elsewhere in Australia.
The fact that light levels in these regions have not chan-
ged significantly for most species over time indicates
that these nesting turtles have likely been exposed to
high levels of light pollution since at least 1993, and
although the level of exposure to light pollution has not
increased, neither has it decreased. As long-lived ani-
mals taking decades to reach maturity (Heppell et al.,
2003), potential population-level impacts from sus-
tained exposure to artificial lighting at nesting beaches,
if present, will take several decades to become evident
in the next generation (e.g., Mortimer, 1989). Moreover,
determining the long-term impact of artificial light
exposure for marine turtles in these areas is com-
pounded by the fact that many MUs, particularly in
northern and WA, suffer from incomplete nesting pop-
ulation surveys and/or a lack of long-term census data
(Limpus, 2009) that will make assessing the long-term
temporal impacts of artificial light on nesting popula-
tions difficult.
The lack of change in artificial lighting found in the
present study supports the finding of Elvidge et al.
(2011) that Australia is characterized by ‘stable lighting’
despite population and economic growth. This finding
was attributed to the development of more efficient
lighting and improved lighting design (Narisada &
Schreuder, 2004). However, advances in lighting tech-
nology are also expected to shift artificial lighting to
shorter wavelength lights (e.g., LEDs) (Kyba et al.,
2012). As the OLS sensor is only responsive to wave-
lengths between 440 and 940 nm (Cinzano et al., 2001),
it is possible that light has actually continued to
increase around Australia, but the newer, shorter wave-
length LED lights are not registering in the data. This is
of particular concern with regards to impacts on marine
turtles because hatchling turtles preferentially respond
to shorter-wavelength light from the near ultraviolet
part of the spectrum (Witherington & Bjorndal, 1991;
Pendoley, 2005; Fritsches, 2012). While the advantages
posed by a satellite system capable of collecting multi-
spectral NTL data have been recognized (Elvidge et al.,
2007), the technology is still under development
(Elvidge et al., 2010). To the best of our knowledge, the
NTL data used here are the only large-scale, multitem-
poral, dataset available for this region for the time per-
iod under consideration, and our findings thus provide
a valuable baseline for future comparisons as sensor
technology improves.
Our second aim was to determine trends in levels of
artificial light at a finer geographic scale. Marine turtles
show fidelity to natal regions, but not necessarily spe-
cific beaches (Miller et al., 2003). Thus, nesting popula-
tions may shun beaches deemed too bright for nesting
purposes in favor of other, darker beaches in the same
region. Knowledge of where and how light levels have
changed within an MU is important to allow predic-
tions of where future shifts in nesting may occur. We
determined that the nesting areas with the fastest
changing light over time were those of flatback turtles
along the mainland of the Northwest Shelf (WA), log-
gerhead turtles in the Dampier Archipelago (WA) and
loggerhead turtles on the east coast of Australia from
the Sunshine Coast south to New South Wales.
The mainland coast of the Northwest Shelf (particu-
larly around Karratha and Port Hedland), and the
Dampier Archipelago are both areas which support
heavy industry (Drenth, 2007). Industrial expansion is
also likely to be the cause of the significant increases of
light in the nesting area groupings of more northerly
MUs. Significant light increases occurred for Gulf of
Carpentaria hawksbill turtles at mainland and Bremer
Island nesting areas, and for Gulf of Carpentaria flat-
back turtle major nesting areas. Light increases for
these hawksbills are likely to be a result of light from
mining operations and associated urban development,
located nearby at Nhulunbuy in the Northern Territory,
which is the site of a growing bauxite mine and alu-
mina refinery (Northern Territory Government, 2011).
Similarly, the growth of the mining towns of Weipa
and Napranum in far north Queensland accounted for
much of the light growth for the major flatback nesting
areas.
The significant change in NTL for the North Queens-
land MU of olive ridleys is also due in part to the
growth of Weipa and Napranum. At a finer -scale nest-
ing, this light change was not found to be significant
(Table 5), and low levels of light exist in this area com-
pared with other MUs; however, the very small size of
this olive ridley population (Jensen et al., 2013) indi-
cates that proactive light management strategies may
be warranted at the nesting beaches of this MU.
Within the MU with the fastest changing NTL levels
(flatback turtles in east Australia), the significant
change over time was found to occur at the major rook-
eries (primarily Peak Island) and at other minor rooker-
ies north of Rockhampton. This is of concern because
NTL levels at these nesting areas were found to be sig-
nificantly lower than for nesting beaches in the Glad-
stone region, and although light levels at Gladstone
were not found to have changed significantly between
1993 and 2010, substantial industrial expansion is
planned for this area (Jones et al., 2005; Grech et al.,
2013), including the construction of several liquefied
natural gas plants on Curtis Island, just offshore from
Gladstone. Thus, further increases in artificial light are
likely within this MU and should a shift in nesting
away from the brightly lit Gladstone area occur, the
© 2013 John Wiley & Sons Ltd, Global Change Biology, doi: 10.1111/gcb.12503
MARINE TURTLES AND CHANGING LIGHT LEVELS 9
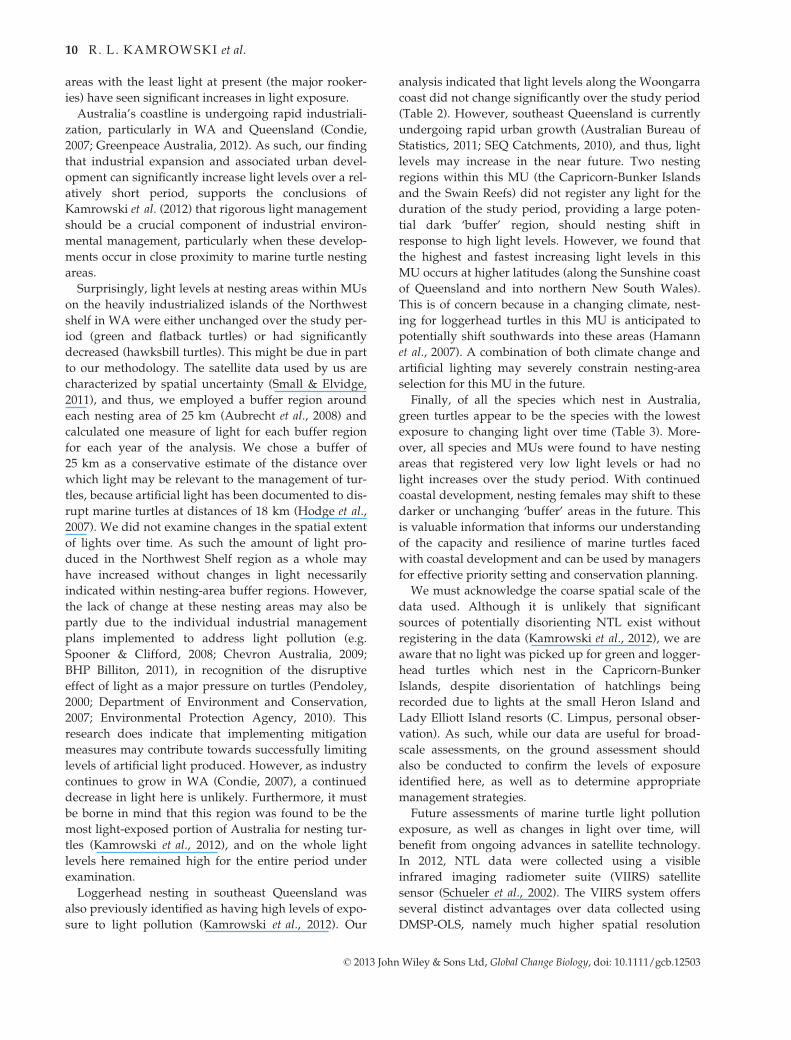
areas with the least light at present (the major rooker-
ies) have seen significant increases in light exposure.
Australia’s coastline is undergoing rapid industriali-
zation, particularly in WA and Queensland (Condie,
2007; Greenpeace Australia, 2012). As such, our finding
that industrial expansion and associated urban devel-
opment can significantly increase light levels over a rel-
atively short period, supports the conclusions of
Kamrowski et al. (2012) that rigorous light management
should be a crucial component of industrial environ-
mental management, particularly when these develop-
ments occur in close proximity to marine turtle nesting
areas.
Surprisingly, light levels at nesting areas within MUs
on the heavily industrialized islands of the Northwest
shelf in WA were either unchanged over the study per-
iod (green and flatback turtles) or had significantly
decreased (hawksbill turtles). This might be due in part
to our methodology. The satellite data used by us are
characterized by spatial uncertainty (Small & Elvidge,
2011), and thus, we employed a buffer region around
each nesting area of 25 km (Aubrecht et al., 2008) and
calculated one measure of light for each buffer region
for each year of the analysis. We chose a buffer of
25 km as a conservative estimate of the distance over
which light may be relevant to the management of tur-
tles, because artificial light has been documented to dis-
rupt marine turtles at distances of 18 km (Hodge et al.,
2007). We did not examine changes in the spatial extent
of lights over time. As such the amount of light pro-
duced in the Northwest Shelf region as a whole may
have increased without changes in light necessarily
indicated within nesting-area buffer regions. However,
the lack of change at these nesting areas may also be
partly due to the individual industrial management
plans implemented to address light pollution (e.g.
Spooner & Clifford, 2008; Chevron Australia, 2009;
BHP Billiton, 2011), in recognition of the disruptive
effect of light as a major pressure on turtles (Pendoley,
2000; Department of Environment and Conservation,
2007; Environmental Protection Agency, 2010). This
research does indicate that implementing mitigation
measures may contribute towards successfully limiting
levels of artificial light produced. However, as industry
continues to grow in WA (Condie, 2007), a continued
decrease in light here is unlikely. Furthermore, it must
be borne in mind that this region was found to be the
most light-exposed portion of Australia for nesting tur-
tles (Kamrowski et al., 2012), and on the whole light
levels here remained high for the entire period under
examination.
Loggerhead nesting in southeast Queensland was
also previously identified as having high levels of expo-
sure to light pollution (Kamrowski et al., 2012). Our
analysis indicated that light levels along the Woongarra
coast did not change significantly over the study period
(Table 2). However, southeast Queensland is currently
undergoing rapid urban growth (Australian Bureau of
Statistics, 2011; SEQ Catchments, 2010), and thus, light
levels may increase in the near future. Two nesting
regions within this MU (the Capricorn-Bunker Islands
and the Swain Reefs) did not register any light for the
duration of the study period, providing a large poten-
tial dark ‘buffer’ region, should nesting shift in
response to high light levels. However, we found that
the highest and fastest increasing light levels in this
MU occurs at higher latitudes (along the Sunshine coast
of Queensland and into northern New South Wales).
This is of concern because in a changing climate, nest-
ing for loggerhead turtles in this MU is anticipated to
potentially shift southwards into these areas (Hamann
et al., 2007). A combination of both climate change and
artificial lighting may severely constrain nesting-area
selection for this MU in the future.
Finally, of all the species which nest in Australia,
green turtles appear to be the species with the lowest
exposure to changing light over time (Table 3). More-
over, all species and MUs were found to have nesting
areas that registered very low light levels or had no
light increases over the study period. With continued
coastal development, nesting females may shift to these
darker or unchanging ‘buffer’ areas in the future. This
is valuable information that informs our understanding
of the capacity and resilience of marine turtles faced
with coastal development and can be used by managers
for effective priority setting and conservation planning.
We must acknowledge the coarse spatial scale of the
data used. Although it is unlikely that significant
sources of potentially disorienting NTL exist without
registering in the data (Kamrowski et al., 2012), we are
aware that no light was picked up for green and logger-
head turtles which nest in the Capricorn-Bunker
Islands, despite disorientation of hatchlings being
recorded due to lights at the small Heron Island and
Lady Elliott Island resorts (C. Limpus, personal obser-
vation). As such, while our data are useful for broad-
scale assessments, on the ground assessment should
also be conducted to confirm the levels of exposure
identified here, as well as to determine appropriate
management strategies.
Future assessments of marine turtle light pollution
exposure, as well as changes in light over time, will
benefit from ongoing advances in satellite technology.
In 2012, NTL data were collected using a visible
infrared imaging radiometer suite (VIIRS) satellite
sensor (Schueler et al., 2002). The VIIRS system offers
several distinct advantages over data collected using
DMSP-OLS, namely much higher spatial resolution
© 2013 John Wiley & Sons Ltd, Global Change Biology, doi: 10.1111/gcb.12503
10 R. L. KAMROWSKI et al.

and a sensitivity to much lower levels of light at
night (Hillger et al., 2013). However, for assessing
how light has already changed at marine turtle nest-
ing areas, we demonstrate that the DMSP-OLS multi-
temporal NTL data are valuable tools for informing
the effective management of marine turtles poten-
tially exposed to the disruptive influence of artificial
lighting.
The biological world is primarily driven by light
(Bradshaw & Holzapfel, 2010), thus the increasingly
widespread use of artificial light at night is considered
a serious and significant global issue (H€olker et al.,
2010a; Lyytim€aki, 2013). Marine turtle survival across
the world is at risk from light pollution (Witherington,
1999), and coastal development close to marine turtle
nesting areas is likely to escalate as the human popula-
tion continues to expand. Knowledge of where turtles
are exposed to artificial lights, as well as how that light-
ing is changing over time, is necessary to enable an
accurate evaluation of both the ecological consequences
of artificial light, and the effectiveness of conservation
responses (e.g., Iovanna & Vance, 2007). Our approach
will be of interest and value to managers worldwide
who are concerned with disruptive impacts of artificial
lighting.
Acknowledgments
We acknowledge the image and data processing of NTL data byNOAA’s National Geophysical Data Center and the DMSP datacollected by the US Air Force Weather Agency. We thank ChrisElvidge for advice regarding intercalibration of the NTL data.This manuscript forms part of RLK’s PhD research at JamesCook University. R. L. K. is supported by the Northcote TrustGraduate Scholarship Scheme. M. H. is supported by the Aus-tralian Government’s NERP program.
References
Aubrecht C, Elvidge CD, Eakin CM (2008) Earth observation based assessment of
anthropogenic stress to coral reefs – a global analysis. In: IGARSS’08: IEEE
International Geoscience and Remote Sensing Symposium, Vol 4, pp. 367–370. IEEE
International, Boston, Massachusetts, USA, http://ieeexplore.ieee.org/xpl/tocre
sult.jsp?isnumber=4779630.
Australian Bureau of Statistics (2011) 3218.0 Queensland regional population growth,
Australia, 2009-2010. Available at: http://www.abs.gov.au/ausstats/[email protected]/
Previousproducts/3218.0Main%20Features62009-10?opendocument&tab-
name=Summary&prodno=3218.0&issue=2009-10&num=&view=#PARALINK34
(accessed 20 April 2013).
Baugh KE, Elvidge C, Ghosh T, Ziskin D (2010) Development of a 2009 stable lights
product using DMSP-OLS data. In: Proceedings of the Asia Pacific Advanced Network
30th Meeting, pp. 114–130. APAN, Hanoi, Vietnam, http://journals.sfu.ca/apan/
index.php/apan/article/view/87/pdf_53.
Bertolotti L, Salmon M (2005) Do embedded roadway lights protect sea turtles? Envi-
ronmental Management, 36, 702–710.
Beyer HL (2012) Geospatial modelling environment (Version 0.7.2.0). (Software).
Available at: http://www.spatialecology.com/gme (accessed 18 October 2012).
BHP Billiton (2011) Marine turtle management plan. Available at: http://www.bhpb
illiton.com/home/aboutus/regulatory/Documents/perAppendixA1MarineTurtle
ManagementPlan.pdf (accessed 2 November 2011).
Bird BL, Branch LC, Miller DL (2004) Effects of coastal lighting on foraging behavior
of beach mice. Conservation Biology, 18, 1435–1439.
Bowen BW, Meylan AB, Ross JP, Limpus CJ, Balazs GH, Avise JC (1992) Global popu-
lation structure and natural history of the green turtle (Chelonia mydas) in terms
of matriarchal phylogeny. Evolution, 46, 865–881.
Bradshaw WE, Holzapfel CM (2010) Light, time, and the physiology of biotic
response to rapid climate change in animals. Annual Review of Physiology, 72, 147–
166.
Broderick D, Moritz C, Miller J, Guinea M, Prince R, Limpus C (1994) Genetic studies
of the hawksbill turtle Eretmochelys imbricata: evidence for multiple stocks in
Australian waters. Pacific Conservation Biology, 1, 123–131.
SEQ Catchments (2010) Summary Report On: Managing What Matters, the Cost of Envi-
ronmental Decline in South East Queensland. SEQ Catchments Ltd, Brisbane, Queens-
land.
Chalkias C, Petrakis M, Psiloglou B, Lianou M (2006) Modelling of light pollution in
suburban areas using remotely sensed imagery and GIS. Journal of Environmental
Management, 79, 57–63.
Chevron Australia (2009) Gorgon Gas Development and Jansz Feed Gas Pipeline Long-term
Marine Turtle Management Plan. Chevron Australia Pty Ltd. Available at: http://
www.chevronaustralia.com/Libraries/Chevron_Documents/Gorgon_Long-term_
Marine_Turtle_Management_Plan.pdf.sflb.ashx (accessed 4 November 2011).
Cinzano P, Falchi F, Elvidge CD (2001) The first World Atlas of the artificial night sky
brightness. Monthly Notices of the Royal Astronomical Society, 328, 689–707.
Conant TA, Dutton PH, Eguchi T, Epperly SP, Fahy CC, Godfrey MH, Seminoff JA
(2009) Loggerhead sea turtle (Caretta caretta) 2009 status review under the US
Endangered Species Act. Report of the Loggerhead Biological Review Team to the
National Marine Fisheries Service, Silver Spring, MD.
Condie S (2007) North West Shelf joint environmental management study final
report. CSIRO and the Western Australian Government. Available at: http://
www.cmar.csiro.au/nwsjems/reports.htm (accessed 10 May 2013).
Defeo O, McLachlan A, Schoeman DS, Schlacher TA, Dugan J, Jones A, Scapini F
(2009) Threats to sandy beach ecosystems: a review. Estuarine Coastal and Shelf Sci-
ence, 81, 1–12.
Department of Environment and Conservation (2007) Management Plan for the Monte-
bello/Barrow Islands Marine Conservation Reserves. 2007-2017. Department of Envi-
ronment and Conservation, Perth, Australia.
Dethmers KEM, Broderick D, Moritz C, Fitzsimmons NN, Limpus CJ, Lavery S, Ken-
nett ROD (2006) The genetic structure of Australasian green turtles (Chelonia
mydas): exploring the geographical scale of genetic exchange. Molecular Ecology,
15, 3931–3946.
Dobbs K, Miller J, Limpus C, Landry A Jr (1999) Hawksbill turtle, Eretmochelys imbri-
cata, nesting at Milman Island, northern Great Barrier Reef, Australia. Chelonian
Conservation and Biology, 3, 344–361.
Drenth M (2007) Petroleum and minerals industries in the northwest marine region:
A report to the Department of the Environment, Water, Heritage and the Arts.
ENV-REP-07-0086 REV 0.
Elvidge CD, Imhoff ML, Baugh KE, Hobson VR, Nelson I, Safran J, Tuttle BT (2001)
Night-time lights of the world: 1994-1995. ISPRS Journal of Photogrammetry and
Remote Sensing, 56, 81–99.
Elvidge CD, Cinzano P, Pettit DR, Arvesen J, Sutton P, Small C, Ebener S (2007) The
Nightsat mission concept. International Journal of Remote Sensing, 28, 2645–2670.
Elvidge C, Ziskin D, Baugh K, Tuttle B, Ghosh T, Pack D, Zhizhin M (2009) A fifteen
year record of global natural gas flaring derived from satellite data. Energies, 2,
595–622.
Elvidge C, Keith DM, Tuttle BT, Baugh KE (2010) Spectral identification of lighting
type and character. Sensors, 10, 3961–3988.
Elvidge C, Sutton P, Baugh K, Ziskin D, Ghosh T, Anderson S (2011) National trends
in satellite observed lighting: 1992-2009. Remote Sensing, 3, 1–17.
Environmental Protection Agency (2010) No. 5 Environmental Assessment Guideline for
Protecting Marine Turtles from Light Impacts. Environmental Protection Agency,
Western Australia.
Fritsches KA (2012) Australian loggerhead sea turtle hatchlings do not avoid yellow.
Marine and Freshwater Behaviour and Physiology, 45, 79–89.
Fuentes M, Maynard J, Guinea M, Bell I, Werdell P, Hamann M (2009) Proxy indica-
tors of sand temperature help project impacts of global warming on sea turtles in
northern Australia. Endangered Species Research, 9, 33–40.
Fuentes M, Limpus C, Hamann M, Dawson J (2010) Potential impacts of projected
sea-level rise on sea turtle rookeries. Aquatic Conservation: Marine and Freshwater
Ecosystems, 20, 132–139.
Fuentes M, Limpus C, Hamann M (2011) Vulnerability of sea turtle nesting grounds
to climate change. Global Change Biology, 17, 140–153.
© 2013 John Wiley & Sons Ltd, Global Change Biology, doi: 10.1111/gcb.12503
MARINE TURTLES AND CHANGING LIGHT LEVELS 11

Fuentes M, Pike DA, Dimatteo A, Wallace BP (2013) Resilience of marine turtle regio-
nal management units to climate change. Global Change Biology, 19, 1399–1406.
Gaston KJ, Bennie J, Davies TW, Hopkins J (2013) The ecological impacts of nighttime
light pollution: a mechanistic appraisal. Biological Reviews, 88, 912–927.
Grech A, Bos M, Brodie J, Coles R, Dale A, Gilbert R, Pressey R (2013) Guiding princi-
ples for the improved governance of port and shipping impacts in the Great Bar-
rier Reef. Marine Pollution Bulletin, 75, 8–20.
Greenpeace Australia (2012) Boom goes the reef: Australia’s coal export boom and
the industrialization of the Great Barrier Reef. Available at: http://www.green
peace.org/australia/Global/australia/reports/Boom_goes_the_Reef_Report_4MB.
pdf (accessed 17 April 2012).
Gyuris E (1993) Factors that control the emergence of green turtle hatchlings from the
nest. Wildlife Research, 20, 345–353.
Hamann M, Limpus C, Read MA (2007) Chapter 15 vulnerability of marine reptiles in
the Great Barrier Reef to climate change. In: Climate Change and the Great Barrier
Reef: A Vulnerability Assessment (eds Johnson JE, Marshall PA), pp. 465–496. Great
Barrier Reef Marine Park Authority and Australia Greenhouse Office, Hobart,
Australia.
Hamann M, Godfrey M, Seminoff J, Arthur K, Barata P, Bjorndal K, Carreras C (2010)
Global research priorities for sea turtles: informing management and conservation
in the 21st century. Endangered Species Research, 11, 245–269.
Hamann M, Grech A, Wolanski E, Lambrechts J (2011) Modelling the fate of marine
turtle hatchlings. Ecological Modelling, 222, 1515–1521.
Harewood A, Horrocks J (2008) Impacts of coastal development on hawksbill hatch-
ling survival and swimming success during the initial offshore migration. Biologi-
cal Conservation, 141, 394–401.
Hawkes LA, Broderick AC, Godfrey MH, Godley BJ (2009) Climate change and mar-
ine turtles. Endangered Species Research, 7, 137–154.
Hays GC, Ashworth JS, Barnsley MJ, Broderick AC, Emery DR, Godley BJ, Jones EL
(2001) The importance of sand albedo for the thermal conditions on sea turtle nest-
ing beaches. Oikos, 93, 87–94.
Heard G (2013) 23 million and counting: why Australia’s population outlook is the
envy of the world. In: The Conversation. Available at: http://theconversation.com/
23-million-and-counting-why-australias-population-out-
look-is-the-envy-of-the-world-13660 (accessed 20 June 2013).
Heppell SS, Snover ML, Crowder LB (2003) Sea turtle population ecology. In: The Biol-
ogy of Sea Turtles (eds Lutz PL, Musick JA, Wyneken J), pp. 275–306. CRC Press,
Boca Raton, FL.
Hillger D, Kopp T, Lee T, Lindsey D, Seaman C, Miller S, Rink T (2013) First-Light
Imagery from Suomi NPP VIIRS. Bulletin of the American Meteorological Society, 94,
1019–1029.
Hodge W, Limpus CJ, Smissen P (2007) Queensland Turtle Conservation Project: Hum-
mock Hill Island Nesting Turtle Study December 2006. Environmental Protection
Agency, Queensland, Australia.
H€olker F, Moss B, Griefahn W, Kloas CC, Voigt D, Henckel A, Tockner K (2010a) The
dark side of light: a transdisciplinary research agenda for light pollution policy.
Ecology and Society, 15, 13.
H€olker F, Wolter C, Perkin EK, Tockner K (2010b) Light pollution as a biodiversity
threat. Trends in Ecology and Evolution, 25, 681–682.
Horch KW, Gocke JP, Salmon M, Forward RB (2008) Visual spectral sensitivity of
hatchling loggerhead (Caretta caretta L.) and leatherback (Dermochelys coriacea
L.) sea turtles, as determined by single-flash electroretinography. Marine and Fresh-
water Behaviour and Physiology, 41, 107–119.
Iovanna R, Vance C (2007) Modeling of continuous-time land cover change using
satellite imagery: an application from North Carolina. Journal of Land Use Science,
2, 147–166.
Jensen MP, Limpus CJ, Whiting SD, Guinea M, Prince RI, Dethmers KE, FitzSimmons
NN (2013) Defining olive ridley turtle Lepidochelys olivacea management units in
Australia and assessing the potential impact of mortality in ghost nets. Endangered
Species Research, 21, 241–253.
Jones M-A, Stauber J, Apte S, Simpson S, Vicente-Beckett V, Johnson R, Duivenvoor-
den L (2005) A risk assessment approach to contaminants in Port Curtis, Queens-
land, Australia. Marine Pollution Bulletin, 51, 448–458.
Kamrowski RL, Limpus C, Moloney J, Hamann M (2012) Coastal light pollution and
marine turtles: assessing the magnitude of the problem. Endangered Species
Research, 19, 85–98.
Kyba C, Ruhtz T, Fischer J, H€olker F (2012) Red is the new black: how the colour of
urban skyglow varies with cloud cover. Monthly Notices of the Royal Astronomical
Society, 425, 701–708.
Levenson DH, Eckert SA, Crognale MA, Deegan JF II, Jacobs GH (2004) Photopic
spectral sensitivity of green and loggerhead sea turtles. Copeia, 2004, 908–914.
Limpus C (1985) A Study of the Loggerhead Turtle, Caretta caretta, in Queensland. Ph.D.
University of Queensland, Brisbane, Australia.
Limpus C (2009) A Biological Review of Australian Marine Turtles. The State of Queens-
land, Environmental Protection Agency, Queensland Government, Brisbane.
Limpus CJ, Kamrowski RL (2013) Ocean-finding in marine turtles: the importance of
low horizon elevation as an orientation cue. Behaviour, 150, 863–893.
Limpus C, Miller J, Chatto R (2000) Distribution and abundance of marine turtle nest-
ing in northern and eastern Australia. Final Report for Australian Hawksbill Turtle
Population Dynamics Project, Queensland Parks and Wildlife Service, Brisbane,
19–37.
Longcore T, Rich C (2004) Ecological light pollution. Frontiers in Ecology and the Envi-
ronment, 2, 191–198.
Lorne JK, Salmon M (2007) Effects of exposure to artificial lighting on orientation of
hatchling sea turtles on the beach and in the ocean. Endangered Species Research, 3,
23–30.
Lyytim€aki J (2013) Nature’s nocturnal services: light pollution as a non-recognised
challenge for ecosystem services research and management. Ecosystem Services, 3,
e44–e48.
Lyytim€aki J, Tapio P, Assmuth T (2012) Unawareness in environmental protection:
the case of light pollution from traffic. Land Use Policy, 29, 598–604.
Mazor T, Levin N, Possingham HP, Levy Y, Rocchini D, Richardson AJ, Kark S (2013)
Can satellite-based night lights be used for conservation? The case of nesting sea
turtles in the Mediterranean. Biological Conservation, 159, 63–72.
Miller J, Limpus C (1981) Incubation period and sexual differentiation in the green
turtle Chelonia mydas L. In: Proceedings of the Melbourne Herpetological Symposium
(ed. Banks CB, Martin AA), pp. 66–73. Zoological Board of Victoria, Parkville,
Victoria, Australia.
Miller JD, Limpus CJ, Godfrey MH (2003) Nest site selection, oviposition, eggs, devel-
opment, hatching, and emergence of loggerhead turtles. In: Loggerhead Sea Turtles
(eds Bolten A, Witherington B), pp. 125–143. Smithsonian Books, Washington, DC.
Mills AM (2008) Latitudinal gradients of biologically useful semi-darkness. Ecography,
31, 578–582.
Miloslav N, Jirat J, Kosata B (2012) IUPAC Compendium of chemical terminology. Gold
book. Version 2.3.2. International Union of Pure and Applied Chemistry, Available
at: http://goldbook.iupac.org/PDF/goldbook.pdf (accessed 27 May 2013).
Mortimer JA (1989) Threats to the Survival of Terengganu’s Sea Turtles and a Review of
Management Options: Report Submitted to the Turtle Sanctuary Advisory Council of
Terengganu. WWF, Malaysia.
Narisada K, Schreuder D (2004) Light Pollution Handbook. Springer, Dordrecht, the
Netherlands.
Ngo L, Brand R (1997) Model selection in linear mixed effects models using SAS Proc
Mixed. Technical proceedings, 1997, 1335–1340.
Nicholls RJ (1995) Coastal megacities and climate change. GeoJournal, 37, 369–379.
Northern Territory Government (2011) East Arnhem Economic Profile: Growing the
Territory. Northern Territory Government, NT, Australia.
Pendoley K (2000) The Influence of Gas Flares on the Orientation of Green Turtle Hatch-
lings at Thevenard Island, Western Australia. Second ASEAN Symposium and Work-
shop on Sea Turtle biology and Conservation, Kotal Kinabalu, ASEAN Academic
Press, Kota Kinabalu, pp. 130–142.
Pendoley K (2005) Sea Turtles and the Environmental Management of Industrial Activities
in North West Western Australia. Unpublished Ph.D. Thesis. Murdoch University,
Perth, Western Australia.
Pestalozzi N, Cauwels P, Sornette D (2013) Dynamics and spatial distribution of glo-
bal nighttime lights. arXiv preprint arXiv:1303.2901.
Peters A, Verhoeven KJF (1994) Impact of artificial lighting on the seaward orienta-
tion of hatchling loggerhead turtles. Journal of Herpetology, 28, 112–114.
Pfaller JB, Limpus CJ, Bjorndal KA (2009) Nest-site selection in individual loggerhead
turtles and consequences for doomed-egg relocation. Conservation Biology, 23, 72–
80.
Poloczanska ES, Limpus CJ, Hays GC (2009) Vulnerability of marine turtles to climate
change. In: Advances in Marine Biology (ed. Sims D), pp. 151–211. Academic Press,
Burlington, VT.
Rich C, Longcore T (2006) Ecological Consequences of Artificial Night Lighting. Island
Press, Washington, DC.
Salmon M (2003) Artificial night lighting and sea turtles. Biologist, 50, 163–168.
Salmon M (2006) Protecting sea turtles from artificial night lighting at Florida’s oce-
anic beaches. In: Ecological Consequences of Artificial Night Lighting (eds Rich C,
Longcore T), pp. 141–168. Island Press, Washington, DC.
Salmon M, Wyneken J, Fritz E, Lucas M (1992) Seafinding by hatchling sea turtles:
role of brightness, silhouette and beach slope as orientation cues. Behaviour, 122,
56–77.
© 2013 John Wiley & Sons Ltd, Global Change Biology, doi: 10.1111/gcb.12503
12 R. L. KAMROWSKI et al.

Salmon M, Tolbert MG, Painter DP, Goff M, Reiners R (1995) Behavior of Loggerhead
Sea Turtles on an Urban Beach. II. Hatchling Orientation. Journal of Herpetology, 29,
568–576.
Schueler CF, Clement JE, Ardanuy PE, Welsch C, DeLuccia F, Swenson H (2002)
NPOESS VIIRS Sensor Design Overview. Proceedings of SPIE - Earth Observing
Systems VI, 4483 doi: 10.1117/12.453451.
Small C, Elvidge CD (2011) Mapping decadal change in anthropogenic night light.
Procedia Environmental Sciences, 7, 353–358.
Smith M (2008) Time to turn off the lights. Nature, 457, 27.
Spooner D, Clifford J (2008) Pluto LNG Development Sea Turtle Management Plan.
Sinclair Knight Merz, Perth.
Sutton P, Roberts D, Elvidge C, Meij H (1997) A comparison of nighttime satellite
imagery and population density for the continental United States. Photogrammetric
Engineering and Remote Sensing, 63, 1303–1313.
Turner RK, Subak S, Adger WN (1996) Pressures, trends, and impacts in coastal
zones: interactions between socioeconomic and natural systems. Environmental
Management, 20, 159–173.
Tuxbury SM, Salmon M (2005) Competitive interactions between artificial lighting
and natural cues during seafinding by hatchling marine turtles. Biological Conserva-
tion, 121, 311–316.
UNESCO (2012) Great Barrier Reef (Australia) (N 154). State of conservation of World
Heritage properties inscribed on the World Heritage List. Saint-Petersburg,
Russian Federation, 24 June–6 July 2012.
Verheijen F (1985) Photopollution: artificial light optic spatial control systems fail to
cope with. Incidents, causation, remedies. Experimental Biology, 44, 1–18.
Wallace BP, DiMatteo AD, Hurley BJ, Finkbeiner EM, Bolten AB, Chaloupka MY,
Mast RB (2010) Regional management units for marine turtles: a novel framework
for prioritizing conservation and research across multiple scales. PLoS ONE, 5, 11.
Wallace B, DiMatteo AD, Bolten AB, Chaloupka MY, Hutchinson BJ, Abreu-Grobois
FA, Bjorndal KA (2011) Global conservation priorities for marine turtles. PLoS
ONE, 6, e24510.
Witherington BE (1992) Behavioral responses of nesting sea turtles to artificial light-
ing. Herpetologica, 48, 31–39.
Witherington B (1999) Reducing threats to nesting habitat. In: Research and Manage-
ment Techniques for the Conservation of Sea Turtles (eds Eckert K, Bjorndal KA,
Abreu-Grobois AF, Donnelly M), pp. 179–183. IUCN/SSC Marine Turtle Specialist
Group Publication No. 4, Washington, DC.
Witherington B, Bjorndal KA (1991) Influences of wavelength and intensity on hatch-
ling sea turtle phototaxis: implications for sea-finding behavior. Copeia, 1991, 1060–
1069.
Witherington B, Martin RE (2000) Understanding, Assessing, and Resolving Light-Pollu-
tion Problems on Sea Turtle Nesting Beaches, 2nd rev. edn. Florida Fish and Wildlife
Conservation Commission, Marine Research Institute, St. Petersburg, FL. Tech.
Rep. TR-2.
Witt M, Hawkes L, Godfrey M, Godley B, Broderick A (2010) Predicting the impacts
of climate change on a globally distributed species: the case of the loggerhead tur-
tle. The Journal of Experimental Biology, 213, 901–911.
Yntema C, Mrosovsky N (1980) Sexual differentiation in hatchling loggerheads
(Caretta caretta) incubated at different controlled temperatures. Herpetologica, 36,
33–36.
Supporting Information
Additional Supporting Information may be found in theonline version of this article:
Table S1. Satellite data chosen for each year, followingexpert opinion, for assessing temporal change in artificiallight levels close to marine turtle nesting areas.
© 2013 John Wiley & Sons Ltd, Global Change Biology, doi: 10.1111/gcb.12503
MARINE TURTLES AND CHANGING LIGHT LEVELS 13