
TEMPERATURE MAPPING OF FRESH FISH SUPPLY CHAINS - AIR AND SEA TRANSPORT
35
TEMPERATURE MAPPING OF FRESH FISH SUPPLY CHAINS – AIR AND SEA TRANSPORT NGA THI TUYET MAI 1,2,3,4 , BJÖRN MARGEIRSSON 1,3 , SVEINN MARGEIRSSON 3 , SIGURDUR GRÉTAR BOGASON 1 , SJÖFN SIGURGÍSLADÓTTIR 3 and SIGURJÓN ARASON 1,3 1 University of Iceland Sæmundargötu 2 101 Reykjavik, Iceland 2 University of Nhatrang 2 Nguyen Dinh Chieu Nha Trang, Vietnam 3 Matis ohf, Vínlandsleið 12 113 Reykjavik, Iceland Received for Publication October 16, 2009 ABSTRACT Temperature history from three air and three sea freights of fresh cod loins and haddock fillets in expanded polystyrene boxes from Iceland to the U.K. and France were analyzed to find out the effect of different factors on the temperature profile and predicted remaining shelf life (RSL) of the product. It was also aimed to pinpoint hazardous steps in the supply chains. Significant difference (P < 0.001) was found in: the temperature at different locations inside a certain box; mean product temperature between boxes of a certain shipment; and the boxes’ surface temperature at different positions on a pallet for the whole logistics period. The predicted RSL depends on the time and temperature history of the product, shortest for sea transportation and longest for an air shipment with precooled product. Several critical steps were found in air freighting: the flight itself, loading/unloading operations and holding storage at unchilled conditions. PRACTICAL APPLICATION The paper strengthens fundamental understandings on logistics of fresh fish by air and sea in EPS boxes using ice or gel mats as coolants, with 4 Corresponding author. TEL: +84-58-3831149; FAX: +84-58-3831147; EMAIL: [email protected] Journal of Food Process Engineering •• (2011) ••–••. All Rights Reserved. © 2011 Wiley Periodicals, Inc. DOI: 10.1111/j.1745-4530.2010.00611.x 1
-
Upload
independent -
Category
Documents
-
view
2 -
download
0
Transcript of TEMPERATURE MAPPING OF FRESH FISH SUPPLY CHAINS - AIR AND SEA TRANSPORT

jfpe_611 1..35
TEMPERATURE MAPPING OF FRESH FISH SUPPLY CHAINS –AIR AND SEA TRANSPORT
NGA THI TUYET MAI1,2,3,4, BJÖRN MARGEIRSSON1,3,SVEINN MARGEIRSSON3, SIGURDUR GRÉTAR BOGASON1,
SJÖFN SIGURGÍSLADÓTTIR3 and SIGURJÓN ARASON1,3
1University of IcelandSæmundargötu 2
101 Reykjavik, Iceland
2University of Nhatrang2 Nguyen Dinh ChieuNha Trang, Vietnam
3Matis ohf, Vínlandsleið 12113 Reykjavik, Iceland
Received for Publication October 16, 2009
ABSTRACT
Temperature history from three air and three sea freights of freshcod loins and haddock fillets in expanded polystyrene boxes from Iceland tothe U.K. and France were analyzed to find out the effect of different factors onthe temperature profile and predicted remaining shelf life (RSL) of the product.It was also aimed to pinpoint hazardous steps in the supply chains. Significantdifference (P < 0.001) was found in: the temperature at different locationsinside a certain box; mean product temperature between boxes of a certainshipment; and the boxes’ surface temperature at different positions on a palletfor the whole logistics period. The predicted RSL depends on the time andtemperature history of the product, shortest for sea transportation and longestfor an air shipment with precooled product. Several critical steps were foundin air freighting: the flight itself, loading/unloading operations and holdingstorage at unchilled conditions.
PRACTICAL APPLICATION
The paper strengthens fundamental understandings on logistics of freshfish by air and sea in EPS boxes using ice or gel mats as coolants, with
4 Corresponding author. TEL: +84-58-3831149; FAX: +84-58-3831147; EMAIL: [email protected]
Journal of Food Process Engineering •• (2011) ••–••. All Rights Reserved.© 2011 Wiley Periodicals, Inc.DOI: 10.1111/j.1745-4530.2010.00611.x
1

particular contribution of information related to mode of transportation, box–pallet arrangement and location, time–temperature and precooling effects. It isproposed to precool products before packing to better stabilize the temperatureof product during abusive period(s). It is also suggested to group the productsbased on the time–temperature history and/or positions on the pallets for bettermanagement in further handling of the fish.
INTRODUCTION
The consumption of fresh fish has been growing while other forms of fishproducts have remained the same or even declined (Vannuccini 2004; FAO2009). This makes the supply of fresh fish increasingly important. The worldproduction of fresh seafood has gradually grown from about 30,000,000 tonsin 1994 to 50,000,000 tons in 2002 (Vannuccini 2004).
Temperature is considered as the main factor that affects the quality andsafety of perishable products. Abusive and/or fluctuating temperature acceler-ates rapid growth of specific spoilage microorganisms as well as pathogens (Jolet al. 2005; Raab et al. 2008), thus may cause economic losses and safetyproblems.
It is well known that fresh fish is often stored and shipped at melting icetemperature (Pawsey 1995; ATP 2007) or even below 0C, at superchilledtemperature (Olafsdottir et al. 2006b) to keep it good and safe for a certainperiod. However, the fresh fish supply chains may face certain hazards whenthe requirements are not fulfilled.
The transportation of perishable products such as fresh fish is verycommon by air as it is very fast. However, during loading, unloading, truck andair transportation, storage and holding the product is normally subjected totemperature abuse at unchilled conditions (Brecht et al. 2003; Nunes et al.2003), which means that much of its journey is unprotected (James et al.2006). Even fluctuation and/or high temperature for short time was reported tocause the rejection of a whole strawberry load (Nunes et al. 2003). Resultsfrom a study on chilled modified atmosphere packaged Pacific hake haveshown that even a small fraction of storage time (4.3%) at abusive temperaturecaused a significant reduction in shelf life (25%) of the product (Simpson et al.2003).
Another means of transporting fresh fish is by sea where the product iscontainerized in refrigerated containers to maintain the required low tempera-ture for the whole voyage. This mode of transportation, however, takes muchlonger time compared with air freighting where time is known as a main factorin reducing the quality of perishables even at optimum conditions of handling(Pawsey 1995).
2 N.T.T. MAI ET AL.

There are several studies about the effect of different factors in the coldchains on the temperature distribution and/or quality of food products such asfresh-cut endive (Rediers et al. 2009), strawberry (Nunes et al. 2003), aspara-gus (Laurin 2001), chilled chicken breast (Raab et al. 2008), frozen fish(Moureh and Derens 2000), chilled gilthead seabream (Giannakourou et al.2005) and so forth. However, there is still no scientific publication on thetemperature mapping and comparison for a real supply chain of fresh cod loinsor haddock fillets from processing to market by air and sea transportation.
Shelf-life models are very useful to assess the effects of temperaturechanges on product quality (Jedermann et al. 2009). The data set of time–temperature history can be fitted to predict RSL by using available modelssuch as the square root model for relative rate of spoilage (RRS) of freshseafood (DTU-Aqua 2008).
The aim of this work was to investigate the temperature changes of freshcod loins and haddock fillets packed in EPS boxes, as well as of the environmentaround the product during the logistics from producers in Iceland to markets inthe U.K. and France by air and sea freights, and from that, to pinpoint criticalsteps in the supply chains. The study was also aimed to compare the effect ofdifferent factors such as product locations inside each box, box positions on apallet, logistics units (i.e., master boxes, pallets or containers), precooling andmodes of transportation on the temperature profiles of product and box surface,and to compare the effect of these factors on the predicted RSL of product basedon the time–temperature records from the shipments.
MATERIALS AND METHODS
Temperature Mapping
The temperature mappings were performed for three air and three seatrips of the fresh fish supply chains from the processors in Iceland (IS) to themarkets (distributors, retailers or secondary processors) in the U.K. and France(FRA) in September 2007 and June, July and September 2008. Descriptions ofthe logistics of these chains are shown in Table 1.
Product Profile for the Shipments. Products of all the studied trips,except for the one in July 2008, were fresh cod loins from a processingcompany in Dalvik (North – Iceland). In July 2008, they were fresh haddockfillets from another company in Hafnarfjordur (South West – Iceland).
The cod was caught east of Iceland. Onboard, it was bled, gutted, washedand iced in insulated tubs. The fish to ice ratio was about 3:1, and the fish waspacked in four to five layers alternatively with ice above and below each fishlayer. The preprocessed whole fish was stored in the tubs in the refrigerated
TEMPERATURE MAPPING OF FRESH FISH SUPPLY CHAINS 3

TAB
LE
1.D
ESC
RIP
TIO
NS
ON
TH
EL
OG
IST
ICS
OF
TH
EST
UD
IED
CH
AIN
S
Frei
ght
Step
Des
crip
tion
Dur
atio
nA
mbi
ent
tem
pera
ture
Am
bien
tte
mpe
ratu
reof
palle
t1
Am
bien
tte
mpe
ratu
reof
palle
t2
Mea
n�
STD
EV
(C)
Mea
n�
STD
EV
(C)
Mea
n�
STD
EV
(C)
Air
_Se
p20
07(F
reig
hter
)1
Froz
enst
orag
eat
prod
ucer
afte
rpa
ckin
g(D
alvi
k,IS
)6
h-1
6.2
�9.
2-2
2.5
�3.
3-1
3.0
�9.
62
Chi
lled
stor
age
atpr
oduc
er2
h2.
5�
0.5
2.3
�0.
32.
5�
0.5
3T
rans
port
atio
nfr
omD
alvi
kto
Rey
kjav
ik(R
VK
,IS)
ina
refr
iger
ated
truc
k8
h20
min
-12.
3�
6.0
-8.1
�3.
5-1
4.4
�5.
9
4U
nloa
ding
and
load
ing
ina
chill
edtr
uck
inR
VK
2h
8.6
�1.
38.
4�
1.1
8.7
�1.
35
Tra
nspo
rtat
ion
from
RV
Kto
Kefl
avik
airp
ort
(KE
F,IS
)in
ach
illed
truc
k1
h20
min
1.6
�1.
12.
2�
0.7
1.3
�1.
1
6U
nchi
lled
stor
age
atK
EF
airp
ort
5h
20m
in11
.3�
3.0
13.3
�2.
010
.3�
3.0
7C
hille
dst
orag
eat
KE
Fai
rpor
t6
h3.
1�
4.9
8.1
�5.
30.
5�
1.6
8Fl
ight
from
KE
Fto
Hum
bers
ide
airp
ort
(HU
Y,U
.K.)
and
unch
illed
stor
age
atH
UY
6h
15m
in9.
9�
4.5
6.4
�4.
811
.7�
3.1
9St
orag
eat
HU
Yan
dtr
ansp
orta
tion
toC
arlis
le(U
.K.)
7h
15m
in0.
2�
0.8
1.0
�0.
4-0
.2�
0.6
10U
nloa
ding
/unc
hille
dst
orag
eat
who
lesa
ler
inC
arlis
le3
h3.
9�
2.1
4.7
�2.
73.
6�
1.7
11St
orag
ein
Car
lisle
45h
45m
in1.
5�
1.1
1.3
�1.
01.
7�
1.1
12D
istr
ibut
ion
tore
taile
rs2
h12
min
3.7
�1.
33.
0�
1.2
4.0
�1.
2To
tal
3.9
dat
dist
ribu
tor;
or4
dat
reta
ilers
0.6
�7.
70.
7�
8.0
0.5
�7.
6A
ir_J
une
2008
(Fre
ight
er)
1C
old
stor
age
afte
rpa
ckin
gat
prod
ucer
(Dal
vik)
2h
-6.8
�8.
2-1
1.5
�6.
0-2
.2�
7.4
2L
oadi
ngtr
uck
and
tran
spor
tatio
nto
RV
K9
h35
min
-0.3
�2.
9-2
.4�
2.8
1.7
�1.
13
Unc
hille
dst
orag
eov
erni
ght
inR
VK
10h
10m
in8.
8�
2.5
10.5
�1.
77.
1�
2.0
4T
rans
port
atio
nin
refr
iger
ated
truc
kto
KE
F2
h15
min
3.4
�2.
84.
5�
2.5
2.2
�2.
75
Chi
lled
stor
age
atK
EF
airp
ort
2h
45m
in1.
2�
1.0
1.9
�0.
70.
5�
0.6
6L
oadi
ngat
KE
Fan
dfli
ght
from
KE
Fto
Not
tingh
am(U
.K.)
5h
30m
in4.
6�
3.0
3.6
�2.
65.
6�
3.2
7T
rans
port
atio
nfr
ompr
oces
sors
stor
age
7h
55m
in1.
7�
2.3
1.0
�2.
62.
3�
1.8
Tota
l1.
7d
3.0
�5.
22.
6�
6.3
3.5
�3.
7
4 N.T.T. MAI ET AL.

TAB
LE
1.C
ON
TIN
UE
D
Frei
ght
Step
Des
crip
tion
Dur
atio
nA
mbi
ent
tem
pera
ture
Am
bien
tte
mpe
ratu
reof
palle
t1
Am
bien
tte
mpe
ratu
reof
palle
t2
Mea
n�
STD
EV
(C)
Mea
n�
STD
EV
(C)
Mea
n�
STD
EV
(C)
Air
_Jul
y20
08(P
asse
nger
)1
Chi
lled
stor
age
atth
epr
oduc
erin
Haf
narf
jord
ur(I
S)af
ter
pack
agin
g21
h30
min
3.6
�1.
3
2T
rans
port
from
Haf
narf
jord
urto
som
est
orag
eat
KE
F19
h10
min
14.4
�2.
83
From
taki
ngof
fto
land
ing
3h
5m
in12
.1�
4.2
4St
orag
eat
Lon
don
Hea
thro
wai
rpor
t(L
HR
,U.K
.)7
h15
min
10.7
�5.
05
Lan
dtr
ansp
ort
inre
frig
erat
edtr
uck
tose
cond
ary
prod
ucer
inPl
ymou
th(U
.K.)
5h
4.2
�0.
4
Tota
l2.
3d
8.7
�5.
6Se
a_18
–23S
ep20
08H
andl
ing
and
tran
spor
tatio
nin
refr
iger
ated
cont
aine
r:tr
ucke
dfr
ompr
oduc
erto
habo
rR
eyda
rfjo
rdur
(IS)
;sh
ippi
ngto
Rot
terd
amha
bor
(the
Net
herl
ands
);an
dla
ndtr
ansp
orta
tion
until
final
dest
inat
ion
(Bou
logn
esu
rm
er,
FRA
)
4d
19h
45m
in(4
.8d)
-0.2
�0.
5
Sea_
23–2
9Se
p20
081
Col
dst
orag
eat
the
prod
ucer
(Dal
vik)
3h
35m
in-1
1.6
�5.
52
Loa
ding
into
cont
aine
ran
dtr
ansp
orta
tion
toR
VK
8h
30m
in-2
.8�
2.1
3Pa
rtly
chill
edho
ldin
RV
K4
h50
min
3.5
�4.
34
Tra
nspo
rtat
ion
and
hand
ling
inre
frig
erat
edco
ntai
ner:
truc
ked
from
prod
ucer
toR
VK
;sh
ippi
ngto
Imm
ingh
am(U
.K.)
;an
dla
ndtr
ansp
orta
tion
till
final
dest
inat
ion
(Gri
msb
y,U
.K.)
5d
3h
30m
in-0
.4�
1.5
Tota
l5.
9d
-0.7
�2.
8Se
a_24
Sep–
1O
ct20
08H
andl
ing
and
tran
spor
tatio
nin
refr
iger
ated
cont
aine
r:tr
ucke
dfr
ompr
oduc
er(D
alvi
k)to
RV
K;
ship
ping
toIm
min
gham
(U.K
.);
and
land
tran
spor
tatio
ntil
lfin
alde
stin
atio
n(G
rim
sby,
U.K
.)
6d
16h
35m
in(6
.7d)
-0.7
�0.
2
TEMPERATURE MAPPING OF FRESH FISH SUPPLY CHAINS 5

ship’s hold until landing approximately 2–4 days from catch. After landing, itwas transported in unrefrigerated trucks to the processing plant located only afew hundred meters away from the harbor. The catch was processed thefollowing day after a chilled storage overnight.
For the products aimed to air transportation, the fish was headed, filleted,skinned and cut into portions (approximate size: 26 ¥ 5 ¥ 2.3 cm, approximateweight: 0.32 kg). After processing, the cod loins were immediately packed inEPS boxes (outer dimensions: 400 ¥ 264 ¥ 118 mm), which contained about3 kg of cod loins with two frozen gel – mats (September 2007) or one gel matof 125 g (June 2008) lying on top of the loins, and with a plastic film inbetween. The EPS boxes were loaded on Euro pallets (1,200 ¥ 800 mm) witheight boxes in each row and 12 rows high (Fig. 1), and the palletized boxeswrapped in a thin plastic sheet for protection.
FIG. 1. COMMON LOADING PATTERN OF 3-KG EXPANDED POLYSTYRENE BOXES ONA PALLET
Round buttons on top and side of the pallet illustrate the surface loggers.
6 N.T.T. MAI ET AL.

For the products aimed to sea transportation, the processing steps includeheading, filleting, liquid cooling, combined blast and contact (CBC) cooling,skinning and trimming. After processing, the cod loins of the same size as forair shipments were immediately packed in EPS boxes (400 ¥ 264 ¥ 135 mm)which contained 5 kg of cod loins. The boxes were equipped with drainageholes at the bottom in order to drain melting ice which was put on top of a thinplastic sheet above the loins. The amount of ice utilized in each box was about0.3–0.5 kg. The boxes were palletized on Euro pallets (1,200 ¥ 800 mm) withnine boxes in each row and 12 rows on each pallet. A few layers of thin plasticfilm were wrapped around the palletized boxes before they were containerized.
The haddock was caught north of Iceland by a line vessel in July 2008.On board, it was bled, washed, packed and stored with ice in insulated tubsuntil landing in North Iceland. Fish tubs were transported in a refrigeratedtruck approximately 400 km to the processing plant in Hafnarfjordur. The rawmaterial was stored in the plant’s chilled storage room (ambient temperatureabout 2 to 4C) overnight. The fish was about 1 day old from catch when theprocessing started the following morning. The different steps in the processinginclude gutting, washing, filleting, trimming, liquid cooling (10–15 min in iceslurry at -1 to 1C), CBC cooling (10–11 min at about -10 to -8C), skinningand trimming, followed immediately by packaging into EPS boxes(600 ¥ 400 ¥ 147 mm). Each box contained 12 kg of haddock fillets, withoutany ice or gel packs as a cooling medium since the CBC treatment decreasesthe fillet temperature to around -0.5C. Twenty-eight boxes (seven rows withfour boxes in each row) were palletized on each Euro pallet (1,200 ¥ 800 mm)and the pallet load wrapped with layers of thin plastic sheet.
Logger Configurations. Based on previous studies (Moureh and Derens2000; Moureh et al. 2002) and own preliminary studies, it was observed thatthe temperature at different positions of product and packages is often nothomogeneous during thermal load. Loggers were configured in the way thattemperature changes at different positions inside a box and on box surface, andat different positions of boxes on a pallet could be sufficiently monitored.
Loggers for the temperature mapping were placed in the product duringpackaging and on the box surface before or during palletizing. Logger con-figurations are the following:
In September 2007, measurements were carried out with two pallets (P1,P2): four boxes for each pallet: at top center (TM), top corner (TC), bottomcorner (B) and in the center of middle row (M) of the pallets; 3 loggers insideeach box: on top (t), in the middle (m), and at the bottom (b) of product. Threeoutside loggers to measure box ambient temperature (A) were attached to themiddle side (MC) boxes of P1 (P1_A_MC), P2 (P2_A_MC) and to the topcorner box of P2 (P2_A_T). The box positions and outside loggers are shown
TEMPERATURE MAPPING OF FRESH FISH SUPPLY CHAINS 7

for one pallet in Fig. 1. At the end, two inside loggers of P2, which were thetop loggers inside the center–middle row box (P2_M_t) and the top center box(P2_TM_t), got lost.
In June 2008, measurements were conducted with two pallets (P1, P2):three boxes for each pallet: at top corner (T), bottom corner (B) and middleheight (M); 3 loggers inside each box (t, m and b). Four outside loggers wereplaced on top (P1_A_T, P2_A_T) and side (P1_A_MC, P2_A_MC) of the twopallets. However, two inside loggers of P2, which were at the bottoms in thebottom corner box (P2_B_b) and the top corner box (P2_T_b), failed to record.Therefore, the data sets are just available for nine inside loggers of P1, seveninside loggers of P2 and four outside loggers.
For the air shipment by a commercial passenger flight in July 2008, onepallet was investigated: three boxes (T, B and M) with two loggers inside (mand b) and one on the surface of each box (A_T, A_B and A_M).
In the sea freight study September 18–23, 2008, measurements were donewith one pallet: three boxes (T, B and M) with three loggers inside (t, m andb) and one on the surface of each box (A_T, A_B and A_M). However, all theinside loggers were lost; two outside loggers stopped working before theshipment started, only one outside logger on the middle box (A_M) workedproperly.
In the sea freight September 23–29, 2008, a study was carried out for onepallet with only three surface loggers on top corner, bottom corner and middleboxes (A_T, A_B and A_M, respectively).
Lastly, in the sea trip September 24 to October 1, 2008, the temperaturemapping was done on one pallet: three boxes (T, B and M) with three loggersinside (t, m and b) and one on the surface of each box (A_T, A_B and A_M).One inside logger (B_t) was lost.
It should be noticed that in all the sea trips and in the air freight July 2008,the middle boxes (M) also means middle side (MC) as they have one free sideon a pallet side. Furthermore, the middle box in July 2008 had two free sidesas it was located at the corner of the middle row.
In general, each mapped box was equipped with three loggers inside (oneat the bottom, one in the middle height of product and another on top ofproduct) and a logger on the box surface (top or side). This gives the actualtemperature history of product at different positions inside a box, as well as theactual temperature changes on the box surface.
Types of Loggers. The iButton temperature loggers are small and rela-tively cheap devices with wide range of operation temperature, high precisionand sufficient memory for data storage (up to 4,096 data points, e.g., recordingcontinuously for 14 days at 5 min interval or 28 days at 10 min interval). Theycan function during contact with food, water or ice and can be easily set.
8 N.T.T. MAI ET AL.

DS1922L temperature loggers iButton were used for mapping the temperatureinside the boxes, with temperature range: -40C to 85C; resolution: 0.0625C;accuracy: �0.5C and �1 min/week. Recording intervals were set at 2(Air_July 2008), 4 (Air_September 2007), 5 (Sea_24September 2008) or 10(Air_June 2008) min.
TBI32-20+50 Temp Data Loggers were used for the measurement ofambient temperature on the box surfaces, with temperature range: -20C to+50C; resolution: 0.3C; accuracy: �0.4C and �1 min/week. Recording inter-vals were set at 1 (Sea_23–29September 2008, Sea_24September 2008), 2(Air_July 2008), 4 (Air_September 2007) or 5 (Air_June 2008, Sea_18–23September 2008) min.
All loggers were calibrated in thick mixture of fresh crushed ice andwater before use.
Data Analysis
Multivariate analysis was performed using the Unscrambler version 9.0(CAMO Process AS, Norway). The main variance in the data set was studiedusing PCA with full cross validation. Data were preprocessed by autoscalingprior to the PCA, i.e., first centered by subtracting the column average ofelements from every element in the column, and then each element was scaledby multiplying with the inverse standard deviation (1/STDEV) of the corre-sponding variable, to handle the model offsets and to let the variance of eachvariable be identical initially (Bro and Smilde 2003).
One-way repeated measures analysis of variance was applied to the datausing the software SPSS version 16.0 (released September 2007) (SPSS Inc.,Chicago, IL) in order to study the effect of some factors such as productlocations, box positions and chain steps on the temperature of product and boxsurface. The null hypothesis was that the analyzed factors have no influence onthe temperature. Bonferroni correction was used in confidence interval adjust-ment for multiple comparisons of locations. Tukey’s multiple comparison testwas used to determine the statistical difference between steps. All tests wereperformed with significance level of 0.05.
Microsoft Excel 2003 was used to calculate means, standard deviationand range for all measurements and to generate graphs.
The Seafood Spoilage and Safety Predictor (SSSP) software version 3.0(DTU Aqua, Denmark) was used to predict the effect of time–temperaturecombination on the RSL based on the recorded temperature profile. Recordeddata of cod loins and haddock fillets from different positions inside boxes wereseparately fitted into a square root model for RRS of fresh seafood fromtemperate water. In SSSP, RRS at T °C has been defined as the shelf life at areference temperature Tref, which normally is 0C, divided by the shelf life at T
TEMPERATURE MAPPING OF FRESH FISH SUPPLY CHAINS 9

°C (Dalgaard 2002), where shelf life was determined by sensory evaluation.The SSSP uses the concept of accumulative effects of time and temperature.The SSSP is based on growth kinetics of specific spoilage organisms andempirical RRS secondary models (Dalgaard et al. 2002). A reference shelf lifeof 9 days (from catch) stored at 1.5C for fresh cod loins in EPS boxes (Wanget al. 2008) was used in this study. A shelf life of 12 days (from catch) at 0Cwas applied for fresh haddock fillets in EPS boxes (Olafsdottir et al. 2006a). Inorder to enable the comparison of the effect of different logistics practices onthe RSL, it was assumed that all fish batches had undergone 3 days from catchof the same conditions before the temperature mapping started. Therefore,3 days were subtracted from the SSSP’s RSL outputs based on the temperaturehistory during logistics to get the final RSL. The mapping data for haddockfillets in July 2008 were also used for cod loins, assuming that the product wascod, to compare the RSL between the shipments.
RESULTS AND DISCUSSION
Temperature Mapping
Air Freight in September 2007. Figure 2a reveals some hazardous partsof the chain because of the ambient temperature rise. The two most abusingsteps were the flight followed by unchilled storage at the arrival at Humbersideairport (step 8) and the unchilled storage at the departure at Keflavik airport(step 6), which caused the rise of temperature inside boxes in steps 6–8(Fig. 2b). Unloading and reloading activities (steps 4 and 10) were also notablebut with shorter durations (approximately 2 h in step 4, and 3 h in step 10). Intotal, the pallets were exposed to unchilled conditions (up to 15C) for morethan 16.5 h, accounting for about 17.4% of the total time from processor toretailers.
In step 1, the temperature on the side of pallet 2 (P2_A_MC) wasconsiderably higher than on the top of this pallet (P2_A_T) and on the side ofpallet 1 (P1_A_MC) where the temperature was the lowest (Fig. 2a). Thismight be because pallet 2 was placed closer to the door of the cold store andwith the mentioned side facing the door which was opened for the loading/unloading processes.
It can be seen from Fig. 2b that the temperature inside boxes was rela-tively high (up to about 5C) when the pallets were transferred into the coldstorage after packing (step 1). This shows the possibility for the producer toimprove the production, e.g., by adding slurry ice chilling (or another chillingmethod) to the processing line in order to lower the product temperature beforepackaging. The time required to get the average temperature below 2C in the
10 N.T.T. MAI ET AL.

-30
-25
-20
-15
-10
-5
0
5
10
15
20
20/09/07 12:00 21/09/07 12:00 22/09/07 12:00 23/09/07 12:00 24/09/07 12:00
Time
Tem
pera
ture
(oC
)
1 4 6 7 9 10 11 125 82 3
P2_A_T
P2_A_MC
P1_A_MC
a
-1
0
1
2
3
4
5
20/09/07 12:00 21/09/07 12:00 22/09/07 12:00 23/09/07 12:00 24/09/07 12:00
Time
Te
mp
era
ture
(oC
)
1 2 3 4 5 6 7 8 9 1110 12
P1_B_Mean
P2_B_Mean
P1_TM_Mean
P1_TC_Mean
P2_TC_Mean
P2_M_Mean
P1_M_Mean
P2_TM_Mean
b
FIG. 2. AMBIENT TEMPERATURE ON THE BOXES (a), AVERAGE PRODUCTTEMPERATURE INSIDE THE BOXES (b) AND PRODUCT TEMPERATURE ATDIFFERENT LOCATIONS INSIDE EACH BOX (c) DURING THE AIR CARGO
STUDY IN SEPTEMBER 2007
TEMPERATURE MAPPING OF FRESH FISH SUPPLY CHAINS 11
boxes was up to above 8 h, despite the fact that the pallets were mostly facingambient temperature around -20C. This is because the product was wellinsulated by the EPS boxes, and the palletization of the boxes.
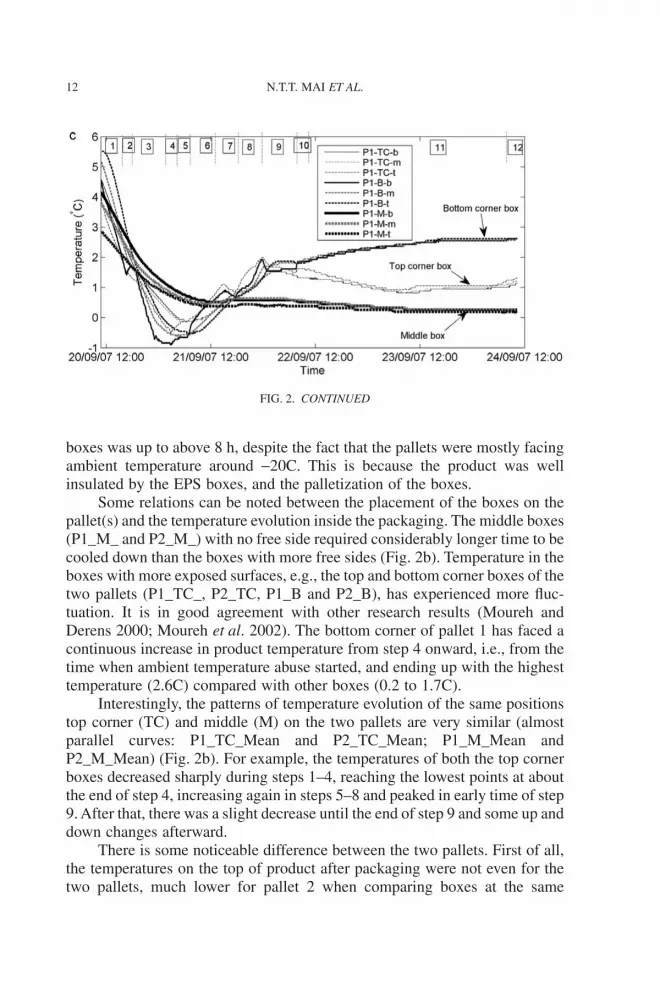
Some relations can be noted between the placement of the boxes on thepallet(s) and the temperature evolution inside the packaging. The middle boxes(P1_M_ and P2_M_) with no free side required considerably longer time to becooled down than the boxes with more free sides (Fig. 2b). Temperature in theboxes with more exposed surfaces, e.g., the top and bottom corner boxes of thetwo pallets (P1_TC_, P2_TC, P1_B and P2_B), has experienced more fluc-tuation. It is in good agreement with other research results (Moureh andDerens 2000; Moureh et al. 2002). The bottom corner of pallet 1 has faced acontinuous increase in product temperature from step 4 onward, i.e., from thetime when ambient temperature abuse started, and ending up with the highesttemperature (2.6C) compared with other boxes (0.2 to 1.7C).
Interestingly, the patterns of temperature evolution of the same positionstop corner (TC) and middle (M) on the two pallets are very similar (almostparallel curves: P1_TC_Mean and P2_TC_Mean; P1_M_Mean andP2_M_Mean) (Fig. 2b). For example, the temperatures of both the top cornerboxes decreased sharply during steps 1–4, reaching the lowest points at aboutthe end of step 4, increasing again in steps 5–8 and peaked in early time of step9. After that, there was a slight decrease until the end of step 9 and some up anddown changes afterward.
There is some noticeable difference between the two pallets. First of all,the temperatures on the top of product after packaging were not even for thetwo pallets, much lower for pallet 2 when comparing boxes at the same
FIG. 2. CONTINUED
12 N.T.T. MAI ET AL.

positions (i.e., B and TC) (see Fig. 9). It might be because boxes of pallet 2were packed earlier (with the ice mats on top) than those of pallet 1 before theloggers were activated to record the temperature. The product temperature ofpallet 2 was far lower than that of pallet 1 (except for the middle box of P1) forthe whole period from step 8 onward (Fig. 2b). It is mainly because pallet 2 hasbeen exposed to lower temperature environment during a quite long refriger-ated truck transportation to Reykjavik (for more than 8 h in step 3), and alsoduring the storage at Keflavik airport (for more than 11 h in steps 6 and 7)(Fig. 2a). It is very likely that pallet 2 was placed close to the cooling equip-ment during chilled transportation (step 3) and storage (step 7).
It can be seen from Fig. 2c that the product temperature at differentlocations inside a box was not the same, with larger range at the beginning(steps 1–10), but becoming more even at the later stages of the logistics (steps11 and 12).
When the results were analyzed with PCA (Fig. 3), a clear grouping wasfound between the samples with different degrees of temperature abuse expo-sure. Principal component 1 (PC1) explains 50% of the variance, whereasprincipal component 2 (PC2) explains 38%. Product at different locations in thebottom corner box on pallet 1 (P1_B_t, _m and _b), which was the most
FIG. 3. PRINCIPAL COMPONENT ANALYSIS BI-PLOT BASEDON AVERAGE-WITHIN-STEP TEMPERATURE FROM THE AIR
TRANSPORTATION STUDY IN SEPTEMBER 2007Samples are labeled with the pallet number (P1, P2), box position on the pallets (TC, TM, M and
B), and the location inside a box (T, M and B). Dotted ellipses group the samples with similarproduct temperature at the end of the logistics (end of step 12). The dash ellipse shows subgroup of
those positions where the product temperature was the most stable.
TEMPERATURE MAPPING OF FRESH FISH SUPPLY CHAINS 13

influenced, forms one group of samples. Similarly, products in the top cornerbox (P1_TC_) and in the top middle box (P1_TM_) of this pallet make two otherdistinct groups. Those three boxes had higher temperature at the later stages ofthe chain (steps 8–12, Fig. 2b), of which the top product temperature inside thetop corner box was the highest in step 8 (curve P1_TC_t, Fig. 2c); thus, thesample score is located very close to the loadings of step 8. Product temperatureof pallet 2 (P2) and in the middle box of pallet 1 (P1_M_) was more stable duringthe chain, grouping together in the PCA plot. Temperature in the middle boxesof the two pallets was the most resistant to change because these boxes areinsulated by others; the change was mostly observed during steps 3–6 (Fig. 2b),making those scores and loadings group together (dash ellipse). This resistanceis in a good agreement with the results of other studies (Moureh and Derens2000; Moureh et al. 2002). Despite the fact that the temperature behavior atdifferent positions inside each box was somewhat different, their PCAscores arelocated relatively close to each other, which in turn contribute to the discrimi-nation of the product temperature between boxes. It would be possible to groupthe boxes with similar temperature evolution so as to have a better managementfor the quality, safety and shelf life of the product. For example, it might supportthe sale managers in further utilization of the resources: highest end temperaturein – first out.
Air Freight in June 2008. Figure 4a reveals some hazardous parts ofthe chain considering the temperature abuse that the pallets have experi-enced. The two most noticeable steps were the storage over night in Reyk-javik (step 3) and the loading at Keflavik airport followed by the flight to theU.K. (step 6). During the loading period of the airplane (beginningof step 6), the top of pallet 2 experienced a rise of air temperature from 10to 20C (see curve P2_A_T in Fig. 4a). The warming and cooling periodstook about 1 hour. The explanation may be that the sunlight might havereached a part of the pallet while loading the airplane (increasing theambient air temperature for a short period). Total abusing time was about14.5 h (ambient temperature >5C), which was 36.1% of the total logisticstime from producer to final destination. This shows that a considerable timein air transportation is under nonrefrigerated conditions as stated elsewhere(James et al. 2006).
The ambient air temperature was much lower for pallet 1 than pallet 2 inthe cold storage after packaging (step 1), and the same but to a lesser extent inthe following step (Fig. 4a). Therefore, the temperature inside the boxes onpallet 1 has decreased faster than that of pallet 2 during the first 12 h from theprocessor at Dalvik until the arrival in Reykjavik (steps 1 and 2) (Fig. 4b).Exposure of the pallets to unchilled conditions for over 10 h (step 3) caused asharp increase of product temperature in the top and bottom corner boxes of
14 N.T.T. MAI ET AL.

-20
-15
-10
-5
0
5
10
15
20
10/06/08 12:00 11/06/08 12:00 12/06/08 12:00
Time
Tem
pera
ture
(oC
)
P1_A_T
P2_A_MC
P2_A_T
P1_A_MC
21 3 4 5 6 7a
1.0
1.5
2.0
2.5
3.0
3.5
4.0
4.5
10/06/08 12:00 11/06/08 12:00 12/06/08 12:00
Time
Tem
pera
ture
(oC
)
1 2 3 4 5 6 7
P2_M_Mean
P1_M_Mean
P1_B_Mean
P2_B_MeanP2_T_Mean
P1_T_Mean
b
FIG. 4. AMBIENT TEMPERATURE ON THE BOXES ON THE TOP (T) AND SIDE (MC) OFTHE PALLETS (a), AVERAGE PRODUCT TEMPERATURE INSIDE THE BOXES (b) ANDPRODUCT TEMPERATURE RANGE OF DIFFERENT POSITIONS INSIDE EACH BOX (c)
DURING AIR CARGO STUDY IN JUNE 2008
TEMPERATURE MAPPING OF FRESH FISH SUPPLY CHAINS 15

pallet 1 and in the bottom corner box of pallet 2 (Fig. 4b). It is clear fromFig. 4b that the top corner box of pallet 1 (P1_T_) was more affected than thebottom one (P1_B_), especially from step 3 onward. The temperature in themiddle box of pallet 1 (P1_M_Mean) was more resistant to change comparedwith those in the top and bottom boxes. This result is comparable with the onefound during the mapping in September 2007, and with the results reportedelsewhere (Moureh et al. 2002). Since the central boxes are better insulated tothe ambient air, ambient temperature change affects them to a smaller degreethan the other boxes.
Figure 4c shows the evolution of temperature range between differentheights (top, middle and bottom) of product inside each box. The ranges in thefirst two steps of the boxes on pallet 2 were much higher than on pallet 1. It canbe explained by two reasons. First, it is because the top of boxes on pallet 2 hadlower initial temperature (1.0 to 2.9C) than on pallet 1 (3.3 to 4.2C) (seeFig. 9). Meanwhile, the deeper layers of product inside boxes on pallet 2 hadhigher initial temperature (4.3 to 5.3C) than on pallet 1 (3.7 to 4.3C) (seeFig. 9). It is very likely that the boxes of pallet 2 were packed earlier (with theice mats on top) than those of pallet 1. Second, higher ambient temperature ofpallet 2 during steps 1 and 2 (Fig. 4a) caused slower cooling process for the
0.0
0.5
1.0
1.5
2.0
2.5
3.0
3.5
4.0
10/06/08 12:00 11/06/08 12:00 12/06/08 12:00
Time
Te
mp
era
ture
ra
ng
e (
oC
)
1 2 3 4 5 6 7
c
P1_B_Max-Min
P2_M_Max-Min
P2_B_Max-Min
P1_T_Max-Min
P2_T_Max-Min
P1_M_Max-Min
FIG. 4. CONTINUED
16 N.T.T. MAI ET AL.

product on pallet 2. The temperature behavior of the top corner box of pallet2 (P2_T_Mean, Fig. 4b) showed that the top corner box was very sensitive toenvironmental changes, e.g., when the product was moved from a cold store(step 1) to a chilled store (step 2) and then to unchilled conditions (step 3).Similar results were found in September 2007 and in other studies (Mourehand Derens 2000; Moureh et al. 2002). Colder environment temperature forpallet 1 during the first two steps led to a faster product cooling (Fig. 4b) anddepletion of the temperature range (Fig. 4c) over this time.
Large increase in ambient temperature of pallet 1 from step 1 to 3 and highfluctuation during steps 3 (Fig. 4a) led to an increase in variability of producttemperature (temperature range) of the outer (B and T) boxes on this pallet instep 3 (Fig. 4c). It is understandable because the top product in a box is moresensitive to the environment change than the one in the middle or at the bottomdue to higher thermal diffusivity of air relative to fish, causing the range of insidetemperature to become larger with higher degree of the ambient fluctuation.
The temperature inside the boxes at the beginning of the transportationwas considerably high (up to 4.2C, Fig. 4b). A possible way to decrease theproduct temperature at this stage is to utilize some kind of precooling methods,e.g., a CBC system or precooling in liquid ice.
PCA loadings (Fig. 5) illustrate the correlation between the product tem-perature and the ambient temperature. PC1 explains 73% and PC2 explains
FIG. 5. PRINCIPAL COMPONENT ANALYSIS LOADING PLOT BASED ONTHE AVERAGE WITHIN-STEP TEMPERATURE OF PRODUCT AND
BOX SURFACE DURING AIR CARGO STUDY IN JUNE 2008The dash curved arrow shows the affecting trend of product positions to its temperature.
The dotted ellipse groups the loadings of ambient temperatures on the box surfaces.
TEMPERATURE MAPPING OF FRESH FISH SUPPLY CHAINS 17

18% of the variance. The loadings of inside temperatures of the pallet 1 middlebox, which was the most stable (see Fig. 4b), are located on the positivedirection of PC1, oppositely to the loadings of ambient temperatures on theother side of this PC. The arrow shows the sensitivity trend of inside tempera-ture, depending on the locations inside a box and box positions on a pallet,toward ambient changes. The loadings of temperature on top of product inboxes on pallet 2 (P2_T_t, P2_B_t, and P2_M_t), which were more sensitiveto change compared with other locations, are located closer to variables“ambient.” It is because the top loggers were placed on the top of the fish in theboxes, and were influenced not only by the product surface temperature, butalso by the air headspace condition, which was very sensitive to the outsidetemperature.
It could be seen that the results were comparable to the measurements inSeptember 2007. The overall temperature of the product was noticeably higherin this measurement than in 2007, although the ambient air temperature wasvery similar. A probable explanation is that the precooling period, which theproduct went through in the frozen storage room at the processor in Dalvik,was longer during the measurements in 2007 than in the 2008 trials. The setpoint temperature in the truck during transportation from Dalvik to Reykjavikwas -20C in the measurements of 2007 but 0C in 2008. This resulted in betterprecooling of the product, which was greatly needed, since the product tem-perature before packing was approximately 5C.
These measurements confirm that there are certain critical points whichcan be improved regarding the temperature control in the supply chain fromIceland to the U.K.. Cooling the product below 0C without freezing it isimportant to ensure the highest quality of the fresh product and to make theproduct less sensitive to temperature fluctuations during transportation andstorage.
Air Transportation (Passenger Flight) in July 2008. The mappingresults for the ambient temperature in July 2008 (Fig. 6a) show that theboxes have undergone long temperature abuse from leaving the processorstore to the storage at the destination airport (step 2 to 4), which lasted for29.5 h. This made 46.6% of the total logistics time, which was muchlonger than in the air cargoes in September 2007 and June 2008. The resultsagree with the fact that air transportation of perishable food faces suchunrefrigerated temperature problem for much of its voyage (James et al.2006).
From Fig. 6a,b, it can be seen that small fluctuation of outside tempera-ture in step 1 led to small variability (small range) of temperature inside theboxes. In contrast, high fluctuation of ambient temperature in other steps (steps2 to 4) caused a very large variability of inside temperature, especially for
18 N.T.T. MAI ET AL.

-2
0
2
4
6
8
10
12
14
16
18
20
22
07/07/08 12:00 08/07/08 12:00 09/07/08 12:00
Time
Tem
pera
ture
(oC
)
2 3 4 5
A_M
B_Mean
A_B
A_T
T_Mean
M_Mean
1a
0.0
0.2
0.4
0.6
0.8
1.0
1.2
07/07/08 12:00 08/07/08 12:00 09/07/08 12:00
Time
Te
mp
era
ture
ra
ng
e (
oC
)
1 2 3 4 5b
T_Max-Min
B_Max-Min
M_Max-Min
FIG. 6. AMBIENT AND AVERAGE PRODUCT TEMPERATURE (a), TEMPERATURE RANGEINSIDE THE BOXES (b) AND TEMPERATURE IN THE MIDDLE BOX (c) DURING
PASSENGER AIR FREIGHT STUDY IN JULY 2008
TEMPERATURE MAPPING OF FRESH FISH SUPPLY CHAINS 19

boxes with many free sides such as bottom and top corner boxes. This result iscomparable with the results found for the air freight in June 2008.
The temperature mapping results showed that the product in the bottomcorner box of the pallet was the one most influenced by the ambient, especiallyby high temperature fluctuation during steps 2 (transportation to the airport andstorage at the airport before taking off) and 4 (storage at the airport afterlanding). This was well indicated by the fact that the temperature range betweenthe center and the bottom of the product was large (up to 1.1C) during thesesteps, and the product temperature at end of the studied links was extremely high(4.6C at the secondary processor). The product in the top corner box was thesecond most affected by the environment, particularly with long temperatureabuse from step 2 to step 4, causing large temperature range (0.7C) during thistime and high end temperature (1.6C at the secondary processor). These factspoint out that steps 2, 3 and 4 (i.e., transportation and storage before taking off,during the flight and storage at the destination airport, respectively), where thetemperature was not well controlled, are the hazardous ones in the chain. Itshould be noticed that in this case study, the plane was a passenger aircraft andnot a dedicated freight transport plane, resulting in a need to break the pallet upfor loading the individual boxes in the plane hold before taking off. As apparentfrom Fig. 6a, the ambient temperatures between boxes became clearly distin-guished some hours before the taking off.
-1.0
-0.9
-0.8
-0.7
-0.6
-0.5
07/07/08 12:00 08/07/08 12:00 09/07/08 12:00
Time
Te
mp
era
ture
(oC
)
M-b
M-m
c 1 2 3 4 5
FIG. 6. CONTINUED
20 N.T.T. MAI ET AL.
The product temperature in the middle box was stable throughout thechain with relatively small temperature range between the product locations(<0.2C, Fig. 6b) and with low final temperature (-0.7C, Fig. 6c). Interestingly,the temperature in the center of the product in this box remained constant (at-0.70C) in all the steps (Fig. 6c). Therefore, despite the lack of information onhow the pallet was split and where the boxes have been placed afterward, it isreasonable to speculate that the middle box has been kept surrounded by otherboxes all the time. This is based on the other two air cargo studies in Septem-ber 2007 and June 2008, and on the results of other researchers (Moureh andDerens 2000; Moureh et al. 2002) that the temperature inside middle boxes isleast voluntary to change. Because of high fluctuation in the ambient tempera-ture of the middle box after the pallet breakup (see line A_M in Fig. 6a), it isalso speculated that the side with ambient logger of this box has been exposedto the environment during this time.
The temperature in the center of product in the middle box was muchmore stable (actually kept constant) compared with that of the two previous airfreights. This may be explained by the fact that the EPS boxes in this case wereof 12 kg product, much larger compared with the other freight boxes (of 3 kgproduct). The center product of the middle box in this flight was therefore verywell insulated by the surrounding fillets. It is also because the initial tempera-ture in this case was -0.7C (fillets partially frozen, thanks to the CBC pre-cooling), much lower than in the two freighter aircraft flights (3.8 to 4.6C, withno precooling) (Fig. 9).
The difference in the end temperatures of products from different loca-tions on a pallet again supports the statement above that the products should begrouped by the positions and handled in an appropriate way. The more abusedproducts should be used earlier.
Sea Transportation September 18–23, 2008. The results of the tem-perature mapping showed that the box was kept at low and stable temperature(-0.2 � 0.5) for the whole trip of 4.8 days (Table 1). Starting with relativelyhigh ambient temperature (around 9.3C), the surface of the middle box wascooled down below 0C after about 3 h of containerization (results not shown).
Sea Transportation September 23–29, 2008. Figure 7 shows that thesurface temperature on the middle box (A_M) has decreased very fast, reach-ing a minimum temperature of -18.1C after about 3.3 h of the cold storage atthe producer (step 1). Meanwhile, the top corner (A_T) and the bottom corner(A_B) boxes of the pallet gained their coolest points at -13.5 and -10.3C,respectively, at later time of this step. This indicates that the middle height boxwas located closer to the air blast refrigeration unit than the other two boxesduring step 1. During step 3 (partly chilled hold in Reykjavik), the surface
TEMPERATURE MAPPING OF FRESH FISH SUPPLY CHAINS 21

temperature of the boxes sharply increased due to the turning off of the coolingequipment. In step 4, when the cooling equipment inside the container wasfunctioning, the temperatures of all boxes became stable, maintaining below0C most of the time until the destination.
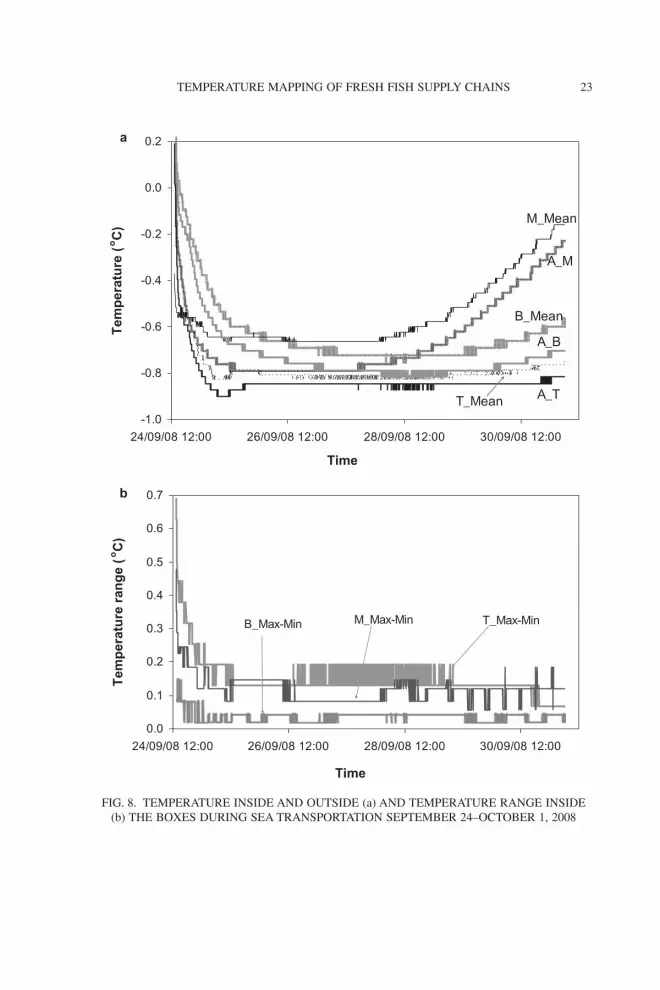
Sea Transportation September 24–October 1, 2008. Figure 8a indi-cates that the temperature of product inside the boxes were very stable com-pared with the air transportation. It is because in the sea freight chain, theboxes were kept in a refrigerated container for the whole trip from processorto the final destination. The temperature difference between the locationsinside a box was also small (�0.2C most of the time) (Fig. 8b) because the fishwas cooled during processing (by liquid and CBC cooling before skinning)and then put with ice on top of the fillets when packed into the EPS boxes.Despite the initial temperature difference of product between inside positionsand between box locations on the pallet (see Fig. 9), all the inside temperaturesdropped below 0C very soon after 2 h of containerization (Fig. 8a). The tem-perature was then maintained stable between -0.9 and 0C for the remaininglogistics process. This makes a clear distinction between sea and air transpor-tations: in the latter case, there are several critical steps where the product issubjected to temperature abuse.
-20
-15
-10
-5
0
5
10
15
23/09/08 00:00 25/09/08 00:00 27/09/08 00:00 29/09/08 00:00
Time
Te
mp
era
ture
(oC
)
A_B
A_M
A_T
1 2 43
FIG. 7. SURFACE TEMPERATURE OF THE TOP CORNER (A_T), MIDDLE (A_M) ANDBOTTOM CORNER (A_B) BOXES ON THE PALLET DURING THE SEA TRANSPORTATION
STUDY ON SEPTEMBER 23–29, 2008
22 N.T.T. MAI ET AL.
-1.0
-0.8
-0.6
-0.4
-0.2
0.0
0.2
24/09/08 12:00 26/09/08 12:00 28/09/08 12:00 30/09/08 12:00
Time
Tem
pera
ture
(oC
)
M_Mean
A_M
B_Mean
A_B
A_TT_Mean
a
0.0
0.1
0.2
0.3
0.4
0.5
0.6
0.7
24/09/08 12:00 26/09/08 12:00 28/09/08 12:00 30/09/08 12:00
Time
Te
mp
era
ture
ra
ng
e (
oC
)
b
T_Max-MinM_Max-MinB_Max-Min
FIG. 8. TEMPERATURE INSIDE AND OUTSIDE (a) AND TEMPERATURE RANGE INSIDE(b) THE BOXES DURING SEA TRANSPORTATION SEPTEMBER 24–OCTOBER 1, 2008
TEMPERATURE MAPPING OF FRESH FISH SUPPLY CHAINS 23

The inside and outside temperatures of each box behave similarly. Thiscan be seen from Fig. 8a where the temperature curves of each box are closerto each other than to the curves of other boxes. For a long period (more than2 days), the temperatures inside and outside the bottom corner box were higherthan those at the top corner and in the middle of the pallet. The surfacetemperature of the bottom box reached 0C just after 1 h of operation, whereasit took only about 20 min for the top corner box to be cooled down to thistemperature. The temperature inside the top corner box of the pallet was thefastest to change. This is comparable with the results from the air chains aboveand from other studies (Moureh and Derens 2000; Moureh et al. 2002) that thetop corner box is very sensitive to the environment conditions.
Comparison between the Freights
Initial Temperature Inside and Outside the Boxes. Figure 9 showsthat, normally, the initial temperature of product in a box, or on a pallet, is noteven. Due to the insulation of the package and surrounding boxes, the productis very difficult to be cooled down after being packed. A good solution would beto use some superchilling technique, e.g., a CBC system or slurry ice,to chill the product before packing. In the experiments in July 2008 (passengerflight) and September 2008 (shipping), the product was prechilled by CBC
-1
0
1
2
3
4
5
6
B M TC TM B M TC TM B M TC B M TC B M TC B M TC
Box position
Pro
du
ct
tem
pe
ratu
re (
oC
)
-25
-20
-15
-10
-5
0
5
10
15
20
Am
bie
nt
tem
pe
ratu
re (
oC
)
Bottom
Center
Top
Ambient
P1-Sep 07 P2-Sep 07 P1-June 08 P2-June 08 July 08 24 Sep 08
Air freight chains Shipping
A_MC
FIG. 9. INITIAL TEMPERATURE AT DIFFERENT POSITIONS INSIDE AND ON THESURFACE OF BOXES PLACED AT THE BOTTOM CORNER (B), MIDDLE (M), TOP
CORNER (TC) AND TOP CENTER (TM) OF EACH PALLET (P1, PALLET 1; P2, PALLET 2);AMBIENT TEMPERATURE ON THE SIDE OF PALLETS IS SHOWN AS A_MC
24 N.T.T. MAI ET AL.

cooling; therefore, its initial temperature (-0.6 to 0.6C) was much lower than inthe other two air freights where the initial temperature was as high as 5.5C.
In most cases, the initial temperature on top of product is the lowest, andthe one at the bottom is the highest. It is understandable because either ice mats(in September 2007 and June 2008) or ice (in September 2008) were placed ontop of the product when packaged into boxes. There are some exceptionalcases, such as the bottom corner box (B) of pallet 1 in September 2007 and topcorner (TC) box of pallet 1 in June 2008, where the highest temperature wason the top of product. It may be because these products have been exposed tounchilled conditions for rather long time before the ice mats were put on topand the temperature recording started.
Ambient Temperature of the Freights. The mean and standard devia-tion of box surface temperature in each step of the trips and in each trip areshown in Table 1.
A clear distinction between the surface temperature of sea and air freightswas observed. The temperature in sea transportation was well below 0C andwith smaller deviation, whereas in the air trips, it was much higher and withlarger variation. The passenger flight yielded the highest average temperature onthe boxes; this is because they became more exposed to the surroundings afterthe pallet splitting. Furthermore, the difference in surface temperature betweenpallets 1 and 2 as previously mentioned can also be clearly observed in this table.
Statistical Test Results Regarding the Effect of Different Factors onthe Temperature. The statistical test results shown in Table 2 indicate thatthe null hypothesis, i.e., that product locations, box positions and chain stepshave no influence on the temperature of product and box surface, is rejected.The average product temperatures over the whole logistics period at differentlocations inside each of the boxes, except for the top corner box of pallet 1(P1_T) in June 2008, are significantly different (P < 0.001). For box P1_T inJune 2008, only top temperature is different (P < 0.001) from the other parts inthe box (see rows “Location”). The difference in product temperaturesbetween the inside box positions is not the same for all the steps in the threeair freights (P < 0.001 for all the studied boxes of the air freights, see rows“Location*Step”). The average product temperature inside each box is signifi-cantly different between the steps in the three air freights (P < 0.001 for all thestudies boxes of the air freights, see rows “Step”).
The inside-box product mean temperatures (named as inside mean) overthe whole logistics are significantly different between the boxes of a trip(P < 0.001 for all the boxes, see rows “Location” – column “Inside Mean”),meaning that the product temperature depends on the locations of boxes duringthe logistics. The difference in inside mean temperature between the box
TEMPERATURE MAPPING OF FRESH FISH SUPPLY CHAINS 25

TAB
LE
2.ST
AT
IST
ICA
LT
EST
RE
SULT
SFO
RT
HE
EFF
EC
TO
FPR
OD
UC
TL
OC
AT
ION
SIN
SID
EA
BO
X,B
OX
POSI
TIO
NS
ON
APA
LL
ET
AN
DL
OG
IST
ICS
STE
PSO
NT
HE
PRO
DU
CT
AN
DB
OX
SUR
FAC
ET
EM
PER
AT
UR
ES
Frei
ght
P1_T
MP1
_TC
P1_B
P1_M
P2_T
MP2
_TC
P2_B
P2_M
Insi
deM
ean
A
Air
_Sep
2007
Loc
atio
nF
617.
387
.41,
222.
613
,506
.34,
067.
81,
921.
952
.425
,021
.84,
796.
712
.5df
1.0
1.1
1.2
1.3
1.0
1.1
1.1
1.0
3.1
1.8
1,47
6.1
1,56
7.7
1,69
0.9
1,87
0.2
1,42
2.0
1,50
8.1
1,53
8.5
1,42
2.0
4,40
8.0
2,51
7.8
P<0
.001
<0.0
01<0
.001
<0.0
01<0
.001
<0.0
01<0
.001
<0.0
01<0
.001
<0.0
01D
iffe
renc
e*t,
m,b
t,m
,bt,
m,b
t,m
,bm
,bt,
m,b
t,m
,bm
,bA
ll8
boxe
sP2
_A_T
Loc
atio
n*
Step
F51
6.5
1,09
6.1
1,43
4.6
1,96
3.7
1,18
4.3
580.
317
6.9
3,10
2.7
1,75
9.7
332.
8df
11.4
12.1
13.1
14.5
11.0
11.7
11.9
11.0
34.1
19.5
P<0
.001
<0.0
01<0
.001
<0.0
01<0
.001
<0.0
01<0
.001
<0.0
01<0
.001
<0.0
01St
epF
698.
185
8.8
1,29
0.9
3,04
4.4
1,17
8.1
879.
522
1.3
2,13
4.4
829.
01,
275.
5df
1111
1111
1111
1111
1111
P<0
.001
<0.0
01<0
.001
<0.0
01<0
.001
<0.0
01<0
.001
<0.0
01<0
.001
<0.0
01A
ir_J
une
2008
Loc
atio
nF
140.
946
2.5
334.
037
0.5
598.
287
5.4
839.
810
3.5
df1.
11.
31.
91.
01.
01.
12.
22.
624
8.8
304.
045
1.8
235.
023
5.0
262.
052
0.6
607.
1P
<0.0
01<0
.001
<0.0
01<0
.001
<0.0
01<0
.001
<0.0
01<0
.001
Dif
fere
nce*
tb,
m,t
b,m
,tm
,tm
,tb,
m,t
All
6bo
xes
P1_A
_T,
P1_A
_MC
Loc
atio
n*
Step
F14
8.7
79.8
108.
423
6.1
317.
718
1.1
283.
615
9.4
df6.
47.
811
.56.
06.
06.
713
.315
.5P
<0.0
01<0
.001
<0.0
01<0
.001
<0.0
01<0
.001
<0.0
01<0
.001
Step
F47
.156
.336
8.2
79.4
414.
658
.659
.814
8.2
df6
66
66
66
6P
<0.0
01<0
.001
<0.0
01<0
.001
<0.0
01<0
.001
<0.0
01<0
.001
26 N.T.T. MAI ET AL.

TA
BL
E2.
CO
NT
INU
ED
Frei
ght
P1_T
MP1
_TC
P1_B
P1_M
P2_T
MP2
_TC
P2_B
P2_M
Insi
deM
ean
A
Air
_Jul
y20
08L
ocat
ion
F3,
277.
41,
417.
23,
558.
425
,286
.01,
928.
0df
1.0
1.0
1.0
1.0
1.9
1,67
6.0
1,67
6.0
1,67
6.0
1,73
8.3
3,17
9.7
P<0
.001
<0.0
01<0
.001
<0.0
01<0
.001
Dif
fere
nce*
b,m
b,m
b,m
All
3bo
xes
A_B
,A_M
,A
_TL
ocat
ion
*St
epF
688.
31,
162.
087
9.5
5,11
8.6
1,15
0.4
df4.
04.
04.
04.
17.
6P
<0.0
01<0
.001
<0.0
01<0
.001
<0.0
01St
epF
13,9
97.1
5,72
6.1
879.
57,
494.
52,
652.
8df
44
44
4P
<0.0
01<0
.001
<0.0
01<0
.001
<0.0
01Se
a_Se
p24 20
08
Loc
atio
nF
6,87
8.3
350.
63,
592.
22,
153.
16,
592.
3df
1.5
1.0
1.3
1.2
1.5
2,93
9.5
1,92
7.0
2,43
1.9
2,35
3.7
14,0
68.0
P<0
.001
<0.0
01<0
.001
<0.0
01<0
.001
Dif
fere
nce*
b,m
,tb,
mb,
m,t
All
3bo
xes
A_B
,A_M
,A
_T
*Loc
atio
n(s)
whe
reth
em
ean
tem
pera
ture
sis
/are
sign
ifica
ntly
diff
eren
t.
TEMPERATURE MAPPING OF FRESH FISH SUPPLY CHAINS 27

locations is not the same for all the steps in the three air freights (P < 0.001 forall the boxes of the air freights, see rows “Location*Step” – column “InsideMean”). The average of inside mean temperatures of all the boxes in a trip issignificantly different between the steps (P < 0.001 for all the three air freights,see rows “Step” – column “Inside Mean”).
The average ambient temperatures (measured on the box surfaces) aredifferent between the box locations on a pallet (P < 0.001 for all the four abovefreights, see rows “Location” – column “A”). For example, for the air trip inSeptember 2007, the temperature on top of pallet 2 (P2_A_T) differs signifi-cantly from the temperatures measured on the sides of pallets 1 (P < 0.001, notshown in Table 2) and 2 (P < 0.001, not shown in Table 2). The difference inambient temperatures between the box locations is not the same for all thesteps (P < 0.001 for all the three air freights, see rows “Location*Step” –column “A”). The average ambient temperature from all the surface loggers ofeach trip is significantly different between the steps (P < 0.001 for all the threeair freights, see rows “Step” – column “A”).
Predicted RSL of the Product from Different Freights. Figure 10gives an overview on all the three air and one sea trips regarding total used
0
1
2
3
4
5
6
7
8
9
10
B M TC TM B M TC TM B M TC B M TC B M TC B M TC B M TC
Box position
Us
ed
tim
e a
nd
RS
L (
d)
-2
-1
0
1
2
3
4
5
6
7
8
9
10
Te
mp
era
ture
(oC
)
RSL0_b RSL0_m RSL0_t Temp_b Temp_m Temp_t
RSL5_b RSL5_m RSL5_t Ambient Used time
P1-June 08
24 Sep 08
Air freights Shipping
July 08
HaddockIf it had
been cod
A_MC
P1-Sep 07 P2-Sep 07
P2-June 08
FIG. 10. TOTAL USED TIME FROM CATCH AND PREDICTED REMAINING SHELF LIFE(RSL) OF PRODUCT AT 0C (RSL0) AND 5C (RSL5)
The average ambient and product temperatures over the whole logistics from different pallets (P1,P2), box positions on a pallet (B, M, TC, and TM), and locations inside a box (b, m, and t) are alsoshown. A_MC means the temperature on the side of a pallet. The three lines of predicted RSL at 5C
(RSL5_b, _m, and_t) are almost identical on the graph.
28 N.T.T. MAI ET AL.

time, predicted RSL and (average) temperatures of product and box surface. Ofthe three air freights, the September 2007 batch had the longest logistics. Theproduct in June 2008 had the highest average temperature, but the shortestused time (less than 5 days). The July 2008 trip has undergone the most severeabuse by outside temperature, but with relatively low average product tem-perature. The sea trip during September 24–October 1, 2008 took the longesttime, but was the best regarding temperature control. The temperatures of bothenvironment and product therein were the lowest (below 0C).
Although the product in the sea trip was kept at a very low and stabletemperature, it has traveled for a long time, taking almost 7 days (or 10 totalused days from catch). That explains why it has the shortest predicted RSL ofless than 5 days. The short RSL of the sea freight verifies the fact that thequality of perishable product decreases apparently with time even underoptimal conditions (Pawsey 1995).
The air September 2007 samples have the second shortest predicted RSL.It is because the trip was quite long (almost 4 days, total used time around7 days) and the initial product temperature was high (up to 5.5C, see Fig. 9).This reveals the importance of precooling the product before packing. It hasalso been reported by others (James et al. 2006) that precooling productsbefore transportation is essential. The air June 2008 samples have relativelylong RSL due to short logistics (1.7 days).
The air July 2008 product also has long RSL because its temperature wasrelatively low. This once again indicates how important the precooling is. Theproduct of this set was cooled in a CBC cooler before packing into EPS boxes.
Difference in the predicted RSL between product and box locations andbetween pallets of the same trips indicates that the samples have differenttemperature evolutions.
It should be mentioned that the end product temperature of many mea-surements was considerably high, 2.2–3.3C and some up to 4.6C (i.e., higherthan rejection limit upon reception at most retailers which is 4C). The productwas then kept in retailer and home refrigerators where it could hardly bechilled down to 0C. This is because the temperature in retail cabinets andhousehold refrigerators is usually high (Laguerre et al. 2002; Kennedy et al.2005), e.g., average 6.6C in home refrigerators in France (Laguerre et al.2002). These may dramatically reduce the shelf life of the fish. This can clearlybe seen from Fig. 10 when comparing the predicted RSL of the same productlocation at temperatures 0 and 5C. For example, for the product in the topcorner box (TC) of pallet 2 in the June 2008 study, the RSL is more likelybelow 2 days at 5C, instead of around 7.5 days at 0C, because the producttemperature in this box at the logistics end was considerably high (about 3C,see Fig. 4b). Another example is the product in the bottom corner box (B) inJuly 2008; the RSL of haddock is very likely below 1.5 days at 5C, rather than
TEMPERATURE MAPPING OF FRESH FISH SUPPLY CHAINS 29

above 6 days at 0C since the final temperature was very high (4.6C, seeFig. 6a).
The PCA bi-plot (Fig. 11) shows the ability to discriminate between theproducts of different trips based on the time–temperature history. A total of89% of the variance is explained by the first two PC, 60% by PC1 and 29% byPC2. The right-hand side of PC1 represents the total used time of the logistics.Samples located more to the positive part of PC1 and closer to the variable“UsedTime,” e.g., the product from the sea trip in September–October 2008,have undergone longer logistics time. The lower left quarter of the plot rep-resents the RSL, samples placed to the left of PC1 and closer to variable“RSL,” e.g., the product from the air trip in July 2008, have longer RSL.
For the air trip in September 2007, the product in the bottom corner box(Sep07_P1_B_) had high initial temperature (4.5 to 5.5C, Fig. 9), located closeto the variable “Initial_Temp” on the positive direction of PC2 (Fig. 11). Theproduct of this box has been more exposed to high ambient temperature, thesamples Sep07_P1_B_t; Sep07_P1_B_m; and Sep07_P1_B_b located moretoward the variables “Final_Temp” and “Average_Temp” compared with other
FIG. 11. PRINCIPAL COMPONENT ANALYSIS BI-PLOT BASED ON ALL THETEMPERATURE MEASUREMENTS AND PREDICTED REMAINING SHELF LIFE (RSL)
FROM THREE AIR AND ONE SEA SHIPMENTS FOR COD LOINSSample scores are labeled with time or transport mode of the trip_(pallet number)_box
position_product location. Loadings of variables RSL; total used time (UsedTime); average ambienttemperature (Ambient); initial (Initital_Temp), final (Final_Temp), and average within product
location (Average_Temp) temperatures are shown in rectangular. Dotted ellipses group the samplesof the same trips. The same symbol of the samples shows similarity in RSL: the circles indicate agroup of samples with the RSL of 4.2–4.7 days; the squares for group with RSL of 5.2–6.0 days;
the triangle with RSL of 7.2 days; and the hexagons for the RSL of 7.3–8.3 days at 0C.
30 N.T.T. MAI ET AL.

samples in the cluster “September 2008” (Fig. 11). This statement can beverified by the product temperature of this box against others: the averagetemperature was 1.7 to 1.8C against 0.3 to 1.1C of other boxes in this trip(Fig. 10), and the final temperature was 2.6C in contrast to 0.2 to 1.8C in otherboxes (Fig. 2b). Thus, the product of this bottom corner box has shorter RSLthan of others (4.6 to 4.7 days versus 5.2 to 6.0 days, Fig. 10).
The July 2008 trip samples have undergone most ambient temperaturefluctuations, located very close to the variable “Ambient.” Furthermore,samples of different box positions are differed on the bi-plot relatively to thisvariable, meaning that they were exposed to very different ambient conditionsduring the whole trip (see also Fig. 6a). This interesting point has already beendiscussed above, considering the fact that the pallet was broken up in thispassenger flight.
Overall, the predicted RSL and PCA results (Figs. 10 and 11) support theneed to continuously monitor time and temperature history of product (Gian-nakourou et al. 2005). Long exposure to high temperature also facilitates thepathogens to growth (Raab et al. 2008) which causes food safety problems. Tobetter manage the fish quality and safety, it is useful to apply some techniquesuch as temperature loggers, time temperature indicator labels, radio fre-quency identification tags with the temperature sensor and time recorder andso forth on or inside the packaged product. Heat transfer modeling of indi-vidual and palletized EPS boxes containing fresh fish, similar to the modelingof frozen fish pallets by Moureh and Derens (2000) and Moureh et al. (2002),would be useful to predict product temperatures under dynamic ambient con-ditions as described in the current study. The models could even be used forimproving packaging design in order to decrease the negative effect of ambienttemperature fluctuations on product temperature.
Furthermore, trade-off between modes of transportation should be madebased on: the quality and safety perspective regarding time–temperaturehistory, customer requirement on delivery time, economic efficiency related tocost of transport, cost of more efficient packaging and weight against theresulting overall environmental impacts.
Air transportation is quick, but with several hazardous steps duringground and flight operations regarding temperature abuse. Precooling theproduct before packing shows to be necessary to minimize the negative effectof abusive temperature, especially during passenger flights where boxes aremore exposed to the environment due to the splitting up of pallets. Freighteraircraft flights are more fuel efficient than passenger flight but are affectedmore by fuel prices than passenger aircraft operators since their fuel cost is amuch larger part of total expenses (Morrell 2008).
Sea transportation is considered as a cheaper but slower means of trans-port. The product temperature is well controlled during the whole logistics
TEMPERATURE MAPPING OF FRESH FISH SUPPLY CHAINS 31

inside refrigerated containers. While air transport has several strong, but shortlasting, effects on the global temperature, shipping emissions have a coolingeffect on climate that lasts 30–70 years due to very high emissions of SO2 andNOx, but with dominating warming effect in the long term because of signifi-cant amounts of CO2 emitted (CICERO 2008).
CONCLUSION
Abusive temperature during air freighting causes fluctuation and/or riseof product temperature inside boxes, especially in those with more free sidessuch as at top corner of the pallets. The more temperature around the boxesfluctuates, the larger the temperature range inside the packaged productbecomes. Temperature on top of product inside the EPS boxes is more sensi-tive to environment changes than those deeper in the box. Thus, groupingproducts according to their positions during transportation is useful for furthermanagement of the resource.
There are several critical steps found in air freighting, especially inpassenger flight, including the flight itself, loading/unloading operations andholding storage at unchilled conditions. This reveals the importance of pre-cooling the product before packing. Temperature during sea transportation inrefrigerated containers is well maintained at low temperature. However, longshipment time causes a relatively short RSL of product in sea freight. Thisindicates that the trade-off between transportation modes would need to bebased on several aspects such as quality and safety, available time to reachmarket as well as differential costing of transport (air versus ship) and theresulting environmental impact for the different options.
NOMENCLATURE
P palletA ambient (box surface)T or TC top corner box of a palletTM top center (top middle) box of a palletMC middle side box: box at the middle of a pallet sideM middle box: box in the middle of a palletB bottom corner box of a pallett top of product inside a boxm middle of product inside a boxb bottom of product inside a boxMean average, e.g., temperature average
32 N.T.T. MAI ET AL.

Max maximumMin minimumMax–Min range, e.g., temperature rangeRSL remaining shelf lifePCA principal component analysisEPS expanded polystyrene
ACKNOWLEDGMENTS
This work was carried out at Matis ohf as a part of the ongoing sixframework EU-funded project called CHILL-ON (project no. FP6-016333-2)and of the Icelandic project Hermun kæliferla (Thermal modeling of chillingand transportation of fish). The latter project is funded by AVS R&D Fund ofMinistry of Fisheries in Iceland, Technology Development Fund of The Ice-landic Centre for Research and University of Iceland Research Fund. Theauthor, Nga Thi Tuyet Mai, would like to thank the United Nations University-Fisheries Training Programme for a PhD scholarship granted.
REFERENCES
ATP. 2007. Agreement on the International Carriage of Perishable Foodstuffsand on the Special Equipment to Be Used for Such Carriage, p. 82, TheUnited Nations Economic Commission for Europe (UNECE), Geneva.
BRECHT, J.K., CHAU, K.V., FONSECA, S.C., OLIVEIRA, F.A.R., SILVA,F.M., NUNES, M.C.N. and BENDER, R.J. 2003. Maintaining optimalatmosphere conditions for fruits and vegetables throughout the posthar-vest handling chain. Postharvest Biol. Technol. 27(1), 87–101.
BRO, R. and SMILDE, A.K. 2003. Centering and scaling in componentanalysis. J Chemometrics 17, 16–33.
CICERO. 2008. Road emissions dominate global transport emissions. Sci-enceDaily, November 28. Centre for International Climate and Environ-mental Research (CICERO). http://www.sciencedaily.com (accessedApril 29, 2009).
DALGAARD, P. 2002. Modelling and predicting the shelf-life of seafood. InSafety and Quality Issues in Fish Processing (H.A. BREMNER, ed.) pp.191–219, Woodhead Publishing Ltd, London, U.K.
DALGAARD, P., BUCH, P. and SILBERG, S. 2002. Seafood spoilage pre-dictor – development and distribution of a product specific applicationsoftware. Int. J. Food Microbiol. 73, 227–233.
TEMPERATURE MAPPING OF FRESH FISH SUPPLY CHAINS 33

DTU-AQUA. 2008. Introduction to relative rate of spoilage (RRS) models.Seafood Spoilage and Safety Predictor (SSSP) ver. 3.0. National Instituteof Aquatic Resources (DTU Aqua). http://sssp.dtuaqua.dk/HTML_Pages/Help/English/RRS/RRS-intro/rrs.htm (accessed April 30, 2009).
FAO. 2009. Utilization and trade. Fisheries Issues. FAO Fisheries and Aquac-ulture Department, Rome. http://www.fao.org/fishery/topic/2888/en(accessed April 28, 2009)
GIANNAKOUROU, M.C., KOUTSOUMANIS, K., NYCHAS, G.J.E. andTAOUKIS, P.S. 2005. Field evaluation of the application of time tem-perature integrators for monitoring fish quality in the chill chain. Int. J.Food Microbiol. 102(3), 323–336.
JAMES, S.J., JAMES, C. and EVANS, J.A. 2006. Modelling of food trans-portation systems – a review. Int. J. Refrig. 29(6), 947–957.
JEDERMANN, R., RUIZ-GARCIA, L. and LANG, W. 2009. Spatial tempera-ture profiling by semi-passive RFID loggers for perishable food transpor-tation. Comput. Electron. Agric. 65(2), 145–154.
JOL, S., KASSIANENKO, A., WSZOL, K. and OGGEL, J. 2005. Issues intime and temperature abuse of refrigerated foods. In Food Safety Maga-zine, December 2005, Target Group.
KENNEDY, J., JACKSON, V., BLAIR, I.S., MCDOWELL, D.A., COWAN,C. and BOLTON, D.J. 2005. Food safety knowledge of consumers andthe microbiological and temperature status of their refrigerators. J. FoodProt. 68(7), 1421–1430.
LAGUERRE, O., DERENS, E. and PALAGOS, B. 2002. Study of domesticrefrigerator temperature and analysis of factors affecting temperature: AFrench survey. Int. J. Refrig. 25(5), 653–659.
LAURIN, E. 2001. Étude de divers systèmes de refroidissement applicablesaux asperges et aux fraises ayant subi un stress thermique lors du trans-port aerien. In Département des sols et de génie agroalimentaire. Facultédes études supérieures, p. 59, l’Université Laval.
MORRELL, P. 2008. The environmental impact of air cargo. In ExecutiveConference & Annual General Meeting (EC/AGM) 2008, P. 13, TheInternational Air Cargo Association (TIACA), Copenhagen, Denmark.http://www.tiaca.org/images/TIACA/PDF/The%20Environmental%20Impact%20of%20Air%20Cargo.pdf (accessed April 19, 2009)
MOUREH, J. and DERENS, E. 2000. Numerical modelling of the temperatureincrease in frozen food packaged in pallets in the distribution chain. Int.J. Refrig. 23(7), 540–552.
MOUREH, J., LAGUERRE, O., FLICK, D. and COMMERE, B. 2002.Analysis of use of insulating pallet covers for shipping heat-sensitivefoodstuffs in ambient conditions. Comput. Electron. Agric. 34(1–3),89–109.
34 N.T.T. MAI ET AL.

NUNES, M.C.N., EMOND, J.P. and BRECHT, J.K. 2003. Quality of straw-berries as affected by temperature abuse during ground, in-flight andretail handling operations. In International Conference on Quality inChains. An Integrated View on Fruit and Vegetable Quality (L.M.M.Tijskens and H.M. Vollebregt, eds.) pp. 239–246, Acta Hort. (ISHS),Wageningen, The Netherlands.
OLAFSDOTTIR, G., LAUZON, H.L., MARTINSDOTTIR, E. and KRIST-BERGSSON, K. 2006a. Influence of storage temperature on microbialspoilage characteristics of haddock fillets (Melanogrammus aeglefinus)evaluated by multivariate quality prediction. Int. J. Food Microbiol.111(2), 112–125.
OLAFSDOTTIR, O.G., LAUZON, H.L., MARTINSDOTTIR, E., OEHLEN-SCHLAGER, J. and KRISTBERGSSON, K. 2006b. Evaluation of shelflife of superchilled cod (Gadus morhua) fillets and the influence oftemperature fluctuations during storage on microbial and chemicalquality indicators. J. Food Sci. 71(2), S97–S109.
PAWSEY, R.K. 1995. Preventing losses and preserving quality in foodcargoes. In Food, Nutrition and Agriculture - 15 - Food Safety and Trade(J.L. Albert, ed.) Food and Agriculture Organization (FAO) of the UnitedNations, Rome.
RAAB, V., BRUCKNER, S., BEIERLE, E., KAMPMANN, Y., PETERSEN,B. and KREYENSCHMIDT, J. 2008. Generic model for the prediction ofremaining shelf life in support of cold chain management in pork andpoultry supply chains. J. Chain Netw. Sci. 8(1), 59–73.
REDIERS, H., CLAES, M., PEETERS, L. and WILLEMS, K.A. 2009. Evalu-ation of the cold chain of fresh-cut endive from farmer to plate. Posthar-vest Biol. Technol. 51(2), 257–262.
SIMPSON, R., ALMONACID, S., ACEVEDO, C. and CORTES, C. 2003.Mathematical model to predict effect of temperature abuse in mapsystems applied to pacific hake (Merluccius australis). J. Food ProcessEng. 26(5), 413–434.
VANNUCCINI, S. 2004. Overview of Fish Production, Utilization, Consump-tion and Trade: Based on 2002 Data, FAO, Fishery Information, Dataand Statistics Unit, Rome.
WANG, T., SVEINSDÓTTIR, K., MAGNÚSSON, H. and MARTINSDÓT-TIR, E. 2008. Combined application of modified atmosphere packagingand superchilled storage to extend the shelf life of fresh cod (Gadusmorhua) loins. J. Food Sci. 73(1), S11–S19.
TEMPERATURE MAPPING OF FRESH FISH SUPPLY CHAINS 35