Tapering for Strength-Power Individual Event and Team Sport ...
205
East Tennessee State University Digital Commons @ East Tennessee State University Electronic eses and Dissertations Student Works 8-2016 Tapering for Strength-Power Individual Event and Team Sport Athletes Caleb Bazyler East Tennessee State University Follow this and additional works at: hps://dc.etsu.edu/etd Part of the Sports Sciences Commons is Dissertation - Open Access is brought to you for free and open access by the Student Works at Digital Commons @ East Tennessee State University. It has been accepted for inclusion in Electronic eses and Dissertations by an authorized administrator of Digital Commons @ East Tennessee State University. For more information, please contact [email protected]. Recommended Citation Bazyler, Caleb, "Tapering for Strength-Power Individual Event and Team Sport Athletes" (2016). Electronic eses and Dissertations. Paper 3089. hps://dc.etsu.edu/etd/3089
-
Upload
khangminh22 -
Category
Documents
-
view
2 -
download
0
Transcript of Tapering for Strength-Power Individual Event and Team Sport ...

East Tennessee State UniversityDigital Commons @ East
Tennessee State University
Electronic Theses and Dissertations Student Works
8-2016
Tapering for Strength-Power Individual Event andTeam Sport AthletesCaleb BazylerEast Tennessee State University
Follow this and additional works at: https://dc.etsu.edu/etd
Part of the Sports Sciences Commons
This Dissertation - Open Access is brought to you for free and open access by the Student Works at Digital Commons @ East Tennessee StateUniversity. It has been accepted for inclusion in Electronic Theses and Dissertations by an authorized administrator of Digital Commons @ EastTennessee State University. For more information, please contact [email protected].
Recommended CitationBazyler, Caleb, "Tapering for Strength-Power Individual Event and Team Sport Athletes" (2016). Electronic Theses and Dissertations.Paper 3089. https://dc.etsu.edu/etd/3089
Tapering for Strength-Power Individual Event and Team Sport Athletes
_____________________
A dissertation
presented to
the faculty of the Department of Exercise and Sport Science
East Tennessee State University
In partial fulfillment
of the requirements for the degree
Doctor of Philosophy in Sport Physiology and Performance
_____________________
by
Caleb Daniel Bazyler
August 2016
_____________________
Satoshi Mizuguchi, Ph.D., Chair
Kimitake Sato, Ph.D.
Ashley A. Kavanaugh, Ph.D.
Brad H. DeWeese, Ed.D.
Michael H.Stone, Ph.D.
Keywords: peaking, overreach, track and field, volleyball, weightlifting

2
ABSTRACT
Tapering for Strength-Power Individual Event and Team Sport Athletes
by
Caleb Daniel Bazyler
The overall purpose of this dissertation was to address mechanistic and performance changes
following a peaking phase in individual event and team sport strength-power athletes. This
purpose was addressed by conducting 4 separate investigations with track and field athletes,
volleyball athletes, and a national level weightlifter. The following are the primary findings from
these investigations. Division I collegiate throwers increased competition throwing performance,
jumping performance, and preserved muscle architecture characteristics following an overreach
and taper. There were moderate decreases in division I female collegiate volleyball athlete’s
vastus lateralis muscle thickness with no statistical changes in jumping performance following a
taper with no prior overreach in. There were moderate to very large differences in
countermovement jump height supercompensation during the peaking phase in favor of the
returners over the new players on a similar team of female volleyball athletes. Changes in serum
concentrations of inflammatory, hypertrophic and endocrine markers corresponded with
alterations in training volume-load and partially explained changes in jump, dynamic mid-thigh
pull, and weightlifting performance following multiple competition phases in a national level
weightlifter. Additionally, vastus lateralis cross-sectional area can be maintained following a
competition phase in a high level weightlifter provided large changes in body mass are not
attempted close to competition. The findings of these investigations support the use of overreach
and tapering for strength-power athletes and provide an underlying biochemical, morphological,
and biomechanical basis for the observed changes in performance.

3
Copyright © 2016 Caleb D. Bazyler
All Rights Reserved

4
DEDICATION
This dissertation is dedicated to my LORD and Savior, Jesus Christ who loved us and
gave himself for us to redeem from all wickedness and to purify for himself a people that are His
very own, eager to do what is good. At times I felt overwhelmed by work and other obligations
and have felt distant from you, but where can I go from your Spirit? Where can I flee from your
presence? If I go up to the heavens, you are there; if I make my bed in the depths, you are there.
If I rise on the wings of the dawn, if I settle on the far side of the sea, even there your hand will
guide me, your right hand will hold me fast. God, your Spirit has guided me, whether I turn to
the right or to the left I hear your voice behind me saying this is the way, walk in it. I only pray
that you take everything away from me that wants to boast in myself for any accomplishments
you have given me. May I never boast except in the cross of my Lord Jesus Christ!

5
ACKNOWLEDGEMENTS
I would like to first thank my beautiful wife, Alina, who has been by my side this entire
time. She has been patient, kind, supportive, and loving through all my studies over the years.
Alina, you are a wonderful wife and mother to our little Elle. I look forward to spending the rest
of our life together and into eternity! “Glorify the Lord with me, let us exalt His name together!”
(Psalm 34:3). Little Elle, even though I have only known you for 7 months, you have changed
my life! I love you so much! I can’t imagine life without you and I am so excited to see how God
is going to use you to glorify Himself. Every night I pray that God would give you a love for
Himself that far surpasses anything else.
I would like to thank my parents, Simon and Laura, who have always been very
supportive through the years and are wonderful grandparents. My younger brothers, Josh, Ben,
and Josiah, I love you guys (now that I am older, haha), and I am so thankful God has changed
your lives and is using you to advance His kingdom.
Thank you to Dr. Mizuguchi for all your editing and advice throughout this whole
process. You have been very helpful and I look forward to working together in the future. To the
rest of my committee members (Dr. Sato, Dr. Kavanaugh, Dr. DeWeese, Dr. Stone), thank you
for the time you have spent editing my dissertation and teaching me inside and outside the
classroom. I am very grateful for all the time you all have devoted to teaching me over the years.
Also, special thanks to Dr. Breuel and Dr. Zourdos for the help with analyzing/interpreting the
blood markers we examined.
I would also like to thank the subject who volunteered for the case study. You endured a
lot of training and testing during an already busy school and work schedule. You did a fantastic
job, and always had a great attitude. Thank you so much for all of your hard work. Also thank

6
you to the sport science staff and coaches who helped with all the data collection over the 10
months for this study! You guys are awesome.
Thank you to all the sport science masters and doctoral students who have given me
advice and supported me during my time here at ETSU. I look forward to working with you guys
in the future.
Lastly, I want to acknowledge the only one who deserves all the credit: Jesus you are my
life, breath, and everything I need. I couldn’t have made it this far unless your hand were with
me. I pray that you continue to guide me throughout the rest of my career and keep me mindful
of what really matters: Your Word and the Souls of Man. Lord, you must become and I must
become less!

7
TABLE OF CONTENTS
Page
ABSTRACT .....................................................................................................................................2
DEDICATION .................................................................................................................................4
ACKNOWLEDGEMENTS .............................................................................................................5
LIST OF TABLES .........................................................................................................................12
LIST OF FIGURES .......................................................................................................................13
Chapter
1. INTRODUCTION .....................................................................................................................14
Dissertation Purposes ...............................................................................................................16
Operational Definitions ............................................................................................................17
2. REVIEW OF THE LITERATURE ...........................................................................................19
Peaking Phase Components .....................................................................................................20
Training Load...............................................................................................................20
Pre-Taper Overreach ....................................................................................................22
Taper ............................................................................................................................26
Confounding Factors ....................................................................................................30
Peaking Phase Mechanistic Factors .........................................................................................33
Muscular ......................................................................................................................33
Neural ...........................................................................................................................35
Biochemical .................................................................................................................36
Peaking Phase Performance Outcomes ....................................................................................38
Individual Event ...........................................................................................................38

8
Team Sport ...................................................................................................................40
Conclusion ...............................................................................................................................41
3. CHANGES IN MUSCLE ARCHITECTURE, EXPLOSIVE ABILITY, AND THROWING
PERFORMANCE IN NCAA DIVISION I TRACK AND FIELD THROWERS
THROUGHOUT A COMPETITIVE SEASON AND FOLLOWING A TAPER ........................42
Abstract ....................................................................................................................................43
Introduction ..............................................................................................................................44
Methods....................................................................................................................................47
Experimental Approach to the Problem .......................................................................47
Athletes ........................................................................................................................47
Training ........................................................................................................................47
Training Load……………………………………………………………………...…50
Testing……………………………………………………………………………..…50
Statistical Analyses……………………………………………………………….….53
Results ......................................................................................................................................55
Discussion ................................................................................................................................58
Practical Applications ..............................................................................................................61
Acknowledgements ..................................................................................................................62
References ................................................................................................................................62
4. CHANGES IN MUSCLE ARCHITECTURE AND EXPLOSIVE ABILITY IN NCAA
DIVISON I WOMEN’S VOLLEYBALL ATHLETES THROUGHOUT A COMPETITIVE
SEASON AND FOLLOWING A TAPER ....................................................................................67
Abstract ....................................................................................................................................68

9
Introduction ..............................................................................................................................69
Methods....................................................................................................................................70
Athletes ........................................................................................................................70
Procedures ....................................................................................................................71
Training Load...............................................................................................................73
Testing..........................................................................................................................75
Statistical Analyses ......................................................................................................76
Results ......................................................................................................................................76
Discussion ................................................................................................................................79
Acknowledgements ..................................................................................................................84
References ................................................................................................................................84
5. DIFFERENCES IN COUNTERMOVEMENT JUMP PERFORMANCE CHANGES
BETWEEN NEW PLAYERS AND RETURNERS FOLLOWING AN OVERREACH AND
TAPER IN NCAA DIVISION I WOMEN’S VOLLEYBALL ATHLETES ...............................91
Abstract ....................................................................................................................................92
Introduction ..............................................................................................................................93
Methods....................................................................................................................................95
Athletes ........................................................................................................................95
Procedures ....................................................................................................................95
Testing..........................................................................................................................98
Statistical Analyses ....................................................................................................101
Results ....................................................................................................................................102
Baseline ......................................................................................................................102

10
Rating of Perceived Exertion Training Load and Volume-Load ...............................103
Peaking Phase ............................................................................................................105
Peak and Nadir Performance .....................................................................................106
Variables Explaining Jump Height Performance Supercompensation ......................107
Discussion ..............................................................................................................................108
Acknowledgements ................................................................................................................113
References ..............................................................................................................................113
6. BIOCHEMICAL, MORPHOLOGICAL, AND BIOMECHANICAL CHANGES IN A
NATIONAL LEVEL WEIGHTLIFTER PEAKING FOR COMPETITION: A CASE
STUDY ........................................................................................................................................123
Abstract ..................................................................................................................................124
Introduction ............................................................................................................................125
Methods..................................................................................................................................128
Athlete Characteristics ...............................................................................................128
Procedures ..................................................................................................................129
Statistical Analyses ....................................................................................................135
Results ....................................................................................................................................136
Volume-load ..............................................................................................................136
Anthropometrics and Cross-Sectional Area ...............................................................136
Biomarkers .................................................................................................................138
Squat Jumps ...............................................................................................................139
Dynamic Mid-Thigh Pulls .........................................................................................139
Discussion ..............................................................................................................................140

11
Descriptive Characteristics ........................................................................................140
Anthropometrics and Cross-Sectional Area Changes ................................................141
Biomarker Changes ....................................................................................................142
Squat Jumps and Dynamic Mid-Thigh Pull Performance Changes...........................145
Conclusion .............................................................................................................................146
Acknowledgements ................................................................................................................147
References ..............................................................................................................................147
7. SUMMARY AND FUTURE INVESTIGATIONS ................................................................156
REFERENCES ............................................................................................................................160
APPENDICES .............................................................................................................................187
Appendix A: Institutional Review Board Approval Letters ............................................187
Appendix B: Informed Consent Documents ....................................................................191
VITA ............................................................................................................................................203

12
LIST OF TABLES
Table Page
3.1 Training program .....................................................................................................................49
3.2 Changes in dependent variables (mean±SD) ..........................................................................55
4.1 Strength training program ........................................................................................................71
4.2 Changes in dependent variables over time ...............................................................................77
5.1: Strength training program .......................................................................................................97
5.2: Changes in weekly average RPETL and strength training VL during the peaking phase
relative to In-season training (mean±SD) ...................................................................................104
5.3: Weekly JH and PPa during the peaking phase (mean±SD) .................................................104
6.1: Final week of training prior to COMP3 ................................................................................129

13
LIST OF FIGURES
Figure Page
3.1a and 3.1b Exponential reduction in strength training VLd and RPETL during ORT .............48
3.2 Changes in MT overlaying weekly RPETL .............................................................................56
3.3 Changes in CMJPF 0kg overlaying weekly RPETL ................................................................56
3.4 Individual changes in OHT and TP following ORT ................................................................57
4.1a and 4.1b Changes in weekly total RPETL and VLd ..............................................................73
4.2 Changes in vastus lateralis MT and PA from T2 to T3 .............................................................78
4.3 Relationship between BS 1RMa and mean change from T1 to T3 in SJPPa with 0kg ...........79
5.1a and 5.1b: Vastus lateralis longitudinal and cross-sectional measurements ..........................100
5.2: Differences between groups at baseline in descriptive and performance characteristics .... 103
5.3: Within-group changes and differences in between-group changes in JH relative to pre-
OR1 ...............................................................................................................................................106
5.4a and 5.4b: Within-group changes and differences in between-group changes in JH and PPa
from pre-OR1 to peak performance during the peaking phase ....................................................107
5.5a and 5.5b: Occurrence of individual JH peak and nadir week during the peaking phase….107
5.6: Relationships between JH supercompensation and other variables ......................................108
6.1: Competition phase weekly training volume-load. Black line represent “normal” average
training VL over 10 months of training .......................................................................................129
6.2: Competition phase testing timeline.......................................................................................130
6.3: Vastus lateralis CSA using β-mode ultrasonography ...........................................................133
6.4: Weekly changes in body mass, CSA, and unloaded JH during each competition phase .....137
6.5: Changes in biomarkers pre- to post-competition phase ........................................................139

14
CHAPTER 1
INTRODUCTION
Tapering in athletics has been previously defined as a “progressive nonlinear reduction of
the training load during a variable period of time, in an attempt to reduce the physiological and
psychological stress of daily training and optimize sports performance” (Mujika & Padilla,
2003). Traditionally, it is the final period in a sequence of mesocycles leading up to a major
competition or tournament (Pyne, Mujika, & Reilly, 2009). The taper can be best conceptualized
along a training-load continuum with overtraining characterizing one end and detraining the
opposite end. Athletes from various sport backgrounds have used tapers for decades to recover
and enhance performance prior to important competitions (Banister, Carter, & Zarkadas, 1999;
Garhammer, 1979; Mujika et al., 1996; Shepley et al., 1992). Despite numerous studies
describing the mechanistic and performance enhancing effects of tapering for endurance athletes
(Banister et al., 1999; Luden et al., 2010; Mujika, Padilla, Pyne, & Busso, 2004; Murach et al.,
2014; Neary, Martin, & Quinney, 2003; Thomas & Busso, 2005; Trappe, Costill, & Thomas,
2000) a paucity of similar research exists with individual event strength-power athletes (Busso et
al., 1992; Hakkinen, Pakarinen, Alen, Kauhanen, & Komi, 1987; Stone et al., 2003; Zaras et al.,
2016). Moreover, there are few studies examining methods used by high level team sport athletes
to peak for competition (Claudino et al., 2016; Coutts, Reaburn, Piva, & Murphy, 2007; Freitas,
Nakamura, Miloski, Samulski, & Bara-Filho, 2014; Gibson, Boyd, & Murray, 2016; Papacosta,
Gleeson, & Nassis, 2013).
Muscle architecture has demonstrated plasticity to heavy strength and plyometric training
(Aagaard et al., 2001; Alegre, Jimenez, Gonzalo-Orden, Martin-Acero, & Aguado, 2006;
Blazevich, Gill, Bronks, & Newton, 2003; Kawakami, Abe, & Fukunaga, 1993; Kawakami, Abe,

15
Kuno, & Fukunaga, 1995). Quantifying changes in athlete’s muscle architecture following a
peaking phase can provide a non-invasive means of explaining corresponding performance
changes. Considering the contribution of muscle architectural characteristics to a muscle’s force-
producing capabilities, changes in muscle architecture should hypothetically be expressed in
sport-related movement kinetics. Previous studies have observed changes in single muscle fiber
morphology, contractile properties, and enzymatic activity (Luden et al., 2010; Murach et al.,
2014; Neary et al., 2003; Trappe et al., 2000) following overreaching and tapering periods
(ORT). Furthermore, multiple studies have noted improvements in maximal strength, explosive
ability, and repeated sprint ability in individual event and team sport athletes (Claudino et al.,
2016; A. Coutts et al., 2007; Zaras et al., 2016). Therefore, it is reasonable to believe that
changes in muscle architecture would occur following a peaking phase corresponding with
performance changes. However, only one known study has examined changes in muscle
architecture following a taper in strength-power athletes (Zaras et al., 2016).
Jumping is a task common to many team sport sports. Vertical jump performance
provides an indirect measurement of an athlete’s explosive ability and competitive readiness.
Squat and countermovement jumps (SJ and CMJ, respectively) have been used previously with
various athletes to monitor training responses during a competitive season (Freitas et al., 2014;
Gibson et al., 2016). Monitoring jump performance during the competition phase may provide an
effective means to determine an athlete’s response to training without causing undue fatigue.
Additionally, a force-time trace from a SJ or CMJ can provide a more comprehensive analysis of
changes in jumping performance following a peaking phase (Mizuguchi, Sands, Wassinger,
Lamont, & Stone, 2015; Sole, Mizuguchi, Sato, Moir, & Stone, 2015). Jump performance has
also been to shown to discriminant between levels of play (elite, sub-elite, collegiate) in various

16
sports such as weightlifting (Carlock et al., 2004), sprinting (Peterson, Alvar, & Rhea, 2006), and
volleyball (Pion et al., 2015). Therefore, determining changes in jumping performance following
a peaking phase can provide an indirect measure of sport performance changes.
Few studies have addressed the molecular basis for changes in athlete’s muscle
architecture and sport performance following a peaking phase. The hypothalamic-pituitary-
adrenal (HPA) and hypothalamic-pituitary-gonadal (HPG) axis have been implicated in
overreaching and overtraining (Smith, 2000). While hormonal changes have been the
predominate focus of these studies, inflammatory cytokines, chemokines, and myokines have
also been studied. Various biochemical markers have been shown to mediate the inflammatory
and hypertrophic responses to training (Busso et al., 1992; Farhangimaleki, Zehsaz, & Tiidus,
2009; Fry et al., 1994; Main et al., 2010; Nieman et al., 2014; Storey, Birch, Fan, & Smith, 2016;
Tuan et al., 2008); however, more research is needed examining changes in these markers
following a peaking phase. Additionally, to our knowledge, no published research has examined
these markers in conjunction with morphological changes in skeletal muscle, sport-related
kinetic variables, and sport performance following a peaking phase.
Dissertation Purposes
1. To examine the effects of an ORT on individual-event strength-power athletes preparing for
conference championships.
2. To examine changes in team sport athletes throughout a competitive season in preparation for
conference championships.
3. To examine differences in the effects of a peaking phase between new and returning team
sport athletes in order to identify variables that best explain the variation in performance
changes.

17
4. To examine changes in a national level female weightlifter following three separate
competition phases.
Operational Definitions
1. Allometric scaling: the absolute value of a variable divided by the body mass of the subject
raised to the two thirds power (Jaric, Mirkov, & Markovic, 2005).
2. Biomarker: substance measured in serum that provides an indication of the presence of some
phenomenon such as inflammation, tissue damage or repair, or glucose metabolism (Strimbu &
Tavel, 2010).
3. Endocrine: hormones or glands that secrete hormones directly into the blood.
4. Endurance: the ability to maintain or repeat a given force or power output (Stone et al., 2006).
5. Muscle architecture: includes measures of muscle thickness (MT), fascicle pennation angle
(PA) and length (FL) often measured via ultrasonography (Abe, Kumagai, & Brechue, 2000).
6. Overreach: an accumulation of training and/or non-training stress resulting in short-term
decrement in performance capacity with or without related physiological and psychological signs
and symptoms of maladaptation in which restoration of performance capacity may take from
several days to several weeks (Kreider, Fry, & O’Toole, 1998); Functional overreaching (FOR)
results in an initial decrease in performance that is reversed with a short rest period. During non-
functional overreaching (NFOR) the recovery period is delayed and takes longer than desired
(Meeusen et al., 2013).
7. Peaking phase: training period an athlete completes prior to a major competition comprised of
a taper with or without a prior overreach
8. Performance: outcome of a competition, laboratory assessment or field-based test

18
9. Rating of perceived exertion (RPE): measure of the athlete’s perception of training intensity;
in the context of session RPE, it is quantified on a modified 0-10 Borg scale developed and
validated by Foster et al. 2001.
10. Rating of perceived exertion training load (RPETL): an athlete’s RPE score on a modified
Borg scale (0-10) multiplied by the duration of the training session (Foster et al., 2001).
11. Strength: the ability of the neuromuscular system to produce force (Stone, Stone, & Sands,
2007).
12. Strength-Power: used to describe athletes or sports where the anaerobic energy system is the
primary provider of adenosine tri-phosphate used during play.
13. Supercompensation- increase in a dependent variable above baseline levels following a taper
period (Stone et al., 2007).
14. Taper: a progressive nonlinear reduction of the training load during a variable period of time;
used in an attempt to reduce the physiological and psychological stress of daily training and
optimize sports performance (Mujika & Padilla, 2003).
15. Training Load: the combination of training volume, intensity, and frequency. External
training load is used to describe the work the athlete performs, while internal training load is
used to describe relative physiological and psychological response to the work they perform
(Halson, 2014).
16. Volume-load multiplied by displacement (Vld): resistance training external load lifted for an
exercise multiplied by the total number of repetitions performed across all sets and the concentric
bar displacement measured manually using a tape measure (Haff, 2010).
17. Volume-load (VL): resistance training external load lifted for an exercise multiplied by the
total number of repetitions performed across all sets (Haff, 2010).

19
CHAPTER 2
REVIEW OF THE LITERATURE
The purpose of the taper is to reduce fatigue accumulated during previous training to
express changes in fitness and thereby maximize performance (Mujika, 2010). Training load
during the taper has been divided into various subcomponents, namely: intensity, volume,
frequency, duration and type of taper (Mujika & Padilla, 2003). A meta-analysis by Bosquet et
al. (2007) demonstrated maintaining training intensity and frequency, and exponentially reducing
training volume over a 2-week tapering period resulted in the largest magnitude of improvements
in endurance performance. Previous investigations on tapering for sport performance have
mostly involved endurance athletes and current tapering recommendations are based on these
studies (Aubry, Hausswirth, Louis, Coutts 2014). Because limited research exists examining the
efficacy of tapering for strength-power athletes, no evidence based tapering standards have been
established, although recommendations have been made similar to those for endurance
performance (Pritchard, Keogh, Barnes, & McGuigan, 2015).
Various mechanisms have been studied to explain the performance enhancing effects of
the taper. These include glycogen supercompensation (Houmard & Johns, 1994; Shepley et al.,
1992), improved anabolic to catabolic hormonal profile (Fry et al., 2000; Fry et al., 1994),
increased muscle shortening velocities resulting from myosin isoform shifting (Type IIa to IIx)
(J. Andersen & Aagaard, 2000; L. Andersen et al., 2005; Terzis, Stratakos, Manta, & Georgiadis,
2008) and possibly increased FL (Alegre et al., 2006; Blazevich et al., 2003), increased myosin
heavy chain IIa fiber size, peak force and absolute power (Luden et al., 2010; Trappe et al.,
2000), altered regulation of growth-related genes (fibroblast growth factor-inducible 14, muscle
ring finger protein-1) in MHC IIa fibers (Luden et al., 2010; Murach et al., 2014), increased

20
muscle activation (Hakkinen, Kallinen, Komi, & Kauhanen, 1991), and recruitment of high
threshold motor units (Cormie, McGuigan, & Newton, 2011).
Considering previous reviews of tapering literature have primarily addressed endurance
performance, it would be prudent and benefit sport scientists and coaches to have a
comprehensive review of the mechanistic factors and associated performance changes in both
endurance and strength-power athletes following a peaking phase in preparation for the
remaining dissertation chapters. Thus, the purposes of this review are to: 1) discuss various
components of the peaking phase, 2) review mechanisms mediating peaking phase performance
outcomes, 3) describe peaking phase performance outcomes in individual event and team sport
athletes.
Peaking Phase Components
Training Load
Training load has been previously described as the combination of training volume,
intensity, and frequency (Wenger & Bell, 1986). Training load is reduced during a tapering
period to mitigate fatigue effects from training allowing for improvements in fitness (i.e. cross-
sectional area (CSA), rate coding, mitochondrial density, aerobic enzymes) to be expressed.
Training load has been categorized as external and internal (Halson, 2014). Briefly, external
training load is used to describe the work the athlete performs, while internal training load is
used to describe the relative physiological and psychological response to the work they perform
(Halson, 2014). Various methods for quantifying external and internal training load have been
proposed (Halson, 2014). Measures of external training load include: speed, distance covered,
load lifted, and acceleration; measures of internal training load include: heart rate, lactate
response, rating of perceived exertion, and sleep quantity. Generally, external training load is

21
easier to quantify for individual sports (weightlifting, sprinting, and swimming) than team sports
(rugby, volleyball, tennis). However, with the advent of wearable global positioning system
(GPS) units, quantifying training load with team sport athletes has become more promising
(Aughey, 2011).
Foster et al. (1995) proposed the use of session RPETL, which is the product of the
athlete’s rating of the training session intensity and the duration of the training session in
minutes. Rating of perceived exertion is quantified on a modified Borg scale (0-10) with verbal
descriptions of session intensity. Foster and colleauges found strong relationships between
session RPE and heart rate and blood lactate response in steady state (1995) and intermittent
training conditions (2001). These authors concluded RPETL is a valid and practical means of
quantifying training load for aerobic exercise, intermittent training, resistance training and
plyometric training. However, objections include: assuming that equal RPETLs in different
training modalities result in the same amount of strain and fatigue on an athlete, subjectivity of
the measure requires corroboration with physiological data, and scores could be biased based on
difficulty of the drill or exercise performed at the end of a session.
Endocrine and non-endocrine serum markers have been used to quantify internal training
load. Previous markers include inflammatory cytokines and myokines (i.e. interleukin-6 (IL-6),
tumor necrosis factor alpha (TNFα), C-reactive protein (CRP), myostatin, decorin), endocrine
hormones (testosterone (T), cortisol (C), epinephrine, and norepinephrine), immune cells
(neutrophils, CD4 and CD8 lymphocytes) and amino acids (glutamine, glutamate, branched-
chain amino acids). These markers, however, are not often observed on a routine basis with
athletes possibly due to time constraints, and expense. Although these markers provide insight

22
into the mechanistic underpinnings of an athlete’s response to training they are often impractical
to collect in an applied setting with a large number of athletes.
Questionnaires have been commonly used to provide information of the athlete’s
subjective response to training. A number of questionnaires have been described in the literature
including: profile of mood states (POMS), the recovery-stress questionnaire for athletes (REST-
Q-Sport), and the daily analysis of life demands for athletes (DALDA) (Morgan, Brown, Raglin,
O'Connor, & Ellickson, 1987; Rushall, 1990). However, limitations include athletes’ over- or
under-estimating training load, and the frequency, timing, and length of the questionnaire. While
questionnaires are relatively easy to implement, physiological data should also be collected to
corroborate.
Previous authors have suggested a systems-based approach that involves entering GPS
data, heart rate data, RPETL data, and questionnaire data into a data management system that
allows for easy access and retrieval of information to more efficiently inform training.
Commercially available systems include Training Peaks TSS, Kinetic Athlete, and Smartabase,
which are becoming increasingly popular. The utility of the Training Peaks system has been
described previously (Halson, 2014). A useful application is monitoring chronic and acute
training load to gauge an athlete’s response to training, their susceptibility to injury, and
predicting future performance. As stated previously, integrating external and internal training
load data in a seamless manner is the future for fatigue management in sport (Pyne & Martin,
2011).
Pre-Taper Overreach
Coaches and athletes have used overreaching periods for decades in an attempt to achieve
a performance supercompensation during the subsequent taper (Hellard et al., 2013; Stone et al.,

23
1993; Thomas & Busso, 2005) In a joint position statement from the American College of
Sports Medicine and European College of Sport Science, the authors adopted the following
definition previously used by Kreider et al. (1998) to define an overreach: “an accumulation of
training and/or non-training stress resulting in short-term decrement in performance capacity
with or without related physiological and psychological signs and symptoms of maladaptation in
which restoration of performance capacity may take from several days to several weeks.”
Overreaching can be further categorized as functional (FOR) or non-functional (NFOR) (Halson
& Jeukendrup, 2004). During a FOR state the athlete experiences a temporary decline in
performance; however, given an appropriate recovery period, the athlete may experience a
supercompensation effect where performance is enhanced above baseline levels (Meeusen et al.,
2013). When this intensified training continues, the athlete could reach a NFOR state resulting in
stagnation or decrease in performance without supercompensation following sufficient recovery.
During a NFOR state the athlete will likely experience both quantitative (increased training load)
and qualitative (psychological, neuroendocrine perturbations) signs and symptoms of
overreaching (Meeusen et al., 2013).
It has long been believed by many coaches and researchers that a FOR period prior to a
taper will result in a greater supercompensation effect (Hellard et al., 2013; Stone et al., 1993;
Thomas & Busso, 2005). Using mathematical modeling simulations, Thomas and Busso (2005)
reported greater improvements in endurance performance as a result of 20% increase in training
load during 28 day period leading up to taper compared to habitual training during that period.
Their findings also demonstrated that a more intense overreach period prior to the taper was
more effective at enhancing performance, but required a longer taper. Le Meur et al. (2013)
found a 9% decrease in performance in triathletes after a 3-week overreaching phase. After a

24
recovery week the athletes increased performance over pre-testing levels by 7.9% and exhibited
greater supercompensation effects than a control group that performed “normal” training during
the same period. Coutts et al. (2007) had 7 rugby players (V̇O2max ~ 56.1 ml/kg/min) complete a
6-week progressive OR followed by a 1-week taper that decreased training time by 55% and
intensity by 17%. The overreaching period reduced their capacity to produce force at slower
movement velocities during an isokinetic knee flexion and reduced their performance during a
multi-stage fitness test. Following the taper, only isokinetic measures of set work at 1.05 and
5.25 rad/s and peak hamstring torque at 5.25 rad/s were significantly improved from baseline. In
another study, Coutts et al. (2007) compared 4 weeks of overreaching and a 2-week taper to 4
weeks of “normal” training and a 2-week taper in triathletes. Athlete’s 3km time trial
performance decreased after the overreaching phase by 3.7% and rebounded following the taper
by 7%; the “normal” training group increased performance by 3% after 4 weeks. However, no
statistical difference in performance improvements from pre-training to post-taper were observed
between groups. The authors concluded the taper may not have been long enough for the
overreaching group to fully recover. These findings demonstrate mixed results for overreaching
prior to the taper with some studies showing no change or an increase from pre-overreach values
following the taper. Differences between findings are likely related to differences between
athlete’s training status, and the length, volume, and intensity of the overreaching phase and
subsequent taper.
In a recent investigation, Aubry et al. (2014) divided 34 well trained male cyclists into a
control and overreaching training group. Cyclists were tested prior to and following the 3-week
overreaching phase. Cyclists who decreased cycling performance on a V̇O2max test were
assigned to the FOR group, while those who maintained or increased were assigned to an acutely

25
fatigue group. The cyclists were then tested on the same performance measure each week during
a 4-week taper. Those assigned to the FOR group returned to pre-overload values, but a
supercompensation effect was observed in the acutely fatigued group with significantly greater
improvements than the FOR group observed at the end of the second week of the taper.
Additionally, there were increased incidences of upper respiratory tract infections in the FOR
condition. These findings indicate that responses to an overreaching phase and taper vary
amongst a group of similar athletes and the importance of monitoring an athlete’s response to an
overreach phase.
Previous investigations have found increases in stress-related symptoms following an
ovrreaching phase in various groups of athletes (Aubry et al., 2014; Freitas et al., 2014; Fry et
al., 1994; Storey et al., 2016). Fry et al. (1994) examined changes in T concentrations in elite
junior weightlifters following a fatiguing testing battery (jumps, snatches to failure, snatch pulls)
before and after an overreach and before and after 1 year of training. Decreases in T were
observed after the testing battery during year 1, but not during year 2 indicating a greater
tolerance to high workloads. These findings demonstrate that an athlete’s training status (i.e.
work capacity) plays a role in how they respond to an overreach. More recently, Storey et al.
(2016) reported symptoms of stress from a DALDA questionnaire and negative mood state were
worse than normal during a 2-week overreach in international level weightlifters. The increase in
stress-related symptoms also corresponded with decreases in maximal snatch and vertical jump
height (JH) during the overreach; however, all were restored following a 1-week period of
reduced training.
The findings of these investigations demonstrate differences in how athletes respond to
ORT phases. Importantly, not all studies have observed performance supercompensation

26
following an ORT. Many studies report physiological, biochemical, and sport performance
measures that return to baseline levels following the taper. However, differences between
findings may be related to the intensity, length, and type of ORT implemented. Also, differences
in individual responses could be due to the athlete’s work capacity, training experience, maximal
strength, or genetic characteristics. Future research should further investigate which variables
explain response differences between athletes to an ORT.
Taper
The taper has been previously defined as “a progressive nonlinear reduction of the
training load during a variable period of time, in an attempt to reduce the physiological and
psychological stress of daily training and optimize sports performance” (Mujika & Padilla,
2003). The tapering period presents a unique opportunity for athletes to maximize performance
for a crucial competitive event (Bosquet et al., 2007; Le Meur, Hausswirth, & Mujika, 2012;
Mujika & Padilla, 2003). Mujika et al. (2002) has previously demonstrated that the training an
Olympic athlete undertakes during the tapering period can make the difference between winning
gold and not making the podium. To further illustrate this point, during the Beijing 2008
Olympics Michael Phelps beat his opponent Milorad Cavic by only a hundredth of a second in
the 100m butterfly despite trailing Cavic most of the race. Therefore, the training load prescribed
during the taper is of utmost importance for athletes seeking to obtain an edge over their
opponents.
Tapering involves the manipulation of various factors including training volume,
intensity, frequency, and duration (Mujika & Padilla, 2003). Based on a meta-analysis, Bosquet
et al. (2007) reported the largest magnitude of change in endurance performance following a 2-
week taper during which training volume is exponentially reduced by 41-60%, without any

27
modification in training intensity or frequency. The magnitude of change in swimming, cycling,
rowing, running, and triathlon performance following the taper is ~3% (0.5-6%) (Mujika &
Padilla, 2003). Previous investigations on tapering for sport performance have mostly involved
endurance athletes and current tapering recommendations are based on these studies (Aubry et
al., 2014; Le Meur et al., 2012; Mujika & Padilla, 2003). Because limited research exists
examining the efficacy of tapering for strength-power athletes no evidence based tapering
standards have been established, although recommendations have been made similar to those for
endurance performance (Pritchard et al., 2015).
The training load during a tapering period can be characterized with the intensity,
volume, and frequency of training (Le Meur et al., 2012). Decreases in training load should be
programmed so that the balance between fatigue reduction and fitness preservation is
maximized. While reducing training load is important, detrimental effects on performance can
occur if the training load remains low for an extended period (detraining). Arguably the most
important variable influencing performance outcomes following the taper is training intensity
(Mujika, 2010). In one of the earliest studies examining adaptations following a reduced training
period, Hickson et al. (1985) had 12 moderately active subjects run and cycle for 40 min, 6
days/week for 10 weeks. Training intensity was reduced for an additional 15 weeks by 1/3 (n=6)
or 2/3 (n=6). The authors reported decreased VO2 max, left ventricular mass, short-term and
long-term exercise endurance in both groups with greater decrements in the group that reduced
their intensity by 2/3. In further support of this, Mujika et al. (1995) found that performance
improvement in 18 elite level swimmers following a competition period was highly correlated
(r=0.69) with their mean training intensity during the season, but not with volume or frequency.
Iaia et al. (2009) had endurance runners reduce their weekly running volume from 45 km to 10

28
km for weeks, while supplementing their training with 8-12, 30 s sprint runs 3-4 times/week.
These authors observed maintenance of muscle oxidative capacity, capillarization, and 10 km
running performance with improved running economy at submaximal running speeds. Zaras et
al. (2014) examined the effects of a 2-week taper using light versus heavy loads in 13
international level track and field throwers. Heavy resistance training (>85% 1-repetition
maximum (RM)) resulted in greater improvements in leg press 1RM, rate of force development
(RFD), SJ power, and shot throws than light resistance training (30% 1RM). These findings are
corroborated by Stone et al. (2003) who demonstrated strong positive relationships among
maximal strength (isometric mid-thigh pull peak force), dynamic mid-thigh pull (MTP) peak
power (PP), and throwing performance (shot-put and weight throw) in collegiate throwers. In
this study, the ORT period (strength-power block) resulted in improved 1RM power snatch,
isometric MTP peak force, dynamic MTP peak RFD, and throwing performance. The findings of
these investigations support training intensity as the most important variable influencing
performance outcomes following the taper in endurance and strength-power athletes.
In regards to training volume, previous investigators have found that this training load
parameter can be reduced without losing training induced adaptations, and is in fact crucial for
attaining performance benefits from a taper (Bosquet et al., 2007; Le Meur et al., 2012). Previous
literature reviews and a meta-analysis examining the endurance performance improvements
following a taper have concluded that training volume should be reduced by at least 41% during
a taper (Bosquet et al., 2007; Le Meur et al., 2012; Mujika & Padilla, 2003). Shepley et al.
(1992) had 9 male middle-distance runners (V̇O2 max: 66-71 ml/kg/min) complete 3 different 7-
day tapers (high intensity, low-intensity, complete rest) in a cross-over design. The greatest
improvements in muscle glycogen concentrations, treadmill run to exhaustion, total blood

29
volume, red blood cell volume, and citrate synthase activity were observed in the high intensity
taper condition where run volume was reduced from 60-80 km/week to 7.5 km (composed of
strictly interval training). Importantly, the reduction in training load should be commensurate
with the training load prior to the taper. Using computer simulations, Thomas and Busso (2005)
determined that a 20% increase in training load over a 28-day period prior to a taper requires a
step-taper of ~65% over 3 weeks compared to only 2 weeks when no overreach period is
performed. Gibala et al. (1994) had 8 strength trained males perform 10 days of training
following a 3-week training phase. Resistance training intensity was maintained while volume
was reduced by 72%. The authors reported significant improvements in maximal voluntary
isometric (MVIC) elbow extension torque following the taper. Additionally, MVIC and maximal
low-velocity isokinetic peak torque of the elbow flexors were improved at days 2, 4, 6, and 8 of
the taper. These findings demonstrate that maximal strength of the elbow extensors and flexors
can be improved with as little as 2 days of tapering. Therefore, it has been recommended that
training volume be reduced by 30-70% and intensity maintained or slightly increased during a
tapering period for strength-power athletes (Pritchard et al., 2015).
It has been recommended that training frequency be maintained during a tapering period
for endurance and strength-power athletes (Bosquet et al., 2007; Mujika & Padilla, 2003;
Pritchard et al., 2015). However, Johns et al. (1992) reported increased power output and
swimming performance in competitive swimmers when training frequency was reduced by 50%.
Additionally, Dressendorfer et al. (2002) found improvements in a simulated 20-km cycling time
trial after training frequency was reduced by 50% during a 10-day taper. Graves et al. (1988) had
24 men and 26 women reduce their strength training frequency from 3 to 2 days per week, 2 to 1
day per week or 1 to 0 day per week for 12 weeks. Mean peak MVIC increased by 21% in the

30
groups that trained twice or one day per week, whereas the group that stopped training decreased
MVIC by 68%. These findings demonstrate the importance of maintenance of a minimal training
stimulus to prevent losses in strength and that strength can be maintained in recreationally
subjects with minimal training. Support for maintaining training frequency with athletes is
supported by Mujika et al. (2002) who reported that highly trained middle distance runners
achieved significant improvements in an 800-m race with daily training during a 6-day taper,
whereas no improvements were observed when the athletes rested every third day of the taper.
These findings support previous recommendations that training frequency should be maintained
above 80% for higher trained athletes, and that low to moderately trained individuals can sustain
performance with fairly low training frequencies (~50%). However, considering the overlap
between training frequency and volume, it is difficult to isolate the effects of either on
performance outcomes following a taper.
Confounding Factors
While the above literature provides a strong support for the taper, there are many
confounding variables that affect decisions coaches make when planning a peaking phase for
their athletes. An obvious, but often overlooked factor, is the individual differences between
athletes. This is important when considering the training load prescribed by a coach. Wallace et
al. (2009) found a clear discrepancy between coaches’ perception of athlete’s internal training
load using session RPETL and athlete’s reported RPETL. The athlete’s reported greater RPETL
than coaches for sessions that were intended to be easy, and lower RPETL for sessions intended
to be hard. Therefore, coaches should closely monitor prescribed training load during the taper
and individual athlete’s perception of the prescribed training load to ensure they are similar. It is
also important to quantify what is a meaningful change in performance for individual athletes.

31
Hopkins (2000) recommends using typical error determined from a reliability study of the
performance measure and the smallest worthwhile change (SWC) based on the athlete’s previous
competition performances. Using this information, the probability (precision) that an athlete’s
performance is a greater than a reference value can be quantified, as well as the probability that
there is a worthwhile change from one performance to the next.
The majority of tapering studies have been conducted with individual sport athletes (Pyne
et al., 2009). This is likely because it is easier to quantify training load and performance in these
sports compared to team sports, combat sports, and racquet sports (Mujika, 2007; Pyne et al.,
2009). Also, clear moderate to large correlations have been observed between physiological
factors, training intensity, and volume and competitive performance (Pyne et al., 2009). An
additional difficulty with team sport research is differences in demands placed on athletes
depending on their position on a team, starters and non-starters, and new players and returners.
Previous research has demonstrated that maximal strength, JH, and power output are different
between starters and non-starters and between different levels of athletes for various sports
(Fleck, Case, Puhl, & Van Handle, 1985; Forthomme, Croisier, Ciccarone, Crielaard, & Cloes,
2005; Fry & Kraemer, 1991; Gabbett, 2009; Gabbett, Kelly, Ralph, & Driscoll, 2009; Pion et al.,
2015; Sheppard et al., 2008; Smith, Roberts, & Watson, 1992). Considering these differences, it
is likely that responses to an ORT would vary amongst these subgroups. Future research should
therefore address differences in how starters/non-starters, new players/returners, elite/sub-elite
athletes respond to an ORT.
Further compounding the issue, new lucrative commercial sponsorships are driving
increases in the number of competitions in an already busy sporting calendar (Pyne et al., 2009).
Now athletes are attempting to peak for several major competitions per year as compared to one

32
or two. The competition schedule presents one of the biggest challenges to team sport athletes
seeking to peak for a series of competitions. It has been suggested that an ideal approach to
peaking for team sport athletes would include a period of recovery after regular-season play
followed by a return to fitness/rebuilding period and finalized with a pre-tournament taper (I
Mujika, 2007). However, the competition schedule does not always work out this conveniently.
Teams may finish regular season play and have only a week to recover prior to tournament play.
While training through early competitions in a tournament is an option for stronger teams,
weaker teams run the risk of peaking too early and ruining their chances of progressing further.
An alternative option is overreaching 2-3 weeks prior to the end of regular season play and
unloading the week following regular season play prior to the tournament. Future research on
tapering for team sport should examine different strategies for preparing for post-season play.
Another difficulty when preparing for an important competition is travel. Crossing
multiple time zones causes desynchronization of human circadian rhythms resulting in travel
fatigue commonly known as jet lag. Decrements in maximal strength, reaction time, and arousal
have been observed following travel (Reilly, Atkinson, & Budgett, 2001). Differences in
response to long travel can be due to the number of time zones crossed, direction of travel, and
times of departure and arrival. It is recommended that training load be reduced until the athlete
accommodates to the new time zone to reduce injury risk (Pyne et al., 2009). Additionally,
napping at inappropriate times of the day following long travel could interfere with re-
synchronization (Minors & Waterhouse, 1981). Training load prescribed should be adjusted
based on individual athlete’s “body clock” resynchronization.

33
Peaking Phase Mechanistic Factors
Muscular
Trappe et al. (2000) were the first to demonstrate changes in single muscle fiber
morphology and contractile properties following a tapering phase with athletes. Muscle biopsies
from the posterior deltoid were obtained from six highly trained male swimmers prior to and
following a 21-day taper. Increases in Type II fiber CSA, peak contractile force, shortening
velocity, and PP were observed without any significant change in Type I fibers. These findings
were corroborated in a later study with collegiate cross-country runners following a 3-week taper
(Luden et al., 2010). These authors found significant increases in gastrocnemius Type IIa fiber
diameter, peak force, and absolute power following the tapering period with no changes in Type
I fibers. Additionally, a distinct post-taper gene response was observed following an 8 km run.
Expression of proteolytic genes (MuRF-1) was reduced following the taper, whereas myogenic
(MRF4) and protective cellular processes (HSP 72, and MT-2A) displayed an exaggerated
response. Using the same subjects, Murach et al. (2014) found an increased gene expression of
fibroblast growth factor-inducible 14 (FN14) following an 8 km time trial in a tapered compared
to an overreached state. Fibroblast growth factor-inducible 14 has been shown to correlate
strongly with Type II fiber growth in response to exercise (Raue, Slivka, Minchev, & Trappe,
2009; Schmutz et al., 2006). Therefore, changes in FN14 provide a molecular basis for the
observed hypertrophy of Type II fibers following the taper.
Andersen and Aagaard (2000) previously demonstrated that strength training induced a
myosin isoform shift from type IIx to IIa, whereas a reduced training period can cause an
overshoot in the shift back to type IIx in sedentary males. However, it is important to note that
this overshoot was observed following a 3-month detraining period and that maximal isometric

34
knee extension strength returned to baseline levels. Therefore, it is unknown whether athletes
would experience similar myosin isoform shifts following a tapering phase. It is more likely that
alterations in Type II fiber morphology, enzymatic activity, and contractile properties explain the
performance enhancing effects of the taper in athletes (Luden et al., 2010; Murach et al., 2014;
Neary et al., 2003; Trappe et al., 2000).
While research on single-fiber gene expression and mechanical characteristics has
provided great insight into the mechanisms underlying the performance enhancing effects of the
taper (Luden et al., 2010; Murach et al., 2014; Trappe et al., 2000), this process is expensive,
invasive, requires highly trained personnel, and coaches who are willing to allow their athletes to
participate in the rigors of such testing. Over the past few decades, ultrasonography has been
used as a reliable, less invasive method of determining changes in muscle architecture following
training (Ikai & Fukunaga, 1970; Kawakami et al., 1995; Wells et al., 2014; Zaras et al., 2016).
Increases in MT and PA have been observed following heavy strength training (Aagaard et al.,
2001; Kawakami et al., 1995); however studies where subjects trained with high-velocity
contractions and lighter loads (<60% 1RM) have reported increases in FL with no changes in PA
(Alegre et al., 2006; Blazevich et al., 2003). Moderate to strong relationships have been observed
between vastus lateralis MT and 1RM back squat and deadlift (r=0.82, 0.79), SJ and CMJ height
(r=0.63-0.8), isometric MTP peak force (r=0.6), isometric leg press peak force (r=0.85), hang
power clean (r=0.71), relative 1RM power clean (r=0.51) and shot-put front throw (r=0.66) in
various groups of athletes (Brechue & Abe, 2002; McMahon, Turner, & Comfort, 2015; Secomb
et al., 2015; Zaras et al., 2016). Recently, Zaras et al. (2016) reported no statistical alterations in
muscle architecture following the taper. The lack of observable changes may have been due to

35
the short duration of the taper (2 weeks). Further research is needed examining the effects of
tapering on muscle architecture.
Neural
In one of the earliest investigations examining the effects of overreaching on strength-
power athlete’s performance, Barker et al. (1990) found greater anterior bar displacement during
a snatch after 1-week of increased training volumes (30,000 kg/week to 90,000 kg/week) in elite
junior weightlifters. Considering the well-established link between fatigue and motor output, it
has been suggested that technique changes are among the earliest observable effects of
overreaching and reduced training (Stone et al., 1993). It has already been established that at
high levels of performance, milliseconds and centimeters can make the difference between
winning and losing. Therefore, recovery and supercompensation of motor output could partially
explain the beneficial effects of tapering. Hakkinen et al. (1991) found greater average
electromyography (EMG) of vastus lateralis, vastus medialis, and rectus femoris during an
isometric knee extension following a 1-week taper in well trained Finish powerlifters, but not for
the weaker non-competitive lifters. However, Gibala et al. (1994) found no statistical changes in
motor unit activation (interpolated twitch technique), or maximum rate of torque development
following a 10-day taper in strength-trained subjects. They surmised that the interpolated twitch
technique may have been too insensitive to detect changes, and using integrated EMG may have
been more effective. Dupuy et al. (2014) found slower reaction times during a Stroop task in
overreached (2 weeks, 100% above normal training) endurance athletes, which returned to
baseline following a 1-week taper (50% below normal training). Flanagan et al. (2014) found
greater cortical motor output via electroencephalography in a back squat high volume protocol
(6x10 at 80% 1RM) from set 1 through set 6 than other protocols (high force: 6x3 at 95% 1RM,

36
high power: 6x3 at 30% 1RM, control condition- stand with bar on back for 20 s). The increases
in motor output were directly related to fatigue evidenced by the greatest fall-off in PP from sets
1 through 6 in the high volume protocol. Although no research has examined the direct effects of
an ORT on cortical motor output, it is probable based on Flanagan and colleague’s acute findings
that periods of sustained increases in training volumes would result in significant perturbations to
cortical motor output, while tapering periods would allow for recovery. The above findings
demonstrate that neural mechanisms likely contribute significantly to performance changes
following ORT periods; however, considering the paucity of research it is difficult to draw any
conclusions.
Biochemical
Observational and experimental studies have examined the effects of an ORT on
biochemical profile and sport performance (Busso et al., 1992; Coutts et al., 2007; Fry et al.,
1994; Hakkinen et al., 1987; Le Meur et al., 2014). Hakkinen and colleagues (1987) found
decreases in the T:C ratio following a 2-week overreach in trained weightlifters. The T:C ratio
returned to baseline levels following 2 weeks of normal training and a 2-week taper primarily
due to reductions in C. Additionally, there was a positive relationship between change in the
T/sex hormone binding globulin (SHBG) ratio and change in clean and jerk performance
following the normal training and tapering period. Similarly, Fry et al. (2000) found increases in
the T:C ratio following a 1-week overreach and 3 weeks of normal training in elite weightlifters.
Also, the change in the T:C ratio during the normal training period was positively related to the
change in clean and jerk performance. Additionally, Fry et al. (1994) found that one year of
weightlifting experience and prior exposure to an overreaching period results in an attenuated
post-training lactate response indicating a higher level of fitness.

37
Fry et al. (2006) had strength trained subjects perform a daily 1RM on a hack squat
machine for 2 weeks to induce a state of overtraining. Decreases in 1RM squat over the 2 weeks
corresponded with reduced β2 receptor sensitivity (ratio of nocturnal urinary epinephrine
excretion to β2 receptor density) in an overtrained state compared to a control group. Epinephrine
exerts its effects on muscle contractile force by binding to β2 receptors, which activate protein
kinase A causing an increase in extracellular Ca2+ entry and intracellular Ca2+ release from
sarcoplasmic reticulum (Cairns & Borrani, 2015). Therefore, Fry and colleagues concluded that
the decreases in β2 receptor sensitivity likely explained the observed decreases in 1RM squat in
the overtrained group. Although it has not been studied directly, it is possible these changes
occur to a lesser extent in an overreached state.
Myostatin has been implicated as an important myokine, which limits myocyte
differentiation and growth by binding to the activin type II receptor on the myocyte surface and
subsequently inhibiting Akt-induced muscle protein synthesis (Kim, Cross, & Bamman, 2005).
Myostatin mRNA expression has been shown to decrease following heavy strength training
(Hulmi et al., 2007; Kim et al., 2005; Roth et al., 2003), however, not all studies agree (de Souza
et al., 2014; Willoughby, 2004). Decorin is a proteoglycan that is part of the myocyte
extracellular matrix and has been shown to bind myostatin and possibly trap it in the
extracellular matrix (Miura et al., 2006). Kanzleiter and colleagues (2014) found a positive
relationship between acute changes in serum decorin levels following a strength training session
and subject’s 8RM leg press strength. Additionally, these authors found a positive relationship
between changes in decorin mRNA expression and changes in leg press strength following a 12-
week strength and endurance training program. Therefore, these myokines may provide insight
into how the hypertrophic response is regulated following an ORT.

38
Interleukin-6, and TNF-ὰ are acute phase proteins that promote secretion of acute phase
reactants (i.e., C-reactive protein (CRP), fibrinogen, plasminogen) in response to injury,
infection, and tissue damage (Biffl, Moore, Moore, & Peterson, 1996; Smith, 2000). Interleukin-
6 has been implicated as an anti-inflammatory myokine responsible for initiating satellite cell
proliferation and differentiation, and inhibiting TNF-ὰ expression (Vierck et al., 2000). Both IL-
6 and TNF-ὰ have been found to increase glucocorticoid production via interaction with
hypothalamic receptors resulting in the secretion of corticotropin releasing hormone (Schobitz,
Reul, & Holsboer, 1994). There is also evidence that elevated IL-6 and TNF-ὰ reduce
hypothalamic secretion of gonadotropin-releasing hormone possibly leading to reduced T
secretion (Schobitz et al., 1994; Wu & Wolfe, 2012). Previous evidence demonstrates TNF-ὰ
reduces muscle protein synthesis via inhibition of insulin receptor substrate 1 and increases
protein degradation (Copps & White, 2012). Both IL-6 and TNF-ὰ have been shown to be
elevated following an overreaching phase (Main et al., 2010; Nieman et al., 2014), and
subsequently reduced following a 3-week taper (Farhangimaleki et al., 2009) in endurance
athletes. Recently, Storey et al. (2016) reported increased plasma protein carbonyls, increased
symptoms of stress, and decreased maximal snatch performance during an overreaching period
compared to a reduced training period in international-level weightlifters. These findings
demonstrate the profound effects an athlete’s training volume has on endocrine and non-
endocrine molecules and subsequent sport performance.
Peaking Phase Performance Outcomes
Individual Event
Mujika et al. (2002) followed 99 male and female Olympic swimmers from different
countries who competed in the Melbourne Grand Prix Series and 21-28 days later in the Sydney

39
Olympics. He found 91 out of 99 athletes improved swimming performance following the 3-
week tapering period with an overall performance improvement of 2.18%, which was greater
than the average difference between first and fourth place (1.62%). Interestingly, the change in
performance was statistically greater in males than females (2.57% vs 1.78%, respectively).
These findings provide a strong practical argument for the taper. Zaras et al. (2016) found greater
improvements in impulse and RFD at 100ms, 150ms, 200ms, and 250ms during an isometric leg
press in the condition that trained with heavy loads (>85% 1RM) compared to the condition that
trained with light loads (30% 1RM) during the 2-week taper. However, no differences were
observed between conditions in throwing performance (shot, disc, javelin, hammer). Stone et al.
(2003) found that a 4-week ORT period (strength-power block) resulted in improved 1RM power
snatch, isometric MTP peak force, dynamic MTP peak RFD, and throwing performance in track
and field throwers. Hellard et al. (2013) monitored 32 male and female elite swimmers during 6-
week periods (3-week overreach, 3-week taper) prior to a major competition with competitions
before and after each 3-week period. The training pattern that resulted in the greatest
improvement in swimming performance following an overreaching period was a peak in training
load the first week followed by a linear slow decay during the following 2 weeks of the
overreach. The training pattern associated with greatest improvements in performance following
tapering periods was a training load peak during the first week followed by a slow decay.
Importantly, they found that a moderate training load during the overreach that was sustained
during the taper was more beneficial earlier in the athlete’s career, while a large increase in
training load during the overreach and a steep decrease during the taper was more beneficial later
in their career. In a simulation study, Banister et al. (1999) found that an exponential reduction in
training volume was more effective than a step-taper in improving endurance performance.

40
These findings were confirmed a group of triathletes; the exponential reduction in training load
resulted in a significantly greater improvement in a cycle to exhaustion than the step-taper.
Additionally, the fast exponential taper was more effective than the slow exponential taper at
improving cycling time to exhaustion, but not 5 km time trial performance. The above findings
demonstrate the efficacy of a peaking phase for improving maximal strength, endurance, and
explosive ability in a wide range of individual event performances.
Team Sport
To assess the effects of tapering on maximal strength, Izqueirdo et al. (2007) had 11
national Basque ball players perform a 4-week taper involving a progressive increase in training
intensity and decrease in volume. The taper resulted in statistical improvements in 1RM half
squat and bench press. In the only known study examining ORT responses in volleyball athletes,
Freitas et al. (2014) found significantly greater creatine kinase, RPETL, training monotony, and
training strain in half of a team of male volleyball players who performed an 11-day overreach
compared to the other half of the team who continued with normal training. The authors
concluded that CMJ performance should not be used to evaluate training adaptations in
volleyball athletes because no significant within-group changes were observed in JH during the
overreach or the 14-day taper that followed. In contrast, Claudino et al. (2016) showed that
monitoring CMJ JH using the minimal detectable difference could be used to regulate a training
phase that elicited FOR and tapering in team sport athletes. The authors divided 17 male futsal
players into a control and regulated group. The weekly training load in the regulated group was
determined using weekly CMJ results; no changes in CMJ height were observed in the control
group during the 2-week taper, whereas the regulated group increased CMJ JH during week 2 of
the taper. Gibson et al. (2016) recently demonstrated that CMJ JH can be preserved in elite rugby

41
sevens players during a 3-week period prior to international competitions when training load is
managed appropriately. Coutts et al. (2007) found significance decreases in distance covered
during a multi-stage fitness test, meaningful decreases in vertical jump, 3RM squat, 3RM bench
press, and chin-ups to failure following a 6-week overreaching phase in trained rugby players.
Values during each test tended to return to baseline following a 1-week taper; it is likely the
taper was not long enough for athletes to fully recover from the overreach. The above findings
show disparate results for ORT with team sport athletes with some studies showing an increase,
decrease, or no change in sport-related performance measures. Future research should address
what factors explain differences in how athletes within a team respond to a peaking phase.
Conclusion
The purpose of this dissertation is to examine changes following a peaking phase in
individual event and team sport strength-power athletes. We can conclude the following from the
literature review: 1) A peaking phase prior to important competitions has been shown to alter
mechanistic variables and performance outcomes in endurance and strength-power athletes, 2)
These mechanistic variables include profound changes to an athlete’s muscle contractile
properties, motor output, and biochemical profile that partially explain the observed changes in
performance, 3) There are clear beneficial performance outcomes in individual event athletes
following a peaking phase; however, sport-related performance changes in team sport athletes
are less clear.

42
CHAPTER 3
CHANGES IN MUSCLE ARCHITECTURE, EXPLOSIVE ABILITY, AND THROWING
PERFORMANCE IN NCAA DIVISION I TRACK AND FIELD THROWERS
THROUGHOUT A COMPETITIVE SEASON AND FOLLOWING A TAPER
Authors: 1Caleb D. Bazyler, 1Satoshi Mizuguchi, 1Alex P. Harrison, 1Sato Kimitake, 1Ashley A.
Kavanaugh, 1Brad H. DeWeese, 1Michael H. Stone
Affiliations: 1Center of Excellence for Sport Science and Coach Education, Department of Exercise and
Sport Science, East Tennessee State University, Johnson City, TN

43
ABSTRACT
The purpose of this study was to examine the effects of a coach-designed overreach and taper on
measures of muscle architecture, jumping, and throwing performance in Division I collegiate
throwers preparing for conference championships. Six collegiate track and field throwers (3
hammer, 2 discus, 1 javelin) trained for 12 weeks using a block-periodization model culminating
with a one week overreach followed by a 3 week taper (ORT). Session rating of perceived
exertion training load (RPETL) and strength training volume-load times bar displacement (VLd)
were recorded weekly. Athletes were tested pre- and post-ORT on measures of vastus lateralis
architecture, squat and countermovement jump performance with 0kg and 40kg, underhand and
overhead throwing performance, and competition throwing performance. There was a statistical
reduction in weight training VLd/session (d=1.21, p<0.05) and RPETL/session (d=0.9, p<0.05)
between the in-season and ORT training phases. Five of six athletes improved overhead throw
and competition throwing performance following the ORT (d=0.50, p<0.05). Vastus lateralis
muscle thickness statistically increased following the in-season training phase (d=0.28, p<0.05),
but did not change following the ORT. Unloaded countermovement jump peak force and relative
peak power improved significantly following the ORT (d=0.59, p<0.05, d=0.31, p<0.05,
respectively). These findings demonstrate that an overreaching week followed by a 3-week taper
is an effective means of improving explosive ability and throwing performance in collegiate
track and field throwers despite the absence of detectable changes in muscle architecture.
KEYWORDS: muscle thickness, overreaching, strength training, hammer, discus, javelin

44
INTRODUCTION
The tapering period presents a unique opportunity for athletes to maximize performance
for a crucial competitive event (7, 22, 27). Tapering involves the manipulation of various factors
including training volume, intensity, frequency, and duration (27). Based on a meta-analysis,
Bosquet et al. (7) reported the largest magnitude of change in endurance performance following
a 2-week taper where training volume was exponentially reduced by 41-60%, without any
modification in training intensity or frequency. The magnitude of change in swimming, cycling,
rowing, running, and triathlon performance following the taper was ~3% (0.5-6%) (27). Previous
investigations on tapering for sport performance have mostly involved endurance athletes and
current tapering recommendations are based on these studies (4, 22, 27). Because limited
research exists examining the efficacy of tapering for strength-power athletes no evidence based
tapering standards have been established, although recommendations have been made similar to
those for endurance performance (30).
Track and field throwing events require athletes to generate high force outputs over a
short time period (<250ms) (42). It has been previously established that neuromuscular fatigue
negatively affects rate of force development (RFD) during maximal leg extension tasks (24, 45).
Thus, the taper provides an opportunity for throwers to dissipate fatigue and express higher
RFDs. This was demonstrated recently by Zaras et al. (43) who reported improved throwing
performance following a 2-week taper in collegiate throwers regardless of the resistance training
intensity. However, heavy resistance training (>85% 1-RM (repetition maximum)) resulted in
greater improvements in leg press 1-RM, RFD, squat jump power, and shot throws than light
resistance training (30% 1-RM). These findings are corroborated by Stone et al. (34), who
demonstrated strong positive relationships among maximal strength (isometric mid-thigh pull

45
peak force), dynamic mid-thigh pull peak power, and throwing performance (shot-put and weight
throw) in collegiate throwers. In this study, the overreach and taper period (strength-power
block) resulted in improved 1-RM power snatch, isometric mid-thigh pull peak force, dynamic
mid-thigh pull peak RFD, and throwing performance. In contrast, a 4-week detraining period
following 14 weeks of strength training has been shown to decrease 1-RM squat, backward
overhead throw and squat underhand throw in novices (37). These studies highlight the
importance of tapering for maximizing throwing performance.
Tapering for strength-power athletes not only involves a reduction in training volume, but
should also involve a greater emphasis on power development (33). These stimuli result in
specific neuromuscular adaptations that may explain the performance improvements following
the taper. These adaptations include increased muscle shortening velocities resulting from a
myosin isoform shift (Type IIa to IIx) (3, 37), and increased fascicle length (FL) (2, 6), increased
myosin heavy chain (MHC) IIa fiber size, peak force and absolute power (23, 39), altered
regulation of growth-related genes in MHC IIa fibers (23, 28), and increased muscle activation
(15).
Research on single-fiber gene expression and mechanical characteristics has provided
great insight into the mechanisms underlying the performance enhancing effects of the taper (23,
28, 39). However, this process is expensive, invasive, requires highly trained personnel, and
coaches who are willing to allow their athletes to participate in the rigors of such testing. Over
the past few decades, ultrasonography has been used as a reliable, less invasive method of
determining changes in muscle architecture following training (19, 20, 41, 44). Increases in
muscle thickness (MT) and pennation angle (PA) have been observed following heavy strength
training (1, 20); however, studies where subjects trained with high-velocity contractions and

46
lighter loads (<60% 1-RM) have reported increases in FL with no changes in PA (2, 6).
Moderate to strong relationships have been observed between vastus lateralis MT and 1-RM
back squat and deadlift (r=0.82, 0.79), squat and countermovement jump (SJ and CMJ,
respectively) height (r=0.63-0.8), isometric mid-thigh pull peak force (r=0.6), isometric leg press
peak force (r=0.85), hang power clean (r=0.71), relative 1-RM power clean (r=0.51) and shot-
put front throw (r=0.66) in various groups of athletes (8, 25, 31, 44). Recently, Zaras et al. (44)
reported no statistical alterations in muscle architecture (MT, PA, or FL) following the taper. The
lack of observable changes may have been due to the short duration of the taper (2 weeks).
Further research is needed examining the effects of tapering on muscle architecture.
Furthermore, there is a paucity of research examining the efficacy of training programs
implemented by coaches with their athletes. Previous training studies with athletes have been
concerned with determining the outcome of an intervention with strict internal controls rather
than preserving ecological validity (29, 35). While these investigations are important for
establishing causality, studies with greater ecological validity are also necessary for greater
external validity to athletic populations, educating coaches, and developing relevant research
questions for future inquiry. There is often a disconnect between what track and field coaches
typically implement in their training, and what current research advocates for the development of
strength and power with these athletes (9, 11). Further research is needed to bridge this gap, and
enhance coaches’ education. Thus, the purpose of this study was to examine the effects of an
overreach and taper (ORT) on measures of muscle architecture, jumping, and throwing
performance in Division I collegiate throwers preparing for conference championships. Based on
previous training studies (1, 2, 6), we hypothesized that MT and PA would increase following
the pre/in-season training period (strength-endurance and strength emphasis blocks) and FL

47
would increase following the ORT (strength-power emphasized block). Corresponding with the
changes in FL, we also hypothesized CMJ and SJ variables, overhead shot-put throw (OHT),
underhand shot-put throw (UHT), and competition throwing performance (TP) would increase
following the ORT.
METHODS
Experimental Approach to the Problem
A repeated measures design was used to examine the effect of the ORT on muscle
characteristics, jumping and throwing performance measures. The study was conducted over a
12-week period consisting of the pre-season (3 weeks) and outdoor track and field competitive
season (9 weeks). Athletes were tested at the beginning of the pre-season to use as a baseline (T1)
for comparing pre-ORT (T2) and post-ORT (T3) testing.
Athletes
Seven National Collegiate Athletic Association (NCAA) Division I throwers were
recruited for the study; however, one athlete failed to complete the final testing session, therefore
only 6 were included in the analyses (4 male: 2 hammer, 2 discus; 2 female: 1 javelin, 1 hammer)
(20.6 ± 0.93 years, 182.3 ± 8.3 cm, 103.2 ± 23.1 kg). All 6 athletes were healthy and received no
nutritional supplements during the study period. All athletes signed an informed consent in
accordance with the guidelines set forth by the university’s Institutional Review Board.
Training
The throwers strength trained using a block periodization model comprised of sequenced
phases: strength-endurance, strength, and power over a 12-week period (Table 3.1). Maximal
strength was increased prior to explosiveness development through a combination of traditional
resistance training and weightlifting exercises using relative intensities to calculate loads. The

48
first 3 weeks were part of the specific preparation phase, and the following 9 weeks were part of
the outdoor track and field competitive season. During the specific preparation phase, emphasis
was placed on preparing the athletes for the competitive season. During the competitive season,
strength training volume was reduced and emphasis was placed on throw training and technique.
Strength training was conducted 2-4 days per week. Throwing training was implemented by the
coach 2-3 days per week. Prior to the taper, an overreaching week of increased strength training
volume was implemented at the coaches’ discretion. During the 3-week taper, training volume
was reduced exponentially leading up to the conference championship (Figure 3.1a and 3.1b).
The ORT implemented in this study was similar to the strength-power block performed by the
throwers in Stone et al. (34).
Figure 3.1a and 3.1b: Exponential reduction in strength training VLd and RPETL during ORT. VLd-volume-load
multiplied by bar displacement, RPETL- rating of perceived exertion training load, ORT-overreach and taper
0
2000
4000
6000
8000
10000
12000
9 10 11 12
VL
d (
kg
·m)
Week
0
500
1000
1500
2000
2500
3000
3500
9 10 11 12
RP
ET
L (
AU
)
Week
Practice
Strength Training
Competition

49
Table 3.1 Training program
BS-back squat, PP-push press, IBP-incline bench press, CP-clean pull, SLDL-stiff-leg deadlift, BOR-bent over row, PU-pull-up, PJ-push jerk, FS-front squat,
CGBP-clean grip bench press, MTP-mid-thigh pull, SP-snatch pull, PC-power clean, SJ-split jerk, EPU-explosive push-ups
Strength Training (1-3 days) SetxRep Relative Intensity Throwing Drills (2-3 days) Conditioning (1-2 days)
Week 1 BS, PP, IBP, CP, SLDL,
BOR, PU
3x10 MH (85-90%) turns with implement (no throws) 10x5, knee drop drill
5x5, half turn drill 3x5, clock drill 3x5
sprints- 2x10, 15m, 1x20m;
jumps- 4-stair and unilateral 2
stair 2x6, hurdle hops 3x5
Week 2 same as week 1 3x10 H (90-95%) same as week 1 same as week 1
Week 3 same as week 1 3x5 L (70-75%) turns with implement (no throws) 10x5, knee drop drill
5x5; clock drill 3x5, half turns 2-5reps, 3/4 turns 2-
5reps, 5-10 full throws
none
Week 4 1/2 squat w/ext., PJ, FS,
CGBP, IBP, MTP, SP, BOR,
SLDL, PU
5x5 MH (85-90%) knee drops 2x5, turn with implement 2x5, partial
throws 3-5, 3/4 turns 3-6, 10 full throws
sprints- 2x10, 15m; jumps- 4-
stair 4x6, unilateral 2 stair 2x6,
single-leg broad jump 3x3
Week 5 same as week 4 3x5 H (90-95%) knee drops 2x5, turn with implement 2x5, partial
throws 3-5, 2-3 half turns, 3-6 reps ¾ turns, 15 full
throws
same as week 1
Week 6 same as week 4 3x5 VH (95-100%) same as week 5 same as week 1
Week 7 1/2 squat w/ext., PJ, FS,
CGBP, IBP, MTP, SP, BOR,
SLDL, PU
3x5 L (70-75%) 2x5 knee drops, turn with implement 2x5, 2 standing
throws, 2 half turns, 3 reps ¾ turns, 3 partial throws, 5
full throws
Week 8 1/4 squat w/ext., SJ, BS,
IBP, PC, SP, SLDL, PU, PP,
MTP
3x3 M (80-85%) 2x5 knee drops, 2x5 of turn with implement, 2-3
standing throws, 2-3 half turns, 3-6 reps ¾ turns, 3-5
partial throws, 15 full throws
same as week 1
Week 9 1/4 squat w/ext., 1/2 squat
w/ext. SJ, IBP, PC, SP, CP,
BOR, PU
5x5 MH (85-90%) turn with implement 2x5, 2-3 standing throws, 2-3
step-half turns, 3-6 reps ¾ turns, 3-5 partial throws, 15
full throws
Sprints- 2x10m, 15, 20, 1x30m;
Jumps- 4-stair 4x6, unilateral 2
stair 2x6, single-leg lateral
jumps 2x5, hurdle hops 3x5
Week 10 1/4 squat w/ext., SJ, IBP,
PC, SP, BOR, PU
3x3 H (90-95%) same as week 9 same as week 9
Week 11 1/4 squat w/ext., SJ, IBP,
PC, SP, BOR, PU, PP, MTP
3x2 MH (85-90%) 3 partial throws, 1-2 standing throws, 2-3 step-half
turns, 5-10 full throws
same as week 9 plus broad to
vertical jumps 2x3
Week 12 1/4 squat w/ext., SJ, IBP,
EPU
2x2 ML (75-80%) 1-3 partial throws, 1-2 standing throws, 1-2 half turns,
1 3/4 turn, 3-5 full throws; mock competition to
preparation for conference championship
none

50
Training Load
Internal training load was estimated using a session rating of perceived exertion (sRPE) collected
on a 1-10 subjective scale. Based on previously established methods, sRPE was multiplied by the duration
of the session in minutes to form a rating of perceived exertion training load (RPETL) for all competitions
practices, and strength training sessions (12). Strength training volume load (VLd) was recorded weekly
for 12 weeks for all barbell lifts and was calculated using the following equation (14):
Volume Load (kg*m) = Mass of External Load (kg) x Repetitions x Displacement (m)
Vertical bar displacement was measured with a tape measure from the start position to terminal position
of the eccentric phase. Total RPETL and VLd were scaled per session for each athlete to compare training
volume completed between testing time points (T1-T2 compared to T2-T3).
Testing
Testing occurred at the beginning of each training week at least 48 hours following a
competition and after a scheduled off day from training. Athletes were instructed to refrain from
practicing and strength training 24 hours prior to each testing session. Athletes were given a 24-
hour dietary log to complete prior to T1 and were instructed to replicate the log prior to all
subsequent testing sessions. Athletes were tested on measures of vastus lateralis MT, PA, FL,
squat jump height (SJH), peak power and peak force allometrically scaled for body mass (SJPP,
and SJPF, respectively), and countermovement jump height (CMJH), peak power and peak force
allometrically scaled for body mass (CMJPP, CMJPF, respectively). Both jump conditions were
performed with 0kg and 40kg. Additionally, OHT, and UHT were performed at all three testing
sessions (T1, T2 and T3). Throwing performance was the best throw recorded at scheduled
outdoor competitions pre- and post-taper (T2 and T3).
Anthropometrics. Body mass was measured using a digital scale (Tanita B.F. 350, Tanita
Corp. of America, Inc., Arlington Heights, IL), and percent body fat was estimated from the sum

51
of 7 skinfold sites using a skinfold caliper (Lange, Beta Technology Inc., Cambridge, MD) (5).
All anthropometrics were measured at the same time of day by the same experienced assistant
for all testing sessions.
Muscle Architecture. Following anthropometric measures, muscle architecture
measurements of MT, PA, and FL were collected using non-invasive ultrasonography by the
same technician. Subjects laid supine with knees fully extended, and sampling location for the
vastus lateralis was determined by the point of intersection between the VL and 50% of the
distance between the greater trochanter and the lateral epicondyle of the femur (21). This
location was marked with permanent ink and the probe oriented longitudinally in the sagittal
plane, parallel to the muscle for each sample. The femur length of each athlete was recorded and
used for subsequent testing sessions to ensure proper placement of the probe. Muscle thickness
and PA were quantified in still images captured longitudinally in the transverse plane using the
measuring features of the ultrasound machine. Muscle thickness was determined as the distance
between subcutaneous adipose tissue-muscle interface and inter-muscular interface, and PA was
determined as the angles between the echoes of the deep aponeurosis of the muscle and the
echoes from interspaces among the fascicles (41). Fascicle length was calculated from MT and
PA using the following equation (21):
FL = MT · SIN (PA)-1
The ultrasound examiner took five images from each sonogram and those which showed the
largest and the smallest muscle thickness were excluded. The means of MT, PA, and FL were
assessed from the three remaining images (2). Repeated measurements yielded a coefficient of
variation of 0.05%, 2.6%, and 1.0% for MT, PA, and FL, respectively.

52
Squat and Countermovement Jumps. Following a dynamic warm-up, SJs with 0kg and
40kg were measured using dual force plates affixed side by side with a sampling frequency of
1000 Hz (Rice Lake, WI). The tester instructed the athlete to perform a squat to 90° of knee
flexion, measured using a handheld goniometer, and hold the position until the force-time trace
was stable. Once the force-time trace was stable, the tester shouted “3,2,1...jump” and the athlete
performed a maximal effort jump. Countermovement jumps with 0kg, and 40kg were performed
following SJs. During the CMJ the athletes were instructed to remain stable in an upright
position. Once the force-time trace was stable the tester shouted “3,2,1...jump” and the athlete
performed a maximal CMJ from a self-selected depth. All jump trials were recorded and
analyzed using a custom program (LabView 8.5.1, 8.6, and 2010, National Instruments Co.,
Austin, TX). Jump height was estimated from flight time using the formula: g·flight time2·8-1,
where “g” is the acceleration due to gravity. The average of two trials within 2cm was used for
analysis. Additional trials were performed when the difference in jump height between trials was
greater than 2cm. Peak power was determined as the maximal value obtained from the product of
the velocity-time and force-time trace and was allometrically scaled for athlete’s body mass.
Shot-Put Tests. Following the laboratory tests, athletes were tested on overhead shot put
throw (OHT) and underhand shot put throw (UHT) with a 7.26kg implement measured on the
same indoor throwing ring. These tests have been used previously to measure changes in
throwing performance in field athletes (37, 42). The OHT and UHT have also been shown to
correlate strongly with shot-put performance (36), and exhibit moderate to strong relationships
with MT measured via ultrasonography (44). A familiarization period was not prescribed as the
athletes regularly performed these throwing movements in their daily training warm-up. Athletes
were given at least 2 attempts for each throw with full recovery between throws. The average of

53
two throws within 30cm was used for analysis. Additional throws were performed when the
difference between throws was greater than 30cm.
Competition Throwing Performance. Throwing performance was measured during two
regularly scheduled outdoor competitions pre- and post-ORT (T2 and T3) according to NCAA
track and field rules. After completing a dynamic warm-up followed by 2-4 standing and partial
throws, athletes performed 3-6 maximal effort throws. Considering the athletes specialized in
different events, TP was normalized across events using z-scores calculated from the top 500
throws/year in division I over the past 5 years (z-score: -1.28 ± 0.99). The best competition
throw was converted to a z-score and used for statistical analysis.
Statistical Analyses
All data are reported as mean ± standard deviation (SD). Intraclass correlation
coefficients (ICCs) for all dependent variables ranged from 0.96 to 0.99. A Shapiro-Wilks
normality test was used to determine if the data were normally distributed. One-way repeated
measures ANOVA were calculated for all dependent variables to determine if there was a main
effect for time. Mauchly’s test of sphericity was calculated for the repeated measures analysis to
determine if the variance between all possible pairs of levels of the independent variable (time)
were equal. Pairwise comparisons between time points were calculated for all dependent
variables. Considering the exploratory nature of the study and to reduce the probability of
committing a Type II error, no correction was made for multiple comparisons. Alpha level for all
analyses was set at p≤0.05. Cohen’s d with 95% confidence intervals (CI) were calculated from
mean differences of all pairwise comparisons and were used to determine the magnitude of
performance change. Effect sizes values of 0.0, 0.2, 0.6, 1.2, 2.0, and 4.0 were interpreted as
trivial, small, moderate, large, very large, and nearly perfect, respectively (18). Analyses were

54
performed using SPSS software version 22 (IBM Co., New York, NY, USA), and Microsoft
Excel 2010 version 14 (Microsoft Corporation, Redmond, WA, USA).
RESULTS
There was a statistical reduction in weight training VLd/session (d=1.21, 95% CI [0.41,
2.0], p=0.01) and RPETL/session (d=0.96 [0.07, 1.9], p=0.04) between in-season (T1-T2) and
ORT (T2-T3) training phases. There were statistical time effects for MT (F(2,10)=4.703 p=0.04),
CMJPP 0kg (F(2,12)=4.187, p=0.04), and CMJPF 0kg (F(2,10)=7.051, p=0.01). Fisher’s least
significant difference revealed statistical improvements with small to moderate effect sizes for
MT (T1-T2: d=0.28 [0.04, 0.52], p=0.03; T1-T3: d=0.41 [0.15, 0.67], p=0.01) (Figure 3.2),
CMJPP with 0kg (T2-T3: d=0.31 [0.02, 0.6], p=0.04), CMJPF 0kg (T2-T3: d=0.59 [0.21, 0.97],
p=0.01; T1-T3: d=0.43 [0.03, 0.83], p=0.04) (Figure 3.3), and TP (T2-T3: d=0.50 [0.03, 0.97],
p=0.04) (Table 3.2). The average percentage improvement in TP was 6.3%. It is also worth
noting 5 out of 6 athletes improved OHT and TP pre- to post-ORT (Figure 3.4).

55
Table 3.2 Changes in dependent variables (mean±SD)
T1 T2 T3
Anthropometrics
Mass (kg) 103.23±23.14 102.63±24.22 102.49±23.56
Body Fat (%) 21.58±8.37 21.85±8.86 21.52±9.05
Muscle Architecture
Thickness (cm) 2.66±0.45 2.78±0.5* 2.84±0.5*
Pennation Angle (degrees) 21.74±4.46 22.57±2.28 21.58±4.23
Fascicle Length (cm) 7.42±2.06 7.28±1.3 7.85±1.18
Jumps
SJH 0kg (m) 0.28±0.07 0.27±0.08 0.27±0.08
SJPP 0kg (W/kg0.67) 217.57±52.15 213.36±51.76 220.17±58.53
SJPF 0kg (N/kg0.67) 102.09±16.24 101.14±14.9 104.04±16.21
SJH 40kg (m) 0.17±0.05 0.16±0.05 0.17±0.06
SJPP 40kg (W/kg0.67) 208.24±53.66 209.48±52.74 211.51±61.47
SJPF 40kg (N/kg0.67) 117.9±14.92 117.51±13.04 120.59±13.46#
CMJH 0kg (m) 0.32±0.08 0.31±0.09 0.33±0.1
CMJPP 0kg (W/kg0.67) 230.08±54.46 223.26±46.63 237.81±60.78#
CMJPF 0kg (N/kg0.67) 101.91±10.87 99.49±11.99 106.56±14.07*#
CMJH 40kg (m) 0.19±0.06 0.19±0.06 0.2±0.07
CMJPP 40kg (W/kg0.67) 222.75±57.38 222.34±45.12 227.9±57.63
CMJPF 40kg (N/kg0.67) 116.06±10.23 114.89±8.07 119.57±8.67#
Throws
OHT (m) 11.88±2.35 11.83±2.29 12.43±3.35
UHT (m) 11.25±2.14 11.61±2.63 11.48±2.47
TP (z-score) -1.22±1.07 -0.68±1.1# *significantly different from T1 (p<0.05), #significantly different from T2 (p<0.05), SJH-squat jump height, SJPP-
squat jump peak power, SJPF-squat jump peak force; CMJH-countermovement jump height; CMJPP-
countermovement jump peak power; CMJPF-countermovement jump peak force; OHT-overhead throw; UHT-
underhand throw, TP-competition throwing performance

56
Figure 3.2: Changes in MT overlaying weekly RPETL. *significantly different from T1 (p<0.05). MT-muscle
thickness, RPETL- rating of perceived exertion training load
Figure 3.3: Changes in CMJPF 0kg overlaying weekly RPETL. *significantly different from T1 (p<0.05),
#significantly different from T2 (p<0.05). CMJPF-countermovement jump relative peak force, RPETL-
rating of perceived exertion training load
2.55
2.6
2.65
2.7
2.75
2.8
2.85
2.9
0
500
1000
1500
2000
2500
3000
3500
4000
4500
1 2 3 4 5 6 7 8 9 10 11 12
MT
(cm
)
RP
ET
L (
AU
)
Week
Practice Strength Training Competition Muscle Thickness
*
*
94
96
98
100
102
104
106
108
0
500
1000
1500
2000
2500
3000
3500
4000
4500
1 2 3 4 5 6 7 8 9 10 11 12
CM
JPF
0kg
(N
/kg0
.67)
RP
ETL
(AU
)
Week
Practice Strength Training Competition CMJPF 0kg
*#

57
Figure 3.4: Individual changes in OHT and TP following ORT. OHT-overhead throw, TP-competition
throwing performance, ORT-overreach and taper
DISCUSSION
The purpose of this study was to examine the effects of a coach-designed overreaching
week followed by a 3-week taper on measures of muscle architecture, jumping, and throwing
performance in NCAA division I collegiate throwers preparing for conference championships.
The primary findings of this investigation are: 1) Increases in vastus lateralis MT and PA
following in-season training without any further alterations in muscle architecture after the ORT,
and 2) enhanced TP, CMJPF 0kg, and CMJPP 0kg following the ORT. Previous investigations
have reported similar improvements in strength and power outcomes following a tapering period
(34, 43). A finding unique to this study is the significant increase in vastus lateralis MT
corresponding with the greater weight training VL/session during the in-season training period
compared to the ORT.
-20.00%
-15.00%
-10.00%
-5.00%
0.00%
5.00%
10.00%
15.00%
20.00%
25.00%
1 2 3 4 5 6
Per
cen
tag
e C
ha
ng
e
OHT TP

58
These findings agree with previous research showing that there is lag time between the
initiation of a training stimulus and when its effects are realized (16, 40). This concept, known as
the long-term lag of the training effect, was originally proposed by Verkhoshansky (40) and
forms the basis of block periodization. This is evidenced by the improvements in measures of
throwing performance and explosive ability following the ORT even though weight training
VLd/session and RPETL/session were statistically reduced and there were no further observable
alterations in MT.
Increases in MT measured via ultrasonography have been observed following heavy
strength training (1, 20). Additionally, previous investigations have reported strong positive
correlations between vastus lateralis MT and the maximal isometric leg extension force (44).
Therefore, it appears the increases in MT during the pre/in-season training period may have
facilitated the later improvements in TP, CMJPP 0kg, and CMJPF 0kg following the ORT. In
agreement with Zaras et al. (44), no statistical alterations in muscle architecture (MT, PA, or FL)
were found following the tapering period. Blazevich et al. (6) reported increases in vastus
lateralis FL and MT following 5 weeks of sprint/jump training with athletes; however, groups
performing concurrent strength training and sprint/jump training increased PA and MT. In the
present study, strength and plyometric training volumes were statistically reduced during the
ORT, which may have attenuated further alterations in muscle architecture.
Training volume reductions coupled with greater emphasis on developing neuromuscular
power have been shown to result in myosin isoform shifts (IIa to IIx) (37), increases in MHC IIa
fiber size, peak force and absolute power (23, 39), and greater muscle activation (15).
Considering the training performed during the taper in the present study, these adaptations may
also be responsible for the observed performance improvements. However, these adaptations

59
were not quantified in the current investigation. Future research is necessary examining changes
in electromyographic activity, spinal and supra-spinal fatigue, muscle fiber gene expression and
contractile properties during the taper with strength-power athletes.
It has long been believed by coaches and researchers that a period of intensified training
prior to a taper (i.e. an overreach) will result in a greater supercompensation effect (17, 32, 38).
Functional overreaching results in an initial decrease in performance that is reversed and is often
accompanied by supercompensation following a short rest period. During non-functional
overreaching the recovery period is delayed and takes longer than desired with no performance
supercompensation (26). While overreaching has been shown to be an effective means of
improving endurance parameters and performance during a taper (4, 17, 38), limited evidence
exists supporting its efficacy with strength-power athletes (10, 13, 32). It is important to note that
CMJPF 0kg is the only variable that exhibited an observable supercompensation over baseline
values following the ORT. Also, it is unclear whether the overreaching week prior to the taper
was responsible for the performance improvements. Experimental studies with strength-power
athletes comparing tapering with and without a prior overreaching phase are necessary.
Mujika and Padilla (27) stated a realistic performance improvement to expect following a
taper is ~3% (0.5-6%) based on a review of the tapering literature with swimmers, runners,
cyclists, rowers, and triathletes. The findings of the current study agree with Zaras et al. (43) and
Stone et al. (34), who reported enhanced throwing performance following the tapering period in
collegiate throwers. Zaras and colleagues reported a mean performance improvement of 5.2%
following the taper with national level throwers. Stone and colleagues observed a shot put throw
improvement of 3.1% and weight throw improvement of 4.3% following an overreach and taper
with collegiate throwers. A similar mean improvement of 6.3% was found in the current study

60
following the taper. Considering the difference between first and fourth place for men’s discus at
the 2015 NCAA division I national championships was <2.5%, the taper could make the
difference between winning a medal or failing to make the podium.
In conclusion, the pre/in-season training appeared to elicit increases in MT, whereas the
ORT resulted in improved explosive ability in the absence of further detectable changes in
muscle architecture. Additionally, the ORT appeared to augment TP at the conference
championships and national ranking, which may have been due to the reduced RPETL and VLd.
Collegiate throwers may benefit from an ORT phase where training load is exponentially
reduced prior to an important competition.
PRACTICAL APPLICATIONS
The findings of this study show that an overreaching week followed by a 3-week taper is
an effective means of improving explosive ability and throwing performance in collegiate track
and field throwers. Coaches working with collegiate throwers should develop an annual plan
based on the athlete’s competition schedule and highlight the most important competition(s) to
appropriately plan the taper. During the taper, coaches should significantly reduce training
volume while maintaining or increasing relative training intensity (≥85% 1-RM). Greater
emphasis should be placed on developing neuromuscular power using variations of the
weightlifting movements, potentiation complexes, ballistic and plyometric drills performed with
maximal movement intent. Based on this study and previous findings with track and field
throwers, coaches and athletes can realistically expect a 3.1-6.3% performance improvement
following the taper.
61
ACKNOWLEDGMENTS
The authors wish to confirm that there is no conflict of interest associated with this
publication and that there has been no financial support for this work that could have influenced
its outcome. The authors would like to thank the graduate students who assisted in the
implementation of the training program and data collection.
REFERENCES
1. Aagaard P, Andersen JL, Dyhre-Poulsen P, Leffers AM, Wagner A, Magnusson SP,
Halkjaer-Kristensen J, and Simonsen EB. A mechanism for increased contractile strength
of human pennate muscle in response to strength training: changes in muscle architecture.
J Physiol 534: 613-623, 2001.
2. Alegre LM, Jimenez F, Gonzalo-Orden JM, Martin-Acero R, and Aguado X. Effects of
dynamic resistance training on fascicle length and isometric strength. J Sports Sci 24:
501-508, 2006.
3. Andersen LL, Andersen JL, Magnusson SP, Suetta C, Madsen JL, Christensen LR, and
Aagaard P. Changes in the human muscle force-velocity relationship in response to
resistance training and subsequent detraining. J Appl Physiol (1985) 99: 87-94, 2005.
4. Aubry A, Hausswirth C, Louis J, Coutts AJ, and Y LEM. Functional overreaching: the
key to peak performance during the taper? Med Sci Sports Exerc 46: 1769-1777, 2014.
5. Ball SD, Altena TS, and Swan PD. Comparison of anthropometry to DXA: a new
prediction equation for men. Eur J Clin Nutr 58: 1525-1531, 2004.
6. Blazevich AJ, Gill ND, Bronks R, and Newton RU. Training-specific muscle architecture
adaptation after 5-wk training in athletes. Med Sci Sports Exerc 35: 2013-2022, 2003.

62
7. Bosquet L, Montpetit J, Arvisais D, and Mujika I. Effects of tapering on performance: a
meta-analysis. Med Sci Sports Exerc 39: 1358-1365, 2007.
8. Brechue WF and Abe T. The role of FFM accumulation and skeletal muscle architecture
in powerlifting performance. Eur J Appl Physiol 86: 327-336, 2002.
9. Cormie P, McGuigan MR, and Newton RU. Developing maximal neuromuscular power:
part 2 - training considerations for improving maximal power production, Sports Med.
New Zealand, 2011, pp 125-146.
10. Coutts A, Reaburn P, Piva TJ, and Murphy A. Changes in selected biochemical, muscular
strength, power, and endurance measures during deliberate overreaching and tapering in
rugby league players. Int J Sports Med 28: 116-124, 2007.
11. DeWeese BH, Sams ML, Williams JH, and Bellon CR. The nature of speed: enhancing
sprint abilities through a short to long training approach. Techniques Magazine. New
Orleans, LA: U.S. Track & Field and Cross Country Coaches Association, 2015, p 23.
12. Foster C, Florhaug JA, Franklin J, Gottschall L, Hrovatin LA, Parker S, Doleshal P, and
Dodge C. A new approach to monitoring exercise training. J Strength Cond Res 15: 109-
115, 2001.
13. Fry AC, Kraemer WJ, Stone MH, Warren BJ, Fleck SJ, Kearney JT, and Gordon SE.
Endocrine responses to overreaching before and after 1 year of weightlifting. Canadian
journal of applied physiology 19: 400-410, 1994.
14. Haff GG. Quantifying workloads in resistance training: a brief review. Strength and
Conditioning Journal 10: 31-40, 2010.

63
15. Hakkinen K, Kallinen M, Komi PV, and Kauhanen H. Neuromuscular adaptations during
short-term "normal" and reduced training periods in strength athletes. Electromyography
and clinical neurophysiology 31: 35-42, 1991.
16. Harris GR, Stone MH, O'Bryant HS, Proulx CM, and Johnson RL. Short-term
performance effects of high power, high force, or combined weight-training methods. J
Strength Cond Res 14: 14-20, 2000.
17. Hellard P, Avalos M, Hausswirth C, Pyne D, Toussaint JF, and Mujika I. Identifying
Optimal Overload and Taper in Elite Swimmers over Time. J Sports Sci Med 12: 668-
678, 2013.
18. Hopkins WG. A scale of magnitudes for effect statistics. A new view of statistics, 2002.
19. Ikai M and Fukunaga T. A study on training effect on strength per unit cross-sectional
area of muscle by means of ultrasonic measurement. Internationale Zeitschrift fur
angewandte Physiologie, einschliesslich Arbeitsphysiologie 28: 173-180, 1970.
20. Kawakami Y, Abe T, Kuno SY, and Fukunaga T. Training-induced changes in muscle
architecture and specific tension. Eur J Appl Physiol Occup Physiol 72: 37-43, 1995.
21. Kumagai K, Abe T, Brechue WF, Ryushi T, Takano S, and Mizuno M. Sprint
performance is related to muscle fascicle length in male 100-m sprinters. Journal of
Applied Physiology 88: 811-816, 2000.
22. Le Meur Y, Hausswirth C, and Mujika I. Tapering for competition: a review. Science &
Sports 27: 77-87, 2012.
23. Luden N, Hayes E, Galpin A, Minchev K, Jemiolo B, Raue U, Trappe TA, Harber MP,
Bowers T, and Trappe S. Myocellular basis for tapering in competitive distance runners.
J Appl Physiol (1985) 108: 1501-1509, 2010.

64
24. McCaulley GO, McBride JM, Cormie P, Hudson MB, Nuzzo JL, Quindry JC, and Travis
Triplett N. Acute hormonal and neuromuscular responses to hypertrophy, strength and
power type resistance exercise. European Journal of Applied Physiology 105: 695-704,
2009.
25. McMahon JJ, Turner A, and Comfort P. Relationships between lower body muscle
structure and maximal power clean performance. Journal of Trainology 4: 32-36, 2015.
26. Meeusen R, Duclos M, Foster C, Fry A, Gleeson M, Nieman D, Raglin J, Rietjens G,
Steinacker J, and Urhausen A. Prevention, diagnosis, and treatment of the overtraining
syndrome: joint consensus statement of the European College of Sport Science and the
American College of Sports Medicine. Med Sci Sports Exerc 45: 186-205, 2013.
27. Mujika I and Padilla S. Scientific bases for precompetition tapering strategies. Med Sci
Sports Exerc 35: 1182-1187, 2003.
28. Murach K, Raue U, Wilkerson B, Minchev K, Jemiolo B, Bagley J, Luden N, and Trappe
S. Single muscle fiber gene expression with run taper. PloS one 9: e108547, 2014.
29. Nimphius S, McGuigan MR, and Newton RU. Changes in muscle architecture and
performance during a competitive season in female softball players. J Strength Cond Res
26: 2655-2666, 2012.
30. Pritchard H, Keogh J, Barnes M, and McGuigan M. Effects and mechanisms of tapering
in maximizing muscular strength. Strength and Conditioning Journal 37: 72-83, 2015.
31. Secomb JL, Lundgren LE, Farley OR, Tran TT, Nimphius S, and Sheppard JM.
Relationships Between Lower-Body Muscle Structure and Lower-Body Strength, Power,
and Muscle-Tendon Complex Stiffness. J Strength Cond Res 29: 2221-2228, 2015.

65
32. Stone MH, Fry AC, Thrush J, Fleck SJ, Kraemer WJ, Kearney JT, and and Marsit J.
Overtraining in weightlifters. Presented at Weightlifting Symposium, Ancient Olympia,
Greece, 1993.
33. Stone MH, Sanborn K, O'Bryant HS, Hartman M, Stone ME, Proulx C, Ward B, and
Hruby J. Maximum strength-power-performance relationships in collegiate throwers.
Journal of Strength and Conditioning Research 17: 739-745, 2003.
34. Stone MH, Sanborn K, O'Bryant HS, Hartman M, Stone ME, Proulx C, Ward B, and
Hruby J. Maximum strength-power-performance relationships in collegiate throwers. J
Strength Cond Res 17: 739-745, 2003.
35. Stone MH, Sands WA, and Stone ME. The downfall of sports science in the United
States. Strength and Conditioning Journal 26: 72-75, 2004.
36. Terzis G, Spengos K, Kavouras S, Manta P, and Georgiadis G. Muscle fibre type
composition and body composition in hammer throwers. J Sports Sci Med 9: 104-109,
2010.
37. Terzis G, Stratakos G, Manta P, and Georgiadis G. Throwing performance after
resistance training and detraining. J Strength Cond Res 22: 1198-1204, 2008.
38. Thomas L and Busso T. A theoretical study of taper characteristics to optimize
performance. Med Sci Sports Exerc 37: 1615-1621, 2005.
39. Trappe S, Costill D, and Thomas R. Effect of swim taper on whole muscle and single
muscle fiber contractile properties. Med Sci Sports Exerc 32: 48-56, 2000.
40. Verkhoshansky UV. The long-lasting training effect of strength exercises. Soviet Sports
Review 20: 1-3, 1985.

66
41. Wells AJ, Fukuda DH, Hoffman JR, Gonzalez AM, Jajtner AR, Townsend JR, Mangine
GT, Fragala MS, and Stout JR. Vastus lateralis exhibits non-homogenous adaptation to
resistance training. Muscle Nerve 50: 785-793, 2014.
42. Zaras N, Spengos K, Methenitis S, Papadopoulos C, Karampatsos G, Georgiadis G,
Stasinaki A, Manta P, and Terzis G. Effects of strength vs. ballistic-power training on
throwing performance. J Sports Sci Med 12: 130-137, 2013.
43. Zaras ND, Stasinaki AN, Krase AA, Methenitis SK, Karampatsos GP, Georgiadis GV,
Spengos KM, and Terzis GD. Effects of tapering with light vs. heavy loads on track and
field throwing performance. J Strength Cond Res 28: 3484-3495, 2014.
44. Zaras ND, Stasinaki AN, Methenitis SK, Krase AA, Karampatsos GP, Georgiadis GV,
Spengos KM, and Terzis GD. Rate of force development, muscle architecture, and
performance in young competitive track and field throwers. J Strength Cond Res 30: 81-
92, 2016.
45. Zhou S, McKenna MJ, Lawson DL, Morrison WE, and Fairweather I. Effects of fatigue
and sprint training on electromechanical delay of knee extensor muscles. Eur J Appl
Physiol Occup Physiol 72: 410-416, 1996.

67
CHAPTER 4
CHANGES IN MUSCLE ARCHITECTURE AND EXPLOSIVE ABILITY IN NCAA
DIVISON I WOMEN’S VOLLEYBALL ATHLETES THROUGHOUT A COMPETITIVE
SEASON AND FOLLOWING A TAPER.
Authors: 1Caleb D. Bazyler, 1Satoshi Mizuguchi, 2Timothy J. Suchomel, 3Christopher J. Sole, 1Sato
Kimitake, 1Ashley A. Kavanaugh, 1Brad H. DeWeese, 1Michael H. Stone
Affiliations: 1Center of Excellence for Sport Science and Coach Education, Department of Exercise and
Sport Science, East Tennessee State University, Johnson City, TN
2Department of Exercise Science, East Stroudsburg University, East Stroudsburg, Pennsylvania
3Department of Health, Exercise, and Sport Science, The Citadel, Charleston, South Carolina

68
ABSTRACT
PURPOSE: The purpose was to examine changes in muscle architecture and explosive ability in
NCAA division I collegiate volleyball players throughout a competitive season. METHODS:
Ten female volleyball players (20.4 ± 1.1 y, 178.3 ± 4.8 cm, 72.6 ± 5.3 kg) were tested at pre-
season (T1), pre-taper (T2), and post-taper (T3) on measures of vastus lateralis muscle thickness
(MT), pennation angle (PA) and fascicle length (FL) using ultrasonography, and unloaded and
loaded squat jump height (SJH) and peak power allometrically scaled for body mass (SJPPa) on
a force platform. Total rating of perceived exertion training load (RPETL) and strength training
volume-load multiplied by displacement (VLd) were monitored weekly. RESULTS: There was a
reduction in VLd/wk (p<0.001, d=3.1) and RPETL/wk (p<0.001, d=2.7) between in-season (T1-
T2) and tapering (T2-T3) training phases. Athlete’s MT (p<0.001, d=2.8) and PA increased
(p=0.02, d=3.9) following in-season training. However, MT decreased following the taper
(p=0.01, d=0.6), but remained elevated above pre-season values (p<0.001, d=1.7). There were no
statistical changes in FL, SJH or SJPPa. Large to very large, negative relationships (r=-0.51 to -
0.81) were observed between relative maximal strength at T1 and changes in SJH and SJPPa
with various loads over the season. CONCLUSION: In-season training resulted in favorable
changes in muscle architecture, which remained elevated above pre-season values following the
taper; however, these changes did not appear to appreciably alter explosive ability throughout the
competitive season. Stronger athletes may benefit from an overreaching microcycle prior to the
taper to preserve previously accrued muscular adaptations and explosive ability.
Keywords: jump height, peak power, muscle thickness, strength, training load
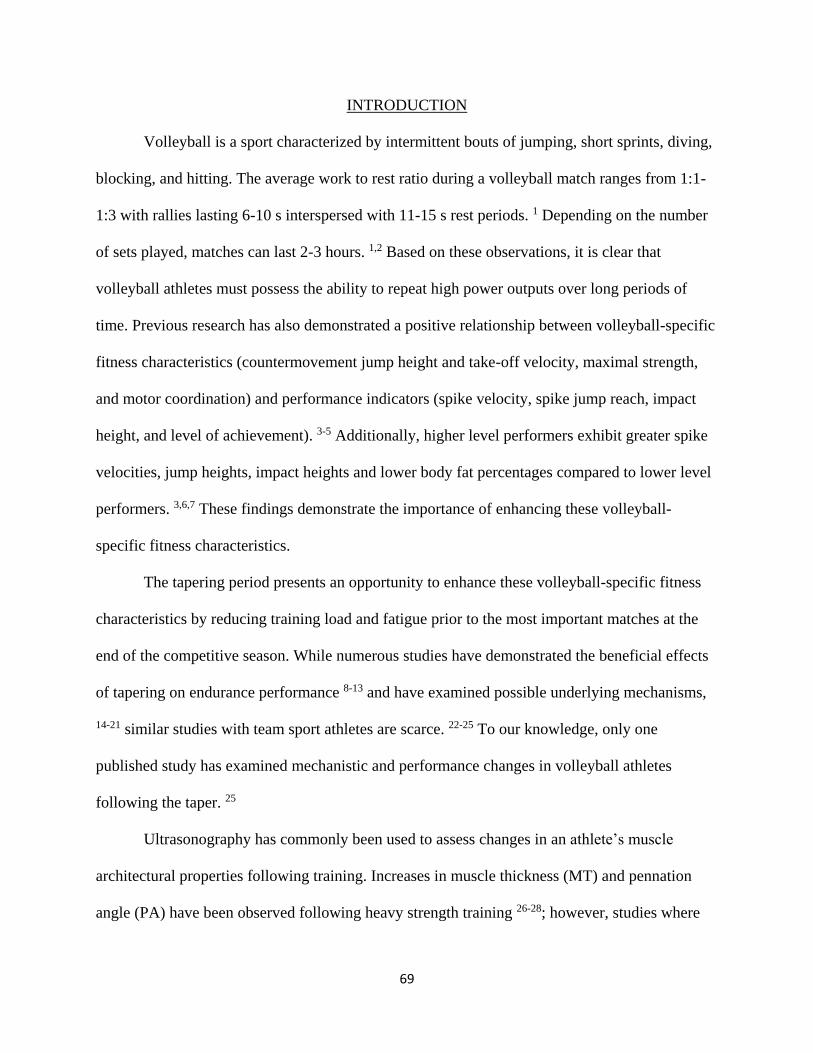
69
INTRODUCTION
Volleyball is a sport characterized by intermittent bouts of jumping, short sprints, diving,
blocking, and hitting. The average work to rest ratio during a volleyball match ranges from 1:1-
1:3 with rallies lasting 6-10 s interspersed with 11-15 s rest periods. 1 Depending on the number
of sets played, matches can last 2-3 hours. 1,2 Based on these observations, it is clear that
volleyball athletes must possess the ability to repeat high power outputs over long periods of
time. Previous research has also demonstrated a positive relationship between volleyball-specific
fitness characteristics (countermovement jump height and take-off velocity, maximal strength,
and motor coordination) and performance indicators (spike velocity, spike jump reach, impact
height, and level of achievement). 3-5 Additionally, higher level performers exhibit greater spike
velocities, jump heights, impact heights and lower body fat percentages compared to lower level
performers. 3,6,7 These findings demonstrate the importance of enhancing these volleyball-
specific fitness characteristics.
The tapering period presents an opportunity to enhance these volleyball-specific fitness
characteristics by reducing training load and fatigue prior to the most important matches at the
end of the competitive season. While numerous studies have demonstrated the beneficial effects
of tapering on endurance performance 8-13 and have examined possible underlying mechanisms,
14-21 similar studies with team sport athletes are scarce. 22-25 To our knowledge, only one
published study has examined mechanistic and performance changes in volleyball athletes
following the taper. 25
Ultrasonography has commonly been used to assess changes in an athlete’s muscle
architectural properties following training. Increases in muscle thickness (MT) and pennation
angle (PA) have been observed following heavy strength training 26-28; however, studies where

70
subjects trained with high-velocity contractions (e.g. sprint/jump training) and lighter loads
(<60% 1-RM) have reported increases in fascicle length (FL) with no changes in PA. 29,30
Previous evidence has also demonstrated contraction mode specific alterations in PA and FL.
Specifically, Franchi et al. 31 have demonstrated eccentric loading of the knee extensors increases
vastus lateralis FL and heavy concentric loading increases PA. Considering volleyball athletes
perform both eccentric and concentric contractions during stretch-shortening cycle actions in
practice and strength training sessions, it is possible that increases in PA and FL may occur
following training.
Moderate to strong correlations have been observed between vastus lateralis MT, FL and
squat (SJ) and countermovement height, isometric mid-thigh pull peak force, 1-RM (repetition
maximum) back squat and sprint performance in various athletic groups. 32-35 Considering these
findings, leg extensor muscle architecture appears to play an important role in fitness
characteristics specific to volleyball performance and may explain alterations in these
characteristics following training. Also, to our knowledge, no published research has examined
changes in muscle architecture with volleyball athletes throughout the competitive season and
following a taper. Therefore, the purpose of this study was to examine changes in muscle
architecture and explosive ability in National Collegiate Athletic Association (NCAA) division I
collegiate volleyball players throughout a competitive season in preparation for conference
championships.
METHODS
Athletes
Fourteen Division I NCAA volleyball players were recruited for the study; however, four
athletes failed to complete all testing sessions, and therefore only ten were included in the

71
analyses (age: 20.4 ± 1.1 y, height: 178.3 ± 4.8 cm, mass: 72.6 ± 5.3 kg). All athletes had at least
1 year of strength training experience and received no nutritional supplements during the study
period. The study was performed as part of the athlete’s training in preparation for conference
championships. All subjects signed an informed consent form in accordance with the guidelines
set forth by the University’s Institutional Review Board.
Procedures
Training. The athletes trained using a block periodization model that comprised of
sequenced phases: strength, strength-speed, speed-strength, and a taper over a 15-week period
(Table 4.1). Maximal strength was increased prior to explosiveness development through a
combination of traditional resistance training and weightlifting exercises using relative intensities
to calculate loads. The first two weeks were part of the specific preparation phase and the
following 13 weeks were part of the NCAA competitive season. During the specific preparation
phase, emphasis was placed on preparing the athletes for the competitive season. During the
competitive season, strength training volume was reduced and emphasis was placed on
maximizing neuromuscular power and managing fatigue. Strength training was conducted 1-2
days per week during the season with most weeks consisting of 3-4 practice sessions and two
competitions. Strength training volume loads were calculated using percentage of RM values for
sets and repetitions.
Table 4.1: Strength training program
Week Testing Block
Frequency
(days/week) Set x rep
Relative
Training
Intensity Exercises
Week1 T1
Strength
2 3x5 (1x5) M (80-85%) MTP, MTC, BS,
MGBP, BOR Week2 2 3x5 (1x5) MH (85-90%)
Week3 2 3x3 (1x5) H (90-95%)

72
Week4 2 3x3 (1x5) ML (75-80%)
Week5
Strength-
Speed
2 3x5 (1x5) M (80-85%)
MTP, MTSP, BS,
CGBP, DBBOR
Week6 2 3x3 (1x5) MH (85-90%)
Week7 1 3x3 (1x5) MH (85-90%)
Week8 2 3x2 (1x5) L (70-75%)
Week9 Speed-
Strength
1 3x3 L (70-75%) MTP, BS, CGBP,
MBCP Week10 2 3x3 MH (80-85%)
Week11 0 did not lift
Week12 T2
Taper
1 3x5 (1x5) MH (85-90%) MTP, BS (week 1
only), 1/4 BS, IBP,
MBS, MBCP
Week13 1 3x3 (1x5) M (80-85%)
Week14 1 3x2 (1x5) H (90-95%)
Week15 0 did not lift
Week16 T3 Active Rest 0 did not lift
MTP-mid-thigh pull, MTC-mid-thigh clean, BS-back squat, mid-grip bench press, BOR-bent over row, MTSP-mid-
thigh snatch pull, CGBP-clean grip bench press, DBBOR-dumbbell bent over row, MBCP-medicine chest pass,
IBP-incline bench press, MBS-medicine ball slam
Training Load. Internal training load was estimated using a session rating of perceived
exertion collected on a 1-10 subjective scale. Rating of perceived exertion was multiplied by the
duration of the session in minutes to form a rating of perceived exertion training load (RPETL)
for all competitions, practices, and strength training sessions. 36 Strength training volume-load
(VLd) was recorded weekly for all barbell lifts and was calculated using the following equation
37: Volume Load (kg*m) = Mass of External Load (kg) x Repetitions x Displacement (m)
Vertical bar displacement was measured manually from the start position to terminal position of
the lift. Total RPETL and VLd were scaled per week for each athlete to compare training volume
completed between testing time points (T1-T2 compared to T2-T3). Total RPETL was reduced by
47 ± 11% over the 4-week taper leading up to the conference championship (Figure 4.1a and
4.1b).

73
Figure 4.1a and 4.1b: Changes in weekly total RPETL and VLd
Testing
The study was conducted over a 15-week period consisting of the pre-season and
competitive season. Body mass, body fat percentage, vastus lateralis MT, PA, FL, squat jump
height (SJH), and peak power allometrically scaled for body mass (SJPPa) with 0kg, 11kg, 20kg,
30kg, and 40kg were assessed during the pre-season (T1), pre-taper (T2), and post-taper (T3).
Back squat 1-RM was estimated from the Epley equation (1985) using the athlete’s 3RM back
squat from week three training and was allometrically scaled for body mass (BS 1RMa) to
provide a descriptive measure of relative maximal strength. Testing was conducted at the
beginning of the week at the same time of day (06:30-08:30 h) for all testing sessions. Athletes
were instructed to refrain from practicing and strength training 24 hours prior to each testing
session.
Anthropometrics. Body mass was measured using a digital scale (Tanita B.F. 350, Tanita
Corp. of America, Inc., Arlington Heights, IL), and body fat percentage was estimated from the
sum of 7 skinfold sites using a skinfold caliper (Lange, Beta Technology Inc., Cambridge, MD)
38. All anthropometrics were measured at the same time of day by the same experienced assistant
for all testing sessions.
0
1000
2000
3000
4000
5000
6000
7000
1 2 3 4 5 6 7 8 9 10 11 12 13 14 15
RP
ET
L (
a.u
.)
Week
0
500
1000
1500
2000
2500
3000
3500
4000
4500
1 2 3 4 5 6 7 8 9 10 11 12 13 14 15
VL
d (
kg
*m
)
Week

74
Muscle Architecture. Following anthropometric measures, vastus lateralis MT, PA, and
FL were collected using non-invasive ultrasonography (LOGIQ P6, General Electric Medical
Systems, Wauwatosa, WI) by an experienced technician (>500 ultrasounds performed on
athletes). The athlete laid on their left side with their hips perpendicular to the examination table
in the axial plane with a knee angle set at 120 ± 5º angle as measured by a goniometer. Sampling
location for the vastus lateralis was determined as 5cm medial to 50% of the distance between
the greater trochanter and the lateral epicondyle of the femur. 39 The location was marked with
permanent ink and the probe oriented parallel to the muscle length for each sample. The femur
length of each athlete was recorded and used for subsequent testing sessions to ensure proper
placement of the probe. Muscle thickness and PA were quantified in still images captured
longitudinally in the transverse plane using the manufacturer’s measuring features. Muscle
thickness was determined as the distance between subcutaneous adipose tissue-muscle interface
and inter-muscular interface, and PA was determined as the angle between the echoes of the deep
aponeurosis of the muscle and the echoes from interspaces among the fascicles. 39 Fascicle
length was calculated from MT and PA using the following equation 40: FL = MT · SIN (PA)-1
The ultrasound examiner took five images from each sonogram and those which showed the
largest and the smallest MT were excluded. The means of MT, PA, and FL were assessed from
the three images left and used for further analysis. 30 Repeated measurements yielded a
coefficient of variation (CV) of 0.03%, 3.29%, 2.69% and intraclass correlation coefficients
(ICCs) of 0.99, 0.86, 0.95 for MT, PA, and FL, respectively.
Squat Jumps. Following a dynamic warm-up, SJs were performed on dual force plates
affixed side by side with a sampling frequency of 1000 Hz (Rice Lake Weighing Systems, Rice
Lake, WI). The SJs were performed with a polyvinyl coated pipe (0kg) and loaded barbell (11kg,

75
20kg, 30kg, and 40kg) placed across the shoulders. The tester instructed the athlete to perform a
squat to 90° knee angle, measured using a handheld goniometer, and hold the position until the
force-time trace was stable. Once the force-time trace was stable, the tester shouted
“3,2,1...jump” and the athlete performed a maximal effort jump. All jump trials were recorded
and analyzed using a custom program (LabView 8.5.1, 8.6, and 2010, National Instruments Co.,
Austin, TX). Jump height was estimated from flight time using the formula: g·flight time2·8-1,
where “g” is a constant of 9.81 m∙s-2 for the acceleration due to gravity. 41 Peak power was
determined as the maximal value obtained during the concentric phase of the jump. 42 The
average of two best trials within a 2cm difference in jump height was used for analysis.
Additional trials were performed when the difference between two trials was greater than 2cm.
Intraclass correlation coefficients for all SJ variables ranged from r=0.93 to 0.99.
Statistical Analyses
All data are reported as mean ± standard deviation (SD). A Shapiro-Wilks normality test
was used to determine if the data were normally distributed. One-way repeated measures
ANOVA were calculated for body mass, body fat percentage, MT, PA, and FL. A 3 x 5 (time by
load) repeated measures ANOVA was used to analyze changes in SJH and SJPPa. Mauchly’s
test of sphericity was calculated for the repeated measures analysis to determine if the variance
between all possible pairs of levels of the independent variables were equal. If sphericity was
violated Huynh-Feldt results were reported when the epsilon correction factor was >0.75, and
Greenhouse-Geisser results were reported when the epsilon correction factor was <0.75 43.
Statistical time effects were followed by post-hoc comparisons. Alpha level for all analyses was
set at p≤0.05 and a Benjamini-Hochberg adjustment was used to correct for multiple
comparisons and control the false discovery rate. 44 Cohen’s d with 95% confidence intervals

76
(CI) were calculated for all statistical post-hoc comparisons and were used to determine the
magnitude of performance change. Effect sizes values of 0.0, 0.2, 0.6, 1.2, 2.0, and 4.0 were
interpreted as trivial, small, moderate, large, very large, and extremely large, respectively. 45
Relationships between estimated back squat 1-RM, mean change in muscle architecture and SJ
variables, and training load completed from T1 to T3 were evaluated using Pearson product-
moment zero order correlation coefficients. Effect size magnitudes for correlations were based
on the following scale: trivial, ≤0.10; small, 0.10–0.29; moderate, 0.30–0.49; large, 0.50–0.69;
very large, 0.70–0.89; and nearly perfect, ≥0.90. 45 Analyses were performed using SPSS
software version 23 (IBM Co., New York, NY, USA), and Microsoft Excel 2013 version 15
(Microsoft Corporation, Redmond, WA, USA).
RESULTS
There were statistical changes in multiple dependent variables across time (Table 4.2).
There was a statistical reduction in weight training VLd/session (p<0.001, d=3.12, 95% CI [2.3,
3.0]) and RPETL/session (p<0.001, d=3.12 [0.07, 1.9]) between training phases (T1-T2 compared
to T2-T3). There were statistical time effects for body mass (F(2,18)=5.98, p=0.03), body fat
percentage (F(2,18)=9.33, p=0.01), MT (F(2,18)=37.78 p<0.001), and PA (F(2,18)=4.57,
p=0.03). There were no statistical time effects for FL. There were no statistical time by load
interactions or time effects for SJH and SJPPa. Post-hoc comparisons revealed statistical
decreases in body mass (T1-T3: p=0.03, d=0.32 [0.12, 0.87]; T2-T3: p=0.02, d=0.22 [0.07, 0.74]),
and body fat percentage (T1-T3: p=0.008, d=0.48 [0.29, 0.78]; T2-T3: p<0.001, d=0.48 [0.34,
0.68]). MT statistically increased from T1-T2 (p<0.001, d=2.8 [1.7, 4.6]) and from T1-T3
(p<0.001, d=1.7 [1.3, 2.2]); however there was a statistical decrease from T2-T3 (Figure 4.2,
p=0.01, d=0.6 [0.42, 0.86]). PA statistically increased from T1-T2 (p=0.02, d=3.9 [1.3, 12]).

77
Table 4.2: Changes in dependent variables over time
Mean±SD Cohen's d
T1 T2 T3 T1-T2 T1-T3 T2-T3
Anthropometrics
Mass (kg) 72.57±5.31 71.69±4.93 70.79±4.55*# 0.17 0.34 0.18
Body Fat (%) 22.29±4.3 21.82±3.31 20.24±3.25*# 0.11 0.48 0.48
Muscle Architecture
Thickness (cm) 2.1±0.3 2.96±0.54* 2.63±0.36*# 2.87 1.77 0.61
Pennation Angle (degrees) 12.59±0.81 15.76±3.38* 15.37±3.86 3.91 3.43 0.12
Fascicle Length (cm) 9.52±1.91 11.31±1.83 10.45±1.56 0.94 0.49 0.47
Jumps
SJH 0kg (m) 0.28±0.03 0.29±0.02 0.29±0.03 0.33 0.33 0.00
SJPPa 0kg (W·kg-0.67) 212.18±21.79 216.82±19.37 210.59±22.08 0.21 0.07 0.32
SJH 11kg (m) 0.24±0.04 0.25±0.02 0.25±0.03 0.25 0.25 0.00
SJPPa 11kg (W·kg-0.67) 208.24±25 209.43±16.9 204.74±24.02 0.05 0.14 0.28
SJH 20kg (m) 0.21±0.04 0.2±0.03 0.21±0.03 0.25 0.00 0.33
SJPPa 20kg (W·kg-0.67) 206.93±24.26 208.39±17.45 204.64±20.79 0.06 0.09 0.21
SJH 30kg (m) 0.18±0.03 0.18±0.02 0.17±0.03 0.00 0.33 0.50
SJPPa 30kg (W·kg-0.67) 203.95±25.35 209.16±22.25 203.73±19.1 0.21 0.01 0.24
SJH 40kg (m) 0.15±0.04 0.14±0.03 0.14±0.02 0.25 0.25 0.00
SJPPa 40kg (W·kg-0.67) 197.57±26.28 203.08±22.26 197.74±20.24 0.21 0.01 0.24
*significantly different from T1 (p<0.05), #significantly different from T2 (p<0.05). SJH-squat jump height, SJPPa-
squat jump peak power allometrically scaled for body mass

78
Figure 4.2: Changes in vastus lateralis MT and PA from T2 to T3. MT-muscle thickness, PA-pennation
angle
There was a nearly perfect, positive relationship between BS 1RMa and VLd completed
from T1 to T3 (r=0.93, p<0.001). There were large to very large, negative relationships between
BS 1RMa and mean change in SJPPa from T1 to T3 with 0kg (Figure 4.3, r=-0.8, p<0.01), 11kg
(r=-0.7, p=0.02), 20kg (r=-0.81, p<0.01), 30kg (r=-0.55, p=0.1), 40kg (r=-0.51, p=0.13).
Similarly, there were large negative relationships between BS 1RMa and mean change in SJH
from T1 to T3 with 20kg (r=-0.53, p=0.12), 30kg (r=-0.64, p=0.04), and 40kg (r=-0.53, p=0.12).
Changes in MT, PA, and FL from T1 to T3 were not statistically related to any other variable
assessed. Also, there were no statistical relationships between RPETL completed from T1 to T3
and any other variable assessed.
T2: Pre-Taper T3: Post-Taper
1: MT
2: PA
1: MT
2: PA

79
Figure 4.3: Relationship between BS 1RMa and mean change from T1 to T3 in SJPPa with 0kg. The two
strongest athletes are circled above for applications stated in the discussion.
DISCUSSION
The primary findings in this investigation include positive alterations in collegiate female
volleyball athletes vastus lateralis muscle architecture, and preserved explosive ability over the
competitive season while performing a periodized training program. Additionally, the tapering
period resulted in large decreases in body fat percentage and moderate decreases in vastus
lateralis MT with no statistical changes in jumping performance. Although no time effect was
observed, effect sizes indicated a small decreasing trend in SJPPa with all loads following the
tapering period. Large to very large, negative relationships were observed between maximal
strength and changes in SJPPa and SJH with various loads. Additionally, there were no statistical
relationships between changes in muscle architecture variables over the course of the season and
any other variables assessed. These findings indicate: 1) explosive ability and vastus lateralis
muscle architecture can be maintained close to pre-season levels following a taper despite large
reductions in practice and strength training volumes, and 2) vastus lateralis architecture is highly
R² = 0.6399
-60
-50
-40
-30
-20
-10
0
10
20
30
40
3 3.5 4 4.5 5 5.5 6 6.5
SJP
Pa0
kg
T1
to
T3
(W
·Mas
s-0
.67
)
BS 1RMa (kg·Mass-0.67)

80
adaptable during in-season play; however, these changes are not strongly related to changes in
squat jump performance in a sample of collegiate volleyball athletes.
The observed decreases in body fat percentage are similar to previous research
demonstrating positive alterations in female’s body composition resulting from sport training. 46-
50 Previous investigations have reported increases in vastus lateralis MT and PA in response to
heavy strength training. 26-28 However, a limited number of studies have examined changes in
muscle architecture in response to concurrent sport and strength training, 29,34,51 and only one of
these studies has examined changes following a taper. 51 In this study, Zaras et al. 51 reported no
statistical alterations in vastus lateralis MT, PA, and FL following a two week taper in track and
field throwers. The moderate decreases in vastus lateralis MT observed in the present study
following the taper may have been due to the long duration (4 weeks) and very large, statistical
reduction in strength and practice training volume during the taper. However, MT remained
elevated above pre-season levels following the taper. In contrast, the greater practice and
strength training volumes during in-season training were accompanied by large to very large
increases in MT and PA from T1 to T2. These in-season changes are in agreement with previous
findings by Blazevich et al., 29 who reported increases in vastus lateralis MT and PA in a
combined group of male and female athletes following strength training and sprint/jump training.
Considering the observed decreases in MT following the taper in the present study, athletes may
benefit from a short-term overreaching microcycle (i.e. a period of higher training volume) prior
to the taper where strength training volume is acutely increased to preserve muscular adaptations
accrued prior to the competitive season.

81
In one of the few published studies examining longitudinal changes in female athlete’s
muscle architecture, Nimphius et al. 34 found moderate increases in FL (d=0.80) with no
statistical changes in MT and PA over the course of the pre-season/in-season in softball players.
These changes in FL primarily occurred from mid to post testing during a period of lower
volume, high-velocity training in preparation for a national tournament. No statistical changes in
FL were observed in the present study; however, a moderate increase was observed from pre-
season to pre-taper (T1 to T2: d=0.94). Additionally, these authors observed moderate to large
relationships between change in FL and sprint performance, whereas no statistical relationships
were observed between changes in muscle architecture and changes in any SJ variable over the
course of the season in the present study. The difference in findings may be attributed to
differences in the mode of sport training (softball vs. volleyball), conditioning sessions (1-2
sessions/week vs. none), strength training frequency during the peaking phase (2 sessions/week
vs. 1 session/week), and testing modality (sprints vs. jumps).
Previous evidence indicates a possible relationship between the force-velocity
characteristics of exercises used in training and the corresponding muscle architectural changes.
29,40 Abe et al., 40 found FL was longer in 100m sprinters compared to long-distance runners and
concluded these differences may have been related to training adaptations, with longer FLs
favoring greater muscle fiber shortening velocities in the sprinters. In support of this, Blazevich
et al. 29 found that athletes who trained with a combination of strength training and speed/jump
training exercises for five weeks achieved statistical increases in vastus lateralis PA and MT,
whereas athletes who ceased performing strength training and performed sprint/jump training
alone increased vastus lateralis FL and MT. However, these changes were not observed in the
present study during the tapering period. A possible explanation is that the volume and/or

82
intensity of jump training (practice and competition) during the taper was insufficient to produce
increases in FL. It is also possible that differences in adaptations exist within the team between
starters and non-starters; however, considering most of the athletes who completed the study
were starters (7 of 10), this comparison was not possible. Future research should assess the
relationship between playing time and response to the taper in team sport athletes.
Importantly, more recent findings have demonstrated contraction-specific adaptations in
FL. 31,52 These studies demonstrated knee extensor eccentric contractions increase vastus lateralis
FL and concentric contractions increase vastus lateralis PA. During the tapering phase, athletes
primarily performed lower extremity strength training exercises that involved concentric
contractions of the vastus lateralis (MTP, ¼ BS), which may partially explain why no changes in
FL were observed during this period. Also, the method of determining FL in the present study
may have mis-estimated the athlete’s true FL because it does not account for changes in fascicle
curvature. 53
Although no statistical changes were observed in SJ performance following the taper in
the present study, the small decreasing effect sizes for SJPPa indicate the tapering period (4
weeks) may have been too long. Additionally, it is possible the athletes peaked earlier than the
week they were tested. In a meta-analysis summarizing results of tapering studies in endurance
events (swimming, cycling, running), Bosquet et al. 11 found that peak performances occurred
during the second week of the taper. Considering these findings, future research on tapering for
team sport athletes should assess sport-related performance weekly to determine when athletes
peak.
It is also possible that the strength training volumes in the present study were insufficient
to produce increases in SJH and SJPPa. In further support of this, large to very large negative

83
relationships were found between BS 1RMa and changes in SJH and SJPPa with multiple loads
from T1 to T3. These results are more convincing when considering that 8 out of 10 possible SJ
variables had correlation coefficients ranging from r=-0.51 to -0.81. One possible explanation is
that the training stimulus may have been insufficient for the stronger athletes, which negatively
affected their SJ performance. In support of this, Figure 4.3 shows the two strongest athletes
(relative to body mass) decreased SJPPa at 0kg from T1 to T3. Although there was a nearly
perfect linear relationship between athletes relative strength level (BS 1RMa) and strength
training volume completed from T1 to T3 (VLd), the SJ correlation results indicate these strength
training volumes may have been sufficient for weaker, but not stronger athletes suggesting a
possible curve linear relationship. The relationship between BS 1RMa and VLd is likely
explained by the large proportion of lower extremity exercises included in the strength training
program. Additionally, the lack of association between RPETL from T1 to T3 and change in any
SJ variables indicates athletes perception of the difficulty of training had no relationship with
how they performed on the SJ. Nevertheless, the correlation data should be interpreted with
caution considering the small sample size.
In summary, these findings demonstrate that relatively low volumes of strength training
performed concurrently with sport training are capable of preserving unloaded and loaded SJ
performance during a tapering period in female volleyball athletes. Additionally, concurrent
strength and sport training resulted in increases in vastus lateralis MT, and PA. However,
training volumes did not appear sufficient to maintain vastus lateralis MT during the tapering
period. One solution may be to perform an overreaching microcycle prior to the taper in an
attempt to preserve previously accrued muscular adaptations. These findings also demonstrate
that fluctuations in muscle architecture measures during in-season play are not strongly related to

84
changes in SJ performance in collegiate volleyball athletes. Negative correlations observed
between relative maximal strength and changes in SJ performance may be due to an insufficient
strength training stimulus for the stronger athletes. Furthermore, differences may exist between
starters and non-starters in response to the taper. Future research on tapering for team sport
athletes should address weekly changes in performance measures and determine which factors
(e.g. playing time, experience, strength level, opponent strength, etc.) may explain the variation
in response.
ACKNOWLEDGMENTS
The authors wish to confirm that there is no conflict of interest associated with this
publication and that there has been no financial support for this work that could have influenced
its outcome. The authors would like to thank the graduate students who assisted in the
implementation of the training program and data collection.
REFERENCES
1. Reilly T, Secher N, Snell P, Williams C. Physiology of sports: An overview. Physiology
of sports. 1990:465-485.
2. Lecompte JC, Rivet D. Tabulated data on the duration of exchanges and stops in a
volleyball game. Volleyball Technical Journal. 1979;4(3):91.
3. Forthomme B, Croisier JL, Ciccarone G, Crielaard JM, Cloes M. Factors correlated with
volleyball spike velocity. Am J Sports Med. 2005;33(10):1513-1519.
4. Pion JA, Fransen J, Deprez DN, et al. Stature and Jumping Height Are Required in
Female Volleyball, but Motor Coordination Is a Key Factor for Future Elite Success. The
Journal of Strength & Conditioning Research. 2015;29(6):1480-1485.
85
5. Sheppard JM, Cronin JB, Gabbett TJ, McGuigan MR, Etxebarria N, Newton RU.
Relative importance of strength, power, and anthropometric measures to jump
performance of elite volleyball players. The Journal of Strength & Conditioning
Research. 2008;22(3):758-765.
6. Fleck SJ, Case S, Puhl J, Van Handle P. Physical and physiological characteristics of elite
women volleyball players. Can J Appl Sport Sci. 1985;10(3):122-126.
7. Smith DJ, Roberts D, Watson B. Physical, physiological and performance differences
between Canadian national team and universiade volleyball players. J Sports Sci.
1992;10(2):131-138.
8. Banister EW, Carter JB, Zarkadas PC. Training theory and taper: validation in triathlon
athletes. Eur J Appl Physiol Occup Physiol. 1999;79(2):182-191.
9. Thomas L, Mujika I, Busso T. A model study of optimal training reduction during pre-
event taper in elite swimmers. J Sports Sci. 2008;26(6):643-652.
10. Mujika I, Padilla S. Scientific bases for precompetition tapering strategies. Med Sci
Sports Exerc. 2003;35(7):1182-1187.
11. Bosquet L, Montpetit J, Arvisais D, Mujika I. Effects of tapering on performance: a meta-
analysis. Med Sci Sports Exerc. 2007;39(8):1358-1365.
12. Houmard JA, Johns RA. Effects of taper on swim performance. Practical implications.
Sports Med. 1994;17(4):224-232.
13. Spilsbury KL, Fudge BW, Ingham SA, Faulkner SH, Nimmo MA. Tapering strategies in
elite British endurance runners. Eur J Sport Sci. 2015;15(5):367-373.
14. Aubry A, Hausswirth C, Louis J, Coutts AJ, Y LEM. Functional overreaching: the key to
peak performance during the taper? Med Sci Sports Exerc. 2014;46(9):1769-1777.

86
15. Bellenger CR, Karavirta L, Thomson RL, Robertson EY, Davison K, Buckley JD.
Contextualising Parasympathetic Hyperactivity in Functionally Overreached Athletes
With Perceptions of Training Tolerance. Int J Sports Physiol Perform. 2015.
16. Dupuy O, Lussier M, Fraser S, Bherer L, Audiffren M, Bosquet L. Effect of overreaching
on cognitive performance and related cardiac autonomic control. Scand J Med Sci Sports.
2014;24(1):234-242.
17. Trappe S, Costill D, Thomas R. Effect of swim taper on whole muscle and single muscle
fiber contractile properties. Med Sci Sports Exerc. 2000;32(12):48-56.
18. Luden N, Hayes E, Galpin A, et al. Myocellular basis for tapering in competitive distance
runners. J Appl Physiol (1985). 2010;108(6):1501-1509.
19. Murach K, Raue U, Wilkerson B, et al. Single muscle fiber gene expression with run
taper. PLoS One. 2014;9(9):e108547.
20. Neary JP, Martin TP, Quinney HA. Effects of taper on endurance cycling capacity and
single muscle fiber properties. Med Sci Sports Exerc. 2003;35(11):1875-1881.
21. Le Meur Y, Louis J, Aubry A, et al. Maximal exercise limitation in functionally
overreached triathletes: role of cardiac adrenergic stimulation. J Appl Physiol (1985).
2014;117(3):214-222.
22. Coutts A, Reaburn P, Piva TJ, Murphy A. Changes in Selected Biochemical, Muscular
Strength, Power, and Endurance Measures during Deliberate Overreaching and Tapering
in Rugby League Players. International Journal of Sports Medicine. 2007;28(2):116-124.
23. Gibson NE, Boyd AJ, Murray AM. Countermovement Jump is Not Affected During
Final Competition Preparation Periods in Elite Rugby Sevens Players. J Strength Cond
Res. 2016;30(3):777-783.

87
24. Claudino JG, Cronin JB, Mezencio B, et al. Auto-regulating jump performance to induce
functional overreaching. J Strength Cond Res. 2016.
25. Freitas VH, Nakamura FY, Miloski B, Samulski D, Bara-Filho MG. Sensitivity of
physiological and psychological markers to training load intensification in volleyball
players. J Sports Sci Med. 2014;13(3):571-579.
26. Aagaard P, Andersen JL, Dyhre-Poulsen P, et al. A mechanism for increased contractile
strength of human pennate muscle in response to strength training: changes in muscle
architecture. J Physiol. 2001;534(Pt. 2):613-623.
27. Kawakami Y, Abe T, Fukunaga T. Muscle-fiber pennation angles are greater in
hypertrophied than in normal muscles. J Appl Physiol (1985). 1993;74(6):2740-2744.
28. Kawakami Y, Abe T, Kuno SY, Fukunaga T. Training-induced changes in muscle
architecture and specific tension. Eur J Appl Physiol Occup Physiol. 1995;72(1-2):37-43.
29. Blazevich AJ, Gill ND, Bronks R, Newton RU. Training-specific muscle architecture
adaptation after 5-wk training in athletes. Med Sci Sports Exerc. 2003;35(12):2013-2022.
30. Alegre LM, Jimenez F, Gonzalo-Orden JM, Martin-Acero R, Aguado X. Effects of
dynamic resistance training on fascicle length and isometric strength. J Sports Sci.
2006;24(5):501-508.
31. Franchi MV, Atherton PJ, Reeves ND, et al. Architectural, functional and molecular
responses to concentric and eccentric loading in human skeletal muscle. Acta Physiol
(Oxf). 2014;210(3):642-654.
32. Alegre LM, Lara AJ, Elvira JL, Aguado X. Muscle morphology and jump performance:
gender and intermuscular variability. J Sports Med Phys Fitness. 2009;49(3):320-326.

88
33. Brechue WF, Abe T. The role of FFM accumulation and skeletal muscle architecture in
powerlifting performance. Eur J Appl Physiol. 2002;86(4):327-336.
34. Nimphius S, McGuigan MR, Newton RU. Changes in muscle architecture and
performance during a competitive season in female softball players. J Strength Cond Res.
2012;26(10):2655-2666.
35. Secomb JL, Lundgren LE, Farley OR, Tran TT, Nimphius S, Sheppard JM. Relationships
Between Lower-Body Muscle Structure and Lower-Body Strength, Power, and Muscle-
Tendon Complex Stiffness. J Strength Cond Res. 2015;29(8):2221-2228.
36. Foster C, Florhaug JA, Franklin J, et al. A new approach to monitoring exercise training.
J Strength Cond Res. 2001;15(1):109-115.
37. Haff GG. Quantifying workloads in resistance training: a brief review. Strength and
Cond. 2010;10:31-40.
38. Ball SD, Altena TS, Swan PD. Comparison of anthropometry to DXA: a new prediction
equation for men. Eur J Clin Nutr. 2004;58(11):1525-1531.
39. Wells AJ, Fukuda DH, Hoffman JR, et al. Vastus lateralis exhibits non-homogenous
adaptation to resistance training. Muscle Nerve. 2014;50(5):785-793.
40. Abe T, Kumagai K, Brechue WF. Fascicle length of leg muscles is greater in sprinters
than distance runners. Med Sci Sports Exerc. 2000;32(6):1125-1129.
41. Linthorne NP. Analysis of standing vertical jumps using a force platform. American
Journal of Physics. 2001;69(11):1198-1204.
42. Cormie P, McCaulley GO, McBride JM. Power versus strength-power jump squat
training: influence on the load-power relationship. Med Sci Sports Exerc. Vol 39. United
States2007:996-1003.

89
43. Girden ER. ANOVA: Repeated measures. Sage; 1992.
44. Benjamini Y, Hochberg Y. Controlling the false discovery rate: a practical and powerful
approach to multiple testing. Journal of the Royal Statistical Society Series B
(Methodological). 1995:289-300.
45. Hopkins WG. A scale of magnitude for effect statistics. 2002; www.sportsci.org.
Accessed 09/01/2015, 2015.
46. Clark M, Reed DB, Crouse SF, Armstrong RB. Pre- and post-season dietary intake, body
composition, and performance indices of NCAA division I female soccer players. Int J
Sport Nutr Exerc Metab. 2003;13(3):303-319.
47. Carbuhn AF, Fernandez TE, Bragg AF, Green JS, Crouse SF. Sport and training
influence bone and body composition in women collegiate athletes. J Strength Cond Res.
2010;24(7):1710-1717.
48. Barr SI. Relationship of eating attitudes to anthropometric variable and dietary intakes of
female collegiate swimmers. J Am Diet Assoc. 1991;91(8):976-977.
49. Berg K, Blanke D, Miller M. Muscular fitness profile of female college basketball
players. J Orthop Sports Phys Ther. 1985;7(2):59-64.
50. Stanforth PR, Crim BN, Stanforth D, Stults-Kolehmainen MA. Body composition
changes among female NCAA division 1 athletes across the competitive season and over
a multiyear time frame. J Strength Cond Res. 2014;28(2):300-307.
51. Zaras ND, Stasinaki AN, Methenitis SK, et al. Rate of Force Development, Muscle
Architecture, and Performance in Young Competitive Track and Field Throwers. J
Strength Cond Res. 2016;30(1):81-92.

90
52. Reeves ND, Maganaris CN, Longo S, Narici MV. Differential adaptations to eccentric
versus conventional resistance training in older humans. Exp Physiol. 2009;94(7):825-
833.
53. Benard MR, Becher JG, Harlaar J, Huijing PA, Jaspers RT. Anatomical information is
needed in ultrasound imaging of muscle to avoid potentially substantial errors in
measurement of muscle geometry. Muscle Nerve. 2009;39(5):652-665.

91
CHAPTER 5
DIFFERENCES IN COUNTERMOVEMENT JUMP PERFORMANCE CHANGES
BETWEEN NEW PLAYERS AND RETURNERS FOLLOWING AN OVERREACH AND
TAPER IN NCAA DIVISION I WOMEN’S VOLLEYBALL ATHLETES.
Authors: 1Caleb D. Bazyler, 1Satoshi Mizuguchi, 1Sato Kimitake, 1Ashley A. Kavanaugh, 1Brad H.
DeWeese, 1Michael H. Stone
Affiliations: 1Center of Excellence for Sport Science and Coach Education, Department of Exercise and
Sport Science, East Tennessee State University, Johnson City, TN

92
ABSTRACT
PURPOSE: To examine differences in countermovement jump performance changes between
new players and returners in a group of female collegiate volleyball players following a peaking
phase, and to determine which variables best explain the variation in performance changes.
METHODS: Fourteen female volleyball players were divided into two groups: returners (n=7,
20.66±0.89 y, 68.67±3.69 kg, 176.14±6.82 cm) and new players (n=7, 18.82±0.97 y,
72.86±10.58 kg, 176.43±6.95 cm). Vastus lateralis muscle architecture, relative maximal back
squat strength, unloaded countermovement jump height (JH), and relative peak power (PPa)
were measured prior to the season to determine between-group differences. Total rating of
perceived exertion training load (RPETL), strength training volume-load (VL), JH, PPa, and sets
played were recorded weekly during the peaking phase. RESULTS: There were large to very
large (cohen’s d ± 90% CI: 1.66 ± 1.70, p=0.002), and trivial to very large (1.06 ± 1.00, p=0.08)
differences in changes in JH the first and second week of the taper, and moderate to very large
(1.74 ± 0.96, p=0.007), and trivial to very large (1.09 ± 0.98, p=0.07) differences in JH and PPa
supercompensation during the peaking phase in favor of returners over new players, respectively.
The number of sets played during the peaking phase (r=0.78 ± 0.21, p=0.003) and athlete’s pre-
season relative maximal strength (r=0.54 ± 0.35, p=0.05) were the strongest correlates of JH
supercompensation during the peaking phase. These findings demonstrate that new players and
returners respond differently to an overreach and taper. Training prescription during this phase
should differ between athletes based on their relative maximal strength and time spent
competing.
Keywords: jump height, peak power, muscle cross-sectional area, strength, training load

93
INTRODUCTION
Tapering in athletics has been previously defined as a “progressive nonlinear reduction of
the training load during a variable period of time, in an attempt to reduce the physiological and
psychological stress of daily training and optimize sports performance.” 1 Conceptually it is the
final period in a sequence of mesocycles leading up to a major competition or tournament. 2 The
purpose of the taper is to reduce fatigue accumulated during previous training to express changes
in fitness and thereby maximize performance. 3-5 While numerous studies have demonstrated the
beneficial effects of tapering on endurance performance, 1,3,6-9 and have examined possible
underlying mechanisms, 10-17 similar studies with team sport athletes are scarce. 18-20 The paucity
of research on tapering for team sport athletes has been attributed to difficulties such as long
competitive periods, multiple important competitions in close succession, and difficulty in
quantifying training load and sport performance. 2,21 It has been suggested that an ideal approach
to peaking for team sport athletes would include a period of recovery after regular-season play
followed by a return to fitness/rebuilding period and finalized with a pre-tournament taper. 22
Previous research has focused on the effect of an overreaching period on performance
supercompensation during the subsequent taper. 4,10,23,24 The theoretical basis for performing an
overreach prior to the taper is derived from the fitness-fatigue paradigm. 25 The overreaching
period results in an acute increase in fitness and fatigue; however fatigue masks the expression of
the athlete’s improved fitness. The tapering period allows for accumulated fatigue to dissipate
and fitness to be expressed leading to enhanced performance. Using mathematical modeling,
previous investigators have found that greater increases in volume and intensity during the
overreaching period lead to larger improvements in performance; however, this requires a larger
and longer reduction in training load. 4,6,26 Physiological mechanisms explaining performance

94
supercompensation during the taper may include glycogen supercompensation, 8,27 improved
anabolic to catabolic hormonal ration profile, 24,28 increased muscle shortening velocities
resulting from myosin isoform shifting (Type IIa to IIx) 29-31 and increased fascicle length (FL),
32,33 increased myosin heavy chain (MHC) IIa fiber size, peak force and absolute power, 13,14
altered regulation of growth-related genes (fibroblast growth factor-inducible 14, muscle ring
finger protein-1) in MHC IIa fibers, 14,15 increased muscle activation, 34 and recruitment of high
threshold motor units. 35 Additionally, there appears to be distinct differences in how athletes
respond to an overreach with recent evidence demonstrating that functionally overreached
cyclists exhibit an impaired cardiac response to exhaustive exercise possibly due to reduced
epinephrine excretion, decreased central command and lower chemoreflex activity. 17,36
Considering differences in sport experience and work capacity between athletes within a team,
it’s possible differences exist in corresponding performance changes following an overreach and
taper. Previous research has used countermovement or squat jumps as a monitoring tool to
examine performance changes following a taper in rugby, 19,37 futsal, 20 judo, 38 and volleyball
athletes. 39 Strong, positive relationships have been observed between countermovement jump
(CMJ) height and volleyball performance indicators (spike velocity, spike jump reach, impact
height, and athlete’s level of achievement). 40-42 Therefore, weekly CMJ testing during the taper
period can provide an indication of volleyball athlete’s neuromuscular status and elucidate
possible differences in preparedness between athletes within a team.
In a previous investigation, Bazyler et al. 43 found that changes in female collegiate
volleyball athlete’s squat jump performance following the taper were inversely related to pre-
season maximal strength scaled for body mass. Additionally, the authors found statistical
decreases in vastus lateralis muscle thickness (MT) following the taper. It was hypothesized that

95
these findings may have been due to an insufficient strength training stimulus for the stronger
athletes and an overreaching microcyle was recommended prior to the taper. Yet, it is unknown
whether differences in overreaching and taper responses exist between players within a team.
Thus, the purpose of this investigation was to examine differences in countermovement jump
(CMJ) performance changes between new players and returners in a group of female collegiate
volleyball platers following a peaking phase and to determine which variables best explain the
variation in performance changes.
METHODS
Athletes
Fourteen National Collegiate Athletic Association (NCAA) division I volleyball players
completed the study and were divided into 2 groups for analysis: returners (n=7, age: 20.66±0.89
y, body mass: 68.67±3.69 kg, height: 176.14±6.82 cm) and new players (n=7, 18.82±0.97 y,
72.86±10.58 kg, 176.43±6.95 cm). All athletes had at least 1 year of prior strength training
experience and received no nutritional supplements during the study period. The study was
performed as part of the athlete’s training in preparation for conference championships. All
subjects signed an informed consent form in accordance with the guidelines set forth by the
University’s Institutional Review Board.
Procedures
Training. The athletes trained using a block periodization model comprised of sequenced
phases: strength, strength-speed, strength, and an overreach-taper over a 15-week period (Table
5.1). Maximal strength was increased prior to explosiveness development through a combination
of traditional strength training and weightlifting exercises using percentage of repetition
maximum (RM) values for sets and repetitions to calculate loads. Strength training was

96
conducted 1-2 days per week during the season with most weeks consisting of 3-4 practice
sessions and 2-3 competitions. The first 2 weeks were part of the specific preparation phase and
the following 13 weeks were part of the NCAA competitive season. The focus of this study was
the training performed during the peaking phase, which was the final 5 weeks of training (weeks
11-15) prior to conference championships at the end of week 15. Training during the peaking
phase began with an overreaching microcycle prior to reducing training volumes during the
taper. The week of conference championships, a second short overreach was implemented for the
first 2 training days followed by 3 lighter training sessions.

97
Table 5.1: Strength training program
Week Testing Block Frequency
(days/week) SetxRep
Relative
Training
Intensity
Exercises Competitions
Week1 Baseline
Strength
2 3x3 (1x5) MH (85-90%)
BS, SLDL, BP, BOR
Week2 2 3x3 (1x5) H (90-95%)
Week3 2 3x3 (1x5) ML (75-80%) $,$,$
Week4 2 3x3 (1x5) M (80-85%) $,$,$
Week5 2 3x3 (1x5) MH (85-90%) $,$,$
Week6
Strength-Speed
2 3x5, 3x3 (1x5) MH (80-85%)
BS, CPK, IBP, PU
$,$,$
Week7 1 3x3 (1x5) L (70-75%) $,$$,$
Week8 2 3x3 (1x5) L (70-75%) $$,$
Week9 Strength
2 3x5, 3x3 (1x5) MH (85-90%) BS, SLDL, BP, PU
$$
Week10 1 3x3 (1x5) VL (65-70%) $,$$,$
Week11 Pre-OR1
Overreach-Taper
2 5x5, 3x3 (1x5) M (80-85%)
BS, SLDL, IBP, BOR
$,$
Week12 Post-OR1 2 3x3 (1x5) L (70-75%) $$,$
Week13 T1 2 3x3 (1x5) L (70-75%) $,$$
Week14 T2 2 3x5, 3x3 (1x5) M (80-85%) $$,$$
Week15 Pre-OR2 Overreach-Taper 2 5x5, 3x5 H (90-95%) BS, 1/2 BS, SLDL, MTP,
BP, PU, 1ADBR $$$,$$$
Week16 Post-OR2 Active Rest 0 did not lift
MTP-mid-thigh pull, MTC-mid-thigh clean, CPK-clean pull from knee, BS-back squat, BOR-bent over row, MTSP-mid-thigh snatch pull,
CGBP-clean grip bench press, 1ADBR-one arm dumbbell row, MBCP-medicine chest pass, MGBP-mid-grip bench press, IBP-incline bench
press, MBS-medicine ball slam, PU-pull-up; H-heavy, MH-moderately heavy, M-moderate, ML-moderately light, L-light, VL-very light;
compertitions: $least important, $$moderately important, $$$most important

98
Training Load. Internal training load was estimated using a session rating of perceived
exertion collected on a 1-10 scale. Based on previously established methods, rating of perceived
exertion was multiplied by the duration of the session in minutes to form a rating of perceived
exertion training load (RPETL) for practice and strength training sessions. 44 Strength training
volume-load (VL) was recorded weekly for all barbell lifts and was calculated using the
following equation 45: Volume Load (kg) = Mass of External Load (kg) x Repetitions
Additionally, sets played in each match during the peaking phase were recorded for each athlete
and used for correlational analyses.
Testing
Baseline testing was conducted prior to the pre-season to examine differences between
new players and returners. Groups were initially compared at this time point to avoid the
potential confounding effects of training. CMJ testing was conducted weekly during the peaking
phase to examine changes within and between groups relative to the first week of the overreach-
taper (pre-OR1). Athletes were instructed to refrain from practicing and strength training 24
hours prior to each testing session. During the baseline testing session athletes were tested on
measures of body mass, body fat percentage (BF%), vastus lateralis MT, PA, FL, cross-sectional
area allometrically scaled for body mass (CSAa), CMJ height (JH), and peak power
allometrically scaled for body mass (PPa) with 0kg. Additionally, as a descriptive measure of
maximal strength, athlete’s back squat 1-RM allometrically scaled for body mass (BS1RMa) was
estimated from the Epley equation 46 using athlete’s heaviest set of 3 repetitions during the back
squat from week 2 training.
Anthropometrics. Body mass was measured using a digital scale (Tanita B.F. 350, Tanita
Corp. of America, Inc., Arlington Heights, IL), and BF% was estimated from the sum of 7

99
skinfold sites using a skinfold caliper (Lange, Beta Technology Inc., Cambridge, MD). 47 All
anthropometrics were measured at the same time of day by the same experienced assistant for all
testing sessions.
Muscle Architecture. A 7.5 MHz ultrasound probe was used to measure vastus lateralis
CSAa, MT, PA and FL of the right leg (LOGIQ P6, General Electric Healthcare,
Wauwatosa, WI). For vastus lateralis measurements, the athlete laid on their left side with their
hips perpendicular to the examination table in the axial plane with a knee angle set at 120 ± 5º
angle as measured by a goniometer. This positioning was selected to improve image clarity
during cross-sectional scans and it was easier for athletes to relax their knee extensors. Sampling
location for the vastus lateralis was determined by the point of intersection between the vastus
lateralis and 5cm medial to 50% of the femur length, which was defined as the distance between
the greater trochanter and the lateral epicondyle of the femur. 48 The location was marked with a
permanent marker and the probe oriented longitudinally in the sagittal plane, parallel to the
muscle for each sample. The ultrasonography probe was covered with water-soluble transmission
gel to aid acoustic coupling and avoid depression of the skin, which may cause changes in the
measured parameters. 49 Vastus lateralis MT and PA were quantified in still images captured
longitudinally in the sagittal plane using the measuring features of the ultrasound device (Figure
5.1a). Vastus lateralis MT was determined as the distance between subcutaneous adipose tissue-
muscle interface and inter-muscular interface, PA was determined as the angles between the
echoes of the deep aponeurosis of the muscle and the echoes from interspaces among the
fascicles. 48 Vastus lateralis CSAa was measured by placing the probe perpendicular to the
muscle and moving it in the transverse plane to collect a cross-sectional image using the
LogiqView function of the ultrasound device (Figure 5.1b). The reliability of this method has

100
been determined previously. 50 Vastus lateralis CSAa was measured by tracing the inter-
muscular interface in the cross sectional images. 51-53 Vastus lateralis FL was calculated from
MT and PA using the following equation 48,54,55: FL = MT · SIN (PA)-1. The ultrasound examiner
took three longitudinal and three cross-sectional images from each sonogram. The means from
the three images of MT, PA, FL, and CSAa were assessed from the images and used for further
analysis. 56 Repeated measurements yielded coefficients of variation of 0.01%, 1.12%, 0.49%,
and 1.32% for MT, PA, FL, and CSAa respectively.
Figure 5.1a and 5.1b: Vastus lateralis longitudinal and cross-sectional measurements
Countermovement Jumps. Following a dynamic warm-up, CMJs were measured using
dual force plates affixed side by side with a sampling frequency of 1000 Hz (Rice Lake
Weighing Systems, Rice Lake, WI). Countermovement jumps were performed while holding a
nearly weightless polyvinyl chloride pipe across their shoulders (0kg) to prevent arm swing and
strictly measure performance of the lower extremities. Countermovement jumps with 0kg were
performed during baseline testing and were performed weekly during the peaking phase. During
the CMJs athletes were instructed to remain stable in an upright position. Once the force-time
trace was stable the tester shouted “3,2,1...jump” and the athlete performed a maximal CMJ from
1: MT
2: PA 1: CSA

101
a self-selected depth. All jump trials were recorded and analyzed using a custom program
(LabView 8.5.1, 8.6, and 2010, National Instruments Co., Austin, TX). Jump height was
estimated from flight time using the formula: g·flight time2·8-1, where “g” is a constant of 9.81
m∙s-2 for the acceleration due to gravity. 57 Peak power was determined as the maximal value
obtained from the product of the velocity-time and force-time trace and was allometrically scaled
for athlete’s body mass. The average of two best trials within a 2cm difference in jump height
was used for analysis. Additional trials were performed when the difference between two trials
was greater than 2cm. The week peak JH occurred for each athlete during the peaking phase and
the change in JH from pre-OR1 to peak (supercompensation) were determined for further
analyses.
Statistical Analyses
Intraclass correlation coefficients (ICC) for all dependent variables ranged from r=0.92 to
0.99. Homogeneity of between-group variance was assessed using a Levene’s test. Group
descriptive data were compared using an independent samples t-test. Peaking phase CMJ and
training load data was analyzed using a 2 x 6 (group by time) repeated measure ANOVA for the
mean scores to determine within and between group differences, and a 2 x 5 (group by time)
repeated measures ANOVA for the change in mean scores relative to pre-OR1 to determine
within and between-group difference in changes. Main effects were followed by post-hoc
comparisons using a Benjamini-Hochberg adjustment to correct for multiple comparisons and
control the false discovery rate. 58 Magnitude of within-group and difference in between-group
changes relative to pre-OR1 were determined using Cohen’s d effect sizes with 90% confidence
intervals (CI). A Welch-Satterhwaite approximation to the degrees of freedom was used to
calculate 90% CI for variables with unequal variances between groups. Effect sizes with CIs

102
were assessed using the following scale: trivial, 0.0-0.2; small 0.2-0.6; moderate 0.6-1.2; large,
1.2-2.0; very large, 2.0-4.0. 59 Effects were deemed unclear when the 90% CI overlapped
positive and negative outcomes (90% CI upper bound >0.2 and lower bound <-0.2). Pearson
product-moment zero order correlations with 90% CIs were calculated to determine the
relationship between other variables and JH supercompensation during the peaking phase.
Correlation coefficients with CIs were based on the following scale: trivial, ≤0.10; small, 0.10–
0.3; moderate, 0.30–0.5; large, 0.50–0.70; very large, 0.70–0.90; and nearly perfect, ≥0.90. 59
Correlations were deemed unclear when the 90% CI overlapped positive and negative
relationships (90% CI upper bound >0.1 and lower bound <-0.1). Tests with p-values ≤0.05 were
considered statistically significant, and tests with p-values ≤0.10 were deemed as “approached
significance” for all analyses. Analyses were performed using SPSS software version 23 (IMB
Co., New York, NY, USA), and Microsoft Excel 2013 (Microsoft Corporation, Redmond, WA,
USA).
RESULTS
Baseline
There was a large to very large difference in age with returners being older than new
players (mean ± standard deviation (SD): 20.66 ± 0.89 vs 18.82 ± 0.97 years, p<0.001,
respectively). There were trivial to large differences in favor of the returners over new players
for vastus lateralis PA (15.20 ± 2.19 vs 12.92 ± 2.17°, p=0.08, respectively), and CSAa (1.80 ±
0.22 vs 1.58 ± 0.20 cm2·kg-0.67, p=0.08, respectively). Differences between groups at baseline for
height, body mass, BF%, and vastus lateralis FL were unclear. There were moderate to very
large differences in favor of returners over new players for BS1RMa (5.11 ± 0.86 vs 3.27 ± 1.07
kg·kg-0.67, p=0.004, respectively). There were small to large and trivial to large differences in

103
favor of returners over new players for JH (0.33 ± 0.02 vs 0.28 ± 0.05 m, p=0.03), and PPa
(201.40 ± 13.46 vs 180.37 ± 22.47 W·kg-0.67, p=0.06), respectively (Figure 5.2).
Figure 5.2: Differences between groups at baseline in descriptive and performance characteristics. BF%-
body fat percentage, MT-muscle thickness, PA-pennation angle, FL-fascicle length, CSAa-cross-sectional
area allometrically scaled for body mass, BS1RMa-estimated back squat 1-repetition maximum
allometrically scaled for body mass, JH-jump height, PPa-peak power allometrically scaled for body mass
Rating of Perceived Exertion Training Load and Volume-Load
There were no group by time interactions or group effects for any training load variables.
There were significant time effects for practice RPETL (p<0.001), strength training RPETL
(p<0.001), total RPETL (p<0.001), and strength training VL (p<0.001) during the peaking phase.
There were significant increases in total RPETL during OR1 (p<0.001, p=0.02) and significant
decreases in total RPETL during the second week of the taper compared to in-season training for
returners and new players (p<0.001, p<0.001), respectively (Table 5.2). Additionally, there were
significant differences in sets played during the peaking phase with returners playing more than
new players (36.14 ± 6.52 vs 22.71 ± 12.28 sets, p=0.03, respectively).
3.5 3.0 2.5 2.0 1.5 1.0 0.5 0.0 0.5 1.0 1.5 2.0 2.5 3.0 3.5
Effect Size
Larger for ReturnersLarger for New Players
Mass
BF%
MT
PA
FL
CSAa
moder
ate
larg
e
very
larg
e
small
moder
ate
larg
e
very
larg
e
small
Height
Age
BS1RMa
JH
PPa

104
Table 5.2: Changes in weekly average RPETL and strength training VL during the peaking phase relative to in-season training
(mean±SD)
Training Phase In-season OR1 Taper OR2
Duration (Weeks) 8 1 1 1 1 1
New
Players Strength Training RPETL (A.U.) 275±109 367±130 117±64** 437±162* 409±121* 688±216**
Practice RPETL score (A.U.) 1302±364 1831±575* 1830±1051 438±91** 329±278*
* 803±722
Total RPETL score (A.U.) 1528±346 2198±555** 1947±1075 750±246** 739±279*
* 1491±903
Strength Training VL (kg) 5743±524 8313±809** 5350±566 6140±692 6162±973 11893±1110*
*
Returners Strength Training RPETL score (A.U.) 222±45 356±149 196±40 248±121 331±121* 570±296**
Practice RPETL score (A.U.) 1096±164 2041±454** 1441±493 353±70** 748±401* 1032±406
Total RPETL score (A.U.) 1161±210 2296±396** 1525±559 465±148** 1078±468 1602±658
Strength Training VL (kg) 5494±1655 7810±2542* 5185±1102 5636±1163 5511±205
3 9533±3242**
within group changes relative to In-season phase: *p≤0.10, **p≤0.05. OR1-first overreach, OR2-second overreach, RPETL-rating of perceived exertion training load, VL-volume-load
Table 5.3: Weekly JH and PPa during the peaking phase (mean±SD)
Testing Week Pre-OR1 Post-OR1 T1 T2 Pre-OR2 Post-OR2
Returners
JH (m) 0.29±0.02 0.31±0.03* 0.31±0.02** 0.32±0.03** 0.30±0.02* 0.31±0.03**
ΔJH (m) N/A 0.02±0.02# 0.01±0.01## 0.03±0.02# 0.01±0.01 0.02±0.02
PPa (W·kg-0.67) 190.66±11.9 199.62±13.57 197.20±15.72* 202.85±19.28** 196.01±13.08* 206.66±16.98**
ΔPPa (W·kg-0.67) N/A 8.95±14.04 6.54±8.42 12.19±10.77 5.34±7.5 16.00±12.16
New Players
JH (m) 0.27±0.05 0.27±0.04 0.26±0.05** 0.28±0.05 0.27±0.04 0.27±0.04
ΔJH (m) N/A 0.00±0.02 -0.01±0.01 0.01±0.03 0.00±0.01 0.00±0.02
PPa (W·kg-0.67) 180.58±21.18 185.49±16.74 181.94±16.6 189.9±24.25** 180.97±16.14 187.15±18.17
ΔPPa (W·kg-0.67) N/A 4.91±8.95 1.35±6.54 9.31±12.19 0.39±5.34 6.57±16
Within group change relative to pre-OR1: *p≤0.10, **p≤0.05. Difference in between-group changes relative to pre-OR1: #p≤0.10, ##p≤0.05. OR1-first overreach, OR2-second overreach, T1-second week
of taper, T2-third week of taper, JH-jump height, PPa-peak power allometrically scaled for body mass

Peaking Phase
There were no group by time interactions for JH and PPa or change in mean JH and PPa
scores relative to pre-OR1 during the peaking phase. There were statistical time effects (p=0.01,
p=0.01) and group effects approaching statistical significance (p=0.06, p=0.10) for JH and PPa,
respectively. There were significant time effects (p=0.04) and group effects (p=0.01) for change
in mean JH scores relative to pre-OR1. The time effect for change in mean PPa scores relative to
pre-OR1 approached significance (p=0.07).
Changes in JH for the returners relative to pre-OR1 were nearly statistically trivial to very
large at post-OR1 (p=0.07), statistically small to large (p=0.03) at T1, moderate to very large
(p=0.009) at T2, and small to large (p=0.03) at post-OR2. Changes in PPa for the returners
relative to pre-OR1 were statistically small to large (p=0.02) at T2, and moderate to very large
(p=0.01) at post-OR2. Changes in JH and PPa for the new players relative to pre-OR1 were
statistically trivial to small (p=0.03) at T1, and trivial to moderate (p=0.02) at T2, respectively
(Table 5.3).
Between-group differences in change from pre-OR1 for JH were nearly statistically trivial
to very large at post-OR1 (p=0.10), statistically large to very large (p=0.002) at T1, and nearly
statistically trivial to very large (p=0.08) at T2 (Figure 5.3).

106
Figure 5.3: Within-group changes and differences in between-group changes in JH relative to pre-OR1.
Changes are reported as (d±90%CI). White color marker indicates unclear between-group difference in
change from pre-OR1; grey color marker indicates trivial to very large; black indicates large to very large.
JH-jump height, OR-overreach. T-taper
Peak and Nadir Performance
Jump height and PPa supercompensation for the returners were statistically large to very
large (p<0.001), and large to very large (p<0.001), respectively. Jump height and PPa
supercompensation for the new players were statistically trivial to small (p=0.05), and small to
moderate (p=0.004), respectively. Between-group differences in JH and PPa supercompensation
were statistically moderate to very large (p=0.007), and nearly statistically trivial to very large
(p=0.07), respectively (Figure 5.4a and 5.4b). Irrespective of group, the majority of athletes
achieved peak JH at T2 (7 of 14) and nadir JH at pre-OR2 (6 of 14) (Figure 5.5a and 5.5b).
-0.6
-0.2
0.2
0.6
1
1.4
1.8
2.2
2.6
3
Pre-OR1 Post-OR1 T1 T2 Pre-OR2 Post-OR2
JH E
ffec
t S
ize
New Players
Returners
small
moderate
large
very large
small

107
Figure 5.4a and 5.4b: Within-group changes and differences in between-group changes in JH and PPa
from pre-OR1 to peak performance during the peaking phase. Within group change relative to pre-OR1:
*p≤0.05, **p≤0.001. Difference in between-group changes relative to pre-OR1: #p≤0.10, ##p≤0.05. Gray
dashed lines are individual changes and black lines are group mean changes.
Figure 5.5a and 5.5b: Occurrence of individual JH peak and nadir week during the peaking phase. JH-
jump height.
Variables Explaining JH Performance Supercompensation
Jump height supercompensation exhibited a statistically large to nearly perfect, positive
relationship with sets played during the peaking phase (r=0.78 ± 0.21, p=0.003), and a
statistically small to very large, positive relationship with athlete’s BS1RMa (r=0.54 ± 0.35,
p=0.05) (Figure 5.6). There was a trivial to very large non-statistical relationship between sets
0.2
0.22
0.24
0.26
0.28
0.3
0.32
0.34
0.36
0.38
0.4
Pre OR1 Peak Pre OR1 Peak
New Players Returners
JH (
cm)
##* **
150
160
170
180
190
200
210
220
230
240
Pre OR1 Peak Pre OR1 Peak
New Players Returners
PP
a (W
·kg
-0.6
7)
#* **
0
1
2
3
4
5
Post OR1 T1 T2 Pre OR2 Post OR2
Nu
mb
er o
f A
thle
tes
Week of Peak JH
New Players
Returners
0
1
2
3
4
5
Post OR1 T1 T2 Pre OR2 Post OR2
Nu
mb
er o
f A
thle
tes
Week of Nadir JH
New Players
Returners

108
played during the peaking phase and BS1RMa (r=0.44 ± 0.39, p=0.12). Additionally, BS1RMa
exhibited a statistically moderate to nearly perfect relationship with PA (r=0.72 ± 0.25¸ p=0.003)
and MT (r=0.74 ± 0.24, p=0.003), and a statistically large to nearly perfect relationship with
CSAa (r=0.78 ± 0.21, p=0.001).
Figure 5.6: Relationships between JH supercompensation and other variables. JH-jump height, MT-
muscle thickness, PA-pennation angle, CSAa-cross-sectional area allometrically scaled for body mass,
BS1RMa-estimated back squat 1-repetition maximum allometrically scaled for body mass, VL OR1-
volume-load during first overreach, Total RPETL OR1- total rating of perceived exertion training load
during the first overreach
DISCUSSION
The purpose of this investigation was to determine if performance changes during a
peaking phase differed between returners and new players in a group of female collegiate
volleyball players and to determine which variables best explained the variation in performance
changes. The primary findings of this investigation include: a) large to very large differences in
age, trivial to large differences in vastus lateralis muscle architecture, trivial to very large
-1.0 -0.8 -0.6 -0.4 -0.2 0.0 0.2 0.4 0.6 0.8 1.0
Correlation Coefficient
Positive RelationshipNegative Relationship
CSAa
BS1RMa
VL OR1
Total RPETL OR1
Sets
played
moder
ate
larg
e
very
larg
e
small
moder
ate
larg
e
very
larg
e
small
PA
MT
nea
rly
per
fect
nea
rly
per
fect

109
differences in relative maximal strength and CMJ performance in favor of returners over new
players at baseline, b) trivial to very large differences in changes in JH following the initial
overreach in favor of returners over new players, c) moderate to very large, and trivial to very
large differences in JH and PPa supercompensation during the peaking phase, respectively, d)
number of sets played during the peaking phase and athlete’s baseline BS1RMa were the
strongest correlates of JH supercompensation during the peaking phase.
The baseline testing results demonstrate that the returners were older, had a more
advantageous muscle architectural profile, greater relative maximal strength and greater CMJ
performance. These findings are in agreement with similar previous research demonstrating
maximal strength, jump height, and power output are different between starters and non-starters
and between different levels of athletes for various sports. 40-42,60-64
In the only other known study examining overreaching and tapering responses in
volleyball athletes, Freitas et al. 39 found significantly greater creatine kinase, RPETL, training
monotony, and training strain in half a team of male volleyball players who performed an 11-day
overreach compared to the other half of the team who continued with normal training. The
authors concluded that CMJ performance should not be used to evaluate training adaptations in
volleyball athletes because no significant within-group changes were observed in JH during the
overreach or the 14-day taper that followed. In contrast, we found large to very large, and trivial
to small increases in JH during the taper for the returners and new players, respectively. The
differences between Freitas and colleagues findings and the present study, may have been due to
differences in how JH was measured (contact mat vs. uniaxial force plates) and the caliber of
athletes (national vs. collegiate level). Sole et al., 65 recently demonstrated that mechanistic
variables (RFD, stretching phase duration, acceleration-propulsion phase shape factor, etc.)

110
obtained from force-time curve data provide a more comprehensive assessment of jumping
performance than JH alone. We conclude, given the appropriate instrumentation, CMJ
performance can be used to monitor training adaptations in volleyball athletes and that greater
attention should be given to mechanistic variables.
Despite differences in between group changes, the within group changes relative to pre-
OR1 followed a similar trend in returners and new players. In support of this, peak and nadir JH
occurred at similar time points in both groups with a fairly even distribution between weeks.
Irrespective of group, 7 of 14 athletes achieved peak JH at T2, and nadir JH occurred at pre-OR2
for 6 of 14. These findings agree with the meta-analysis results from Bosquet and colleagues, 7
who demonstrated that peak endurance performance occurred after 2 weeks of tapering and
diminished after 3 and 4 weeks of tapering. The athlete’s competition schedule may also explain
the timing of peak and nadir performance. The team played their two worst opponents the week
prior to their best jumping performance, and their two best opponents the week prior to their
worst jumping performance. Previous research has demonstrated that volleyball matches induce
significant increases in blood lactate, and increases in reaction time and decreased knee joint
position sense resulting in decreased sensorimotor system acuity. 66,67 It is possible that the rest
period between matches and weekly jump testing sessions was insufficient to completely
dissipate fatigue effects of play. Additional confounding variables explaining the timing of peak
and nadir performance may include psychological readiness, nutritional status, and other external
stressors (school, relationships, job, etc.).
Both returners and new players perceived total training load to be more difficult during
the initial overreach and lighter during the second week of the taper compared to in-season
training. Also, both groups completed greater strength training VLs during the two overreaching

111
microcycles compared to in-season training. Despite these similarities, the weekly CMJ data
demonstrate that the returners consistently achieved greater JH improvements compared to the
new players during a similar overreach and taper. These findings beg the question, which
variables best explain the variation in JH supercompensation response? There was a large to
nearly perfect positive relationship between sets played during the peaking phase and JH
supercompensation. A trivial to very large relationship was observed between sets played during
the peaking phase and athlete’s BS1RMa. Also, previous research has demonstrated that stronger
individuals have greater fatigue resistance at a given absolute workload as an adaptation to
repetitive high load training. 24,68-70 Therefore, a possible explanation is that athletes who played
more also had greater relative maximal strength, which in turn provided them with a greater
work tolerance enhancing their ability to respond to the overreach and subsequent taper. In
support of this hypothesis, the returners, who had a greater BS1RMa, achieved larger
improvements in JH than the new players following the initial overreach. Another important
consideration is that returners in this investigation were accustomed to periodized training from
previous seasons with the team, whereas new players were introduced to periodized training at
the beginning of the pre-season. Previous research has demonstrated that the inflammatory
response is greatest when a novel stimulus is applied and is attenuated following successive
bouts of similar training. 71-73 This phenomenon has been termed the repeated bout effect. 74,75
Coutts and colleagues 18 have also shown that overreaching prior to a taper results in significant
increases in creatine kinase and decreases in the testosterone to cortisol ratio and the glutamine
to glutamate ratio in semi-professional rugby league players. Considering the differences in
training experience, it is possible that the overreaching period resulted in greater fatigue after
effects in the new players compared to the returners.
112
The proposed hypothesis highlights the importance of lower extremity relative maximal
strength to jumping performance supercompensation following an overreach and taper. The
correlation results also demonstrate that relative maximal strength was largely related to muscle
architectural characteristics, namely, vastus lateralis MT, CSAa, and PA. Previous research has
demonstrated large relationships between vastus lateralis MT and relative maximal strength,
jumping, sprinting and throwing ability in various groups of athletes. 76-80 Furthermore,
longitudinal studies have observed increases in MT and PA following periodized strength
training. 33,81-83 Therefore, improving muscle architectural characteristics and relative maximal
strength of the lower extremities through periodized strength training may enhance volleyball
athlete’s ability to respond to an overreach and taper. Future research should develop and test a
model to determine the unique contribution of different variables (relative maximum strength,
training load, work tolerance, sport experience, etc.) to performance supercompensation during
the taper.
In summary these findings demonstrate that differences in muscle architecture, relative
maximal strength, and CMJ performance exist between female collegiate volleyball returners and
new players. Returners achieved greater CMJ performance supercompensation following the
initial overreach and during the subsequent taper compared to new players. The greater CMJ
performance supercompensation during the peaking phase in the returners appears to be related
to their greater relative maximal strength and number of sets played during this phase. A possible
explanation is that athletes who played more sets during the peaking phase had greater relative
maximal strength, which may have enhanced their ability to tolerate higher training loads
resulting in greater CMJ performance supercompensation during the taper. These results suggest
that training prescription during the peaking phase should differ between athletes based on their

113
relative maximal strength, time spent competing, and training experience. Additionally, emphasis
should be placed on developing lower extremity muscle architectural characteristics to enhance
strength of the musculature contributing to volleyball performance. Thus, when prescribing
training during a peaking phase for returners and new players, sport coaches and strength
coaches should consider these factors to ensure athletes are prepared for important competitions.
ACKNOWLEDGMENTS
The authors wish to confirm that there is no conflict of interest associated with this
publication and that there has been no financial support for this work that could have influenced
its outcome. The authors would like to thank the graduate students who assisted in the
implementation of the training program and data collection.
REFERENCES
1. Mujika I, Padilla S. Scientific bases for precompetition tapering strategies. Med Sci
Sports Exerc. 2003;35(7):1182-1187.
2. Pyne DB, Mujika I, Reilly T. Peaking for optimal performance: Research limitations and
future directions. J Sports Sci. Vol 27. England2009:195-202.
3. Banister EW, Carter JB, Zarkadas PC. Training theory and taper: validation in triathlon
athletes. Eur J Appl Physiol Occup Physiol. 1999;79(2):182-191.
4. Thomas L, Busso T. A theoretical study of taper characteristics to optimize performance.
Med Sci Sports Exerc. 2005;37(9):1615-1621.
5. Mujika I. Intense training: the key to optimal performance before and during the taper.
Scandinavian Journal of Medicine & Science in Sports. 2010;20:24-31.
6. Thomas L, Mujika I, Busso T. A model study of optimal training reduction during pre-
event taper in elite swimmers. J Sports Sci. 2008;26(6):643-652.

114
7. Bosquet L, Montpetit J, Arvisais D, Mujika I. Effects of tapering on performance: a meta-
analysis. Med Sci Sports Exerc. 2007;39(8):1358-1365.
8. Houmard JA, Johns RA. Effects of taper on swim performance. Practical implications.
Sports Med. 1994;17(4):224-232.
9. Spilsbury KL, Fudge BW, Ingham SA, Faulkner SH, Nimmo MA. Tapering strategies in
elite British endurance runners. Eur J Sport Sci. 2015;15(5):367-373.
10. Aubry A, Hausswirth C, Louis J, Coutts AJ, Y LEM. Functional overreaching: the key to
peak performance during the taper? Med Sci Sports Exerc. 2014;46(9):1769-1777.
11. Bellenger CR, Karavirta L, Thomson RL, Robertson EY, Davison K, Buckley JD.
Contextualising Parasympathetic Hyperactivity in Functionally Overreached Athletes
With Perceptions of Training Tolerance. Int J Sports Physiol Perform. 2015.
12. Dupuy O, Lussier M, Fraser S, Bherer L, Audiffren M, Bosquet L. Effect of overreaching
on cognitive performance and related cardiac autonomic control. Scand J Med Sci Sports.
2014;24(1):234-242.
13. Trappe S, Costill D, Thomas R. Effect of swim taper on whole muscle and single muscle
fiber contractile properties. Med Sci Sports Exerc. 2000;32(12):48-56.
14. Luden N, Hayes E, Galpin A, et al. Myocellular basis for tapering in competitive distance
runners. J Appl Physiol (1985). 2010;108(6):1501-1509.
15. Murach K, Raue U, Wilkerson B, et al. Single muscle fiber gene expression with run
taper. PLoS One. 2014;9(9):e108547.
16. Neary JP, Martin TP, Quinney HA. Effects of taper on endurance cycling capacity and
single muscle fiber properties. Med Sci Sports Exerc. 2003;35(11):1875-1881.

115
17. Le Meur Y, Louis J, Aubry A, et al. Maximal exercise limitation in functionally
overreached triathletes: role of cardiac adrenergic stimulation. J Appl Physiol (1985).
2014;117(3):214-222.
18. Coutts A, Reaburn P, Piva TJ, Murphy A. Changes in Selected Biochemical, Muscular
Strength, Power, and Endurance Measures during Deliberate Overreaching and Tapering
in Rugby League Players. International Journal of Sports Medicine. 2007;28(2):116-124.
19. Gibson NE, Boyd AJ, Murray AM. Countermovement Jump is Not Affected During
Final Competition Preparation Periods in Elite Rugby Sevens Players. J Strength Cond
Res. 2016;30(3):777-783.
20. Claudino JG, Cronin JB, Mezencio B, et al. Auto-regulating jump performance to induce
functional overreaching. J Strength Cond Res. 2016.
21. Mujika I. Challenges of team-sport research. International journal of sports physiology
and performance. 2007;2(3):221.
22. Mujika I. Thoughts and considerations for team-sport peaking. Olympic Coach.
2007;18(4):9-11.
23. Hellard P, Avalos M, Hausswirth C, Pyne D, Toussaint JF, Mujika I. Identifying Optimal
Overload and Taper in Elite Swimmers over Time. J Sports Sci Med. 2013;12(4):668-
678.
24. Fry AC, Kraemer WJ, Stone MH, et al. Endocrine responses to overreaching before and
after 1 year of weightlifting. Can J Appl Physiol. 1994;19(4):400-410.
25. Banister EW, Calvert TW. Planning for future performance: implications for long term
training. Canadian Journal of Applied Sport Sciences. 1980;5(3):170-176.

116
26. Avalos M, Hellard P, Chatard JC. Modeling the training-performance relationship using a
mixed model in elite swimmers. Med Sci Sports Exerc. 2003;35(5):838-846.
27. Shepley B, MacDougall JD, Cipriano N, Sutton JR, Tarnopolsky MA, Coates G.
Physiological effects of tapering in highly trained athletes. J Appl Physiol (1985).
1992;72(2):706-711.
28. Fry AC, Kraemer WJ, Stone MH, Koziris PL, Thrush JT, Fleck SJ. Relationships
Between Serum Testosterone, Cortisol, and Weightlifting Performance. The Journal of
Strength & Conditioning Research. 2000;14(3):338-343.
29. Andersen JL, Aagaard P. Myosin heavy chain IIX overshoot in human skeletal muscle.
Muscle Nerve. Vol 23. United States: 2000 John Wiley & Sons, Inc.; 2000:1095-1104.
30. Andersen LL, Andersen JL, Magnusson SP, et al. Changes in the human muscle force-
velocity relationship in response to resistance training and subsequent detraining. J Appl
Physiol (1985). 2005;99(1):87-94.
31. Terzis G, Stratakos G, Manta P, Georgiadis G. Throwing performance after resistance
training and detraining. J Strength Cond Res. 2008;22(4):1198-1204.
32. Alegre LM, Jimenez F, Gonzalo-Orden JM, Martin-Acero R, Aguado X. Effects of
dynamic resistance training on fascicle length and isometric strength. J Sports Sci.
2006;24(5):501-508.
33. Blazevich AJ, Gill ND, Bronks R, Newton RU. Training-specific muscle architecture
adaptation after 5-wk training in athletes. Med Sci Sports Exerc. 2003;35(12):2013-2022.
34. Hakkinen K, Kallinen M, Komi PV, Kauhanen H. Neuromuscular adaptations during
short-term "normal" and reduced training periods in strength athletes. Electromyogr Clin
Neurophysiol. 1991;31(1):35-42.

117
35. Cormie P, McGuigan MR, Newton RU. Developing maximal neuromuscular power: Part
1--biological basis of maximal power production. Sports Med. Vol 41. New
Zealand2011:17-38.
36. Aubry A, Hausswirth C, Louis J, Coutts AJ, Buchheit M, Le Meur Y. The Development
of Functional Overreaching Is Associated with a Faster Heart Rate Recovery in
Endurance Athletes. PLoS One. 2015;10(10):e0139754.
37. de Lacey J, Brughelli M, McGuigan M, Hansen K, Samozino P, Morin JB. The effects of
tapering on power-force-velocity profiling and jump performance in professional rugby
league players. J Strength Cond Res. 2014;28(12):3567-3570.
38. Papacosta E, Gleeson M, Nassis GP. Salivary hormones, IgA, and performance during
intense training and tapering in judo athletes. J Strength Cond Res. 2013;27(9):2569-
2580.
39. Freitas VH, Nakamura FY, Miloski B, Samulski D, Bara-Filho MG. Sensitivity of
physiological and psychological markers to training load intensification in volleyball
players. J Sports Sci Med. 2014;13(3):571-579.
40. Forthomme B, Croisier JL, Ciccarone G, Crielaard JM, Cloes M. Factors correlated with
volleyball spike velocity. Am J Sports Med. 2005;33(10):1513-1519.
41. Pion JA, Fransen J, Deprez DN, et al. Stature and Jumping Height Are Required in
Female Volleyball, but Motor Coordination Is a Key Factor for Future Elite Success. The
Journal of Strength & Conditioning Research. 2015;29(6):1480-1485.
42. Sheppard JM, Cronin JB, Gabbett TJ, McGuigan MR, Etxebarria N, Newton RU.
Relative importance of strength, power, and anthropometric measures to jump

118
performance of elite volleyball players. The Journal of Strength & Conditioning
Research. 2008;22(3):758-765.
43. Bazyler C, Suchomel T, Sole C, et al. Changes in muscle architecture and explosive
ability in NCAA DI women’s volleyball athletes throughout a competitive season and
following a taper. East Tennessee State University: Exercise and Sport Science, East
Tennessee State University 2016.
44. Foster C, Florhaug JA, Franklin J, et al. A new approach to monitoring exercise training.
J Strength Cond Res. 2001;15(1):109-115.
45. Haff GG. Quantifying workloads in resistance training: a brief review. Strength and
Cond. 2010;10:31-40.
46. Epley B. Poundage chart. Lincoln, NE: Boyd Epley Workout. 1985.
47. Ball SD, Altena TS, Swan PD. Comparison of anthropometry to DXA: a new prediction
equation for men. Eur J Clin Nutr. 2004;58(11):1525-1531.
48. Wells AJ, Fukuda DH, Hoffman JR, et al. Vastus lateralis exhibits non-homogenous
adaptation to resistance training. Muscle & Nerve. 2014;50(5):785-793.
49. Blazevich AJ, Cannavan D, Coleman DR, Horne S. Influence of concentric and eccentric
resistance training on architectural adaptation in human quadriceps muscles. J Appl
Physiol (1985). 2007;103(5):1565-1575.
50. Palmer TB, Akehi K, Thiele RM, Smith DB, Thompson BJ. Reliability of panoramic
ultrasound imaging in simultaneously examining muscle size and quality of the hamstring
muscles in young, healthy males and females. Ultrasound Med Biol. 2015;41(3):675-684.

119
51. Seymour JM, Ward K, Sidhu PS, et al. Ultrasound measurement of rectus femoris cross-
sectional area and the relationship with quadriceps strength in COPD. Thorax.
2009;64(5):418-423.
52. Howe TE, Oldham JA. The reliability of measuring quadriceps cross-sectional area with
compound B ultrasound scanning. Physiother Res Int. 1996;1(2):112-126.
53. e Lima KM, da Matta TT, de Oliveira LF. Reliability of the rectus femoris muscle cross-
sectional area measurements by ultrasonography. Clin Physiol Funct Imaging.
2012;32(3):221-226.
54. Kumagai K, Abe T Fau - Brechue WF, Brechue Wf Fau - Ryushi T, Ryushi T Fau -
Takano S, Takano S Fau - Mizuno M, Mizuno M. Sprint performance is related to muscle
fascicle length in male 100-m sprinters. (8750-7587 (Print)).
55. Abe T, Sakamaki M Fau - Yasuda T, Yasuda T Fau - Bemben MG, et al. Age-related,
site-specific muscle loss in 1507 Japanese men and women aged 20 to 95 years. (1303-
2968 (Electronic)).
56. Alegre LM, Jiménez F, Gonzalo-Orden JM, Martín-Acero R, Aguado X. Effects of
dynamic resistance training on fascicle lengthand isometric strength. Journal of sports
sciences. 2006;24(05):501-508.
57. Linthorne NP. Analysis of standing vertical jumps using a force platform. American
Journal of Physics. 2001;69(11):1198-1204.
58. Benjamini Y, Hochberg Y. Controlling the false discovery rate: a practical and powerful
approach to multiple testing. Journal of the Royal Statistical Society Series B
(Methodological). 1995:289-300.
120
59. Hopkins WG. A scale of magnitude for effect statistics. 2002; www.sportsci.org.
Accessed 09/01/2015, 2015.
60. Gabbett T, Kelly J, Ralph S, Driscoll D. Physiological and anthropometric characteristics
of junior elite and sub-elite rugby league players, with special reference to starters and
non-starters. J Sci Med Sport. 2009;12(1):215-222.
61. Gabbett TJ. Physiological and anthropometric characteristics of starters and non-starters
in junior rugby league players, aged 13-17 years. J Sports Med Phys Fitness. Vol 49.
Italy2009:233-239.
62. Fry AC, Kraemer WJ. Physical Performance Characteristics of American Collegiate
Football Players. The Journal of Strength & Conditioning Research. 1991;5(3):126-138.
63. Fleck SJ, Case S, Puhl J, Van Handle P. Physical and physiological characteristics of elite
women volleyball players. Can J Appl Sport Sci. 1985;10(3):122-126.
64. Smith DJ, Roberts D, Watson B. Physical, physiological and performance differences
between Canadian national team and universiade volleyball players. J Sports Sci.
1992;10(2):131-138.
65. Sole C, Mizuguchi S, Sato K, Moir G, Stone M. Analysis of countermovement vertical
jump force-time curve phase characteristics in athletes Johnson City, TN: East Tennessee
State University 2015.
66. Ribeiro F, Santos F, Gonçalves P, Oliveira J. Effects of volleyball match-induced fatigue
on knee joint position sense. European Journal of Sport Science. 2008;8(6):397-402.
67. Mroczek D, Kawczyński A, Chmura J. Changes of reaction time and blood lactate
concentration of elite volleyball players during a game. Journal of human kinetics.
2011;28:73-78.

121
68. Chiu LZ, Fry AC, Schilling BK, Johnson EJ, Weiss LW. Neuromuscular fatigue and
potentiation following two successive high intensity resistance exercise sessions. Eur J
Appl Physiol. 2004;92(4-5):385-392.
69. Jo E, Judelson DA, Brown LE, Coburn JW, Dabbs NC. Influence of recovery duration
after a potentiating stimulus on muscular power in recreationally trained individuals. J
Strength Cond Res. 2010;24(2):343-347.
70. Suchomel TJ, Nimphius S, Stone MH. The Importance of Muscular Strength in Athletic
Performance. Sports Med. 2016.
71. Zourdos MC, Henning PC, Jo E, et al. Repeated Bout Effect in Muscle-Specific Exercise
Variations. J Strength Cond Res. 2015;29(8):2270-2276.
72. Nosaka K, Sakamoto K, Newton M, Sacco P. The repeated bout effect of reduced-load
eccentric exercise on elbow flexor muscle damage. Eur J Appl Physiol. 2001;85(1-2):34-
40.
73. Clarkson PM, Nosaka K, Braun B. Muscle function after exercise-induced muscle
damage and rapid adaptation. Med Sci Sports Exerc. 1992;24(5):512-520.
74. Nosaka K, Clarkson PM. Muscle damage following repeated bouts of high force
eccentric exercise. Med Sci Sports Exerc. 1995;27(9):1263-1269.
75. McHugh MP, Connolly DA, Eston RG, Gleim GW. Exercise-induced muscle damage
and potential mechanisms for the repeated bout effect. Sports Med. 1999;27(3):157-170.
76. McMahon J, Stapley J, Suchomel T, Comfort P. Relationships between lower body
muscle structure and isometric mid-thigh pull peak force. Journal of Trainology.
2015;4(2):43-48.

122
77. Brechue WF, Abe T. The role of FFM accumulation and skeletal muscle architecture in
powerlifting performance. Eur J Appl Physiol. 2002;86(4):327-336.
78. Secomb JL, Lundgren LE, Farley OR, Tran TT, Nimphius S, Sheppard JM. Relationships
Between Lower-Body Muscle Structure and Lower-Body Strength, Power, and Muscle-
Tendon Complex Stiffness. J Strength Cond Res. 2015;29(8):2221-2228.
79. Zaras ND, Stasinaki AN, Methenitis SK, et al. Rate of Force Development, Muscle
Architecture, and Performance in Young Competitive Track and Field Throwers. J
Strength Cond Res. 2016;30(1):81-92.
80. Nimphius S, McGuigan MR, Newton RU. Changes in muscle architecture and
performance during a competitive season in female softball players. J Strength Cond Res.
2012;26(10):2655-2666.
81. Aagaard P, Andersen JL, Dyhre-Poulsen P, et al. A mechanism for increased contractile
strength of human pennate muscle in response to strength training: changes in muscle
architecture. J Physiol. 2001;534(Pt. 2):613-623.
82. Kawakami Y, Abe T, Fukunaga T. Muscle-fiber pennation angles are greater in
hypertrophied than in normal muscles. J Appl Physiol (1985). 1993;74(6):2740-2744.
83. Kawakami Y, Abe T, Kuno SY, Fukunaga T. Training-induced changes in muscle
architecture and specific tension. Eur J Appl Physiol Occup Physiol. 1995;72(1-2):37-43.

123
CHAPTER 6
BIOCHEMICAL, MORPHOLOGICAL, AND BIOMECHANICAL CHANGES IN A
NATIONAL LEVEL WEIGHTLIFTER PEAKING FOR COMPETITION: A CASE STUDY
Authors: 1Caleb D. Bazyler, 1Satoshi Mizuguchi, 3Michael C. Zourdos, 1Sato Kimitake, 1Ashley A.
Kavanaugh, 1Brad H. DeWeese, 2Kevin F. Breuel, 1Michael H. Stone
Affiliations: 1Center of Excellence for Sport Science and Coach Education, Department of Exercise and
Sport Science, East Tennessee State University, Johnson City, TN
2East Tennessee Reproductive Endocrinology Laboratory, East Tennessee State University, Johnson City,
TN
3Department of Exercise Science and Health Promotion, Florida Atlantic University, Boca Raton, FL

124
ABSTRACT
The purpose of this study was to examine changes in anthropometrics, muscle cross-sectional
area, biomarkers, and performance measures in a national level female weightlifter following
three competition phases. Training volume-load, body mass, vastus lateralis cross-sectional area,
and unloaded and loaded squat jump performance were assessed weekly during each competition
phase. Sum of seven skinfolds, serum biomarkers, and dynamic mid-thigh pulls were assessed
pre- and post-competition phase. Weightlifting performance goals were met for the first
competition (total: 200 kg) and the second (193 kg), but not the third (196 kg). Her body mass
decreased to a greater extent in preparation for COMP3 (-6.0 kg) compared to COMP1 (-2.5 kg)
and COMP2 (+2.2 kg). Cross-sectional area very likely decreased following COMP3
(probability: 99%, cohen’s d: 2.08). Her T:C ratio likely increased (88%, 2.64), while IL-6 (79%,
2.47) and TNFα (81%, 3.59) likely decreased following COMP3. Myostatin (99%, 1.95) and
decorin (99%, 1.96) very likely decreased following COMP2. Unloaded squat jump height likely
increased the final week of COMP1 (89%, 0.95) and COMP2 (99%, 1.83), whereas unloaded
and loaded squat jump height possibly (69%, 0.99) and likely (82%, 1.52) decreased the final
week of COMP3. Changes in endocrine, inflammatory, and hypertrophic markers corresponded
with training volume-load; however, body mass, muscle cross-sectional area, squat jump and
dynamic mid-thigh pull performance provided a clearer indication of her competition
performance. These findings provide a biochemical, morphological, and biomechanical basis for
alterations in performance following multiple competition phases in a national level weightlifter.
Keywords: taper, testosterone, myostatin, jump height, clean and jerk, snatch

125
INTRODUCTION
There is a paucity of research monitoring longitudinal changes in physiological,
biochemical, and performance measures with high level (e.g. national, international, elite)
athletes (Mujika, 2014). This is likely due to the expectation placed on researchers to conduct
studies with sample sizes large enough to achieve sufficient statistical power. This expectation,
however, is often unrealistic when conducting research with high level athletes. Thus, case
studies and single subject designs are viable alternatives to traditional training studies for sport
scientists working with high level athletes. Case studies can often provide coaches and sport
scientists with a better understanding of how individual athletes respond to a given stimulus.
Training results in individual-specific adaptations that depend on an athlete’s training age,
genetics, and fatigue state (Banister & Calvert, 1980; Bouchard, Dionne, Simoneau, & Boulay,
1992). Case studies can give an indication of the athlete’s progress and can be used to aid with
training decisions. Previous studies monitoring longitudinal changes in performance using a
single-subject design or case study have been conducted with an Olympic-level weightlifter
(Gisslen, Ohberg, & Alfredson, 2006), Olympic-level diver (Baker, 2001), world class triathlete
(Mujika, 2014), national champion boxer (Halperin, Hughes, & Chapman, 2016), well trained
powerlifters (Zourdos et al., 2016), and collegiate volleyball players (Kavanaugh, 2014). These
studies ranged from 2 months to 4 years and have monitored training load, anthropometrics,
body composition, tendon structural changes, kinetic and kinematic variables, and agility
performance. The results of these studies demonstrate positive alterations in these variables
along with improvements in competitive performance over the training periods examined.

126
The tapering period is an important component of the training process that has not been
extensively researched in strength-power athletes. Previous research has primarily focused on
tapering for endurance performance and thus most literature reviews and meta-analyses on the
topic have focused on running, cycling, and swimming (Bosquet, Montpetit, Arvisais, & Mujika,
2007; Le Meur, Hausswirth, & Mujika, 2012; Mujika & Padilla, 2003). Despite weightlifting
being one of oldest Olympic sports, tapering research with high-level weightlifters is scarce
(Busso et al., 1992; Hakkinen, Pakarinen, Alen, Kauhanen, & Komi, 1987; Stone et al., 1996).
Observational and experimental studies have examined the effects of overreaching and tapering
on biochemical profile and weightlifting performance (Busso et al., 1992; Fry et al., 1994;
Hakkinen et al., 1987). Hakkinen and colleagues (1987) found decreases in the
testosterone:cortisol (T:C) ratio following a 2-week overreach in trained weightlifters. The T:C
ratio returned to baseline levels following 2 weeks of normal training and a 2-week taper
primarily due to reductions in cortisol. Additionally, there was a positive relationship between
change in the T/sex hormone binding globulin (SHBG) ratio and change in clean and jerk
performance following the normal training and tapering period. Similarly, Fry et al., (2000)
found increases in the T:C ratio following a 1-week overreach and 3 weeks of normal training in
elite weightlifters. Also, the change in the T:C ratio during the normal training period was
positively related to the change in clean and jerk performance.
Recent advancement in biochemical assay techniques have provided greater insight into
molecular responses to training. Results of recent studies demonstrate the profound effects an
athlete’s training volume has on endocrine and non-endocrine molecules and subsequent sport
performance. Interleukin-6 (IL-6) has been implicated as an anti-inflammatory myokine
responsible for initiating satellite cell proliferation and differentiation, and inhibiting tumor

127
necrosis factor alpha (TNF-ὰ) expression (Vierck et al., 2000). Both IL-6 and TNF-ὰ have been
shown to be elevated following an overreaching phase (Main et al., 2010; Nieman et al., 2014),
and subsequently reduced following a 3-week taper (Farhangimaleki, Zehsaz, & Tiidus, 2009) in
endurance athletes. Myostatin is a myokine that limits myocyte differentiation and growth by
binding to the activin type II receptor on the myocyte surface and subsequently inhibiting Akt-
induced muscle protein synthesis (Kim, Cross, & Bamman, 2005). Myostatin mRNA expression
has been shown to decrease following heavy strength training (Hulmi et al., 2007; Kim et al.,
2005; Roth et al., 2003). However, not all studies agree (de Souza et al., 2014; Willoughby,
2004). Decorin is a proteoglycan that is part of the myocyte extracellular matrix and has been
shown to bind myostatin and possibly trap it in the extracellular matrix (Miura et al., 2006).
Kanzleiter and colleagues (2014) found a positive relationship between acute changes in serum
decorin levels following a strength training session and subject’s 8-repetition maximum (RM)
leg press strength. Additionally, these authors found a positive relationship between changes in
decorin mRNA expression and changes in leg press strength following a 12-week strength and
endurance training program. Therefore, these myokines may provide insight into how the
hypertrophic response is regulated following an overreach and taper.
Previous research has demonstrated a strong relationship between weightlifting
performance and vertical jump height (JH) (Haff et al., 2005; Kawamori et al., 2006). Squat and
countermovement jumps have been used previously with various athletes to monitor training
responses during a competitive season (Freitas, Nakamura, Miloski, Samulski, & Bara-Filho,
2014; Gibson, Boyd, & Murray, 2016). Therefore, monitoring jump performance during the
competition phase may provide an effective means to determine a weightlifter’s response to
training without causing undue fatigue. The dynamic mid-thigh pull (MTP) has also been used to

128
assess an athlete’s explosive ability at various loads (Haff et al., 2005; Kawamori et al., 2006).
Dynamic MTP peak rate of force development and peak force have been shown to be strongly
related to vertical jump (r=0.61-0.88) and weightlifting performance (r=0.69-0.74) in elite female
weightlifters (Haff et al., 2005). Additionally, changes in athlete’s muscle architecture have been
observed following a competition phase (Bazyler, Suchomel, et al., 2016); however, other
studies have reported no changes (Bazyler, Mizuguchi, et al., 2016a; Zaras et al., 2016).
Currently, no studies have examined changes in biochemical markers, muscle architecture, and
kinetic and kinematic variables in conjunction with weightlifting performance during multiple
competition phases. Therefore, the purpose of this study was to examine changes in
anthropometrics, muscle CSA, biomarkers, and performance measures in a national level female
weightlifter following three separate competition phases.
METHODS
Athlete Characteristics
The athlete was a U.S. national level female weightlifter competing in the 69kg weight
class (age: 21.82 years, body mass: 70.7 kg, height: 161 cm). Her accolades include two first
place finishes at University National Championships, two second place finishes at the American
Open, and one third place finish at Senior Nationals. She also competed internationally at the
Pan-American Junior Championships and Junior World Championships. The athlete had been
training competitively for 6 years, and performed 4-7 weightlifting sessions per week using a
block-periodization model. The athlete was informed of the risks and benefits of participating in
the study and provided written informed consent. The study was approved by the universities’
institutional review board.

129
Procedures
The study occurred over a ten month period consisting of 3 competitions. Each
competition phase was a 4-week mesocycle where VL was reduced based on the importance of
the competition (Figure 6.1). The first competition phase (COMP1) led up to a regional
championship, the second competition phase (COMP2) led up to a local meet that she trained
through (i.e. didn’t attempt to peak) prior to the third competition phase (COMP3), which lead
up to the national championship. Training prior to regional and national championships consisted
primarily of the competition lifts and variations followed by assistance exercises (Table 6.1).
External training load was estimated using strength training volume-load (VL) (Haff, 2010).
Figure 6.1: Competition phase weekly training volume-load. Black lines represent “normal” average training
VL±95% confidence limits (broken lines) per week for the macrocycle corresponding with each competition phase.
VL during COMP1 was reduced by 59%. VL during COMP2 was reduced by 47%. VL during COMP3 was reduced
by 71%. Changes in average VL relative to normal were -28% for COMP1, -10% for COMP2, and –19% for
COMP3. VL-volume-load, COMP-competition phase, OR-overreach, T1-taper week 1, T2-taper week 2, T3-taper
week 3
Table 6.1: Final week of training prior to the third competition
Time Monday Tuesday Wednesday Thursday Friday Saturday Sunday
AM FS/Jerk : 2x1@75-
80% Rest
Snatch tech: 6x2-
3@50-55% Rest Jerk: 2x1@70%
Snatch:
2x2@40-45% Compete
SGSS: 3x5@70-75% DB OHP: 3x5@65-
70%
C&J: 2x2@50-
55%
Snatch: 2x1@65%
0
5000
10000
15000
20000
25000
30000
35000
40000
45000
50000
OR T1 T2 T3 OR T1 T2 T3 OR T1 T2 T3
COMP1 COMP2 COMP3
VL
(kg
)

130
PM Partial Squat:
3x2@75-80%
Snatch tech: 6x2-
3@45-50%
DB OHP: 3x5@75-
80% CGSS: 3x5@70-75%
MTP: 3x2@70-75%
SLDL: 3x5@70-75%
FS/Jerk- front squat followed by a split jerk, DB OHP- dumbbell overhead press, tech-technique; SGSS- snatch grip shoulder
shrug, CGSS-clean grip shoulder shrug, MTP-mid-thigh pull, SLDL- stiff leg deadlift, C&J- clean and jerk
The athlete completed 18 testing sessions during the three competition phases including 2
baseline testing sessions at the beginning of the 10-month period. The athlete participated in an
ongoing athlete monitoring program and was familiar with all tests performed. A full testing
battery was conducted pre-and post-competition phase (Figure 6.2), whereas selected tests were
performed weekly (i.e. OR, T1, T2, T3) during each competition phase to avoid significant
interference with her training. During the full testing battery the athlete completed
anthropometrics followed by blood draws and squat jumps the first day of the training week after
an off day from training; dynamic MTPs were performed >48 hrs. later after an off day from
training. The first day of every training week during each competition phase the athlete
completed anthropometrics, ultrasonography measurements, and squat jumps. During the two
baseline testing sessions (>72 hrs. apart during a de-load week) the athlete completed the full
testing battery.
Figure 6.2: Competition phase testing timeline. COMP-competition phase, OR-overreach, T1-taper week
1, T2-taper week 2, T3-taper week 3

131
Anthropometrics. Standing and seated height were measured to the nearest 0.01 meters
using a stadiometer (Cardinal Scale Manufacturing Co., Webb City, MO), body mass was
measured using a digital scale (Tanita B.F. 350, Tanita Corp. of America, Inc., Arlington
Heights, IL), and the sum of 7 skinfold sites (tricep, subscapular, mid-axillary, supraspinale,
chest, abdominal, quadricep) were measured by the same examiner at all testing sessions using
Harpenden skinfold calipers (Baty International, Burgess Hill, UK). The following
anthropometric measurements were also recorded to determine somatotype using the Heath-
Carter method (Carter, 1975): bicep and medial calf skinfolds, bicep girth (flexed 90° and
tensed), standing calf girth, abdominal and hip girth, bi-epicondylar femur and humerus breadth.
Biomarkers. All blood draws were conducted between 7am-9am following an overnight
fast. Blood was drawn from the antecubital vein into a serum clot tube. The blood was allowed to
clot for 20 min. at room temperature. The samples were then centrifuged at 3400 rpm for 15 min.
at room temperature. Serum was pipetted into smaller centrifuge tubes and stored in a -80°C
freezer. Blood draws were obtained following an off-day from training at the beginning of a de-
load week prior to each competition phase and >72 hours following competitions. Two blood
draws were obtained at the beginning of the 10-month training period during a de-load week
within 72hrs to use as a baseline. Cortisol and SHBG were measured in duplicate using an
IMMULITE 1000 automated immunoassay analyzer (Siemens Healthcare, Erlangen, Germany).
The coefficient of variation ranged for these assays ranged from 4.9% to 13.7%. Total
testosterone, IL-6, TNF-ὰ, myostatin and decorin were measured in duplicate using a solid-phase
sandwich enzyme-linked immunosorbent assay (ELISA) according to the manufacturer’s
procedures (R&D systems, Minneapolis, MN; ThermoFisher Scientific Waltham, MA). Sample
concentrations were determined by interpolating their respective absorbance values obtained

132
from standard concentrations plotted on a 4-parameter logistic curve using a SpectraMax 340
microplate reader and SoftMax Pro analysis software (Molecular Devices, Sunnyvale, CA). The
coefficient of variation for these assays ranged from 1.09% to 8.37%. Bioavailable testosterone
was calculated from total testosterone, SHBG, and albumin using the Sodergard equation
(Sodergard, Backstrom, Shanbhag, & Carstensen, 1982).
Ultrasound. A 7.5 MHz ultrasound probe was used to measure CSA of the vastus lateralis
(LOGIQ P6, General Electric Healthcare, Wauwatosa, WI). The athlete laid on their left side
with their hips perpendicular to the examination table in the axial plane. Sampling location for
the vastus lateralis was 50% of the femur length, which was defined as the distance between the
greater trochanter and the lateral epicondyle of the femur (Abe, Kumagai, & Brechue, 2000). The
location was marked with a permanent marker and the ultrasonography probe was covered with
water-soluble transmission gel to aid acoustic coupling and avoid depression of the skin. Vastus
lateralis CSA was measured by placing the probe perpendicular to the muscle and moving it in
the transverse plane to collect a cross-sectional image using the LOGIQView function of the
ultrasound device (Figure 6.3). The reliability of this method has been determined previously
(Howe & Oldham, 1996). Vastus lateralis CSA was measured by tracing the inter-muscular
interface in the cross sectional images. The ultrasound examiner took three cross-sectional
images from each sonogram and the mean of these images was used for analysis. Intra-session
reliability has been previously established for this measurement by the same examiner in our
laboratory (intra-class correlation coefficient (ICC): 0.99) (Bazyler, Mizuguchi, et al., 2016b).

133
Figure 6.3: Vastus lateralis CSA using β-mode ultrasonography. CSA-cross-sectional area
Squat Jumps. Following a standardized dynamic warm-up, squat jumps were performed
on dual uniaxial force plates affixed side by side with a sampling frequency of 1000 Hz (Rice
Lake Weighing Systems, Rice Lake, WI). The squat jumps were performed with a polyvinyl
coated pipe (0kg) and loaded barbell (20kg) placed across the shoulders. The tester instructed the
athlete to perform a squat to 90° knee angle, measured using a handheld goniometer, and hold
the position until the force-time trace was stable. Once the force-time trace was stable, the tester
shouted “3,2,1...jump” and the athlete performed a maximal effort jump. All jump trials were
recorded and analyzed using a custom program (LabView 8.5.1, 8.6, and 2010, National
Instruments Co., Austin, TX). Voltage data from the force platforms were converted to vertical
ground reaction forces using laboratory calibrations and were smoothed using a 4th order
Butterworth filter. Jump height was estimated from flight time using the formula: g·flight
time2·8-1, where “g” is a constant of 9.81 m∙s-2 for the acceleration due to gravity. Peak power
was determined as the maximal value during the concentric phase obtained from the product of
the velocity-time and force-time trace and was allometrically scaled for the athlete’s body mass

134
(PPa). The average of the two best trials within a 2 cm difference in JH was used for analysis.
Additional trials were performed when the difference between two trials was greater than 2cm.
Intra-session reliability of this method has been previously established in our laboratory (ICC:
0.96-0.99) (Kraska et al., 2009).
Dynamic Mid-Thigh Pulls. Following a standardized dynamic warm-up, dynamic MTPs
were performed in a custom built power rack on dual uniaxial force plates (Rice Lake Weighing
Systems, Rice Lake, WI) synchronized with 4 string potentiometers (2 on each side of the bar)
(Celesco Measurement Specialties, Chatsworth, CA) collecting at a sampling frequency of 1000
Hz using a BNC 2110 connector with an analog to digital converter (DAQCard-6063E, National
Instruments, Austin, TX) as described previously (Cormie, McBride, & McCaulley, 2007). The
same absolute loads and bar height were used for each testing session to assess changes over
time. The athlete performed the MTPs in the following order for each testing session: 1 set of 3
repetitions (1x3) at 50% of estimated 3RM (150kg) from training, 1x3 at 70% of 3RM, and 1x3
at 90% of 3RM. These loads were chosen because they are similar to what the athlete used on
this exercise during training. The athlete was allowed to wear straps for all sets and was
instructed to rest the bar on the rack between repetitions. All MTP trials were recorded and
analyzed using a custom program (LabView 8.6, and 2010, National Instruments Co., Austin,
TX). Concentric peak force was determined as the maximal value obtained from the concentric
force-time trace and was allometrically scaled for body mass (PFa). Maximal concentric vertical
displacement (VD) was calculated by triangulating the position of the barbell relative to the front
and back linear position transducers given the known distance between the two linear position
transducers in conjunction with their displacement data. The mean PFa and VD of three
repetitions for each load were used for analysis. Intra-session reliability of this method has been

135
previously established in our laboratory (ICC: 0.99 for both measures) (Goodin, DeWeese, Sato,
Mizuguchi, & Kavanaugh, 2015).
Statistical Analyses
The precision (probability) of weekly changes relative to pre-OR values during each
competition phase was determined using previously described methods (Hopkins, 2000).
Qualitative terms corresponding to the probability values associated with weekly changes
relative to pre-OR for each competition phase were classified as almost certainly not (< 1%),
very unlikely (< 5%), unlikely (< 25%), possibly (25-75%), likely (>75%), very likely (> 95%),
and almost certain (> 99%). Cohen’s d effect sizes were calculated for the mean differences
between pre-OR and subsequent weekly testing sessions during each competition phase using the
pooled standard deviation across sessions. Effect sizes were classified as trivial (<0.25), small
(0.25-0.5), moderate (0.5-1.0), and large (>1.0) (Rhea, 2004). The smallest worthwhile change
(SWC) was used to determine whether changes were meaningful relative to pre-OR values.
Smallest worthwhile change was calculated for each dependent variable by multiplying the
pooled standard deviation of all time points over ten months of training by 0.3 (Halperin et al.,
2016; Hopkins, 2004). Alpha level for all analyses was set at p≤0.05. Probabilities of clinically
meaningful changes were calculated using a published online spreadsheet (Hopkins, 2000). All
other analyses were performed using Microsoft Excel 2013 (Microsoft Corporation, Redmond,
WA, USA).

136
RESULTS
Volume-Load
Average training VL during COMP1 was reduced by 59% from the first week to the final
week of the phase. Average training VL during COMP2 was reduced by 47% from the first week
to the final week of the phase. Average training VL during COMP3 was reduced by 71% from the
first week to the final week of the phase. Changes in average training VL for each competition
phase relative to normal average training VL during the corresponding macrocycle were -28% for
COMP1, -10% for COMP2, and –19% for COMP3.
Anthropometrics and Cross-Sectional Area
The athlete was characterized as an endomorphic mesomorph (3.5-6.9-0.4). Her standing
height was 162cm, femur length was 41cm, and her initial body fat percentage calculated from the
sum of skinfolds was 15.4%. She met performance goals for the first competition (total: 200kg)
and the second (total: 193kg), but not the third (total: 196kg). Body mass very likely increased
following COMP2 (99%, ES=2.61), and very likely decreased following COMP3 (99%, ES=1.87)
compared to pre-OR values. Similarly, sum of skinfolds very likely increased following COMP2
(99%, ES=0.9), and very likely decreased following COMP3 (99%, ES=1.18). Vastus lateralis
CSA very likely decreased following COMP3 (99%, ES=1.93) (Figure 6.4).

137
Figure 6.4: Weekly changes in body mass, CSA, and unloaded JH during each competition phase. Shaded region
represents smallest worthwhile change (SWC) from pre-overreach values for each competition phase. Gray marker
represents week of competition. *precision>75% (likely) and **precision>95% (very likely) change from pre-
overreach values. CSA-cross-sectional area, JH-unloaded squat jump height, OR-overreach, T1-taper week 1; T2-
taper week 2, T3-taper week 3, DL- de-load week.
70
71
72
73
74
75
76
C1OR C1T1 C1T2 C1T3 C1DL C2OR C2T1 C2T2 C2T3 C3OR C3T1 C3T2 C3T3 C3DL
Body
mas
s (k
g)
**
*
****
***
**
**
0.2
0.21
0.22
0.23
0.24
0.25
0.26
0.27
0.28
0.29
0.3
C1OR C1T1 C1T2 C1T3 C1DLC2OR C2T1 C2T2 C2T3 C3OR C3T1 C3T2 C3T3 C3DL
JH (
m)
****
*
****
*
**
* *
30
31
32
33
34
35
36
37
38
39
40
C1OR C1T1 C1T2 C1T3 C1DLC2OR C2T1 C2T2 C2T3 C3OR C3T1 C3T2 C3T3 C3DL
CS
A (
cm2) **
**
*

138
Biomarkers
Baseline values for all biomarkers were as follows: total testosterone (127.50 ± 17.68 ng/dl),
SHBG (95.25 ± 30.76 nmol/L), bioavailable testosterone (27.33 ± 10.92 ng/dl), cortisol (13.45 ±
4.45 ug/dl), T:C ratio (10.26 ± 4.71 A.U.), IL-6 (0.28 ± 0.06 pg/ml), TNFα (10.44 ± 0.30 pg/ml),
decorin (5573.26 ± 336.95 pg/ml), myostatin (4554.51 ± 599.72 pg/ml). Total testosterone likely
decreased following COMP2 (89%, ES=1.5) and likely increased following COMP3 (82%,
ES=1.17). Sex hormone binding globulin likely increased following COMP3 (76%, ES=1.08).
Bioavailable testosterone likely decreased following COMP2 (85%, ES=1.23), and possibly
increased following COMP3 (72%, ES=0.81). Cortisol likely decreased following COMP1 (75%,
ES=0.96), very likely decreased following COMP2 (97%, ES=1.84) and possibly decreased
following COMP3 (70%, ES=0.88). The T:C ratio possibly decreased following COMP2 (67%,
ES=1.25), and likely increased following COMP3 (88%, ES=2.64). Interleukin-6 and TNFα
concentrations likely decreased following COMP3 (79%, ES=2.47, 81%, ES=3.59, respectively).
Decorin concentrations very likely decreased following COMP2 (99%, ES=1.95). Myostatin
concentrations very likely increased following COMP1 (99%, ES=1.21) and very likely decreased
following COMP2 (99%, ES=1.96) (Figure 6.5).
0
5
10
15
20
25
30
35
40
COMP1 COMP2 COMP3
T:C
rat
io (
AU
)
Pre
Post
*
0
0.2
0.4
0.6
0.8
1
COMP1 COMP2 COMP3
IL-6
(pg/m
l)
Pre
Post
*

139
Figure 6.5: Changes in biomarkers pre- to post-competition phase. *precision>75% (likely) and **precision>99%
(almost certain) change from pre-overreach value. T:C-testosterone to cortisol ratio, IL-6-interleukin 6, COMP-
competition
Squat Jumps
Squat JH with 0kg likely increased the third week of the taper during COMP1 (89%,
ES=0.95), very likely increased the third week of the taper during COMP2 (99%, ES=1.83), and
possibly decreased the third week of the taper during COMP3 (69%, ES=0.99). There were no
worthwhile changes in PPa with 0kg during the third week of the taper for any competition.
Squat JH with 20kg likely decreased the third week of the taper during COMP3 (82%, ES=1.52).
Squat jump peak power allometrically scaled with 20kg likely decreased the third week of the
taper during COMP1 (86%, ES=2.1) and COMP2 (88%, ES=1.19).
Dynamic Mid-Thigh Pulls
Concentric VD50% likely increased following COMP1 (94%, ES=0.81) and very likely
increased following COMP3 (97%, ES=0.95). Concentric VD70% likely increased following
COMP1 (81%, ES=0.84). Concentric VD90% likely increased following COMP1 (93%,
ES=0.84), and likely decreased following COMP2 (83%, ES=0.61), and COMP3 (94%,
ES=0.87). Concentric PFa50% very likely decreased following COMP2 (98%, ES=1.47), and
possibly decreased following COMP3 (70%, ES=0.54). Concentric PFa70% likely increased
following COMP1 (85%, ES=0.84), and likely decreased following COMP2 (94%, ES=1.14).
0
1000
2000
3000
4000
5000
COMP1 COMP2 COMP3
My
ost
atin
(pg/m
l)Pre
Post
**
**
0
1000
2000
3000
4000
5000
6000
7000
8000
COMP1 COMP2 COMP3
Dec
ori
n (
pg/m
l)
Pre
Post
**

140
Concentric PFa90% likely increased following COMP1 (81%, 0.6), and very likely decreased
following COMP2 (99%, ES=1.39).
DISCUSSION
The purpose of this investigation was to examine changes in anthropometric, muscle
CSA, biochemical, and performance measures in a national level female weightlifter following
three separate competition phases. The primary results of this investigation include: a)
weightlifting performance goals were met for COMP1 and COMP2, but not COMP3, b) vastus
lateralis CSA increased or was preserved following each competition phase except for COMP3,
c) the T:C ratio likely increased, IL-6 and TNFα likely decreased following COMP3, whereas
myostatin and decorin very likely decreased following COMP2, d) unloaded squat JH likely
increased the final week of COMP1 and COMP2, whereas unloaded and loaded squat JH
possibly and likely decreased the final week of COMP3, e) MTP concentric VD90% likely
increased following COMP1 and likely decreased following COMP3.
Descriptive Characteristics
The athlete’s somatotype (endomorphic mesomorph) matched previous descriptions of
high level female weightlifters (Stone, Pierce, Sands, & Stone, 2006). She was younger (21.82 y)
than the average age of a group of seven U.S. elite female weightlifters (23 ± 4 y) (Stone et al.,
2006). Her height (162 cm) was similar (161.1 ± 5.8 cm), whereas her initial body mass (70.8
kg) was slightly higher than the average reported in this group (68.9 ± 7.5 kg). Her baseline body
fat percentage (15.4%) was lower than the average reported in this group (19.6 ± 4.4%). Her
baseline maximal snatch (90 kg) and clean and jerk (110 kg) were similar to the average reported
from a group of six U.S. female weightlifters (90.8 ± 8.0 kg, 110 ± 16 kg) who had a higher
average body mass (82.8 ± 18.9 kg) (Haff et al., 2005). Her baseline unloaded squat JH (0.24 m)

141
and PPa (177.57 W/kg0.67) were slightly lower than those reported in this same group (0.29 ±
0.05 m, 185.53 ± 37.45 W/kg0.67). Her baseline total (127.5 ng/dl) and bioavailable testosterone
concentrations (27.33 ng/dl) were greater than the normal ranges reported for pre-menopausal
females (8-60 ng/dl, 0.8-10 ng/dl, respectively) (Mayo Clinic, 2016c). Her baseline serum
cortisol (13.45 ug/dl) and SHBG (95.25 nmol/L) concentrations were within the normal range for
females (7-25 ug/dl, 18-144 nmol/L, respectively) (Mayo Clinic, 2016a, 2016b). Interleukin-6
and TNFα, were similar to normal physiological values (<5 pg/ml, <22 pg/ml) (ARUP, 2014;
Fayad et al., 2001). While concerns have been raised about detecting mature myostatin in serum
due to poor specificity of previous assays, the athlete’s serum myostatin concentration (4,554.54
pg/ml) was similar to those reported for young females using a mass-spectrometry based assay
(5,500 ± 2,100 pg/ml) (Bergen et al., 2015). Normative serum decorin concentrations have not
been established. Nonetheless, the athlete’s (5,573.26 pg/ml) concentrations were higher than
previously reported values in healthy control subjects (1,514.9 ± 391.2 pg/ml) (Tanino et al.,
2014).
Anthropometrics and Cross-Sectional Area Changes
Changes in her sum of skinfolds following each competition corresponded with the
changes in body mass and varied between competition periods. Body mass increased weekly
during the competition phase leading up to COMP2; however, she was training through this
competition so weight loss was not attempted. Despite the large decrease in training VL during
each competition phase, there were no worthwhile reductions in vastus lateralis CSA. The
overreaching microcycle implemented in the first week of each competition phase may have
helped preserve CSA during the following tapering weeks. A decrease in CSA was observed
following COMP3, which may be due to the large, abrupt decreases in body mass over this

142
competition phase (-6.0 kg) compared to the others (COMP1: -2.5 kg, COMP2: +2.2 kg),
particularly during the final week (-3.5 kg). An alternative explanation could be the larger
decrease in average training VL across this competition phase (71%) compared to the others
(COMP1: 59%, COMP2: 47%). The poor weight loss strategy used coupled with the decreases in
CSA following COMP3 could at least partially explain why she did not meet performance goals
for this competition.
Biomarker Changes
Changes in testosterone, cortisol, T:C, and SHBG were consistent with previous studies
on overreaching and tapering with weightlifters (Busso et al., 1992; Fry et al., 1994; Hakkinen et
al., 1987). Total and bioavailable testosterone only increased following the competition phase
with the largest decrease in VL (COMP3), whereas moderate to large decreases in cortisol were
observed following each competition phase. Increases in the T:C ratio following COMP3 were
primarily due to increases in total testosterone rather than decreases in cortisol. Despite very
likely decreases in cortisol following COMP2, there was a possible decrease in T:C due to the
likely decrease in total testosterone. Considering she was training through COMP2, reductions in
T:C are likely due to the greater training stress during this period. The large reduction in VL
leading up to COMP3 likely explains the increased T:C. As expected, SHBG mirrored changes
in total testosterone with increases observed following COMP3 indicating a homeostatic
regulation of free testosterone. Despite the greater testosterone bioavailability, CSA was not
preserved following COMP3 demonstrating that changes in testosterone concentrations over this
period were more indicative of changes in training stress than changes in hypertrophic signaling.
We also acknowledge that changes in these biomarkers may be due to normal variation
throughout her menstrual cycle; however, none of the blood draws occurred around her ovulation

143
window, which decreases the probability that testosterone changes were due to a luteinizing
hormone surge.
Serum myostatin has been shown to be inversely related with skeletal muscle mass and is
a potent inhibitor of muscle protein synthesis (Bergen et al., 2015). Decorin has been shown to
antagonize myostatin and serum levels have been found to increase following strength training
(Kanzleiter et al., 2014). Therefore, these biomarkers may provide an indication of changes in
hypertrophic/atrophic signaling following training. Serum decorin and myostatin changed in a
similar manner following each competition phase, and the changes corresponded with training
VL. Specifically, average training VL during COMP1 was 28% lower than her normal average
training VL during this macrocycle, which corresponded with a very likely, large increase in
myostatin. In contrast, average training VL during COMP2 was only 10% lower than her normal
average training VL during this macrocycle with 3 of the 4 weeks having a similar VL to the
macrocycle average. The relatively higher average VL during this competition phase
corresponded with a very likely, large decrease in myostatin and decorin. These findings provide
evidence that serum concentrations of these myokines may be related to changes in training VL.
The large decreases in serum decorin and myostatin following COMP2 suggest a homeostatic
regulation of these myokines. However, caution should be applied in interpreting these findings
as changes in resting serum myostatin and decorin can be contributed to by tissue other than
muscle. Changes in serum decorin could also be indicative of tendon restructuring as it has been
shown to have a crucial role in the early repair process (Dunkman et al., 2014).
Interleukin-6 and TNF-ὰ are acute phase proteins that promote secretion of acute phase
reactants (i.e. C-reactive protein, fibrinogen, plasminogen) in response to injury, infection, and
tissue damage (Biffl, Moore, Moore, & Peterson, 1996; Smith, 2000). Systemic elevations of

144
these cytokines have been observed following injury and various disease states (Peake, Della
Gatta, Suzuki, & Nieman, 2015). They are also implicated in chronic fatigue syndrome and
upper respiratory tract infections limiting athletic performance. Systemic inflammation can lead
to “sickness behaviors” such as tiredness, drowsiness, and lethargicness, which promote return to
homeostasis (Smith, 2000). Elevated IL-6 and TNFα have been observed following overreaching
periods and are subsequently reduced following a taper (Farhangimaleki et al., 2009; Main et al.,
2010). Worthwhile reductions in IL-6 and TNFα were only observed following COMP3.
Considering the role of IL-6 and TNF-ὰ in the inflammatory response to training it is possible
that decreases in these markers are related to the greater reduction in training VL during this
competition phase compared to the others. While reduced inflammation is advantageous for
recovery, reduced mechanical and metabolic stress also decrease hypertrophic signaling
(Schoenfeld, 2013). Therefore, reduced training-induced inflammation may also explain the
decreases in CSA observed following COMP3.
Furthermore, the observed decreases in IL-6 and TNFα coupled with increases in the T:C
ratio following COMP3 provide evidence that these circulating cytokines influence the
hypothalamic-pituitary-adrenal axis and hypothalamic-pituitary-gonadal axis in response to
significant decreases in training VL. In support of this, IL-6 and TNF-ὰ have been found to
increase glucocorticoid production via interaction with hypothalamic receptors resulting in the
secretion of corticotropin releasing hormone (Schobitz, Reul, & Holsboer, 1994). There is also
evidence that elevated IL-6 and TNF-ὰ disrupt hypothalamic secretion of gonadotropin-releasing
hormone possibly leading to reduced testosterone secretion (Schobitz et al., 1994; Wu & Wolfe,
2012). Therefore, reductions in IL-6 and TNF-ὰ following COMP3 may have indirectly
attenuated cortisol secretion and promoted greater testosterone secretion explaining the elevated

145
T:C ratio following COMP3. These findings demonstrate that training during a competition
phase is as a balance between reducing training stress and inflammation (fatigue) while
preserving and expressing previously accrued adaptations (fitness) to optimize performance
(Stone, Stone, & Sands, 2007).
Squat Jump and Mid-Thigh Pull Performance Changes
Squat jump and MTP performance provide an indication of the athlete’s explosive ability
prior to and following the competition phase. Overall, squat jump and MTP performance
changes correspond with weightlifting performance at each competition. Increases in unloaded
squat JH were observed the final week of the competition phase prior to COMP1, whereas
decreases in unloaded and loaded squat JH were observed the final week of the competition
phase prior to COMP3. Similarly, MTP concentric VD90% increased following COMP1, and
decreased following COMP3. Squat and MTP performance changes were inconsistent (positive
and negative) following COMP2 making it difficult to characterize the athlete’s response.
However, MTP PFa was consistently reduced at all loads following COMP2, which is more
likely reflective of the increase in body mass during this period rather than changes in peak
force. Also, training VL during COMP2 was greater than her normal training VL except for the
week of competition because she was not peaking. Overreaching periods have been shown to
alter weightlifting technique and cognitive function (Dupuy et al., 2014; Stone et al., 1993),
which may explain why changes in her squat jump and dynamic MTP performance were
inconsistent following COMP2.
Interestingly, concentric VD50% increased although VD90% decreased following
COMP3. These findings indicate that heavier loads may be necessary to identify sport-specific
performance changes in weightlifters. Considering the relative ease, low fatigue, and low injury

146
risk associated with performing dynamic MTPs, performing this test with heavier loads is not a
concern from an athlete monitoring standpoint. The unloaded squat jump performance
improvements and dynamic MTP performance improvements corresponded with increases in
CSA and successful weightlifting performance during her first competition. In contrast, the
decreases in unloaded and loaded squat jump performance and dynamic MTP performance
corresponded with decreases in CSA and unsuccessful weightlifting performance during her
third competition.
CONCLUSION
In summary, the athlete’s competition weightlifting performance can be explained by
changes in body mass, muscle CSA, biochemical, kinetic and kinematic factors following a
competition phase. Specifically, these findings demonstrate that vastus lateralis CSA can be
maintained following a competition phase in a high level weightlifter provided large changes in
body mass are not attempted close to competition. Changes in circulating cytokines (IL-6 and
TNFα) may explain the alterations in testosterone and cortisol concentrations corresponding with
the changes in weightlifting training VL observed in the present study and in previous
investigations following a taper. However, reduced muscle damage-induced inflammation can
reduce hypertrophic signaling, which may have partially explained the observed decreases in
CSA and corresponding decreases in squat jump and dynamic MTP performance following
COMP3. Conversely, increases in squat jump and dynamic MTP performance likely explain
successful performance during her first competition. The athlete trained through her second
competition, which may explain the reductions in total and bioavailable testosterone, possible
reductions in the T:C ratio, and corresponding decreases in loaded squat jump and dynamic MTP
performance. Concurrent changes in serum decorin and myostatin suggest homeostatic

147
regulation and appeared to correspond with changes in training VL. Overall, these findings
provide a biochemical, morphological, and biomechanical basis for alterations in performance
outcomes following multiple competition phases in a national level weightlifter.
ACKNOWLEDGMENTS
The authors wish to confirm that there is no conflict of interest associated with this
publication and that there has been no financial support for this work that could have influenced
its outcome. The authors would like to thank the graduate students who assisted in the
implementation of the training program and data collection.
REFERENCES
Abe, T., Kumagai, K., & Brechue, W. F. (2000). Fascicle length of leg muscles is greater in
sprinters than distance runners. Med Sci Sports Exerc, 32(6), 1125-1129
ARUP, L. (2014). TNF alpha reference interval. Retrieved from
http://ltd.aruplab.com/Tests/Pub/0051539
Baker, D. (2001). Acute and long-term power responses to power training: Observations on the
training of an elite power athlete. Strength & Conditioning Journal, 23(1), 47-56
Banister, E. W., & Calvert, T. W. (1980). Planning for future performance: implications for long
term training. Canadian Journal of Applied Sport Sciences, 5(3), 170-176
Bazyler, C., Mizuguchi, S., Sato, K., Kavanaugh, A., DeWeese, B., & Stone, M. (2016a).
Changes in muscle architecture, explosive ability, and throwing performance in NCAA
DI track and field throwers throughout a competitive season and following a taper.
(PhD), East Tennessee State University, East Tennessee State University.
Bazyler, C., Mizuguchi, S., Sato, K., Kavanaugh, A., DeWeese, B., & Stone, M. (2016b).
Differences in countermovement jump performance changes between new players and

148
returners following an overreach and taper in NCAA division I women’s volleyball
athletes. (Ph.D.), East Tennessee State University East Tennessee State University.
Bazyler, C., Suchomel, T., Sole, C., Mizuguchi, S., Sato, K., Kavanaugh, A., . . . Stone, M.
(2016). Changes in muscle architecture and explosive ability in NCAA DI women’s
volleyball athletes throughout a competitive season and following a taper. (PhD), East
Tennessee State University East Tennessee State University.
Bergen, H. R., 3rd, Farr, J. N., Vanderboom, P. M., Atkinson, E. J., White, T. A., Singh, R.
J., . . . LeBrasseur, N. K. (2015). Myostatin as a mediator of sarcopenia versus
homeostatic regulator of muscle mass: insights using a new mass spectrometry-based
assay. Skelet Muscle, 5, 21. doi: 10.1186/s13395-015-0047-5
Biffl, W. L., Moore, E. E., Moore, F. A., & Peterson, V. M. (1996). Interleukin-6 in the injured
patient. Marker of injury or mediator of inflammation? Ann Surg, 224(5), 647-664
Bosquet, L., Montpetit, J., Arvisais, D., & Mujika, I. (2007). Effects of tapering on performance:
a meta-analysis. Med Sci Sports Exerc, 39(8), 1358-1365
Bouchard, C., Dionne, F. T., Simoneau, J. A., & Boulay, M. R. (1992). Genetics of aerobic and
anaerobic performances. Exercise & Sport Sciences Reviews, 20, 27-58
Busso, T., Hakkinen, K., Pakarinen, A., Kauhanen, H., Komi, P. V., & Lacour, J. R. (1992).
Hormonal adaptations and modelled responses in elite weightlifters during 6 weeks of
training. Eur J Appl Physiol Occup Physiol, 64(4), 381-386
Carter, J. E. L. (1975). The Heath-Carter somatotype method: San Diego State Univ.,
Department of Physical Education.
Cormie, P., McBride, J. M., & McCaulley, G. O. (2007). Validation of power measurement
techniques in dynamic lower body resistance exercises. J Appl Biomech, 23(2), 103-118

149
de Souza, E. O., Tricoli, V., Aoki, M. S., Roschel, H., Brum, P. C., Bacurau, A. V., . . .
Ugrinowitsch, C. (2014). Effects of concurrent strength and endurance training on genes
related to myostatin signaling pathway and muscle fiber responses. J Strength Cond Res,
28(11), 3215-3223. doi: 10.1519/jsc.0000000000000525
Dunkman, A. A., Buckley, M. R., Mienaltowski, M. J., Adams, S. M., Thomas, S. J., Satchell,
L., . . . Soslowsky, L. J. (2014). The tendon injury response is influenced by decorin and
biglycan. Ann Biomed Eng, 42(3), 619-630. doi: 10.1007/s10439-013-0915-2
Dupuy, O., Lussier, M., Fraser, S., Bherer, L., Audiffren, M., & Bosquet, L. (2014). Effect of
overreaching on cognitive performance and related cardiac autonomic control. Scand J
Med Sci Sports, 24(1), 234-242. doi: 10.1111/j.1600-0838.2012.01465.x
Farhangimaleki, N., Zehsaz, F., & Tiidus, P. M. (2009). The Effect of Tapering Period on
Plasma Pro-Inflammatory Cytokine Levels and Performance in Elite Male Cyclists J
Sports Sci Med (Vol. 8, pp. 600-606).
Fayad, L., Keating, M. J., Reuben, J. M., O'Brien, S., Lee, B. N., Lerner, S., & Kurzrock, R.
(2001). Interleukin-6 and interleukin-10 levels in chronic lymphocytic leukemia:
correlation with phenotypic characteristics and outcome. Blood, 97(1), 256-263
Freitas, V. H., Nakamura, F. Y., Miloski, B., Samulski, D., & Bara-Filho, M. G. (2014).
Sensitivity of physiological and psychological markers to training load intensification in
volleyball players. J Sports Sci Med, 13(3), 571-579
Fry, A., Kraemer, W. J., Stone, M. H., Koziris, P. L., Thrush, J. T., & Fleck, S. J. (2000).
Relationships Between Serum Testosterone, Cortisol, and Weightlifting Performance.
The Journal of Strength & Conditioning Research, 14(3), 338-343

150
Fry, A., Kraemer, W. J., Stone, M. H., Warren, B. J., Fleck, S. J., Kearney, J. T., & Gordon, S. E.
(1994). Endocrine responses to overreaching before and after 1 year of weightlifting. Can
J Appl Physiol, 19(4), 400-410
Gibson, N. E., Boyd, A. J., & Murray, A. M. (2016). Countermovement Jump is Not Affected
During Final Competition Preparation Periods in Elite Rugby Sevens Players. J Strength
Cond Res, 30(3), 777-783. doi: 10.1519/jsc.0000000000001156
Gisslen, K., Ohberg, L., & Alfredson, H. (2006). Is the chronic painful tendinosis tendon a strong
tendon?: a case study involving an Olympic weightlifter with chronic painful Jumper's
knee. Knee Surg Sports Traumatol Arthrosc, 14(9), 897-902. doi: 10.1007/s00167-006-
0054-5
Goodin, J., DeWeese, B., Sato, K., Mizuguchi, S., & Kavanaugh, A. (2015). Comparison of
external kinetic and kinematic variables between high barbell back squats and low
barbell back squats across a range of loads. (M.A.), East Tennessee State
University East Tennessee State University.
Haff, G. (2010). Quantifying workloads in resistance training: a brief review. Strength and Cond,
10, 31-40
Haff, G., Carlock, J. M., Hartman, M. J., Kilgore, J. L., Kawamori, N., Jackson, J. R., . . . Stone,
M. H. (2005). Force-time curve characteristics of dynamic and isometric muscle actions
of elite women olympic weightlifters. Journal of strength and conditioning research /
National Strength & Conditioning Association, 19(4), 741-748. doi: 10.1519/R-15134.1
Hakkinen, K., Pakarinen, A., Alen, M., Kauhanen, H., & Komi, P. V. (1987). Relationships
between training volume, physical performance capacity, and serum hormone
151
concentrations during prolonged training in elite weight lifters. Int J Sports Med, 8 Suppl
1, 61-65
Halperin, I., Hughes, S., & Chapman, D. W. (2016). Physiological profile of a professional boxer
preparing for Title Bout: A case study. J Sports Sci, 1-8. doi:
10.1080/02640414.2016.1143110
Hopkins, W. (2000). Precision of the estimate of a subject's true value (Excel spreadsheet). In: A
new view of statistics. Retrieved from sportsci.org/resource/stats/xprecisionsubject.xls
Hopkins, W. (2004). How to interpret changes in an athletic performance test. . Sportscience, 8,
7
Howe, T. E., & Oldham, J. A. (1996). The reliability of measuring quadriceps cross-sectional
area with compound B ultrasound scanning. Physiother Res Int, 1(2), 112-126
Hulmi, J. J., Ahtiainen, J. P., Kaasalainen, T., Pollanen, E., Hakkinen, K., Alen, M., . . . Mero, A.
A. (2007). Postexercise myostatin and activin IIb mRNA levels: effects of strength
training. Med Sci Sports Exerc, 39(2), 289-297. doi:
10.1249/01.mss.0000241650.15006.6e
Kanzleiter, T., Rath, M., Gorgens, S. W., Jensen, J., Tangen, D. S., Kolnes, A. J., . . . Eckardt, K.
(2014). The myokine decorin is regulated by contraction and involved in muscle
hypertrophy. Biochem Biophys Res Commun, 450(2), 1089-1094. doi:
10.1016/j.bbrc.2014.06.123
Kavanaugh, A. A., & Sands, W.A. (2014). Longitudinal changes in strength and explosive
performance characteristics in NCAA division I women’s volleyball athletes. . (PhD.),
East Tennessee State University, Johnson City, TN.

152
Kawamori, N., Rossi, S. J., Justice, B. D., Haff, E. E., Pistilli, E. E., O'Bryant, H. S., . . . Haff, G.
G. (2006). Peak force and rate of force development during isometric and dynamic mid-
thigh clean pulls performed at various intensities. Journal of strength and conditioning
research / National Strength & Conditioning Association, 20(3), 483-491. doi:
10.1519/18025.1
Kim, J. S., Cross, J. M., & Bamman, M. M. (2005). Impact of resistance loading on myostatin
expression and cell cycle regulation in young and older men and women. Am J Physiol
Endocrinol Metab, 288(6), E1110-1119. doi: 10.1152/ajpendo.00464.2004
Kraska, J. M., Ramsey, M. W., Haff, G. G., Fethke, N., Sands, W. A., Stone, M. E., & Stone, M.
H. (2009). Relationship between strength characteristics and unweighted and weighted
vertical jump height. Int J Sports Physiol Perform, 4(4), 461-473
Le Meur, Y., Hausswirth, C., & Mujika, I. (2012). Tapering for competition: A review. Science
& Sports, 27(2), 77-87. doi: http://dx.doi.org/10.1016/j.scispo.2011.06.013
Main, L. C., Dawson, B., Heel, K., Grove, J. R., Landers, G. J., & Goodman, C. (2010).
Relationship between inflammatory cytokines and self-report measures of training
overload. Res Sports Med, 18(2), 127-139. doi: 10.1080/15438621003627133
Mayo Clinic, L. (2016a). Test ID: CORT. Cortisol, Serum. Retrieved from
http://www.mayomedicallaboratories.com/test-catalog/Clinical+and+Interpretive/8545
Mayo Clinic, L. (2016b). Test ID: SHBG. Sex Hormone-Binding Globulin (SHBG), Serum.
Retrieved from http://www.mayomedicallaboratories.com/test-
catalog/Clinical+and+Interpretive/9285

153
Mayo Clinic, L. (2016c). Test ID: TTFB. Testosterone, Total, Bioavailable, and Free, Serum.
Retrieved from http://www.mayomedicallaboratories.com/test-
catalog/Clinical+and+Interpretive/83686
Miura, T., Kishioka, Y., Wakamatsu, J., Hattori, A., Hennebry, A., Berry, C. J., . . . Nishimura,
T. (2006). Decorin binds myostatin and modulates its activity to muscle cells. Biochem
Biophys Res Commun, 340(2), 675-680. doi: 10.1016/j.bbrc.2005.12.060
Mujika, I. (2014). Olympic preparation of a world-class female triathlete. Int J Sports Physiol
Perform, 9(4), 727-731. doi: 10.1123/ijspp.2013-0245
Mujika, I., & Padilla, S. (2003). Scientific bases for precompetition tapering strategies. Med Sci
Sports Exerc, 35(7), 1182-1187. doi: 10.1249/01.mss.0000074448.73931.11
Nieman, D. C., Luo, B., Dreau, D., Henson, D. A., Shanely, R. A., Dew, D., & Meaney, M. P.
(2014). Immune and inflammation responses to a 3-day period of intensified running
versus cycling. Brain Behav Immun, 39, 180-185. doi: 10.1016/j.bbi.2013.09.004
Peake, J. M., Della Gatta, P., Suzuki, K., & Nieman, D. C. (2015). Cytokine expression and
secretion by skeletal muscle cells: regulatory mechanisms and exercise effects. Exerc
Immunol Rev, 21, 8-25
Rhea, M. R. (2004). Determining the magnitude of treatment effects in strength training research
through the use of the effect size. Journal of strength and conditioning research /
National Strength & Conditioning Association, 18(4), 918-920. doi: 10.1519/14403.1
Roth, S. M., Martel, G. F., Ferrell, R. E., Metter, E. J., Hurley, B. F., & Rogers, M. A. (2003).
Myostatin gene expression is reduced in humans with heavy-resistance strength training:
a brief communication. Exp Biol Med (Maywood), 228(6), 706-709

154
Schobitz, B., Reul, J. M., & Holsboer, F. (1994). The role of the hypothalamic-pituitary-
adrenocortical system during inflammatory conditions. Crit Rev Neurobiol, 8(4), 263-291
Schoenfeld, B. J. (2013). Potential mechanisms for a role of metabolic stress in hypertrophic
adaptations to resistance training. Sports Med, 43(3), 179-194. doi: 10.1007/s40279-013-
0017-1
Smith, L. L. (2000). Cytokine hypothesis of overtraining: a physiological adaptation to excessive
stress? Med Sci Sports Exerc, 32(2), 317-331
Sodergard, R., Backstrom, T., Shanbhag, V., & Carstensen, H. (1982). Calculation of free and
bound fractions of testosterone and estradiol-17 beta to human plasma proteins at body
temperature. J Steroid Biochem, 16(6), 801-810
Stone, M., Fry, A. C., Thrush, J., Fleck, S. J., Kraemer, W. J., Kearney, J. T., & and Marsit, J.
(1993). Overtraining in weightlifters. Weightlifting Symposium (pp. 133-141). Ancient
Olympia, Greece.
Stone, M., Josey, J., Hunter, G., Kearney, J. T., Fry, A. C., Kraemer, W. J., . . . Haff, G. (1996).
Different taper lengths: effects on weightlifting performance In, Overtraining and
overreaching in sport: physiological, psychological, and biomedical
considerations...Memphis, Tenn., University of Memphis, 1996, l. 59.;.
Stone, M., Pierce, K. C., Sands, W. A., & Stone, M. E. (2006). Weightlifting: A Brief Overview.
Strength & Conditioning Journal, 28(1), 50-66
Stone, M., Stone, M., & Sands, W. A. (2007). Principles and practice of resistance training.
Champaign, IL: Human Kinetics.

155
Tanino, Y., Wang, X., Fukuhara, N., Misa, K., Uematsu, M., Fukuhara, A., . . . Nikaido, M.
(2014). Analysis Of Serum Revel Of Small Leucin-Rich Repeat Proteoglycan, Decorin In
Idiopathic Pulmonary Fibrosis. Am J Respir Crit Care Med, 189, A1518
Vierck, J., O'Reilly, B., Hossner, K., Antonio, J., Byrne, K., Bucci, L., & Dodson, M. (2000).
Satellite cell regulation following myotrauma caused by resistance exercise Cell Biol Int
(Vol. 24, pp. 263-272). England: 2000 Academic Press.
Willoughby, D. S. (2004). Effects of heavy resistance training on myostatin mRNA and protein
expression. Med Sci Sports Exerc, 36(4), 574-582
Wu, S., & Wolfe, A. (2012). Signaling of cytokines is important in regulation of GnRH neurons.
Mol Neurobiol, 45(1), 119-125. doi: 10.1007/s12035-011-8224-y
Zaras, N. D., Stasinaki, A. N., Methenitis, S. K., Krase, A. A., Karampatsos, G. P., Georgiadis,
G. V., . . . Terzis, G. D. (2016). Rate of Force Development, Muscle Architecture, and
Performance in Young Competitive Track and Field Throwers. J Strength Cond Res,
30(1), 81-92. doi: 10.1519/JSC.0000000000001048
Zourdos, M., Dolan, C., Quiles, J., Klemp, A., Jo, E., Loenneke, J., . . . Whitehurst, M. (2016).
Efficacy of Daily 1RM Training in Well-Trained Powerlifters and Weightlifters: A Case
Series. Nutricion hospitalaria: organo oficial de la Sociedad Espanola de Nutricion
Parenteral y Enteral, 33, 443

156
CHAPTER 7
SUMMARY AND FUTURE INVESTIGATIONS
The purpose of this dissertation was to examine changes following a peaking phase in
individual event and team sport strength-power athletes. This purpose was addressed by
conducting individual research investigations: 1) examining the effects of an ORT on individual-
event strength-power athletes preparing for conference championships, 2) examining changes in
team sport athletes throughout a competitive season in preparation for conference
championships, 3) examining differences in the effects of a peaking phase between new and
returning team sport athletes in order to identify variables that best explain the variation in
performance changes, and 4) examining changes in a national level female weightlifter following
three separate competition phases.
The results of study I demonstrated that pre/in-season training appeared to elicit increases
in MT, whereas the ORT resulted in improved explosive ability in the absence of further
detectable changes in muscle architecture. Additionally, the ORT appeared to augment throwing
performance at conference championships and national ranking, which may have been due to the
reduced RPETL and VLd. The findings of this study show that an overreaching week followed
by a 3-week taper is an effective means of improving explosive ability and throwing
performance in collegiate track and field throwers. Collegiate throwers and athletes in similar
sports may benefit from an ORT phase where training load is exponentially reduced prior to an
important competition.
In order to assess whether an ORT would benefit team sport athletes preparing for
conference championships, we conducted two further studies (study II and III) with NCAA
division I female collegiate volleyball athletes. In study II, we found positive alterations in

157
female volleyball athletes vastus lateralis muscle architecture and preserved explosive ability
over the competitive season while performing a periodized training program. Additionally, the
tapering period resulted in large decreases in body fat percentage and moderate decreases in
vastus lateralis MT with no statistical changes in jumping performance. Large to very large,
negative relationships were observed between maximal strength and changes in SJPPa and SJH
with various loads (0kg to 40kg). One possible explanation is that the training stimulus may have
been insufficient for the stronger athletes, which negatively affected their SJ performance. In
support of this, the two athletes with the greatest relative strength decreased SJ performance over
the course of the season suggesting an insufficient strength training stimulus. A solution we
suggested was to perform an overreaching microcycle prior to the taper in an attempt to preserve
previously accrued muscular adaptations.
In a follow up study with a similar team of volleyball athletes (study III), we had players
perform an overreach microcyle prior to the taper and an abbreviated overreach the week of
conference championships followed by a sharp reduction in training load. We found large to very
large differences in age, trivial to large differences in vastus lateralis muscle architecture, trivial
to very large differences in relative maximal strength and CMJ performance in favor of returners
over new players at baseline. We also found moderate to very large, and trivial to very large
differences in CMJ JH and PPa supercompensation during the peaking phase in favor of the
returners over the new players. These findings of this study demonstrated that returners
responded better to the ORT than the new players. Upon further examination, we found that the
number of sets played during the peaking phase and athlete’s baseline back squat 1RMa were the
strongest correlates of JH supercompensation during the peaking phase. A possible explanation
is that athletes who played more sets during the peaking phase had greater relative maximal
158
strength, which may have enhanced their ability to tolerate higher training loads resulting in
greater CMJ performance supercompensation during the taper. These findings suggest that
training prescription during the peaking phase should differ between athletes based on their
relative maximal strength and time spent competing. Strength coaches should emphasize
developing lower extremity muscle architectural characteristics to enhance strength of the
musculature contributing to volleyball performance.
A fourth study was conducted to provide a more comprehensive evaluation of changes a
strength-power athlete undergoes during and following a peaking phase. The national level
female weightlifter had a similar somatotype and weightlifting total to those previously reported
for high level U.S. weightlifters. The findings showed that vastus lateralis CSA can be
maintained following a competition phase in a high level weightlifter provided large changes in
body mass are not attempted close to competition. Changes in circulating cytokines (IL-6 and
TNFα) may explain the alterations in T and C concentrations, which corresponded with the
changes in weightlifting training VL. The athlete trained through COMP2, which may explain
the reductions in total and bioavailable T, possible reductions in the T:C ratio, and corresponding
decreases in loaded SJ and dynamic MTP performance. Changes in serum myostatin and decorin
following the competition periods appeared to correspond with changes in training VL with
increases in training VL leading to decreases in myostatin and decorin indicating a homeostatic
regulation of these muscle growth-related markers in serum. The findings of this study provide a
biochemical, morphological, and biomechanical basis for alterations in performance outcomes
following multiple competition phases in a national level weightlifter.
Overall, the findings of these investigations support the use of an ORT for strength-power
athletes and provide an underlying biochemical, morphological, and biomechanical basis for the

159
observed changes in performance. The investigations were, however, observational and did not
control for multiple confounding variables that could influence the outcomes. Therefore, future
research should use an experimental design and address changes in muscle architecture and sport
performance in individual event and team sport strength-power athletes following a taper with or
without a prior overreach. Future studies should also examine the effect of inflammatory
cytokines on GnRH and subsequent production of LH and T following an ORT in male and
female strength-power athletes. Additional mechanistic research should examine changes in the
serum concentrations of decorin and myostatin in conjunction with expression of its receptor
(Activin-II) on the myocyte surface following ORT phases. Providing additional information of
the biochemical, morphological, and biomechanical changes following ORT periods will greatly
enhance how these characteristics can be modified to optimize performance at crucial
competitions with individual event and team sport strength-power athletes.

160
REFERENCES
Aagaard, P., Andersen, J. L., Dyhre-Poulsen, P., Leffers, A. M., Wagner, A., Magnusson, S.
P., . . . Simonsen, E. B. (2001). A mechanism for increased contractile strength of human
pennate muscle in response to strength training: changes in muscle architecture. J
Physiol, 534(Pt. 2), 613-623.
Abe, T., Kumagai, K., & Brechue, W. F. (2000). Fascicle length of leg muscles is greater in
sprinters than distance runners. Med Sci Sports Exerc, 32(6), 1125-1129.
Abe, T., Sakamaki M Fau - Yasuda, T., Yasuda T Fau - Bemben, M. G., Bemben Mg Fau -
Kondo, M., Kondo M Fau - Kawakami, Y., Kawakami Y Fau - Fukunaga, T., &
Fukunaga, T. Age-related, site-specific muscle loss in 1507 Japanese men and women
aged 20 to 95 years. (1303-2968 (Electronic)). doi:D - NLM: PMC3737910 OTO -
NOTNLM
Alegre, L. M., Jimenez, F., Gonzalo-Orden, J. M., Martin-Acero, R., & Aguado, X. (2006).
Effects of dynamic resistance training on fascicle length and isometric strength. J Sports
Sci, 24(5), 501-508. doi:10.1080/02640410500189322
Alegre, L. M., Lara, A. J., Elvira, J. L., & Aguado, X. (2009). Muscle morphology and jump
performance: gender and intermuscular variability. J Sports Med Phys Fitness, 49(3),
320-326.
Andersen, J. L., & Aagaard, P. (2000). Myosin heavy chain IIX overshoot in human skeletal
muscle Muscle Nerve (Vol. 23, pp. 1095-1104). United States: 2000 John Wiley & Sons,
Inc.
Andersen, L. L., Andersen, J. L., Magnusson, S. P., Suetta, C., Madsen, J. L., Christensen, L. R.,
& Aagaard, P. (2005). Changes in the human muscle force-velocity relationship in

161
response to resistance training and subsequent detraining. J Appl Physiol (1985), 99(1),
87-94. doi:10.1152/japplphysiol.00091.2005
ARUP, L. (2014). TNF alpha reference interval. Retrieved from
http://ltd.aruplab.com/Tests/Pub/0051539
Aubry, A., Hausswirth, C., Louis, J., Coutts, A. J., & Y, L. E. M. (2014). Functional
overreaching: the key to peak performance during the taper? Med Sci Sports Exerc, 46(9),
1769-1777. doi:10.1249/mss.0000000000000301
Aubry, A., Hausswirth, C., Louis, J., Coutts, A. J., Buchheit, M., & Le Meur, Y. (2015). The
Development of Functional Overreaching Is Associated with a Faster Heart Rate
Recovery in Endurance Athletes. PLoS One, 10(10), e0139754.
doi:10.1371/journal.pone.0139754
Aughey, R. J. (2011). Applications of GPS technologies to field sports. Int J Sports Physiol
Perform, 6(3), 295-310.
Avalos, M., Hellard, P., & Chatard, J. C. (2003). Modeling the training-performance relationship
using a mixed model in elite swimmers. Med Sci Sports Exerc, 35(5), 838-846.
doi:10.1249/01.mss.0000065004.05033.42
Baker, D. (2001). Acute and long-term power responses to power training: Observations on the
training of an elite power athlete. Strength & Conditioning Journal, 23(1), 47-56.
Ball, S. D., Altena, T. S., & Swan, P. D. (2004). Comparison of anthropometry to DXA: a new
prediction equation for men. Eur J Clin Nutr, 58(11), 1525-1531.
doi:10.1038/sj.ejcn.1602003
Banister, E. W., & Calvert, T. W. (1980). Planning for future performance: implications for long
term training. Canadian Journal of Applied Sport Sciences, 5(3), 170-176.

162
Banister, E. W., Carter, J. B., & Zarkadas, P. C. (1999). Training theory and taper: validation in
triathlon athletes. Eur J Appl Physiol Occup Physiol, 79(2), 182-191.
Barr, S. I. (1991). Relationship of eating attitudes to anthropometric variable and dietary intakes
of female collegiate swimmers. J Am Diet Assoc, 91(8), 976-977.
Bazyler, C., Mizuguchi, S., Sato, K., Kavanaugh, A., DeWeese, B., & Stone, M. (2016a).
Changes in muscle architecture, explosive ability, and throwing performance in NCAA
DI track and field throwers throughout a competitive season and following a taper.
(PhD), East Tennessee State University, East Tennessee State University.
Bazyler, C., Mizuguchi, S., Sato, K., Kavanaugh, A., DeWeese, B., & Stone, M. (2016b).
Differences in countermovement jump performance changes between new players and
returners following an overreach and taper in NCAA division I women’s volleyball
athletes. (Ph.D.), East Tennessee State University East Tennessee State University.
Bazyler, C., Suchomel, T., Sole, C., Mizuguchi, S., Sato, K., Kavanaugh, A., . . . Stone, M.
(2016). Changes in muscle architecture and explosive ability in NCAA DI women’s
volleyball athletes throughout a competitive season and following a taper. (PhD), East
Tennessee State University East Tennessee State University.
Bellenger, C. R., Karavirta, L., Thomson, R. L., Robertson, E. Y., Davison, K., & Buckley, J. D.
(2015). Contextualising Parasympathetic Hyperactivity in Functionally Overreached
Athletes With Perceptions of Training Tolerance. Int J Sports Physiol Perform.
doi:10.1123/ijspp.2015-0495
Benard, M. R., Becher, J. G., Harlaar, J., Huijing, P. A., & Jaspers, R. T. (2009). Anatomical
information is needed in ultrasound imaging of muscle to avoid potentially substantial

163
errors in measurement of muscle geometry. Muscle Nerve, 39(5), 652-665.
doi:10.1002/mus.21287
Benjamini, Y., & Hochberg, Y. (1995). Controlling the false discovery rate: a practical and
powerful approach to multiple testing. Journal of the Royal Statistical Society. Series B
(Methodological), 289-300.
Berg, K., Blanke, D., & Miller, M. (1985). Muscular fitness profile of female college basketball
players. J Orthop Sports Phys Ther, 7(2), 59-64.
Bergen, H. R., 3rd, Farr, J. N., Vanderboom, P. M., Atkinson, E. J., White, T. A., Singh, R.
J., . . . LeBrasseur, N. K. (2015). Myostatin as a mediator of sarcopenia versus
homeostatic regulator of muscle mass: insights using a new mass spectrometry-based
assay. Skelet Muscle, 5, 21. doi:10.1186/s13395-015-0047-5
Biffl, W. L., Moore, E. E., Moore, F. A., & Peterson, V. M. (1996). Interleukin-6 in the injured
patient. Marker of injury or mediator of inflammation? Ann Surg, 224(5), 647-664.
Blazevich, A. J., Cannavan, D., Coleman, D. R., & Horne, S. (2007). Influence of concentric and
eccentric resistance training on architectural adaptation in human quadriceps muscles. J
Appl Physiol (1985), 103(5), 1565-1575. doi:10.1152/japplphysiol.00578.2007
Blazevich, A. J., Gill, N. D., Bronks, R., & Newton, R. U. (2003). Training-specific muscle
architecture adaptation after 5-wk training in athletes. Med Sci Sports Exerc, 35(12),
2013-2022. doi:10.1249/01.mss.0000099092.83611.20
Bosquet, L., Montpetit, J., Arvisais, D., & Mujika, I. (2007). Effects of tapering on performance:
a meta-analysis. Med Sci Sports Exerc, 39(8), 1358-1365.
doi:10.1249/mss.0b013e31806010e0

164
Bouchard, C., Dionne, F. T., Simoneau, J. A., & Boulay, M. R. (1992). Genetics of aerobic and
anaerobic performances. Exercise & Sport Sciences Reviews, 20, 27-58.
Brechue, W. F., & Abe, T. (2002). The role of FFM accumulation and skeletal muscle
architecture in powerlifting performance. Eur J Appl Physiol, 86(4), 327-336.
Busso, T., Hakkinen, K., Pakarinen, A., Kauhanen, H., Komi, P. V., & Lacour, J. R. (1992).
Hormonal adaptations and modelled responses in elite weightlifters during 6 weeks of
training. Eur J Appl Physiol Occup Physiol, 64(4), 381-386.
Cairns, S. P., & Borrani, F. (2015). beta-Adrenergic modulation of skeletal muscle contraction:
key role of excitation-contraction coupling. J Physiol, 593(21), 4713-4727.
doi:10.1113/jp270909
Carbuhn, A. F., Fernandez, T. E., Bragg, A. F., Green, J. S., & Crouse, S. F. (2010). Sport and
training influence bone and body composition in women collegiate athletes. J Strength
Cond Res, 24(7), 1710-1717. doi:10.1519/JSC.0b013e3181d09eb3
Carlock, J. M., Smith, S. L., Hartman, M. J., Morris, R. T., Ciroslan, D. A., Pierce, K. C., . . .
Stone, M. H. (2004). The relationship between vertical jump power estimates and
weightlifting ability: a field-test approach. J Strength Cond Res, 18(3), 534-539.
doi:10.1519/r-13213.1
Carter, J. E. L. (1975). The Heath-Carter somatotype method: San Diego State Univ.,
Department of Physical Education.
Chiu, L. Z., Fry, A. C., Schilling, B. K., Johnson, E. J., & Weiss, L. W. (2004). Neuromuscular
fatigue and potentiation following two successive high intensity resistance exercise
sessions. Eur J Appl Physiol, 92(4-5), 385-392. doi:10.1007/s00421-004-1144-z

165
Clark, M., Reed, D. B., Crouse, S. F., & Armstrong, R. B. (2003). Pre- and post-season dietary
intake, body composition, and performance indices of NCAA division I female soccer
players. Int J Sport Nutr Exerc Metab, 13(3), 303-319.
Clarkson, P. M., Nosaka, K., & Braun, B. (1992). Muscle function after exercise-induced muscle
damage and rapid adaptation. Med Sci Sports Exerc, 24(5), 512-520.
Claudino, J. G., Cronin, J. B., Mezencio, B., Pinho, J. P., Pereira, C., Mochizuki, L., . . . Serrao,
J. C. (2016). Auto-regulating jump performance to induce functional overreaching. J
Strength Cond Res. doi:10.1519/jsc.0000000000001325
Copps, K. D., & White, M. F. (2012). Regulation of insulin sensitivity by serine/threonine
phosphorylation of insulin receptor substrate proteins IRS1 and IRS2. Diabetologia,
55(10), 2565-2582.
Cormie, P., McBride, J. M., & McCaulley, G. O. (2007). Validation of power measurement
techniques in dynamic lower body resistance exercises. J Appl Biomech, 23(2), 103-118.
Cormie, P., McCaulley, G. O., & McBride, J. M. (2007). Power versus strength-power jump
squat training: influence on the load-power relationship Med Sci Sports Exerc (Vol. 39,
pp. 996-1003). United States.
Cormie, P., McGuigan, M. R., & Newton, R. U. (2011). Developing maximal neuromuscular
power: Part 1--biological basis of maximal power production Sports Med (Vol. 41, pp.
17-38). New Zealand.
Cormie, P., McGuigan, M. R., & Newton, R. U. (2011). Developing maximal neuromuscular
power: part 2 - training considerations for improving maximal power production Sports
Med (Vol. 41, pp. 125-146). New Zealand.

166
Coutts, A. J., Slattery, K. M., & Wallace, L. K. (2007). Practical tests for monitoring
performance, fatigue and recovery in triathletes. J Sci Med Sport, 10(6), 372-381.
doi:10.1016/j.jsams.2007.02.007
Coutts, A., Reaburn, P., Piva, T. J., & Murphy, A. (2007). Changes in selected biochemical,
muscular strength, power, and endurance measures during deliberate overreaching and
tapering in rugby league players. Int J Sports Med, 28(2), 116-124. doi:10.1055/s-2006-
924145
de Lacey, J., Brughelli, M., McGuigan, M., Hansen, K., Samozino, P., & Morin, J. B. (2014).
The effects of tapering on power-force-velocity profiling and jump performance in
professional rugby league players. J Strength Cond Res, 28(12), 3567-3570.
doi:10.1519/jsc.0000000000000572
de Souza, E. O., Tricoli, V., Aoki, M. S., Roschel, H., Brum, P. C., Bacurau, A. V., . . .
Ugrinowitsch, C. (2014). Effects of concurrent strength and endurance training on genes
related to myostatin signaling pathway and muscle fiber responses. J Strength Cond Res,
28(11), 3215-3223. doi:10.1519/jsc.0000000000000525
DeWeese, B. H., Sams, M. L., Williams, J. H., & Bellon, C. R. (2015). The Nature of
Speed. Enhancing sprint abilities through a short to long training approach. Techniques
Magazine, 8, 23.
Dressendorfer, R. H., Petersen, S. R., Lovshin, S. E., & Keen, C. L. (2002). Mineral metabolism
in male cyclists during high-intensity endurance training. Int J Sport Nutr Exerc Metab,
12(1), 63-72.

167
Dunkman, A. A., Buckley, M. R., Mienaltowski, M. J., Adams, S. M., Thomas, S. J., Satchell,
L., . . . Soslowsky, L. J. (2014). The tendon injury response is influenced by decorin and
biglycan. Ann Biomed Eng, 42(3), 619-630. doi:10.1007/s10439-013-0915-2
Dupuy, O., Lussier, M., Fraser, S., Bherer, L., Audiffren, M., & Bosquet, L. (2014). Effect of
overreaching on cognitive performance and related cardiac autonomic control. Scand J
Med Sci Sports, 24(1), 234-242. doi:10.1111/j.1600-0838.2012.01465.x
e Lima, K. M., da Matta, T. T., & de Oliveira, L. F. (2012). Reliability of the rectus femoris
muscle cross-sectional area measurements by ultrasonography. Clin Physiol Funct
Imaging, 32(3), 221-226. doi:10.1111/j.1475-097X.2011.01115.x
Epley, B. (1985). Poundage chart. Lincoln, NE: Boyd Epley Workout.
Farhangimaleki, N., Zehsaz, F., & Tiidus, P. M. (2009). The Effect of Tapering Period on
Plasma Pro-Inflammatory Cytokine Levels and Performance in Elite Male Cyclists J
Sports Sci Med (Vol. 8, pp. 600-606).
Fayad, L., Keating, M. J., Reuben, J. M., O'Brien, S., Lee, B. N., Lerner, S., & Kurzrock, R.
(2001). Interleukin-6 and interleukin-10 levels in chronic lymphocytic leukemia:
correlation with phenotypic characteristics and outcome. Blood, 97(1), 256-263.
Flanagan, E. P., & Jovanovic, M. (2014). Researched Applications of Velocity Based Strength
Training.
Fleck, S. J., Case, S., Puhl, J., & Van Handle, P. (1985). Physical and physiological
characteristics of elite women volleyball players. Can J Appl Sport Sci, 10(3), 122-126.
Forthomme, B., Croisier, J. L., Ciccarone, G., Crielaard, J. M., & Cloes, M. (2005). Factors
correlated with volleyball spike velocity. Am J Sports Med, 33(10), 1513-1519.
doi:10.1177/0363546505274935

168
Foster, C., Florhaug, J. A., Franklin, J., Gottschall, L., Hrovatin, L. A., Parker, S., . . . Dodge, C.
(2001). A new approach to monitoring exercise training. J Strength Cond Res, 15(1),
109-115.
Foster, C., Hector, L. L., Welsh, R., Schrager, M., Green, M. A., & Snyder, A. C. (1995). Effects
of specific versus cross-training on running performance. Eur J Appl Physiol Occup
Physiol, 70(4), 367-372.
Franchi, M. V., Atherton, P. J., Reeves, N. D., Fluck, M., Williams, J., Mitchell, W. K., . . .
Narici, M. V. (2014). Architectural, functional and molecular responses to concentric and
eccentric loading in human skeletal muscle. Acta Physiol (Oxf), 210(3), 642-654.
doi:10.1111/apha.12225
Freitas, V. H., Nakamura, F. Y., Miloski, B., Samulski, D., & Bara-Filho, M. G. (2014).
Sensitivity of physiological and psychological markers to training load intensification in
volleyball players. J Sports Sci Med, 13(3), 571-579.
Fry, A. C., & Kraemer, W. J. (1991). Physical Performance Characteristics of American
Collegiate Football Players. The Journal of Strength & Conditioning Research, 5(3), 126-
138.
Fry, A. C., Kraemer, W. J., Stone, M. H., Koziris, P. L., Thrush, J. T., & Fleck, S. J. (2000).
Relationships Between Serum Testosterone, Cortisol, and Weightlifting Performance.
The Journal of Strength & Conditioning Research, 14(3), 338-343.
Fry, A. C., Kraemer, W. J., Stone, M. H., Warren, B. J., Fleck, S. J., Kearney, J. T., & Gordon, S.
E. (1994). Endocrine responses to overreaching before and after 1 year of weightlifting.
Can J Appl Physiol, 19(4), 400-410.

169
Fry, A. C., Schilling, B. K., Weiss, L. W., & Chiu, L. Z. (2006). beta2-Adrenergic receptor
downregulation and performance decrements during high-intensity resistance exercise
overtraining. J Appl Physiol (1985), 101(6), 1664-1672.
doi:10.1152/japplphysiol.01599.2005
Gabbett, T. J. (2009). Physiological and anthropometric characteristics of starters and non-
starters in junior rugby league players, aged 13-17 years J Sports Med Phys Fitness (Vol.
49, pp. 233-239). Italy.
Gabbett, T., Kelly, J., Ralph, S., & Driscoll, D. (2009). Physiological and anthropometric
characteristics of junior elite and sub-elite rugby league players, with special reference to
starters and non-starters. J Sci Med Sport, 12(1), 215-222.
doi:10.1016/j.jsams.2007.06.008
Garhammer, J. (1979). Periodization of strength training for athletes. Track Tech(73), 2398-
2399.
Gibala, M. J., MacDougall, J. D., & Sale, D. G. (1994). The effects of tapering on strength
performance in trained athletes. Int J Sports Med, 15(8), 492-497. doi:10.1055/s-2007-
1021093
Gibson, N. E., Boyd, A. J., & Murray, A. M. (2016). Countermovement Jump is Not Affected
During Final Competition Preparation Periods in Elite Rugby Sevens Players. J Strength
Cond Res, 30(3), 777-783. doi:10.1519/jsc.0000000000001156
Girden, E. R. (1992). ANOVA: Repeated measures: Sage.
Gisslen, K., Ohberg, L., & Alfredson, H. (2006). Is the chronic painful tendinosis tendon a strong
tendon?: a case study involving an Olympic weightlifter with chronic painful Jumper's

170
knee. Knee Surg Sports Traumatol Arthrosc, 14(9), 897-902. doi:10.1007/s00167-006-
0054-5
Goodin, J., DeWeese, B., Sato, K., Mizuguchi, S., & Kavanaugh, A. (2015). Comparison of
external kinetic and kinematic variables between high barbell back squats and low
barbell back squats across a range of loads. (M.A.), East Tennessee State
University East Tennessee State University.
Graves, J. E., Pollock, M. L., Leggett, S. H., Braith, R. W., Carpenter, D. M., & Bishop, L. E.
(1988). Effect of reduced training frequency on muscular strength. Int J Sports Med, 9(5),
316-319. doi:10.1055/s-2007-1025031
Haff, G. G. (2010). Quantifying workloads in resistance training: a brief review. Strength and
Cond, 10, 31-40.
Haff, G., Carlock, J. M., Hartman, M. J., Kilgore, J. L., Kawamori, N., Jackson, J. R., . . . Stone,
M. H. (2005). Force-time curve characteristics of dynamic and isometric muscle actions
of elite women olympic weightlifters. Journal of strength and conditioning research /
National Strength & Conditioning Association, 19(4), 741-748. doi:10.1519/R-15134.1
Hakkinen, K., Kallinen, M., Komi, P. V., & Kauhanen, H. (1991). Neuromuscular adaptations
during short-term "normal" and reduced training periods in strength athletes.
Electromyogr Clin Neurophysiol, 31(1), 35-42.
Hakkinen, K., Pakarinen, A., Alen, M., Kauhanen, H., & Komi, P. V. (1987). Relationships
between training volume, physical performance capacity, and serum hormone
concentrations during prolonged training in elite weight lifters. Int J Sports Med, 8 Suppl
1, 61-65.

171
Halperin, I., Hughes, S., & Chapman, D. W. (2016). Physiological profile of a professional boxer
preparing for Title Bout: A case study. J Sports Sci, 1-8.
doi:10.1080/02640414.2016.1143110
Halson, S. L. (2014). Monitoring training load to understand fatigue in athletes. Sports Med, 44
Suppl 2, S139-147. doi:10.1007/s40279-014-0253-z
Halson, S. L., & Jeukendrup, A. E. (2004). Does overtraining exist? An analysis of overreaching
and overtraining research. Sports Med, 34(14), 967-981.
Harris, G. R., Stone, M. H., O'Bryant, H. S., Proulx, C. M., & Johnson, R. L. (2000). Short-term
performance effects of high power, high force, or combined weight-training methods. J
Strength Cond Res, 14(1), 14-20.
Hellard, P., Avalos, M., Hausswirth, C., Pyne, D., Toussaint, J. F., & Mujika, I. (2013).
Identifying Optimal Overload and Taper in Elite Swimmers over Time. J Sports Sci Med,
12(4), 668-678.
Hickson, R. C., Foster, C., Pollock, M. L., Galassi, T. M., & Rich, S. (1985). Reduced training
intensities and loss of aerobic power, endurance, and cardiac growth. J Appl Physiol
(1985), 58(2), 492-499.
Hopkins, W. (2000). Precision of the estimate of a subject's true value (Excel spreadsheet). In: A
new view of statistics. Retrieved from sportsci.org/resource/stats/xprecisionsubject.xls
Hopkins, W. (2004). How to interpret changes in an athletic performance test. . Sportscience, 8,
7.
Hopkins, W. G. (2002). A scale of magnitude for effect statistics. Retrieved from
www.sportsci.org

172
Houmard, J. A., & Johns, R. A. (1994). Effects of taper on swim performance. Practical
implications. Sports Med, 17(4), 224-232.
Howe, T. E., & Oldham, J. A. (1996). The reliability of measuring quadriceps cross-sectional
area with compound B ultrasound scanning. Physiother Res Int, 1(2), 112-126.
Hulmi, J. J., Ahtiainen, J. P., Kaasalainen, T., Pollanen, E., Hakkinen, K., Alen, M., . . . Mero, A.
A. (2007). Postexercise myostatin and activin IIb mRNA levels: effects of strength
training. Med Sci Sports Exerc, 39(2), 289-297.
doi:10.1249/01.mss.0000241650.15006.6e
Iaia, F. M., Hellsten, Y., Nielsen, J. J., Fernstrom, M., Sahlin, K., & Bangsbo, J. (2009). Four
weeks of speed endurance training reduces energy expenditure during exercise and
maintains muscle oxidative capacity despite a reduction in training volume. J Appl
Physiol (1985), 106(1), 73-80. doi:10.1152/japplphysiol.90676.2008
Ikai, M., & Fukunaga, T. (1970). A study on training effect on strength per unit cross-sectional
area of muscle by means of ultrasonic measurement. Int Z Angew Physiol, 28(3), 173-
180.
Izquierdo, M., Ibanez, J., Gonzalez-Badillo, J. J., Ratamess, N. A., Kraemer, W. J., Hakkinen,
K., . . . Gorostiaga, E. M. (2007). Detraining and tapering effects on hormonal responses
and strength performance. J Strength Cond Res, 21(3), 768-775. doi:10.1519/r-21136.1
Jaric, S., Mirkov, D., & Markovic, G. (2005). Normalizing physical performance tests for body
size: a proposal for standardization. J Strength Cond Res, 19(2), 467-474. doi:10.1519/r-
15064.1
Jo, E., Judelson, D. A., Brown, L. E., Coburn, J. W., & Dabbs, N. C. (2010). Influence of
recovery duration after a potentiating stimulus on muscular power in recreationally

173
trained individuals. J Strength Cond Res, 24(2), 343-347.
doi:10.1519/JSC.0b013e3181cc22a4
Johns, R. A., Houmard, J. A., Kobe, R. W., Hortobagyi, T., Bruno, N. J., Wells, J. M., &
Shinebarger, M. H. (1992). Effects of taper on swim power, stroke distance, and
performance. Med Sci Sports Exerc, 24(10), 1141-1146.
Kanzleiter, T., Rath, M., Gorgens, S. W., Jensen, J., Tangen, D. S., Kolnes, A. J., . . . Eckardt, K.
(2014). The myokine decorin is regulated by contraction and involved in muscle
hypertrophy. Biochem Biophys Res Commun, 450(2), 1089-1094.
doi:10.1016/j.bbrc.2014.06.123
Kavanaugh, A. A., & Sands, W.A. (2014). Longitudinal changes in strength and explosive
performance characteristics in NCAA division I women’s volleyball athletes. . (PhD.),
East Tennessee State University, Johnson City, TN.
Kawakami, Y., Abe, T., & Fukunaga, T. (1993). Muscle-fiber pennation angles are greater in
hypertrophied than in normal muscles. J Appl Physiol (1985), 74(6), 2740-2744.
Kawakami, Y., Abe, T., Kuno, S. Y., & Fukunaga, T. (1995). Training-induced changes in
muscle architecture and specific tension. Eur J Appl Physiol Occup Physiol, 72(1-2), 37-
43.
Kawamori, N., Rossi, S. J., Justice, B. D., Haff, E. E., Pistilli, E. E., O'Bryant, H. S., . . . Haff, G.
G. (2006). Peak force and rate of force development during isometric and dynamic mid-
thigh clean pulls performed at various intensities. Journal of strength and conditioning
research / National Strength & Conditioning Association, 20(3), 483-491.
doi:10.1519/18025.1

174
Kim, J. S., Cross, J. M., & Bamman, M. M. (2005). Impact of resistance loading on myostatin
expression and cell cycle regulation in young and older men and women. Am J Physiol
Endocrinol Metab, 288(6), E1110-1119. doi:10.1152/ajpendo.00464.2004
Kraska, J. M., Ramsey, M. W., Haff, G. G., Fethke, N., Sands, W. A., Stone, M. E., & Stone, M.
H. (2009). Relationship between strength characteristics and unweighted and weighted
vertical jump height. Int J Sports Physiol Perform, 4(4), 461-473.
Kreider, R., Fry, A., & O’Toole, M. (1998). Overtraining in sport: terms, definitions, and
prevalence. Overtraining in sport, 309e331.
Kumagai, K., Abe T Fau - Brechue, W. F., Brechue Wf Fau - Ryushi, T., Ryushi T Fau - Takano,
S., Takano S Fau - Mizuno, M., & Mizuno, M. Sprint performance is related to muscle
fascicle length in male 100-m sprinters. (8750-7587 (Print)).
Kumagai, K., Abe, T., Brechue, W. F., Ryushi, T., Takano, S., & Mizuno, M. (2000). Sprint
performance is related to muscle fascicle length in male 100-m sprinters. Journal of
applied physiology, 88(3), 811-816.
Le Meur, Y., Hausswirth, C., & Mujika, I. (2012). Tapering for competition: A review. Science
& Sports, 27(2), 77-87. doi:http://dx.doi.org/10.1016/j.scispo.2011.06.013
Le Meur, Y., Louis, J., Aubry, A., Gueneron, J., Pichon, A., Schaal, K., . . . Hausswirth, C.
(2014). Maximal exercise limitation in functionally overreached triathletes: role of
cardiac adrenergic stimulation. J Appl Physiol (1985), 117(3), 214-222.
doi:10.1152/japplphysiol.00191.2014
Le Meur, Y., Pichon, A., Schaal, K., Schmitt, L., Louis, J., Gueneron, J., . . . Hausswirth, C.
(2013). Evidence of parasympathetic hyperactivity in functionally overreached athletes.
Med Sci Sports Exerc, 45(11), 2061-2071. doi:10.1249/MSS.0b013e3182980125

175
Lecompte, J. C., & Rivet, D. (1979). Tabulated data on the duration of exchanges and stops in a
volleyball game. Volleyball Technical Journal, 4(3), 91.
Linthorne, N. P. (2001). Analysis of standing vertical jumps using a force platform. American
Journal of Physics, 69(11), 1198-1204.
Luden, N., Hayes, E., Galpin, A., Minchev, K., Jemiolo, B., Raue, U., . . . Trappe, S. (2010).
Myocellular basis for tapering in competitive distance runners. J Appl Physiol (1985),
108(6), 1501-1509. doi:10.1152/japplphysiol.00045.2010
Main, L. C., Dawson, B., Heel, K., Grove, J. R., Landers, G. J., & Goodman, C. (2010).
Relationship between inflammatory cytokines and self-report measures of training
overload. Res Sports Med, 18(2), 127-139. doi:10.1080/15438621003627133
Mayo Clinic, L. (2016a). Test ID: CORT. Cortisol, Serum. Retrieved from
http://www.mayomedicallaboratories.com/test-catalog/Clinical+and+Interpretive/8545
Mayo Clinic, L. (2016b). Test ID: SHBG. Sex Hormone-Binding Globulin (SHBG), Serum.
Retrieved from http://www.mayomedicallaboratories.com/test-
catalog/Clinical+and+Interpretive/9285
Mayo Clinic, L. (2016c). Test ID: TTFB. Testosterone, Total, Bioavailable, and Free, Serum.
Retrieved from http://www.mayomedicallaboratories.com/test-
catalog/Clinical+and+Interpretive/83686
McCaulley, G. O., McBride, J. M., Cormie, P., Hudson, M. B., Nuzzo, J. L., Quindry, J. C., &
Travis Triplett, N. (2009). Acute hormonal and neuromuscular responses to hypertrophy,
strength and power type resistance exercise. European journal of applied physiology,
105(5), 695-704. doi:10.1007/s00421-008-0951-z

176
McHugh, M. P., Connolly, D. A., Eston, R. G., & Gleim, G. W. (1999). Exercise-induced muscle
damage and potential mechanisms for the repeated bout effect. Sports Med, 27(3), 157-
170.
McMahon, J. J., Turner, A., & Comfort, P. (2015). Relationships between lower body muscle
structure and maximal power clean performance. Journal of Trainology, 4(2), 32-36.
McMahon, J., Stapley, J., Suchomel, T., & Comfort, P. (2015). Relationships between lower
body muscle structure and isometric mid-thigh pull peak force. Journal of Trainology,
4(2), 43-48.
Meeusen, R., Duclos, M., Foster, C., Fry, A., Gleeson, M., Nieman, D., . . . Urhausen, A. (2013).
Prevention, diagnosis, and treatment of the overtraining syndrome: joint consensus
statement of the European College of Sport Science and the American College of Sports
Medicine. Med Sci Sports Exerc, 45(1), 186-205. doi:10.1249/MSS.0b013e318279a10a
Minors, D. S., & Waterhouse, J. M. (1981). Anchor sleep as a synchronizer of rhythms on
abnormal routines. Int J Chronobiol, 7(3), 165-188.
Miura, T., Kishioka, Y., Wakamatsu, J., Hattori, A., Hennebry, A., Berry, C. J., . . . Nishimura,
T. (2006). Decorin binds myostatin and modulates its activity to muscle cells. Biochem
Biophys Res Commun, 340(2), 675-680. doi:10.1016/j.bbrc.2005.12.060
Mizuguchi, S., Sands, W. A., Wassinger, C. A., Lamont, H. S., & Stone, M. H. (2015). A new
approach to determining net impulse and identification of its characteristics in
countermovement jumping: reliability and validity. Sports Biomech, 14(2), 258-272.
doi:10.1080/14763141.2015.1053514
Morgan, W. P., Brown, D. R., Raglin, J. S., O'Connor, P. J., & Ellickson, K. A. (1987).
Psychological monitoring of overtraining and staleness. Br J Sports Med, 21(3), 107-114.

177
Mroczek, D., Kawczyński, A., & Chmura, J. (2011). Changes of reaction time and blood lactate
concentration of elite volleyball players during a game. Journal of human kinetics, 28,
73-78.
Mujika, I. (2007). Challenges of team-sport research. International journal of sports physiology
and performance, 2(3), 221.
Mujika, I. (2007). Thoughts and considerations for team-sport peaking. Olympic Coach, 18(4), 9-
11.
Mujika, I. (2010). Intense training: the key to optimal performance before and during the taper.
Scandinavian Journal of Medicine & Science in Sports, 20, 24-31.
Mujika, I. (2014). Olympic preparation of a world-class female triathlete. Int J Sports Physiol
Perform, 9(4), 727-731. doi:10.1123/ijspp.2013-0245
Mujika, I., & Padilla, S. (2003). Scientific bases for precompetition tapering strategies. Med Sci
Sports Exerc, 35(7), 1182-1187. doi:10.1249/01.mss.0000074448.73931.11
Mujika, I., Busso, T., Lacoste, L., Barale, F., Geyssant, A., & Chatard, J. C. (1996). Modeled
responses to training and taper in competitive swimmers. Med Sci Sports Exerc, 28(2),
251-258.
Mujika, I., Chatard, J. C., Busso, T., Geyssant, A., Barale, F., & Lacoste, L. (1995). Effects of
training on performance in competitive swimming. Can J Appl Physiol, 20(4), 395-406.
Mujika, I., Goya, A., Ruiz, E., Grijalba, A., Santisteban, J., & Padilla, S. (2002). Physiological
and performance responses to a 6-day taper in middle-distance runners: influence of
training frequency. Int J Sports Med, 23(5), 367-373. doi:10.1055/s-2002-33146

178
Mujika, I., Padilla, S., & Pyne, D. (2002). Swimming performance changes during the final 3
weeks of training leading to the Sydney 2000 Olympic Games. Int J Sports Med, 23(8),
582-587. doi:10.1055/s-2002-35526
Mujika, I., Padilla, S., Pyne, D., & Busso, T. (2004). Physiological Changes Associated with the
Pre-Event Taper in Athletes. Sports Medicine, 34(13), 891-927.
Murach, K., Raue, U., Wilkerson, B., Minchev, K., Jemiolo, B., Bagley, J., . . . Trappe, S.
(2014). Single muscle fiber gene expression with run taper. PLoS One, 9(9), e108547.
doi:10.1371/journal.pone.0108547
Neary, J. P., Martin, T. P., & Quinney, H. A. (2003). Effects of taper on endurance cycling
capacity and single muscle fiber properties. Med Sci Sports Exerc, 35(11), 1875-1881.
doi:10.1249/01.mss.0000093617.28237.20
Nieman, D. C., Luo, B., Dreau, D., Henson, D. A., Shanely, R. A., Dew, D., & Meaney, M. P.
(2014). Immune and inflammation responses to a 3-day period of intensified running
versus cycling. Brain Behav Immun, 39, 180-185. doi:10.1016/j.bbi.2013.09.004
Nimphius, S., McGuigan, M. R., & Newton, R. U. (2012). Changes in muscle architecture and
performance during a competitive season in female softball players. J Strength Cond Res,
26(10), 2655-2666. doi:10.1519/JSC.0b013e318269f81e
Nosaka, K., & Clarkson, P. M. (1995). Muscle damage following repeated bouts of high force
eccentric exercise. Med Sci Sports Exerc, 27(9), 1263-1269.
Nosaka, K., Sakamoto, K., Newton, M., & Sacco, P. (2001). The repeated bout effect of reduced-
load eccentric exercise on elbow flexor muscle damage. Eur J Appl Physiol, 85(1-2), 34-
40.

179
Palmer, T. B., Akehi, K., Thiele, R. M., Smith, D. B., & Thompson, B. J. (2015). Reliability of
panoramic ultrasound imaging in simultaneously examining muscle size and quality of
the hamstring muscles in young, healthy males and females. Ultrasound Med Biol, 41(3),
675-684. doi:10.1016/j.ultrasmedbio.2014.10.011
Papacosta, E., Gleeson, M., & Nassis, G. P. (2013). Salivary hormones, IgA, and performance
during intense training and tapering in judo athletes. J Strength Cond Res, 27(9), 2569-
2580. doi:10.1519/JSC.0b013e31827fd85c
Peake, J. M., Della Gatta, P., Suzuki, K., & Nieman, D. C. (2015). Cytokine expression and
secretion by skeletal muscle cells: regulatory mechanisms and exercise effects. Exerc
Immunol Rev, 21, 8-25.
Peterson, M. D., Alvar, B. A., & Rhea, M. R. (2006). The contribution of maximal force
production to explosive movement among young collegiate athletes. J Strength Cond
Res, 20(4), 867-873. doi:10.1519/r-18695.1
Pion, J. A., Fransen, J., Deprez, D. N., Segers, V. I., Vaeyens, R., Philippaerts, R. M., & Lenoir,
M. (2015). Stature and Jumping Height Are Required in Female Volleyball, but Motor
Coordination Is a Key Factor for Future Elite Success. The Journal of Strength &
Conditioning Research, 29(6), 1480-1485.
Pritchard, H., Keogh, J., Barnes, M., & McGuigan, M. (2015). Effects and Mechanisms of
Tapering in Maximizing Muscular Strength. Strength and Conditioning Journal, 37(2),
72-83.
Pyne, D. B., Mujika, I., & Reilly, T. (2009). Peaking for optimal performance: Research
limitations and future directions J Sports Sci (Vol. 27, pp. 195-202). England.
Pyne, D., & Martin, D. (2011). Fatigue-Insights from individual and team sports.

180
Raue, U., Slivka, D., Minchev, K., & Trappe, S. (2009). Improvements in whole muscle and
myocellular function are limited with high-intensity resistance training in octogenarian
women. J Appl Physiol (1985), 106(5), 1611-1617. doi:10.1152/japplphysiol.91587.2008
Reeves, N. D., Maganaris, C. N., Longo, S., & Narici, M. V. (2009). Differential adaptations to
eccentric versus conventional resistance training in older humans. Exp Physiol, 94(7),
825-833. doi:10.1113/expphysiol.2009.046599
Reilly, T., Atkinson, G., & Budgett, R. (2001). Effect of low-dose temazepam on physiological
variables and performance tests following a westerly flight across five time zones. Int J
Sports Med, 22(3), 166-174. doi:10.1055/s-2001-16379
Reilly, T., Secher, N., Snell, P., & Williams, C. (1990). Physiology of sports: An overview.
Physiology of sports, 465-485.
Rhea, M. R. (2004). Determining the magnitude of treatment effects in strength training research
through the use of the effect size. Journal of strength and conditioning research /
National Strength & Conditioning Association, 18(4), 918-920. doi:10.1519/14403.1
Ribeiro, F., Santos, F., Gonçalves, P., & Oliveira, J. (2008). Effects of volleyball match-induced
fatigue on knee joint position sense. European Journal of Sport Science, 8(6), 397-402.
Roth, S. M., Martel, G. F., Ferrell, R. E., Metter, E. J., Hurley, B. F., & Rogers, M. A. (2003).
Myostatin gene expression is reduced in humans with heavy-resistance strength training:
a brief communication. Exp Biol Med (Maywood), 228(6), 706-709.
Rushall, B. S. (1990). A tool for measuring stress tolerance in elite athletes. Journal of Applied
Sport Psychology, 2(1), 51-66.

181
Schmutz, S., Dapp, C., Wittwer, M., Vogt, M., Hoppeler, H., & Fluck, M. (2006). Endurance
training modulates the muscular transcriptome response to acute exercise. Pflugers Arch,
451(5), 678-687. doi:10.1007/s00424-005-1497-0
Schobitz, B., Reul, J. M., & Holsboer, F. (1994). The role of the hypothalamic-pituitary-
adrenocortical system during inflammatory conditions. Crit Rev Neurobiol, 8(4), 263-
291.
Schoenfeld, B. J. (2013). Potential mechanisms for a role of metabolic stress in hypertrophic
adaptations to resistance training. Sports Med, 43(3), 179-194. doi:10.1007/s40279-013-
0017-1
Secomb, J. L., Lundgren, L. E., Farley, O. R., Tran, T. T., Nimphius, S., & Sheppard, J. M.
(2015). Relationships Between Lower-Body Muscle Structure and Lower-Body Strength,
Power, and Muscle-Tendon Complex Stiffness. J Strength Cond Res, 29(8), 2221-2228.
doi:10.1519/JSC.0000000000000858
Seymour, J. M., Ward, K., Sidhu, P. S., Puthucheary, Z., Steier, J., Jolley, C. J., . . . Moxham, J.
(2009). Ultrasound measurement of rectus femoris cross-sectional area and the
relationship with quadriceps strength in COPD. Thorax, 64(5), 418-423.
doi:10.1136/thx.2008.103986
Shepley, B., MacDougall, J. D., Cipriano, N., Sutton, J. R., Tarnopolsky, M. A., & Coates, G.
(1992). Physiological effects of tapering in highly trained athletes. J Appl Physiol (1985),
72(2), 706-711.
Sheppard, J. M., Cronin, J. B., Gabbett, T. J., McGuigan, M. R., Etxebarria, N., & Newton, R. U.
(2008). Relative importance of strength, power, and anthropometric measures to jump

182
performance of elite volleyball players. The Journal of Strength & Conditioning
Research, 22(3), 758-765.
Smith, D. J., Roberts, D., & Watson, B. (1992). Physical, physiological and performance
differences between Canadian national team and universiade volleyball players. J Sports
Sci, 10(2), 131-138. doi:10.1080/02640419208729915
Smith, L. (2000). Cytokine hypothesis of overtraining: a physiological adaptation to excessive
stress? Med Sci Sports Exerc, 32(2), 317-331.
Sodergard, R., Backstrom, T., Shanbhag, V., & Carstensen, H. (1982). Calculation of free and
bound fractions of testosterone and estradiol-17 beta to human plasma proteins at body
temperature. J Steroid Biochem, 16(6), 801-810.
Sole, C., Mizuguchi, S., Sato, K., Moir, G., & Stone, M. (2015). Analysis of countermovement
vertical jump force-time curve phase characteristics in athletes Johnson City, TN: East
Tennessee State University
Spilsbury, K. L., Fudge, B. W., Ingham, S. A., Faulkner, S. H., & Nimmo, M. A. (2015).
Tapering strategies in elite British endurance runners. Eur J Sport Sci, 15(5), 367-373.
doi:10.1080/17461391.2014.955128
Stanforth, P. R., Crim, B. N., Stanforth, D., & Stults-Kolehmainen, M. A. (2014). Body
composition changes among female NCAA division 1 athletes across the competitive
season and over a multiyear time frame. J Strength Cond Res, 28(2), 300-307.
doi:10.1519/JSC.0b013e3182a20f06
Stone, M. H., Fry, A. C., Thrush, J., Fleck, S. J., Kraemer, W. J., Kearney, J. T., & and Marsit, J.
(1993). Overtraining in weightlifters. Paper presented at the Weightlifting Symposium,
Ancient Olympia, Greece.

183
Stone, M. H., Sanborn, K., O'Bryant, H. S., Hartman, M., Stone, M. E., Proulx, C., . . . Hruby, J.
(2003b). Maximum strength-power-performance relationships in collegiate throwers. J
Strength Cond Res, 17(4), 739-745. doi:R-12592 [pii]
Stone, M. H., Sands, W. A., & Stone, M. E. (2004). The downfall of sports science in the United
States. Strength and Conditioning Journal, 26(2), 72-75. doi:Doi 10.1519/00126548-
200404000-00014
Stone, M. H., Stone, M. E., Sands, W. A., Pierce, K. C., Newton, R. U., Haff, G. G., & Carlock,
J. (2006). Maximum Strength and Strength Training---A Relationship to Endurance?
Strength & Conditioning Journal, 28(3), 44-53.
Stone, M. H., Stone, M., & Sands, W. A. (2007). Principles and practice of resistance training.
Champaign, IL: Human Kinetics.
Stone, M., Josey, J., Hunter, G., Kearney, J. T., Fry, A. C., Kraemer, W. J., . . . Haff, G. (1996).
Different taper lengths: effects on weightlifting performance In, Overtraining and
overreaching in sport: physiological, psychological, and biomedical
considerations...Memphis, Tenn., University of Memphis, 1996, l. 59.;.
Stone, M., Pierce, K. C., Sands, W. A., & Stone, M. E. (2006). Weightlifting: A Brief Overview.
Strength & Conditioning Journal, 28(1), 50-66.
Storey, A. G., Birch, N. P., Fan, V., & Smith, H. K. (2016). Stress responses to short-term
intensified and reduced training in competitive weightlifters. Scand J Med Sci Sports,
26(1), 29-40. doi:10.1111/sms.12400
Strimbu, K., & Tavel, J. A. (2010). What are Biomarkers? Curr Opin HIV AIDS, 5(6), 463-466.
doi:10.1097/COH.0b013e32833ed177

184
Suchomel, T. J., Nimphius, S., & Stone, M. H. (2016). The Importance of Muscular Strength in
Athletic Performance. Sports Med. doi:10.1007/s40279-016-0486-0
Tanino, Y., Wang, X., Fukuhara, N., Misa, K., Uematsu, M., Fukuhara, A., . . . Nikaido, M.
(2014). Analysis Of Serum Revel Of Small Leucin-Rich Repeat Proteoglycan, Decorin In
Idiopathic Pulmonary Fibrosis. Am J Respir Crit Care Med, 189, A1518.
Terzis, G., Spengos, K., Kavouras, S., Manta, P., & Georgiadis, G. (2010). Muscle fibre type
composition and body composition in hammer throwers. J Sports Sci Med, 9(1), 104-109.
Terzis, G., Stratakos, G., Manta, P., & Georgiadis, G. (2008). Throwing performance after
resistance training and detraining. J Strength Cond Res, 22(4), 1198-1204.
doi:10.1519/JSC.0b013e31816d5c97
Thomas, L., & Busso, T. (2005). A theoretical study of taper characteristics to optimize
performance. Med Sci Sports Exerc, 37(9), 1615-1621.
Thomas, L., Mujika, I., & Busso, T. (2008). A model study of optimal training reduction during
pre-event taper in elite swimmers. J Sports Sci, 26(6), 643-652.
doi:10.1080/02640410701716782
Trappe, S., Costill, D., & Thomas, R. (2000). Effect of swim taper on whole muscle and single
muscle fiber contractile properties. Med Sci Sports Exerc, 32(12), 48-56.
Tuan, T. C., Hsu, T. G., Fong, M. C., Hsu, C. F., Tsai, K. K., Lee, C. Y., & Kong, C. W. (2008).
Deleterious effects of short-term, high-intensity exercise on immune function: evidence
from leucocyte mitochondrial alterations and apoptosis. Br J Sports Med, 42(1), 11-15.
doi:10.1136/bjsm.2006.029314
Verkhoshansky, U. V. (1985). The long-lasting training effect of strength exercises. Soviet
Sports Review, 20, 1-3.

185
Vierck, J., O'Reilly, B., Hossner, K., Antonio, J., Byrne, K., Bucci, L., & Dodson, M. (2000).
Satellite cell regulation following myotrauma caused by resistance exercise Cell Biol Int
(Vol. 24, pp. 263-272). England: 2000 Academic Press.
Wallace, L. K., Slattery, K. M., & Coutts, A. J. (2009). The ecological validity and application of
the session-RPE method for quantifying training loads in swimming. J Strength Cond
Res, 23(1), 33-38. doi:10.1519/JSC.0b013e3181874512
Wells, A. J., Fukuda, D. H., Hoffman, J. R., Gonzalez, A. M., Jajtner, A. R., Townsend, J. R., . . .
Stout, J. R. (2014). Vastus lateralis exhibits non-homogenous adaptation to resistance
training. Muscle Nerve, 50(5), 785-793. doi:10.1002/mus.24222
Wenger, H. A., & Bell, G. J. (1986). The interactions of intensity, frequency and duration of
exercise training in altering cardiorespiratory fitness. Sports Med, 3(5), 346-356.
Willoughby, D. S. (2004). Effects of heavy resistance training on myostatin mRNA and protein
expression. Med Sci Sports Exerc, 36(4), 574-582.
Wu, S., & Wolfe, A. (2012). Signaling of cytokines is important in regulation of GnRH neurons.
Mol Neurobiol, 45(1), 119-125. doi:10.1007/s12035-011-8224-y
Zaras, N. D., Stasinaki, A. N., Krase, A. A., Methenitis, S. K., Karampatsos, G. P., Georgiadis,
G. V., . . . Terzis, G. D. (2014). Effects of tapering with light vs. heavy loads on track and
field throwing performance. J Strength Cond Res, 28(12), 3484-3495.
doi:10.1519/jsc.0000000000000566
Zaras, N. D., Stasinaki, A. N., Methenitis, S. K., Krase, A. A., Karampatsos, G. P., Georgiadis,
G. V., . . . Terzis, G. D. (2016). Rate of Force Development, Muscle Architecture, and
Performance in Young Competitive Track and Field Throwers. J Strength Cond Res,
30(1), 81-92. doi:10.1519/JSC.0000000000001048

186
Zaras, N., Spengos, K., Methenitis, S., Papadopoulos, C., Karampatsos, G., Georgiadis, G., . . .
Terzis, G. (2013). Effects of Strength vs. Ballistic-Power Training on Throwing
Performance. J Sports Sci Med, 12(1), 130-137.
Zhou, S., McKenna, M. J., Lawson, D. L., Morrison, W. E., & Fairweather, I. (1996). Effects of
fatigue and sprint training on electromechanical delay of knee extensor muscles. Eur J
Appl Physiol Occup Physiol, 72(5-6), 410-416.
Zourdos, M. C., Henning, P. C., Jo, E., Khamoui, A. V., Lee, S. R., Park, Y. M., . . . Kim, J. S.
(2015). Repeated Bout Effect in Muscle-Specific Exercise Variations. J Strength Cond
Res, 29(8), 2270-2276. doi:10.1519/jsc.0000000000000856
Zourdos, M., Dolan, C., Quiles, J., Klemp, A., Jo, E., Loenneke, J., . . . Whitehurst, M. (2016).
Efficacy of Daily 1RM Training in Well-Trained Powerlifters and Weightlifters: A Case
Series. Nutricion hospitalaria: organo oficial de la Sociedad Espanola de Nutricion
Parenteral y Enteral, 33, 443.

187
APPENDICES
APPENDIX A: Institutional Review Board Approval Letters

188

189

190

191
APPENDIX B: Informed Consent Documents

192

193

194

195
196

197

198

199

200

201

202

203
VITA
CALEB DANIEL BAZYLER
Education: PhD. in Sport Physiology and Performance, East Tennessee State
University, Johnson City, TN, 2016
M.A. in Kinesiology and Sport Studies, East Tennessee State
University, Johnson City, TN 2013
B.S. in Exercise Science, Florida State University,
Tallahassee, FL, 2010
Professional Experience: Doctoral Fellow, East Tennessee State University, Johnson City,
TN, 2014-2016
Strength and Conditioning Coach men’s and women’s tennis, East
Tennessee State University, Johnson City, TN, 2011-2016
Graduate Assistant- Academic Advisor, East Tennessee State
University, Johnson City, TN, 2013-2014
Graduate Assistant, East Tennessee State University, Johnson City,
TN, 2011-2013
Publications: Bazyler, C., Abbott, H., Bellon, C., Taber, C., Stone, M.H.
Strength training for endurance athletes: theory to practice.
Strength Cond Journal, 37(2), 1-12, 2015
Zourdos, M.C. Bazyler, C.D., Jo, E., Khamoui, A.V., Park, B.,
Lee, S., Panton, L.B., Kim, J. Impact of a Submaximal Warm-up
on Endurance Performance in Trained and Competitive Male
Runners. Research Quarterly for Exercise and Sport (in review).
Sato, K., Beckham, G.K., Carroll, K., Bazyler, C., Zhanxin, S.,
Haff, G. Validity of a wireless device measuring velocity of
resistance exercises. Journal of Trainology 4(1), 15-18, 2015
Bazyler, C.D.; Beckham G., Sato, K. The use of the isometric
squat as a measure of strength and explosiveness. J Strength Cond
Res 29(5), 1386-1392, 2015.
Bazyler, C.D.; Sato, K., Wassinger, C., Lamont, H., Stone, M. The
efficacy of incorporating partial squats in maximal strength
training. J Strength Cond Res 28(11), 3024-3032, 2014.

204
Bazyler, C., Bailey, C., Chiang, C.Y., Sato, K., Stone, M.H. The
effects of strength training on isometric force production symmetry
in recreationally trained males. Journal of Trainology 3(1), 6-10.
2014
Honors and Awards: Clemmer College of Education Outstanding Graduate Student
Award, 2016
GPSA Travel Award: $500 for NACSM annual meeting, 2016
GPSA Travel Award: $500 for NACSM annual meeting, 2015
1st place coaches education poster presentation at Sports Science
and Coach’s College, Johnson City, TN, 2014
ASUN Champions ETSU Women’s Tennis, strength coach and
sport scientist, Johnson City, TN, 2014
ASUN Champions ETSU Men’s Tennis, strength coach and sport
scientist, Johnson City, TN, 2012 and 2013
National Strength and Conditioning Association, Certified Strength
and Conditioning Specialist (CSCS), 2011
Hortense Glenn Award, Florida State University, Tallahassee, FL,
2010
Bess H. Ward Honor’s Thesis Award, Florida State University,
Tallahassee, FL, $1,000, 2009